Wartburg, TN Map & Demographics
Wartburg Map
Wartburg Overview
$18,307
PER CAPITA INCOME
$53,958
AVG FAMILY INCOME
$28,036
AVG HOUSEHOLD INCOME
48.5%
WAGE / INCOME GAP [ % ]
51.5¢/ $1
WAGE / INCOME GAP [ $ ]
$12,515
FAMILY INCOME DEFICIT
0.51
INEQUALITY / GINI INDEX
1,330
TOTAL POPULATION
634
MALE POPULATION
696
FEMALE POPULATION
91.09
MALES / 100 FEMALES
109.78
FEMALES / 100 MALES
34.2
MEDIAN AGE
3.8
AVG FAMILY SIZE
2.7
AVG HOUSEHOLD SIZE
399
LABOR FORCE [ PEOPLE ]
38.4%
PERCENT IN LABOR FORCE
8.8%
UNEMPLOYMENT RATE
Wartburg Zip Codes
Wartburg Area Codes
Income in Wartburg
Income Overview in Wartburg
Per Capita Income in Wartburg is $18,307, while median incomes of families and households are $53,958 and $28,036 respectively.
| Characteristic | Number | Measure |
| Per Capita Income | 1,330 | $18,307 |
| Median Family Income | 228 | $53,958 |
| Mean Family Income | 228 | $70,237 |
| Median Household Income | 433 | $28,036 |
| Mean Household Income | 433 | $50,257 |
| Income Deficit | 228 | $12,515 |
| Wage / Income Gap (%) | 1,330 | 48.53% |
| Wage / Income Gap ($) | 1,330 | 51.47¢ per $1 |
| Gini / Inequality Index | 1,330 | 0.51 |
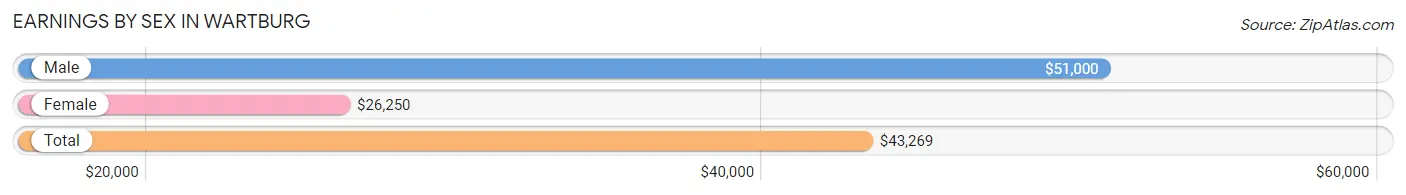
Earnings by Sex in Wartburg
Average Earnings in Wartburg are $43,269, $51,000 for men and $26,250 for women, a difference of 48.5%.
| Sex | Number | Average Earnings |
| Male | 244 (58.9%) | $51,000 |
| Female | 170 (41.1%) | $26,250 |
| Total | 414 (100.0%) | $43,269 |
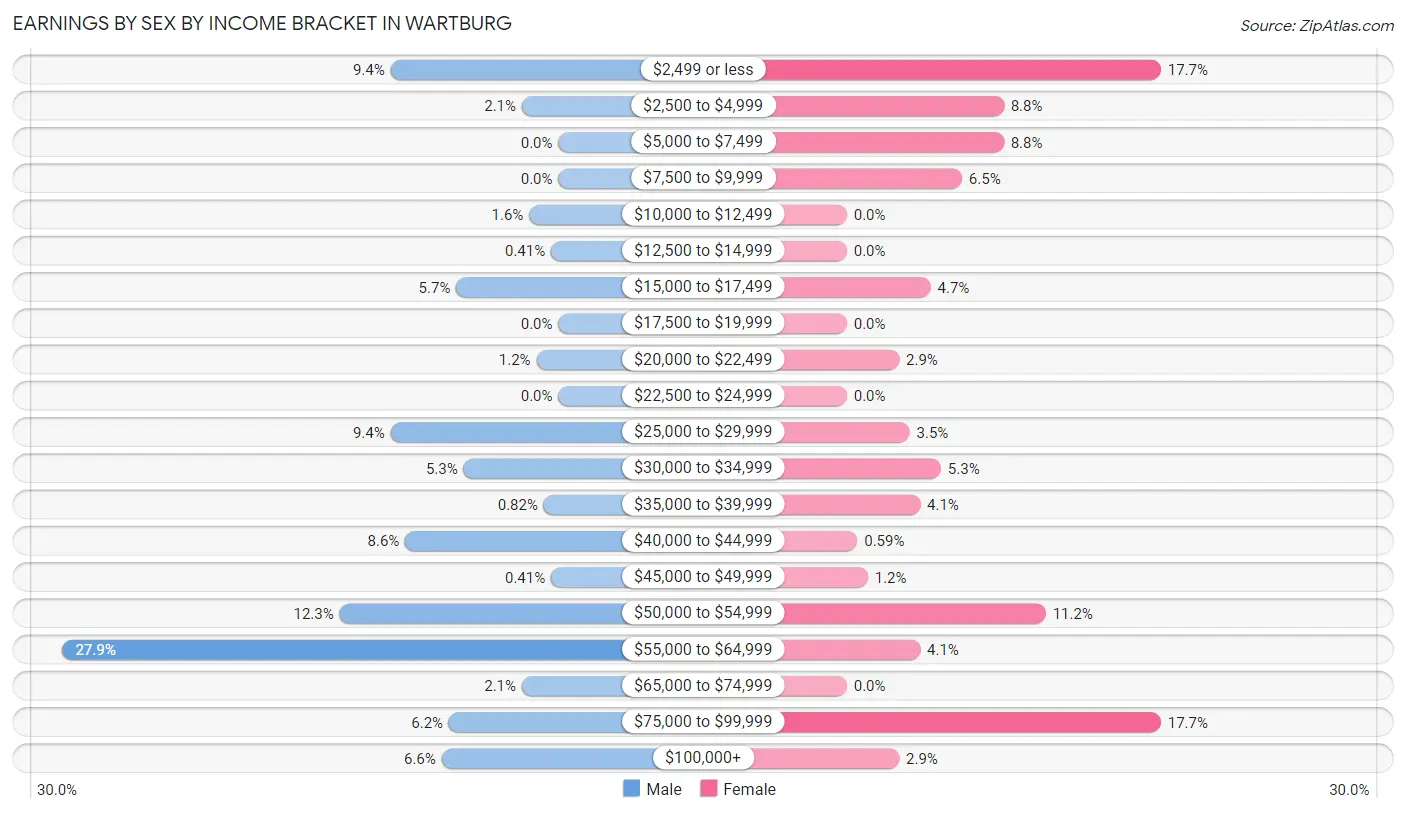
Earnings by Sex by Income Bracket in Wartburg
The most common earnings brackets in Wartburg are $55,000 to $64,999 for men (68 | 27.9%) and $2,499 or less for women (30 | 17.6%).
| Income | Male | Female |
| $2,499 or less | 23 (9.4%) | 30 (17.6%) |
| $2,500 to $4,999 | 5 (2.1%) | 15 (8.8%) |
| $5,000 to $7,499 | 0 (0.0%) | 15 (8.8%) |
| $7,500 to $9,999 | 0 (0.0%) | 11 (6.5%) |
| $10,000 to $12,499 | 4 (1.6%) | 0 (0.0%) |
| $12,500 to $14,999 | 1 (0.4%) | 0 (0.0%) |
| $15,000 to $17,499 | 14 (5.7%) | 8 (4.7%) |
| $17,500 to $19,999 | 0 (0.0%) | 0 (0.0%) |
| $20,000 to $22,499 | 3 (1.2%) | 5 (2.9%) |
| $22,500 to $24,999 | 0 (0.0%) | 0 (0.0%) |
| $25,000 to $29,999 | 23 (9.4%) | 6 (3.5%) |
| $30,000 to $34,999 | 13 (5.3%) | 9 (5.3%) |
| $35,000 to $39,999 | 2 (0.8%) | 7 (4.1%) |
| $40,000 to $44,999 | 21 (8.6%) | 1 (0.6%) |
| $45,000 to $49,999 | 1 (0.4%) | 2 (1.2%) |
| $50,000 to $54,999 | 30 (12.3%) | 19 (11.2%) |
| $55,000 to $64,999 | 68 (27.9%) | 7 (4.1%) |
| $65,000 to $74,999 | 5 (2.1%) | 0 (0.0%) |
| $75,000 to $99,999 | 15 (6.1%) | 30 (17.6%) |
| $100,000+ | 16 (6.6%) | 5 (2.9%) |
| Total | 244 (100.0%) | 170 (100.0%) |
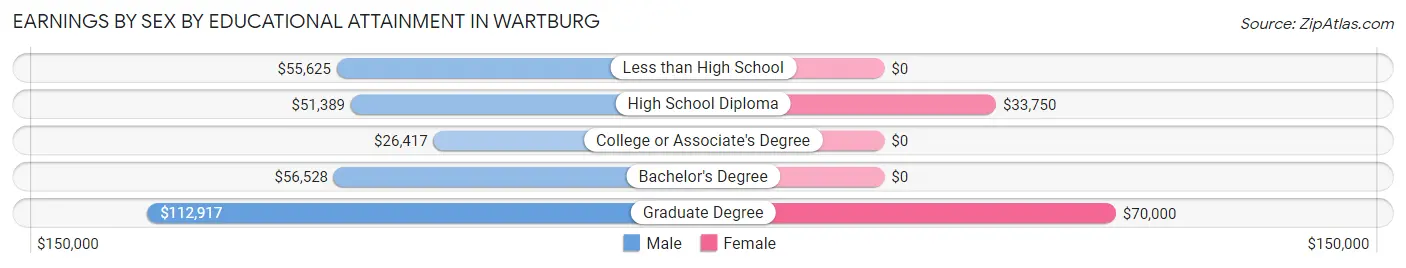
Earnings by Sex by Educational Attainment in Wartburg
Average earnings in Wartburg are $52,250 for men and $32,500 for women, a difference of 37.8%. Men with an educational attainment of graduate degree enjoy the highest average annual earnings of $112,917, while those with college or associate's degree education earn the least with $26,417. Women with an educational attainment of graduate degree earn the most with the average annual earnings of $70,000, while those with high school diploma education have the smallest earnings of $33,750.
| Educational Attainment | Male Income | Female Income |
| Less than High School | $55,625 | $0 |
| High School Diploma | $51,389 | $33,750 |
| College or Associate's Degree | $26,417 | $0 |
| Bachelor's Degree | $56,528 | $0 |
| Graduate Degree | $112,917 | $70,000 |
| Total | $52,250 | $32,500 |
Family Income in Wartburg
Family Income Brackets in Wartburg
According to the Wartburg family income data, there are 41 families falling into the $100,000 to $149,999 income range, which is the most common income bracket and makes up 18.0% of all families. Conversely, the $10,000 to $14,999 income bracket is the least frequent group with only 2 families (0.9%) belonging to this category.
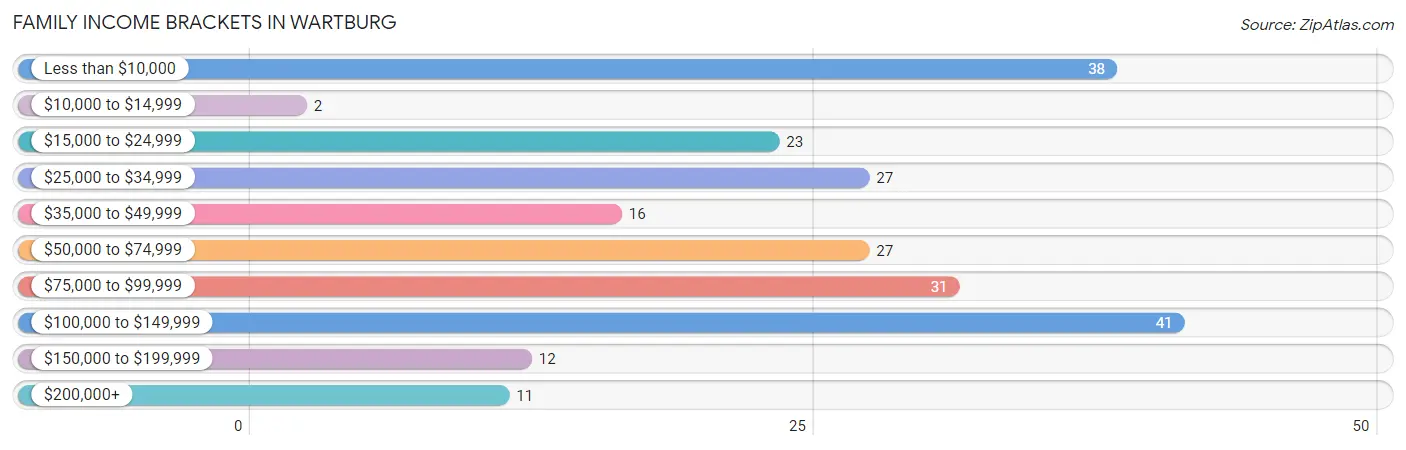
| Income Bracket | # Families | % Families |
| Less than $10,000 | 38 | 16.7% |
| $10,000 to $14,999 | 2 | 0.9% |
| $15,000 to $24,999 | 23 | 10.1% |
| $25,000 to $34,999 | 27 | 11.8% |
| $35,000 to $49,999 | 16 | 7.0% |
| $50,000 to $74,999 | 27 | 11.8% |
| $75,000 to $99,999 | 31 | 13.6% |
| $100,000 to $149,999 | 41 | 18.0% |
| $150,000 to $199,999 | 12 | 5.3% |
| $200,000+ | 11 | 4.8% |
Family Income by Famaliy Size in Wartburg
6-person families (24 | 10.5%) account for the highest median family income in Wartburg with $110,192 per family, while 4-person families (27 | 11.8%) have the highest median income of $19,948 per family member.
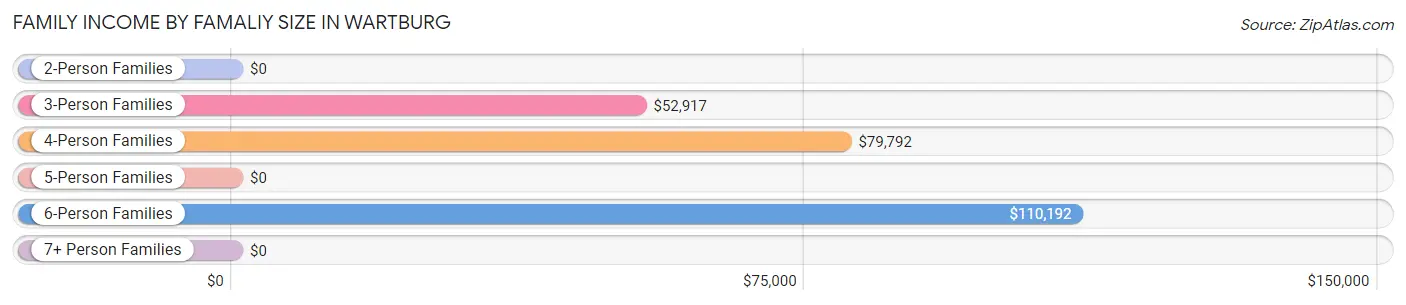
| Income Bracket | # Families | Median Income |
| 2-Person Families | 81 (35.5%) | $0 |
| 3-Person Families | 58 (25.4%) | $52,917 |
| 4-Person Families | 27 (11.8%) | $79,792 |
| 5-Person Families | 37 (16.2%) | $0 |
| 6-Person Families | 24 (10.5%) | $110,192 |
| 7+ Person Families | 1 (0.4%) | $0 |
| Total | 228 (100.0%) | $53,958 |
Family Income by Number of Earners in Wartburg
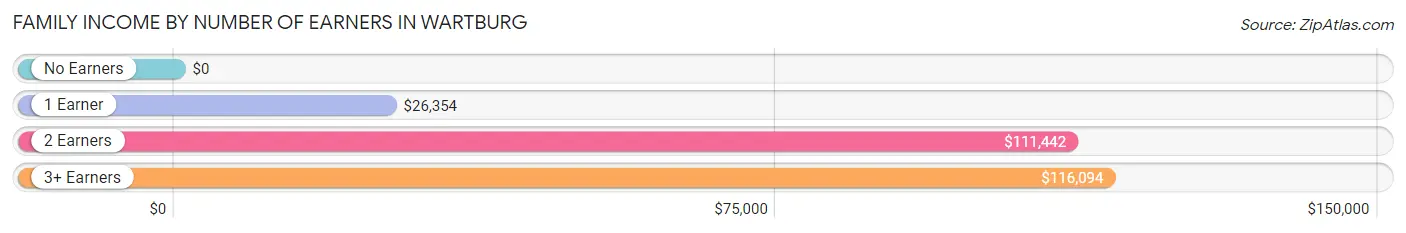
| Number of Earners | # Families | Median Income |
| No Earners | 51 (22.4%) | $0 |
| 1 Earner | 83 (36.4%) | $26,354 |
| 2 Earners | 65 (28.5%) | $111,442 |
| 3+ Earners | 29 (12.7%) | $116,094 |
| Total | 228 (100.0%) | $53,958 |
Household Income in Wartburg
Household Income Brackets in Wartburg
With 97 households falling in the category, the $15,000 to $24,999 income range is the most frequent in Wartburg, accounting for 22.4% of all households. In contrast, only 11 households (2.5%) fall into the $200,000+ income bracket, making it the least populous group.
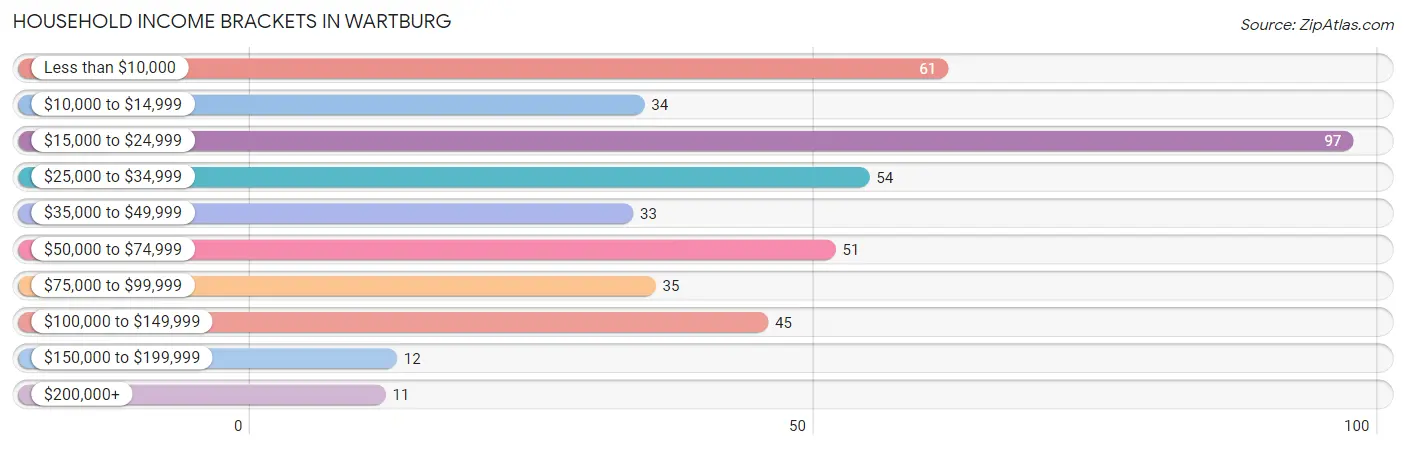
| Income Bracket | # Households | % Households |
| Less than $10,000 | 61 | 14.1% |
| $10,000 to $14,999 | 34 | 7.9% |
| $15,000 to $24,999 | 97 | 22.4% |
| $25,000 to $34,999 | 54 | 12.5% |
| $35,000 to $49,999 | 33 | 7.6% |
| $50,000 to $74,999 | 51 | 11.8% |
| $75,000 to $99,999 | 35 | 8.1% |
| $100,000 to $149,999 | 45 | 10.4% |
| $150,000 to $199,999 | 12 | 2.8% |
| $200,000+ | 11 | 2.5% |
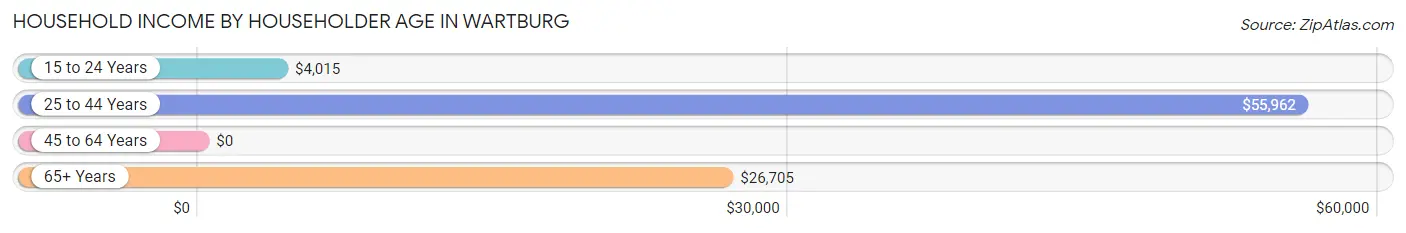
Household Income by Householder Age in Wartburg
The median household income in Wartburg is $28,036, with the highest median household income of $55,962 found in the 25 to 44 years age bracket for the primary householder. A total of 132 households (30.5%) fall into this category. Meanwhile, the 45 to 64 years age bracket for the primary householder has the lowest median household income of $0, with 160 households (36.9%) in this group.
| Income Bracket | # Households | Median Income |
| 15 to 24 Years | 40 (9.2%) | $4,015 |
| 25 to 44 Years | 132 (30.5%) | $55,962 |
| 45 to 64 Years | 160 (36.9%) | $0 |
| 65+ Years | 101 (23.3%) | $26,705 |
| Total | 433 (100.0%) | $28,036 |
Poverty in Wartburg
Income Below Poverty by Sex and Age in Wartburg
With 28.7% poverty level for males and 42.6% for females among the residents of Wartburg, 16 and 17 year old males and 15 year old females are the most vulnerable to poverty, with 15 males (83.3%) and 15 females (100.0%) in their respective age groups living below the poverty level.
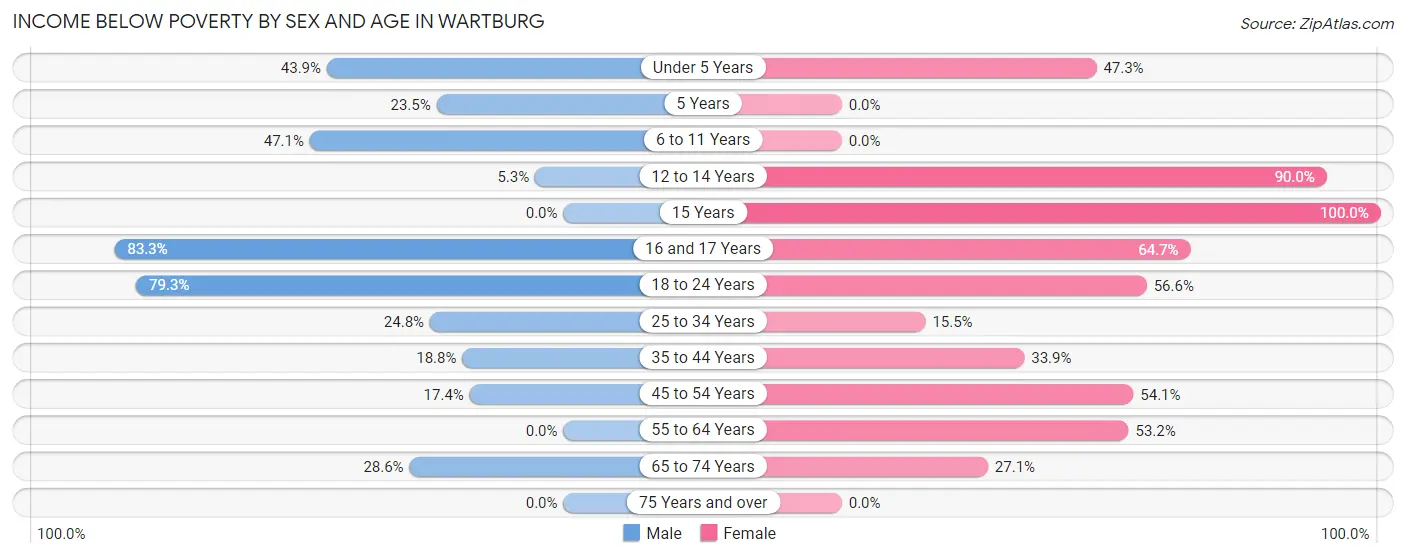
| Age Bracket | Male | Female |
| Under 5 Years | 18 (43.9%) | 26 (47.3%) |
| 5 Years | 4 (23.5%) | 0 (0.0%) |
| 6 to 11 Years | 16 (47.1%) | 0 (0.0%) |
| 12 to 14 Years | 1 (5.3%) | 54 (90.0%) |
| 15 Years | 0 (0.0%) | 15 (100.0%) |
| 16 and 17 Years | 15 (83.3%) | 11 (64.7%) |
| 18 to 24 Years | 46 (79.3%) | 30 (56.6%) |
| 25 to 34 Years | 27 (24.8%) | 16 (15.5%) |
| 35 to 44 Years | 12 (18.8%) | 21 (33.9%) |
| 45 to 54 Years | 8 (17.4%) | 46 (54.1%) |
| 55 to 64 Years | 0 (0.0%) | 33 (53.2%) |
| 65 to 74 Years | 8 (28.6%) | 16 (27.1%) |
| 75 Years and over | 0 (0.0%) | 0 (0.0%) |
| Total | 155 (28.7%) | 268 (42.6%) |
Income Above Poverty by Sex and Age in Wartburg
According to the poverty statistics in Wartburg, males aged 15 years and females aged 6 to 11 years are the age groups that are most secure financially, with 100.0% of males and 100.0% of females in these age groups living above the poverty line.
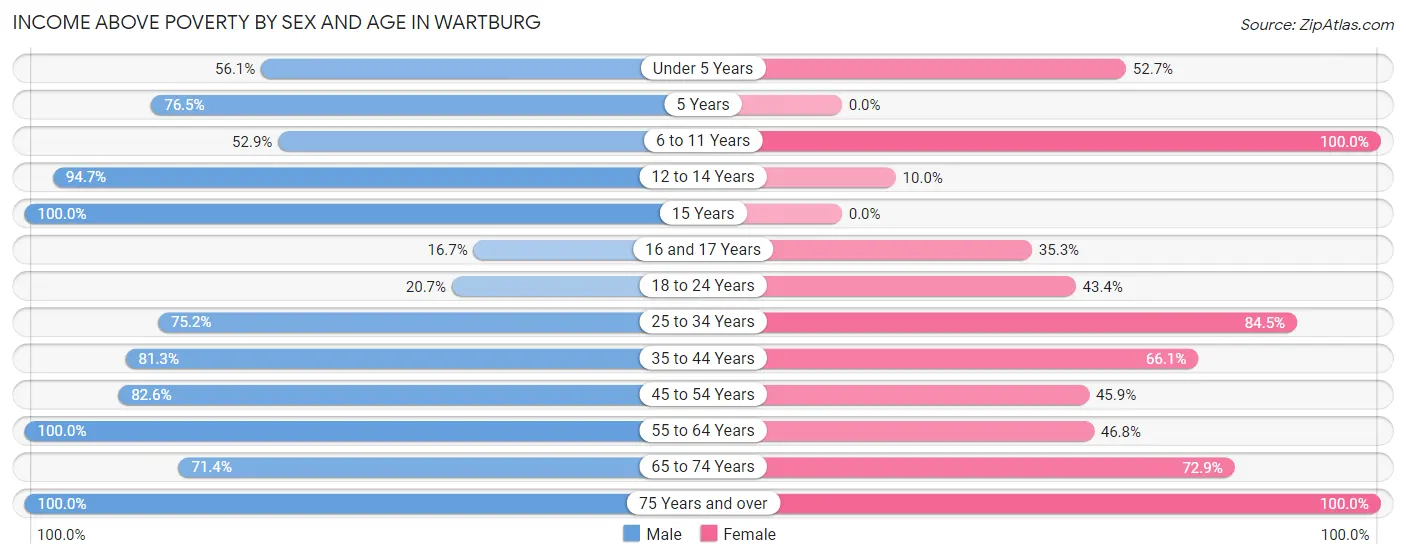
| Age Bracket | Male | Female |
| Under 5 Years | 23 (56.1%) | 29 (52.7%) |
| 5 Years | 13 (76.5%) | 0 (0.0%) |
| 6 to 11 Years | 18 (52.9%) | 27 (100.0%) |
| 12 to 14 Years | 18 (94.7%) | 6 (10.0%) |
| 15 Years | 10 (100.0%) | 0 (0.0%) |
| 16 and 17 Years | 3 (16.7%) | 6 (35.3%) |
| 18 to 24 Years | 12 (20.7%) | 23 (43.4%) |
| 25 to 34 Years | 82 (75.2%) | 87 (84.5%) |
| 35 to 44 Years | 52 (81.2%) | 41 (66.1%) |
| 45 to 54 Years | 38 (82.6%) | 39 (45.9%) |
| 55 to 64 Years | 71 (100.0%) | 29 (46.8%) |
| 65 to 74 Years | 20 (71.4%) | 43 (72.9%) |
| 75 Years and over | 25 (100.0%) | 31 (100.0%) |
| Total | 385 (71.3%) | 361 (57.4%) |
Income Below Poverty Among Married-Couple Families in Wartburg
The poverty statistics for married-couple families in Wartburg show that 22.6% or 35 of the total 155 families live below the poverty line. Families with 3 or 4 children have the highest poverty rate of 100.0%, comprising of 25 families. On the other hand, families with 1 or 2 children have the lowest poverty rate of 0.0%, which includes 0 families.
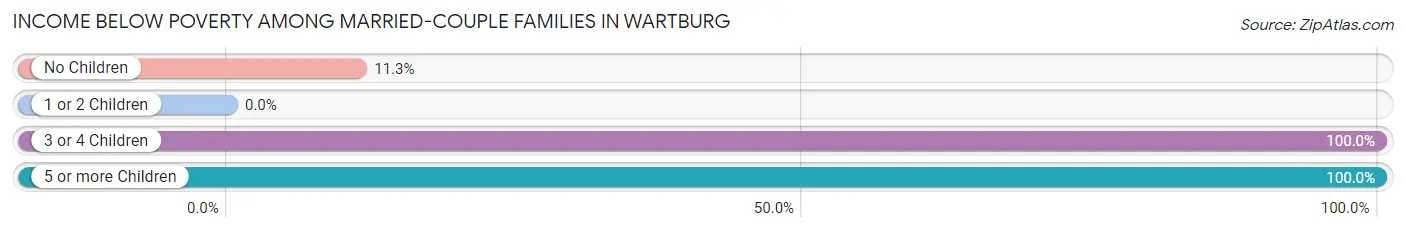
| Children | Above Poverty | Below Poverty |
| No Children | 71 (88.7%) | 9 (11.3%) |
| 1 or 2 Children | 49 (100.0%) | 0 (0.0%) |
| 3 or 4 Children | 0 (0.0%) | 25 (100.0%) |
| 5 or more Children | 0 (0.0%) | 1 (100.0%) |
| Total | 120 (77.4%) | 35 (22.6%) |
Income Below Poverty Among Single-Parent Households in Wartburg
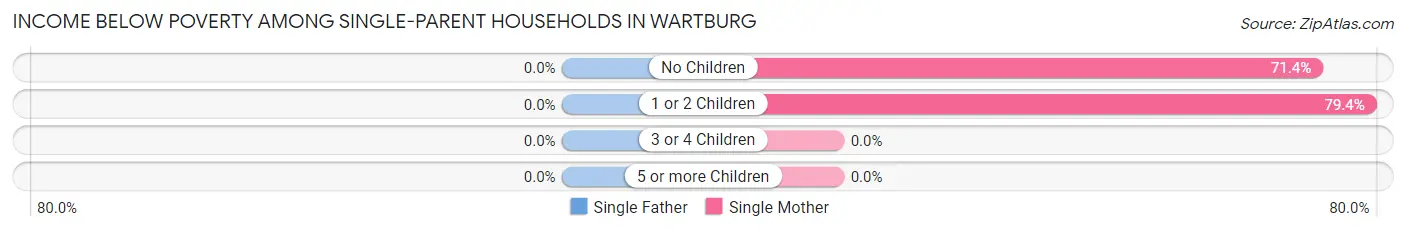
| Children | Single Father | Single Mother |
| No Children | 0 (0.0%) | 10 (71.4%) |
| 1 or 2 Children | 0 (0.0%) | 27 (79.4%) |
| 3 or 4 Children | 0 (0.0%) | 0 (0.0%) |
| 5 or more Children | 0 (0.0%) | 0 (0.0%) |
| Total | 0 (0.0%) | 37 (67.3%) |
Income Below Poverty Among Married-Couple vs Single-Parent Households in Wartburg
The poverty data for Wartburg shows that 35 of the married-couple family households (22.6%) and 37 of the single-parent households (50.7%) are living below the poverty level. Within the married-couple family households, those with 3 or 4 children have the highest poverty rate, with 25 households (100.0%) falling below the poverty line. Among the single-parent households, those with no children have the highest poverty rate, with 10 household (71.4%) living below poverty.
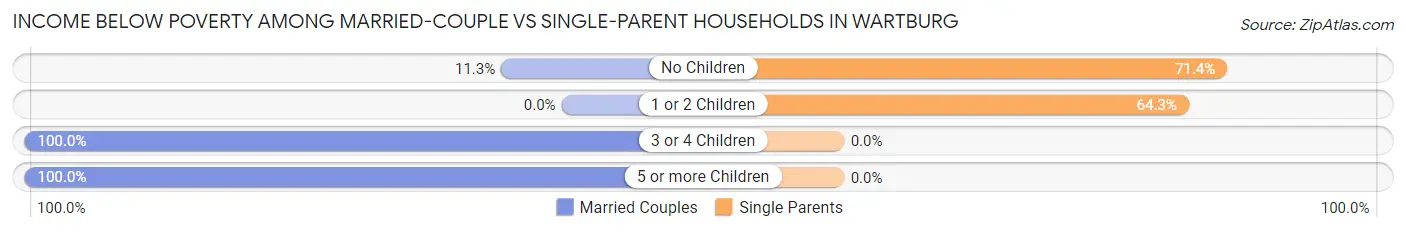
| Children | Married-Couple Families | Single-Parent Households |
| No Children | 9 (11.3%) | 10 (71.4%) |
| 1 or 2 Children | 0 (0.0%) | 27 (64.3%) |
| 3 or 4 Children | 25 (100.0%) | 0 (0.0%) |
| 5 or more Children | 1 (100.0%) | 0 (0.0%) |
| Total | 35 (22.6%) | 37 (50.7%) |
Race in Wartburg
The most populous races in Wartburg are White / Caucasian (1,250 | 94.0%), Black / African American (33 | 2.5%), and Two or more Races (22 | 1.7%).
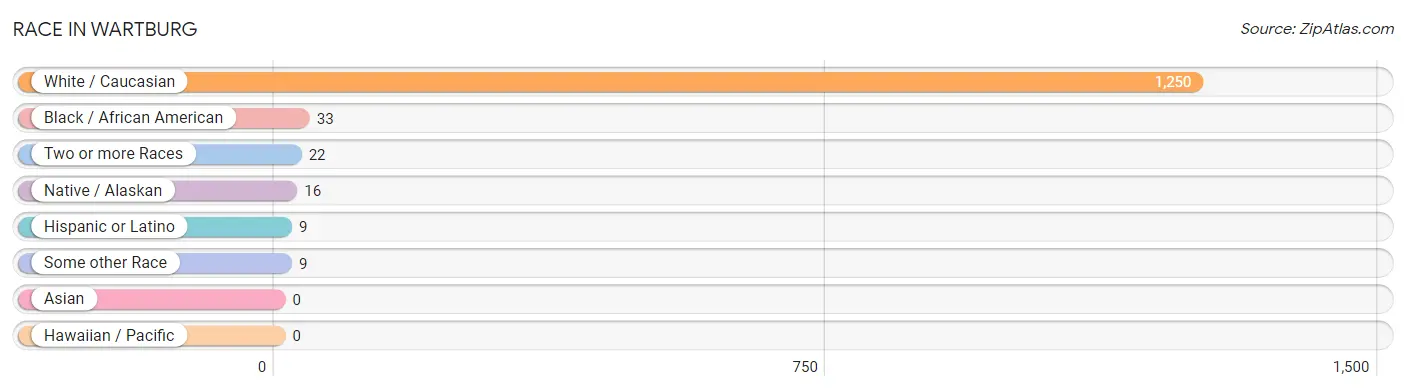
| Race | # Population | % Population |
| Asian | 0 | 0.0% |
| Black / African American | 33 | 2.5% |
| Hawaiian / Pacific | 0 | 0.0% |
| Hispanic or Latino | 9 | 0.7% |
| Native / Alaskan | 16 | 1.2% |
| White / Caucasian | 1,250 | 94.0% |
| Two or more Races | 22 | 1.7% |
| Some other Race | 9 | 0.7% |
| Total | 1,330 | 100.0% |
Ancestry in Wartburg
The most populous ancestries reported in Wartburg are German (293 | 22.0%), Irish (262 | 19.7%), English (171 | 12.9%), Dutch (81 | 6.1%), and Scottish (69 | 5.2%), together accounting for 65.9% of all Wartburg residents.
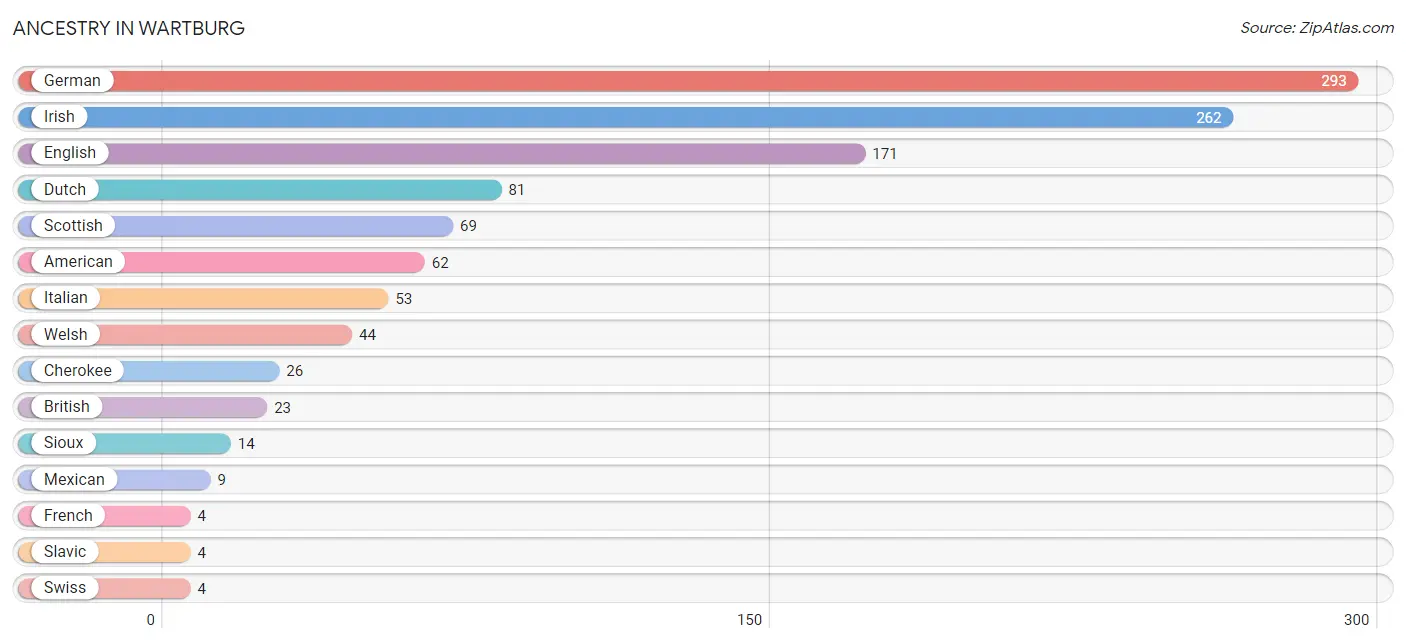
| Ancestry | # Population | % Population |
| American | 62 | 4.7% |
| British | 23 | 1.7% |
| Cherokee | 26 | 1.9% |
| Czech | 3 | 0.2% |
| Dutch | 81 | 6.1% |
| Dutch West Indian | 1 | 0.1% |
| English | 171 | 12.9% |
| European | 3 | 0.2% |
| French | 4 | 0.3% |
| German | 293 | 22.0% |
| Irish | 262 | 19.7% |
| Italian | 53 | 4.0% |
| Jamaican | 3 | 0.2% |
| Mexican | 9 | 0.7% |
| Norwegian | 2 | 0.2% |
| Polish | 3 | 0.2% |
| Scotch-Irish | 3 | 0.2% |
| Scottish | 69 | 5.2% |
| Sioux | 14 | 1.1% |
| Slavic | 4 | 0.3% |
| Swiss | 4 | 0.3% |
| Welsh | 44 | 3.3% | View All 22 Rows |
Immigrants in Wartburg
The most numerous immigrant groups reported in Wartburg came from Central America (9 | 0.7%), Latin America (9 | 0.7%), and Mexico (9 | 0.7%), together accounting for 2.0% of all Wartburg residents.
| Immigration Origin | # Population | % Population |
| Central America | 9 | 0.7% |
| Latin America | 9 | 0.7% |
| Mexico | 9 | 0.7% | View All 3 Rows |
Sex and Age in Wartburg
Sex and Age in Wartburg
The most populous age groups in Wartburg are 30 to 34 Years (88 | 13.9%) for men and 10 to 14 Years (72 | 10.3%) for women.
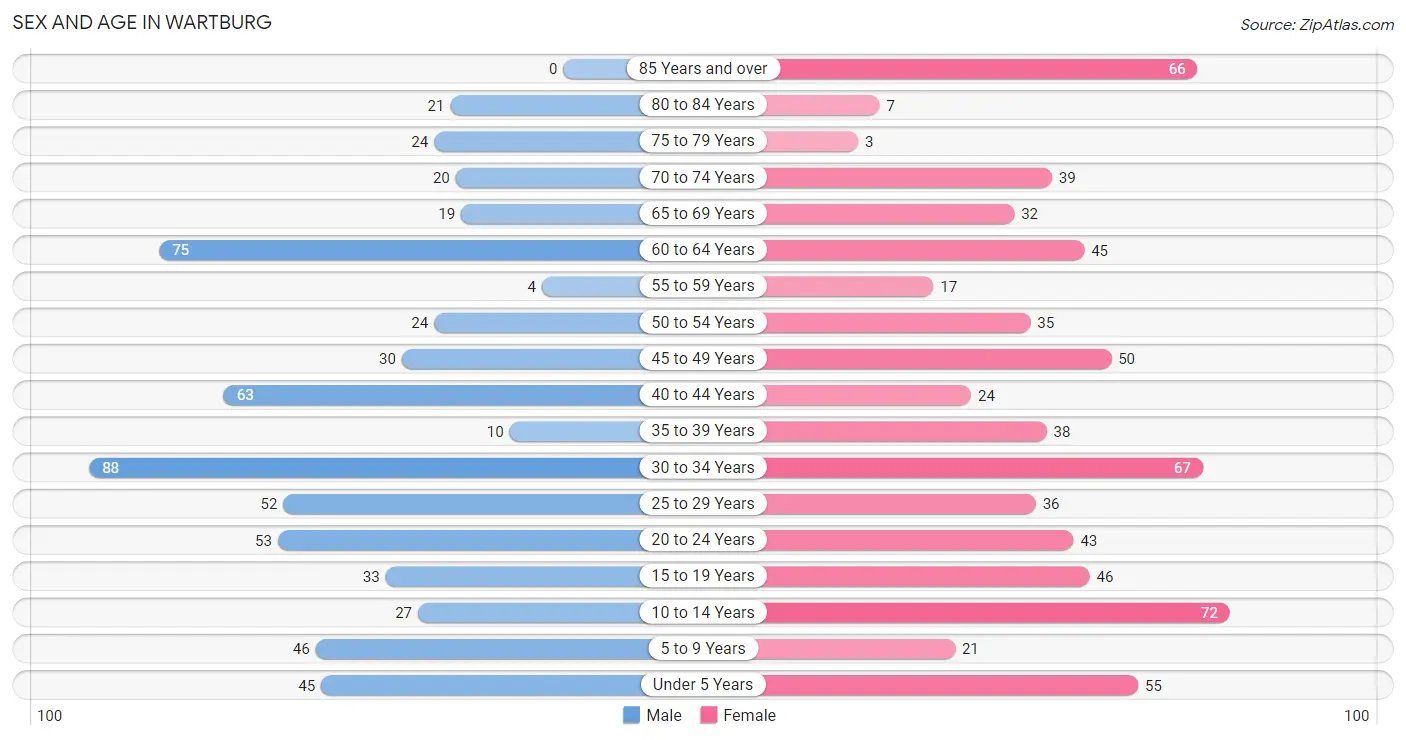
| Age Bracket | Male | Female |
| Under 5 Years | 45 (7.1%) | 55 (7.9%) |
| 5 to 9 Years | 46 (7.3%) | 21 (3.0%) |
| 10 to 14 Years | 27 (4.3%) | 72 (10.3%) |
| 15 to 19 Years | 33 (5.2%) | 46 (6.6%) |
| 20 to 24 Years | 53 (8.4%) | 43 (6.2%) |
| 25 to 29 Years | 52 (8.2%) | 36 (5.2%) |
| 30 to 34 Years | 88 (13.9%) | 67 (9.6%) |
| 35 to 39 Years | 10 (1.6%) | 38 (5.5%) |
| 40 to 44 Years | 63 (9.9%) | 24 (3.5%) |
| 45 to 49 Years | 30 (4.7%) | 50 (7.2%) |
| 50 to 54 Years | 24 (3.8%) | 35 (5.0%) |
| 55 to 59 Years | 4 (0.6%) | 17 (2.4%) |
| 60 to 64 Years | 75 (11.8%) | 45 (6.5%) |
| 65 to 69 Years | 19 (3.0%) | 32 (4.6%) |
| 70 to 74 Years | 20 (3.2%) | 39 (5.6%) |
| 75 to 79 Years | 24 (3.8%) | 3 (0.4%) |
| 80 to 84 Years | 21 (3.3%) | 7 (1.0%) |
| 85 Years and over | 0 (0.0%) | 66 (9.5%) |
| Total | 634 (100.0%) | 696 (100.0%) |
Families and Households in Wartburg
Median Family Size in Wartburg
The median family size in Wartburg is 3.82 persons per family, with single male/father families (18 | 7.9%) accounting for the largest median family size of 4 persons per family. On the other hand, single female/mother families (55 | 24.1%) represent the smallest median family size with 3.53 persons per family.
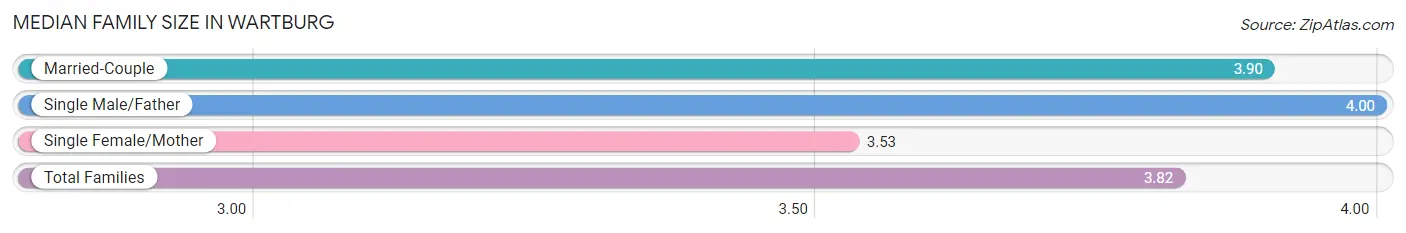
| Family Type | # Families | Family Size |
| Married-Couple | 155 (68.0%) | 3.90 |
| Single Male/Father | 18 (7.9%) | 4.00 |
| Single Female/Mother | 55 (24.1%) | 3.53 |
| Total Families | 228 (100.0%) | 3.82 |
Median Household Size in Wartburg
The median household size in Wartburg is 2.73 persons per household, with single male/father households (18 | 4.2%) accounting for the largest median household size of 5.28 persons per household. non-family households (205 | 47.3%) represent the smallest median household size with 1.40 persons per household.
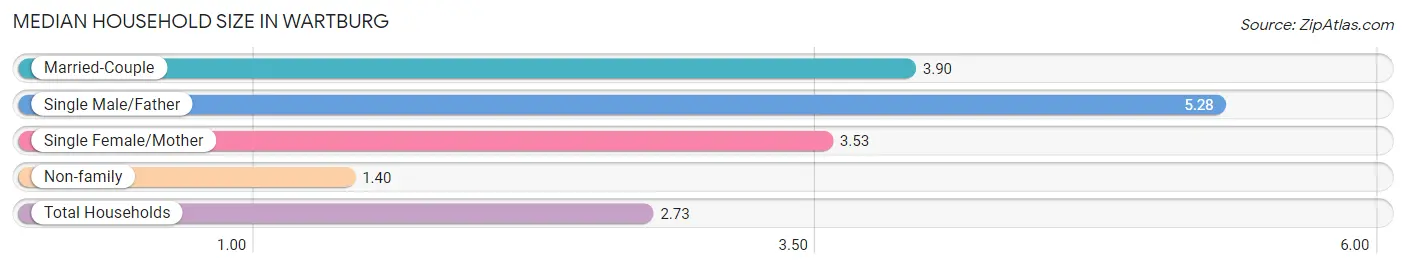
| Household Type | # Households | Household Size |
| Married-Couple | 155 (35.8%) | 3.90 |
| Single Male/Father | 18 (4.2%) | 5.28 |
| Single Female/Mother | 55 (12.7%) | 3.53 |
| Non-family | 205 (47.3%) | 1.40 |
| Total Households | 433 (100.0%) | 2.73 |
Household Size by Marriage Status in Wartburg
Out of a total of 433 households in Wartburg, 228 (52.7%) are family households, while 205 (47.3%) are nonfamily households. The most numerous type of family households are 2-person households, comprising 81, and the most common type of nonfamily households are 1-person households, comprising 173.
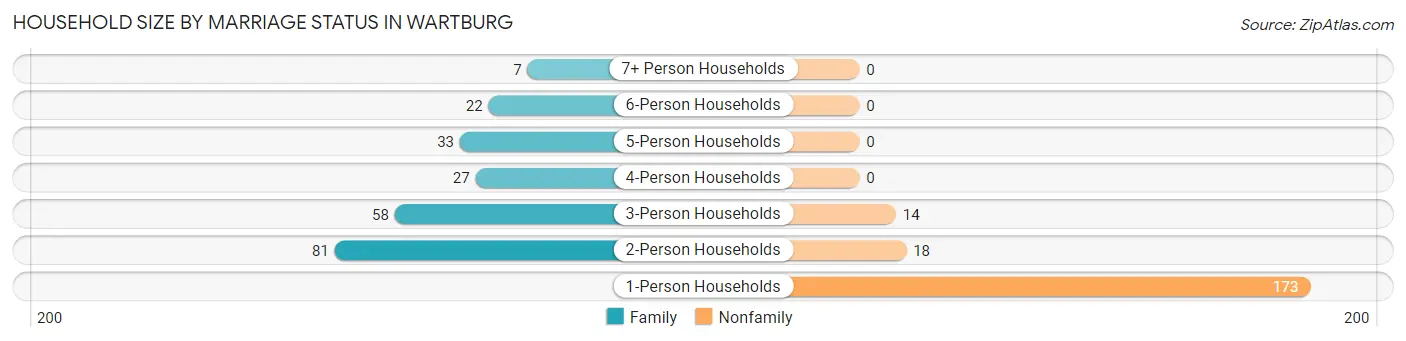
| Household Size | Family Households | Nonfamily Households |
| 1-Person Households | - | 173 (40.0%) |
| 2-Person Households | 81 (18.7%) | 18 (4.2%) |
| 3-Person Households | 58 (13.4%) | 14 (3.2%) |
| 4-Person Households | 27 (6.2%) | 0 (0.0%) |
| 5-Person Households | 33 (7.6%) | 0 (0.0%) |
| 6-Person Households | 22 (5.1%) | 0 (0.0%) |
| 7+ Person Households | 7 (1.6%) | 0 (0.0%) |
| Total | 228 (52.7%) | 205 (47.3%) |
Female Fertility in Wartburg
Fertility by Age in Wartburg
Average fertility rate in Wartburg is 20.0 births per 1,000 women. Women in the age bracket of 20 to 34 years have the highest fertility rate with 41.0 births per 1,000 women. Women in the age bracket of 20 to 34 years acount for 100.0% of all women with births.
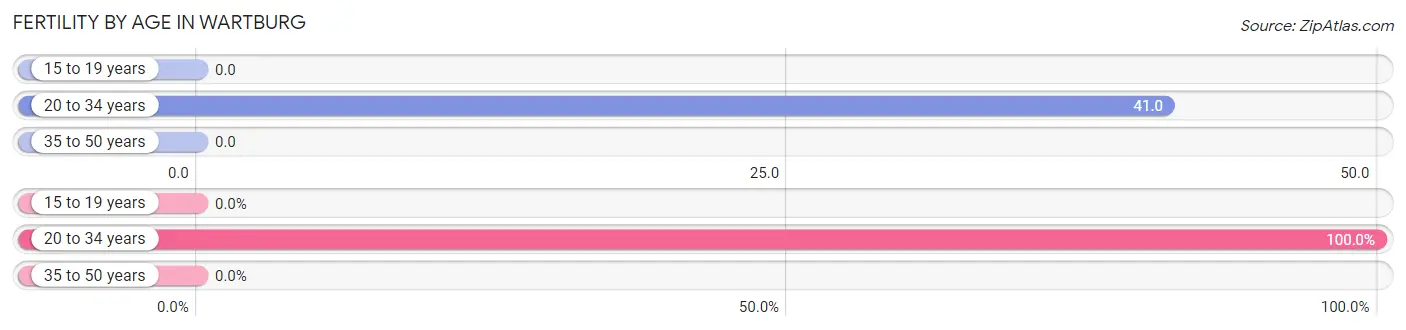
| Age Bracket | Women with Births | Births / 1,000 Women |
| 15 to 19 years | 0 (0.0%) | 0.0 |
| 20 to 34 years | 6 (100.0%) | 41.0 |
| 35 to 50 years | 0 (0.0%) | 0.0 |
| Total | 6 (100.0%) | 20.0 |
Fertility by Age by Marriage Status in Wartburg
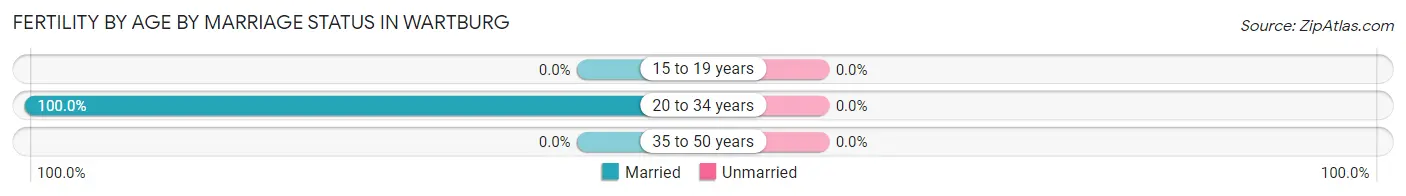
| Age Bracket | Married | Unmarried |
| 15 to 19 years | 0 (0.0%) | 0 (0.0%) |
| 20 to 34 years | 6 (100.0%) | 0 (0.0%) |
| 35 to 50 years | 0 (0.0%) | 0 (0.0%) |
| Total | 6 (100.0%) | 0 (0.0%) |
Fertility by Education in Wartburg
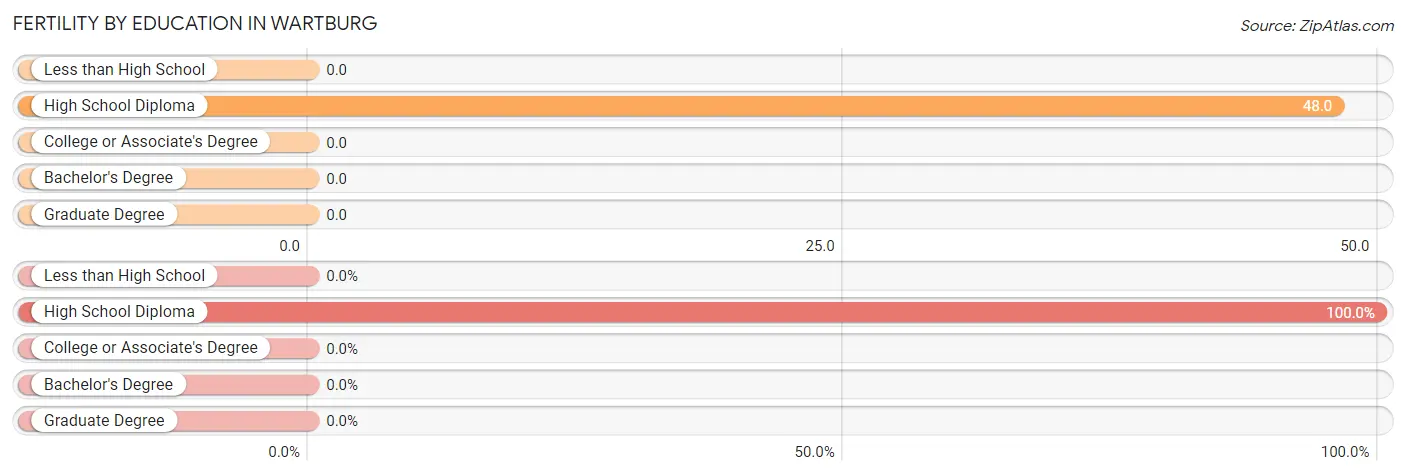
| Educational Attainment | Women with Births | Births / 1,000 Women |
| Less than High School | 0 (0.0%) | 0.0 |
| High School Diploma | 6 (100.0%) | 48.0 |
| College or Associate's Degree | 0 (0.0%) | 0.0 |
| Bachelor's Degree | 0 (0.0%) | 0.0 |
| Graduate Degree | 0 (0.0%) | 0.0 |
| Total | 6 (100.0%) | 20.0 |
Fertility by Education by Marriage Status in Wartburg
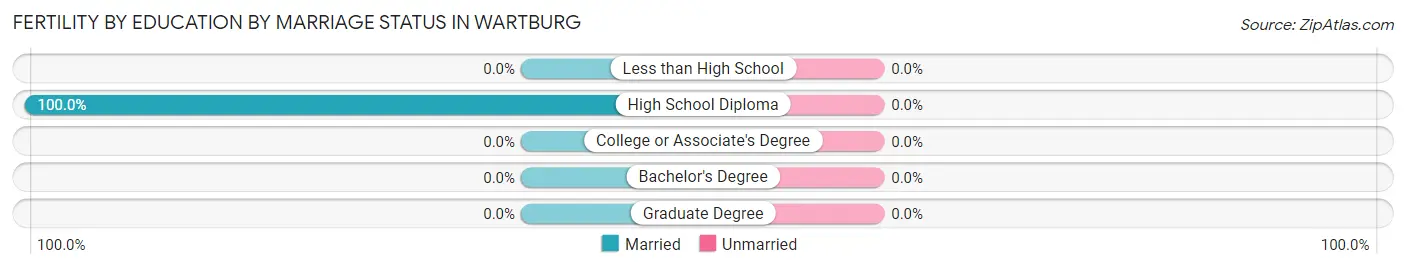
| Educational Attainment | Married | Unmarried |
| Less than High School | 0 (0.0%) | 0 (0.0%) |
| High School Diploma | 6 (100.0%) | 0 (0.0%) |
| College or Associate's Degree | 0 (0.0%) | 0 (0.0%) |
| Bachelor's Degree | 0 (0.0%) | 0 (0.0%) |
| Graduate Degree | 0 (0.0%) | 0 (0.0%) |
| Total | 6 (100.0%) | 0 (0.0%) |
Employment Characteristics in Wartburg
Employment by Class of Employer in Wartburg
Among the 364 employed individuals in Wartburg, private company employees (220 | 60.4%), local government employees (67 | 18.4%), and not-for-profit organizations (25 | 6.9%) make up the most common classes of employment.
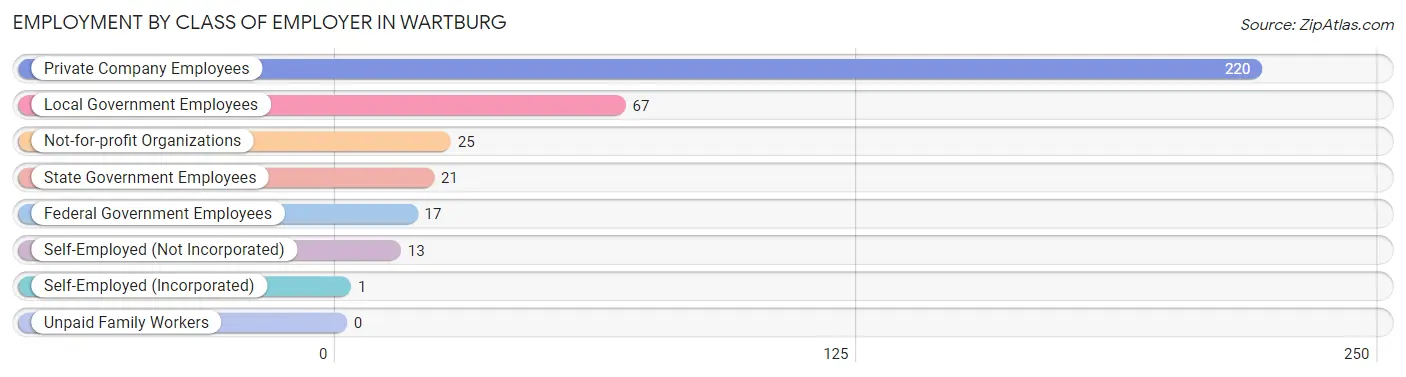
| Employer Class | # Employees | % Employees |
| Private Company Employees | 220 | 60.4% |
| Self-Employed (Incorporated) | 1 | 0.3% |
| Self-Employed (Not Incorporated) | 13 | 3.6% |
| Not-for-profit Organizations | 25 | 6.9% |
| Local Government Employees | 67 | 18.4% |
| State Government Employees | 21 | 5.8% |
| Federal Government Employees | 17 | 4.7% |
| Unpaid Family Workers | 0 | 0.0% |
| Total | 364 | 100.0% |
Employment Status by Age in Wartburg
According to the labor force statistics for Wartburg, out of the total population over 16 years of age (1,039), 38.4% or 399 individuals are in the labor force, with 8.8% or 35 of them unemployed. The age group with the highest labor force participation rate is 25 to 29 years, with 64.8% or 57 individuals in the labor force. Within the labor force, the 20 to 24 years age range has the highest percentage of unemployed individuals, with 55.8% or 29 of them being unemployed.
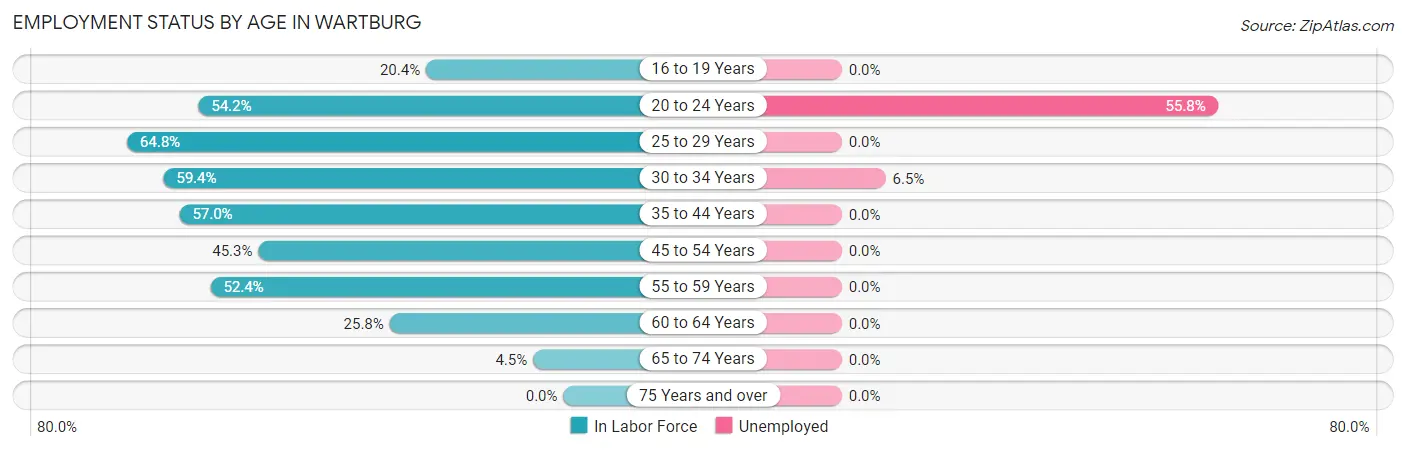
| Age Bracket | In Labor Force | Unemployed |
| 16 to 19 Years | 11 (20.4%) | 0 (0.0%) |
| 20 to 24 Years | 52 (54.2%) | 29 (55.8%) |
| 25 to 29 Years | 57 (64.8%) | 0 (0.0%) |
| 30 to 34 Years | 92 (59.4%) | 6 (6.5%) |
| 35 to 44 Years | 77 (57.0%) | 0 (0.0%) |
| 45 to 54 Years | 63 (45.3%) | 0 (0.0%) |
| 55 to 59 Years | 11 (52.4%) | 0 (0.0%) |
| 60 to 64 Years | 31 (25.8%) | 0 (0.0%) |
| 65 to 74 Years | 5 (4.5%) | 0 (0.0%) |
| 75 Years and over | 0 (0.0%) | 0 (0.0%) |
| Total | 399 (38.4%) | 35 (8.8%) |
Employment Status by Educational Attainment in Wartburg
According to labor force statistics for Wartburg, 50.3% of individuals (331) out of the total population between 25 and 64 years of age (658) are in the labor force, with 1.8% or 6 of them being unemployed. The group with the highest labor force participation rate are those with the educational attainment of bachelor's degree or higher, with 74.5% or 105 individuals in the labor force. Within the labor force, individuals with college / associate degree education have the highest percentage of unemployment, with 3.4% or 3 of them being unemployed.
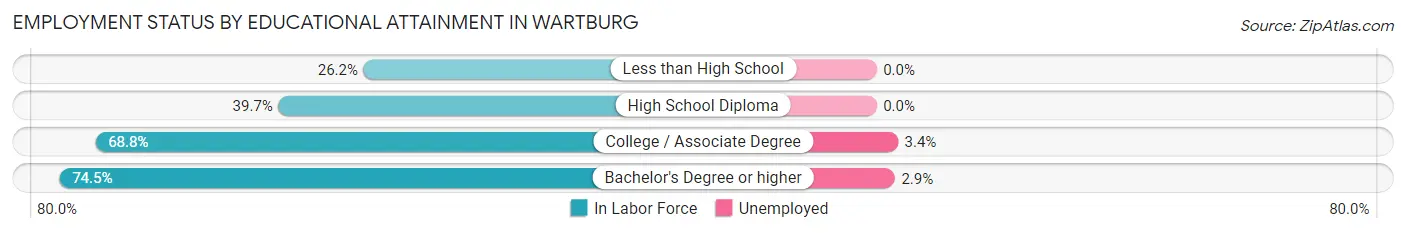
| Educational Attainment | In Labor Force | Unemployed |
| Less than High School | 32 (26.2%) | 0 (0.0%) |
| High School Diploma | 106 (39.7%) | 0 (0.0%) |
| College / Associate Degree | 88 (68.8%) | 4 (3.4%) |
| Bachelor's Degree or higher | 105 (74.5%) | 4 (2.9%) |
| Total | 331 (50.3%) | 12 (1.8%) |
Employment Occupations by Sex in Wartburg
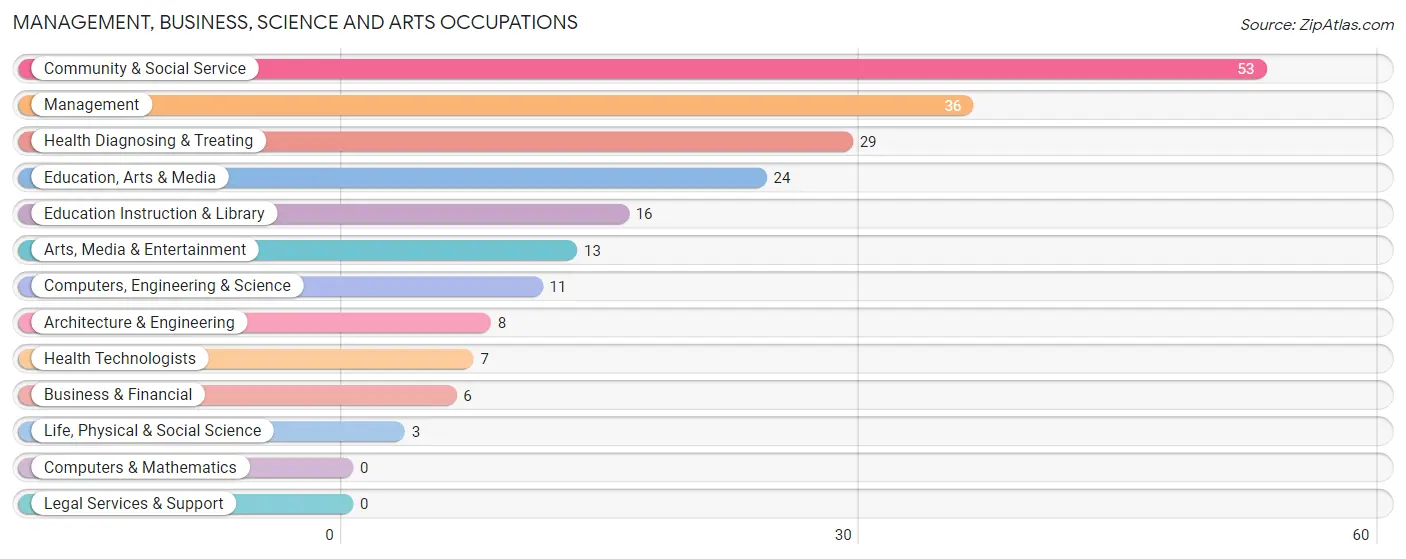
Management, Business, Science and Arts Occupations
The most common Management, Business, Science and Arts occupations in Wartburg are Community & Social Service (53 | 14.6%), Management (36 | 9.9%), Health Diagnosing & Treating (29 | 8.0%), Education, Arts & Media (24 | 6.6%), and Education Instruction & Library (16 | 4.4%).
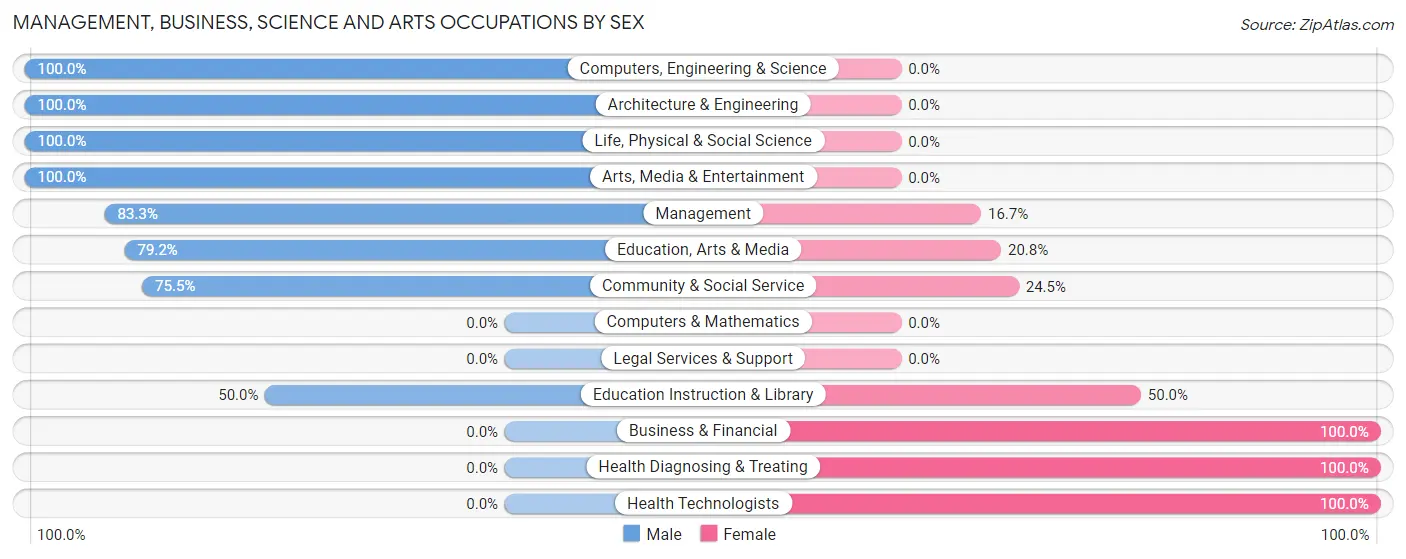
Management, Business, Science and Arts Occupations by Sex
Within the Management, Business, Science and Arts occupations in Wartburg, the most male-oriented occupations are Computers, Engineering & Science (100.0%), Architecture & Engineering (100.0%), and Life, Physical & Social Science (100.0%), while the most female-oriented occupations are Business & Financial (100.0%), Health Diagnosing & Treating (100.0%), and Health Technologists (100.0%).
| Occupation | Male | Female |
| Management | 30 (83.3%) | 6 (16.7%) |
| Business & Financial | 0 (0.0%) | 6 (100.0%) |
| Computers, Engineering & Science | 11 (100.0%) | 0 (0.0%) |
| Computers & Mathematics | 0 (0.0%) | 0 (0.0%) |
| Architecture & Engineering | 8 (100.0%) | 0 (0.0%) |
| Life, Physical & Social Science | 3 (100.0%) | 0 (0.0%) |
| Community & Social Service | 40 (75.5%) | 13 (24.5%) |
| Education, Arts & Media | 19 (79.2%) | 5 (20.8%) |
| Legal Services & Support | 0 (0.0%) | 0 (0.0%) |
| Education Instruction & Library | 8 (50.0%) | 8 (50.0%) |
| Arts, Media & Entertainment | 13 (100.0%) | 0 (0.0%) |
| Health Diagnosing & Treating | 0 (0.0%) | 29 (100.0%) |
| Health Technologists | 0 (0.0%) | 7 (100.0%) |
| Total (Category) | 81 (60.0%) | 54 (40.0%) |
| Total (Overall) | 220 (60.4%) | 144 (39.6%) |
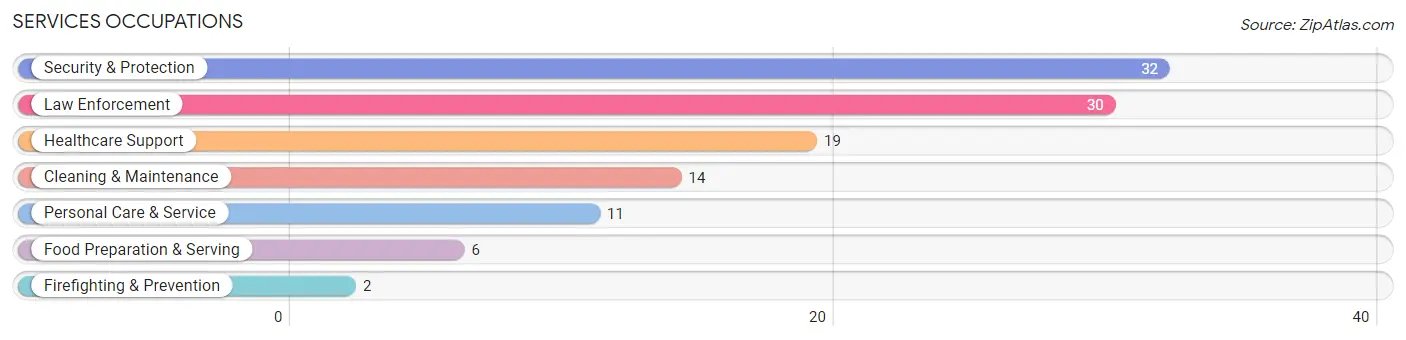
Services Occupations
The most common Services occupations in Wartburg are Security & Protection (32 | 8.8%), Law Enforcement (30 | 8.2%), Healthcare Support (19 | 5.2%), Cleaning & Maintenance (14 | 3.8%), and Personal Care & Service (11 | 3.0%).
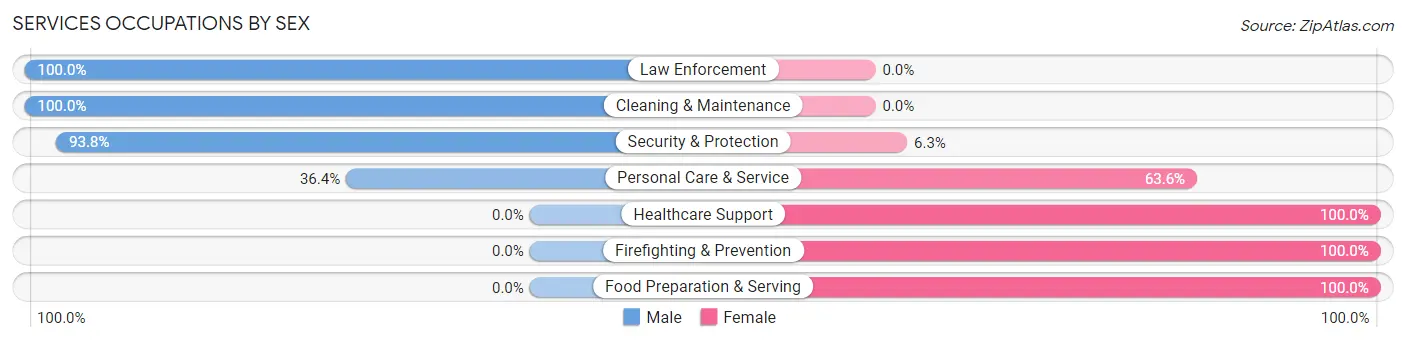
Services Occupations by Sex
Within the Services occupations in Wartburg, the most male-oriented occupations are Law Enforcement (100.0%), Cleaning & Maintenance (100.0%), and Security & Protection (93.8%), while the most female-oriented occupations are Healthcare Support (100.0%), Firefighting & Prevention (100.0%), and Food Preparation & Serving (100.0%).
| Occupation | Male | Female |
| Healthcare Support | 0 (0.0%) | 19 (100.0%) |
| Security & Protection | 30 (93.8%) | 2 (6.2%) |
| Firefighting & Prevention | 0 (0.0%) | 2 (100.0%) |
| Law Enforcement | 30 (100.0%) | 0 (0.0%) |
| Food Preparation & Serving | 0 (0.0%) | 6 (100.0%) |
| Cleaning & Maintenance | 14 (100.0%) | 0 (0.0%) |
| Personal Care & Service | 4 (36.4%) | 7 (63.6%) |
| Total (Category) | 48 (58.5%) | 34 (41.5%) |
| Total (Overall) | 220 (60.4%) | 144 (39.6%) |
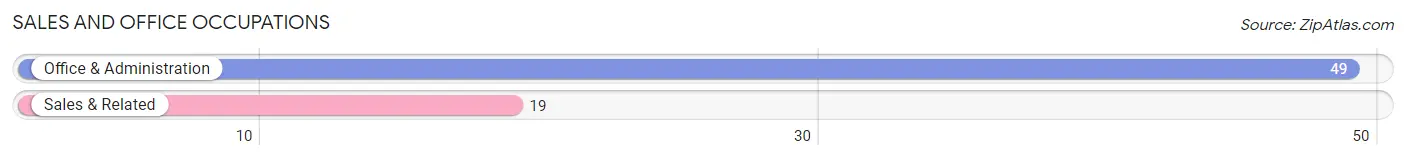
Sales and Office Occupations
The most common Sales and Office occupations in Wartburg are Office & Administration (49 | 13.5%), and Sales & Related (19 | 5.2%).
Sales and Office Occupations by Sex
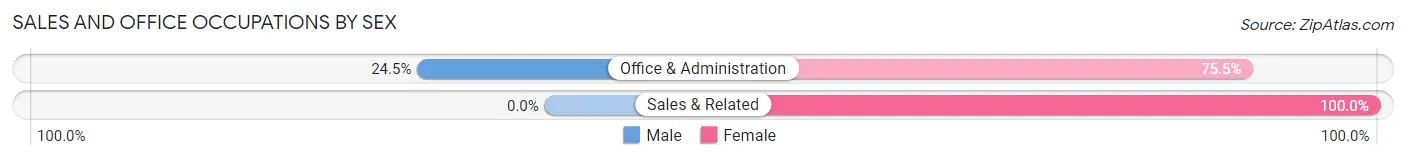
| Occupation | Male | Female |
| Sales & Related | 0 (0.0%) | 19 (100.0%) |
| Office & Administration | 12 (24.5%) | 37 (75.5%) |
| Total (Category) | 12 (17.6%) | 56 (82.4%) |
| Total (Overall) | 220 (60.4%) | 144 (39.6%) |
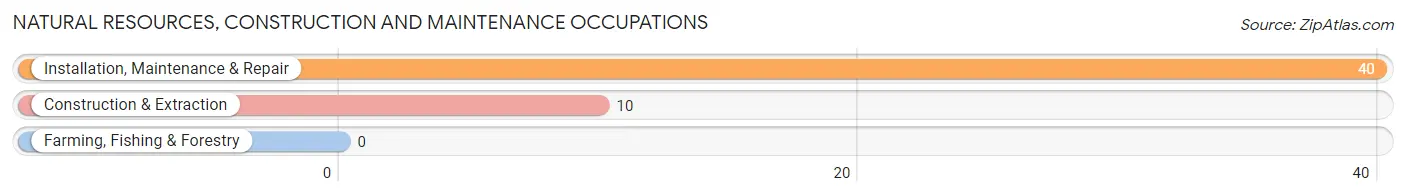
Natural Resources, Construction and Maintenance Occupations
The most common Natural Resources, Construction and Maintenance occupations in Wartburg are Installation, Maintenance & Repair (40 | 11.0%), and Construction & Extraction (10 | 2.8%).
Natural Resources, Construction and Maintenance Occupations by Sex
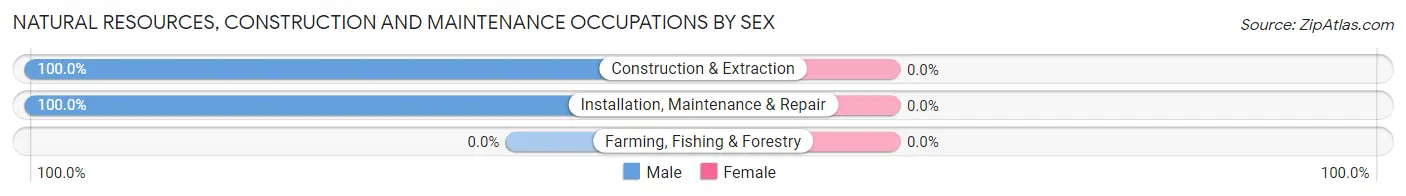
| Occupation | Male | Female |
| Farming, Fishing & Forestry | 0 (0.0%) | 0 (0.0%) |
| Construction & Extraction | 10 (100.0%) | 0 (0.0%) |
| Installation, Maintenance & Repair | 40 (100.0%) | 0 (0.0%) |
| Total (Category) | 50 (100.0%) | 0 (0.0%) |
| Total (Overall) | 220 (60.4%) | 144 (39.6%) |
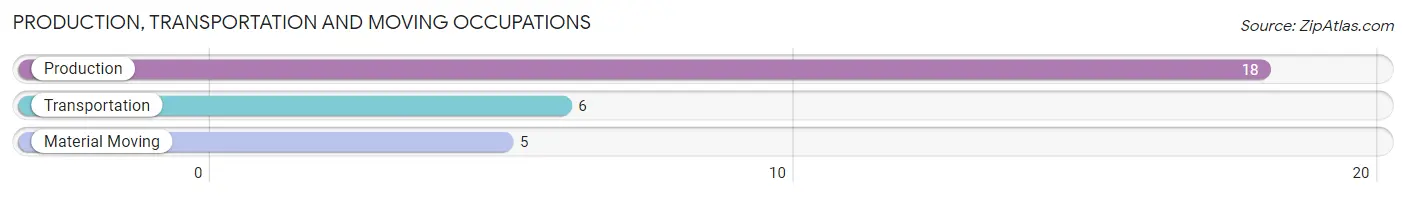
Production, Transportation and Moving Occupations
The most common Production, Transportation and Moving occupations in Wartburg are Production (18 | 5.0%), Transportation (6 | 1.7%), and Material Moving (5 | 1.4%).
Production, Transportation and Moving Occupations by Sex
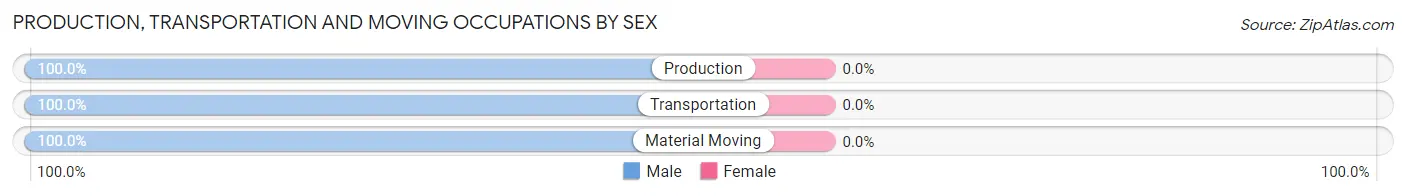
| Occupation | Male | Female |
| Production | 18 (100.0%) | 0 (0.0%) |
| Transportation | 6 (100.0%) | 0 (0.0%) |
| Material Moving | 5 (100.0%) | 0 (0.0%) |
| Total (Category) | 29 (100.0%) | 0 (0.0%) |
| Total (Overall) | 220 (60.4%) | 144 (39.6%) |
Employment Industries by Sex in Wartburg
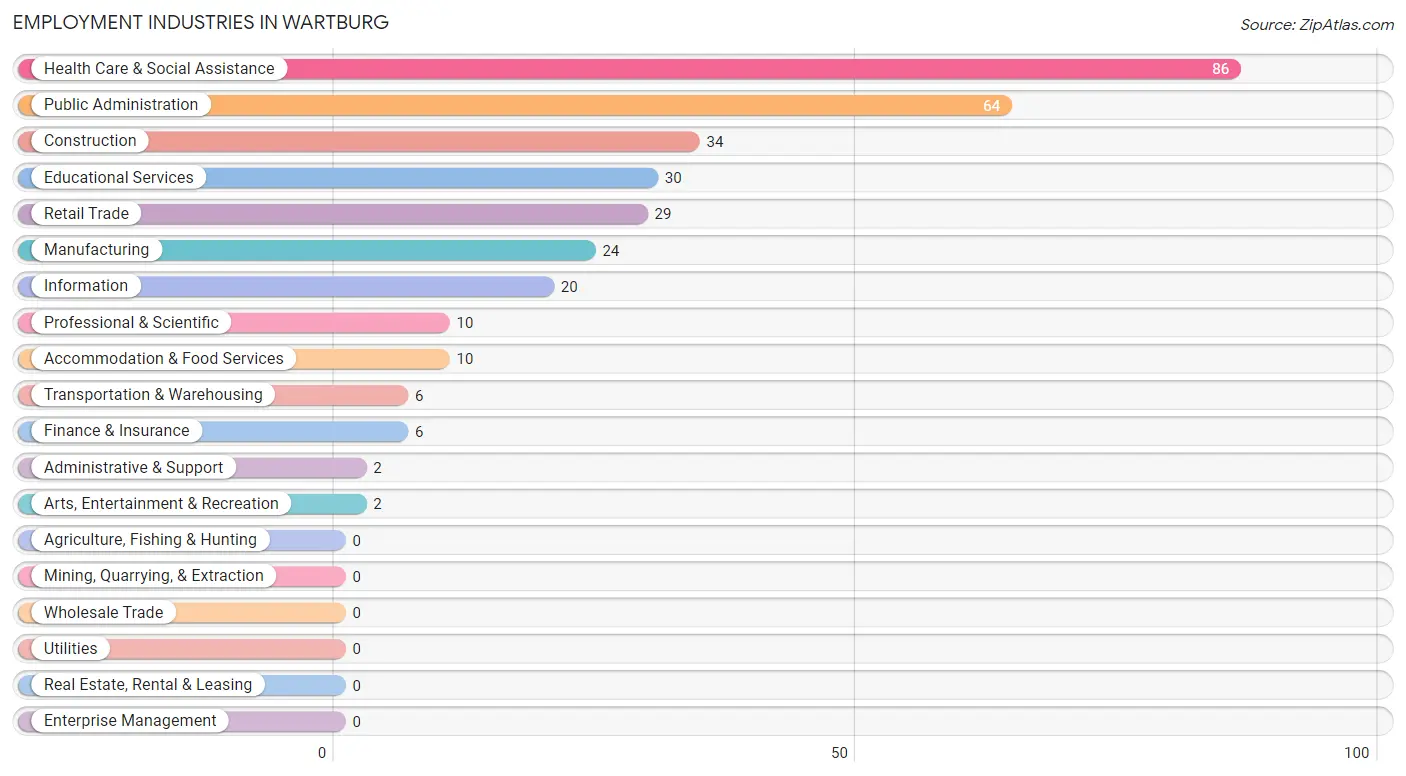
Employment Industries in Wartburg
The major employment industries in Wartburg include Health Care & Social Assistance (86 | 23.6%), Public Administration (64 | 17.6%), Construction (34 | 9.3%), Educational Services (30 | 8.2%), and Retail Trade (29 | 8.0%).
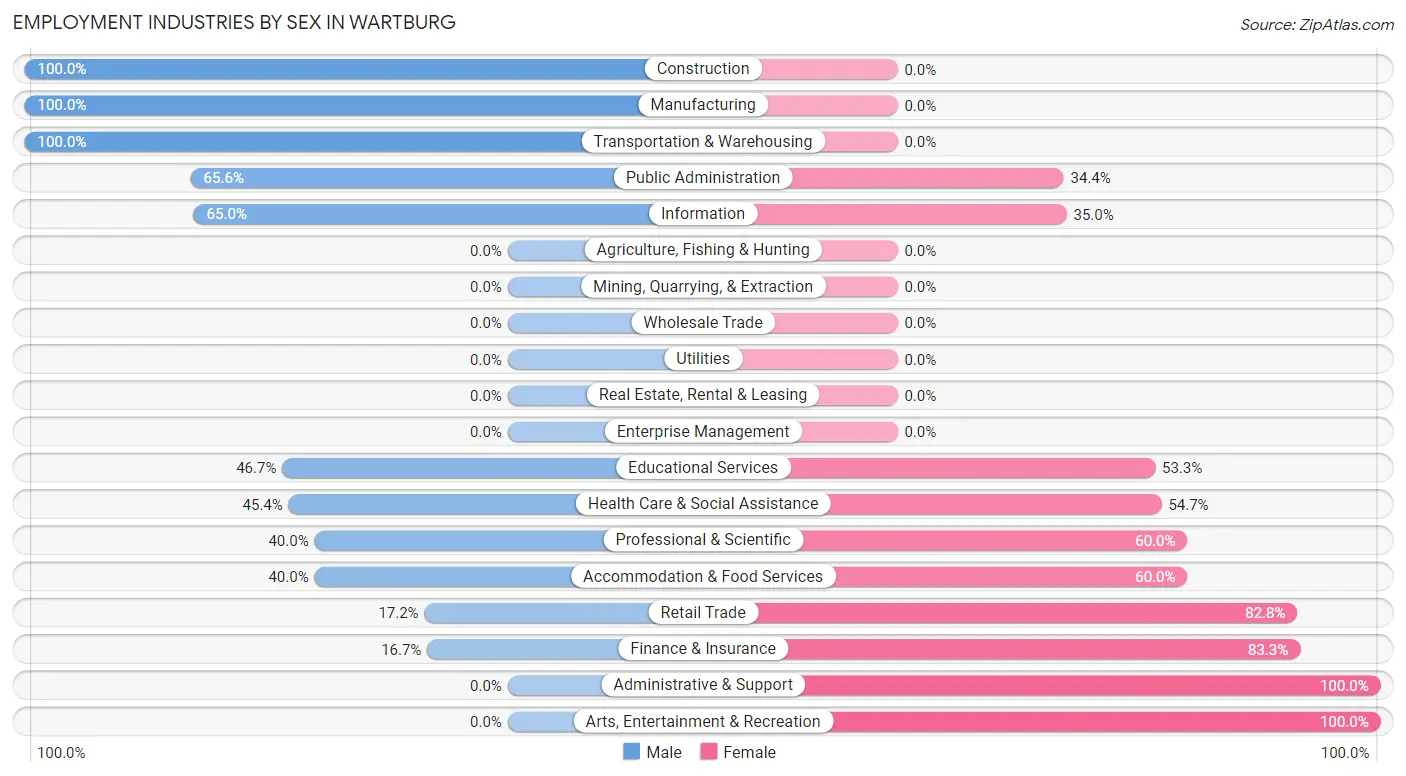
Employment Industries by Sex in Wartburg
The Wartburg industries that see more men than women are Construction (100.0%), Manufacturing (100.0%), and Transportation & Warehousing (100.0%), whereas the industries that tend to have a higher number of women are Administrative & Support (100.0%), Arts, Entertainment & Recreation (100.0%), and Finance & Insurance (83.3%).
| Industry | Male | Female |
| Agriculture, Fishing & Hunting | 0 (0.0%) | 0 (0.0%) |
| Mining, Quarrying, & Extraction | 0 (0.0%) | 0 (0.0%) |
| Construction | 34 (100.0%) | 0 (0.0%) |
| Manufacturing | 24 (100.0%) | 0 (0.0%) |
| Wholesale Trade | 0 (0.0%) | 0 (0.0%) |
| Retail Trade | 5 (17.2%) | 24 (82.8%) |
| Transportation & Warehousing | 6 (100.0%) | 0 (0.0%) |
| Utilities | 0 (0.0%) | 0 (0.0%) |
| Information | 13 (65.0%) | 7 (35.0%) |
| Finance & Insurance | 1 (16.7%) | 5 (83.3%) |
| Real Estate, Rental & Leasing | 0 (0.0%) | 0 (0.0%) |
| Professional & Scientific | 4 (40.0%) | 6 (60.0%) |
| Enterprise Management | 0 (0.0%) | 0 (0.0%) |
| Administrative & Support | 0 (0.0%) | 2 (100.0%) |
| Educational Services | 14 (46.7%) | 16 (53.3%) |
| Health Care & Social Assistance | 39 (45.4%) | 47 (54.6%) |
| Arts, Entertainment & Recreation | 0 (0.0%) | 2 (100.0%) |
| Accommodation & Food Services | 4 (40.0%) | 6 (60.0%) |
| Public Administration | 42 (65.6%) | 22 (34.4%) |
| Total | 220 (60.4%) | 144 (39.6%) |
Education in Wartburg
School Enrollment in Wartburg
The most common levels of schooling among the 292 students in Wartburg are middle school (96 | 32.9%), high school (74 | 25.3%), and elementary school (43 | 14.7%).
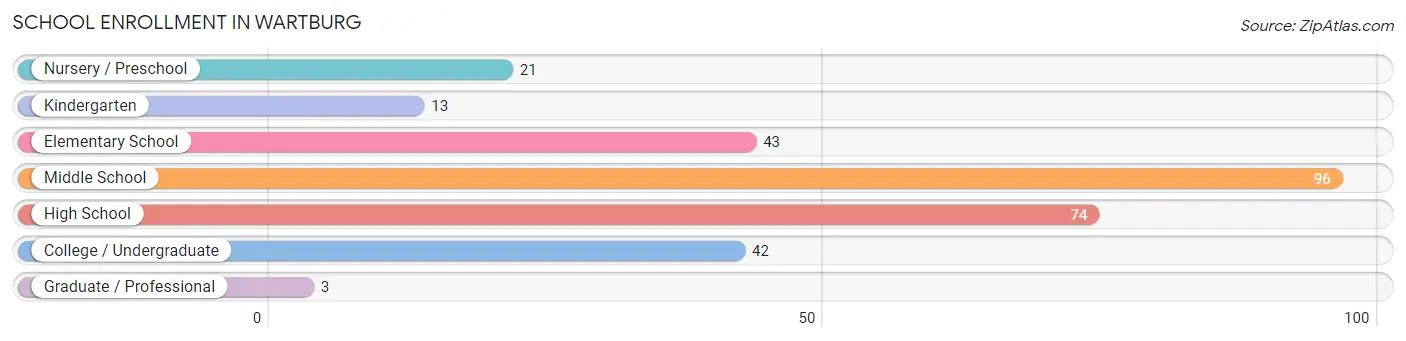
| School Level | # Students | % Students |
| Nursery / Preschool | 21 | 7.2% |
| Kindergarten | 13 | 4.4% |
| Elementary School | 43 | 14.7% |
| Middle School | 96 | 32.9% |
| High School | 74 | 25.3% |
| College / Undergraduate | 42 | 14.4% |
| Graduate / Professional | 3 | 1.0% |
| Total | 292 | 100.0% |
School Enrollment by Age by Funding Source in Wartburg
Out of a total of 292 students who are enrolled in schools in Wartburg, 73 (25.0%) attend a private institution, while the remaining 219 (75.0%) are enrolled in public schools. The age group of 3 to 4 year olds has the highest likelihood of being enrolled in private schools, with 8 (100.0% in the age bracket) enrolled. Conversely, the age group of 18 to 19 year olds has the lowest likelihood of being enrolled in a private school, with 19 (100.0% in the age bracket) attending a public institution.
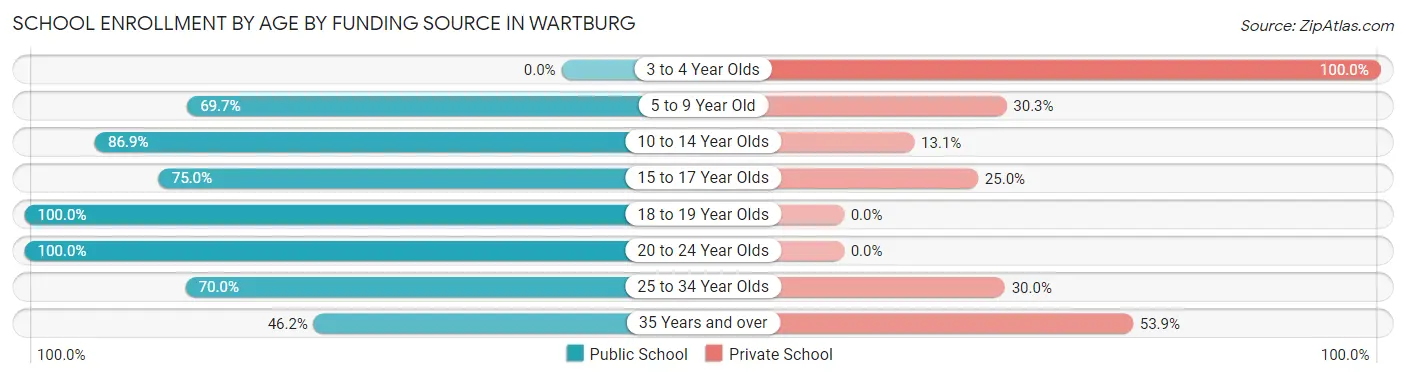
| Age Bracket | Public School | Private School |
| 3 to 4 Year Olds | 0 (0.0%) | 8 (100.0%) |
| 5 to 9 Year Old | 46 (69.7%) | 20 (30.3%) |
| 10 to 14 Year Olds | 86 (86.9%) | 13 (13.1%) |
| 15 to 17 Year Olds | 45 (75.0%) | 15 (25.0%) |
| 18 to 19 Year Olds | 19 (100.0%) | 0 (0.0%) |
| 20 to 24 Year Olds | 4 (100.0%) | 0 (0.0%) |
| 25 to 34 Year Olds | 7 (70.0%) | 3 (30.0%) |
| 35 Years and over | 12 (46.2%) | 14 (53.8%) |
| Total | 219 (75.0%) | 73 (25.0%) |
Educational Attainment by Field of Study in Wartburg
Bio, nature & agricultural (34 | 19.8%), education (29 | 16.9%), arts & humanities (29 | 16.9%), business (23 | 13.4%), and science & technology (14 | 8.1%) are the most common fields of study among 172 individuals in Wartburg who have obtained a bachelor's degree or higher.
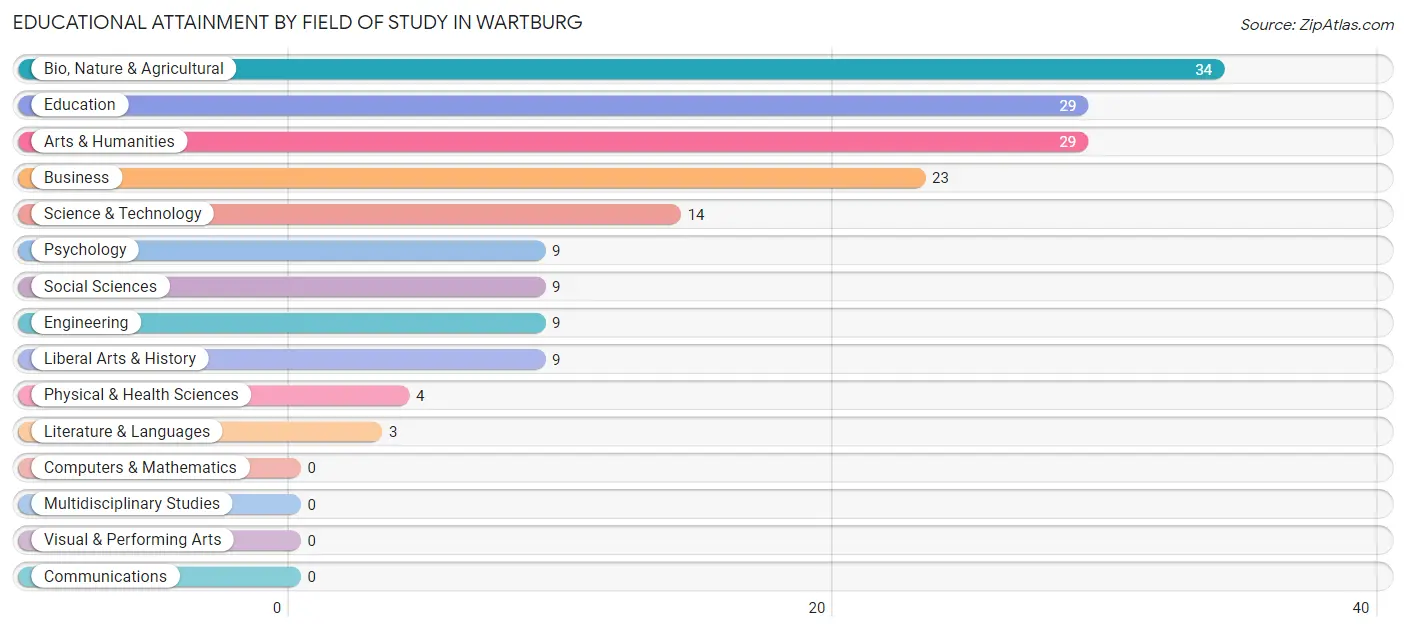
| Field of Study | # Graduates | % Graduates |
| Computers & Mathematics | 0 | 0.0% |
| Bio, Nature & Agricultural | 34 | 19.8% |
| Physical & Health Sciences | 4 | 2.3% |
| Psychology | 9 | 5.2% |
| Social Sciences | 9 | 5.2% |
| Engineering | 9 | 5.2% |
| Multidisciplinary Studies | 0 | 0.0% |
| Science & Technology | 14 | 8.1% |
| Business | 23 | 13.4% |
| Education | 29 | 16.9% |
| Literature & Languages | 3 | 1.7% |
| Liberal Arts & History | 9 | 5.2% |
| Visual & Performing Arts | 0 | 0.0% |
| Communications | 0 | 0.0% |
| Arts & Humanities | 29 | 16.9% |
| Total | 172 | 100.0% |
Transportation & Commute in Wartburg
Vehicle Availability by Sex in Wartburg
The most prevalent vehicle ownership categories in Wartburg are males with 3 vehicles (100, accounting for 45.5%) and females with 3 vehicles (62, making up 69.4%).
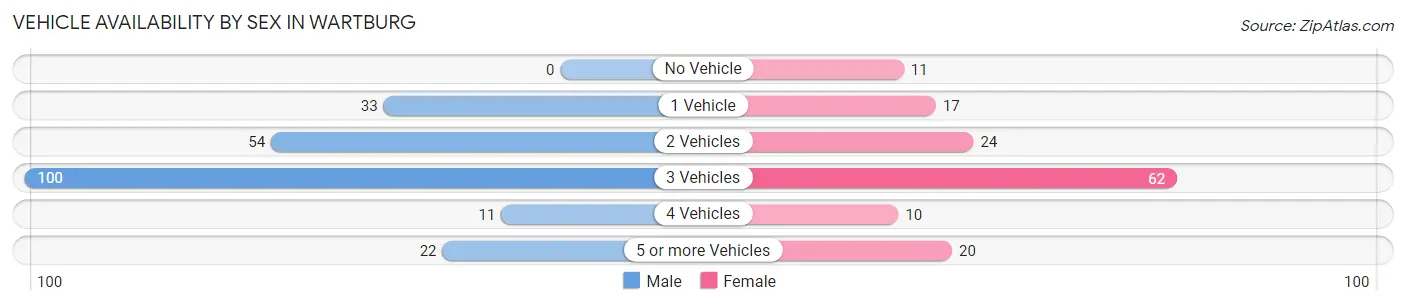
| Vehicles Available | Male | Female |
| No Vehicle | 0 (0.0%) | 11 (7.6%) |
| 1 Vehicle | 33 (15.0%) | 17 (11.8%) |
| 2 Vehicles | 54 (24.5%) | 24 (16.7%) |
| 3 Vehicles | 100 (45.5%) | 62 (43.1%) |
| 4 Vehicles | 11 (5.0%) | 10 (6.9%) |
| 5 or more Vehicles | 22 (10.0%) | 20 (13.9%) |
| Total | 220 (100.0%) | 144 (100.0%) |
Commute Time in Wartburg
The most frequently occuring commute durations in Wartburg are 5 to 9 minutes (89 commuters, 25.3%), less than 5 minutes (69 commuters, 19.6%), and 45 to 59 minutes (63 commuters, 17.9%).
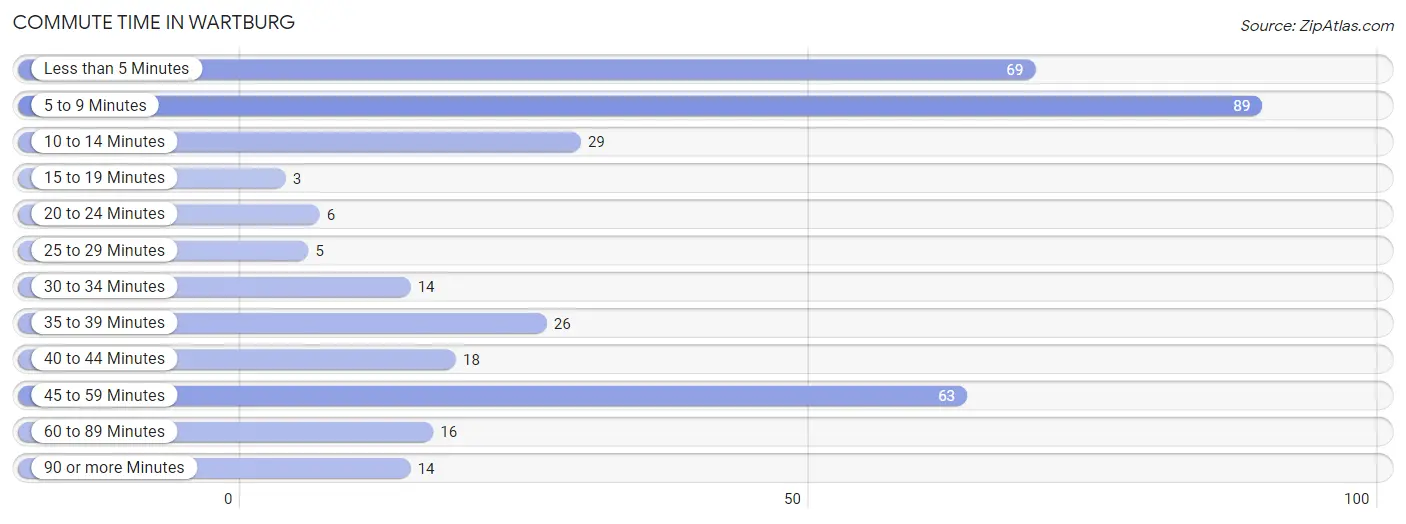
| Commute Time | # Commuters | % Commuters |
| Less than 5 Minutes | 69 | 19.6% |
| 5 to 9 Minutes | 89 | 25.3% |
| 10 to 14 Minutes | 29 | 8.2% |
| 15 to 19 Minutes | 3 | 0.9% |
| 20 to 24 Minutes | 6 | 1.7% |
| 25 to 29 Minutes | 5 | 1.4% |
| 30 to 34 Minutes | 14 | 4.0% |
| 35 to 39 Minutes | 26 | 7.4% |
| 40 to 44 Minutes | 18 | 5.1% |
| 45 to 59 Minutes | 63 | 17.9% |
| 60 to 89 Minutes | 16 | 4.5% |
| 90 or more Minutes | 14 | 4.0% |
Commute Time by Sex in Wartburg
The most common commute times in Wartburg are 5 to 9 minutes (63 commuters, 28.6%) for males and 10 to 14 minutes (27 commuters, 20.4%) for females.
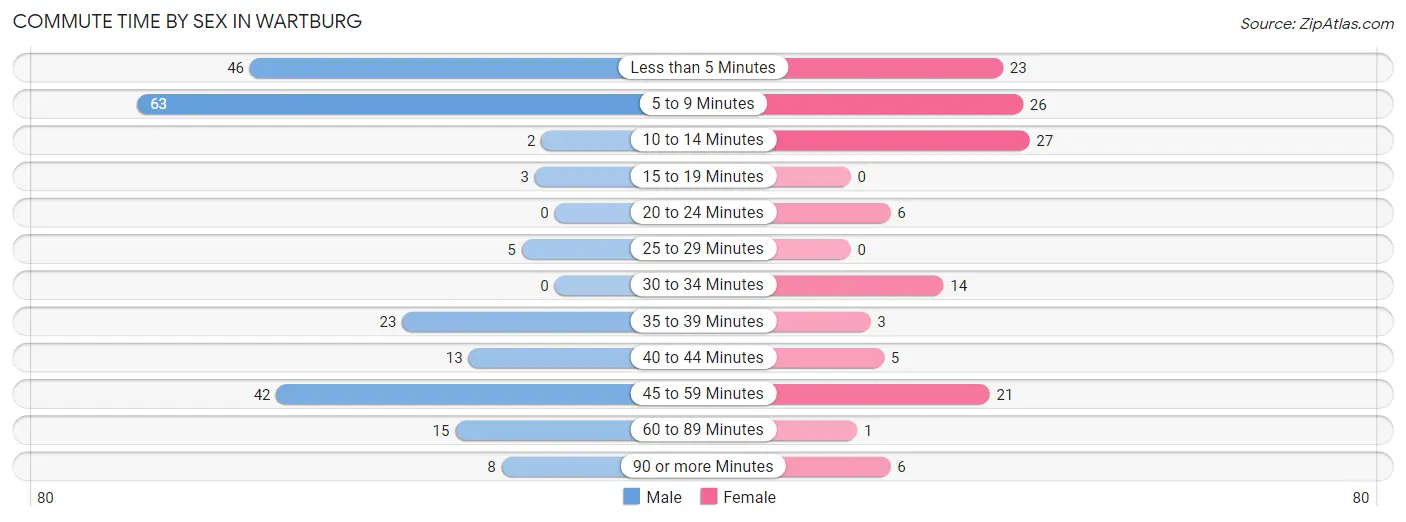
| Commute Time | Male | Female |
| Less than 5 Minutes | 46 (20.9%) | 23 (17.4%) |
| 5 to 9 Minutes | 63 (28.6%) | 26 (19.7%) |
| 10 to 14 Minutes | 2 (0.9%) | 27 (20.4%) |
| 15 to 19 Minutes | 3 (1.4%) | 0 (0.0%) |
| 20 to 24 Minutes | 0 (0.0%) | 6 (4.5%) |
| 25 to 29 Minutes | 5 (2.3%) | 0 (0.0%) |
| 30 to 34 Minutes | 0 (0.0%) | 14 (10.6%) |
| 35 to 39 Minutes | 23 (10.4%) | 3 (2.3%) |
| 40 to 44 Minutes | 13 (5.9%) | 5 (3.8%) |
| 45 to 59 Minutes | 42 (19.1%) | 21 (15.9%) |
| 60 to 89 Minutes | 15 (6.8%) | 1 (0.8%) |
| 90 or more Minutes | 8 (3.6%) | 6 (4.5%) |
Time of Departure to Work by Sex in Wartburg
The most frequent times of departure to work in Wartburg are 7:00 AM to 7:29 AM (75, 34.1%) for males and 8:00 AM to 8:29 AM (29, 22.0%) for females.
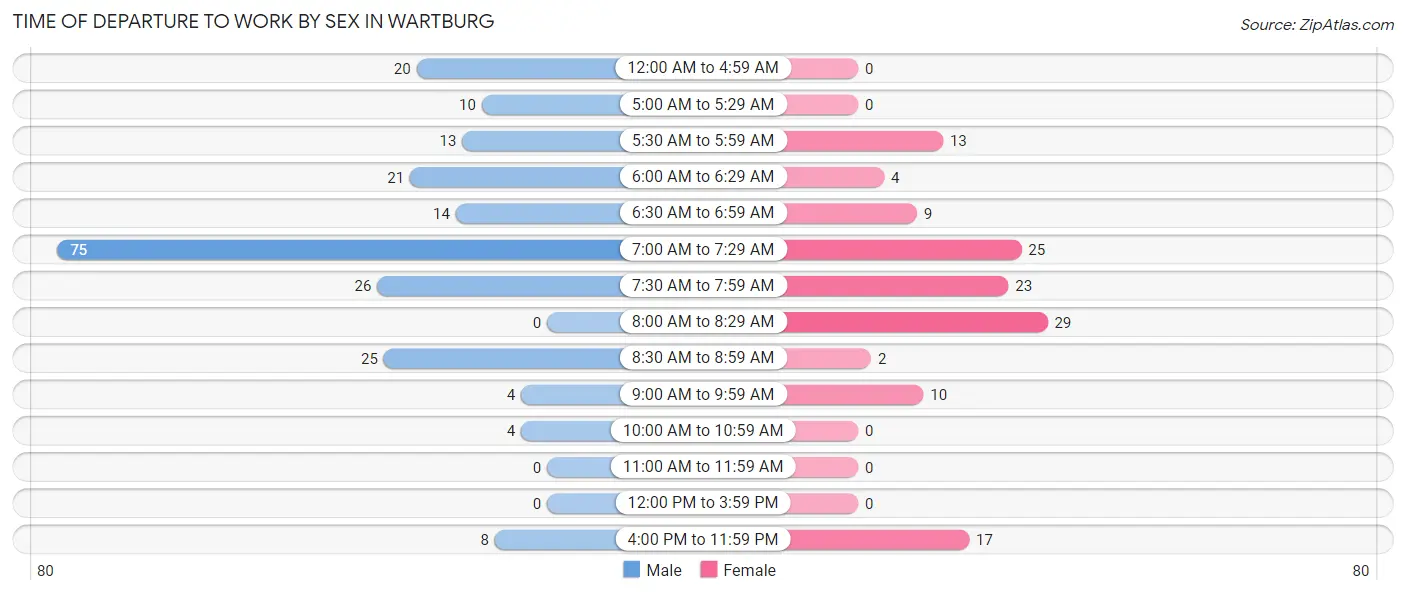
| Time of Departure | Male | Female |
| 12:00 AM to 4:59 AM | 20 (9.1%) | 0 (0.0%) |
| 5:00 AM to 5:29 AM | 10 (4.5%) | 0 (0.0%) |
| 5:30 AM to 5:59 AM | 13 (5.9%) | 13 (9.9%) |
| 6:00 AM to 6:29 AM | 21 (9.6%) | 4 (3.0%) |
| 6:30 AM to 6:59 AM | 14 (6.4%) | 9 (6.8%) |
| 7:00 AM to 7:29 AM | 75 (34.1%) | 25 (18.9%) |
| 7:30 AM to 7:59 AM | 26 (11.8%) | 23 (17.4%) |
| 8:00 AM to 8:29 AM | 0 (0.0%) | 29 (22.0%) |
| 8:30 AM to 8:59 AM | 25 (11.4%) | 2 (1.5%) |
| 9:00 AM to 9:59 AM | 4 (1.8%) | 10 (7.6%) |
| 10:00 AM to 10:59 AM | 4 (1.8%) | 0 (0.0%) |
| 11:00 AM to 11:59 AM | 0 (0.0%) | 0 (0.0%) |
| 12:00 PM to 3:59 PM | 0 (0.0%) | 0 (0.0%) |
| 4:00 PM to 11:59 PM | 8 (3.6%) | 17 (12.9%) |
| Total | 220 (100.0%) | 132 (100.0%) |
Housing Occupancy in Wartburg
Occupancy by Ownership in Wartburg
Of the total 433 dwellings in Wartburg, owner-occupied units account for 145 (33.5%), while renter-occupied units make up 288 (66.5%).
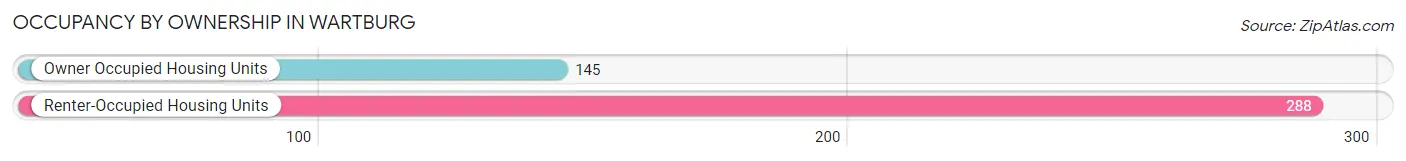
| Occupancy | # Housing Units | % Housing Units |
| Owner Occupied Housing Units | 145 | 33.5% |
| Renter-Occupied Housing Units | 288 | 66.5% |
| Total Occupied Housing Units | 433 | 100.0% |
Occupancy by Household Size in Wartburg
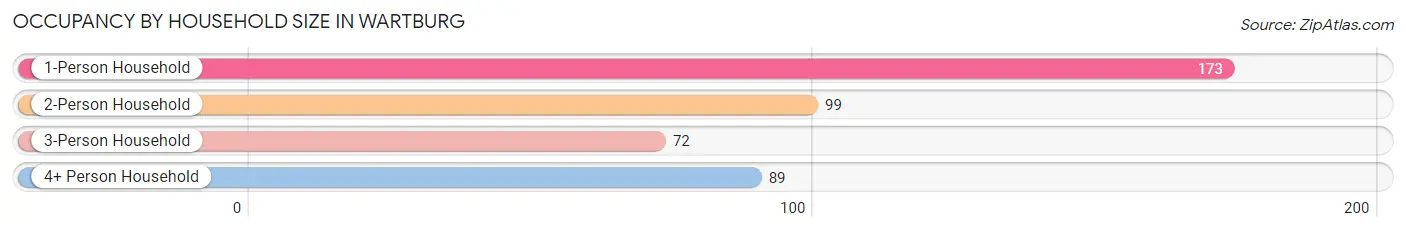
| Household Size | # Housing Units | % Housing Units |
| 1-Person Household | 173 | 40.0% |
| 2-Person Household | 99 | 22.9% |
| 3-Person Household | 72 | 16.6% |
| 4+ Person Household | 89 | 20.5% |
| Total Housing Units | 433 | 100.0% |
Occupancy by Ownership by Household Size in Wartburg
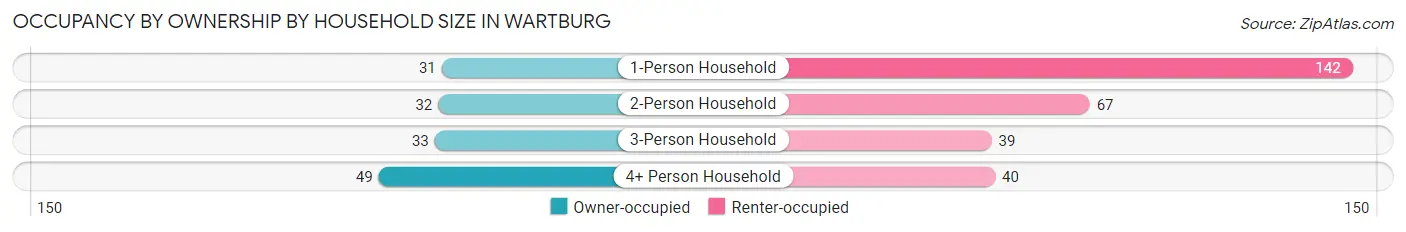
| Household Size | Owner-occupied | Renter-occupied |
| 1-Person Household | 31 (17.9%) | 142 (82.1%) |
| 2-Person Household | 32 (32.3%) | 67 (67.7%) |
| 3-Person Household | 33 (45.8%) | 39 (54.2%) |
| 4+ Person Household | 49 (55.1%) | 40 (44.9%) |
| Total Housing Units | 145 (33.5%) | 288 (66.5%) |
Occupancy by Educational Attainment in Wartburg
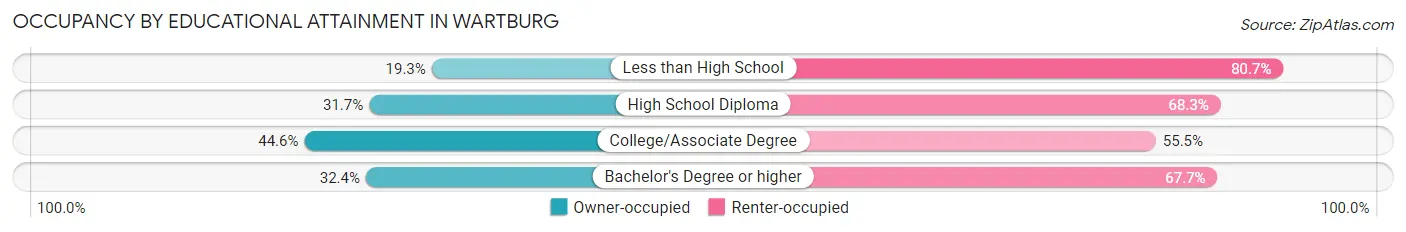
| Household Size | Owner-occupied | Renter-occupied |
| Less than High School | 11 (19.3%) | 46 (80.7%) |
| High School Diploma | 52 (31.7%) | 112 (68.3%) |
| College/Associate Degree | 49 (44.6%) | 61 (55.4%) |
| Bachelor's Degree or higher | 33 (32.4%) | 69 (67.6%) |
Occupancy by Age of Householder in Wartburg
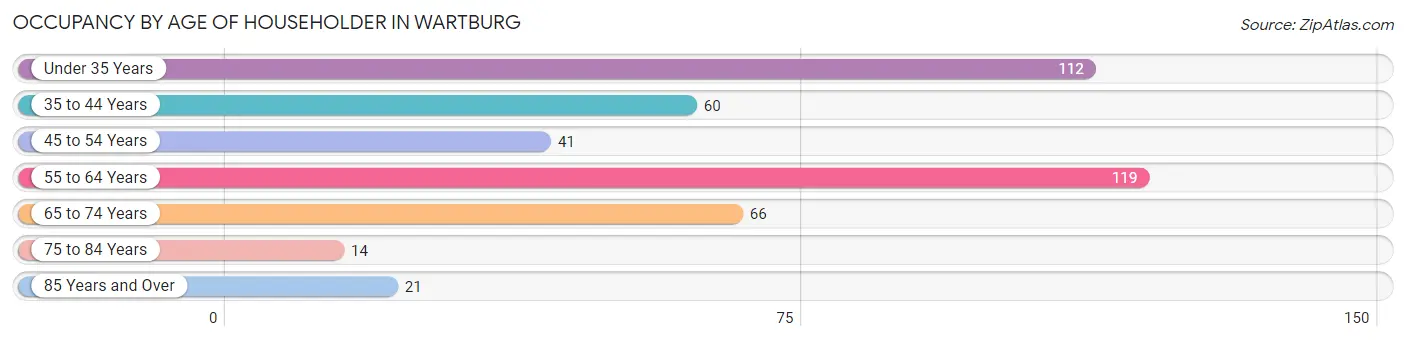
| Age Bracket | # Households | % Households |
| Under 35 Years | 112 | 25.9% |
| 35 to 44 Years | 60 | 13.9% |
| 45 to 54 Years | 41 | 9.5% |
| 55 to 64 Years | 119 | 27.5% |
| 65 to 74 Years | 66 | 15.2% |
| 75 to 84 Years | 14 | 3.2% |
| 85 Years and Over | 21 | 4.9% |
| Total | 433 | 100.0% |
Housing Finances in Wartburg
Median Income by Occupancy in Wartburg
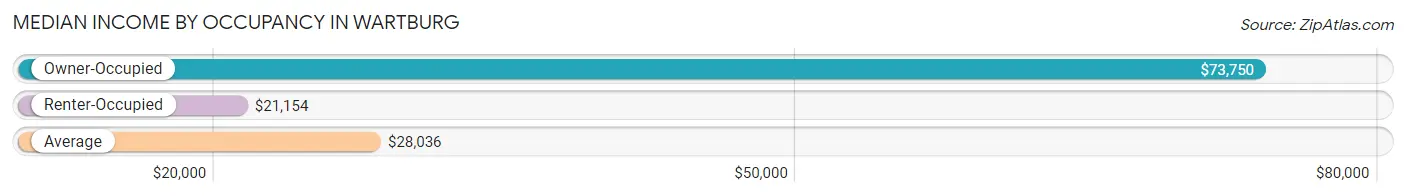
| Occupancy Type | # Households | Median Income |
| Owner-Occupied | 145 (33.5%) | $73,750 |
| Renter-Occupied | 288 (66.5%) | $21,154 |
| Average | 433 (100.0%) | $28,036 |
Occupancy by Householder Income Bracket in Wartburg
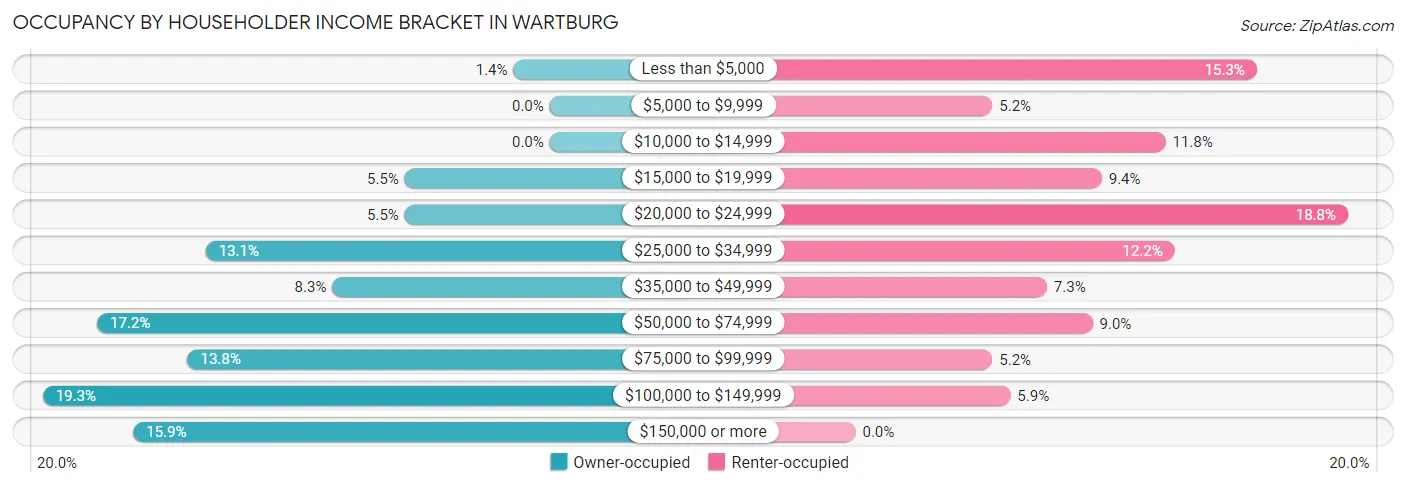
| Income Bracket | Owner-occupied | Renter-occupied |
| Less than $5,000 | 2 (1.4%) | 44 (15.3%) |
| $5,000 to $9,999 | 0 (0.0%) | 15 (5.2%) |
| $10,000 to $14,999 | 0 (0.0%) | 34 (11.8%) |
| $15,000 to $19,999 | 8 (5.5%) | 27 (9.4%) |
| $20,000 to $24,999 | 8 (5.5%) | 54 (18.8%) |
| $25,000 to $34,999 | 19 (13.1%) | 35 (12.1%) |
| $35,000 to $49,999 | 12 (8.3%) | 21 (7.3%) |
| $50,000 to $74,999 | 25 (17.2%) | 26 (9.0%) |
| $75,000 to $99,999 | 20 (13.8%) | 15 (5.2%) |
| $100,000 to $149,999 | 28 (19.3%) | 17 (5.9%) |
| $150,000 or more | 23 (15.9%) | 0 (0.0%) |
| Total | 145 (100.0%) | 288 (100.0%) |
Monthly Housing Cost Tiers in Wartburg
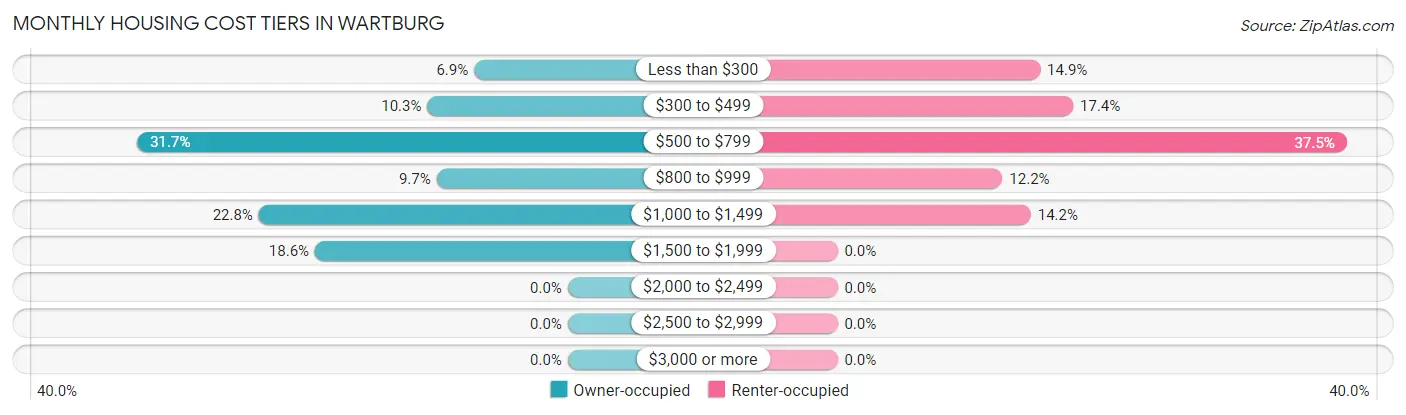
| Monthly Cost | Owner-occupied | Renter-occupied |
| Less than $300 | 10 (6.9%) | 43 (14.9%) |
| $300 to $499 | 15 (10.3%) | 50 (17.4%) |
| $500 to $799 | 46 (31.7%) | 108 (37.5%) |
| $800 to $999 | 14 (9.7%) | 35 (12.1%) |
| $1,000 to $1,499 | 33 (22.8%) | 41 (14.2%) |
| $1,500 to $1,999 | 27 (18.6%) | 0 (0.0%) |
| $2,000 to $2,499 | 0 (0.0%) | 0 (0.0%) |
| $2,500 to $2,999 | 0 (0.0%) | 0 (0.0%) |
| $3,000 or more | 0 (0.0%) | 0 (0.0%) |
| Total | 145 (100.0%) | 288 (100.0%) |
Physical Housing Characteristics in Wartburg
Housing Structures in Wartburg
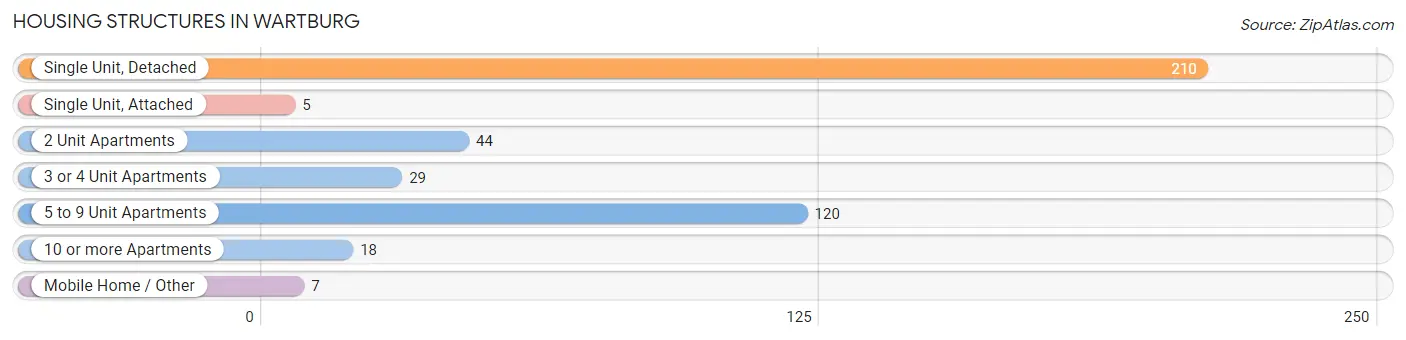
| Structure Type | # Housing Units | % Housing Units |
| Single Unit, Detached | 210 | 48.5% |
| Single Unit, Attached | 5 | 1.1% |
| 2 Unit Apartments | 44 | 10.2% |
| 3 or 4 Unit Apartments | 29 | 6.7% |
| 5 to 9 Unit Apartments | 120 | 27.7% |
| 10 or more Apartments | 18 | 4.2% |
| Mobile Home / Other | 7 | 1.6% |
| Total | 433 | 100.0% |
Housing Structures by Occupancy in Wartburg
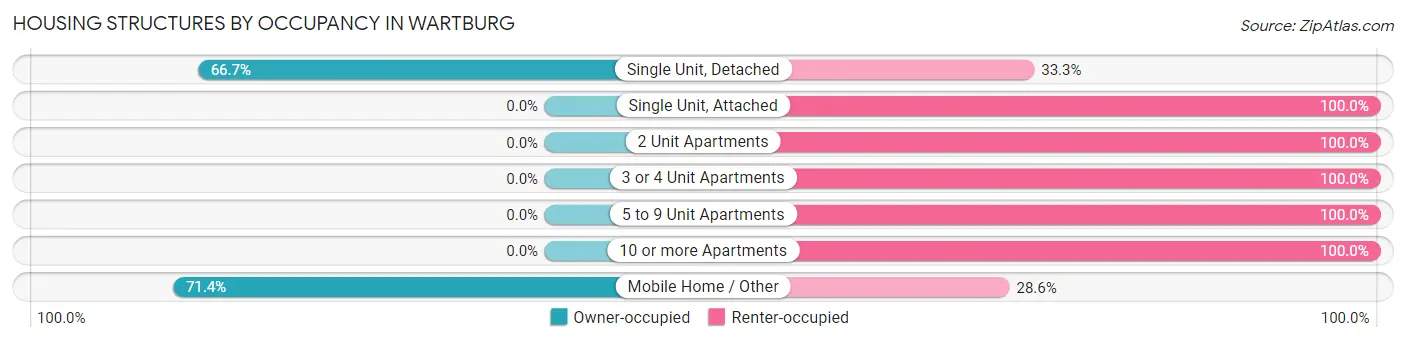
| Structure Type | Owner-occupied | Renter-occupied |
| Single Unit, Detached | 140 (66.7%) | 70 (33.3%) |
| Single Unit, Attached | 0 (0.0%) | 5 (100.0%) |
| 2 Unit Apartments | 0 (0.0%) | 44 (100.0%) |
| 3 or 4 Unit Apartments | 0 (0.0%) | 29 (100.0%) |
| 5 to 9 Unit Apartments | 0 (0.0%) | 120 (100.0%) |
| 10 or more Apartments | 0 (0.0%) | 18 (100.0%) |
| Mobile Home / Other | 5 (71.4%) | 2 (28.6%) |
| Total | 145 (33.5%) | 288 (66.5%) |
Housing Structures by Number of Rooms in Wartburg
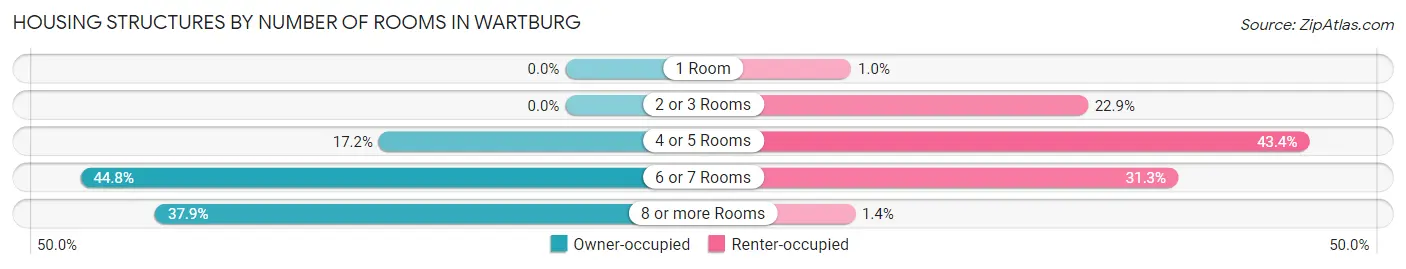
| Number of Rooms | Owner-occupied | Renter-occupied |
| 1 Room | 0 (0.0%) | 3 (1.0%) |
| 2 or 3 Rooms | 0 (0.0%) | 66 (22.9%) |
| 4 or 5 Rooms | 25 (17.2%) | 125 (43.4%) |
| 6 or 7 Rooms | 65 (44.8%) | 90 (31.2%) |
| 8 or more Rooms | 55 (37.9%) | 4 (1.4%) |
| Total | 145 (100.0%) | 288 (100.0%) |
Housing Structure by Heating Type in Wartburg
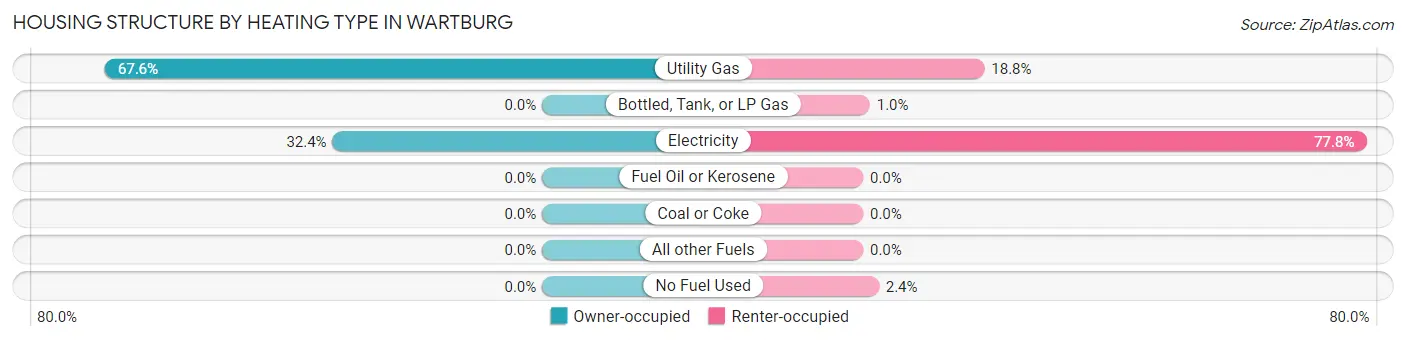
| Heating Type | Owner-occupied | Renter-occupied |
| Utility Gas | 98 (67.6%) | 54 (18.8%) |
| Bottled, Tank, or LP Gas | 0 (0.0%) | 3 (1.0%) |
| Electricity | 47 (32.4%) | 224 (77.8%) |
| Fuel Oil or Kerosene | 0 (0.0%) | 0 (0.0%) |
| Coal or Coke | 0 (0.0%) | 0 (0.0%) |
| All other Fuels | 0 (0.0%) | 0 (0.0%) |
| No Fuel Used | 0 (0.0%) | 7 (2.4%) |
| Total | 145 (100.0%) | 288 (100.0%) |
Household Vehicle Usage in Wartburg
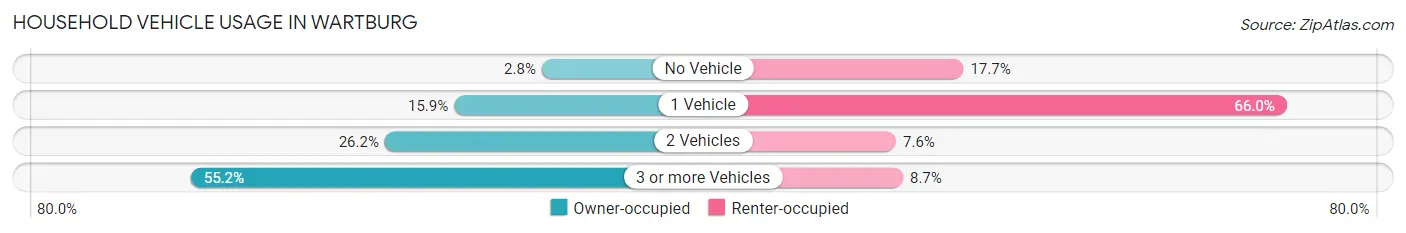
| Vehicles per Household | Owner-occupied | Renter-occupied |
| No Vehicle | 4 (2.8%) | 51 (17.7%) |
| 1 Vehicle | 23 (15.9%) | 190 (66.0%) |
| 2 Vehicles | 38 (26.2%) | 22 (7.6%) |
| 3 or more Vehicles | 80 (55.2%) | 25 (8.7%) |
| Total | 145 (100.0%) | 288 (100.0%) |
Real Estate & Mortgages in Wartburg
Real Estate and Mortgage Overview in Wartburg
| Characteristic | Without Mortgage | With Mortgage |
| Housing Units | 56 | 89 |
| Median Property Value | $156,700 | $164,200 |
| Median Household Income | - | - |
| Monthly Housing Costs | $514 | $0 |
| Real Estate Taxes | $800 | $0 |
Property Value by Mortgage Status in Wartburg
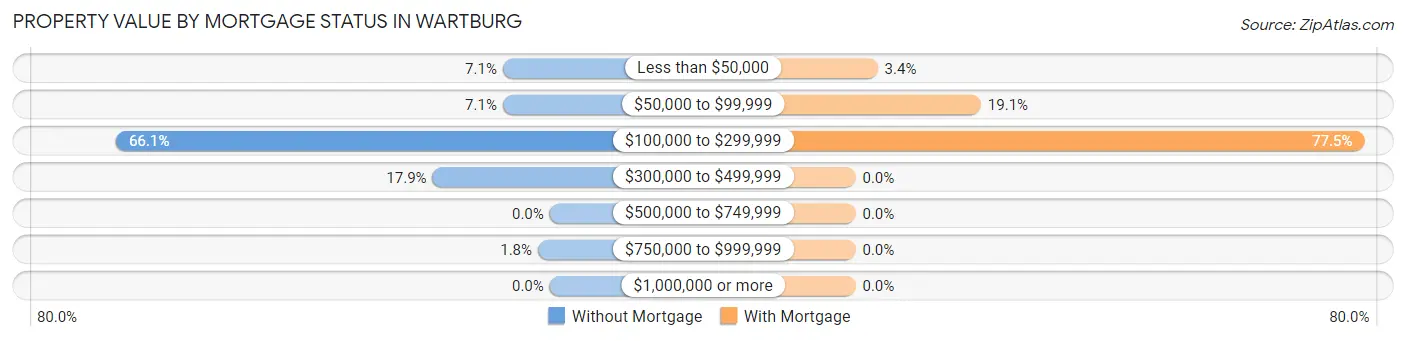
| Property Value | Without Mortgage | With Mortgage |
| Less than $50,000 | 4 (7.1%) | 3 (3.4%) |
| $50,000 to $99,999 | 4 (7.1%) | 17 (19.1%) |
| $100,000 to $299,999 | 37 (66.1%) | 69 (77.5%) |
| $300,000 to $499,999 | 10 (17.9%) | 0 (0.0%) |
| $500,000 to $749,999 | 0 (0.0%) | 0 (0.0%) |
| $750,000 to $999,999 | 1 (1.8%) | 0 (0.0%) |
| $1,000,000 or more | 0 (0.0%) | 0 (0.0%) |
| Total | 56 (100.0%) | 89 (100.0%) |
Household Income by Mortgage Status in Wartburg
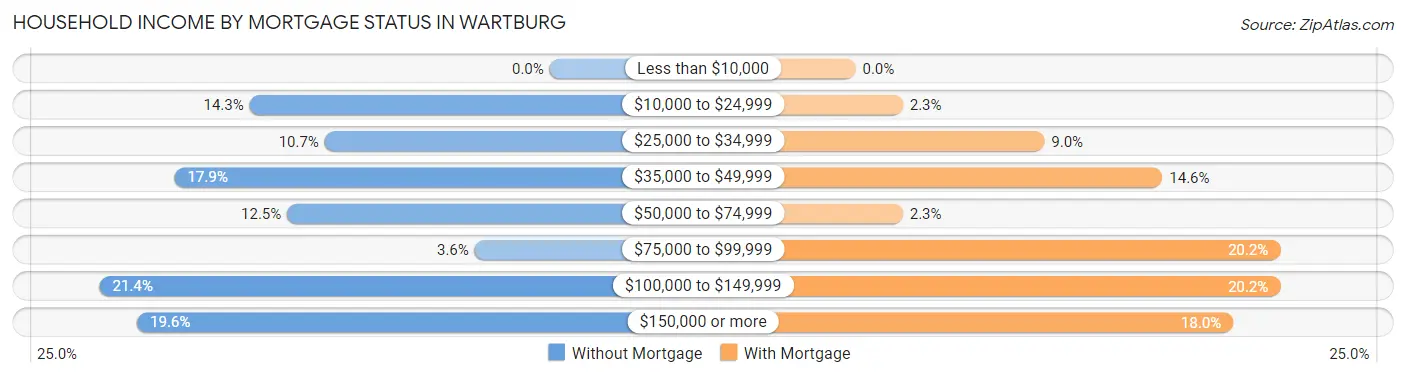
| Household Income | Without Mortgage | With Mortgage |
| Less than $10,000 | 0 (0.0%) | 0 (0.0%) |
| $10,000 to $24,999 | 8 (14.3%) | 2 (2.2%) |
| $25,000 to $34,999 | 6 (10.7%) | 8 (9.0%) |
| $35,000 to $49,999 | 10 (17.9%) | 13 (14.6%) |
| $50,000 to $74,999 | 7 (12.5%) | 2 (2.2%) |
| $75,000 to $99,999 | 2 (3.6%) | 18 (20.2%) |
| $100,000 to $149,999 | 12 (21.4%) | 18 (20.2%) |
| $150,000 or more | 11 (19.6%) | 16 (18.0%) |
| Total | 56 (100.0%) | 89 (100.0%) |
Property Value to Household Income Ratio in Wartburg
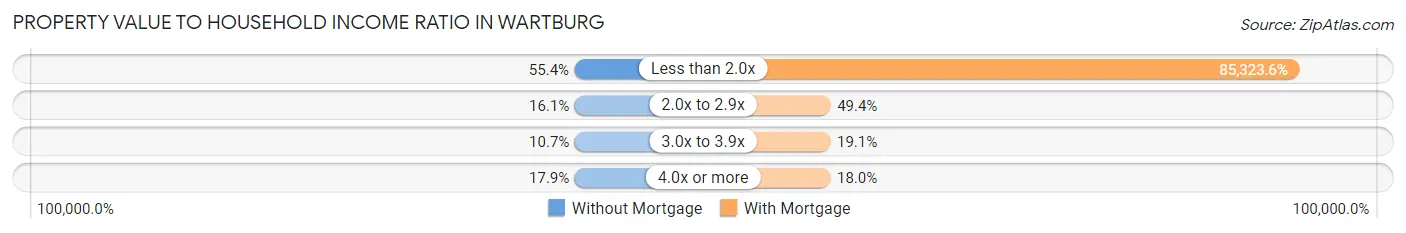
| Value-to-Income Ratio | Without Mortgage | With Mortgage |
| Less than 2.0x | 31 (55.4%) | 75,938 (85,323.6%) |
| 2.0x to 2.9x | 9 (16.1%) | 44 (49.4%) |
| 3.0x to 3.9x | 6 (10.7%) | 17 (19.1%) |
| 4.0x or more | 10 (17.9%) | 16 (18.0%) |
| Total | 56 (100.0%) | 89 (100.0%) |
Real Estate Taxes by Mortgage Status in Wartburg
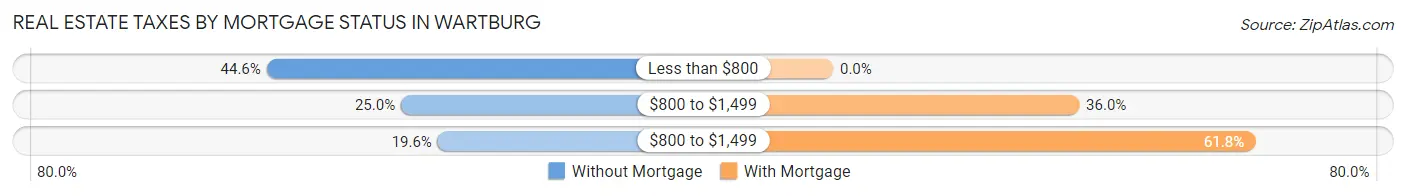
| Property Taxes | Without Mortgage | With Mortgage |
| Less than $800 | 25 (44.6%) | 0 (0.0%) |
| $800 to $1,499 | 14 (25.0%) | 32 (36.0%) |
| $800 to $1,499 | 11 (19.6%) | 55 (61.8%) |
| Total | 56 (100.0%) | 89 (100.0%) |
Health & Disability in Wartburg
Health Insurance Coverage by Age in Wartburg
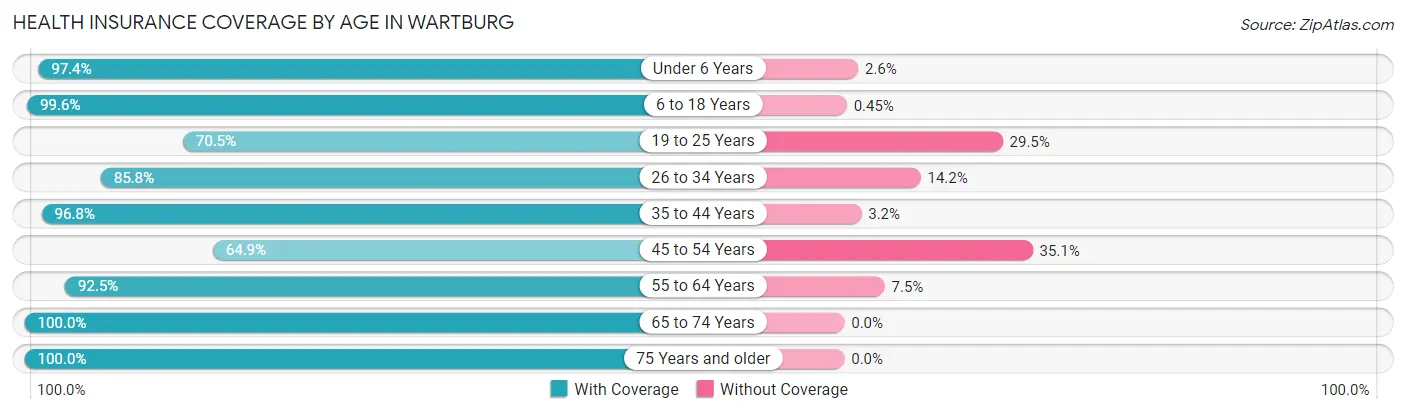
| Age Bracket | With Coverage | Without Coverage |
| Under 6 Years | 114 (97.4%) | 3 (2.6%) |
| 6 to 18 Years | 222 (99.6%) | 1 (0.4%) |
| 19 to 25 Years | 74 (70.5%) | 31 (29.5%) |
| 26 to 34 Years | 175 (85.8%) | 29 (14.2%) |
| 35 to 44 Years | 122 (96.8%) | 4 (3.2%) |
| 45 to 54 Years | 85 (64.9%) | 46 (35.1%) |
| 55 to 64 Years | 123 (92.5%) | 10 (7.5%) |
| 65 to 74 Years | 87 (100.0%) | 0 (0.0%) |
| 75 Years and older | 56 (100.0%) | 0 (0.0%) |
| Total | 1,058 (89.5%) | 124 (10.5%) |
Health Insurance Coverage by Citizenship Status in Wartburg
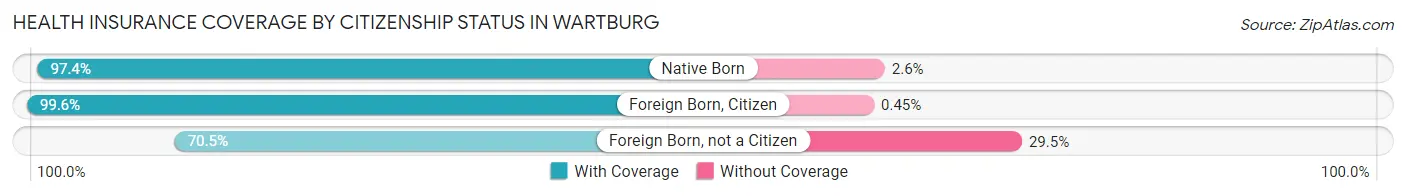
| Citizenship Status | With Coverage | Without Coverage |
| Native Born | 114 (97.4%) | 3 (2.6%) |
| Foreign Born, Citizen | 222 (99.6%) | 1 (0.4%) |
| Foreign Born, not a Citizen | 74 (70.5%) | 31 (29.5%) |
Health Insurance Coverage by Household Income in Wartburg
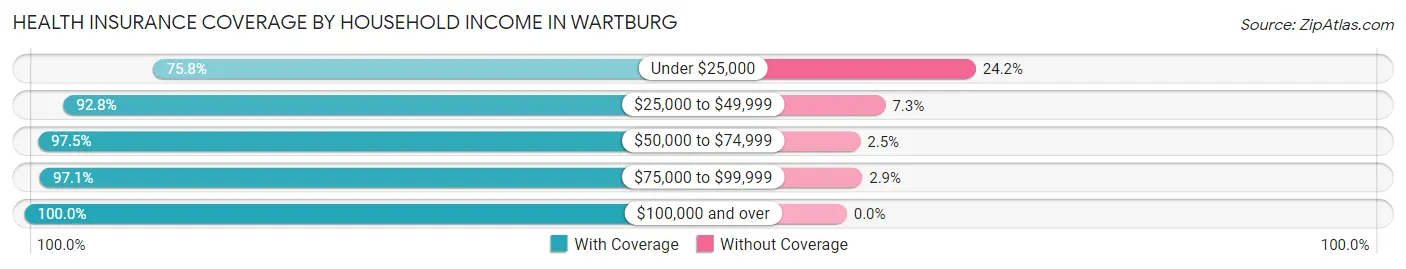
| Household Income | With Coverage | Without Coverage |
| Under $25,000 | 323 (75.8%) | 103 (24.2%) |
| $25,000 to $49,999 | 179 (92.7%) | 14 (7.2%) |
| $50,000 to $74,999 | 115 (97.5%) | 3 (2.5%) |
| $75,000 to $99,999 | 134 (97.1%) | 4 (2.9%) |
| $100,000 and over | 307 (100.0%) | 0 (0.0%) |
Public vs Private Health Insurance Coverage by Age in Wartburg
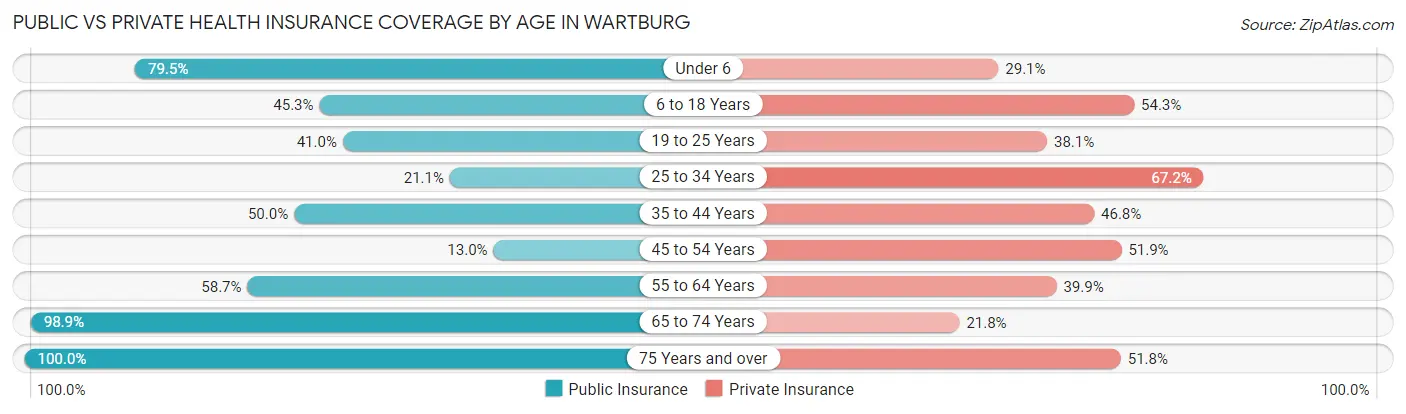
| Age Bracket | Public Insurance | Private Insurance |
| Under 6 | 93 (79.5%) | 34 (29.1%) |
| 6 to 18 Years | 101 (45.3%) | 121 (54.3%) |
| 19 to 25 Years | 43 (40.9%) | 40 (38.1%) |
| 25 to 34 Years | 43 (21.1%) | 137 (67.2%) |
| 35 to 44 Years | 63 (50.0%) | 59 (46.8%) |
| 45 to 54 Years | 17 (13.0%) | 68 (51.9%) |
| 55 to 64 Years | 78 (58.7%) | 53 (39.9%) |
| 65 to 74 Years | 86 (98.9%) | 19 (21.8%) |
| 75 Years and over | 56 (100.0%) | 29 (51.8%) |
| Total | 580 (49.1%) | 560 (47.4%) |
Disability Status by Sex by Age in Wartburg
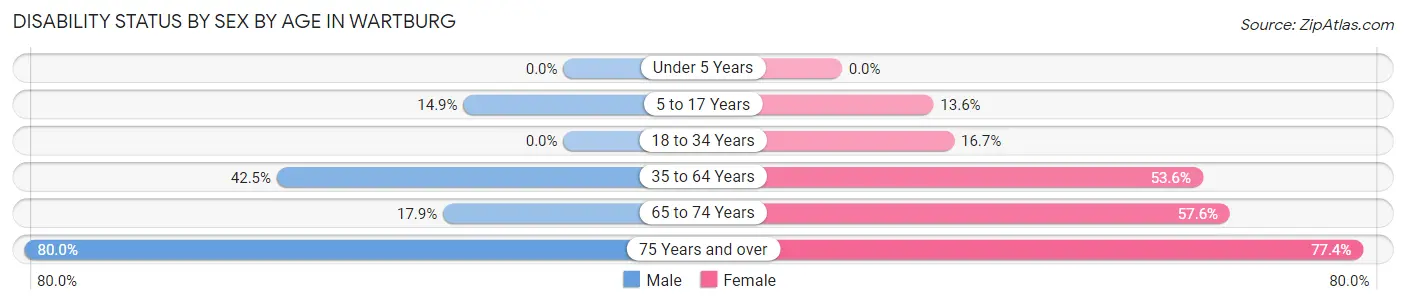
| Age Bracket | Male | Female |
| Under 5 Years | 0 (0.0%) | 0 (0.0%) |
| 5 to 17 Years | 15 (14.8%) | 17 (13.6%) |
| 18 to 34 Years | 0 (0.0%) | 26 (16.7%) |
| 35 to 64 Years | 77 (42.5%) | 112 (53.6%) |
| 65 to 74 Years | 5 (17.9%) | 34 (57.6%) |
| 75 Years and over | 20 (80.0%) | 24 (77.4%) |
Disability Class by Sex by Age in Wartburg
Disability Class: Hearing Difficulty
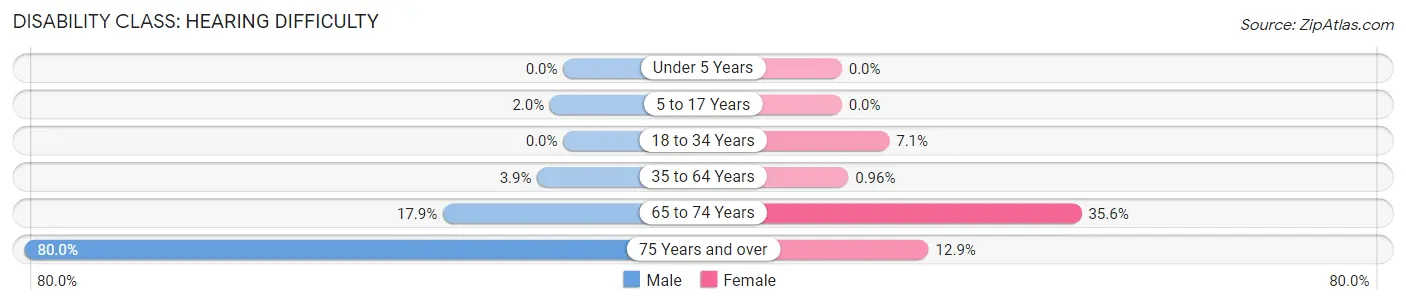
| Age Bracket | Male | Female |
| Under 5 Years | 0 (0.0%) | 0 (0.0%) |
| 5 to 17 Years | 2 (2.0%) | 0 (0.0%) |
| 18 to 34 Years | 0 (0.0%) | 11 (7.0%) |
| 35 to 64 Years | 7 (3.9%) | 2 (1.0%) |
| 65 to 74 Years | 5 (17.9%) | 21 (35.6%) |
| 75 Years and over | 20 (80.0%) | 4 (12.9%) |
Disability Class: Vision Difficulty
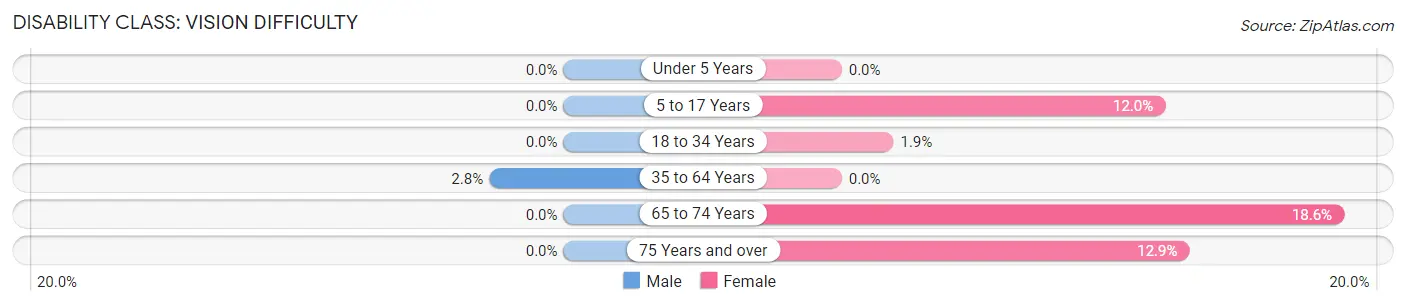
| Age Bracket | Male | Female |
| Under 5 Years | 0 (0.0%) | 0 (0.0%) |
| 5 to 17 Years | 0 (0.0%) | 15 (12.0%) |
| 18 to 34 Years | 0 (0.0%) | 3 (1.9%) |
| 35 to 64 Years | 5 (2.8%) | 0 (0.0%) |
| 65 to 74 Years | 0 (0.0%) | 11 (18.6%) |
| 75 Years and over | 0 (0.0%) | 4 (12.9%) |
Disability Class: Cognitive Difficulty
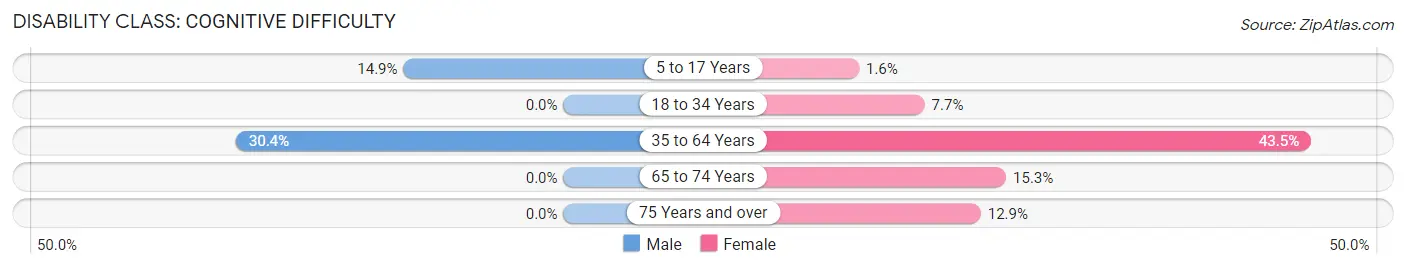
| Age Bracket | Male | Female |
| 5 to 17 Years | 15 (14.8%) | 2 (1.6%) |
| 18 to 34 Years | 0 (0.0%) | 12 (7.7%) |
| 35 to 64 Years | 55 (30.4%) | 91 (43.5%) |
| 65 to 74 Years | 0 (0.0%) | 9 (15.2%) |
| 75 Years and over | 0 (0.0%) | 4 (12.9%) |
Disability Class: Ambulatory Difficulty
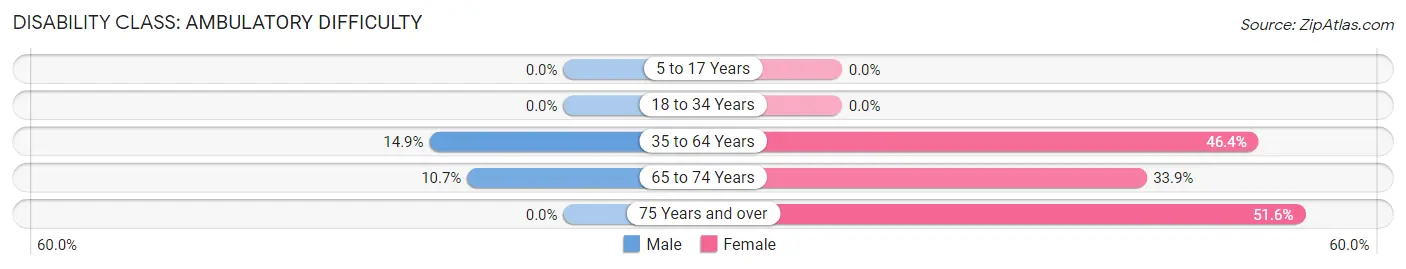
| Age Bracket | Male | Female |
| 5 to 17 Years | 0 (0.0%) | 0 (0.0%) |
| 18 to 34 Years | 0 (0.0%) | 0 (0.0%) |
| 35 to 64 Years | 27 (14.9%) | 97 (46.4%) |
| 65 to 74 Years | 3 (10.7%) | 20 (33.9%) |
| 75 Years and over | 0 (0.0%) | 16 (51.6%) |
Disability Class: Self-Care Difficulty
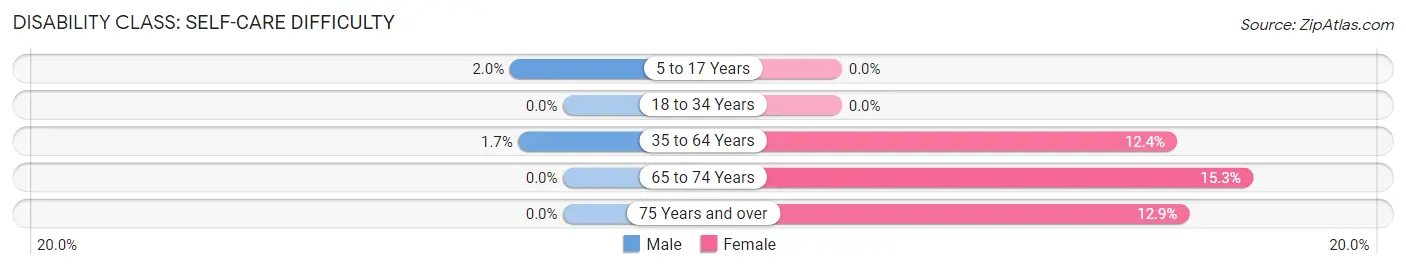
| Age Bracket | Male | Female |
| 5 to 17 Years | 2 (2.0%) | 0 (0.0%) |
| 18 to 34 Years | 0 (0.0%) | 0 (0.0%) |
| 35 to 64 Years | 3 (1.7%) | 26 (12.4%) |
| 65 to 74 Years | 0 (0.0%) | 9 (15.2%) |
| 75 Years and over | 0 (0.0%) | 4 (12.9%) |
Technology Access in Wartburg
Computing Device Access in Wartburg
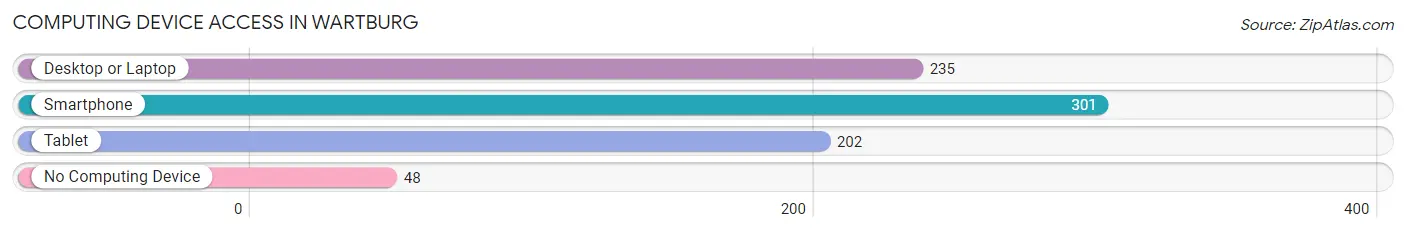
| Device Type | # Households | % Households |
| Desktop or Laptop | 235 | 54.3% |
| Smartphone | 301 | 69.5% |
| Tablet | 202 | 46.7% |
| No Computing Device | 48 | 11.1% |
| Total | 433 | 100.0% |
Internet Access in Wartburg
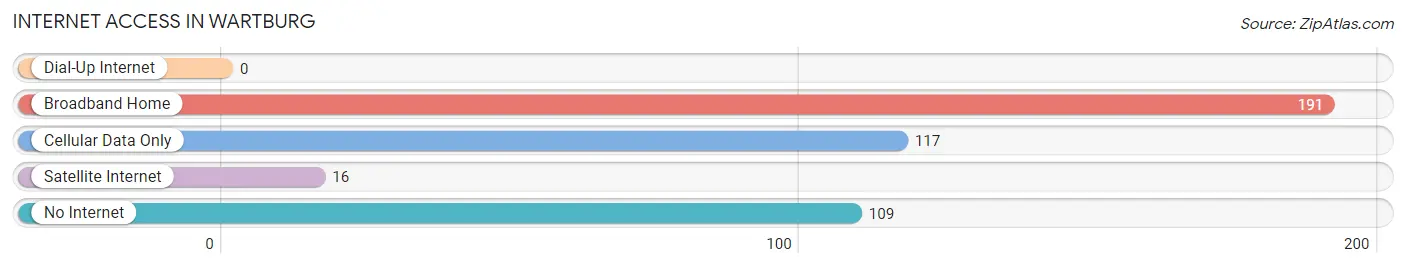
| Internet Type | # Households | % Households |
| Dial-Up Internet | 0 | 0.0% |
| Broadband Home | 191 | 44.1% |
| Cellular Data Only | 117 | 27.0% |
| Satellite Internet | 16 | 3.7% |
| No Internet | 109 | 25.2% |
| Total | 433 | 100.0% |
Wartburg Summary
Wartburg is a small town located in Morgan County, Tennessee. It is situated in the foothills of the Cumberland Mountains, approximately 40 miles north of Knoxville. The town was founded in 1854 and was named after the Wartburg Castle in Germany. The population of Wartburg was 1,845 as of the 2010 census.
History
The area that is now Wartburg was first settled in the early 1800s by German immigrants. The town was officially founded in 1854 and was named after the Wartburg Castle in Germany. The town was originally known as “Wartburg Station” due to its location on the East Tennessee and Virginia Railroad. The railroad was a major factor in the growth of the town, as it allowed for the transportation of goods and people.
In the late 1800s, Wartburg was a thriving community with a variety of businesses, including a hotel, a bank, a sawmill, and a gristmill. The town also had a school, a post office, and a newspaper.
In the early 1900s, Wartburg experienced a period of decline due to the Great Depression and the decline of the railroad industry. The town was revitalized in the 1950s with the construction of the Wartburg Dam, which created a lake that is now a popular recreational area.
Geography
Wartburg is located in Morgan County, Tennessee, in the foothills of the Cumberland Mountains. The town is situated at the intersection of State Route 62 and State Route 63. The town is approximately 40 miles north of Knoxville and is surrounded by the towns of Sunbright, Petros, and Lancing.
The terrain around Wartburg is mostly hilly and forested, with some flat areas. The town is located in a valley, with the Cumberland Mountains to the east and the Clinch Mountains to the west. The town is located at an elevation of 1,100 feet.
Economy
The economy of Wartburg is largely based on agriculture and tourism. The town is home to several farms, which produce a variety of crops, including corn, soybeans, and hay. The town is also home to several small businesses, including restaurants, stores, and a gas station.
The town is also a popular tourist destination, due to its proximity to the Wartburg Dam and the recreational opportunities it provides. The lake created by the dam is a popular spot for fishing, boating, and swimming. The town also has several parks and trails, which are popular with hikers and campers.
Demographics
As of the 2010 census, the population of Wartburg was 1,845. The town has a median age of 41.7 years, with 48.3% of the population being male and 51.7% being female. The racial makeup of the town is 97.2% White, 0.7% African American, 0.2% Native American, 0.2% Asian, and 1.7% from other races.
The median household income in Wartburg is $31,250, and the median family income is $37,500. The town has a poverty rate of 22.3%, with 18.3% of the population living below the poverty line. The town has a high school graduation rate of 87.3%.
Conclusion
Wartburg is a small town located in Morgan County, Tennessee. It was founded in 1854 and was named after the Wartburg Castle in Germany. The town has a population of 1,845 and is situated in the foothills of the Cumberland Mountains. The economy of Wartburg is largely based on agriculture and tourism, and the town is a popular tourist destination due to its proximity to the Wartburg Dam. The racial makeup of the town is 97.2% White, 0.7% African American, 0.2% Native American, 0.2% Asian, and 1.7% from other races. The median household income in Wartburg is $31,250, and the median family income is $37,500.
Common Questions
What is Per Capita Income in Wartburg?
Per Capita income in Wartburg is $18,307.
What is the Median Family Income in Wartburg?
Median Family Income in Wartburg is $53,958.
What is the Median Household income in Wartburg?
Median Household Income in Wartburg is $28,036.
What is Income or Wage Gap in Wartburg?
Income or Wage Gap in Wartburg is 48.5%.
Women in Wartburg earn 51.5 cents for every dollar earned by a man.
What is Family Income Deficit in Wartburg?
Family Income Deficit in Wartburg is $12,515.
Families that are below poverty line in Wartburg earn $12,515 less on average than the poverty threshold level.
What is Inequality or Gini Index in Wartburg?
Inequality or Gini Index in Wartburg is 0.51.
What is the Total Population of Wartburg?
Total Population of Wartburg is 1,330.
What is the Total Male Population of Wartburg?
Total Male Population of Wartburg is 634.
What is the Total Female Population of Wartburg?
Total Female Population of Wartburg is 696.
What is the Ratio of Males per 100 Females in Wartburg?
There are 91.09 Males per 100 Females in Wartburg.
What is the Ratio of Females per 100 Males in Wartburg?
There are 109.78 Females per 100 Males in Wartburg.
What is the Median Population Age in Wartburg?
Median Population Age in Wartburg is 34.2 Years.
What is the Average Family Size in Wartburg
Average Family Size in Wartburg is 3.8 People.
What is the Average Household Size in Wartburg
Average Household Size in Wartburg is 2.7 People.
How Large is the Labor Force in Wartburg?
There are 399 People in the Labor Forcein in Wartburg.
What is the Percentage of People in the Labor Force in Wartburg?
38.4% of People are in the Labor Force in Wartburg.
What is the Unemployment Rate in Wartburg?
Unemployment Rate in Wartburg is 8.8%.