Troy, TN Map & Demographics
Troy Map
Troy Overview
$24,688
PER CAPITA INCOME
$63,750
AVG FAMILY INCOME
$49,839
AVG HOUSEHOLD INCOME
11.7%
WAGE / INCOME GAP [ % ]
88.3¢/ $1
WAGE / INCOME GAP [ $ ]
0.36
INEQUALITY / GINI INDEX
1,941
TOTAL POPULATION
897
MALE POPULATION
1,044
FEMALE POPULATION
85.92
MALES / 100 FEMALES
116.39
FEMALES / 100 MALES
37.1
MEDIAN AGE
3.1
AVG FAMILY SIZE
2.5
AVG HOUSEHOLD SIZE
921
LABOR FORCE [ PEOPLE ]
60.8%
PERCENT IN LABOR FORCE
3.7%
UNEMPLOYMENT RATE
Troy Zip Codes
Troy Area Codes
Income in Troy
Income Overview in Troy
Per Capita Income in Troy is $24,688, while median incomes of families and households are $63,750 and $49,839 respectively.
| Characteristic | Number | Measure |
| Per Capita Income | 1,941 | $24,688 |
| Median Family Income | 436 | $63,750 |
| Mean Family Income | 436 | $74,093 |
| Median Household Income | 786 | $49,839 |
| Mean Household Income | 786 | $57,818 |
| Income Deficit | 436 | $0 |
| Wage / Income Gap (%) | 1,941 | 11.70% |
| Wage / Income Gap ($) | 1,941 | 88.30¢ per $1 |
| Gini / Inequality Index | 1,941 | 0.36 |
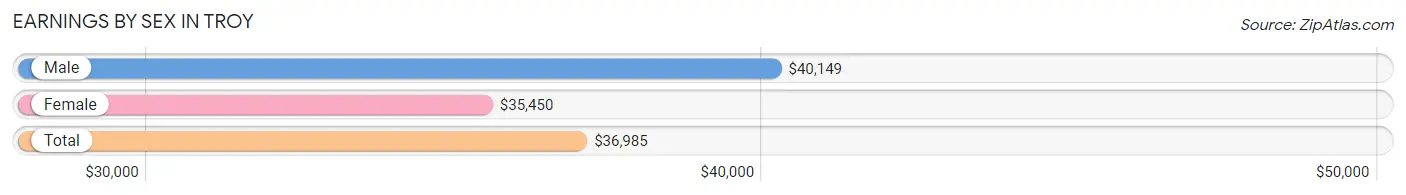
Earnings by Sex in Troy
Average Earnings in Troy are $36,985, $40,149 for men and $35,450 for women, a difference of 11.7%.
| Sex | Number | Average Earnings |
| Male | 469 (49.7%) | $40,149 |
| Female | 475 (50.3%) | $35,450 |
| Total | 944 (100.0%) | $36,985 |
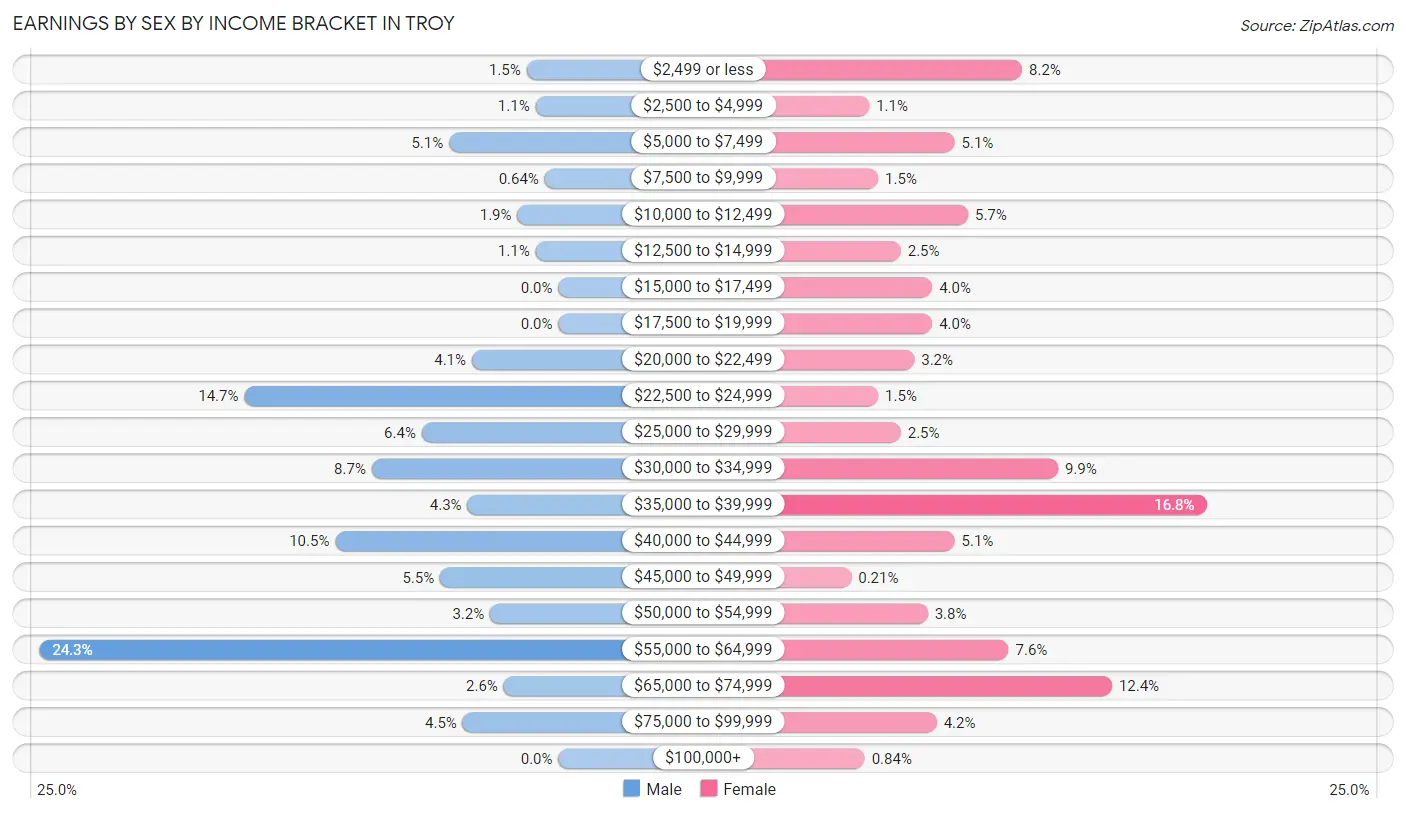
Earnings by Sex by Income Bracket in Troy
The most common earnings brackets in Troy are $55,000 to $64,999 for men (114 | 24.3%) and $35,000 to $39,999 for women (80 | 16.8%).
| Income | Male | Female |
| $2,499 or less | 7 (1.5%) | 39 (8.2%) |
| $2,500 to $4,999 | 5 (1.1%) | 5 (1.1%) |
| $5,000 to $7,499 | 24 (5.1%) | 24 (5.1%) |
| $7,500 to $9,999 | 3 (0.6%) | 7 (1.5%) |
| $10,000 to $12,499 | 9 (1.9%) | 27 (5.7%) |
| $12,500 to $14,999 | 5 (1.1%) | 12 (2.5%) |
| $15,000 to $17,499 | 0 (0.0%) | 19 (4.0%) |
| $17,500 to $19,999 | 0 (0.0%) | 19 (4.0%) |
| $20,000 to $22,499 | 19 (4.1%) | 15 (3.2%) |
| $22,500 to $24,999 | 69 (14.7%) | 7 (1.5%) |
| $25,000 to $29,999 | 30 (6.4%) | 12 (2.5%) |
| $30,000 to $34,999 | 41 (8.7%) | 47 (9.9%) |
| $35,000 to $39,999 | 20 (4.3%) | 80 (16.8%) |
| $40,000 to $44,999 | 49 (10.4%) | 24 (5.1%) |
| $45,000 to $49,999 | 26 (5.5%) | 1 (0.2%) |
| $50,000 to $54,999 | 15 (3.2%) | 18 (3.8%) |
| $55,000 to $64,999 | 114 (24.3%) | 36 (7.6%) |
| $65,000 to $74,999 | 12 (2.6%) | 59 (12.4%) |
| $75,000 to $99,999 | 21 (4.5%) | 20 (4.2%) |
| $100,000+ | 0 (0.0%) | 4 (0.8%) |
| Total | 469 (100.0%) | 475 (100.0%) |
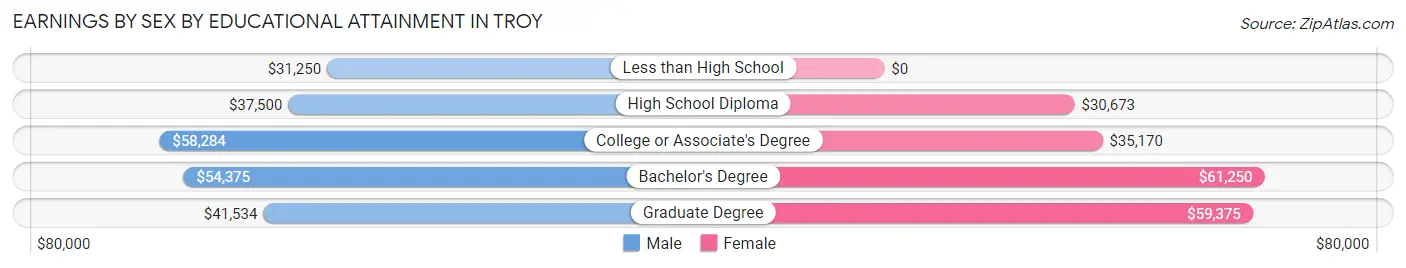
Earnings by Sex by Educational Attainment in Troy
Average earnings in Troy are $41,220 for men and $37,818 for women, a difference of 8.3%. Men with an educational attainment of college or associate's degree enjoy the highest average annual earnings of $58,284, while those with less than high school education earn the least with $31,250. Women with an educational attainment of bachelor's degree earn the most with the average annual earnings of $61,250, while those with high school diploma education have the smallest earnings of $30,673.
| Educational Attainment | Male Income | Female Income |
| Less than High School | $31,250 | $0 |
| High School Diploma | $37,500 | $30,673 |
| College or Associate's Degree | $58,284 | $35,170 |
| Bachelor's Degree | $54,375 | $61,250 |
| Graduate Degree | $41,534 | $59,375 |
| Total | $41,220 | $37,818 |
Family Income in Troy
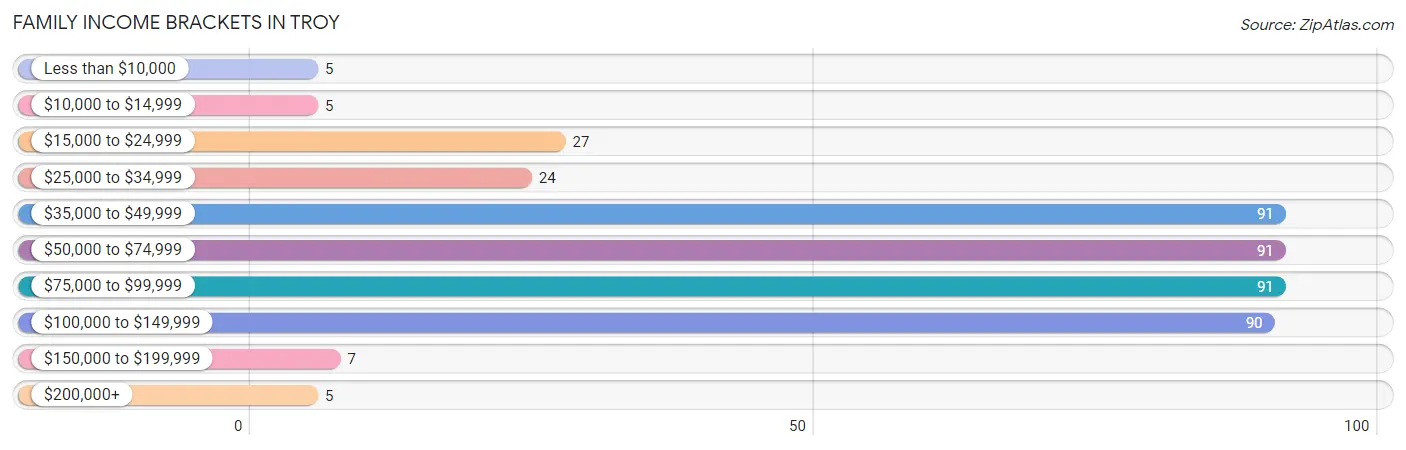
Family Income Brackets in Troy
According to the Troy family income data, there are 91 families falling into the $35,000 to $49,999 income range, which is the most common income bracket and makes up 20.9% of all families. Conversely, the less than $10,000 income bracket is the least frequent group with only 5 families (1.1%) belonging to this category.
| Income Bracket | # Families | % Families |
| Less than $10,000 | 5 | 1.1% |
| $10,000 to $14,999 | 5 | 1.1% |
| $15,000 to $24,999 | 27 | 6.2% |
| $25,000 to $34,999 | 24 | 5.5% |
| $35,000 to $49,999 | 91 | 20.9% |
| $50,000 to $74,999 | 91 | 20.9% |
| $75,000 to $99,999 | 91 | 20.9% |
| $100,000 to $149,999 | 90 | 20.6% |
| $150,000 to $199,999 | 7 | 1.6% |
| $200,000+ | 5 | 1.1% |
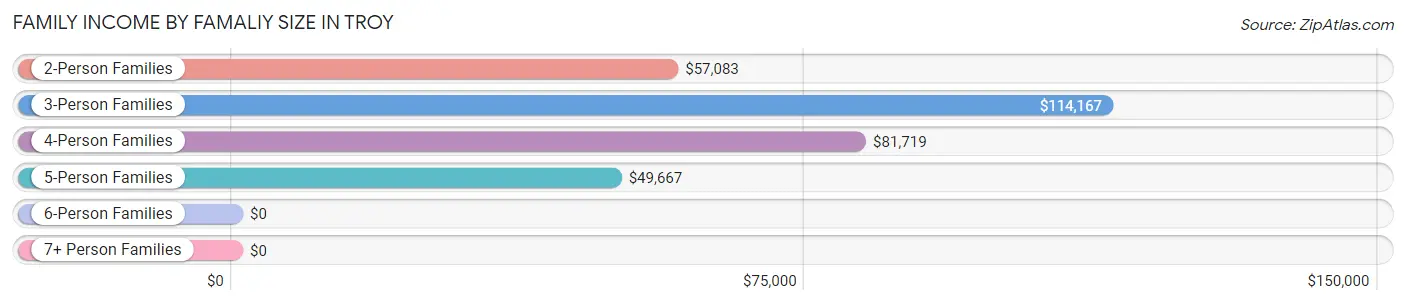
Family Income by Famaliy Size in Troy
3-person families (110 | 25.2%) account for the highest median family income in Troy with $114,167 per family, while 3-person families (110 | 25.2%) have the highest median income of $38,056 per family member.
| Income Bracket | # Families | Median Income |
| 2-Person Families | 186 (42.7%) | $57,083 |
| 3-Person Families | 110 (25.2%) | $114,167 |
| 4-Person Families | 111 (25.5%) | $81,719 |
| 5-Person Families | 26 (6.0%) | $49,667 |
| 6-Person Families | 3 (0.7%) | $0 |
| 7+ Person Families | 0 (0.0%) | $0 |
| Total | 436 (100.0%) | $63,750 |
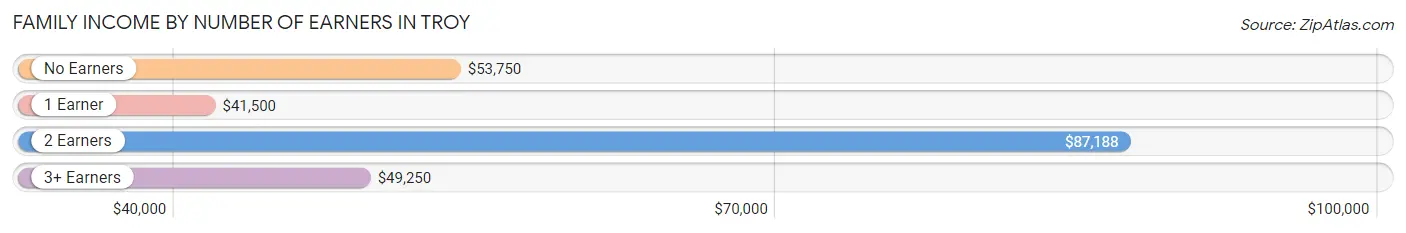
Family Income by Number of Earners in Troy
The median family income in Troy is $63,750, with families comprising 2 earners (203) having the highest median family income of $87,188, while families with 1 earner (118) have the lowest median family income of $41,500, accounting for 46.6% and 27.1% of families, respectively.
| Number of Earners | # Families | Median Income |
| No Earners | 82 (18.8%) | $53,750 |
| 1 Earner | 118 (27.1%) | $41,500 |
| 2 Earners | 203 (46.6%) | $87,188 |
| 3+ Earners | 33 (7.6%) | $49,250 |
| Total | 436 (100.0%) | $63,750 |
Household Income in Troy
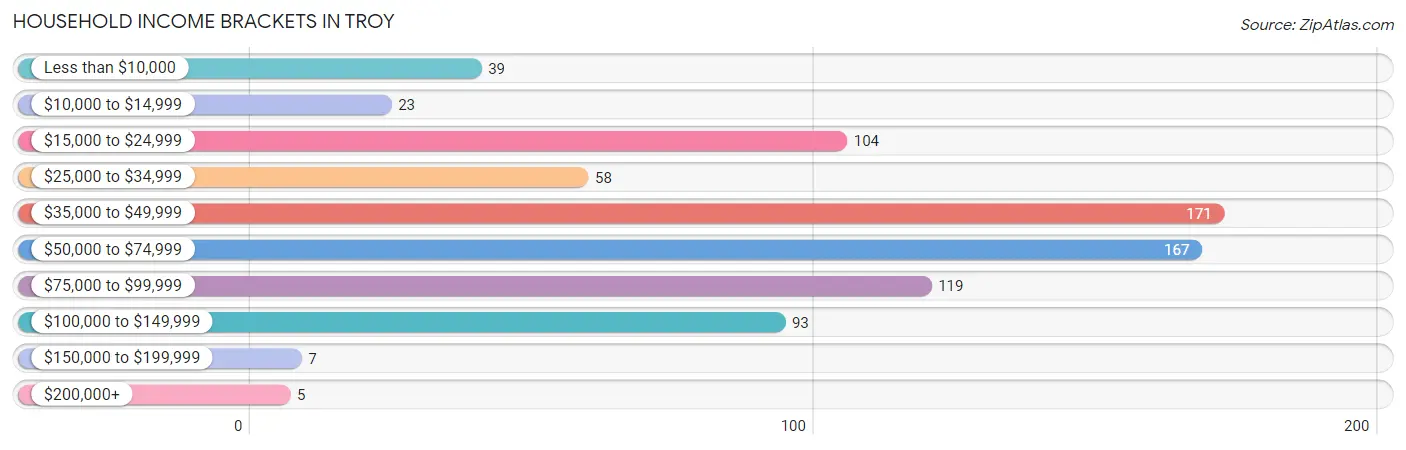
Household Income Brackets in Troy
With 171 households falling in the category, the $35,000 to $49,999 income range is the most frequent in Troy, accounting for 21.8% of all households. In contrast, only 5 households (0.6%) fall into the $200,000+ income bracket, making it the least populous group.
| Income Bracket | # Households | % Households |
| Less than $10,000 | 39 | 5.0% |
| $10,000 to $14,999 | 23 | 2.9% |
| $15,000 to $24,999 | 104 | 13.2% |
| $25,000 to $34,999 | 58 | 7.4% |
| $35,000 to $49,999 | 171 | 21.8% |
| $50,000 to $74,999 | 167 | 21.2% |
| $75,000 to $99,999 | 119 | 15.1% |
| $100,000 to $149,999 | 93 | 11.8% |
| $150,000 to $199,999 | 7 | 0.9% |
| $200,000+ | 5 | 0.6% |
Household Income by Householder Age in Troy
The median household income in Troy is $49,839, with the highest median household income of $70,729 found in the 25 to 44 years age bracket for the primary householder. A total of 310 households (39.4%) fall into this category. Meanwhile, the 15 to 24 years age bracket for the primary householder has the lowest median household income of $0, with 15 households (1.9%) in this group.
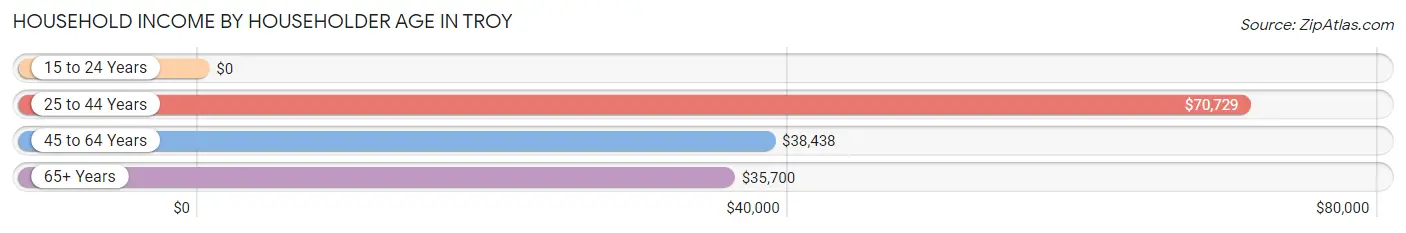
| Income Bracket | # Households | Median Income |
| 15 to 24 Years | 15 (1.9%) | $0 |
| 25 to 44 Years | 310 (39.4%) | $70,729 |
| 45 to 64 Years | 205 (26.1%) | $38,438 |
| 65+ Years | 256 (32.6%) | $35,700 |
| Total | 786 (100.0%) | $49,839 |
Poverty in Troy
Income Below Poverty by Sex and Age in Troy
With 12.7% poverty level for males and 11.9% for females among the residents of Troy, 15 year old males and 18 to 24 year old females are the most vulnerable to poverty, with 3 males (100.0%) and 38 females (48.1%) in their respective age groups living below the poverty level.
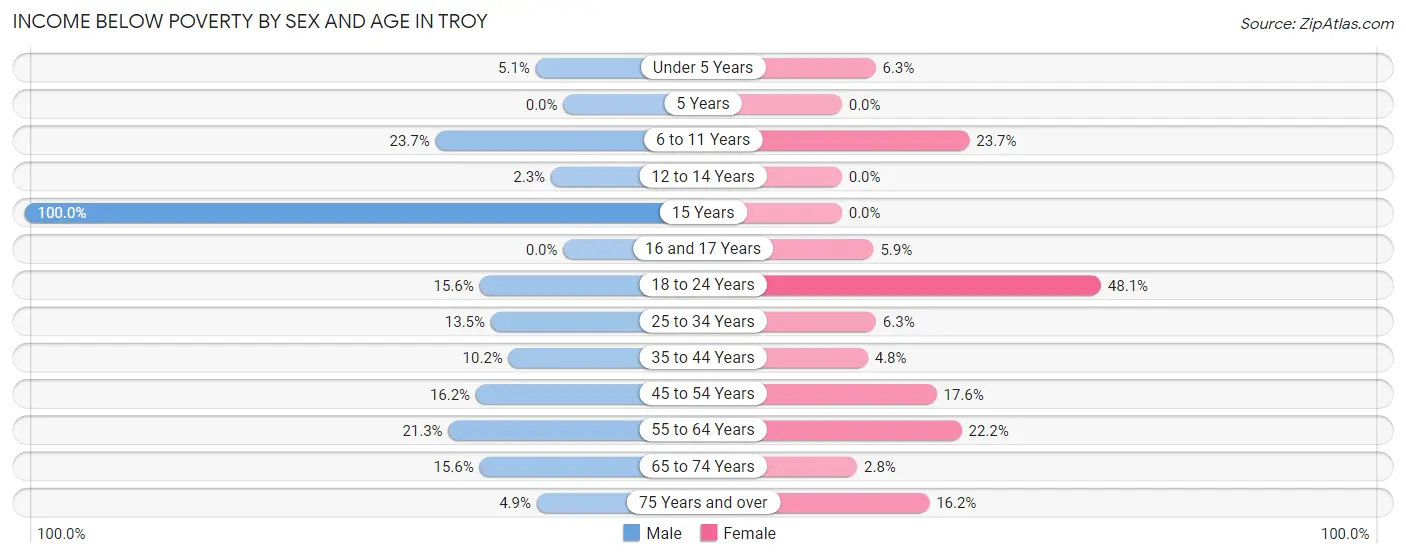
| Age Bracket | Male | Female |
| Under 5 Years | 2 (5.1%) | 2 (6.2%) |
| 5 Years | 0 (0.0%) | 0 (0.0%) |
| 6 to 11 Years | 14 (23.7%) | 9 (23.7%) |
| 12 to 14 Years | 2 (2.3%) | 0 (0.0%) |
| 15 Years | 3 (100.0%) | 0 (0.0%) |
| 16 and 17 Years | 0 (0.0%) | 2 (5.9%) |
| 18 to 24 Years | 7 (15.6%) | 38 (48.1%) |
| 25 to 34 Years | 21 (13.5%) | 5 (6.3%) |
| 35 to 44 Years | 20 (10.2%) | 11 (4.8%) |
| 45 to 54 Years | 12 (16.2%) | 19 (17.6%) |
| 55 to 64 Years | 16 (21.3%) | 14 (22.2%) |
| 65 to 74 Years | 14 (15.6%) | 4 (2.8%) |
| 75 Years and over | 3 (4.9%) | 12 (16.2%) |
| Total | 114 (12.7%) | 116 (11.9%) |
Income Above Poverty by Sex and Age in Troy
According to the poverty statistics in Troy, males aged 5 years and females aged 5 years are the age groups that are most secure financially, with 100.0% of males and 100.0% of females in these age groups living above the poverty line.
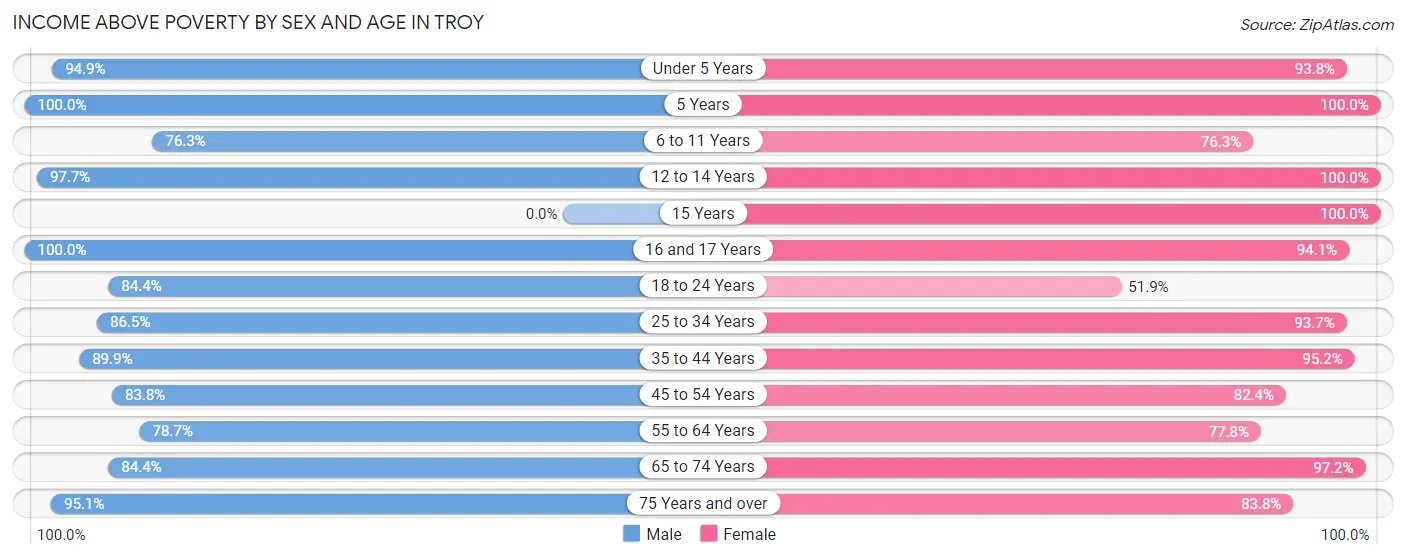
| Age Bracket | Male | Female |
| Under 5 Years | 37 (94.9%) | 30 (93.8%) |
| 5 Years | 1 (100.0%) | 39 (100.0%) |
| 6 to 11 Years | 45 (76.3%) | 29 (76.3%) |
| 12 to 14 Years | 85 (97.7%) | 42 (100.0%) |
| 15 Years | 0 (0.0%) | 16 (100.0%) |
| 16 and 17 Years | 10 (100.0%) | 32 (94.1%) |
| 18 to 24 Years | 38 (84.4%) | 41 (51.9%) |
| 25 to 34 Years | 135 (86.5%) | 74 (93.7%) |
| 35 to 44 Years | 177 (89.8%) | 217 (95.2%) |
| 45 to 54 Years | 62 (83.8%) | 89 (82.4%) |
| 55 to 64 Years | 59 (78.7%) | 49 (77.8%) |
| 65 to 74 Years | 76 (84.4%) | 137 (97.2%) |
| 75 Years and over | 58 (95.1%) | 62 (83.8%) |
| Total | 783 (87.3%) | 857 (88.1%) |
Income Below Poverty Among Married-Couple Families in Troy
The poverty statistics for married-couple families in Troy show that 3.0% or 10 of the total 338 families live below the poverty line. Families with no children have the highest poverty rate of 6.7%, comprising of 10 families. On the other hand, families with 1 or 2 children have the lowest poverty rate of 0.0%, which includes 0 families.
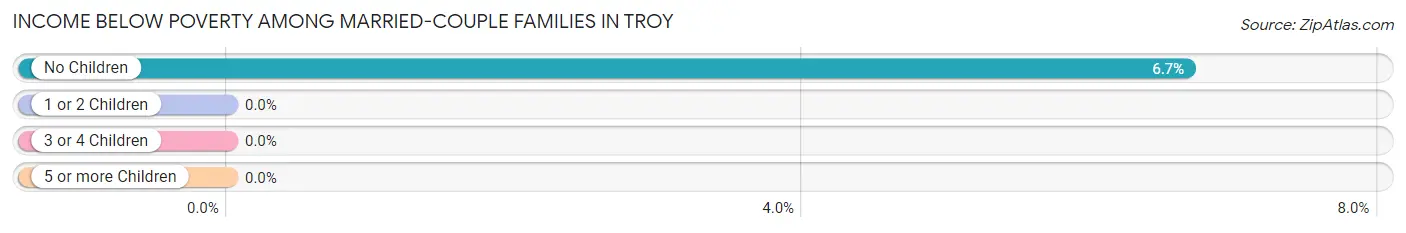
| Children | Above Poverty | Below Poverty |
| No Children | 140 (93.3%) | 10 (6.7%) |
| 1 or 2 Children | 188 (100.0%) | 0 (0.0%) |
| 3 or 4 Children | 0 (0.0%) | 0 (0.0%) |
| 5 or more Children | 0 (0.0%) | 0 (0.0%) |
| Total | 328 (97.0%) | 10 (3.0%) |
Income Below Poverty Among Single-Parent Households in Troy
According to the poverty data in Troy, 32.4% or 12 single-father households and 8.2% or 5 single-mother households are living below the poverty line. Among single-father households, those with 1 or 2 children have the highest poverty rate, with 12 households (32.4%) experiencing poverty. Likewise, among single-mother households, those with 5 or more children have the highest poverty rate, with 3 households (100.0%) falling below the poverty line.
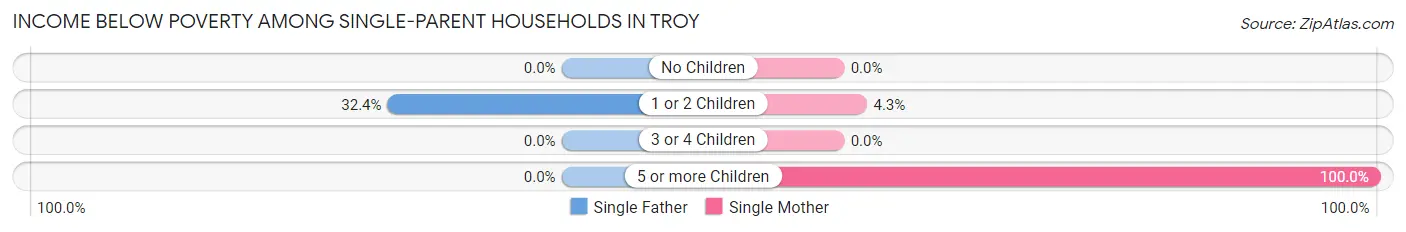
| Children | Single Father | Single Mother |
| No Children | 0 (0.0%) | 0 (0.0%) |
| 1 or 2 Children | 12 (32.4%) | 2 (4.3%) |
| 3 or 4 Children | 0 (0.0%) | 0 (0.0%) |
| 5 or more Children | 0 (0.0%) | 3 (100.0%) |
| Total | 12 (32.4%) | 5 (8.2%) |
Income Below Poverty Among Married-Couple vs Single-Parent Households in Troy
The poverty data for Troy shows that 10 of the married-couple family households (3.0%) and 17 of the single-parent households (17.3%) are living below the poverty level. Within the married-couple family households, those with no children have the highest poverty rate, with 10 households (6.7%) falling below the poverty line. Among the single-parent households, those with 5 or more children have the highest poverty rate, with 3 household (100.0%) living below poverty.
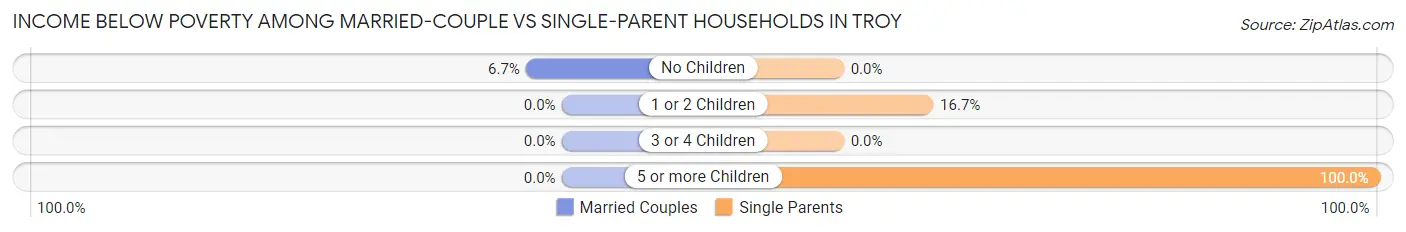
| Children | Married-Couple Families | Single-Parent Households |
| No Children | 10 (6.7%) | 0 (0.0%) |
| 1 or 2 Children | 0 (0.0%) | 14 (16.7%) |
| 3 or 4 Children | 0 (0.0%) | 0 (0.0%) |
| 5 or more Children | 0 (0.0%) | 3 (100.0%) |
| Total | 10 (3.0%) | 17 (17.3%) |
Race in Troy
The most populous races in Troy are White / Caucasian (1,899 | 97.8%), Two or more Races (38 | 2.0%), and Hispanic or Latino (19 | 1.0%).
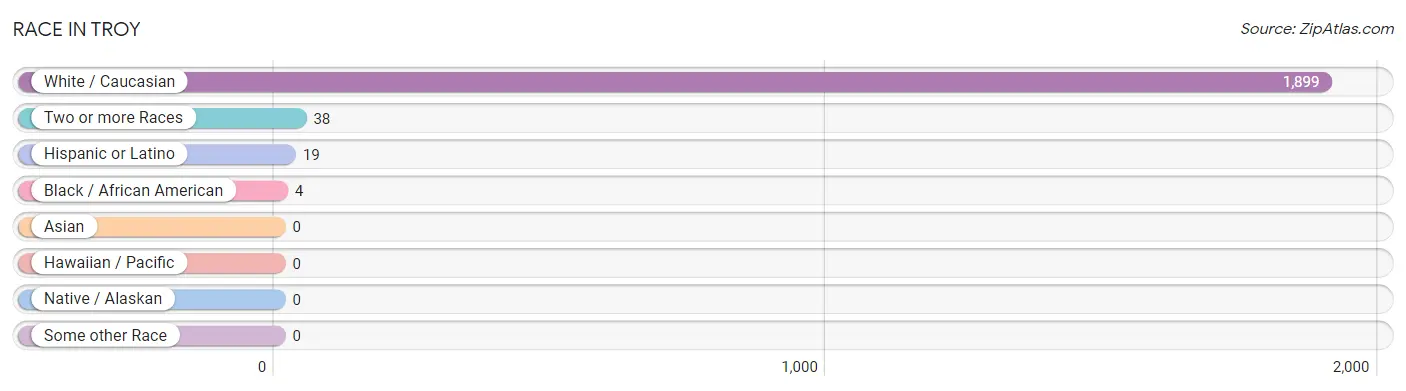
| Race | # Population | % Population |
| Asian | 0 | 0.0% |
| Black / African American | 4 | 0.2% |
| Hawaiian / Pacific | 0 | 0.0% |
| Hispanic or Latino | 19 | 1.0% |
| Native / Alaskan | 0 | 0.0% |
| White / Caucasian | 1,899 | 97.8% |
| Two or more Races | 38 | 2.0% |
| Some other Race | 0 | 0.0% |
| Total | 1,941 | 100.0% |
Ancestry in Troy
The most populous ancestries reported in Troy are Irish (400 | 20.6%), American (368 | 19.0%), English (309 | 15.9%), German (46 | 2.4%), and European (36 | 1.8%), together accounting for 59.7% of all Troy residents.
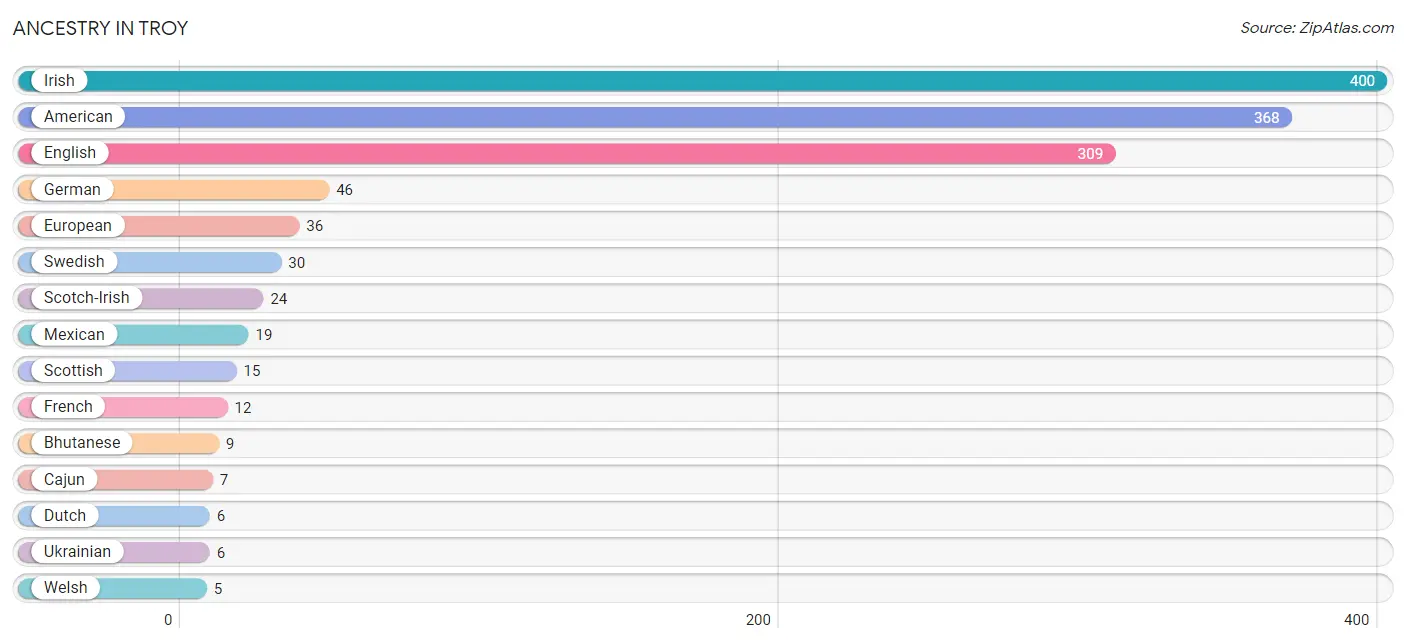
| Ancestry | # Population | % Population |
| American | 368 | 19.0% |
| Bhutanese | 9 | 0.5% |
| British | 3 | 0.2% |
| Cajun | 7 | 0.4% |
| Cherokee | 3 | 0.2% |
| Dutch | 6 | 0.3% |
| English | 309 | 15.9% |
| European | 36 | 1.8% |
| French | 12 | 0.6% |
| French Canadian | 4 | 0.2% |
| German | 46 | 2.4% |
| Hungarian | 4 | 0.2% |
| Irish | 400 | 20.6% |
| Italian | 4 | 0.2% |
| Mexican | 19 | 1.0% |
| Scotch-Irish | 24 | 1.2% |
| Scottish | 15 | 0.8% |
| Slovene | 4 | 0.2% |
| Swedish | 30 | 1.5% |
| Ukrainian | 6 | 0.3% |
| Welsh | 5 | 0.3% | View All 21 Rows |
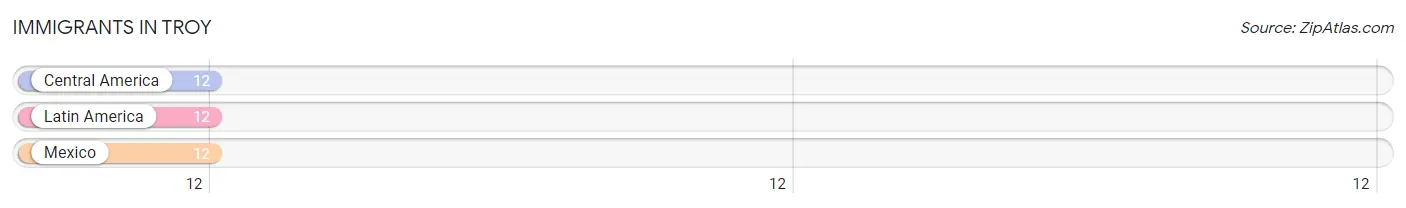
Immigrants in Troy
The most numerous immigrant groups reported in Troy came from Central America (12 | 0.6%), Latin America (12 | 0.6%), and Mexico (12 | 0.6%), together accounting for 1.9% of all Troy residents.
| Immigration Origin | # Population | % Population |
| Central America | 12 | 0.6% |
| Latin America | 12 | 0.6% |
| Mexico | 12 | 0.6% | View All 3 Rows |
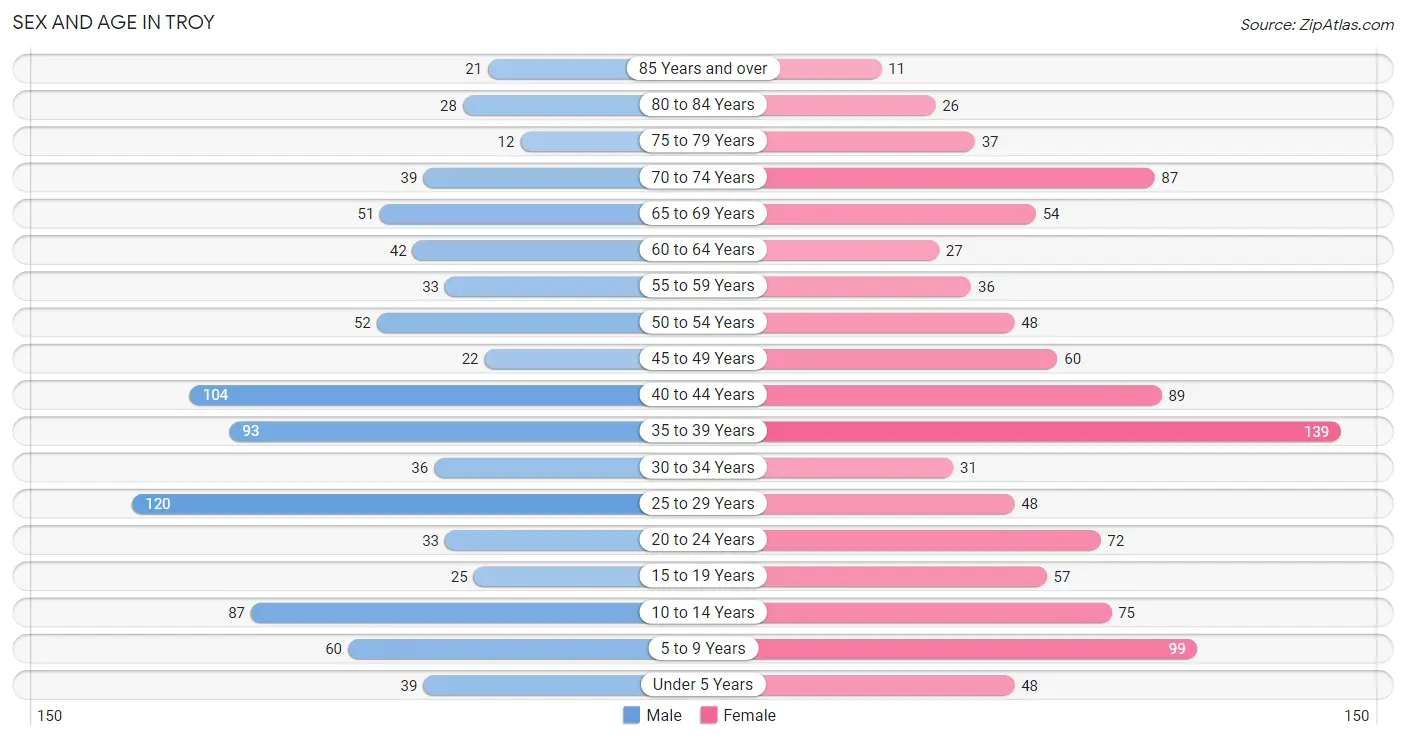
Sex and Age in Troy
Sex and Age in Troy
The most populous age groups in Troy are 25 to 29 Years (120 | 13.4%) for men and 35 to 39 Years (139 | 13.3%) for women.
| Age Bracket | Male | Female |
| Under 5 Years | 39 (4.3%) | 48 (4.6%) |
| 5 to 9 Years | 60 (6.7%) | 99 (9.5%) |
| 10 to 14 Years | 87 (9.7%) | 75 (7.2%) |
| 15 to 19 Years | 25 (2.8%) | 57 (5.5%) |
| 20 to 24 Years | 33 (3.7%) | 72 (6.9%) |
| 25 to 29 Years | 120 (13.4%) | 48 (4.6%) |
| 30 to 34 Years | 36 (4.0%) | 31 (3.0%) |
| 35 to 39 Years | 93 (10.4%) | 139 (13.3%) |
| 40 to 44 Years | 104 (11.6%) | 89 (8.5%) |
| 45 to 49 Years | 22 (2.5%) | 60 (5.8%) |
| 50 to 54 Years | 52 (5.8%) | 48 (4.6%) |
| 55 to 59 Years | 33 (3.7%) | 36 (3.5%) |
| 60 to 64 Years | 42 (4.7%) | 27 (2.6%) |
| 65 to 69 Years | 51 (5.7%) | 54 (5.2%) |
| 70 to 74 Years | 39 (4.3%) | 87 (8.3%) |
| 75 to 79 Years | 12 (1.3%) | 37 (3.5%) |
| 80 to 84 Years | 28 (3.1%) | 26 (2.5%) |
| 85 Years and over | 21 (2.3%) | 11 (1.1%) |
| Total | 897 (100.0%) | 1,044 (100.0%) |
Families and Households in Troy
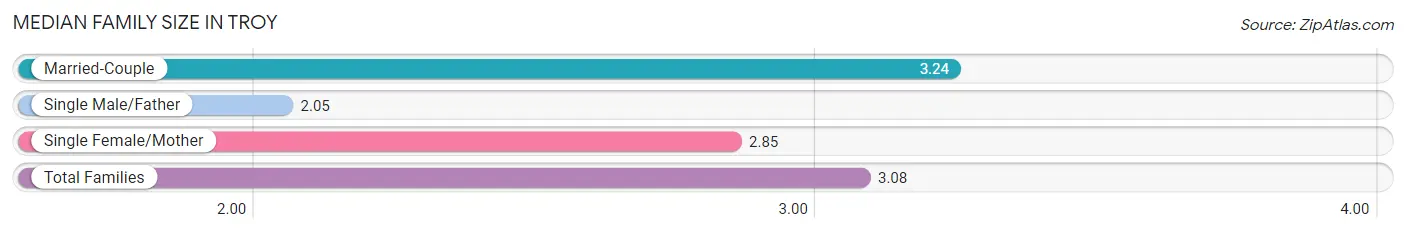
Median Family Size in Troy
The median family size in Troy is 3.08 persons per family, with married-couple families (338 | 77.5%) accounting for the largest median family size of 3.24 persons per family. On the other hand, single male/father families (37 | 8.5%) represent the smallest median family size with 2.05 persons per family.
| Family Type | # Families | Family Size |
| Married-Couple | 338 (77.5%) | 3.24 |
| Single Male/Father | 37 (8.5%) | 2.05 |
| Single Female/Mother | 61 (14.0%) | 2.85 |
| Total Families | 436 (100.0%) | 3.08 |
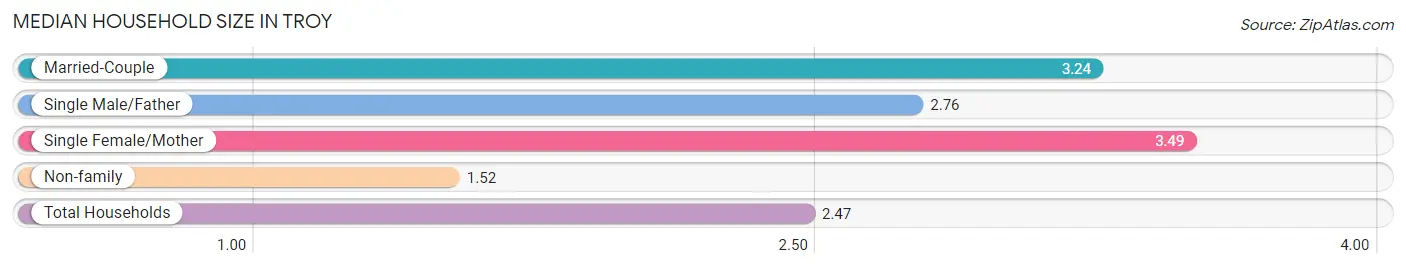
Median Household Size in Troy
The median household size in Troy is 2.47 persons per household, with single female/mother households (61 | 7.8%) accounting for the largest median household size of 3.49 persons per household. non-family households (350 | 44.5%) represent the smallest median household size with 1.52 persons per household.
| Household Type | # Households | Household Size |
| Married-Couple | 338 (43.0%) | 3.24 |
| Single Male/Father | 37 (4.7%) | 2.76 |
| Single Female/Mother | 61 (7.8%) | 3.49 |
| Non-family | 350 (44.5%) | 1.52 |
| Total Households | 786 (100.0%) | 2.47 |
Household Size by Marriage Status in Troy
Out of a total of 786 households in Troy, 436 (55.5%) are family households, while 350 (44.5%) are nonfamily households. The most numerous type of family households are 2-person households, comprising 161, and the most common type of nonfamily households are 1-person households, comprising 280.
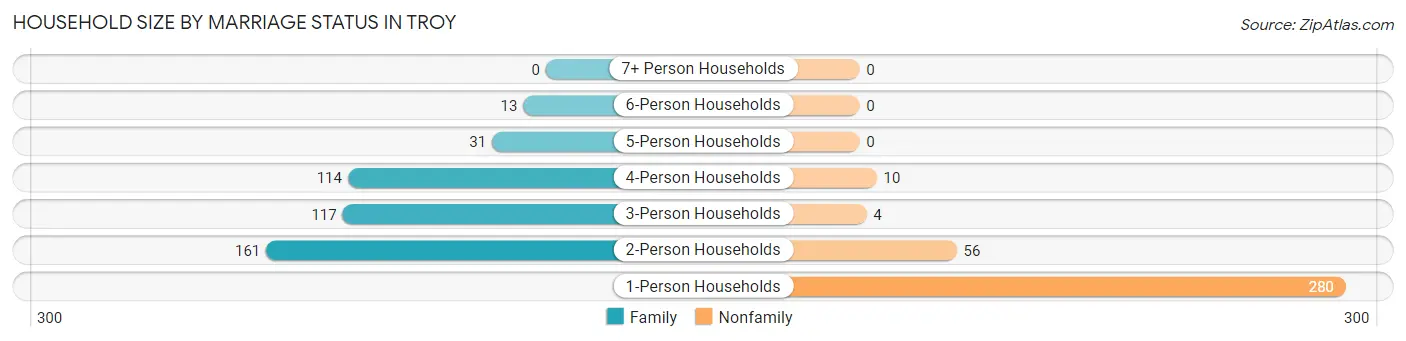
| Household Size | Family Households | Nonfamily Households |
| 1-Person Households | - | 280 (35.6%) |
| 2-Person Households | 161 (20.5%) | 56 (7.1%) |
| 3-Person Households | 117 (14.9%) | 4 (0.5%) |
| 4-Person Households | 114 (14.5%) | 10 (1.3%) |
| 5-Person Households | 31 (3.9%) | 0 (0.0%) |
| 6-Person Households | 13 (1.7%) | 0 (0.0%) |
| 7+ Person Households | 0 (0.0%) | 0 (0.0%) |
| Total | 436 (55.5%) | 350 (44.5%) |
Female Fertility in Troy
Fertility by Age in Troy
Average fertility rate in Troy is 51.0 births per 1,000 women. Women in the age bracket of 20 to 34 years have the highest fertility rate with 146.0 births per 1,000 women. Women in the age bracket of 20 to 34 years acount for 84.6% of all women with births.
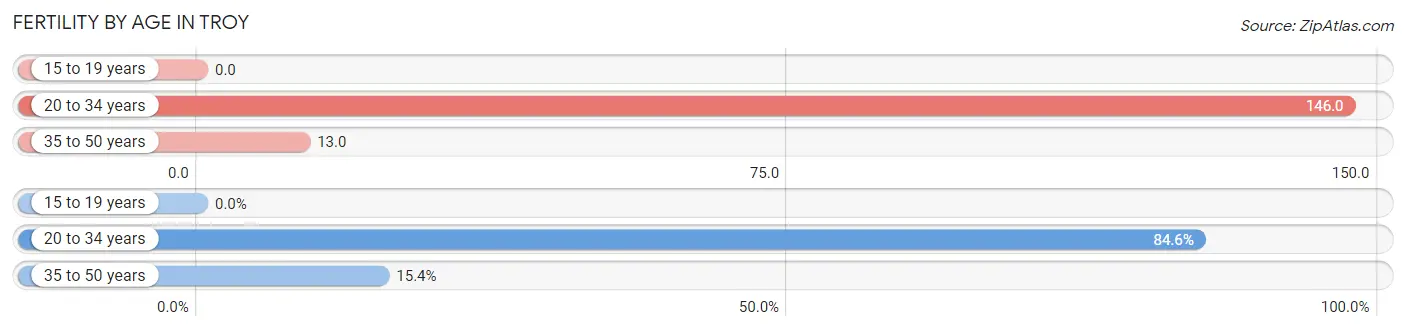
| Age Bracket | Women with Births | Births / 1,000 Women |
| 15 to 19 years | 0 (0.0%) | 0.0 |
| 20 to 34 years | 22 (84.6%) | 146.0 |
| 35 to 50 years | 4 (15.4%) | 13.0 |
| Total | 26 (100.0%) | 51.0 |
Fertility by Age by Marriage Status in Troy
30.8% of women with births (26) in Troy are married. The highest percentage of unmarried women with births falls into 20 to 34 years age bracket with 81.8% of them unmarried at the time of birth, while the lowest percentage of unmarried women with births belong to 35 to 50 years age bracket with 0.0% of them unmarried.
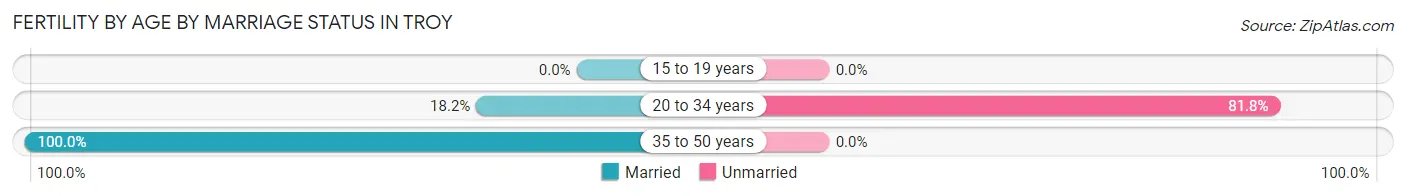
| Age Bracket | Married | Unmarried |
| 15 to 19 years | 0 (0.0%) | 0 (0.0%) |
| 20 to 34 years | 4 (18.2%) | 18 (81.8%) |
| 35 to 50 years | 4 (100.0%) | 0 (0.0%) |
| Total | 8 (30.8%) | 18 (69.2%) |
Fertility by Education in Troy
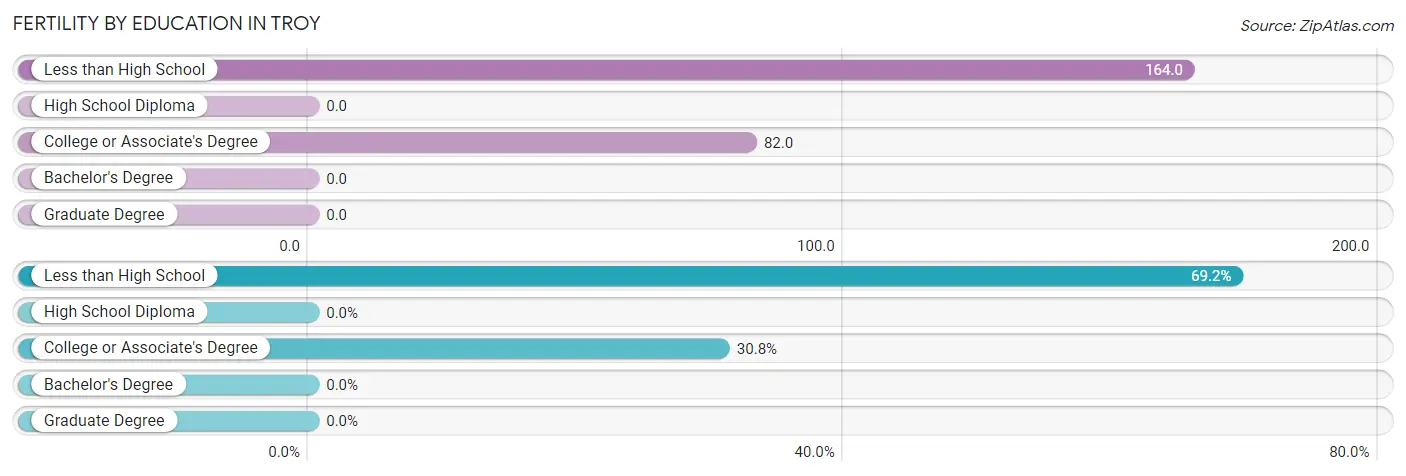
| Educational Attainment | Women with Births | Births / 1,000 Women |
| Less than High School | 18 (69.2%) | 164.0 |
| High School Diploma | 0 (0.0%) | 0.0 |
| College or Associate's Degree | 8 (30.8%) | 82.0 |
| Bachelor's Degree | 0 (0.0%) | 0.0 |
| Graduate Degree | 0 (0.0%) | 0.0 |
| Total | 26 (100.0%) | 51.0 |
Fertility by Education by Marriage Status in Troy
69.2% of women with births in Troy are unmarried. Women with the educational attainment of college or associate's degree are most likely to be married with 100.0% of them married at childbirth, while women with the educational attainment of less than high school are least likely to be married with 100.0% of them unmarried at childbirth.
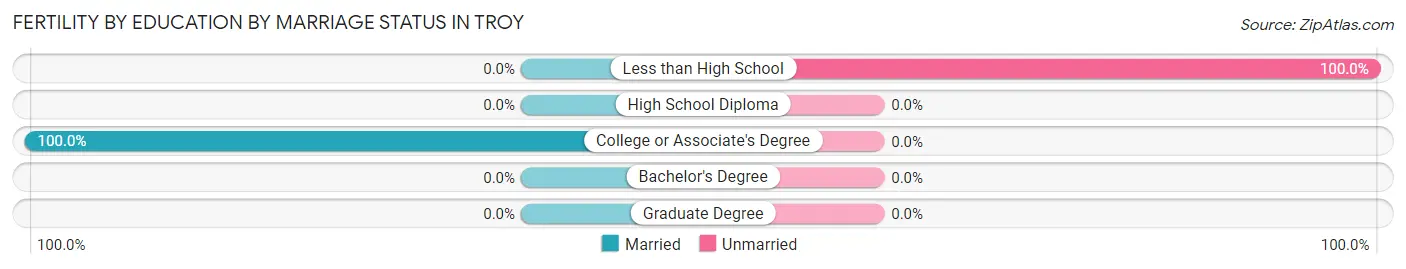
| Educational Attainment | Married | Unmarried |
| Less than High School | 0 (0.0%) | 18 (100.0%) |
| High School Diploma | 0 (0.0%) | 0 (0.0%) |
| College or Associate's Degree | 8 (100.0%) | 0 (0.0%) |
| Bachelor's Degree | 0 (0.0%) | 0 (0.0%) |
| Graduate Degree | 0 (0.0%) | 0 (0.0%) |
| Total | 8 (30.8%) | 18 (69.2%) |
Employment Characteristics in Troy
Employment by Class of Employer in Troy
Among the 868 employed individuals in Troy, private company employees (527 | 60.7%), not-for-profit organizations (101 | 11.6%), and local government employees (99 | 11.4%) make up the most common classes of employment.
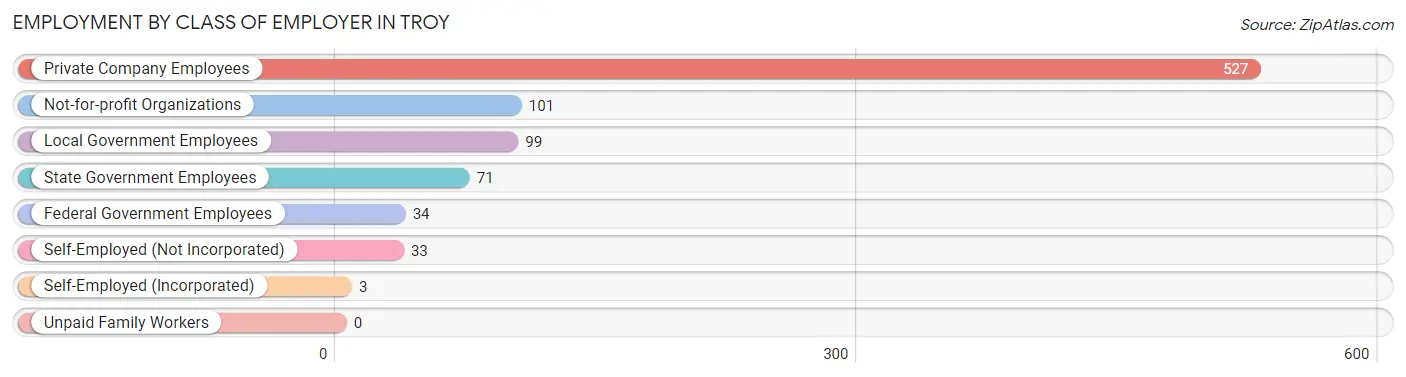
| Employer Class | # Employees | % Employees |
| Private Company Employees | 527 | 60.7% |
| Self-Employed (Incorporated) | 3 | 0.4% |
| Self-Employed (Not Incorporated) | 33 | 3.8% |
| Not-for-profit Organizations | 101 | 11.6% |
| Local Government Employees | 99 | 11.4% |
| State Government Employees | 71 | 8.2% |
| Federal Government Employees | 34 | 3.9% |
| Unpaid Family Workers | 0 | 0.0% |
| Total | 868 | 100.0% |
Employment Status by Age in Troy
According to the labor force statistics for Troy, out of the total population over 16 years of age (1,514), 60.8% or 921 individuals are in the labor force, with 3.7% or 34 of them unemployed. The age group with the highest labor force participation rate is 25 to 29 years, with 94.6% or 159 individuals in the labor force. Within the labor force, the 20 to 24 years age range has the highest percentage of unemployed individuals, with 27.3% or 18 of them being unemployed.
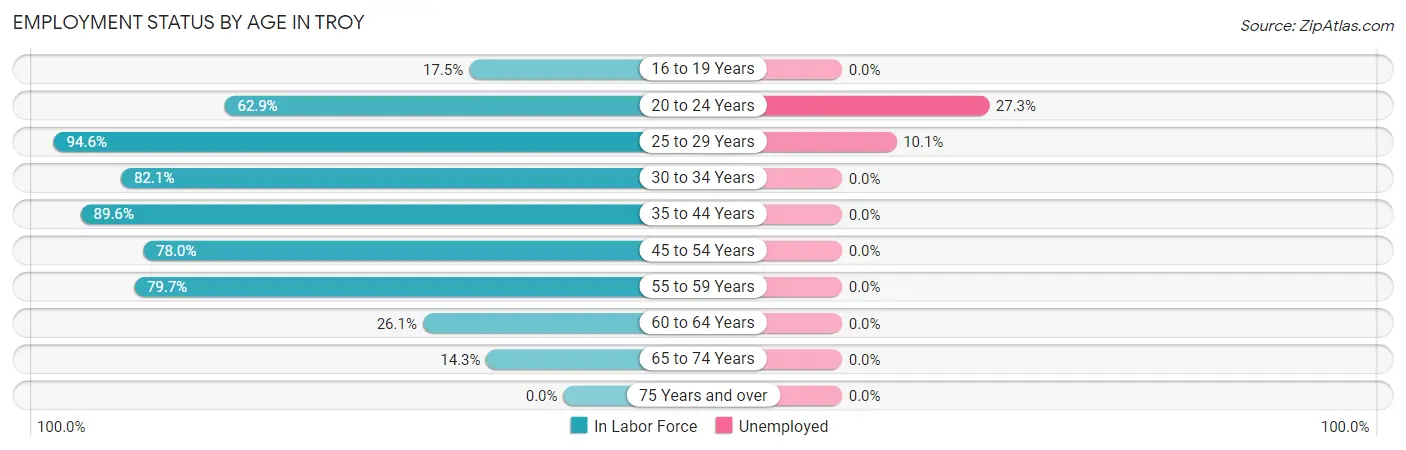
| Age Bracket | In Labor Force | Unemployed |
| 16 to 19 Years | 11 (17.5%) | 0 (0.0%) |
| 20 to 24 Years | 66 (62.9%) | 18 (27.3%) |
| 25 to 29 Years | 159 (94.6%) | 16 (10.1%) |
| 30 to 34 Years | 55 (82.1%) | 0 (0.0%) |
| 35 to 44 Years | 381 (89.6%) | 0 (0.0%) |
| 45 to 54 Years | 142 (78.0%) | 0 (0.0%) |
| 55 to 59 Years | 55 (79.7%) | 0 (0.0%) |
| 60 to 64 Years | 18 (26.1%) | 0 (0.0%) |
| 65 to 74 Years | 33 (14.3%) | 0 (0.0%) |
| 75 Years and over | 0 (0.0%) | 0 (0.0%) |
| Total | 921 (60.8%) | 34 (3.7%) |
Employment Status by Educational Attainment in Troy
According to labor force statistics for Troy, 82.7% of individuals (810) out of the total population between 25 and 64 years of age (980) are in the labor force, with 2.0% or 16 of them being unemployed. The group with the highest labor force participation rate are those with the educational attainment of bachelor's degree or higher, with 100.0% or 196 individuals in the labor force. Within the labor force, individuals with less than high school education have the highest percentage of unemployment, with 12.5% or 16 of them being unemployed.
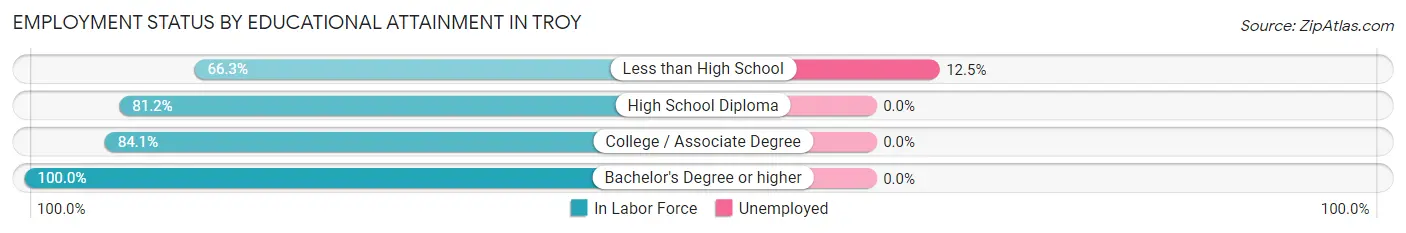
| Educational Attainment | In Labor Force | Unemployed |
| Less than High School | 128 (66.3%) | 24 (12.5%) |
| High School Diploma | 311 (81.2%) | 0 (0.0%) |
| College / Associate Degree | 175 (84.1%) | 0 (0.0%) |
| Bachelor's Degree or higher | 196 (100.0%) | 0 (0.0%) |
| Total | 810 (82.7%) | 20 (2.0%) |
Employment Occupations by Sex in Troy
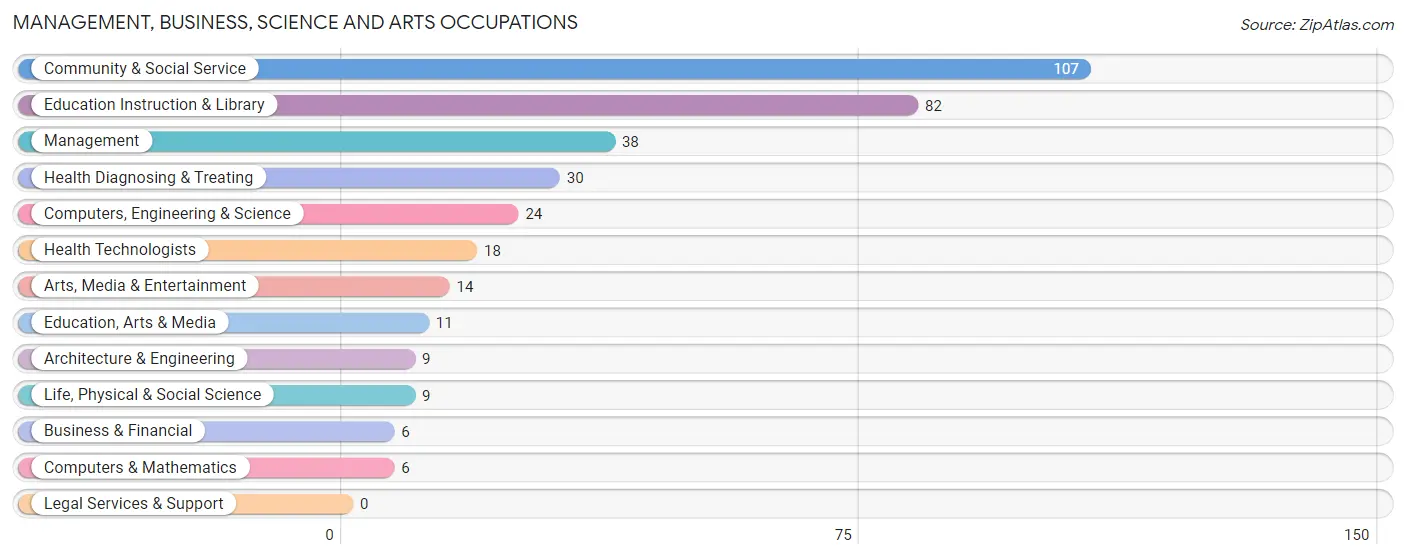
Management, Business, Science and Arts Occupations
The most common Management, Business, Science and Arts occupations in Troy are Community & Social Service (107 | 12.1%), Education Instruction & Library (82 | 9.3%), Management (38 | 4.3%), Health Diagnosing & Treating (30 | 3.4%), and Computers, Engineering & Science (24 | 2.7%).
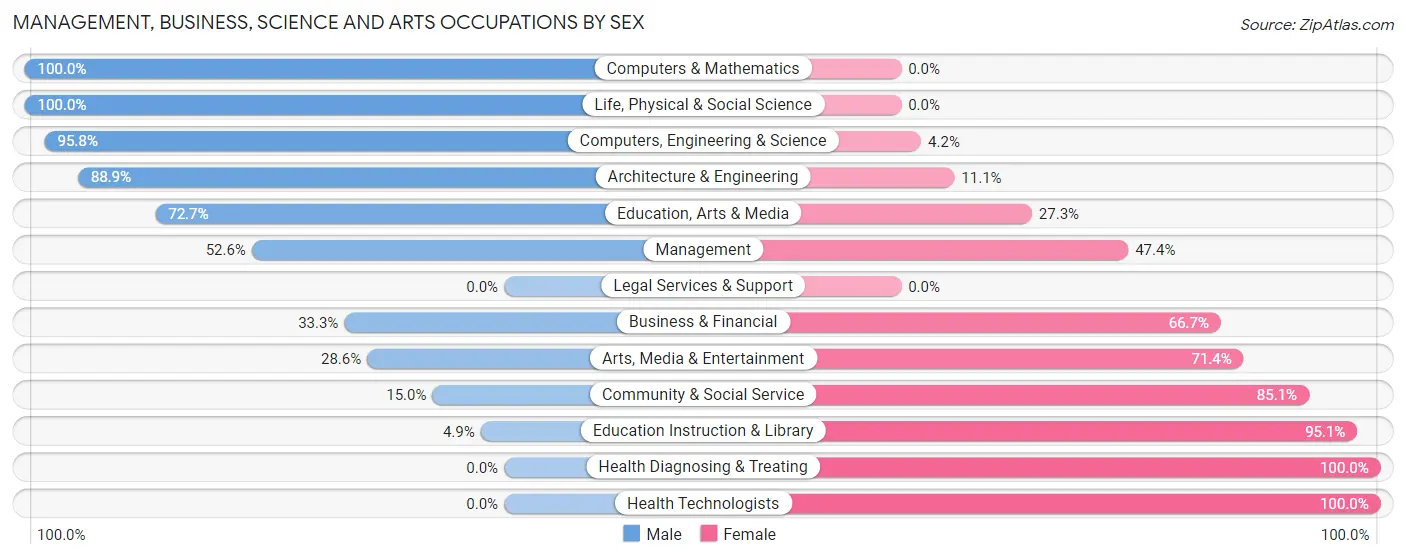
Management, Business, Science and Arts Occupations by Sex
Within the Management, Business, Science and Arts occupations in Troy, the most male-oriented occupations are Computers & Mathematics (100.0%), Life, Physical & Social Science (100.0%), and Computers, Engineering & Science (95.8%), while the most female-oriented occupations are Health Diagnosing & Treating (100.0%), Health Technologists (100.0%), and Education Instruction & Library (95.1%).
| Occupation | Male | Female |
| Management | 20 (52.6%) | 18 (47.4%) |
| Business & Financial | 2 (33.3%) | 4 (66.7%) |
| Computers, Engineering & Science | 23 (95.8%) | 1 (4.2%) |
| Computers & Mathematics | 6 (100.0%) | 0 (0.0%) |
| Architecture & Engineering | 8 (88.9%) | 1 (11.1%) |
| Life, Physical & Social Science | 9 (100.0%) | 0 (0.0%) |
| Community & Social Service | 16 (14.9%) | 91 (85.1%) |
| Education, Arts & Media | 8 (72.7%) | 3 (27.3%) |
| Legal Services & Support | 0 (0.0%) | 0 (0.0%) |
| Education Instruction & Library | 4 (4.9%) | 78 (95.1%) |
| Arts, Media & Entertainment | 4 (28.6%) | 10 (71.4%) |
| Health Diagnosing & Treating | 0 (0.0%) | 30 (100.0%) |
| Health Technologists | 0 (0.0%) | 18 (100.0%) |
| Total (Category) | 61 (29.8%) | 144 (70.2%) |
| Total (Overall) | 455 (51.3%) | 431 (48.6%) |
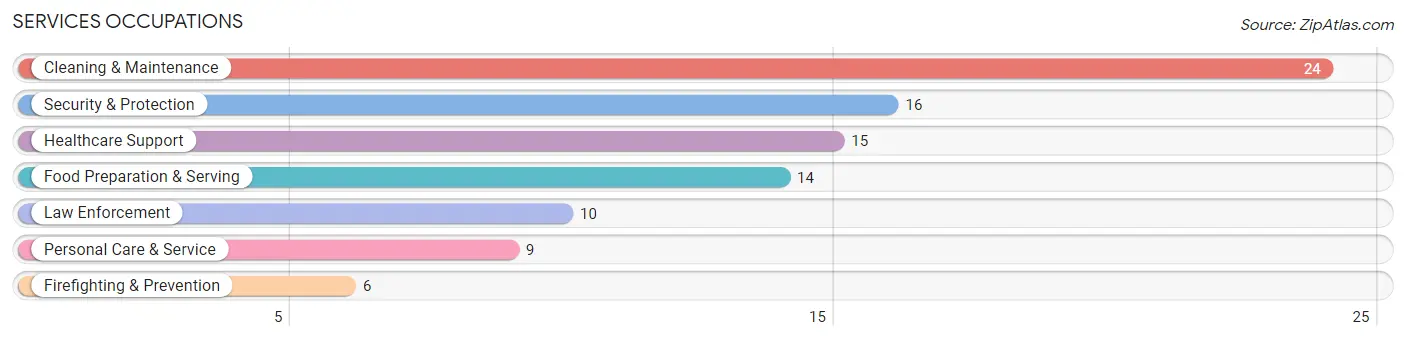
Services Occupations
The most common Services occupations in Troy are Cleaning & Maintenance (24 | 2.7%), Security & Protection (16 | 1.8%), Healthcare Support (15 | 1.7%), Food Preparation & Serving (14 | 1.6%), and Law Enforcement (10 | 1.1%).
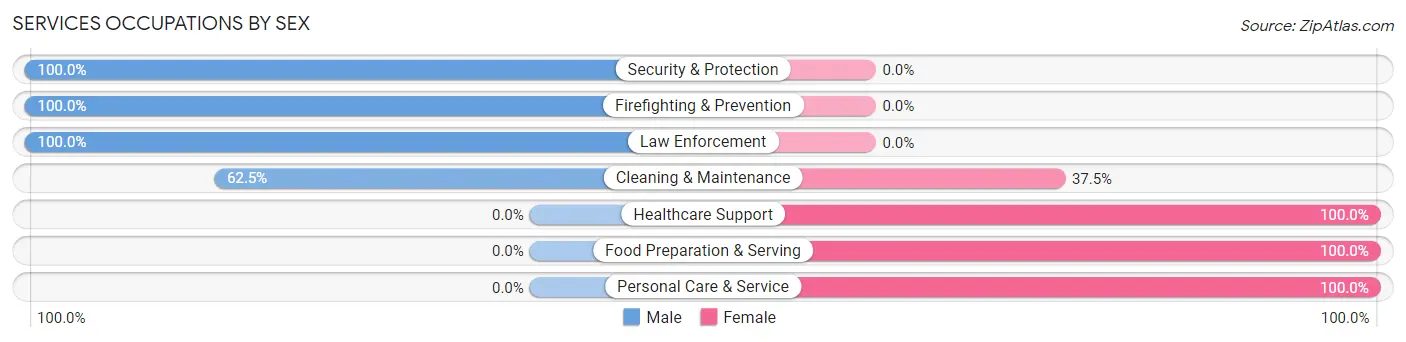
Services Occupations by Sex
Within the Services occupations in Troy, the most male-oriented occupations are Security & Protection (100.0%), Firefighting & Prevention (100.0%), and Law Enforcement (100.0%), while the most female-oriented occupations are Healthcare Support (100.0%), Food Preparation & Serving (100.0%), and Personal Care & Service (100.0%).
| Occupation | Male | Female |
| Healthcare Support | 0 (0.0%) | 15 (100.0%) |
| Security & Protection | 16 (100.0%) | 0 (0.0%) |
| Firefighting & Prevention | 6 (100.0%) | 0 (0.0%) |
| Law Enforcement | 10 (100.0%) | 0 (0.0%) |
| Food Preparation & Serving | 0 (0.0%) | 14 (100.0%) |
| Cleaning & Maintenance | 15 (62.5%) | 9 (37.5%) |
| Personal Care & Service | 0 (0.0%) | 9 (100.0%) |
| Total (Category) | 31 (39.7%) | 47 (60.3%) |
| Total (Overall) | 455 (51.3%) | 431 (48.6%) |
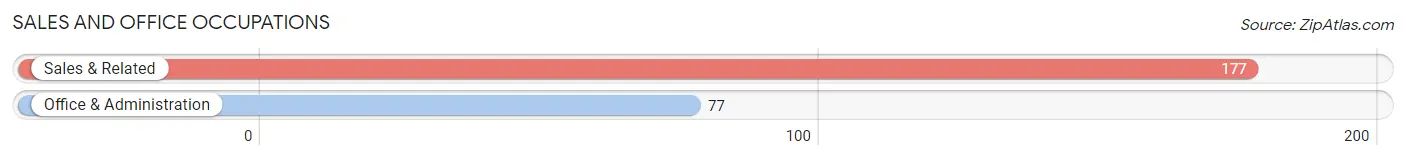
Sales and Office Occupations
The most common Sales and Office occupations in Troy are Sales & Related (177 | 20.0%), and Office & Administration (77 | 8.7%).
Sales and Office Occupations by Sex
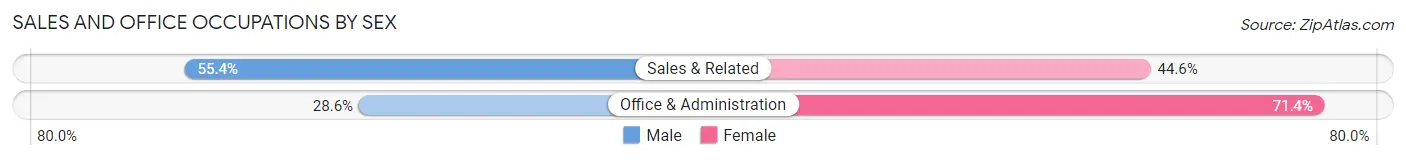
| Occupation | Male | Female |
| Sales & Related | 98 (55.4%) | 79 (44.6%) |
| Office & Administration | 22 (28.6%) | 55 (71.4%) |
| Total (Category) | 120 (47.2%) | 134 (52.8%) |
| Total (Overall) | 455 (51.3%) | 431 (48.6%) |
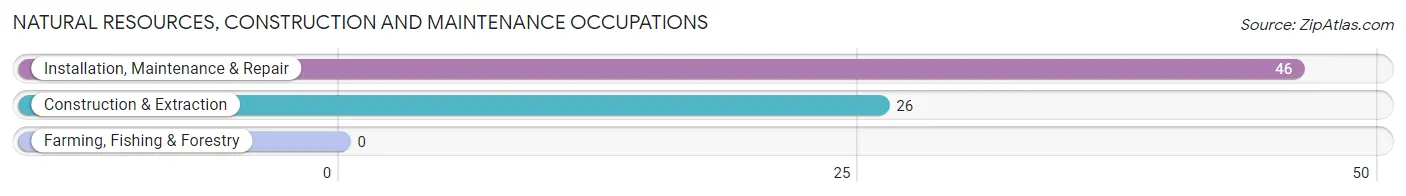
Natural Resources, Construction and Maintenance Occupations
The most common Natural Resources, Construction and Maintenance occupations in Troy are Installation, Maintenance & Repair (46 | 5.2%), and Construction & Extraction (26 | 2.9%).
Natural Resources, Construction and Maintenance Occupations by Sex

| Occupation | Male | Female |
| Farming, Fishing & Forestry | 0 (0.0%) | 0 (0.0%) |
| Construction & Extraction | 26 (100.0%) | 0 (0.0%) |
| Installation, Maintenance & Repair | 46 (100.0%) | 0 (0.0%) |
| Total (Category) | 72 (100.0%) | 0 (0.0%) |
| Total (Overall) | 455 (51.3%) | 431 (48.6%) |
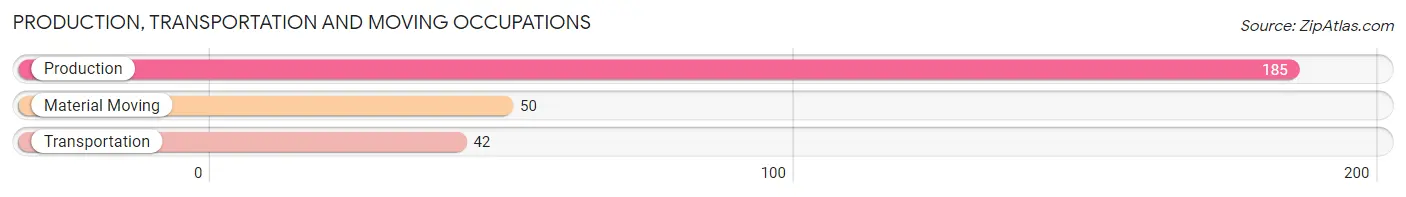
Production, Transportation and Moving Occupations
The most common Production, Transportation and Moving occupations in Troy are Production (185 | 20.9%), Material Moving (50 | 5.6%), and Transportation (42 | 4.7%).
Production, Transportation and Moving Occupations by Sex
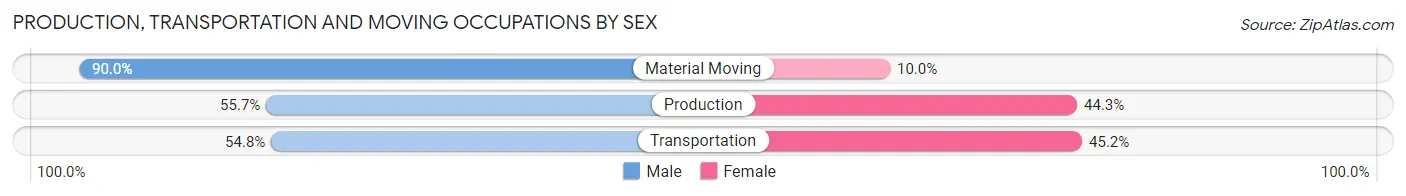
| Occupation | Male | Female |
| Production | 103 (55.7%) | 82 (44.3%) |
| Transportation | 23 (54.8%) | 19 (45.2%) |
| Material Moving | 45 (90.0%) | 5 (10.0%) |
| Total (Category) | 171 (61.7%) | 106 (38.3%) |
| Total (Overall) | 455 (51.3%) | 431 (48.6%) |
Employment Industries by Sex in Troy
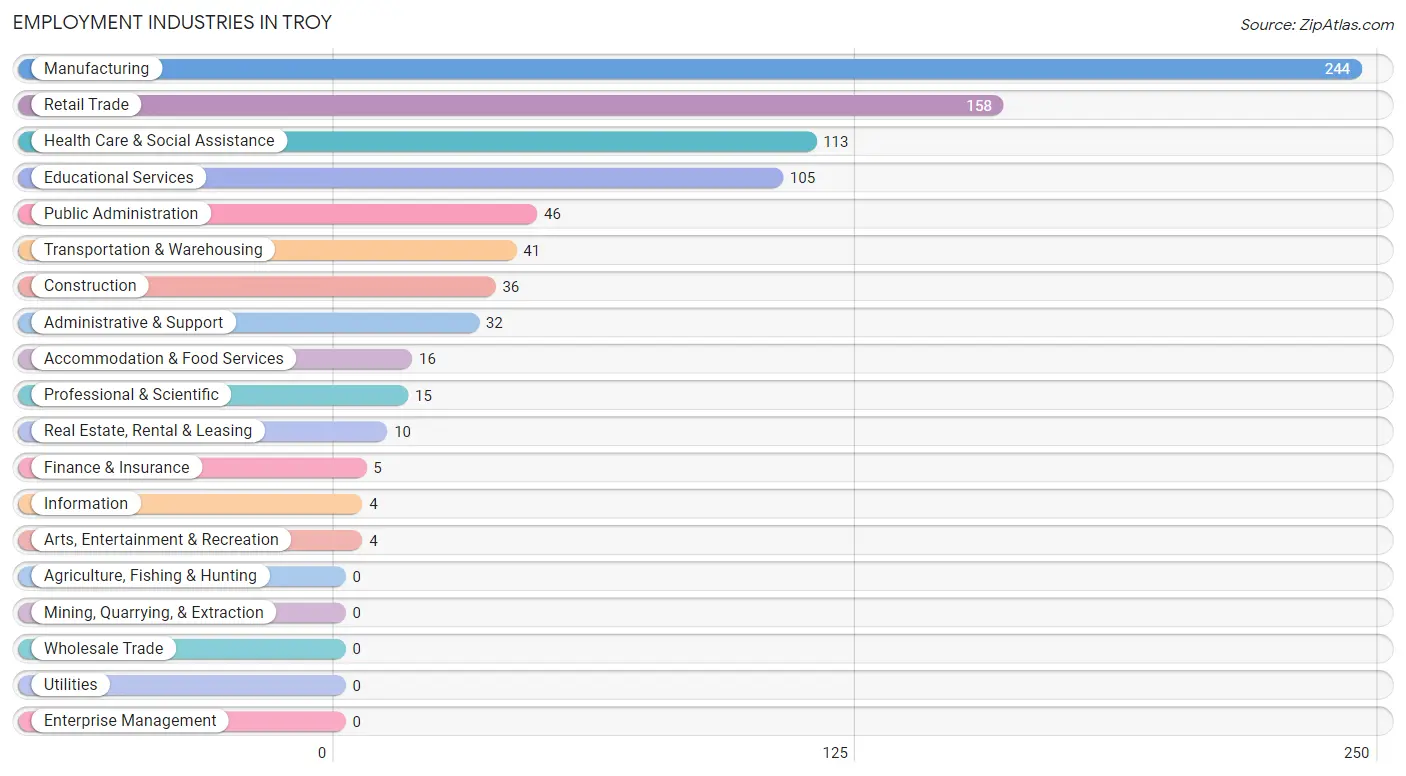
Employment Industries in Troy
The major employment industries in Troy include Manufacturing (244 | 27.5%), Retail Trade (158 | 17.8%), Health Care & Social Assistance (113 | 12.8%), Educational Services (105 | 11.8%), and Public Administration (46 | 5.2%).
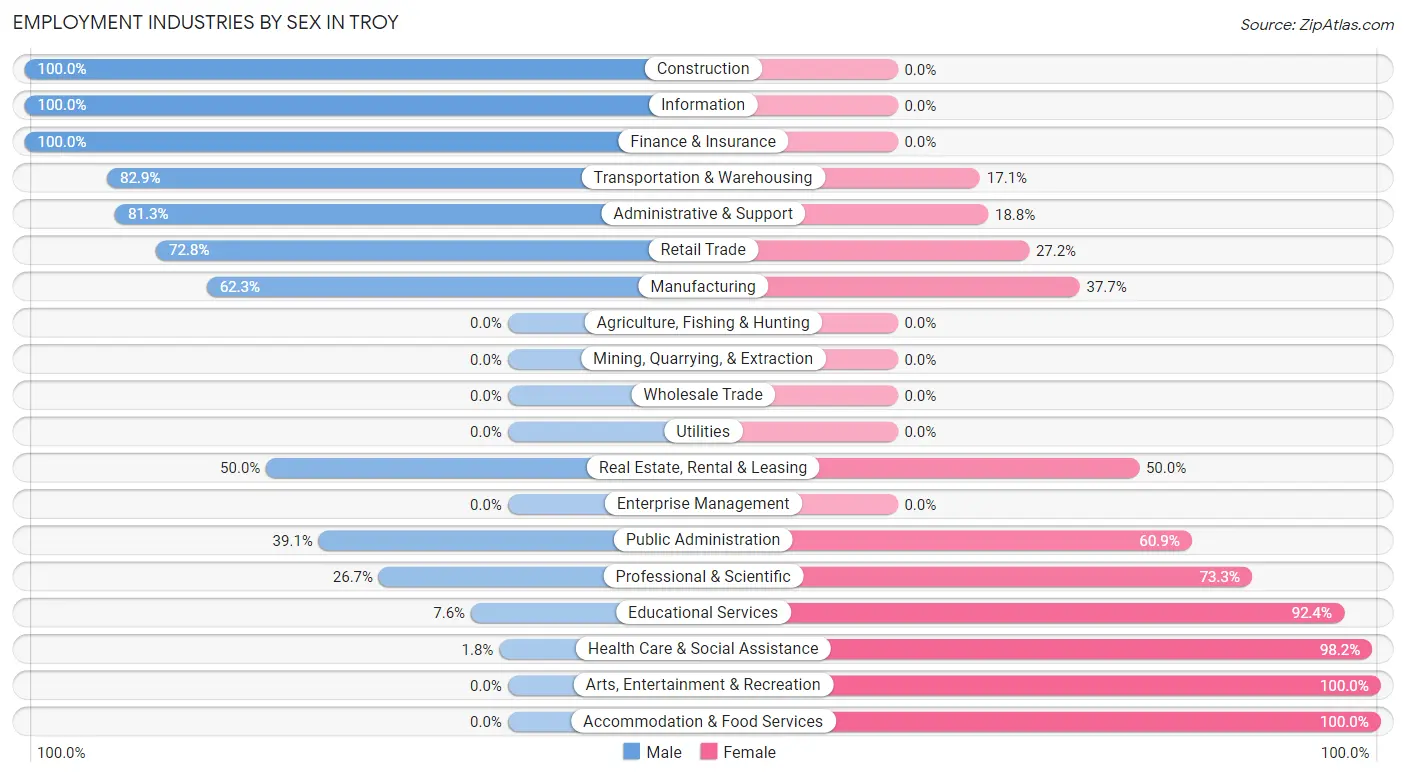
Employment Industries by Sex in Troy
The Troy industries that see more men than women are Construction (100.0%), Information (100.0%), and Finance & Insurance (100.0%), whereas the industries that tend to have a higher number of women are Arts, Entertainment & Recreation (100.0%), Accommodation & Food Services (100.0%), and Health Care & Social Assistance (98.2%).
| Industry | Male | Female |
| Agriculture, Fishing & Hunting | 0 (0.0%) | 0 (0.0%) |
| Mining, Quarrying, & Extraction | 0 (0.0%) | 0 (0.0%) |
| Construction | 36 (100.0%) | 0 (0.0%) |
| Manufacturing | 152 (62.3%) | 92 (37.7%) |
| Wholesale Trade | 0 (0.0%) | 0 (0.0%) |
| Retail Trade | 115 (72.8%) | 43 (27.2%) |
| Transportation & Warehousing | 34 (82.9%) | 7 (17.1%) |
| Utilities | 0 (0.0%) | 0 (0.0%) |
| Information | 4 (100.0%) | 0 (0.0%) |
| Finance & Insurance | 5 (100.0%) | 0 (0.0%) |
| Real Estate, Rental & Leasing | 5 (50.0%) | 5 (50.0%) |
| Professional & Scientific | 4 (26.7%) | 11 (73.3%) |
| Enterprise Management | 0 (0.0%) | 0 (0.0%) |
| Administrative & Support | 26 (81.2%) | 6 (18.8%) |
| Educational Services | 8 (7.6%) | 97 (92.4%) |
| Health Care & Social Assistance | 2 (1.8%) | 111 (98.2%) |
| Arts, Entertainment & Recreation | 0 (0.0%) | 4 (100.0%) |
| Accommodation & Food Services | 0 (0.0%) | 16 (100.0%) |
| Public Administration | 18 (39.1%) | 28 (60.9%) |
| Total | 455 (51.3%) | 431 (48.6%) |
Education in Troy
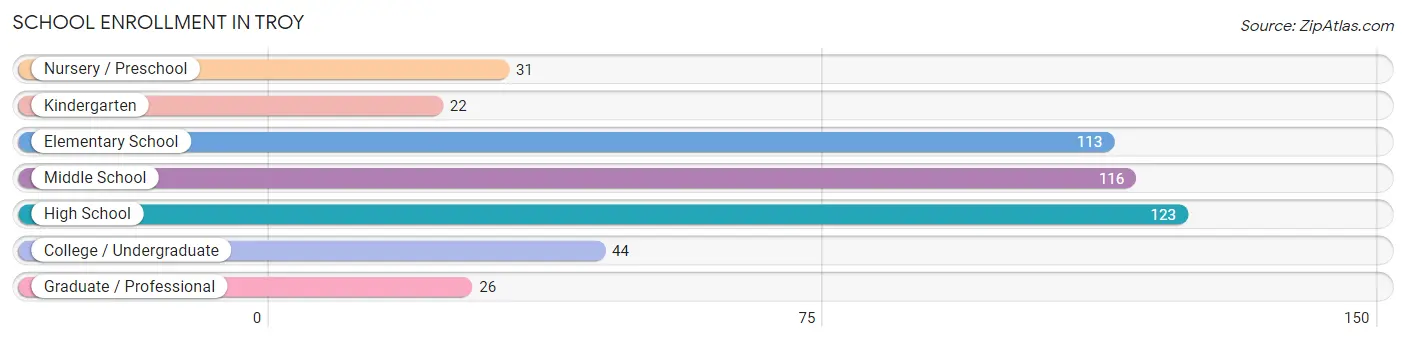
School Enrollment in Troy
The most common levels of schooling among the 475 students in Troy are high school (123 | 25.9%), middle school (116 | 24.4%), and elementary school (113 | 23.8%).
| School Level | # Students | % Students |
| Nursery / Preschool | 31 | 6.5% |
| Kindergarten | 22 | 4.6% |
| Elementary School | 113 | 23.8% |
| Middle School | 116 | 24.4% |
| High School | 123 | 25.9% |
| College / Undergraduate | 44 | 9.3% |
| Graduate / Professional | 26 | 5.5% |
| Total | 475 | 100.0% |
School Enrollment by Age by Funding Source in Troy
Out of a total of 475 students who are enrolled in schools in Troy, 41 (8.6%) attend a private institution, while the remaining 434 (91.4%) are enrolled in public schools. The age group of 3 to 4 year olds has the highest likelihood of being enrolled in private schools, with 7 (100.0% in the age bracket) enrolled. Conversely, the age group of 18 to 19 year olds has the lowest likelihood of being enrolled in a private school, with 19 (100.0% in the age bracket) attending a public institution.
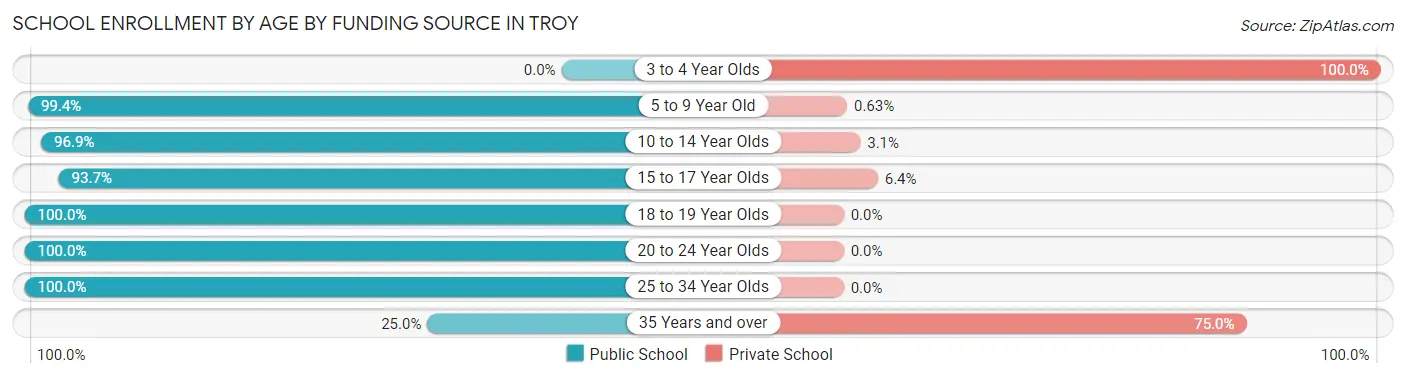
| Age Bracket | Public School | Private School |
| 3 to 4 Year Olds | 0 (0.0%) | 7 (100.0%) |
| 5 to 9 Year Old | 158 (99.4%) | 1 (0.6%) |
| 10 to 14 Year Olds | 157 (96.9%) | 5 (3.1%) |
| 15 to 17 Year Olds | 59 (93.6%) | 4 (6.4%) |
| 18 to 19 Year Olds | 19 (100.0%) | 0 (0.0%) |
| 20 to 24 Year Olds | 29 (100.0%) | 0 (0.0%) |
| 25 to 34 Year Olds | 4 (100.0%) | 0 (0.0%) |
| 35 Years and over | 8 (25.0%) | 24 (75.0%) |
| Total | 434 (91.4%) | 41 (8.6%) |
Educational Attainment by Field of Study in Troy
Physical & health sciences (57 | 21.3%), social sciences (31 | 11.6%), liberal arts & history (26 | 9.7%), computers & mathematics (24 | 9.0%), and business (24 | 9.0%) are the most common fields of study among 268 individuals in Troy who have obtained a bachelor's degree or higher.
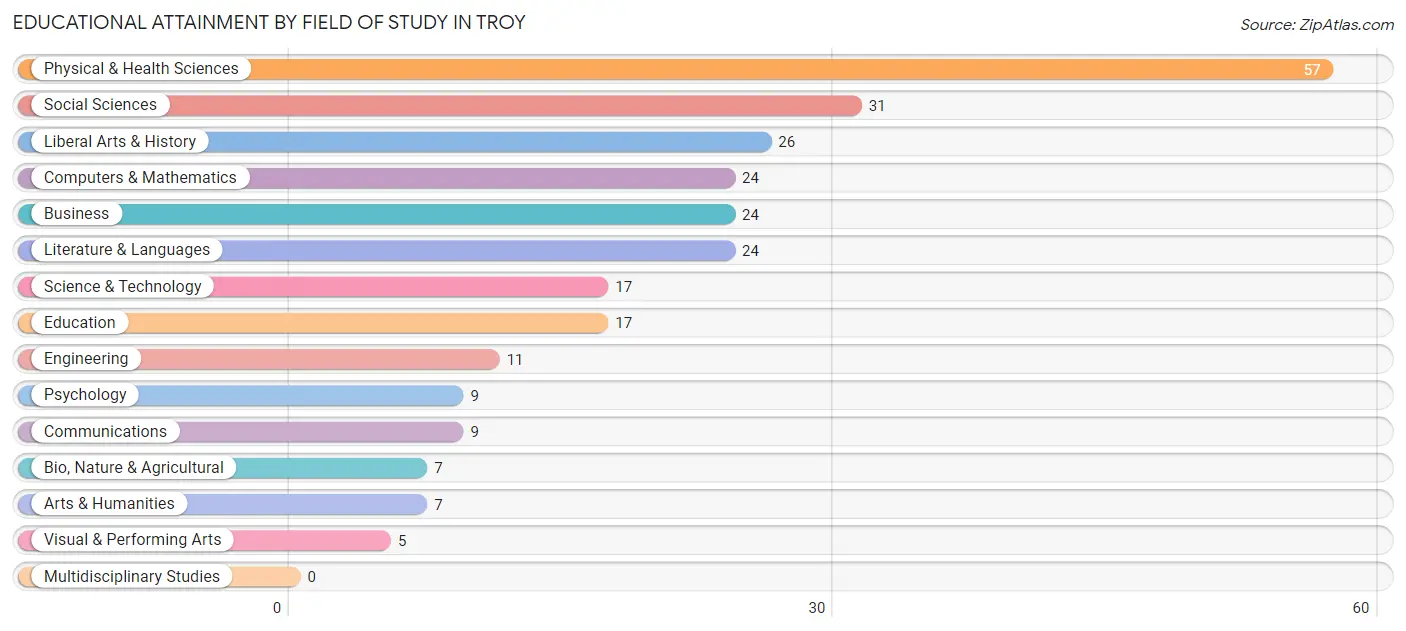
| Field of Study | # Graduates | % Graduates |
| Computers & Mathematics | 24 | 9.0% |
| Bio, Nature & Agricultural | 7 | 2.6% |
| Physical & Health Sciences | 57 | 21.3% |
| Psychology | 9 | 3.4% |
| Social Sciences | 31 | 11.6% |
| Engineering | 11 | 4.1% |
| Multidisciplinary Studies | 0 | 0.0% |
| Science & Technology | 17 | 6.3% |
| Business | 24 | 9.0% |
| Education | 17 | 6.3% |
| Literature & Languages | 24 | 9.0% |
| Liberal Arts & History | 26 | 9.7% |
| Visual & Performing Arts | 5 | 1.9% |
| Communications | 9 | 3.4% |
| Arts & Humanities | 7 | 2.6% |
| Total | 268 | 100.0% |
Transportation & Commute in Troy
Vehicle Availability by Sex in Troy
The most prevalent vehicle ownership categories in Troy are males with 2 vehicles (229, accounting for 51.9%) and females with 2 vehicles (158, making up 53.6%).
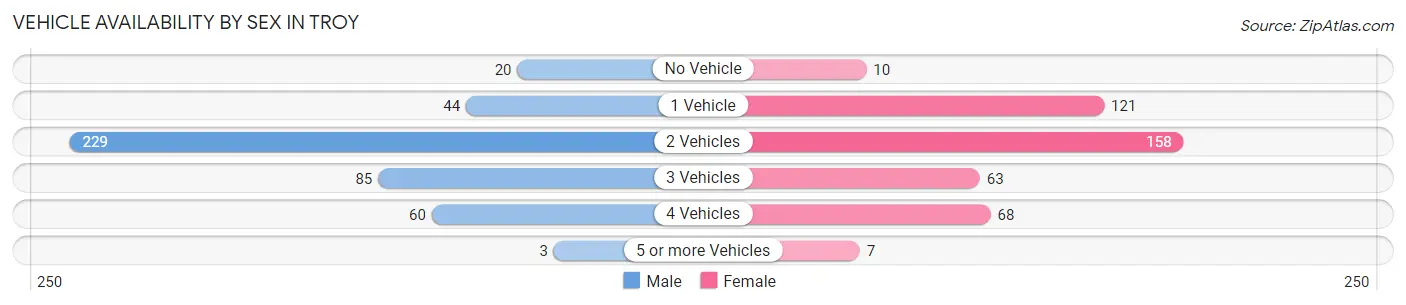
| Vehicles Available | Male | Female |
| No Vehicle | 20 (4.5%) | 10 (2.3%) |
| 1 Vehicle | 44 (10.0%) | 121 (28.3%) |
| 2 Vehicles | 229 (51.9%) | 158 (37.0%) |
| 3 Vehicles | 85 (19.3%) | 63 (14.7%) |
| 4 Vehicles | 60 (13.6%) | 68 (15.9%) |
| 5 or more Vehicles | 3 (0.7%) | 7 (1.6%) |
| Total | 441 (100.0%) | 427 (100.0%) |
Commute Time in Troy
The most frequently occuring commute durations in Troy are 15 to 19 minutes (209 commuters, 24.7%), 10 to 14 minutes (117 commuters, 13.8%), and 20 to 24 minutes (112 commuters, 13.2%).
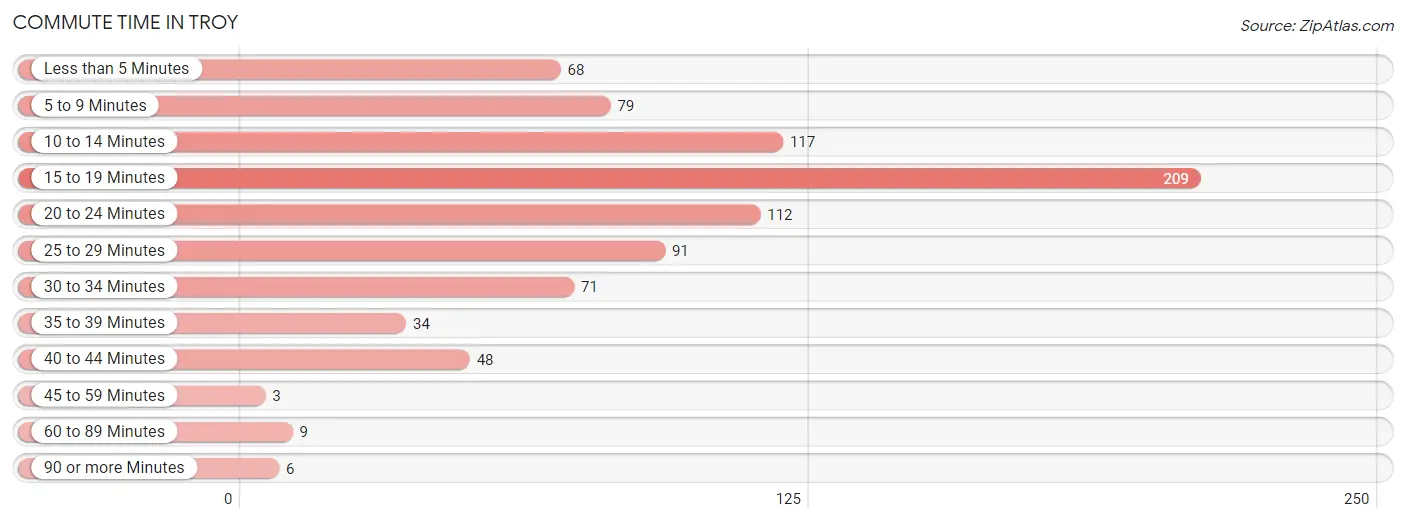
| Commute Time | # Commuters | % Commuters |
| Less than 5 Minutes | 68 | 8.0% |
| 5 to 9 Minutes | 79 | 9.3% |
| 10 to 14 Minutes | 117 | 13.8% |
| 15 to 19 Minutes | 209 | 24.7% |
| 20 to 24 Minutes | 112 | 13.2% |
| 25 to 29 Minutes | 91 | 10.7% |
| 30 to 34 Minutes | 71 | 8.4% |
| 35 to 39 Minutes | 34 | 4.0% |
| 40 to 44 Minutes | 48 | 5.7% |
| 45 to 59 Minutes | 3 | 0.4% |
| 60 to 89 Minutes | 9 | 1.1% |
| 90 or more Minutes | 6 | 0.7% |
Commute Time by Sex in Troy
The most common commute times in Troy are 15 to 19 minutes (104 commuters, 23.7%) for males and 15 to 19 minutes (105 commuters, 25.7%) for females.
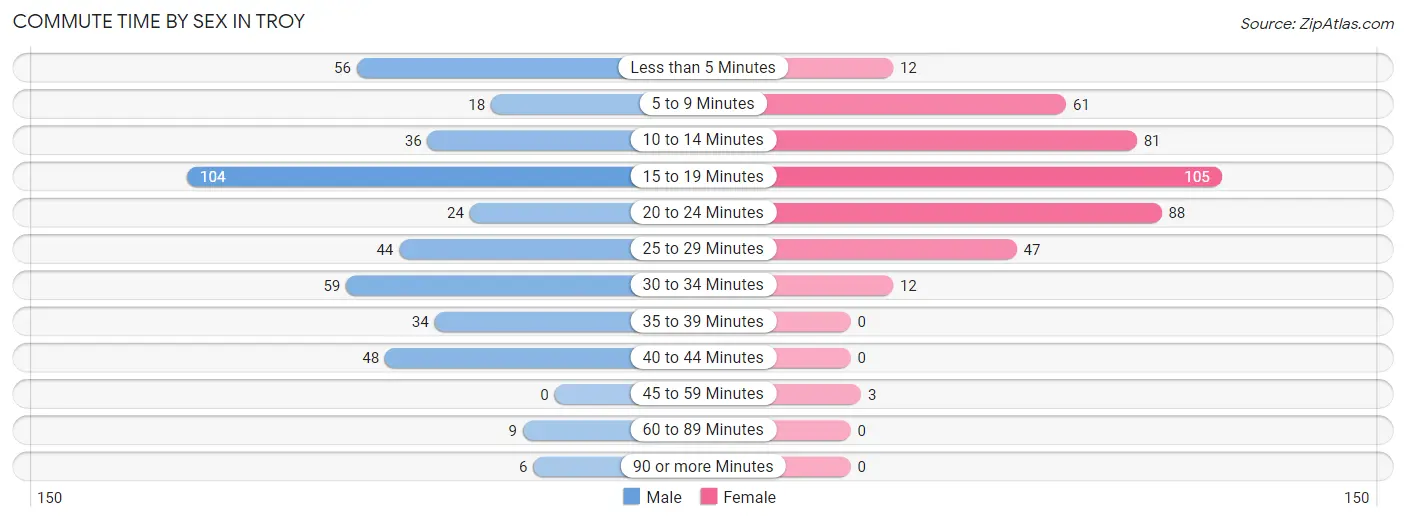
| Commute Time | Male | Female |
| Less than 5 Minutes | 56 (12.8%) | 12 (2.9%) |
| 5 to 9 Minutes | 18 (4.1%) | 61 (14.9%) |
| 10 to 14 Minutes | 36 (8.2%) | 81 (19.8%) |
| 15 to 19 Minutes | 104 (23.7%) | 105 (25.7%) |
| 20 to 24 Minutes | 24 (5.5%) | 88 (21.5%) |
| 25 to 29 Minutes | 44 (10.1%) | 47 (11.5%) |
| 30 to 34 Minutes | 59 (13.5%) | 12 (2.9%) |
| 35 to 39 Minutes | 34 (7.8%) | 0 (0.0%) |
| 40 to 44 Minutes | 48 (11.0%) | 0 (0.0%) |
| 45 to 59 Minutes | 0 (0.0%) | 3 (0.7%) |
| 60 to 89 Minutes | 9 (2.1%) | 0 (0.0%) |
| 90 or more Minutes | 6 (1.4%) | 0 (0.0%) |
Time of Departure to Work by Sex in Troy
The most frequent times of departure to work in Troy are 7:00 AM to 7:29 AM (87, 19.9%) for males and 6:30 AM to 6:59 AM (152, 37.2%) for females.
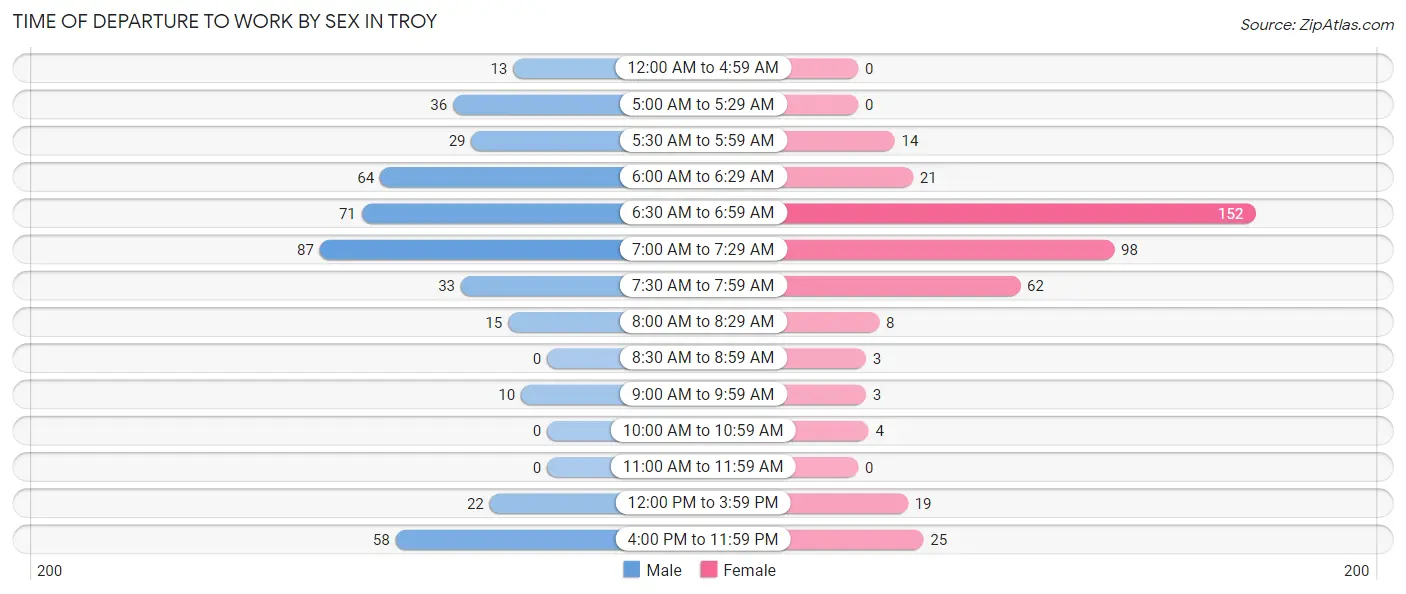
| Time of Departure | Male | Female |
| 12:00 AM to 4:59 AM | 13 (3.0%) | 0 (0.0%) |
| 5:00 AM to 5:29 AM | 36 (8.2%) | 0 (0.0%) |
| 5:30 AM to 5:59 AM | 29 (6.6%) | 14 (3.4%) |
| 6:00 AM to 6:29 AM | 64 (14.6%) | 21 (5.1%) |
| 6:30 AM to 6:59 AM | 71 (16.2%) | 152 (37.2%) |
| 7:00 AM to 7:29 AM | 87 (19.9%) | 98 (24.0%) |
| 7:30 AM to 7:59 AM | 33 (7.5%) | 62 (15.2%) |
| 8:00 AM to 8:29 AM | 15 (3.4%) | 8 (2.0%) |
| 8:30 AM to 8:59 AM | 0 (0.0%) | 3 (0.7%) |
| 9:00 AM to 9:59 AM | 10 (2.3%) | 3 (0.7%) |
| 10:00 AM to 10:59 AM | 0 (0.0%) | 4 (1.0%) |
| 11:00 AM to 11:59 AM | 0 (0.0%) | 0 (0.0%) |
| 12:00 PM to 3:59 PM | 22 (5.0%) | 19 (4.6%) |
| 4:00 PM to 11:59 PM | 58 (13.2%) | 25 (6.1%) |
| Total | 438 (100.0%) | 409 (100.0%) |
Housing Occupancy in Troy
Occupancy by Ownership in Troy
Of the total 786 dwellings in Troy, owner-occupied units account for 556 (70.7%), while renter-occupied units make up 230 (29.3%).
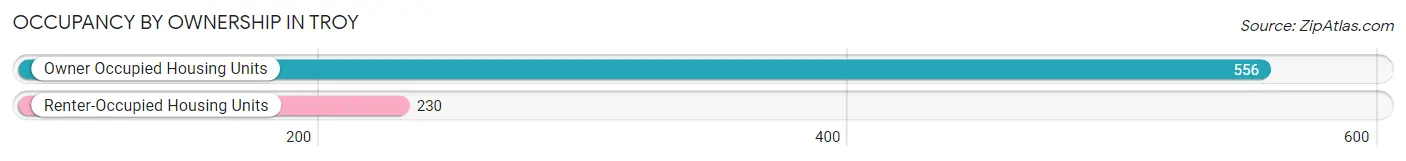
| Occupancy | # Housing Units | % Housing Units |
| Owner Occupied Housing Units | 556 | 70.7% |
| Renter-Occupied Housing Units | 230 | 29.3% |
| Total Occupied Housing Units | 786 | 100.0% |
Occupancy by Household Size in Troy
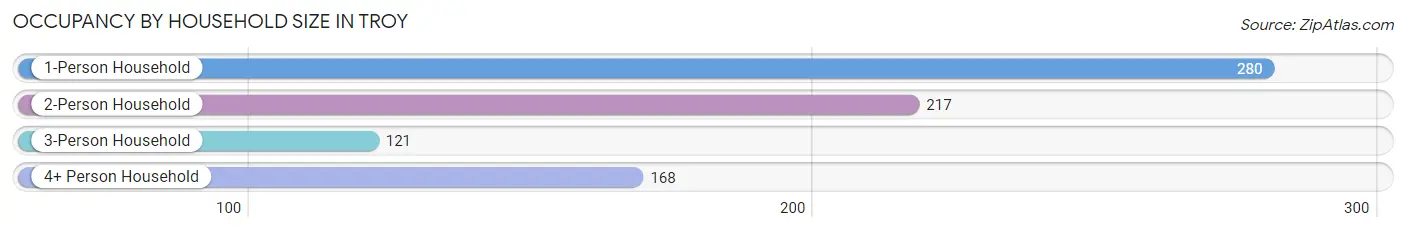
| Household Size | # Housing Units | % Housing Units |
| 1-Person Household | 280 | 35.6% |
| 2-Person Household | 217 | 27.6% |
| 3-Person Household | 121 | 15.4% |
| 4+ Person Household | 168 | 21.4% |
| Total Housing Units | 786 | 100.0% |
Occupancy by Ownership by Household Size in Troy
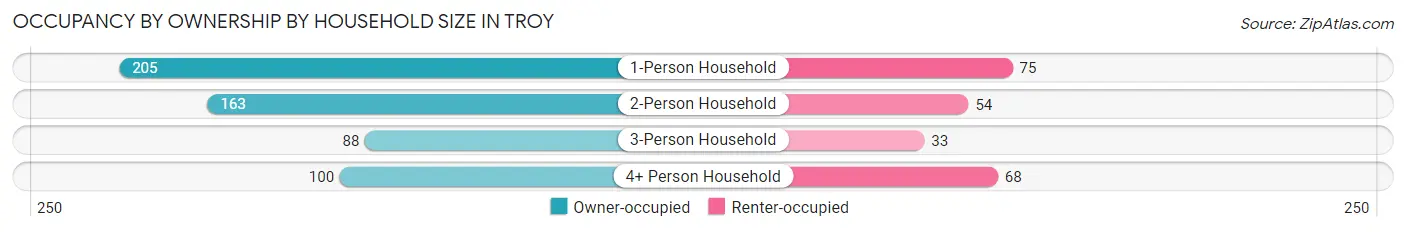
| Household Size | Owner-occupied | Renter-occupied |
| 1-Person Household | 205 (73.2%) | 75 (26.8%) |
| 2-Person Household | 163 (75.1%) | 54 (24.9%) |
| 3-Person Household | 88 (72.7%) | 33 (27.3%) |
| 4+ Person Household | 100 (59.5%) | 68 (40.5%) |
| Total Housing Units | 556 (70.7%) | 230 (29.3%) |
Occupancy by Educational Attainment in Troy
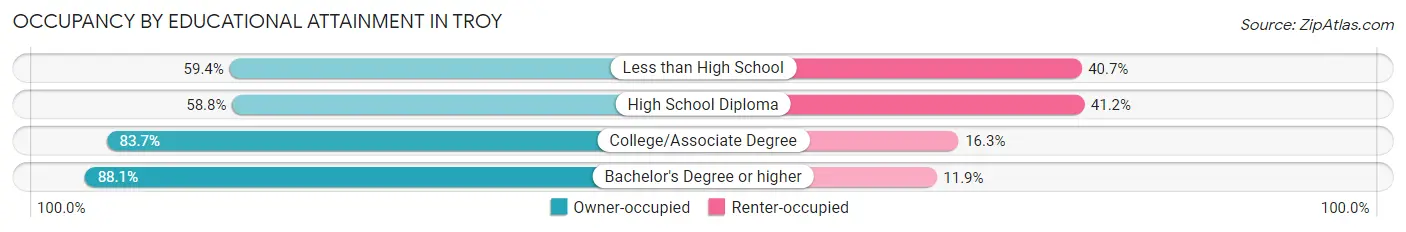
| Household Size | Owner-occupied | Renter-occupied |
| Less than High School | 92 (59.4%) | 63 (40.6%) |
| High School Diploma | 170 (58.8%) | 119 (41.2%) |
| College/Associate Degree | 139 (83.7%) | 27 (16.3%) |
| Bachelor's Degree or higher | 155 (88.1%) | 21 (11.9%) |
Occupancy by Age of Householder in Troy
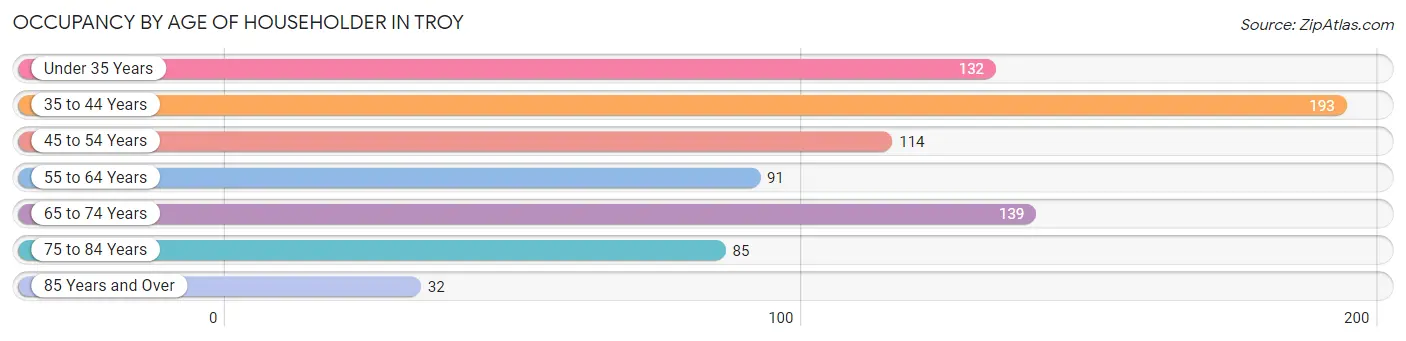
| Age Bracket | # Households | % Households |
| Under 35 Years | 132 | 16.8% |
| 35 to 44 Years | 193 | 24.5% |
| 45 to 54 Years | 114 | 14.5% |
| 55 to 64 Years | 91 | 11.6% |
| 65 to 74 Years | 139 | 17.7% |
| 75 to 84 Years | 85 | 10.8% |
| 85 Years and Over | 32 | 4.1% |
| Total | 786 | 100.0% |
Housing Finances in Troy
Median Income by Occupancy in Troy
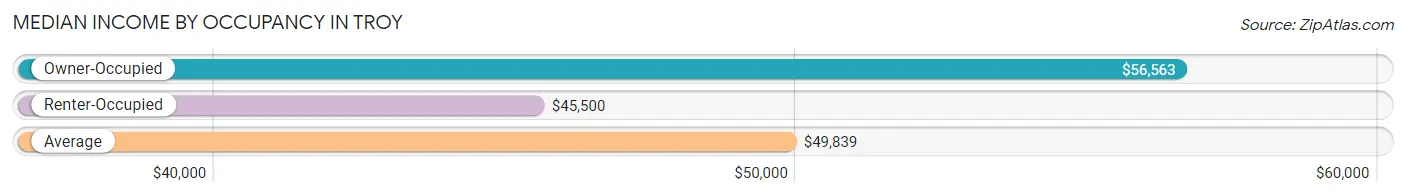
| Occupancy Type | # Households | Median Income |
| Owner-Occupied | 556 (70.7%) | $56,563 |
| Renter-Occupied | 230 (29.3%) | $45,500 |
| Average | 786 (100.0%) | $49,839 |
Occupancy by Householder Income Bracket in Troy
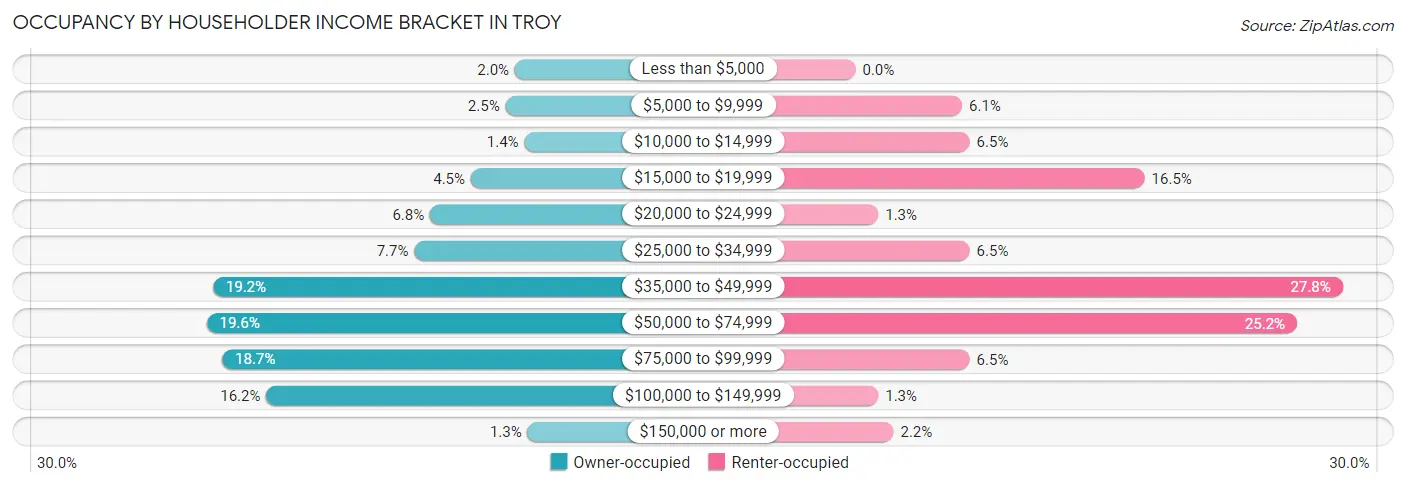
| Income Bracket | Owner-occupied | Renter-occupied |
| Less than $5,000 | 11 (2.0%) | 0 (0.0%) |
| $5,000 to $9,999 | 14 (2.5%) | 14 (6.1%) |
| $10,000 to $14,999 | 8 (1.4%) | 15 (6.5%) |
| $15,000 to $19,999 | 25 (4.5%) | 38 (16.5%) |
| $20,000 to $24,999 | 38 (6.8%) | 3 (1.3%) |
| $25,000 to $34,999 | 43 (7.7%) | 15 (6.5%) |
| $35,000 to $49,999 | 107 (19.2%) | 64 (27.8%) |
| $50,000 to $74,999 | 109 (19.6%) | 58 (25.2%) |
| $75,000 to $99,999 | 104 (18.7%) | 15 (6.5%) |
| $100,000 to $149,999 | 90 (16.2%) | 3 (1.3%) |
| $150,000 or more | 7 (1.3%) | 5 (2.2%) |
| Total | 556 (100.0%) | 230 (100.0%) |
Monthly Housing Cost Tiers in Troy
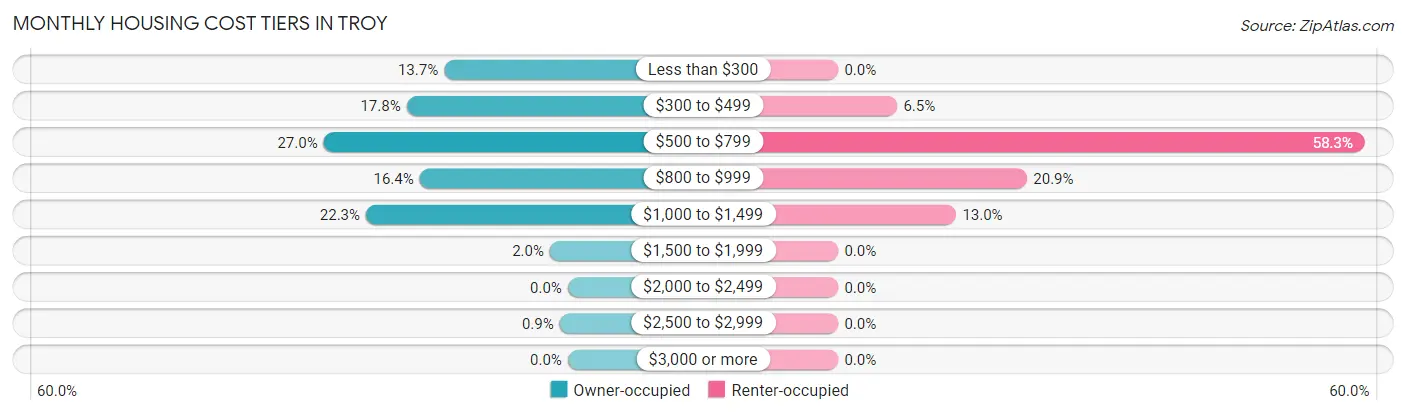
| Monthly Cost | Owner-occupied | Renter-occupied |
| Less than $300 | 76 (13.7%) | 0 (0.0%) |
| $300 to $499 | 99 (17.8%) | 15 (6.5%) |
| $500 to $799 | 150 (27.0%) | 134 (58.3%) |
| $800 to $999 | 91 (16.4%) | 48 (20.9%) |
| $1,000 to $1,499 | 124 (22.3%) | 30 (13.0%) |
| $1,500 to $1,999 | 11 (2.0%) | 0 (0.0%) |
| $2,000 to $2,499 | 0 (0.0%) | 0 (0.0%) |
| $2,500 to $2,999 | 5 (0.9%) | 0 (0.0%) |
| $3,000 or more | 0 (0.0%) | 0 (0.0%) |
| Total | 556 (100.0%) | 230 (100.0%) |
Physical Housing Characteristics in Troy
Housing Structures in Troy
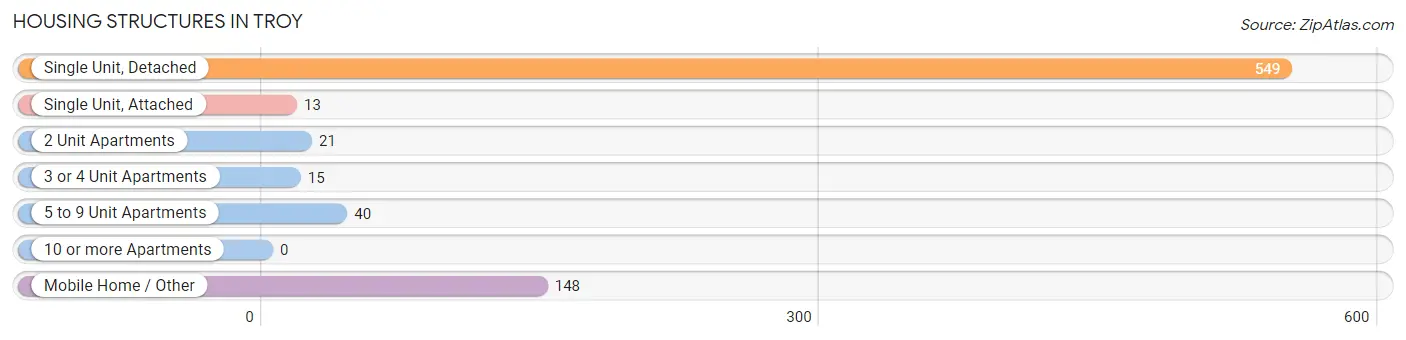
| Structure Type | # Housing Units | % Housing Units |
| Single Unit, Detached | 549 | 69.9% |
| Single Unit, Attached | 13 | 1.7% |
| 2 Unit Apartments | 21 | 2.7% |
| 3 or 4 Unit Apartments | 15 | 1.9% |
| 5 to 9 Unit Apartments | 40 | 5.1% |
| 10 or more Apartments | 0 | 0.0% |
| Mobile Home / Other | 148 | 18.8% |
| Total | 786 | 100.0% |
Housing Structures by Occupancy in Troy
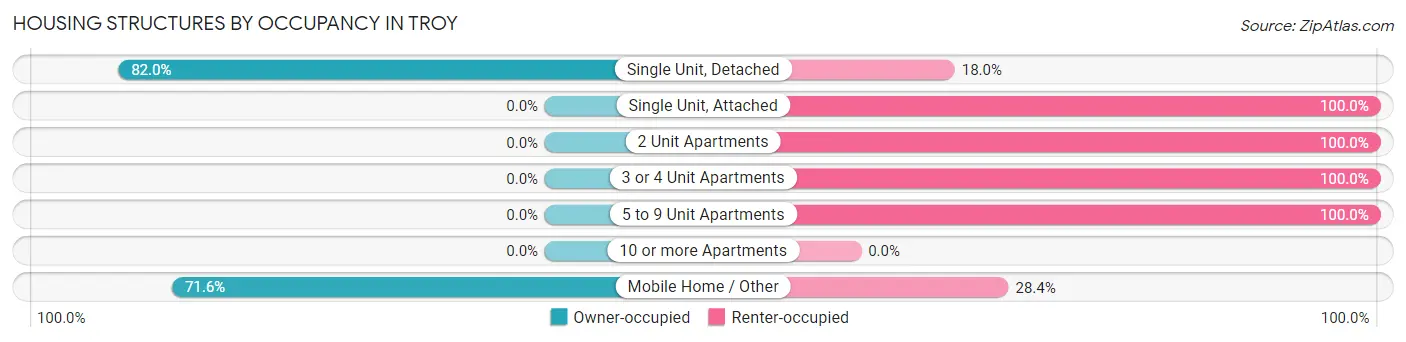
| Structure Type | Owner-occupied | Renter-occupied |
| Single Unit, Detached | 450 (82.0%) | 99 (18.0%) |
| Single Unit, Attached | 0 (0.0%) | 13 (100.0%) |
| 2 Unit Apartments | 0 (0.0%) | 21 (100.0%) |
| 3 or 4 Unit Apartments | 0 (0.0%) | 15 (100.0%) |
| 5 to 9 Unit Apartments | 0 (0.0%) | 40 (100.0%) |
| 10 or more Apartments | 0 (0.0%) | 0 (0.0%) |
| Mobile Home / Other | 106 (71.6%) | 42 (28.4%) |
| Total | 556 (70.7%) | 230 (29.3%) |
Housing Structures by Number of Rooms in Troy
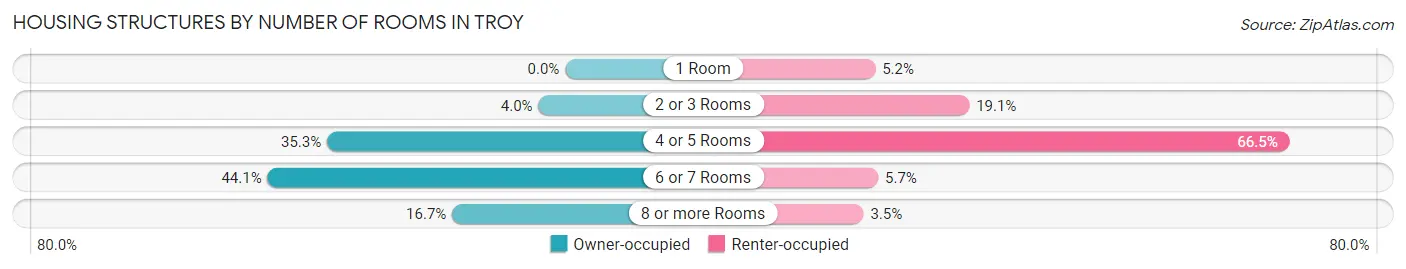
| Number of Rooms | Owner-occupied | Renter-occupied |
| 1 Room | 0 (0.0%) | 12 (5.2%) |
| 2 or 3 Rooms | 22 (4.0%) | 44 (19.1%) |
| 4 or 5 Rooms | 196 (35.2%) | 153 (66.5%) |
| 6 or 7 Rooms | 245 (44.1%) | 13 (5.7%) |
| 8 or more Rooms | 93 (16.7%) | 8 (3.5%) |
| Total | 556 (100.0%) | 230 (100.0%) |
Housing Structure by Heating Type in Troy
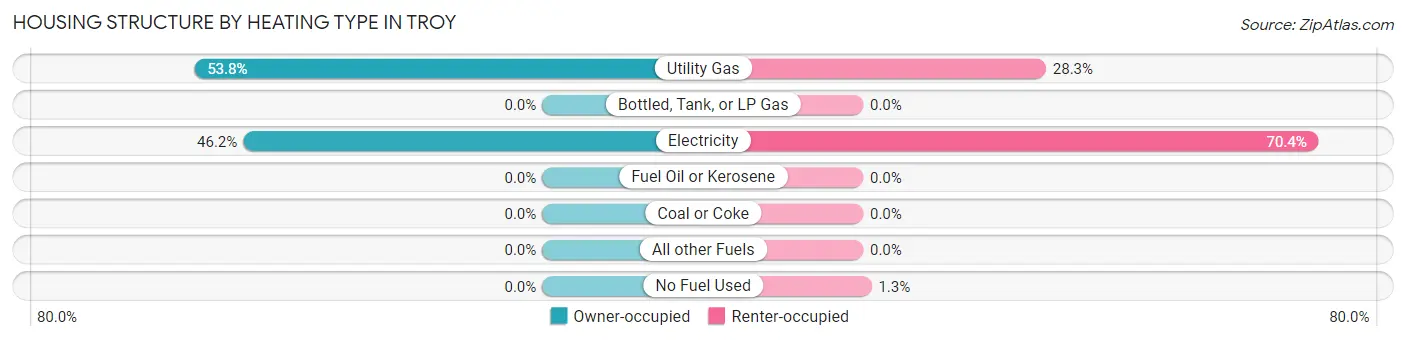
| Heating Type | Owner-occupied | Renter-occupied |
| Utility Gas | 299 (53.8%) | 65 (28.3%) |
| Bottled, Tank, or LP Gas | 0 (0.0%) | 0 (0.0%) |
| Electricity | 257 (46.2%) | 162 (70.4%) |
| Fuel Oil or Kerosene | 0 (0.0%) | 0 (0.0%) |
| Coal or Coke | 0 (0.0%) | 0 (0.0%) |
| All other Fuels | 0 (0.0%) | 0 (0.0%) |
| No Fuel Used | 0 (0.0%) | 3 (1.3%) |
| Total | 556 (100.0%) | 230 (100.0%) |
Household Vehicle Usage in Troy
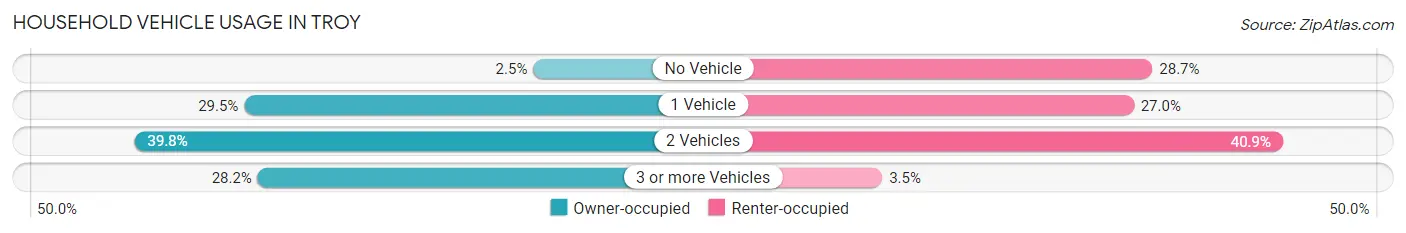
| Vehicles per Household | Owner-occupied | Renter-occupied |
| No Vehicle | 14 (2.5%) | 66 (28.7%) |
| 1 Vehicle | 164 (29.5%) | 62 (27.0%) |
| 2 Vehicles | 221 (39.8%) | 94 (40.9%) |
| 3 or more Vehicles | 157 (28.2%) | 8 (3.5%) |
| Total | 556 (100.0%) | 230 (100.0%) |
Real Estate & Mortgages in Troy
Real Estate and Mortgage Overview in Troy
| Characteristic | Without Mortgage | With Mortgage |
| Housing Units | 217 | 339 |
| Median Property Value | $83,000 | $105,800 |
| Median Household Income | $40,750 | $7 |
| Monthly Housing Costs | $358 | $0 |
| Real Estate Taxes | $671 | $4 |
Property Value by Mortgage Status in Troy
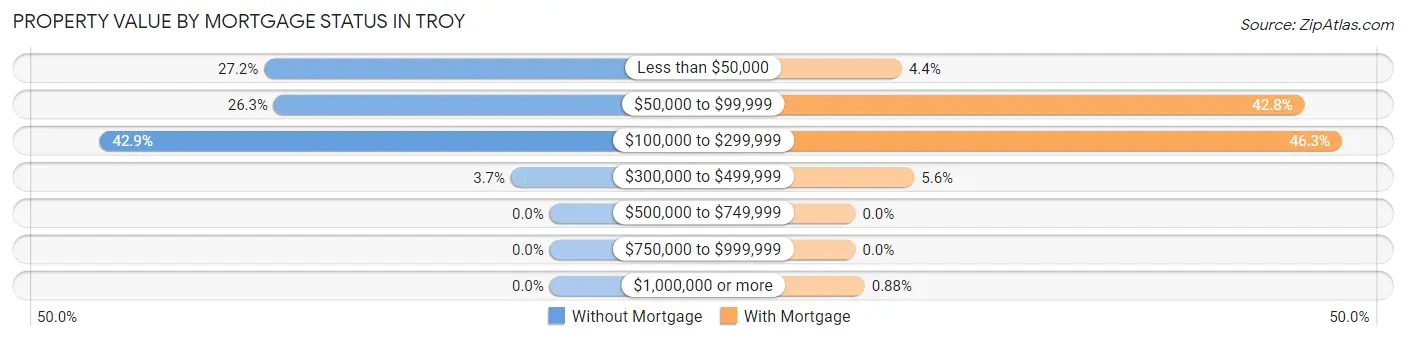
| Property Value | Without Mortgage | With Mortgage |
| Less than $50,000 | 59 (27.2%) | 15 (4.4%) |
| $50,000 to $99,999 | 57 (26.3%) | 145 (42.8%) |
| $100,000 to $299,999 | 93 (42.9%) | 157 (46.3%) |
| $300,000 to $499,999 | 8 (3.7%) | 19 (5.6%) |
| $500,000 to $749,999 | 0 (0.0%) | 0 (0.0%) |
| $750,000 to $999,999 | 0 (0.0%) | 0 (0.0%) |
| $1,000,000 or more | 0 (0.0%) | 3 (0.9%) |
| Total | 217 (100.0%) | 339 (100.0%) |
Household Income by Mortgage Status in Troy
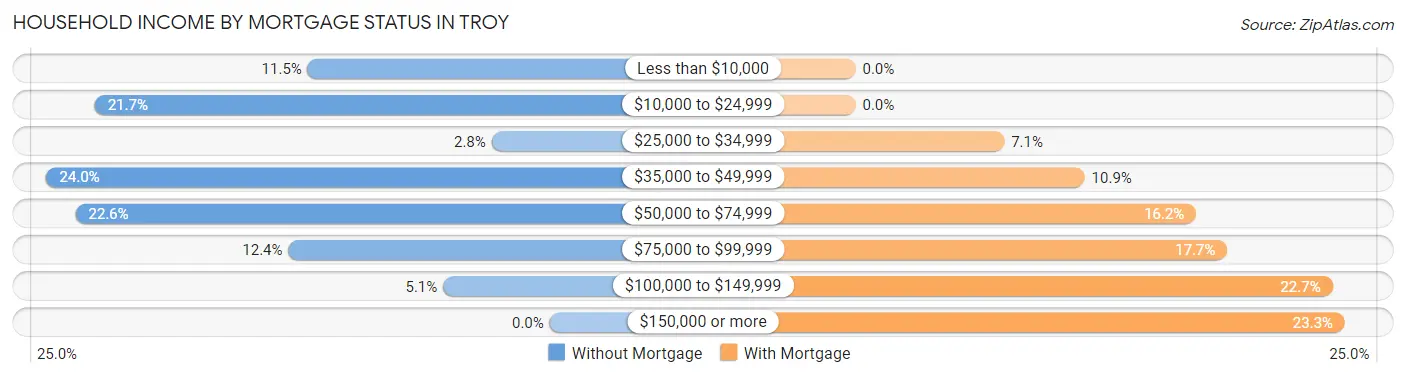
| Household Income | Without Mortgage | With Mortgage |
| Less than $10,000 | 25 (11.5%) | 0 (0.0%) |
| $10,000 to $24,999 | 47 (21.7%) | 0 (0.0%) |
| $25,000 to $34,999 | 6 (2.8%) | 24 (7.1%) |
| $35,000 to $49,999 | 52 (24.0%) | 37 (10.9%) |
| $50,000 to $74,999 | 49 (22.6%) | 55 (16.2%) |
| $75,000 to $99,999 | 27 (12.4%) | 60 (17.7%) |
| $100,000 to $149,999 | 11 (5.1%) | 77 (22.7%) |
| $150,000 or more | 0 (0.0%) | 79 (23.3%) |
| Total | 217 (100.0%) | 339 (100.0%) |
Property Value to Household Income Ratio in Troy
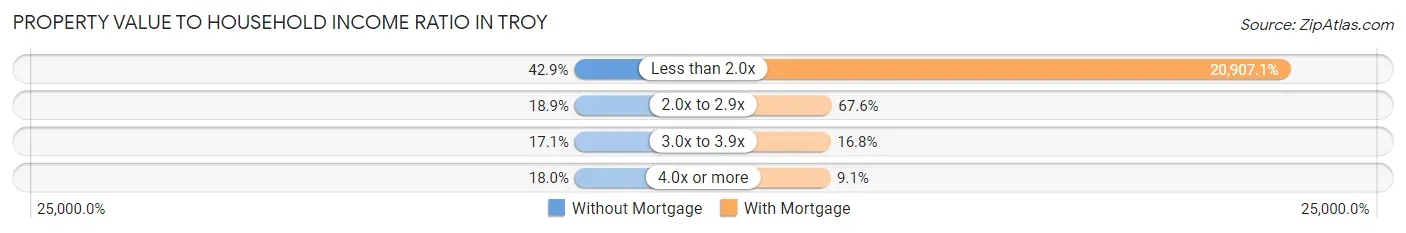
| Value-to-Income Ratio | Without Mortgage | With Mortgage |
| Less than 2.0x | 93 (42.9%) | 70,875 (20,907.1%) |
| 2.0x to 2.9x | 41 (18.9%) | 229 (67.5%) |
| 3.0x to 3.9x | 37 (17.1%) | 57 (16.8%) |
| 4.0x or more | 39 (18.0%) | 31 (9.1%) |
| Total | 217 (100.0%) | 339 (100.0%) |
Real Estate Taxes by Mortgage Status in Troy
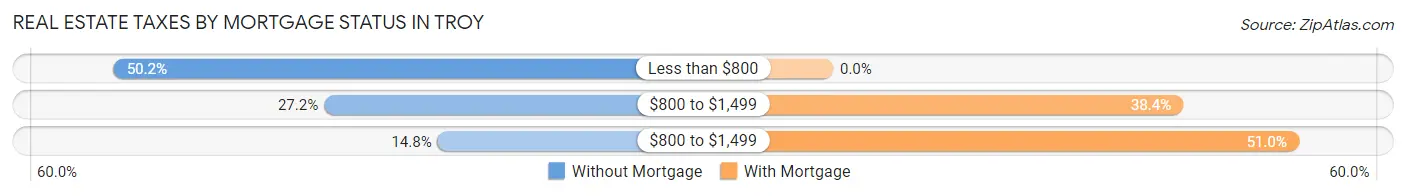
| Property Taxes | Without Mortgage | With Mortgage |
| Less than $800 | 109 (50.2%) | 0 (0.0%) |
| $800 to $1,499 | 59 (27.2%) | 130 (38.4%) |
| $800 to $1,499 | 32 (14.7%) | 173 (51.0%) |
| Total | 217 (100.0%) | 339 (100.0%) |
Health & Disability in Troy
Health Insurance Coverage by Age in Troy
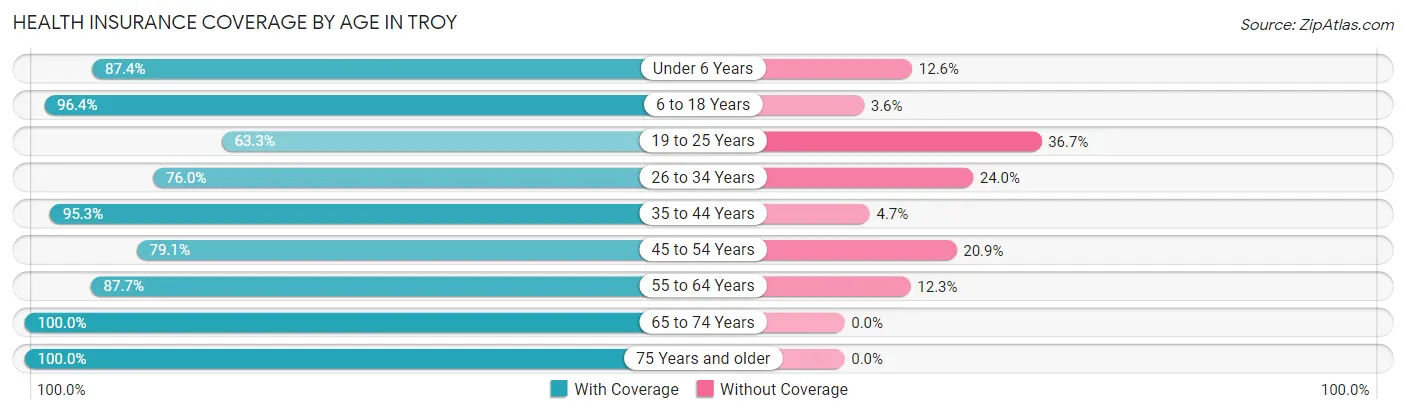
| Age Bracket | With Coverage | Without Coverage |
| Under 6 Years | 111 (87.4%) | 16 (12.6%) |
| 6 to 18 Years | 345 (96.4%) | 13 (3.6%) |
| 19 to 25 Years | 81 (63.3%) | 47 (36.7%) |
| 26 to 34 Years | 165 (76.0%) | 52 (24.0%) |
| 35 to 44 Years | 405 (95.3%) | 20 (4.7%) |
| 45 to 54 Years | 144 (79.1%) | 38 (20.9%) |
| 55 to 64 Years | 121 (87.7%) | 17 (12.3%) |
| 65 to 74 Years | 231 (100.0%) | 0 (0.0%) |
| 75 Years and older | 135 (100.0%) | 0 (0.0%) |
| Total | 1,738 (89.5%) | 203 (10.5%) |
Health Insurance Coverage by Citizenship Status in Troy
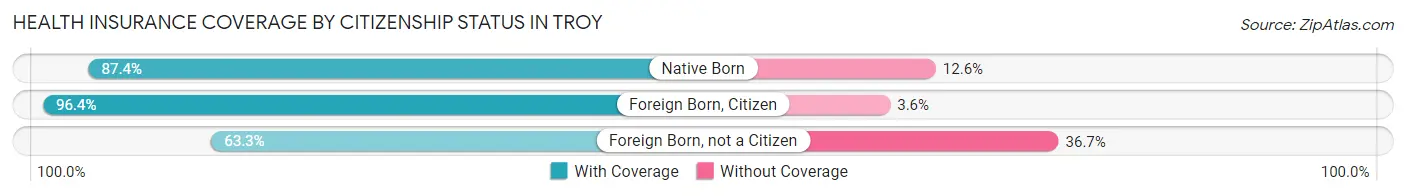
| Citizenship Status | With Coverage | Without Coverage |
| Native Born | 111 (87.4%) | 16 (12.6%) |
| Foreign Born, Citizen | 345 (96.4%) | 13 (3.6%) |
| Foreign Born, not a Citizen | 81 (63.3%) | 47 (36.7%) |
Health Insurance Coverage by Household Income in Troy
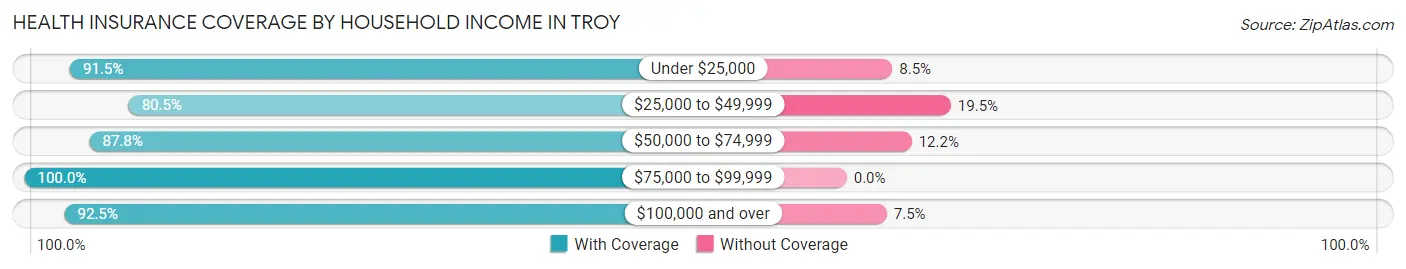
| Household Income | With Coverage | Without Coverage |
| Under $25,000 | 193 (91.5%) | 18 (8.5%) |
| $25,000 to $49,999 | 458 (80.5%) | 111 (19.5%) |
| $50,000 to $74,999 | 361 (87.8%) | 50 (12.2%) |
| $75,000 to $99,999 | 430 (100.0%) | 0 (0.0%) |
| $100,000 and over | 296 (92.5%) | 24 (7.5%) |
Public vs Private Health Insurance Coverage by Age in Troy
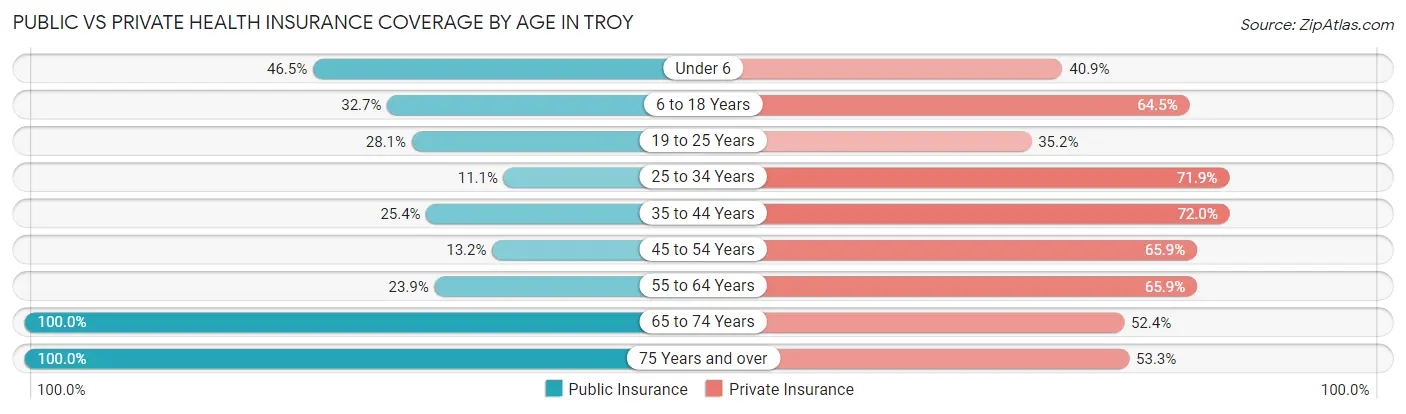
| Age Bracket | Public Insurance | Private Insurance |
| Under 6 | 59 (46.5%) | 52 (40.9%) |
| 6 to 18 Years | 117 (32.7%) | 231 (64.5%) |
| 19 to 25 Years | 36 (28.1%) | 45 (35.2%) |
| 25 to 34 Years | 24 (11.1%) | 156 (71.9%) |
| 35 to 44 Years | 108 (25.4%) | 306 (72.0%) |
| 45 to 54 Years | 24 (13.2%) | 120 (65.9%) |
| 55 to 64 Years | 33 (23.9%) | 91 (65.9%) |
| 65 to 74 Years | 231 (100.0%) | 121 (52.4%) |
| 75 Years and over | 135 (100.0%) | 72 (53.3%) |
| Total | 767 (39.5%) | 1,194 (61.5%) |
Disability Status by Sex by Age in Troy
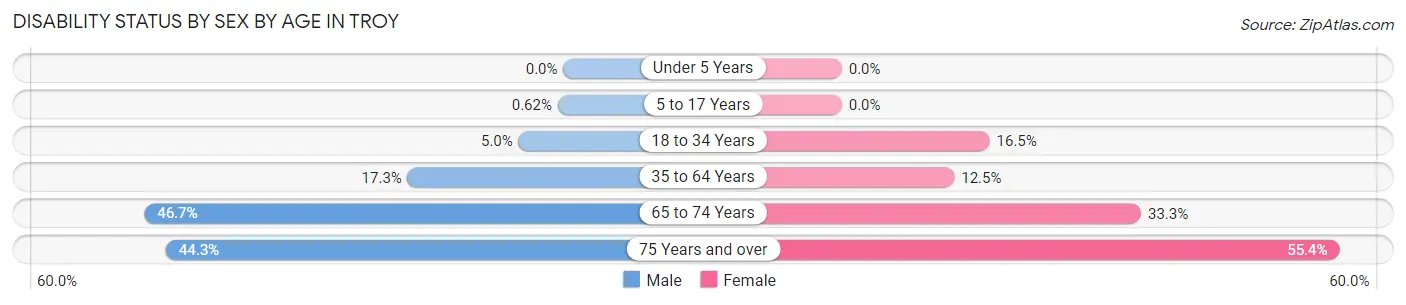
| Age Bracket | Male | Female |
| Under 5 Years | 0 (0.0%) | 0 (0.0%) |
| 5 to 17 Years | 1 (0.6%) | 0 (0.0%) |
| 18 to 34 Years | 10 (5.0%) | 26 (16.5%) |
| 35 to 64 Years | 60 (17.3%) | 50 (12.5%) |
| 65 to 74 Years | 42 (46.7%) | 47 (33.3%) |
| 75 Years and over | 27 (44.3%) | 41 (55.4%) |
Disability Class by Sex by Age in Troy
Disability Class: Hearing Difficulty
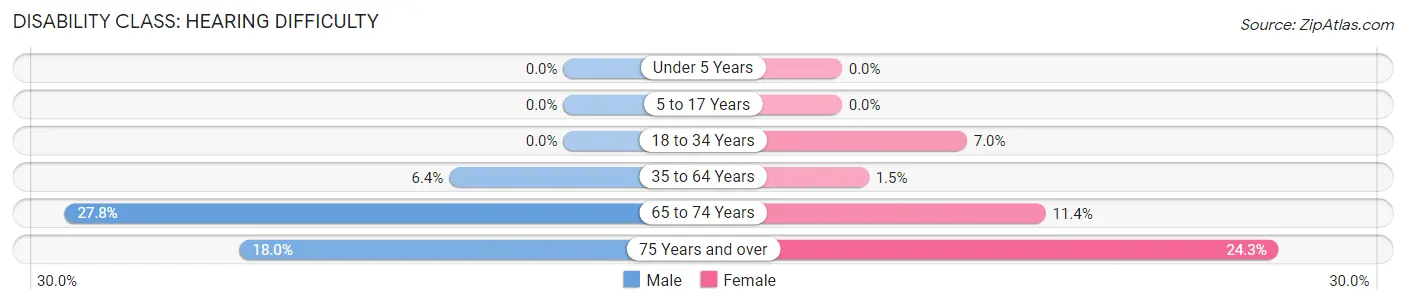
| Age Bracket | Male | Female |
| Under 5 Years | 0 (0.0%) | 0 (0.0%) |
| 5 to 17 Years | 0 (0.0%) | 0 (0.0%) |
| 18 to 34 Years | 0 (0.0%) | 11 (7.0%) |
| 35 to 64 Years | 22 (6.4%) | 6 (1.5%) |
| 65 to 74 Years | 25 (27.8%) | 16 (11.4%) |
| 75 Years and over | 11 (18.0%) | 18 (24.3%) |
Disability Class: Vision Difficulty
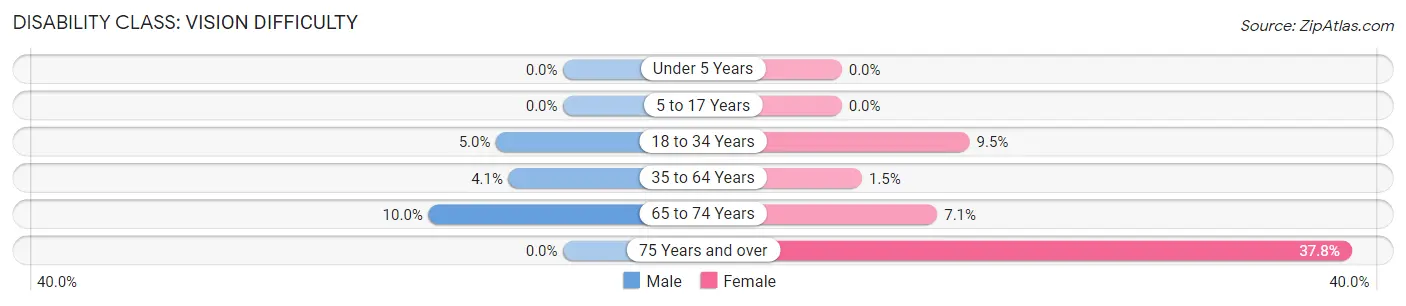
| Age Bracket | Male | Female |
| Under 5 Years | 0 (0.0%) | 0 (0.0%) |
| 5 to 17 Years | 0 (0.0%) | 0 (0.0%) |
| 18 to 34 Years | 10 (5.0%) | 15 (9.5%) |
| 35 to 64 Years | 14 (4.1%) | 6 (1.5%) |
| 65 to 74 Years | 9 (10.0%) | 10 (7.1%) |
| 75 Years and over | 0 (0.0%) | 28 (37.8%) |
Disability Class: Cognitive Difficulty
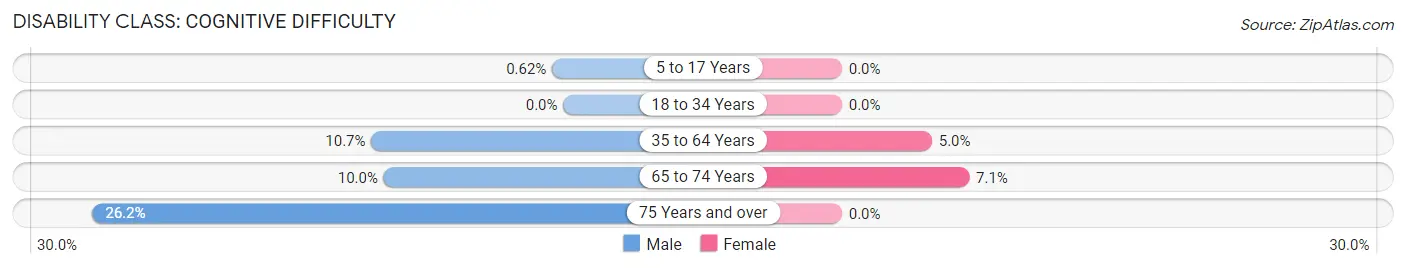
| Age Bracket | Male | Female |
| 5 to 17 Years | 1 (0.6%) | 0 (0.0%) |
| 18 to 34 Years | 0 (0.0%) | 0 (0.0%) |
| 35 to 64 Years | 37 (10.7%) | 20 (5.0%) |
| 65 to 74 Years | 9 (10.0%) | 10 (7.1%) |
| 75 Years and over | 16 (26.2%) | 0 (0.0%) |
Disability Class: Ambulatory Difficulty
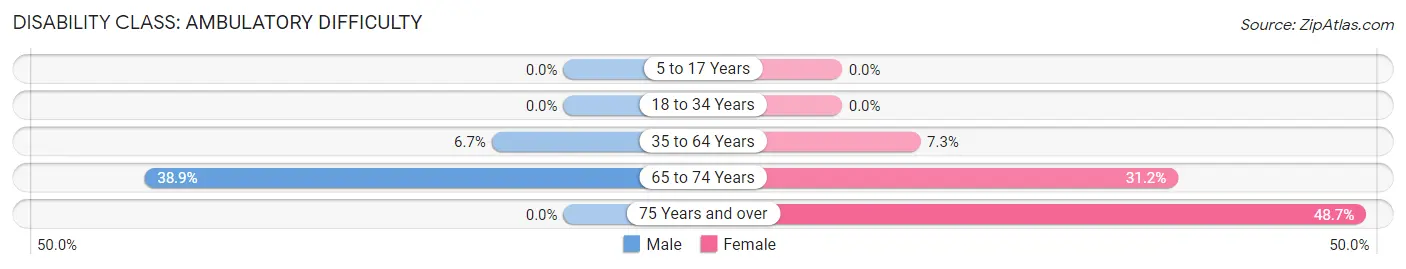
| Age Bracket | Male | Female |
| 5 to 17 Years | 0 (0.0%) | 0 (0.0%) |
| 18 to 34 Years | 0 (0.0%) | 0 (0.0%) |
| 35 to 64 Years | 23 (6.7%) | 29 (7.3%) |
| 65 to 74 Years | 35 (38.9%) | 44 (31.2%) |
| 75 Years and over | 0 (0.0%) | 36 (48.6%) |
Disability Class: Self-Care Difficulty
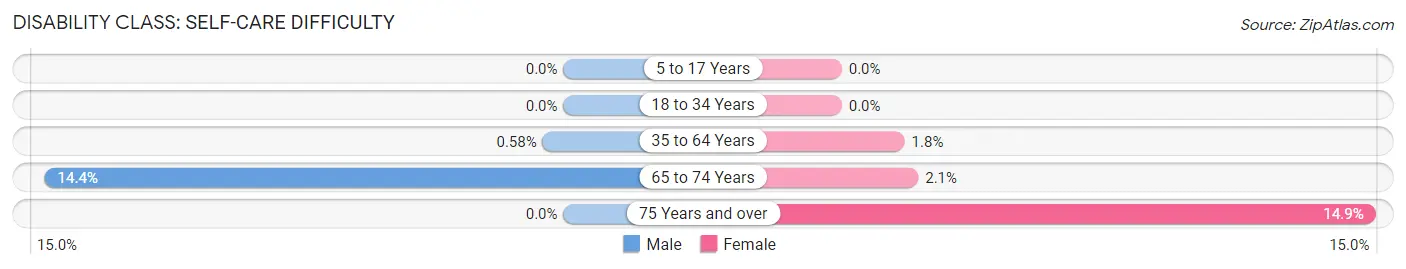
| Age Bracket | Male | Female |
| 5 to 17 Years | 0 (0.0%) | 0 (0.0%) |
| 18 to 34 Years | 0 (0.0%) | 0 (0.0%) |
| 35 to 64 Years | 2 (0.6%) | 7 (1.8%) |
| 65 to 74 Years | 13 (14.4%) | 3 (2.1%) |
| 75 Years and over | 0 (0.0%) | 11 (14.9%) |
Technology Access in Troy
Computing Device Access in Troy
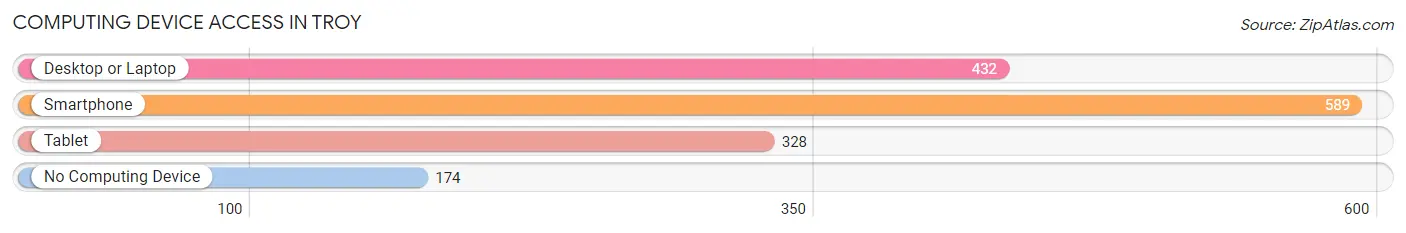
| Device Type | # Households | % Households |
| Desktop or Laptop | 432 | 55.0% |
| Smartphone | 589 | 74.9% |
| Tablet | 328 | 41.7% |
| No Computing Device | 174 | 22.1% |
| Total | 786 | 100.0% |
Internet Access in Troy
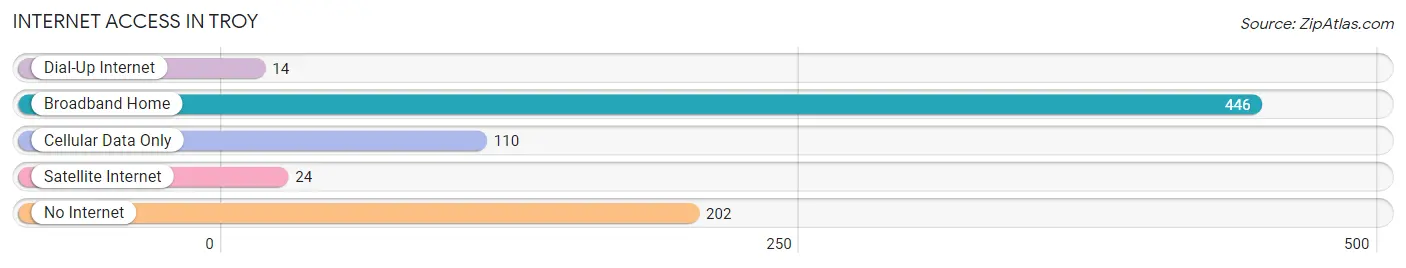
| Internet Type | # Households | % Households |
| Dial-Up Internet | 14 | 1.8% |
| Broadband Home | 446 | 56.7% |
| Cellular Data Only | 110 | 14.0% |
| Satellite Internet | 24 | 3.0% |
| No Internet | 202 | 25.7% |
| Total | 786 | 100.0% |
Troy Summary
Troy is a small town located in Obion County, Tennessee. It is situated on the banks of the Obion River, about halfway between the cities of Union City and Martin. The population of Troy was 1,845 in the 2010 census, making it the second-largest town in Obion County.
History
Troy was founded in 1836 by a group of settlers from North Carolina. The town was named after the ancient city of Troy in Asia Minor. The first post office was established in 1837, and the town was incorporated in 1838.
Troy was an important stop on the Memphis and Ohio Railroad, which ran through the town from 1858 to 1871. The railroad brought economic growth to the area, and Troy became a center of commerce and industry. The town was also home to several cotton gins and sawmills.
In the late 19th century, Troy was a popular destination for tourists, who came to enjoy the town’s natural beauty and the nearby Obion River. The town was also home to several resorts, including the Troy Hotel and the Troy Springs Hotel.
Geography
Troy is located in the western part of Obion County, about halfway between the cities of Union City and Martin. The town is situated on the banks of the Obion River, which flows through the town from north to south. The town is surrounded by rolling hills and farmland.
The climate in Troy is humid subtropical, with hot summers and mild winters. The average annual temperature is around 62°F (17°C). The average annual precipitation is around 45 inches (114 cm).
Economy
Troy’s economy is largely based on agriculture. The town is home to several farms, which produce a variety of crops, including corn, soybeans, and cotton. The town is also home to several manufacturing companies, which produce a variety of products, including furniture, clothing, and automotive parts.
Demographics
As of the 2010 census, the population of Troy was 1,845. The racial makeup of the town was 95.3% White, 2.2% African American, 0.3% Native American, 0.2% Asian, 0.1% Pacific Islander, 0.7% from other races, and 1.2% from two or more races. Hispanic or Latino of any race were 1.7% of the population.
The median household income in Troy was $31,250, and the median family income was $37,500. The per capita income was $17,845. About 17.2% of the population was below the poverty line.
Troy is served by the Obion County School System. The town is home to two elementary schools, one middle school, and one high school. The town is also home to the University of Tennessee at Martin, which is located about 10 miles (16 km) away.
Common Questions
What is Per Capita Income in Troy?
Per Capita income in Troy is $24,688.
What is the Median Family Income in Troy?
Median Family Income in Troy is $63,750.
What is the Median Household income in Troy?
Median Household Income in Troy is $49,839.
What is Income or Wage Gap in Troy?
Income or Wage Gap in Troy is 11.7%.
Women in Troy earn 88.3 cents for every dollar earned by a man.
What is Inequality or Gini Index in Troy?
Inequality or Gini Index in Troy is 0.36.
What is the Total Population of Troy?
Total Population of Troy is 1,941.
What is the Total Male Population of Troy?
Total Male Population of Troy is 897.
What is the Total Female Population of Troy?
Total Female Population of Troy is 1,044.
What is the Ratio of Males per 100 Females in Troy?
There are 85.92 Males per 100 Females in Troy.
What is the Ratio of Females per 100 Males in Troy?
There are 116.39 Females per 100 Males in Troy.
What is the Median Population Age in Troy?
Median Population Age in Troy is 37.1 Years.
What is the Average Family Size in Troy
Average Family Size in Troy is 3.1 People.
What is the Average Household Size in Troy
Average Household Size in Troy is 2.5 People.
How Large is the Labor Force in Troy?
There are 921 People in the Labor Forcein in Troy.
What is the Percentage of People in the Labor Force in Troy?
60.8% of People are in the Labor Force in Troy.
What is the Unemployment Rate in Troy?
Unemployment Rate in Troy is 3.7%.