Trimble, TN Map & Demographics
Trimble Map
Trimble Overview
$20,516
PER CAPITA INCOME
$56,458
AVG FAMILY INCOME
$50,625
AVG HOUSEHOLD INCOME
46.3%
WAGE / INCOME GAP [ % ]
53.7¢/ $1
WAGE / INCOME GAP [ $ ]
$8,823
FAMILY INCOME DEFICIT
0.33
INEQUALITY / GINI INDEX
610
TOTAL POPULATION
227
MALE POPULATION
383
FEMALE POPULATION
59.27
MALES / 100 FEMALES
168.72
FEMALES / 100 MALES
39.2
MEDIAN AGE
3.5
AVG FAMILY SIZE
2.9
AVG HOUSEHOLD SIZE
292
LABOR FORCE [ PEOPLE ]
61.7%
PERCENT IN LABOR FORCE
1.4%
UNEMPLOYMENT RATE
Trimble Zip Codes
Trimble Area Codes
Income in Trimble
Income Overview in Trimble
Per Capita Income in Trimble is $20,516, while median incomes of families and households are $56,458 and $50,625 respectively.
| Characteristic | Number | Measure |
| Per Capita Income | 610 | $20,516 |
| Median Family Income | 143 | $56,458 |
| Mean Family Income | 143 | $59,546 |
| Median Household Income | 208 | $50,625 |
| Mean Household Income | 208 | $52,196 |
| Income Deficit | 143 | $8,823 |
| Wage / Income Gap (%) | 610 | 46.28% |
| Wage / Income Gap ($) | 610 | 53.72¢ per $1 |
| Gini / Inequality Index | 610 | 0.33 |
Earnings by Sex in Trimble
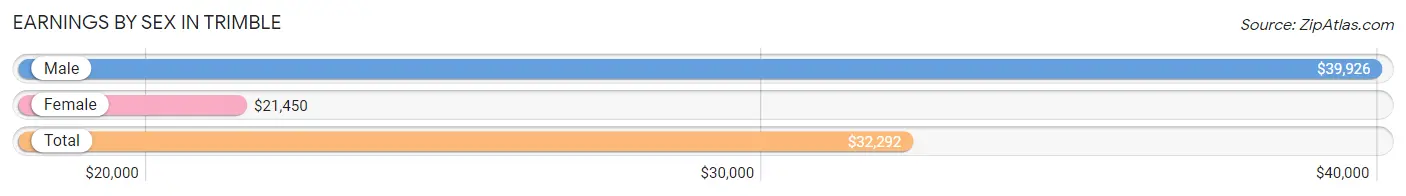
Average Earnings in Trimble are $32,292, $39,926 for men and $21,450 for women, a difference of 46.3%.
| Sex | Number | Average Earnings |
| Male | 139 (46.3%) | $39,926 |
| Female | 161 (53.7%) | $21,450 |
| Total | 300 (100.0%) | $32,292 |
Earnings by Sex by Income Bracket in Trimble
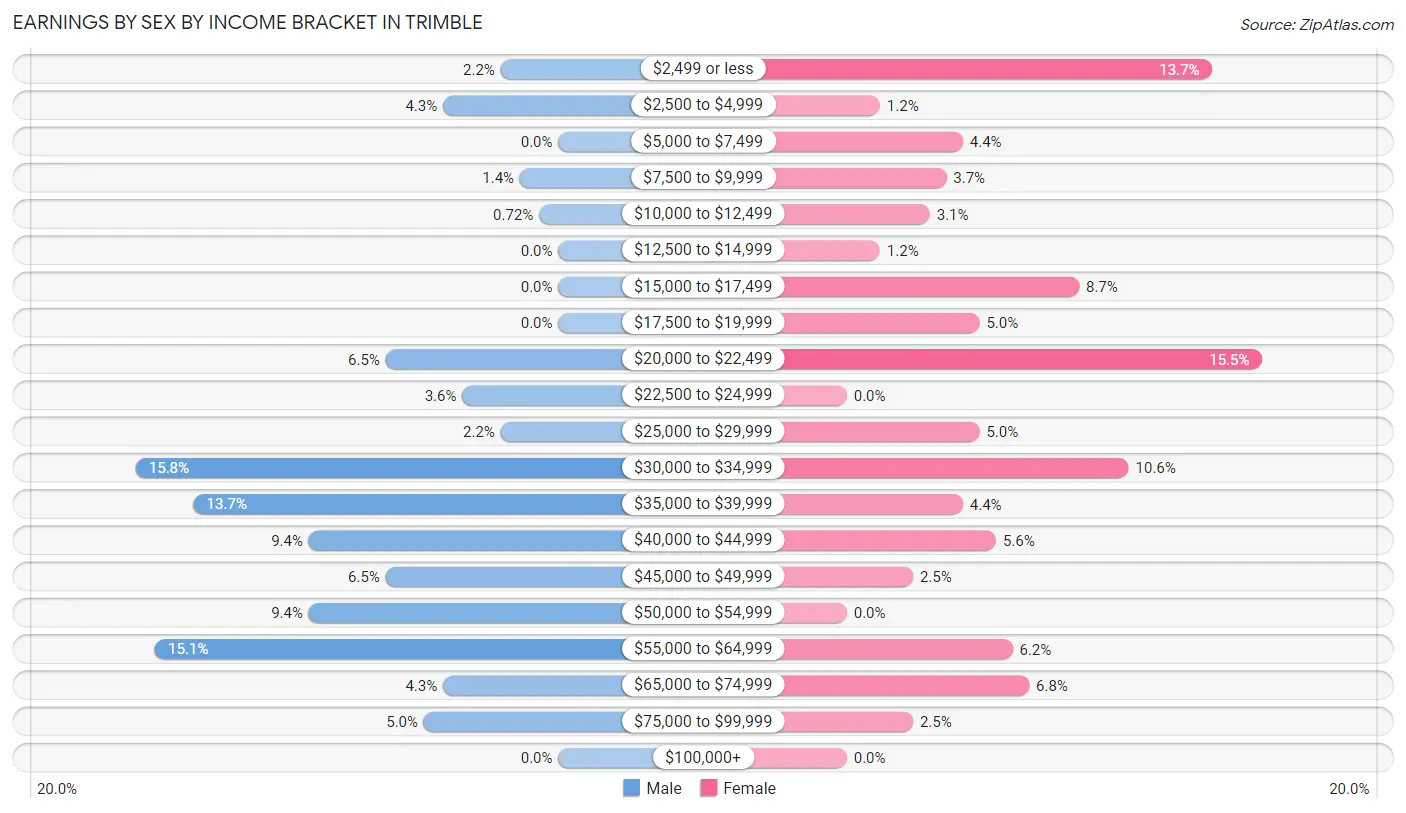
The most common earnings brackets in Trimble are $30,000 to $34,999 for men (22 | 15.8%) and $20,000 to $22,499 for women (25 | 15.5%).
| Income | Male | Female |
| $2,499 or less | 3 (2.2%) | 22 (13.7%) |
| $2,500 to $4,999 | 6 (4.3%) | 2 (1.2%) |
| $5,000 to $7,499 | 0 (0.0%) | 7 (4.3%) |
| $7,500 to $9,999 | 2 (1.4%) | 6 (3.7%) |
| $10,000 to $12,499 | 1 (0.7%) | 5 (3.1%) |
| $12,500 to $14,999 | 0 (0.0%) | 2 (1.2%) |
| $15,000 to $17,499 | 0 (0.0%) | 14 (8.7%) |
| $17,500 to $19,999 | 0 (0.0%) | 8 (5.0%) |
| $20,000 to $22,499 | 9 (6.5%) | 25 (15.5%) |
| $22,500 to $24,999 | 5 (3.6%) | 0 (0.0%) |
| $25,000 to $29,999 | 3 (2.2%) | 8 (5.0%) |
| $30,000 to $34,999 | 22 (15.8%) | 17 (10.6%) |
| $35,000 to $39,999 | 19 (13.7%) | 7 (4.3%) |
| $40,000 to $44,999 | 13 (9.3%) | 9 (5.6%) |
| $45,000 to $49,999 | 9 (6.5%) | 4 (2.5%) |
| $50,000 to $54,999 | 13 (9.3%) | 0 (0.0%) |
| $55,000 to $64,999 | 21 (15.1%) | 10 (6.2%) |
| $65,000 to $74,999 | 6 (4.3%) | 11 (6.8%) |
| $75,000 to $99,999 | 7 (5.0%) | 4 (2.5%) |
| $100,000+ | 0 (0.0%) | 0 (0.0%) |
| Total | 139 (100.0%) | 161 (100.0%) |
Earnings by Sex by Educational Attainment in Trimble
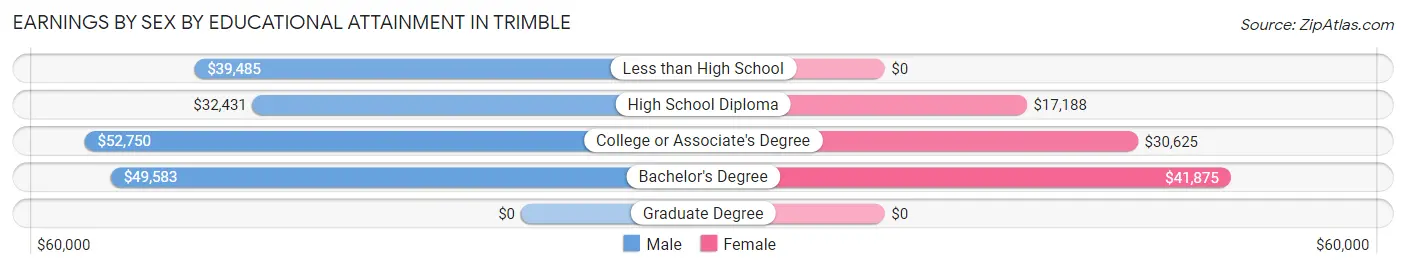
Average earnings in Trimble are $43,281 for men and $22,250 for women, a difference of 48.6%. Men with an educational attainment of college or associate's degree enjoy the highest average annual earnings of $52,750, while those with high school diploma education earn the least with $32,431. Women with an educational attainment of bachelor's degree earn the most with the average annual earnings of $41,875, while those with high school diploma education have the smallest earnings of $17,188.
| Educational Attainment | Male Income | Female Income |
| Less than High School | $39,485 | $0 |
| High School Diploma | $32,431 | $17,188 |
| College or Associate's Degree | $52,750 | $30,625 |
| Bachelor's Degree | $49,583 | $41,875 |
| Graduate Degree | - | - |
| Total | $43,281 | $22,250 |
Family Income in Trimble
Family Income Brackets in Trimble
According to the Trimble family income data, there are 49 families falling into the $50,000 to $74,999 income range, which is the most common income bracket and makes up 34.3% of all families.
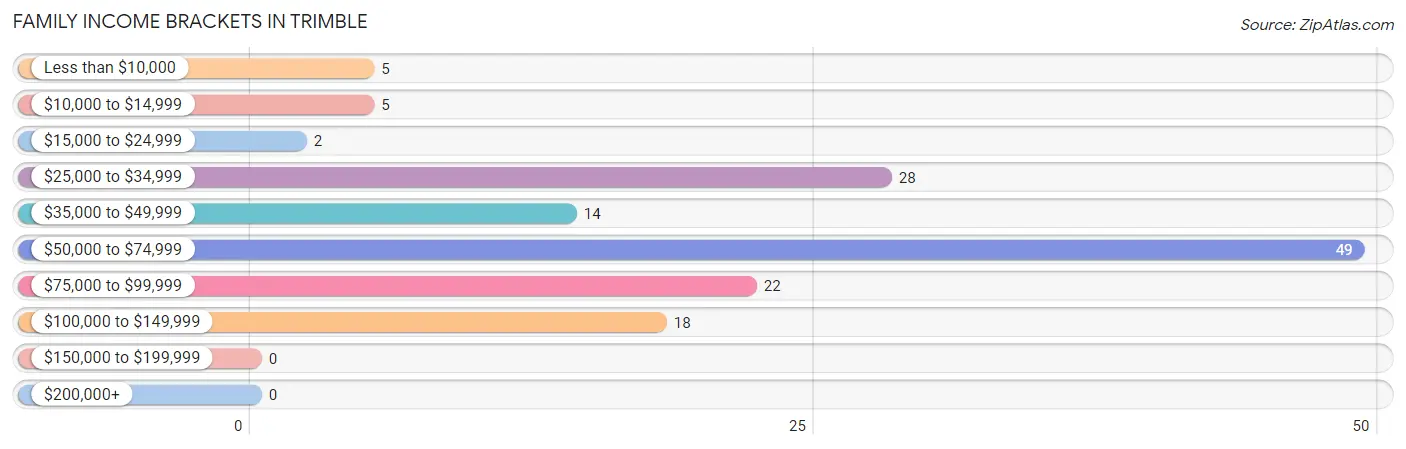
| Income Bracket | # Families | % Families |
| Less than $10,000 | 5 | 3.5% |
| $10,000 to $14,999 | 5 | 3.5% |
| $15,000 to $24,999 | 2 | 1.4% |
| $25,000 to $34,999 | 28 | 19.6% |
| $35,000 to $49,999 | 14 | 9.8% |
| $50,000 to $74,999 | 49 | 34.3% |
| $75,000 to $99,999 | 22 | 15.4% |
| $100,000 to $149,999 | 18 | 12.6% |
| $150,000 to $199,999 | 0 | 0.0% |
| $200,000+ | 0 | 0.0% |
Family Income by Famaliy Size in Trimble
2-person families (69 | 48.2%) account for the highest median family income in Trimble with $56,797 per family, while 2-person families (69 | 48.2%) have the highest median income of $28,398 per family member.
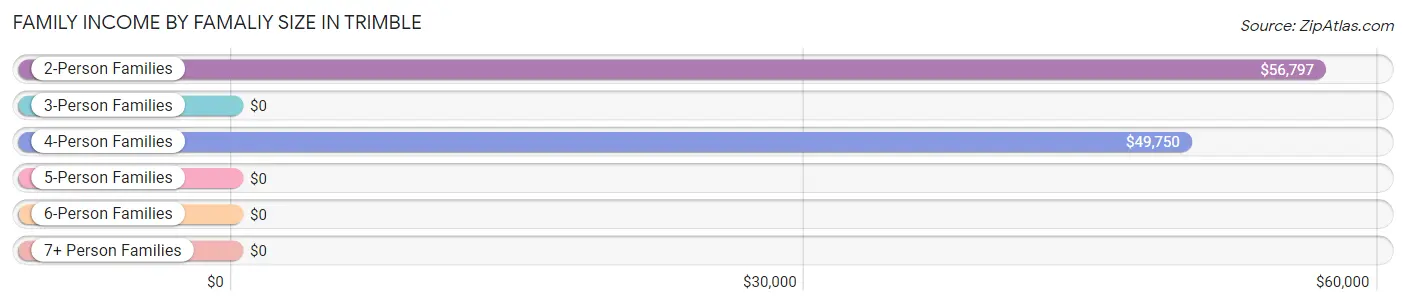
| Income Bracket | # Families | Median Income |
| 2-Person Families | 69 (48.2%) | $56,797 |
| 3-Person Families | 38 (26.6%) | $0 |
| 4-Person Families | 19 (13.3%) | $49,750 |
| 5-Person Families | 6 (4.2%) | $0 |
| 6-Person Families | 4 (2.8%) | $0 |
| 7+ Person Families | 7 (4.9%) | $0 |
| Total | 143 (100.0%) | $56,458 |
Family Income by Number of Earners in Trimble
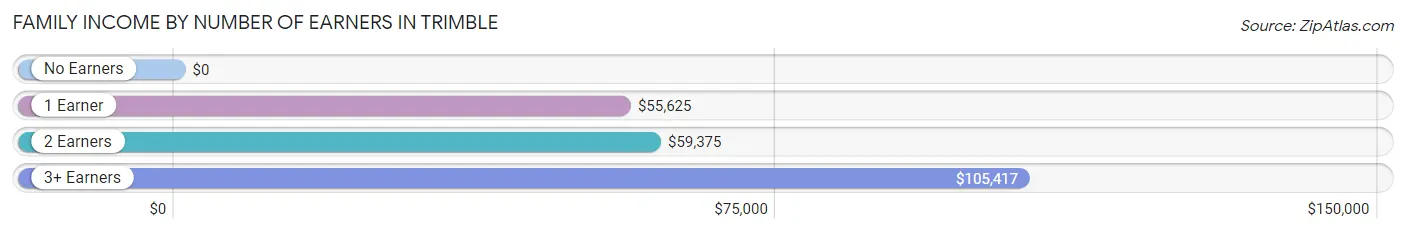
| Number of Earners | # Families | Median Income |
| No Earners | 17 (11.9%) | $0 |
| 1 Earner | 71 (49.6%) | $55,625 |
| 2 Earners | 38 (26.6%) | $59,375 |
| 3+ Earners | 17 (11.9%) | $105,417 |
| Total | 143 (100.0%) | $56,458 |
Household Income in Trimble
Household Income Brackets in Trimble
With 63 households falling in the category, the $50,000 to $74,999 income range is the most frequent in Trimble, accounting for 30.3% of all households.
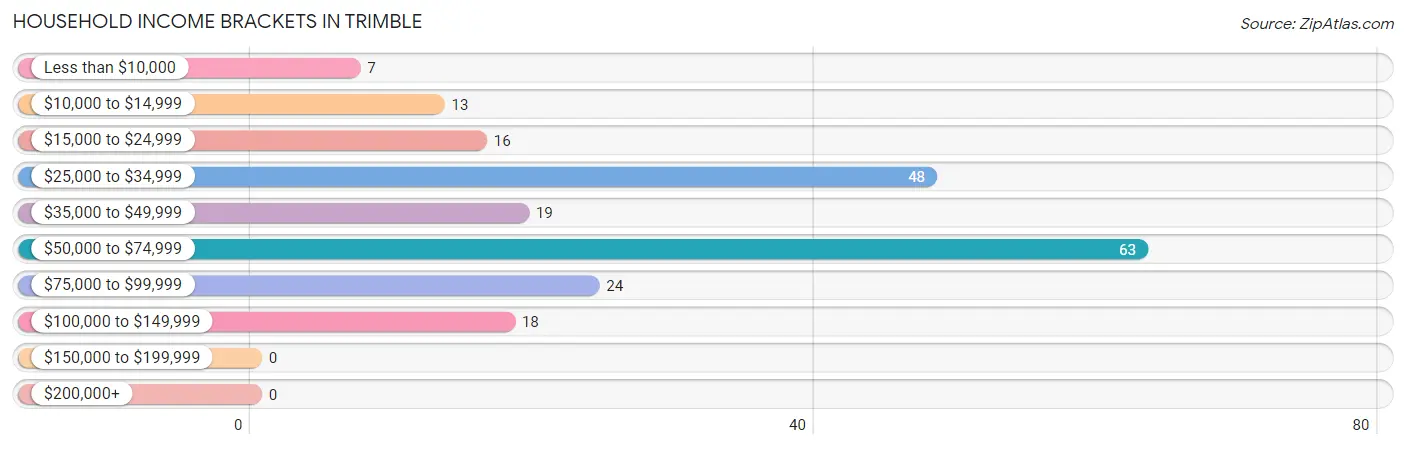
| Income Bracket | # Households | % Households |
| Less than $10,000 | 7 | 3.4% |
| $10,000 to $14,999 | 13 | 6.3% |
| $15,000 to $24,999 | 16 | 7.7% |
| $25,000 to $34,999 | 48 | 23.1% |
| $35,000 to $49,999 | 19 | 9.1% |
| $50,000 to $74,999 | 63 | 30.3% |
| $75,000 to $99,999 | 24 | 11.5% |
| $100,000 to $149,999 | 18 | 8.7% |
| $150,000 to $199,999 | 0 | 0.0% |
| $200,000+ | 0 | 0.0% |
Household Income by Householder Age in Trimble
The median household income in Trimble is $50,625, with the highest median household income of $70,398 found in the 25 to 44 years age bracket for the primary householder. A total of 81 households (38.9%) fall into this category. Meanwhile, the 15 to 24 years age bracket for the primary householder has the lowest median household income of $0, with 3 households (1.4%) in this group.
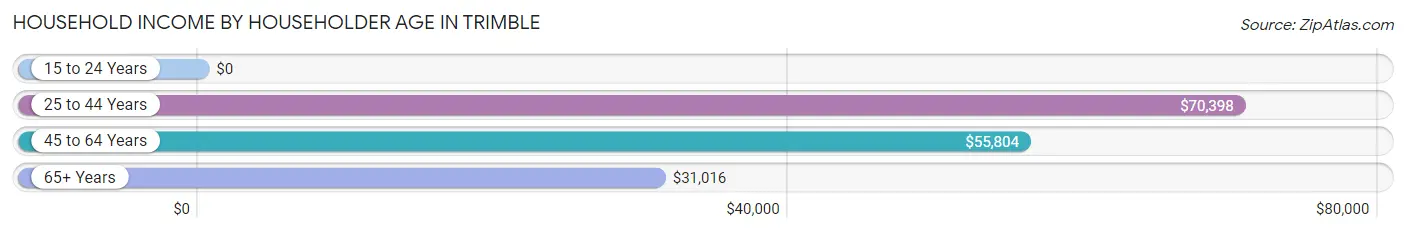
| Income Bracket | # Households | Median Income |
| 15 to 24 Years | 3 (1.4%) | $0 |
| 25 to 44 Years | 81 (38.9%) | $70,398 |
| 45 to 64 Years | 55 (26.4%) | $55,804 |
| 65+ Years | 69 (33.2%) | $31,016 |
| Total | 208 (100.0%) | $50,625 |
Poverty in Trimble
Income Below Poverty by Sex and Age in Trimble
With 10.1% poverty level for males and 13.7% for females among the residents of Trimble, 16 and 17 year old males and 55 to 64 year old females are the most vulnerable to poverty, with 6 males (46.2%) and 10 females (35.7%) in their respective age groups living below the poverty level.
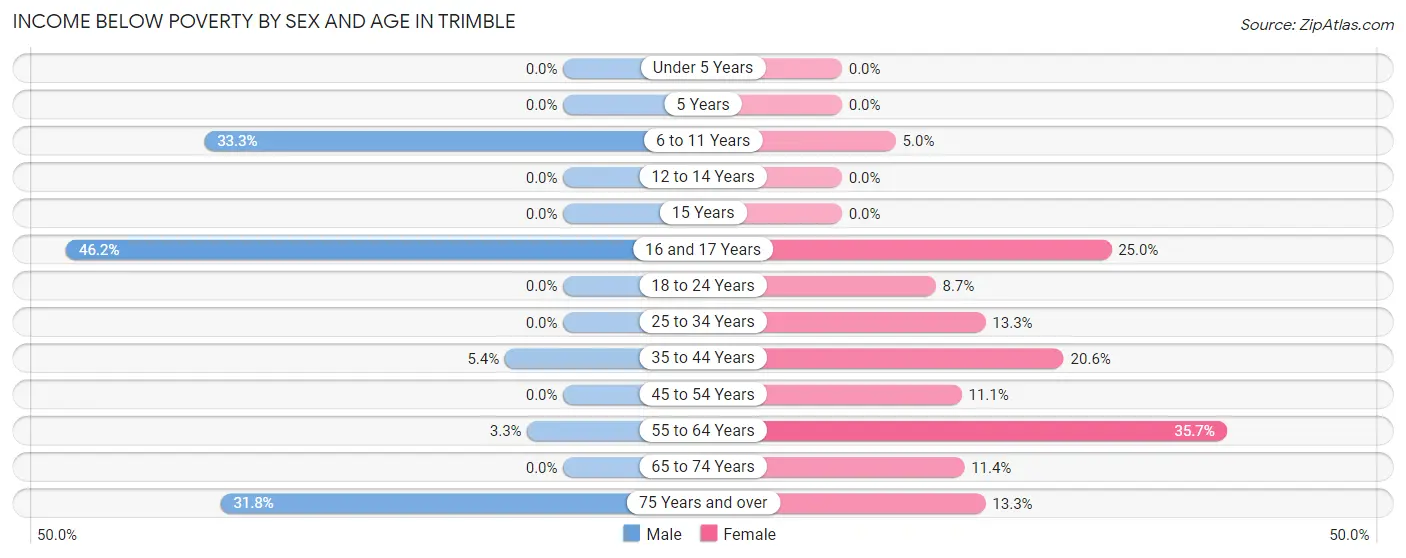
| Age Bracket | Male | Female |
| Under 5 Years | 0 (0.0%) | 0 (0.0%) |
| 5 Years | 0 (0.0%) | 0 (0.0%) |
| 6 to 11 Years | 6 (33.3%) | 3 (5.0%) |
| 12 to 14 Years | 0 (0.0%) | 0 (0.0%) |
| 15 Years | 0 (0.0%) | 0 (0.0%) |
| 16 and 17 Years | 6 (46.2%) | 3 (25.0%) |
| 18 to 24 Years | 0 (0.0%) | 4 (8.7%) |
| 25 to 34 Years | 0 (0.0%) | 2 (13.3%) |
| 35 to 44 Years | 2 (5.4%) | 21 (20.6%) |
| 45 to 54 Years | 0 (0.0%) | 2 (11.1%) |
| 55 to 64 Years | 2 (3.3%) | 10 (35.7%) |
| 65 to 74 Years | 0 (0.0%) | 5 (11.4%) |
| 75 Years and over | 7 (31.8%) | 2 (13.3%) |
| Total | 23 (10.1%) | 52 (13.7%) |
Income Above Poverty by Sex and Age in Trimble
According to the poverty statistics in Trimble, males aged under 5 years and females aged under 5 years are the age groups that are most secure financially, with 100.0% of males and 100.0% of females in these age groups living above the poverty line.
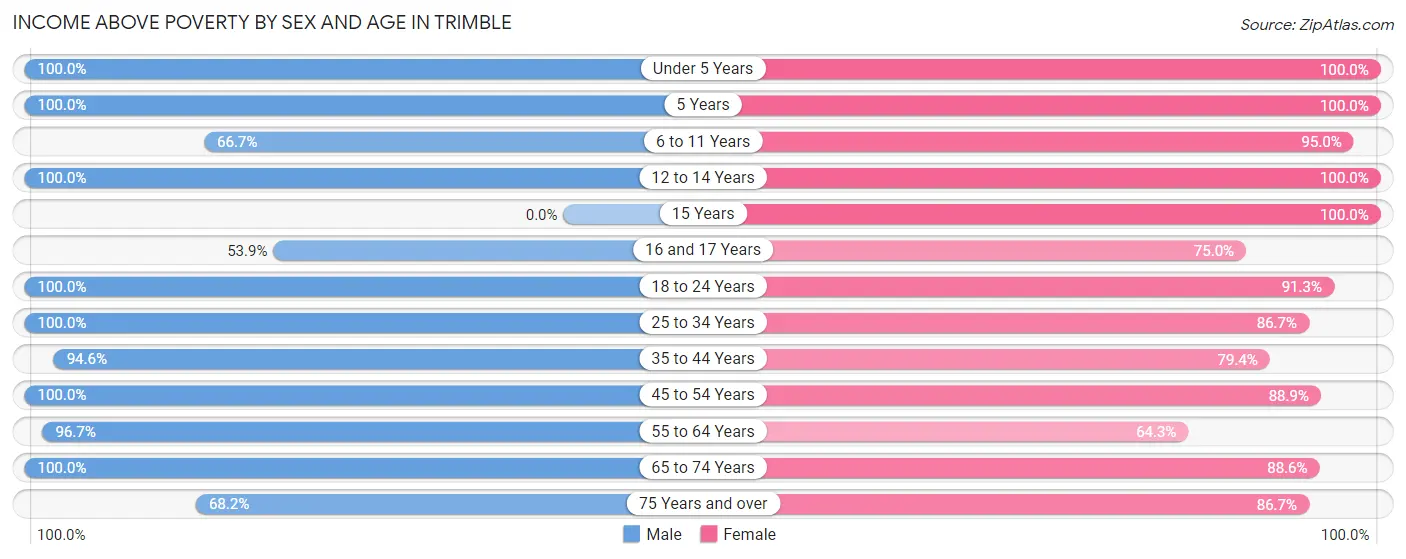
| Age Bracket | Male | Female |
| Under 5 Years | 7 (100.0%) | 17 (100.0%) |
| 5 Years | 6 (100.0%) | 6 (100.0%) |
| 6 to 11 Years | 12 (66.7%) | 57 (95.0%) |
| 12 to 14 Years | 3 (100.0%) | 15 (100.0%) |
| 15 Years | 0 (0.0%) | 3 (100.0%) |
| 16 and 17 Years | 7 (53.8%) | 9 (75.0%) |
| 18 to 24 Years | 9 (100.0%) | 42 (91.3%) |
| 25 to 34 Years | 21 (100.0%) | 13 (86.7%) |
| 35 to 44 Years | 35 (94.6%) | 81 (79.4%) |
| 45 to 54 Years | 18 (100.0%) | 16 (88.9%) |
| 55 to 64 Years | 58 (96.7%) | 18 (64.3%) |
| 65 to 74 Years | 13 (100.0%) | 39 (88.6%) |
| 75 Years and over | 15 (68.2%) | 13 (86.7%) |
| Total | 204 (89.9%) | 329 (86.4%) |
Income Below Poverty Among Married-Couple Families in Trimble
The poverty statistics for married-couple families in Trimble show that 7.8% or 6 of the total 77 families live below the poverty line. Families with no children have the highest poverty rate of 13.0%, comprising of 6 families. On the other hand, families with 1 or 2 children have the lowest poverty rate of 0.0%, which includes 0 families.
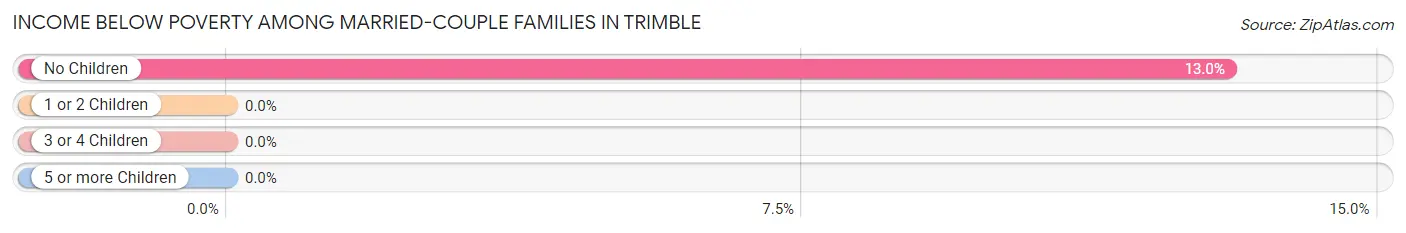
| Children | Above Poverty | Below Poverty |
| No Children | 40 (87.0%) | 6 (13.0%) |
| 1 or 2 Children | 28 (100.0%) | 0 (0.0%) |
| 3 or 4 Children | 3 (100.0%) | 0 (0.0%) |
| 5 or more Children | 0 (0.0%) | 0 (0.0%) |
| Total | 71 (92.2%) | 6 (7.8%) |
Income Below Poverty Among Single-Parent Households in Trimble
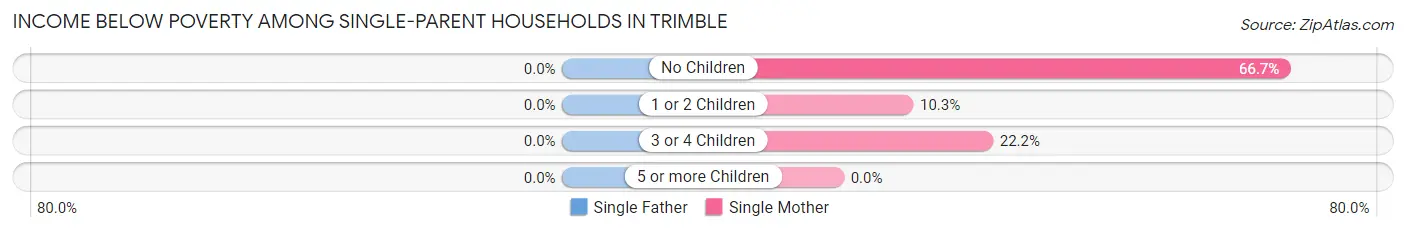
| Children | Single Father | Single Mother |
| No Children | 0 (0.0%) | 2 (66.7%) |
| 1 or 2 Children | 0 (0.0%) | 3 (10.3%) |
| 3 or 4 Children | 0 (0.0%) | 2 (22.2%) |
| 5 or more Children | 0 (0.0%) | 0 (0.0%) |
| Total | 0 (0.0%) | 7 (17.1%) |
Income Below Poverty Among Married-Couple vs Single-Parent Households in Trimble
The poverty data for Trimble shows that 6 of the married-couple family households (7.8%) and 7 of the single-parent households (10.6%) are living below the poverty level. Within the married-couple family households, those with no children have the highest poverty rate, with 6 households (13.0%) falling below the poverty line. Among the single-parent households, those with 3 or 4 children have the highest poverty rate, with 2 household (14.3%) living below poverty.
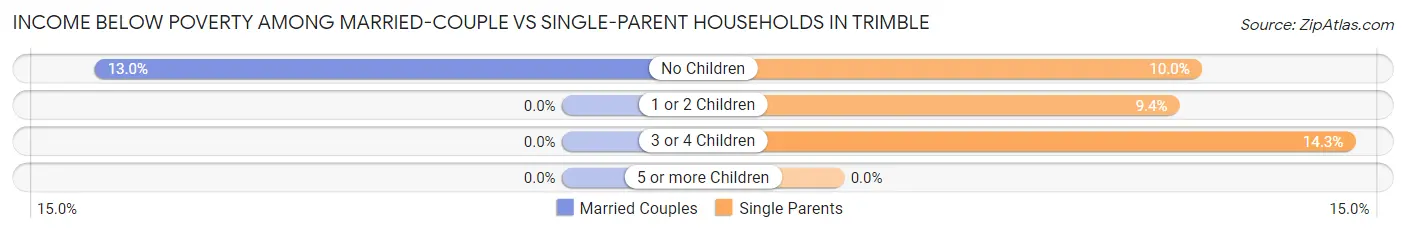
| Children | Married-Couple Families | Single-Parent Households |
| No Children | 6 (13.0%) | 2 (10.0%) |
| 1 or 2 Children | 0 (0.0%) | 3 (9.4%) |
| 3 or 4 Children | 0 (0.0%) | 2 (14.3%) |
| 5 or more Children | 0 (0.0%) | 0 (0.0%) |
| Total | 6 (7.8%) | 7 (10.6%) |
Race in Trimble
The most populous races in Trimble are White / Caucasian (539 | 88.4%), Two or more Races (49 | 8.0%), and Black / African American (15 | 2.5%).
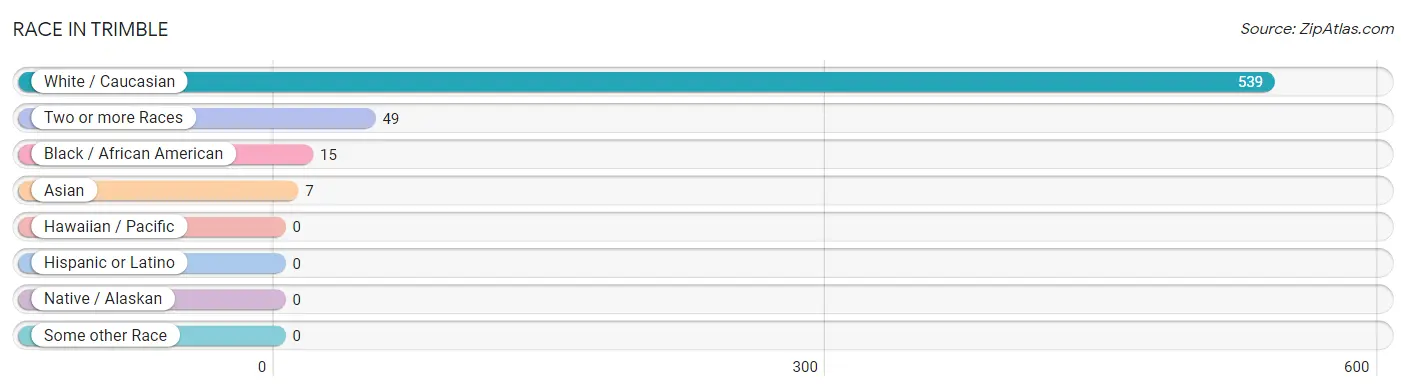
| Race | # Population | % Population |
| Asian | 7 | 1.1% |
| Black / African American | 15 | 2.5% |
| Hawaiian / Pacific | 0 | 0.0% |
| Hispanic or Latino | 0 | 0.0% |
| Native / Alaskan | 0 | 0.0% |
| White / Caucasian | 539 | 88.4% |
| Two or more Races | 49 | 8.0% |
| Some other Race | 0 | 0.0% |
| Total | 610 | 100.0% |
Ancestry in Trimble
The most populous ancestries reported in Trimble are American (69 | 11.3%), German (68 | 11.2%), Irish (54 | 8.8%), English (45 | 7.4%), and Scotch-Irish (32 | 5.2%), together accounting for 43.9% of all Trimble residents.
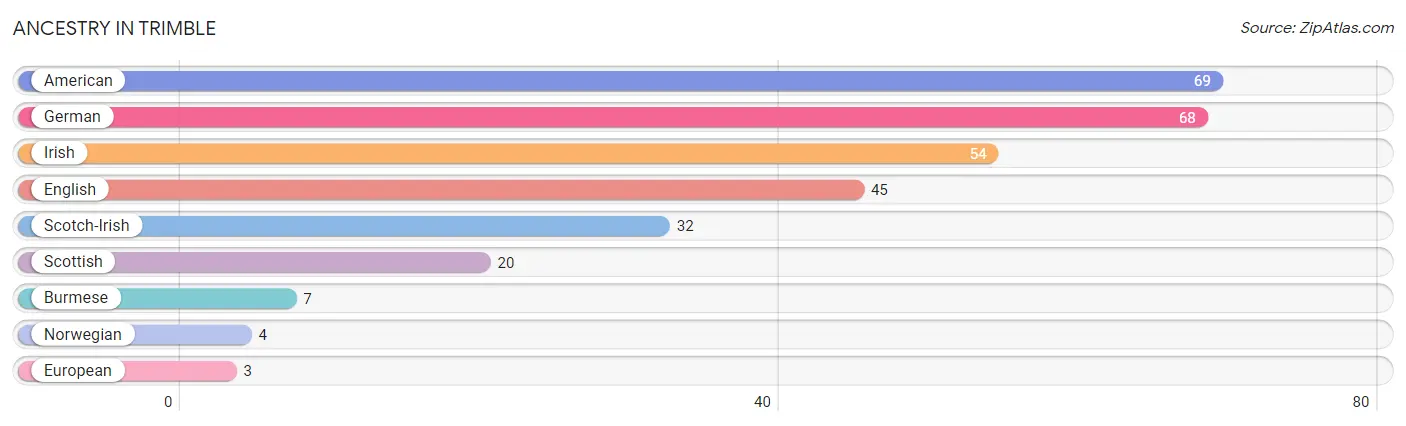
| Ancestry | # Population | % Population |
| American | 69 | 11.3% |
| Burmese | 7 | 1.1% |
| English | 45 | 7.4% |
| European | 3 | 0.5% |
| German | 68 | 11.2% |
| Irish | 54 | 8.8% |
| Norwegian | 4 | 0.7% |
| Scotch-Irish | 32 | 5.2% |
| Scottish | 20 | 3.3% | View All 9 Rows |
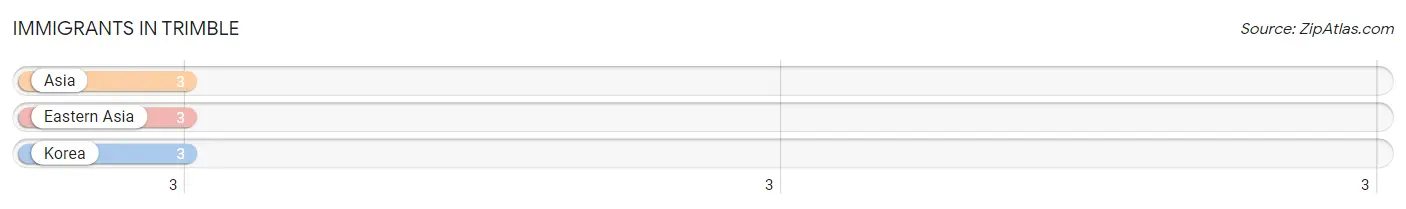
Immigrants in Trimble
The most numerous immigrant groups reported in Trimble came from Asia (3 | 0.5%), Eastern Asia (3 | 0.5%), and Korea (3 | 0.5%), together accounting for 1.5% of all Trimble residents.
| Immigration Origin | # Population | % Population |
| Asia | 3 | 0.5% |
| Eastern Asia | 3 | 0.5% |
| Korea | 3 | 0.5% | View All 3 Rows |
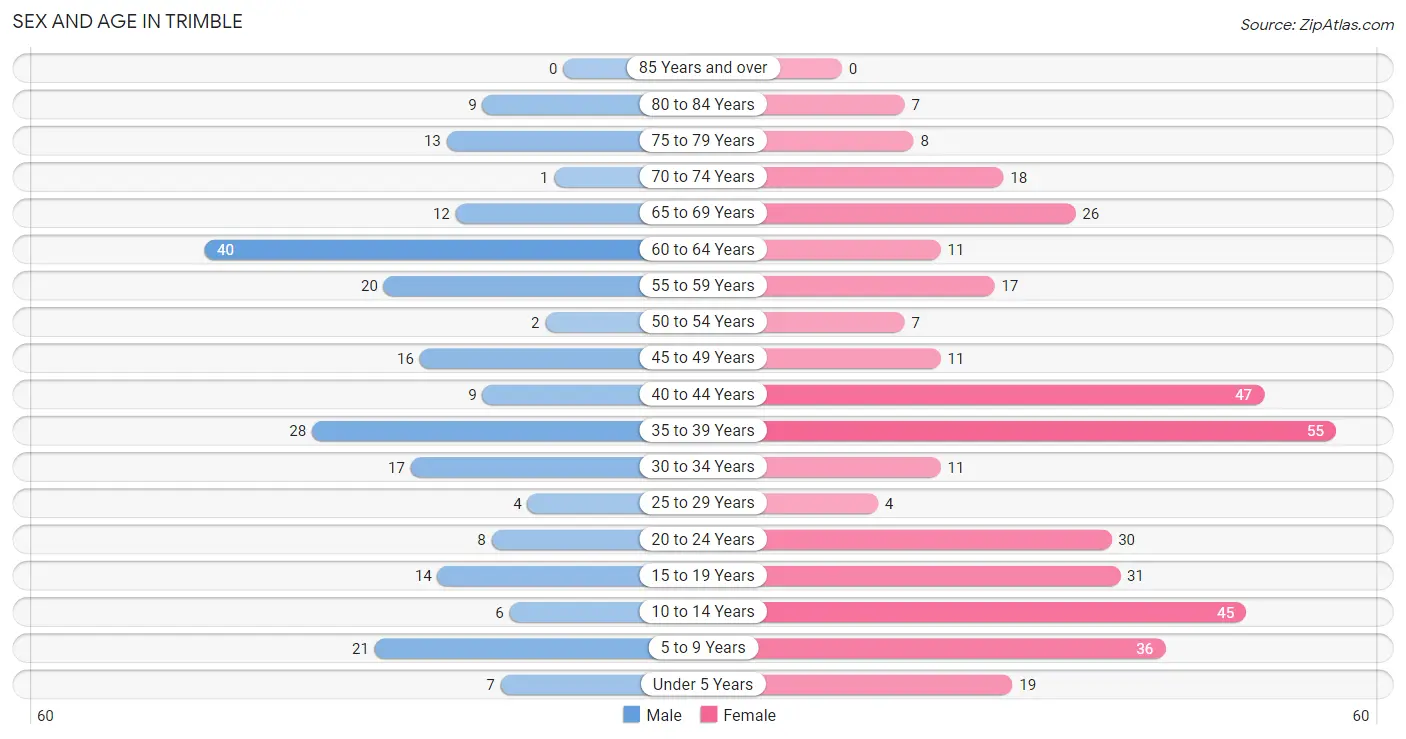
Sex and Age in Trimble
Sex and Age in Trimble
The most populous age groups in Trimble are 60 to 64 Years (40 | 17.6%) for men and 35 to 39 Years (55 | 14.4%) for women.
| Age Bracket | Male | Female |
| Under 5 Years | 7 (3.1%) | 19 (5.0%) |
| 5 to 9 Years | 21 (9.2%) | 36 (9.4%) |
| 10 to 14 Years | 6 (2.6%) | 45 (11.7%) |
| 15 to 19 Years | 14 (6.2%) | 31 (8.1%) |
| 20 to 24 Years | 8 (3.5%) | 30 (7.8%) |
| 25 to 29 Years | 4 (1.8%) | 4 (1.0%) |
| 30 to 34 Years | 17 (7.5%) | 11 (2.9%) |
| 35 to 39 Years | 28 (12.3%) | 55 (14.4%) |
| 40 to 44 Years | 9 (4.0%) | 47 (12.3%) |
| 45 to 49 Years | 16 (7.0%) | 11 (2.9%) |
| 50 to 54 Years | 2 (0.9%) | 7 (1.8%) |
| 55 to 59 Years | 20 (8.8%) | 17 (4.4%) |
| 60 to 64 Years | 40 (17.6%) | 11 (2.9%) |
| 65 to 69 Years | 12 (5.3%) | 26 (6.8%) |
| 70 to 74 Years | 1 (0.4%) | 18 (4.7%) |
| 75 to 79 Years | 13 (5.7%) | 8 (2.1%) |
| 80 to 84 Years | 9 (4.0%) | 7 (1.8%) |
| 85 Years and over | 0 (0.0%) | 0 (0.0%) |
| Total | 227 (100.0%) | 383 (100.0%) |
Families and Households in Trimble
Median Family Size in Trimble
The median family size in Trimble is 3.54 persons per family, with single female/mother families (41 | 28.7%) accounting for the largest median family size of 3.9 persons per family. On the other hand, single male/father families (25 | 17.5%) represent the smallest median family size with 2.72 persons per family.
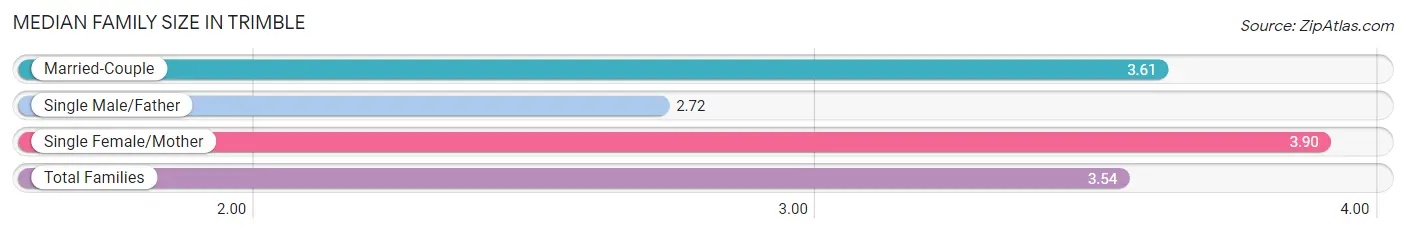
| Family Type | # Families | Family Size |
| Married-Couple | 77 (53.8%) | 3.61 |
| Single Male/Father | 25 (17.5%) | 2.72 |
| Single Female/Mother | 41 (28.7%) | 3.90 |
| Total Families | 143 (100.0%) | 3.54 |
Median Household Size in Trimble
The median household size in Trimble is 2.93 persons per household, with married-couple households (77 | 37.0%) accounting for the largest median household size of 3.91 persons per household. non-family households (65 | 31.2%) represent the smallest median household size with 1.22 persons per household.
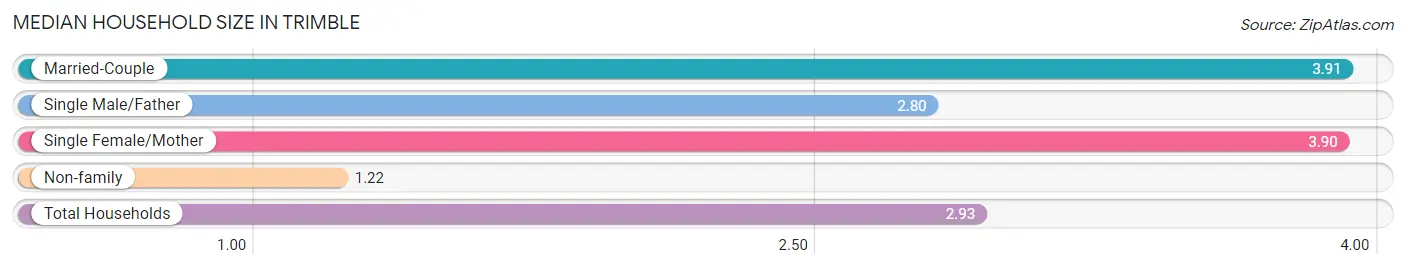
| Household Type | # Households | Household Size |
| Married-Couple | 77 (37.0%) | 3.91 |
| Single Male/Father | 25 (12.0%) | 2.80 |
| Single Female/Mother | 41 (19.7%) | 3.90 |
| Non-family | 65 (31.2%) | 1.22 |
| Total Households | 208 (100.0%) | 2.93 |
Household Size by Marriage Status in Trimble
Out of a total of 208 households in Trimble, 143 (68.8%) are family households, while 65 (31.2%) are nonfamily households. The most numerous type of family households are 2-person households, comprising 67, and the most common type of nonfamily households are 1-person households, comprising 59.
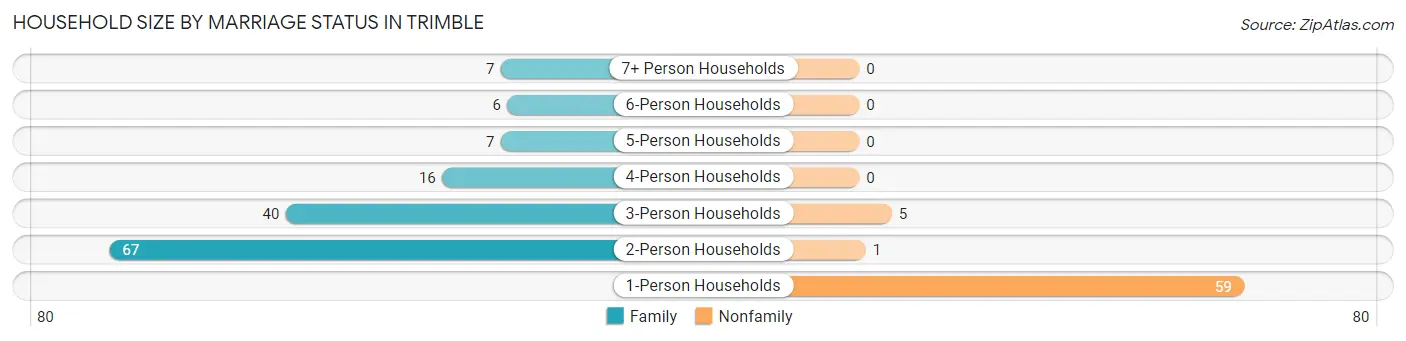
| Household Size | Family Households | Nonfamily Households |
| 1-Person Households | - | 59 (28.4%) |
| 2-Person Households | 67 (32.2%) | 1 (0.5%) |
| 3-Person Households | 40 (19.2%) | 5 (2.4%) |
| 4-Person Households | 16 (7.7%) | 0 (0.0%) |
| 5-Person Households | 7 (3.4%) | 0 (0.0%) |
| 6-Person Households | 6 (2.9%) | 0 (0.0%) |
| 7+ Person Households | 7 (3.4%) | 0 (0.0%) |
| Total | 143 (68.8%) | 65 (31.2%) |
Female Fertility in Trimble
Fertility by Age in Trimble
Average fertility rate in Trimble is 11.0 births per 1,000 women. Women in the age bracket of 20 to 34 years have the highest fertility rate with 44.0 births per 1,000 women. Women in the age bracket of 20 to 34 years acount for 100.0% of all women with births.
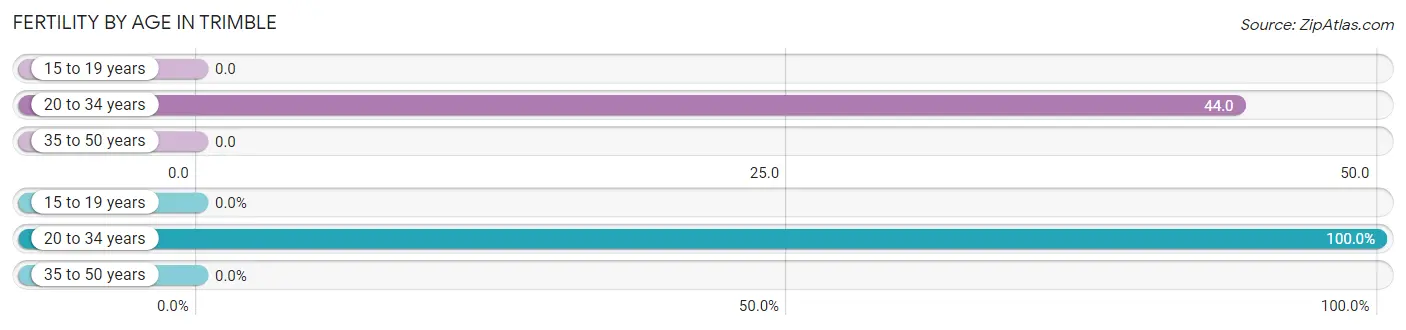
| Age Bracket | Women with Births | Births / 1,000 Women |
| 15 to 19 years | 0 (0.0%) | 0.0 |
| 20 to 34 years | 2 (100.0%) | 44.0 |
| 35 to 50 years | 0 (0.0%) | 0.0 |
| Total | 2 (100.0%) | 11.0 |
Fertility by Age by Marriage Status in Trimble
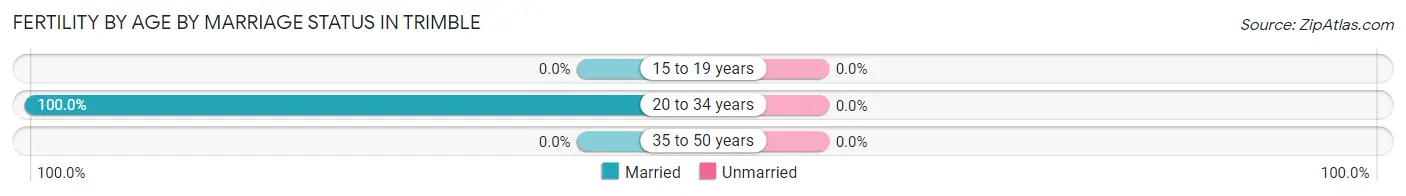
| Age Bracket | Married | Unmarried |
| 15 to 19 years | 0 (0.0%) | 0 (0.0%) |
| 20 to 34 years | 2 (100.0%) | 0 (0.0%) |
| 35 to 50 years | 0 (0.0%) | 0 (0.0%) |
| Total | 2 (100.0%) | 0 (0.0%) |
Fertility by Education in Trimble
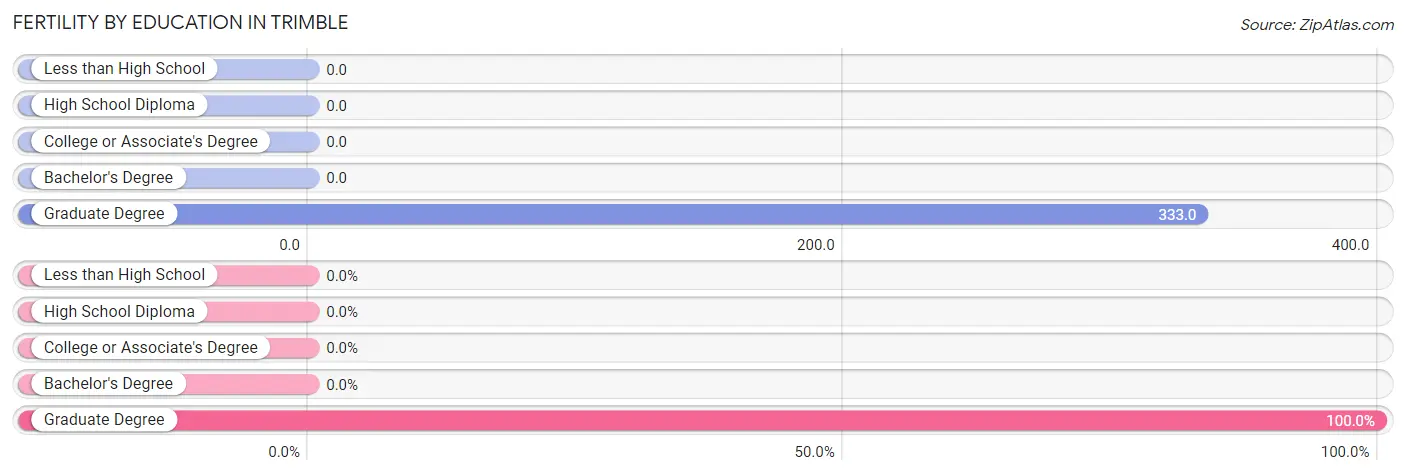
| Educational Attainment | Women with Births | Births / 1,000 Women |
| Less than High School | 0 (0.0%) | 0.0 |
| High School Diploma | 0 (0.0%) | 0.0 |
| College or Associate's Degree | 0 (0.0%) | 0.0 |
| Bachelor's Degree | 0 (0.0%) | 0.0 |
| Graduate Degree | 2 (100.0%) | 333.0 |
| Total | 2 (100.0%) | 11.0 |
Fertility by Education by Marriage Status in Trimble
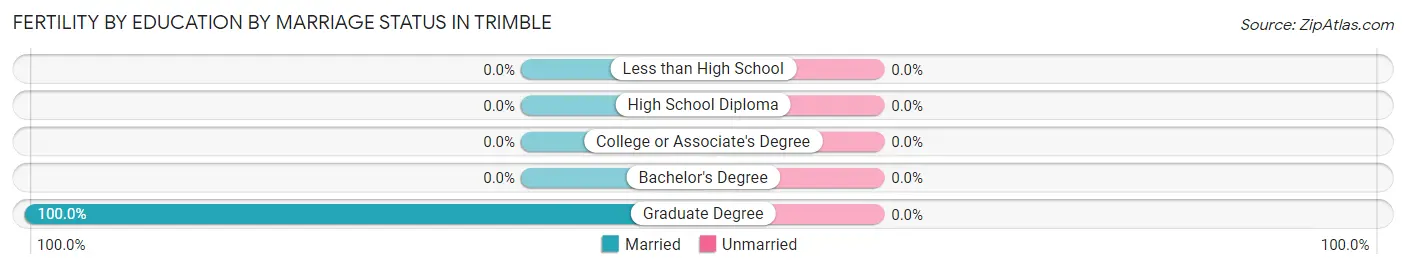
| Educational Attainment | Married | Unmarried |
| Less than High School | 0 (0.0%) | 0 (0.0%) |
| High School Diploma | 0 (0.0%) | 0 (0.0%) |
| College or Associate's Degree | 0 (0.0%) | 0 (0.0%) |
| Bachelor's Degree | 0 (0.0%) | 0 (0.0%) |
| Graduate Degree | 2 (100.0%) | 0 (0.0%) |
| Total | 2 (100.0%) | 0 (0.0%) |
Employment Characteristics in Trimble
Employment by Class of Employer in Trimble
Among the 276 employed individuals in Trimble, private company employees (198 | 71.7%), local government employees (40 | 14.5%), and state government employees (21 | 7.6%) make up the most common classes of employment.
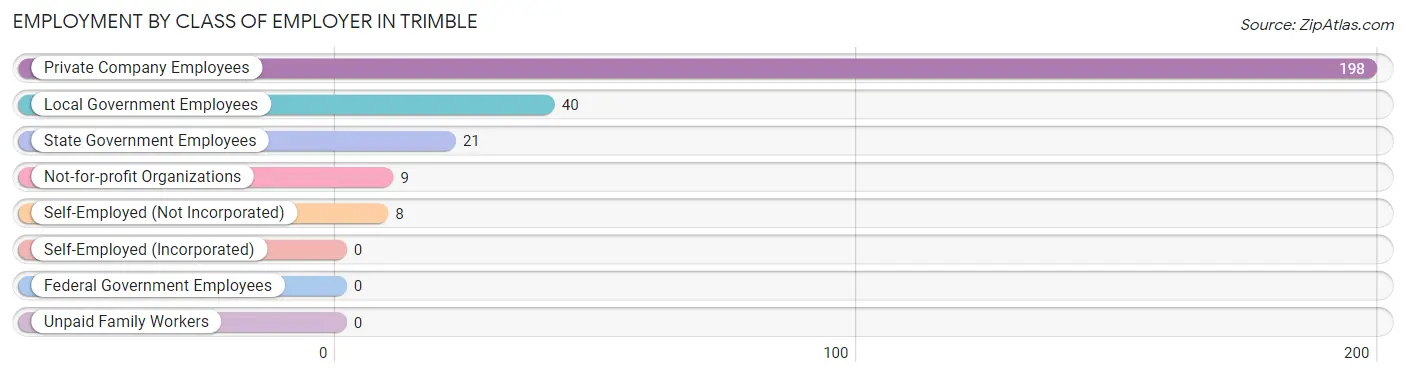
| Employer Class | # Employees | % Employees |
| Private Company Employees | 198 | 71.7% |
| Self-Employed (Incorporated) | 0 | 0.0% |
| Self-Employed (Not Incorporated) | 8 | 2.9% |
| Not-for-profit Organizations | 9 | 3.3% |
| Local Government Employees | 40 | 14.5% |
| State Government Employees | 21 | 7.6% |
| Federal Government Employees | 0 | 0.0% |
| Unpaid Family Workers | 0 | 0.0% |
| Total | 276 | 100.0% |
Employment Status by Age in Trimble
According to the labor force statistics for Trimble, out of the total population over 16 years of age (473), 61.7% or 292 individuals are in the labor force, with 1.4% or 4 of them unemployed. The age group with the highest labor force participation rate is 25 to 29 years, with 100.0% or 8 individuals in the labor force. Within the labor force, the 16 to 19 years age range has the highest percentage of unemployed individuals, with 11.8% or 4 of them being unemployed.
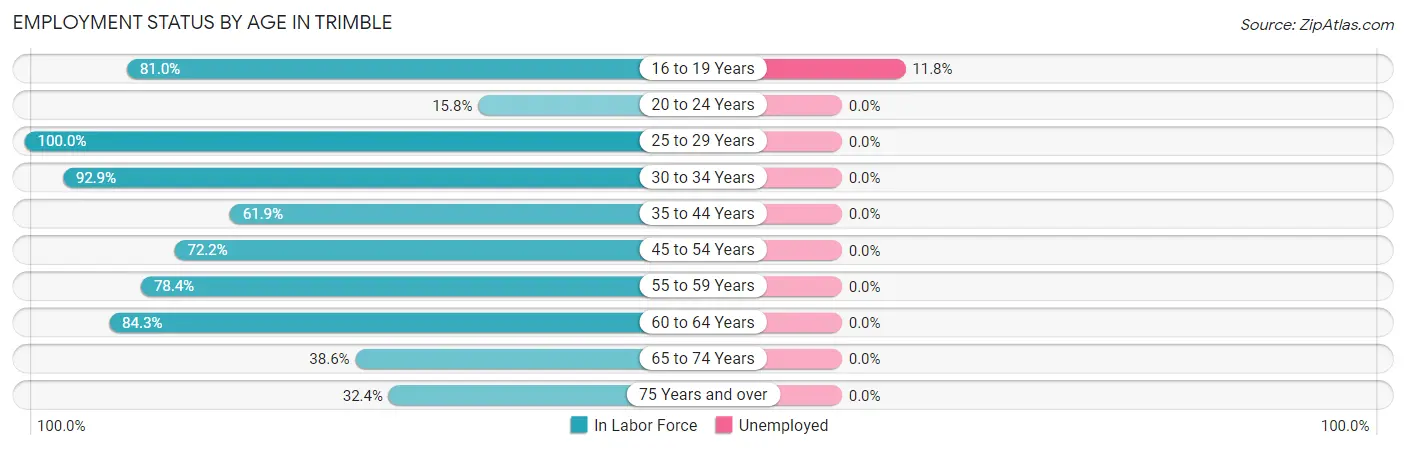
| Age Bracket | In Labor Force | Unemployed |
| 16 to 19 Years | 34 (81.0%) | 4 (11.8%) |
| 20 to 24 Years | 6 (15.8%) | 0 (0.0%) |
| 25 to 29 Years | 8 (100.0%) | 0 (0.0%) |
| 30 to 34 Years | 26 (92.9%) | 0 (0.0%) |
| 35 to 44 Years | 86 (61.9%) | 0 (0.0%) |
| 45 to 54 Years | 26 (72.2%) | 0 (0.0%) |
| 55 to 59 Years | 29 (78.4%) | 0 (0.0%) |
| 60 to 64 Years | 43 (84.3%) | 0 (0.0%) |
| 65 to 74 Years | 22 (38.6%) | 0 (0.0%) |
| 75 Years and over | 12 (32.4%) | 0 (0.0%) |
| Total | 292 (61.7%) | 4 (1.4%) |
Employment Status by Educational Attainment in Trimble
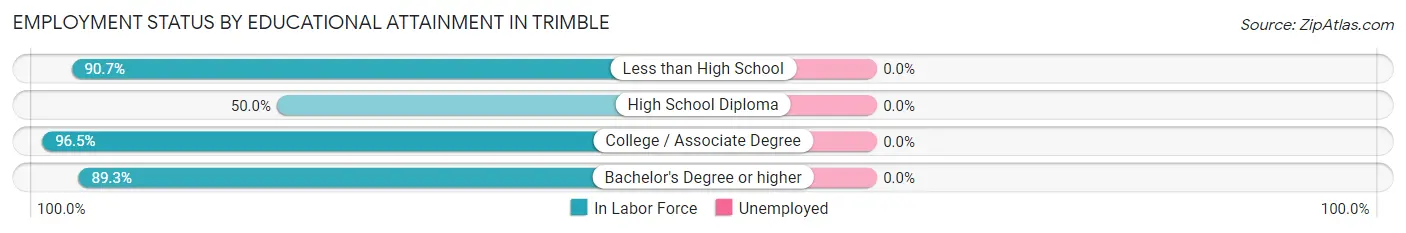
| Educational Attainment | In Labor Force | Unemployed |
| Less than High School | 39 (90.7%) | 0 (0.0%) |
| High School Diploma | 71 (50.0%) | 0 (0.0%) |
| College / Associate Degree | 83 (96.5%) | 0 (0.0%) |
| Bachelor's Degree or higher | 25 (89.3%) | 0 (0.0%) |
| Total | 218 (72.9%) | 0 (0.0%) |
Employment Occupations by Sex in Trimble
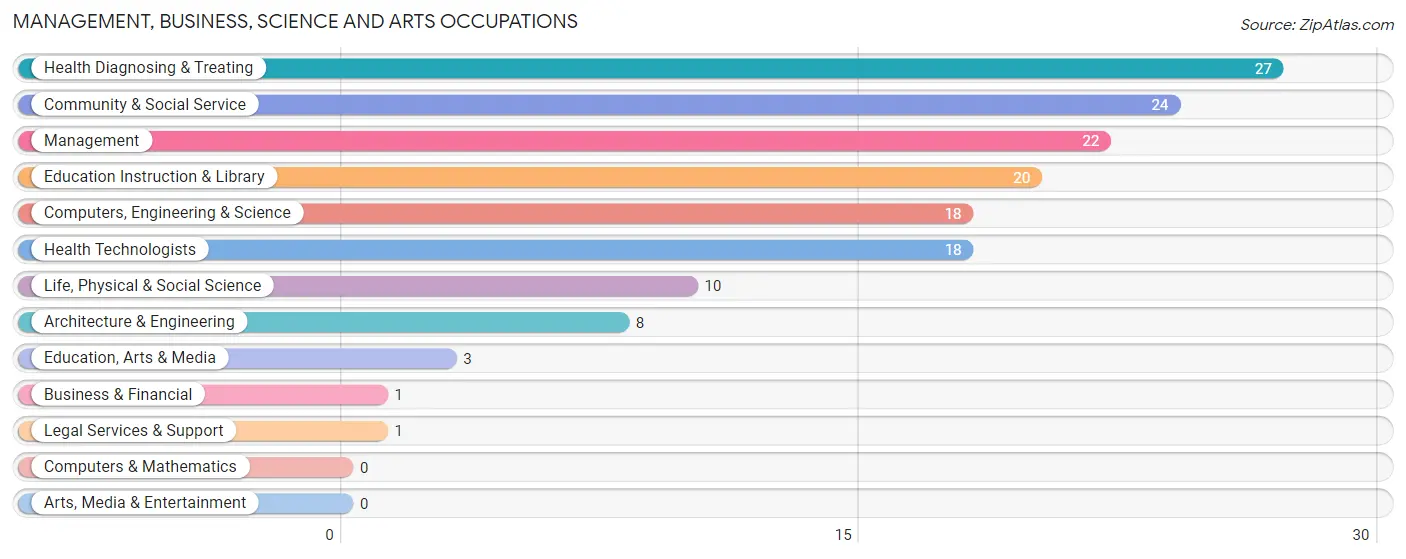
Management, Business, Science and Arts Occupations
The most common Management, Business, Science and Arts occupations in Trimble are Health Diagnosing & Treating (27 | 9.4%), Community & Social Service (24 | 8.3%), Management (22 | 7.6%), Education Instruction & Library (20 | 6.9%), and Computers, Engineering & Science (18 | 6.2%).
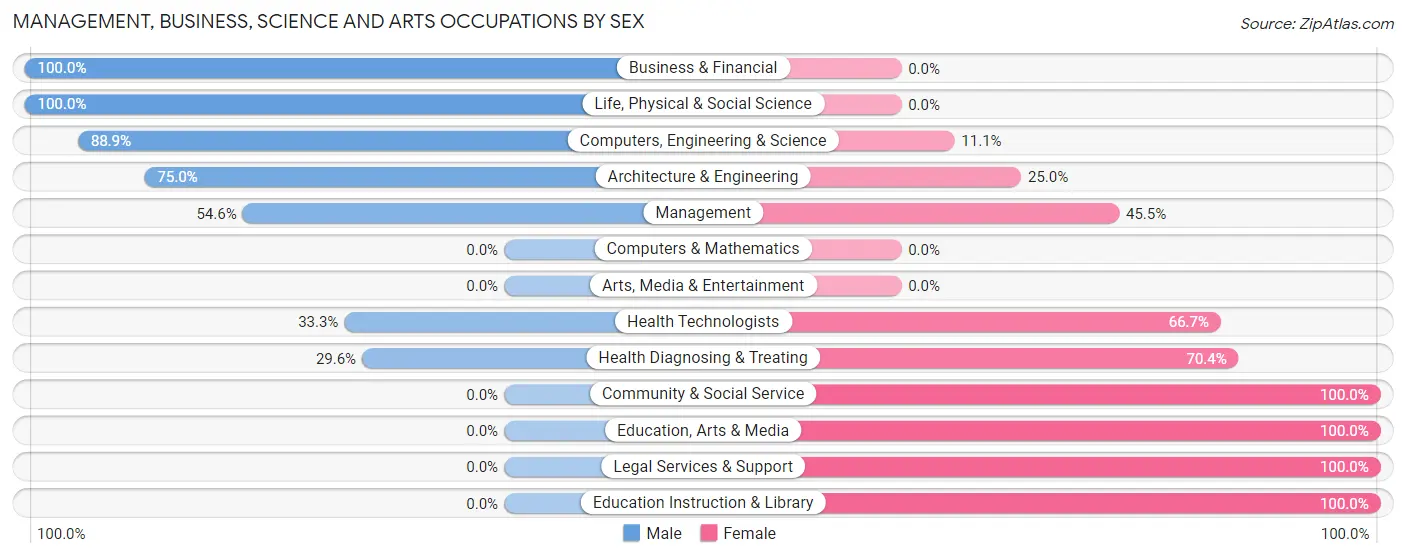
Management, Business, Science and Arts Occupations by Sex
Within the Management, Business, Science and Arts occupations in Trimble, the most male-oriented occupations are Business & Financial (100.0%), Life, Physical & Social Science (100.0%), and Computers, Engineering & Science (88.9%), while the most female-oriented occupations are Community & Social Service (100.0%), Education, Arts & Media (100.0%), and Legal Services & Support (100.0%).
| Occupation | Male | Female |
| Management | 12 (54.5%) | 10 (45.5%) |
| Business & Financial | 1 (100.0%) | 0 (0.0%) |
| Computers, Engineering & Science | 16 (88.9%) | 2 (11.1%) |
| Computers & Mathematics | 0 (0.0%) | 0 (0.0%) |
| Architecture & Engineering | 6 (75.0%) | 2 (25.0%) |
| Life, Physical & Social Science | 10 (100.0%) | 0 (0.0%) |
| Community & Social Service | 0 (0.0%) | 24 (100.0%) |
| Education, Arts & Media | 0 (0.0%) | 3 (100.0%) |
| Legal Services & Support | 0 (0.0%) | 1 (100.0%) |
| Education Instruction & Library | 0 (0.0%) | 20 (100.0%) |
| Arts, Media & Entertainment | 0 (0.0%) | 0 (0.0%) |
| Health Diagnosing & Treating | 8 (29.6%) | 19 (70.4%) |
| Health Technologists | 6 (33.3%) | 12 (66.7%) |
| Total (Category) | 37 (40.2%) | 55 (59.8%) |
| Total (Overall) | 136 (47.2%) | 152 (52.8%) |
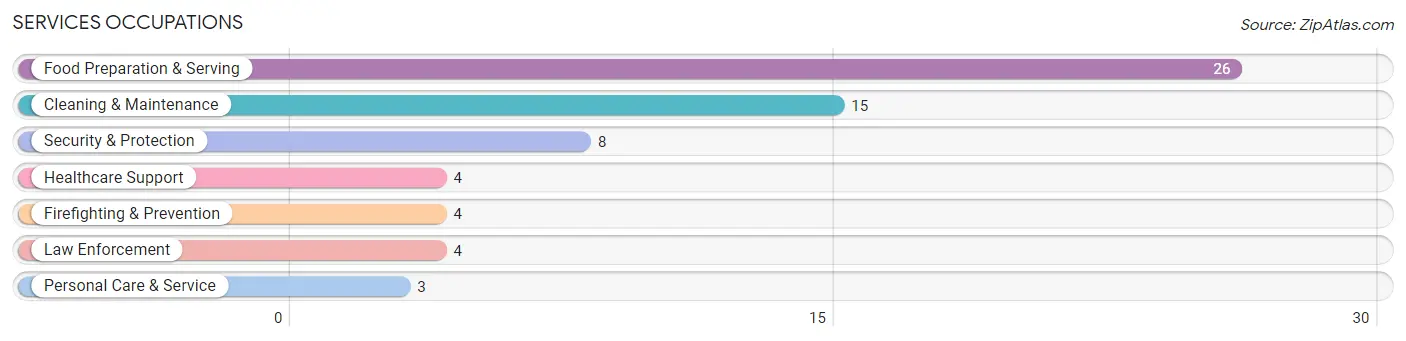
Services Occupations
The most common Services occupations in Trimble are Food Preparation & Serving (26 | 9.0%), Cleaning & Maintenance (15 | 5.2%), Security & Protection (8 | 2.8%), Healthcare Support (4 | 1.4%), and Firefighting & Prevention (4 | 1.4%).
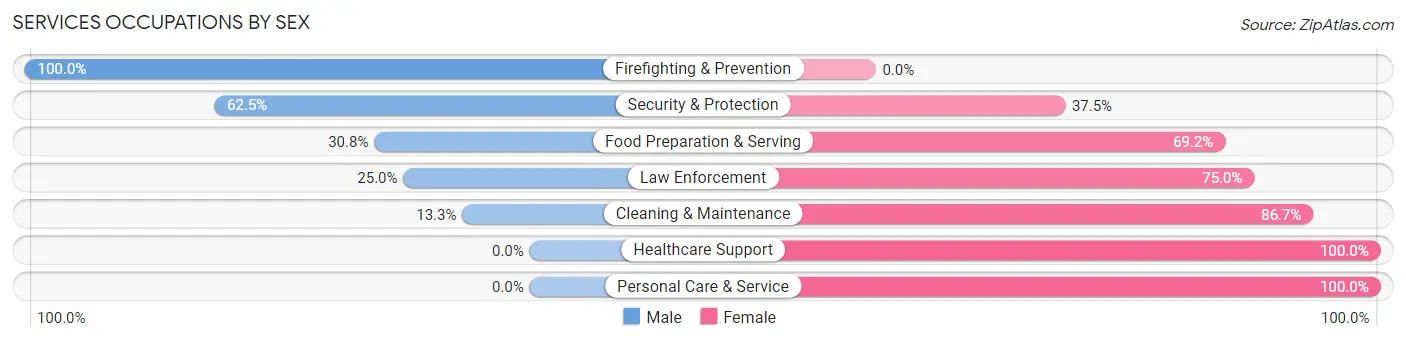
Services Occupations by Sex
Within the Services occupations in Trimble, the most male-oriented occupations are Firefighting & Prevention (100.0%), Security & Protection (62.5%), and Food Preparation & Serving (30.8%), while the most female-oriented occupations are Healthcare Support (100.0%), Personal Care & Service (100.0%), and Cleaning & Maintenance (86.7%).
| Occupation | Male | Female |
| Healthcare Support | 0 (0.0%) | 4 (100.0%) |
| Security & Protection | 5 (62.5%) | 3 (37.5%) |
| Firefighting & Prevention | 4 (100.0%) | 0 (0.0%) |
| Law Enforcement | 1 (25.0%) | 3 (75.0%) |
| Food Preparation & Serving | 8 (30.8%) | 18 (69.2%) |
| Cleaning & Maintenance | 2 (13.3%) | 13 (86.7%) |
| Personal Care & Service | 0 (0.0%) | 3 (100.0%) |
| Total (Category) | 15 (26.8%) | 41 (73.2%) |
| Total (Overall) | 136 (47.2%) | 152 (52.8%) |
Sales and Office Occupations
The most common Sales and Office occupations in Trimble are Office & Administration (19 | 6.6%), and Sales & Related (18 | 6.2%).
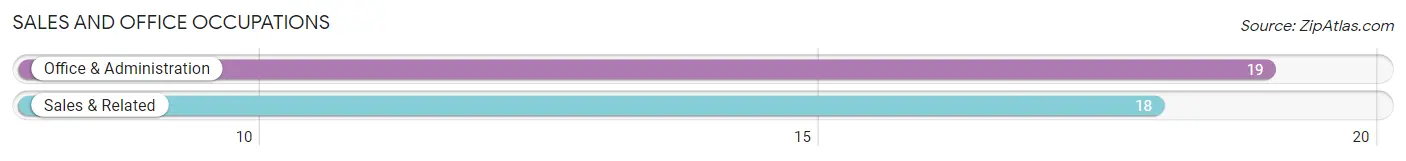
Sales and Office Occupations by Sex
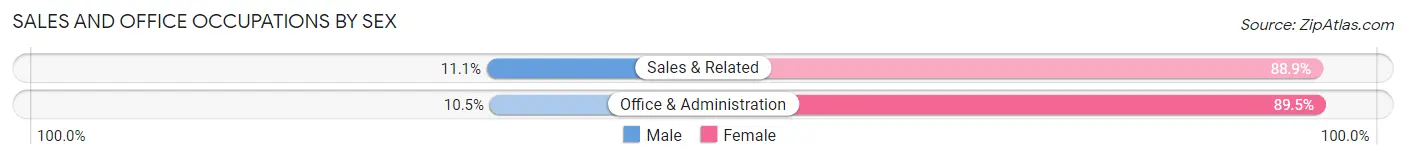
| Occupation | Male | Female |
| Sales & Related | 2 (11.1%) | 16 (88.9%) |
| Office & Administration | 2 (10.5%) | 17 (89.5%) |
| Total (Category) | 4 (10.8%) | 33 (89.2%) |
| Total (Overall) | 136 (47.2%) | 152 (52.8%) |
Natural Resources, Construction and Maintenance Occupations
The most common Natural Resources, Construction and Maintenance occupations in Trimble are Installation, Maintenance & Repair (13 | 4.5%), and Farming, Fishing & Forestry (1 | 0.4%).
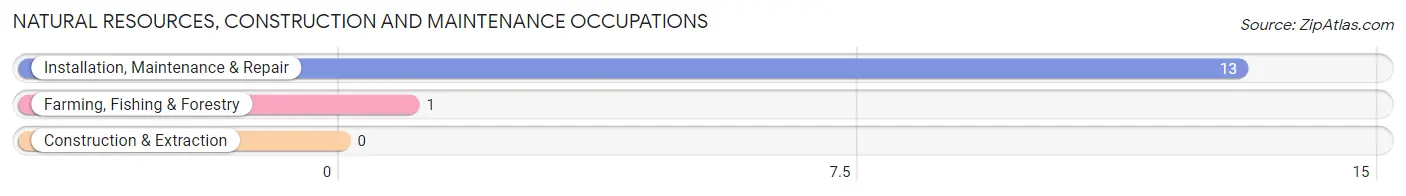
Natural Resources, Construction and Maintenance Occupations by Sex
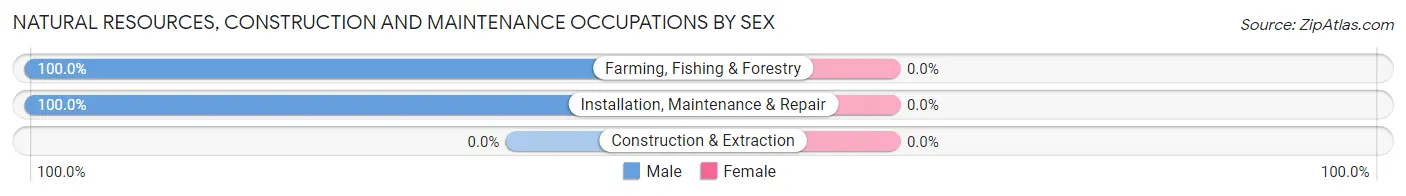
| Occupation | Male | Female |
| Farming, Fishing & Forestry | 1 (100.0%) | 0 (0.0%) |
| Construction & Extraction | 0 (0.0%) | 0 (0.0%) |
| Installation, Maintenance & Repair | 13 (100.0%) | 0 (0.0%) |
| Total (Category) | 14 (100.0%) | 0 (0.0%) |
| Total (Overall) | 136 (47.2%) | 152 (52.8%) |
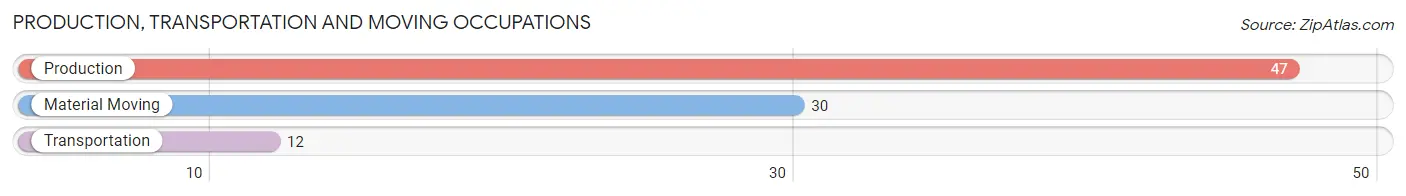
Production, Transportation and Moving Occupations
The most common Production, Transportation and Moving occupations in Trimble are Production (47 | 16.3%), Material Moving (30 | 10.4%), and Transportation (12 | 4.2%).
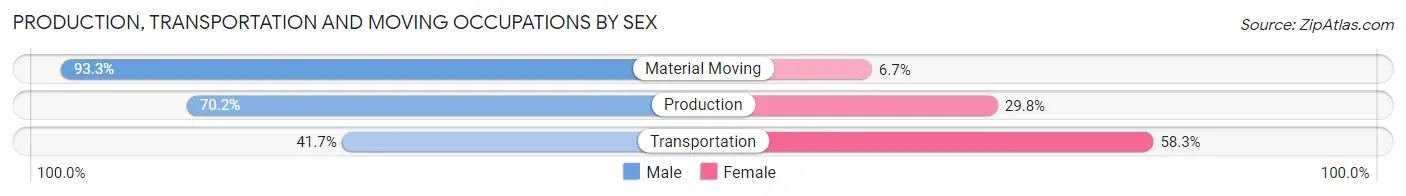
Production, Transportation and Moving Occupations by Sex
| Occupation | Male | Female |
| Production | 33 (70.2%) | 14 (29.8%) |
| Transportation | 5 (41.7%) | 7 (58.3%) |
| Material Moving | 28 (93.3%) | 2 (6.7%) |
| Total (Category) | 66 (74.2%) | 23 (25.8%) |
| Total (Overall) | 136 (47.2%) | 152 (52.8%) |
Employment Industries by Sex in Trimble
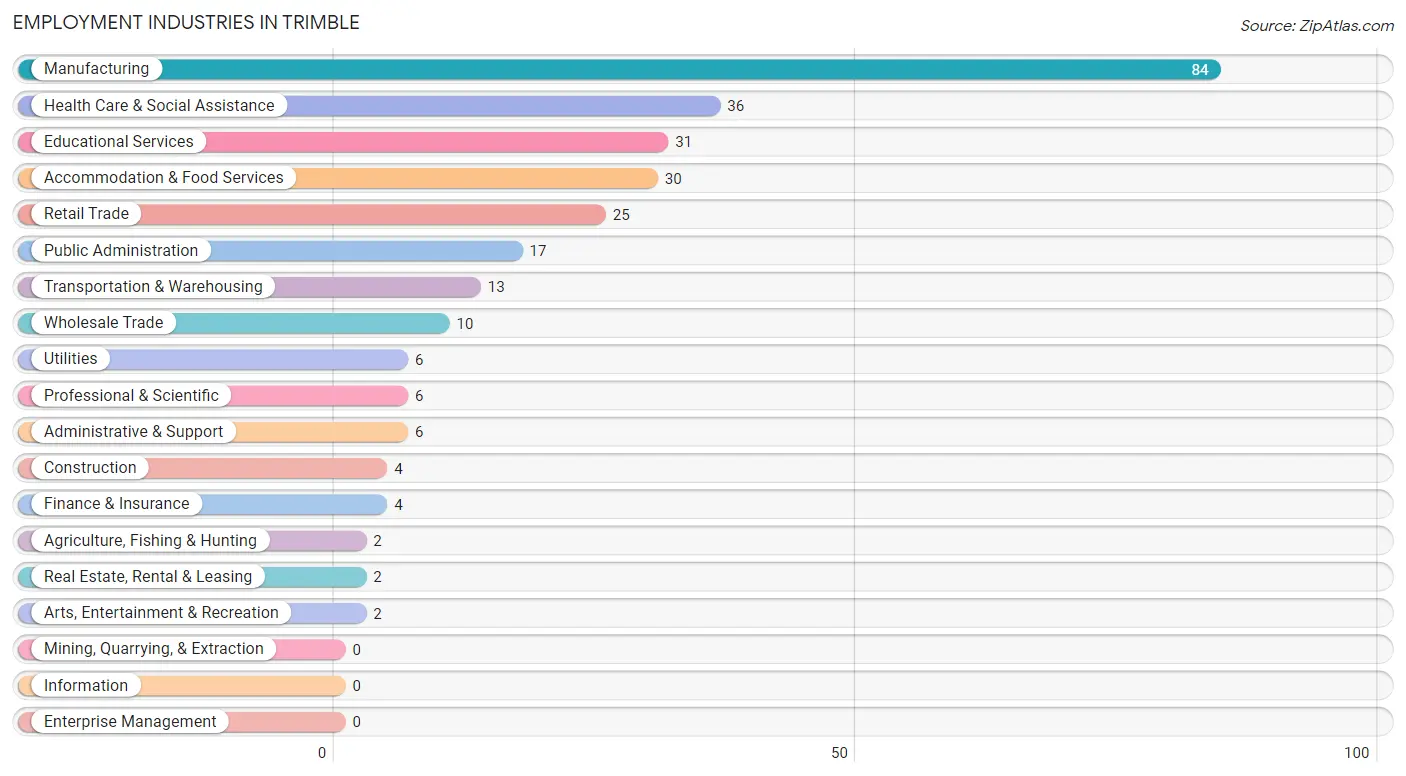
Employment Industries in Trimble
The major employment industries in Trimble include Manufacturing (84 | 29.2%), Health Care & Social Assistance (36 | 12.5%), Educational Services (31 | 10.8%), Accommodation & Food Services (30 | 10.4%), and Retail Trade (25 | 8.7%).
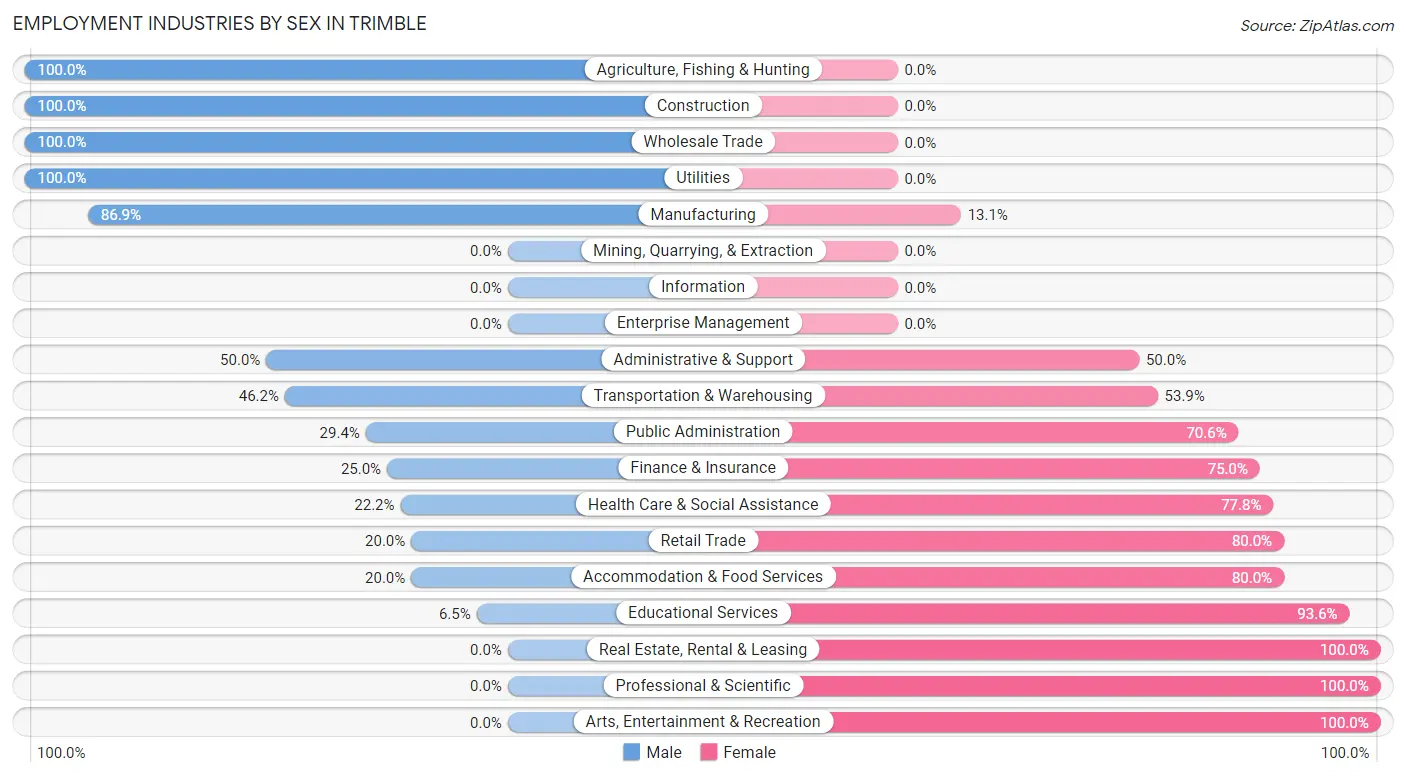
Employment Industries by Sex in Trimble
The Trimble industries that see more men than women are Agriculture, Fishing & Hunting (100.0%), Construction (100.0%), and Wholesale Trade (100.0%), whereas the industries that tend to have a higher number of women are Real Estate, Rental & Leasing (100.0%), Professional & Scientific (100.0%), and Arts, Entertainment & Recreation (100.0%).
| Industry | Male | Female |
| Agriculture, Fishing & Hunting | 2 (100.0%) | 0 (0.0%) |
| Mining, Quarrying, & Extraction | 0 (0.0%) | 0 (0.0%) |
| Construction | 4 (100.0%) | 0 (0.0%) |
| Manufacturing | 73 (86.9%) | 11 (13.1%) |
| Wholesale Trade | 10 (100.0%) | 0 (0.0%) |
| Retail Trade | 5 (20.0%) | 20 (80.0%) |
| Transportation & Warehousing | 6 (46.2%) | 7 (53.8%) |
| Utilities | 6 (100.0%) | 0 (0.0%) |
| Information | 0 (0.0%) | 0 (0.0%) |
| Finance & Insurance | 1 (25.0%) | 3 (75.0%) |
| Real Estate, Rental & Leasing | 0 (0.0%) | 2 (100.0%) |
| Professional & Scientific | 0 (0.0%) | 6 (100.0%) |
| Enterprise Management | 0 (0.0%) | 0 (0.0%) |
| Administrative & Support | 3 (50.0%) | 3 (50.0%) |
| Educational Services | 2 (6.5%) | 29 (93.5%) |
| Health Care & Social Assistance | 8 (22.2%) | 28 (77.8%) |
| Arts, Entertainment & Recreation | 0 (0.0%) | 2 (100.0%) |
| Accommodation & Food Services | 6 (20.0%) | 24 (80.0%) |
| Public Administration | 5 (29.4%) | 12 (70.6%) |
| Total | 136 (47.2%) | 152 (52.8%) |
Education in Trimble
School Enrollment in Trimble
The most common levels of schooling among the 162 students in Trimble are elementary school (49 | 30.2%), middle school (34 | 21.0%), and high school (33 | 20.4%).
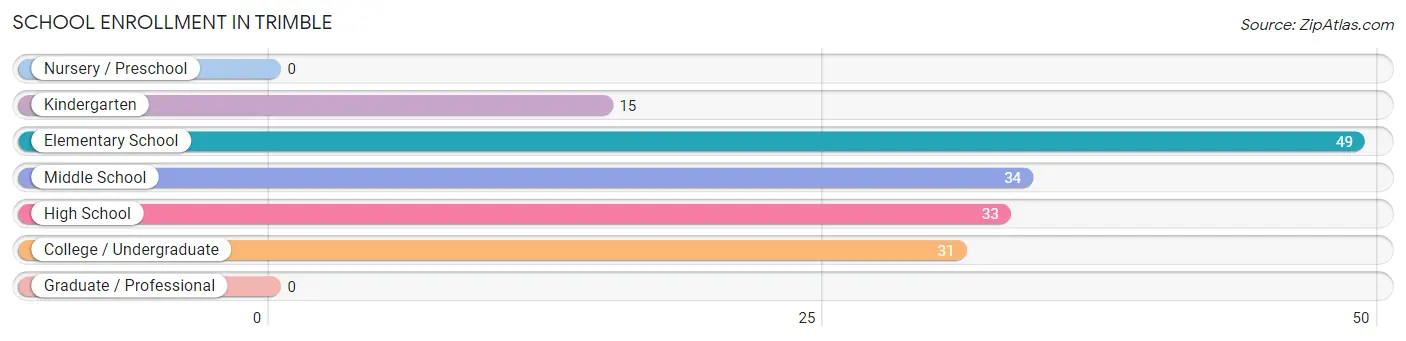
| School Level | # Students | % Students |
| Nursery / Preschool | 0 | 0.0% |
| Kindergarten | 15 | 9.3% |
| Elementary School | 49 | 30.2% |
| Middle School | 34 | 21.0% |
| High School | 33 | 20.4% |
| College / Undergraduate | 31 | 19.1% |
| Graduate / Professional | 0 | 0.0% |
| Total | 162 | 100.0% |
School Enrollment by Age by Funding Source in Trimble
Out of a total of 162 students who are enrolled in schools in Trimble, 21 (13.0%) attend a private institution, while the remaining 141 (87.0%) are enrolled in public schools. The age group of 35 years and over has the highest likelihood of being enrolled in private schools, with 10 (100.0% in the age bracket) enrolled. Conversely, the age group of 18 to 19 year olds has the lowest likelihood of being enrolled in a private school, with 7 (100.0% in the age bracket) attending a public institution.
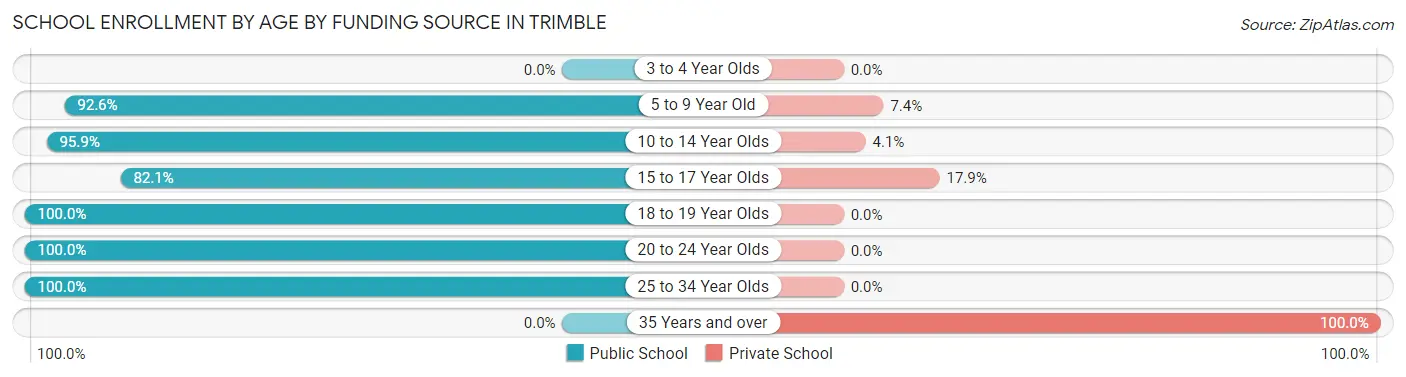
| Age Bracket | Public School | Private School |
| 3 to 4 Year Olds | 0 (0.0%) | 0 (0.0%) |
| 5 to 9 Year Old | 50 (92.6%) | 4 (7.4%) |
| 10 to 14 Year Olds | 47 (95.9%) | 2 (4.1%) |
| 15 to 17 Year Olds | 23 (82.1%) | 5 (17.9%) |
| 18 to 19 Year Olds | 7 (100.0%) | 0 (0.0%) |
| 20 to 24 Year Olds | 10 (100.0%) | 0 (0.0%) |
| 25 to 34 Year Olds | 4 (100.0%) | 0 (0.0%) |
| 35 Years and over | 0 (0.0%) | 10 (100.0%) |
| Total | 141 (87.0%) | 21 (13.0%) |
Educational Attainment by Field of Study in Trimble
Science & technology (13 | 31.7%), bio, nature & agricultural (7 | 17.1%), business (6 | 14.6%), multidisciplinary studies (4 | 9.8%), and physical & health sciences (3 | 7.3%) are the most common fields of study among 41 individuals in Trimble who have obtained a bachelor's degree or higher.
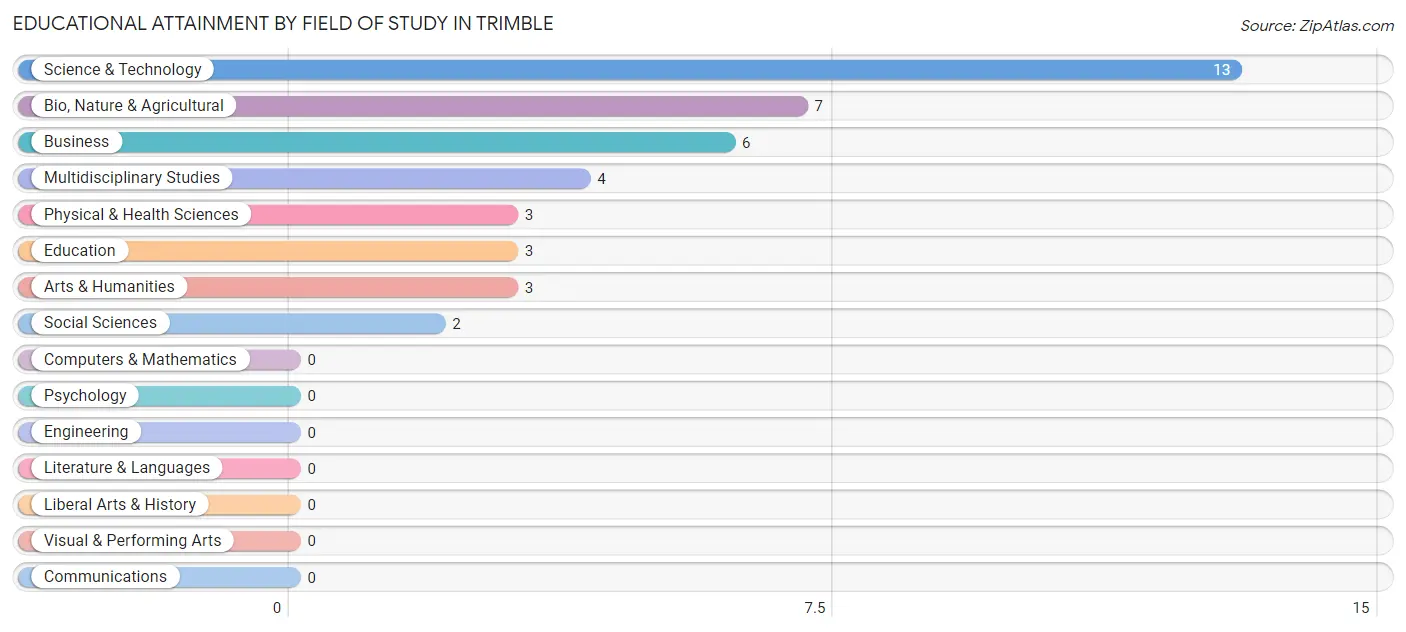
| Field of Study | # Graduates | % Graduates |
| Computers & Mathematics | 0 | 0.0% |
| Bio, Nature & Agricultural | 7 | 17.1% |
| Physical & Health Sciences | 3 | 7.3% |
| Psychology | 0 | 0.0% |
| Social Sciences | 2 | 4.9% |
| Engineering | 0 | 0.0% |
| Multidisciplinary Studies | 4 | 9.8% |
| Science & Technology | 13 | 31.7% |
| Business | 6 | 14.6% |
| Education | 3 | 7.3% |
| Literature & Languages | 0 | 0.0% |
| Liberal Arts & History | 0 | 0.0% |
| Visual & Performing Arts | 0 | 0.0% |
| Communications | 0 | 0.0% |
| Arts & Humanities | 3 | 7.3% |
| Total | 41 | 100.0% |
Transportation & Commute in Trimble
Vehicle Availability by Sex in Trimble
The most prevalent vehicle ownership categories in Trimble are males with 2 vehicles (56, accounting for 45.2%) and females with 2 vehicles (62, making up 36.8%).
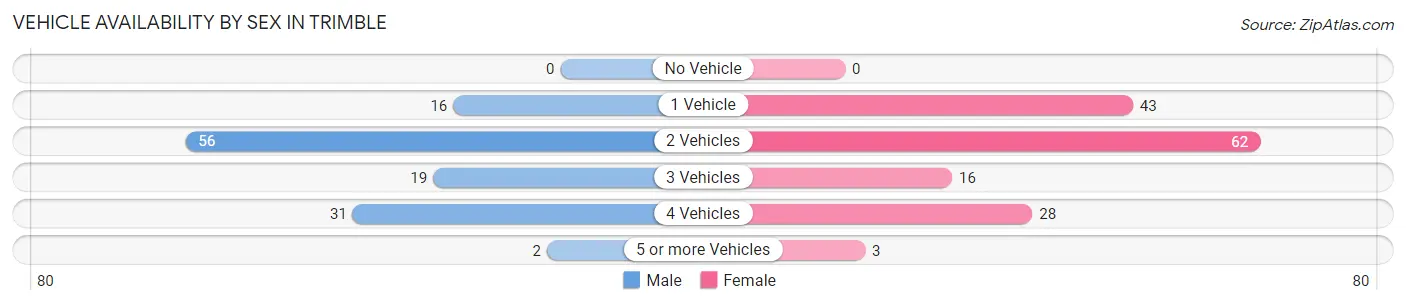
| Vehicles Available | Male | Female |
| No Vehicle | 0 (0.0%) | 0 (0.0%) |
| 1 Vehicle | 16 (12.9%) | 43 (28.3%) |
| 2 Vehicles | 56 (45.2%) | 62 (40.8%) |
| 3 Vehicles | 19 (15.3%) | 16 (10.5%) |
| 4 Vehicles | 31 (25.0%) | 28 (18.4%) |
| 5 or more Vehicles | 2 (1.6%) | 3 (2.0%) |
| Total | 124 (100.0%) | 152 (100.0%) |
Commute Time in Trimble
The most frequently occuring commute durations in Trimble are 20 to 24 minutes (82 commuters, 29.9%), 25 to 29 minutes (53 commuters, 19.3%), and 10 to 14 minutes (30 commuters, 11.0%).
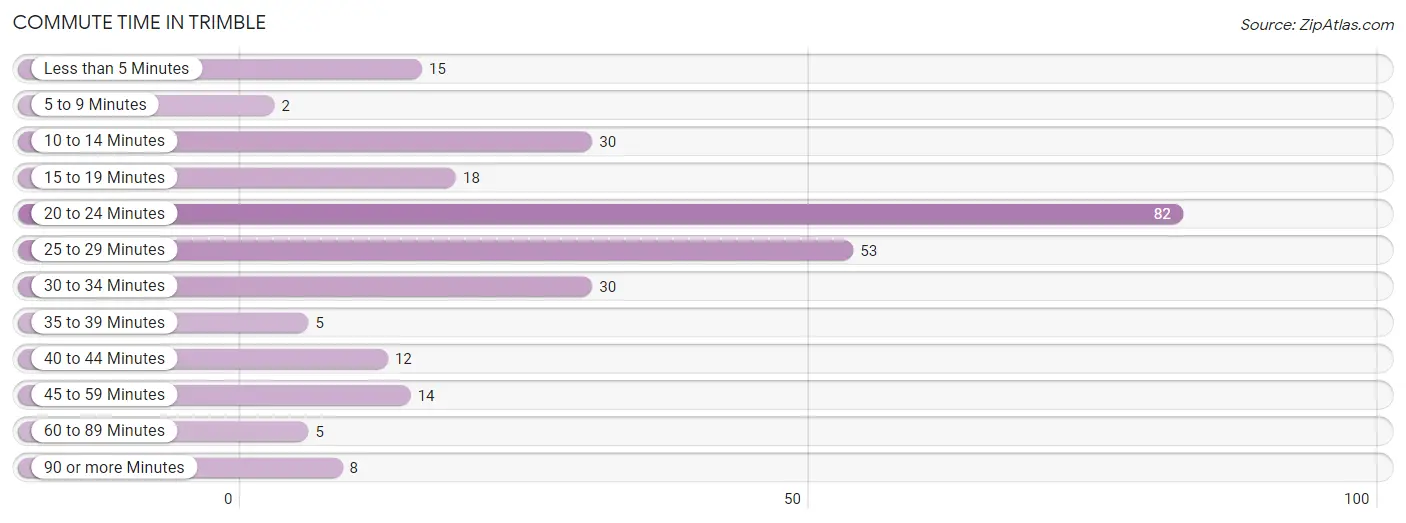
| Commute Time | # Commuters | % Commuters |
| Less than 5 Minutes | 15 | 5.5% |
| 5 to 9 Minutes | 2 | 0.7% |
| 10 to 14 Minutes | 30 | 11.0% |
| 15 to 19 Minutes | 18 | 6.6% |
| 20 to 24 Minutes | 82 | 29.9% |
| 25 to 29 Minutes | 53 | 19.3% |
| 30 to 34 Minutes | 30 | 11.0% |
| 35 to 39 Minutes | 5 | 1.8% |
| 40 to 44 Minutes | 12 | 4.4% |
| 45 to 59 Minutes | 14 | 5.1% |
| 60 to 89 Minutes | 5 | 1.8% |
| 90 or more Minutes | 8 | 2.9% |
Commute Time by Sex in Trimble
The most common commute times in Trimble are 20 to 24 minutes (29 commuters, 23.4%) for males and 20 to 24 minutes (53 commuters, 35.3%) for females.
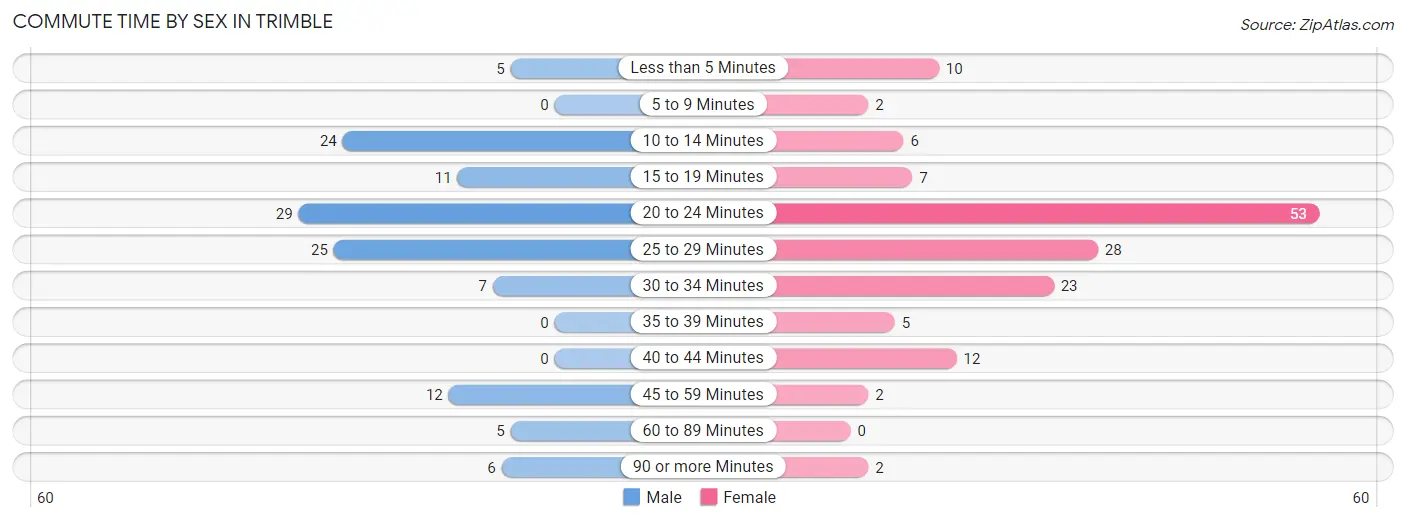
| Commute Time | Male | Female |
| Less than 5 Minutes | 5 (4.0%) | 10 (6.7%) |
| 5 to 9 Minutes | 0 (0.0%) | 2 (1.3%) |
| 10 to 14 Minutes | 24 (19.4%) | 6 (4.0%) |
| 15 to 19 Minutes | 11 (8.9%) | 7 (4.7%) |
| 20 to 24 Minutes | 29 (23.4%) | 53 (35.3%) |
| 25 to 29 Minutes | 25 (20.2%) | 28 (18.7%) |
| 30 to 34 Minutes | 7 (5.7%) | 23 (15.3%) |
| 35 to 39 Minutes | 0 (0.0%) | 5 (3.3%) |
| 40 to 44 Minutes | 0 (0.0%) | 12 (8.0%) |
| 45 to 59 Minutes | 12 (9.7%) | 2 (1.3%) |
| 60 to 89 Minutes | 5 (4.0%) | 0 (0.0%) |
| 90 or more Minutes | 6 (4.8%) | 2 (1.3%) |
Time of Departure to Work by Sex in Trimble
The most frequent times of departure to work in Trimble are 4:00 PM to 11:59 PM (42, 33.9%) for males and 7:00 AM to 7:29 AM (28, 18.7%) for females.
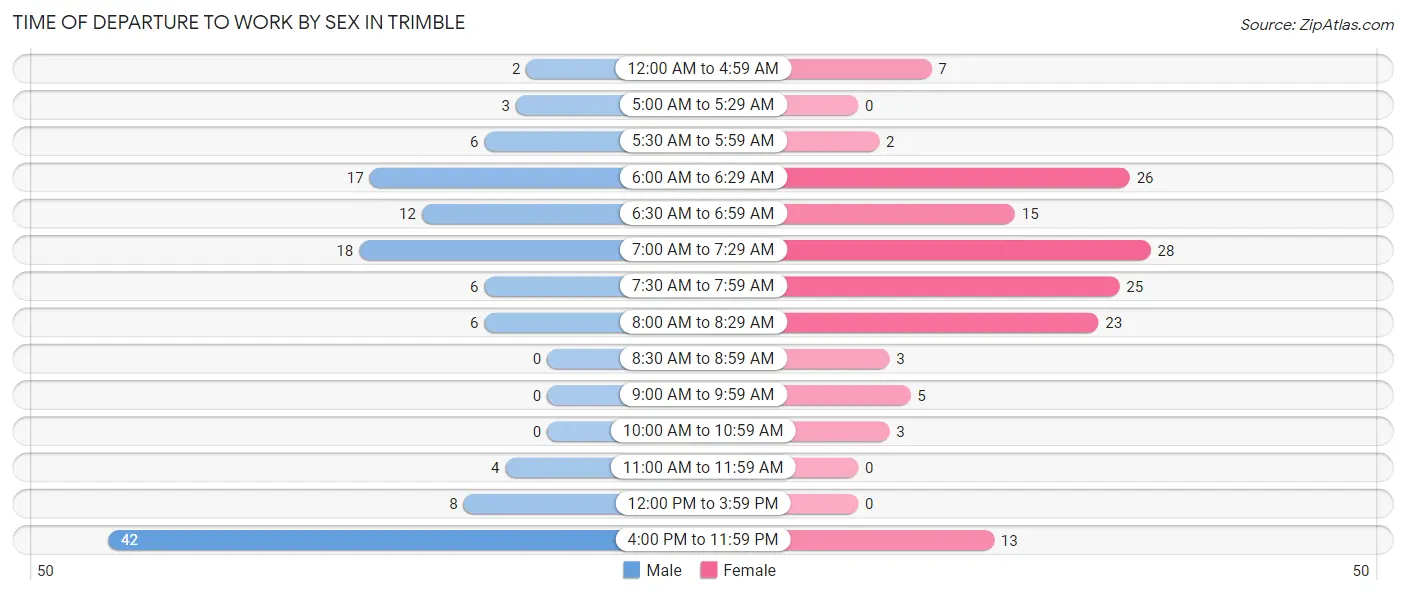
| Time of Departure | Male | Female |
| 12:00 AM to 4:59 AM | 2 (1.6%) | 7 (4.7%) |
| 5:00 AM to 5:29 AM | 3 (2.4%) | 0 (0.0%) |
| 5:30 AM to 5:59 AM | 6 (4.8%) | 2 (1.3%) |
| 6:00 AM to 6:29 AM | 17 (13.7%) | 26 (17.3%) |
| 6:30 AM to 6:59 AM | 12 (9.7%) | 15 (10.0%) |
| 7:00 AM to 7:29 AM | 18 (14.5%) | 28 (18.7%) |
| 7:30 AM to 7:59 AM | 6 (4.8%) | 25 (16.7%) |
| 8:00 AM to 8:29 AM | 6 (4.8%) | 23 (15.3%) |
| 8:30 AM to 8:59 AM | 0 (0.0%) | 3 (2.0%) |
| 9:00 AM to 9:59 AM | 0 (0.0%) | 5 (3.3%) |
| 10:00 AM to 10:59 AM | 0 (0.0%) | 3 (2.0%) |
| 11:00 AM to 11:59 AM | 4 (3.2%) | 0 (0.0%) |
| 12:00 PM to 3:59 PM | 8 (6.5%) | 0 (0.0%) |
| 4:00 PM to 11:59 PM | 42 (33.9%) | 13 (8.7%) |
| Total | 124 (100.0%) | 150 (100.0%) |
Housing Occupancy in Trimble
Occupancy by Ownership in Trimble
Of the total 208 dwellings in Trimble, owner-occupied units account for 154 (74.0%), while renter-occupied units make up 54 (26.0%).
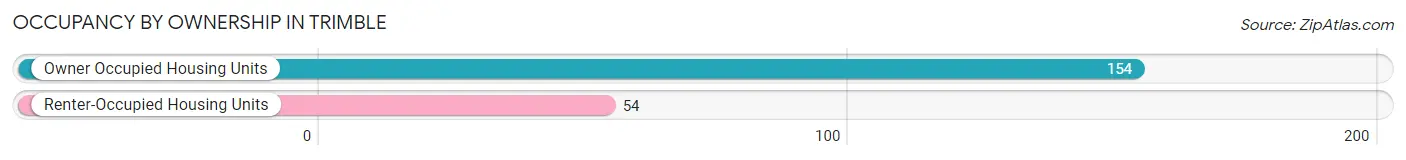
| Occupancy | # Housing Units | % Housing Units |
| Owner Occupied Housing Units | 154 | 74.0% |
| Renter-Occupied Housing Units | 54 | 26.0% |
| Total Occupied Housing Units | 208 | 100.0% |
Occupancy by Household Size in Trimble
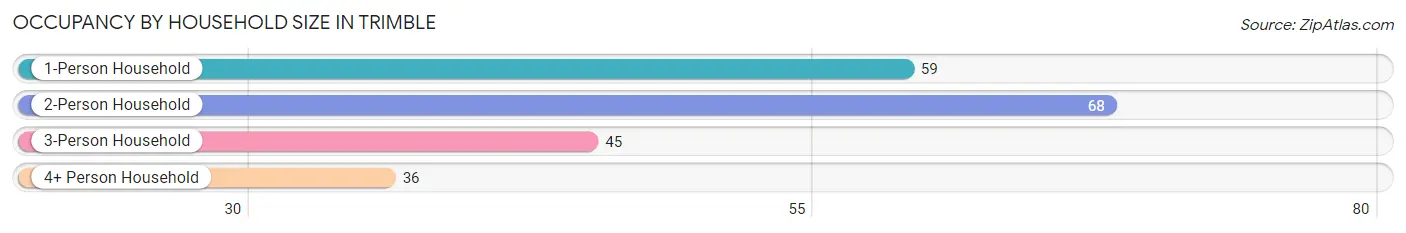
| Household Size | # Housing Units | % Housing Units |
| 1-Person Household | 59 | 28.4% |
| 2-Person Household | 68 | 32.7% |
| 3-Person Household | 45 | 21.6% |
| 4+ Person Household | 36 | 17.3% |
| Total Housing Units | 208 | 100.0% |
Occupancy by Ownership by Household Size in Trimble
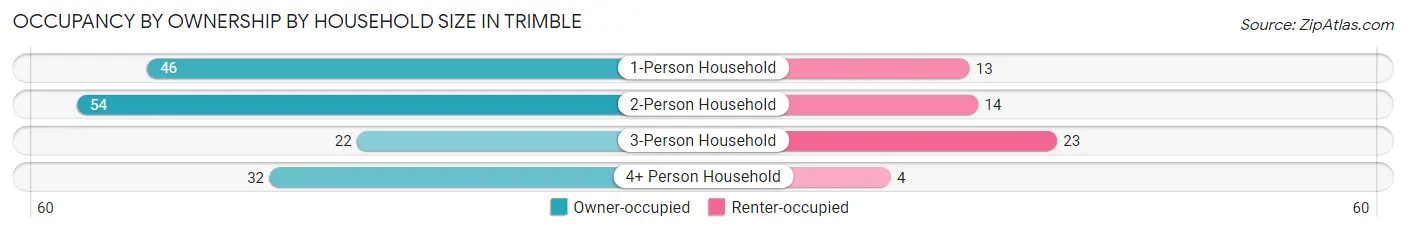
| Household Size | Owner-occupied | Renter-occupied |
| 1-Person Household | 46 (78.0%) | 13 (22.0%) |
| 2-Person Household | 54 (79.4%) | 14 (20.6%) |
| 3-Person Household | 22 (48.9%) | 23 (51.1%) |
| 4+ Person Household | 32 (88.9%) | 4 (11.1%) |
| Total Housing Units | 154 (74.0%) | 54 (26.0%) |
Occupancy by Educational Attainment in Trimble
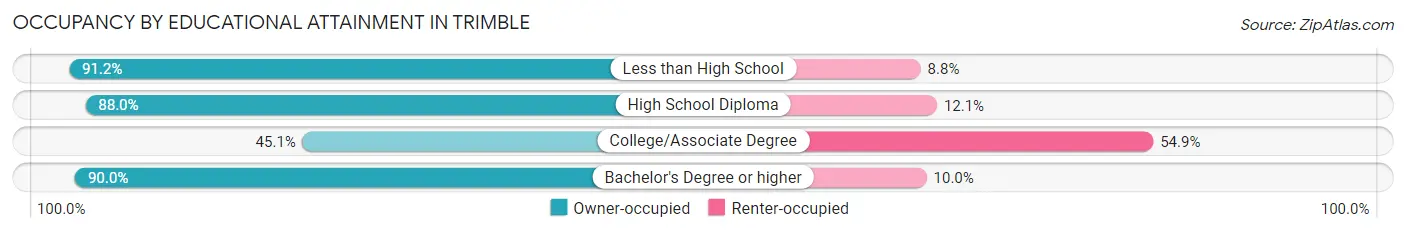
| Household Size | Owner-occupied | Renter-occupied |
| Less than High School | 31 (91.2%) | 3 (8.8%) |
| High School Diploma | 73 (87.9%) | 10 (12.0%) |
| College/Associate Degree | 32 (45.1%) | 39 (54.9%) |
| Bachelor's Degree or higher | 18 (90.0%) | 2 (10.0%) |
Occupancy by Age of Householder in Trimble
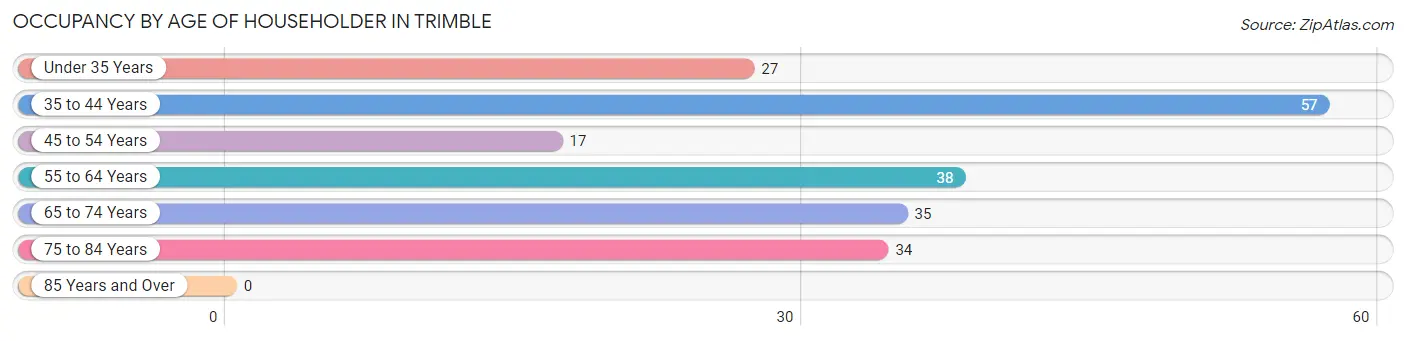
| Age Bracket | # Households | % Households |
| Under 35 Years | 27 | 13.0% |
| 35 to 44 Years | 57 | 27.4% |
| 45 to 54 Years | 17 | 8.2% |
| 55 to 64 Years | 38 | 18.3% |
| 65 to 74 Years | 35 | 16.8% |
| 75 to 84 Years | 34 | 16.4% |
| 85 Years and Over | 0 | 0.0% |
| Total | 208 | 100.0% |
Housing Finances in Trimble
Median Income by Occupancy in Trimble
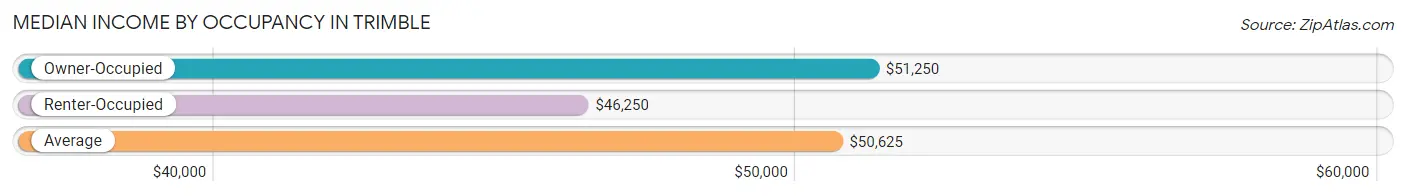
| Occupancy Type | # Households | Median Income |
| Owner-Occupied | 154 (74.0%) | $51,250 |
| Renter-Occupied | 54 (26.0%) | $46,250 |
| Average | 208 (100.0%) | $50,625 |
Occupancy by Householder Income Bracket in Trimble
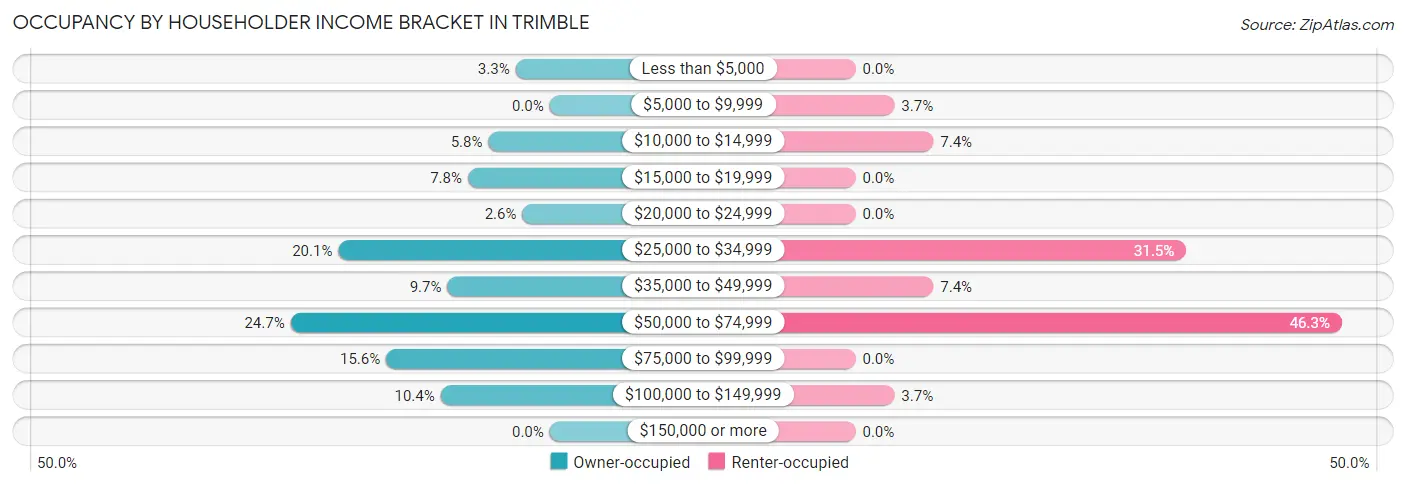
| Income Bracket | Owner-occupied | Renter-occupied |
| Less than $5,000 | 5 (3.3%) | 0 (0.0%) |
| $5,000 to $9,999 | 0 (0.0%) | 2 (3.7%) |
| $10,000 to $14,999 | 9 (5.8%) | 4 (7.4%) |
| $15,000 to $19,999 | 12 (7.8%) | 0 (0.0%) |
| $20,000 to $24,999 | 4 (2.6%) | 0 (0.0%) |
| $25,000 to $34,999 | 31 (20.1%) | 17 (31.5%) |
| $35,000 to $49,999 | 15 (9.7%) | 4 (7.4%) |
| $50,000 to $74,999 | 38 (24.7%) | 25 (46.3%) |
| $75,000 to $99,999 | 24 (15.6%) | 0 (0.0%) |
| $100,000 to $149,999 | 16 (10.4%) | 2 (3.7%) |
| $150,000 or more | 0 (0.0%) | 0 (0.0%) |
| Total | 154 (100.0%) | 54 (100.0%) |
Monthly Housing Cost Tiers in Trimble
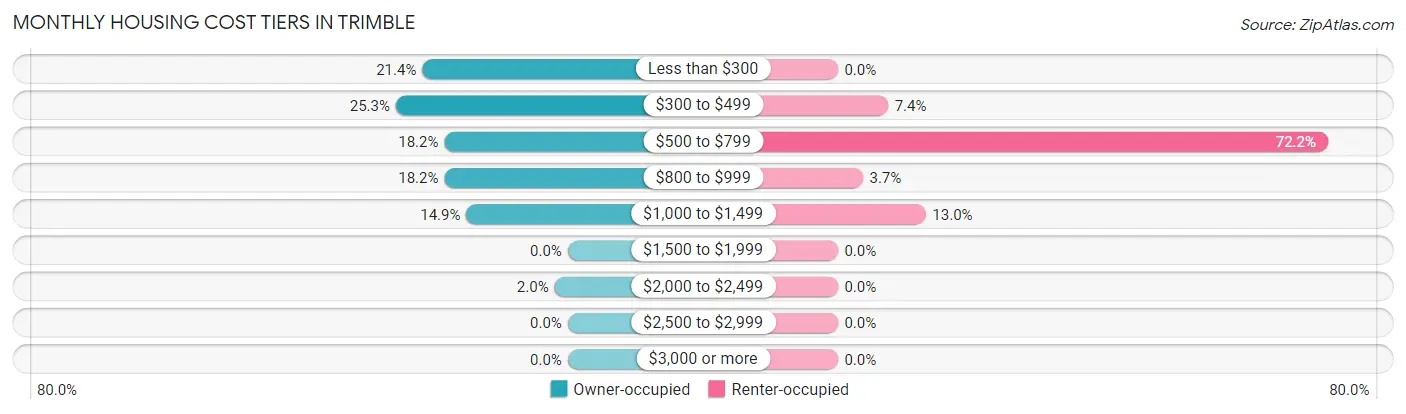
| Monthly Cost | Owner-occupied | Renter-occupied |
| Less than $300 | 33 (21.4%) | 0 (0.0%) |
| $300 to $499 | 39 (25.3%) | 4 (7.4%) |
| $500 to $799 | 28 (18.2%) | 39 (72.2%) |
| $800 to $999 | 28 (18.2%) | 2 (3.7%) |
| $1,000 to $1,499 | 23 (14.9%) | 7 (13.0%) |
| $1,500 to $1,999 | 0 (0.0%) | 0 (0.0%) |
| $2,000 to $2,499 | 3 (1.9%) | 0 (0.0%) |
| $2,500 to $2,999 | 0 (0.0%) | 0 (0.0%) |
| $3,000 or more | 0 (0.0%) | 0 (0.0%) |
| Total | 154 (100.0%) | 54 (100.0%) |
Physical Housing Characteristics in Trimble
Housing Structures in Trimble
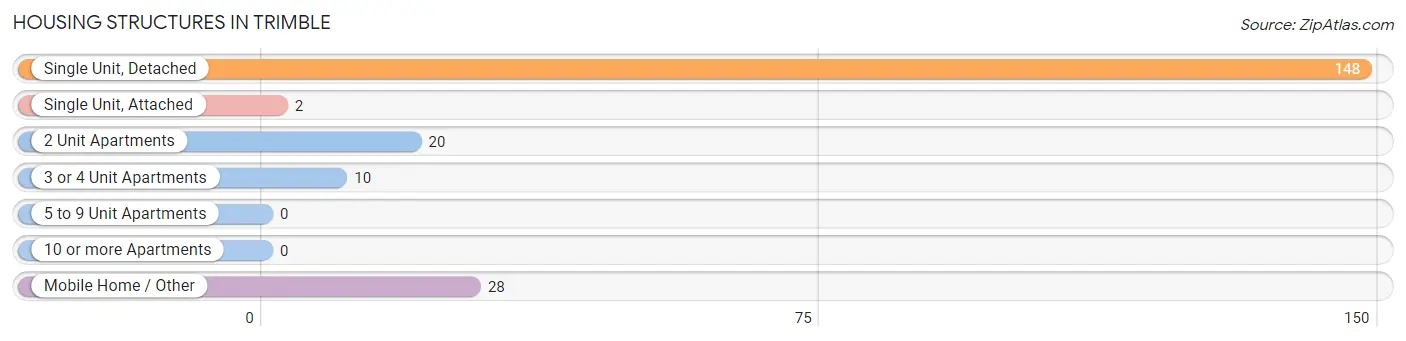
| Structure Type | # Housing Units | % Housing Units |
| Single Unit, Detached | 148 | 71.2% |
| Single Unit, Attached | 2 | 1.0% |
| 2 Unit Apartments | 20 | 9.6% |
| 3 or 4 Unit Apartments | 10 | 4.8% |
| 5 to 9 Unit Apartments | 0 | 0.0% |
| 10 or more Apartments | 0 | 0.0% |
| Mobile Home / Other | 28 | 13.5% |
| Total | 208 | 100.0% |
Housing Structures by Occupancy in Trimble
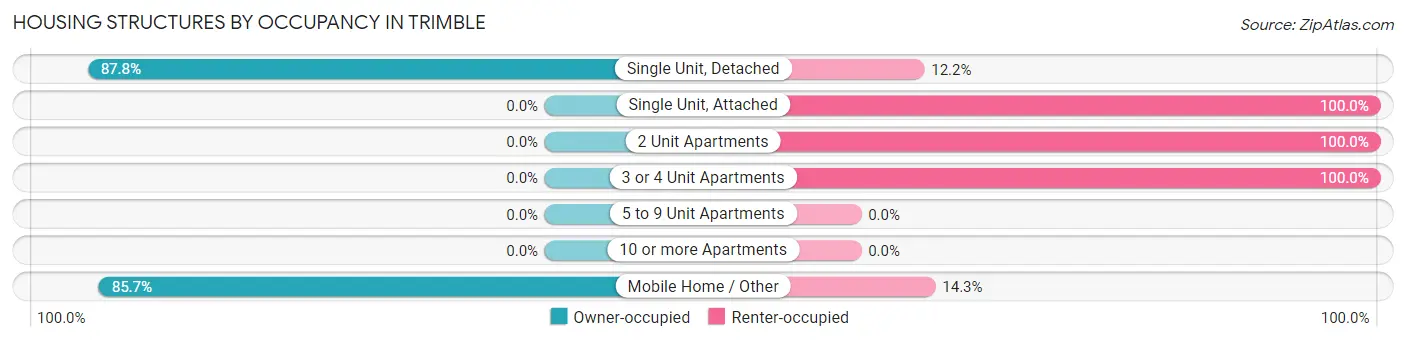
| Structure Type | Owner-occupied | Renter-occupied |
| Single Unit, Detached | 130 (87.8%) | 18 (12.2%) |
| Single Unit, Attached | 0 (0.0%) | 2 (100.0%) |
| 2 Unit Apartments | 0 (0.0%) | 20 (100.0%) |
| 3 or 4 Unit Apartments | 0 (0.0%) | 10 (100.0%) |
| 5 to 9 Unit Apartments | 0 (0.0%) | 0 (0.0%) |
| 10 or more Apartments | 0 (0.0%) | 0 (0.0%) |
| Mobile Home / Other | 24 (85.7%) | 4 (14.3%) |
| Total | 154 (74.0%) | 54 (26.0%) |
Housing Structures by Number of Rooms in Trimble
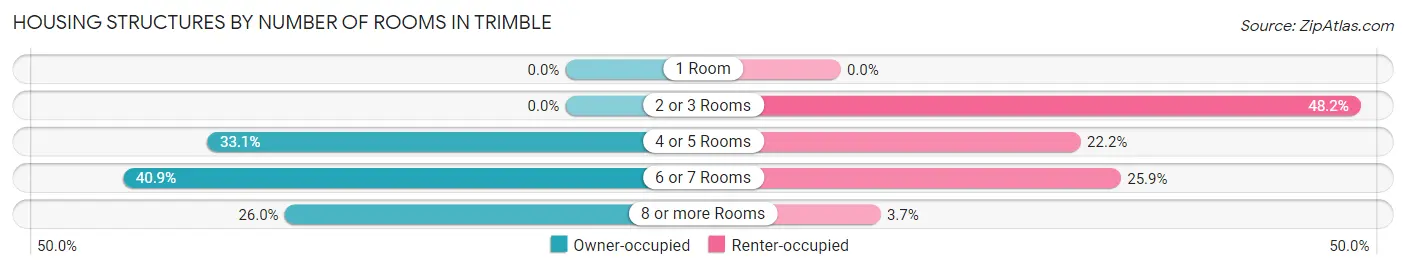
| Number of Rooms | Owner-occupied | Renter-occupied |
| 1 Room | 0 (0.0%) | 0 (0.0%) |
| 2 or 3 Rooms | 0 (0.0%) | 26 (48.1%) |
| 4 or 5 Rooms | 51 (33.1%) | 12 (22.2%) |
| 6 or 7 Rooms | 63 (40.9%) | 14 (25.9%) |
| 8 or more Rooms | 40 (26.0%) | 2 (3.7%) |
| Total | 154 (100.0%) | 54 (100.0%) |
Housing Structure by Heating Type in Trimble
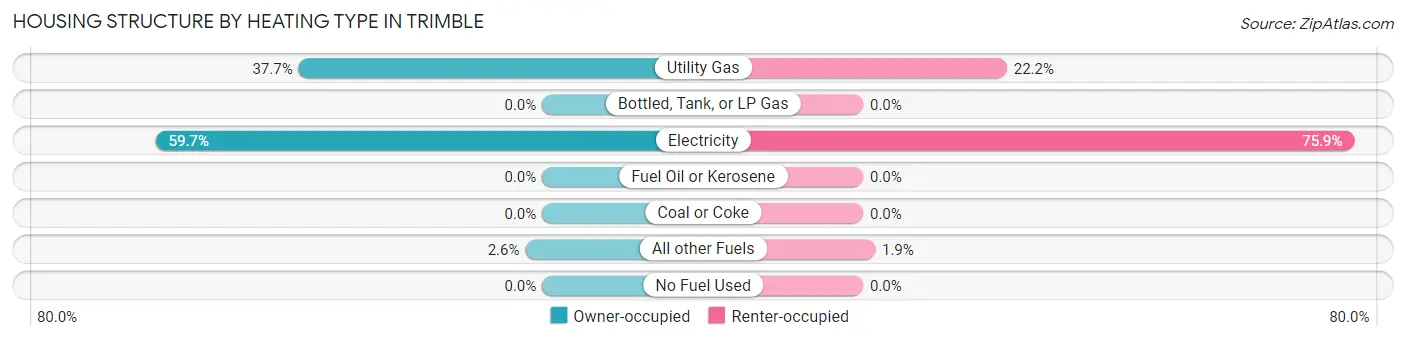
| Heating Type | Owner-occupied | Renter-occupied |
| Utility Gas | 58 (37.7%) | 12 (22.2%) |
| Bottled, Tank, or LP Gas | 0 (0.0%) | 0 (0.0%) |
| Electricity | 92 (59.7%) | 41 (75.9%) |
| Fuel Oil or Kerosene | 0 (0.0%) | 0 (0.0%) |
| Coal or Coke | 0 (0.0%) | 0 (0.0%) |
| All other Fuels | 4 (2.6%) | 1 (1.8%) |
| No Fuel Used | 0 (0.0%) | 0 (0.0%) |
| Total | 154 (100.0%) | 54 (100.0%) |
Household Vehicle Usage in Trimble
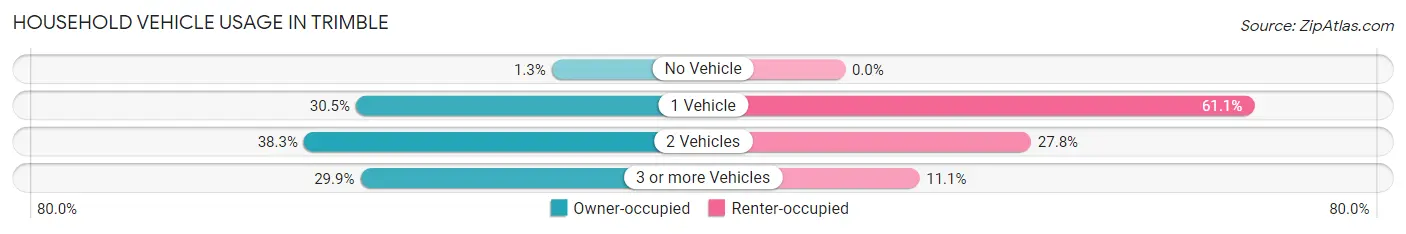
| Vehicles per Household | Owner-occupied | Renter-occupied |
| No Vehicle | 2 (1.3%) | 0 (0.0%) |
| 1 Vehicle | 47 (30.5%) | 33 (61.1%) |
| 2 Vehicles | 59 (38.3%) | 15 (27.8%) |
| 3 or more Vehicles | 46 (29.9%) | 6 (11.1%) |
| Total | 154 (100.0%) | 54 (100.0%) |
Real Estate & Mortgages in Trimble
Real Estate and Mortgage Overview in Trimble
| Characteristic | Without Mortgage | With Mortgage |
| Housing Units | 82 | 72 |
| Median Property Value | $59,300 | $74,100 |
| Median Household Income | $36,667 | $0 |
| Monthly Housing Costs | $320 | $0 |
| Real Estate Taxes | $592 | $0 |
Property Value by Mortgage Status in Trimble
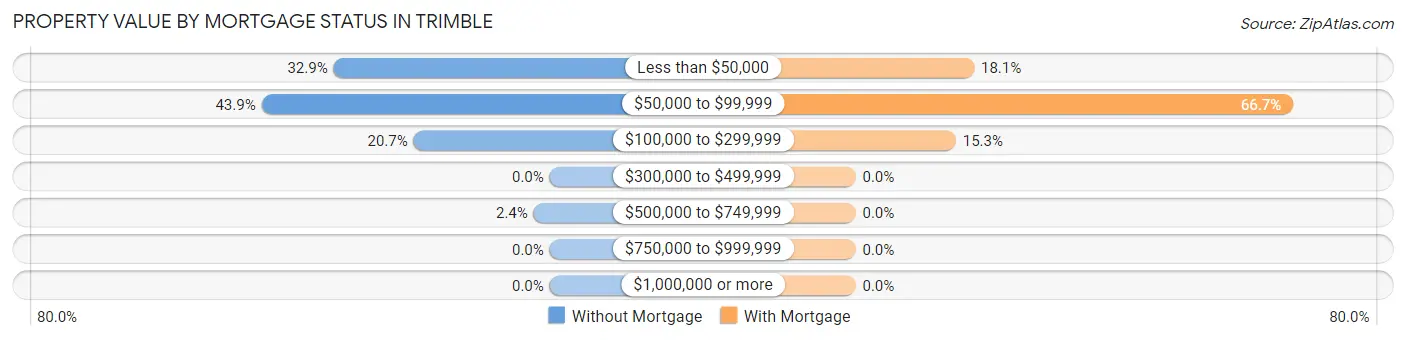
| Property Value | Without Mortgage | With Mortgage |
| Less than $50,000 | 27 (32.9%) | 13 (18.1%) |
| $50,000 to $99,999 | 36 (43.9%) | 48 (66.7%) |
| $100,000 to $299,999 | 17 (20.7%) | 11 (15.3%) |
| $300,000 to $499,999 | 0 (0.0%) | 0 (0.0%) |
| $500,000 to $749,999 | 2 (2.4%) | 0 (0.0%) |
| $750,000 to $999,999 | 0 (0.0%) | 0 (0.0%) |
| $1,000,000 or more | 0 (0.0%) | 0 (0.0%) |
| Total | 82 (100.0%) | 72 (100.0%) |
Household Income by Mortgage Status in Trimble
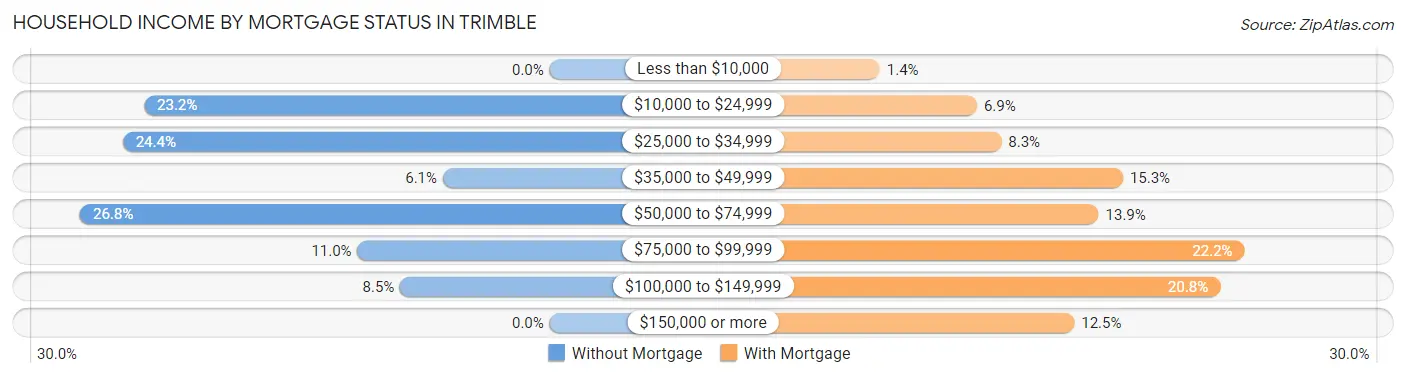
| Household Income | Without Mortgage | With Mortgage |
| Less than $10,000 | 0 (0.0%) | 1 (1.4%) |
| $10,000 to $24,999 | 19 (23.2%) | 5 (6.9%) |
| $25,000 to $34,999 | 20 (24.4%) | 6 (8.3%) |
| $35,000 to $49,999 | 5 (6.1%) | 11 (15.3%) |
| $50,000 to $74,999 | 22 (26.8%) | 10 (13.9%) |
| $75,000 to $99,999 | 9 (11.0%) | 16 (22.2%) |
| $100,000 to $149,999 | 7 (8.5%) | 15 (20.8%) |
| $150,000 or more | 0 (0.0%) | 9 (12.5%) |
| Total | 82 (100.0%) | 72 (100.0%) |
Property Value to Household Income Ratio in Trimble
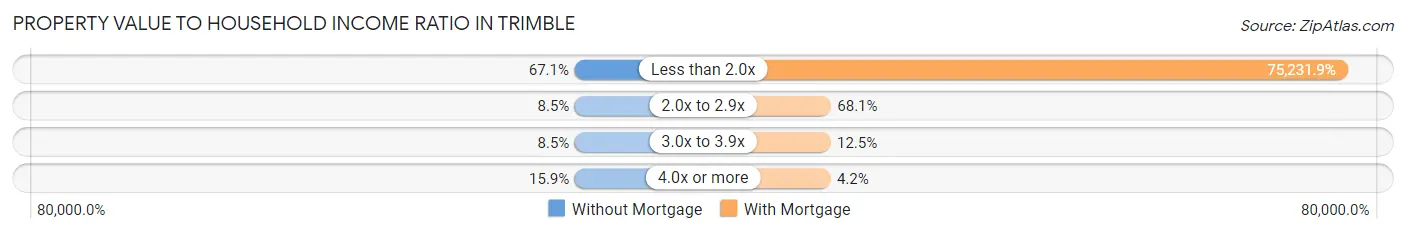
| Value-to-Income Ratio | Without Mortgage | With Mortgage |
| Less than 2.0x | 55 (67.1%) | 54,167 (75,231.9%) |
| 2.0x to 2.9x | 7 (8.5%) | 49 (68.1%) |
| 3.0x to 3.9x | 7 (8.5%) | 9 (12.5%) |
| 4.0x or more | 13 (15.9%) | 3 (4.2%) |
| Total | 82 (100.0%) | 72 (100.0%) |
Real Estate Taxes by Mortgage Status in Trimble
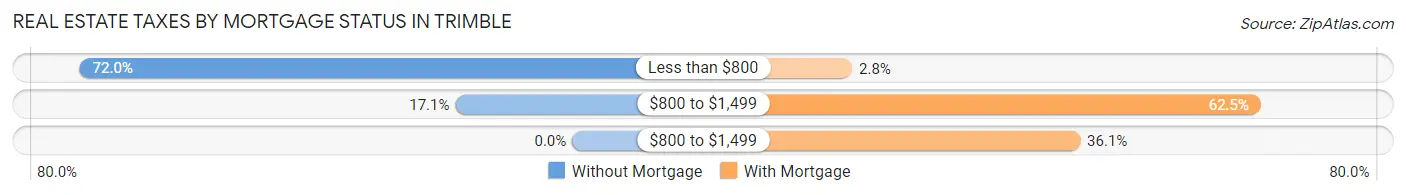
| Property Taxes | Without Mortgage | With Mortgage |
| Less than $800 | 59 (72.0%) | 2 (2.8%) |
| $800 to $1,499 | 14 (17.1%) | 45 (62.5%) |
| $800 to $1,499 | 0 (0.0%) | 26 (36.1%) |
| Total | 82 (100.0%) | 72 (100.0%) |
Health & Disability in Trimble
Health Insurance Coverage by Age in Trimble
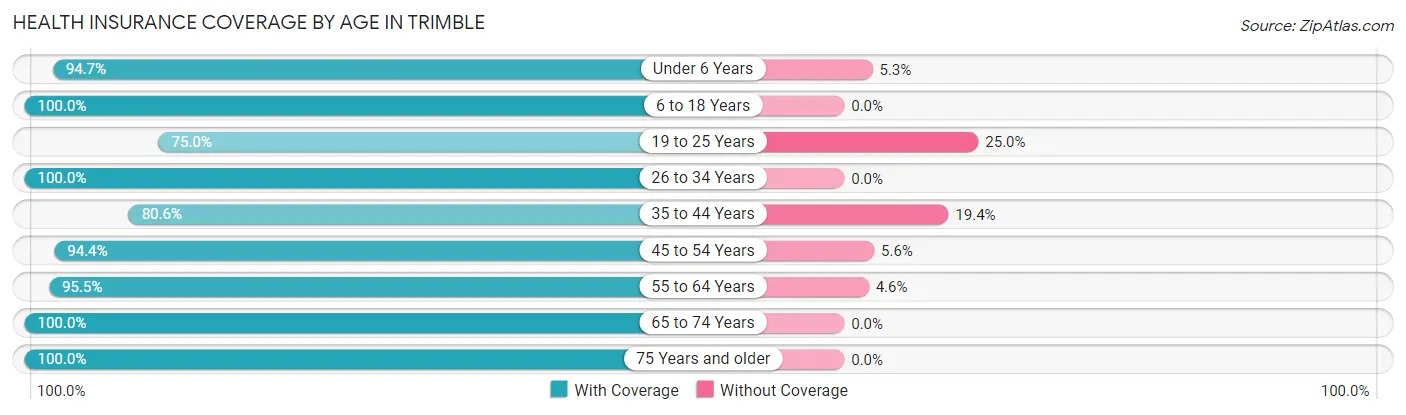
| Age Bracket | With Coverage | Without Coverage |
| Under 6 Years | 36 (94.7%) | 2 (5.3%) |
| 6 to 18 Years | 135 (100.0%) | 0 (0.0%) |
| 19 to 25 Years | 36 (75.0%) | 12 (25.0%) |
| 26 to 34 Years | 32 (100.0%) | 0 (0.0%) |
| 35 to 44 Years | 112 (80.6%) | 27 (19.4%) |
| 45 to 54 Years | 34 (94.4%) | 2 (5.6%) |
| 55 to 64 Years | 84 (95.5%) | 4 (4.5%) |
| 65 to 74 Years | 57 (100.0%) | 0 (0.0%) |
| 75 Years and older | 37 (100.0%) | 0 (0.0%) |
| Total | 563 (92.3%) | 47 (7.7%) |
Health Insurance Coverage by Citizenship Status in Trimble
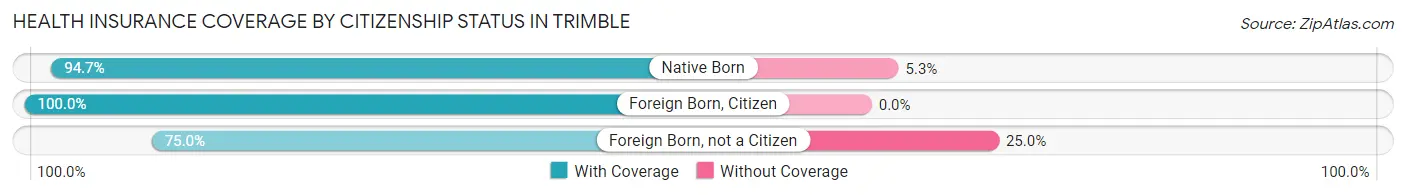
| Citizenship Status | With Coverage | Without Coverage |
| Native Born | 36 (94.7%) | 2 (5.3%) |
| Foreign Born, Citizen | 135 (100.0%) | 0 (0.0%) |
| Foreign Born, not a Citizen | 36 (75.0%) | 12 (25.0%) |
Health Insurance Coverage by Household Income in Trimble
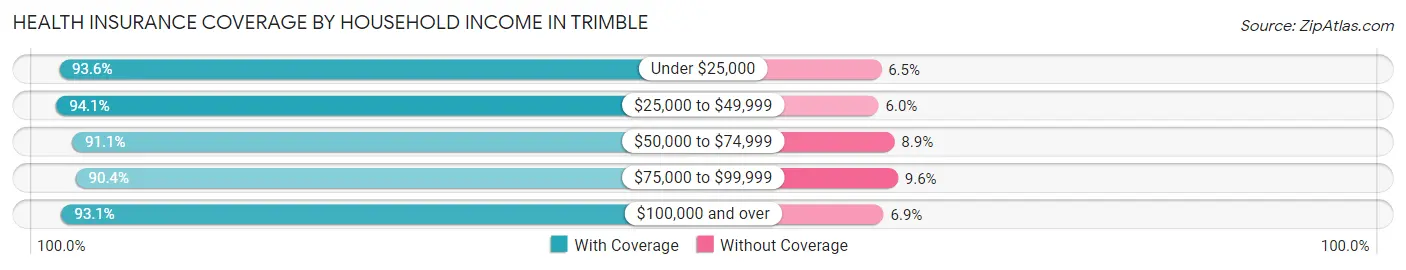
| Household Income | With Coverage | Without Coverage |
| Under $25,000 | 58 (93.5%) | 4 (6.5%) |
| $25,000 to $49,999 | 158 (94.1%) | 10 (5.9%) |
| $50,000 to $74,999 | 143 (91.1%) | 14 (8.9%) |
| $75,000 to $99,999 | 123 (90.4%) | 13 (9.6%) |
| $100,000 and over | 81 (93.1%) | 6 (6.9%) |
Public vs Private Health Insurance Coverage by Age in Trimble
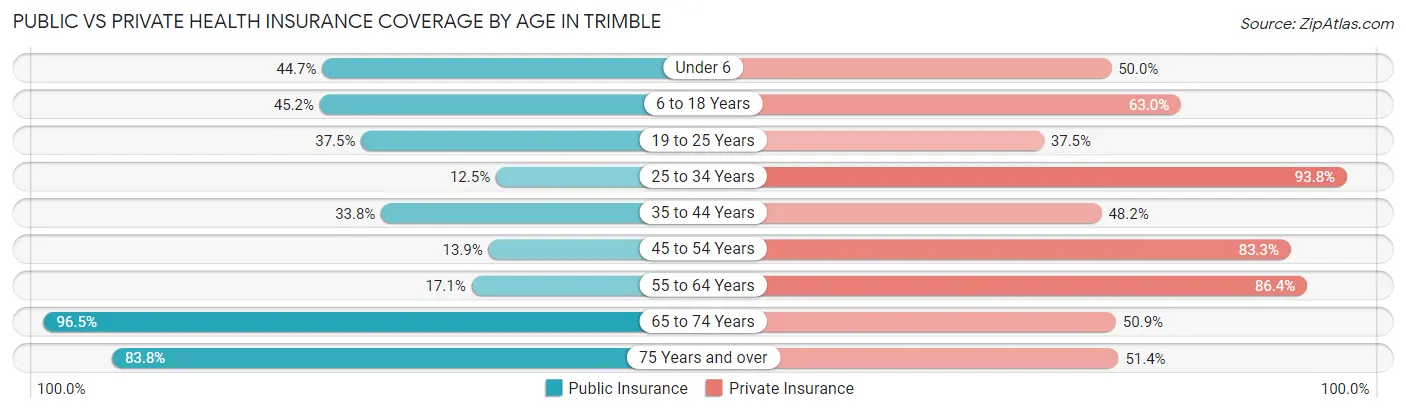
| Age Bracket | Public Insurance | Private Insurance |
| Under 6 | 17 (44.7%) | 19 (50.0%) |
| 6 to 18 Years | 61 (45.2%) | 85 (63.0%) |
| 19 to 25 Years | 18 (37.5%) | 18 (37.5%) |
| 25 to 34 Years | 4 (12.5%) | 30 (93.8%) |
| 35 to 44 Years | 47 (33.8%) | 67 (48.2%) |
| 45 to 54 Years | 5 (13.9%) | 30 (83.3%) |
| 55 to 64 Years | 15 (17.1%) | 76 (86.4%) |
| 65 to 74 Years | 55 (96.5%) | 29 (50.9%) |
| 75 Years and over | 31 (83.8%) | 19 (51.3%) |
| Total | 253 (41.5%) | 373 (61.2%) |
Disability Status by Sex by Age in Trimble
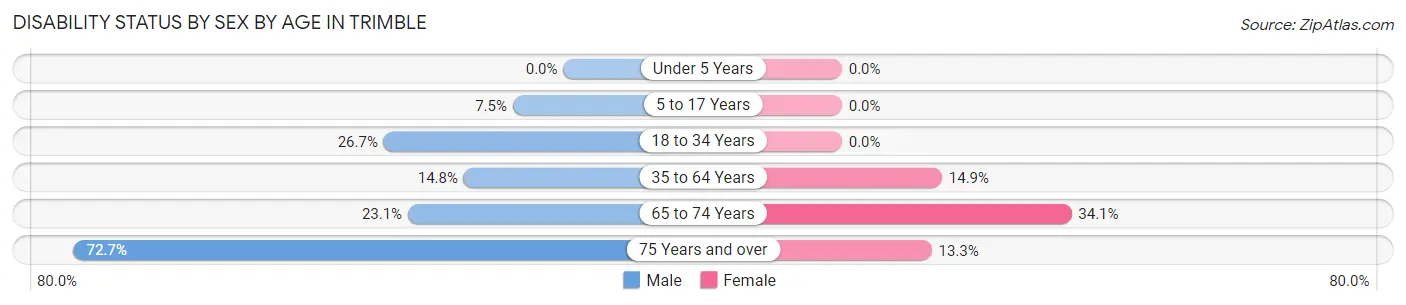
| Age Bracket | Male | Female |
| Under 5 Years | 0 (0.0%) | 0 (0.0%) |
| 5 to 17 Years | 3 (7.5%) | 0 (0.0%) |
| 18 to 34 Years | 8 (26.7%) | 0 (0.0%) |
| 35 to 64 Years | 17 (14.8%) | 22 (14.9%) |
| 65 to 74 Years | 3 (23.1%) | 15 (34.1%) |
| 75 Years and over | 16 (72.7%) | 2 (13.3%) |
Disability Class by Sex by Age in Trimble
Disability Class: Hearing Difficulty
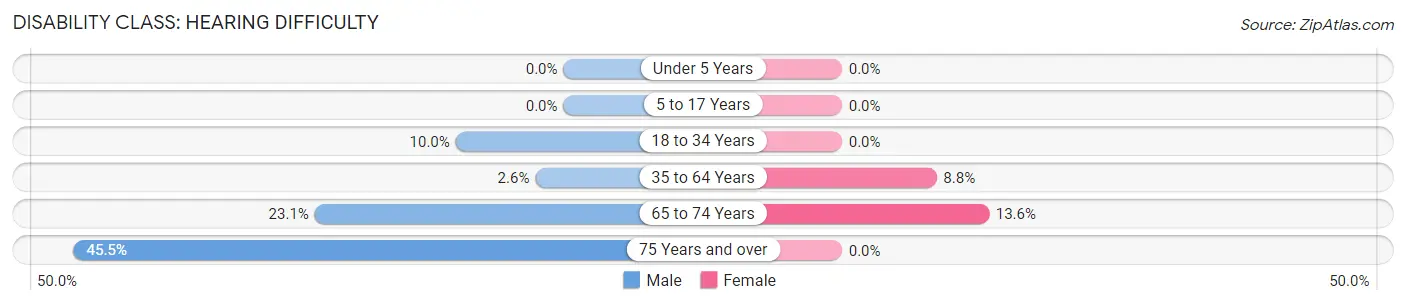
| Age Bracket | Male | Female |
| Under 5 Years | 0 (0.0%) | 0 (0.0%) |
| 5 to 17 Years | 0 (0.0%) | 0 (0.0%) |
| 18 to 34 Years | 3 (10.0%) | 0 (0.0%) |
| 35 to 64 Years | 3 (2.6%) | 13 (8.8%) |
| 65 to 74 Years | 3 (23.1%) | 6 (13.6%) |
| 75 Years and over | 10 (45.5%) | 0 (0.0%) |
Disability Class: Vision Difficulty
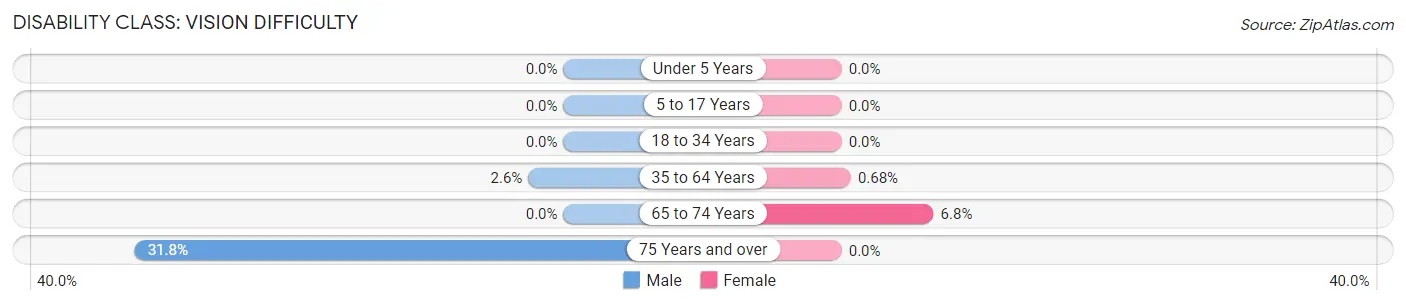
| Age Bracket | Male | Female |
| Under 5 Years | 0 (0.0%) | 0 (0.0%) |
| 5 to 17 Years | 0 (0.0%) | 0 (0.0%) |
| 18 to 34 Years | 0 (0.0%) | 0 (0.0%) |
| 35 to 64 Years | 3 (2.6%) | 1 (0.7%) |
| 65 to 74 Years | 0 (0.0%) | 3 (6.8%) |
| 75 Years and over | 7 (31.8%) | 0 (0.0%) |
Disability Class: Cognitive Difficulty
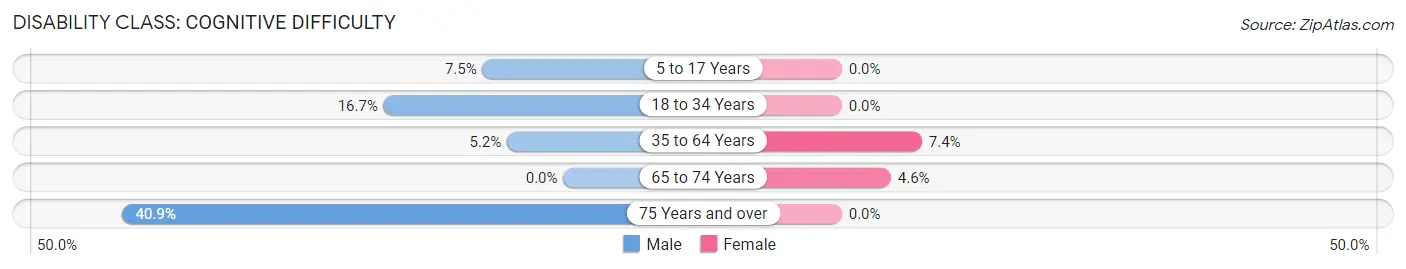
| Age Bracket | Male | Female |
| 5 to 17 Years | 3 (7.5%) | 0 (0.0%) |
| 18 to 34 Years | 5 (16.7%) | 0 (0.0%) |
| 35 to 64 Years | 6 (5.2%) | 11 (7.4%) |
| 65 to 74 Years | 0 (0.0%) | 2 (4.5%) |
| 75 Years and over | 9 (40.9%) | 0 (0.0%) |
Disability Class: Ambulatory Difficulty
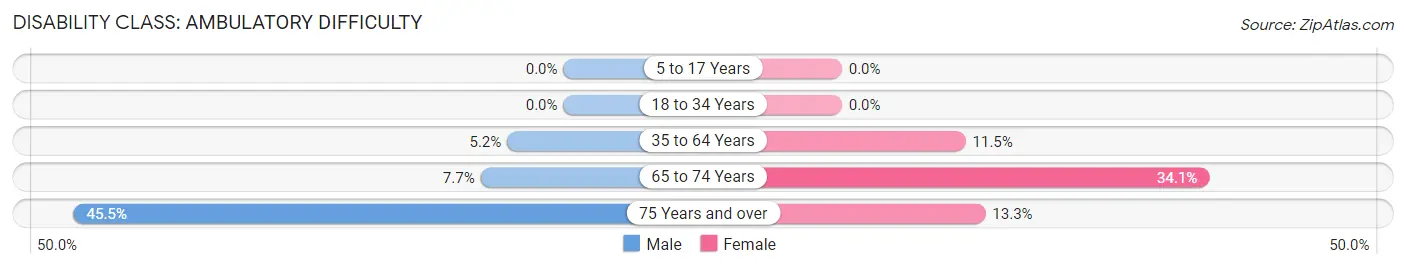
| Age Bracket | Male | Female |
| 5 to 17 Years | 0 (0.0%) | 0 (0.0%) |
| 18 to 34 Years | 0 (0.0%) | 0 (0.0%) |
| 35 to 64 Years | 6 (5.2%) | 17 (11.5%) |
| 65 to 74 Years | 1 (7.7%) | 15 (34.1%) |
| 75 Years and over | 10 (45.5%) | 2 (13.3%) |
Disability Class: Self-Care Difficulty
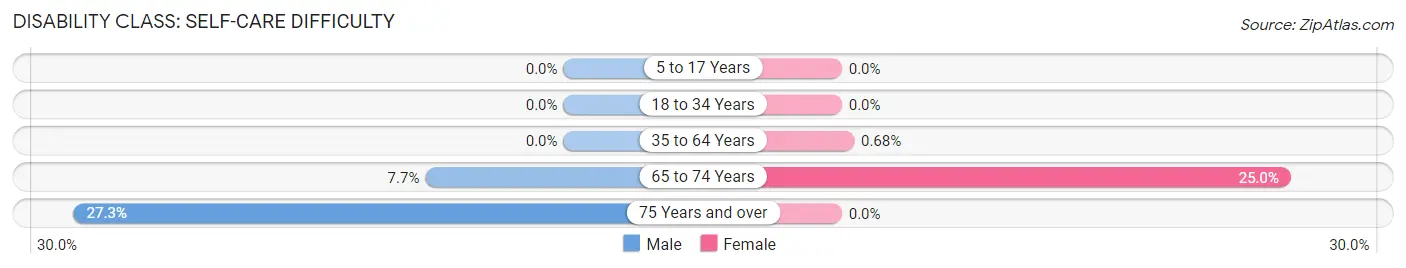
| Age Bracket | Male | Female |
| 5 to 17 Years | 0 (0.0%) | 0 (0.0%) |
| 18 to 34 Years | 0 (0.0%) | 0 (0.0%) |
| 35 to 64 Years | 0 (0.0%) | 1 (0.7%) |
| 65 to 74 Years | 1 (7.7%) | 11 (25.0%) |
| 75 Years and over | 6 (27.3%) | 0 (0.0%) |
Technology Access in Trimble
Computing Device Access in Trimble
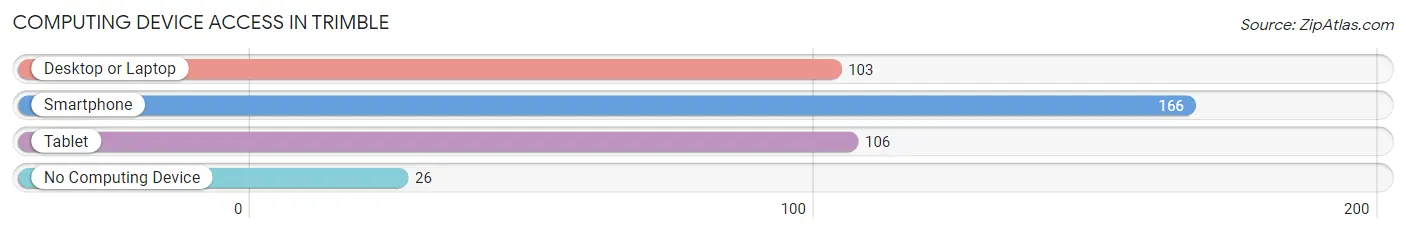
| Device Type | # Households | % Households |
| Desktop or Laptop | 103 | 49.5% |
| Smartphone | 166 | 79.8% |
| Tablet | 106 | 51.0% |
| No Computing Device | 26 | 12.5% |
| Total | 208 | 100.0% |
Internet Access in Trimble
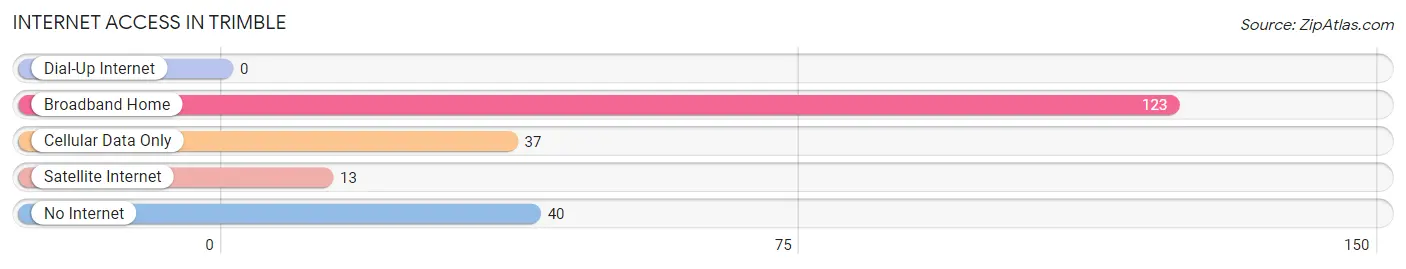
| Internet Type | # Households | % Households |
| Dial-Up Internet | 0 | 0.0% |
| Broadband Home | 123 | 59.1% |
| Cellular Data Only | 37 | 17.8% |
| Satellite Internet | 13 | 6.2% |
| No Internet | 40 | 19.2% |
| Total | 208 | 100.0% |
Trimble Summary
Trimble, Tennessee is a small town located in the western part of the state, in the foothills of the Appalachian Mountains. It is situated in the county of Dyer, and is part of the Jackson metropolitan area. The town has a population of approximately 1,500 people, and is known for its rural charm and friendly atmosphere.
History
Trimble was founded in 1845 by a group of settlers from North Carolina. The town was named after a local family, the Trimbles, who had settled in the area in the early 1800s. The town was originally a farming community, and the main crops grown were cotton, corn, and tobacco. In the late 1800s, the town began to grow and develop, and by the early 1900s, it had become a thriving community.
The town was home to several businesses, including a general store, a blacksmith shop, and a sawmill. In the early 1900s, the town also had a post office, a bank, and a hotel. The town was also home to several churches, including the First Baptist Church, which was founded in 1845.
Geography
Trimble is located in the western part of Tennessee, in the foothills of the Appalachian Mountains. The town is situated in the county of Dyer, and is part of the Jackson metropolitan area. The town is located about 30 miles east of Memphis, and about 50 miles west of Nashville.
The town is situated on the banks of the Obion River, and is surrounded by rolling hills and forests. The town is located at an elevation of about 500 feet above sea level. The climate in Trimble is humid subtropical, with hot summers and mild winters.
Economy
Trimble’s economy is largely based on agriculture. The town is home to several farms, which produce a variety of crops, including corn, soybeans, cotton, and tobacco. The town is also home to several small businesses, including a general store, a hardware store, and a restaurant.
The town is also home to several manufacturing companies, which produce a variety of products, including furniture, clothing, and automotive parts. The town is also home to several service-based businesses, including a bank, a post office, and a hotel.
Demographics
As of the 2010 census, Trimble had a population of 1,500 people. The racial makeup of the town was 95.3% White, 2.7% African American, 0.3% Native American, 0.3% Asian, and 1.3% from other races. The median household income in Trimble was $35,000, and the median age was 38.
Trimble is a small, rural town with a friendly atmosphere and a strong sense of community. The town is home to several churches, and is known for its strong religious values. The town is also home to several schools, including a public elementary school, a middle school, and a high school.
Common Questions
What is Per Capita Income in Trimble?
Per Capita income in Trimble is $20,516.
What is the Median Family Income in Trimble?
Median Family Income in Trimble is $56,458.
What is the Median Household income in Trimble?
Median Household Income in Trimble is $50,625.
What is Income or Wage Gap in Trimble?
Income or Wage Gap in Trimble is 46.3%.
Women in Trimble earn 53.7 cents for every dollar earned by a man.
What is Family Income Deficit in Trimble?
Family Income Deficit in Trimble is $8,823.
Families that are below poverty line in Trimble earn $8,823 less on average than the poverty threshold level.
What is Inequality or Gini Index in Trimble?
Inequality or Gini Index in Trimble is 0.33.
What is the Total Population of Trimble?
Total Population of Trimble is 610.
What is the Total Male Population of Trimble?
Total Male Population of Trimble is 227.
What is the Total Female Population of Trimble?
Total Female Population of Trimble is 383.
What is the Ratio of Males per 100 Females in Trimble?
There are 59.27 Males per 100 Females in Trimble.
What is the Ratio of Females per 100 Males in Trimble?
There are 168.72 Females per 100 Males in Trimble.
What is the Median Population Age in Trimble?
Median Population Age in Trimble is 39.2 Years.
What is the Average Family Size in Trimble
Average Family Size in Trimble is 3.5 People.
What is the Average Household Size in Trimble
Average Household Size in Trimble is 2.9 People.
How Large is the Labor Force in Trimble?
There are 292 People in the Labor Forcein in Trimble.
What is the Percentage of People in the Labor Force in Trimble?
61.7% of People are in the Labor Force in Trimble.
What is the Unemployment Rate in Trimble?
Unemployment Rate in Trimble is 1.4%.