Tracy City, TN Map & Demographics
Tracy City Map
Tracy City Overview
$25,988
PER CAPITA INCOME
$84,688
AVG FAMILY INCOME
$56,481
AVG HOUSEHOLD INCOME
25.6%
WAGE / INCOME GAP [ % ]
74.4¢/ $1
WAGE / INCOME GAP [ $ ]
$7,583
FAMILY INCOME DEFICIT
0.46
INEQUALITY / GINI INDEX
2,008
TOTAL POPULATION
1,061
MALE POPULATION
947
FEMALE POPULATION
112.04
MALES / 100 FEMALES
89.26
FEMALES / 100 MALES
34.8
MEDIAN AGE
3.8
AVG FAMILY SIZE
3.2
AVG HOUSEHOLD SIZE
759
LABOR FORCE [ PEOPLE ]
52.8%
PERCENT IN LABOR FORCE
3.3%
UNEMPLOYMENT RATE
Tracy City Zip Codes
Tracy City Area Codes
Income in Tracy City
Income Overview in Tracy City
Per Capita Income in Tracy City is $25,988, while median incomes of families and households are $84,688 and $56,481 respectively.
| Characteristic | Number | Measure |
| Per Capita Income | 2,008 | $25,988 |
| Median Family Income | 446 | $84,688 |
| Mean Family Income | 446 | $93,511 |
| Median Household Income | 628 | $56,481 |
| Mean Household Income | 628 | $73,810 |
| Income Deficit | 446 | $7,583 |
| Wage / Income Gap (%) | 2,008 | 25.59% |
| Wage / Income Gap ($) | 2,008 | 74.41¢ per $1 |
| Gini / Inequality Index | 2,008 | 0.46 |
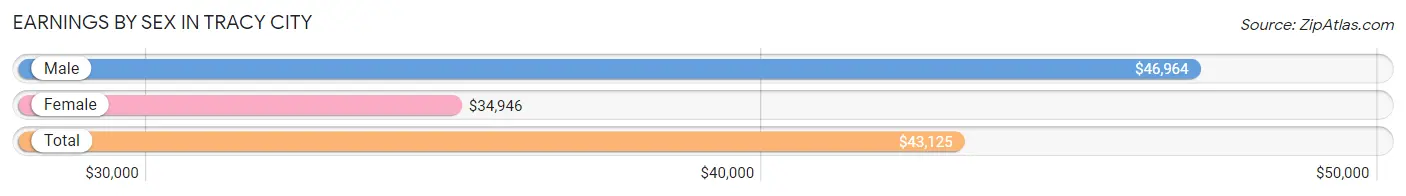
Earnings by Sex in Tracy City
Average Earnings in Tracy City are $43,125, $46,964 for men and $34,946 for women, a difference of 25.6%.
| Sex | Number | Average Earnings |
| Male | 489 (60.2%) | $46,964 |
| Female | 323 (39.8%) | $34,946 |
| Total | 812 (100.0%) | $43,125 |
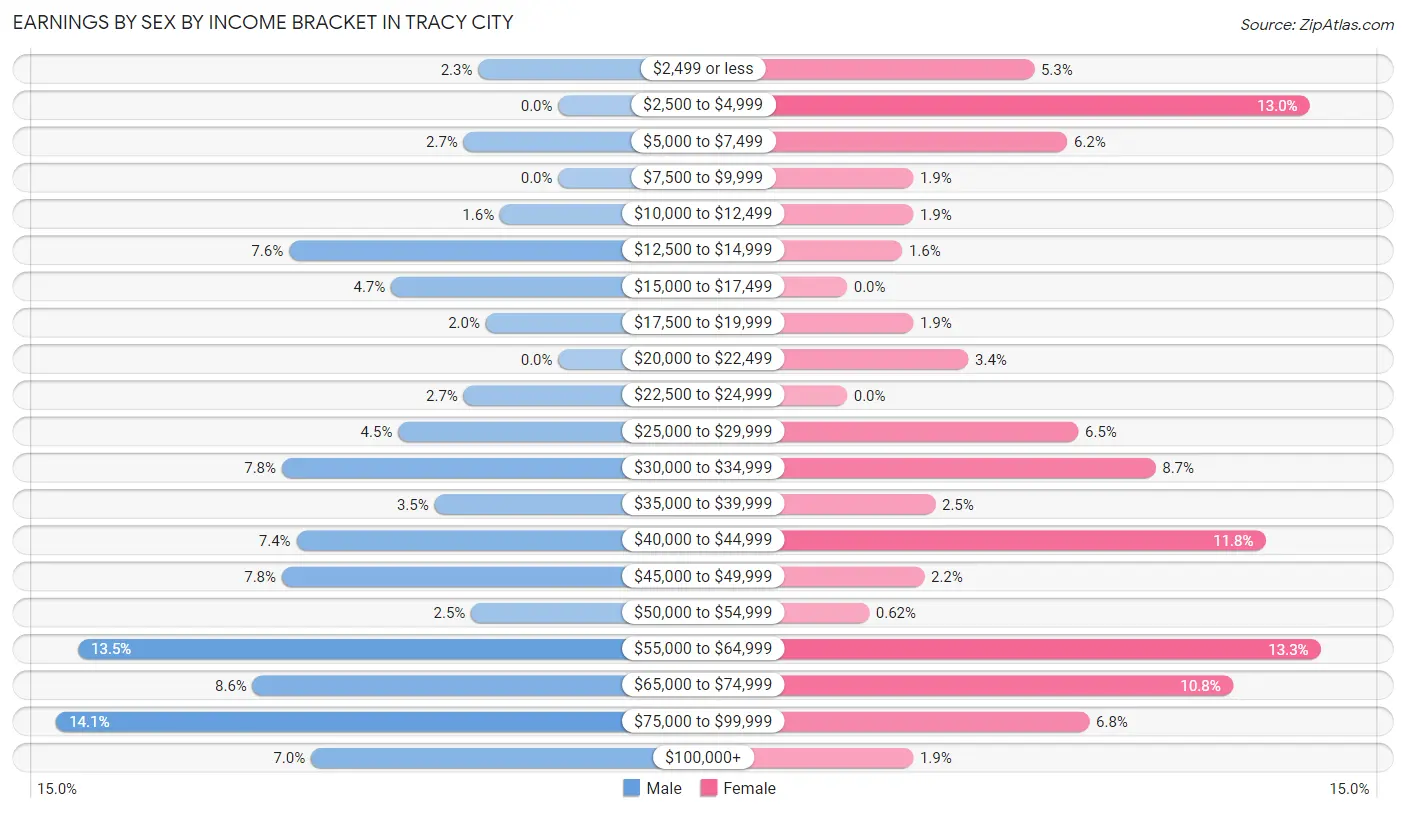
Earnings by Sex by Income Bracket in Tracy City
The most common earnings brackets in Tracy City are $75,000 to $99,999 for men (69 | 14.1%) and $55,000 to $64,999 for women (43 | 13.3%).
| Income | Male | Female |
| $2,499 or less | 11 (2.2%) | 17 (5.3%) |
| $2,500 to $4,999 | 0 (0.0%) | 42 (13.0%) |
| $5,000 to $7,499 | 13 (2.7%) | 20 (6.2%) |
| $7,500 to $9,999 | 0 (0.0%) | 6 (1.9%) |
| $10,000 to $12,499 | 8 (1.6%) | 6 (1.9%) |
| $12,500 to $14,999 | 37 (7.6%) | 5 (1.5%) |
| $15,000 to $17,499 | 23 (4.7%) | 0 (0.0%) |
| $17,500 to $19,999 | 10 (2.0%) | 6 (1.9%) |
| $20,000 to $22,499 | 0 (0.0%) | 11 (3.4%) |
| $22,500 to $24,999 | 13 (2.7%) | 0 (0.0%) |
| $25,000 to $29,999 | 22 (4.5%) | 21 (6.5%) |
| $30,000 to $34,999 | 38 (7.8%) | 28 (8.7%) |
| $35,000 to $39,999 | 17 (3.5%) | 8 (2.5%) |
| $40,000 to $44,999 | 36 (7.4%) | 38 (11.8%) |
| $45,000 to $49,999 | 38 (7.8%) | 7 (2.2%) |
| $50,000 to $54,999 | 12 (2.5%) | 2 (0.6%) |
| $55,000 to $64,999 | 66 (13.5%) | 43 (13.3%) |
| $65,000 to $74,999 | 42 (8.6%) | 35 (10.8%) |
| $75,000 to $99,999 | 69 (14.1%) | 22 (6.8%) |
| $100,000+ | 34 (7.0%) | 6 (1.9%) |
| Total | 489 (100.0%) | 323 (100.0%) |
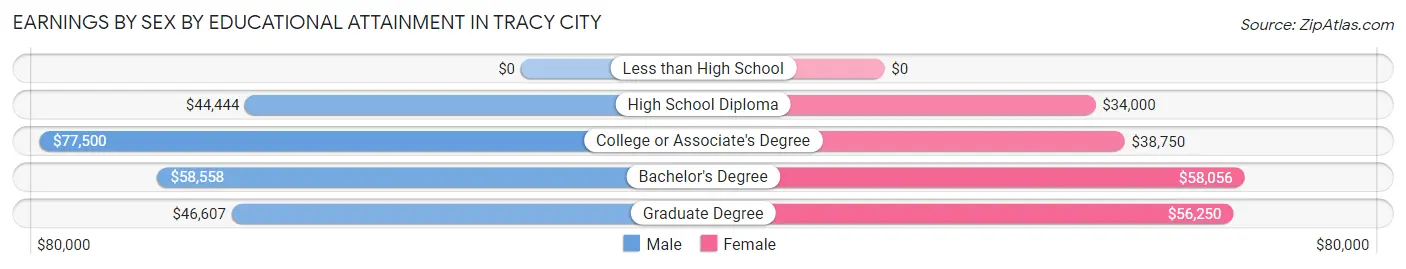
Earnings by Sex by Educational Attainment in Tracy City
Average earnings in Tracy City are $49,632 for men and $42,596 for women, a difference of 14.2%. Men with an educational attainment of college or associate's degree enjoy the highest average annual earnings of $77,500, while those with high school diploma education earn the least with $44,444. Women with an educational attainment of bachelor's degree earn the most with the average annual earnings of $58,056, while those with high school diploma education have the smallest earnings of $34,000.
| Educational Attainment | Male Income | Female Income |
| Less than High School | - | - |
| High School Diploma | $44,444 | $34,000 |
| College or Associate's Degree | $77,500 | $38,750 |
| Bachelor's Degree | $58,558 | $58,056 |
| Graduate Degree | $46,607 | $56,250 |
| Total | $49,632 | $42,596 |
Family Income in Tracy City
Family Income Brackets in Tracy City
According to the Tracy City family income data, there are 142 families falling into the $100,000 to $149,999 income range, which is the most common income bracket and makes up 31.8% of all families.
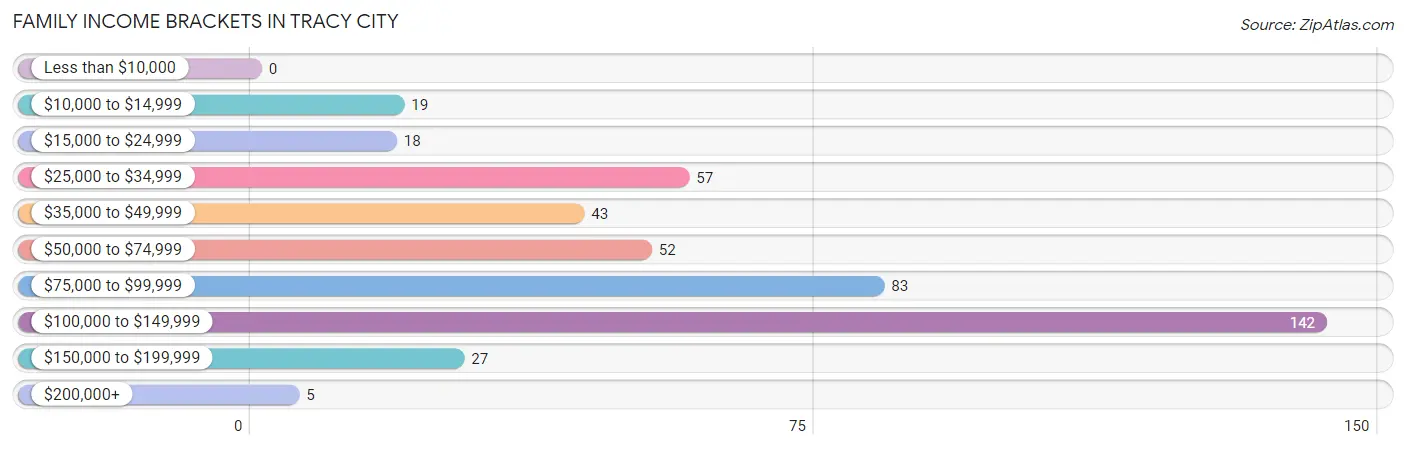
| Income Bracket | # Families | % Families |
| Less than $10,000 | 0 | 0.0% |
| $10,000 to $14,999 | 19 | 4.3% |
| $15,000 to $24,999 | 18 | 4.0% |
| $25,000 to $34,999 | 57 | 12.8% |
| $35,000 to $49,999 | 43 | 9.6% |
| $50,000 to $74,999 | 52 | 11.7% |
| $75,000 to $99,999 | 83 | 18.6% |
| $100,000 to $149,999 | 142 | 31.8% |
| $150,000 to $199,999 | 27 | 6.1% |
| $200,000+ | 5 | 1.1% |
Family Income by Famaliy Size in Tracy City
4-person families (47 | 10.5%) account for the highest median family income in Tracy City with $120,809 per family, while 3-person families (115 | 25.8%) have the highest median income of $34,329 per family member.
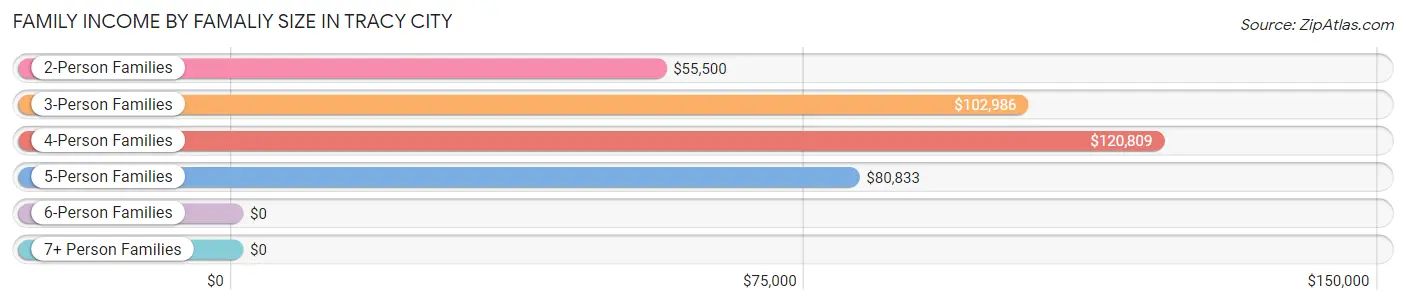
| Income Bracket | # Families | Median Income |
| 2-Person Families | 210 (47.1%) | $55,500 |
| 3-Person Families | 115 (25.8%) | $102,986 |
| 4-Person Families | 47 (10.5%) | $120,809 |
| 5-Person Families | 66 (14.8%) | $80,833 |
| 6-Person Families | 6 (1.3%) | $0 |
| 7+ Person Families | 2 (0.4%) | $0 |
| Total | 446 (100.0%) | $84,688 |
Family Income by Number of Earners in Tracy City
The median family income in Tracy City is $84,688, with families comprising 2 earners (209) having the highest median family income of $104,567, while families with no earners (65) have the lowest median family income of $29,135, accounting for 46.9% and 14.6% of families, respectively.
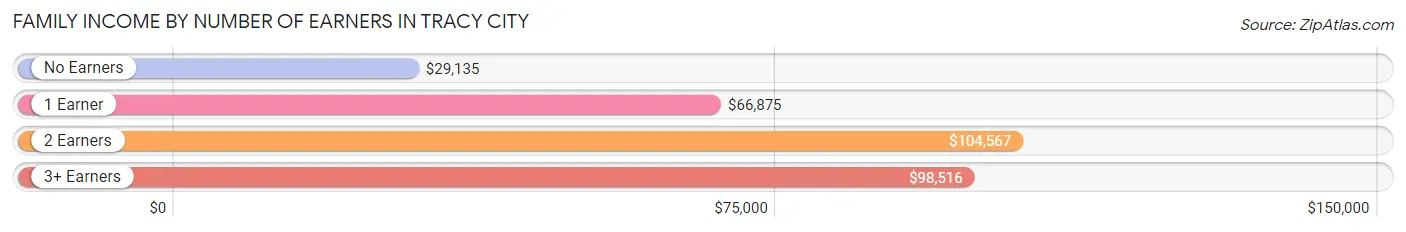
| Number of Earners | # Families | Median Income |
| No Earners | 65 (14.6%) | $29,135 |
| 1 Earner | 141 (31.6%) | $66,875 |
| 2 Earners | 209 (46.9%) | $104,567 |
| 3+ Earners | 31 (7.0%) | $98,516 |
| Total | 446 (100.0%) | $84,688 |
Household Income in Tracy City
Household Income Brackets in Tracy City
With 147 households falling in the category, the $100,000 to $149,999 income range is the most frequent in Tracy City, accounting for 23.4% of all households. In contrast, only 5 households (0.8%) fall into the $200,000+ income bracket, making it the least populous group.
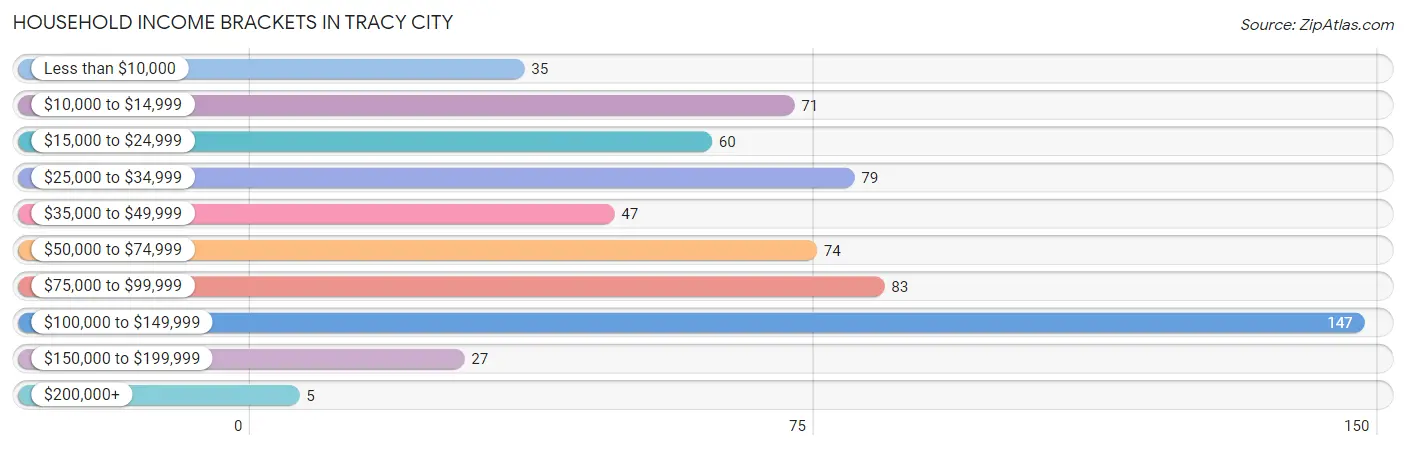
| Income Bracket | # Households | % Households |
| Less than $10,000 | 35 | 5.6% |
| $10,000 to $14,999 | 71 | 11.3% |
| $15,000 to $24,999 | 60 | 9.6% |
| $25,000 to $34,999 | 79 | 12.6% |
| $35,000 to $49,999 | 47 | 7.5% |
| $50,000 to $74,999 | 74 | 11.8% |
| $75,000 to $99,999 | 83 | 13.2% |
| $100,000 to $149,999 | 147 | 23.4% |
| $150,000 to $199,999 | 27 | 4.3% |
| $200,000+ | 5 | 0.8% |
Household Income by Householder Age in Tracy City
The median household income in Tracy City is $56,481, with the highest median household income of $98,879 found in the 25 to 44 years age bracket for the primary householder. A total of 190 households (30.2%) fall into this category. Meanwhile, the 65+ years age bracket for the primary householder has the lowest median household income of $32,870, with 228 households (36.3%) in this group.
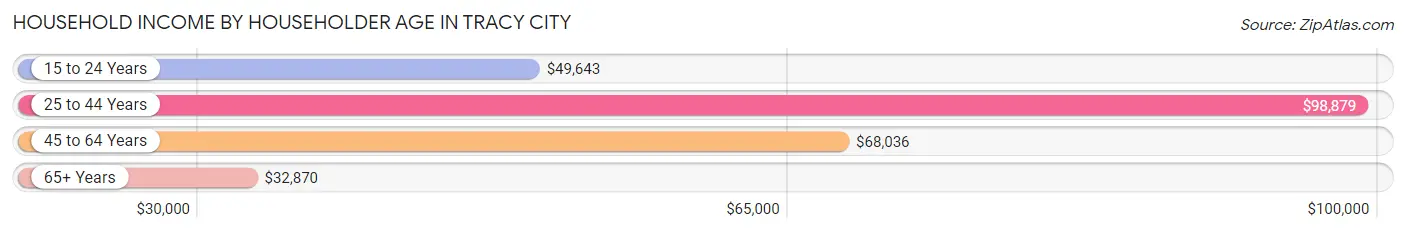
| Income Bracket | # Households | Median Income |
| 15 to 24 Years | 18 (2.9%) | $49,643 |
| 25 to 44 Years | 190 (30.2%) | $98,879 |
| 45 to 64 Years | 192 (30.6%) | $68,036 |
| 65+ Years | 228 (36.3%) | $32,870 |
| Total | 628 (100.0%) | $56,481 |
Poverty in Tracy City
Income Below Poverty by Sex and Age in Tracy City
With 14.0% poverty level for males and 15.8% for females among the residents of Tracy City, 12 to 14 year old males and 25 to 34 year old females are the most vulnerable to poverty, with 14 males (100.0%) and 28 females (43.1%) in their respective age groups living below the poverty level.
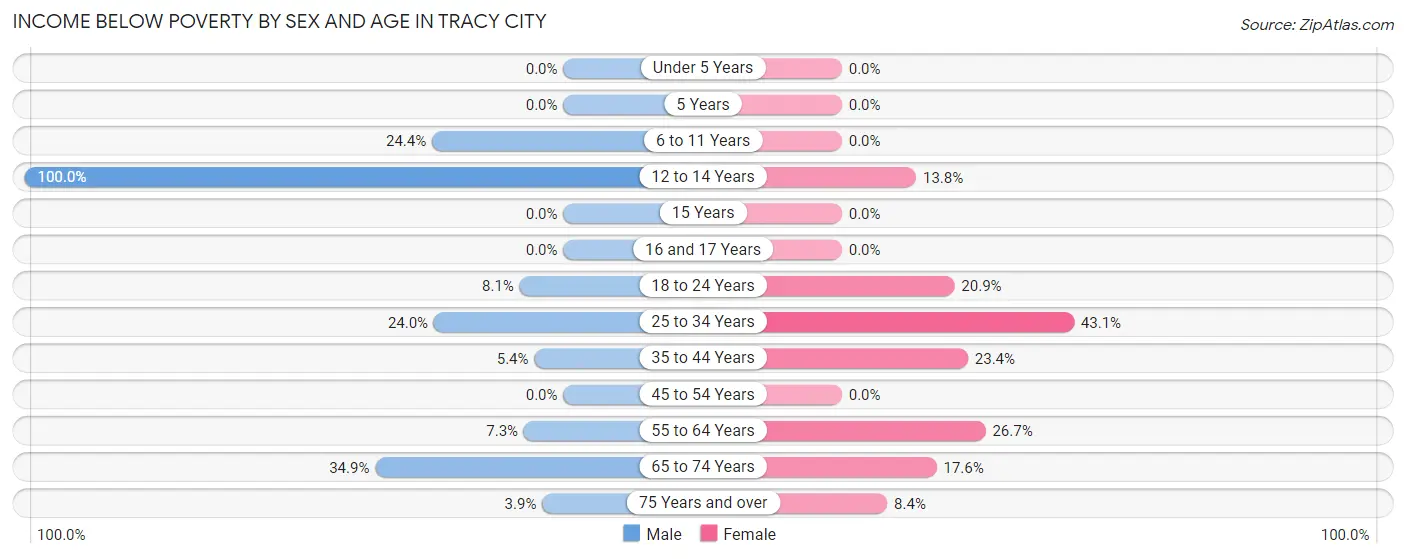
| Age Bracket | Male | Female |
| Under 5 Years | 0 (0.0%) | 0 (0.0%) |
| 5 Years | 0 (0.0%) | 0 (0.0%) |
| 6 to 11 Years | 39 (24.4%) | 0 (0.0%) |
| 12 to 14 Years | 14 (100.0%) | 8 (13.8%) |
| 15 Years | 0 (0.0%) | 0 (0.0%) |
| 16 and 17 Years | 0 (0.0%) | 0 (0.0%) |
| 18 to 24 Years | 9 (8.1%) | 14 (20.9%) |
| 25 to 34 Years | 43 (24.0%) | 28 (43.1%) |
| 35 to 44 Years | 7 (5.4%) | 33 (23.4%) |
| 45 to 54 Years | 0 (0.0%) | 0 (0.0%) |
| 55 to 64 Years | 9 (7.3%) | 36 (26.7%) |
| 65 to 74 Years | 22 (34.9%) | 16 (17.6%) |
| 75 Years and over | 2 (3.9%) | 8 (8.4%) |
| Total | 145 (14.0%) | 143 (15.8%) |
Income Above Poverty by Sex and Age in Tracy City
According to the poverty statistics in Tracy City, males aged under 5 years and females aged under 5 years are the age groups that are most secure financially, with 100.0% of males and 100.0% of females in these age groups living above the poverty line.
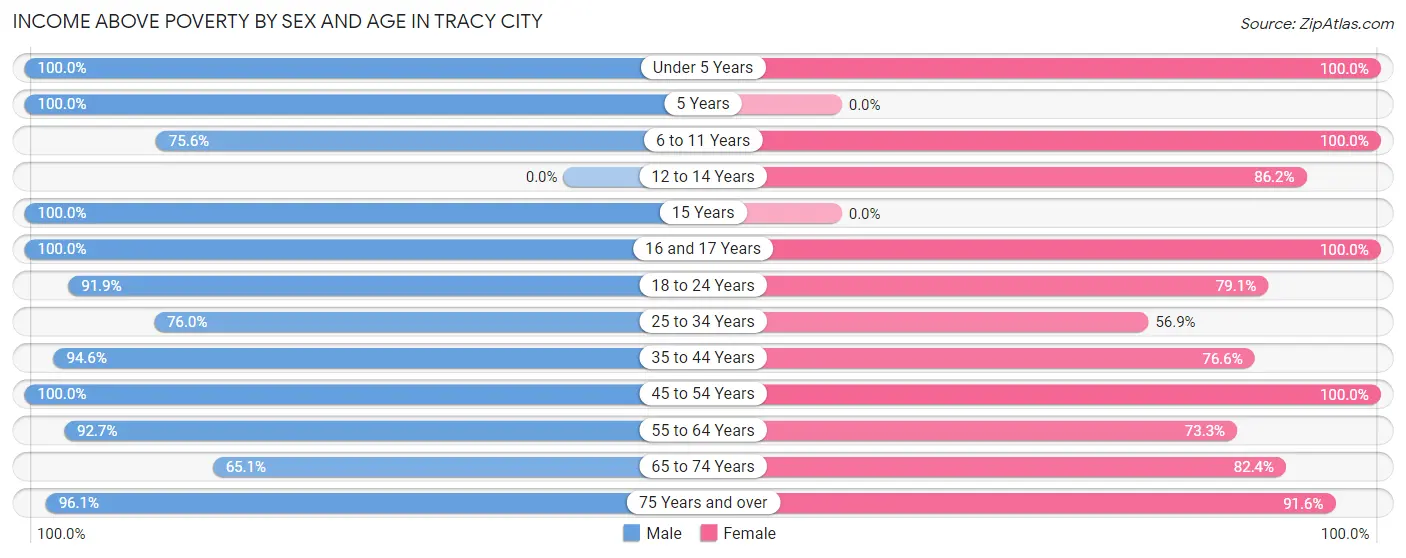
| Age Bracket | Male | Female |
| Under 5 Years | 71 (100.0%) | 107 (100.0%) |
| 5 Years | 33 (100.0%) | 0 (0.0%) |
| 6 to 11 Years | 121 (75.6%) | 59 (100.0%) |
| 12 to 14 Years | 0 (0.0%) | 50 (86.2%) |
| 15 Years | 3 (100.0%) | 0 (0.0%) |
| 16 and 17 Years | 4 (100.0%) | 13 (100.0%) |
| 18 to 24 Years | 102 (91.9%) | 53 (79.1%) |
| 25 to 34 Years | 136 (76.0%) | 37 (56.9%) |
| 35 to 44 Years | 123 (94.6%) | 108 (76.6%) |
| 45 to 54 Years | 94 (100.0%) | 76 (100.0%) |
| 55 to 64 Years | 114 (92.7%) | 99 (73.3%) |
| 65 to 74 Years | 41 (65.1%) | 75 (82.4%) |
| 75 Years and over | 49 (96.1%) | 87 (91.6%) |
| Total | 891 (86.0%) | 764 (84.2%) |
Income Below Poverty Among Married-Couple Families in Tracy City
The poverty statistics for married-couple families in Tracy City show that 5.0% or 16 of the total 319 families live below the poverty line. Families with 3 or 4 children have the highest poverty rate of 27.0%, comprising of 10 families. On the other hand, families with 1 or 2 children have the lowest poverty rate of 0.0%, which includes 0 families.
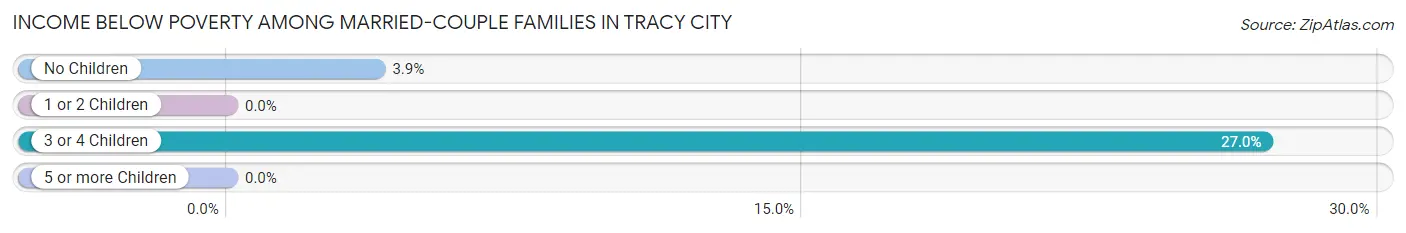
| Children | Above Poverty | Below Poverty |
| No Children | 150 (96.2%) | 6 (3.8%) |
| 1 or 2 Children | 126 (100.0%) | 0 (0.0%) |
| 3 or 4 Children | 27 (73.0%) | 10 (27.0%) |
| 5 or more Children | 0 (0.0%) | 0 (0.0%) |
| Total | 303 (95.0%) | 16 (5.0%) |
Income Below Poverty Among Single-Parent Households in Tracy City
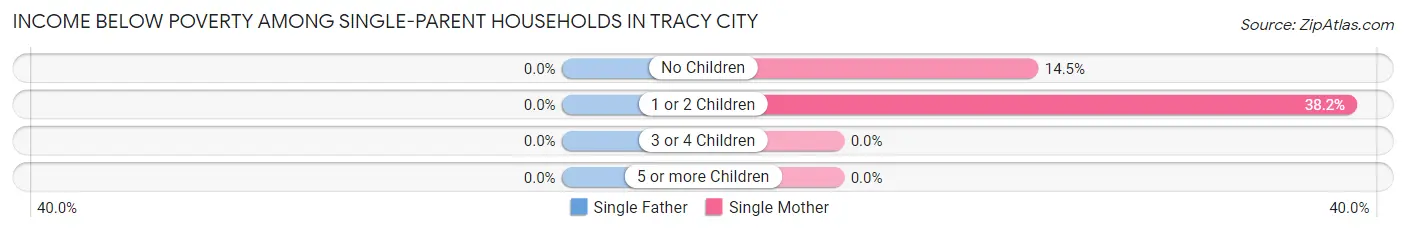
| Children | Single Father | Single Mother |
| No Children | 0 (0.0%) | 11 (14.5%) |
| 1 or 2 Children | 0 (0.0%) | 13 (38.2%) |
| 3 or 4 Children | 0 (0.0%) | 0 (0.0%) |
| 5 or more Children | 0 (0.0%) | 0 (0.0%) |
| Total | 0 (0.0%) | 24 (21.8%) |
Income Below Poverty Among Married-Couple vs Single-Parent Households in Tracy City
The poverty data for Tracy City shows that 16 of the married-couple family households (5.0%) and 24 of the single-parent households (18.9%) are living below the poverty level. Within the married-couple family households, those with 3 or 4 children have the highest poverty rate, with 10 households (27.0%) falling below the poverty line. Among the single-parent households, those with 1 or 2 children have the highest poverty rate, with 13 household (38.2%) living below poverty.
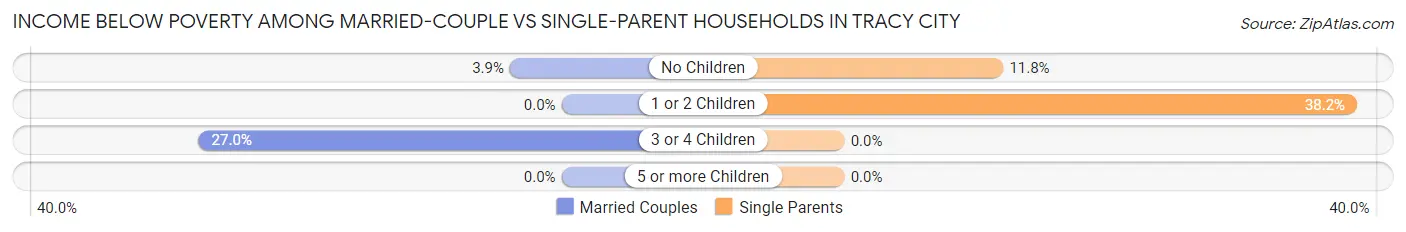
| Children | Married-Couple Families | Single-Parent Households |
| No Children | 6 (3.8%) | 11 (11.8%) |
| 1 or 2 Children | 0 (0.0%) | 13 (38.2%) |
| 3 or 4 Children | 10 (27.0%) | 0 (0.0%) |
| 5 or more Children | 0 (0.0%) | 0 (0.0%) |
| Total | 16 (5.0%) | 24 (18.9%) |
Race in Tracy City
The most populous races in Tracy City are White / Caucasian (1,899 | 94.6%), Two or more Races (101 | 5.0%), and Hispanic or Latino (32 | 1.6%).
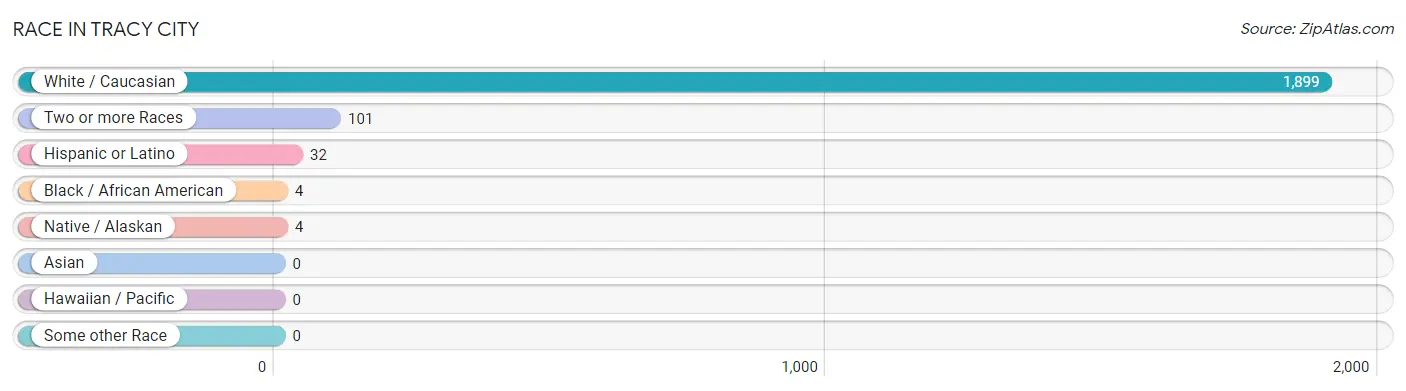
| Race | # Population | % Population |
| Asian | 0 | 0.0% |
| Black / African American | 4 | 0.2% |
| Hawaiian / Pacific | 0 | 0.0% |
| Hispanic or Latino | 32 | 1.6% |
| Native / Alaskan | 4 | 0.2% |
| White / Caucasian | 1,899 | 94.6% |
| Two or more Races | 101 | 5.0% |
| Some other Race | 0 | 0.0% |
| Total | 2,008 | 100.0% |
Ancestry in Tracy City
The most populous ancestries reported in Tracy City are English (229 | 11.4%), Irish (208 | 10.4%), German (202 | 10.1%), Scottish (115 | 5.7%), and American (109 | 5.4%), together accounting for 43.0% of all Tracy City residents.
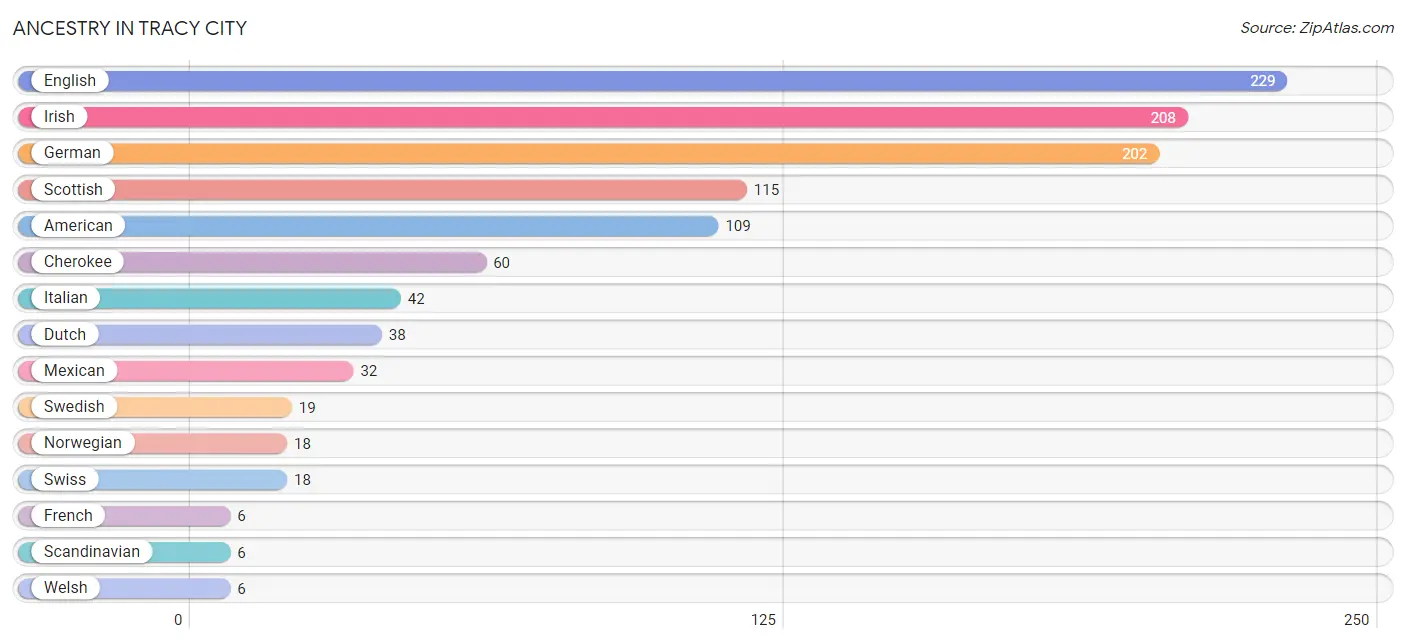
| Ancestry | # Population | % Population |
| American | 109 | 5.4% |
| Cherokee | 60 | 3.0% |
| Dutch | 38 | 1.9% |
| English | 229 | 11.4% |
| French | 6 | 0.3% |
| German | 202 | 10.1% |
| Irish | 208 | 10.4% |
| Italian | 42 | 2.1% |
| Mexican | 32 | 1.6% |
| Norwegian | 18 | 0.9% |
| Pennsylvania German | 3 | 0.2% |
| Polish | 2 | 0.1% |
| Scandinavian | 6 | 0.3% |
| Scotch-Irish | 3 | 0.2% |
| Scottish | 115 | 5.7% |
| Swedish | 19 | 0.9% |
| Swiss | 18 | 0.9% |
| Welsh | 6 | 0.3% | View All 18 Rows |
Immigrants in Tracy City

| Immigration Origin | # Population | % Population | View All 0 Rows |
Sex and Age in Tracy City
Sex and Age in Tracy City
The most populous age groups in Tracy City are 5 to 9 Years (146 | 13.8%) for men and Under 5 Years (107 | 11.3%) for women.
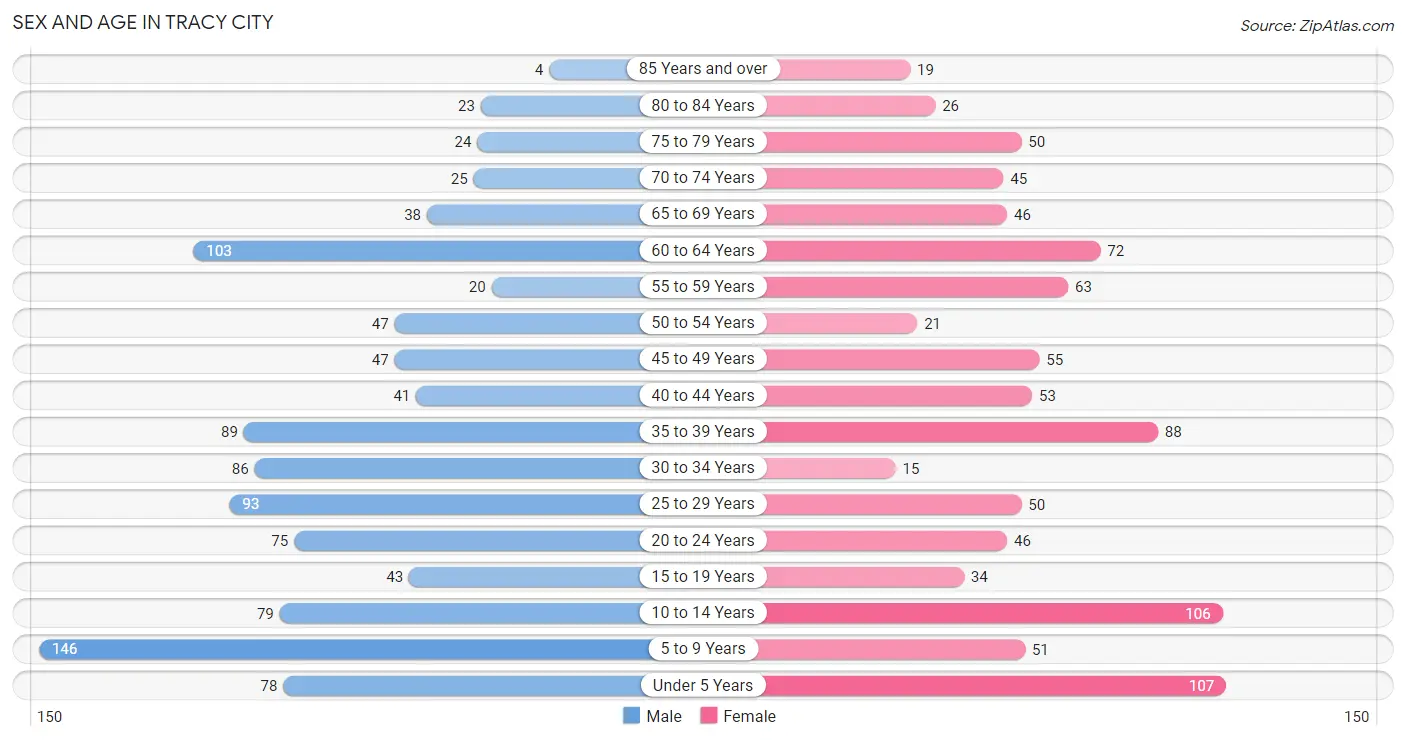
| Age Bracket | Male | Female |
| Under 5 Years | 78 (7.3%) | 107 (11.3%) |
| 5 to 9 Years | 146 (13.8%) | 51 (5.4%) |
| 10 to 14 Years | 79 (7.4%) | 106 (11.2%) |
| 15 to 19 Years | 43 (4.1%) | 34 (3.6%) |
| 20 to 24 Years | 75 (7.1%) | 46 (4.9%) |
| 25 to 29 Years | 93 (8.8%) | 50 (5.3%) |
| 30 to 34 Years | 86 (8.1%) | 15 (1.6%) |
| 35 to 39 Years | 89 (8.4%) | 88 (9.3%) |
| 40 to 44 Years | 41 (3.9%) | 53 (5.6%) |
| 45 to 49 Years | 47 (4.4%) | 55 (5.8%) |
| 50 to 54 Years | 47 (4.4%) | 21 (2.2%) |
| 55 to 59 Years | 20 (1.9%) | 63 (6.7%) |
| 60 to 64 Years | 103 (9.7%) | 72 (7.6%) |
| 65 to 69 Years | 38 (3.6%) | 46 (4.9%) |
| 70 to 74 Years | 25 (2.4%) | 45 (4.8%) |
| 75 to 79 Years | 24 (2.3%) | 50 (5.3%) |
| 80 to 84 Years | 23 (2.2%) | 26 (2.8%) |
| 85 Years and over | 4 (0.4%) | 19 (2.0%) |
| Total | 1,061 (100.0%) | 947 (100.0%) |
Families and Households in Tracy City
Median Family Size in Tracy City
The median family size in Tracy City is 3.79 persons per family, with married-couple families (319 | 71.5%) accounting for the largest median family size of 3.99 persons per family. On the other hand, single male/father families (17 | 3.8%) represent the smallest median family size with 2.71 persons per family.
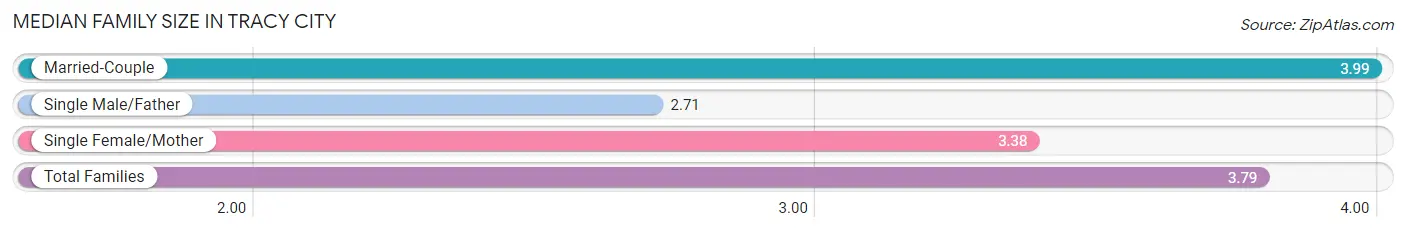
| Family Type | # Families | Family Size |
| Married-Couple | 319 (71.5%) | 3.99 |
| Single Male/Father | 17 (3.8%) | 2.71 |
| Single Female/Mother | 110 (24.7%) | 3.38 |
| Total Families | 446 (100.0%) | 3.79 |
Median Household Size in Tracy City
The median household size in Tracy City is 3.19 persons per household, with married-couple households (319 | 50.8%) accounting for the largest median household size of 4.08 persons per household. non-family households (182 | 29.0%) represent the smallest median household size with 1.53 persons per household.
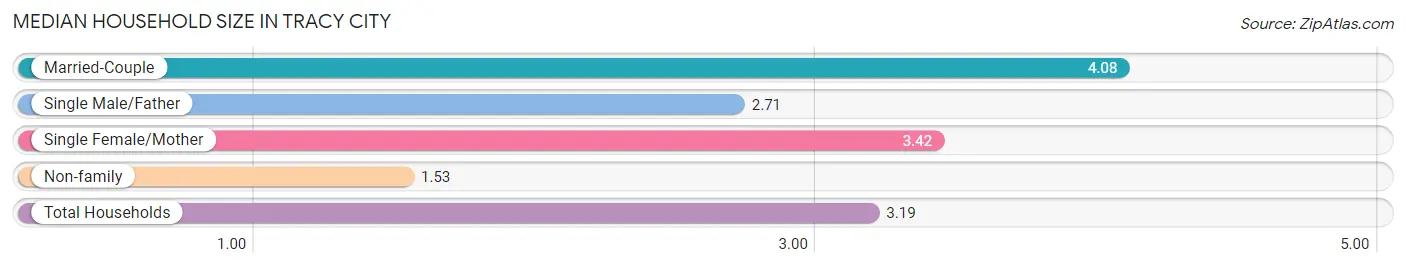
| Household Type | # Households | Household Size |
| Married-Couple | 319 (50.8%) | 4.08 |
| Single Male/Father | 17 (2.7%) | 2.71 |
| Single Female/Mother | 110 (17.5%) | 3.42 |
| Non-family | 182 (29.0%) | 1.53 |
| Total Households | 628 (100.0%) | 3.19 |
Household Size by Marriage Status in Tracy City
Out of a total of 628 households in Tracy City, 446 (71.0%) are family households, while 182 (29.0%) are nonfamily households. The most numerous type of family households are 2-person households, comprising 206, and the most common type of nonfamily households are 1-person households, comprising 158.
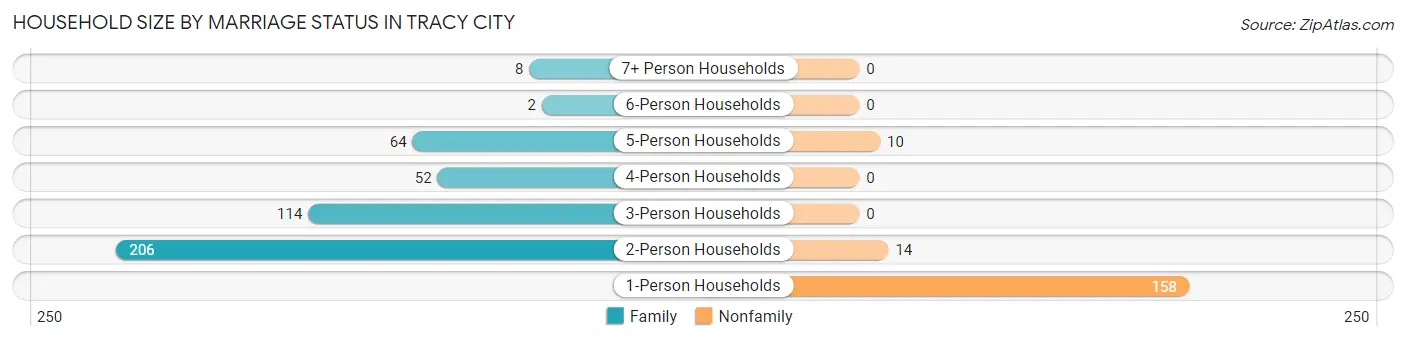
| Household Size | Family Households | Nonfamily Households |
| 1-Person Households | - | 158 (25.2%) |
| 2-Person Households | 206 (32.8%) | 14 (2.2%) |
| 3-Person Households | 114 (18.1%) | 0 (0.0%) |
| 4-Person Households | 52 (8.3%) | 0 (0.0%) |
| 5-Person Households | 64 (10.2%) | 10 (1.6%) |
| 6-Person Households | 2 (0.3%) | 0 (0.0%) |
| 7+ Person Households | 8 (1.3%) | 0 (0.0%) |
| Total | 446 (71.0%) | 182 (29.0%) |
Female Fertility in Tracy City
Fertility by Age in Tracy City
Average fertility rate in Tracy City is 123.0 births per 1,000 women. Women in the age bracket of 15 to 19 years have the highest fertility rate with 471.0 births per 1,000 women. Women in the age bracket of 20 to 34 years acount for 45.2% of all women with births.
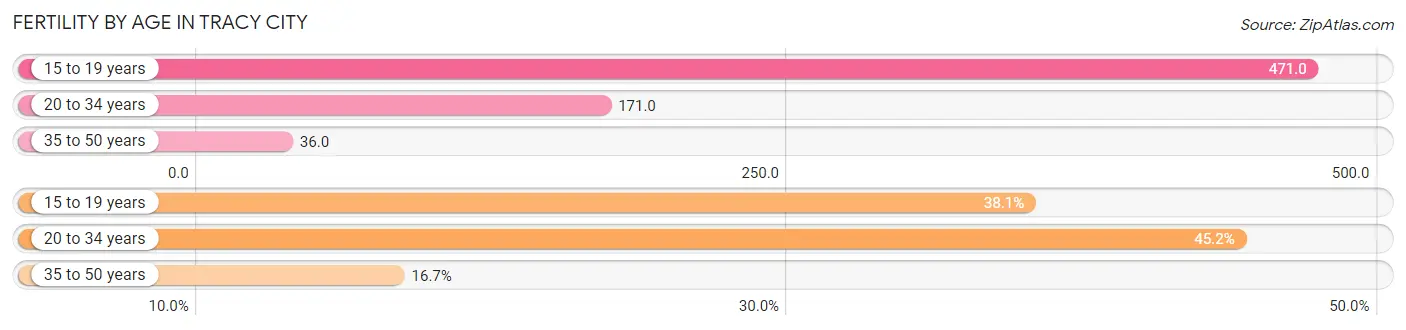
| Age Bracket | Women with Births | Births / 1,000 Women |
| 15 to 19 years | 16 (38.1%) | 471.0 |
| 20 to 34 years | 19 (45.2%) | 171.0 |
| 35 to 50 years | 7 (16.7%) | 36.0 |
| Total | 42 (100.0%) | 123.0 |
Fertility by Age by Marriage Status in Tracy City
47.6% of women with births (42) in Tracy City are married. The highest percentage of unmarried women with births falls into 15 to 19 years age bracket with 100.0% of them unmarried at the time of birth, while the lowest percentage of unmarried women with births belong to 35 to 50 years age bracket with 0.0% of them unmarried.
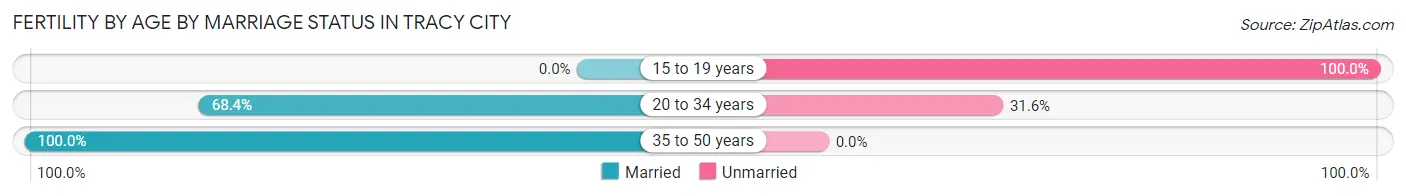
| Age Bracket | Married | Unmarried |
| 15 to 19 years | 0 (0.0%) | 16 (100.0%) |
| 20 to 34 years | 13 (68.4%) | 6 (31.6%) |
| 35 to 50 years | 7 (100.0%) | 0 (0.0%) |
| Total | 20 (47.6%) | 22 (52.4%) |
Fertility by Education in Tracy City
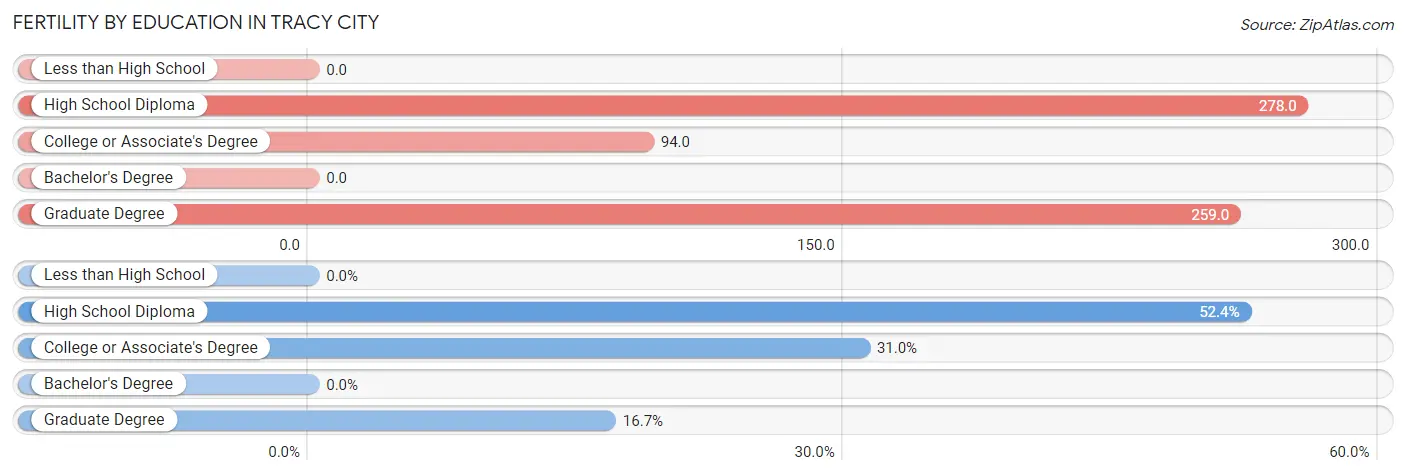
| Educational Attainment | Women with Births | Births / 1,000 Women |
| Less than High School | 0 (0.0%) | 0.0 |
| High School Diploma | 22 (52.4%) | 278.0 |
| College or Associate's Degree | 13 (30.9%) | 94.0 |
| Bachelor's Degree | 0 (0.0%) | 0.0 |
| Graduate Degree | 7 (16.7%) | 259.0 |
| Total | 42 (100.0%) | 123.0 |
Fertility by Education by Marriage Status in Tracy City
52.4% of women with births in Tracy City are unmarried. Women with the educational attainment of college or associate's degree are most likely to be married with 100.0% of them married at childbirth, while women with the educational attainment of high school diploma are least likely to be married with 100.0% of them unmarried at childbirth.
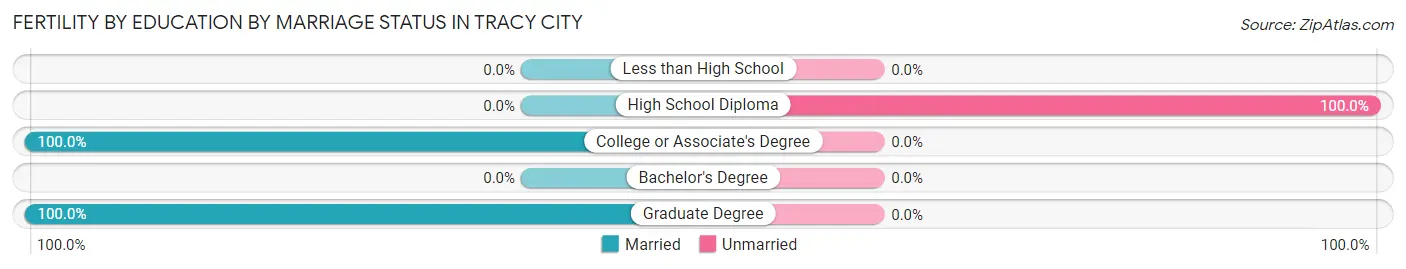
| Educational Attainment | Married | Unmarried |
| Less than High School | 0 (0.0%) | 0 (0.0%) |
| High School Diploma | 0 (0.0%) | 22 (100.0%) |
| College or Associate's Degree | 13 (100.0%) | 0 (0.0%) |
| Bachelor's Degree | 0 (0.0%) | 0 (0.0%) |
| Graduate Degree | 7 (100.0%) | 0 (0.0%) |
| Total | 20 (47.6%) | 22 (52.4%) |
Employment Characteristics in Tracy City
Employment by Class of Employer in Tracy City
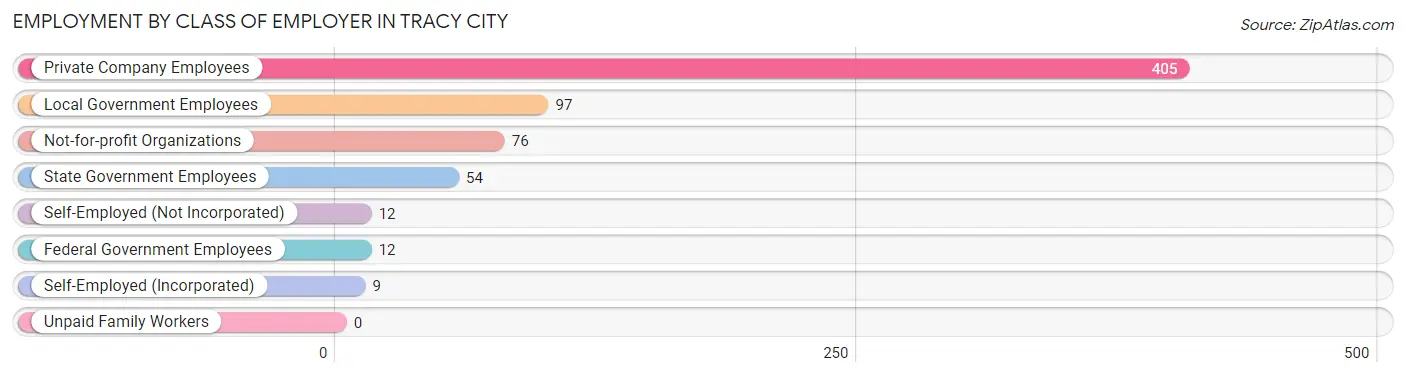
Among the 665 employed individuals in Tracy City, private company employees (405 | 60.9%), local government employees (97 | 14.6%), and not-for-profit organizations (76 | 11.4%) make up the most common classes of employment.
| Employer Class | # Employees | % Employees |
| Private Company Employees | 405 | 60.9% |
| Self-Employed (Incorporated) | 9 | 1.3% |
| Self-Employed (Not Incorporated) | 12 | 1.8% |
| Not-for-profit Organizations | 76 | 11.4% |
| Local Government Employees | 97 | 14.6% |
| State Government Employees | 54 | 8.1% |
| Federal Government Employees | 12 | 1.8% |
| Unpaid Family Workers | 0 | 0.0% |
| Total | 665 | 100.0% |
Employment Status by Age in Tracy City
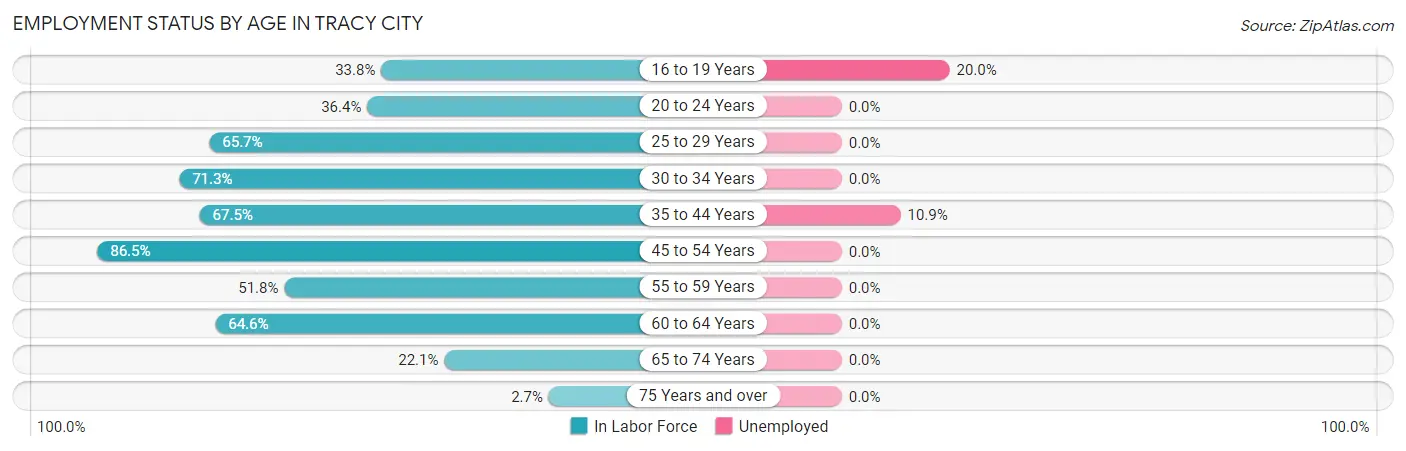
According to the labor force statistics for Tracy City, out of the total population over 16 years of age (1,438), 52.8% or 759 individuals are in the labor force, with 3.3% or 25 of them unemployed. The age group with the highest labor force participation rate is 45 to 54 years, with 86.5% or 147 individuals in the labor force. Within the labor force, the 16 to 19 years age range has the highest percentage of unemployed individuals, with 20.0% or 5 of them being unemployed.
| Age Bracket | In Labor Force | Unemployed |
| 16 to 19 Years | 25 (33.8%) | 5 (20.0%) |
| 20 to 24 Years | 44 (36.4%) | 0 (0.0%) |
| 25 to 29 Years | 94 (65.7%) | 0 (0.0%) |
| 30 to 34 Years | 72 (71.3%) | 0 (0.0%) |
| 35 to 44 Years | 183 (67.5%) | 20 (10.9%) |
| 45 to 54 Years | 147 (86.5%) | 0 (0.0%) |
| 55 to 59 Years | 43 (51.8%) | 0 (0.0%) |
| 60 to 64 Years | 113 (64.6%) | 0 (0.0%) |
| 65 to 74 Years | 34 (22.1%) | 0 (0.0%) |
| 75 Years and over | 4 (2.7%) | 0 (0.0%) |
| Total | 759 (52.8%) | 25 (3.3%) |
Employment Status by Educational Attainment in Tracy City
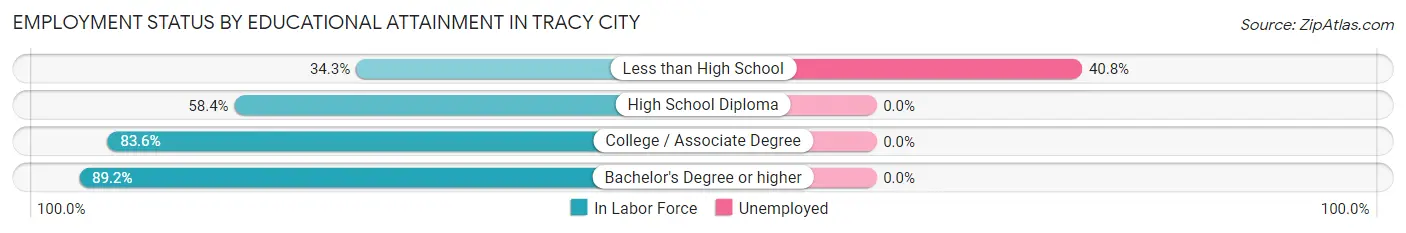
According to labor force statistics for Tracy City, 69.1% of individuals (652) out of the total population between 25 and 64 years of age (943) are in the labor force, with 3.1% or 20 of them being unemployed. The group with the highest labor force participation rate are those with the educational attainment of bachelor's degree or higher, with 89.2% or 181 individuals in the labor force. Within the labor force, individuals with less than high school education have the highest percentage of unemployment, with 40.8% or 20 of them being unemployed.
| Educational Attainment | In Labor Force | Unemployed |
| Less than High School | 49 (34.3%) | 58 (40.8%) |
| High School Diploma | 178 (58.4%) | 0 (0.0%) |
| College / Associate Degree | 244 (83.6%) | 0 (0.0%) |
| Bachelor's Degree or higher | 181 (89.2%) | 0 (0.0%) |
| Total | 652 (69.1%) | 29 (3.1%) |
Employment Occupations by Sex in Tracy City
Management, Business, Science and Arts Occupations
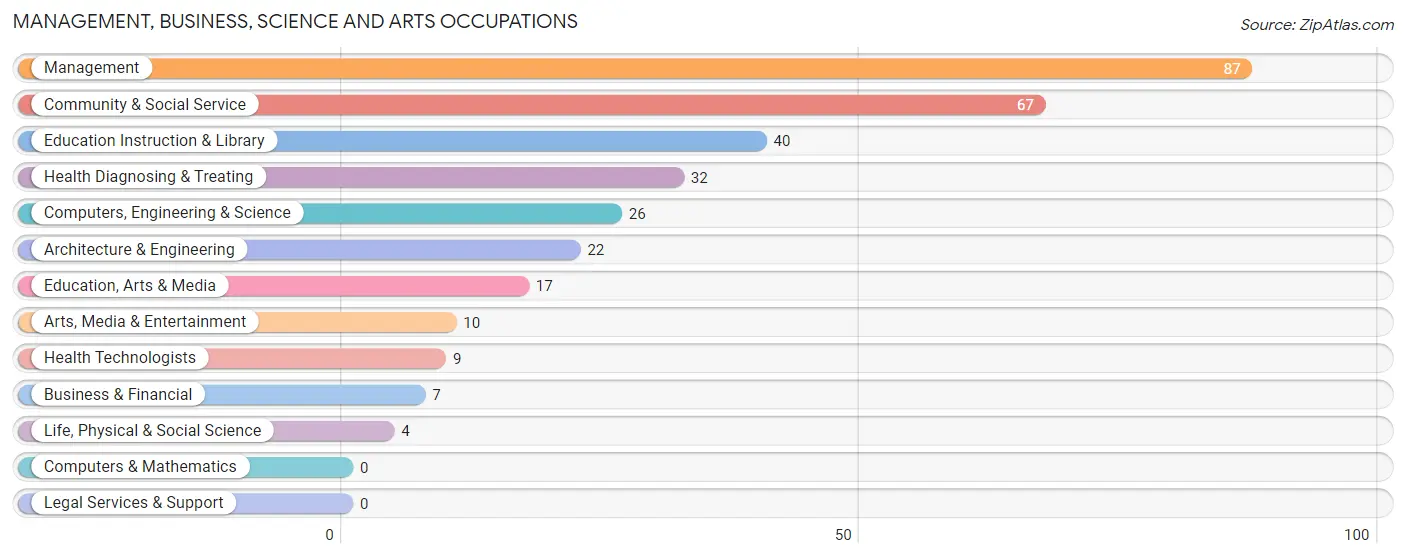
The most common Management, Business, Science and Arts occupations in Tracy City are Management (87 | 11.8%), Community & Social Service (67 | 9.1%), Education Instruction & Library (40 | 5.4%), Health Diagnosing & Treating (32 | 4.4%), and Computers, Engineering & Science (26 | 3.5%).
Management, Business, Science and Arts Occupations by Sex
Within the Management, Business, Science and Arts occupations in Tracy City, the most male-oriented occupations are Life, Physical & Social Science (100.0%), Computers, Engineering & Science (76.9%), and Architecture & Engineering (72.7%), while the most female-oriented occupations are Business & Financial (100.0%), Education, Arts & Media (100.0%), and Arts, Media & Entertainment (100.0%).
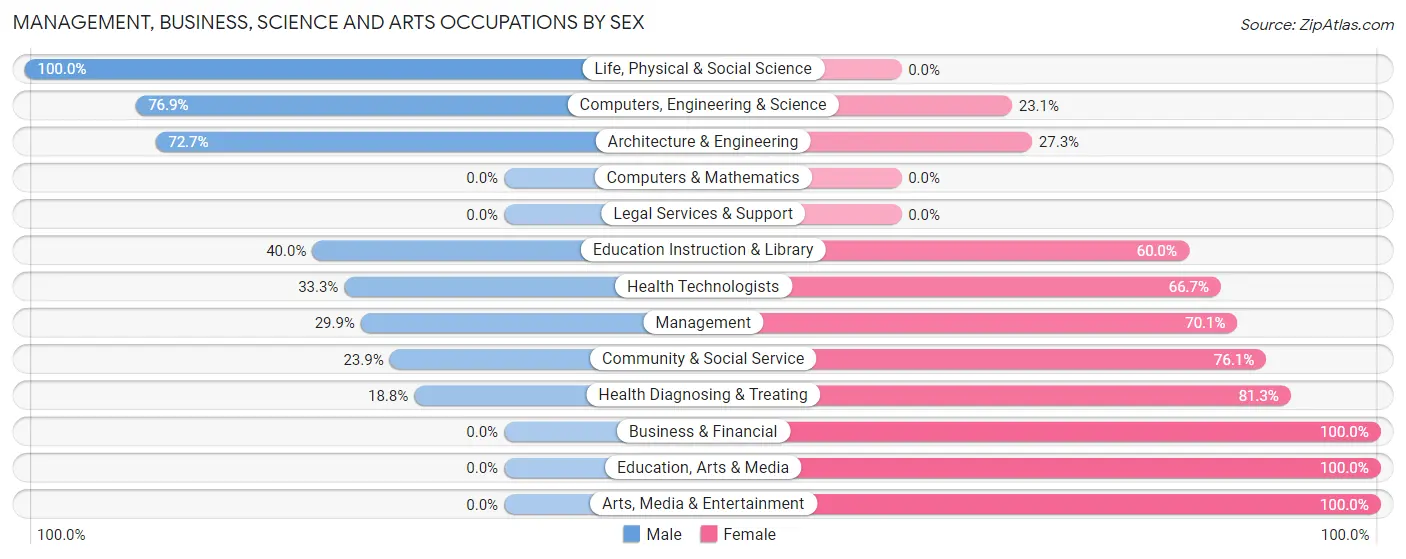
| Occupation | Male | Female |
| Management | 26 (29.9%) | 61 (70.1%) |
| Business & Financial | 0 (0.0%) | 7 (100.0%) |
| Computers, Engineering & Science | 20 (76.9%) | 6 (23.1%) |
| Computers & Mathematics | 0 (0.0%) | 0 (0.0%) |
| Architecture & Engineering | 16 (72.7%) | 6 (27.3%) |
| Life, Physical & Social Science | 4 (100.0%) | 0 (0.0%) |
| Community & Social Service | 16 (23.9%) | 51 (76.1%) |
| Education, Arts & Media | 0 (0.0%) | 17 (100.0%) |
| Legal Services & Support | 0 (0.0%) | 0 (0.0%) |
| Education Instruction & Library | 16 (40.0%) | 24 (60.0%) |
| Arts, Media & Entertainment | 0 (0.0%) | 10 (100.0%) |
| Health Diagnosing & Treating | 6 (18.8%) | 26 (81.2%) |
| Health Technologists | 3 (33.3%) | 6 (66.7%) |
| Total (Category) | 68 (31.0%) | 151 (69.0%) |
| Total (Overall) | 450 (61.3%) | 284 (38.7%) |
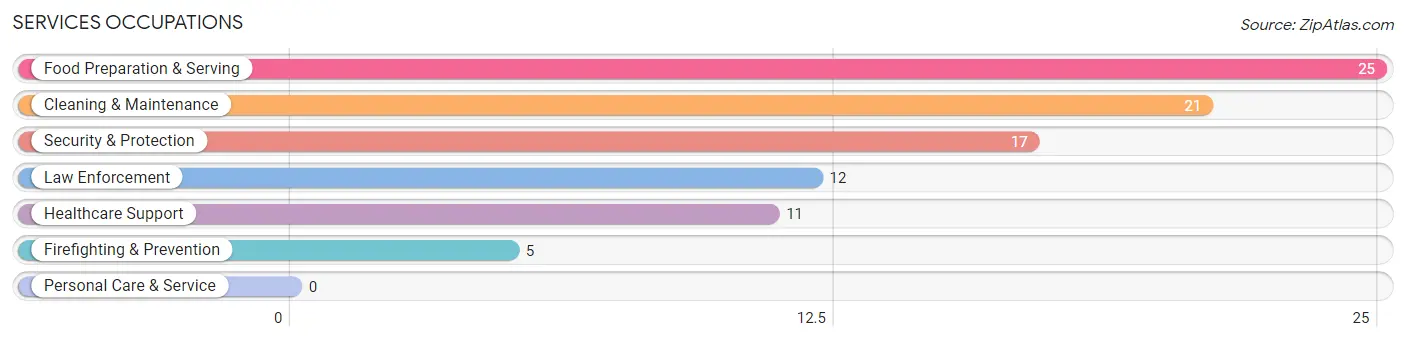
Services Occupations
The most common Services occupations in Tracy City are Food Preparation & Serving (25 | 3.4%), Cleaning & Maintenance (21 | 2.9%), Security & Protection (17 | 2.3%), Law Enforcement (12 | 1.6%), and Healthcare Support (11 | 1.5%).
Services Occupations by Sex
Within the Services occupations in Tracy City, the most male-oriented occupations are Law Enforcement (100.0%), Security & Protection (70.6%), and Cleaning & Maintenance (61.9%), while the most female-oriented occupations are Healthcare Support (100.0%), Firefighting & Prevention (100.0%), and Food Preparation & Serving (64.0%).
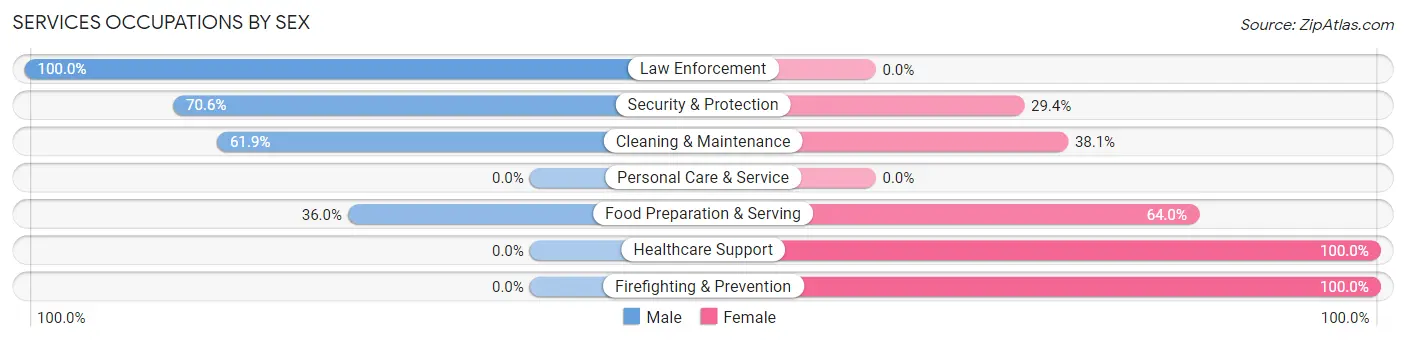
| Occupation | Male | Female |
| Healthcare Support | 0 (0.0%) | 11 (100.0%) |
| Security & Protection | 12 (70.6%) | 5 (29.4%) |
| Firefighting & Prevention | 0 (0.0%) | 5 (100.0%) |
| Law Enforcement | 12 (100.0%) | 0 (0.0%) |
| Food Preparation & Serving | 9 (36.0%) | 16 (64.0%) |
| Cleaning & Maintenance | 13 (61.9%) | 8 (38.1%) |
| Personal Care & Service | 0 (0.0%) | 0 (0.0%) |
| Total (Category) | 34 (46.0%) | 40 (54.0%) |
| Total (Overall) | 450 (61.3%) | 284 (38.7%) |
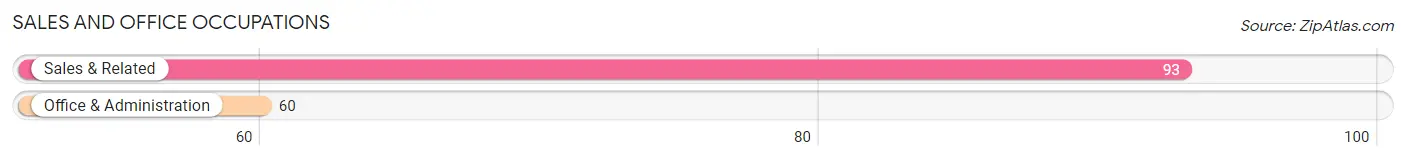
Sales and Office Occupations
The most common Sales and Office occupations in Tracy City are Sales & Related (93 | 12.7%), and Office & Administration (60 | 8.2%).
Sales and Office Occupations by Sex
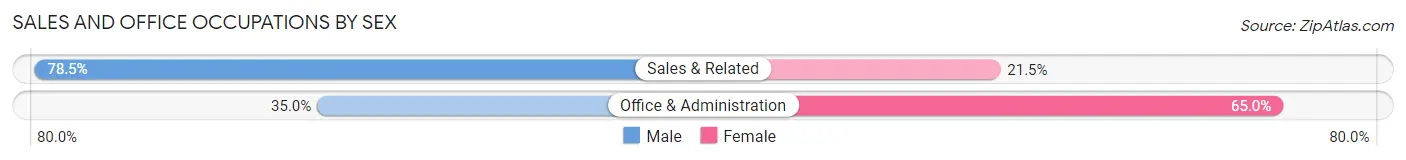
| Occupation | Male | Female |
| Sales & Related | 73 (78.5%) | 20 (21.5%) |
| Office & Administration | 21 (35.0%) | 39 (65.0%) |
| Total (Category) | 94 (61.4%) | 59 (38.6%) |
| Total (Overall) | 450 (61.3%) | 284 (38.7%) |
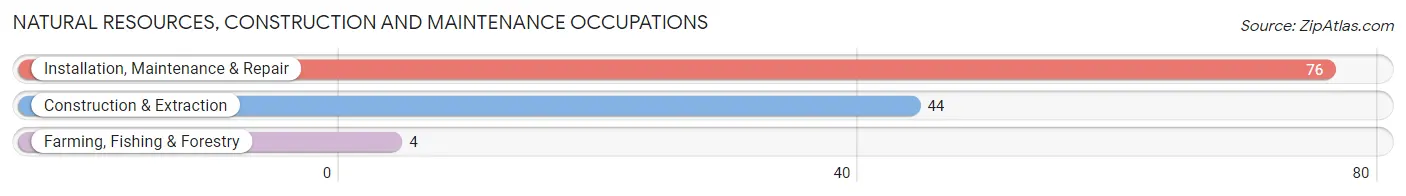
Natural Resources, Construction and Maintenance Occupations
The most common Natural Resources, Construction and Maintenance occupations in Tracy City are Installation, Maintenance & Repair (76 | 10.3%), Construction & Extraction (44 | 6.0%), and Farming, Fishing & Forestry (4 | 0.5%).
Natural Resources, Construction and Maintenance Occupations by Sex
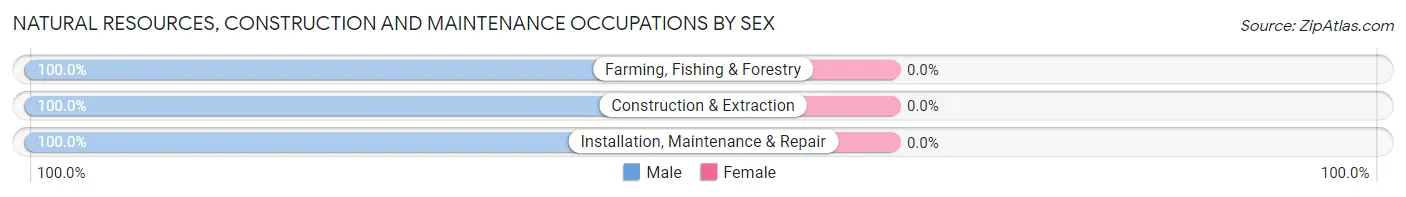
| Occupation | Male | Female |
| Farming, Fishing & Forestry | 4 (100.0%) | 0 (0.0%) |
| Construction & Extraction | 44 (100.0%) | 0 (0.0%) |
| Installation, Maintenance & Repair | 76 (100.0%) | 0 (0.0%) |
| Total (Category) | 124 (100.0%) | 0 (0.0%) |
| Total (Overall) | 450 (61.3%) | 284 (38.7%) |
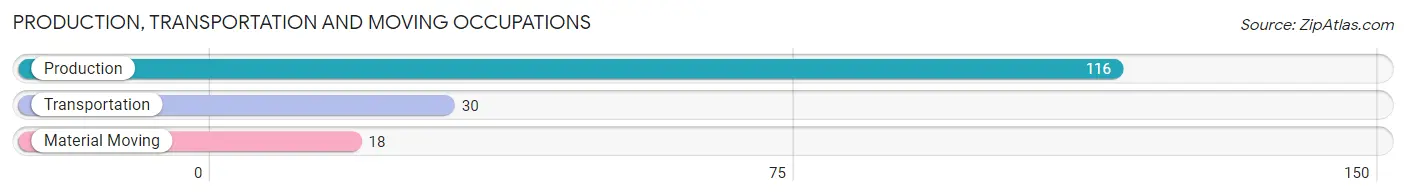
Production, Transportation and Moving Occupations
The most common Production, Transportation and Moving occupations in Tracy City are Production (116 | 15.8%), Transportation (30 | 4.1%), and Material Moving (18 | 2.5%).
Production, Transportation and Moving Occupations by Sex
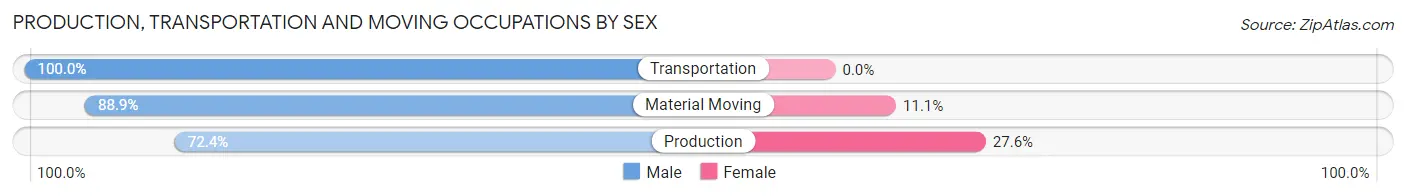
| Occupation | Male | Female |
| Production | 84 (72.4%) | 32 (27.6%) |
| Transportation | 30 (100.0%) | 0 (0.0%) |
| Material Moving | 16 (88.9%) | 2 (11.1%) |
| Total (Category) | 130 (79.3%) | 34 (20.7%) |
| Total (Overall) | 450 (61.3%) | 284 (38.7%) |
Employment Industries by Sex in Tracy City
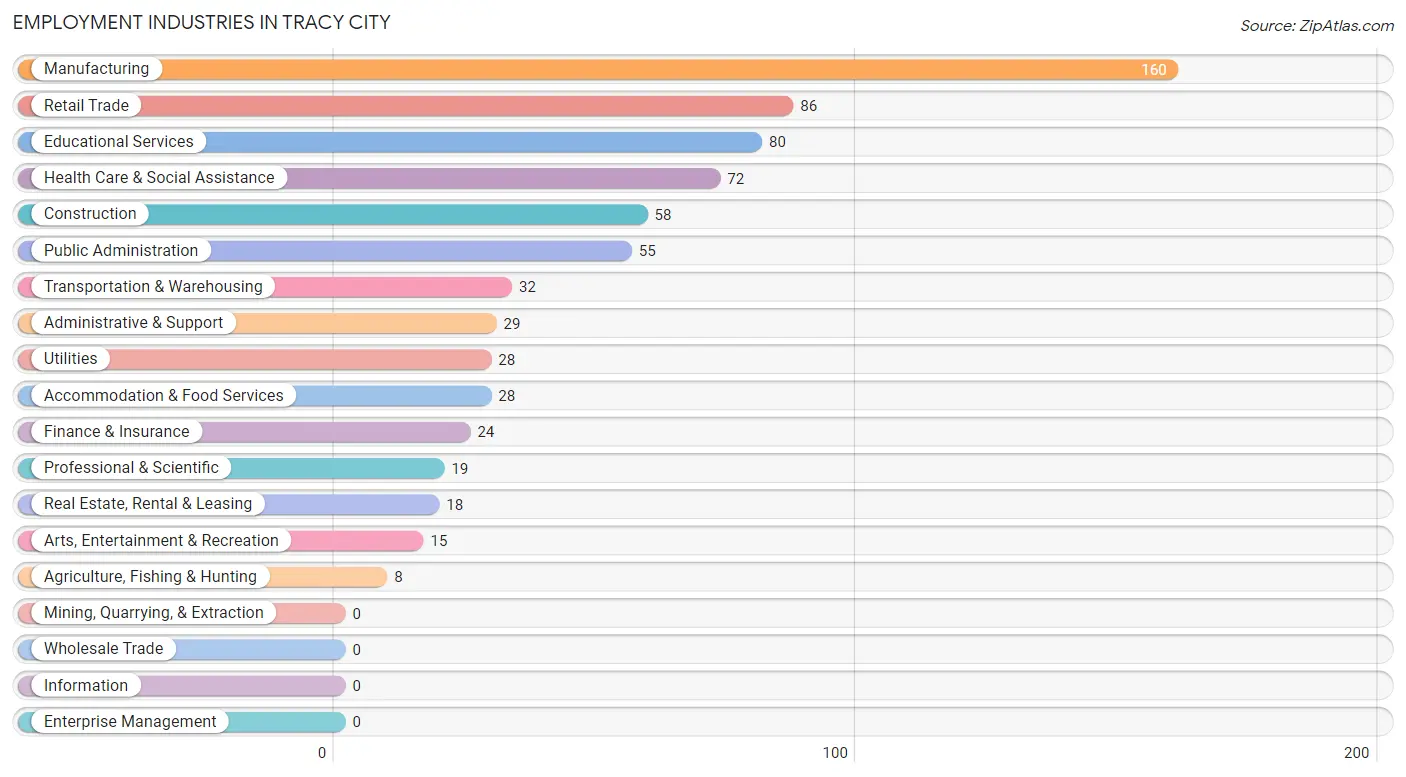
Employment Industries in Tracy City
The major employment industries in Tracy City include Manufacturing (160 | 21.8%), Retail Trade (86 | 11.7%), Educational Services (80 | 10.9%), Health Care & Social Assistance (72 | 9.8%), and Construction (58 | 7.9%).
Employment Industries by Sex in Tracy City
The Tracy City industries that see more men than women are Agriculture, Fishing & Hunting (100.0%), Transportation & Warehousing (100.0%), and Utilities (100.0%), whereas the industries that tend to have a higher number of women are Real Estate, Rental & Leasing (100.0%), Arts, Entertainment & Recreation (100.0%), and Health Care & Social Assistance (76.4%).
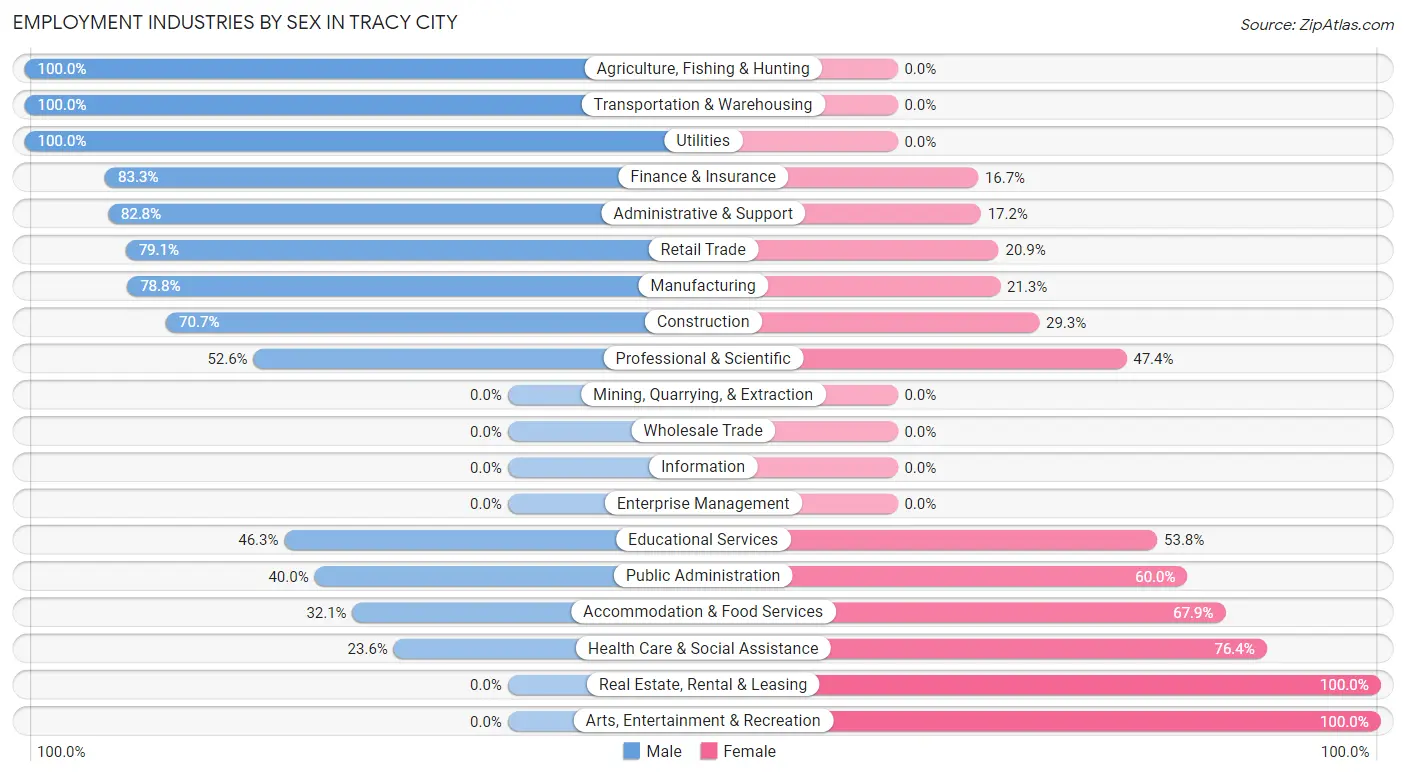
| Industry | Male | Female |
| Agriculture, Fishing & Hunting | 8 (100.0%) | 0 (0.0%) |
| Mining, Quarrying, & Extraction | 0 (0.0%) | 0 (0.0%) |
| Construction | 41 (70.7%) | 17 (29.3%) |
| Manufacturing | 126 (78.7%) | 34 (21.2%) |
| Wholesale Trade | 0 (0.0%) | 0 (0.0%) |
| Retail Trade | 68 (79.1%) | 18 (20.9%) |
| Transportation & Warehousing | 32 (100.0%) | 0 (0.0%) |
| Utilities | 28 (100.0%) | 0 (0.0%) |
| Information | 0 (0.0%) | 0 (0.0%) |
| Finance & Insurance | 20 (83.3%) | 4 (16.7%) |
| Real Estate, Rental & Leasing | 0 (0.0%) | 18 (100.0%) |
| Professional & Scientific | 10 (52.6%) | 9 (47.4%) |
| Enterprise Management | 0 (0.0%) | 0 (0.0%) |
| Administrative & Support | 24 (82.8%) | 5 (17.2%) |
| Educational Services | 37 (46.3%) | 43 (53.7%) |
| Health Care & Social Assistance | 17 (23.6%) | 55 (76.4%) |
| Arts, Entertainment & Recreation | 0 (0.0%) | 15 (100.0%) |
| Accommodation & Food Services | 9 (32.1%) | 19 (67.9%) |
| Public Administration | 22 (40.0%) | 33 (60.0%) |
| Total | 450 (61.3%) | 284 (38.7%) |
Education in Tracy City
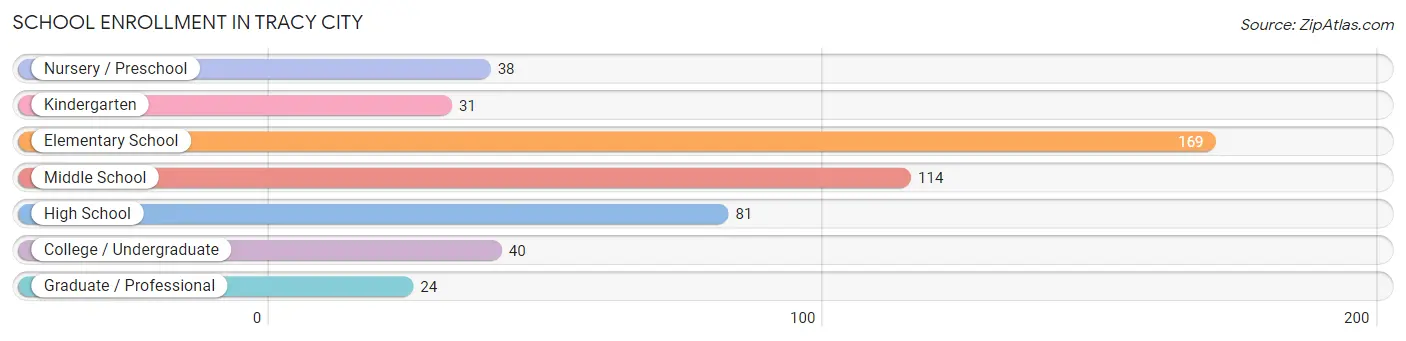
School Enrollment in Tracy City
The most common levels of schooling among the 497 students in Tracy City are elementary school (169 | 34.0%), middle school (114 | 22.9%), and high school (81 | 16.3%).
| School Level | # Students | % Students |
| Nursery / Preschool | 38 | 7.6% |
| Kindergarten | 31 | 6.2% |
| Elementary School | 169 | 34.0% |
| Middle School | 114 | 22.9% |
| High School | 81 | 16.3% |
| College / Undergraduate | 40 | 8.1% |
| Graduate / Professional | 24 | 4.8% |
| Total | 497 | 100.0% |
School Enrollment by Age by Funding Source in Tracy City
Out of a total of 497 students who are enrolled in schools in Tracy City, 111 (22.3%) attend a private institution, while the remaining 386 (77.7%) are enrolled in public schools. The age group of 10 to 14 year olds has the highest likelihood of being enrolled in private schools, with 59 (31.9% in the age bracket) enrolled. Conversely, the age group of 3 to 4 year olds has the lowest likelihood of being enrolled in a private school, with 25 (100.0% in the age bracket) attending a public institution.
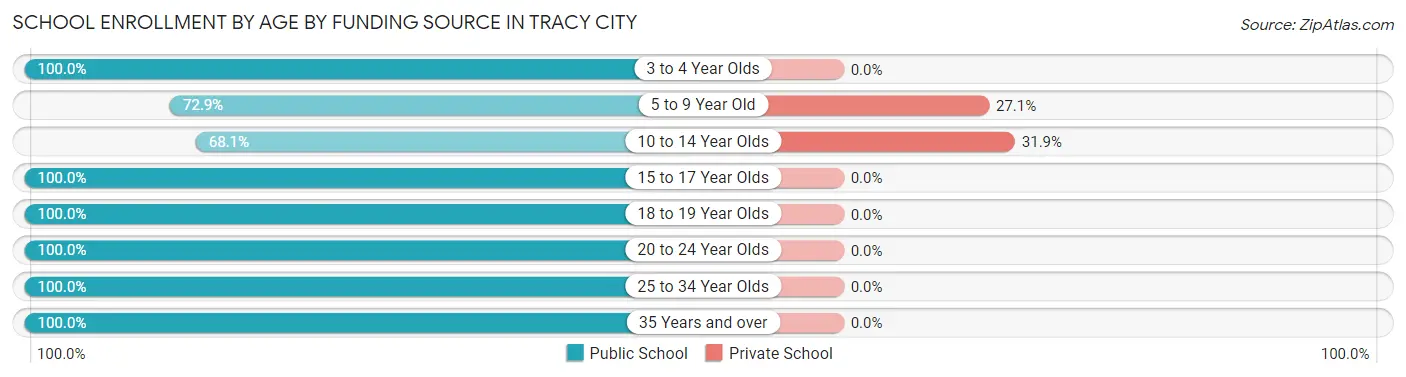
| Age Bracket | Public School | Private School |
| 3 to 4 Year Olds | 25 (100.0%) | 0 (0.0%) |
| 5 to 9 Year Old | 140 (72.9%) | 52 (27.1%) |
| 10 to 14 Year Olds | 126 (68.1%) | 59 (31.9%) |
| 15 to 17 Year Olds | 20 (100.0%) | 0 (0.0%) |
| 18 to 19 Year Olds | 41 (100.0%) | 0 (0.0%) |
| 20 to 24 Year Olds | 4 (100.0%) | 0 (0.0%) |
| 25 to 34 Year Olds | 10 (100.0%) | 0 (0.0%) |
| 35 Years and over | 20 (100.0%) | 0 (0.0%) |
| Total | 386 (77.7%) | 111 (22.3%) |
Educational Attainment by Field of Study in Tracy City
Education (57 | 24.4%), business (52 | 22.2%), engineering (50 | 21.4%), arts & humanities (25 | 10.7%), and bio, nature & agricultural (23 | 9.8%) are the most common fields of study among 234 individuals in Tracy City who have obtained a bachelor's degree or higher.
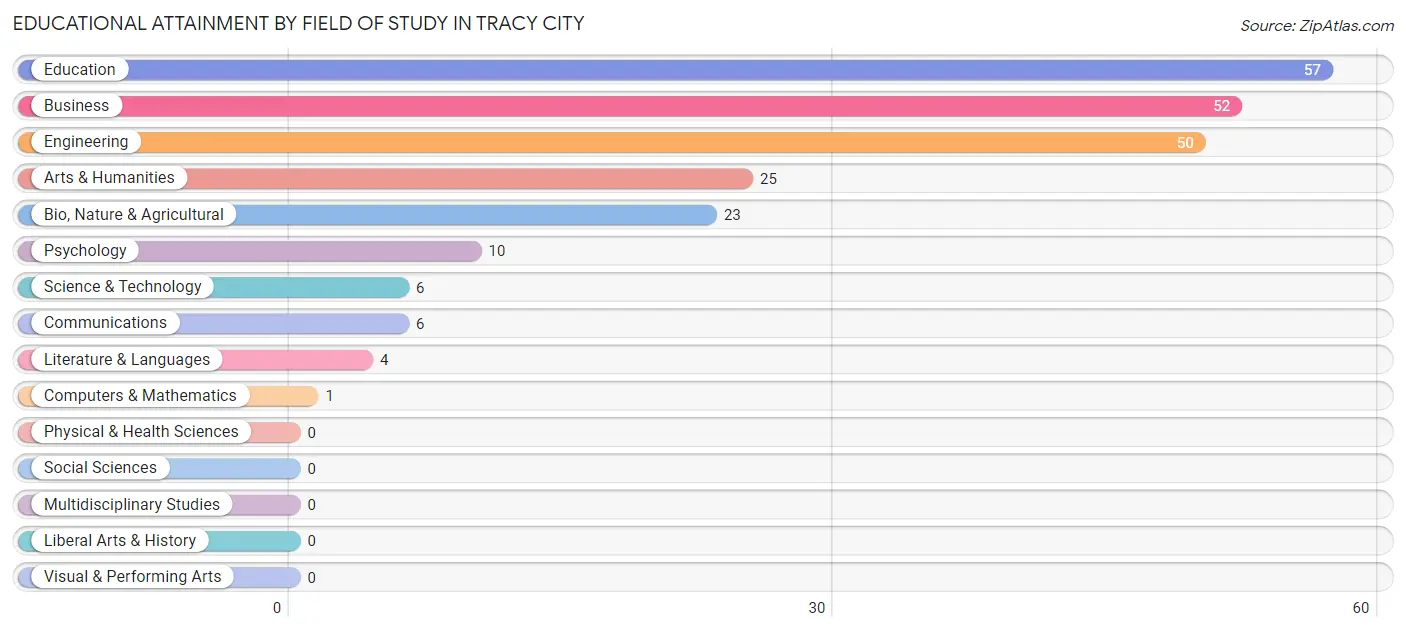
| Field of Study | # Graduates | % Graduates |
| Computers & Mathematics | 1 | 0.4% |
| Bio, Nature & Agricultural | 23 | 9.8% |
| Physical & Health Sciences | 0 | 0.0% |
| Psychology | 10 | 4.3% |
| Social Sciences | 0 | 0.0% |
| Engineering | 50 | 21.4% |
| Multidisciplinary Studies | 0 | 0.0% |
| Science & Technology | 6 | 2.6% |
| Business | 52 | 22.2% |
| Education | 57 | 24.4% |
| Literature & Languages | 4 | 1.7% |
| Liberal Arts & History | 0 | 0.0% |
| Visual & Performing Arts | 0 | 0.0% |
| Communications | 6 | 2.6% |
| Arts & Humanities | 25 | 10.7% |
| Total | 234 | 100.0% |
Transportation & Commute in Tracy City
Vehicle Availability by Sex in Tracy City
The most prevalent vehicle ownership categories in Tracy City are males with 2 vehicles (156, accounting for 39.1%) and females with 2 vehicles (126, making up 58.7%).
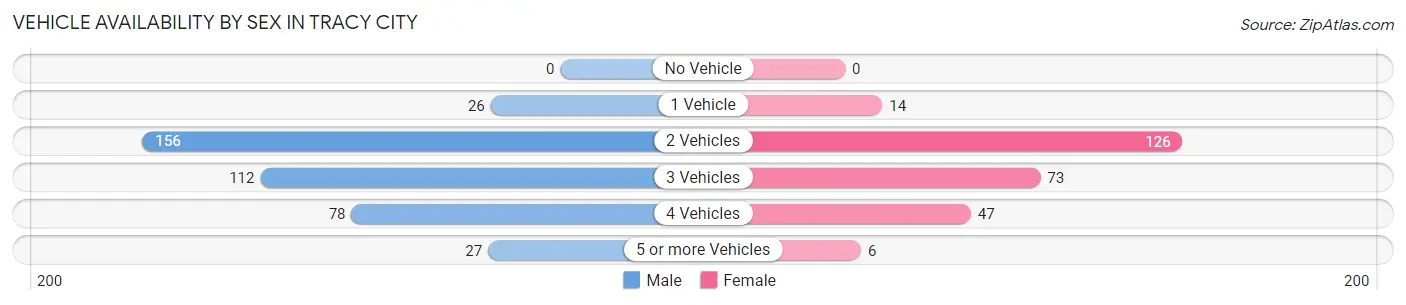
| Vehicles Available | Male | Female |
| No Vehicle | 0 (0.0%) | 0 (0.0%) |
| 1 Vehicle | 26 (6.5%) | 14 (5.3%) |
| 2 Vehicles | 156 (39.1%) | 126 (47.4%) |
| 3 Vehicles | 112 (28.1%) | 73 (27.4%) |
| 4 Vehicles | 78 (19.6%) | 47 (17.7%) |
| 5 or more Vehicles | 27 (6.8%) | 6 (2.3%) |
| Total | 399 (100.0%) | 266 (100.0%) |
Commute Time in Tracy City
The most frequently occuring commute durations in Tracy City are 45 to 59 minutes (100 commuters, 15.9%), 5 to 9 minutes (94 commuters, 15.0%), and 30 to 34 minutes (84 commuters, 13.4%).
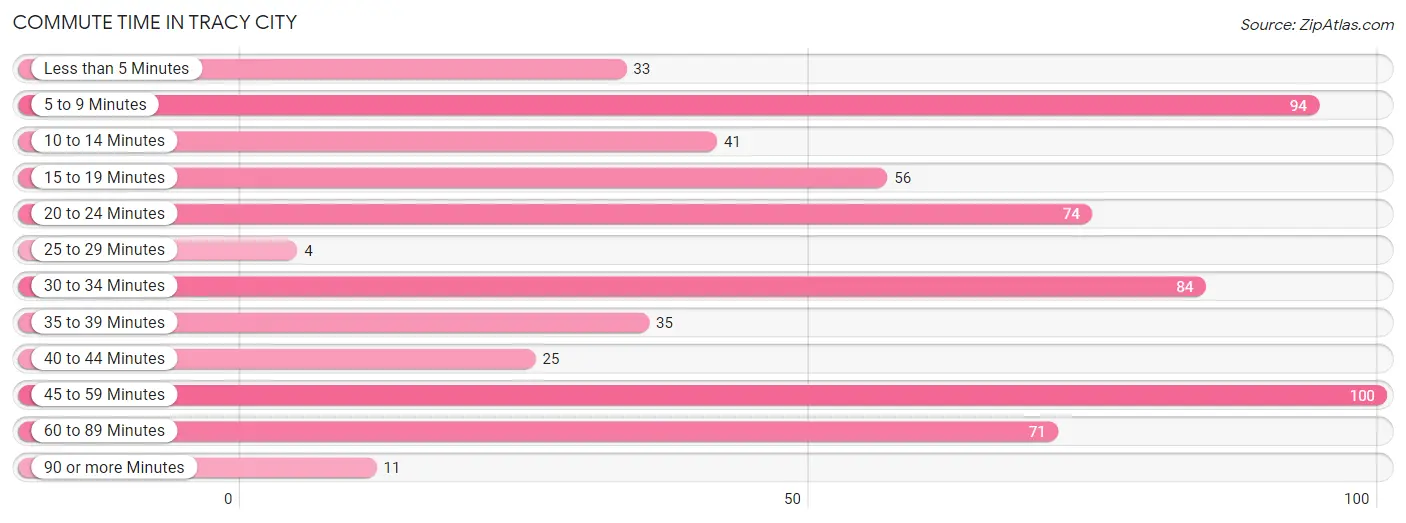
| Commute Time | # Commuters | % Commuters |
| Less than 5 Minutes | 33 | 5.2% |
| 5 to 9 Minutes | 94 | 15.0% |
| 10 to 14 Minutes | 41 | 6.5% |
| 15 to 19 Minutes | 56 | 8.9% |
| 20 to 24 Minutes | 74 | 11.8% |
| 25 to 29 Minutes | 4 | 0.6% |
| 30 to 34 Minutes | 84 | 13.4% |
| 35 to 39 Minutes | 35 | 5.6% |
| 40 to 44 Minutes | 25 | 4.0% |
| 45 to 59 Minutes | 100 | 15.9% |
| 60 to 89 Minutes | 71 | 11.3% |
| 90 or more Minutes | 11 | 1.8% |
Commute Time by Sex in Tracy City
The most common commute times in Tracy City are 45 to 59 minutes (72 commuters, 18.0%) for males and 5 to 9 minutes (41 commuters, 17.9%) for females.
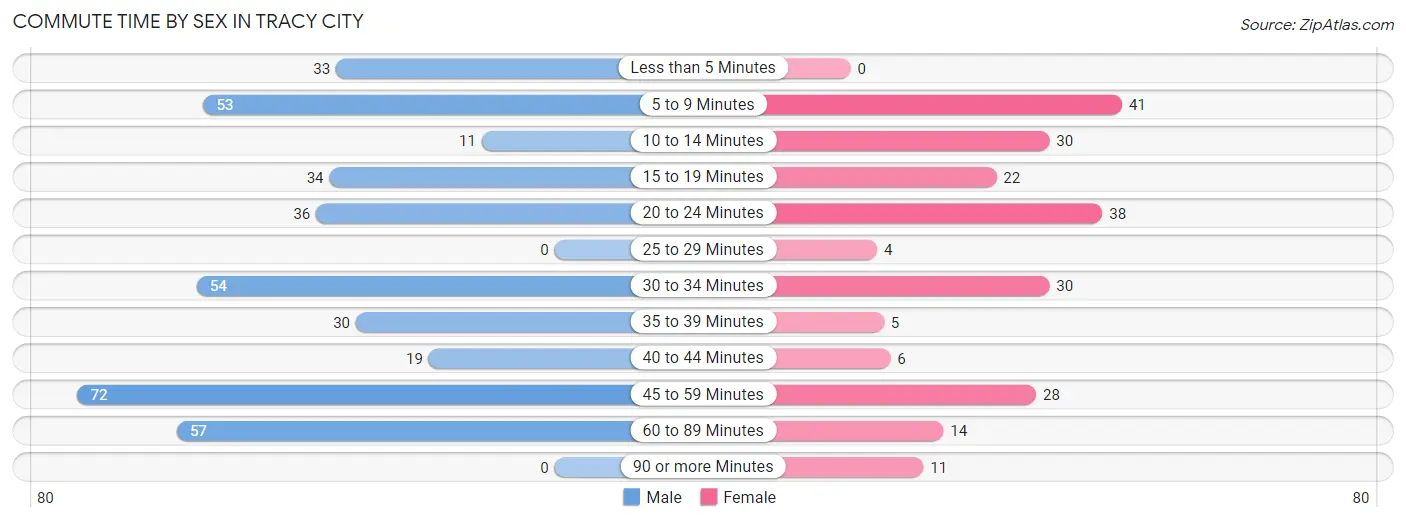
| Commute Time | Male | Female |
| Less than 5 Minutes | 33 (8.3%) | 0 (0.0%) |
| 5 to 9 Minutes | 53 (13.3%) | 41 (17.9%) |
| 10 to 14 Minutes | 11 (2.8%) | 30 (13.1%) |
| 15 to 19 Minutes | 34 (8.5%) | 22 (9.6%) |
| 20 to 24 Minutes | 36 (9.0%) | 38 (16.6%) |
| 25 to 29 Minutes | 0 (0.0%) | 4 (1.8%) |
| 30 to 34 Minutes | 54 (13.5%) | 30 (13.1%) |
| 35 to 39 Minutes | 30 (7.5%) | 5 (2.2%) |
| 40 to 44 Minutes | 19 (4.8%) | 6 (2.6%) |
| 45 to 59 Minutes | 72 (18.0%) | 28 (12.2%) |
| 60 to 89 Minutes | 57 (14.3%) | 14 (6.1%) |
| 90 or more Minutes | 0 (0.0%) | 11 (4.8%) |
Time of Departure to Work by Sex in Tracy City
The most frequent times of departure to work in Tracy City are 7:00 AM to 7:29 AM (79, 19.8%) for males and 6:00 AM to 6:29 AM (48, 21.0%) for females.
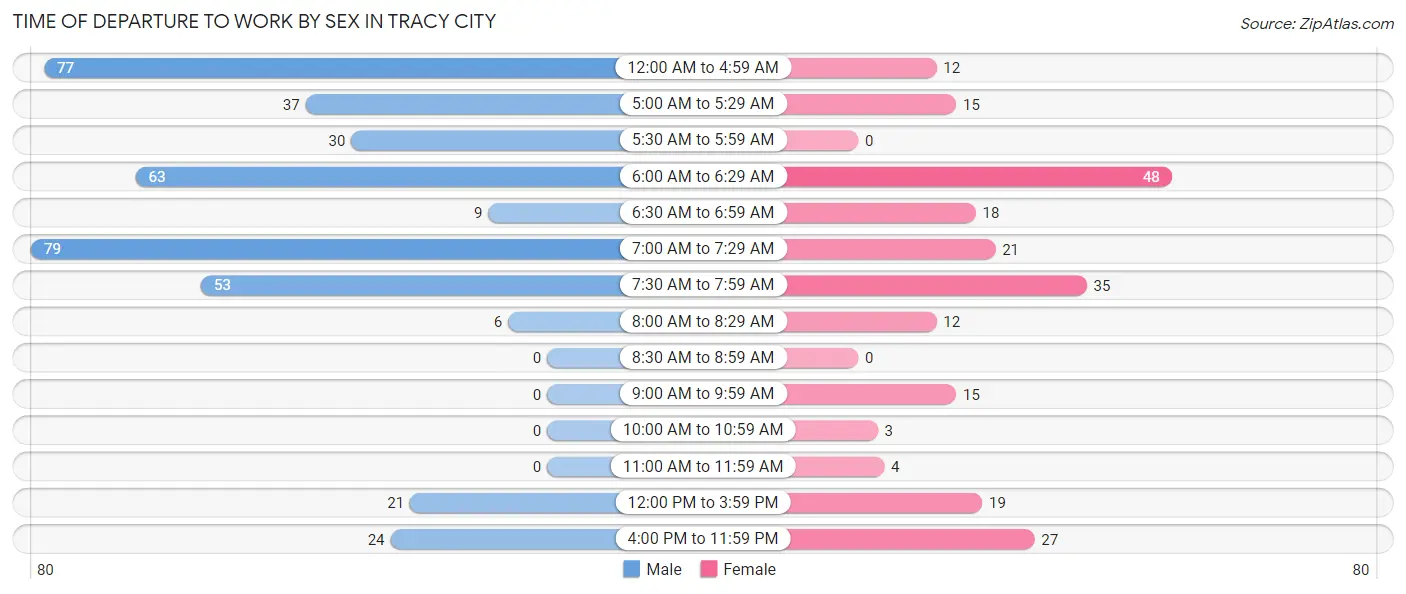
| Time of Departure | Male | Female |
| 12:00 AM to 4:59 AM | 77 (19.3%) | 12 (5.2%) |
| 5:00 AM to 5:29 AM | 37 (9.3%) | 15 (6.6%) |
| 5:30 AM to 5:59 AM | 30 (7.5%) | 0 (0.0%) |
| 6:00 AM to 6:29 AM | 63 (15.8%) | 48 (21.0%) |
| 6:30 AM to 6:59 AM | 9 (2.3%) | 18 (7.9%) |
| 7:00 AM to 7:29 AM | 79 (19.8%) | 21 (9.2%) |
| 7:30 AM to 7:59 AM | 53 (13.3%) | 35 (15.3%) |
| 8:00 AM to 8:29 AM | 6 (1.5%) | 12 (5.2%) |
| 8:30 AM to 8:59 AM | 0 (0.0%) | 0 (0.0%) |
| 9:00 AM to 9:59 AM | 0 (0.0%) | 15 (6.6%) |
| 10:00 AM to 10:59 AM | 0 (0.0%) | 3 (1.3%) |
| 11:00 AM to 11:59 AM | 0 (0.0%) | 4 (1.8%) |
| 12:00 PM to 3:59 PM | 21 (5.3%) | 19 (8.3%) |
| 4:00 PM to 11:59 PM | 24 (6.0%) | 27 (11.8%) |
| Total | 399 (100.0%) | 229 (100.0%) |
Housing Occupancy in Tracy City
Occupancy by Ownership in Tracy City
Of the total 628 dwellings in Tracy City, owner-occupied units account for 431 (68.6%), while renter-occupied units make up 197 (31.4%).
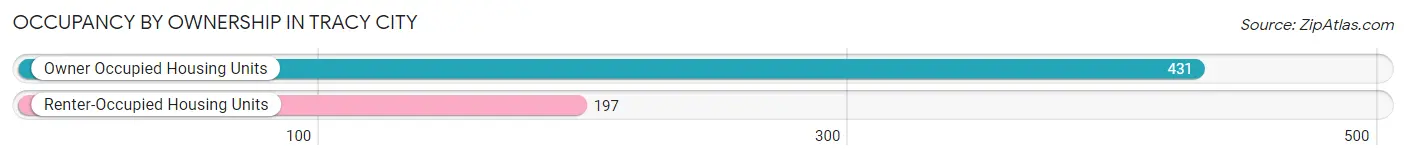
| Occupancy | # Housing Units | % Housing Units |
| Owner Occupied Housing Units | 431 | 68.6% |
| Renter-Occupied Housing Units | 197 | 31.4% |
| Total Occupied Housing Units | 628 | 100.0% |
Occupancy by Household Size in Tracy City
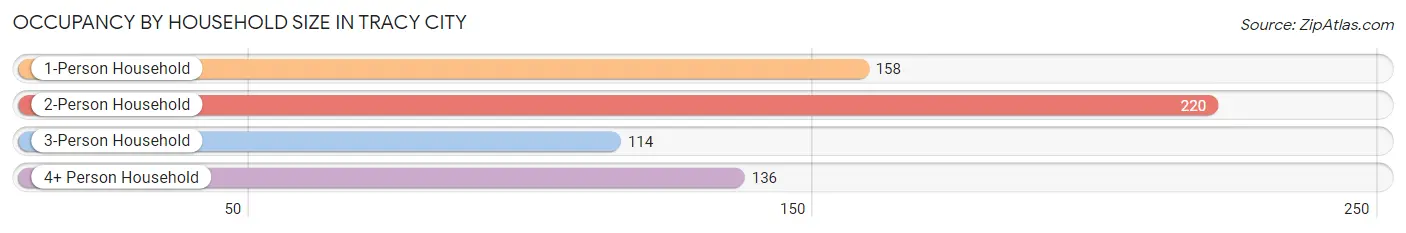
| Household Size | # Housing Units | % Housing Units |
| 1-Person Household | 158 | 25.2% |
| 2-Person Household | 220 | 35.0% |
| 3-Person Household | 114 | 18.1% |
| 4+ Person Household | 136 | 21.7% |
| Total Housing Units | 628 | 100.0% |
Occupancy by Ownership by Household Size in Tracy City
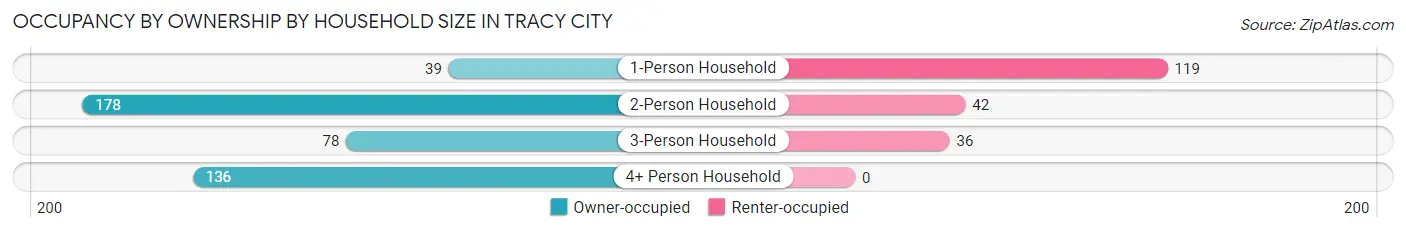
| Household Size | Owner-occupied | Renter-occupied |
| 1-Person Household | 39 (24.7%) | 119 (75.3%) |
| 2-Person Household | 178 (80.9%) | 42 (19.1%) |
| 3-Person Household | 78 (68.4%) | 36 (31.6%) |
| 4+ Person Household | 136 (100.0%) | 0 (0.0%) |
| Total Housing Units | 431 (68.6%) | 197 (31.4%) |
Occupancy by Educational Attainment in Tracy City
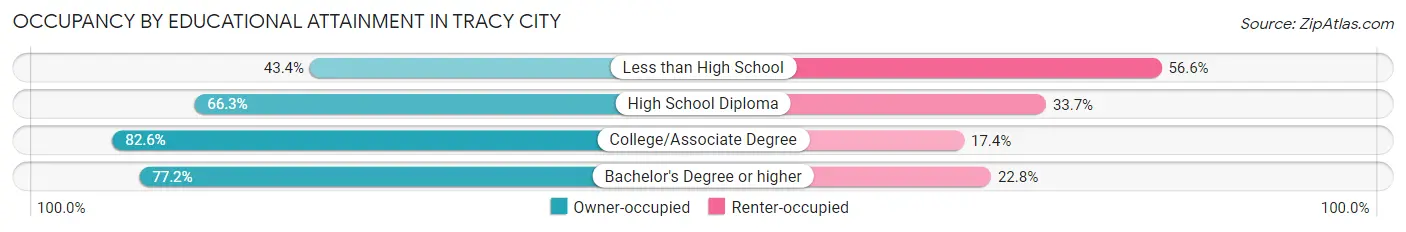
| Household Size | Owner-occupied | Renter-occupied |
| Less than High School | 53 (43.4%) | 69 (56.6%) |
| High School Diploma | 136 (66.3%) | 69 (33.7%) |
| College/Associate Degree | 147 (82.6%) | 31 (17.4%) |
| Bachelor's Degree or higher | 95 (77.2%) | 28 (22.8%) |
Occupancy by Age of Householder in Tracy City
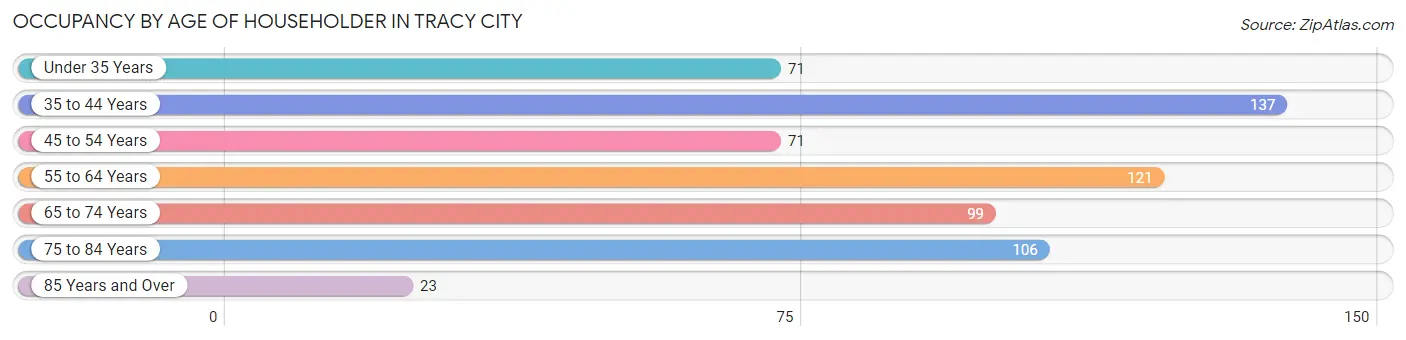
| Age Bracket | # Households | % Households |
| Under 35 Years | 71 | 11.3% |
| 35 to 44 Years | 137 | 21.8% |
| 45 to 54 Years | 71 | 11.3% |
| 55 to 64 Years | 121 | 19.3% |
| 65 to 74 Years | 99 | 15.8% |
| 75 to 84 Years | 106 | 16.9% |
| 85 Years and Over | 23 | 3.7% |
| Total | 628 | 100.0% |
Housing Finances in Tracy City
Median Income by Occupancy in Tracy City
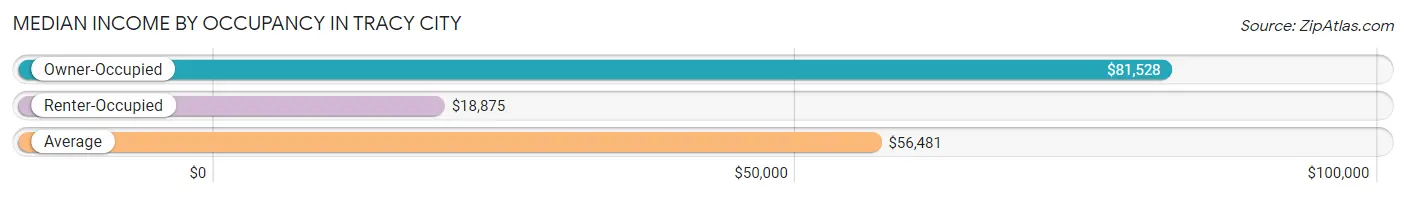
| Occupancy Type | # Households | Median Income |
| Owner-Occupied | 431 (68.6%) | $81,528 |
| Renter-Occupied | 197 (31.4%) | $18,875 |
| Average | 628 (100.0%) | $56,481 |
Occupancy by Householder Income Bracket in Tracy City
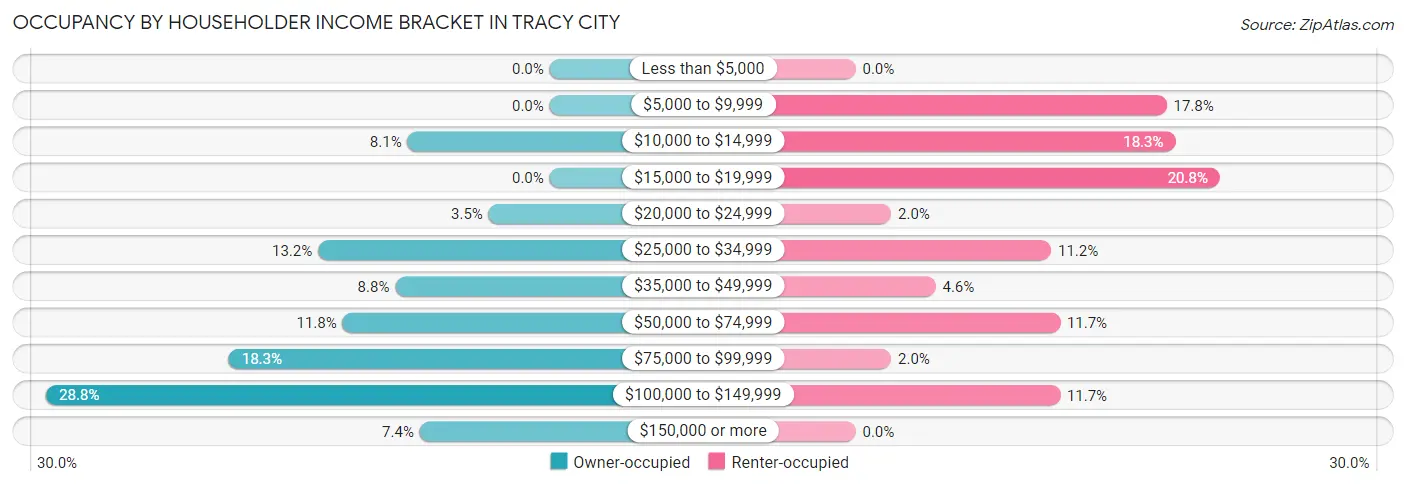
| Income Bracket | Owner-occupied | Renter-occupied |
| Less than $5,000 | 0 (0.0%) | 0 (0.0%) |
| $5,000 to $9,999 | 0 (0.0%) | 35 (17.8%) |
| $10,000 to $14,999 | 35 (8.1%) | 36 (18.3%) |
| $15,000 to $19,999 | 0 (0.0%) | 41 (20.8%) |
| $20,000 to $24,999 | 15 (3.5%) | 4 (2.0%) |
| $25,000 to $34,999 | 57 (13.2%) | 22 (11.2%) |
| $35,000 to $49,999 | 38 (8.8%) | 9 (4.6%) |
| $50,000 to $74,999 | 51 (11.8%) | 23 (11.7%) |
| $75,000 to $99,999 | 79 (18.3%) | 4 (2.0%) |
| $100,000 to $149,999 | 124 (28.8%) | 23 (11.7%) |
| $150,000 or more | 32 (7.4%) | 0 (0.0%) |
| Total | 431 (100.0%) | 197 (100.0%) |
Monthly Housing Cost Tiers in Tracy City
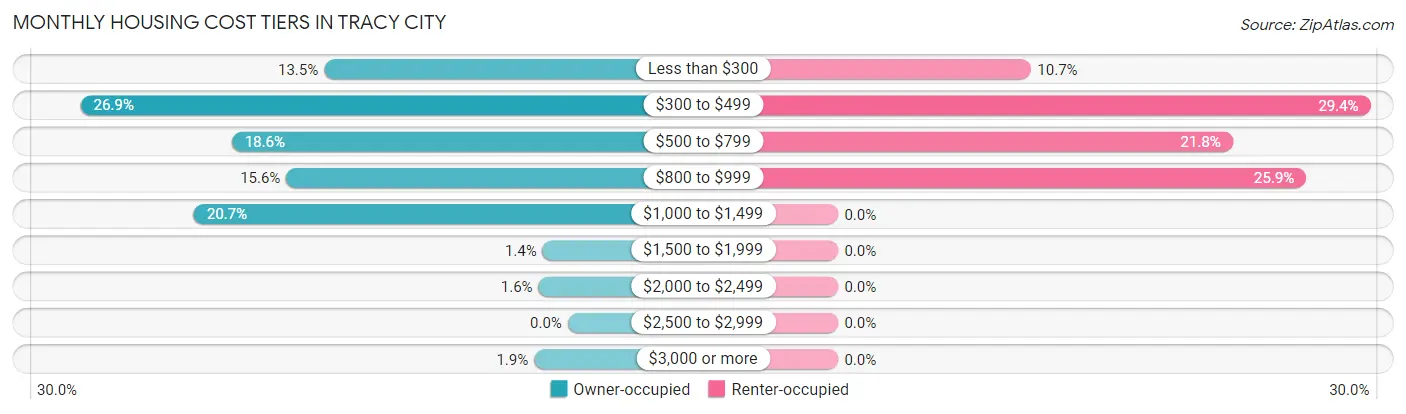
| Monthly Cost | Owner-occupied | Renter-occupied |
| Less than $300 | 58 (13.5%) | 21 (10.7%) |
| $300 to $499 | 116 (26.9%) | 58 (29.4%) |
| $500 to $799 | 80 (18.6%) | 43 (21.8%) |
| $800 to $999 | 67 (15.5%) | 51 (25.9%) |
| $1,000 to $1,499 | 89 (20.6%) | 0 (0.0%) |
| $1,500 to $1,999 | 6 (1.4%) | 0 (0.0%) |
| $2,000 to $2,499 | 7 (1.6%) | 0 (0.0%) |
| $2,500 to $2,999 | 0 (0.0%) | 0 (0.0%) |
| $3,000 or more | 8 (1.9%) | 0 (0.0%) |
| Total | 431 (100.0%) | 197 (100.0%) |
Physical Housing Characteristics in Tracy City
Housing Structures in Tracy City
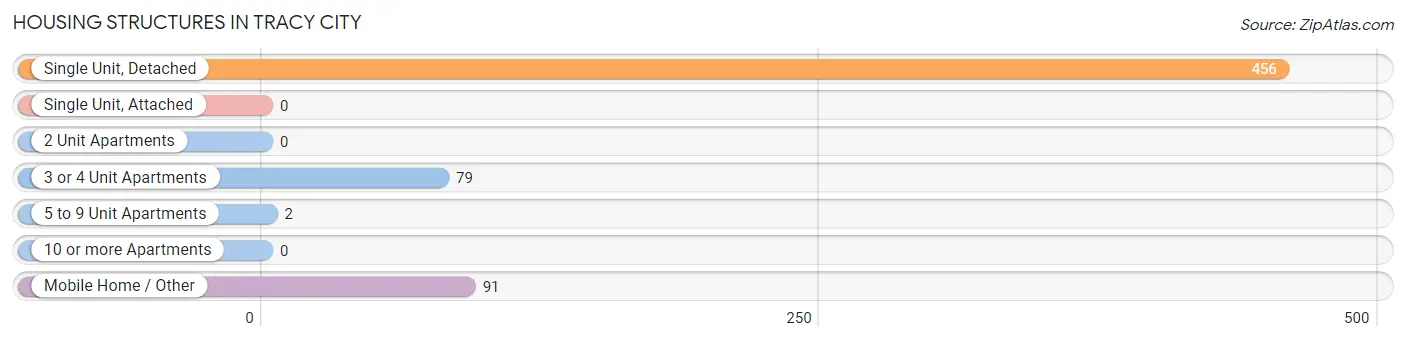
| Structure Type | # Housing Units | % Housing Units |
| Single Unit, Detached | 456 | 72.6% |
| Single Unit, Attached | 0 | 0.0% |
| 2 Unit Apartments | 0 | 0.0% |
| 3 or 4 Unit Apartments | 79 | 12.6% |
| 5 to 9 Unit Apartments | 2 | 0.3% |
| 10 or more Apartments | 0 | 0.0% |
| Mobile Home / Other | 91 | 14.5% |
| Total | 628 | 100.0% |
Housing Structures by Occupancy in Tracy City
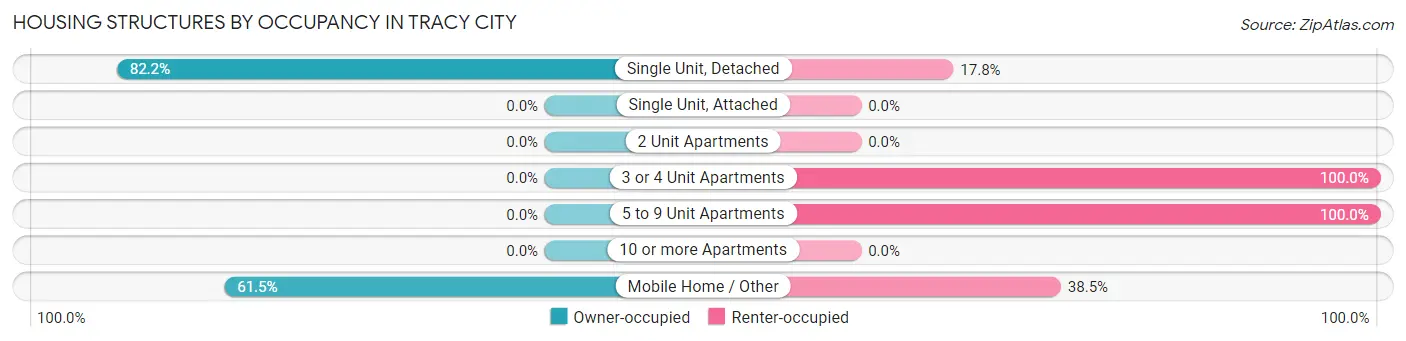
| Structure Type | Owner-occupied | Renter-occupied |
| Single Unit, Detached | 375 (82.2%) | 81 (17.8%) |
| Single Unit, Attached | 0 (0.0%) | 0 (0.0%) |
| 2 Unit Apartments | 0 (0.0%) | 0 (0.0%) |
| 3 or 4 Unit Apartments | 0 (0.0%) | 79 (100.0%) |
| 5 to 9 Unit Apartments | 0 (0.0%) | 2 (100.0%) |
| 10 or more Apartments | 0 (0.0%) | 0 (0.0%) |
| Mobile Home / Other | 56 (61.5%) | 35 (38.5%) |
| Total | 431 (68.6%) | 197 (31.4%) |
Housing Structures by Number of Rooms in Tracy City
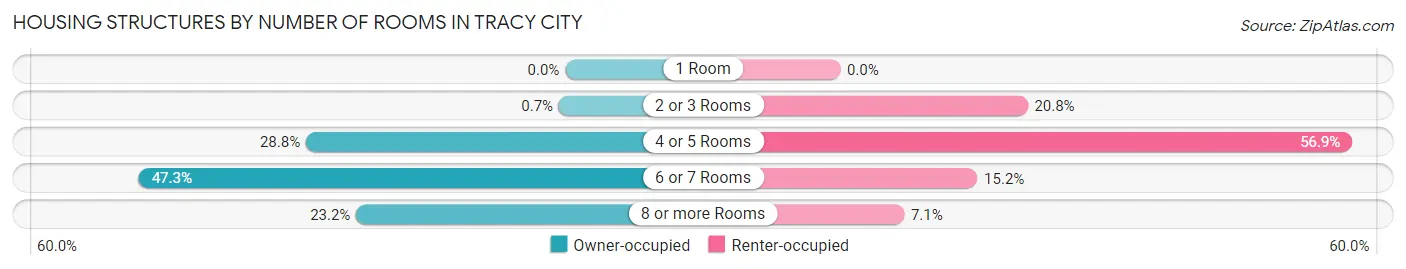
| Number of Rooms | Owner-occupied | Renter-occupied |
| 1 Room | 0 (0.0%) | 0 (0.0%) |
| 2 or 3 Rooms | 3 (0.7%) | 41 (20.8%) |
| 4 or 5 Rooms | 124 (28.8%) | 112 (56.9%) |
| 6 or 7 Rooms | 204 (47.3%) | 30 (15.2%) |
| 8 or more Rooms | 100 (23.2%) | 14 (7.1%) |
| Total | 431 (100.0%) | 197 (100.0%) |
Housing Structure by Heating Type in Tracy City
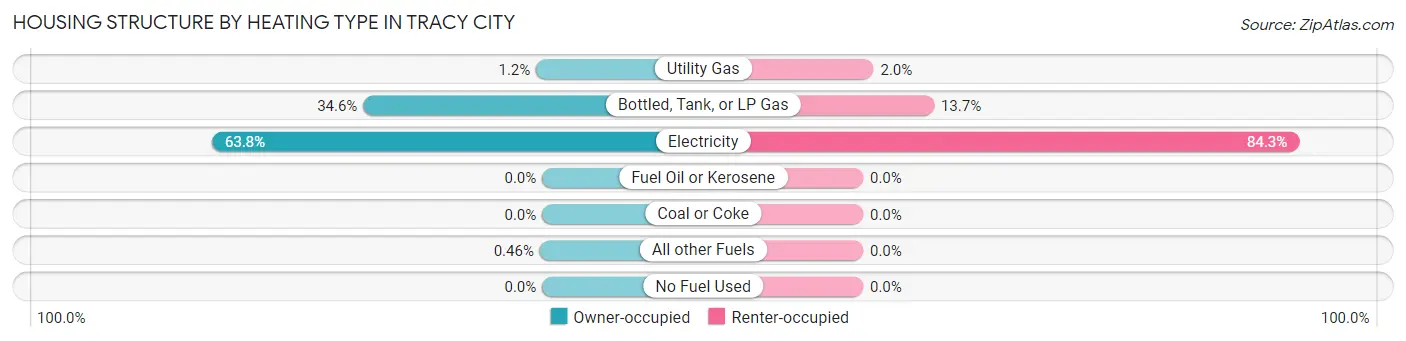
| Heating Type | Owner-occupied | Renter-occupied |
| Utility Gas | 5 (1.2%) | 4 (2.0%) |
| Bottled, Tank, or LP Gas | 149 (34.6%) | 27 (13.7%) |
| Electricity | 275 (63.8%) | 166 (84.3%) |
| Fuel Oil or Kerosene | 0 (0.0%) | 0 (0.0%) |
| Coal or Coke | 0 (0.0%) | 0 (0.0%) |
| All other Fuels | 2 (0.5%) | 0 (0.0%) |
| No Fuel Used | 0 (0.0%) | 0 (0.0%) |
| Total | 431 (100.0%) | 197 (100.0%) |
Household Vehicle Usage in Tracy City
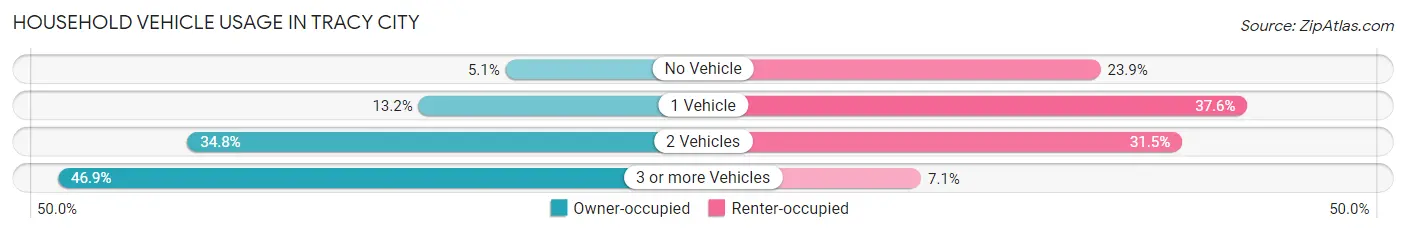
| Vehicles per Household | Owner-occupied | Renter-occupied |
| No Vehicle | 22 (5.1%) | 47 (23.9%) |
| 1 Vehicle | 57 (13.2%) | 74 (37.6%) |
| 2 Vehicles | 150 (34.8%) | 62 (31.5%) |
| 3 or more Vehicles | 202 (46.9%) | 14 (7.1%) |
| Total | 431 (100.0%) | 197 (100.0%) |
Real Estate & Mortgages in Tracy City
Real Estate and Mortgage Overview in Tracy City
| Characteristic | Without Mortgage | With Mortgage |
| Housing Units | 241 | 190 |
| Median Property Value | $127,000 | $117,600 |
| Median Household Income | $75,313 | $6 |
| Monthly Housing Costs | $383 | $8 |
| Real Estate Taxes | $636 | $0 |
Property Value by Mortgage Status in Tracy City
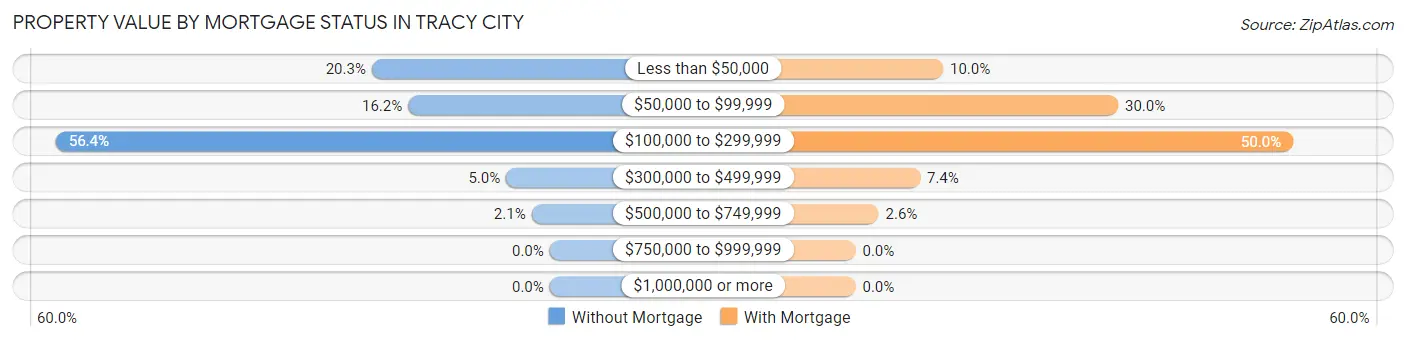
| Property Value | Without Mortgage | With Mortgage |
| Less than $50,000 | 49 (20.3%) | 19 (10.0%) |
| $50,000 to $99,999 | 39 (16.2%) | 57 (30.0%) |
| $100,000 to $299,999 | 136 (56.4%) | 95 (50.0%) |
| $300,000 to $499,999 | 12 (5.0%) | 14 (7.4%) |
| $500,000 to $749,999 | 5 (2.1%) | 5 (2.6%) |
| $750,000 to $999,999 | 0 (0.0%) | 0 (0.0%) |
| $1,000,000 or more | 0 (0.0%) | 0 (0.0%) |
| Total | 241 (100.0%) | 190 (100.0%) |
Household Income by Mortgage Status in Tracy City
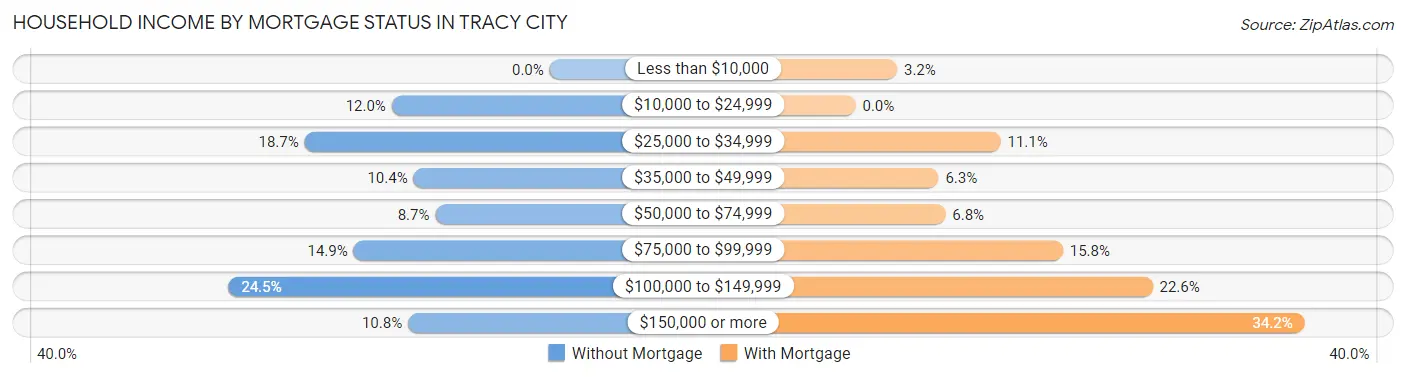
| Household Income | Without Mortgage | With Mortgage |
| Less than $10,000 | 0 (0.0%) | 6 (3.2%) |
| $10,000 to $24,999 | 29 (12.0%) | 0 (0.0%) |
| $25,000 to $34,999 | 45 (18.7%) | 21 (11.1%) |
| $35,000 to $49,999 | 25 (10.4%) | 12 (6.3%) |
| $50,000 to $74,999 | 21 (8.7%) | 13 (6.8%) |
| $75,000 to $99,999 | 36 (14.9%) | 30 (15.8%) |
| $100,000 to $149,999 | 59 (24.5%) | 43 (22.6%) |
| $150,000 or more | 26 (10.8%) | 65 (34.2%) |
| Total | 241 (100.0%) | 190 (100.0%) |
Property Value to Household Income Ratio in Tracy City
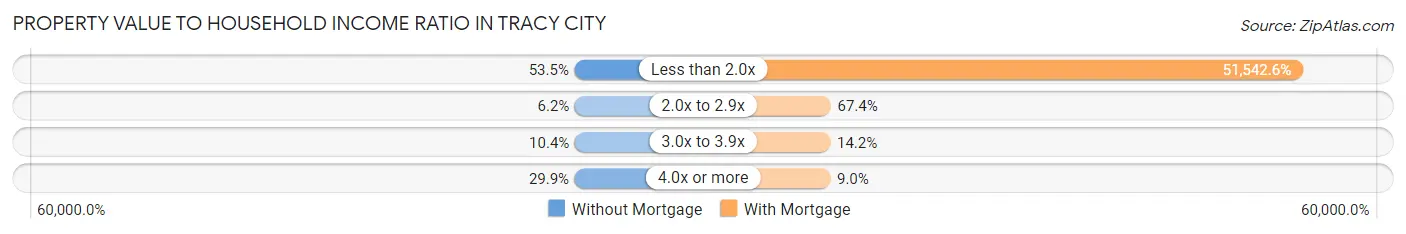
| Value-to-Income Ratio | Without Mortgage | With Mortgage |
| Less than 2.0x | 129 (53.5%) | 97,931 (51,542.6%) |
| 2.0x to 2.9x | 15 (6.2%) | 128 (67.4%) |
| 3.0x to 3.9x | 25 (10.4%) | 27 (14.2%) |
| 4.0x or more | 72 (29.9%) | 17 (8.9%) |
| Total | 241 (100.0%) | 190 (100.0%) |
Real Estate Taxes by Mortgage Status in Tracy City
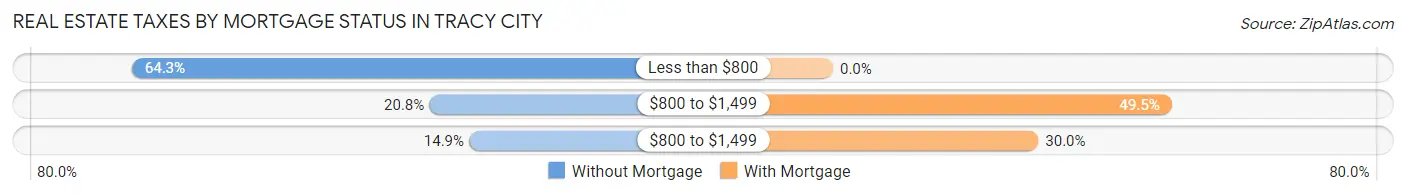
| Property Taxes | Without Mortgage | With Mortgage |
| Less than $800 | 155 (64.3%) | 0 (0.0%) |
| $800 to $1,499 | 50 (20.7%) | 94 (49.5%) |
| $800 to $1,499 | 36 (14.9%) | 57 (30.0%) |
| Total | 241 (100.0%) | 190 (100.0%) |
Health & Disability in Tracy City
Health Insurance Coverage by Age in Tracy City
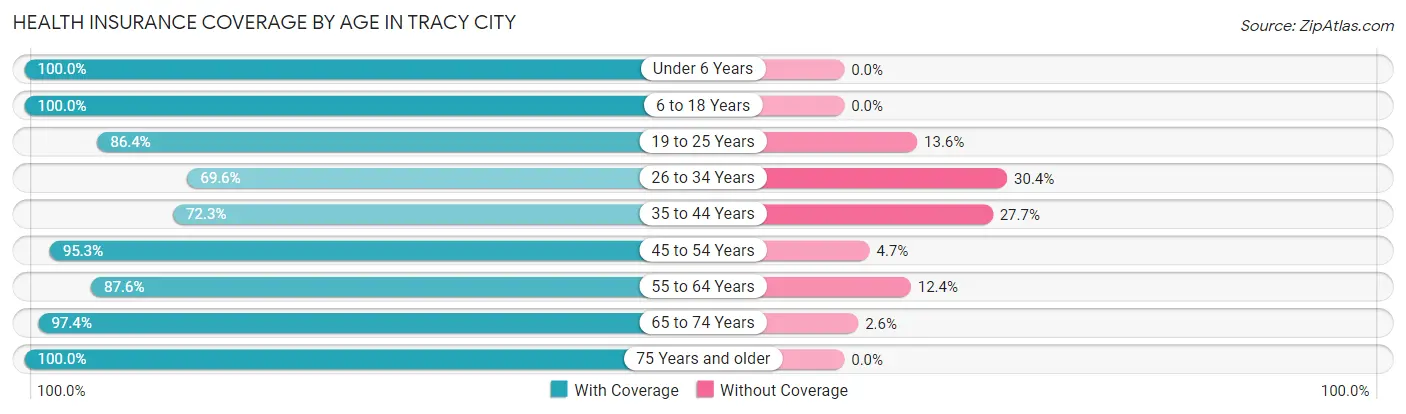
| Age Bracket | With Coverage | Without Coverage |
| Under 6 Years | 218 (100.0%) | 0 (0.0%) |
| 6 to 18 Years | 405 (100.0%) | 0 (0.0%) |
| 19 to 25 Years | 140 (86.4%) | 22 (13.6%) |
| 26 to 34 Years | 156 (69.6%) | 68 (30.4%) |
| 35 to 44 Years | 196 (72.3%) | 75 (27.7%) |
| 45 to 54 Years | 162 (95.3%) | 8 (4.7%) |
| 55 to 64 Years | 226 (87.6%) | 32 (12.4%) |
| 65 to 74 Years | 150 (97.4%) | 4 (2.6%) |
| 75 Years and older | 146 (100.0%) | 0 (0.0%) |
| Total | 1,799 (89.6%) | 209 (10.4%) |
Health Insurance Coverage by Citizenship Status in Tracy City
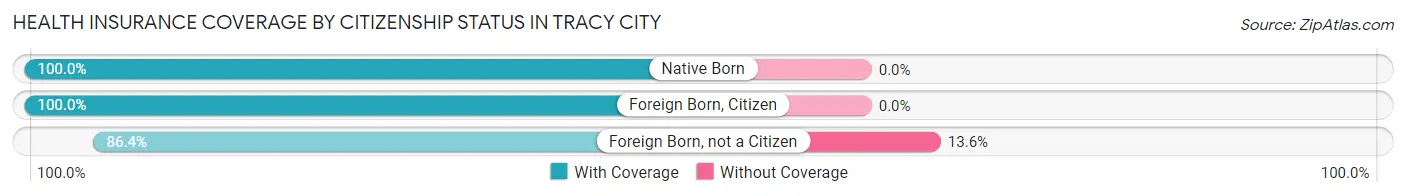
| Citizenship Status | With Coverage | Without Coverage |
| Native Born | 218 (100.0%) | 0 (0.0%) |
| Foreign Born, Citizen | 405 (100.0%) | 0 (0.0%) |
| Foreign Born, not a Citizen | 140 (86.4%) | 22 (13.6%) |
Health Insurance Coverage by Household Income in Tracy City
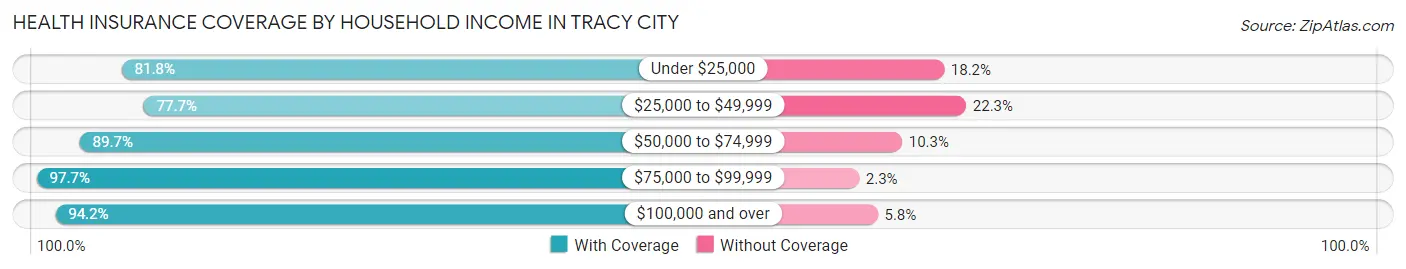
| Household Income | With Coverage | Without Coverage |
| Under $25,000 | 225 (81.8%) | 50 (18.2%) |
| $25,000 to $49,999 | 282 (77.7%) | 81 (22.3%) |
| $50,000 to $74,999 | 261 (89.7%) | 30 (10.3%) |
| $75,000 to $99,999 | 389 (97.7%) | 9 (2.3%) |
| $100,000 and over | 638 (94.2%) | 39 (5.8%) |
Public vs Private Health Insurance Coverage by Age in Tracy City
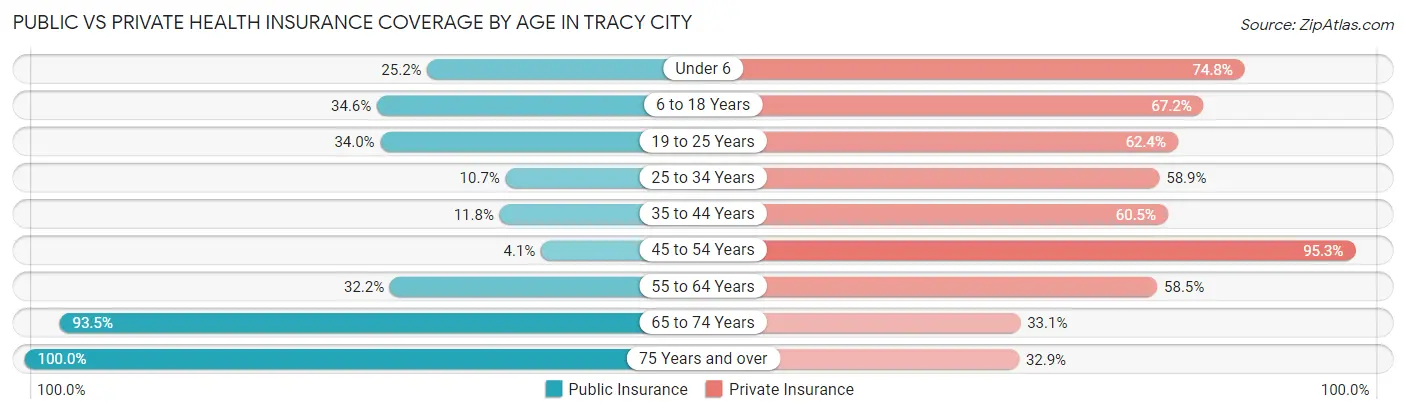
| Age Bracket | Public Insurance | Private Insurance |
| Under 6 | 55 (25.2%) | 163 (74.8%) |
| 6 to 18 Years | 140 (34.6%) | 272 (67.2%) |
| 19 to 25 Years | 55 (34.0%) | 101 (62.4%) |
| 25 to 34 Years | 24 (10.7%) | 132 (58.9%) |
| 35 to 44 Years | 32 (11.8%) | 164 (60.5%) |
| 45 to 54 Years | 7 (4.1%) | 162 (95.3%) |
| 55 to 64 Years | 83 (32.2%) | 151 (58.5%) |
| 65 to 74 Years | 144 (93.5%) | 51 (33.1%) |
| 75 Years and over | 146 (100.0%) | 48 (32.9%) |
| Total | 686 (34.2%) | 1,244 (62.0%) |
Disability Status by Sex by Age in Tracy City
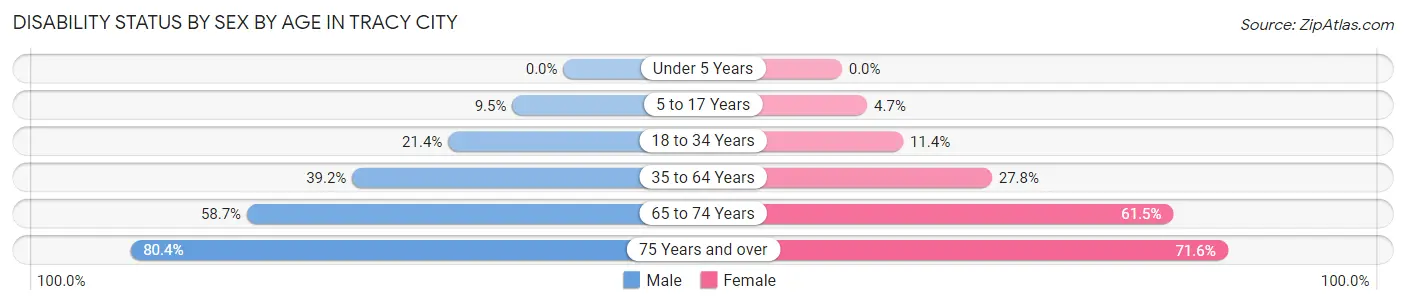
| Age Bracket | Male | Female |
| Under 5 Years | 0 (0.0%) | 0 (0.0%) |
| 5 to 17 Years | 22 (9.5%) | 8 (4.7%) |
| 18 to 34 Years | 62 (21.4%) | 15 (11.4%) |
| 35 to 64 Years | 136 (39.2%) | 98 (27.8%) |
| 65 to 74 Years | 37 (58.7%) | 56 (61.5%) |
| 75 Years and over | 41 (80.4%) | 68 (71.6%) |
Disability Class by Sex by Age in Tracy City
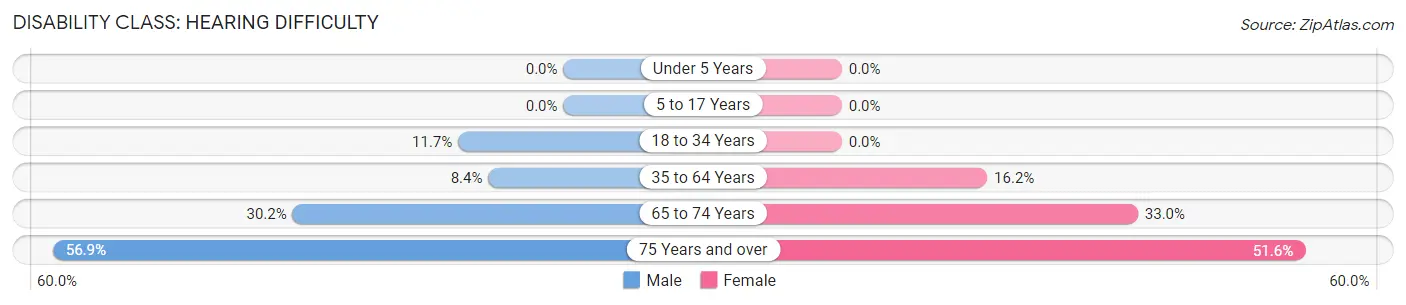
Disability Class: Hearing Difficulty
| Age Bracket | Male | Female |
| Under 5 Years | 0 (0.0%) | 0 (0.0%) |
| 5 to 17 Years | 0 (0.0%) | 0 (0.0%) |
| 18 to 34 Years | 34 (11.7%) | 0 (0.0%) |
| 35 to 64 Years | 29 (8.4%) | 57 (16.2%) |
| 65 to 74 Years | 19 (30.2%) | 30 (33.0%) |
| 75 Years and over | 29 (56.9%) | 49 (51.6%) |
Disability Class: Vision Difficulty
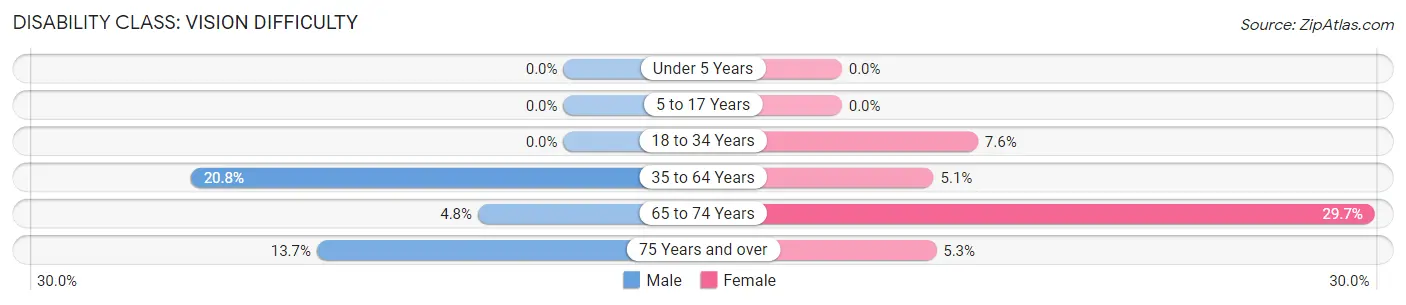
| Age Bracket | Male | Female |
| Under 5 Years | 0 (0.0%) | 0 (0.0%) |
| 5 to 17 Years | 0 (0.0%) | 0 (0.0%) |
| 18 to 34 Years | 0 (0.0%) | 10 (7.6%) |
| 35 to 64 Years | 72 (20.7%) | 18 (5.1%) |
| 65 to 74 Years | 3 (4.8%) | 27 (29.7%) |
| 75 Years and over | 7 (13.7%) | 5 (5.3%) |
Disability Class: Cognitive Difficulty
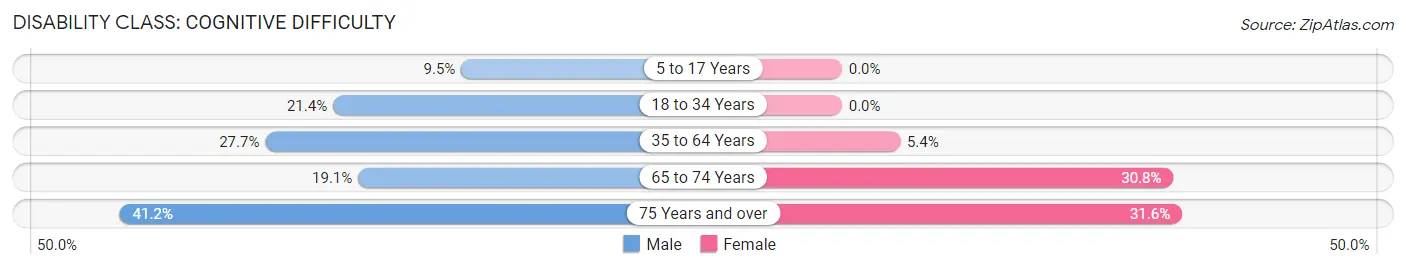
| Age Bracket | Male | Female |
| 5 to 17 Years | 22 (9.5%) | 0 (0.0%) |
| 18 to 34 Years | 62 (21.4%) | 0 (0.0%) |
| 35 to 64 Years | 96 (27.7%) | 19 (5.4%) |
| 65 to 74 Years | 12 (19.1%) | 28 (30.8%) |
| 75 Years and over | 21 (41.2%) | 30 (31.6%) |
Disability Class: Ambulatory Difficulty
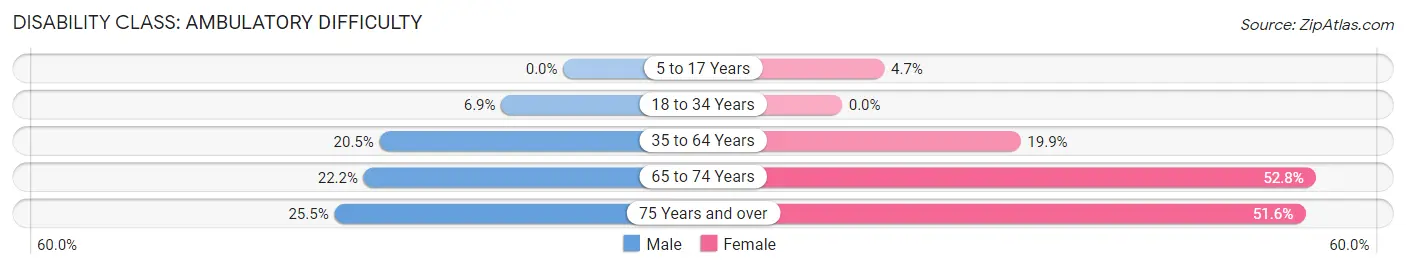
| Age Bracket | Male | Female |
| 5 to 17 Years | 0 (0.0%) | 8 (4.7%) |
| 18 to 34 Years | 20 (6.9%) | 0 (0.0%) |
| 35 to 64 Years | 71 (20.5%) | 70 (19.9%) |
| 65 to 74 Years | 14 (22.2%) | 48 (52.7%) |
| 75 Years and over | 13 (25.5%) | 49 (51.6%) |
Disability Class: Self-Care Difficulty
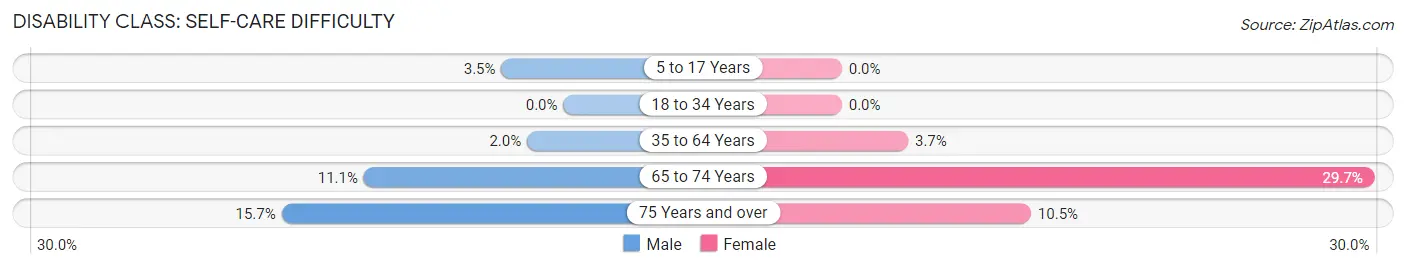
| Age Bracket | Male | Female |
| 5 to 17 Years | 8 (3.5%) | 0 (0.0%) |
| 18 to 34 Years | 0 (0.0%) | 0 (0.0%) |
| 35 to 64 Years | 7 (2.0%) | 13 (3.7%) |
| 65 to 74 Years | 7 (11.1%) | 27 (29.7%) |
| 75 Years and over | 8 (15.7%) | 10 (10.5%) |
Technology Access in Tracy City
Computing Device Access in Tracy City
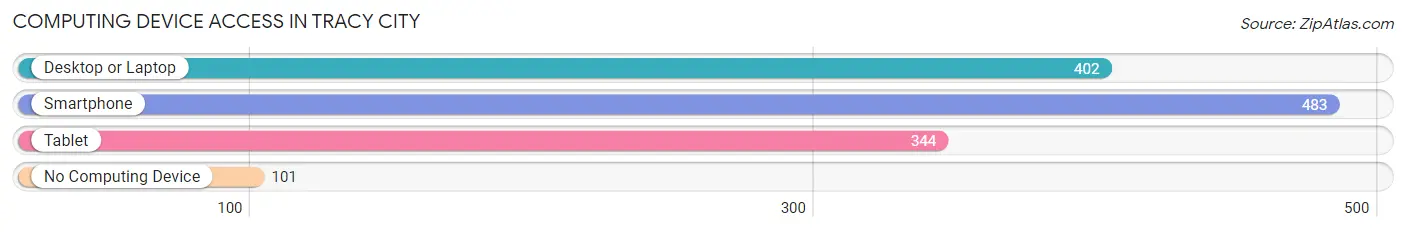
| Device Type | # Households | % Households |
| Desktop or Laptop | 402 | 64.0% |
| Smartphone | 483 | 76.9% |
| Tablet | 344 | 54.8% |
| No Computing Device | 101 | 16.1% |
| Total | 628 | 100.0% |
Internet Access in Tracy City
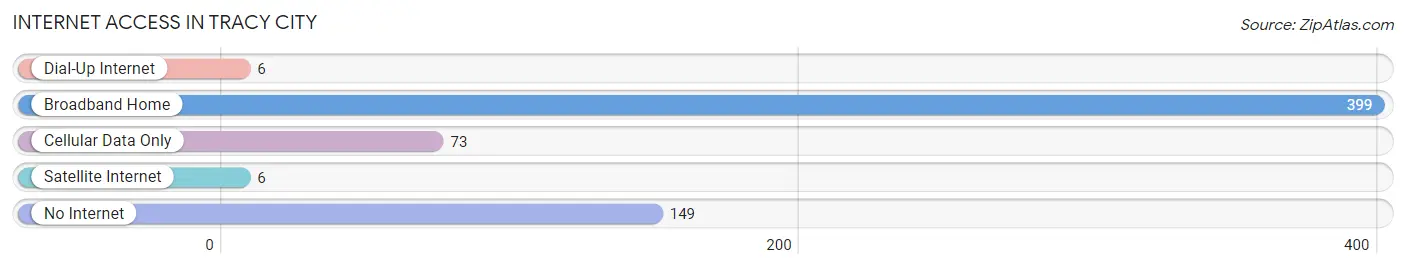
| Internet Type | # Households | % Households |
| Dial-Up Internet | 6 | 1.0% |
| Broadband Home | 399 | 63.5% |
| Cellular Data Only | 73 | 11.6% |
| Satellite Internet | 6 | 1.0% |
| No Internet | 149 | 23.7% |
| Total | 628 | 100.0% |
Tracy City Summary
Tracy City is a small town located in Grundy County, Tennessee. It is situated in the foothills of the Cumberland Plateau, approximately halfway between Chattanooga and Nashville. The town was founded in 1856 and was named after a local family, the Tracys. The population of Tracy City was 1,717 at the 2010 census.
Geography
Tracy City is located at 35°14'25"N 85°37'17"W (35.240278, -85.621389). It is situated in the foothills of the Cumberland Plateau, approximately halfway between Chattanooga and Nashville. The town is located at the intersection of U.S. Route 41 and State Route 56. The town is surrounded by the communities of Monteagle, Palmer, and Gruetli-Laager.
The town is situated in a valley surrounded by mountains. The highest point in the area is Monteagle Mountain, which rises to an elevation of 2,400 feet (731 m). The town is located in a humid subtropical climate zone, with hot summers and mild winters. The average annual temperature is 61°F (16°C). The average annual precipitation is 45.5 inches (115.6 cm).
Economy
Tracy City is a small town with a limited economy. The town is home to several small businesses, including a grocery store, a hardware store, a pharmacy, and a few restaurants. The town is also home to a few manufacturing companies, including a furniture factory and a textile mill. The town is also home to a few tourist attractions, including the Grundy County Museum and the Tracy City Railroad Museum.
The town is also home to a few coal mines, which provide employment for many of the town's residents. The coal mines are owned by the Tennessee Valley Authority (TVA) and are operated by the Grundy County Coal Company. The coal mines provide the town with a significant source of income.
Demographics
As of the 2010 census, the population of Tracy City was 1,717. The racial makeup of the town was 97.2% White, 0.9% African American, 0.2% Native American, 0.2% Asian, 0.1% Pacific Islander, 0.4% from other races, and 0.9% from two or more races. Hispanic or Latino of any race were 1.2% of the population.
The median income for a household in the town was $30,938, and the median income for a family was $37,500. The per capita income for the town was $17,845. About 17.2% of families and 20.2% of the population were below the poverty line, including 28.3% of those under age 18 and 15.2% of those age 65 or over.
Conclusion
Tracy City is a small town located in Grundy County, Tennessee. It is situated in the foothills of the Cumberland Plateau, approximately halfway between Chattanooga and Nashville. The town was founded in 1856 and was named after a local family, the Tracys. The population of Tracy City was 1,717 at the 2010 census. The town is home to several small businesses, including a grocery store, a hardware store, a pharmacy, and a few restaurants. The town is also home to a few manufacturing companies, including a furniture factory and a textile mill. The town is also home to a few tourist attractions, including the Grundy County Museum and the Tracy City Railroad Museum. The town is also home to a few coal mines, which provide employment for many of the town's residents. The racial makeup of the town was 97.2% White, 0.9% African American, 0.2% Native American, 0.2% Asian, 0.1% Pacific Islander, 0.4% from other races, and 0.9% from two or more races. The median income for a household in the town was $30,938, and the median income for a family was $37,500. Tracy City is a small town with a limited economy, but it is a great place to live and work.
Common Questions
What is Per Capita Income in Tracy City?
Per Capita income in Tracy City is $25,988.
What is the Median Family Income in Tracy City?
Median Family Income in Tracy City is $84,688.
What is the Median Household income in Tracy City?
Median Household Income in Tracy City is $56,481.
What is Income or Wage Gap in Tracy City?
Income or Wage Gap in Tracy City is 25.6%.
Women in Tracy City earn 74.4 cents for every dollar earned by a man.
What is Family Income Deficit in Tracy City?
Family Income Deficit in Tracy City is $7,583.
Families that are below poverty line in Tracy City earn $7,583 less on average than the poverty threshold level.
What is Inequality or Gini Index in Tracy City?
Inequality or Gini Index in Tracy City is 0.46.
What is the Total Population of Tracy City?
Total Population of Tracy City is 2,008.
What is the Total Male Population of Tracy City?
Total Male Population of Tracy City is 1,061.
What is the Total Female Population of Tracy City?
Total Female Population of Tracy City is 947.
What is the Ratio of Males per 100 Females in Tracy City?
There are 112.04 Males per 100 Females in Tracy City.
What is the Ratio of Females per 100 Males in Tracy City?
There are 89.26 Females per 100 Males in Tracy City.
What is the Median Population Age in Tracy City?
Median Population Age in Tracy City is 34.8 Years.
What is the Average Family Size in Tracy City
Average Family Size in Tracy City is 3.8 People.
What is the Average Household Size in Tracy City
Average Household Size in Tracy City is 3.2 People.
How Large is the Labor Force in Tracy City?
There are 759 People in the Labor Forcein in Tracy City.
What is the Percentage of People in the Labor Force in Tracy City?
52.8% of People are in the Labor Force in Tracy City.
What is the Unemployment Rate in Tracy City?
Unemployment Rate in Tracy City is 3.3%.