Tellico Plains, TN Map & Demographics
Tellico Plains Map
Tellico Plains Overview
$19,419
PER CAPITA INCOME
$48,750
AVG FAMILY INCOME
$39,886
AVG HOUSEHOLD INCOME
37.3%
WAGE / INCOME GAP [ % ]
62.7¢/ $1
WAGE / INCOME GAP [ $ ]
0.45
INEQUALITY / GINI INDEX
1,275
TOTAL POPULATION
652
MALE POPULATION
623
FEMALE POPULATION
104.65
MALES / 100 FEMALES
95.55
FEMALES / 100 MALES
32.4
MEDIAN AGE
3.1
AVG FAMILY SIZE
2.7
AVG HOUSEHOLD SIZE
463
LABOR FORCE [ PEOPLE ]
55.3%
PERCENT IN LABOR FORCE
6.5%
UNEMPLOYMENT RATE
Tellico Plains Zip Codes
Tellico Plains Area Codes
Income in Tellico Plains
Income Overview in Tellico Plains
Per Capita Income in Tellico Plains is $19,419, while median incomes of families and households are $48,750 and $39,886 respectively.
| Characteristic | Number | Measure |
| Per Capita Income | 1,275 | $19,419 |
| Median Family Income | 342 | $48,750 |
| Mean Family Income | 342 | $63,624 |
| Median Household Income | 476 | $39,886 |
| Mean Household Income | 476 | $54,225 |
| Income Deficit | 342 | $0 |
| Wage / Income Gap (%) | 1,275 | 37.30% |
| Wage / Income Gap ($) | 1,275 | 62.70¢ per $1 |
| Gini / Inequality Index | 1,275 | 0.45 |
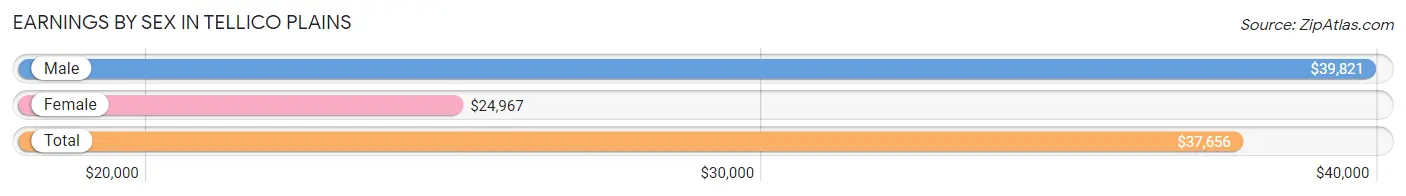
Earnings by Sex in Tellico Plains
Average Earnings in Tellico Plains are $37,656, $39,821 for men and $24,967 for women, a difference of 37.3%.
| Sex | Number | Average Earnings |
| Male | 266 (55.3%) | $39,821 |
| Female | 215 (44.7%) | $24,967 |
| Total | 481 (100.0%) | $37,656 |
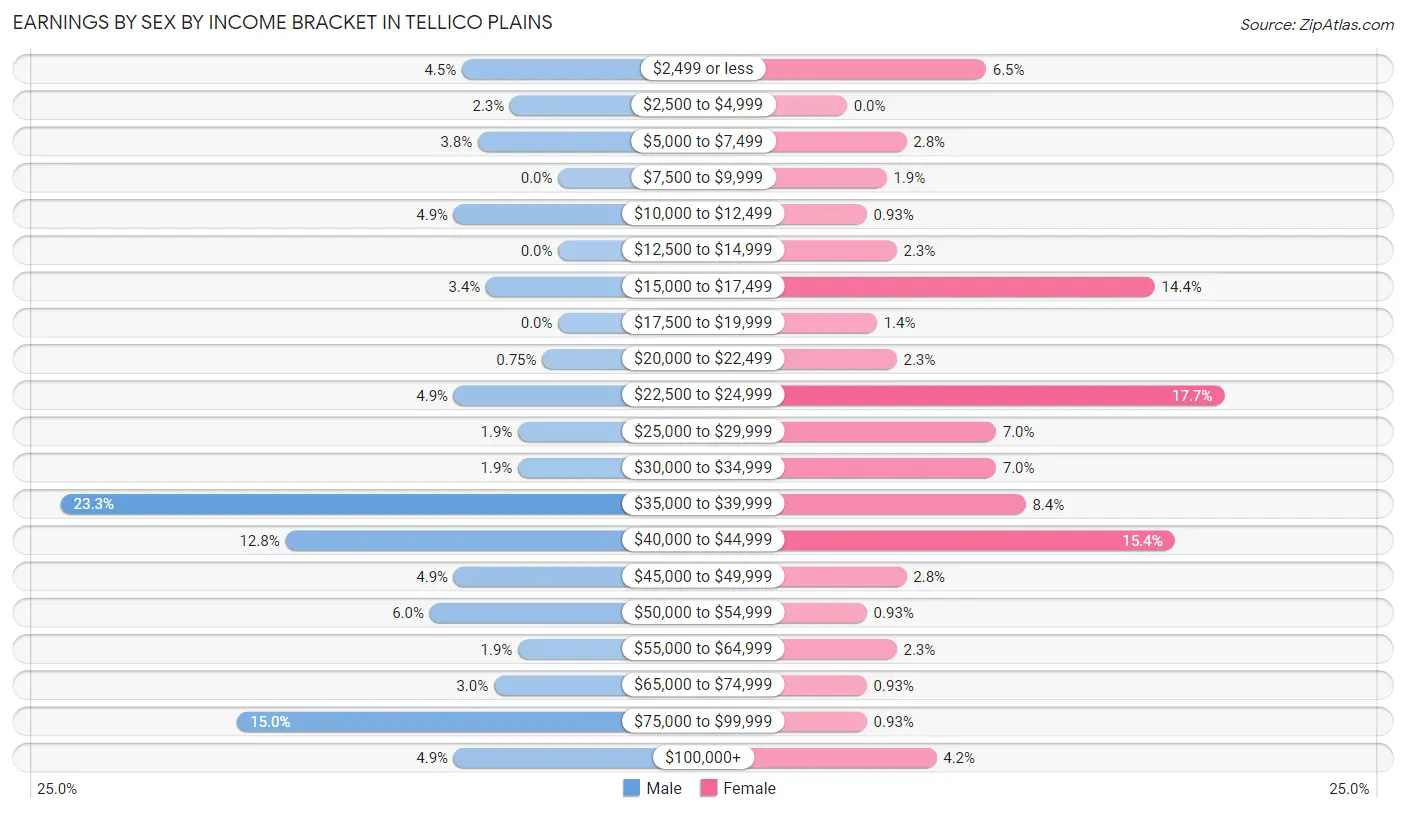
Earnings by Sex by Income Bracket in Tellico Plains
The most common earnings brackets in Tellico Plains are $35,000 to $39,999 for men (62 | 23.3%) and $22,500 to $24,999 for women (38 | 17.7%).
| Income | Male | Female |
| $2,499 or less | 12 (4.5%) | 14 (6.5%) |
| $2,500 to $4,999 | 6 (2.3%) | 0 (0.0%) |
| $5,000 to $7,499 | 10 (3.8%) | 6 (2.8%) |
| $7,500 to $9,999 | 0 (0.0%) | 4 (1.9%) |
| $10,000 to $12,499 | 13 (4.9%) | 2 (0.9%) |
| $12,500 to $14,999 | 0 (0.0%) | 5 (2.3%) |
| $15,000 to $17,499 | 9 (3.4%) | 31 (14.4%) |
| $17,500 to $19,999 | 0 (0.0%) | 3 (1.4%) |
| $20,000 to $22,499 | 2 (0.7%) | 5 (2.3%) |
| $22,500 to $24,999 | 13 (4.9%) | 38 (17.7%) |
| $25,000 to $29,999 | 5 (1.9%) | 15 (7.0%) |
| $30,000 to $34,999 | 5 (1.9%) | 15 (7.0%) |
| $35,000 to $39,999 | 62 (23.3%) | 18 (8.4%) |
| $40,000 to $44,999 | 34 (12.8%) | 33 (15.3%) |
| $45,000 to $49,999 | 13 (4.9%) | 6 (2.8%) |
| $50,000 to $54,999 | 16 (6.0%) | 2 (0.9%) |
| $55,000 to $64,999 | 5 (1.9%) | 5 (2.3%) |
| $65,000 to $74,999 | 8 (3.0%) | 2 (0.9%) |
| $75,000 to $99,999 | 40 (15.0%) | 2 (0.9%) |
| $100,000+ | 13 (4.9%) | 9 (4.2%) |
| Total | 266 (100.0%) | 215 (100.0%) |
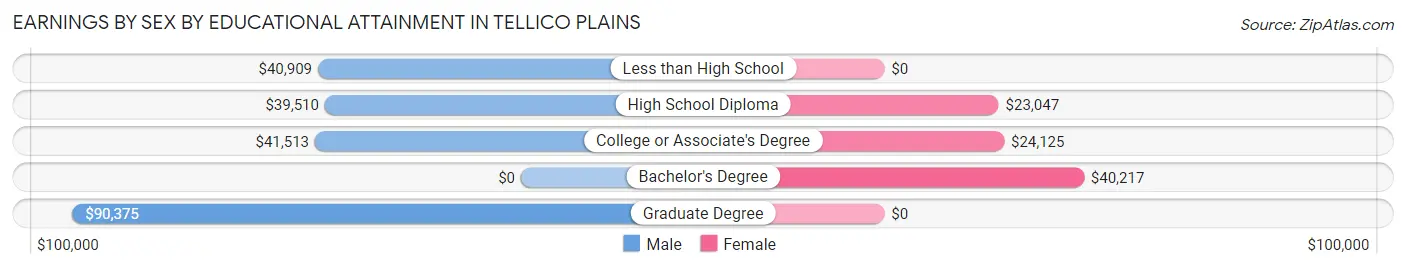
Earnings by Sex by Educational Attainment in Tellico Plains
Average earnings in Tellico Plains are $41,133 for men and $25,500 for women, a difference of 38.0%. Men with an educational attainment of graduate degree enjoy the highest average annual earnings of $90,375, while those with high school diploma education earn the least with $39,510. Women with an educational attainment of bachelor's degree earn the most with the average annual earnings of $40,217, while those with high school diploma education have the smallest earnings of $23,047.
| Educational Attainment | Male Income | Female Income |
| Less than High School | $40,909 | $0 |
| High School Diploma | $39,510 | $23,047 |
| College or Associate's Degree | $41,513 | $24,125 |
| Bachelor's Degree | - | - |
| Graduate Degree | $90,375 | $0 |
| Total | $41,133 | $25,500 |
Family Income in Tellico Plains
Family Income Brackets in Tellico Plains
According to the Tellico Plains family income data, there are 71 families falling into the $35,000 to $49,999 income range, which is the most common income bracket and makes up 20.8% of all families. Conversely, the $150,000 to $199,999 income bracket is the least frequent group with only 4 families (1.2%) belonging to this category.
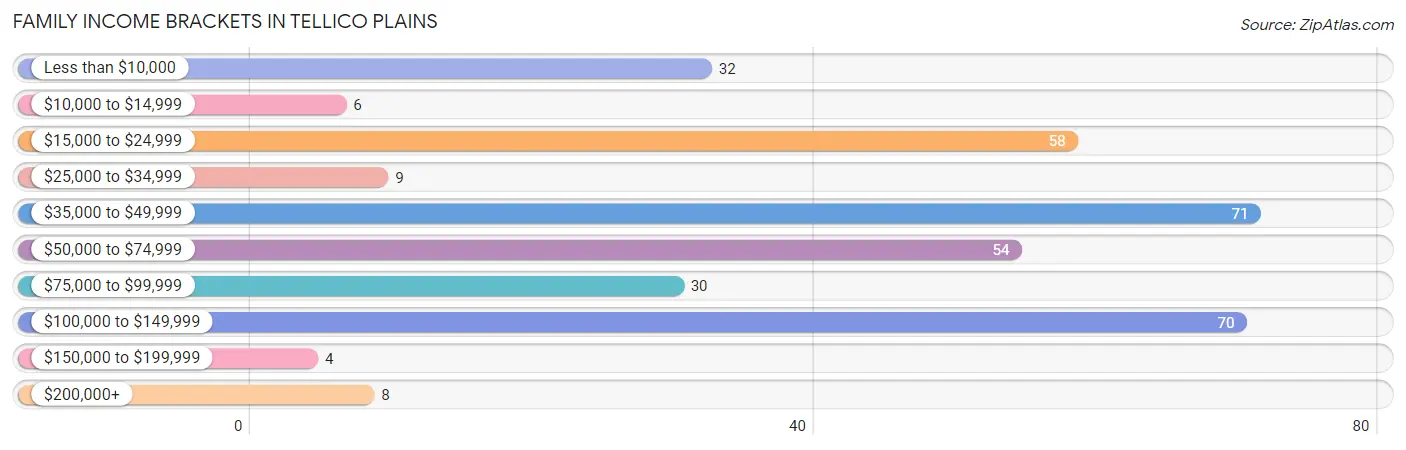
| Income Bracket | # Families | % Families |
| Less than $10,000 | 32 | 9.4% |
| $10,000 to $14,999 | 6 | 1.8% |
| $15,000 to $24,999 | 58 | 17.0% |
| $25,000 to $34,999 | 9 | 2.6% |
| $35,000 to $49,999 | 71 | 20.8% |
| $50,000 to $74,999 | 54 | 15.8% |
| $75,000 to $99,999 | 30 | 8.8% |
| $100,000 to $149,999 | 70 | 20.5% |
| $150,000 to $199,999 | 4 | 1.2% |
| $200,000+ | 8 | 2.3% |
Family Income by Famaliy Size in Tellico Plains
4-person families (78 | 22.8%) account for the highest median family income in Tellico Plains with $110,078 per family, while 2-person families (144 | 42.1%) have the highest median income of $35,116 per family member.
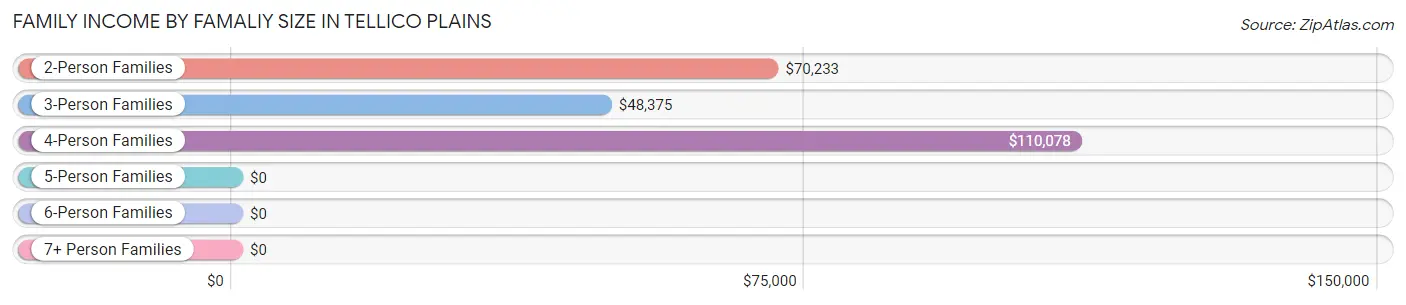
| Income Bracket | # Families | Median Income |
| 2-Person Families | 144 (42.1%) | $70,233 |
| 3-Person Families | 73 (21.3%) | $48,375 |
| 4-Person Families | 78 (22.8%) | $110,078 |
| 5-Person Families | 38 (11.1%) | $0 |
| 6-Person Families | 9 (2.6%) | $0 |
| 7+ Person Families | 0 (0.0%) | $0 |
| Total | 342 (100.0%) | $48,750 |
Family Income by Number of Earners in Tellico Plains
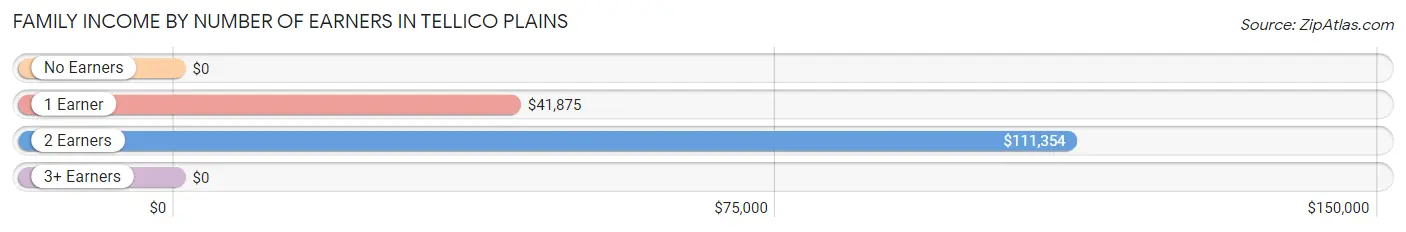
| Number of Earners | # Families | Median Income |
| No Earners | 65 (19.0%) | $0 |
| 1 Earner | 181 (52.9%) | $41,875 |
| 2 Earners | 83 (24.3%) | $111,354 |
| 3+ Earners | 13 (3.8%) | $0 |
| Total | 342 (100.0%) | $48,750 |
Household Income in Tellico Plains
Household Income Brackets in Tellico Plains
With 96 households falling in the category, the $35,000 to $49,999 income range is the most frequent in Tellico Plains, accounting for 20.2% of all households. In contrast, only 6 households (1.3%) fall into the $150,000 to $199,999 income bracket, making it the least populous group.
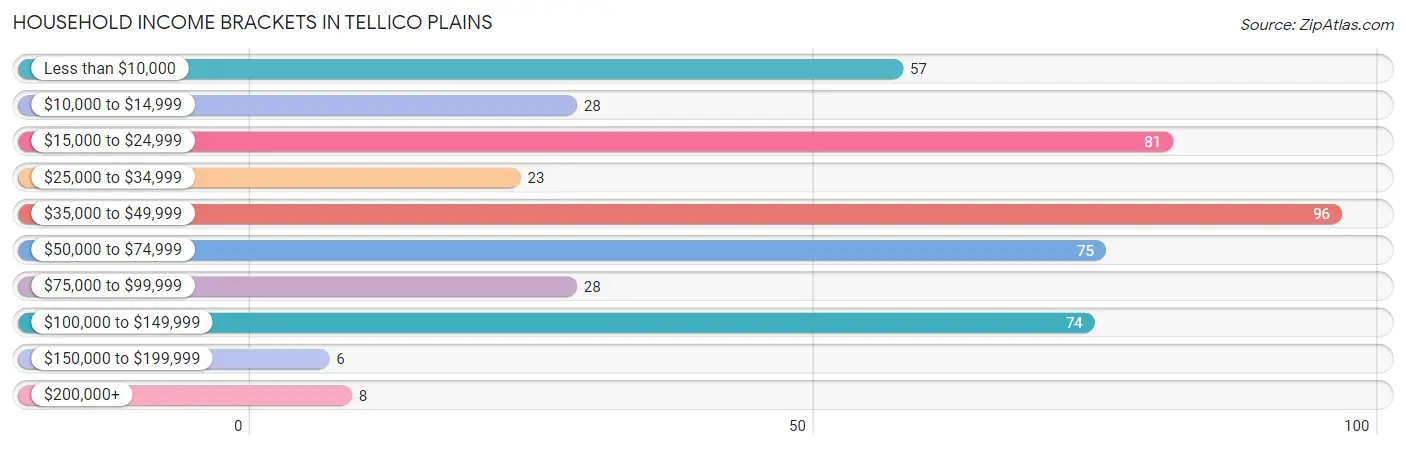
| Income Bracket | # Households | % Households |
| Less than $10,000 | 57 | 12.0% |
| $10,000 to $14,999 | 28 | 5.9% |
| $15,000 to $24,999 | 81 | 17.0% |
| $25,000 to $34,999 | 23 | 4.8% |
| $35,000 to $49,999 | 96 | 20.2% |
| $50,000 to $74,999 | 75 | 15.8% |
| $75,000 to $99,999 | 28 | 5.9% |
| $100,000 to $149,999 | 74 | 15.5% |
| $150,000 to $199,999 | 6 | 1.3% |
| $200,000+ | 8 | 1.7% |
Household Income by Householder Age in Tellico Plains
The median household income in Tellico Plains is $39,886, with the highest median household income of $64,659 found in the 25 to 44 years age bracket for the primary householder. A total of 157 households (33.0%) fall into this category. Meanwhile, the 15 to 24 years age bracket for the primary householder has the lowest median household income of $0, with 2 households (0.4%) in this group.
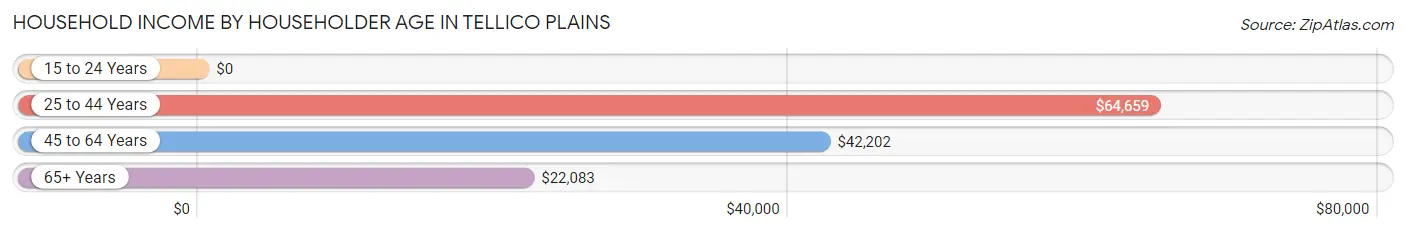
| Income Bracket | # Households | Median Income |
| 15 to 24 Years | 2 (0.4%) | $0 |
| 25 to 44 Years | 157 (33.0%) | $64,659 |
| 45 to 64 Years | 189 (39.7%) | $42,202 |
| 65+ Years | 128 (26.9%) | $22,083 |
| Total | 476 (100.0%) | $39,886 |
Poverty in Tellico Plains
Income Below Poverty by Sex and Age in Tellico Plains
With 28.1% poverty level for males and 33.4% for females among the residents of Tellico Plains, 12 to 14 year old males and 15 year old females are the most vulnerable to poverty, with 19 males (63.3%) and 31 females (100.0%) in their respective age groups living below the poverty level.
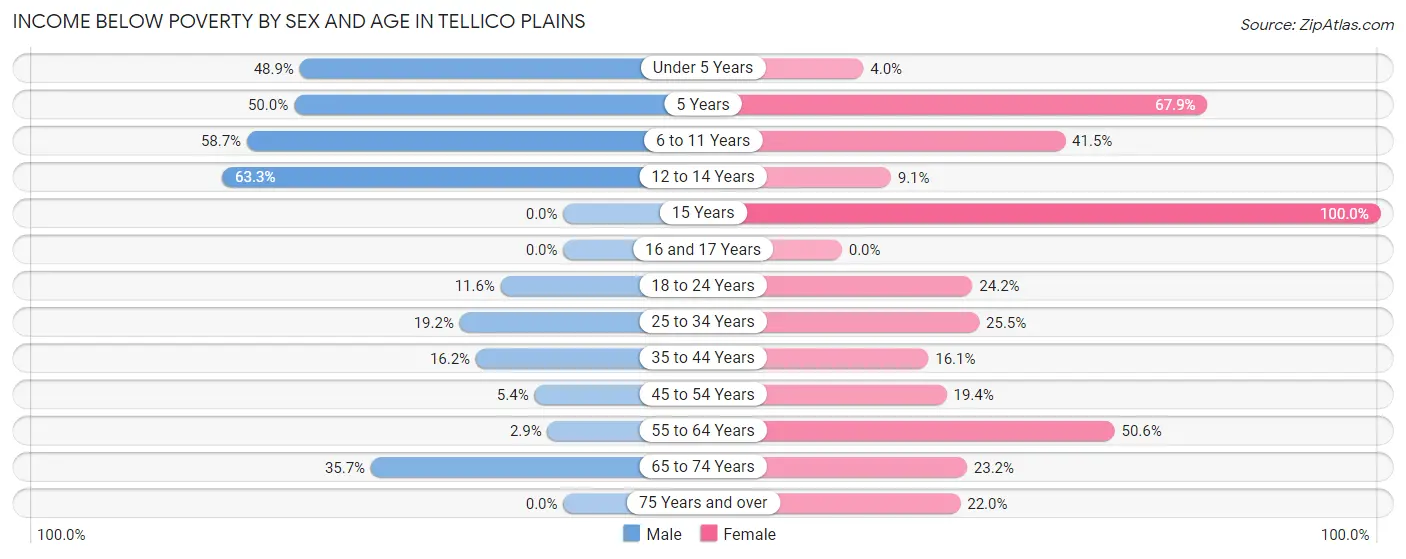
| Age Bracket | Male | Female |
| Under 5 Years | 23 (48.9%) | 1 (4.0%) |
| 5 Years | 23 (50.0%) | 38 (67.9%) |
| 6 to 11 Years | 74 (58.7%) | 17 (41.5%) |
| 12 to 14 Years | 19 (63.3%) | 3 (9.1%) |
| 15 Years | 0 (0.0%) | 31 (100.0%) |
| 16 and 17 Years | 0 (0.0%) | 0 (0.0%) |
| 18 to 24 Years | 5 (11.6%) | 8 (24.2%) |
| 25 to 34 Years | 10 (19.2%) | 26 (25.5%) |
| 35 to 44 Years | 12 (16.2%) | 13 (16.1%) |
| 45 to 54 Years | 6 (5.4%) | 7 (19.4%) |
| 55 to 64 Years | 1 (2.9%) | 40 (50.6%) |
| 65 to 74 Years | 10 (35.7%) | 13 (23.2%) |
| 75 Years and over | 0 (0.0%) | 11 (22.0%) |
| Total | 183 (28.1%) | 208 (33.4%) |
Income Above Poverty by Sex and Age in Tellico Plains
According to the poverty statistics in Tellico Plains, males aged 15 years and females aged under 5 years are the age groups that are most secure financially, with 100.0% of males and 96.0% of females in these age groups living above the poverty line.
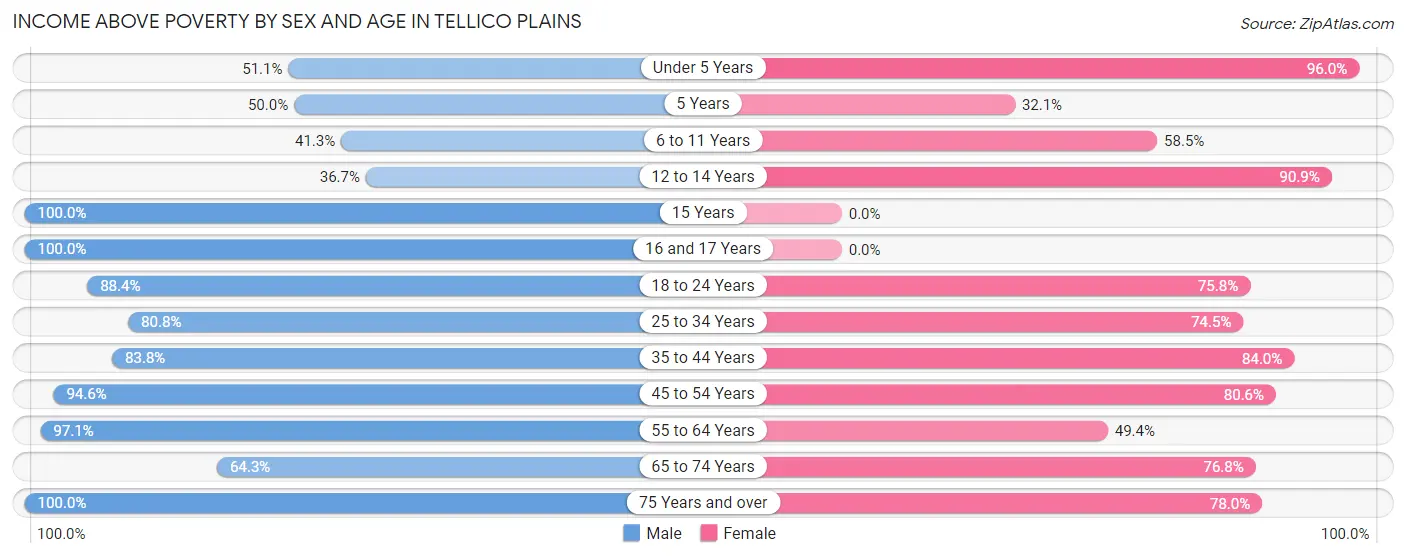
| Age Bracket | Male | Female |
| Under 5 Years | 24 (51.1%) | 24 (96.0%) |
| 5 Years | 23 (50.0%) | 18 (32.1%) |
| 6 to 11 Years | 52 (41.3%) | 24 (58.5%) |
| 12 to 14 Years | 11 (36.7%) | 30 (90.9%) |
| 15 Years | 3 (100.0%) | 0 (0.0%) |
| 16 and 17 Years | 17 (100.0%) | 0 (0.0%) |
| 18 to 24 Years | 38 (88.4%) | 25 (75.8%) |
| 25 to 34 Years | 42 (80.8%) | 76 (74.5%) |
| 35 to 44 Years | 62 (83.8%) | 68 (84.0%) |
| 45 to 54 Years | 106 (94.6%) | 29 (80.6%) |
| 55 to 64 Years | 33 (97.1%) | 39 (49.4%) |
| 65 to 74 Years | 18 (64.3%) | 43 (76.8%) |
| 75 Years and over | 40 (100.0%) | 39 (78.0%) |
| Total | 469 (71.9%) | 415 (66.6%) |
Income Below Poverty Among Married-Couple Families in Tellico Plains
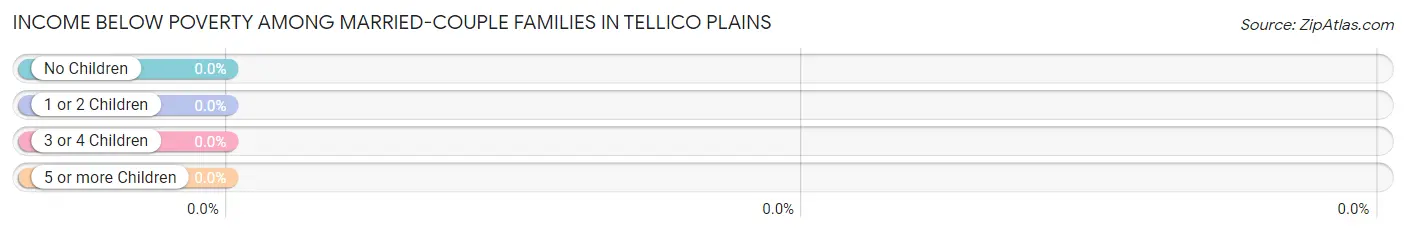
| Children | Above Poverty | Below Poverty |
| No Children | 88 (100.0%) | 0 (0.0%) |
| 1 or 2 Children | 65 (100.0%) | 0 (0.0%) |
| 3 or 4 Children | 10 (100.0%) | 0 (0.0%) |
| 5 or more Children | 0 (0.0%) | 0 (0.0%) |
| Total | 163 (100.0%) | 0 (0.0%) |
Income Below Poverty Among Single-Parent Households in Tellico Plains
According to the poverty data in Tellico Plains, 10.3% or 9 single-father households and 70.7% or 65 single-mother households are living below the poverty line. Among single-father households, those with 1 or 2 children have the highest poverty rate, with 9 households (21.4%) experiencing poverty. Likewise, among single-mother households, those with 5 or more children have the highest poverty rate, with 7 households (100.0%) falling below the poverty line.
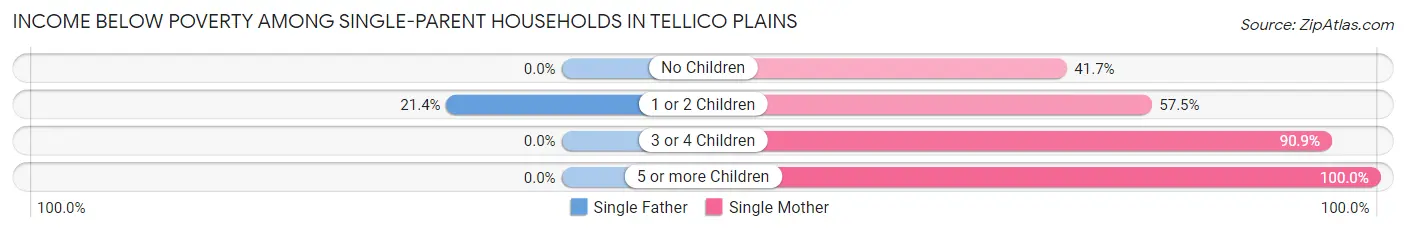
| Children | Single Father | Single Mother |
| No Children | 0 (0.0%) | 5 (41.7%) |
| 1 or 2 Children | 9 (21.4%) | 23 (57.5%) |
| 3 or 4 Children | 0 (0.0%) | 30 (90.9%) |
| 5 or more Children | 0 (0.0%) | 7 (100.0%) |
| Total | 9 (10.3%) | 65 (70.7%) |
Income Below Poverty Among Married-Couple vs Single-Parent Households in Tellico Plains
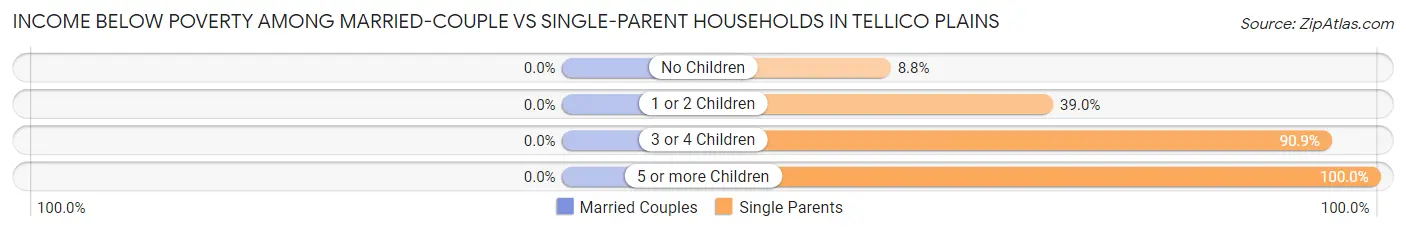
| Children | Married-Couple Families | Single-Parent Households |
| No Children | 0 (0.0%) | 5 (8.8%) |
| 1 or 2 Children | 0 (0.0%) | 32 (39.0%) |
| 3 or 4 Children | 0 (0.0%) | 30 (90.9%) |
| 5 or more Children | 0 (0.0%) | 7 (100.0%) |
| Total | 0 (0.0%) | 74 (41.3%) |
Race in Tellico Plains
The most populous races in Tellico Plains are White / Caucasian (1,229 | 96.4%), Two or more Races (41 | 3.2%), and Hispanic or Latino (40 | 3.1%).
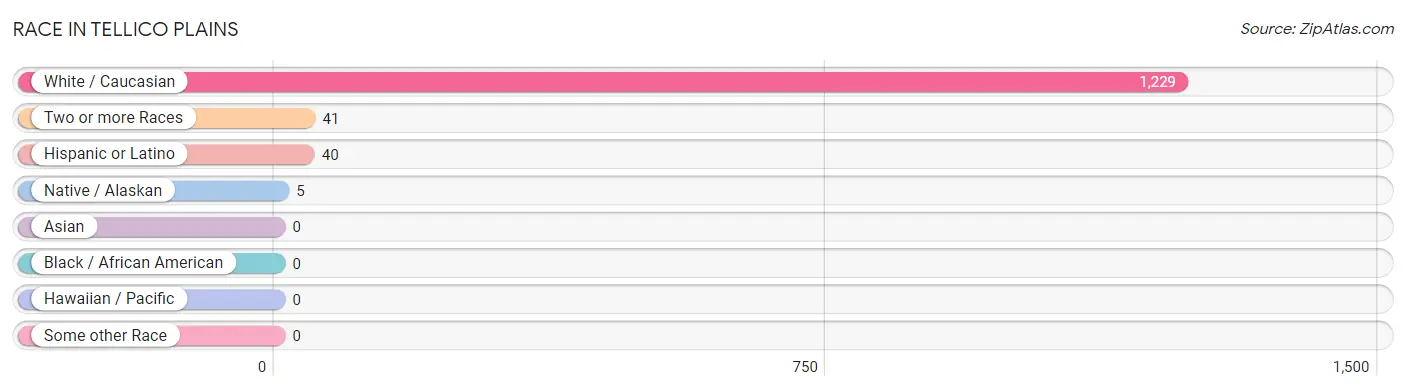
| Race | # Population | % Population |
| Asian | 0 | 0.0% |
| Black / African American | 0 | 0.0% |
| Hawaiian / Pacific | 0 | 0.0% |
| Hispanic or Latino | 40 | 3.1% |
| Native / Alaskan | 5 | 0.4% |
| White / Caucasian | 1,229 | 96.4% |
| Two or more Races | 41 | 3.2% |
| Some other Race | 0 | 0.0% |
| Total | 1,275 | 100.0% |
Ancestry in Tellico Plains
The most populous ancestries reported in Tellico Plains are Irish (239 | 18.8%), English (183 | 14.3%), German (101 | 7.9%), American (90 | 7.1%), and Greek (34 | 2.7%), together accounting for 50.7% of all Tellico Plains residents.
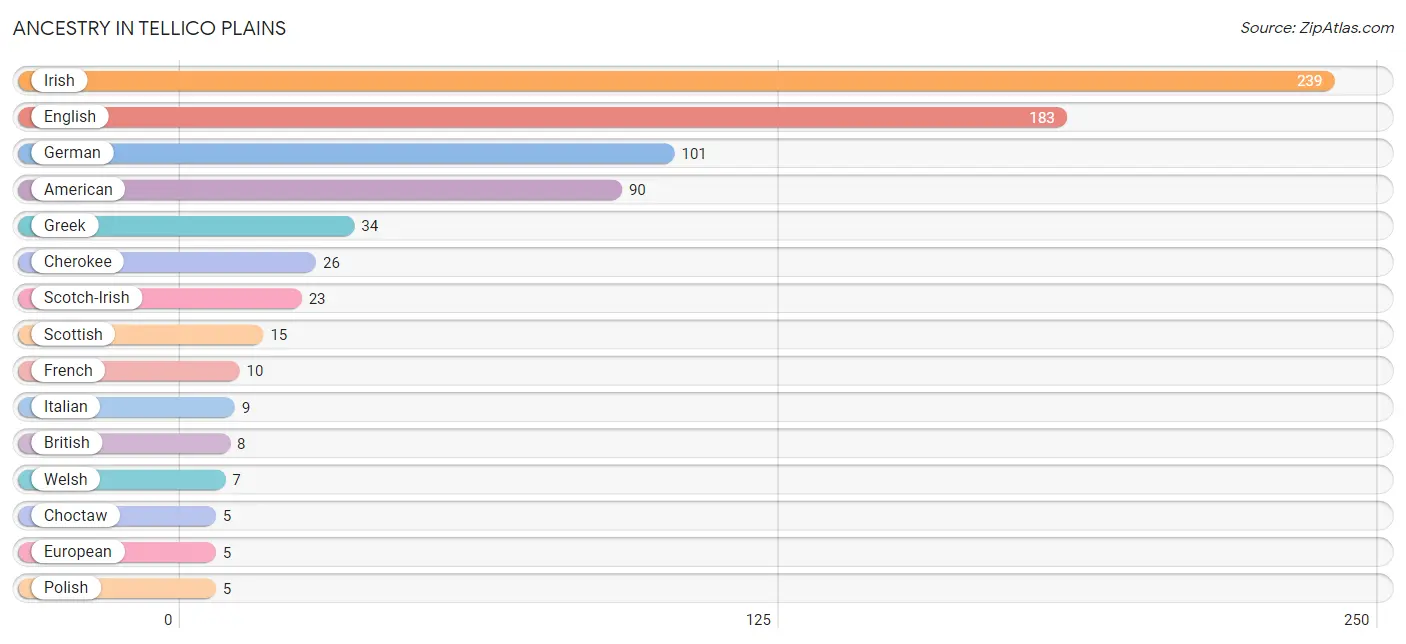
| Ancestry | # Population | % Population |
| American | 90 | 7.1% |
| British | 8 | 0.6% |
| Cherokee | 26 | 2.0% |
| Choctaw | 5 | 0.4% |
| Dutch | 2 | 0.2% |
| Dutch West Indian | 3 | 0.2% |
| English | 183 | 14.3% |
| European | 5 | 0.4% |
| French | 10 | 0.8% |
| German | 101 | 7.9% |
| Greek | 34 | 2.7% |
| Irish | 239 | 18.8% |
| Italian | 9 | 0.7% |
| Polish | 5 | 0.4% |
| Portuguese | 4 | 0.3% |
| Scotch-Irish | 23 | 1.8% |
| Scottish | 15 | 1.2% |
| Welsh | 7 | 0.5% | View All 18 Rows |
Immigrants in Tellico Plains

| Immigration Origin | # Population | % Population | View All 0 Rows |
Sex and Age in Tellico Plains
Sex and Age in Tellico Plains
The most populous age groups in Tellico Plains are 5 to 9 Years (154 | 23.6%) for men and 5 to 9 Years (82 | 13.2%) for women.
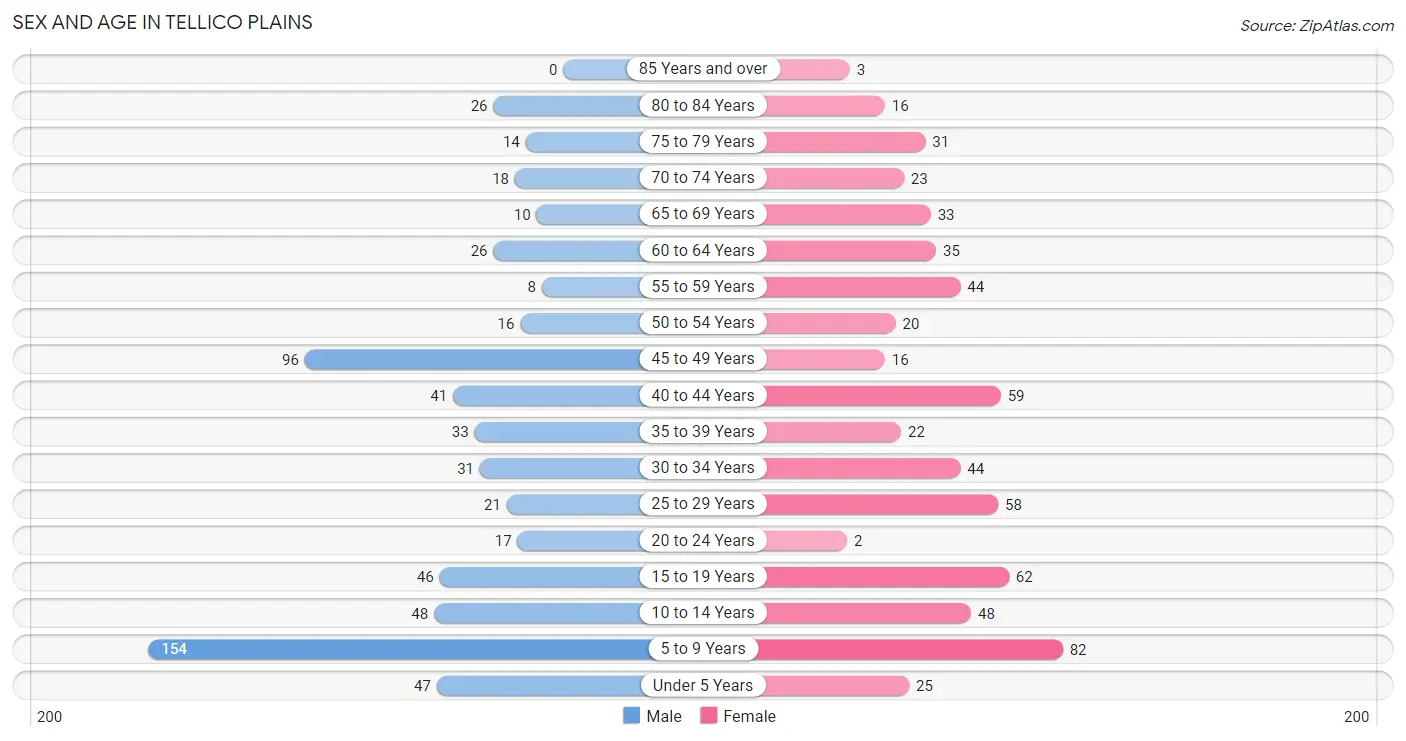
| Age Bracket | Male | Female |
| Under 5 Years | 47 (7.2%) | 25 (4.0%) |
| 5 to 9 Years | 154 (23.6%) | 82 (13.2%) |
| 10 to 14 Years | 48 (7.4%) | 48 (7.7%) |
| 15 to 19 Years | 46 (7.1%) | 62 (10.0%) |
| 20 to 24 Years | 17 (2.6%) | 2 (0.3%) |
| 25 to 29 Years | 21 (3.2%) | 58 (9.3%) |
| 30 to 34 Years | 31 (4.8%) | 44 (7.1%) |
| 35 to 39 Years | 33 (5.1%) | 22 (3.5%) |
| 40 to 44 Years | 41 (6.3%) | 59 (9.5%) |
| 45 to 49 Years | 96 (14.7%) | 16 (2.6%) |
| 50 to 54 Years | 16 (2.5%) | 20 (3.2%) |
| 55 to 59 Years | 8 (1.2%) | 44 (7.1%) |
| 60 to 64 Years | 26 (4.0%) | 35 (5.6%) |
| 65 to 69 Years | 10 (1.5%) | 33 (5.3%) |
| 70 to 74 Years | 18 (2.8%) | 23 (3.7%) |
| 75 to 79 Years | 14 (2.1%) | 31 (5.0%) |
| 80 to 84 Years | 26 (4.0%) | 16 (2.6%) |
| 85 Years and over | 0 (0.0%) | 3 (0.5%) |
| Total | 652 (100.0%) | 623 (100.0%) |
Families and Households in Tellico Plains
Median Family Size in Tellico Plains
The median family size in Tellico Plains is 3.14 persons per family, with single female/mother families (92 | 26.9%) accounting for the largest median family size of 3.95 persons per family. On the other hand, single male/father families (87 | 25.4%) represent the smallest median family size with 2.17 persons per family.
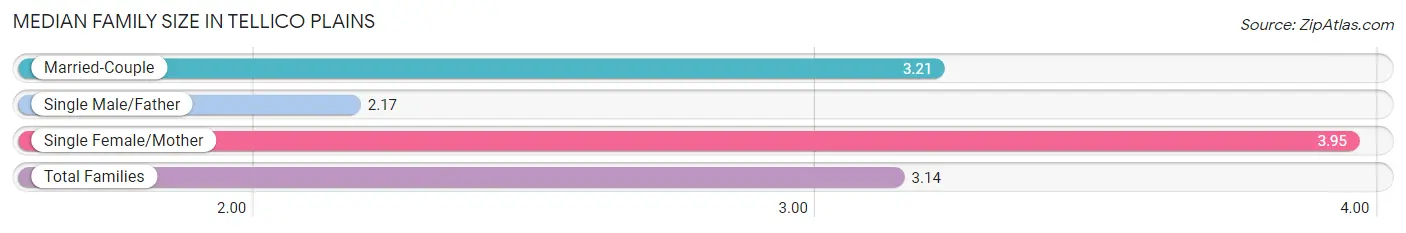
| Family Type | # Families | Family Size |
| Married-Couple | 163 (47.7%) | 3.21 |
| Single Male/Father | 87 (25.4%) | 2.17 |
| Single Female/Mother | 92 (26.9%) | 3.95 |
| Total Families | 342 (100.0%) | 3.14 |
Median Household Size in Tellico Plains
The median household size in Tellico Plains is 2.68 persons per household, with single female/mother households (92 | 19.3%) accounting for the largest median household size of 4.13 persons per household. non-family households (134 | 28.1%) represent the smallest median household size with 1.04 persons per household.
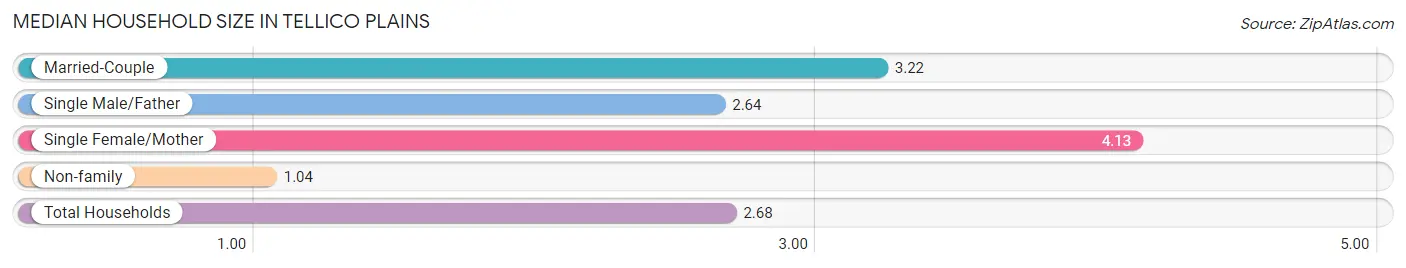
| Household Type | # Households | Household Size |
| Married-Couple | 163 (34.2%) | 3.22 |
| Single Male/Father | 87 (18.3%) | 2.64 |
| Single Female/Mother | 92 (19.3%) | 4.13 |
| Non-family | 134 (28.1%) | 1.04 |
| Total Households | 476 (100.0%) | 2.68 |
Household Size by Marriage Status in Tellico Plains
Out of a total of 476 households in Tellico Plains, 342 (71.9%) are family households, while 134 (28.1%) are nonfamily households. The most numerous type of family households are 2-person households, comprising 127, and the most common type of nonfamily households are 1-person households, comprising 126.
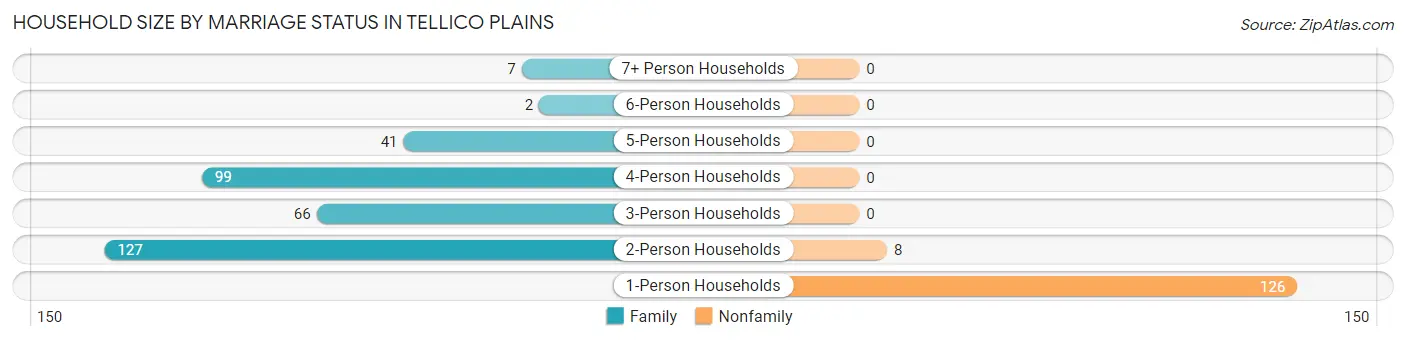
| Household Size | Family Households | Nonfamily Households |
| 1-Person Households | - | 126 (26.5%) |
| 2-Person Households | 127 (26.7%) | 8 (1.7%) |
| 3-Person Households | 66 (13.9%) | 0 (0.0%) |
| 4-Person Households | 99 (20.8%) | 0 (0.0%) |
| 5-Person Households | 41 (8.6%) | 0 (0.0%) |
| 6-Person Households | 2 (0.4%) | 0 (0.0%) |
| 7+ Person Households | 7 (1.5%) | 0 (0.0%) |
| Total | 342 (71.9%) | 134 (28.1%) |
Female Fertility in Tellico Plains
Fertility by Age in Tellico Plains
Average fertility rate in Tellico Plains is 33.0 births per 1,000 women. Women in the age bracket of 20 to 34 years have the highest fertility rate with 87.0 births per 1,000 women. Women in the age bracket of 20 to 34 years acount for 100.0% of all women with births.
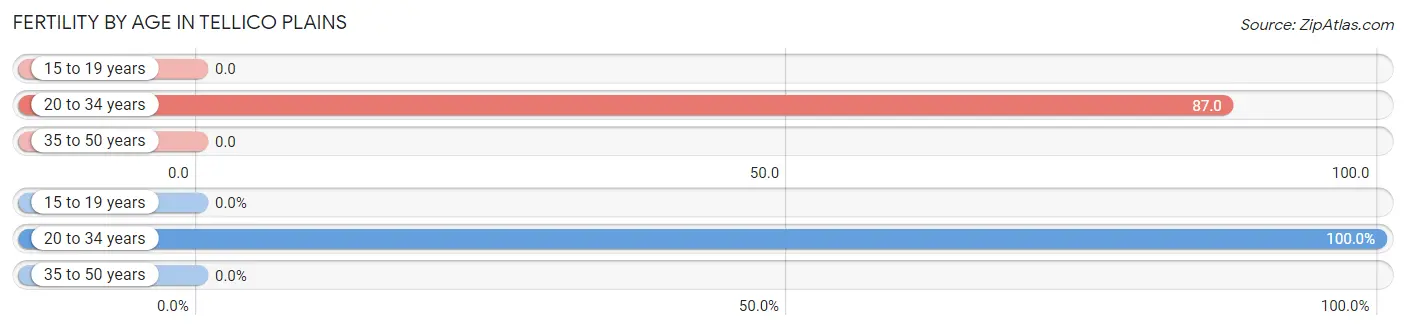
| Age Bracket | Women with Births | Births / 1,000 Women |
| 15 to 19 years | 0 (0.0%) | 0.0 |
| 20 to 34 years | 9 (100.0%) | 87.0 |
| 35 to 50 years | 0 (0.0%) | 0.0 |
| Total | 9 (100.0%) | 33.0 |
Fertility by Age by Marriage Status in Tellico Plains
77.8% of women with births (9) in Tellico Plains are married. The highest percentage of unmarried women with births falls into 20 to 34 years age bracket with 22.2% of them unmarried at the time of birth, while the lowest percentage of unmarried women with births belong to 20 to 34 years age bracket with 22.2% of them unmarried.
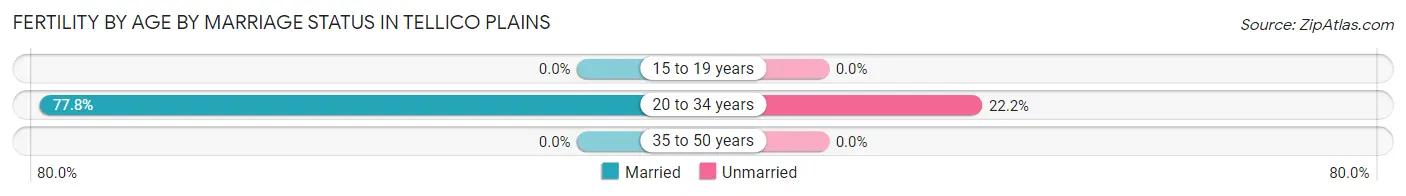
| Age Bracket | Married | Unmarried |
| 15 to 19 years | 0 (0.0%) | 0 (0.0%) |
| 20 to 34 years | 7 (77.8%) | 2 (22.2%) |
| 35 to 50 years | 0 (0.0%) | 0 (0.0%) |
| Total | 7 (77.8%) | 2 (22.2%) |
Fertility by Education in Tellico Plains
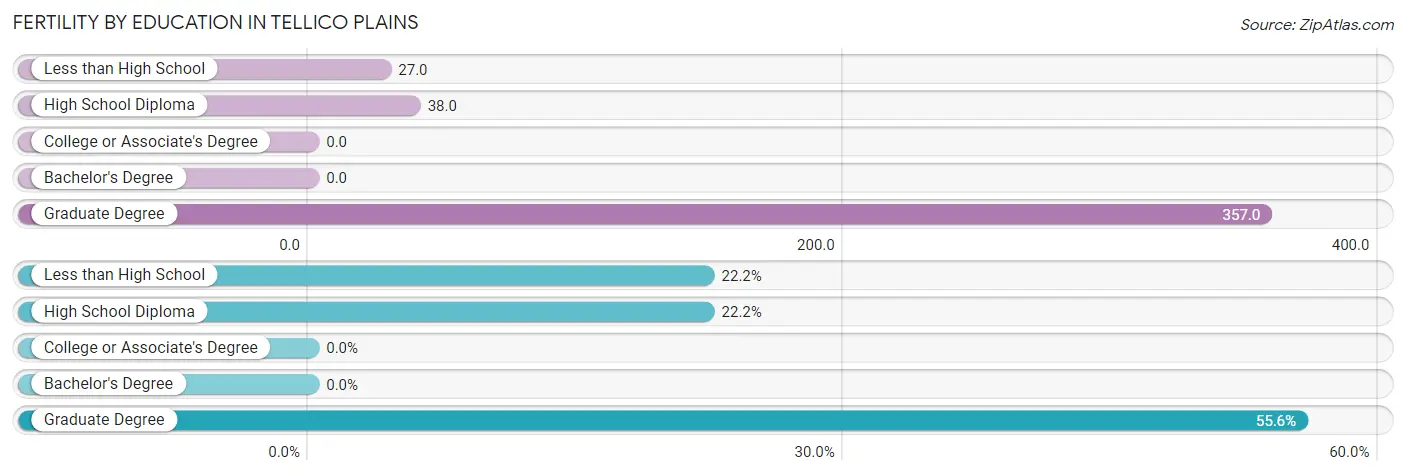
| Educational Attainment | Women with Births | Births / 1,000 Women |
| Less than High School | 2 (22.2%) | 27.0 |
| High School Diploma | 2 (22.2%) | 38.0 |
| College or Associate's Degree | 0 (0.0%) | 0.0 |
| Bachelor's Degree | 0 (0.0%) | 0.0 |
| Graduate Degree | 5 (55.6%) | 357.0 |
| Total | 9 (100.0%) | 33.0 |
Fertility by Education by Marriage Status in Tellico Plains
22.2% of women with births in Tellico Plains are unmarried. Women with the educational attainment of high school diploma are most likely to be married with 100.0% of them married at childbirth, while women with the educational attainment of less than high school are least likely to be married with 100.0% of them unmarried at childbirth.
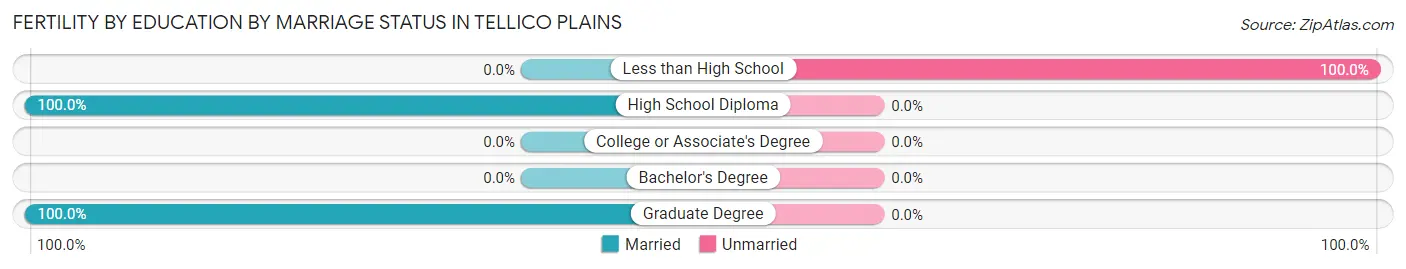
| Educational Attainment | Married | Unmarried |
| Less than High School | 0 (0.0%) | 2 (100.0%) |
| High School Diploma | 2 (100.0%) | 0 (0.0%) |
| College or Associate's Degree | 0 (0.0%) | 0 (0.0%) |
| Bachelor's Degree | 0 (0.0%) | 0 (0.0%) |
| Graduate Degree | 5 (100.0%) | 0 (0.0%) |
| Total | 7 (77.8%) | 2 (22.2%) |
Employment Characteristics in Tellico Plains
Employment by Class of Employer in Tellico Plains
Among the 374 employed individuals in Tellico Plains, private company employees (189 | 50.5%), local government employees (65 | 17.4%), and not-for-profit organizations (39 | 10.4%) make up the most common classes of employment.
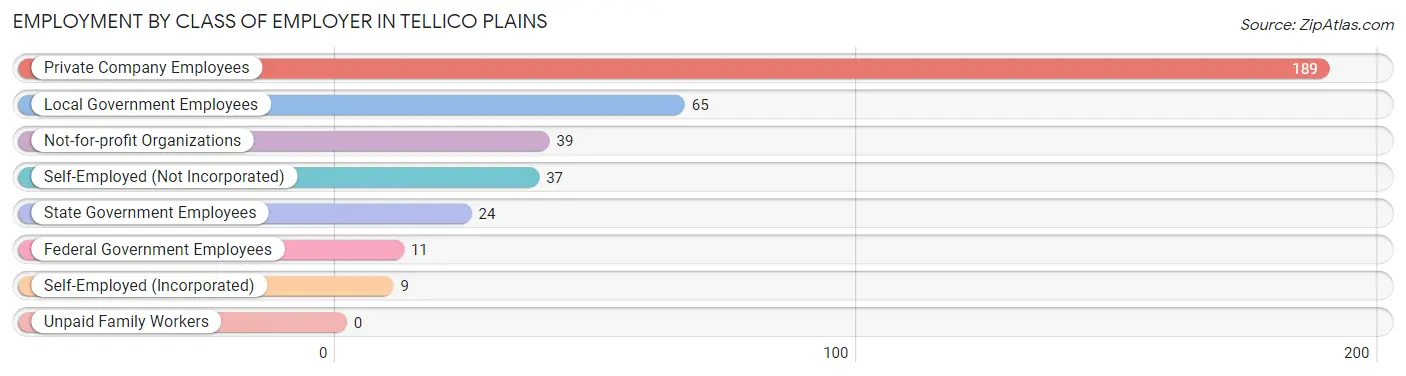
| Employer Class | # Employees | % Employees |
| Private Company Employees | 189 | 50.5% |
| Self-Employed (Incorporated) | 9 | 2.4% |
| Self-Employed (Not Incorporated) | 37 | 9.9% |
| Not-for-profit Organizations | 39 | 10.4% |
| Local Government Employees | 65 | 17.4% |
| State Government Employees | 24 | 6.4% |
| Federal Government Employees | 11 | 2.9% |
| Unpaid Family Workers | 0 | 0.0% |
| Total | 374 | 100.0% |
Employment Status by Age in Tellico Plains
According to the labor force statistics for Tellico Plains, out of the total population over 16 years of age (837), 55.3% or 463 individuals are in the labor force, with 6.5% or 30 of them unemployed. The age group with the highest labor force participation rate is 45 to 54 years, with 87.8% or 130 individuals in the labor force. Within the labor force, the 55 to 59 years age range has the highest percentage of unemployed individuals, with 81.1% or 30 of them being unemployed.
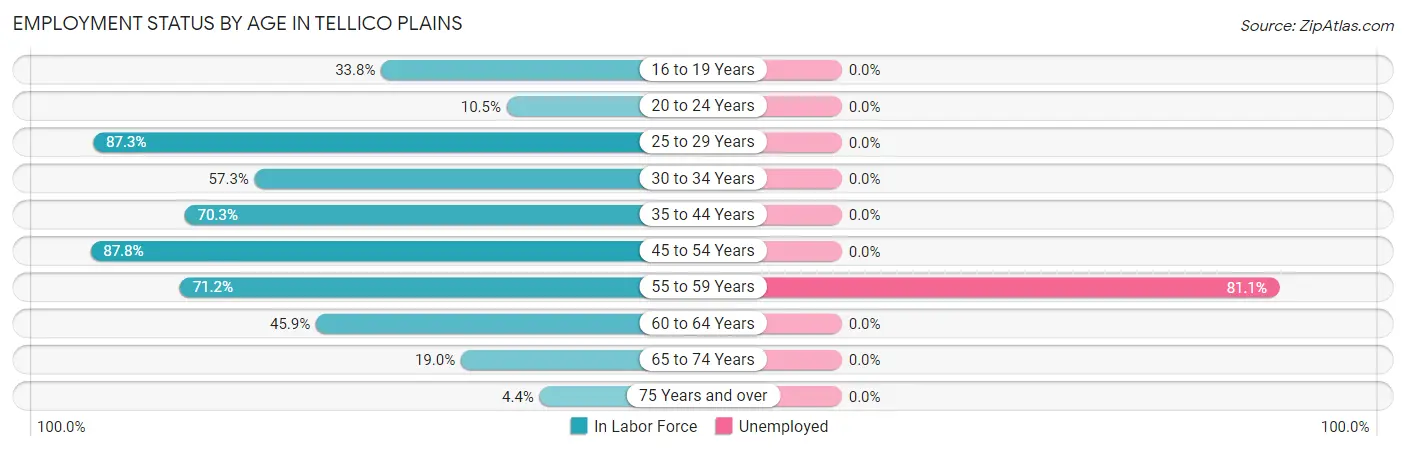
| Age Bracket | In Labor Force | Unemployed |
| 16 to 19 Years | 25 (33.8%) | 0 (0.0%) |
| 20 to 24 Years | 2 (10.5%) | 0 (0.0%) |
| 25 to 29 Years | 69 (87.3%) | 0 (0.0%) |
| 30 to 34 Years | 43 (57.3%) | 0 (0.0%) |
| 35 to 44 Years | 109 (70.3%) | 0 (0.0%) |
| 45 to 54 Years | 130 (87.8%) | 0 (0.0%) |
| 55 to 59 Years | 37 (71.2%) | 30 (81.1%) |
| 60 to 64 Years | 28 (45.9%) | 0 (0.0%) |
| 65 to 74 Years | 16 (19.0%) | 0 (0.0%) |
| 75 Years and over | 4 (4.4%) | 0 (0.0%) |
| Total | 463 (55.3%) | 30 (6.5%) |
Employment Status by Educational Attainment in Tellico Plains
According to labor force statistics for Tellico Plains, 73.0% of individuals (416) out of the total population between 25 and 64 years of age (570) are in the labor force, with 7.2% or 30 of them being unemployed. The group with the highest labor force participation rate are those with the educational attainment of bachelor's degree or higher, with 94.7% or 90 individuals in the labor force. Within the labor force, individuals with college / associate degree education have the highest percentage of unemployment, with 19.1% or 30 of them being unemployed.
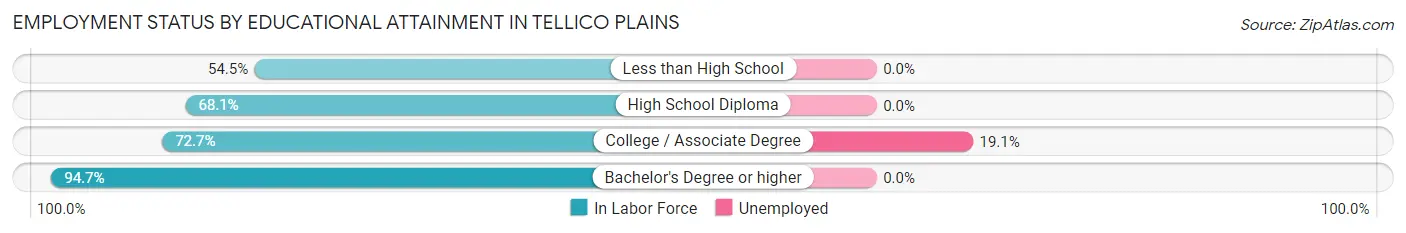
| Educational Attainment | In Labor Force | Unemployed |
| Less than High School | 30 (54.5%) | 0 (0.0%) |
| High School Diploma | 139 (68.1%) | 0 (0.0%) |
| College / Associate Degree | 157 (72.7%) | 41 (19.1%) |
| Bachelor's Degree or higher | 90 (94.7%) | 0 (0.0%) |
| Total | 416 (73.0%) | 41 (7.2%) |
Employment Occupations by Sex in Tellico Plains
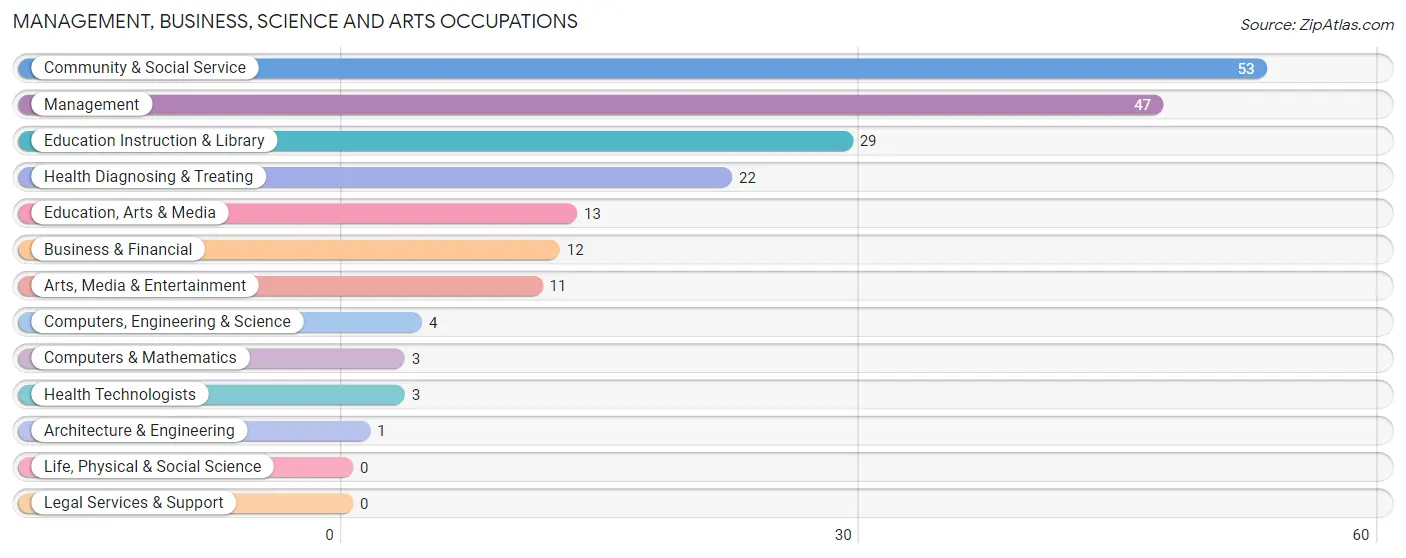
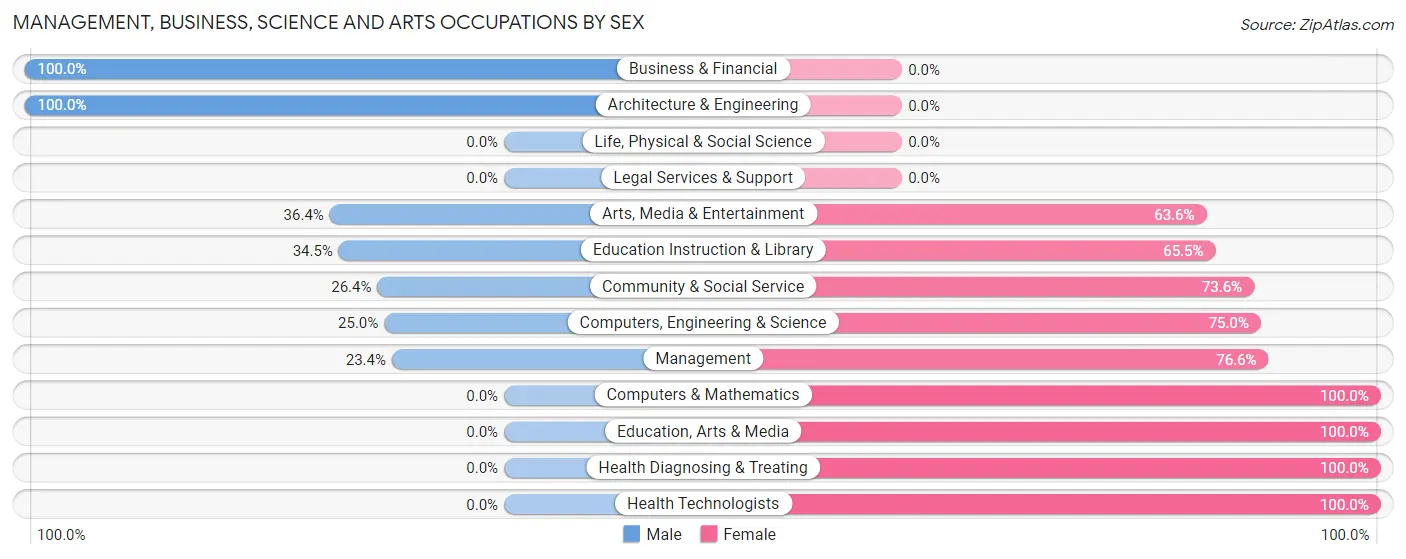
Management, Business, Science and Arts Occupations
The most common Management, Business, Science and Arts occupations in Tellico Plains are Community & Social Service (53 | 12.2%), Management (47 | 10.8%), Education Instruction & Library (29 | 6.7%), Health Diagnosing & Treating (22 | 5.1%), and Education, Arts & Media (13 | 3.0%).
Management, Business, Science and Arts Occupations by Sex
Within the Management, Business, Science and Arts occupations in Tellico Plains, the most male-oriented occupations are Business & Financial (100.0%), Architecture & Engineering (100.0%), and Arts, Media & Entertainment (36.4%), while the most female-oriented occupations are Computers & Mathematics (100.0%), Education, Arts & Media (100.0%), and Health Diagnosing & Treating (100.0%).
| Occupation | Male | Female |
| Management | 11 (23.4%) | 36 (76.6%) |
| Business & Financial | 12 (100.0%) | 0 (0.0%) |
| Computers, Engineering & Science | 1 (25.0%) | 3 (75.0%) |
| Computers & Mathematics | 0 (0.0%) | 3 (100.0%) |
| Architecture & Engineering | 1 (100.0%) | 0 (0.0%) |
| Life, Physical & Social Science | 0 (0.0%) | 0 (0.0%) |
| Community & Social Service | 14 (26.4%) | 39 (73.6%) |
| Education, Arts & Media | 0 (0.0%) | 13 (100.0%) |
| Legal Services & Support | 0 (0.0%) | 0 (0.0%) |
| Education Instruction & Library | 10 (34.5%) | 19 (65.5%) |
| Arts, Media & Entertainment | 4 (36.4%) | 7 (63.6%) |
| Health Diagnosing & Treating | 0 (0.0%) | 22 (100.0%) |
| Health Technologists | 0 (0.0%) | 3 (100.0%) |
| Total (Category) | 38 (27.5%) | 100 (72.5%) |
| Total (Overall) | 235 (54.3%) | 198 (45.7%) |
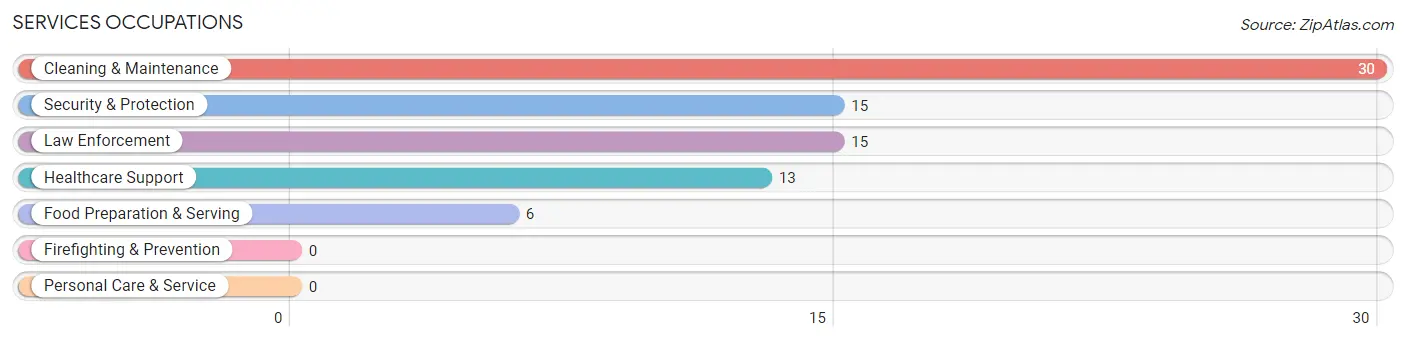
Services Occupations
The most common Services occupations in Tellico Plains are Cleaning & Maintenance (30 | 6.9%), Security & Protection (15 | 3.5%), Law Enforcement (15 | 3.5%), Healthcare Support (13 | 3.0%), and Food Preparation & Serving (6 | 1.4%).
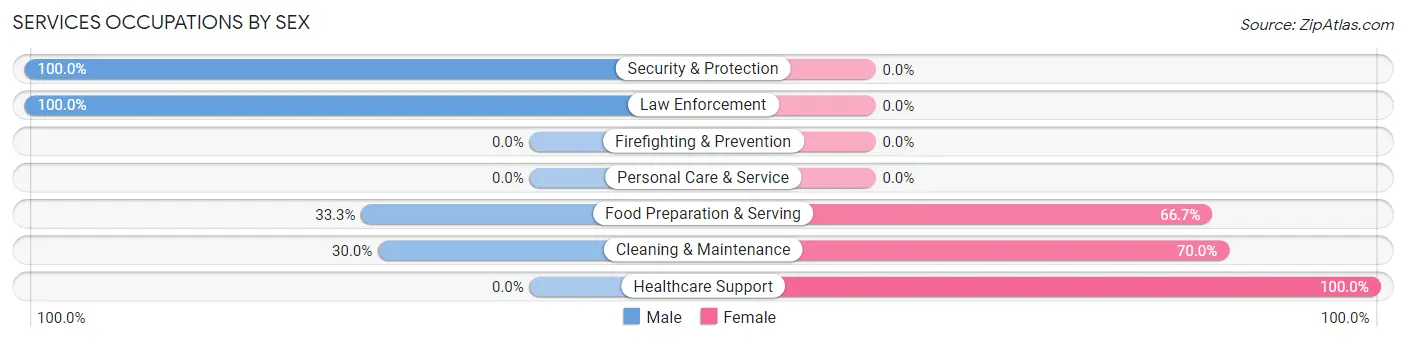
Services Occupations by Sex
Within the Services occupations in Tellico Plains, the most male-oriented occupations are Security & Protection (100.0%), Law Enforcement (100.0%), and Food Preparation & Serving (33.3%), while the most female-oriented occupations are Healthcare Support (100.0%), Cleaning & Maintenance (70.0%), and Food Preparation & Serving (66.7%).
| Occupation | Male | Female |
| Healthcare Support | 0 (0.0%) | 13 (100.0%) |
| Security & Protection | 15 (100.0%) | 0 (0.0%) |
| Firefighting & Prevention | 0 (0.0%) | 0 (0.0%) |
| Law Enforcement | 15 (100.0%) | 0 (0.0%) |
| Food Preparation & Serving | 2 (33.3%) | 4 (66.7%) |
| Cleaning & Maintenance | 9 (30.0%) | 21 (70.0%) |
| Personal Care & Service | 0 (0.0%) | 0 (0.0%) |
| Total (Category) | 26 (40.6%) | 38 (59.4%) |
| Total (Overall) | 235 (54.3%) | 198 (45.7%) |
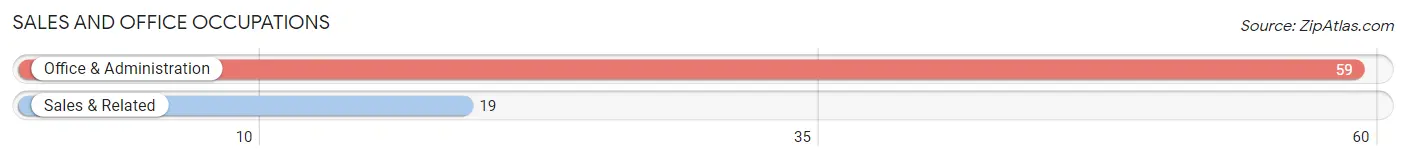
Sales and Office Occupations
The most common Sales and Office occupations in Tellico Plains are Office & Administration (59 | 13.6%), and Sales & Related (19 | 4.4%).
Sales and Office Occupations by Sex

| Occupation | Male | Female |
| Sales & Related | 11 (57.9%) | 8 (42.1%) |
| Office & Administration | 38 (64.4%) | 21 (35.6%) |
| Total (Category) | 49 (62.8%) | 29 (37.2%) |
| Total (Overall) | 235 (54.3%) | 198 (45.7%) |
Natural Resources, Construction and Maintenance Occupations
The most common Natural Resources, Construction and Maintenance occupations in Tellico Plains are Construction & Extraction (38 | 8.8%), and Installation, Maintenance & Repair (7 | 1.6%).
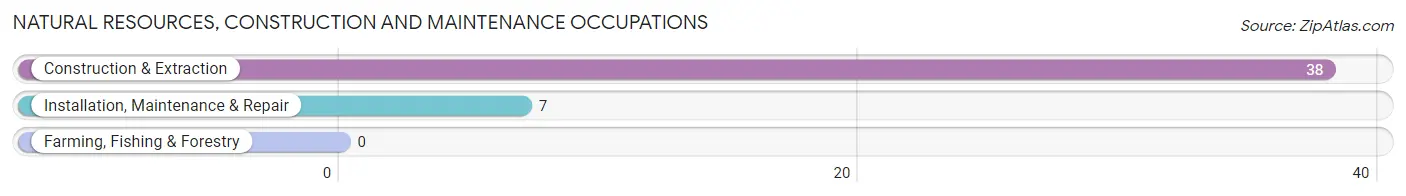
Natural Resources, Construction and Maintenance Occupations by Sex

| Occupation | Male | Female |
| Farming, Fishing & Forestry | 0 (0.0%) | 0 (0.0%) |
| Construction & Extraction | 38 (100.0%) | 0 (0.0%) |
| Installation, Maintenance & Repair | 7 (100.0%) | 0 (0.0%) |
| Total (Category) | 45 (100.0%) | 0 (0.0%) |
| Total (Overall) | 235 (54.3%) | 198 (45.7%) |
Production, Transportation and Moving Occupations
The most common Production, Transportation and Moving occupations in Tellico Plains are Production (65 | 15.0%), Transportation (34 | 7.9%), and Material Moving (9 | 2.1%).
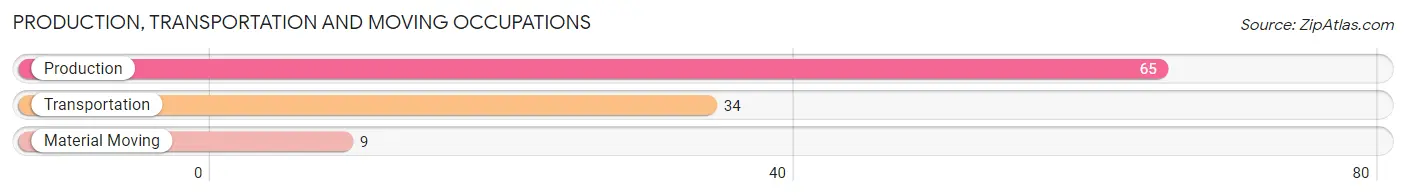
Production, Transportation and Moving Occupations by Sex
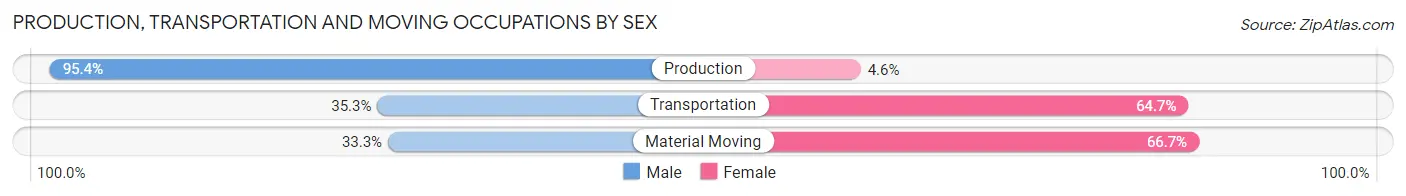
| Occupation | Male | Female |
| Production | 62 (95.4%) | 3 (4.6%) |
| Transportation | 12 (35.3%) | 22 (64.7%) |
| Material Moving | 3 (33.3%) | 6 (66.7%) |
| Total (Category) | 77 (71.3%) | 31 (28.7%) |
| Total (Overall) | 235 (54.3%) | 198 (45.7%) |
Employment Industries by Sex in Tellico Plains
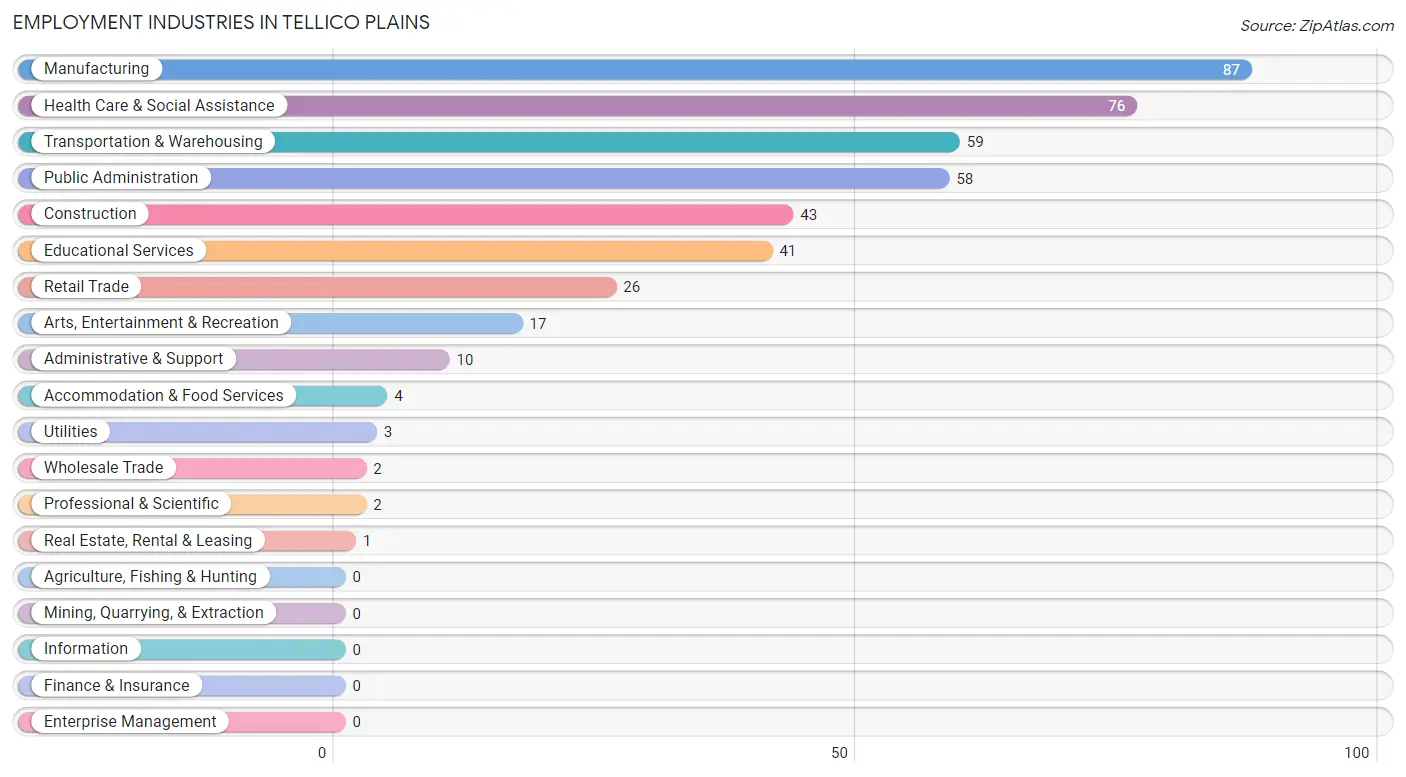
Employment Industries in Tellico Plains
The major employment industries in Tellico Plains include Manufacturing (87 | 20.1%), Health Care & Social Assistance (76 | 17.5%), Transportation & Warehousing (59 | 13.6%), Public Administration (58 | 13.4%), and Construction (43 | 9.9%).
Employment Industries by Sex in Tellico Plains
The Tellico Plains industries that see more men than women are Construction (100.0%), Manufacturing (96.6%), and Transportation & Warehousing (62.7%), whereas the industries that tend to have a higher number of women are Wholesale Trade (100.0%), Utilities (100.0%), and Real Estate, Rental & Leasing (100.0%).
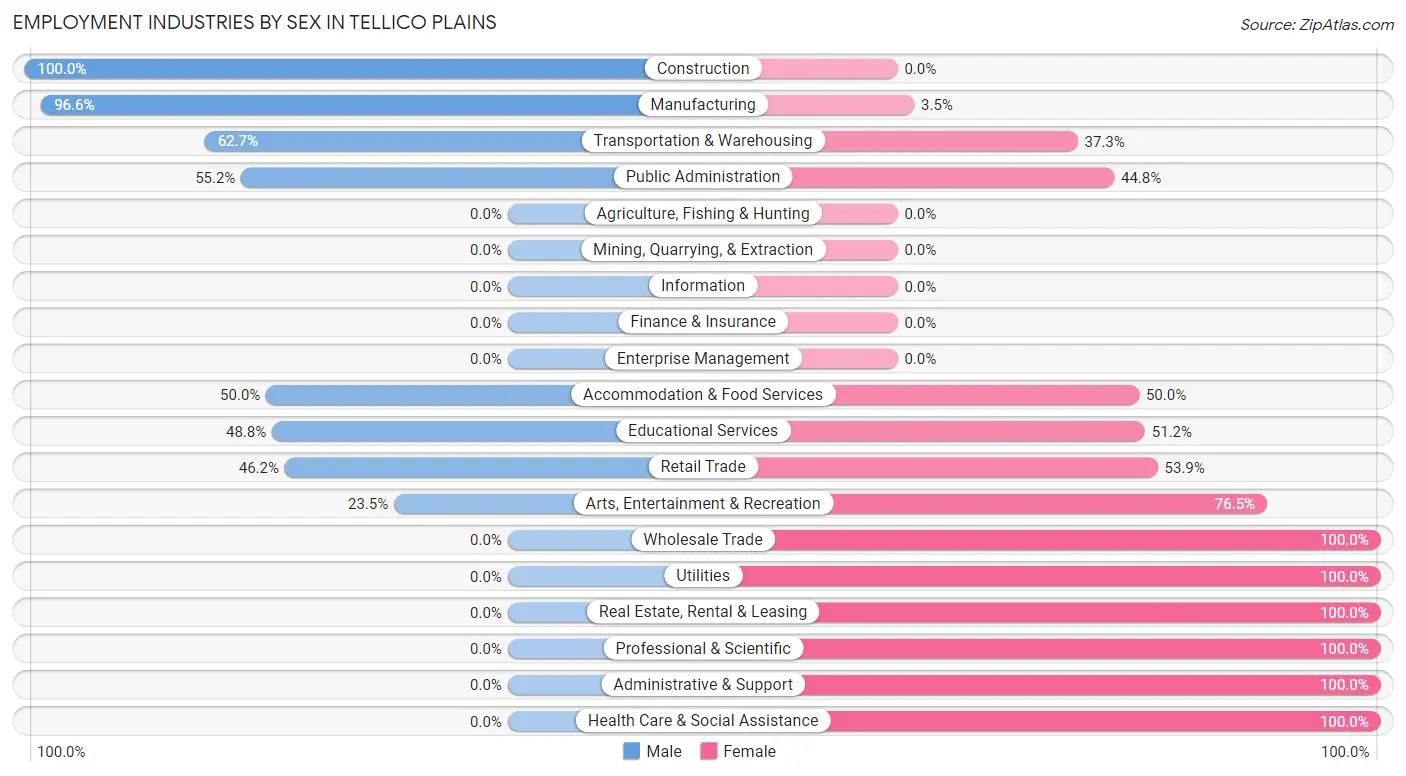
| Industry | Male | Female |
| Agriculture, Fishing & Hunting | 0 (0.0%) | 0 (0.0%) |
| Mining, Quarrying, & Extraction | 0 (0.0%) | 0 (0.0%) |
| Construction | 43 (100.0%) | 0 (0.0%) |
| Manufacturing | 84 (96.6%) | 3 (3.5%) |
| Wholesale Trade | 0 (0.0%) | 2 (100.0%) |
| Retail Trade | 12 (46.2%) | 14 (53.8%) |
| Transportation & Warehousing | 37 (62.7%) | 22 (37.3%) |
| Utilities | 0 (0.0%) | 3 (100.0%) |
| Information | 0 (0.0%) | 0 (0.0%) |
| Finance & Insurance | 0 (0.0%) | 0 (0.0%) |
| Real Estate, Rental & Leasing | 0 (0.0%) | 1 (100.0%) |
| Professional & Scientific | 0 (0.0%) | 2 (100.0%) |
| Enterprise Management | 0 (0.0%) | 0 (0.0%) |
| Administrative & Support | 0 (0.0%) | 10 (100.0%) |
| Educational Services | 20 (48.8%) | 21 (51.2%) |
| Health Care & Social Assistance | 0 (0.0%) | 76 (100.0%) |
| Arts, Entertainment & Recreation | 4 (23.5%) | 13 (76.5%) |
| Accommodation & Food Services | 2 (50.0%) | 2 (50.0%) |
| Public Administration | 32 (55.2%) | 26 (44.8%) |
| Total | 235 (54.3%) | 198 (45.7%) |
Education in Tellico Plains
School Enrollment in Tellico Plains
The most common levels of schooling among the 344 students in Tellico Plains are elementary school (147 | 42.7%), middle school (53 | 15.4%), and high school (44 | 12.8%).
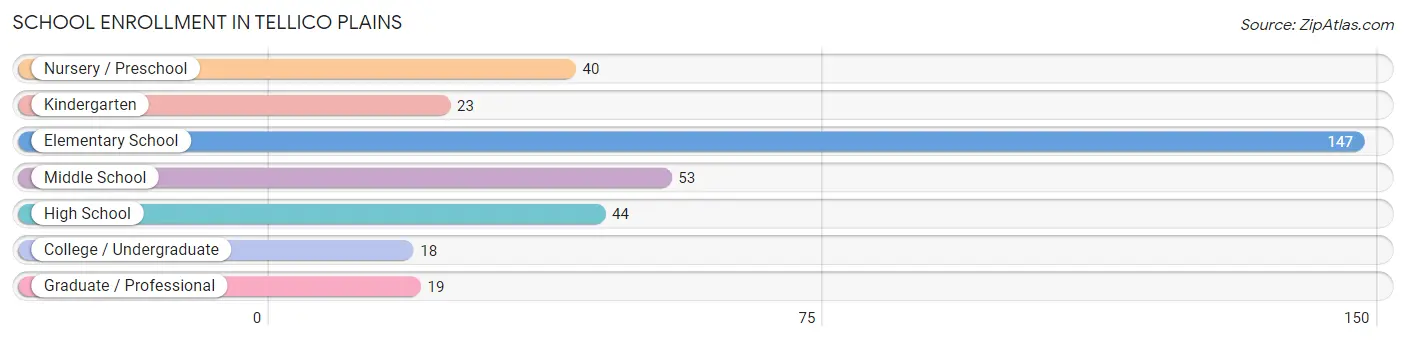
| School Level | # Students | % Students |
| Nursery / Preschool | 40 | 11.6% |
| Kindergarten | 23 | 6.7% |
| Elementary School | 147 | 42.7% |
| Middle School | 53 | 15.4% |
| High School | 44 | 12.8% |
| College / Undergraduate | 18 | 5.2% |
| Graduate / Professional | 19 | 5.5% |
| Total | 344 | 100.0% |
School Enrollment by Age by Funding Source in Tellico Plains
Out of a total of 344 students who are enrolled in schools in Tellico Plains, 80 (23.3%) attend a private institution, while the remaining 264 (76.7%) are enrolled in public schools. The age group of 35 years and over has the highest likelihood of being enrolled in private schools, with 12 (48.0% in the age bracket) enrolled. Conversely, the age group of 3 to 4 year olds has the lowest likelihood of being enrolled in a private school, with 1 (100.0% in the age bracket) attending a public institution.
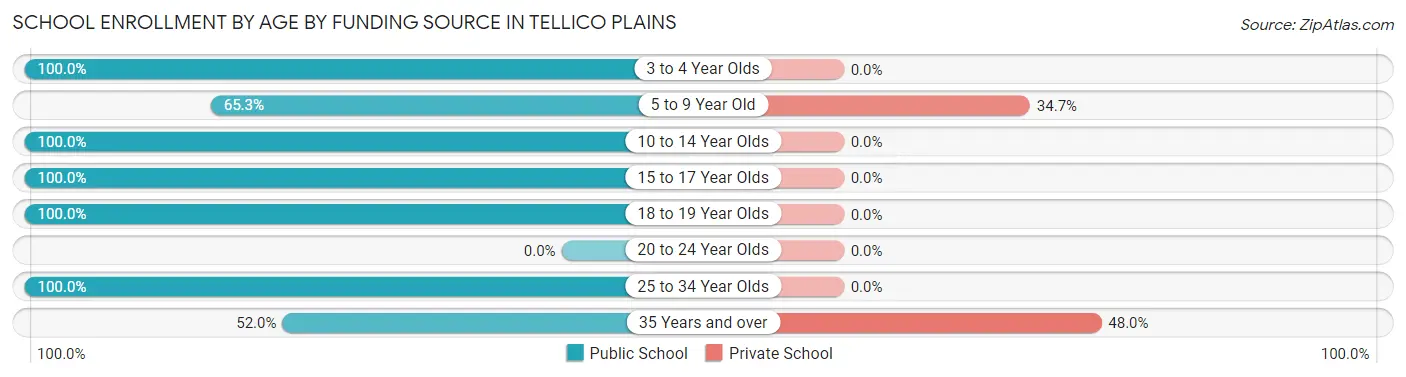
| Age Bracket | Public School | Private School |
| 3 to 4 Year Olds | 1 (100.0%) | 0 (0.0%) |
| 5 to 9 Year Old | 128 (65.3%) | 68 (34.7%) |
| 10 to 14 Year Olds | 84 (100.0%) | 0 (0.0%) |
| 15 to 17 Year Olds | 20 (100.0%) | 0 (0.0%) |
| 18 to 19 Year Olds | 11 (100.0%) | 0 (0.0%) |
| 20 to 24 Year Olds | 0 (0.0%) | 0 (0.0%) |
| 25 to 34 Year Olds | 7 (100.0%) | 0 (0.0%) |
| 35 Years and over | 13 (52.0%) | 12 (48.0%) |
| Total | 264 (76.7%) | 80 (23.3%) |
Educational Attainment by Field of Study in Tellico Plains
Psychology (25 | 20.5%), education (21 | 17.2%), communications (18 | 14.7%), bio, nature & agricultural (15 | 12.3%), and arts & humanities (15 | 12.3%) are the most common fields of study among 122 individuals in Tellico Plains who have obtained a bachelor's degree or higher.
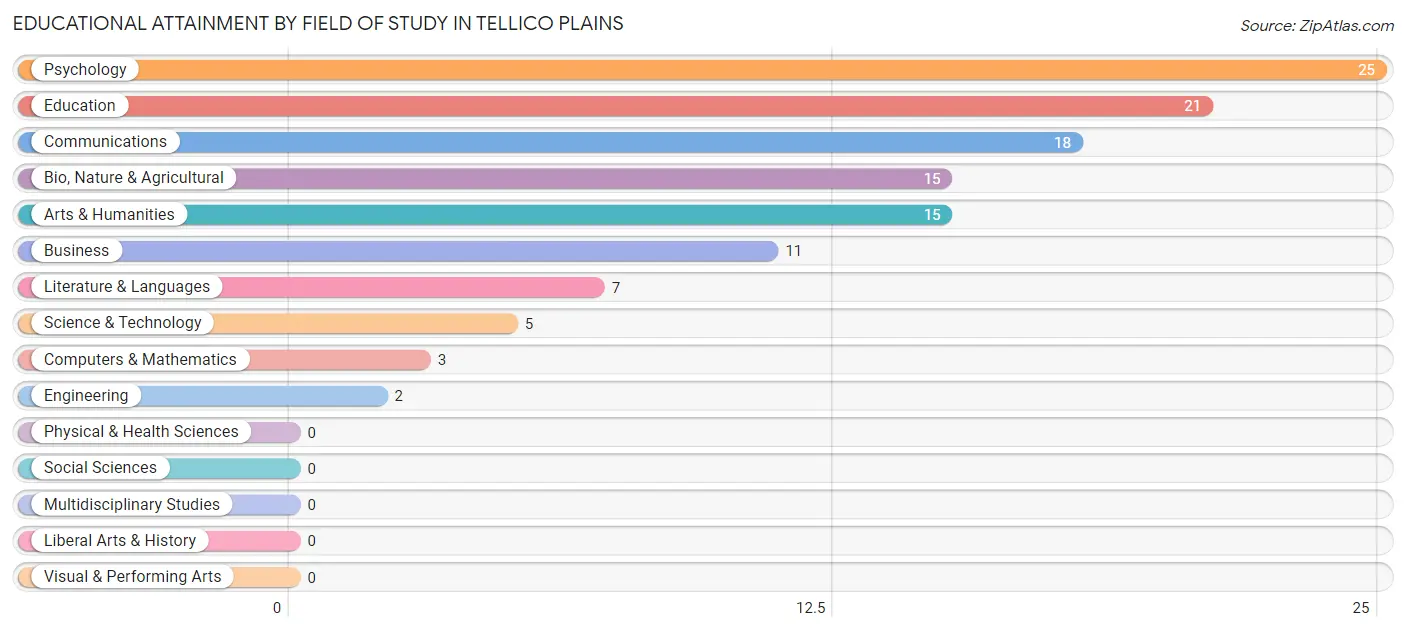
| Field of Study | # Graduates | % Graduates |
| Computers & Mathematics | 3 | 2.5% |
| Bio, Nature & Agricultural | 15 | 12.3% |
| Physical & Health Sciences | 0 | 0.0% |
| Psychology | 25 | 20.5% |
| Social Sciences | 0 | 0.0% |
| Engineering | 2 | 1.6% |
| Multidisciplinary Studies | 0 | 0.0% |
| Science & Technology | 5 | 4.1% |
| Business | 11 | 9.0% |
| Education | 21 | 17.2% |
| Literature & Languages | 7 | 5.7% |
| Liberal Arts & History | 0 | 0.0% |
| Visual & Performing Arts | 0 | 0.0% |
| Communications | 18 | 14.7% |
| Arts & Humanities | 15 | 12.3% |
| Total | 122 | 100.0% |
Transportation & Commute in Tellico Plains
Vehicle Availability by Sex in Tellico Plains
The most prevalent vehicle ownership categories in Tellico Plains are males with 2 vehicles (145, accounting for 68.1%) and females with 2 vehicles (84, making up 90.1%).
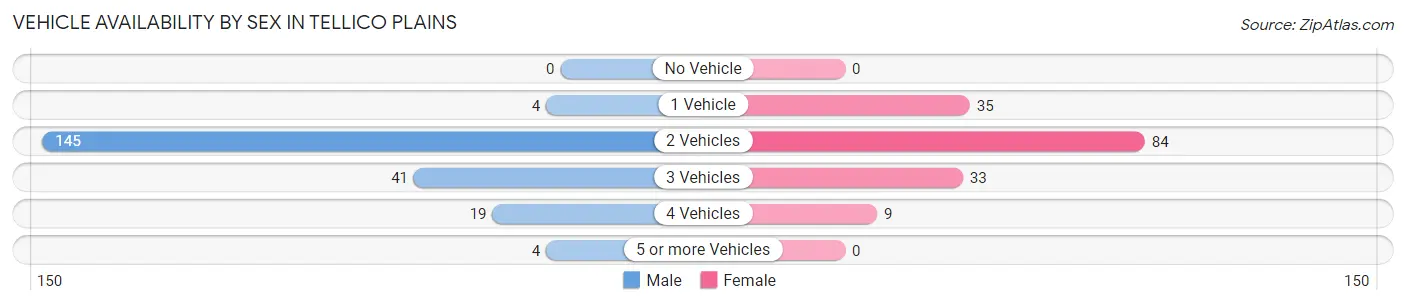
| Vehicles Available | Male | Female |
| No Vehicle | 0 (0.0%) | 0 (0.0%) |
| 1 Vehicle | 4 (1.9%) | 35 (21.7%) |
| 2 Vehicles | 145 (68.1%) | 84 (52.2%) |
| 3 Vehicles | 41 (19.3%) | 33 (20.5%) |
| 4 Vehicles | 19 (8.9%) | 9 (5.6%) |
| 5 or more Vehicles | 4 (1.9%) | 0 (0.0%) |
| Total | 213 (100.0%) | 161 (100.0%) |
Commute Time in Tellico Plains
The most frequently occuring commute durations in Tellico Plains are 20 to 24 minutes (107 commuters, 29.5%), less than 5 minutes (46 commuters, 12.7%), and 30 to 34 minutes (42 commuters, 11.6%).
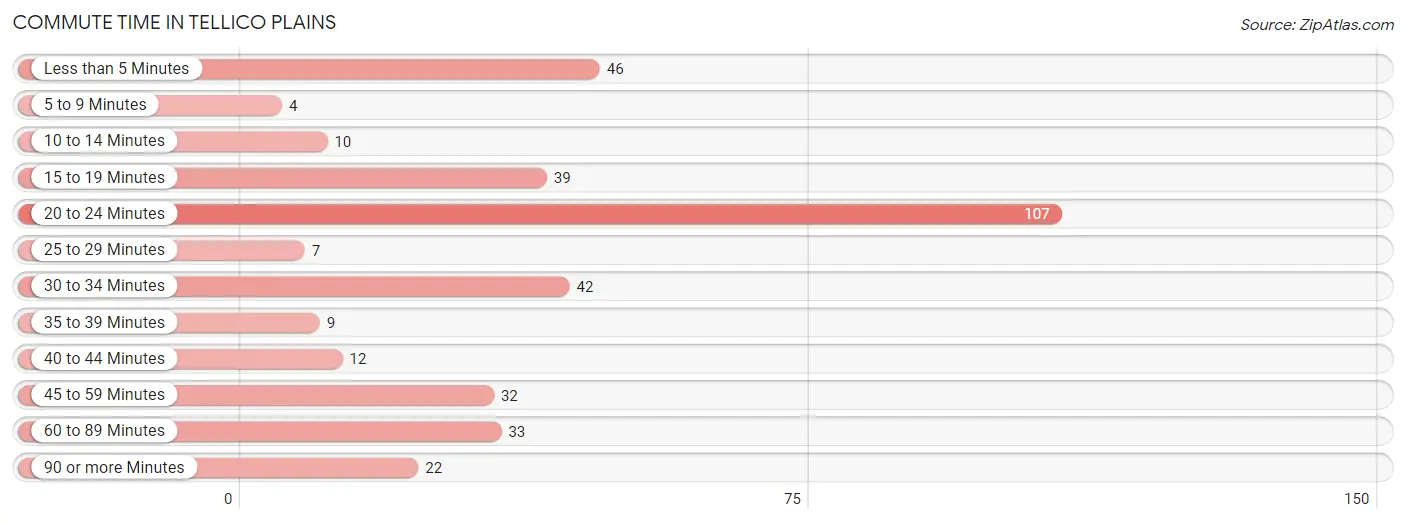
| Commute Time | # Commuters | % Commuters |
| Less than 5 Minutes | 46 | 12.7% |
| 5 to 9 Minutes | 4 | 1.1% |
| 10 to 14 Minutes | 10 | 2.8% |
| 15 to 19 Minutes | 39 | 10.7% |
| 20 to 24 Minutes | 107 | 29.5% |
| 25 to 29 Minutes | 7 | 1.9% |
| 30 to 34 Minutes | 42 | 11.6% |
| 35 to 39 Minutes | 9 | 2.5% |
| 40 to 44 Minutes | 12 | 3.3% |
| 45 to 59 Minutes | 32 | 8.8% |
| 60 to 89 Minutes | 33 | 9.1% |
| 90 or more Minutes | 22 | 6.1% |
Commute Time by Sex in Tellico Plains
The most common commute times in Tellico Plains are 20 to 24 minutes (72 commuters, 34.6%) for males and 20 to 24 minutes (35 commuters, 22.6%) for females.
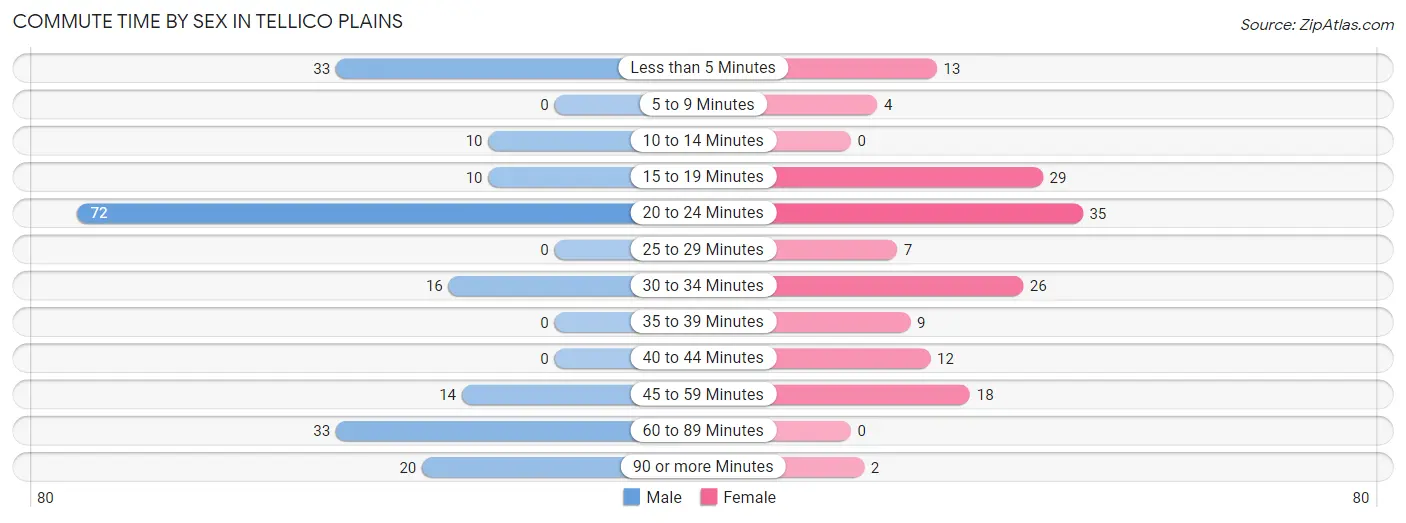
| Commute Time | Male | Female |
| Less than 5 Minutes | 33 (15.9%) | 13 (8.4%) |
| 5 to 9 Minutes | 0 (0.0%) | 4 (2.6%) |
| 10 to 14 Minutes | 10 (4.8%) | 0 (0.0%) |
| 15 to 19 Minutes | 10 (4.8%) | 29 (18.7%) |
| 20 to 24 Minutes | 72 (34.6%) | 35 (22.6%) |
| 25 to 29 Minutes | 0 (0.0%) | 7 (4.5%) |
| 30 to 34 Minutes | 16 (7.7%) | 26 (16.8%) |
| 35 to 39 Minutes | 0 (0.0%) | 9 (5.8%) |
| 40 to 44 Minutes | 0 (0.0%) | 12 (7.7%) |
| 45 to 59 Minutes | 14 (6.7%) | 18 (11.6%) |
| 60 to 89 Minutes | 33 (15.9%) | 0 (0.0%) |
| 90 or more Minutes | 20 (9.6%) | 2 (1.3%) |
Time of Departure to Work by Sex in Tellico Plains
The most frequent times of departure to work in Tellico Plains are 6:30 AM to 6:59 AM (60, 28.8%) for males and 6:00 AM to 6:29 AM (38, 24.5%) for females.
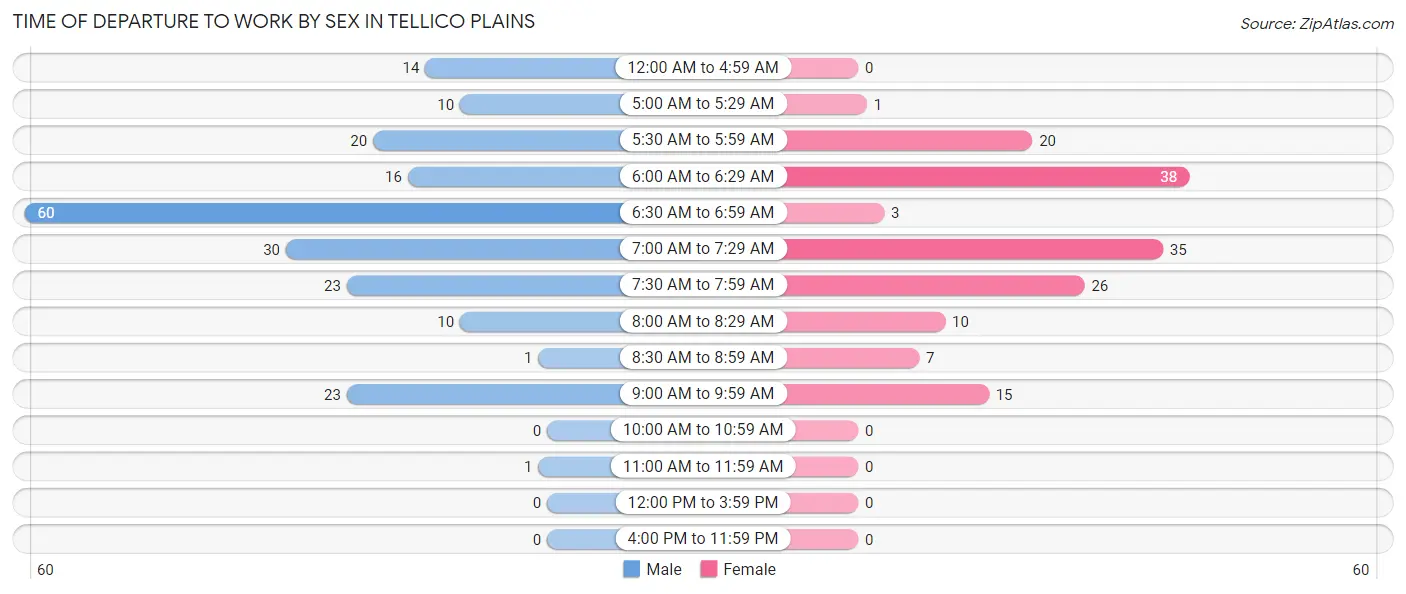
| Time of Departure | Male | Female |
| 12:00 AM to 4:59 AM | 14 (6.7%) | 0 (0.0%) |
| 5:00 AM to 5:29 AM | 10 (4.8%) | 1 (0.6%) |
| 5:30 AM to 5:59 AM | 20 (9.6%) | 20 (12.9%) |
| 6:00 AM to 6:29 AM | 16 (7.7%) | 38 (24.5%) |
| 6:30 AM to 6:59 AM | 60 (28.8%) | 3 (1.9%) |
| 7:00 AM to 7:29 AM | 30 (14.4%) | 35 (22.6%) |
| 7:30 AM to 7:59 AM | 23 (11.1%) | 26 (16.8%) |
| 8:00 AM to 8:29 AM | 10 (4.8%) | 10 (6.5%) |
| 8:30 AM to 8:59 AM | 1 (0.5%) | 7 (4.5%) |
| 9:00 AM to 9:59 AM | 23 (11.1%) | 15 (9.7%) |
| 10:00 AM to 10:59 AM | 0 (0.0%) | 0 (0.0%) |
| 11:00 AM to 11:59 AM | 1 (0.5%) | 0 (0.0%) |
| 12:00 PM to 3:59 PM | 0 (0.0%) | 0 (0.0%) |
| 4:00 PM to 11:59 PM | 0 (0.0%) | 0 (0.0%) |
| Total | 208 (100.0%) | 155 (100.0%) |
Housing Occupancy in Tellico Plains
Occupancy by Ownership in Tellico Plains
Of the total 476 dwellings in Tellico Plains, owner-occupied units account for 341 (71.6%), while renter-occupied units make up 135 (28.4%).
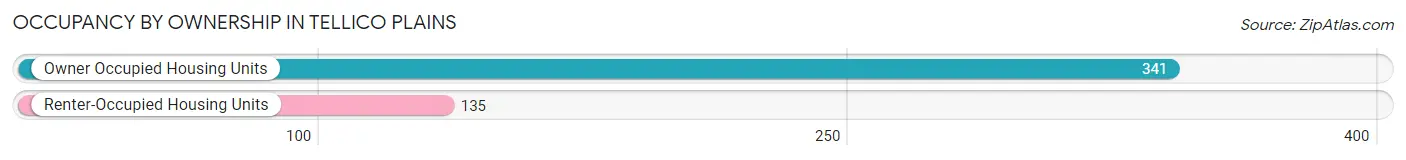
| Occupancy | # Housing Units | % Housing Units |
| Owner Occupied Housing Units | 341 | 71.6% |
| Renter-Occupied Housing Units | 135 | 28.4% |
| Total Occupied Housing Units | 476 | 100.0% |
Occupancy by Household Size in Tellico Plains
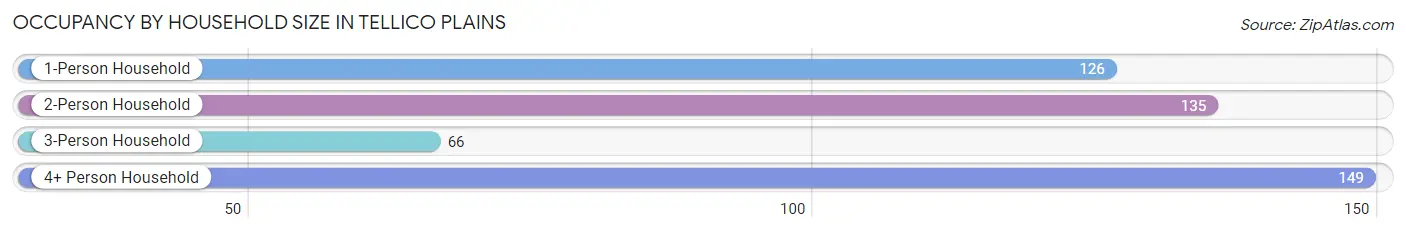
| Household Size | # Housing Units | % Housing Units |
| 1-Person Household | 126 | 26.5% |
| 2-Person Household | 135 | 28.4% |
| 3-Person Household | 66 | 13.9% |
| 4+ Person Household | 149 | 31.3% |
| Total Housing Units | 476 | 100.0% |
Occupancy by Ownership by Household Size in Tellico Plains
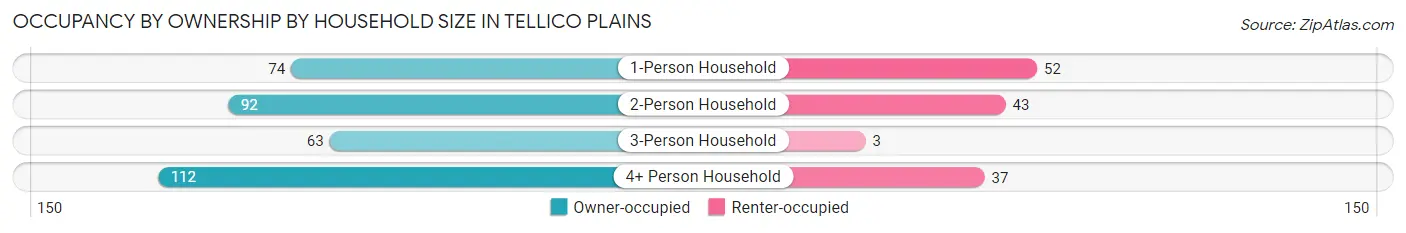
| Household Size | Owner-occupied | Renter-occupied |
| 1-Person Household | 74 (58.7%) | 52 (41.3%) |
| 2-Person Household | 92 (68.1%) | 43 (31.9%) |
| 3-Person Household | 63 (95.5%) | 3 (4.5%) |
| 4+ Person Household | 112 (75.2%) | 37 (24.8%) |
| Total Housing Units | 341 (71.6%) | 135 (28.4%) |
Occupancy by Educational Attainment in Tellico Plains
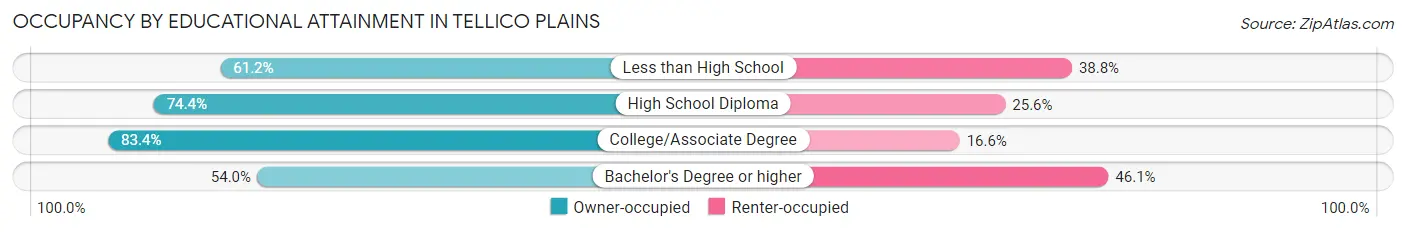
| Household Size | Owner-occupied | Renter-occupied |
| Less than High School | 52 (61.2%) | 33 (38.8%) |
| High School Diploma | 122 (74.4%) | 42 (25.6%) |
| College/Associate Degree | 126 (83.4%) | 25 (16.6%) |
| Bachelor's Degree or higher | 41 (53.9%) | 35 (46.1%) |
Occupancy by Age of Householder in Tellico Plains
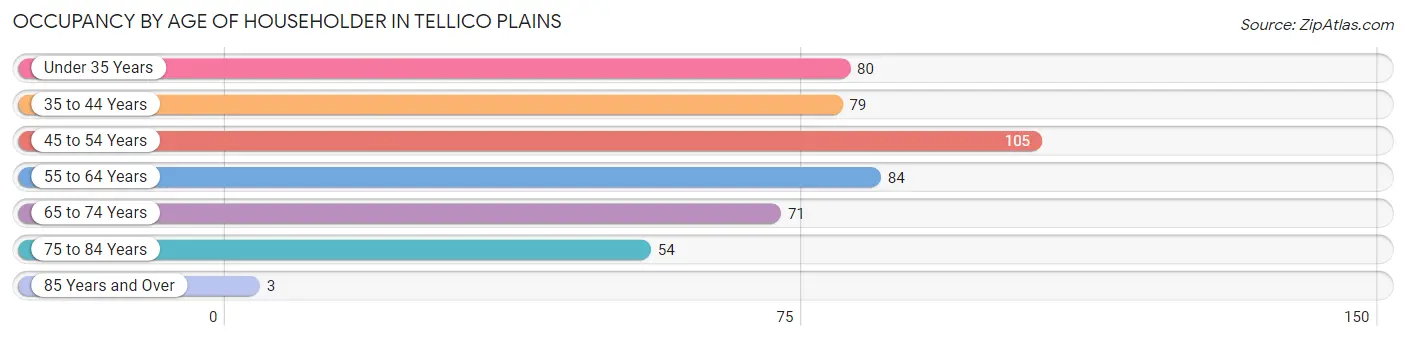
| Age Bracket | # Households | % Households |
| Under 35 Years | 80 | 16.8% |
| 35 to 44 Years | 79 | 16.6% |
| 45 to 54 Years | 105 | 22.1% |
| 55 to 64 Years | 84 | 17.6% |
| 65 to 74 Years | 71 | 14.9% |
| 75 to 84 Years | 54 | 11.3% |
| 85 Years and Over | 3 | 0.6% |
| Total | 476 | 100.0% |
Housing Finances in Tellico Plains
Median Income by Occupancy in Tellico Plains
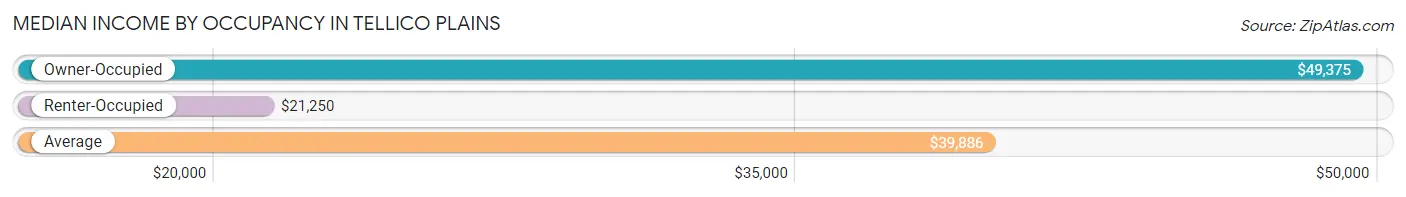
| Occupancy Type | # Households | Median Income |
| Owner-Occupied | 341 (71.6%) | $49,375 |
| Renter-Occupied | 135 (28.4%) | $21,250 |
| Average | 476 (100.0%) | $39,886 |
Occupancy by Householder Income Bracket in Tellico Plains
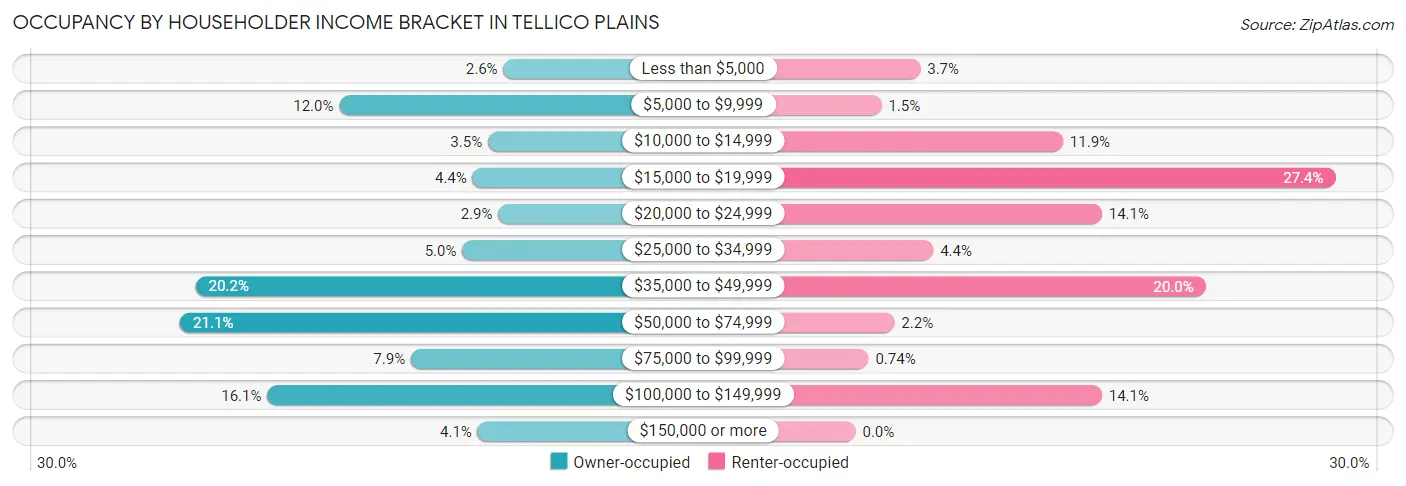
| Income Bracket | Owner-occupied | Renter-occupied |
| Less than $5,000 | 9 (2.6%) | 5 (3.7%) |
| $5,000 to $9,999 | 41 (12.0%) | 2 (1.5%) |
| $10,000 to $14,999 | 12 (3.5%) | 16 (11.8%) |
| $15,000 to $19,999 | 15 (4.4%) | 37 (27.4%) |
| $20,000 to $24,999 | 10 (2.9%) | 19 (14.1%) |
| $25,000 to $34,999 | 17 (5.0%) | 6 (4.4%) |
| $35,000 to $49,999 | 69 (20.2%) | 27 (20.0%) |
| $50,000 to $74,999 | 72 (21.1%) | 3 (2.2%) |
| $75,000 to $99,999 | 27 (7.9%) | 1 (0.7%) |
| $100,000 to $149,999 | 55 (16.1%) | 19 (14.1%) |
| $150,000 or more | 14 (4.1%) | 0 (0.0%) |
| Total | 341 (100.0%) | 135 (100.0%) |
Monthly Housing Cost Tiers in Tellico Plains
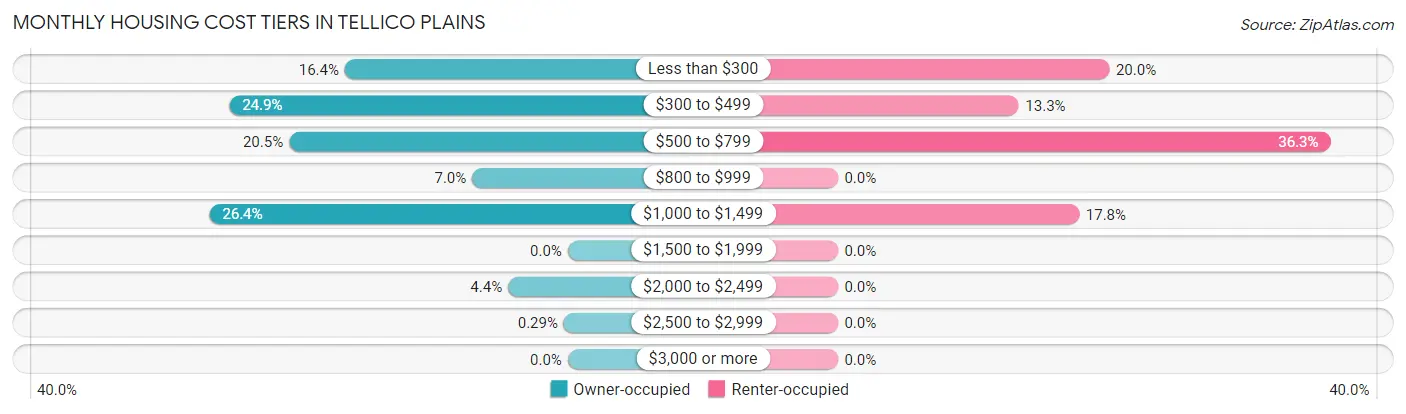
| Monthly Cost | Owner-occupied | Renter-occupied |
| Less than $300 | 56 (16.4%) | 27 (20.0%) |
| $300 to $499 | 85 (24.9%) | 18 (13.3%) |
| $500 to $799 | 70 (20.5%) | 49 (36.3%) |
| $800 to $999 | 24 (7.0%) | 0 (0.0%) |
| $1,000 to $1,499 | 90 (26.4%) | 24 (17.8%) |
| $1,500 to $1,999 | 0 (0.0%) | 0 (0.0%) |
| $2,000 to $2,499 | 15 (4.4%) | 0 (0.0%) |
| $2,500 to $2,999 | 1 (0.3%) | 0 (0.0%) |
| $3,000 or more | 0 (0.0%) | 0 (0.0%) |
| Total | 341 (100.0%) | 135 (100.0%) |
Physical Housing Characteristics in Tellico Plains
Housing Structures in Tellico Plains
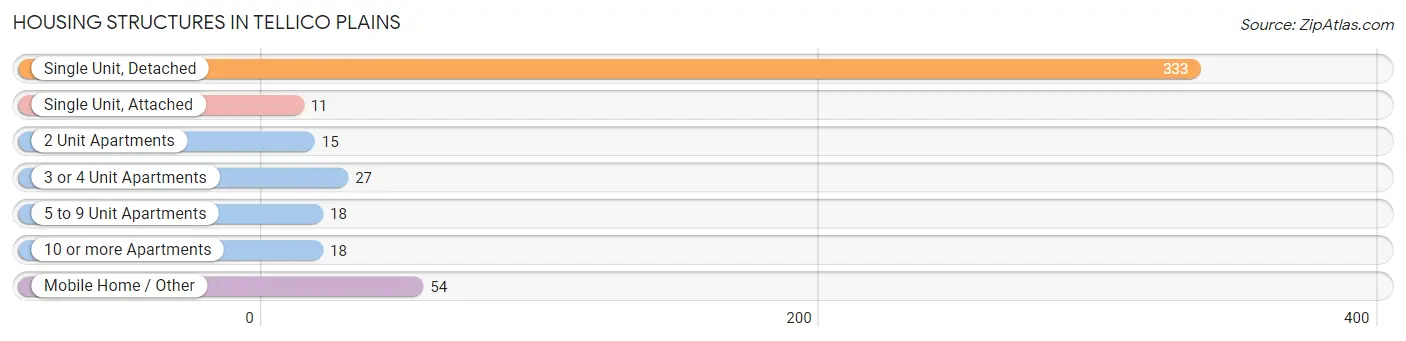
| Structure Type | # Housing Units | % Housing Units |
| Single Unit, Detached | 333 | 70.0% |
| Single Unit, Attached | 11 | 2.3% |
| 2 Unit Apartments | 15 | 3.2% |
| 3 or 4 Unit Apartments | 27 | 5.7% |
| 5 to 9 Unit Apartments | 18 | 3.8% |
| 10 or more Apartments | 18 | 3.8% |
| Mobile Home / Other | 54 | 11.3% |
| Total | 476 | 100.0% |
Housing Structures by Occupancy in Tellico Plains
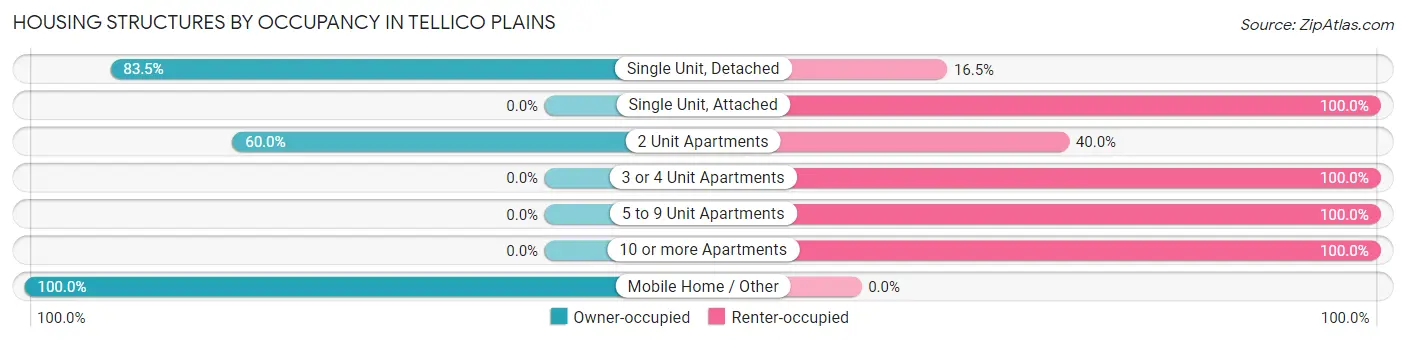
| Structure Type | Owner-occupied | Renter-occupied |
| Single Unit, Detached | 278 (83.5%) | 55 (16.5%) |
| Single Unit, Attached | 0 (0.0%) | 11 (100.0%) |
| 2 Unit Apartments | 9 (60.0%) | 6 (40.0%) |
| 3 or 4 Unit Apartments | 0 (0.0%) | 27 (100.0%) |
| 5 to 9 Unit Apartments | 0 (0.0%) | 18 (100.0%) |
| 10 or more Apartments | 0 (0.0%) | 18 (100.0%) |
| Mobile Home / Other | 54 (100.0%) | 0 (0.0%) |
| Total | 341 (71.6%) | 135 (28.4%) |
Housing Structures by Number of Rooms in Tellico Plains
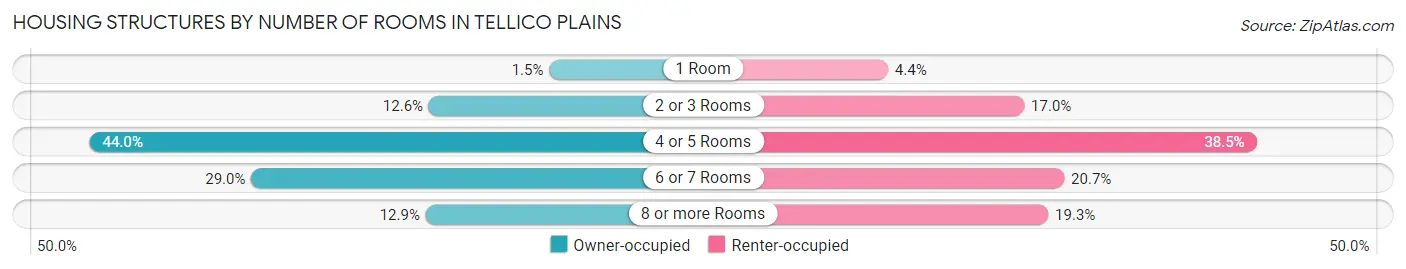
| Number of Rooms | Owner-occupied | Renter-occupied |
| 1 Room | 5 (1.5%) | 6 (4.4%) |
| 2 or 3 Rooms | 43 (12.6%) | 23 (17.0%) |
| 4 or 5 Rooms | 150 (44.0%) | 52 (38.5%) |
| 6 or 7 Rooms | 99 (29.0%) | 28 (20.7%) |
| 8 or more Rooms | 44 (12.9%) | 26 (19.3%) |
| Total | 341 (100.0%) | 135 (100.0%) |
Housing Structure by Heating Type in Tellico Plains
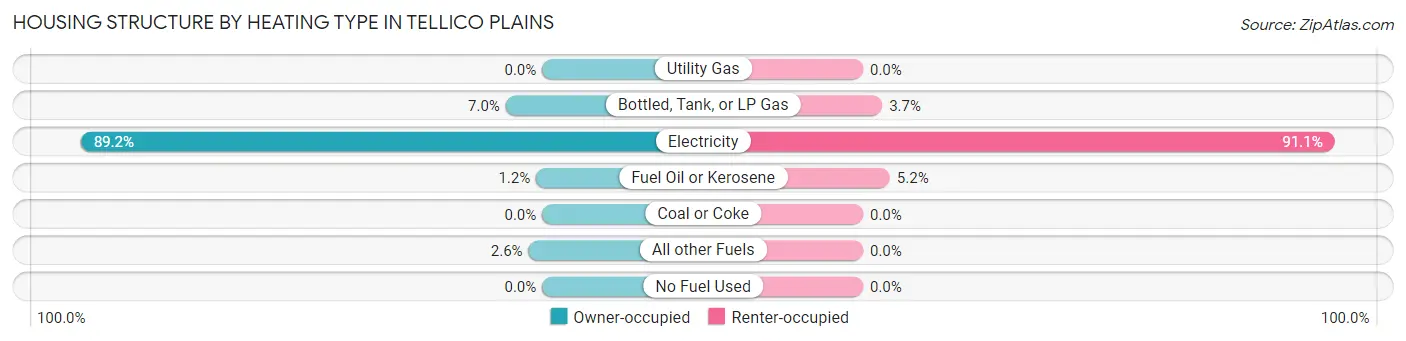
| Heating Type | Owner-occupied | Renter-occupied |
| Utility Gas | 0 (0.0%) | 0 (0.0%) |
| Bottled, Tank, or LP Gas | 24 (7.0%) | 5 (3.7%) |
| Electricity | 304 (89.1%) | 123 (91.1%) |
| Fuel Oil or Kerosene | 4 (1.2%) | 7 (5.2%) |
| Coal or Coke | 0 (0.0%) | 0 (0.0%) |
| All other Fuels | 9 (2.6%) | 0 (0.0%) |
| No Fuel Used | 0 (0.0%) | 0 (0.0%) |
| Total | 341 (100.0%) | 135 (100.0%) |
Household Vehicle Usage in Tellico Plains
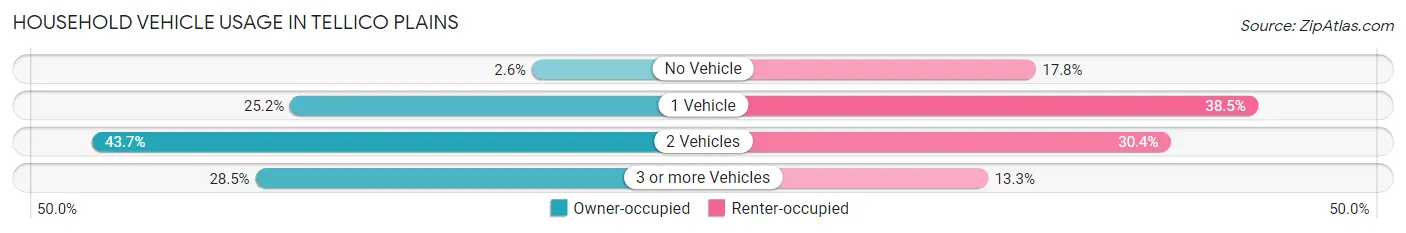
| Vehicles per Household | Owner-occupied | Renter-occupied |
| No Vehicle | 9 (2.6%) | 24 (17.8%) |
| 1 Vehicle | 86 (25.2%) | 52 (38.5%) |
| 2 Vehicles | 149 (43.7%) | 41 (30.4%) |
| 3 or more Vehicles | 97 (28.4%) | 18 (13.3%) |
| Total | 341 (100.0%) | 135 (100.0%) |
Real Estate & Mortgages in Tellico Plains
Real Estate and Mortgage Overview in Tellico Plains
| Characteristic | Without Mortgage | With Mortgage |
| Housing Units | 154 | 187 |
| Median Property Value | $109,400 | $207,300 |
| Median Household Income | $39,615 | $10 |
| Monthly Housing Costs | $348 | $0 |
| Real Estate Taxes | $452 | $1 |
Property Value by Mortgage Status in Tellico Plains
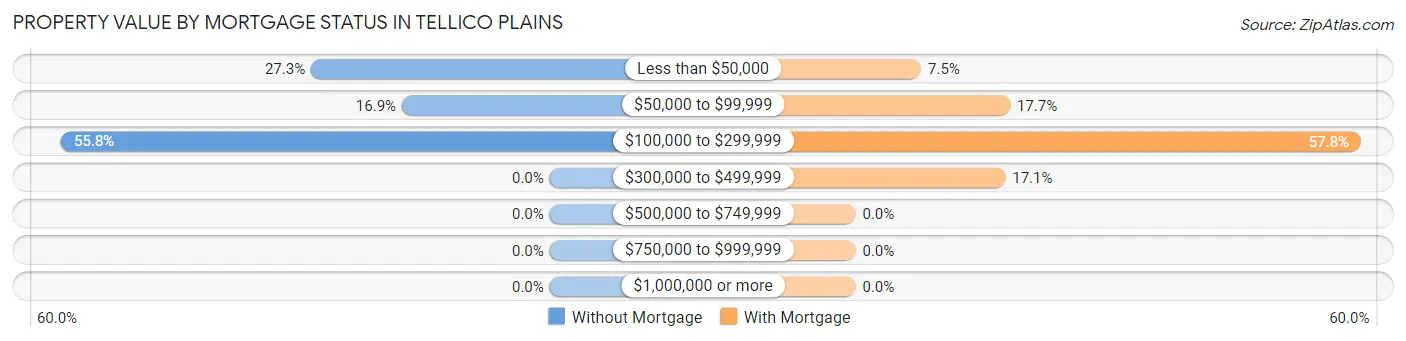
| Property Value | Without Mortgage | With Mortgage |
| Less than $50,000 | 42 (27.3%) | 14 (7.5%) |
| $50,000 to $99,999 | 26 (16.9%) | 33 (17.6%) |
| $100,000 to $299,999 | 86 (55.8%) | 108 (57.8%) |
| $300,000 to $499,999 | 0 (0.0%) | 32 (17.1%) |
| $500,000 to $749,999 | 0 (0.0%) | 0 (0.0%) |
| $750,000 to $999,999 | 0 (0.0%) | 0 (0.0%) |
| $1,000,000 or more | 0 (0.0%) | 0 (0.0%) |
| Total | 154 (100.0%) | 187 (100.0%) |
Household Income by Mortgage Status in Tellico Plains
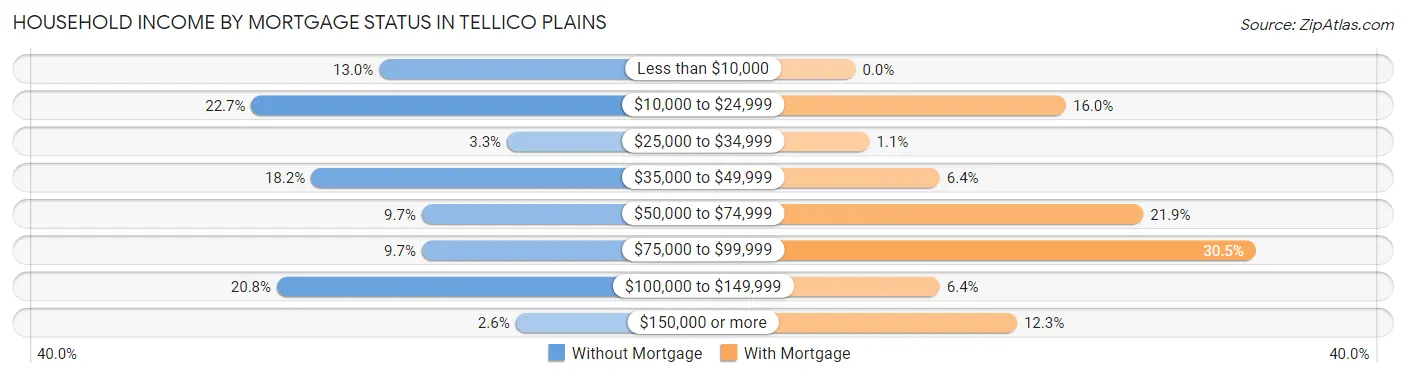
| Household Income | Without Mortgage | With Mortgage |
| Less than $10,000 | 20 (13.0%) | 0 (0.0%) |
| $10,000 to $24,999 | 35 (22.7%) | 30 (16.0%) |
| $25,000 to $34,999 | 5 (3.3%) | 2 (1.1%) |
| $35,000 to $49,999 | 28 (18.2%) | 12 (6.4%) |
| $50,000 to $74,999 | 15 (9.7%) | 41 (21.9%) |
| $75,000 to $99,999 | 15 (9.7%) | 57 (30.5%) |
| $100,000 to $149,999 | 32 (20.8%) | 12 (6.4%) |
| $150,000 or more | 4 (2.6%) | 23 (12.3%) |
| Total | 154 (100.0%) | 187 (100.0%) |
Property Value to Household Income Ratio in Tellico Plains
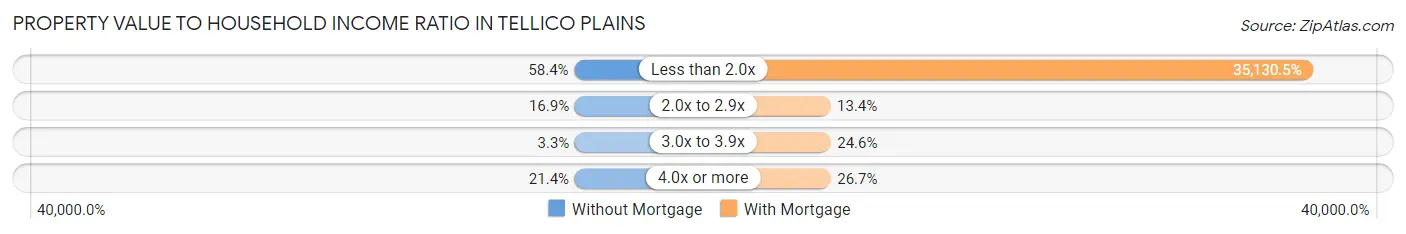
| Value-to-Income Ratio | Without Mortgage | With Mortgage |
| Less than 2.0x | 90 (58.4%) | 65,694 (35,130.5%) |
| 2.0x to 2.9x | 26 (16.9%) | 25 (13.4%) |
| 3.0x to 3.9x | 5 (3.3%) | 46 (24.6%) |
| 4.0x or more | 33 (21.4%) | 50 (26.7%) |
| Total | 154 (100.0%) | 187 (100.0%) |
Real Estate Taxes by Mortgage Status in Tellico Plains
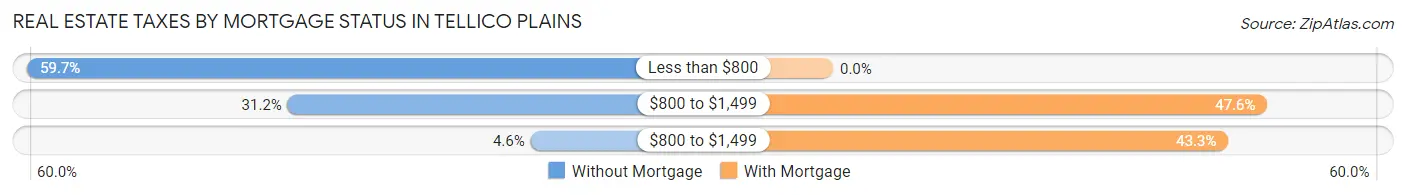
| Property Taxes | Without Mortgage | With Mortgage |
| Less than $800 | 92 (59.7%) | 0 (0.0%) |
| $800 to $1,499 | 48 (31.2%) | 89 (47.6%) |
| $800 to $1,499 | 7 (4.5%) | 81 (43.3%) |
| Total | 154 (100.0%) | 187 (100.0%) |
Health & Disability in Tellico Plains
Health Insurance Coverage by Age in Tellico Plains
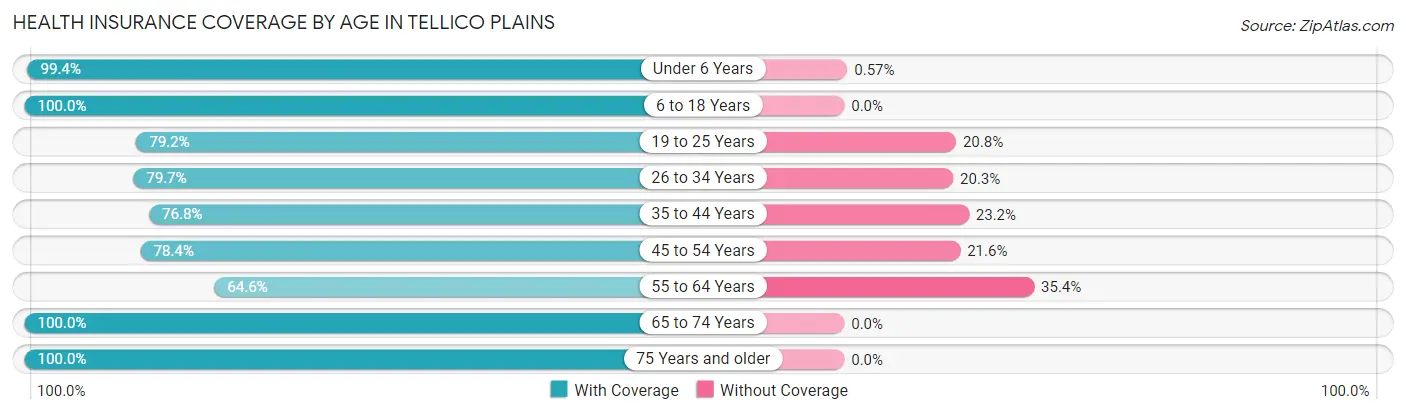
| Age Bracket | With Coverage | Without Coverage |
| Under 6 Years | 173 (99.4%) | 1 (0.6%) |
| 6 to 18 Years | 301 (100.0%) | 0 (0.0%) |
| 19 to 25 Years | 57 (79.2%) | 15 (20.8%) |
| 26 to 34 Years | 110 (79.7%) | 28 (20.3%) |
| 35 to 44 Years | 119 (76.8%) | 36 (23.2%) |
| 45 to 54 Years | 116 (78.4%) | 32 (21.6%) |
| 55 to 64 Years | 73 (64.6%) | 40 (35.4%) |
| 65 to 74 Years | 84 (100.0%) | 0 (0.0%) |
| 75 Years and older | 90 (100.0%) | 0 (0.0%) |
| Total | 1,123 (88.1%) | 152 (11.9%) |
Health Insurance Coverage by Citizenship Status in Tellico Plains
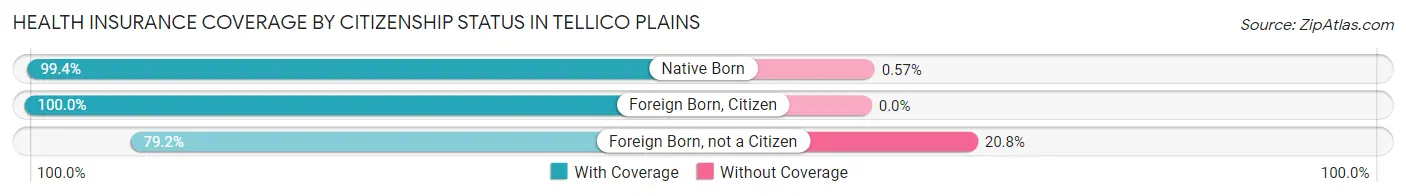
| Citizenship Status | With Coverage | Without Coverage |
| Native Born | 173 (99.4%) | 1 (0.6%) |
| Foreign Born, Citizen | 301 (100.0%) | 0 (0.0%) |
| Foreign Born, not a Citizen | 57 (79.2%) | 15 (20.8%) |
Health Insurance Coverage by Household Income in Tellico Plains
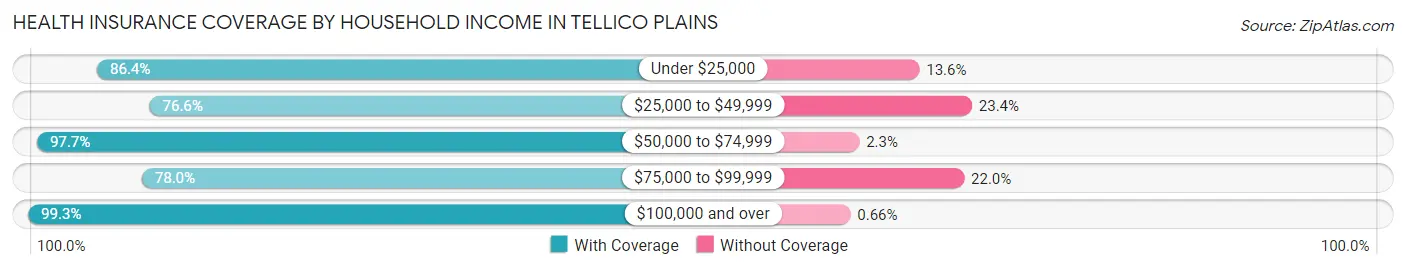
| Household Income | With Coverage | Without Coverage |
| Under $25,000 | 350 (86.4%) | 55 (13.6%) |
| $25,000 to $49,999 | 232 (76.6%) | 71 (23.4%) |
| $50,000 to $74,999 | 168 (97.7%) | 4 (2.3%) |
| $75,000 to $99,999 | 71 (78.0%) | 20 (22.0%) |
| $100,000 and over | 302 (99.3%) | 2 (0.7%) |
Public vs Private Health Insurance Coverage by Age in Tellico Plains
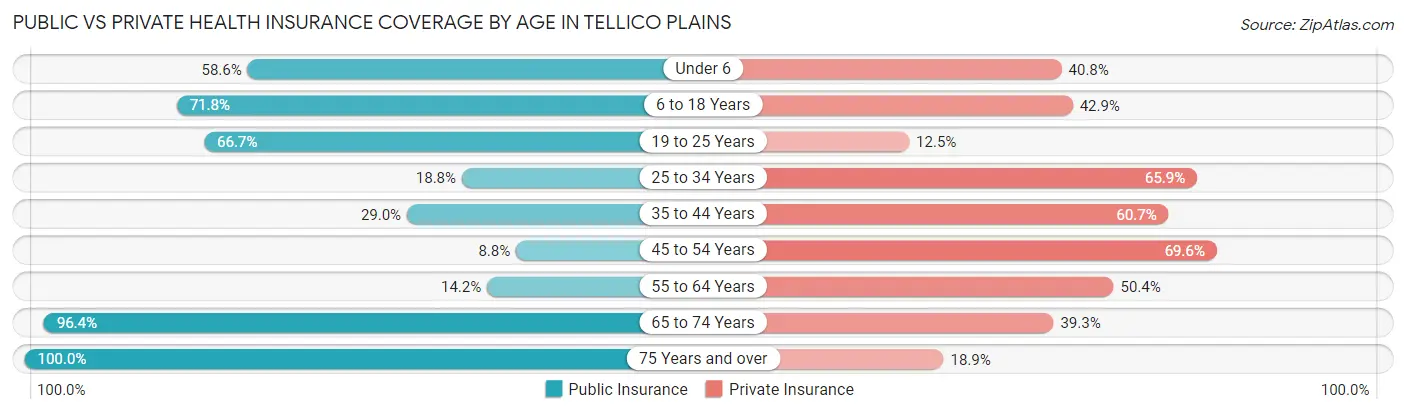
| Age Bracket | Public Insurance | Private Insurance |
| Under 6 | 102 (58.6%) | 71 (40.8%) |
| 6 to 18 Years | 216 (71.8%) | 129 (42.9%) |
| 19 to 25 Years | 48 (66.7%) | 9 (12.5%) |
| 25 to 34 Years | 26 (18.8%) | 91 (65.9%) |
| 35 to 44 Years | 45 (29.0%) | 94 (60.7%) |
| 45 to 54 Years | 13 (8.8%) | 103 (69.6%) |
| 55 to 64 Years | 16 (14.2%) | 57 (50.4%) |
| 65 to 74 Years | 81 (96.4%) | 33 (39.3%) |
| 75 Years and over | 90 (100.0%) | 17 (18.9%) |
| Total | 637 (50.0%) | 604 (47.4%) |
Disability Status by Sex by Age in Tellico Plains
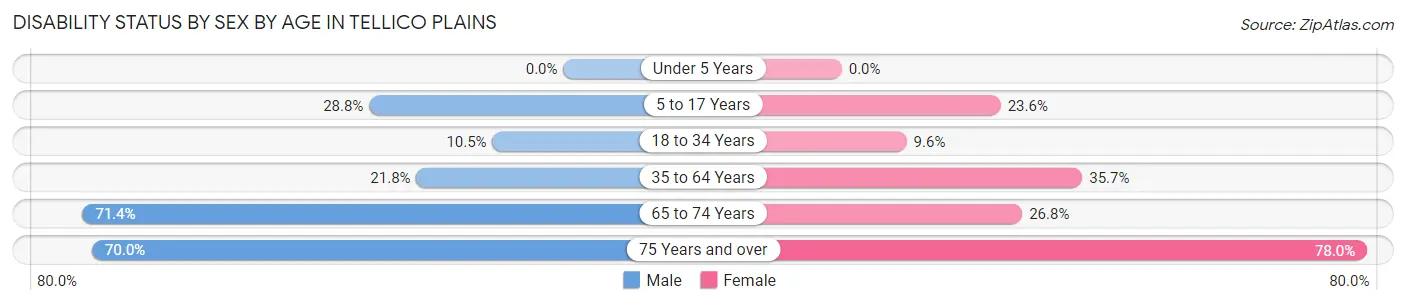
| Age Bracket | Male | Female |
| Under 5 Years | 0 (0.0%) | 0 (0.0%) |
| 5 to 17 Years | 64 (28.8%) | 38 (23.6%) |
| 18 to 34 Years | 10 (10.5%) | 13 (9.6%) |
| 35 to 64 Years | 48 (21.8%) | 70 (35.7%) |
| 65 to 74 Years | 20 (71.4%) | 15 (26.8%) |
| 75 Years and over | 28 (70.0%) | 39 (78.0%) |
Disability Class by Sex by Age in Tellico Plains
Disability Class: Hearing Difficulty
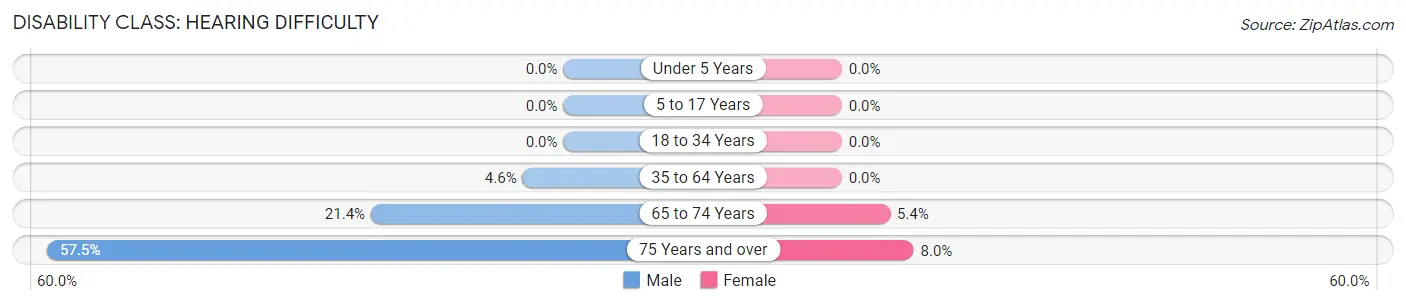
| Age Bracket | Male | Female |
| Under 5 Years | 0 (0.0%) | 0 (0.0%) |
| 5 to 17 Years | 0 (0.0%) | 0 (0.0%) |
| 18 to 34 Years | 0 (0.0%) | 0 (0.0%) |
| 35 to 64 Years | 10 (4.5%) | 0 (0.0%) |
| 65 to 74 Years | 6 (21.4%) | 3 (5.4%) |
| 75 Years and over | 23 (57.5%) | 4 (8.0%) |
Disability Class: Vision Difficulty
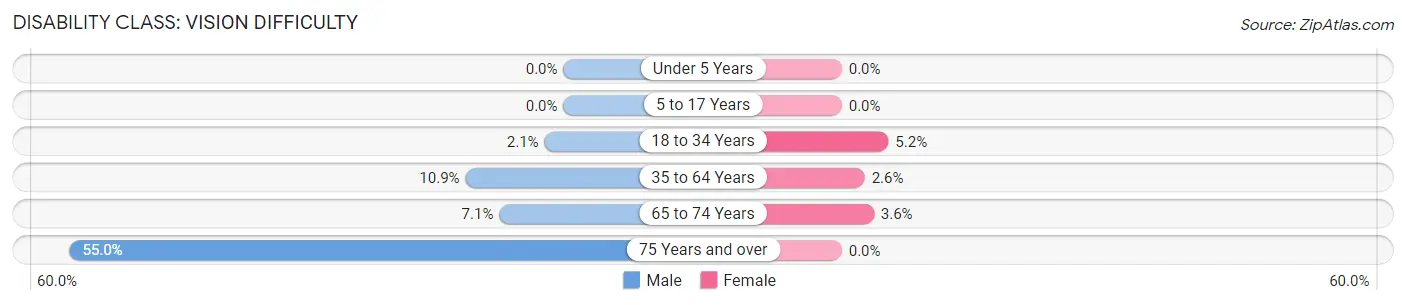
| Age Bracket | Male | Female |
| Under 5 Years | 0 (0.0%) | 0 (0.0%) |
| 5 to 17 Years | 0 (0.0%) | 0 (0.0%) |
| 18 to 34 Years | 2 (2.1%) | 7 (5.2%) |
| 35 to 64 Years | 24 (10.9%) | 5 (2.5%) |
| 65 to 74 Years | 2 (7.1%) | 2 (3.6%) |
| 75 Years and over | 22 (55.0%) | 0 (0.0%) |
Disability Class: Cognitive Difficulty
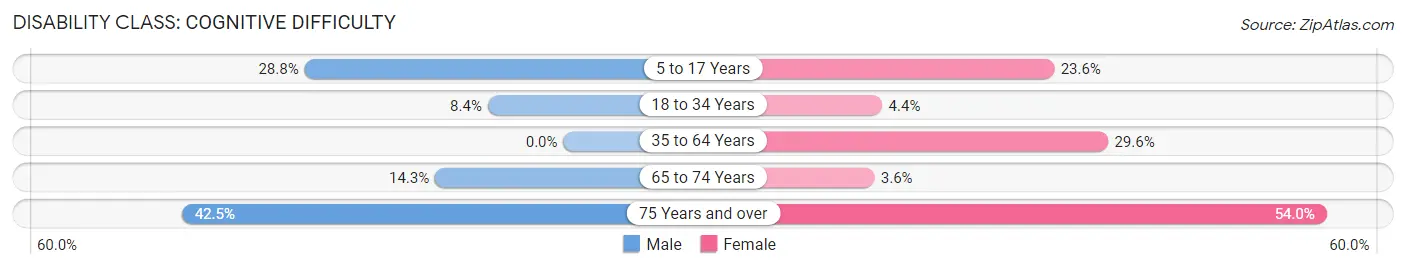
| Age Bracket | Male | Female |
| 5 to 17 Years | 64 (28.8%) | 38 (23.6%) |
| 18 to 34 Years | 8 (8.4%) | 6 (4.4%) |
| 35 to 64 Years | 0 (0.0%) | 58 (29.6%) |
| 65 to 74 Years | 4 (14.3%) | 2 (3.6%) |
| 75 Years and over | 17 (42.5%) | 27 (54.0%) |
Disability Class: Ambulatory Difficulty
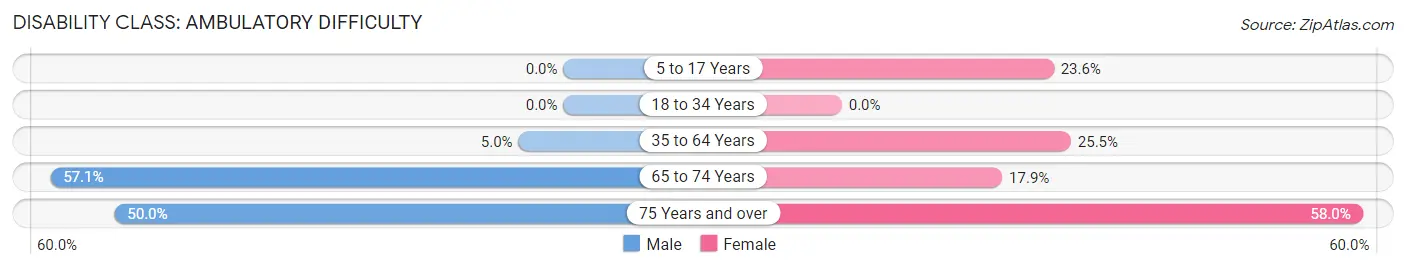
| Age Bracket | Male | Female |
| 5 to 17 Years | 0 (0.0%) | 38 (23.6%) |
| 18 to 34 Years | 0 (0.0%) | 0 (0.0%) |
| 35 to 64 Years | 11 (5.0%) | 50 (25.5%) |
| 65 to 74 Years | 16 (57.1%) | 10 (17.9%) |
| 75 Years and over | 20 (50.0%) | 29 (58.0%) |
Disability Class: Self-Care Difficulty
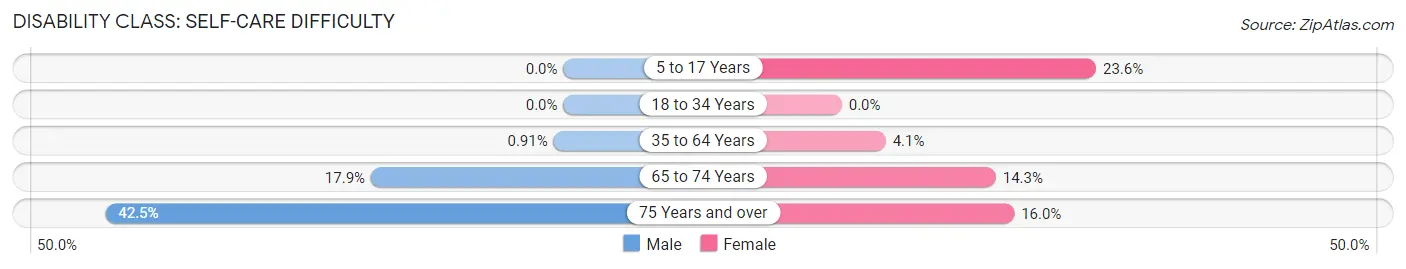
| Age Bracket | Male | Female |
| 5 to 17 Years | 0 (0.0%) | 38 (23.6%) |
| 18 to 34 Years | 0 (0.0%) | 0 (0.0%) |
| 35 to 64 Years | 2 (0.9%) | 8 (4.1%) |
| 65 to 74 Years | 5 (17.9%) | 8 (14.3%) |
| 75 Years and over | 17 (42.5%) | 8 (16.0%) |
Technology Access in Tellico Plains
Computing Device Access in Tellico Plains
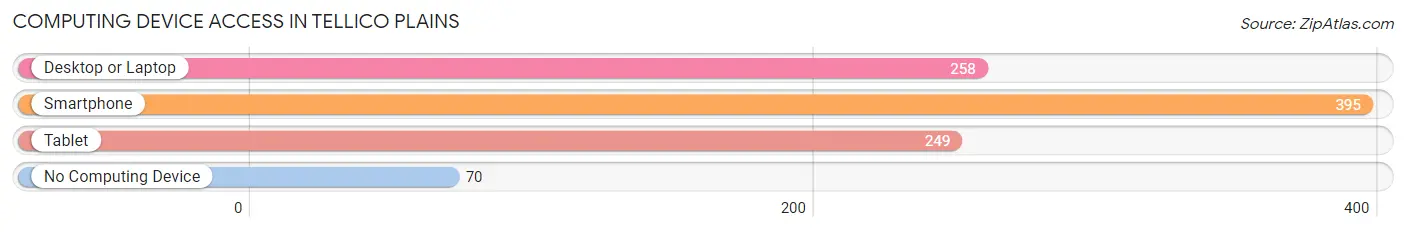
| Device Type | # Households | % Households |
| Desktop or Laptop | 258 | 54.2% |
| Smartphone | 395 | 83.0% |
| Tablet | 249 | 52.3% |
| No Computing Device | 70 | 14.7% |
| Total | 476 | 100.0% |
Internet Access in Tellico Plains
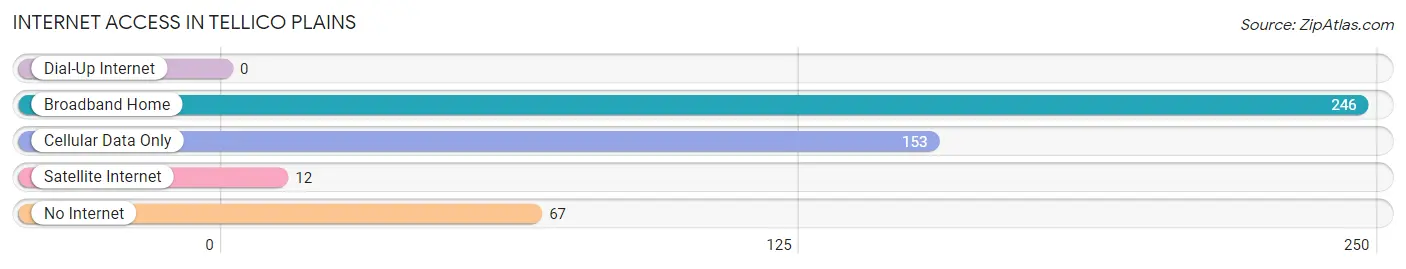
| Internet Type | # Households | % Households |
| Dial-Up Internet | 0 | 0.0% |
| Broadband Home | 246 | 51.7% |
| Cellular Data Only | 153 | 32.1% |
| Satellite Internet | 12 | 2.5% |
| No Internet | 67 | 14.1% |
| Total | 476 | 100.0% |
Tellico Plains Summary
Tellico Plains is a small town located in Monroe County, Tennessee. It is situated in the foothills of the Great Smoky Mountains, and is part of the Cherokee National Forest. The town has a population of 1,741 people, according to the 2010 census.
History
The area that is now Tellico Plains was originally inhabited by the Cherokee Indians. The town was founded in 1819 by settlers from North Carolina, and was named after the nearby Tellico River. The town was incorporated in 1837, and was the first county seat of Monroe County.
During the Civil War, Tellico Plains was the site of a major battle between Union and Confederate forces. The Battle of Tellico Plains was fought on November 29, 1863, and resulted in a Confederate victory.
Geography
Tellico Plains is located in the foothills of the Great Smoky Mountains, and is part of the Cherokee National Forest. The town is situated at an elevation of 1,068 feet above sea level. The town is located along the Tellico River, and is surrounded by the Unicoi Mountains to the north and the Bald Mountains to the south.
The climate in Tellico Plains is humid subtropical, with hot summers and mild winters. The average annual temperature is 57 degrees Fahrenheit, and the average annual precipitation is 51 inches.
Economy
The economy of Tellico Plains is largely based on tourism. The town is a popular destination for outdoor activities such as fishing, camping, hiking, and whitewater rafting. The town is also home to several antique stores, restaurants, and other businesses.
The town is also home to several manufacturing companies, including Tellico Manufacturing, which produces automotive parts, and Tellico Plastics, which produces plastic products.
Demographics
As of the 2010 census, the population of Tellico Plains was 1,741 people. The racial makeup of the town was 95.3% White, 0.9% African American, 0.7% Native American, 0.3% Asian, 0.1% Pacific Islander, and 2.7% from other races. The median household income was $30,938, and the median family income was $37,813.
The town is served by the Tellico Plains School District, which consists of two elementary schools, one middle school, and one high school. The town is also home to the Tellico Plains Public Library.
Conclusion
Tellico Plains is a small town located in Monroe County, Tennessee. It is situated in the foothills of the Great Smoky Mountains, and is part of the Cherokee National Forest. The town has a population of 1,741 people, according to the 2010 census. The economy of Tellico Plains is largely based on tourism, and the town is a popular destination for outdoor activities such as fishing, camping, hiking, and whitewater rafting. The town is also home to several manufacturing companies, and is served by the Tellico Plains School District.
Common Questions
What is Per Capita Income in Tellico Plains?
Per Capita income in Tellico Plains is $19,419.
What is the Median Family Income in Tellico Plains?
Median Family Income in Tellico Plains is $48,750.
What is the Median Household income in Tellico Plains?
Median Household Income in Tellico Plains is $39,886.
What is Income or Wage Gap in Tellico Plains?
Income or Wage Gap in Tellico Plains is 37.3%.
Women in Tellico Plains earn 62.7 cents for every dollar earned by a man.
What is Inequality or Gini Index in Tellico Plains?
Inequality or Gini Index in Tellico Plains is 0.45.
What is the Total Population of Tellico Plains?
Total Population of Tellico Plains is 1,275.
What is the Total Male Population of Tellico Plains?
Total Male Population of Tellico Plains is 652.
What is the Total Female Population of Tellico Plains?
Total Female Population of Tellico Plains is 623.
What is the Ratio of Males per 100 Females in Tellico Plains?
There are 104.65 Males per 100 Females in Tellico Plains.
What is the Ratio of Females per 100 Males in Tellico Plains?
There are 95.55 Females per 100 Males in Tellico Plains.
What is the Median Population Age in Tellico Plains?
Median Population Age in Tellico Plains is 32.4 Years.
What is the Average Family Size in Tellico Plains
Average Family Size in Tellico Plains is 3.1 People.
What is the Average Household Size in Tellico Plains
Average Household Size in Tellico Plains is 2.7 People.
How Large is the Labor Force in Tellico Plains?
There are 463 People in the Labor Forcein in Tellico Plains.
What is the Percentage of People in the Labor Force in Tellico Plains?
55.3% of People are in the Labor Force in Tellico Plains.
What is the Unemployment Rate in Tellico Plains?
Unemployment Rate in Tellico Plains is 6.5%.