Telford, TN Map & Demographics
Telford Map
Telford Overview
$27,699
PER CAPITA INCOME
$78,864
AVG FAMILY INCOME
$62,750
AVG HOUSEHOLD INCOME
68.5%
WAGE / INCOME GAP [ % ]
31.5¢/ $1
WAGE / INCOME GAP [ $ ]
0.37
INEQUALITY / GINI INDEX
992
TOTAL POPULATION
573
MALE POPULATION
419
FEMALE POPULATION
136.75
MALES / 100 FEMALES
73.12
FEMALES / 100 MALES
45.8
MEDIAN AGE
3.0
AVG FAMILY SIZE
2.6
AVG HOUSEHOLD SIZE
440
LABOR FORCE [ PEOPLE ]
49.4%
PERCENT IN LABOR FORCE
6.4%
UNEMPLOYMENT RATE
Telford Zip Codes
Telford Area Codes
Income in Telford
Income Overview in Telford
Per Capita Income in Telford is $27,699, while median incomes of families and households are $78,864 and $62,750 respectively.
| Characteristic | Number | Measure |
| Per Capita Income | 992 | $27,699 |
| Median Family Income | 260 | $78,864 |
| Mean Family Income | 260 | $74,818 |
| Median Household Income | 387 | $62,750 |
| Mean Household Income | 387 | $70,010 |
| Income Deficit | 260 | $0 |
| Wage / Income Gap (%) | 992 | 68.53% |
| Wage / Income Gap ($) | 992 | 31.47¢ per $1 |
| Gini / Inequality Index | 992 | 0.37 |
Earnings by Sex in Telford
Average Earnings in Telford are $25,492, $45,585 for men and $14,346 for women, a difference of 68.5%.
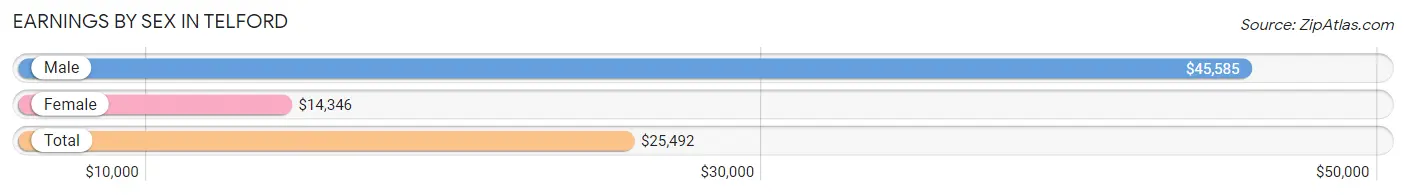
| Sex | Number | Average Earnings |
| Male | 301 (63.9%) | $45,585 |
| Female | 170 (36.1%) | $14,346 |
| Total | 471 (100.0%) | $25,492 |
Earnings by Sex by Income Bracket in Telford
The most common earnings brackets in Telford are $75,000 to $99,999 for men (71 | 23.6%) and $12,500 to $14,999 for women (65 | 38.2%).
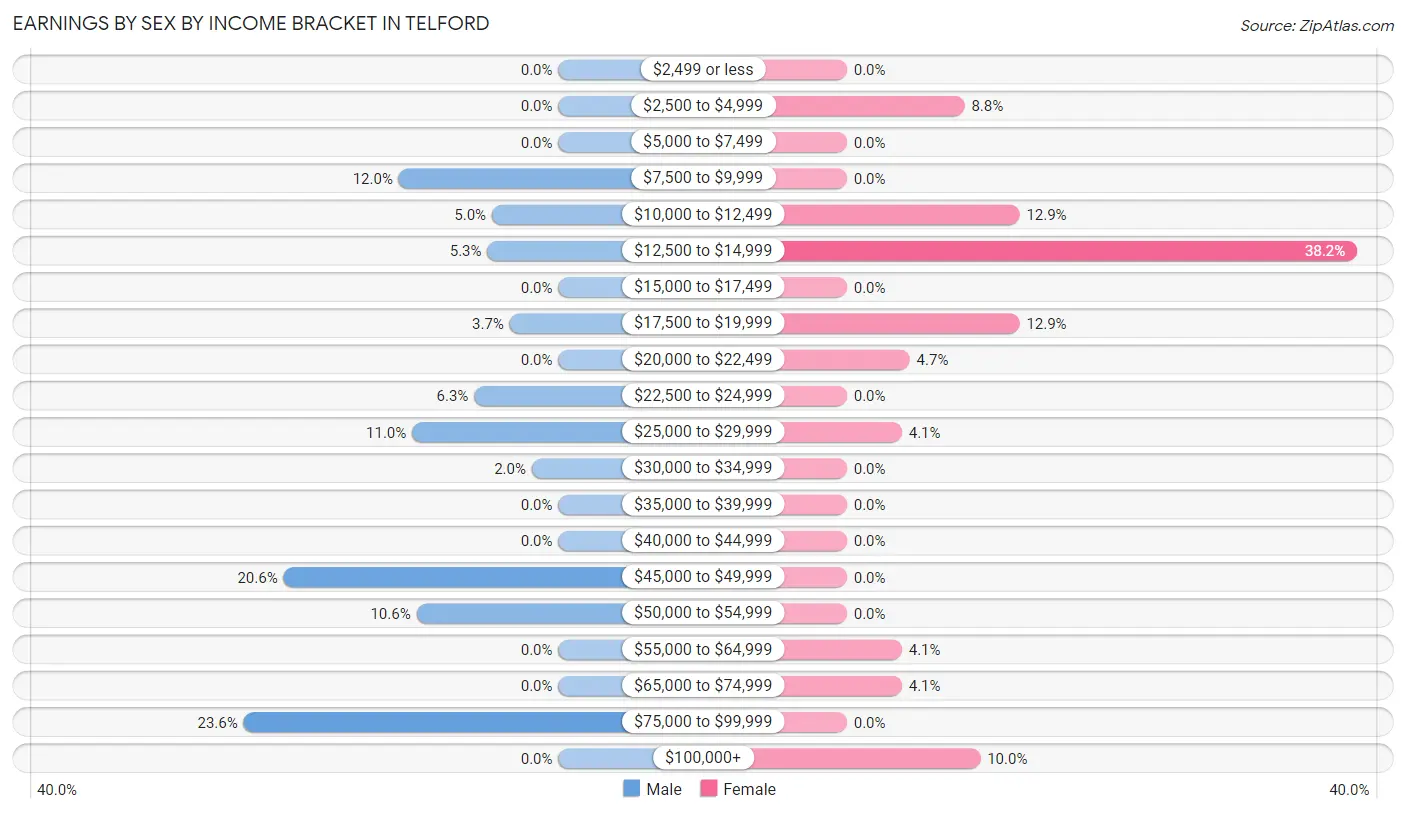
| Income | Male | Female |
| $2,499 or less | 0 (0.0%) | 0 (0.0%) |
| $2,500 to $4,999 | 0 (0.0%) | 15 (8.8%) |
| $5,000 to $7,499 | 0 (0.0%) | 0 (0.0%) |
| $7,500 to $9,999 | 36 (12.0%) | 0 (0.0%) |
| $10,000 to $12,499 | 15 (5.0%) | 22 (12.9%) |
| $12,500 to $14,999 | 16 (5.3%) | 65 (38.2%) |
| $15,000 to $17,499 | 0 (0.0%) | 0 (0.0%) |
| $17,500 to $19,999 | 11 (3.6%) | 22 (12.9%) |
| $20,000 to $22,499 | 0 (0.0%) | 8 (4.7%) |
| $22,500 to $24,999 | 19 (6.3%) | 0 (0.0%) |
| $25,000 to $29,999 | 33 (11.0%) | 7 (4.1%) |
| $30,000 to $34,999 | 6 (2.0%) | 0 (0.0%) |
| $35,000 to $39,999 | 0 (0.0%) | 0 (0.0%) |
| $40,000 to $44,999 | 0 (0.0%) | 0 (0.0%) |
| $45,000 to $49,999 | 62 (20.6%) | 0 (0.0%) |
| $50,000 to $54,999 | 32 (10.6%) | 0 (0.0%) |
| $55,000 to $64,999 | 0 (0.0%) | 7 (4.1%) |
| $65,000 to $74,999 | 0 (0.0%) | 7 (4.1%) |
| $75,000 to $99,999 | 71 (23.6%) | 0 (0.0%) |
| $100,000+ | 0 (0.0%) | 17 (10.0%) |
| Total | 301 (100.0%) | 170 (100.0%) |
Earnings by Sex by Educational Attainment in Telford
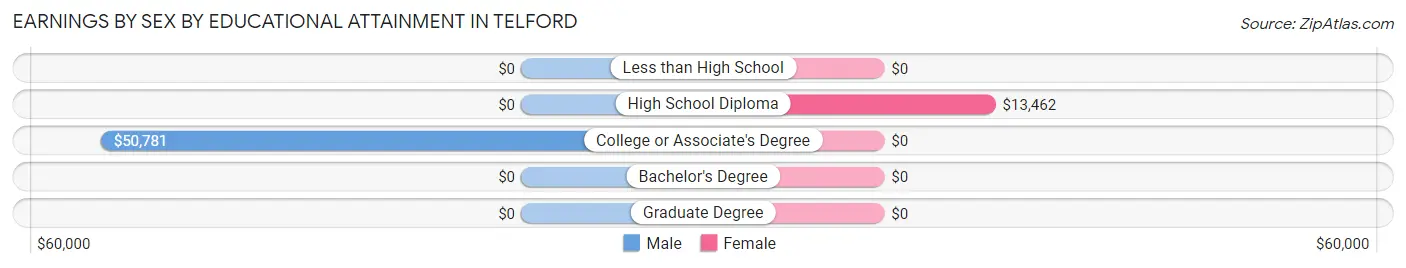
| Educational Attainment | Male Income | Female Income |
| Less than High School | - | - |
| High School Diploma | - | - |
| College or Associate's Degree | $50,781 | $0 |
| Bachelor's Degree | - | - |
| Graduate Degree | - | - |
| Total | - | - |
Family Income in Telford
Family Income Brackets in Telford
According to the Telford family income data, there are 112 families falling into the $75,000 to $99,999 income range, which is the most common income bracket and makes up 43.1% of all families.
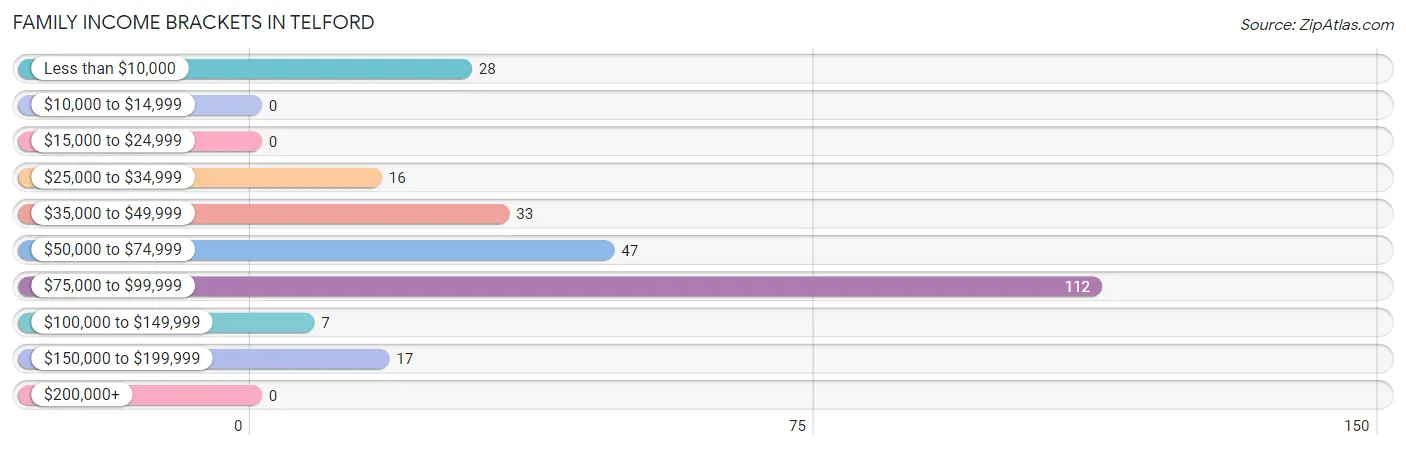
| Income Bracket | # Families | % Families |
| Less than $10,000 | 28 | 10.8% |
| $10,000 to $14,999 | 0 | 0.0% |
| $15,000 to $24,999 | 0 | 0.0% |
| $25,000 to $34,999 | 16 | 6.2% |
| $35,000 to $49,999 | 33 | 12.7% |
| $50,000 to $74,999 | 47 | 18.1% |
| $75,000 to $99,999 | 112 | 43.1% |
| $100,000 to $149,999 | 7 | 2.7% |
| $150,000 to $199,999 | 17 | 6.5% |
| $200,000+ | 0 | 0.0% |
Family Income by Famaliy Size in Telford
4-person families (68 | 26.2%) account for the highest median family income in Telford with $80,865 per family, while 2-person families (108 | 41.5%) have the highest median income of $26,666 per family member.
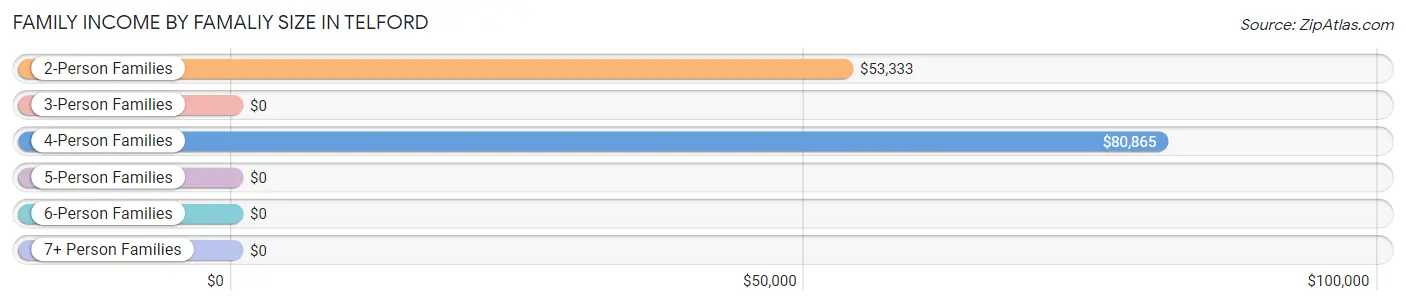
| Income Bracket | # Families | Median Income |
| 2-Person Families | 108 (41.5%) | $53,333 |
| 3-Person Families | 49 (18.9%) | $0 |
| 4-Person Families | 68 (26.2%) | $80,865 |
| 5-Person Families | 35 (13.5%) | $0 |
| 6-Person Families | 0 (0.0%) | $0 |
| 7+ Person Families | 0 (0.0%) | $0 |
| Total | 260 (100.0%) | $78,864 |
Family Income by Number of Earners in Telford
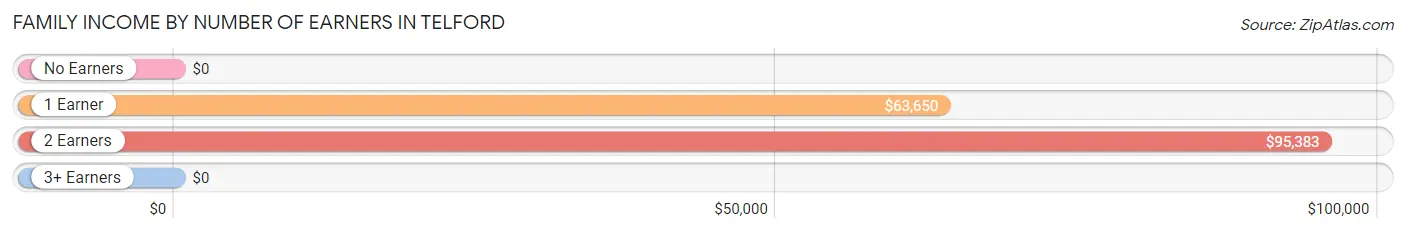
| Number of Earners | # Families | Median Income |
| No Earners | 44 (16.9%) | $0 |
| 1 Earner | 109 (41.9%) | $63,650 |
| 2 Earners | 83 (31.9%) | $95,383 |
| 3+ Earners | 24 (9.2%) | $0 |
| Total | 260 (100.0%) | $78,864 |
Household Income in Telford
Household Income Brackets in Telford
With 98 households falling in the category, the $25,000 to $34,999 income range is the most frequent in Telford, accounting for 25.3% of all households.
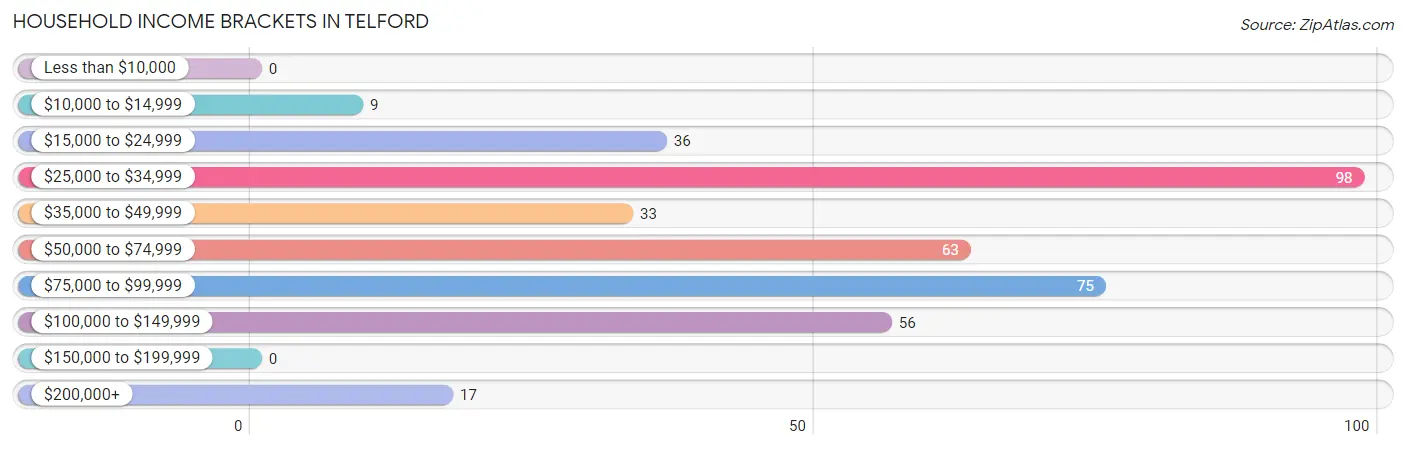
| Income Bracket | # Households | % Households |
| Less than $10,000 | 0 | 0.0% |
| $10,000 to $14,999 | 9 | 2.3% |
| $15,000 to $24,999 | 36 | 9.3% |
| $25,000 to $34,999 | 98 | 25.3% |
| $35,000 to $49,999 | 33 | 8.5% |
| $50,000 to $74,999 | 63 | 16.3% |
| $75,000 to $99,999 | 75 | 19.4% |
| $100,000 to $149,999 | 56 | 14.5% |
| $150,000 to $199,999 | 0 | 0.0% |
| $200,000+ | 17 | 4.4% |
Household Income by Householder Age in Telford
The median household income in Telford is $62,750, with the highest median household income of $52,583 found in the 65+ years age bracket for the primary householder. A total of 117 households (30.2%) fall into this category.
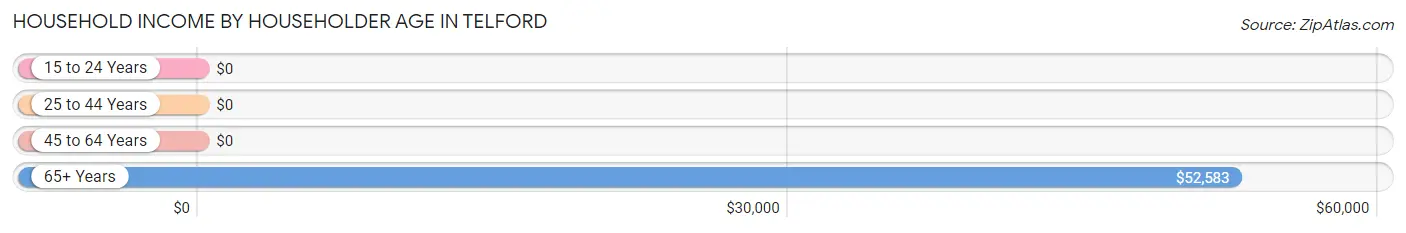
| Income Bracket | # Households | Median Income |
| 15 to 24 Years | 0 (0.0%) | $0 |
| 25 to 44 Years | 115 (29.7%) | $0 |
| 45 to 64 Years | 155 (40.1%) | $0 |
| 65+ Years | 117 (30.2%) | $52,583 |
| Total | 387 (100.0%) | $62,750 |
Poverty in Telford
Income Below Poverty by Sex and Age in Telford
With 12.6% poverty level for males and 17.9% for females among the residents of Telford, under 5 year old males and under 5 year old females are the most vulnerable to poverty, with 19 males (100.0%) and 44 females (100.0%) in their respective age groups living below the poverty level.
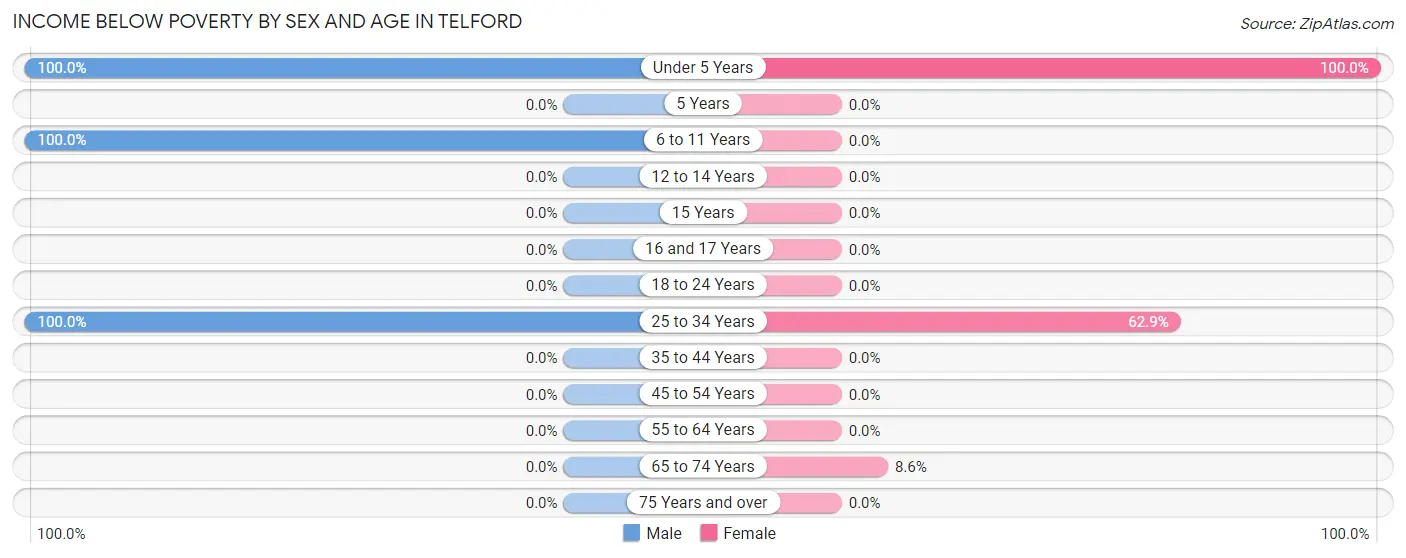
| Age Bracket | Male | Female |
| Under 5 Years | 19 (100.0%) | 44 (100.0%) |
| 5 Years | 0 (0.0%) | 0 (0.0%) |
| 6 to 11 Years | 25 (100.0%) | 0 (0.0%) |
| 12 to 14 Years | 0 (0.0%) | 0 (0.0%) |
| 15 Years | 0 (0.0%) | 0 (0.0%) |
| 16 and 17 Years | 0 (0.0%) | 0 (0.0%) |
| 18 to 24 Years | 0 (0.0%) | 0 (0.0%) |
| 25 to 34 Years | 28 (100.0%) | 22 (62.9%) |
| 35 to 44 Years | 0 (0.0%) | 0 (0.0%) |
| 45 to 54 Years | 0 (0.0%) | 0 (0.0%) |
| 55 to 64 Years | 0 (0.0%) | 0 (0.0%) |
| 65 to 74 Years | 0 (0.0%) | 9 (8.6%) |
| 75 Years and over | 0 (0.0%) | 0 (0.0%) |
| Total | 72 (12.6%) | 75 (17.9%) |
Income Above Poverty by Sex and Age in Telford
According to the poverty statistics in Telford, males aged 12 to 14 years and females aged 15 years are the age groups that are most secure financially, with 100.0% of males and 100.0% of females in these age groups living above the poverty line.
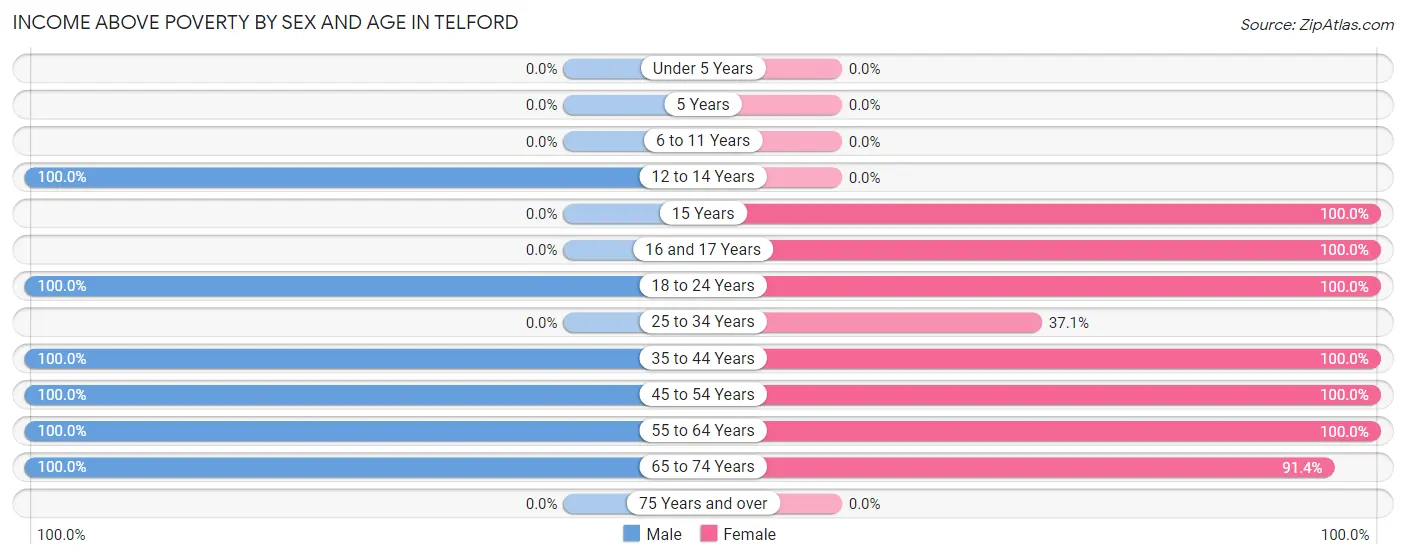
| Age Bracket | Male | Female |
| Under 5 Years | 0 (0.0%) | 0 (0.0%) |
| 5 Years | 0 (0.0%) | 0 (0.0%) |
| 6 to 11 Years | 0 (0.0%) | 0 (0.0%) |
| 12 to 14 Years | 7 (100.0%) | 0 (0.0%) |
| 15 Years | 0 (0.0%) | 7 (100.0%) |
| 16 and 17 Years | 0 (0.0%) | 53 (100.0%) |
| 18 to 24 Years | 89 (100.0%) | 11 (100.0%) |
| 25 to 34 Years | 0 (0.0%) | 13 (37.1%) |
| 35 to 44 Years | 52 (100.0%) | 75 (100.0%) |
| 45 to 54 Years | 122 (100.0%) | 46 (100.0%) |
| 55 to 64 Years | 133 (100.0%) | 43 (100.0%) |
| 65 to 74 Years | 98 (100.0%) | 96 (91.4%) |
| 75 Years and over | 0 (0.0%) | 0 (0.0%) |
| Total | 501 (87.4%) | 344 (82.1%) |
Income Below Poverty Among Married-Couple Families in Telford
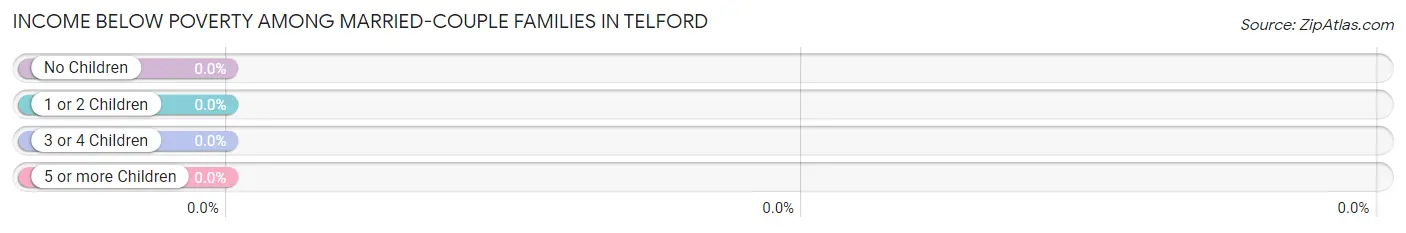
| Children | Above Poverty | Below Poverty |
| No Children | 134 (100.0%) | 0 (0.0%) |
| 1 or 2 Children | 56 (100.0%) | 0 (0.0%) |
| 3 or 4 Children | 0 (0.0%) | 0 (0.0%) |
| 5 or more Children | 0 (0.0%) | 0 (0.0%) |
| Total | 190 (100.0%) | 0 (0.0%) |
Income Below Poverty Among Single-Parent Households in Telford
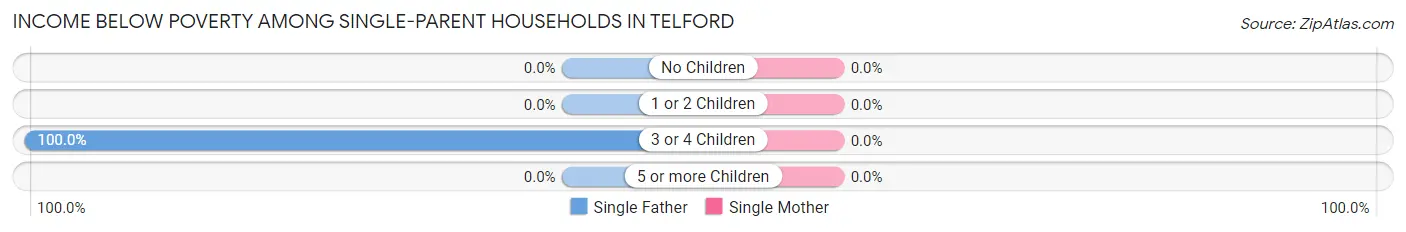
| Children | Single Father | Single Mother |
| No Children | 0 (0.0%) | 0 (0.0%) |
| 1 or 2 Children | 0 (0.0%) | 0 (0.0%) |
| 3 or 4 Children | 28 (100.0%) | 0 (0.0%) |
| 5 or more Children | 0 (0.0%) | 0 (0.0%) |
| Total | 28 (52.8%) | 0 (0.0%) |
Income Below Poverty Among Married-Couple vs Single-Parent Households in Telford
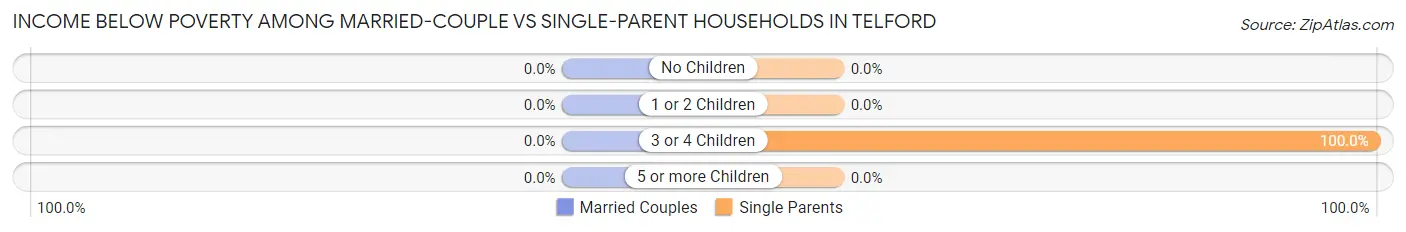
| Children | Married-Couple Families | Single-Parent Households |
| No Children | 0 (0.0%) | 0 (0.0%) |
| 1 or 2 Children | 0 (0.0%) | 0 (0.0%) |
| 3 or 4 Children | 0 (0.0%) | 28 (100.0%) |
| 5 or more Children | 0 (0.0%) | 0 (0.0%) |
| Total | 0 (0.0%) | 28 (40.0%) |
Race in Telford
The most populous races in Telford are White / Caucasian (963 | 97.1%), Two or more Races (19 | 1.9%), and Black / African American (10 | 1.0%).
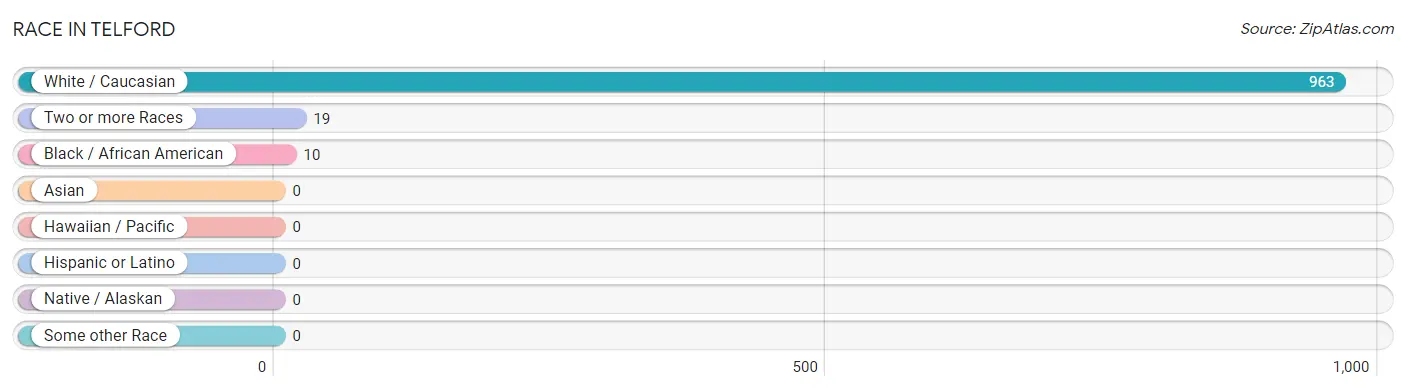
| Race | # Population | % Population |
| Asian | 0 | 0.0% |
| Black / African American | 10 | 1.0% |
| Hawaiian / Pacific | 0 | 0.0% |
| Hispanic or Latino | 0 | 0.0% |
| Native / Alaskan | 0 | 0.0% |
| White / Caucasian | 963 | 97.1% |
| Two or more Races | 19 | 1.9% |
| Some other Race | 0 | 0.0% |
| Total | 992 | 100.0% |
Ancestry in Telford
The most populous ancestries reported in Telford are American (309 | 31.1%), English (231 | 23.3%), German (176 | 17.7%), French (102 | 10.3%), and Irish (76 | 7.7%), together accounting for 90.1% of all Telford residents.
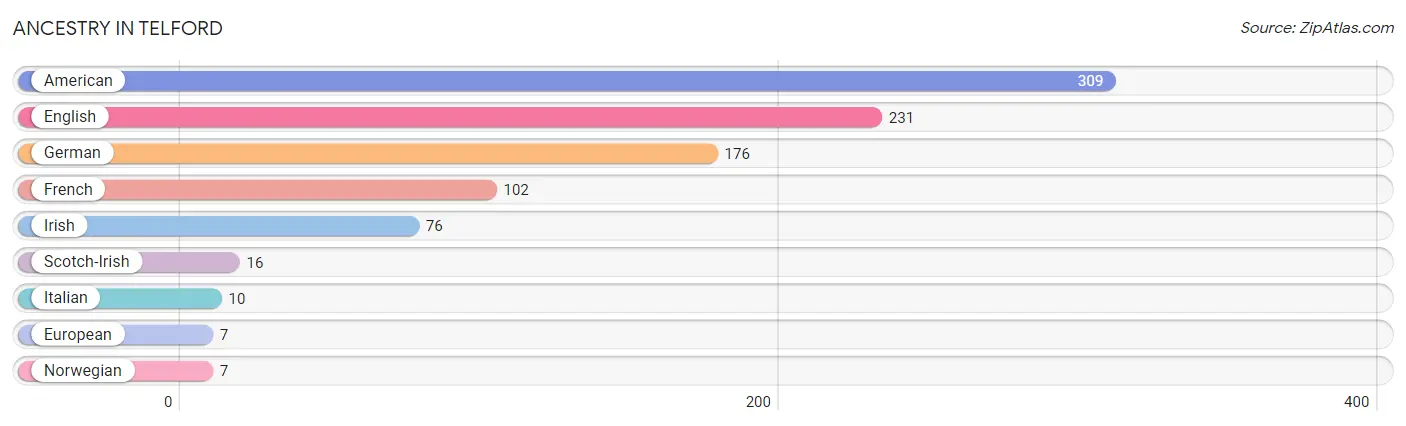
| Ancestry | # Population | % Population |
| American | 309 | 31.1% |
| English | 231 | 23.3% |
| European | 7 | 0.7% |
| French | 102 | 10.3% |
| German | 176 | 17.7% |
| Irish | 76 | 7.7% |
| Italian | 10 | 1.0% |
| Norwegian | 7 | 0.7% |
| Scotch-Irish | 16 | 1.6% | View All 9 Rows |
Immigrants in Telford

| Immigration Origin | # Population | % Population | View All 0 Rows |
Sex and Age in Telford
Sex and Age in Telford
The most populous age groups in Telford are 60 to 64 Years (98 | 17.1%) for men and 65 to 69 Years (96 | 22.9%) for women.
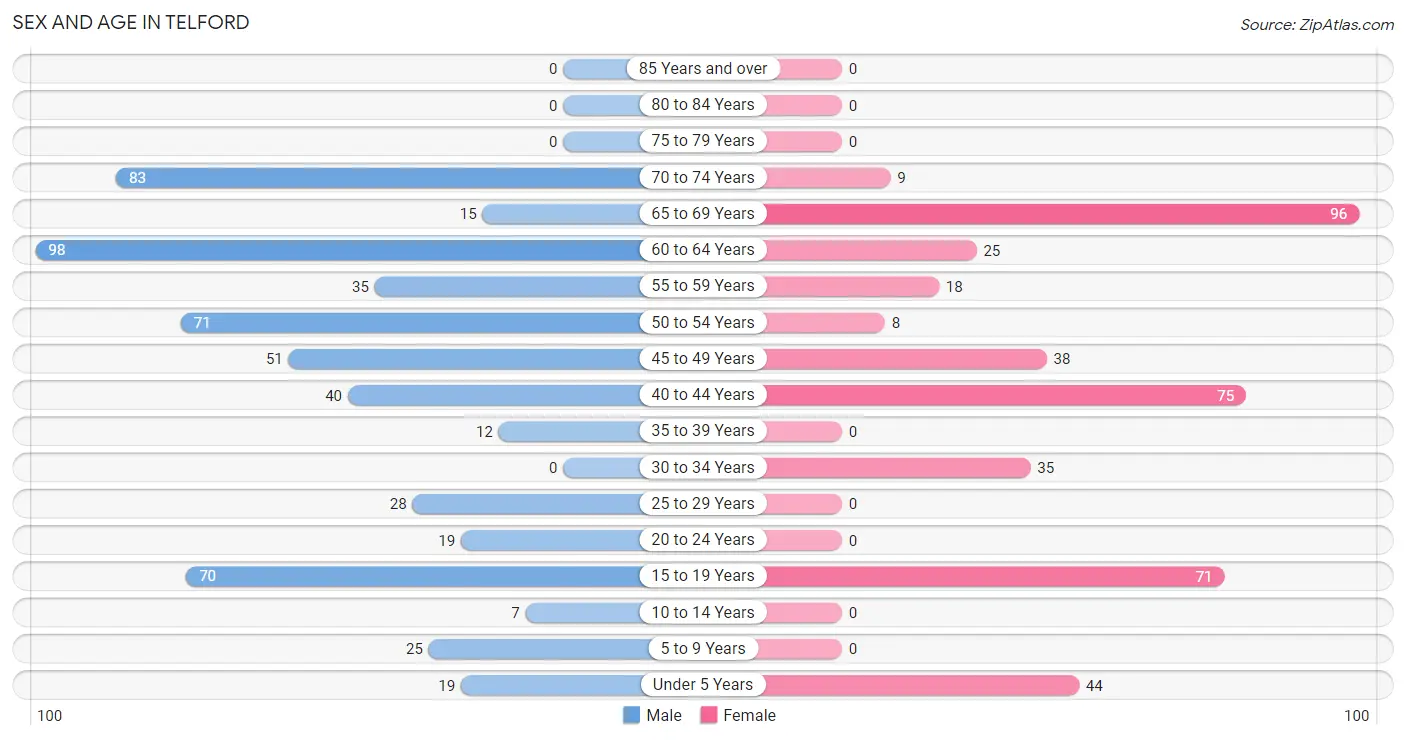
| Age Bracket | Male | Female |
| Under 5 Years | 19 (3.3%) | 44 (10.5%) |
| 5 to 9 Years | 25 (4.4%) | 0 (0.0%) |
| 10 to 14 Years | 7 (1.2%) | 0 (0.0%) |
| 15 to 19 Years | 70 (12.2%) | 71 (17.0%) |
| 20 to 24 Years | 19 (3.3%) | 0 (0.0%) |
| 25 to 29 Years | 28 (4.9%) | 0 (0.0%) |
| 30 to 34 Years | 0 (0.0%) | 35 (8.4%) |
| 35 to 39 Years | 12 (2.1%) | 0 (0.0%) |
| 40 to 44 Years | 40 (7.0%) | 75 (17.9%) |
| 45 to 49 Years | 51 (8.9%) | 38 (9.1%) |
| 50 to 54 Years | 71 (12.4%) | 8 (1.9%) |
| 55 to 59 Years | 35 (6.1%) | 18 (4.3%) |
| 60 to 64 Years | 98 (17.1%) | 25 (6.0%) |
| 65 to 69 Years | 15 (2.6%) | 96 (22.9%) |
| 70 to 74 Years | 83 (14.5%) | 9 (2.1%) |
| 75 to 79 Years | 0 (0.0%) | 0 (0.0%) |
| 80 to 84 Years | 0 (0.0%) | 0 (0.0%) |
| 85 Years and over | 0 (0.0%) | 0 (0.0%) |
| Total | 573 (100.0%) | 419 (100.0%) |
Families and Households in Telford
Median Family Size in Telford
The median family size in Telford is 2.96 persons per family, with single male/father families (53 | 20.4%) accounting for the largest median family size of 4.15 persons per family. On the other hand, married-couple families (190 | 73.1%) represent the smallest median family size with 2.57 persons per family.
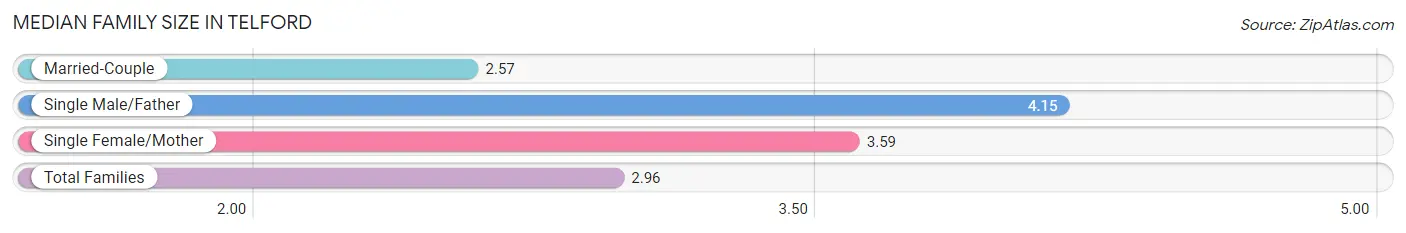
| Family Type | # Families | Family Size |
| Married-Couple | 190 (73.1%) | 2.57 |
| Single Male/Father | 53 (20.4%) | 4.15 |
| Single Female/Mother | 17 (6.5%) | 3.59 |
| Total Families | 260 (100.0%) | 2.96 |
Median Household Size in Telford
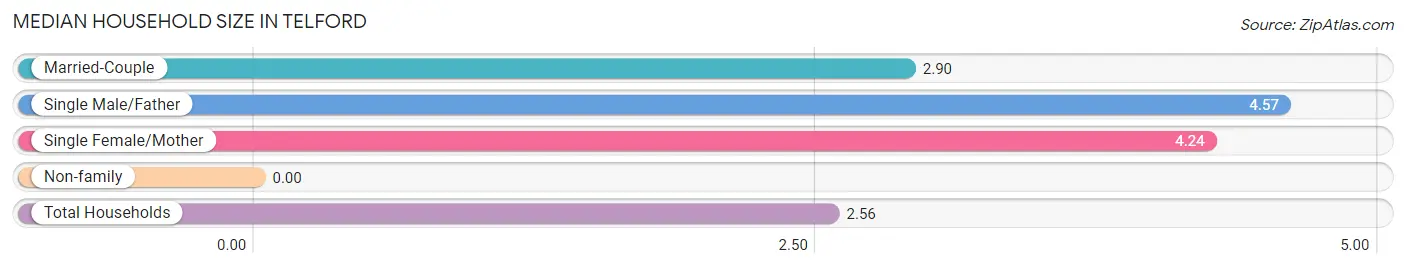
| Household Type | # Households | Household Size |
| Married-Couple | 190 (49.1%) | 2.90 |
| Single Male/Father | 53 (13.7%) | 4.57 |
| Single Female/Mother | 17 (4.4%) | 4.24 |
| Non-family | 127 (32.8%) | - |
| Total Households | 387 (100.0%) | 2.56 |
Household Size by Marriage Status in Telford
Out of a total of 387 households in Telford, 260 (67.2%) are family households, while 127 (32.8%) are nonfamily households. The most numerous type of family households are 2-person households, comprising 108, and the most common type of nonfamily households are 1-person households, comprising 127.
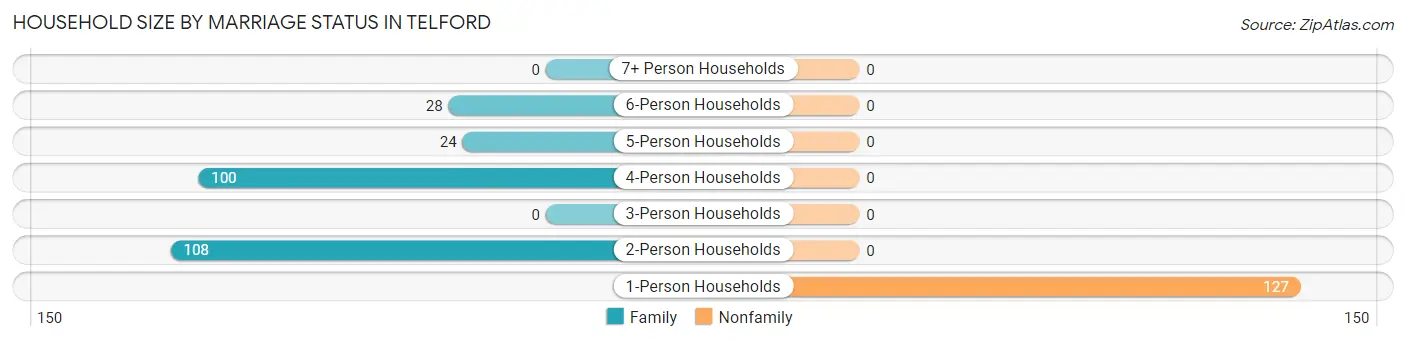
| Household Size | Family Households | Nonfamily Households |
| 1-Person Households | - | 127 (32.8%) |
| 2-Person Households | 108 (27.9%) | 0 (0.0%) |
| 3-Person Households | 0 (0.0%) | 0 (0.0%) |
| 4-Person Households | 100 (25.8%) | 0 (0.0%) |
| 5-Person Households | 24 (6.2%) | 0 (0.0%) |
| 6-Person Households | 28 (7.2%) | 0 (0.0%) |
| 7+ Person Households | 0 (0.0%) | 0 (0.0%) |
| Total | 260 (67.2%) | 127 (32.8%) |
Female Fertility in Telford
Fertility by Age in Telford
| Age Bracket | Women with Births | Births / 1,000 Women |
| 15 to 19 years | 0 (0.0%) | 0.0 |
| 20 to 34 years | 0 (0.0%) | 0.0 |
| 35 to 50 years | 0 (0.0%) | 0.0 |
| Total | 0 (0.0%) | 0.0 |
Fertility by Age by Marriage Status in Telford
| Age Bracket | Married | Unmarried |
| 15 to 19 years | 0 (0.0%) | 0 (0.0%) |
| 20 to 34 years | 0 (0.0%) | 0 (0.0%) |
| 35 to 50 years | 0 (0.0%) | 0 (0.0%) |
| Total | 0 (0.0%) | 0 (0.0%) |
Fertility by Education in Telford
| Educational Attainment | Women with Births | Births / 1,000 Women |
| Less than High School | 0 (0.0%) | 0.0 |
| High School Diploma | 0 (0.0%) | 0.0 |
| College or Associate's Degree | 0 (0.0%) | 0.0 |
| Bachelor's Degree | 0 (0.0%) | 0.0 |
| Graduate Degree | 0 (0.0%) | 0.0 |
| Total | 0 (0.0%) | 0.0 |
Fertility by Education by Marriage Status in Telford
| Educational Attainment | Married | Unmarried |
| Less than High School | 0 (0.0%) | 0 (0.0%) |
| High School Diploma | 0 (0.0%) | 0 (0.0%) |
| College or Associate's Degree | 0 (0.0%) | 0 (0.0%) |
| Bachelor's Degree | 0 (0.0%) | 0 (0.0%) |
| Graduate Degree | 0 (0.0%) | 0 (0.0%) |
| Total | 0 (0.0%) | 0 (0.0%) |
Employment Characteristics in Telford
Employment by Class of Employer in Telford
Among the 412 employed individuals in Telford, private company employees (323 | 78.4%), self-employed (not incorporated) (63 | 15.3%), and not-for-profit organizations (11 | 2.7%) make up the most common classes of employment.
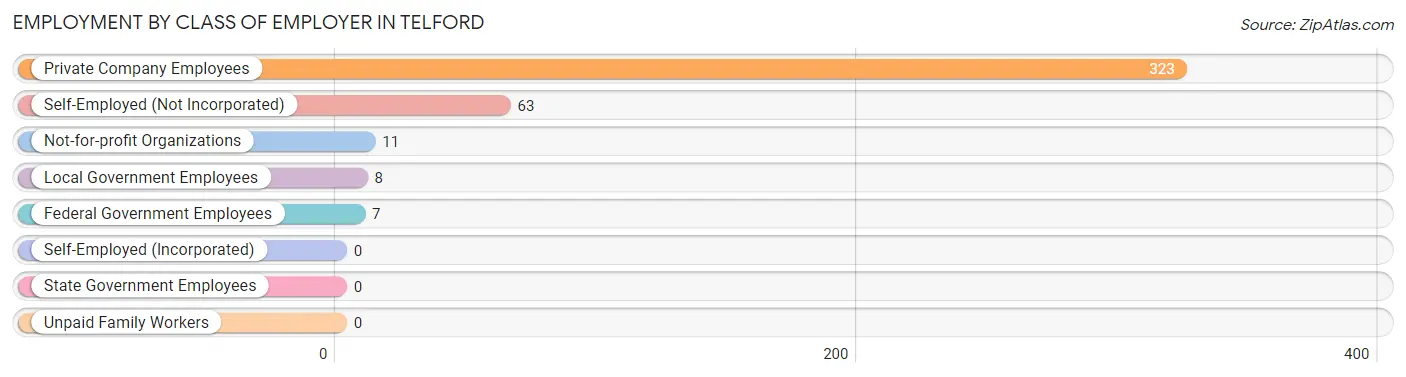
| Employer Class | # Employees | % Employees |
| Private Company Employees | 323 | 78.4% |
| Self-Employed (Incorporated) | 0 | 0.0% |
| Self-Employed (Not Incorporated) | 63 | 15.3% |
| Not-for-profit Organizations | 11 | 2.7% |
| Local Government Employees | 8 | 1.9% |
| State Government Employees | 0 | 0.0% |
| Federal Government Employees | 7 | 1.7% |
| Unpaid Family Workers | 0 | 0.0% |
| Total | 412 | 100.0% |
Employment Status by Age in Telford
According to the labor force statistics for Telford, out of the total population over 16 years of age (890), 49.4% or 440 individuals are in the labor force, with 6.4% or 28 of them unemployed. The age group with the highest labor force participation rate is 20 to 24 years, with 100.0% or 19 individuals in the labor force. Within the labor force, the 25 to 29 years age range has the highest percentage of unemployed individuals, with 100.0% or 28 of them being unemployed.
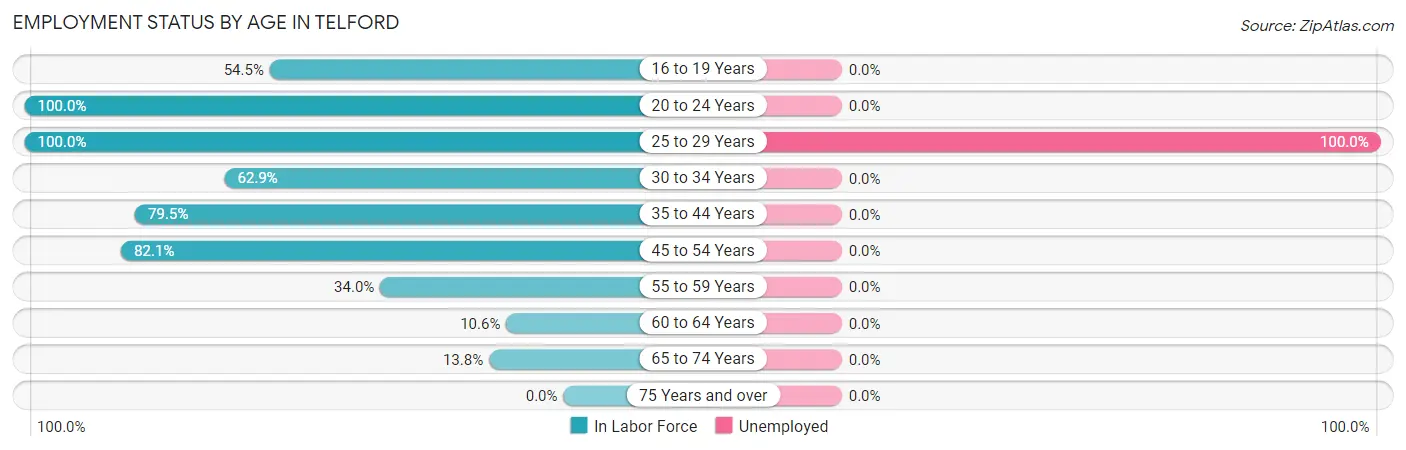
| Age Bracket | In Labor Force | Unemployed |
| 16 to 19 Years | 73 (54.5%) | 0 (0.0%) |
| 20 to 24 Years | 19 (100.0%) | 0 (0.0%) |
| 25 to 29 Years | 28 (100.0%) | 28 (100.0%) |
| 30 to 34 Years | 22 (62.9%) | 0 (0.0%) |
| 35 to 44 Years | 101 (79.5%) | 0 (0.0%) |
| 45 to 54 Years | 138 (82.1%) | 0 (0.0%) |
| 55 to 59 Years | 18 (34.0%) | 0 (0.0%) |
| 60 to 64 Years | 13 (10.6%) | 0 (0.0%) |
| 65 to 74 Years | 28 (13.8%) | 0 (0.0%) |
| 75 Years and over | 0 (0.0%) | 0 (0.0%) |
| Total | 440 (49.4%) | 28 (6.4%) |
Employment Status by Educational Attainment in Telford
According to labor force statistics for Telford, 59.9% of individuals (320) out of the total population between 25 and 64 years of age (534) are in the labor force, with 8.8% or 28 of them being unemployed. The group with the highest labor force participation rate are those with the educational attainment of high school diploma, with 78.3% or 195 individuals in the labor force. Within the labor force, individuals with high school diploma education have the highest percentage of unemployment, with 14.4% or 28 of them being unemployed.
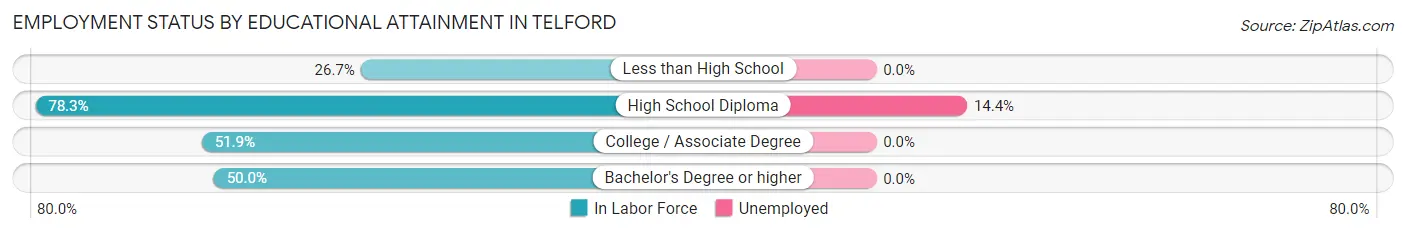
| Educational Attainment | In Labor Force | Unemployed |
| Less than High School | 24 (26.7%) | 0 (0.0%) |
| High School Diploma | 195 (78.3%) | 36 (14.4%) |
| College / Associate Degree | 94 (51.9%) | 0 (0.0%) |
| Bachelor's Degree or higher | 7 (50.0%) | 0 (0.0%) |
| Total | 320 (59.9%) | 47 (8.8%) |
Employment Occupations by Sex in Telford
Management, Business, Science and Arts Occupations
The most common Management, Business, Science and Arts occupations in Telford are Management (49 | 11.9%), Community & Social Service (8 | 1.9%), Education Instruction & Library (8 | 1.9%), Computers, Engineering & Science (6 | 1.5%), and Life, Physical & Social Science (6 | 1.5%).
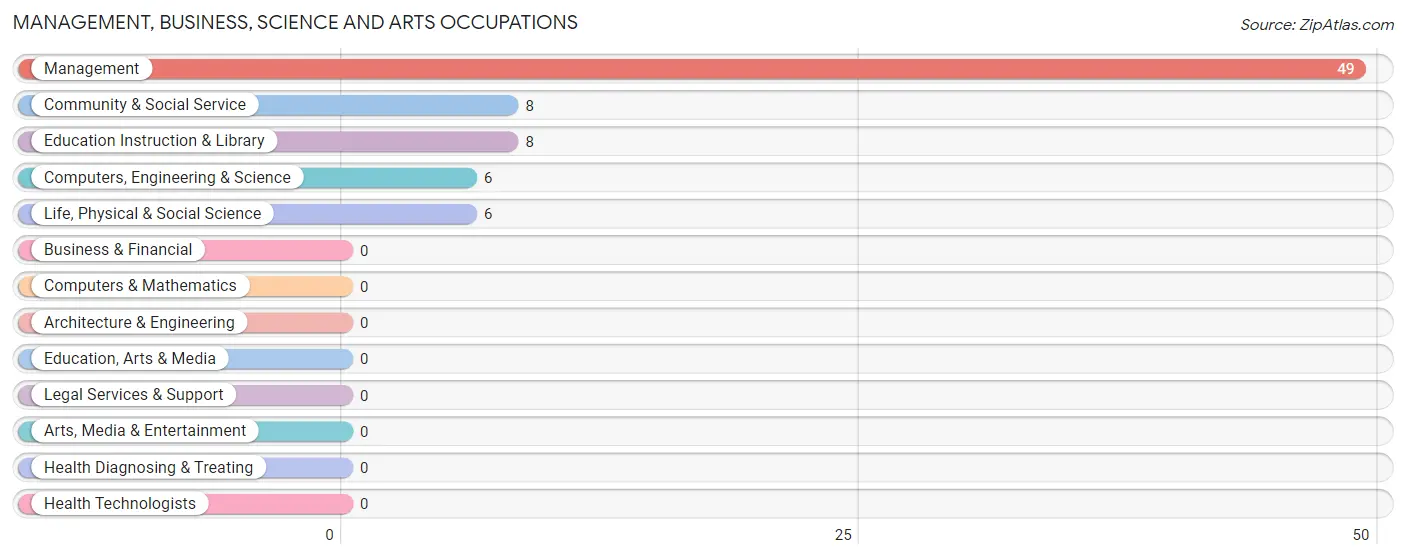
Management, Business, Science and Arts Occupations by Sex
Within the Management, Business, Science and Arts occupations in Telford, the most male-oriented occupations are Computers, Engineering & Science (100.0%), Life, Physical & Social Science (100.0%), and Management (42.9%), while the most female-oriented occupations are Community & Social Service (100.0%), Education Instruction & Library (100.0%), and Management (57.1%).
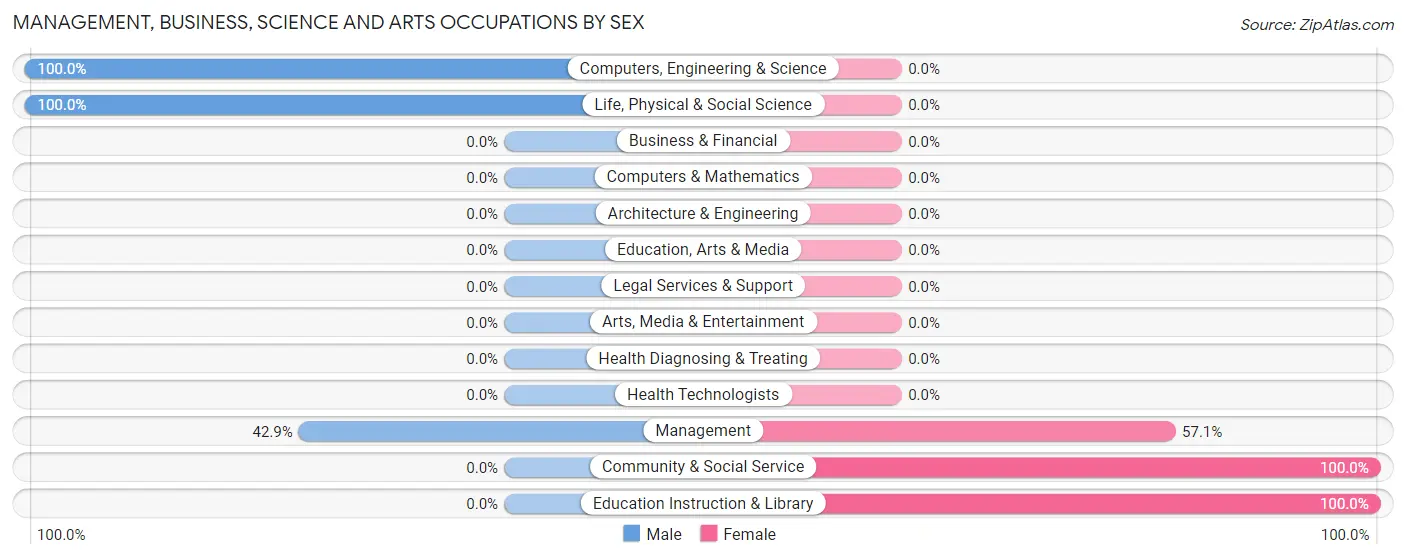
| Occupation | Male | Female |
| Management | 21 (42.9%) | 28 (57.1%) |
| Business & Financial | 0 (0.0%) | 0 (0.0%) |
| Computers, Engineering & Science | 6 (100.0%) | 0 (0.0%) |
| Computers & Mathematics | 0 (0.0%) | 0 (0.0%) |
| Architecture & Engineering | 0 (0.0%) | 0 (0.0%) |
| Life, Physical & Social Science | 6 (100.0%) | 0 (0.0%) |
| Community & Social Service | 0 (0.0%) | 8 (100.0%) |
| Education, Arts & Media | 0 (0.0%) | 0 (0.0%) |
| Legal Services & Support | 0 (0.0%) | 0 (0.0%) |
| Education Instruction & Library | 0 (0.0%) | 8 (100.0%) |
| Arts, Media & Entertainment | 0 (0.0%) | 0 (0.0%) |
| Health Diagnosing & Treating | 0 (0.0%) | 0 (0.0%) |
| Health Technologists | 0 (0.0%) | 0 (0.0%) |
| Total (Category) | 27 (42.9%) | 36 (57.1%) |
| Total (Overall) | 242 (58.7%) | 170 (41.3%) |
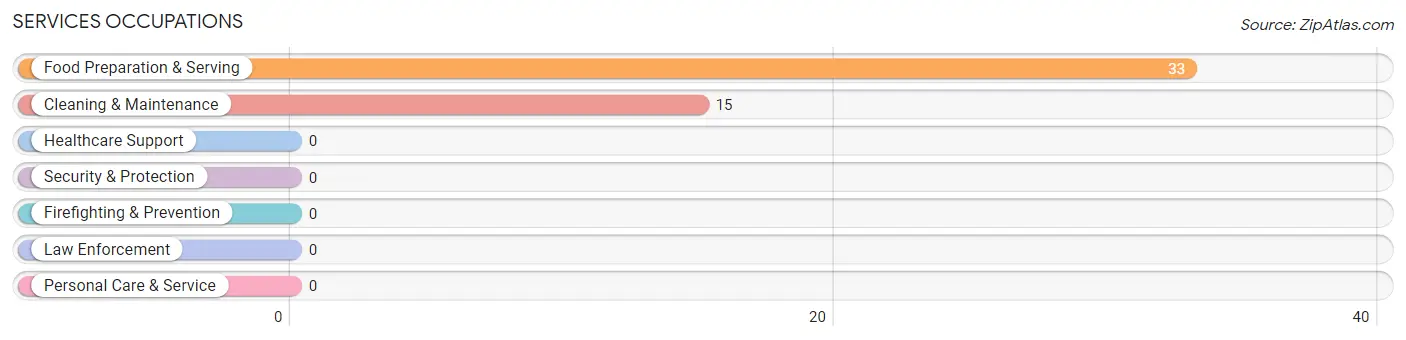
Services Occupations
The most common Services occupations in Telford are Food Preparation & Serving (33 | 8.0%), and Cleaning & Maintenance (15 | 3.6%).
Services Occupations by Sex
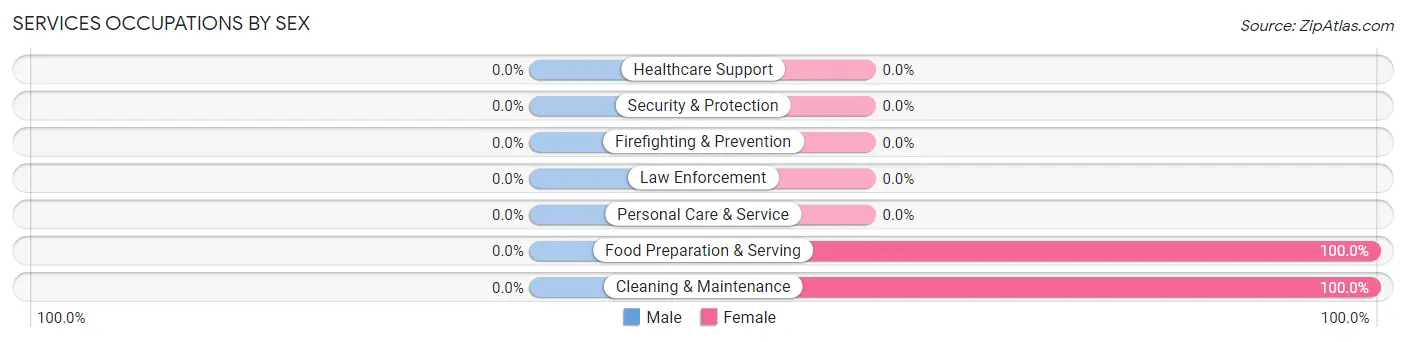
| Occupation | Male | Female |
| Healthcare Support | 0 (0.0%) | 0 (0.0%) |
| Security & Protection | 0 (0.0%) | 0 (0.0%) |
| Firefighting & Prevention | 0 (0.0%) | 0 (0.0%) |
| Law Enforcement | 0 (0.0%) | 0 (0.0%) |
| Food Preparation & Serving | 0 (0.0%) | 33 (100.0%) |
| Cleaning & Maintenance | 0 (0.0%) | 15 (100.0%) |
| Personal Care & Service | 0 (0.0%) | 0 (0.0%) |
| Total (Category) | 0 (0.0%) | 48 (100.0%) |
| Total (Overall) | 242 (58.7%) | 170 (41.3%) |
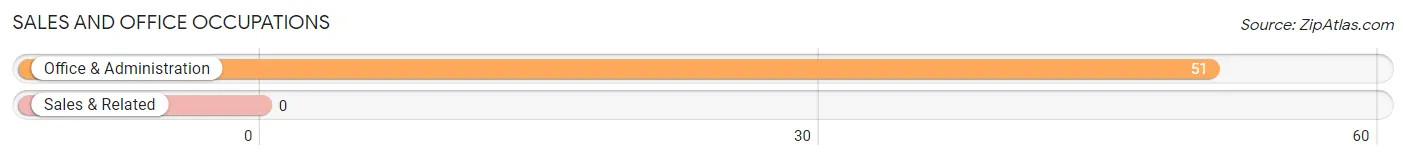
Sales and Office Occupations
The most common Sales and Office occupations in Telford are , and Office & Administration (51 | 12.4%).
Sales and Office Occupations by Sex
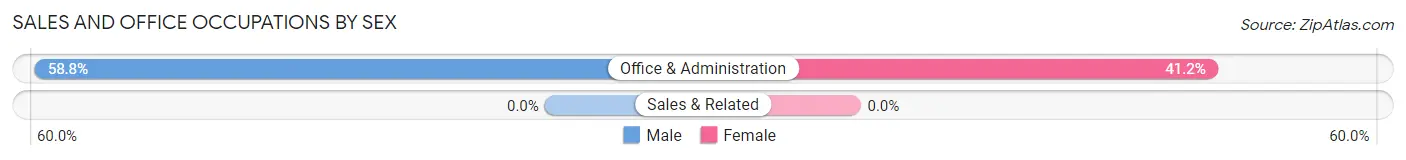
| Occupation | Male | Female |
| Sales & Related | 0 (0.0%) | 0 (0.0%) |
| Office & Administration | 30 (58.8%) | 21 (41.2%) |
| Total (Category) | 30 (58.8%) | 21 (41.2%) |
| Total (Overall) | 242 (58.7%) | 170 (41.3%) |
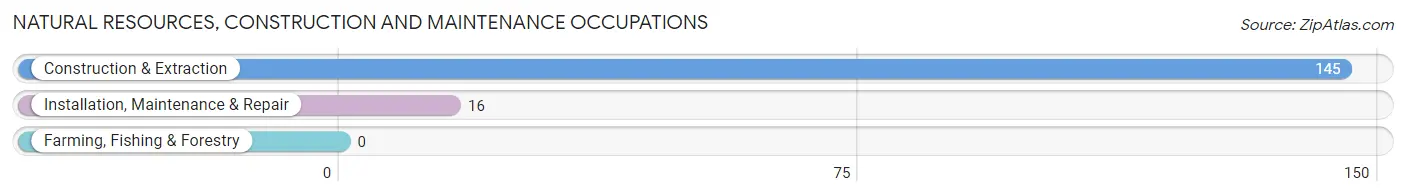
Natural Resources, Construction and Maintenance Occupations
The most common Natural Resources, Construction and Maintenance occupations in Telford are Construction & Extraction (145 | 35.2%), and Installation, Maintenance & Repair (16 | 3.9%).
Natural Resources, Construction and Maintenance Occupations by Sex
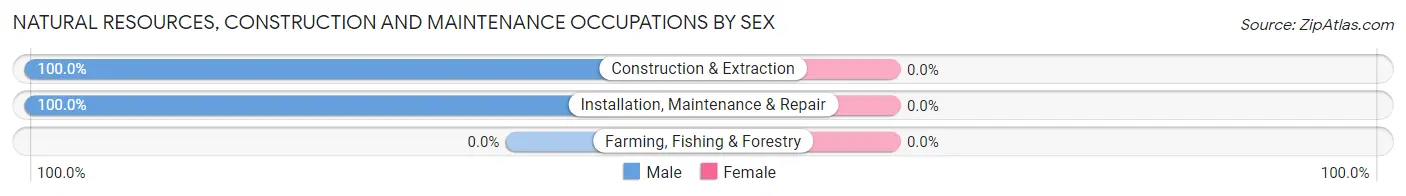
| Occupation | Male | Female |
| Farming, Fishing & Forestry | 0 (0.0%) | 0 (0.0%) |
| Construction & Extraction | 145 (100.0%) | 0 (0.0%) |
| Installation, Maintenance & Repair | 16 (100.0%) | 0 (0.0%) |
| Total (Category) | 161 (100.0%) | 0 (0.0%) |
| Total (Overall) | 242 (58.7%) | 170 (41.3%) |
Production, Transportation and Moving Occupations
The most common Production, Transportation and Moving occupations in Telford are Production (73 | 17.7%), and Transportation (16 | 3.9%).
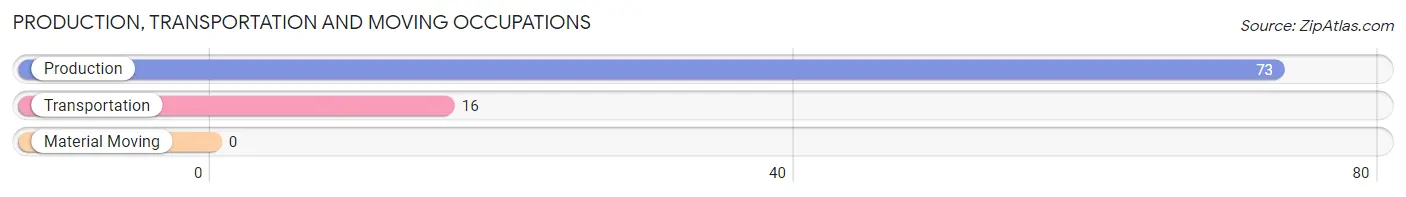
Production, Transportation and Moving Occupations by Sex
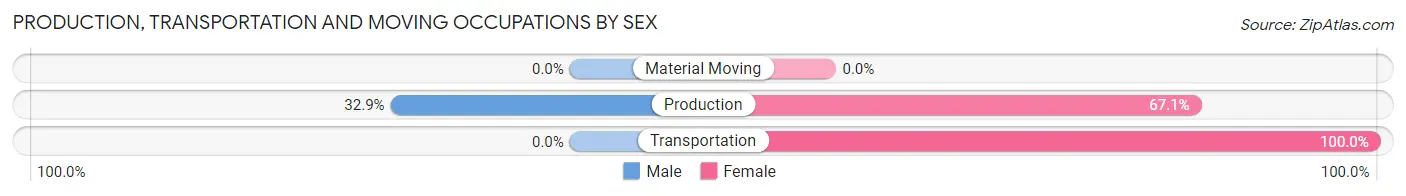
| Occupation | Male | Female |
| Production | 24 (32.9%) | 49 (67.1%) |
| Transportation | 0 (0.0%) | 16 (100.0%) |
| Material Moving | 0 (0.0%) | 0 (0.0%) |
| Total (Category) | 24 (27.0%) | 65 (73.0%) |
| Total (Overall) | 242 (58.7%) | 170 (41.3%) |
Employment Industries by Sex in Telford
Employment Industries in Telford
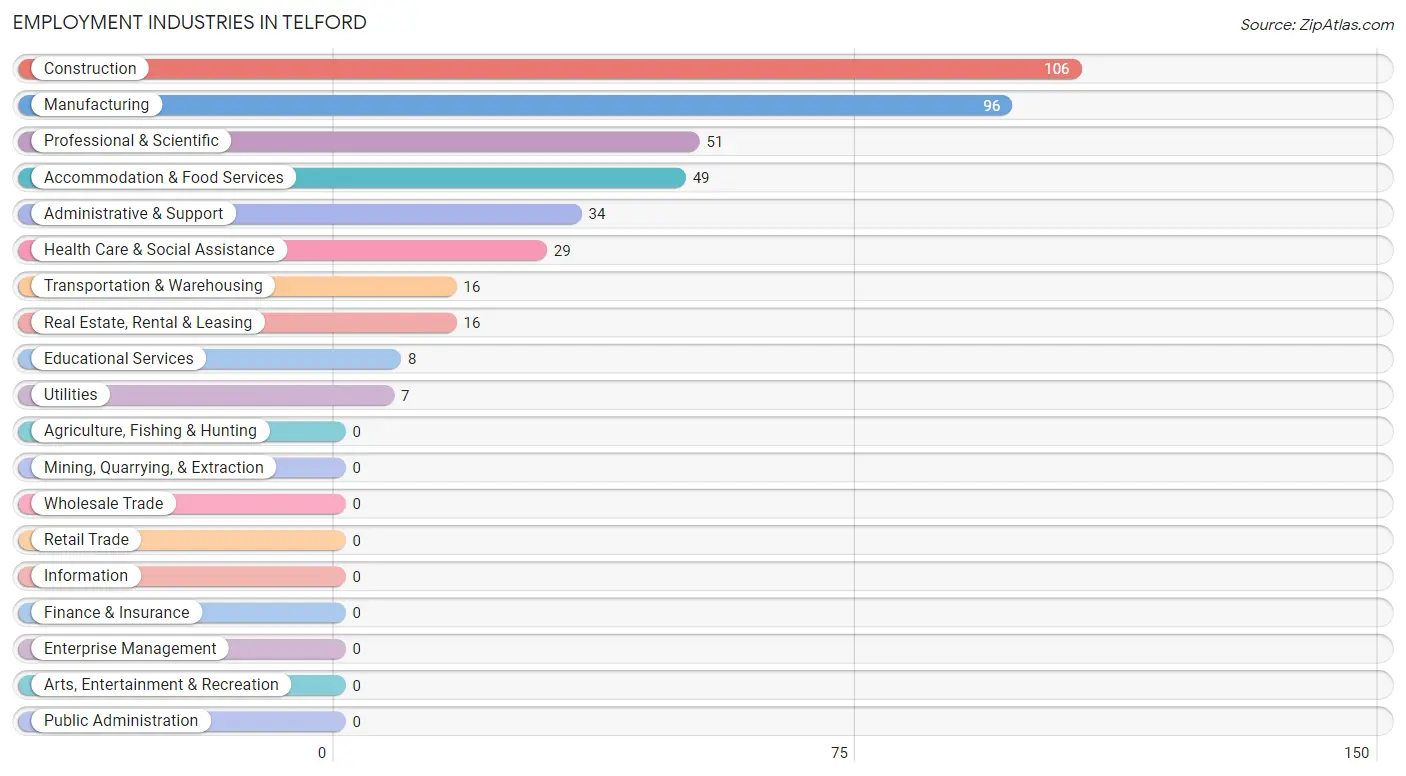
The major employment industries in Telford include Construction (106 | 25.7%), Manufacturing (96 | 23.3%), Professional & Scientific (51 | 12.4%), Accommodation & Food Services (49 | 11.9%), and Administrative & Support (34 | 8.3%).
Employment Industries by Sex in Telford
The Telford industries that see more men than women are Construction (100.0%), Real Estate, Rental & Leasing (100.0%), and Professional & Scientific (100.0%), whereas the industries that tend to have a higher number of women are Utilities (100.0%), Educational Services (100.0%), and Accommodation & Food Services (100.0%).
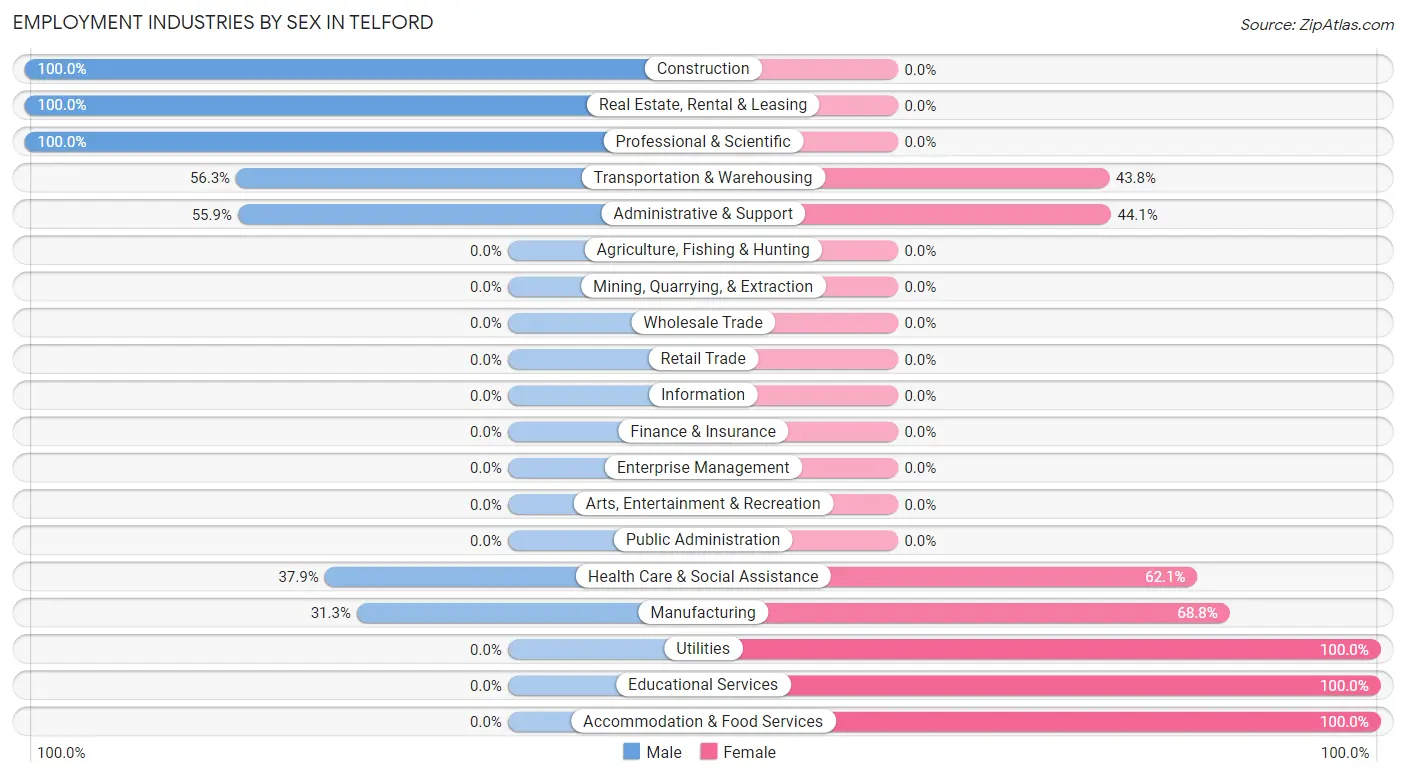
| Industry | Male | Female |
| Agriculture, Fishing & Hunting | 0 (0.0%) | 0 (0.0%) |
| Mining, Quarrying, & Extraction | 0 (0.0%) | 0 (0.0%) |
| Construction | 106 (100.0%) | 0 (0.0%) |
| Manufacturing | 30 (31.2%) | 66 (68.8%) |
| Wholesale Trade | 0 (0.0%) | 0 (0.0%) |
| Retail Trade | 0 (0.0%) | 0 (0.0%) |
| Transportation & Warehousing | 9 (56.2%) | 7 (43.8%) |
| Utilities | 0 (0.0%) | 7 (100.0%) |
| Information | 0 (0.0%) | 0 (0.0%) |
| Finance & Insurance | 0 (0.0%) | 0 (0.0%) |
| Real Estate, Rental & Leasing | 16 (100.0%) | 0 (0.0%) |
| Professional & Scientific | 51 (100.0%) | 0 (0.0%) |
| Enterprise Management | 0 (0.0%) | 0 (0.0%) |
| Administrative & Support | 19 (55.9%) | 15 (44.1%) |
| Educational Services | 0 (0.0%) | 8 (100.0%) |
| Health Care & Social Assistance | 11 (37.9%) | 18 (62.1%) |
| Arts, Entertainment & Recreation | 0 (0.0%) | 0 (0.0%) |
| Accommodation & Food Services | 0 (0.0%) | 49 (100.0%) |
| Public Administration | 0 (0.0%) | 0 (0.0%) |
| Total | 242 (58.7%) | 170 (41.3%) |
Education in Telford
School Enrollment in Telford
The most common levels of schooling among the 99 students in Telford are high school (60 | 60.6%), elementary school (25 | 25.3%), and middle school (7 | 7.1%).
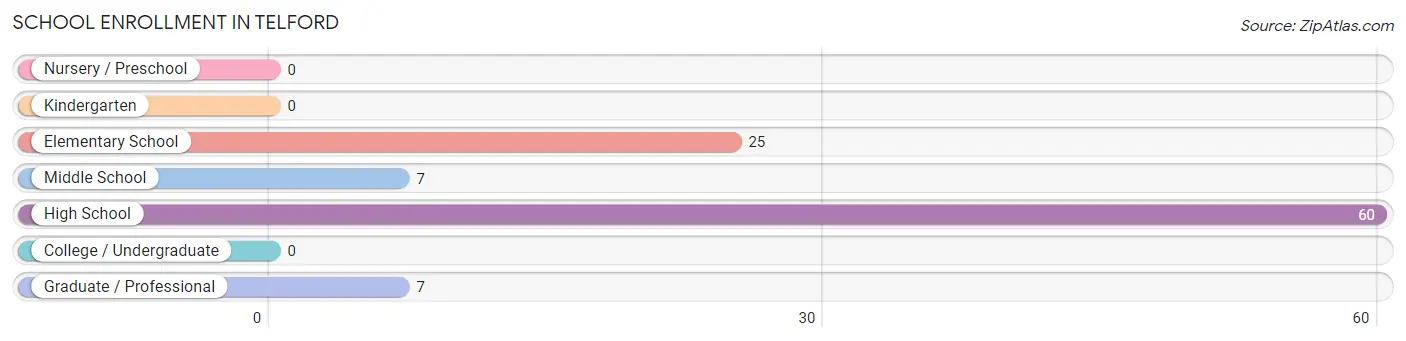
| School Level | # Students | % Students |
| Nursery / Preschool | 0 | 0.0% |
| Kindergarten | 0 | 0.0% |
| Elementary School | 25 | 25.3% |
| Middle School | 7 | 7.1% |
| High School | 60 | 60.6% |
| College / Undergraduate | 0 | 0.0% |
| Graduate / Professional | 7 | 7.1% |
| Total | 99 | 100.0% |
School Enrollment by Age by Funding Source in Telford
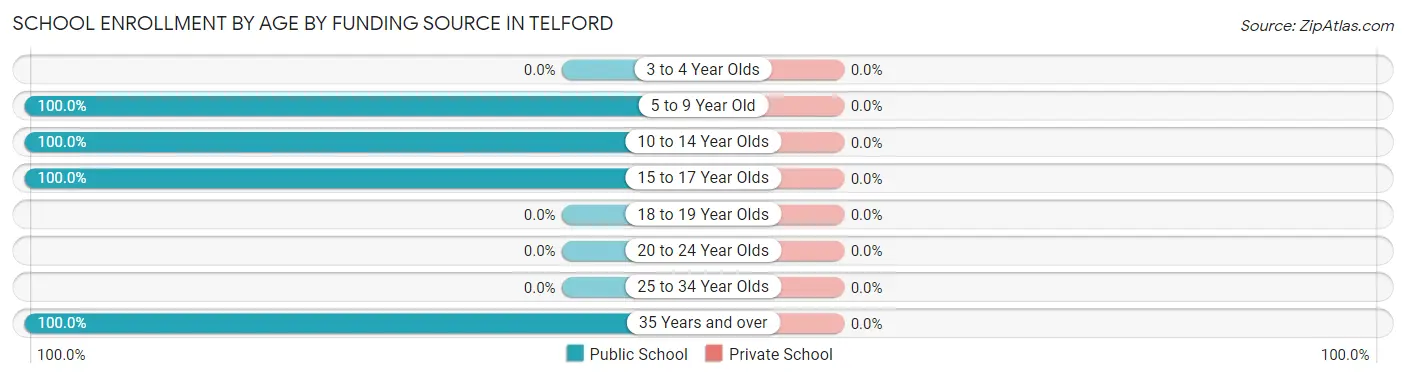
| Age Bracket | Public School | Private School |
| 3 to 4 Year Olds | 0 (0.0%) | 0 (0.0%) |
| 5 to 9 Year Old | 25 (100.0%) | 0 (0.0%) |
| 10 to 14 Year Olds | 7 (100.0%) | 0 (0.0%) |
| 15 to 17 Year Olds | 60 (100.0%) | 0 (0.0%) |
| 18 to 19 Year Olds | 0 (0.0%) | 0 (0.0%) |
| 20 to 24 Year Olds | 0 (0.0%) | 0 (0.0%) |
| 25 to 34 Year Olds | 0 (0.0%) | 0 (0.0%) |
| 35 Years and over | 7 (100.0%) | 0 (0.0%) |
| Total | 99 (100.0%) | 0 (0.0%) |
Educational Attainment by Field of Study in Telford
Education (40 | 51.3%), computers & mathematics (31 | 39.7%), and visual & performing arts (7 | 9.0%) are the most common fields of study among 78 individuals in Telford who have obtained a bachelor's degree or higher.
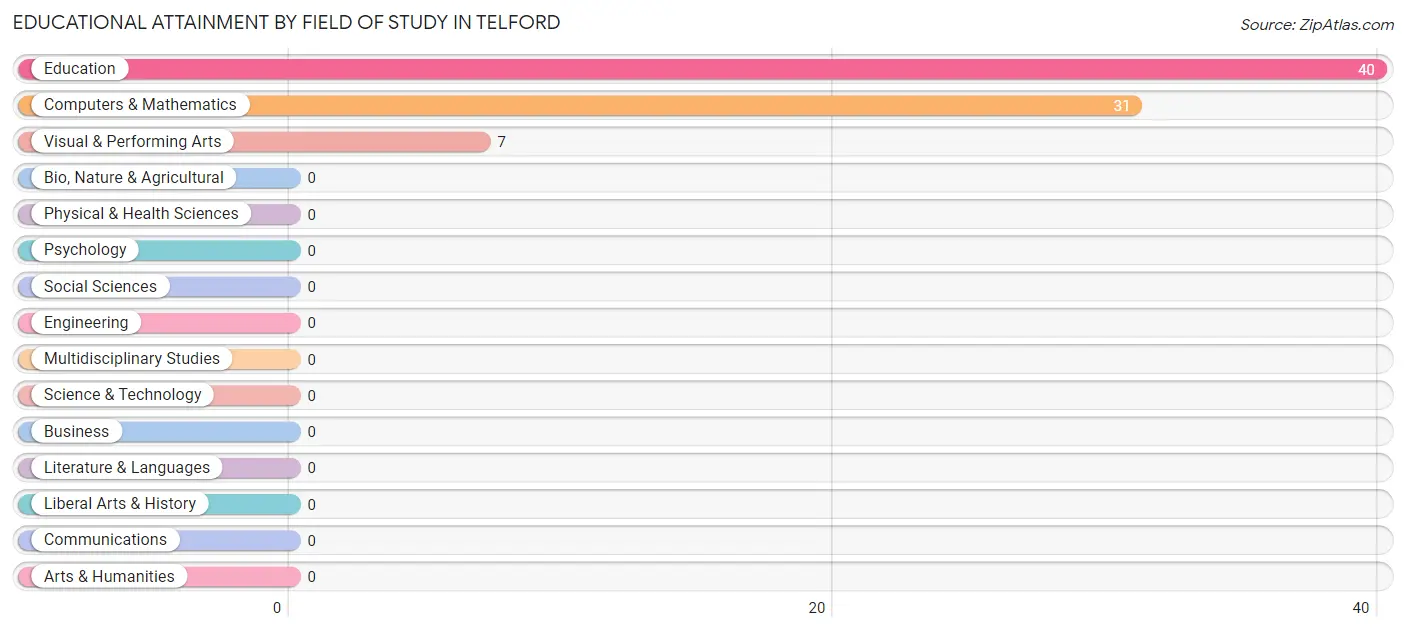
| Field of Study | # Graduates | % Graduates |
| Computers & Mathematics | 31 | 39.7% |
| Bio, Nature & Agricultural | 0 | 0.0% |
| Physical & Health Sciences | 0 | 0.0% |
| Psychology | 0 | 0.0% |
| Social Sciences | 0 | 0.0% |
| Engineering | 0 | 0.0% |
| Multidisciplinary Studies | 0 | 0.0% |
| Science & Technology | 0 | 0.0% |
| Business | 0 | 0.0% |
| Education | 40 | 51.3% |
| Literature & Languages | 0 | 0.0% |
| Liberal Arts & History | 0 | 0.0% |
| Visual & Performing Arts | 7 | 9.0% |
| Communications | 0 | 0.0% |
| Arts & Humanities | 0 | 0.0% |
| Total | 78 | 100.0% |
Transportation & Commute in Telford
Vehicle Availability by Sex in Telford
The most prevalent vehicle ownership categories in Telford are males with 5 or more vehicles (113, accounting for 46.7%) and females with 5 or more vehicles (49, making up 66.5%).
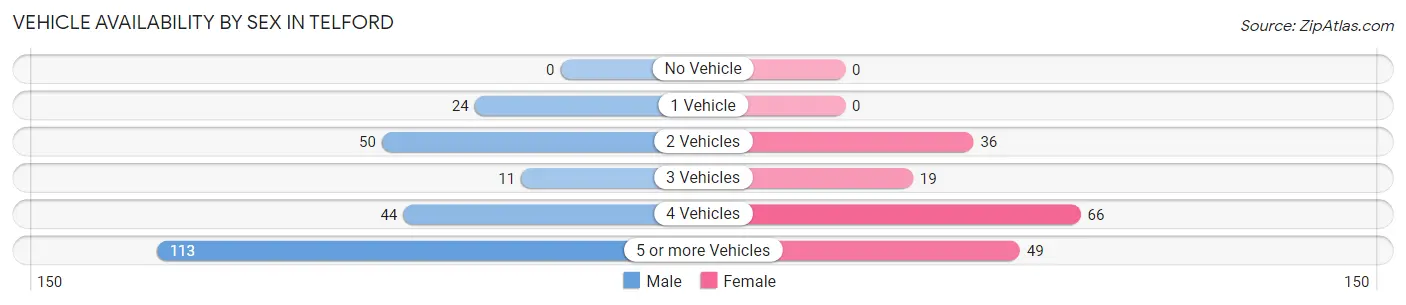
| Vehicles Available | Male | Female |
| No Vehicle | 0 (0.0%) | 0 (0.0%) |
| 1 Vehicle | 24 (9.9%) | 0 (0.0%) |
| 2 Vehicles | 50 (20.7%) | 36 (21.2%) |
| 3 Vehicles | 11 (4.5%) | 19 (11.2%) |
| 4 Vehicles | 44 (18.2%) | 66 (38.8%) |
| 5 or more Vehicles | 113 (46.7%) | 49 (28.8%) |
| Total | 242 (100.0%) | 170 (100.0%) |
Commute Time in Telford
The most frequently occuring commute durations in Telford are 20 to 24 minutes (83 commuters, 20.9%), 15 to 19 minutes (73 commuters, 18.4%), and 5 to 9 minutes (62 commuters, 15.6%).
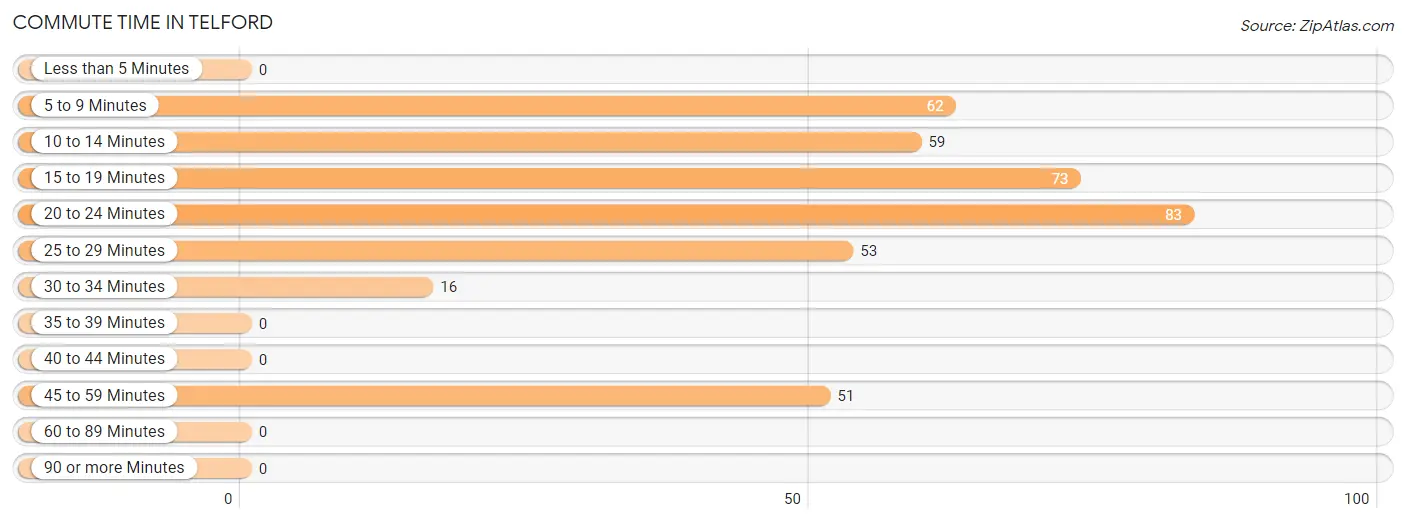
| Commute Time | # Commuters | % Commuters |
| Less than 5 Minutes | 0 | 0.0% |
| 5 to 9 Minutes | 62 | 15.6% |
| 10 to 14 Minutes | 59 | 14.9% |
| 15 to 19 Minutes | 73 | 18.4% |
| 20 to 24 Minutes | 83 | 20.9% |
| 25 to 29 Minutes | 53 | 13.4% |
| 30 to 34 Minutes | 16 | 4.0% |
| 35 to 39 Minutes | 0 | 0.0% |
| 40 to 44 Minutes | 0 | 0.0% |
| 45 to 59 Minutes | 51 | 12.9% |
| 60 to 89 Minutes | 0 | 0.0% |
| 90 or more Minutes | 0 | 0.0% |
Commute Time by Sex in Telford
The most common commute times in Telford are 5 to 9 minutes (62 commuters, 25.6%) for males and 20 to 24 minutes (63 commuters, 40.6%) for females.
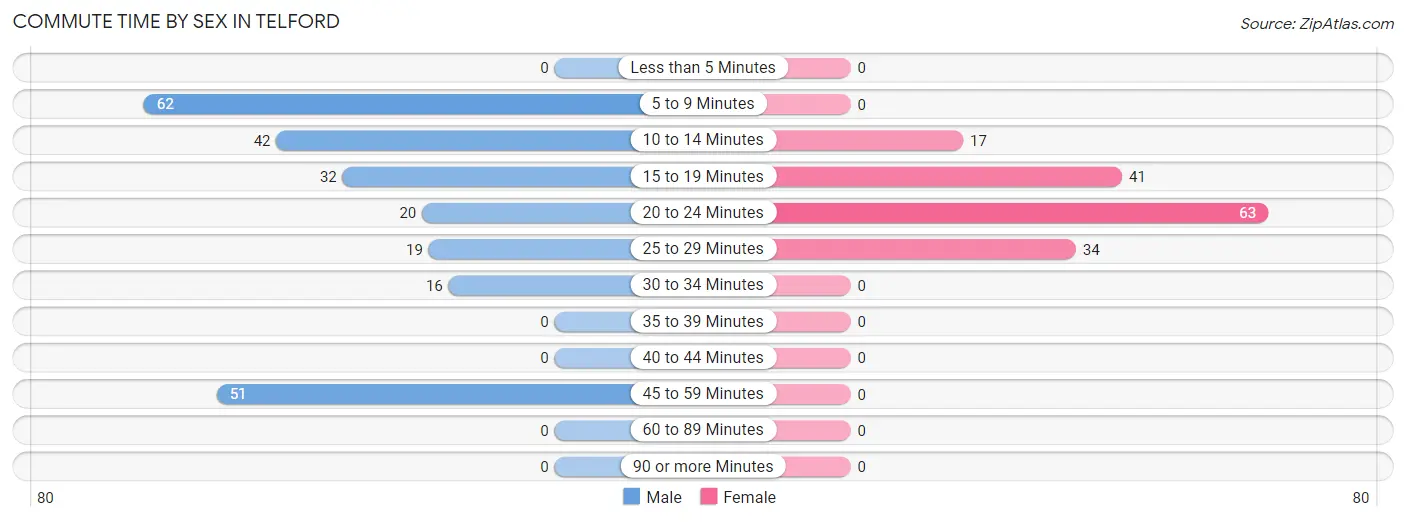
| Commute Time | Male | Female |
| Less than 5 Minutes | 0 (0.0%) | 0 (0.0%) |
| 5 to 9 Minutes | 62 (25.6%) | 0 (0.0%) |
| 10 to 14 Minutes | 42 (17.4%) | 17 (11.0%) |
| 15 to 19 Minutes | 32 (13.2%) | 41 (26.5%) |
| 20 to 24 Minutes | 20 (8.3%) | 63 (40.6%) |
| 25 to 29 Minutes | 19 (7.9%) | 34 (21.9%) |
| 30 to 34 Minutes | 16 (6.6%) | 0 (0.0%) |
| 35 to 39 Minutes | 0 (0.0%) | 0 (0.0%) |
| 40 to 44 Minutes | 0 (0.0%) | 0 (0.0%) |
| 45 to 59 Minutes | 51 (21.1%) | 0 (0.0%) |
| 60 to 89 Minutes | 0 (0.0%) | 0 (0.0%) |
| 90 or more Minutes | 0 (0.0%) | 0 (0.0%) |
Time of Departure to Work by Sex in Telford
The most frequent times of departure to work in Telford are 7:00 AM to 7:29 AM (105, 43.4%) for males and 7:00 AM to 7:29 AM (64, 41.3%) for females.
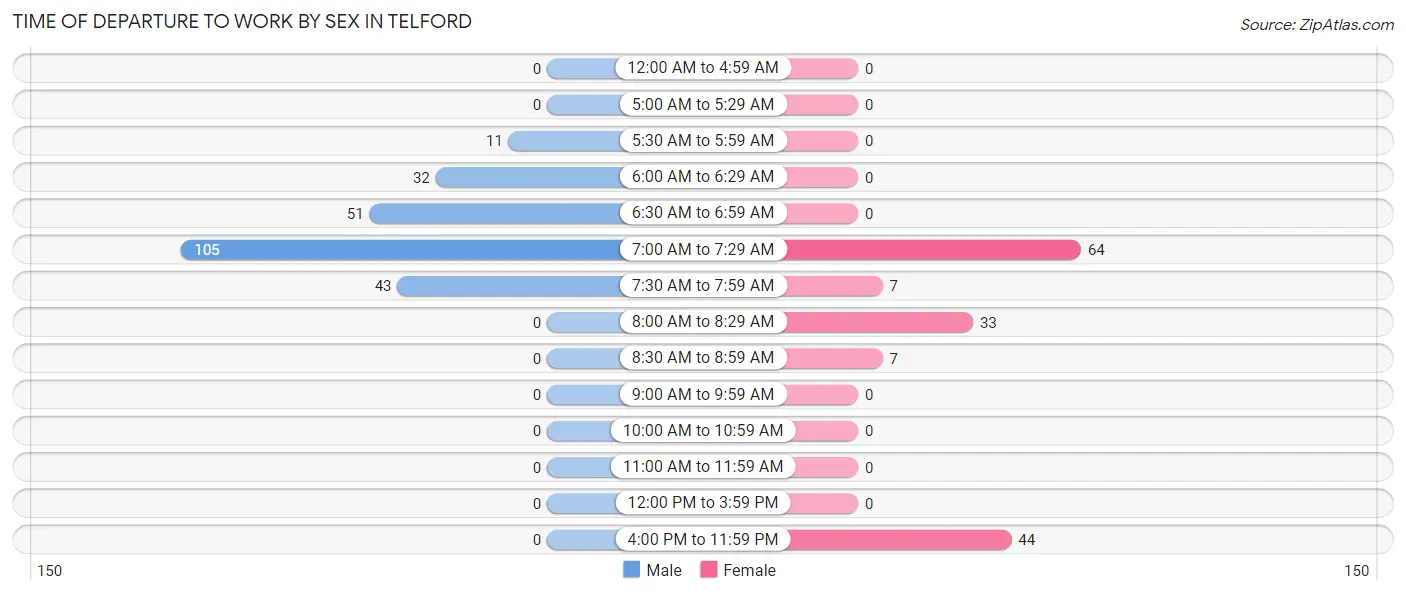
| Time of Departure | Male | Female |
| 12:00 AM to 4:59 AM | 0 (0.0%) | 0 (0.0%) |
| 5:00 AM to 5:29 AM | 0 (0.0%) | 0 (0.0%) |
| 5:30 AM to 5:59 AM | 11 (4.5%) | 0 (0.0%) |
| 6:00 AM to 6:29 AM | 32 (13.2%) | 0 (0.0%) |
| 6:30 AM to 6:59 AM | 51 (21.1%) | 0 (0.0%) |
| 7:00 AM to 7:29 AM | 105 (43.4%) | 64 (41.3%) |
| 7:30 AM to 7:59 AM | 43 (17.8%) | 7 (4.5%) |
| 8:00 AM to 8:29 AM | 0 (0.0%) | 33 (21.3%) |
| 8:30 AM to 8:59 AM | 0 (0.0%) | 7 (4.5%) |
| 9:00 AM to 9:59 AM | 0 (0.0%) | 0 (0.0%) |
| 10:00 AM to 10:59 AM | 0 (0.0%) | 0 (0.0%) |
| 11:00 AM to 11:59 AM | 0 (0.0%) | 0 (0.0%) |
| 12:00 PM to 3:59 PM | 0 (0.0%) | 0 (0.0%) |
| 4:00 PM to 11:59 PM | 0 (0.0%) | 44 (28.4%) |
| Total | 242 (100.0%) | 155 (100.0%) |
Housing Occupancy in Telford
Occupancy by Ownership in Telford
Of the total 387 dwellings in Telford, owner-occupied units account for 268 (69.3%), while renter-occupied units make up 119 (30.7%).
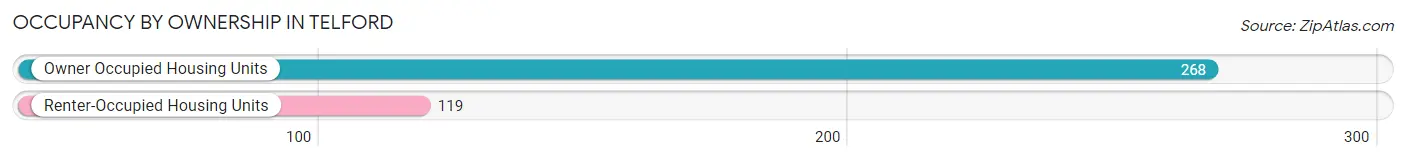
| Occupancy | # Housing Units | % Housing Units |
| Owner Occupied Housing Units | 268 | 69.3% |
| Renter-Occupied Housing Units | 119 | 30.7% |
| Total Occupied Housing Units | 387 | 100.0% |
Occupancy by Household Size in Telford
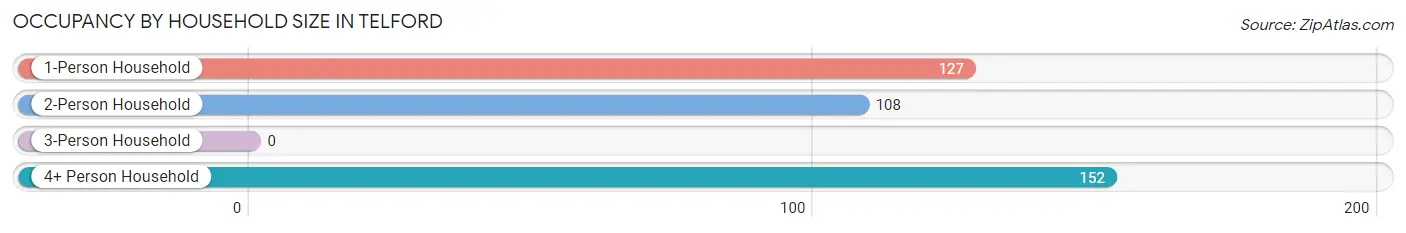
| Household Size | # Housing Units | % Housing Units |
| 1-Person Household | 127 | 32.8% |
| 2-Person Household | 108 | 27.9% |
| 3-Person Household | 0 | 0.0% |
| 4+ Person Household | 152 | 39.3% |
| Total Housing Units | 387 | 100.0% |
Occupancy by Ownership by Household Size in Telford
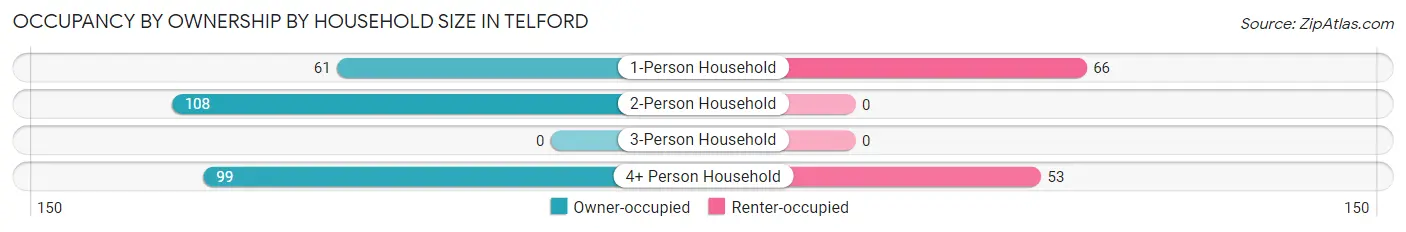
| Household Size | Owner-occupied | Renter-occupied |
| 1-Person Household | 61 (48.0%) | 66 (52.0%) |
| 2-Person Household | 108 (100.0%) | 0 (0.0%) |
| 3-Person Household | 0 (0.0%) | 0 (0.0%) |
| 4+ Person Household | 99 (65.1%) | 53 (34.9%) |
| Total Housing Units | 268 (69.3%) | 119 (30.7%) |
Occupancy by Educational Attainment in Telford
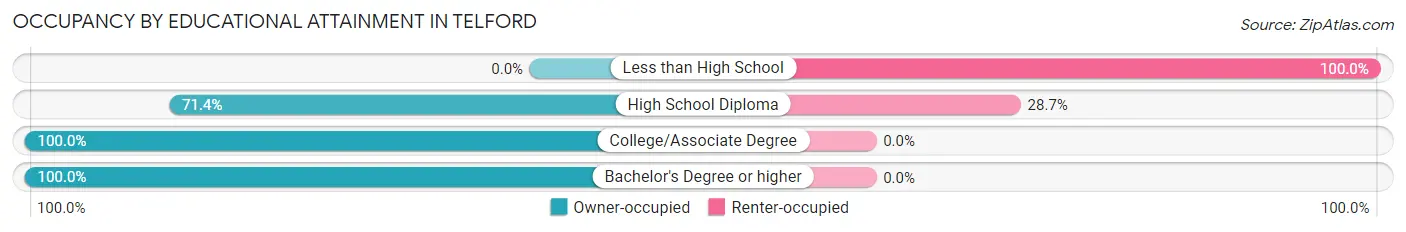
| Household Size | Owner-occupied | Renter-occupied |
| Less than High School | 0 (0.0%) | 66 (100.0%) |
| High School Diploma | 132 (71.4%) | 53 (28.6%) |
| College/Associate Degree | 96 (100.0%) | 0 (0.0%) |
| Bachelor's Degree or higher | 40 (100.0%) | 0 (0.0%) |
Occupancy by Age of Householder in Telford
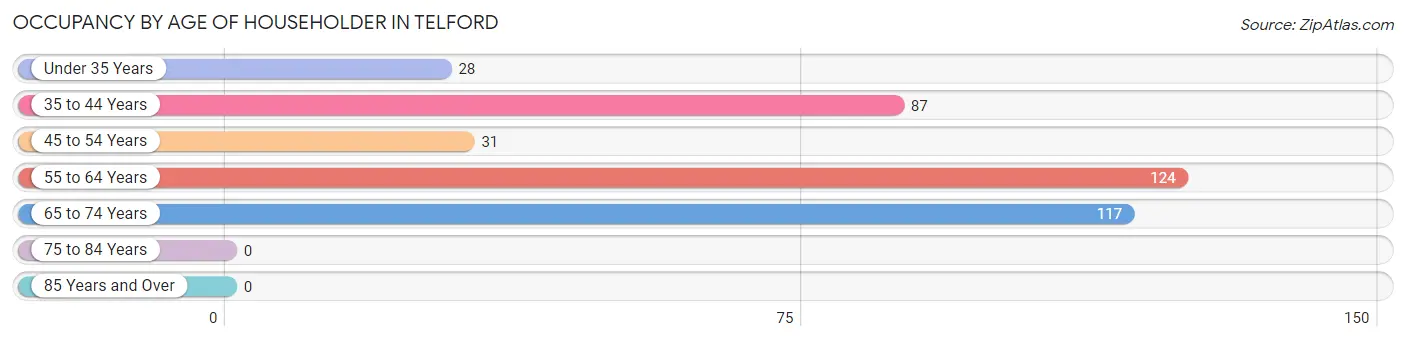
| Age Bracket | # Households | % Households |
| Under 35 Years | 28 | 7.2% |
| 35 to 44 Years | 87 | 22.5% |
| 45 to 54 Years | 31 | 8.0% |
| 55 to 64 Years | 124 | 32.0% |
| 65 to 74 Years | 117 | 30.2% |
| 75 to 84 Years | 0 | 0.0% |
| 85 Years and Over | 0 | 0.0% |
| Total | 387 | 100.0% |
Housing Finances in Telford
Median Income by Occupancy in Telford
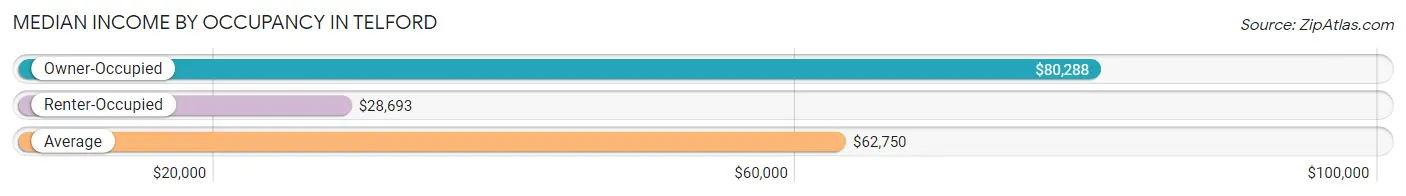
| Occupancy Type | # Households | Median Income |
| Owner-Occupied | 268 (69.3%) | $80,288 |
| Renter-Occupied | 119 (30.7%) | $28,693 |
| Average | 387 (100.0%) | $62,750 |
Occupancy by Householder Income Bracket in Telford
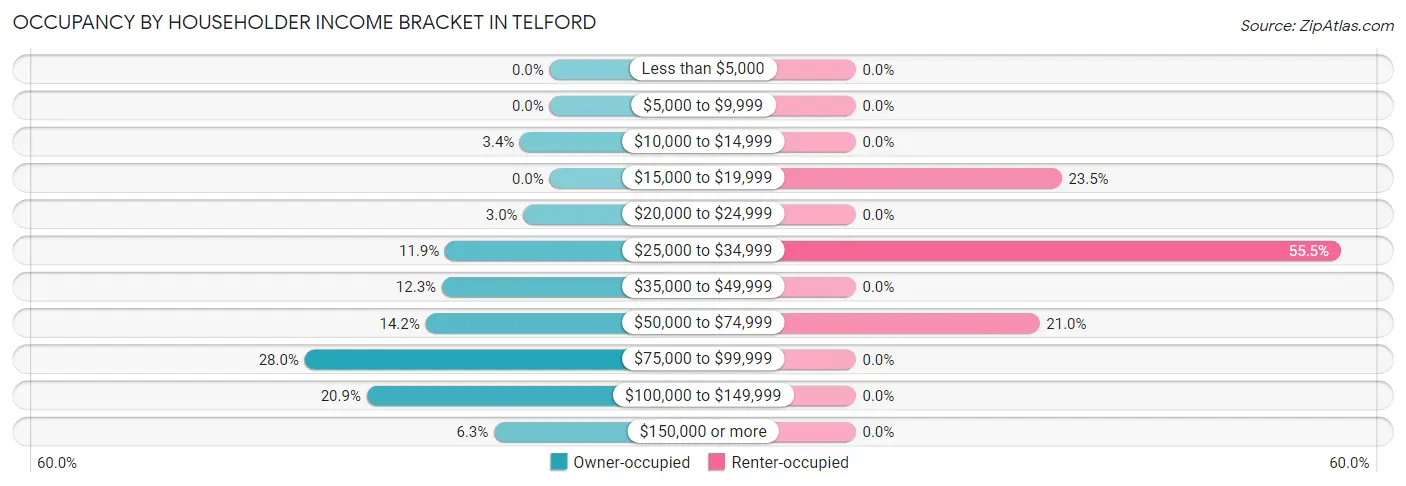
| Income Bracket | Owner-occupied | Renter-occupied |
| Less than $5,000 | 0 (0.0%) | 0 (0.0%) |
| $5,000 to $9,999 | 0 (0.0%) | 0 (0.0%) |
| $10,000 to $14,999 | 9 (3.4%) | 0 (0.0%) |
| $15,000 to $19,999 | 0 (0.0%) | 28 (23.5%) |
| $20,000 to $24,999 | 8 (3.0%) | 0 (0.0%) |
| $25,000 to $34,999 | 32 (11.9%) | 66 (55.5%) |
| $35,000 to $49,999 | 33 (12.3%) | 0 (0.0%) |
| $50,000 to $74,999 | 38 (14.2%) | 25 (21.0%) |
| $75,000 to $99,999 | 75 (28.0%) | 0 (0.0%) |
| $100,000 to $149,999 | 56 (20.9%) | 0 (0.0%) |
| $150,000 or more | 17 (6.3%) | 0 (0.0%) |
| Total | 268 (100.0%) | 119 (100.0%) |
Monthly Housing Cost Tiers in Telford
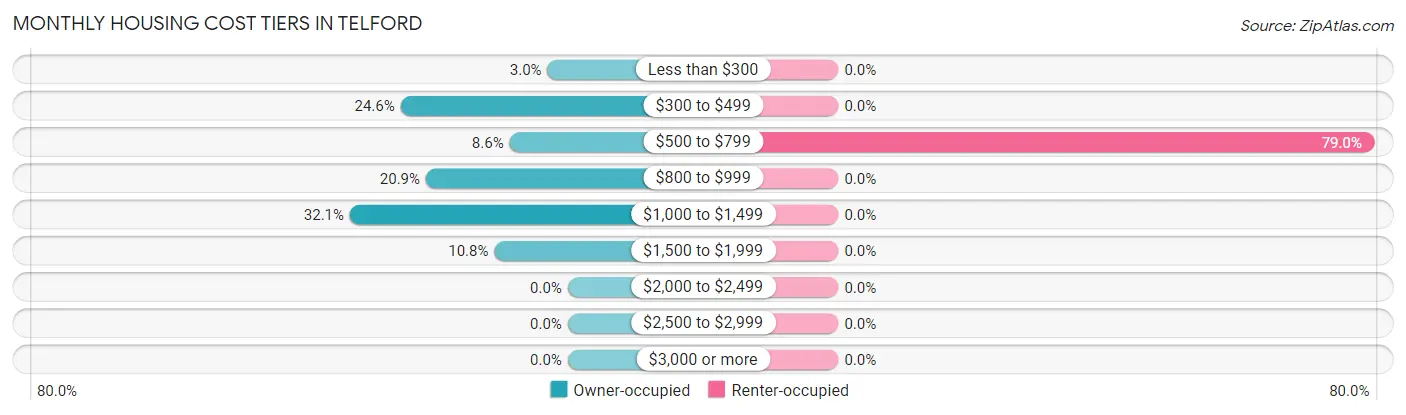
| Monthly Cost | Owner-occupied | Renter-occupied |
| Less than $300 | 8 (3.0%) | 0 (0.0%) |
| $300 to $499 | 66 (24.6%) | 0 (0.0%) |
| $500 to $799 | 23 (8.6%) | 94 (79.0%) |
| $800 to $999 | 56 (20.9%) | 0 (0.0%) |
| $1,000 to $1,499 | 86 (32.1%) | 0 (0.0%) |
| $1,500 to $1,999 | 29 (10.8%) | 0 (0.0%) |
| $2,000 to $2,499 | 0 (0.0%) | 0 (0.0%) |
| $2,500 to $2,999 | 0 (0.0%) | 0 (0.0%) |
| $3,000 or more | 0 (0.0%) | 0 (0.0%) |
| Total | 268 (100.0%) | 119 (100.0%) |
Physical Housing Characteristics in Telford
Housing Structures in Telford
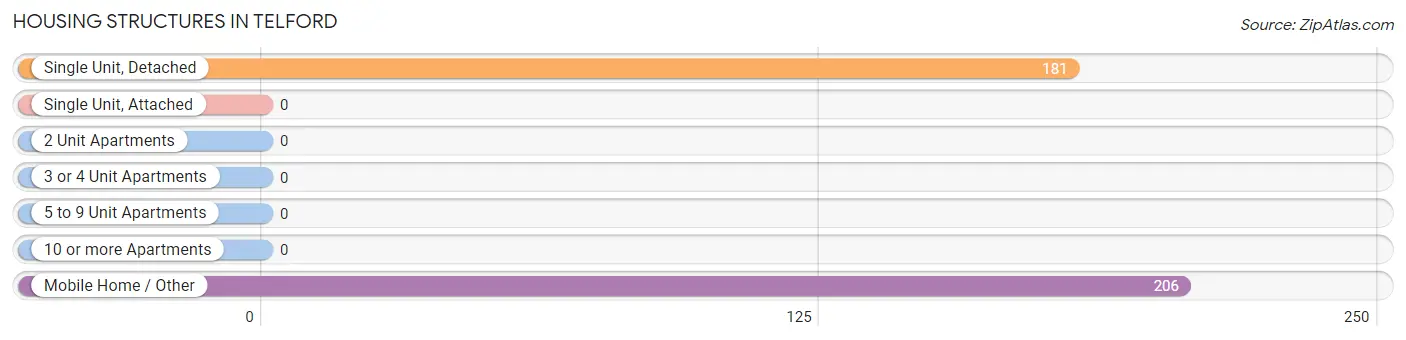
| Structure Type | # Housing Units | % Housing Units |
| Single Unit, Detached | 181 | 46.8% |
| Single Unit, Attached | 0 | 0.0% |
| 2 Unit Apartments | 0 | 0.0% |
| 3 or 4 Unit Apartments | 0 | 0.0% |
| 5 to 9 Unit Apartments | 0 | 0.0% |
| 10 or more Apartments | 0 | 0.0% |
| Mobile Home / Other | 206 | 53.2% |
| Total | 387 | 100.0% |
Housing Structures by Occupancy in Telford
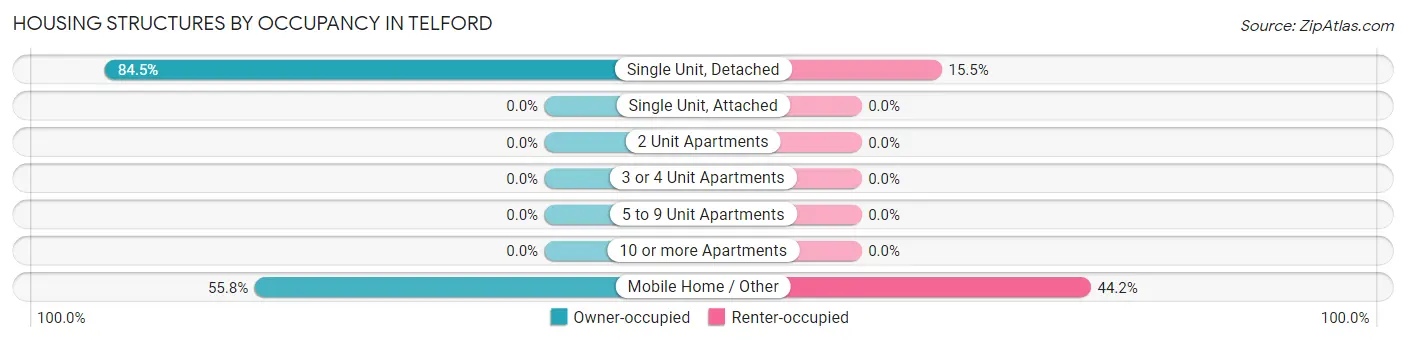
| Structure Type | Owner-occupied | Renter-occupied |
| Single Unit, Detached | 153 (84.5%) | 28 (15.5%) |
| Single Unit, Attached | 0 (0.0%) | 0 (0.0%) |
| 2 Unit Apartments | 0 (0.0%) | 0 (0.0%) |
| 3 or 4 Unit Apartments | 0 (0.0%) | 0 (0.0%) |
| 5 to 9 Unit Apartments | 0 (0.0%) | 0 (0.0%) |
| 10 or more Apartments | 0 (0.0%) | 0 (0.0%) |
| Mobile Home / Other | 115 (55.8%) | 91 (44.2%) |
| Total | 268 (69.3%) | 119 (30.7%) |
Housing Structures by Number of Rooms in Telford
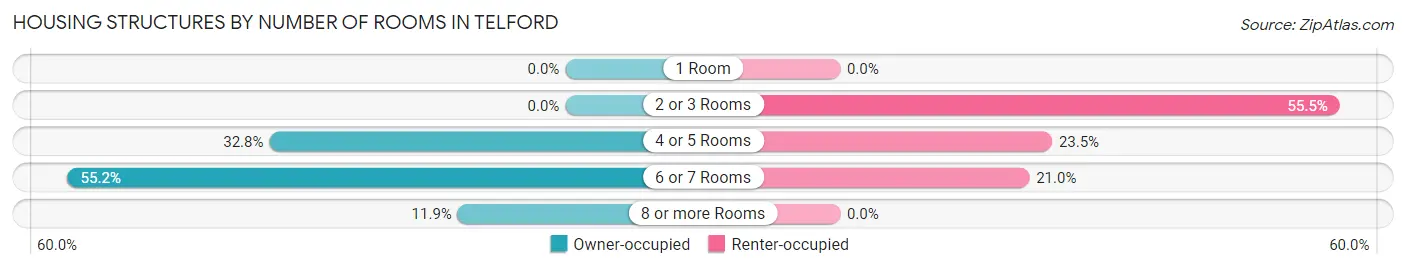
| Number of Rooms | Owner-occupied | Renter-occupied |
| 1 Room | 0 (0.0%) | 0 (0.0%) |
| 2 or 3 Rooms | 0 (0.0%) | 66 (55.5%) |
| 4 or 5 Rooms | 88 (32.8%) | 28 (23.5%) |
| 6 or 7 Rooms | 148 (55.2%) | 25 (21.0%) |
| 8 or more Rooms | 32 (11.9%) | 0 (0.0%) |
| Total | 268 (100.0%) | 119 (100.0%) |
Housing Structure by Heating Type in Telford
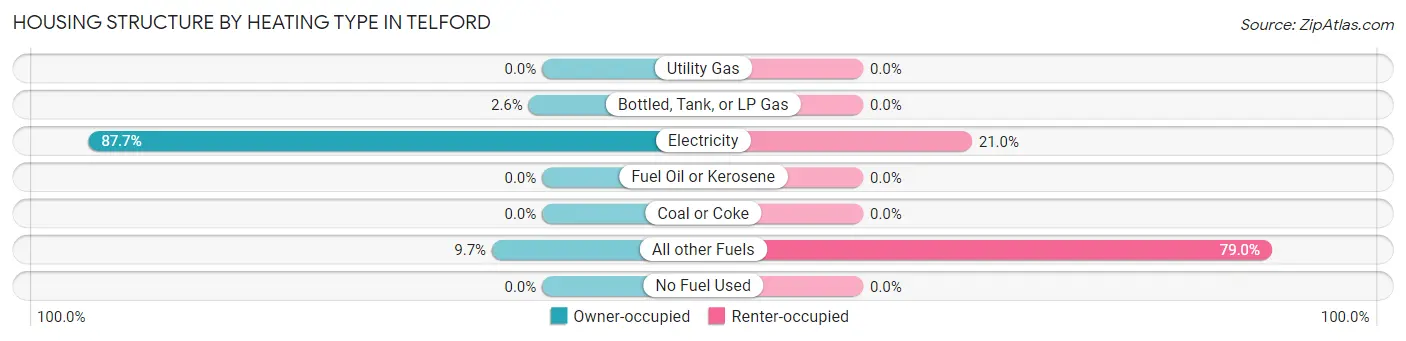
| Heating Type | Owner-occupied | Renter-occupied |
| Utility Gas | 0 (0.0%) | 0 (0.0%) |
| Bottled, Tank, or LP Gas | 7 (2.6%) | 0 (0.0%) |
| Electricity | 235 (87.7%) | 25 (21.0%) |
| Fuel Oil or Kerosene | 0 (0.0%) | 0 (0.0%) |
| Coal or Coke | 0 (0.0%) | 0 (0.0%) |
| All other Fuels | 26 (9.7%) | 94 (79.0%) |
| No Fuel Used | 0 (0.0%) | 0 (0.0%) |
| Total | 268 (100.0%) | 119 (100.0%) |
Household Vehicle Usage in Telford
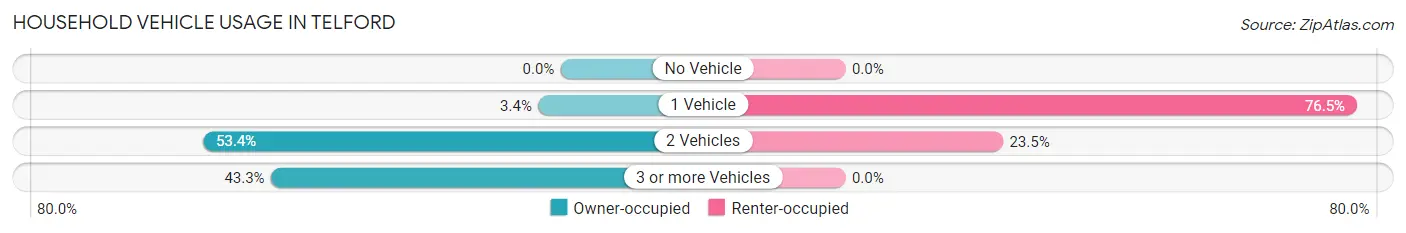
| Vehicles per Household | Owner-occupied | Renter-occupied |
| No Vehicle | 0 (0.0%) | 0 (0.0%) |
| 1 Vehicle | 9 (3.4%) | 91 (76.5%) |
| 2 Vehicles | 143 (53.4%) | 28 (23.5%) |
| 3 or more Vehicles | 116 (43.3%) | 0 (0.0%) |
| Total | 268 (100.0%) | 119 (100.0%) |
Real Estate & Mortgages in Telford
Real Estate and Mortgage Overview in Telford
| Characteristic | Without Mortgage | With Mortgage |
| Housing Units | 88 | 180 |
| Median Property Value | $108,300 | $0 |
| Median Household Income | $80,385 | $17 |
| Monthly Housing Costs | $427 | $0 |
| Real Estate Taxes | $642 | $15 |
Property Value by Mortgage Status in Telford
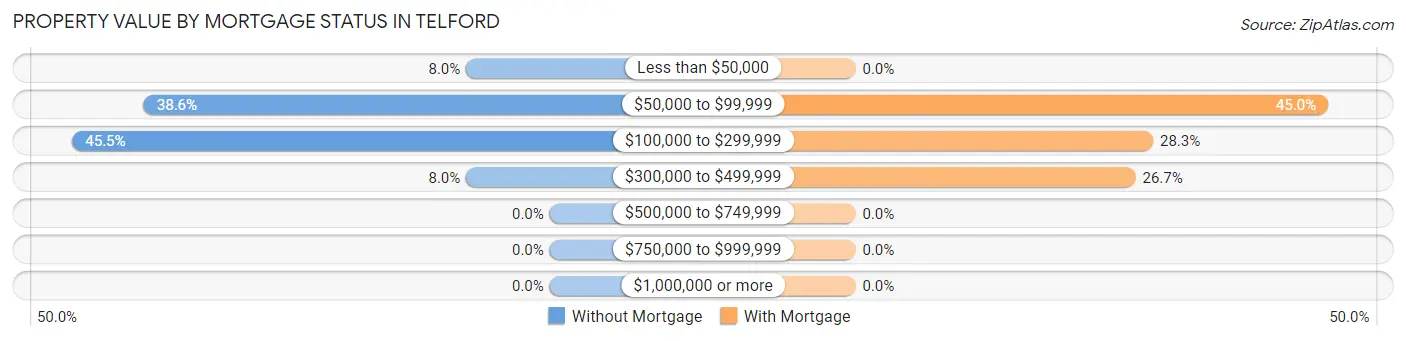
| Property Value | Without Mortgage | With Mortgage |
| Less than $50,000 | 7 (8.0%) | 0 (0.0%) |
| $50,000 to $99,999 | 34 (38.6%) | 81 (45.0%) |
| $100,000 to $299,999 | 40 (45.5%) | 51 (28.3%) |
| $300,000 to $499,999 | 7 (8.0%) | 48 (26.7%) |
| $500,000 to $749,999 | 0 (0.0%) | 0 (0.0%) |
| $750,000 to $999,999 | 0 (0.0%) | 0 (0.0%) |
| $1,000,000 or more | 0 (0.0%) | 0 (0.0%) |
| Total | 88 (100.0%) | 180 (100.0%) |
Household Income by Mortgage Status in Telford
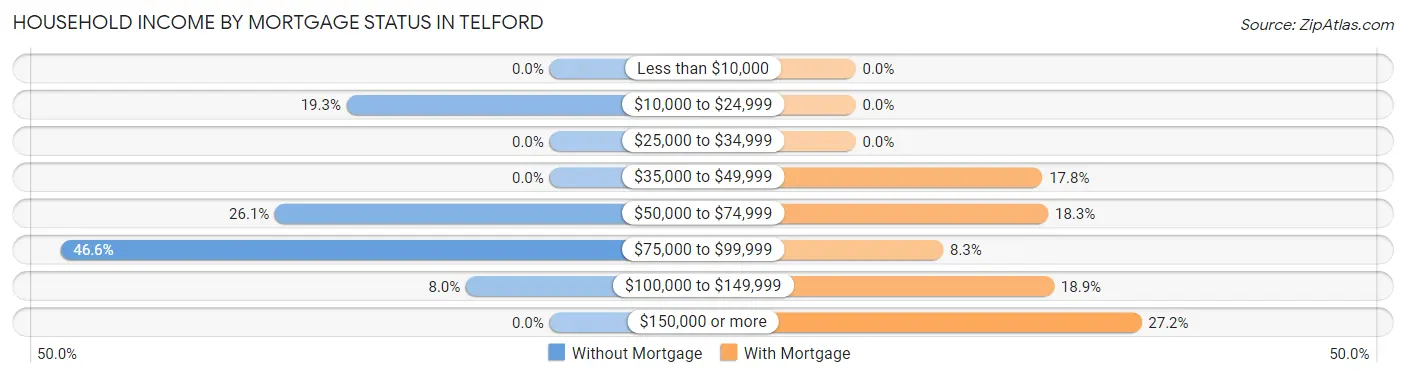
| Household Income | Without Mortgage | With Mortgage |
| Less than $10,000 | 0 (0.0%) | 0 (0.0%) |
| $10,000 to $24,999 | 17 (19.3%) | 0 (0.0%) |
| $25,000 to $34,999 | 0 (0.0%) | 0 (0.0%) |
| $35,000 to $49,999 | 0 (0.0%) | 32 (17.8%) |
| $50,000 to $74,999 | 23 (26.1%) | 33 (18.3%) |
| $75,000 to $99,999 | 41 (46.6%) | 15 (8.3%) |
| $100,000 to $149,999 | 7 (8.0%) | 34 (18.9%) |
| $150,000 or more | 0 (0.0%) | 49 (27.2%) |
| Total | 88 (100.0%) | 180 (100.0%) |
Property Value to Household Income Ratio in Telford
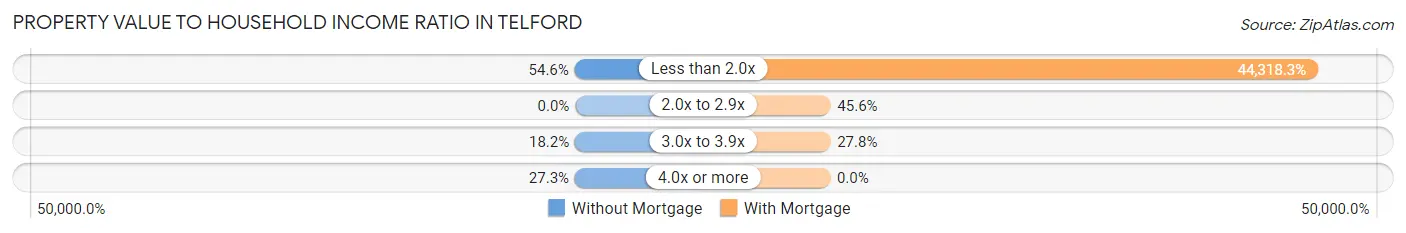
| Value-to-Income Ratio | Without Mortgage | With Mortgage |
| Less than 2.0x | 48 (54.5%) | 79,773 (44,318.3%) |
| 2.0x to 2.9x | 0 (0.0%) | 82 (45.6%) |
| 3.0x to 3.9x | 16 (18.2%) | 50 (27.8%) |
| 4.0x or more | 24 (27.3%) | 0 (0.0%) |
| Total | 88 (100.0%) | 180 (100.0%) |
Real Estate Taxes by Mortgage Status in Telford
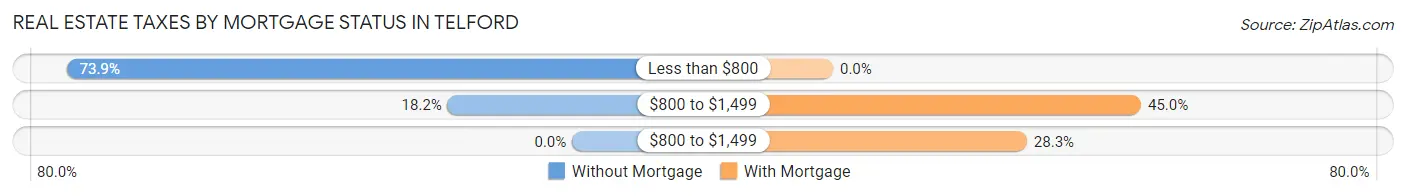
| Property Taxes | Without Mortgage | With Mortgage |
| Less than $800 | 65 (73.9%) | 0 (0.0%) |
| $800 to $1,499 | 16 (18.2%) | 81 (45.0%) |
| $800 to $1,499 | 0 (0.0%) | 51 (28.3%) |
| Total | 88 (100.0%) | 180 (100.0%) |
Health & Disability in Telford
Health Insurance Coverage by Age in Telford
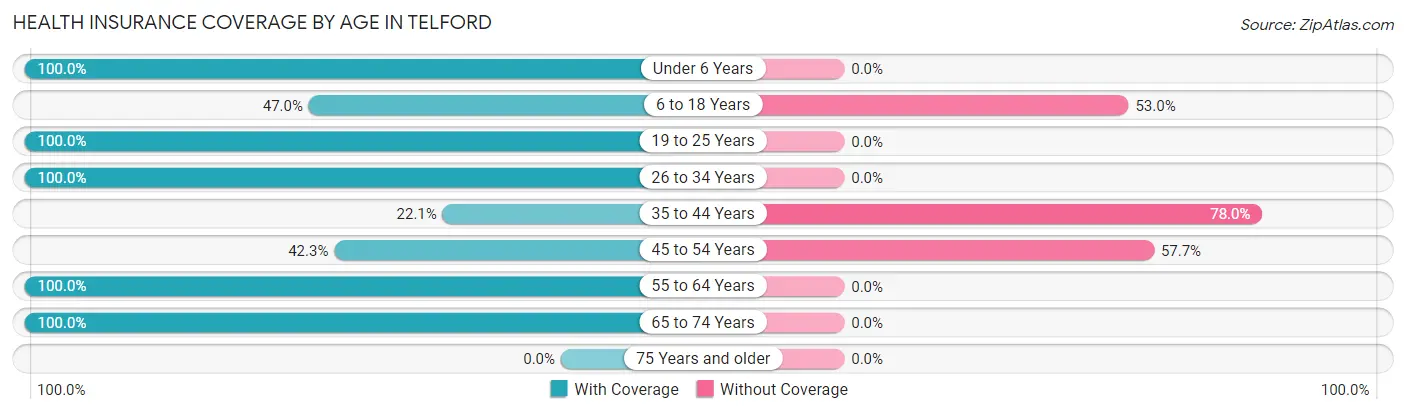
| Age Bracket | With Coverage | Without Coverage |
| Under 6 Years | 63 (100.0%) | 0 (0.0%) |
| 6 to 18 Years | 47 (47.0%) | 53 (53.0%) |
| 19 to 25 Years | 92 (100.0%) | 0 (0.0%) |
| 26 to 34 Years | 63 (100.0%) | 0 (0.0%) |
| 35 to 44 Years | 28 (22.1%) | 99 (77.9%) |
| 45 to 54 Years | 71 (42.3%) | 97 (57.7%) |
| 55 to 64 Years | 176 (100.0%) | 0 (0.0%) |
| 65 to 74 Years | 203 (100.0%) | 0 (0.0%) |
| 75 Years and older | 0 (0.0%) | 0 (0.0%) |
| Total | 743 (74.9%) | 249 (25.1%) |
Health Insurance Coverage by Citizenship Status in Telford
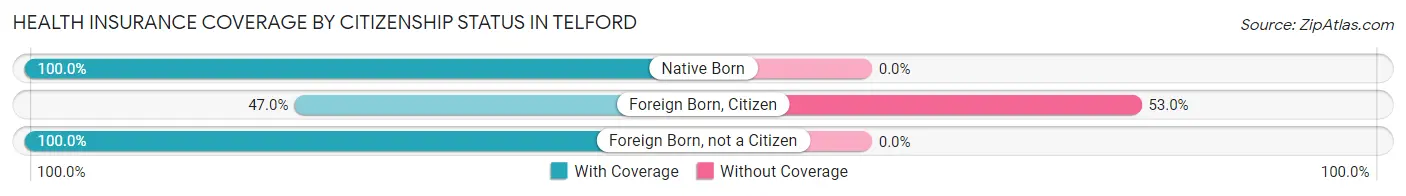
| Citizenship Status | With Coverage | Without Coverage |
| Native Born | 63 (100.0%) | 0 (0.0%) |
| Foreign Born, Citizen | 47 (47.0%) | 53 (53.0%) |
| Foreign Born, not a Citizen | 92 (100.0%) | 0 (0.0%) |
Health Insurance Coverage by Household Income in Telford
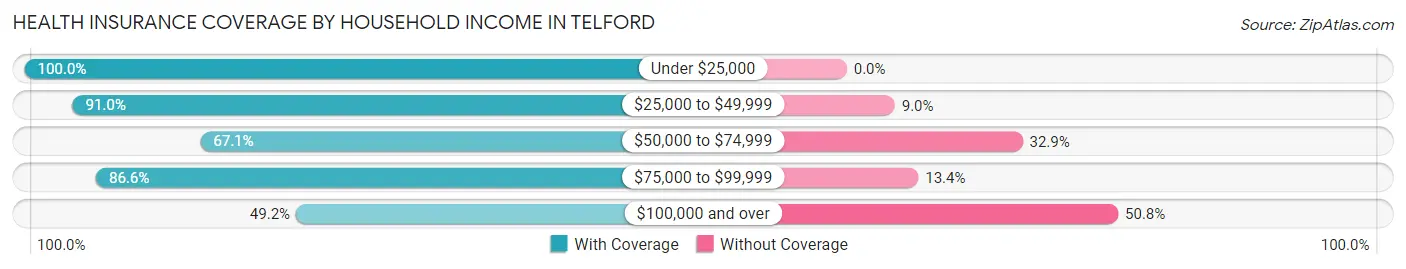
| Household Income | With Coverage | Without Coverage |
| Under $25,000 | 155 (100.0%) | 0 (0.0%) |
| $25,000 to $49,999 | 162 (91.0%) | 16 (9.0%) |
| $50,000 to $74,999 | 110 (67.1%) | 54 (32.9%) |
| $75,000 to $99,999 | 168 (86.6%) | 26 (13.4%) |
| $100,000 and over | 148 (49.2%) | 153 (50.8%) |
Public vs Private Health Insurance Coverage by Age in Telford
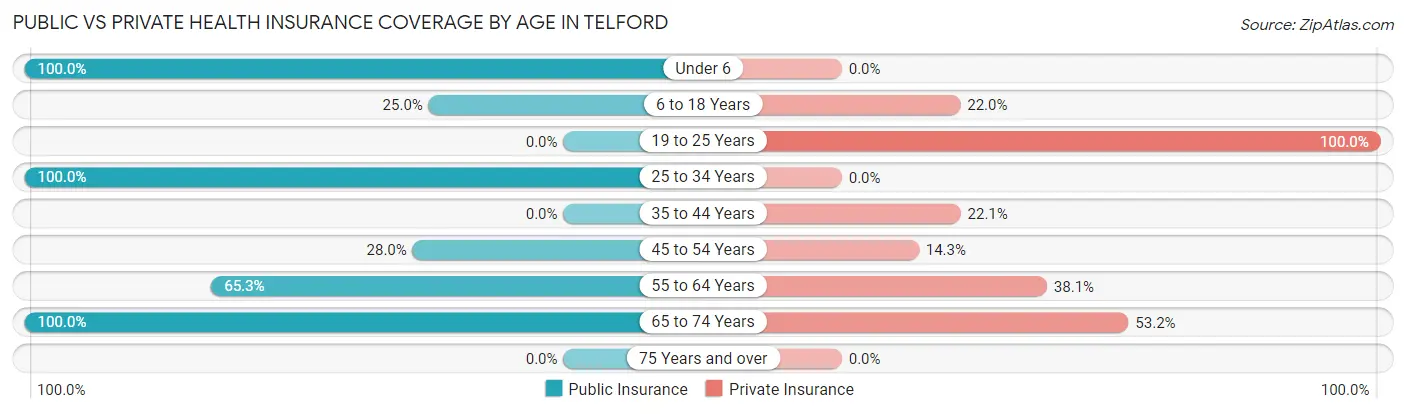
| Age Bracket | Public Insurance | Private Insurance |
| Under 6 | 63 (100.0%) | 0 (0.0%) |
| 6 to 18 Years | 25 (25.0%) | 22 (22.0%) |
| 19 to 25 Years | 0 (0.0%) | 92 (100.0%) |
| 25 to 34 Years | 63 (100.0%) | 0 (0.0%) |
| 35 to 44 Years | 0 (0.0%) | 28 (22.1%) |
| 45 to 54 Years | 47 (28.0%) | 24 (14.3%) |
| 55 to 64 Years | 115 (65.3%) | 67 (38.1%) |
| 65 to 74 Years | 203 (100.0%) | 108 (53.2%) |
| 75 Years and over | 0 (0.0%) | 0 (0.0%) |
| Total | 516 (52.0%) | 341 (34.4%) |
Disability Status by Sex by Age in Telford
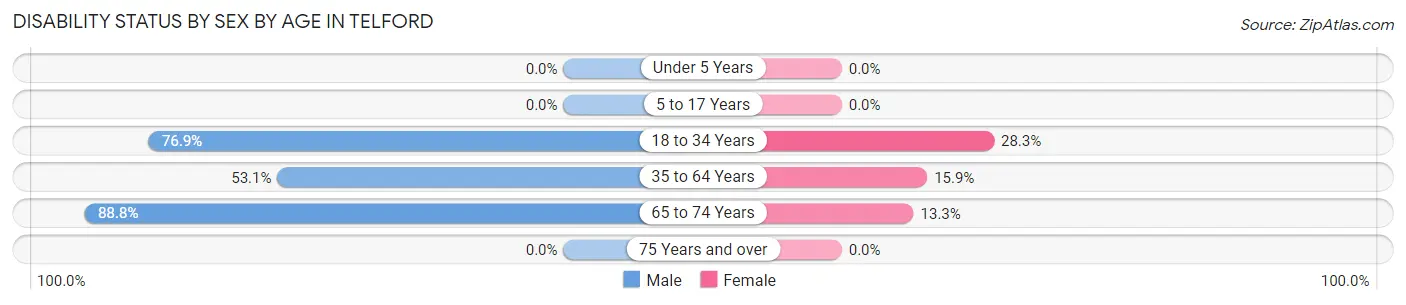
| Age Bracket | Male | Female |
| Under 5 Years | 0 (0.0%) | 0 (0.0%) |
| 5 to 17 Years | 0 (0.0%) | 0 (0.0%) |
| 18 to 34 Years | 90 (76.9%) | 13 (28.3%) |
| 35 to 64 Years | 163 (53.1%) | 26 (15.9%) |
| 65 to 74 Years | 87 (88.8%) | 14 (13.3%) |
| 75 Years and over | 0 (0.0%) | 0 (0.0%) |
Disability Class by Sex by Age in Telford
Disability Class: Hearing Difficulty
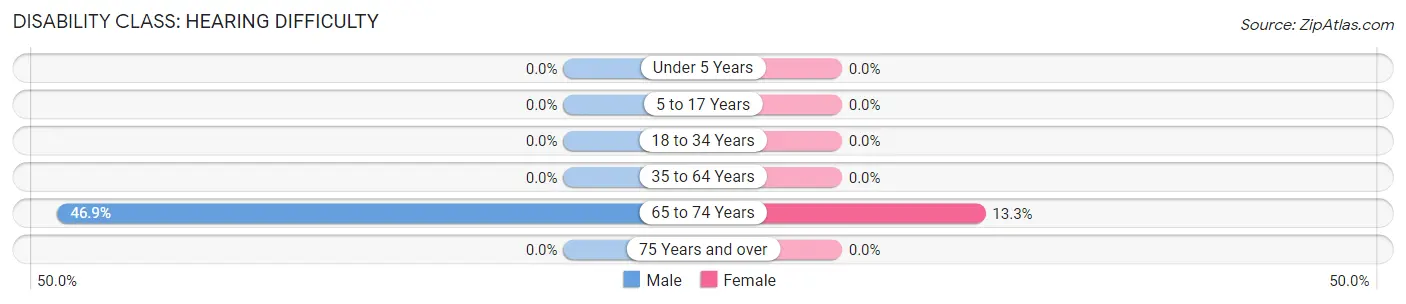
| Age Bracket | Male | Female |
| Under 5 Years | 0 (0.0%) | 0 (0.0%) |
| 5 to 17 Years | 0 (0.0%) | 0 (0.0%) |
| 18 to 34 Years | 0 (0.0%) | 0 (0.0%) |
| 35 to 64 Years | 0 (0.0%) | 0 (0.0%) |
| 65 to 74 Years | 46 (46.9%) | 14 (13.3%) |
| 75 Years and over | 0 (0.0%) | 0 (0.0%) |
Disability Class: Vision Difficulty
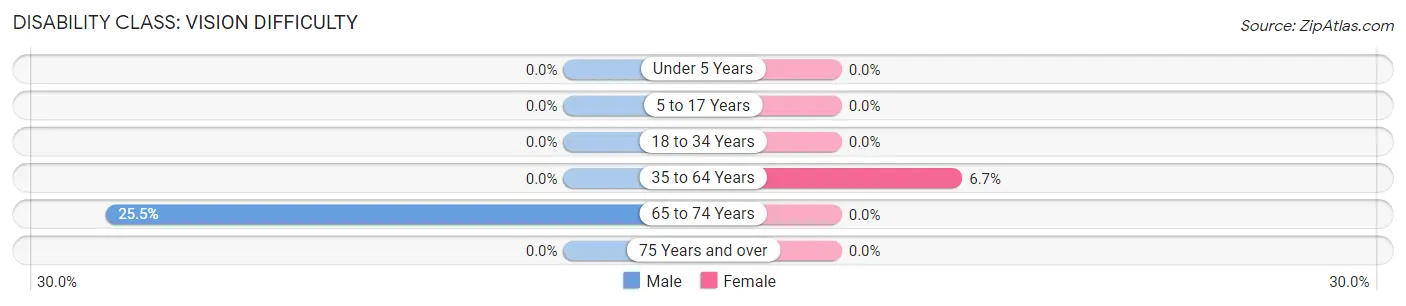
| Age Bracket | Male | Female |
| Under 5 Years | 0 (0.0%) | 0 (0.0%) |
| 5 to 17 Years | 0 (0.0%) | 0 (0.0%) |
| 18 to 34 Years | 0 (0.0%) | 0 (0.0%) |
| 35 to 64 Years | 0 (0.0%) | 11 (6.7%) |
| 65 to 74 Years | 25 (25.5%) | 0 (0.0%) |
| 75 Years and over | 0 (0.0%) | 0 (0.0%) |
Disability Class: Cognitive Difficulty
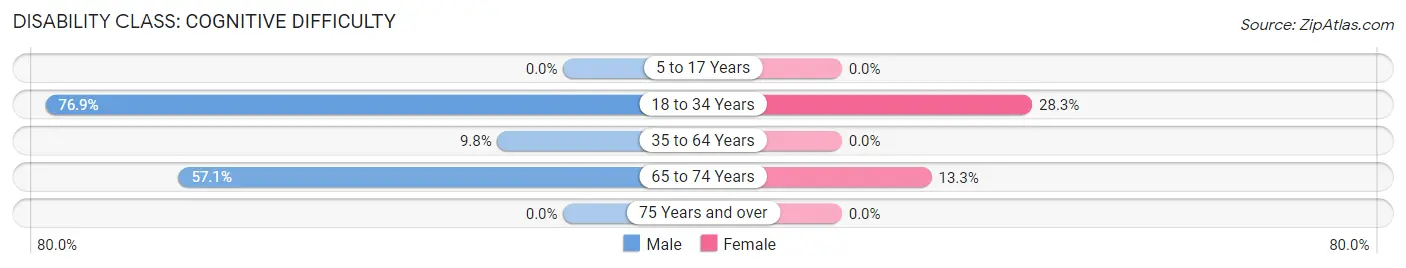
| Age Bracket | Male | Female |
| 5 to 17 Years | 0 (0.0%) | 0 (0.0%) |
| 18 to 34 Years | 90 (76.9%) | 13 (28.3%) |
| 35 to 64 Years | 30 (9.8%) | 0 (0.0%) |
| 65 to 74 Years | 56 (57.1%) | 14 (13.3%) |
| 75 Years and over | 0 (0.0%) | 0 (0.0%) |
Disability Class: Ambulatory Difficulty
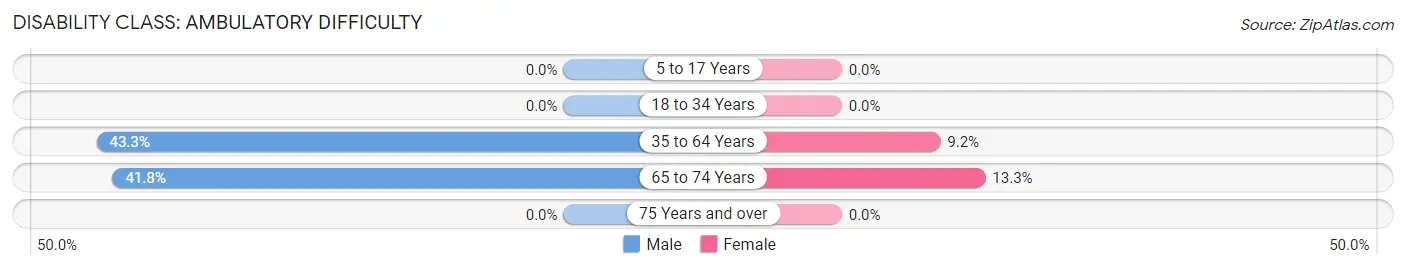
| Age Bracket | Male | Female |
| 5 to 17 Years | 0 (0.0%) | 0 (0.0%) |
| 18 to 34 Years | 0 (0.0%) | 0 (0.0%) |
| 35 to 64 Years | 133 (43.3%) | 15 (9.1%) |
| 65 to 74 Years | 41 (41.8%) | 14 (13.3%) |
| 75 Years and over | 0 (0.0%) | 0 (0.0%) |
Disability Class: Self-Care Difficulty
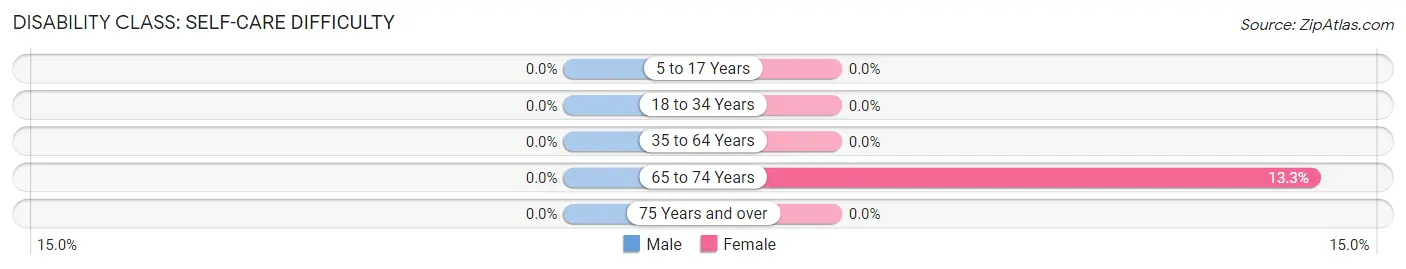
| Age Bracket | Male | Female |
| 5 to 17 Years | 0 (0.0%) | 0 (0.0%) |
| 18 to 34 Years | 0 (0.0%) | 0 (0.0%) |
| 35 to 64 Years | 0 (0.0%) | 0 (0.0%) |
| 65 to 74 Years | 0 (0.0%) | 14 (13.3%) |
| 75 Years and over | 0 (0.0%) | 0 (0.0%) |
Technology Access in Telford
Computing Device Access in Telford
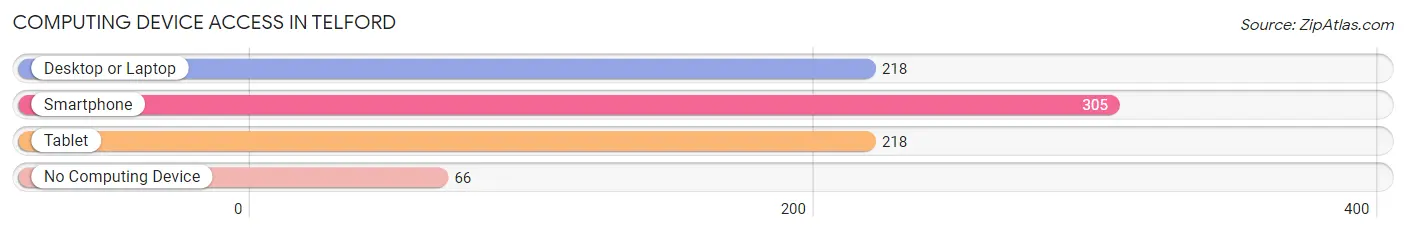
| Device Type | # Households | % Households |
| Desktop or Laptop | 218 | 56.3% |
| Smartphone | 305 | 78.8% |
| Tablet | 218 | 56.3% |
| No Computing Device | 66 | 17.1% |
| Total | 387 | 100.0% |
Internet Access in Telford
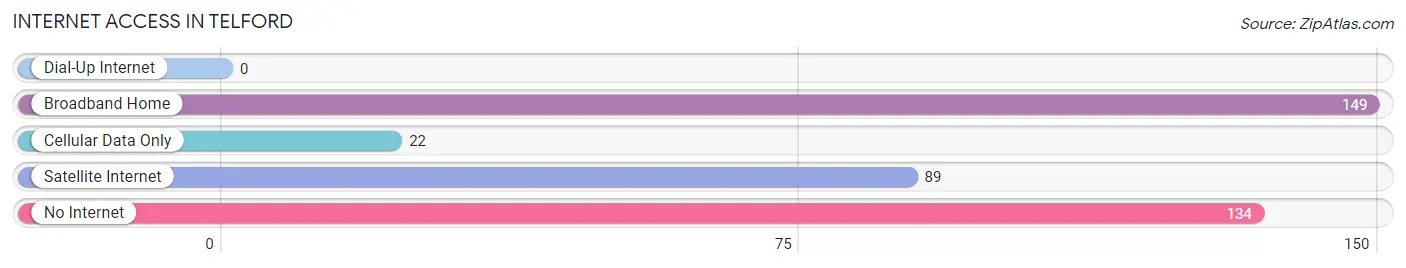
| Internet Type | # Households | % Households |
| Dial-Up Internet | 0 | 0.0% |
| Broadband Home | 149 | 38.5% |
| Cellular Data Only | 22 | 5.7% |
| Satellite Internet | 89 | 23.0% |
| No Internet | 134 | 34.6% |
| Total | 387 | 100.0% |
Telford Summary
Telford is a small town located in the eastern part of Tennessee, in the foothills of the Appalachian Mountains. It is situated in Washington County, and is part of the Johnson City Metropolitan Statistical Area. The town has a population of approximately 1,500 people, and is known for its rural charm and small-town atmosphere.
History
Telford was founded in 1887 by a group of settlers from North Carolina. The town was named after a local farmer, William Telford, who donated the land for the town. The town was originally a farming community, and the main crops grown were corn, wheat, and tobacco. In the early 1900s, the town began to grow and develop, and the first school was built in 1910.
In the 1920s, the town began to experience a period of growth and prosperity. The Great Depression of the 1930s brought economic hardship to the town, but it was able to survive and continue to grow. In the 1940s, the town experienced a period of industrialization, with the opening of several factories. This period of growth continued into the 1950s and 1960s, and the town experienced a population boom.
Geography
Telford is located in the eastern part of Tennessee, in the foothills of the Appalachian Mountains. The town is situated in Washington County, and is part of the Johnson City Metropolitan Statistical Area. The town is located at an elevation of 1,000 feet, and is surrounded by rolling hills and lush forests. The town is located near the Nolichucky River, and is close to several state parks and recreational areas.
Economy
The economy of Telford is largely based on agriculture and manufacturing. The town is home to several farms, which produce a variety of crops, including corn, wheat, and tobacco. The town is also home to several factories, which produce a variety of products, including furniture, textiles, and automotive parts. In addition, the town is home to several small businesses, including restaurants, shops, and services.
Demographics
As of the 2010 census, the population of Telford was 1,500 people. The racial makeup of the town was 95.3% White, 1.7% African American, 0.7% Native American, 0.3% Asian, and 1.7% from other races. The median household income was $35,000, and the median age was 38. The town is served by the Washington County School District, and is home to several churches.
Conclusion
Telford is a small town located in the eastern part of Tennessee, in the foothills of the Appalachian Mountains. The town has a population of approximately 1,500 people, and is known for its rural charm and small-town atmosphere. The economy of Telford is largely based on agriculture and manufacturing, and the town is home to several farms, factories, and small businesses. The racial makeup of the town is predominantly White, with a small percentage of African American, Native American, and Asian residents. The median household income is $35,000, and the median age is 38. Telford is served by the Washington County School District, and is home to several churches.
Common Questions
What is Per Capita Income in Telford?
Per Capita income in Telford is $27,699.
What is the Median Family Income in Telford?
Median Family Income in Telford is $78,864.
What is the Median Household income in Telford?
Median Household Income in Telford is $62,750.
What is Income or Wage Gap in Telford?
Income or Wage Gap in Telford is 68.5%.
Women in Telford earn 31.5 cents for every dollar earned by a man.
What is Inequality or Gini Index in Telford?
Inequality or Gini Index in Telford is 0.37.
What is the Total Population of Telford?
Total Population of Telford is 992.
What is the Total Male Population of Telford?
Total Male Population of Telford is 573.
What is the Total Female Population of Telford?
Total Female Population of Telford is 419.
What is the Ratio of Males per 100 Females in Telford?
There are 136.75 Males per 100 Females in Telford.
What is the Ratio of Females per 100 Males in Telford?
There are 73.12 Females per 100 Males in Telford.
What is the Median Population Age in Telford?
Median Population Age in Telford is 45.8 Years.
What is the Average Family Size in Telford
Average Family Size in Telford is 3.0 People.
What is the Average Household Size in Telford
Average Household Size in Telford is 2.6 People.
How Large is the Labor Force in Telford?
There are 440 People in the Labor Forcein in Telford.
What is the Percentage of People in the Labor Force in Telford?
49.4% of People are in the Labor Force in Telford.
What is the Unemployment Rate in Telford?
Unemployment Rate in Telford is 6.4%.