Sweetwater, TN Map & Demographics
Sweetwater Map
Sweetwater Overview
$28,098
PER CAPITA INCOME
$61,723
AVG FAMILY INCOME
$38,750
AVG HOUSEHOLD INCOME
34.4%
WAGE / INCOME GAP [ % ]
65.6¢/ $1
WAGE / INCOME GAP [ $ ]
0.54
INEQUALITY / GINI INDEX
6,310
TOTAL POPULATION
2,840
MALE POPULATION
3,470
FEMALE POPULATION
81.84
MALES / 100 FEMALES
122.18
FEMALES / 100 MALES
43.7
MEDIAN AGE
2.9
AVG FAMILY SIZE
2.2
AVG HOUSEHOLD SIZE
2,628
LABOR FORCE [ PEOPLE ]
50.7%
PERCENT IN LABOR FORCE
9.4%
UNEMPLOYMENT RATE
Sweetwater Zip Codes
Income in Sweetwater
Income Overview in Sweetwater
Per Capita Income in Sweetwater is $28,098, while median incomes of families and households are $61,723 and $38,750 respectively.
| Characteristic | Number | Measure |
| Per Capita Income | 6,310 | $28,098 |
| Median Family Income | 1,579 | $61,723 |
| Mean Family Income | 1,579 | $86,087 |
| Median Household Income | 2,762 | $38,750 |
| Mean Household Income | 2,762 | $63,616 |
| Income Deficit | 1,579 | $0 |
| Wage / Income Gap (%) | 6,310 | 34.44% |
| Wage / Income Gap ($) | 6,310 | 65.56¢ per $1 |
| Gini / Inequality Index | 6,310 | 0.54 |
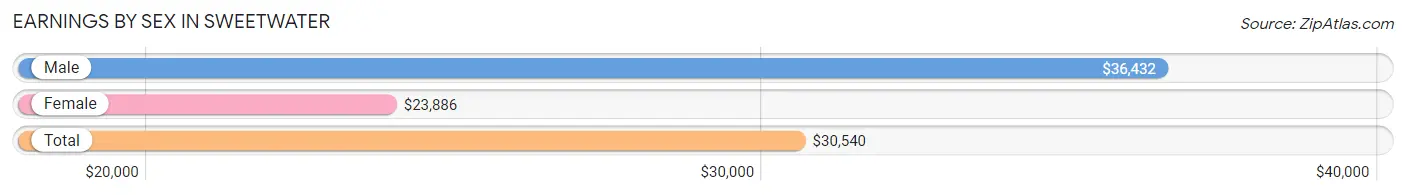
Earnings by Sex in Sweetwater
Average Earnings in Sweetwater are $30,540, $36,432 for men and $23,886 for women, a difference of 34.4%.
| Sex | Number | Average Earnings |
| Male | 1,309 (48.3%) | $36,432 |
| Female | 1,401 (51.7%) | $23,886 |
| Total | 2,710 (100.0%) | $30,540 |
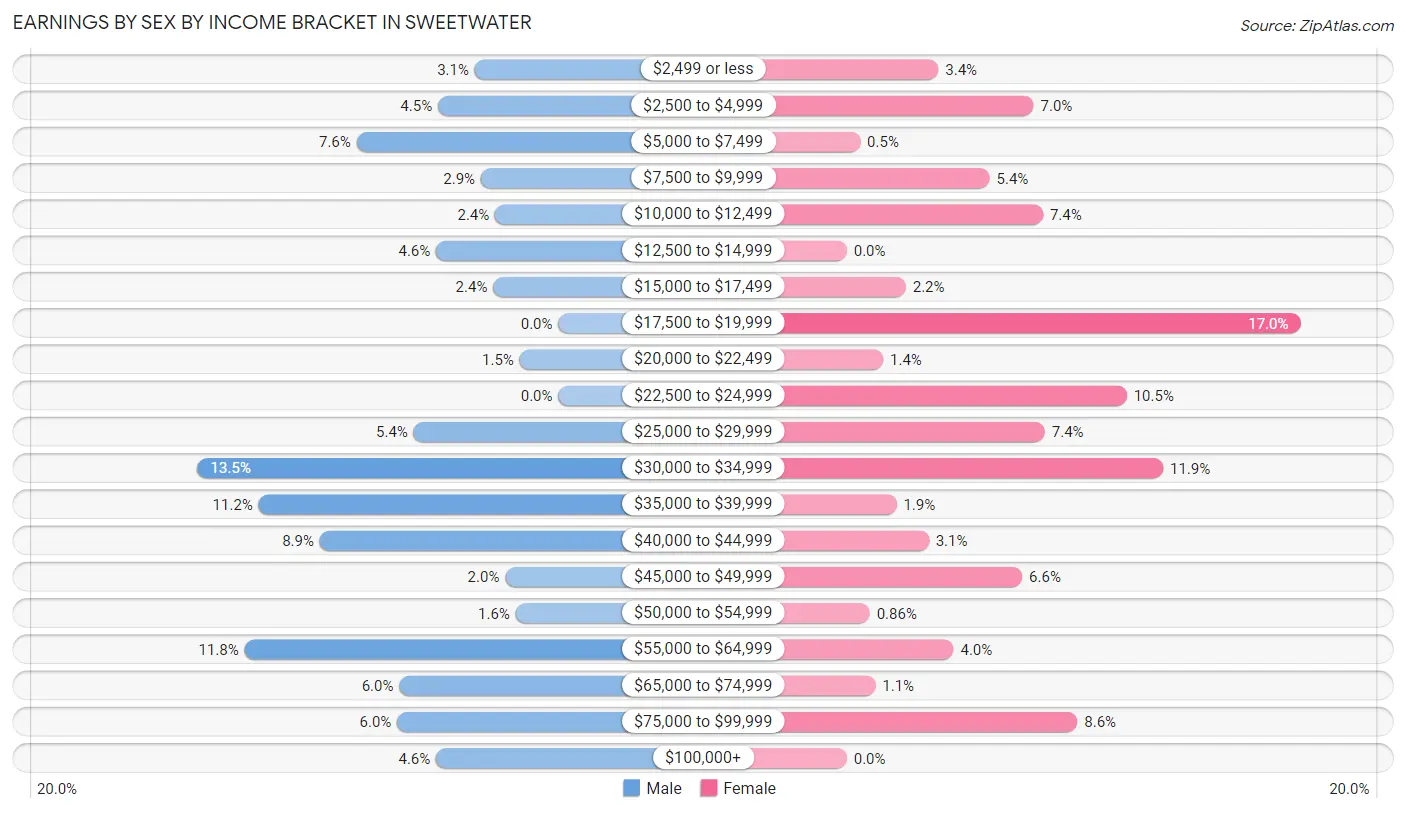
Earnings by Sex by Income Bracket in Sweetwater
The most common earnings brackets in Sweetwater are $30,000 to $34,999 for men (177 | 13.5%) and $17,500 to $19,999 for women (238 | 17.0%).
| Income | Male | Female |
| $2,499 or less | 41 (3.1%) | 48 (3.4%) |
| $2,500 to $4,999 | 59 (4.5%) | 98 (7.0%) |
| $5,000 to $7,499 | 99 (7.6%) | 7 (0.5%) |
| $7,500 to $9,999 | 38 (2.9%) | 75 (5.3%) |
| $10,000 to $12,499 | 31 (2.4%) | 103 (7.3%) |
| $12,500 to $14,999 | 60 (4.6%) | 0 (0.0%) |
| $15,000 to $17,499 | 32 (2.4%) | 31 (2.2%) |
| $17,500 to $19,999 | 0 (0.0%) | 238 (17.0%) |
| $20,000 to $22,499 | 19 (1.5%) | 19 (1.4%) |
| $22,500 to $24,999 | 0 (0.0%) | 147 (10.5%) |
| $25,000 to $29,999 | 71 (5.4%) | 104 (7.4%) |
| $30,000 to $34,999 | 177 (13.5%) | 166 (11.8%) |
| $35,000 to $39,999 | 147 (11.2%) | 26 (1.9%) |
| $40,000 to $44,999 | 117 (8.9%) | 43 (3.1%) |
| $45,000 to $49,999 | 26 (2.0%) | 92 (6.6%) |
| $50,000 to $54,999 | 21 (1.6%) | 12 (0.9%) |
| $55,000 to $64,999 | 154 (11.8%) | 56 (4.0%) |
| $65,000 to $74,999 | 78 (6.0%) | 15 (1.1%) |
| $75,000 to $99,999 | 79 (6.0%) | 121 (8.6%) |
| $100,000+ | 60 (4.6%) | 0 (0.0%) |
| Total | 1,309 (100.0%) | 1,401 (100.0%) |
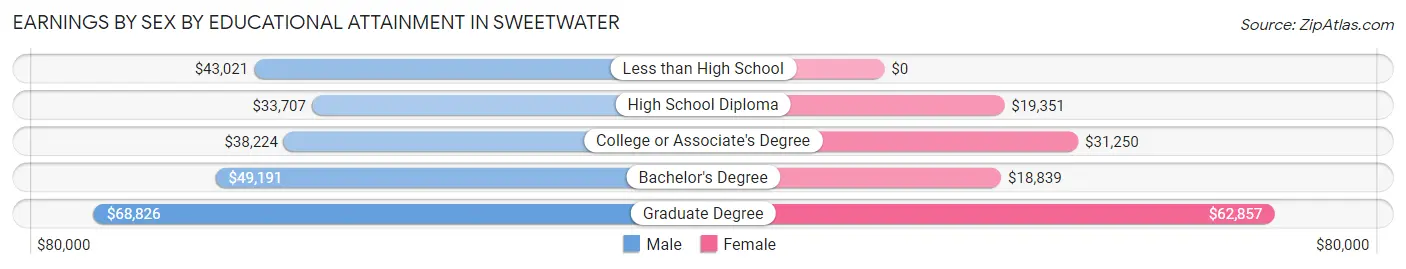
Earnings by Sex by Educational Attainment in Sweetwater
Average earnings in Sweetwater are $37,992 for men and $23,537 for women, a difference of 38.1%. Men with an educational attainment of graduate degree enjoy the highest average annual earnings of $68,826, while those with high school diploma education earn the least with $33,707. Women with an educational attainment of graduate degree earn the most with the average annual earnings of $62,857, while those with bachelor's degree education have the smallest earnings of $18,839.
| Educational Attainment | Male Income | Female Income |
| Less than High School | $43,021 | $0 |
| High School Diploma | $33,707 | $19,351 |
| College or Associate's Degree | $38,224 | $31,250 |
| Bachelor's Degree | $49,191 | $18,839 |
| Graduate Degree | $68,826 | $62,857 |
| Total | $37,992 | $23,537 |
Family Income in Sweetwater
Family Income Brackets in Sweetwater
According to the Sweetwater family income data, there are 384 families falling into the $75,000 to $99,999 income range, which is the most common income bracket and makes up 24.3% of all families. Conversely, the $150,000 to $199,999 income bracket is the least frequent group with only 25 families (1.6%) belonging to this category.
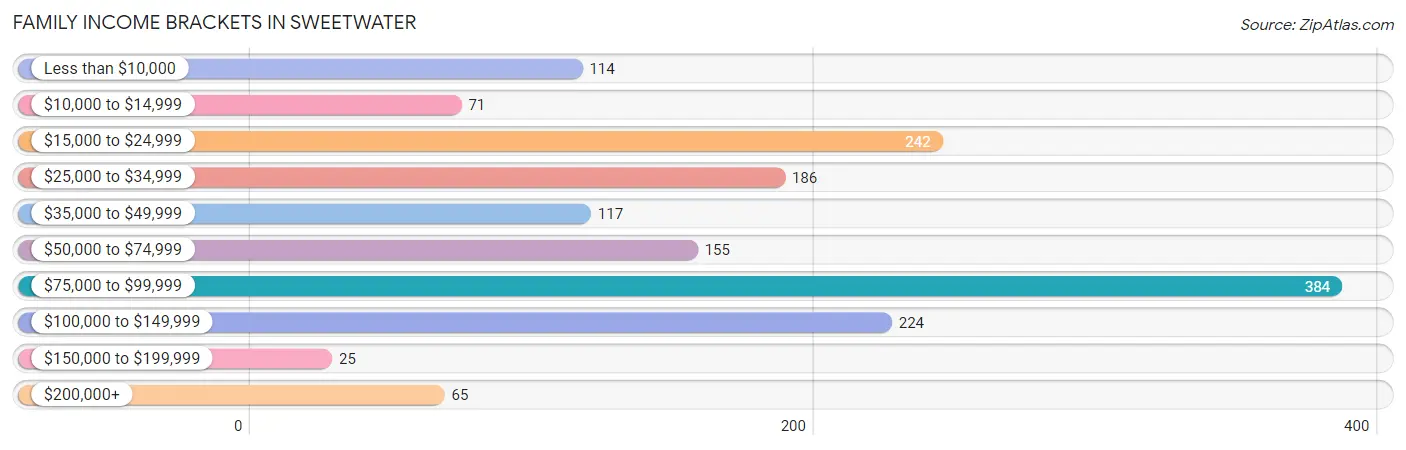
| Income Bracket | # Families | % Families |
| Less than $10,000 | 114 | 7.2% |
| $10,000 to $14,999 | 71 | 4.5% |
| $15,000 to $24,999 | 242 | 15.3% |
| $25,000 to $34,999 | 186 | 11.8% |
| $35,000 to $49,999 | 117 | 7.4% |
| $50,000 to $74,999 | 155 | 9.8% |
| $75,000 to $99,999 | 384 | 24.3% |
| $100,000 to $149,999 | 224 | 14.2% |
| $150,000 to $199,999 | 25 | 1.6% |
| $200,000+ | 65 | 4.1% |
Family Income by Famaliy Size in Sweetwater
5-person families (93 | 5.9%) account for the highest median family income in Sweetwater with $90,824 per family, while 3-person families (365 | 23.1%) have the highest median income of $28,456 per family member.
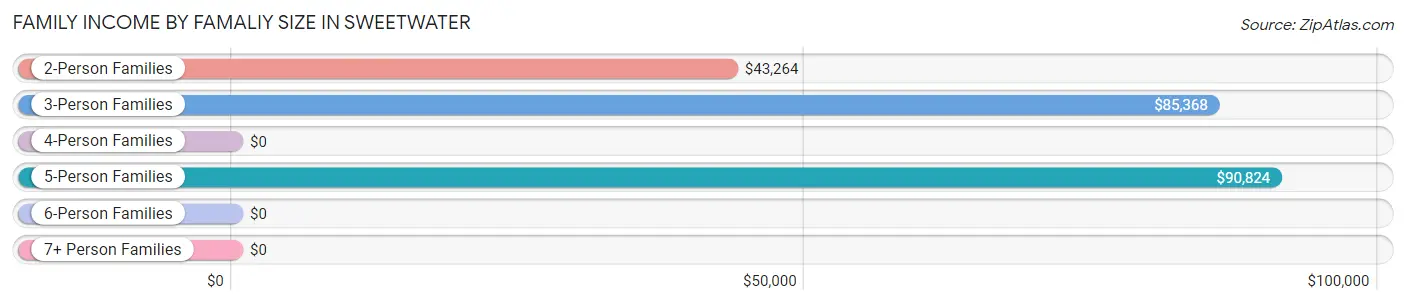
| Income Bracket | # Families | Median Income |
| 2-Person Families | 812 (51.4%) | $43,264 |
| 3-Person Families | 365 (23.1%) | $85,368 |
| 4-Person Families | 161 (10.2%) | $0 |
| 5-Person Families | 93 (5.9%) | $90,824 |
| 6-Person Families | 103 (6.5%) | $0 |
| 7+ Person Families | 45 (2.9%) | $0 |
| Total | 1,579 (100.0%) | $61,723 |
Family Income by Number of Earners in Sweetwater
The median family income in Sweetwater is $61,723, with families comprising 3+ earners (145) having the highest median family income of $125,368, while families with no earners (281) have the lowest median family income of $24,449, accounting for 9.2% and 17.8% of families, respectively.
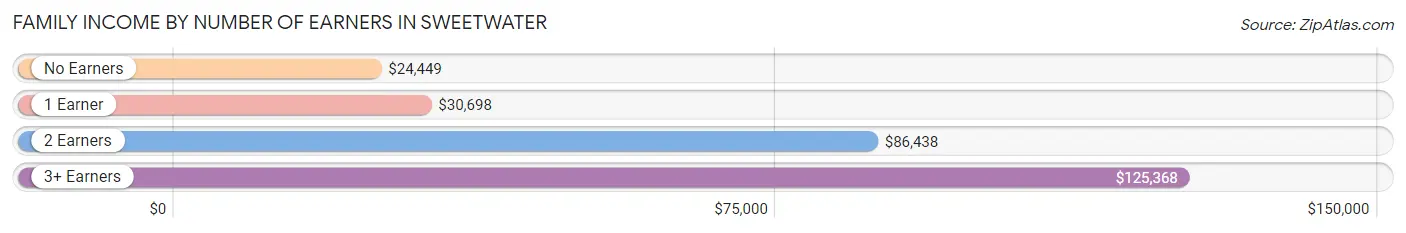
| Number of Earners | # Families | Median Income |
| No Earners | 281 (17.8%) | $24,449 |
| 1 Earner | 654 (41.4%) | $30,698 |
| 2 Earners | 499 (31.6%) | $86,438 |
| 3+ Earners | 145 (9.2%) | $125,368 |
| Total | 1,579 (100.0%) | $61,723 |
Household Income in Sweetwater
Household Income Brackets in Sweetwater
With 439 households falling in the category, the $75,000 to $99,999 income range is the most frequent in Sweetwater, accounting for 15.9% of all households. In contrast, only 36 households (1.3%) fall into the $150,000 to $199,999 income bracket, making it the least populous group.
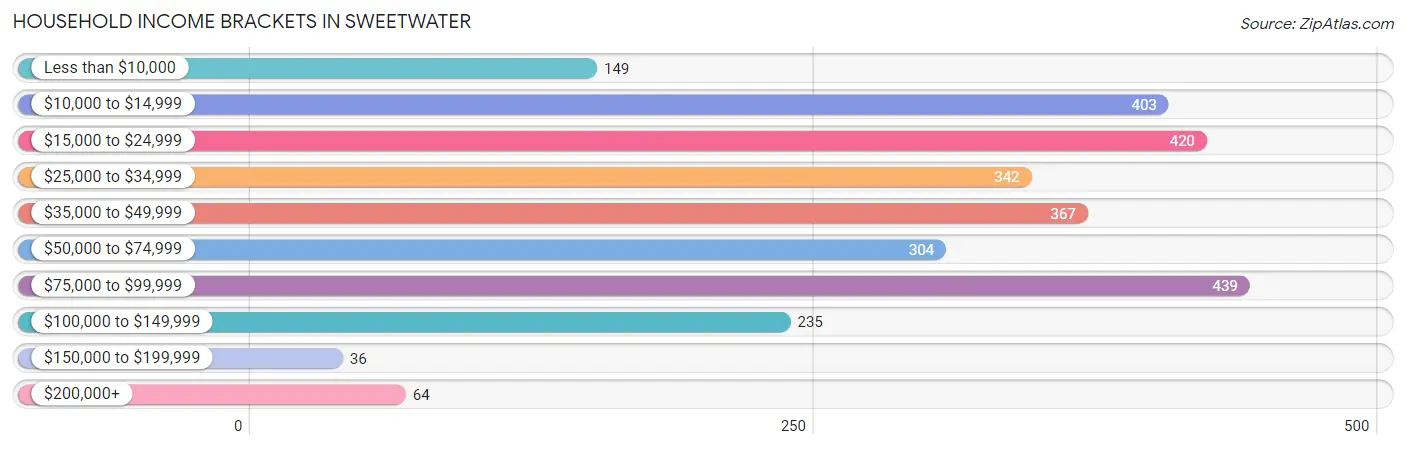
| Income Bracket | # Households | % Households |
| Less than $10,000 | 149 | 5.4% |
| $10,000 to $14,999 | 403 | 14.6% |
| $15,000 to $24,999 | 420 | 15.2% |
| $25,000 to $34,999 | 342 | 12.4% |
| $35,000 to $49,999 | 367 | 13.3% |
| $50,000 to $74,999 | 304 | 11.0% |
| $75,000 to $99,999 | 439 | 15.9% |
| $100,000 to $149,999 | 235 | 8.5% |
| $150,000 to $199,999 | 36 | 1.3% |
| $200,000+ | 64 | 2.3% |
Household Income by Householder Age in Sweetwater
The median household income in Sweetwater is $38,750, with the highest median household income of $41,034 found in the 25 to 44 years age bracket for the primary householder. A total of 832 households (30.1%) fall into this category. Meanwhile, the 15 to 24 years age bracket for the primary householder has the lowest median household income of $0, with 178 households (6.4%) in this group.
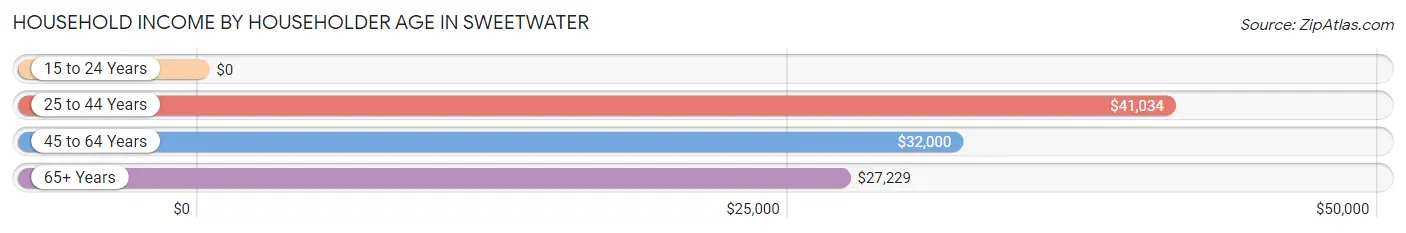
| Income Bracket | # Households | Median Income |
| 15 to 24 Years | 178 (6.4%) | $0 |
| 25 to 44 Years | 832 (30.1%) | $41,034 |
| 45 to 64 Years | 794 (28.7%) | $32,000 |
| 65+ Years | 958 (34.7%) | $27,229 |
| Total | 2,762 (100.0%) | $38,750 |
Poverty in Sweetwater
Income Below Poverty by Sex and Age in Sweetwater
With 18.4% poverty level for males and 23.6% for females among the residents of Sweetwater, 5 year old males and 65 to 74 year old females are the most vulnerable to poverty, with 12 males (100.0%) and 230 females (47.1%) in their respective age groups living below the poverty level.
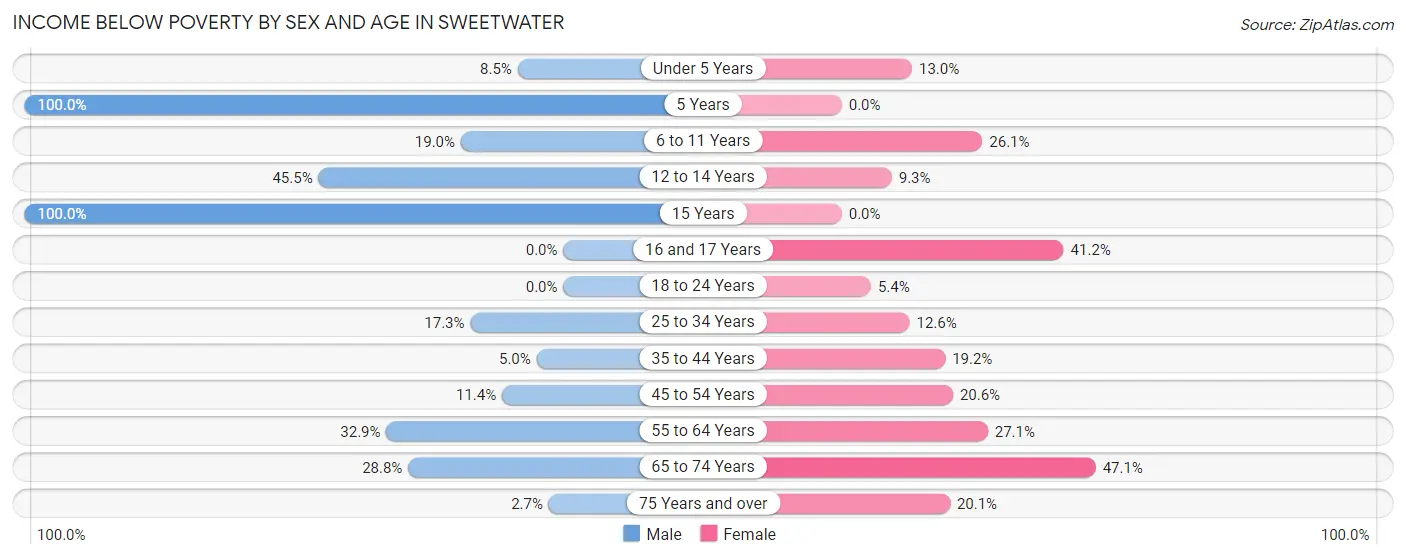
| Age Bracket | Male | Female |
| Under 5 Years | 16 (8.5%) | 12 (13.0%) |
| 5 Years | 12 (100.0%) | 0 (0.0%) |
| 6 to 11 Years | 58 (19.0%) | 48 (26.1%) |
| 12 to 14 Years | 70 (45.5%) | 9 (9.3%) |
| 15 Years | 19 (100.0%) | 0 (0.0%) |
| 16 and 17 Years | 0 (0.0%) | 63 (41.2%) |
| 18 to 24 Years | 0 (0.0%) | 16 (5.4%) |
| 25 to 34 Years | 58 (17.3%) | 44 (12.6%) |
| 35 to 44 Years | 19 (5.0%) | 90 (19.2%) |
| 45 to 54 Years | 28 (11.4%) | 92 (20.6%) |
| 55 to 64 Years | 113 (32.9%) | 126 (27.1%) |
| 65 to 74 Years | 110 (28.8%) | 230 (47.1%) |
| 75 Years and over | 5 (2.7%) | 54 (20.1%) |
| Total | 508 (18.4%) | 784 (23.6%) |
Income Above Poverty by Sex and Age in Sweetwater
According to the poverty statistics in Sweetwater, males aged 16 and 17 years and females aged 5 years are the age groups that are most secure financially, with 100.0% of males and 100.0% of females in these age groups living above the poverty line.
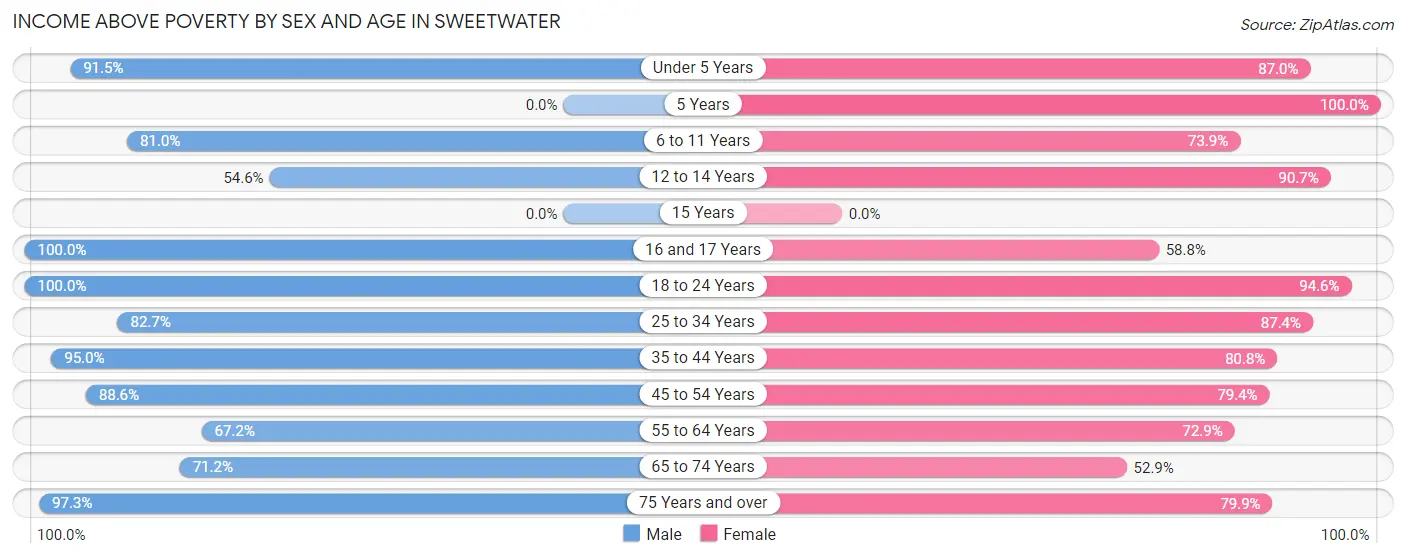
| Age Bracket | Male | Female |
| Under 5 Years | 173 (91.5%) | 80 (87.0%) |
| 5 Years | 0 (0.0%) | 7 (100.0%) |
| 6 to 11 Years | 247 (81.0%) | 136 (73.9%) |
| 12 to 14 Years | 84 (54.5%) | 88 (90.7%) |
| 15 Years | 0 (0.0%) | 0 (0.0%) |
| 16 and 17 Years | 102 (100.0%) | 90 (58.8%) |
| 18 to 24 Years | 107 (100.0%) | 279 (94.6%) |
| 25 to 34 Years | 278 (82.7%) | 306 (87.4%) |
| 35 to 44 Years | 364 (95.0%) | 379 (80.8%) |
| 45 to 54 Years | 218 (88.6%) | 354 (79.4%) |
| 55 to 64 Years | 231 (67.1%) | 339 (72.9%) |
| 65 to 74 Years | 272 (71.2%) | 258 (52.9%) |
| 75 Years and over | 180 (97.3%) | 215 (79.9%) |
| Total | 2,256 (81.6%) | 2,531 (76.3%) |
Income Below Poverty Among Married-Couple Families in Sweetwater
The poverty statistics for married-couple families in Sweetwater show that 6.6% or 65 of the total 983 families live below the poverty line. Families with 1 or 2 children have the highest poverty rate of 16.8%, comprising of 37 families. On the other hand, families with 3 or 4 children have the lowest poverty rate of 0.0%, which includes 0 families.
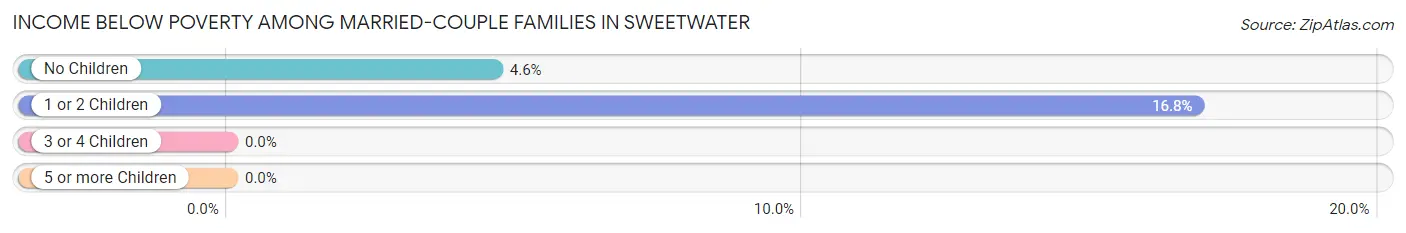
| Children | Above Poverty | Below Poverty |
| No Children | 579 (95.4%) | 28 (4.6%) |
| 1 or 2 Children | 183 (83.2%) | 37 (16.8%) |
| 3 or 4 Children | 156 (100.0%) | 0 (0.0%) |
| 5 or more Children | 0 (0.0%) | 0 (0.0%) |
| Total | 918 (93.4%) | 65 (6.6%) |
Income Below Poverty Among Single-Parent Households in Sweetwater
According to the poverty data in Sweetwater, 23.7% or 19 single-father households and 26.6% or 137 single-mother households are living below the poverty line. Among single-father households, those with 1 or 2 children have the highest poverty rate, with 19 households (100.0%) experiencing poverty. Likewise, among single-mother households, those with 5 or more children have the highest poverty rate, with 17 households (100.0%) falling below the poverty line.
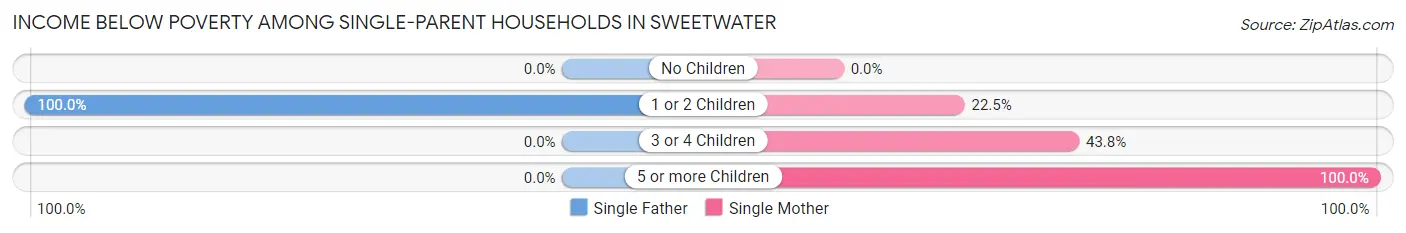
| Children | Single Father | Single Mother |
| No Children | 0 (0.0%) | 0 (0.0%) |
| 1 or 2 Children | 19 (100.0%) | 88 (22.5%) |
| 3 or 4 Children | 0 (0.0%) | 32 (43.8%) |
| 5 or more Children | 0 (0.0%) | 17 (100.0%) |
| Total | 19 (23.7%) | 137 (26.6%) |
Income Below Poverty Among Married-Couple vs Single-Parent Households in Sweetwater
The poverty data for Sweetwater shows that 65 of the married-couple family households (6.6%) and 156 of the single-parent households (26.2%) are living below the poverty level. Within the married-couple family households, those with 1 or 2 children have the highest poverty rate, with 37 households (16.8%) falling below the poverty line. Among the single-parent households, those with 5 or more children have the highest poverty rate, with 17 household (100.0%) living below poverty.
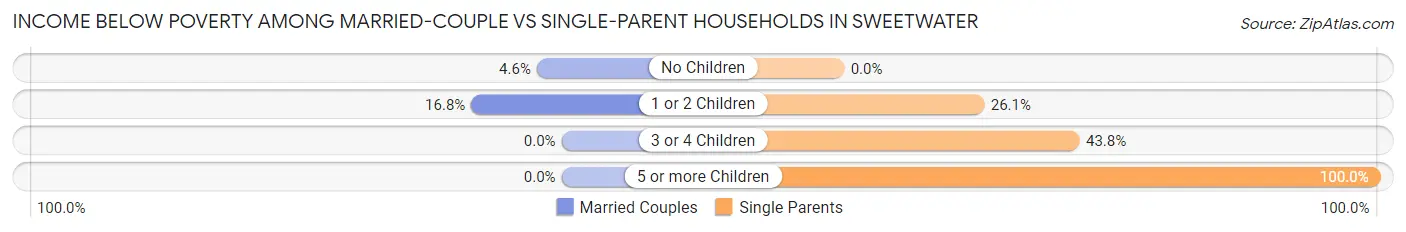
| Children | Married-Couple Families | Single-Parent Households |
| No Children | 28 (4.6%) | 0 (0.0%) |
| 1 or 2 Children | 37 (16.8%) | 107 (26.1%) |
| 3 or 4 Children | 0 (0.0%) | 32 (43.8%) |
| 5 or more Children | 0 (0.0%) | 17 (100.0%) |
| Total | 65 (6.6%) | 156 (26.2%) |
Race in Sweetwater
The most populous races in Sweetwater are White / Caucasian (5,430 | 86.1%), Black / African American (346 | 5.5%), and Hispanic or Latino (314 | 5.0%).
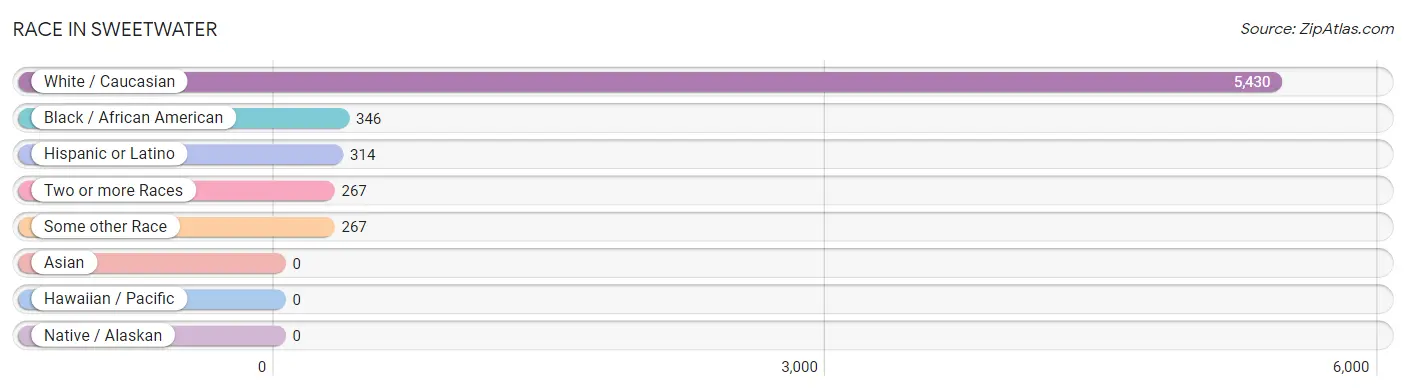
| Race | # Population | % Population |
| Asian | 0 | 0.0% |
| Black / African American | 346 | 5.5% |
| Hawaiian / Pacific | 0 | 0.0% |
| Hispanic or Latino | 314 | 5.0% |
| Native / Alaskan | 0 | 0.0% |
| White / Caucasian | 5,430 | 86.1% |
| Two or more Races | 267 | 4.2% |
| Some other Race | 267 | 4.2% |
| Total | 6,310 | 100.0% |
Ancestry in Sweetwater
The most populous ancestries reported in Sweetwater are German (546 | 8.6%), English (523 | 8.3%), American (521 | 8.3%), Irish (510 | 8.1%), and Mexican (267 | 4.2%), together accounting for 37.5% of all Sweetwater residents.
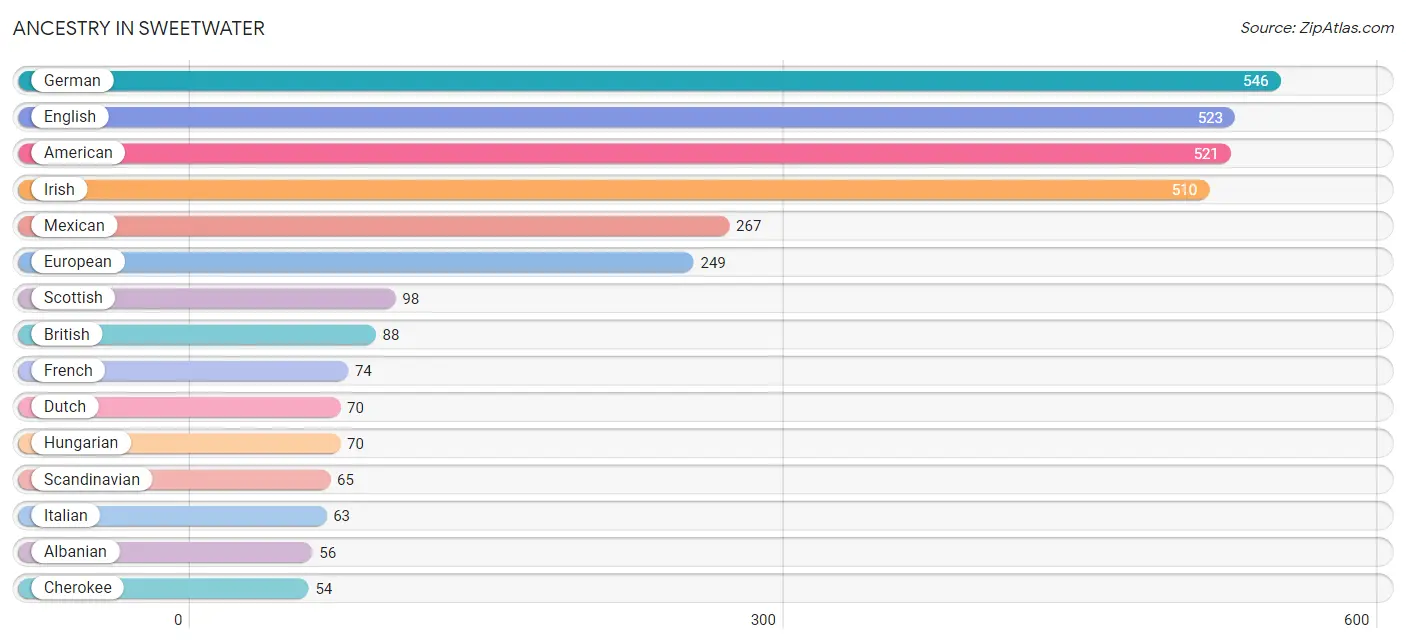
| Ancestry | # Population | % Population |
| Albanian | 56 | 0.9% |
| American | 521 | 8.3% |
| British | 88 | 1.4% |
| Canadian | 12 | 0.2% |
| Cherokee | 54 | 0.9% |
| Colombian | 15 | 0.2% |
| Dutch | 70 | 1.1% |
| English | 523 | 8.3% |
| European | 249 | 4.0% |
| French | 74 | 1.2% |
| German | 546 | 8.6% |
| Greek | 33 | 0.5% |
| Guamanian / Chamorro | 39 | 0.6% |
| Hungarian | 70 | 1.1% |
| Iranian | 18 | 0.3% |
| Irish | 510 | 8.1% |
| Italian | 63 | 1.0% |
| Laotian | 17 | 0.3% |
| Mexican | 267 | 4.2% |
| Norwegian | 8 | 0.1% |
| Polish | 24 | 0.4% |
| Puerto Rican | 32 | 0.5% |
| Scandinavian | 65 | 1.0% |
| Scotch-Irish | 50 | 0.8% |
| Scottish | 98 | 1.5% |
| South American | 15 | 0.2% |
| Swiss | 13 | 0.2% |
| Welsh | 19 | 0.3% | View All 28 Rows |
Immigrants in Sweetwater
The most numerous immigrant groups reported in Sweetwater came from Latin America (99 | 1.6%), Central America (84 | 1.3%), Mexico (84 | 1.3%), Europe (52 | 0.8%), and Eastern Europe (35 | 0.5%), together accounting for 5.6% of all Sweetwater residents.
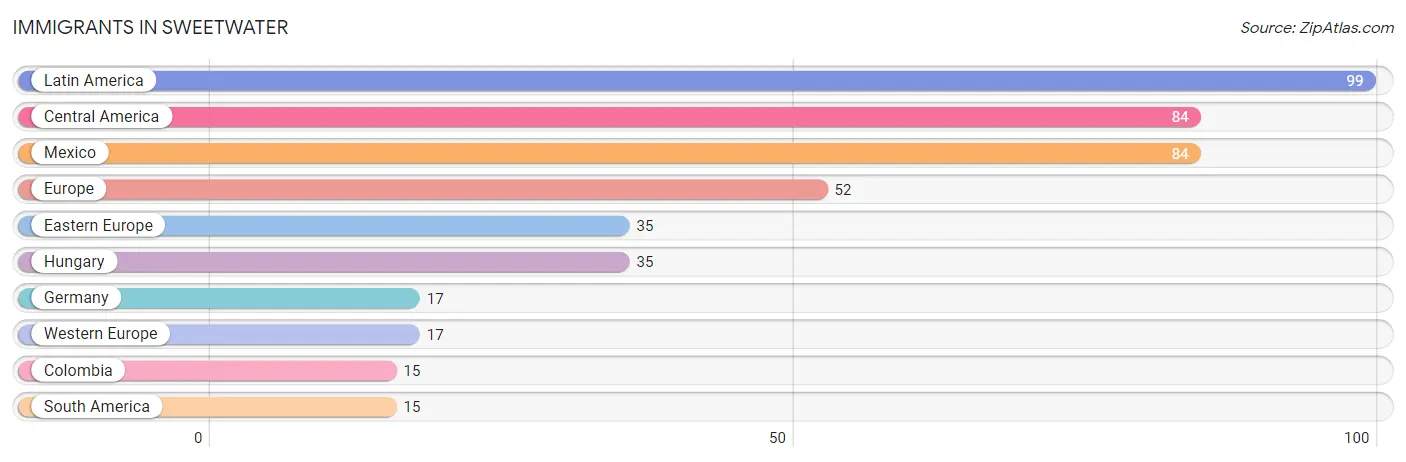
| Immigration Origin | # Population | % Population |
| Central America | 84 | 1.3% |
| Colombia | 15 | 0.2% |
| Eastern Europe | 35 | 0.5% |
| Europe | 52 | 0.8% |
| Germany | 17 | 0.3% |
| Hungary | 35 | 0.5% |
| Latin America | 99 | 1.6% |
| Mexico | 84 | 1.3% |
| South America | 15 | 0.2% |
| Western Europe | 17 | 0.3% | View All 10 Rows |
Sex and Age in Sweetwater
Sex and Age in Sweetwater
The most populous age groups in Sweetwater are 55 to 59 Years (265 | 9.3%) for men and 70 to 74 Years (413 | 11.9%) for women.
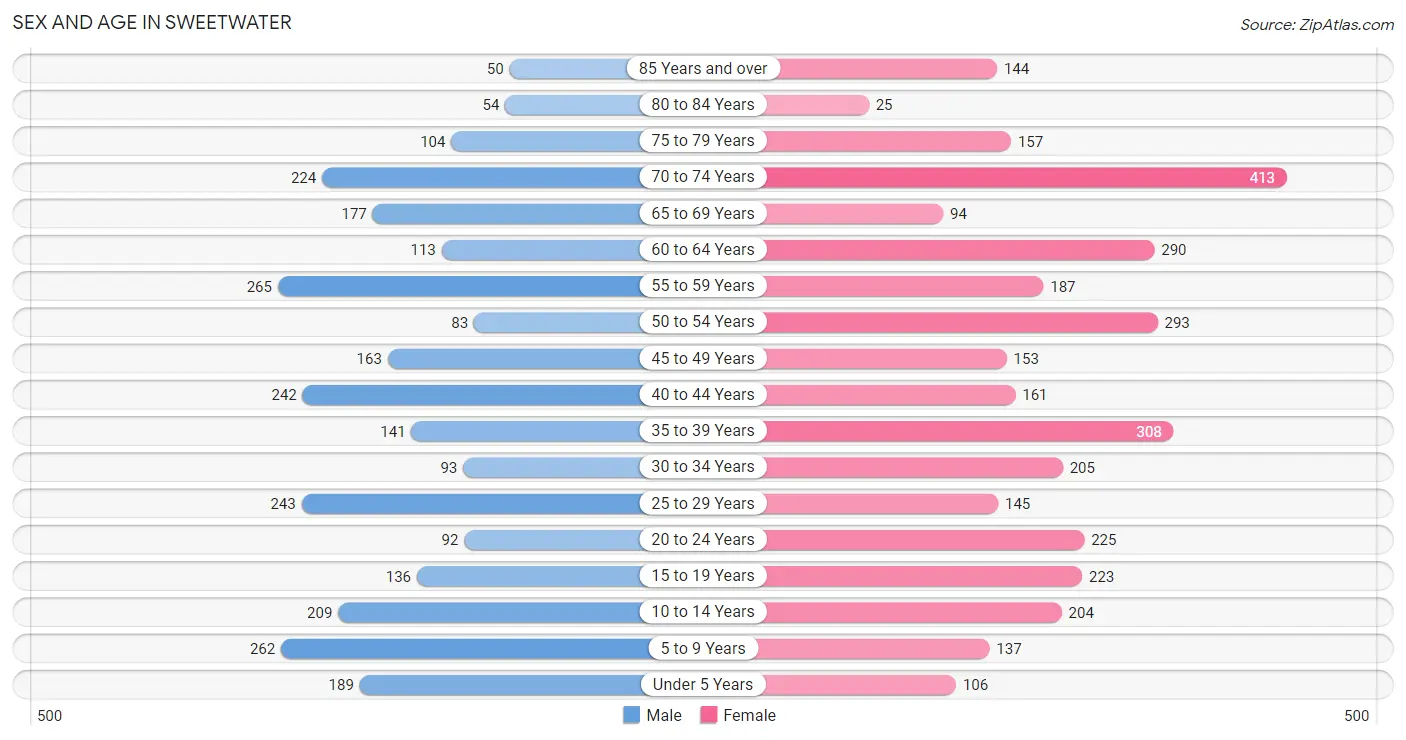
| Age Bracket | Male | Female |
| Under 5 Years | 189 (6.7%) | 106 (3.0%) |
| 5 to 9 Years | 262 (9.2%) | 137 (4.0%) |
| 10 to 14 Years | 209 (7.4%) | 204 (5.9%) |
| 15 to 19 Years | 136 (4.8%) | 223 (6.4%) |
| 20 to 24 Years | 92 (3.2%) | 225 (6.5%) |
| 25 to 29 Years | 243 (8.6%) | 145 (4.2%) |
| 30 to 34 Years | 93 (3.3%) | 205 (5.9%) |
| 35 to 39 Years | 141 (5.0%) | 308 (8.9%) |
| 40 to 44 Years | 242 (8.5%) | 161 (4.6%) |
| 45 to 49 Years | 163 (5.7%) | 153 (4.4%) |
| 50 to 54 Years | 83 (2.9%) | 293 (8.4%) |
| 55 to 59 Years | 265 (9.3%) | 187 (5.4%) |
| 60 to 64 Years | 113 (4.0%) | 290 (8.4%) |
| 65 to 69 Years | 177 (6.2%) | 94 (2.7%) |
| 70 to 74 Years | 224 (7.9%) | 413 (11.9%) |
| 75 to 79 Years | 104 (3.7%) | 157 (4.5%) |
| 80 to 84 Years | 54 (1.9%) | 25 (0.7%) |
| 85 Years and over | 50 (1.8%) | 144 (4.2%) |
| Total | 2,840 (100.0%) | 3,470 (100.0%) |
Families and Households in Sweetwater
Median Family Size in Sweetwater
The median family size in Sweetwater is 2.90 persons per family, with married-couple families (983 | 62.3%) accounting for the largest median family size of 3.35 persons per family. On the other hand, single male/father families (80 | 5.1%) represent the smallest median family size with 1.94 persons per family.
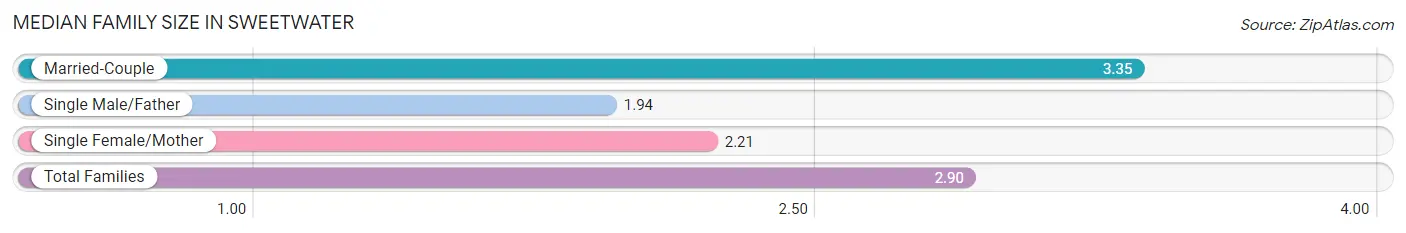
| Family Type | # Families | Family Size |
| Married-Couple | 983 (62.3%) | 3.35 |
| Single Male/Father | 80 (5.1%) | 1.94 |
| Single Female/Mother | 516 (32.7%) | 2.21 |
| Total Families | 1,579 (100.0%) | 2.90 |
Median Household Size in Sweetwater
The median household size in Sweetwater is 2.22 persons per household, with married-couple households (983 | 35.6%) accounting for the largest median household size of 3.4 persons per household. non-family households (1,183 | 42.8%) represent the smallest median household size with 1.13 persons per household.
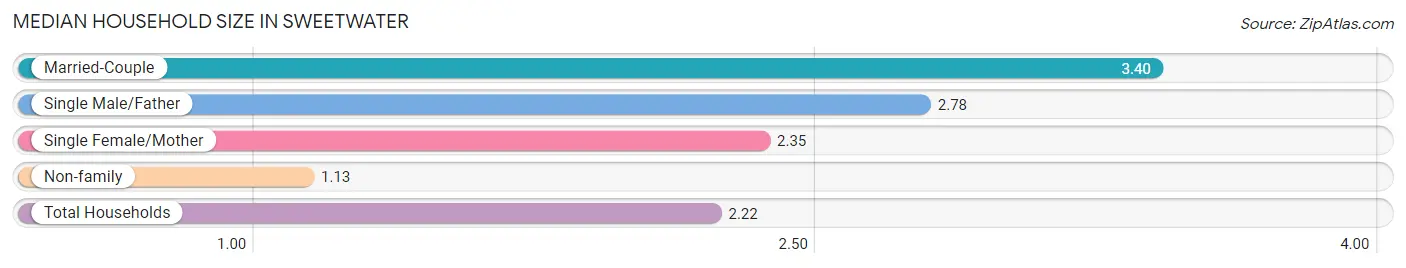
| Household Type | # Households | Household Size |
| Married-Couple | 983 (35.6%) | 3.40 |
| Single Male/Father | 80 (2.9%) | 2.78 |
| Single Female/Mother | 516 (18.7%) | 2.35 |
| Non-family | 1,183 (42.8%) | 1.13 |
| Total Households | 2,762 (100.0%) | 2.22 |
Household Size by Marriage Status in Sweetwater
Out of a total of 2,762 households in Sweetwater, 1,579 (57.2%) are family households, while 1,183 (42.8%) are nonfamily households. The most numerous type of family households are 2-person households, comprising 635, and the most common type of nonfamily households are 1-person households, comprising 1,045.
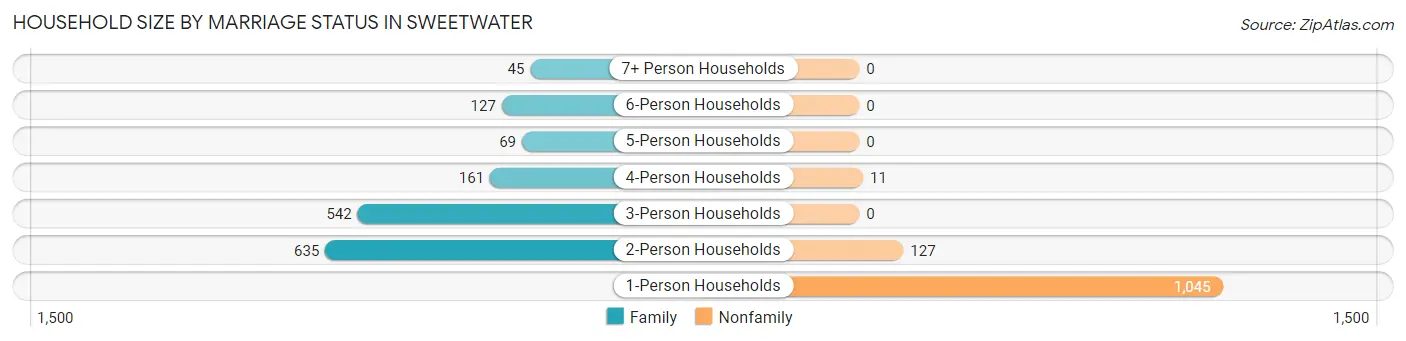
| Household Size | Family Households | Nonfamily Households |
| 1-Person Households | - | 1,045 (37.8%) |
| 2-Person Households | 635 (23.0%) | 127 (4.6%) |
| 3-Person Households | 542 (19.6%) | 0 (0.0%) |
| 4-Person Households | 161 (5.8%) | 11 (0.4%) |
| 5-Person Households | 69 (2.5%) | 0 (0.0%) |
| 6-Person Households | 127 (4.6%) | 0 (0.0%) |
| 7+ Person Households | 45 (1.6%) | 0 (0.0%) |
| Total | 1,579 (57.2%) | 1,183 (42.8%) |
Female Fertility in Sweetwater
Fertility by Age in Sweetwater
Average fertility rate in Sweetwater is 58.0 births per 1,000 women. Women in the age bracket of 20 to 34 years have the highest fertility rate with 155.0 births per 1,000 women. Women in the age bracket of 20 to 34 years acount for 100.0% of all women with births.
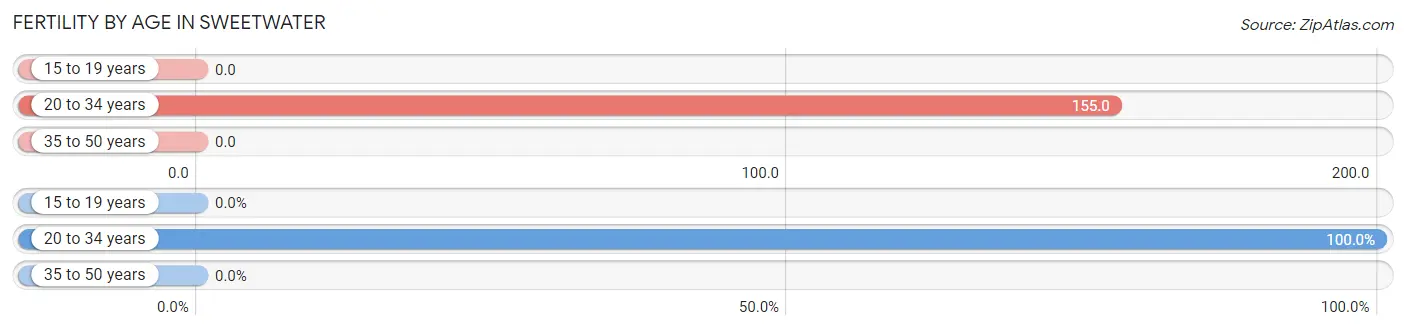
| Age Bracket | Women with Births | Births / 1,000 Women |
| 15 to 19 years | 0 (0.0%) | 0.0 |
| 20 to 34 years | 89 (100.0%) | 155.0 |
| 35 to 50 years | 0 (0.0%) | 0.0 |
| Total | 89 (100.0%) | 58.0 |
Fertility by Age by Marriage Status in Sweetwater
80.9% of women with births (89) in Sweetwater are married. The highest percentage of unmarried women with births falls into 20 to 34 years age bracket with 19.1% of them unmarried at the time of birth, while the lowest percentage of unmarried women with births belong to 20 to 34 years age bracket with 19.1% of them unmarried.
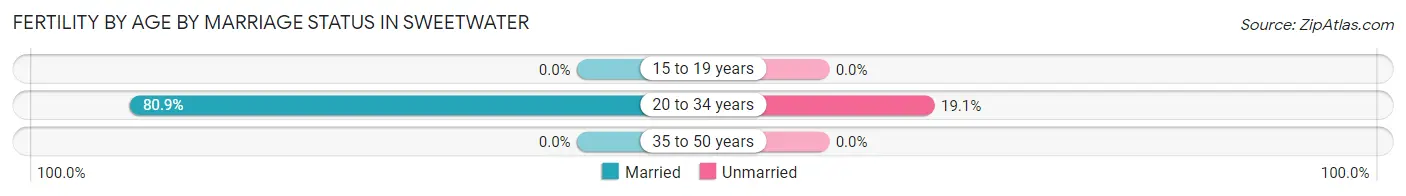
| Age Bracket | Married | Unmarried |
| 15 to 19 years | 0 (0.0%) | 0 (0.0%) |
| 20 to 34 years | 72 (80.9%) | 17 (19.1%) |
| 35 to 50 years | 0 (0.0%) | 0 (0.0%) |
| Total | 72 (80.9%) | 17 (19.1%) |
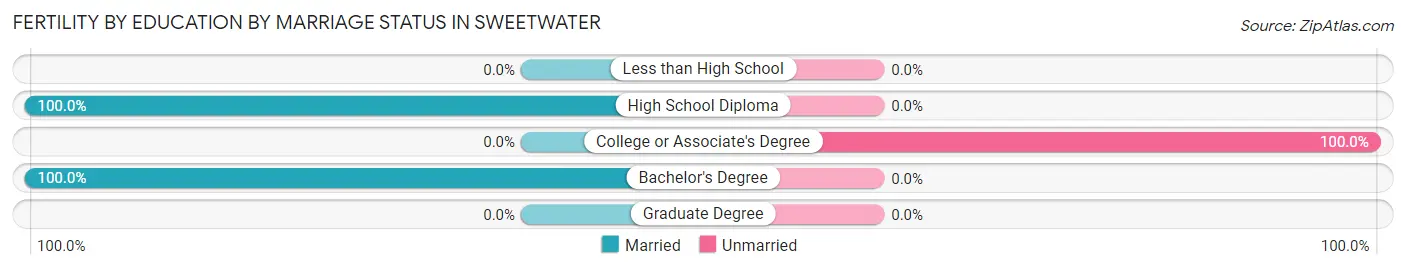
Fertility by Education in Sweetwater
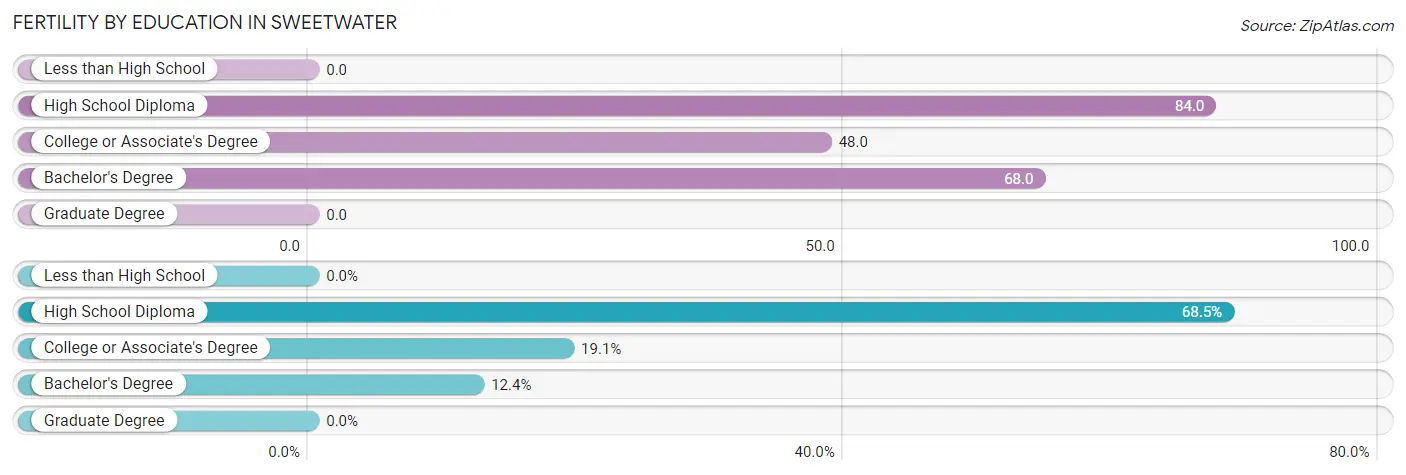
| Educational Attainment | Women with Births | Births / 1,000 Women |
| Less than High School | 0 (0.0%) | 0.0 |
| High School Diploma | 61 (68.5%) | 84.0 |
| College or Associate's Degree | 17 (19.1%) | 48.0 |
| Bachelor's Degree | 11 (12.4%) | 68.0 |
| Graduate Degree | 0 (0.0%) | 0.0 |
| Total | 89 (100.0%) | 58.0 |
Fertility by Education by Marriage Status in Sweetwater
19.1% of women with births in Sweetwater are unmarried. Women with the educational attainment of high school diploma are most likely to be married with 100.0% of them married at childbirth, while women with the educational attainment of college or associate's degree are least likely to be married with 100.0% of them unmarried at childbirth.
| Educational Attainment | Married | Unmarried |
| Less than High School | 0 (0.0%) | 0 (0.0%) |
| High School Diploma | 61 (100.0%) | 0 (0.0%) |
| College or Associate's Degree | 0 (0.0%) | 17 (100.0%) |
| Bachelor's Degree | 11 (100.0%) | 0 (0.0%) |
| Graduate Degree | 0 (0.0%) | 0 (0.0%) |
| Total | 72 (80.9%) | 17 (19.1%) |
Employment Characteristics in Sweetwater
Employment by Class of Employer in Sweetwater
Among the 2,381 employed individuals in Sweetwater, private company employees (1,811 | 76.1%), self-employed (not incorporated) (240 | 10.1%), and local government employees (226 | 9.5%) make up the most common classes of employment.
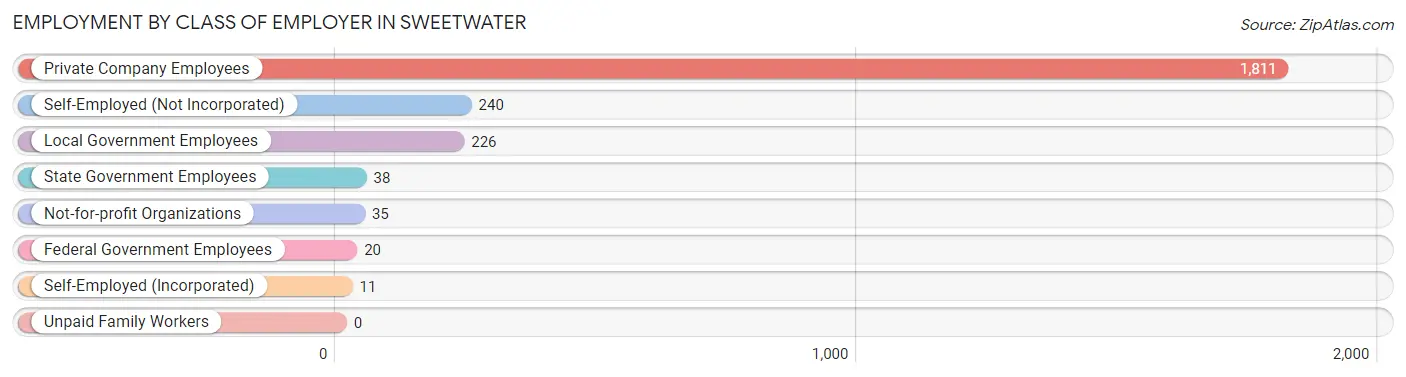
| Employer Class | # Employees | % Employees |
| Private Company Employees | 1,811 | 76.1% |
| Self-Employed (Incorporated) | 11 | 0.5% |
| Self-Employed (Not Incorporated) | 240 | 10.1% |
| Not-for-profit Organizations | 35 | 1.5% |
| Local Government Employees | 226 | 9.5% |
| State Government Employees | 38 | 1.6% |
| Federal Government Employees | 20 | 0.8% |
| Unpaid Family Workers | 0 | 0.0% |
| Total | 2,381 | 100.0% |
Employment Status by Age in Sweetwater
According to the labor force statistics for Sweetwater, out of the total population over 16 years of age (5,184), 50.7% or 2,628 individuals are in the labor force, with 9.4% or 247 of them unemployed. The age group with the highest labor force participation rate is 20 to 24 years, with 97.2% or 308 individuals in the labor force. Within the labor force, the 16 to 19 years age range has the highest percentage of unemployed individuals, with 26.3% or 36 of them being unemployed.
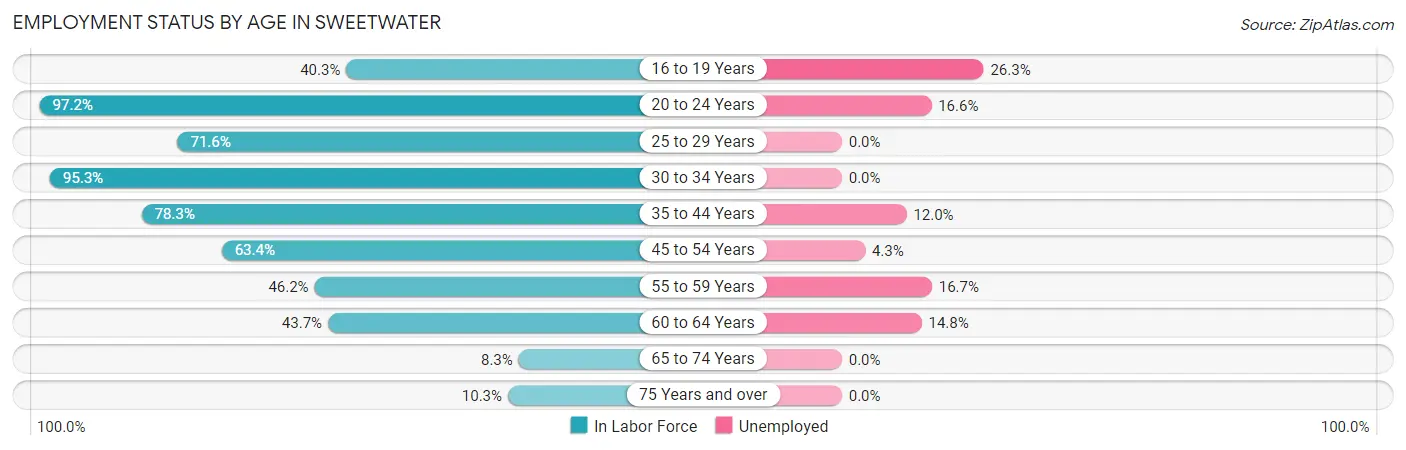
| Age Bracket | In Labor Force | Unemployed |
| 16 to 19 Years | 137 (40.3%) | 36 (26.3%) |
| 20 to 24 Years | 308 (97.2%) | 51 (16.6%) |
| 25 to 29 Years | 278 (71.6%) | 0 (0.0%) |
| 30 to 34 Years | 284 (95.3%) | 0 (0.0%) |
| 35 to 44 Years | 667 (78.3%) | 80 (12.0%) |
| 45 to 54 Years | 439 (63.4%) | 19 (4.3%) |
| 55 to 59 Years | 209 (46.2%) | 35 (16.7%) |
| 60 to 64 Years | 176 (43.7%) | 26 (14.8%) |
| 65 to 74 Years | 75 (8.3%) | 0 (0.0%) |
| 75 Years and over | 55 (10.3%) | 0 (0.0%) |
| Total | 2,628 (50.7%) | 247 (9.4%) |
Employment Status by Educational Attainment in Sweetwater
According to labor force statistics for Sweetwater, 66.5% of individuals (2,052) out of the total population between 25 and 64 years of age (3,085) are in the labor force, with 7.8% or 160 of them being unemployed. The group with the highest labor force participation rate are those with the educational attainment of bachelor's degree or higher, with 87.6% or 446 individuals in the labor force. Within the labor force, individuals with high school diploma education have the highest percentage of unemployment, with 13.2% or 125 of them being unemployed.
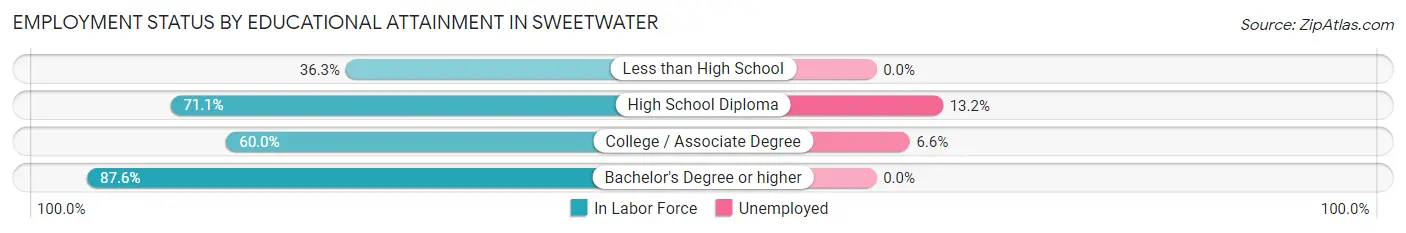
| Educational Attainment | In Labor Force | Unemployed |
| Less than High School | 132 (36.3%) | 0 (0.0%) |
| High School Diploma | 947 (71.1%) | 176 (13.2%) |
| College / Associate Degree | 528 (60.0%) | 58 (6.6%) |
| Bachelor's Degree or higher | 446 (87.6%) | 0 (0.0%) |
| Total | 2,052 (66.5%) | 241 (7.8%) |
Employment Occupations by Sex in Sweetwater
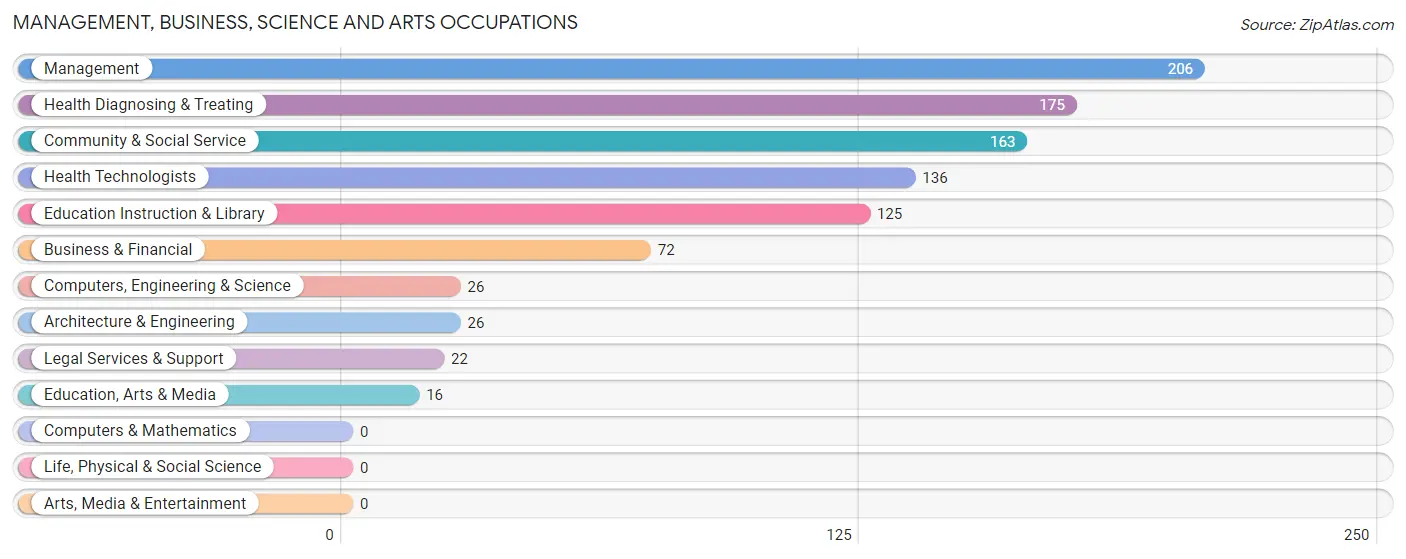
Management, Business, Science and Arts Occupations
The most common Management, Business, Science and Arts occupations in Sweetwater are Management (206 | 8.6%), Health Diagnosing & Treating (175 | 7.3%), Community & Social Service (163 | 6.9%), Health Technologists (136 | 5.7%), and Education Instruction & Library (125 | 5.2%).
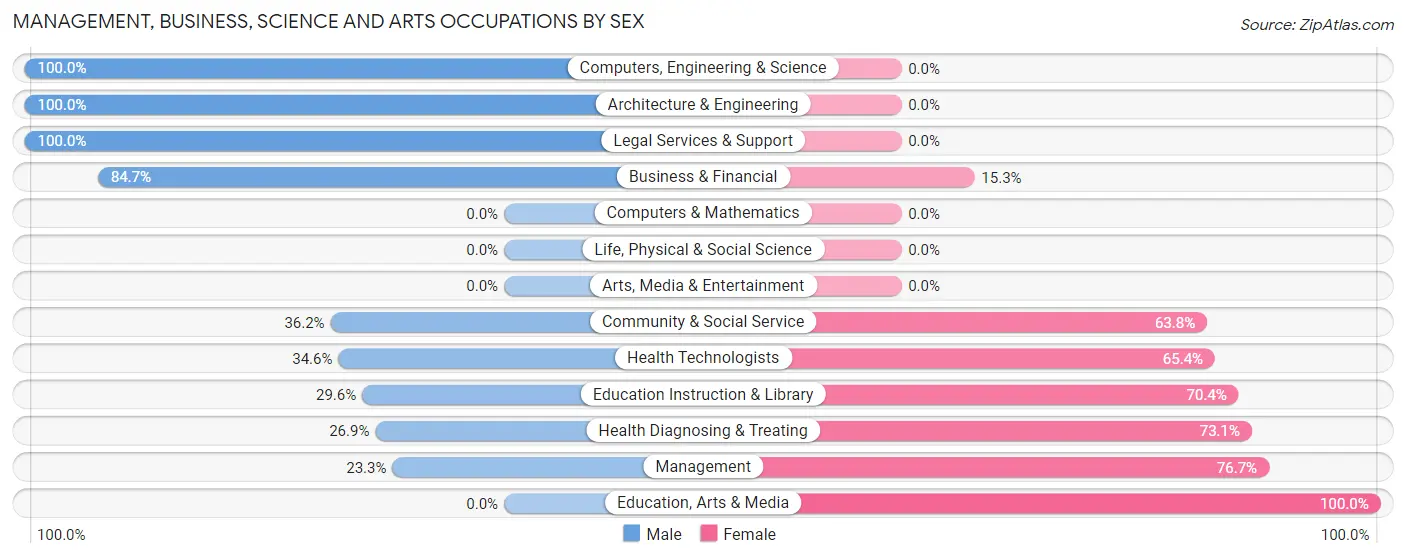
Management, Business, Science and Arts Occupations by Sex
Within the Management, Business, Science and Arts occupations in Sweetwater, the most male-oriented occupations are Computers, Engineering & Science (100.0%), Architecture & Engineering (100.0%), and Legal Services & Support (100.0%), while the most female-oriented occupations are Education, Arts & Media (100.0%), Management (76.7%), and Health Diagnosing & Treating (73.1%).
| Occupation | Male | Female |
| Management | 48 (23.3%) | 158 (76.7%) |
| Business & Financial | 61 (84.7%) | 11 (15.3%) |
| Computers, Engineering & Science | 26 (100.0%) | 0 (0.0%) |
| Computers & Mathematics | 0 (0.0%) | 0 (0.0%) |
| Architecture & Engineering | 26 (100.0%) | 0 (0.0%) |
| Life, Physical & Social Science | 0 (0.0%) | 0 (0.0%) |
| Community & Social Service | 59 (36.2%) | 104 (63.8%) |
| Education, Arts & Media | 0 (0.0%) | 16 (100.0%) |
| Legal Services & Support | 22 (100.0%) | 0 (0.0%) |
| Education Instruction & Library | 37 (29.6%) | 88 (70.4%) |
| Arts, Media & Entertainment | 0 (0.0%) | 0 (0.0%) |
| Health Diagnosing & Treating | 47 (26.9%) | 128 (73.1%) |
| Health Technologists | 47 (34.6%) | 89 (65.4%) |
| Total (Category) | 241 (37.5%) | 401 (62.5%) |
| Total (Overall) | 1,139 (47.8%) | 1,242 (52.2%) |
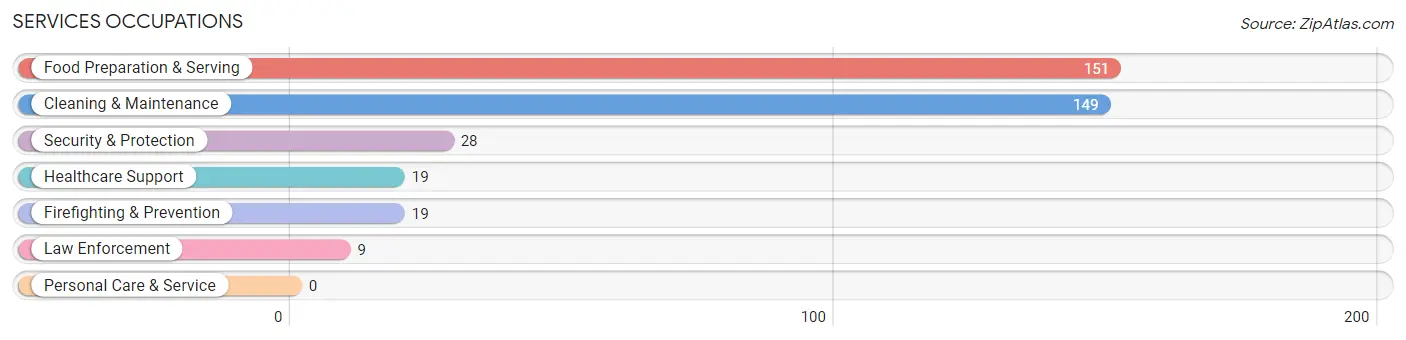
Services Occupations
The most common Services occupations in Sweetwater are Food Preparation & Serving (151 | 6.3%), Cleaning & Maintenance (149 | 6.3%), Security & Protection (28 | 1.2%), Healthcare Support (19 | 0.8%), and Firefighting & Prevention (19 | 0.8%).
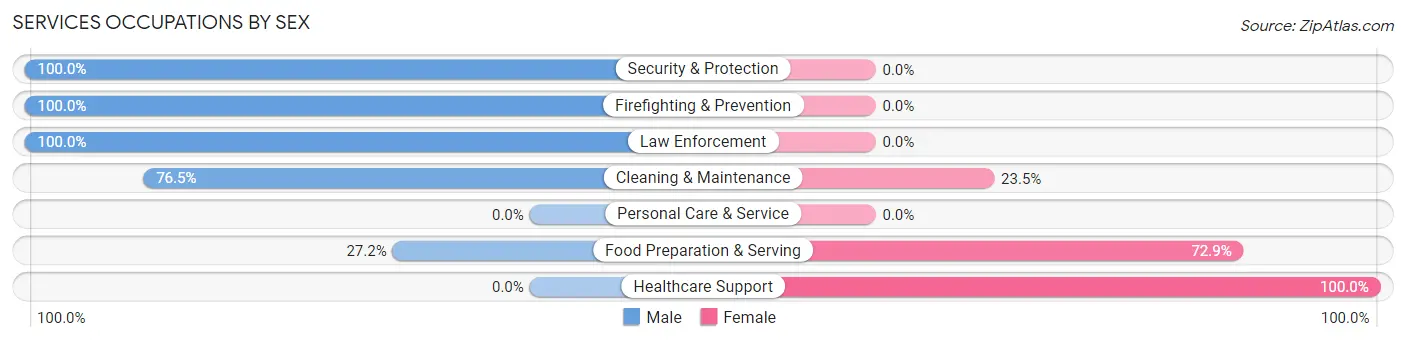
Services Occupations by Sex
Within the Services occupations in Sweetwater, the most male-oriented occupations are Security & Protection (100.0%), Firefighting & Prevention (100.0%), and Law Enforcement (100.0%), while the most female-oriented occupations are Healthcare Support (100.0%), Food Preparation & Serving (72.9%), and Cleaning & Maintenance (23.5%).
| Occupation | Male | Female |
| Healthcare Support | 0 (0.0%) | 19 (100.0%) |
| Security & Protection | 28 (100.0%) | 0 (0.0%) |
| Firefighting & Prevention | 19 (100.0%) | 0 (0.0%) |
| Law Enforcement | 9 (100.0%) | 0 (0.0%) |
| Food Preparation & Serving | 41 (27.2%) | 110 (72.9%) |
| Cleaning & Maintenance | 114 (76.5%) | 35 (23.5%) |
| Personal Care & Service | 0 (0.0%) | 0 (0.0%) |
| Total (Category) | 183 (52.7%) | 164 (47.3%) |
| Total (Overall) | 1,139 (47.8%) | 1,242 (52.2%) |
Sales and Office Occupations
The most common Sales and Office occupations in Sweetwater are Office & Administration (385 | 16.2%), and Sales & Related (154 | 6.5%).
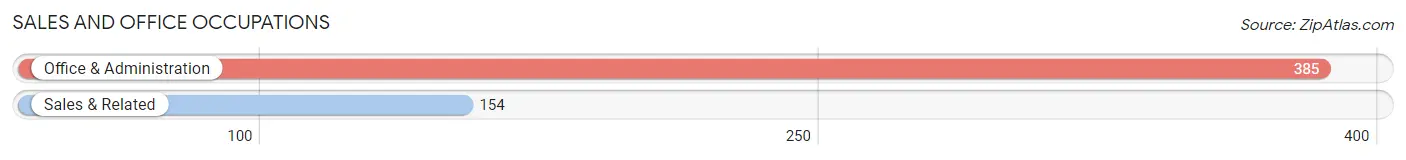
Sales and Office Occupations by Sex
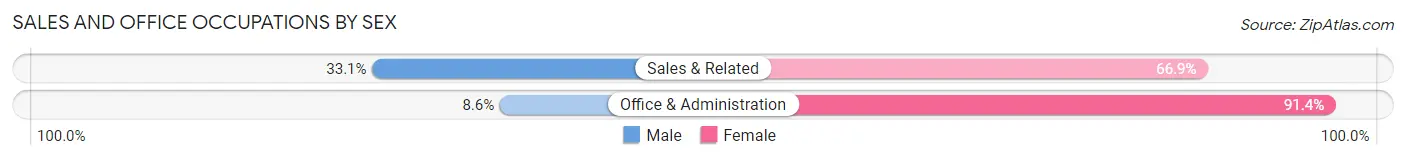
| Occupation | Male | Female |
| Sales & Related | 51 (33.1%) | 103 (66.9%) |
| Office & Administration | 33 (8.6%) | 352 (91.4%) |
| Total (Category) | 84 (15.6%) | 455 (84.4%) |
| Total (Overall) | 1,139 (47.8%) | 1,242 (52.2%) |
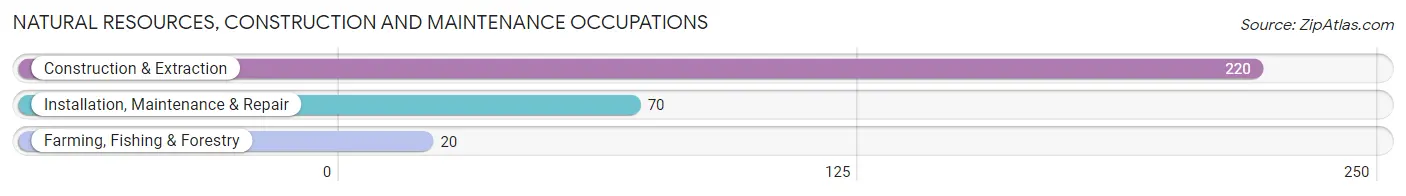
Natural Resources, Construction and Maintenance Occupations
The most common Natural Resources, Construction and Maintenance occupations in Sweetwater are Construction & Extraction (220 | 9.2%), Installation, Maintenance & Repair (70 | 2.9%), and Farming, Fishing & Forestry (20 | 0.8%).
Natural Resources, Construction and Maintenance Occupations by Sex
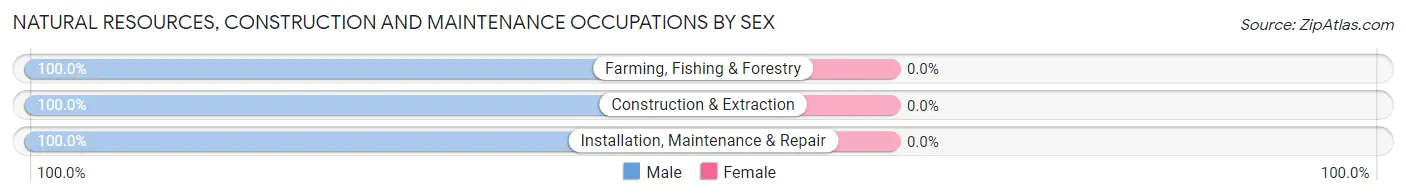
| Occupation | Male | Female |
| Farming, Fishing & Forestry | 20 (100.0%) | 0 (0.0%) |
| Construction & Extraction | 220 (100.0%) | 0 (0.0%) |
| Installation, Maintenance & Repair | 70 (100.0%) | 0 (0.0%) |
| Total (Category) | 310 (100.0%) | 0 (0.0%) |
| Total (Overall) | 1,139 (47.8%) | 1,242 (52.2%) |
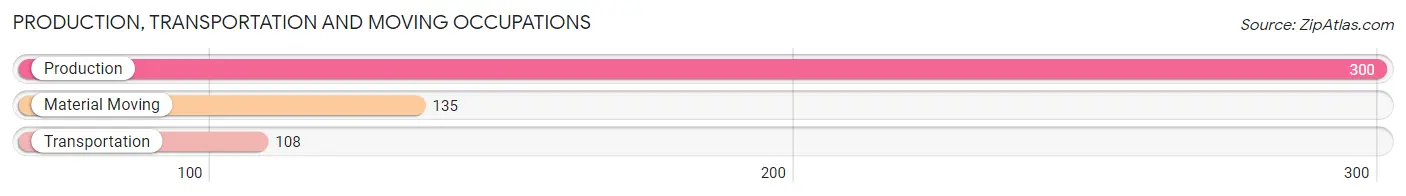
Production, Transportation and Moving Occupations
The most common Production, Transportation and Moving occupations in Sweetwater are Production (300 | 12.6%), Material Moving (135 | 5.7%), and Transportation (108 | 4.5%).
Production, Transportation and Moving Occupations by Sex
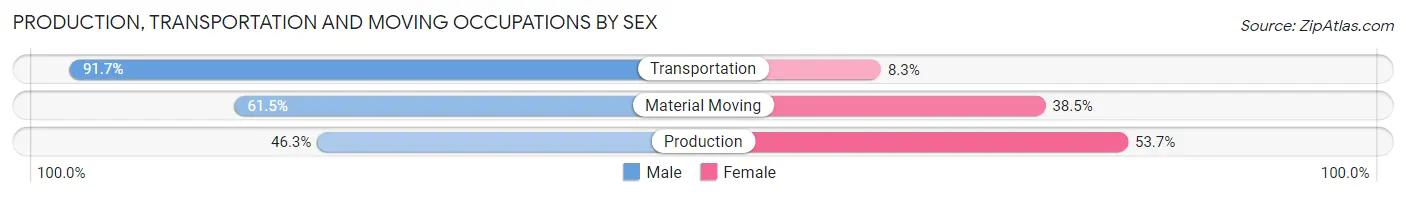
| Occupation | Male | Female |
| Production | 139 (46.3%) | 161 (53.7%) |
| Transportation | 99 (91.7%) | 9 (8.3%) |
| Material Moving | 83 (61.5%) | 52 (38.5%) |
| Total (Category) | 321 (59.1%) | 222 (40.9%) |
| Total (Overall) | 1,139 (47.8%) | 1,242 (52.2%) |
Employment Industries by Sex in Sweetwater
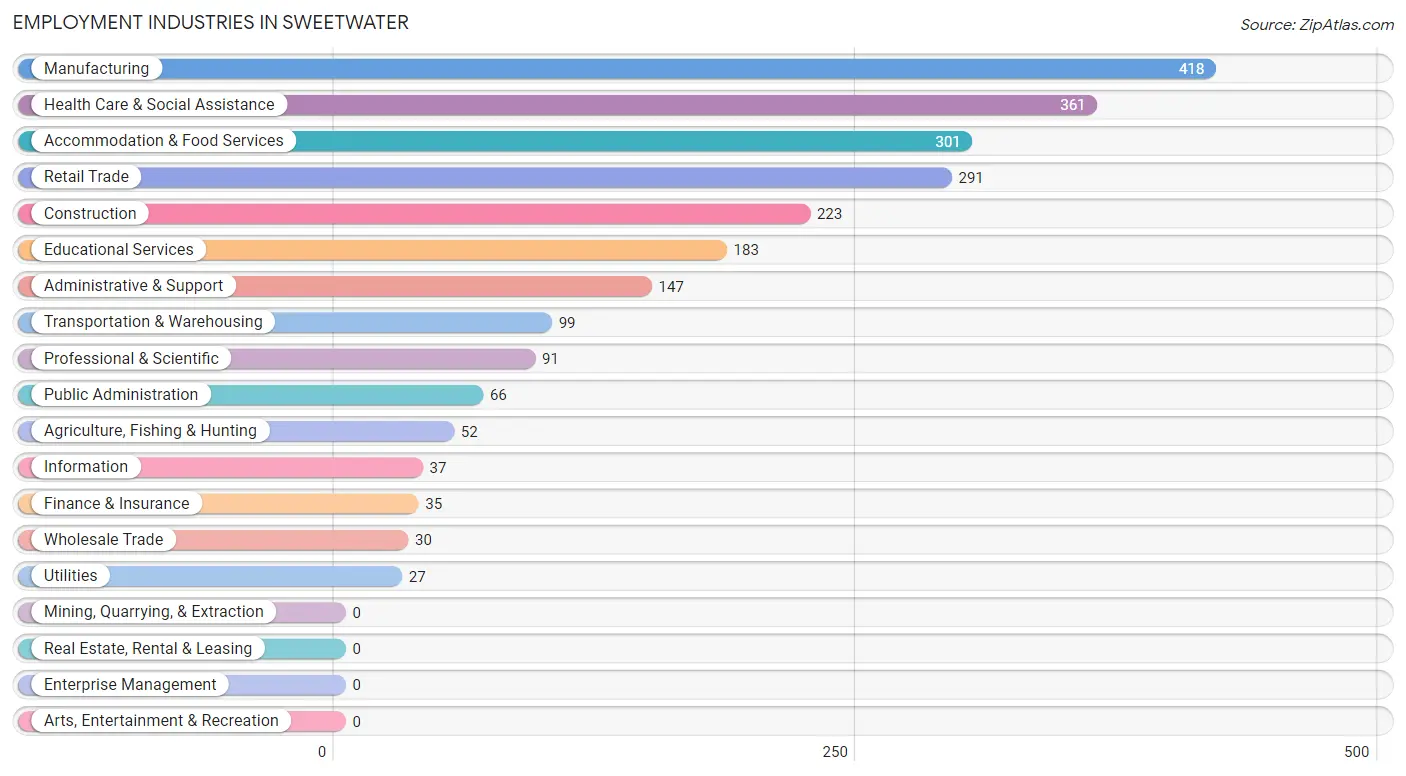
Employment Industries in Sweetwater
The major employment industries in Sweetwater include Manufacturing (418 | 17.6%), Health Care & Social Assistance (361 | 15.2%), Accommodation & Food Services (301 | 12.6%), Retail Trade (291 | 12.2%), and Construction (223 | 9.4%).
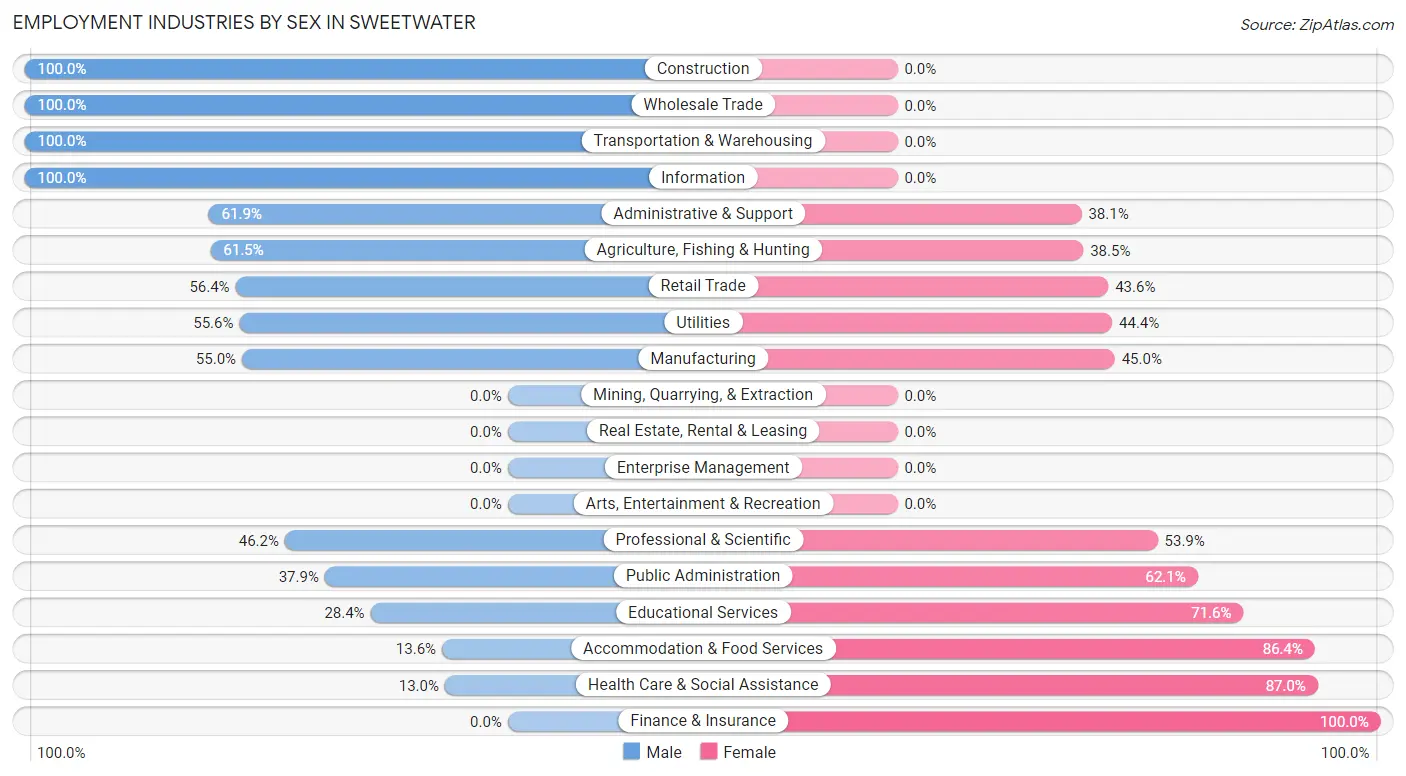
Employment Industries by Sex in Sweetwater
The Sweetwater industries that see more men than women are Construction (100.0%), Wholesale Trade (100.0%), and Transportation & Warehousing (100.0%), whereas the industries that tend to have a higher number of women are Finance & Insurance (100.0%), Health Care & Social Assistance (87.0%), and Accommodation & Food Services (86.4%).
| Industry | Male | Female |
| Agriculture, Fishing & Hunting | 32 (61.5%) | 20 (38.5%) |
| Mining, Quarrying, & Extraction | 0 (0.0%) | 0 (0.0%) |
| Construction | 223 (100.0%) | 0 (0.0%) |
| Manufacturing | 230 (55.0%) | 188 (45.0%) |
| Wholesale Trade | 30 (100.0%) | 0 (0.0%) |
| Retail Trade | 164 (56.4%) | 127 (43.6%) |
| Transportation & Warehousing | 99 (100.0%) | 0 (0.0%) |
| Utilities | 15 (55.6%) | 12 (44.4%) |
| Information | 37 (100.0%) | 0 (0.0%) |
| Finance & Insurance | 0 (0.0%) | 35 (100.0%) |
| Real Estate, Rental & Leasing | 0 (0.0%) | 0 (0.0%) |
| Professional & Scientific | 42 (46.2%) | 49 (53.8%) |
| Enterprise Management | 0 (0.0%) | 0 (0.0%) |
| Administrative & Support | 91 (61.9%) | 56 (38.1%) |
| Educational Services | 52 (28.4%) | 131 (71.6%) |
| Health Care & Social Assistance | 47 (13.0%) | 314 (87.0%) |
| Arts, Entertainment & Recreation | 0 (0.0%) | 0 (0.0%) |
| Accommodation & Food Services | 41 (13.6%) | 260 (86.4%) |
| Public Administration | 25 (37.9%) | 41 (62.1%) |
| Total | 1,139 (47.8%) | 1,242 (52.2%) |
Education in Sweetwater
School Enrollment in Sweetwater
The most common levels of schooling among the 1,260 students in Sweetwater are elementary school (409 | 32.5%), high school (336 | 26.7%), and middle school (274 | 21.7%).
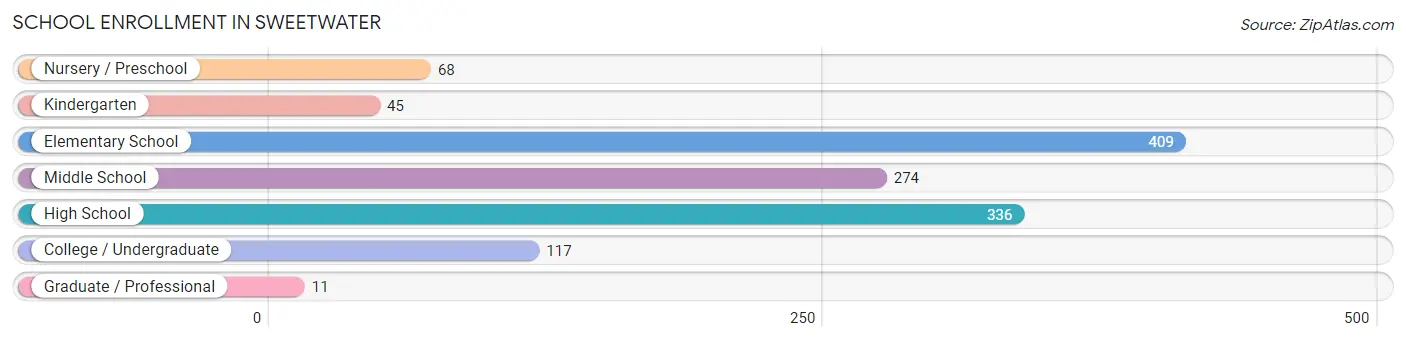
| School Level | # Students | % Students |
| Nursery / Preschool | 68 | 5.4% |
| Kindergarten | 45 | 3.6% |
| Elementary School | 409 | 32.5% |
| Middle School | 274 | 21.7% |
| High School | 336 | 26.7% |
| College / Undergraduate | 117 | 9.3% |
| Graduate / Professional | 11 | 0.9% |
| Total | 1,260 | 100.0% |
School Enrollment by Age by Funding Source in Sweetwater
Out of a total of 1,260 students who are enrolled in schools in Sweetwater, 105 (8.3%) attend a private institution, while the remaining 1,155 (91.7%) are enrolled in public schools. The age group of 25 to 34 year olds has the highest likelihood of being enrolled in private schools, with 38 (52.8% in the age bracket) enrolled. Conversely, the age group of 5 to 9 year old has the lowest likelihood of being enrolled in a private school, with 380 (100.0% in the age bracket) attending a public institution.
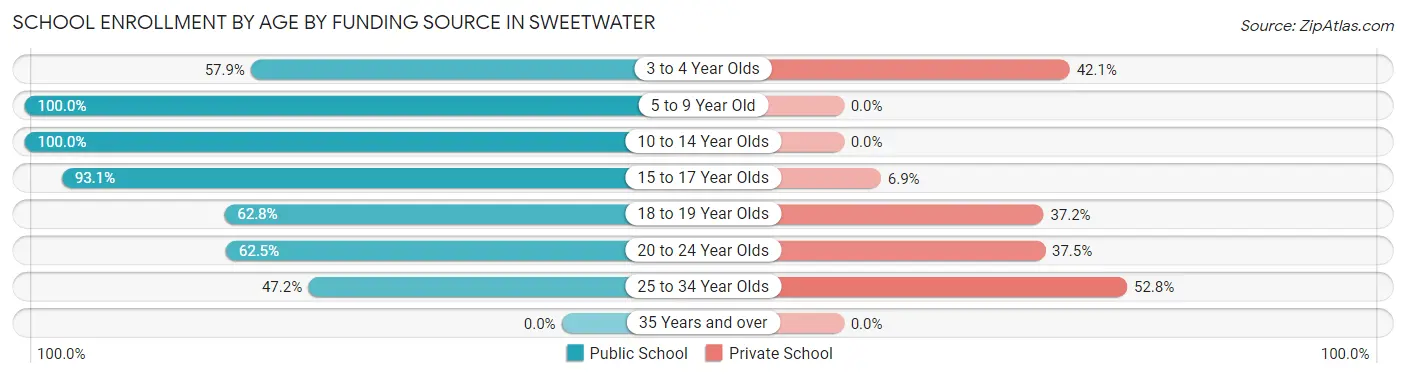
| Age Bracket | Public School | Private School |
| 3 to 4 Year Olds | 22 (57.9%) | 16 (42.1%) |
| 5 to 9 Year Old | 380 (100.0%) | 0 (0.0%) |
| 10 to 14 Year Olds | 413 (100.0%) | 0 (0.0%) |
| 15 to 17 Year Olds | 255 (93.1%) | 19 (6.9%) |
| 18 to 19 Year Olds | 27 (62.8%) | 16 (37.2%) |
| 20 to 24 Year Olds | 25 (62.5%) | 15 (37.5%) |
| 25 to 34 Year Olds | 34 (47.2%) | 38 (52.8%) |
| 35 Years and over | 0 (0.0%) | 0 (0.0%) |
| Total | 1,155 (91.7%) | 105 (8.3%) |
Educational Attainment by Field of Study in Sweetwater
Business (196 | 22.6%), science & technology (129 | 14.9%), education (122 | 14.1%), social sciences (68 | 7.8%), and communications (50 | 5.8%) are the most common fields of study among 868 individuals in Sweetwater who have obtained a bachelor's degree or higher.
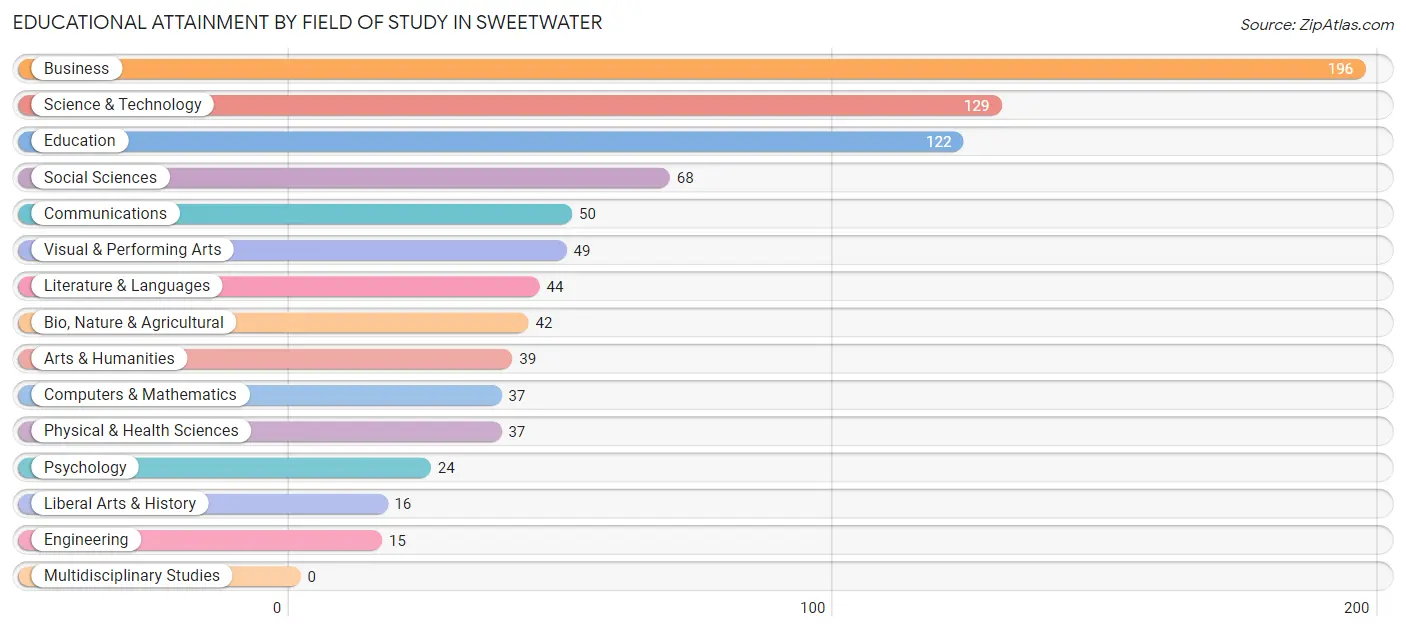
| Field of Study | # Graduates | % Graduates |
| Computers & Mathematics | 37 | 4.3% |
| Bio, Nature & Agricultural | 42 | 4.8% |
| Physical & Health Sciences | 37 | 4.3% |
| Psychology | 24 | 2.8% |
| Social Sciences | 68 | 7.8% |
| Engineering | 15 | 1.7% |
| Multidisciplinary Studies | 0 | 0.0% |
| Science & Technology | 129 | 14.9% |
| Business | 196 | 22.6% |
| Education | 122 | 14.1% |
| Literature & Languages | 44 | 5.1% |
| Liberal Arts & History | 16 | 1.8% |
| Visual & Performing Arts | 49 | 5.7% |
| Communications | 50 | 5.8% |
| Arts & Humanities | 39 | 4.5% |
| Total | 868 | 100.0% |
Transportation & Commute in Sweetwater
Vehicle Availability by Sex in Sweetwater
The most prevalent vehicle ownership categories in Sweetwater are males with 2 vehicles (409, accounting for 35.9%) and females with 2 vehicles (272, making up 32.9%).
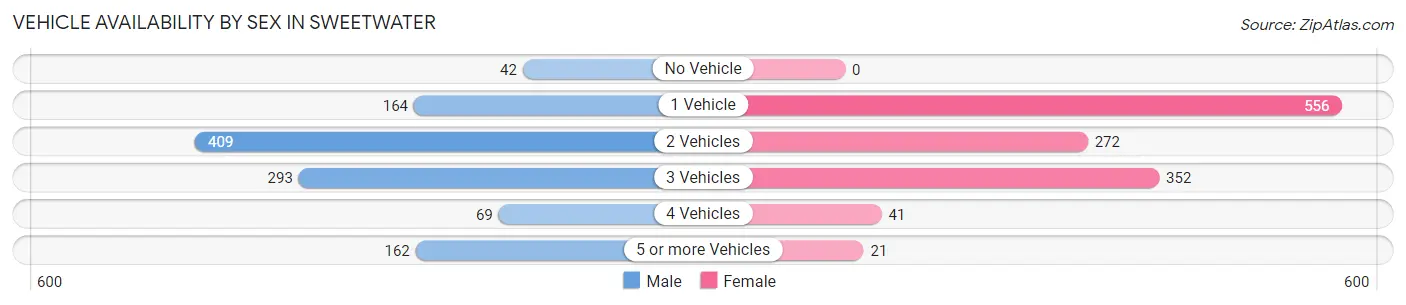
| Vehicles Available | Male | Female |
| No Vehicle | 42 (3.7%) | 0 (0.0%) |
| 1 Vehicle | 164 (14.4%) | 556 (44.8%) |
| 2 Vehicles | 409 (35.9%) | 272 (21.9%) |
| 3 Vehicles | 293 (25.7%) | 352 (28.3%) |
| 4 Vehicles | 69 (6.1%) | 41 (3.3%) |
| 5 or more Vehicles | 162 (14.2%) | 21 (1.7%) |
| Total | 1,139 (100.0%) | 1,242 (100.0%) |
Commute Time in Sweetwater
The most frequently occuring commute durations in Sweetwater are 20 to 24 minutes (437 commuters, 18.5%), 15 to 19 minutes (426 commuters, 18.1%), and 30 to 34 minutes (365 commuters, 15.5%).
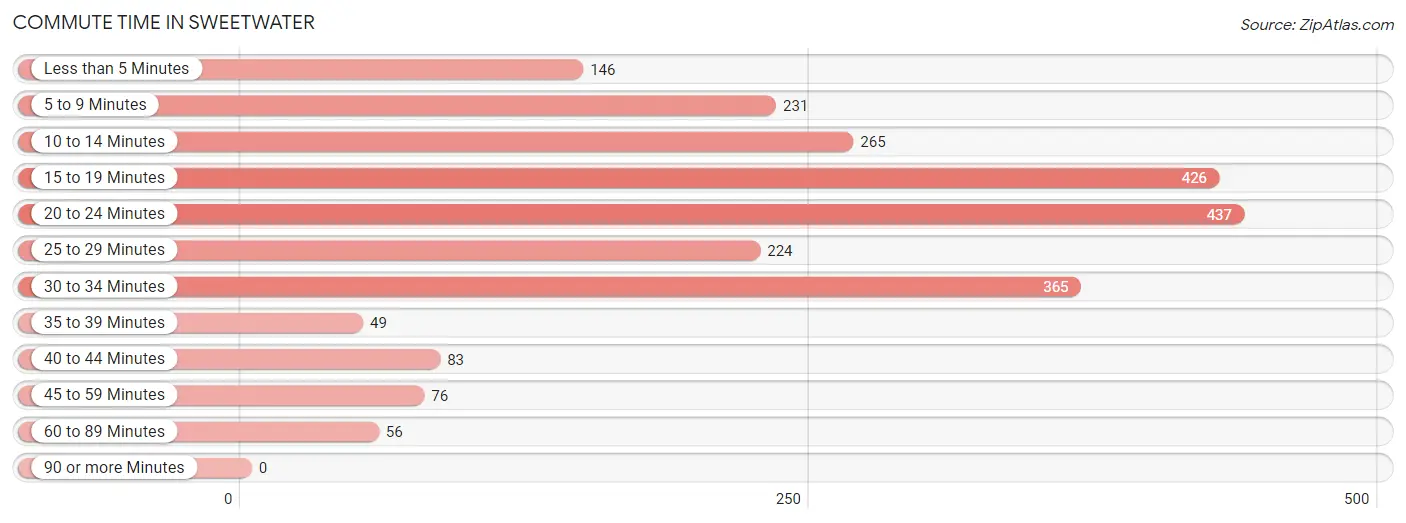
| Commute Time | # Commuters | % Commuters |
| Less than 5 Minutes | 146 | 6.2% |
| 5 to 9 Minutes | 231 | 9.8% |
| 10 to 14 Minutes | 265 | 11.2% |
| 15 to 19 Minutes | 426 | 18.1% |
| 20 to 24 Minutes | 437 | 18.5% |
| 25 to 29 Minutes | 224 | 9.5% |
| 30 to 34 Minutes | 365 | 15.5% |
| 35 to 39 Minutes | 49 | 2.1% |
| 40 to 44 Minutes | 83 | 3.5% |
| 45 to 59 Minutes | 76 | 3.2% |
| 60 to 89 Minutes | 56 | 2.4% |
| 90 or more Minutes | 0 | 0.0% |
Commute Time by Sex in Sweetwater
The most common commute times in Sweetwater are 25 to 29 minutes (204 commuters, 18.3%) for males and 20 to 24 minutes (330 commuters, 26.6%) for females.
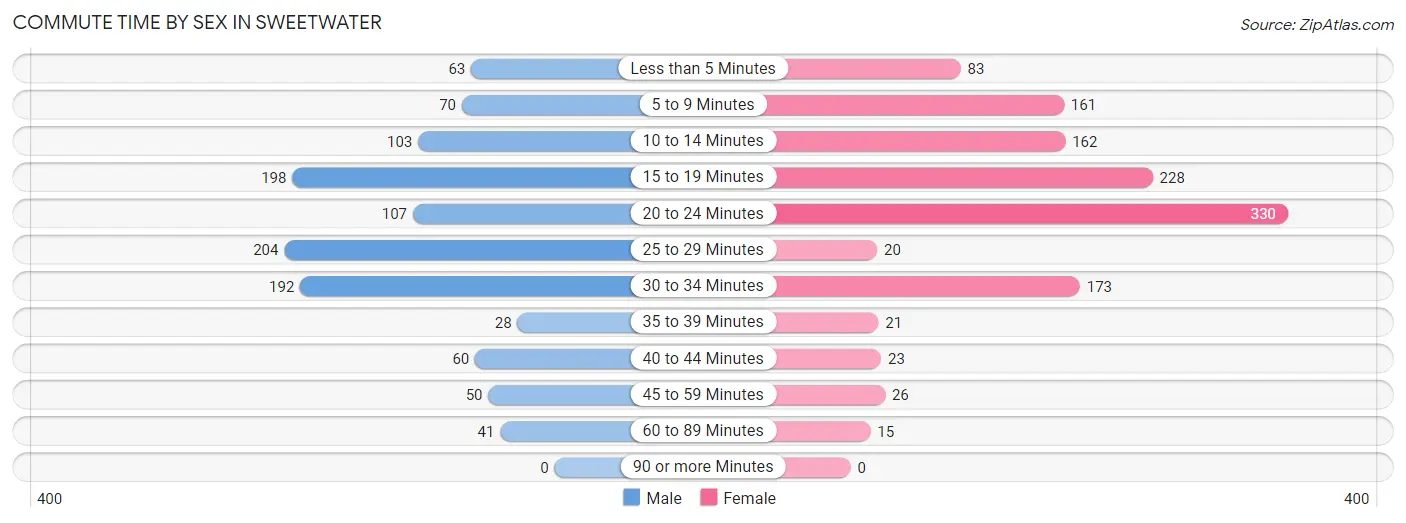
| Commute Time | Male | Female |
| Less than 5 Minutes | 63 (5.7%) | 83 (6.7%) |
| 5 to 9 Minutes | 70 (6.3%) | 161 (13.0%) |
| 10 to 14 Minutes | 103 (9.2%) | 162 (13.0%) |
| 15 to 19 Minutes | 198 (17.7%) | 228 (18.4%) |
| 20 to 24 Minutes | 107 (9.6%) | 330 (26.6%) |
| 25 to 29 Minutes | 204 (18.3%) | 20 (1.6%) |
| 30 to 34 Minutes | 192 (17.2%) | 173 (13.9%) |
| 35 to 39 Minutes | 28 (2.5%) | 21 (1.7%) |
| 40 to 44 Minutes | 60 (5.4%) | 23 (1.8%) |
| 45 to 59 Minutes | 50 (4.5%) | 26 (2.1%) |
| 60 to 89 Minutes | 41 (3.7%) | 15 (1.2%) |
| 90 or more Minutes | 0 (0.0%) | 0 (0.0%) |
Time of Departure to Work by Sex in Sweetwater
The most frequent times of departure to work in Sweetwater are 4:00 PM to 11:59 PM (214, 19.2%) for males and 8:00 AM to 8:29 AM (276, 22.2%) for females.
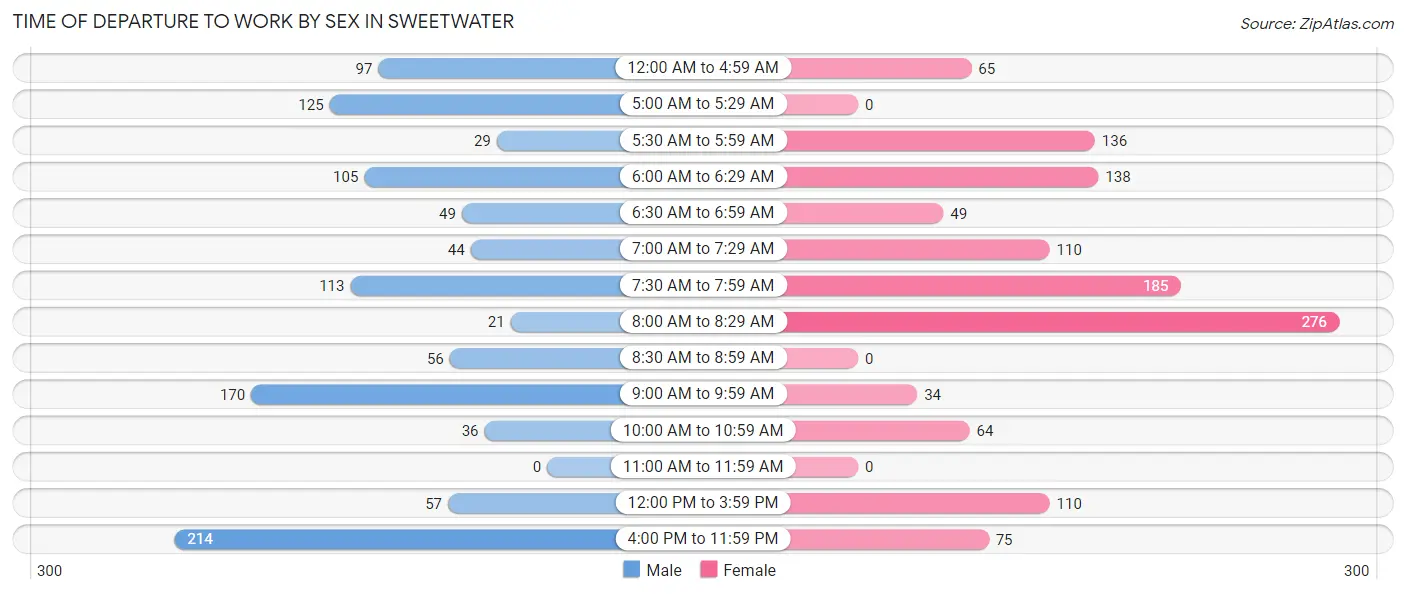
| Time of Departure | Male | Female |
| 12:00 AM to 4:59 AM | 97 (8.7%) | 65 (5.2%) |
| 5:00 AM to 5:29 AM | 125 (11.2%) | 0 (0.0%) |
| 5:30 AM to 5:59 AM | 29 (2.6%) | 136 (11.0%) |
| 6:00 AM to 6:29 AM | 105 (9.4%) | 138 (11.1%) |
| 6:30 AM to 6:59 AM | 49 (4.4%) | 49 (4.0%) |
| 7:00 AM to 7:29 AM | 44 (3.9%) | 110 (8.9%) |
| 7:30 AM to 7:59 AM | 113 (10.1%) | 185 (14.9%) |
| 8:00 AM to 8:29 AM | 21 (1.9%) | 276 (22.2%) |
| 8:30 AM to 8:59 AM | 56 (5.0%) | 0 (0.0%) |
| 9:00 AM to 9:59 AM | 170 (15.2%) | 34 (2.7%) |
| 10:00 AM to 10:59 AM | 36 (3.2%) | 64 (5.1%) |
| 11:00 AM to 11:59 AM | 0 (0.0%) | 0 (0.0%) |
| 12:00 PM to 3:59 PM | 57 (5.1%) | 110 (8.9%) |
| 4:00 PM to 11:59 PM | 214 (19.2%) | 75 (6.0%) |
| Total | 1,116 (100.0%) | 1,242 (100.0%) |
Housing Occupancy in Sweetwater
Occupancy by Ownership in Sweetwater
Of the total 2,762 dwellings in Sweetwater, owner-occupied units account for 1,426 (51.6%), while renter-occupied units make up 1,336 (48.4%).
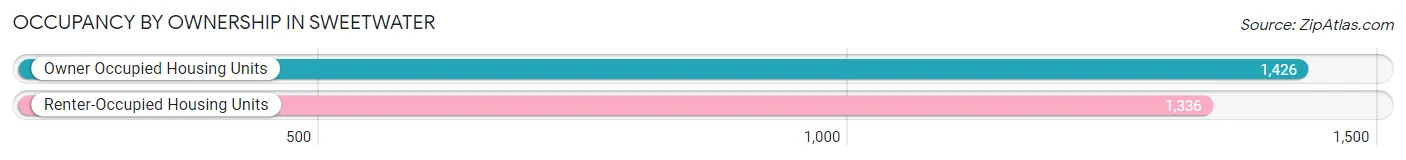
| Occupancy | # Housing Units | % Housing Units |
| Owner Occupied Housing Units | 1,426 | 51.6% |
| Renter-Occupied Housing Units | 1,336 | 48.4% |
| Total Occupied Housing Units | 2,762 | 100.0% |
Occupancy by Household Size in Sweetwater
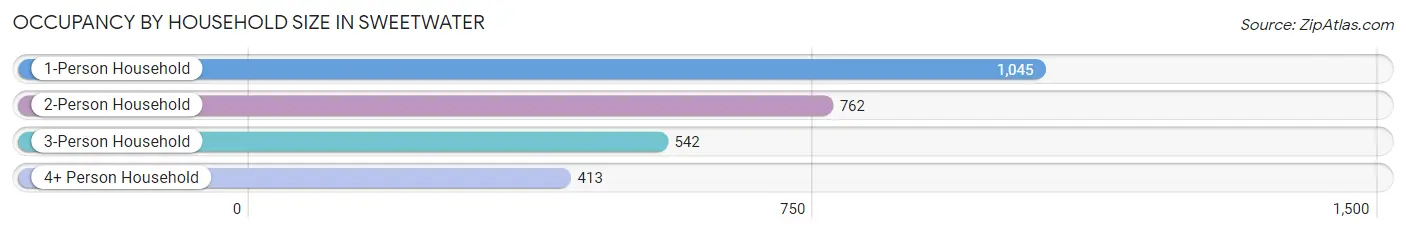
| Household Size | # Housing Units | % Housing Units |
| 1-Person Household | 1,045 | 37.8% |
| 2-Person Household | 762 | 27.6% |
| 3-Person Household | 542 | 19.6% |
| 4+ Person Household | 413 | 14.9% |
| Total Housing Units | 2,762 | 100.0% |
Occupancy by Ownership by Household Size in Sweetwater
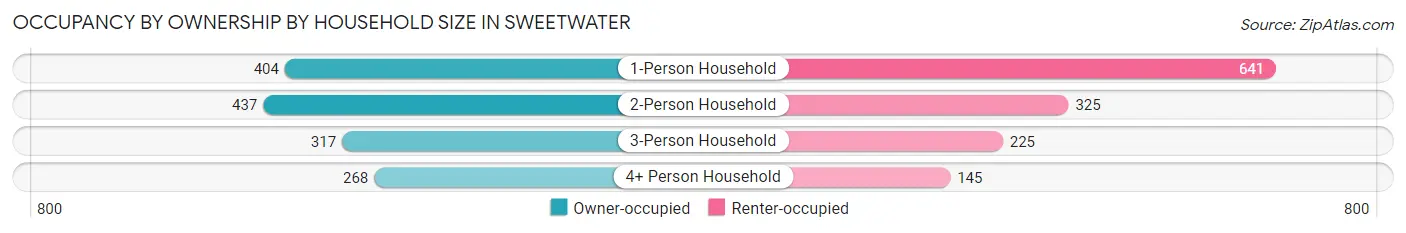
| Household Size | Owner-occupied | Renter-occupied |
| 1-Person Household | 404 (38.7%) | 641 (61.3%) |
| 2-Person Household | 437 (57.4%) | 325 (42.6%) |
| 3-Person Household | 317 (58.5%) | 225 (41.5%) |
| 4+ Person Household | 268 (64.9%) | 145 (35.1%) |
| Total Housing Units | 1,426 (51.6%) | 1,336 (48.4%) |
Occupancy by Educational Attainment in Sweetwater
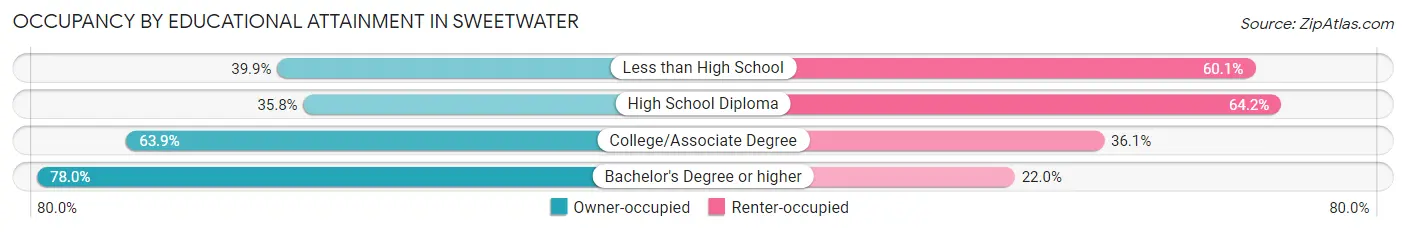
| Household Size | Owner-occupied | Renter-occupied |
| Less than High School | 105 (39.9%) | 158 (60.1%) |
| High School Diploma | 441 (35.8%) | 792 (64.2%) |
| College/Associate Degree | 486 (63.9%) | 275 (36.1%) |
| Bachelor's Degree or higher | 394 (78.0%) | 111 (22.0%) |
Occupancy by Age of Householder in Sweetwater
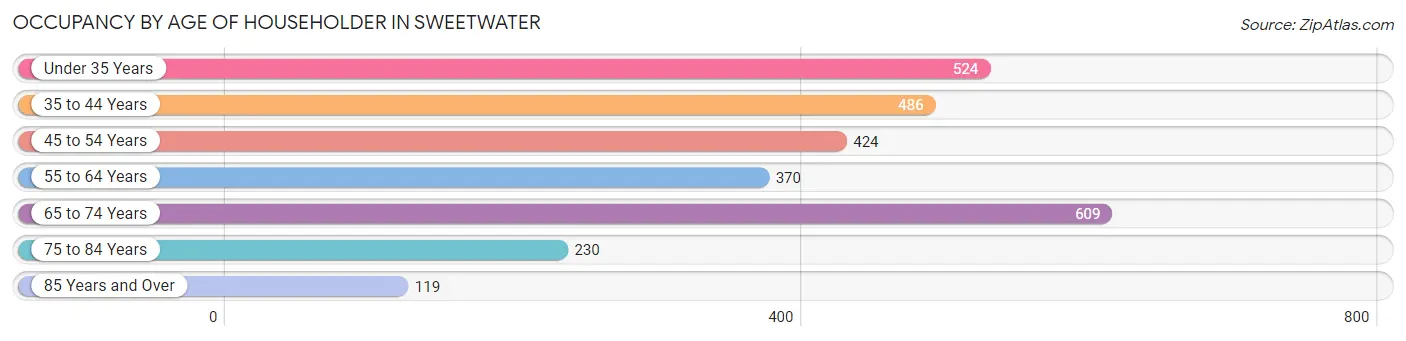
| Age Bracket | # Households | % Households |
| Under 35 Years | 524 | 19.0% |
| 35 to 44 Years | 486 | 17.6% |
| 45 to 54 Years | 424 | 15.3% |
| 55 to 64 Years | 370 | 13.4% |
| 65 to 74 Years | 609 | 22.1% |
| 75 to 84 Years | 230 | 8.3% |
| 85 Years and Over | 119 | 4.3% |
| Total | 2,762 | 100.0% |
Housing Finances in Sweetwater
Median Income by Occupancy in Sweetwater
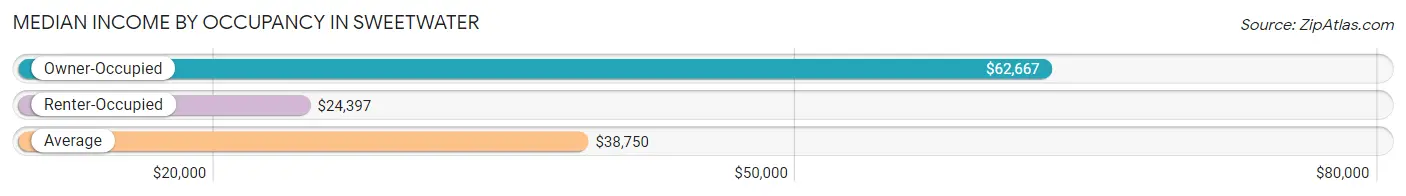
| Occupancy Type | # Households | Median Income |
| Owner-Occupied | 1,426 (51.6%) | $62,667 |
| Renter-Occupied | 1,336 (48.4%) | $24,397 |
| Average | 2,762 (100.0%) | $38,750 |
Occupancy by Householder Income Bracket in Sweetwater
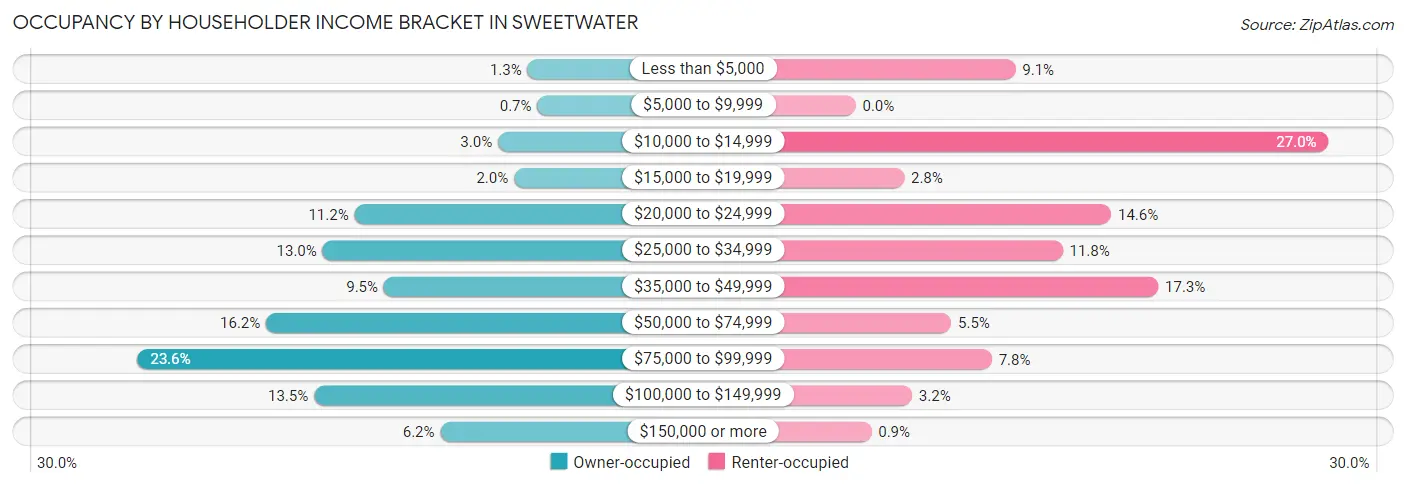
| Income Bracket | Owner-occupied | Renter-occupied |
| Less than $5,000 | 18 (1.3%) | 122 (9.1%) |
| $5,000 to $9,999 | 10 (0.7%) | 0 (0.0%) |
| $10,000 to $14,999 | 42 (2.9%) | 361 (27.0%) |
| $15,000 to $19,999 | 29 (2.0%) | 37 (2.8%) |
| $20,000 to $24,999 | 159 (11.2%) | 195 (14.6%) |
| $25,000 to $34,999 | 185 (13.0%) | 158 (11.8%) |
| $35,000 to $49,999 | 135 (9.5%) | 231 (17.3%) |
| $50,000 to $74,999 | 231 (16.2%) | 73 (5.5%) |
| $75,000 to $99,999 | 336 (23.6%) | 104 (7.8%) |
| $100,000 to $149,999 | 192 (13.5%) | 43 (3.2%) |
| $150,000 or more | 89 (6.2%) | 12 (0.9%) |
| Total | 1,426 (100.0%) | 1,336 (100.0%) |
Monthly Housing Cost Tiers in Sweetwater
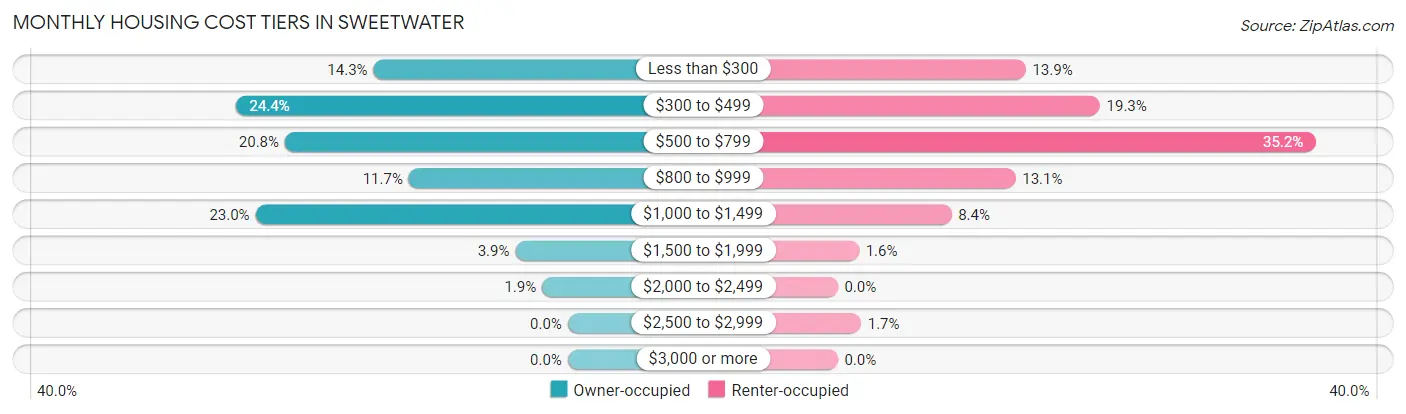
| Monthly Cost | Owner-occupied | Renter-occupied |
| Less than $300 | 204 (14.3%) | 185 (13.9%) |
| $300 to $499 | 348 (24.4%) | 258 (19.3%) |
| $500 to $799 | 297 (20.8%) | 470 (35.2%) |
| $800 to $999 | 167 (11.7%) | 175 (13.1%) |
| $1,000 to $1,499 | 328 (23.0%) | 112 (8.4%) |
| $1,500 to $1,999 | 55 (3.9%) | 21 (1.6%) |
| $2,000 to $2,499 | 27 (1.9%) | 0 (0.0%) |
| $2,500 to $2,999 | 0 (0.0%) | 23 (1.7%) |
| $3,000 or more | 0 (0.0%) | 0 (0.0%) |
| Total | 1,426 (100.0%) | 1,336 (100.0%) |
Physical Housing Characteristics in Sweetwater
Housing Structures in Sweetwater
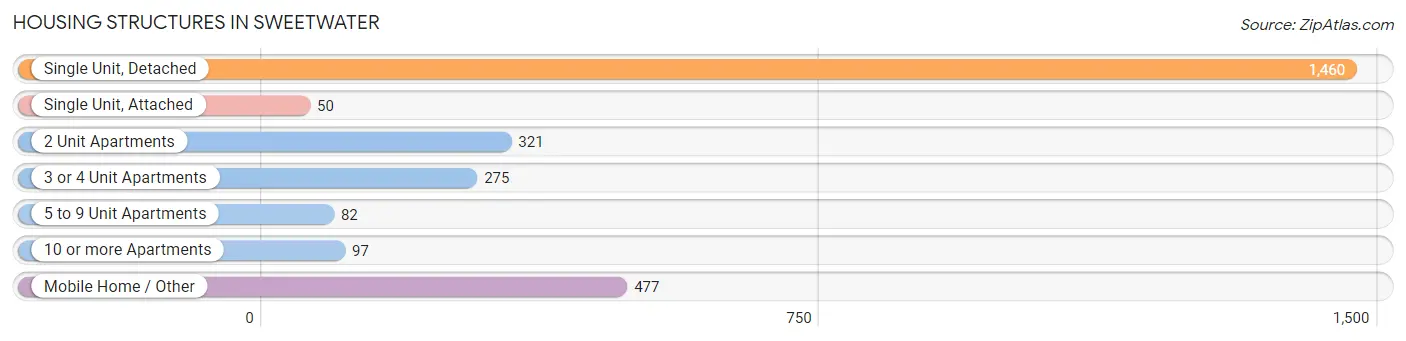
| Structure Type | # Housing Units | % Housing Units |
| Single Unit, Detached | 1,460 | 52.9% |
| Single Unit, Attached | 50 | 1.8% |
| 2 Unit Apartments | 321 | 11.6% |
| 3 or 4 Unit Apartments | 275 | 10.0% |
| 5 to 9 Unit Apartments | 82 | 3.0% |
| 10 or more Apartments | 97 | 3.5% |
| Mobile Home / Other | 477 | 17.3% |
| Total | 2,762 | 100.0% |
Housing Structures by Occupancy in Sweetwater
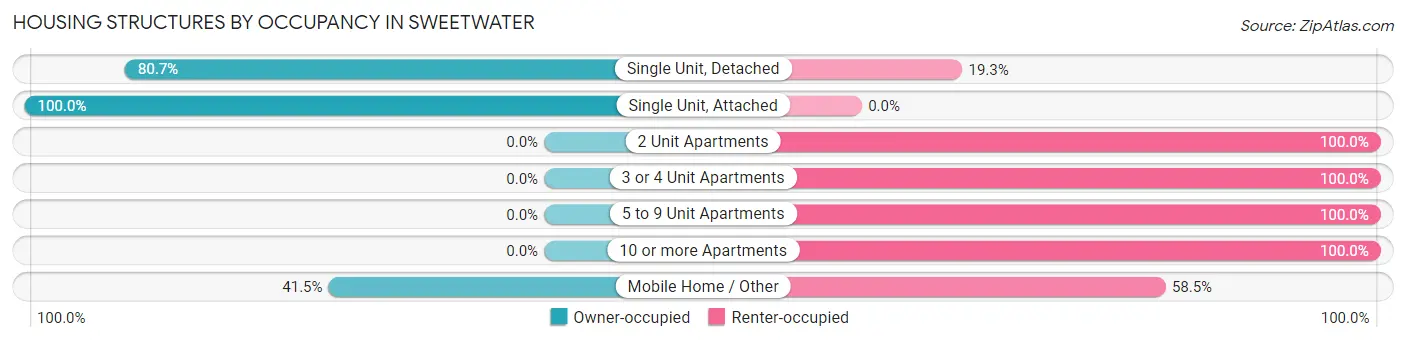
| Structure Type | Owner-occupied | Renter-occupied |
| Single Unit, Detached | 1,178 (80.7%) | 282 (19.3%) |
| Single Unit, Attached | 50 (100.0%) | 0 (0.0%) |
| 2 Unit Apartments | 0 (0.0%) | 321 (100.0%) |
| 3 or 4 Unit Apartments | 0 (0.0%) | 275 (100.0%) |
| 5 to 9 Unit Apartments | 0 (0.0%) | 82 (100.0%) |
| 10 or more Apartments | 0 (0.0%) | 97 (100.0%) |
| Mobile Home / Other | 198 (41.5%) | 279 (58.5%) |
| Total | 1,426 (51.6%) | 1,336 (48.4%) |
Housing Structures by Number of Rooms in Sweetwater
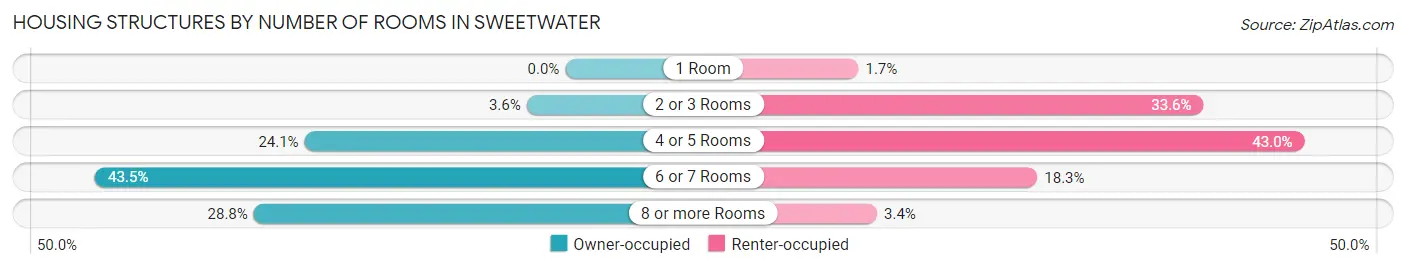
| Number of Rooms | Owner-occupied | Renter-occupied |
| 1 Room | 0 (0.0%) | 23 (1.7%) |
| 2 or 3 Rooms | 51 (3.6%) | 449 (33.6%) |
| 4 or 5 Rooms | 344 (24.1%) | 574 (43.0%) |
| 6 or 7 Rooms | 620 (43.5%) | 244 (18.3%) |
| 8 or more Rooms | 411 (28.8%) | 46 (3.4%) |
| Total | 1,426 (100.0%) | 1,336 (100.0%) |
Housing Structure by Heating Type in Sweetwater
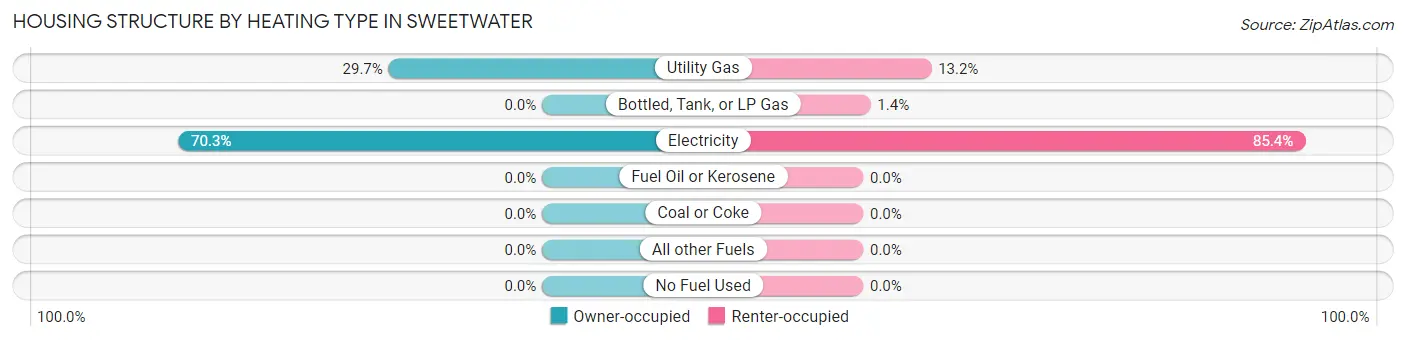
| Heating Type | Owner-occupied | Renter-occupied |
| Utility Gas | 423 (29.7%) | 176 (13.2%) |
| Bottled, Tank, or LP Gas | 0 (0.0%) | 19 (1.4%) |
| Electricity | 1,003 (70.3%) | 1,141 (85.4%) |
| Fuel Oil or Kerosene | 0 (0.0%) | 0 (0.0%) |
| Coal or Coke | 0 (0.0%) | 0 (0.0%) |
| All other Fuels | 0 (0.0%) | 0 (0.0%) |
| No Fuel Used | 0 (0.0%) | 0 (0.0%) |
| Total | 1,426 (100.0%) | 1,336 (100.0%) |
Household Vehicle Usage in Sweetwater
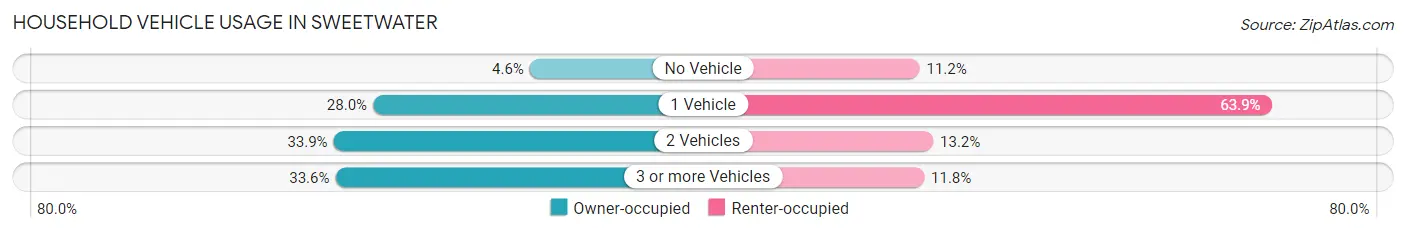
| Vehicles per Household | Owner-occupied | Renter-occupied |
| No Vehicle | 65 (4.6%) | 149 (11.2%) |
| 1 Vehicle | 399 (28.0%) | 853 (63.8%) |
| 2 Vehicles | 483 (33.9%) | 176 (13.2%) |
| 3 or more Vehicles | 479 (33.6%) | 158 (11.8%) |
| Total | 1,426 (100.0%) | 1,336 (100.0%) |
Real Estate & Mortgages in Sweetwater
Real Estate and Mortgage Overview in Sweetwater
| Characteristic | Without Mortgage | With Mortgage |
| Housing Units | 679 | 747 |
| Median Property Value | $142,700 | $151,700 |
| Median Household Income | $55,639 | $44 |
| Monthly Housing Costs | $375 | $0 |
| Real Estate Taxes | $1,109 | $28 |
Property Value by Mortgage Status in Sweetwater
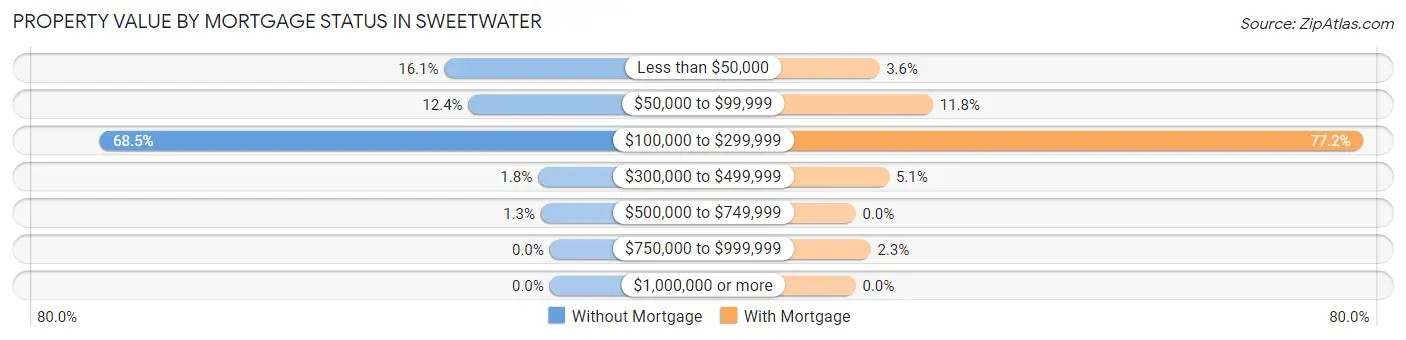
| Property Value | Without Mortgage | With Mortgage |
| Less than $50,000 | 109 (16.1%) | 27 (3.6%) |
| $50,000 to $99,999 | 84 (12.4%) | 88 (11.8%) |
| $100,000 to $299,999 | 465 (68.5%) | 577 (77.2%) |
| $300,000 to $499,999 | 12 (1.8%) | 38 (5.1%) |
| $500,000 to $749,999 | 9 (1.3%) | 0 (0.0%) |
| $750,000 to $999,999 | 0 (0.0%) | 17 (2.3%) |
| $1,000,000 or more | 0 (0.0%) | 0 (0.0%) |
| Total | 679 (100.0%) | 747 (100.0%) |
Household Income by Mortgage Status in Sweetwater
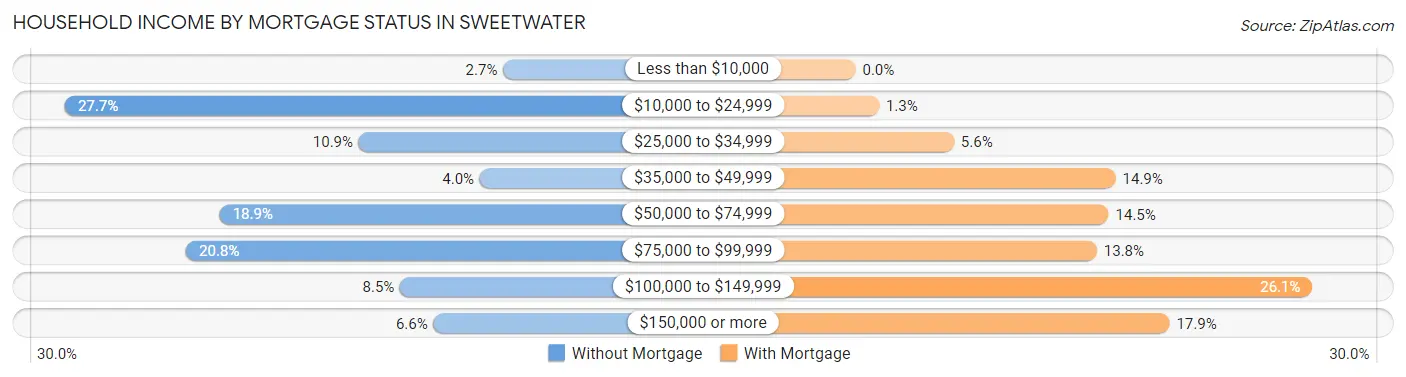
| Household Income | Without Mortgage | With Mortgage |
| Less than $10,000 | 18 (2.6%) | 0 (0.0%) |
| $10,000 to $24,999 | 188 (27.7%) | 10 (1.3%) |
| $25,000 to $34,999 | 74 (10.9%) | 42 (5.6%) |
| $35,000 to $49,999 | 27 (4.0%) | 111 (14.9%) |
| $50,000 to $74,999 | 128 (18.9%) | 108 (14.5%) |
| $75,000 to $99,999 | 141 (20.8%) | 103 (13.8%) |
| $100,000 to $149,999 | 58 (8.5%) | 195 (26.1%) |
| $150,000 or more | 45 (6.6%) | 134 (17.9%) |
| Total | 679 (100.0%) | 747 (100.0%) |
Property Value to Household Income Ratio in Sweetwater
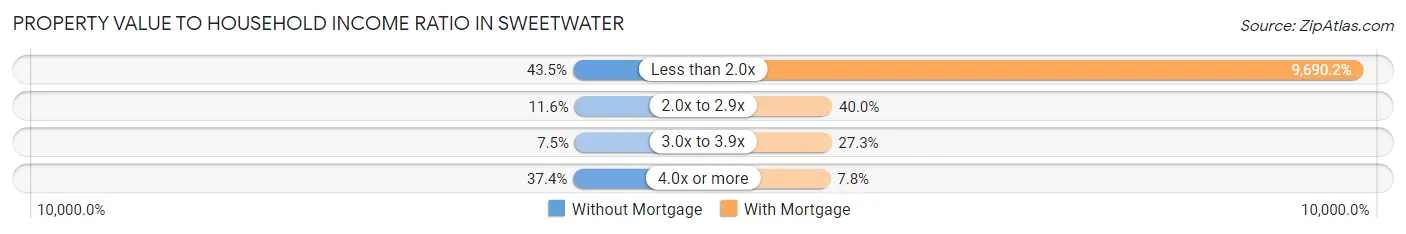
| Value-to-Income Ratio | Without Mortgage | With Mortgage |
| Less than 2.0x | 295 (43.4%) | 72,386 (9,690.2%) |
| 2.0x to 2.9x | 79 (11.6%) | 299 (40.0%) |
| 3.0x to 3.9x | 51 (7.5%) | 204 (27.3%) |
| 4.0x or more | 254 (37.4%) | 58 (7.8%) |
| Total | 679 (100.0%) | 747 (100.0%) |
Real Estate Taxes by Mortgage Status in Sweetwater
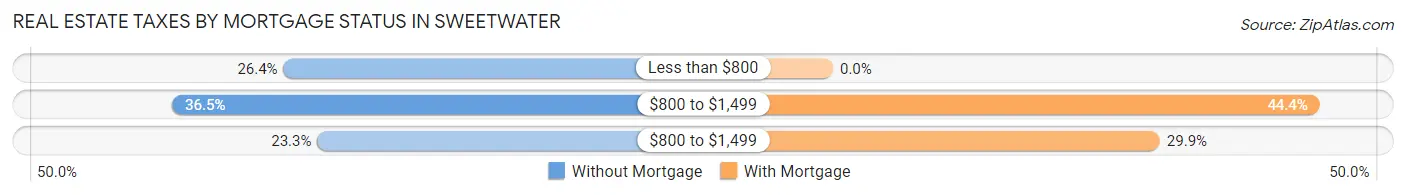
| Property Taxes | Without Mortgage | With Mortgage |
| Less than $800 | 179 (26.4%) | 0 (0.0%) |
| $800 to $1,499 | 248 (36.5%) | 332 (44.4%) |
| $800 to $1,499 | 158 (23.3%) | 223 (29.8%) |
| Total | 679 (100.0%) | 747 (100.0%) |
Health & Disability in Sweetwater
Health Insurance Coverage by Age in Sweetwater
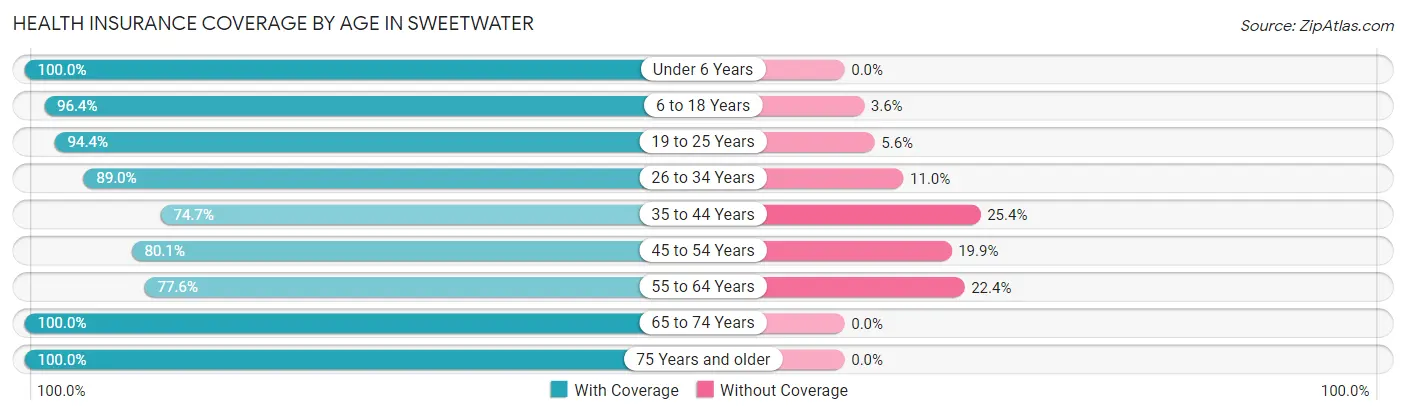
| Age Bracket | With Coverage | Without Coverage |
| Under 6 Years | 314 (100.0%) | 0 (0.0%) |
| 6 to 18 Years | 1,084 (96.4%) | 41 (3.6%) |
| 19 to 25 Years | 370 (94.4%) | 22 (5.6%) |
| 26 to 34 Years | 568 (89.0%) | 70 (11.0%) |
| 35 to 44 Years | 636 (74.7%) | 216 (25.4%) |
| 45 to 54 Years | 554 (80.1%) | 138 (19.9%) |
| 55 to 64 Years | 628 (77.6%) | 181 (22.4%) |
| 65 to 74 Years | 870 (100.0%) | 0 (0.0%) |
| 75 Years and older | 454 (100.0%) | 0 (0.0%) |
| Total | 5,478 (89.1%) | 668 (10.9%) |
Health Insurance Coverage by Citizenship Status in Sweetwater
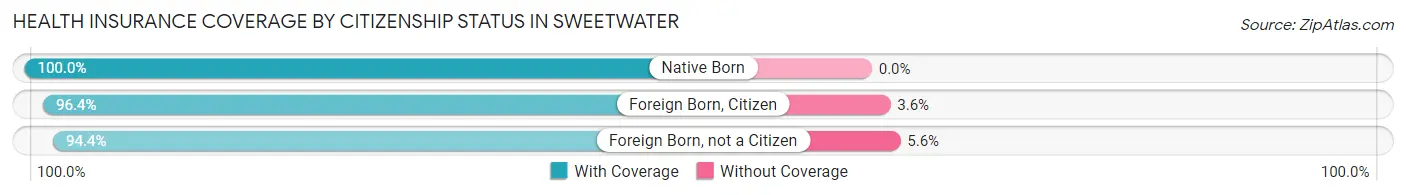
| Citizenship Status | With Coverage | Without Coverage |
| Native Born | 314 (100.0%) | 0 (0.0%) |
| Foreign Born, Citizen | 1,084 (96.4%) | 41 (3.6%) |
| Foreign Born, not a Citizen | 370 (94.4%) | 22 (5.6%) |
Health Insurance Coverage by Household Income in Sweetwater
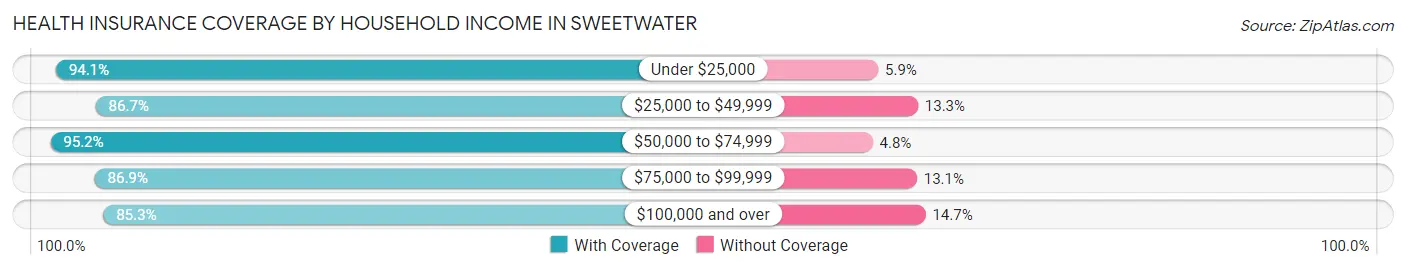
| Household Income | With Coverage | Without Coverage |
| Under $25,000 | 1,350 (94.1%) | 84 (5.9%) |
| $25,000 to $49,999 | 1,238 (86.7%) | 190 (13.3%) |
| $50,000 to $74,999 | 630 (95.2%) | 32 (4.8%) |
| $75,000 to $99,999 | 1,126 (86.9%) | 170 (13.1%) |
| $100,000 and over | 1,111 (85.3%) | 192 (14.7%) |
Public vs Private Health Insurance Coverage by Age in Sweetwater
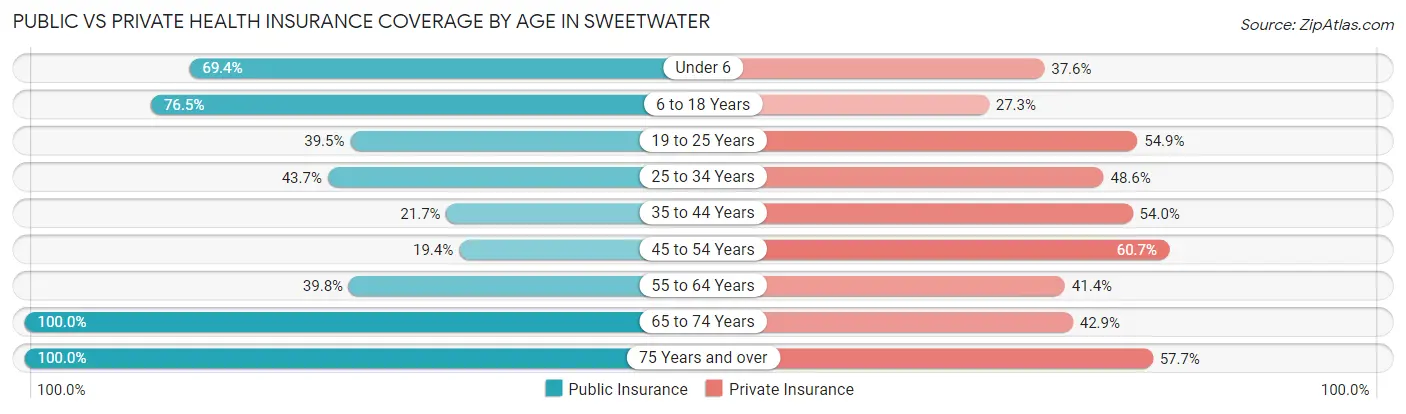
| Age Bracket | Public Insurance | Private Insurance |
| Under 6 | 218 (69.4%) | 118 (37.6%) |
| 6 to 18 Years | 861 (76.5%) | 307 (27.3%) |
| 19 to 25 Years | 155 (39.5%) | 215 (54.8%) |
| 25 to 34 Years | 279 (43.7%) | 310 (48.6%) |
| 35 to 44 Years | 185 (21.7%) | 460 (54.0%) |
| 45 to 54 Years | 134 (19.4%) | 420 (60.7%) |
| 55 to 64 Years | 322 (39.8%) | 335 (41.4%) |
| 65 to 74 Years | 870 (100.0%) | 373 (42.9%) |
| 75 Years and over | 454 (100.0%) | 262 (57.7%) |
| Total | 3,478 (56.6%) | 2,800 (45.6%) |
Disability Status by Sex by Age in Sweetwater
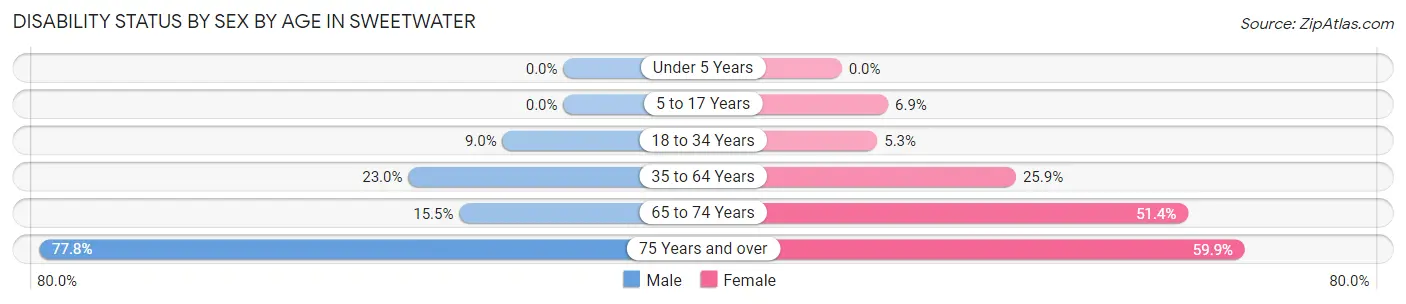
| Age Bracket | Male | Female |
| Under 5 Years | 0 (0.0%) | 0 (0.0%) |
| 5 to 17 Years | 0 (0.0%) | 34 (6.9%) |
| 18 to 34 Years | 40 (9.0%) | 34 (5.3%) |
| 35 to 64 Years | 224 (23.0%) | 357 (25.9%) |
| 65 to 74 Years | 59 (15.4%) | 251 (51.4%) |
| 75 Years and over | 144 (77.8%) | 161 (59.9%) |
Disability Class by Sex by Age in Sweetwater
Disability Class: Hearing Difficulty
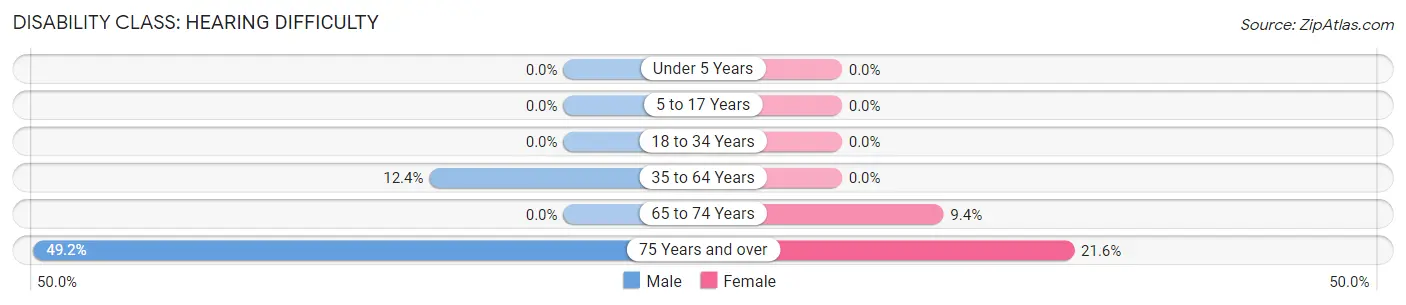
| Age Bracket | Male | Female |
| Under 5 Years | 0 (0.0%) | 0 (0.0%) |
| 5 to 17 Years | 0 (0.0%) | 0 (0.0%) |
| 18 to 34 Years | 0 (0.0%) | 0 (0.0%) |
| 35 to 64 Years | 121 (12.4%) | 0 (0.0%) |
| 65 to 74 Years | 0 (0.0%) | 46 (9.4%) |
| 75 Years and over | 91 (49.2%) | 58 (21.6%) |
Disability Class: Vision Difficulty
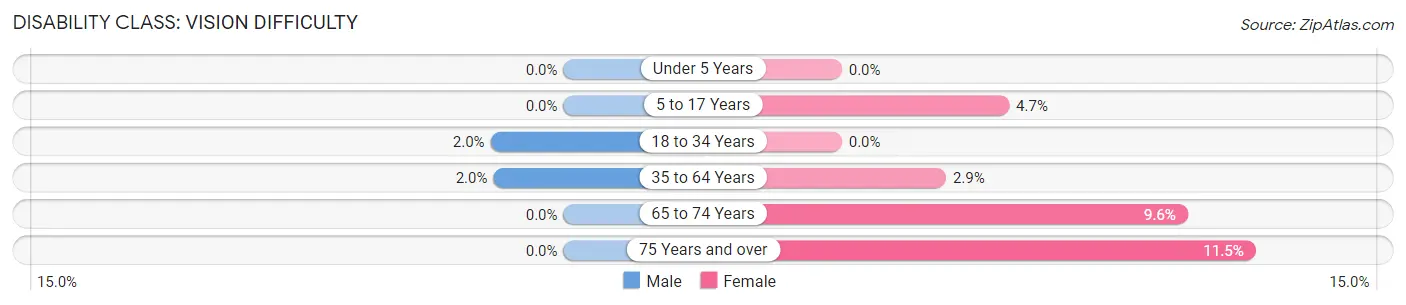
| Age Bracket | Male | Female |
| Under 5 Years | 0 (0.0%) | 0 (0.0%) |
| 5 to 17 Years | 0 (0.0%) | 23 (4.7%) |
| 18 to 34 Years | 9 (2.0%) | 0 (0.0%) |
| 35 to 64 Years | 19 (1.9%) | 40 (2.9%) |
| 65 to 74 Years | 0 (0.0%) | 47 (9.6%) |
| 75 Years and over | 0 (0.0%) | 31 (11.5%) |
Disability Class: Cognitive Difficulty
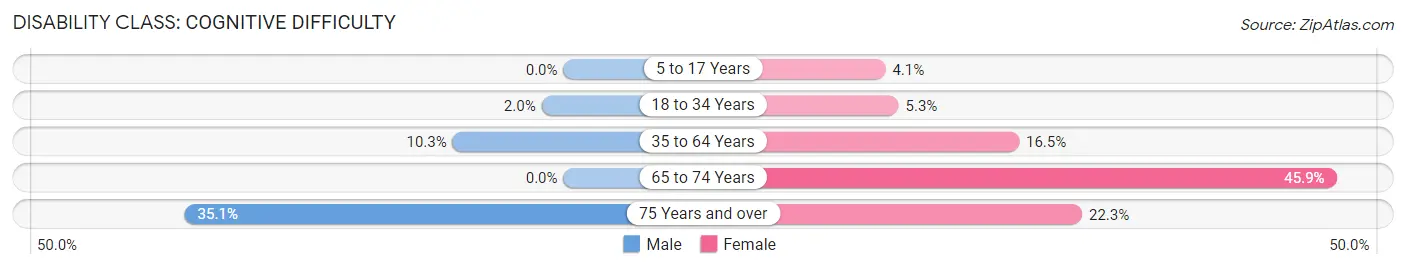
| Age Bracket | Male | Female |
| 5 to 17 Years | 0 (0.0%) | 20 (4.1%) |
| 18 to 34 Years | 9 (2.0%) | 34 (5.3%) |
| 35 to 64 Years | 100 (10.3%) | 227 (16.5%) |
| 65 to 74 Years | 0 (0.0%) | 224 (45.9%) |
| 75 Years and over | 65 (35.1%) | 60 (22.3%) |
Disability Class: Ambulatory Difficulty
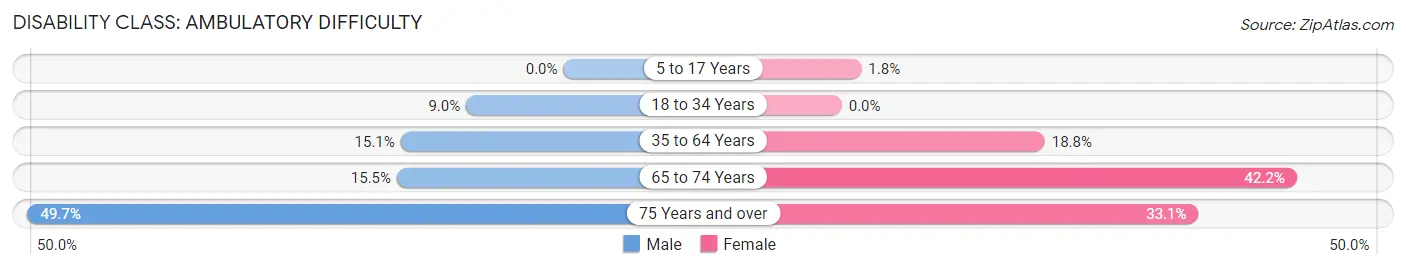
| Age Bracket | Male | Female |
| 5 to 17 Years | 0 (0.0%) | 9 (1.8%) |
| 18 to 34 Years | 40 (9.0%) | 0 (0.0%) |
| 35 to 64 Years | 147 (15.1%) | 260 (18.8%) |
| 65 to 74 Years | 59 (15.4%) | 206 (42.2%) |
| 75 Years and over | 92 (49.7%) | 89 (33.1%) |
Disability Class: Self-Care Difficulty
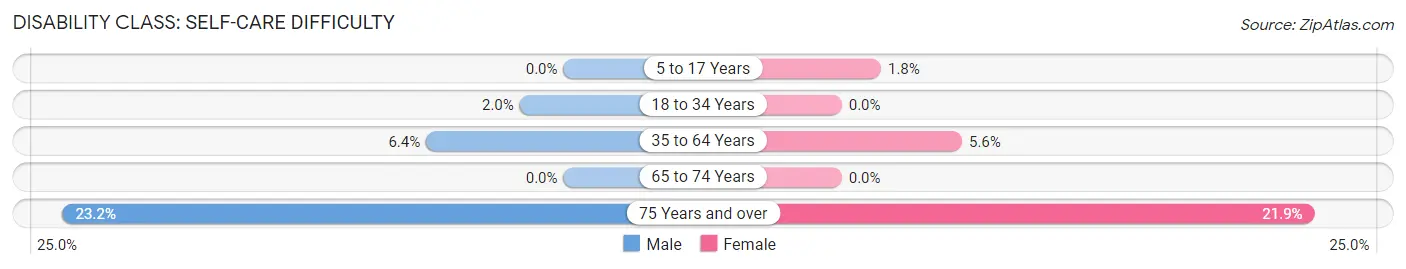
| Age Bracket | Male | Female |
| 5 to 17 Years | 0 (0.0%) | 9 (1.8%) |
| 18 to 34 Years | 9 (2.0%) | 0 (0.0%) |
| 35 to 64 Years | 62 (6.4%) | 77 (5.6%) |
| 65 to 74 Years | 0 (0.0%) | 0 (0.0%) |
| 75 Years and over | 43 (23.2%) | 59 (21.9%) |
Technology Access in Sweetwater
Computing Device Access in Sweetwater
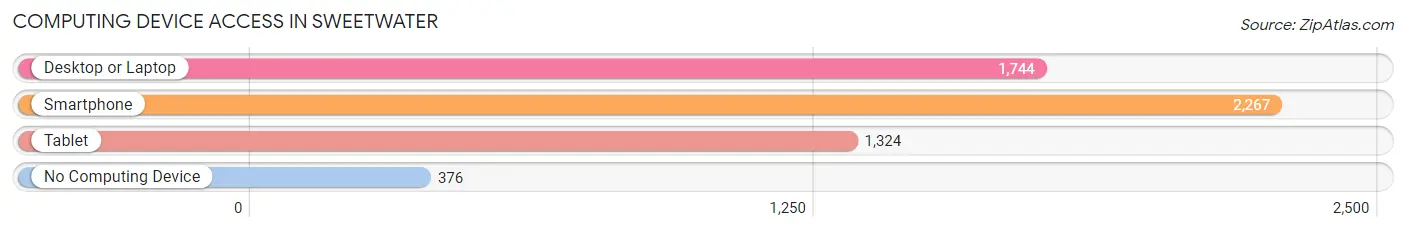
| Device Type | # Households | % Households |
| Desktop or Laptop | 1,744 | 63.1% |
| Smartphone | 2,267 | 82.1% |
| Tablet | 1,324 | 47.9% |
| No Computing Device | 376 | 13.6% |
| Total | 2,762 | 100.0% |
Internet Access in Sweetwater
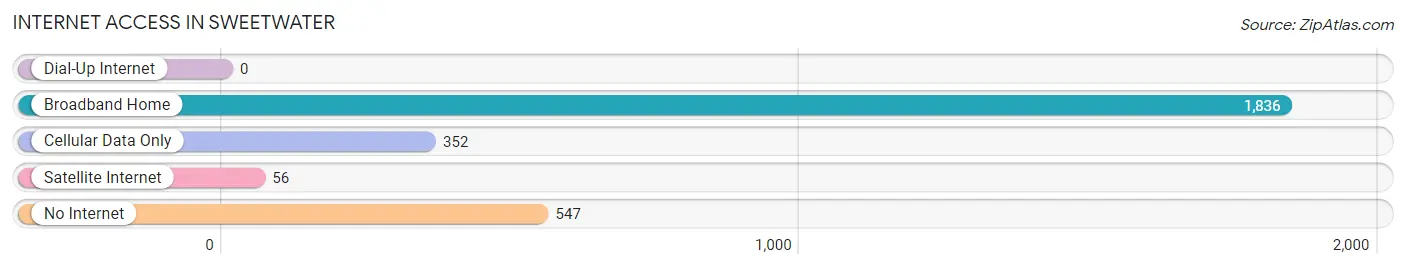
| Internet Type | # Households | % Households |
| Dial-Up Internet | 0 | 0.0% |
| Broadband Home | 1,836 | 66.5% |
| Cellular Data Only | 352 | 12.7% |
| Satellite Internet | 56 | 2.0% |
| No Internet | 547 | 19.8% |
| Total | 2,762 | 100.0% |
Sweetwater Summary
History
Sweetwater, Tennessee is a small city located in Monroe County, Tennessee. It is situated along the banks of the Tennessee River and is part of the Knoxville Metropolitan Statistical Area. The city was founded in 1819 and was originally known as Sweet Water. The name was changed to Sweetwater in 1845.
The area was first inhabited by the Cherokee Indians, who called the area “Tanasi”, meaning “river of many bends”. The first settlers arrived in the area in the late 1700s and early 1800s. The first settler was John Walker, who established a trading post in the area in 1819. The town was officially established in 1845 and was named after the nearby Sweetwater Creek.
The city quickly grew and became an important trading center for the surrounding area. The city was also a major stop on the East Tennessee and Georgia Railroad, which connected Knoxville to Chattanooga. The railroad brought many new businesses and industries to the area, including a cotton mill, a flour mill, and a sawmill.
The city was also home to several important Civil War battles, including the Battle of Sweetwater in 1863. The city was occupied by Union forces during the war and was the site of a major Confederate victory.
Geography
Sweetwater is located in Monroe County, Tennessee, along the banks of the Tennessee River. The city is situated at the intersection of Interstate 75 and U.S. Route 11. The city is located approximately 25 miles south of Knoxville and is part of the Knoxville Metropolitan Statistical Area.
The city has a total area of 4.2 square miles, all of which is land. The terrain is mostly flat, with some rolling hills in the surrounding area. The climate is humid subtropical, with hot summers and mild winters.
Economy
Sweetwater’s economy is largely based on manufacturing and agriculture. The city is home to several manufacturing plants, including a paper mill, a plastics plant, and a steel mill. The city is also home to several agricultural businesses, including a dairy farm and a poultry farm.
The city is also home to several retail businesses, including several restaurants, a grocery store, and a hardware store. The city is also home to several medical facilities, including a hospital and several clinics.
Demographics
As of the 2010 census, the population of Sweetwater was 5,267. The racial makeup of the city was 92.3% White, 4.2% African American, 0.3% Native American, 0.7% Asian, 0.1% Pacific Islander, and 2.4% from other races. Hispanic or Latino of any race were 2.7% of the population.
The median household income in Sweetwater was $35,938, and the median family income was $41,944. The per capita income was $17,845. About 16.2% of the population was below the poverty line.
Sweetwater is served by the Sweetwater City School District, which includes two elementary schools, a middle school, and a high school. The city is also home to several churches, including the First United Methodist Church, the First Baptist Church, and the Church of God.
Common Questions
What is Per Capita Income in Sweetwater?
Per Capita income in Sweetwater is $28,098.
What is the Median Family Income in Sweetwater?
Median Family Income in Sweetwater is $61,723.
What is the Median Household income in Sweetwater?
Median Household Income in Sweetwater is $38,750.
What is Income or Wage Gap in Sweetwater?
Income or Wage Gap in Sweetwater is 34.4%.
Women in Sweetwater earn 65.6 cents for every dollar earned by a man.
What is Inequality or Gini Index in Sweetwater?
Inequality or Gini Index in Sweetwater is 0.54.
What is the Total Population of Sweetwater?
Total Population of Sweetwater is 6,310.
What is the Total Male Population of Sweetwater?
Total Male Population of Sweetwater is 2,840.
What is the Total Female Population of Sweetwater?
Total Female Population of Sweetwater is 3,470.
What is the Ratio of Males per 100 Females in Sweetwater?
There are 81.84 Males per 100 Females in Sweetwater.
What is the Ratio of Females per 100 Males in Sweetwater?
There are 122.18 Females per 100 Males in Sweetwater.
What is the Median Population Age in Sweetwater?
Median Population Age in Sweetwater is 43.7 Years.
What is the Average Family Size in Sweetwater
Average Family Size in Sweetwater is 2.9 People.
What is the Average Household Size in Sweetwater
Average Household Size in Sweetwater is 2.2 People.
How Large is the Labor Force in Sweetwater?
There are 2,628 People in the Labor Forcein in Sweetwater.
What is the Percentage of People in the Labor Force in Sweetwater?
50.7% of People are in the Labor Force in Sweetwater.
What is the Unemployment Rate in Sweetwater?
Unemployment Rate in Sweetwater is 9.4%.