Stantonville, TN Map & Demographics
Stantonville Map
Stantonville Overview
$23,416
PER CAPITA INCOME
$47,031
AVG FAMILY INCOME
$47,500
AVG HOUSEHOLD INCOME
0.32
INEQUALITY / GINI INDEX
400
TOTAL POPULATION
228
MALE POPULATION
172
FEMALE POPULATION
132.56
MALES / 100 FEMALES
75.44
FEMALES / 100 MALES
45.5
MEDIAN AGE
3.2
AVG FAMILY SIZE
2.9
AVG HOUSEHOLD SIZE
152
LABOR FORCE [ PEOPLE ]
44.6%
PERCENT IN LABOR FORCE
0.7%
UNEMPLOYMENT RATE
Stantonville Zip Codes
Stantonville Area Codes
Income in Stantonville
Income Overview in Stantonville
Per Capita Income in Stantonville is $23,416, while median incomes of families and households are $47,031 and $47,500 respectively.
| Characteristic | Number | Measure |
| Per Capita Income | 400 | $23,416 |
| Median Family Income | 113 | $47,031 |
| Mean Family Income | 113 | $65,265 |
| Median Household Income | 138 | $47,500 |
| Mean Household Income | 138 | $62,337 |
| Income Deficit | 113 | $0 |
| Wage / Income Gap (%) | 400 | 0.00% |
| Wage / Income Gap ($) | 400 | 100.00¢ per $1 |
| Gini / Inequality Index | 400 | 0.32 |
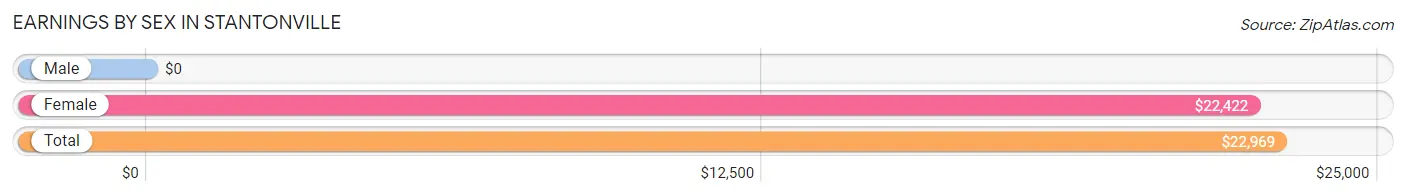
Earnings by Sex in Stantonville
| Sex | Number | Average Earnings |
| Male | 108 (65.4%) | $0 |
| Female | 57 (34.5%) | $22,422 |
| Total | 165 (100.0%) | $22,969 |
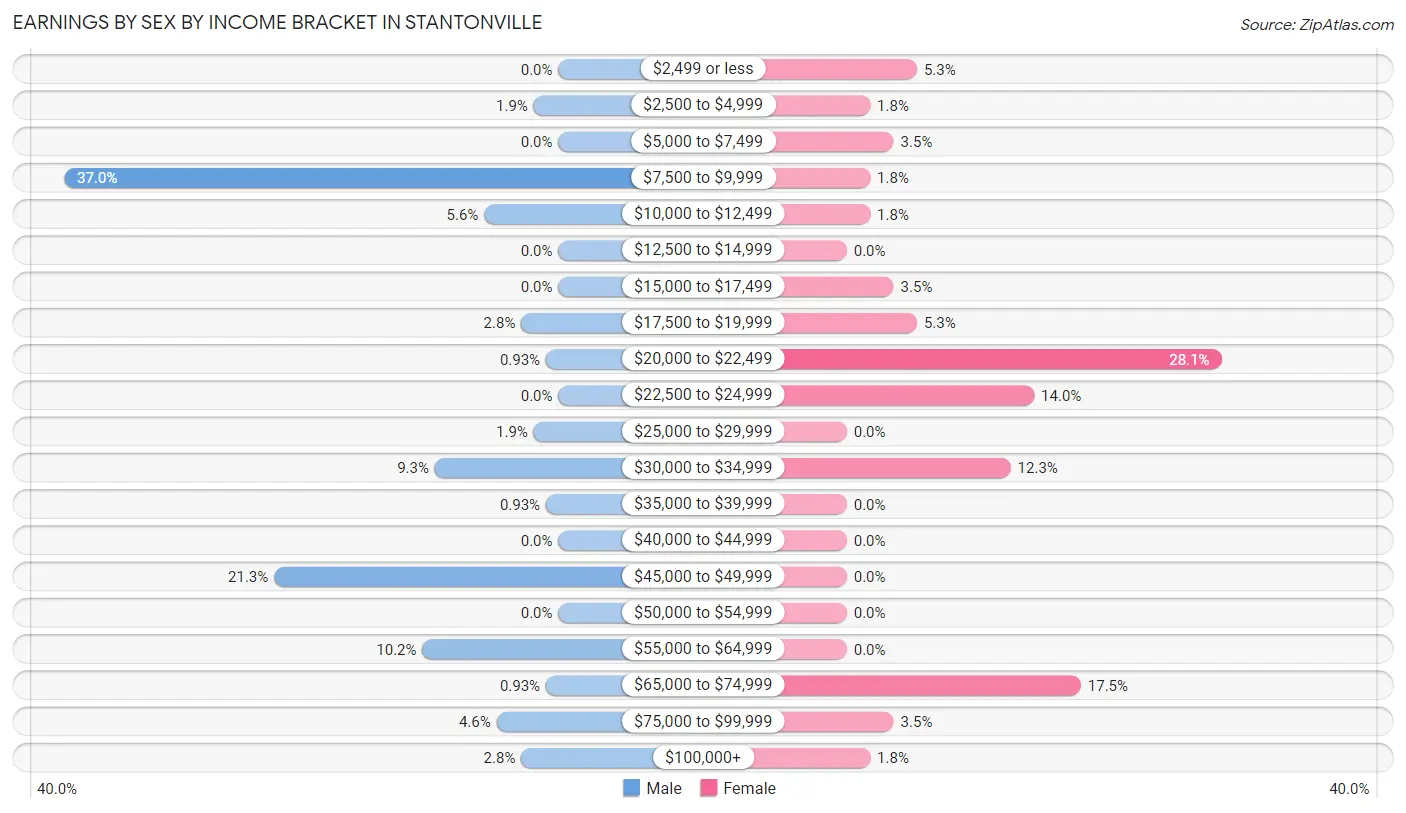
Earnings by Sex by Income Bracket in Stantonville
The most common earnings brackets in Stantonville are $7,500 to $9,999 for men (40 | 37.0%) and $20,000 to $22,499 for women (16 | 28.1%).
| Income | Male | Female |
| $2,499 or less | 0 (0.0%) | 3 (5.3%) |
| $2,500 to $4,999 | 2 (1.8%) | 1 (1.8%) |
| $5,000 to $7,499 | 0 (0.0%) | 2 (3.5%) |
| $7,500 to $9,999 | 40 (37.0%) | 1 (1.8%) |
| $10,000 to $12,499 | 6 (5.6%) | 1 (1.8%) |
| $12,500 to $14,999 | 0 (0.0%) | 0 (0.0%) |
| $15,000 to $17,499 | 0 (0.0%) | 2 (3.5%) |
| $17,500 to $19,999 | 3 (2.8%) | 3 (5.3%) |
| $20,000 to $22,499 | 1 (0.9%) | 16 (28.1%) |
| $22,500 to $24,999 | 0 (0.0%) | 8 (14.0%) |
| $25,000 to $29,999 | 2 (1.8%) | 0 (0.0%) |
| $30,000 to $34,999 | 10 (9.3%) | 7 (12.3%) |
| $35,000 to $39,999 | 1 (0.9%) | 0 (0.0%) |
| $40,000 to $44,999 | 0 (0.0%) | 0 (0.0%) |
| $45,000 to $49,999 | 23 (21.3%) | 0 (0.0%) |
| $50,000 to $54,999 | 0 (0.0%) | 0 (0.0%) |
| $55,000 to $64,999 | 11 (10.2%) | 0 (0.0%) |
| $65,000 to $74,999 | 1 (0.9%) | 10 (17.5%) |
| $75,000 to $99,999 | 5 (4.6%) | 2 (3.5%) |
| $100,000+ | 3 (2.8%) | 1 (1.8%) |
| Total | 108 (100.0%) | 57 (100.0%) |
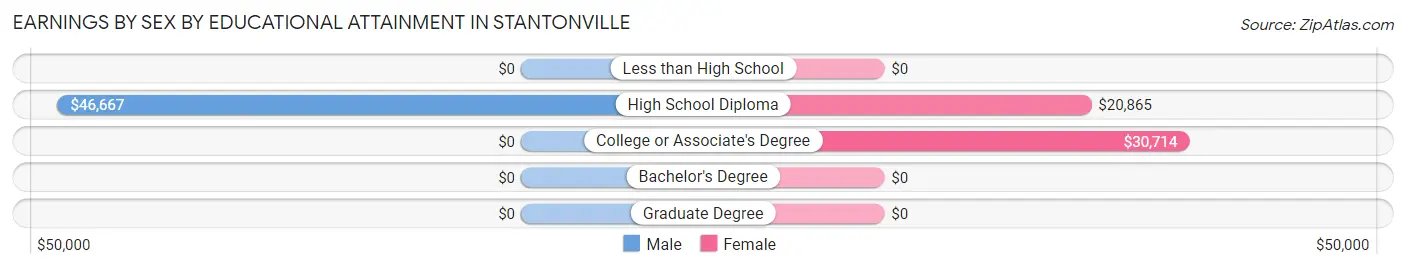
Earnings by Sex by Educational Attainment in Stantonville
Average earnings in Stantonville are $46,250 for men and $22,266 for women, a difference of 51.9%. Men with an educational attainment of high school diploma enjoy the highest average annual earnings of $46,667, while those with high school diploma education earn the least with $46,667. Women with an educational attainment of college or associate's degree earn the most with the average annual earnings of $30,714, while those with high school diploma education have the smallest earnings of $20,865.
| Educational Attainment | Male Income | Female Income |
| Less than High School | - | - |
| High School Diploma | $46,667 | $20,865 |
| College or Associate's Degree | - | - |
| Bachelor's Degree | - | - |
| Graduate Degree | - | - |
| Total | $46,250 | $22,266 |
Family Income in Stantonville
Family Income Brackets in Stantonville
According to the Stantonville family income data, there are 42 families falling into the $35,000 to $49,999 income range, which is the most common income bracket and makes up 37.2% of all families.
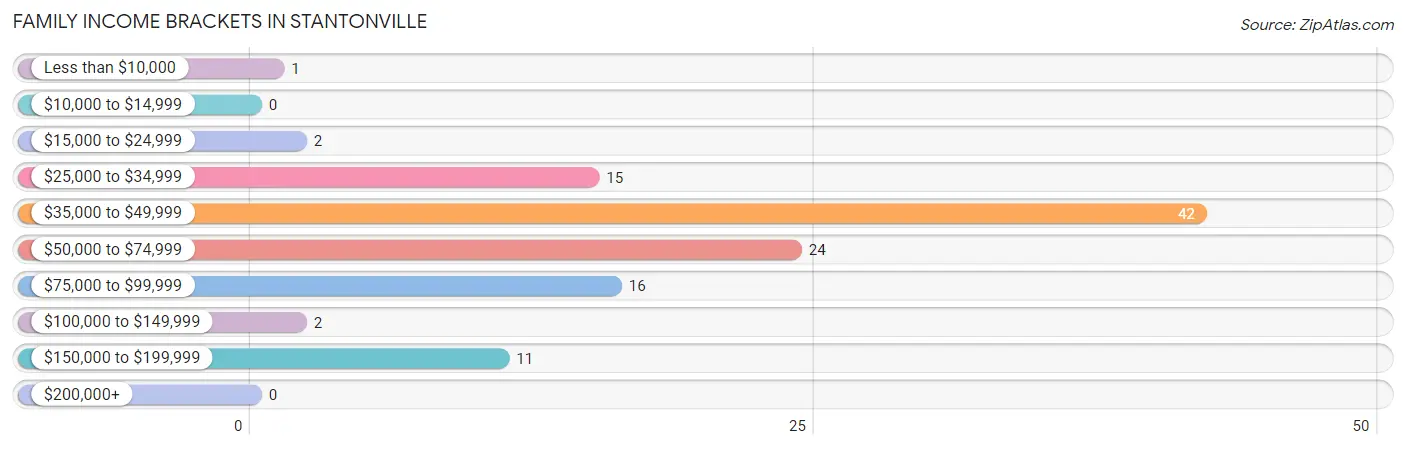
| Income Bracket | # Families | % Families |
| Less than $10,000 | 1 | 0.9% |
| $10,000 to $14,999 | 0 | 0.0% |
| $15,000 to $24,999 | 2 | 1.8% |
| $25,000 to $34,999 | 15 | 13.3% |
| $35,000 to $49,999 | 42 | 37.2% |
| $50,000 to $74,999 | 24 | 21.2% |
| $75,000 to $99,999 | 16 | 14.2% |
| $100,000 to $149,999 | 2 | 1.8% |
| $150,000 to $199,999 | 11 | 9.7% |
| $200,000+ | 0 | 0.0% |
Family Income by Famaliy Size in Stantonville
3-person families (22 | 19.5%) account for the highest median family income in Stantonville with $76,250 per family, while 2-person families (51 | 45.1%) have the highest median income of $31,696 per family member.
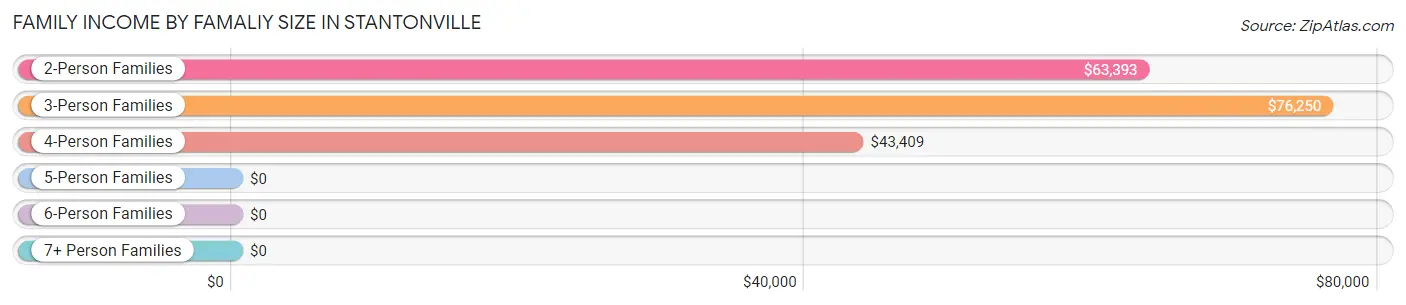
| Income Bracket | # Families | Median Income |
| 2-Person Families | 51 (45.1%) | $63,393 |
| 3-Person Families | 22 (19.5%) | $76,250 |
| 4-Person Families | 34 (30.1%) | $43,409 |
| 5-Person Families | 6 (5.3%) | $0 |
| 6-Person Families | 0 (0.0%) | $0 |
| 7+ Person Families | 0 (0.0%) | $0 |
| Total | 113 (100.0%) | $47,031 |
Family Income by Number of Earners in Stantonville
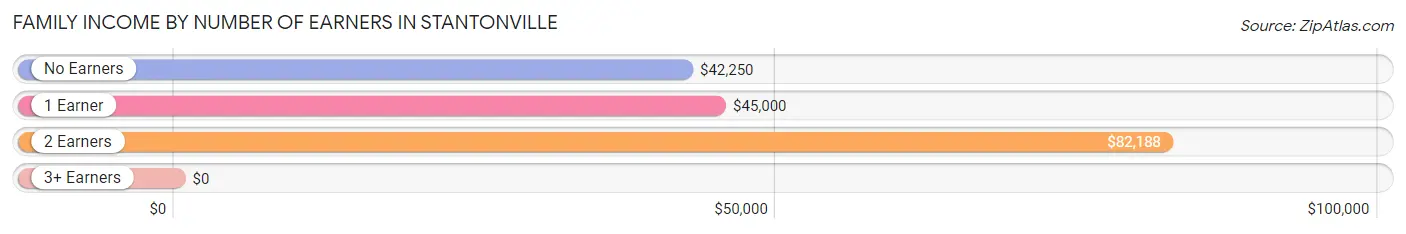
| Number of Earners | # Families | Median Income |
| No Earners | 25 (22.1%) | $42,250 |
| 1 Earner | 60 (53.1%) | $45,000 |
| 2 Earners | 25 (22.1%) | $82,188 |
| 3+ Earners | 3 (2.6%) | $0 |
| Total | 113 (100.0%) | $47,031 |
Household Income in Stantonville
Household Income Brackets in Stantonville
With 48 households falling in the category, the $35,000 to $49,999 income range is the most frequent in Stantonville, accounting for 34.8% of all households.
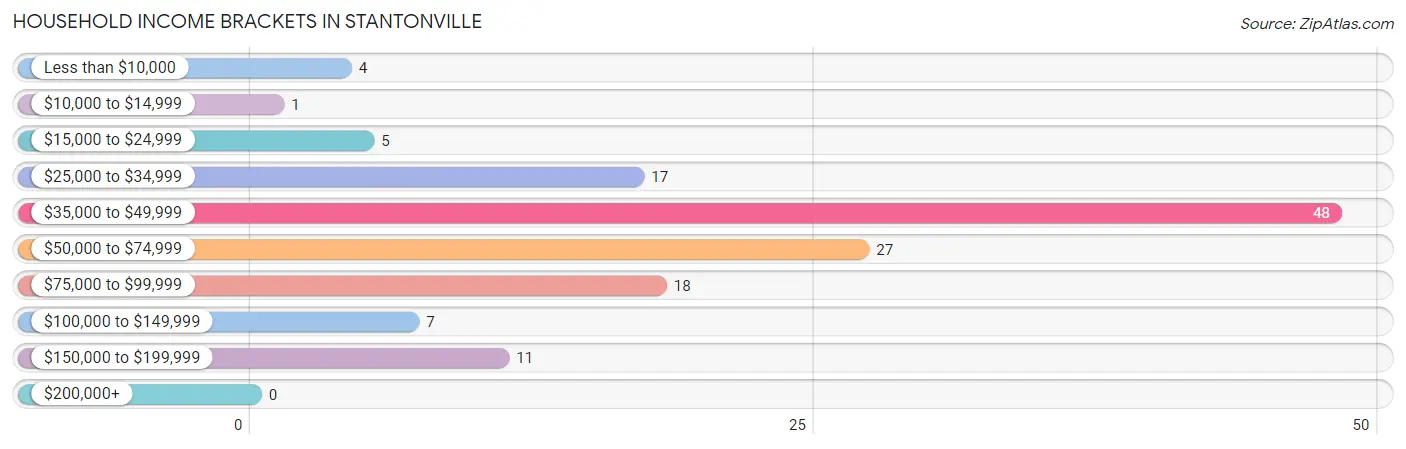
| Income Bracket | # Households | % Households |
| Less than $10,000 | 4 | 2.9% |
| $10,000 to $14,999 | 1 | 0.7% |
| $15,000 to $24,999 | 5 | 3.6% |
| $25,000 to $34,999 | 17 | 12.3% |
| $35,000 to $49,999 | 48 | 34.8% |
| $50,000 to $74,999 | 27 | 19.6% |
| $75,000 to $99,999 | 18 | 13.0% |
| $100,000 to $149,999 | 7 | 5.1% |
| $150,000 to $199,999 | 11 | 8.0% |
| $200,000+ | 0 | 0.0% |
Household Income by Householder Age in Stantonville
The median household income in Stantonville is $47,500, with the highest median household income of $55,000 found in the 65+ years age bracket for the primary householder. A total of 48 households (34.8%) fall into this category. Meanwhile, the 15 to 24 years age bracket for the primary householder has the lowest median household income of $0, with 5 households (3.6%) in this group.
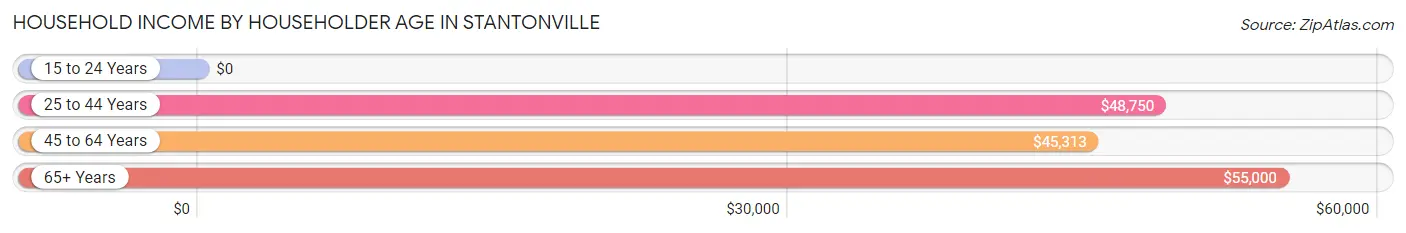
| Income Bracket | # Households | Median Income |
| 15 to 24 Years | 5 (3.6%) | $0 |
| 25 to 44 Years | 24 (17.4%) | $48,750 |
| 45 to 64 Years | 61 (44.2%) | $45,313 |
| 65+ Years | 48 (34.8%) | $55,000 |
| Total | 138 (100.0%) | $47,500 |
Poverty in Stantonville
Income Below Poverty by Sex and Age in Stantonville
With 11.8% poverty level for males and 18.0% for females among the residents of Stantonville, 12 to 14 year old males and 16 and 17 year old females are the most vulnerable to poverty, with 3 males (37.5%) and 5 females (100.0%) in their respective age groups living below the poverty level.
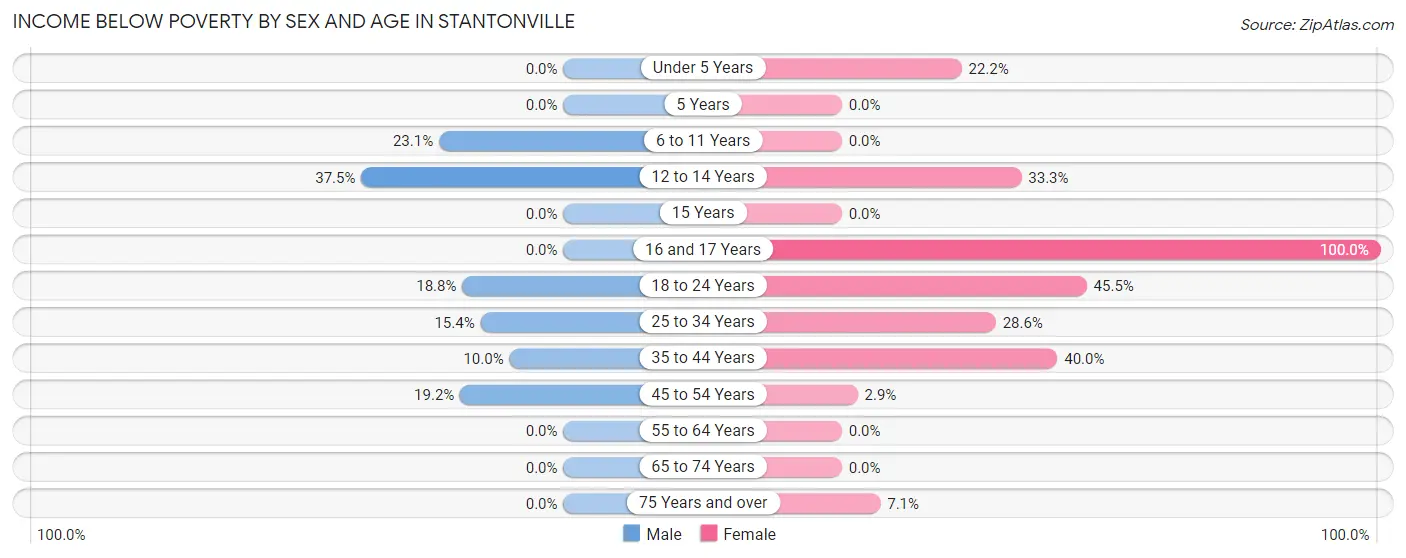
| Age Bracket | Male | Female |
| Under 5 Years | 0 (0.0%) | 2 (22.2%) |
| 5 Years | 0 (0.0%) | 0 (0.0%) |
| 6 to 11 Years | 3 (23.1%) | 0 (0.0%) |
| 12 to 14 Years | 3 (37.5%) | 1 (33.3%) |
| 15 Years | 0 (0.0%) | 0 (0.0%) |
| 16 and 17 Years | 0 (0.0%) | 5 (100.0%) |
| 18 to 24 Years | 9 (18.8%) | 5 (45.5%) |
| 25 to 34 Years | 2 (15.4%) | 2 (28.6%) |
| 35 to 44 Years | 1 (10.0%) | 14 (40.0%) |
| 45 to 54 Years | 9 (19.2%) | 1 (2.9%) |
| 55 to 64 Years | 0 (0.0%) | 0 (0.0%) |
| 65 to 74 Years | 0 (0.0%) | 0 (0.0%) |
| 75 Years and over | 0 (0.0%) | 1 (7.1%) |
| Total | 27 (11.8%) | 31 (18.0%) |
Income Above Poverty by Sex and Age in Stantonville
According to the poverty statistics in Stantonville, males aged under 5 years and females aged 5 years are the age groups that are most secure financially, with 100.0% of males and 100.0% of females in these age groups living above the poverty line.
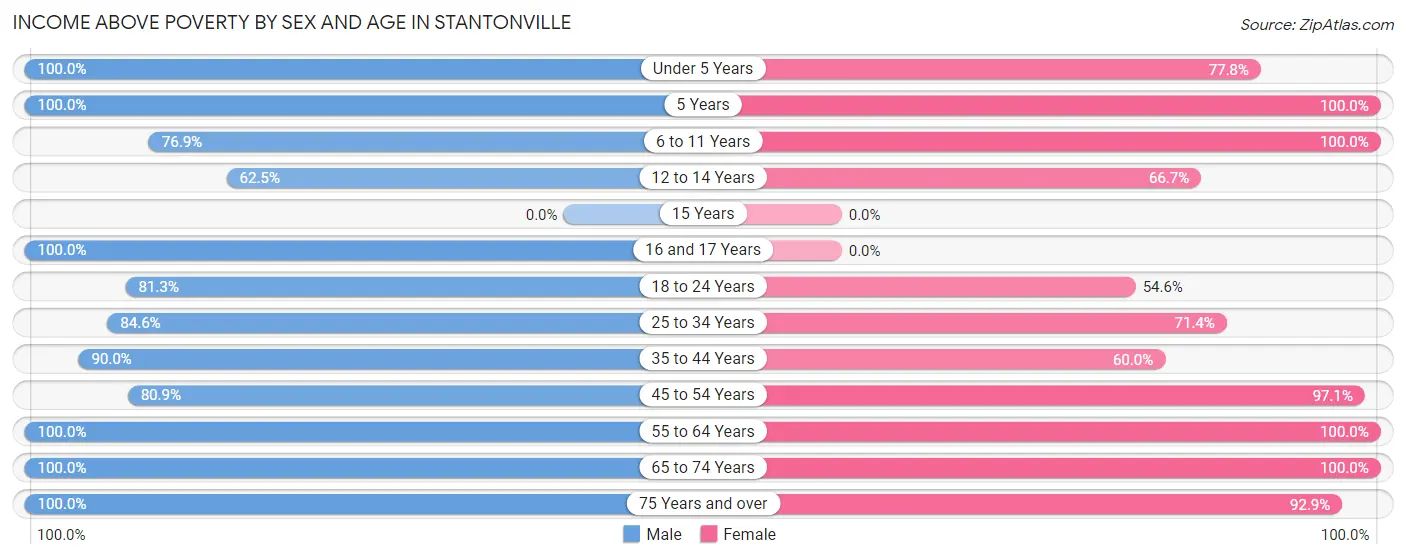
| Age Bracket | Male | Female |
| Under 5 Years | 2 (100.0%) | 7 (77.8%) |
| 5 Years | 12 (100.0%) | 4 (100.0%) |
| 6 to 11 Years | 10 (76.9%) | 8 (100.0%) |
| 12 to 14 Years | 5 (62.5%) | 2 (66.7%) |
| 15 Years | 0 (0.0%) | 0 (0.0%) |
| 16 and 17 Years | 5 (100.0%) | 0 (0.0%) |
| 18 to 24 Years | 39 (81.2%) | 6 (54.5%) |
| 25 to 34 Years | 11 (84.6%) | 5 (71.4%) |
| 35 to 44 Years | 9 (90.0%) | 21 (60.0%) |
| 45 to 54 Years | 38 (80.8%) | 33 (97.1%) |
| 55 to 64 Years | 20 (100.0%) | 21 (100.0%) |
| 65 to 74 Years | 35 (100.0%) | 21 (100.0%) |
| 75 Years and over | 15 (100.0%) | 13 (92.9%) |
| Total | 201 (88.2%) | 141 (82.0%) |
Income Below Poverty Among Married-Couple Families in Stantonville
The poverty statistics for married-couple families in Stantonville show that 3.0% or 3 of the total 100 families live below the poverty line. Families with 1 or 2 children have the highest poverty rate of 7.1%, comprising of 3 families. On the other hand, families with no children have the lowest poverty rate of 0.0%, which includes 0 families.
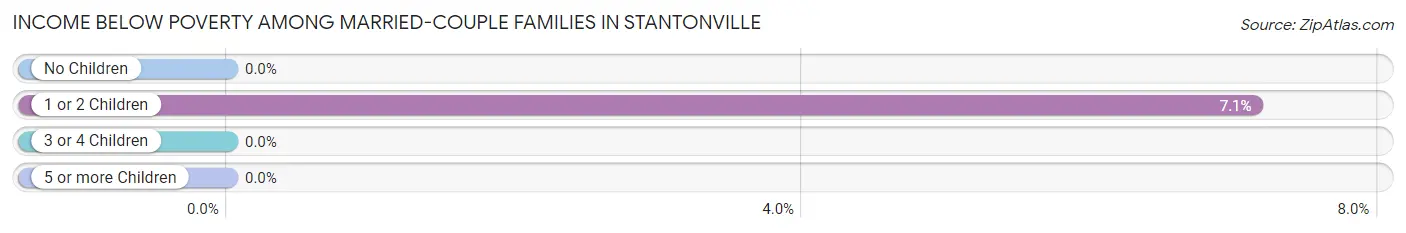
| Children | Above Poverty | Below Poverty |
| No Children | 55 (100.0%) | 0 (0.0%) |
| 1 or 2 Children | 39 (92.9%) | 3 (7.1%) |
| 3 or 4 Children | 3 (100.0%) | 0 (0.0%) |
| 5 or more Children | 0 (0.0%) | 0 (0.0%) |
| Total | 97 (97.0%) | 3 (3.0%) |
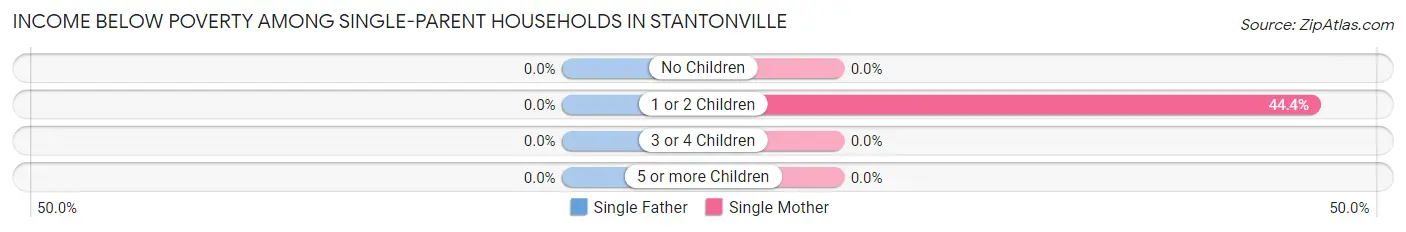
Income Below Poverty Among Single-Parent Households in Stantonville
| Children | Single Father | Single Mother |
| No Children | 0 (0.0%) | 0 (0.0%) |
| 1 or 2 Children | 0 (0.0%) | 4 (44.4%) |
| 3 or 4 Children | 0 (0.0%) | 0 (0.0%) |
| 5 or more Children | 0 (0.0%) | 0 (0.0%) |
| Total | 0 (0.0%) | 4 (36.4%) |
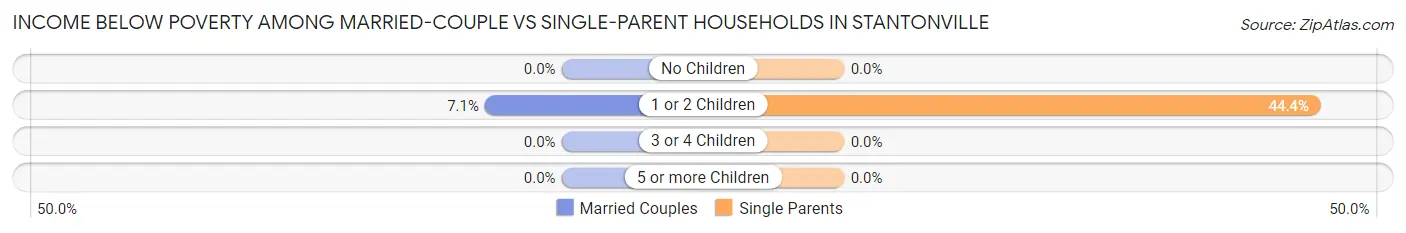
Income Below Poverty Among Married-Couple vs Single-Parent Households in Stantonville
The poverty data for Stantonville shows that 3 of the married-couple family households (3.0%) and 4 of the single-parent households (30.8%) are living below the poverty level. Within the married-couple family households, those with 1 or 2 children have the highest poverty rate, with 3 households (7.1%) falling below the poverty line. Among the single-parent households, those with 1 or 2 children have the highest poverty rate, with 4 household (44.4%) living below poverty.
| Children | Married-Couple Families | Single-Parent Households |
| No Children | 0 (0.0%) | 0 (0.0%) |
| 1 or 2 Children | 3 (7.1%) | 4 (44.4%) |
| 3 or 4 Children | 0 (0.0%) | 0 (0.0%) |
| 5 or more Children | 0 (0.0%) | 0 (0.0%) |
| Total | 3 (3.0%) | 4 (30.8%) |
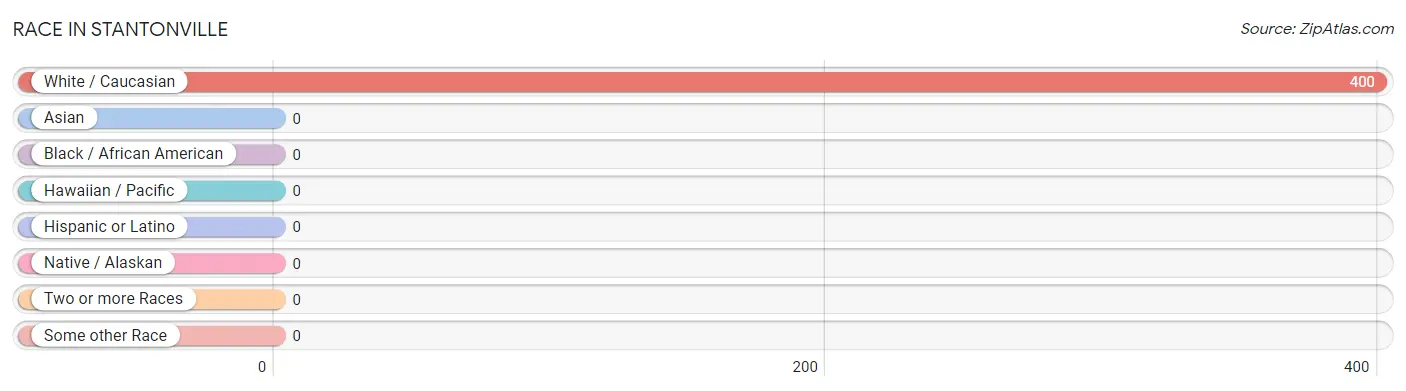
Race in Stantonville
The most populous races in Stantonville are , and White / Caucasian (400 | 100.0%).
| Race | # Population | % Population |
| Asian | 0 | 0.0% |
| Black / African American | 0 | 0.0% |
| Hawaiian / Pacific | 0 | 0.0% |
| Hispanic or Latino | 0 | 0.0% |
| Native / Alaskan | 0 | 0.0% |
| White / Caucasian | 400 | 100.0% |
| Two or more Races | 0 | 0.0% |
| Some other Race | 0 | 0.0% |
| Total | 400 | 100.0% |
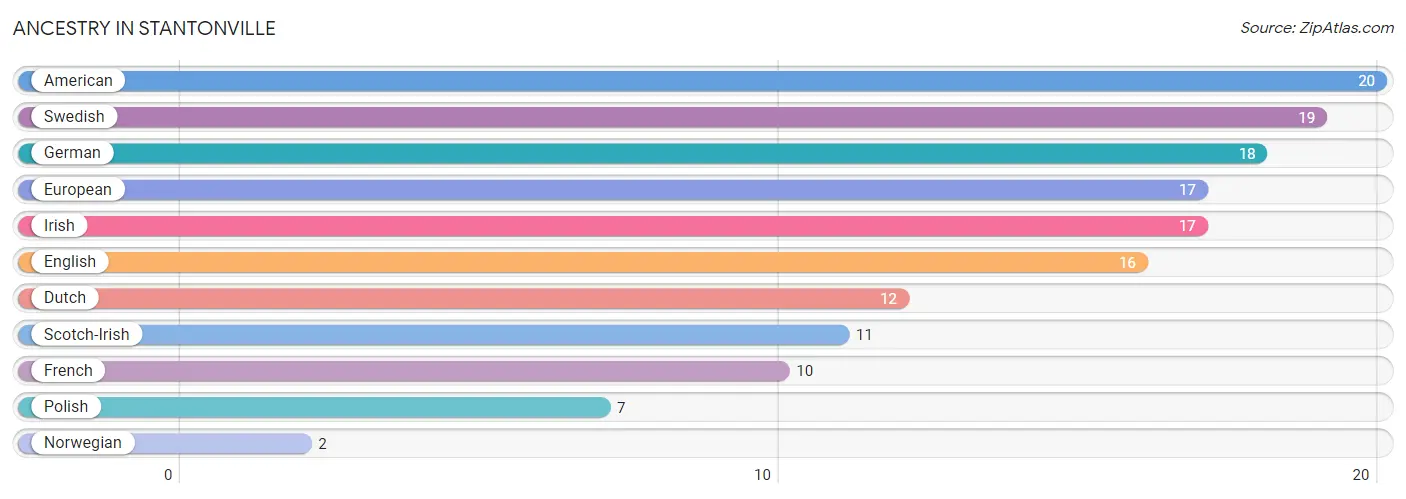
Ancestry in Stantonville
The most populous ancestries reported in Stantonville are American (20 | 5.0%), Swedish (19 | 4.8%), German (18 | 4.5%), European (17 | 4.3%), and Irish (17 | 4.3%), together accounting for 22.8% of all Stantonville residents.
| Ancestry | # Population | % Population |
| American | 20 | 5.0% |
| Dutch | 12 | 3.0% |
| English | 16 | 4.0% |
| European | 17 | 4.3% |
| French | 10 | 2.5% |
| German | 18 | 4.5% |
| Irish | 17 | 4.3% |
| Norwegian | 2 | 0.5% |
| Polish | 7 | 1.8% |
| Scotch-Irish | 11 | 2.8% |
| Swedish | 19 | 4.8% | View All 11 Rows |
Immigrants in Stantonville

| Immigration Origin | # Population | % Population | View All 0 Rows |
Sex and Age in Stantonville
Sex and Age in Stantonville
The most populous age groups in Stantonville are 50 to 54 Years (42 | 18.4%) for men and 45 to 49 Years (19 | 11.1%) for women.
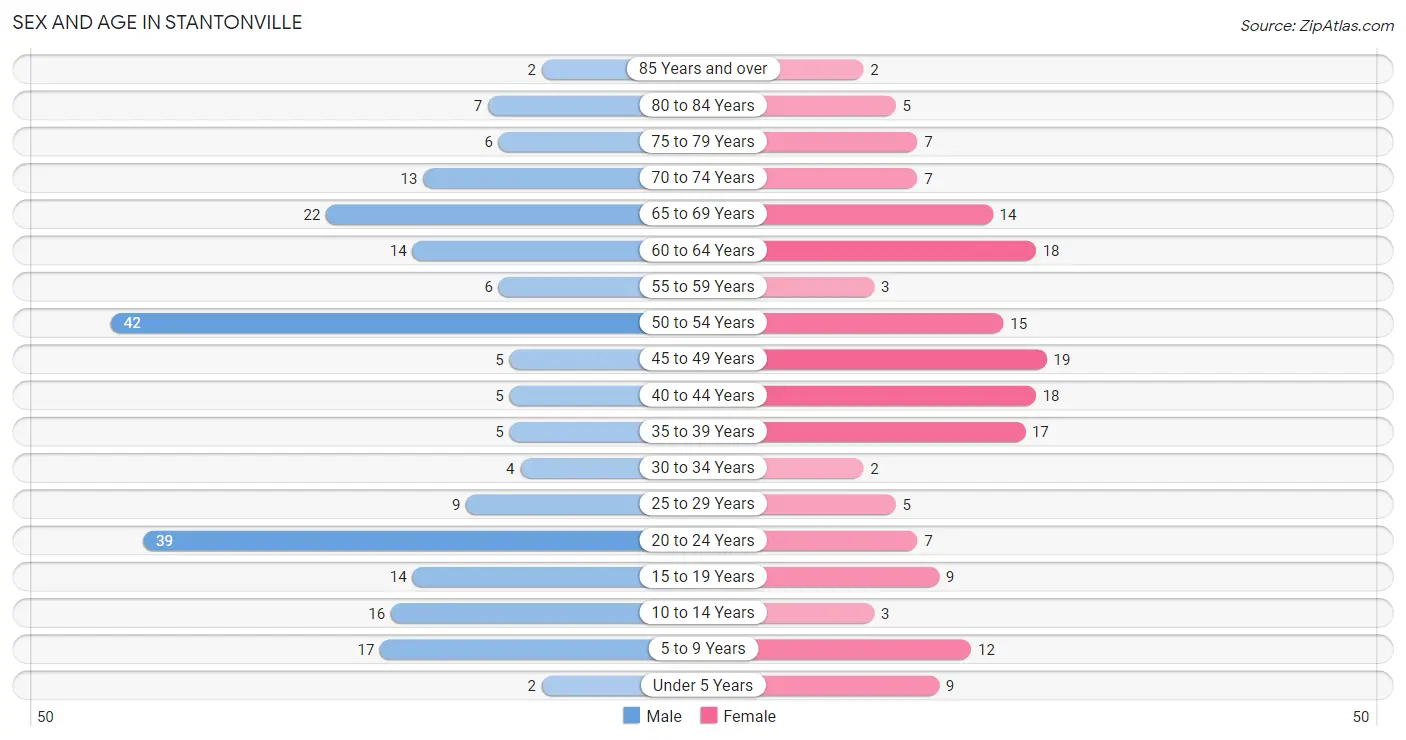
| Age Bracket | Male | Female |
| Under 5 Years | 2 (0.9%) | 9 (5.2%) |
| 5 to 9 Years | 17 (7.5%) | 12 (7.0%) |
| 10 to 14 Years | 16 (7.0%) | 3 (1.7%) |
| 15 to 19 Years | 14 (6.1%) | 9 (5.2%) |
| 20 to 24 Years | 39 (17.1%) | 7 (4.1%) |
| 25 to 29 Years | 9 (4.0%) | 5 (2.9%) |
| 30 to 34 Years | 4 (1.8%) | 2 (1.2%) |
| 35 to 39 Years | 5 (2.2%) | 17 (9.9%) |
| 40 to 44 Years | 5 (2.2%) | 18 (10.5%) |
| 45 to 49 Years | 5 (2.2%) | 19 (11.1%) |
| 50 to 54 Years | 42 (18.4%) | 15 (8.7%) |
| 55 to 59 Years | 6 (2.6%) | 3 (1.7%) |
| 60 to 64 Years | 14 (6.1%) | 18 (10.5%) |
| 65 to 69 Years | 22 (9.7%) | 14 (8.1%) |
| 70 to 74 Years | 13 (5.7%) | 7 (4.1%) |
| 75 to 79 Years | 6 (2.6%) | 7 (4.1%) |
| 80 to 84 Years | 7 (3.1%) | 5 (2.9%) |
| 85 Years and over | 2 (0.9%) | 2 (1.2%) |
| Total | 228 (100.0%) | 172 (100.0%) |
Families and Households in Stantonville
Median Family Size in Stantonville
The median family size in Stantonville is 3.22 persons per family, with single female/mother families (11 | 9.7%) accounting for the largest median family size of 5.36 persons per family. On the other hand, married-couple families (100 | 88.5%) represent the smallest median family size with 2.99 persons per family.
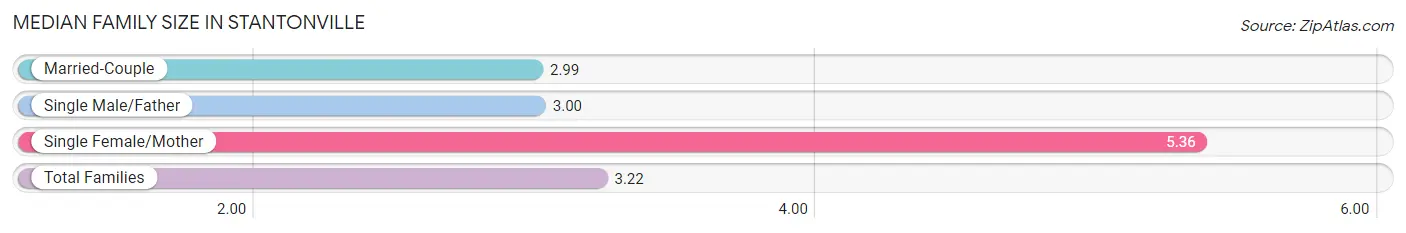
| Family Type | # Families | Family Size |
| Married-Couple | 100 (88.5%) | 2.99 |
| Single Male/Father | 2 (1.8%) | 3.00 |
| Single Female/Mother | 11 (9.7%) | 5.36 |
| Total Families | 113 (100.0%) | 3.22 |
Median Household Size in Stantonville
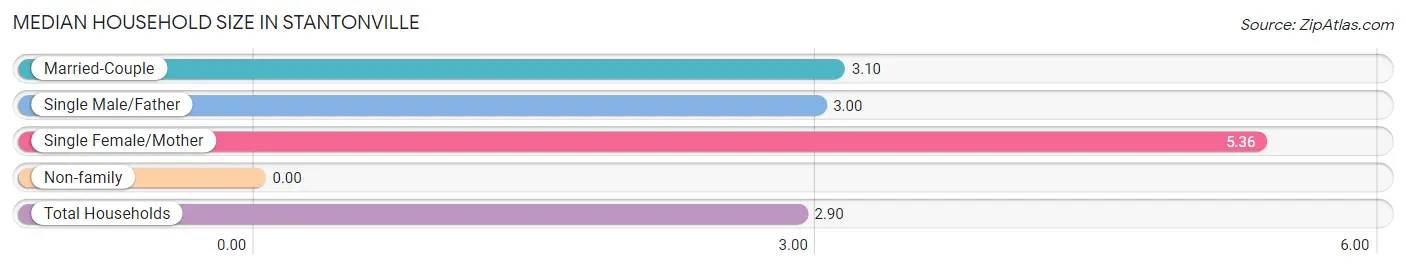
| Household Type | # Households | Household Size |
| Married-Couple | 100 (72.5%) | 3.10 |
| Single Male/Father | 2 (1.5%) | 3.00 |
| Single Female/Mother | 11 (8.0%) | 5.36 |
| Non-family | 25 (18.1%) | - |
| Total Households | 138 (100.0%) | 2.90 |
Household Size by Marriage Status in Stantonville
Out of a total of 138 households in Stantonville, 113 (81.9%) are family households, while 25 (18.1%) are nonfamily households. The most numerous type of family households are 2-person households, comprising 46, and the most common type of nonfamily households are 1-person households, comprising 25.
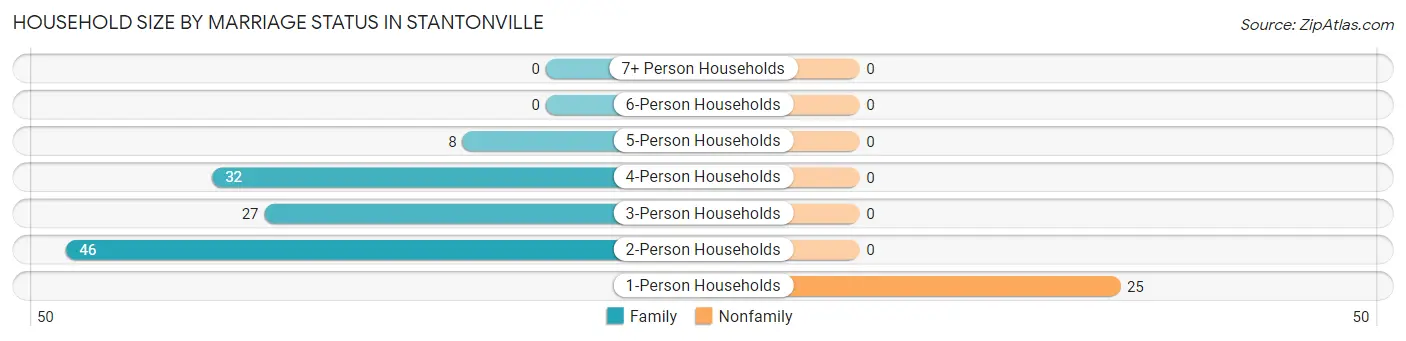
| Household Size | Family Households | Nonfamily Households |
| 1-Person Households | - | 25 (18.1%) |
| 2-Person Households | 46 (33.3%) | 0 (0.0%) |
| 3-Person Households | 27 (19.6%) | 0 (0.0%) |
| 4-Person Households | 32 (23.2%) | 0 (0.0%) |
| 5-Person Households | 8 (5.8%) | 0 (0.0%) |
| 6-Person Households | 0 (0.0%) | 0 (0.0%) |
| 7+ Person Households | 0 (0.0%) | 0 (0.0%) |
| Total | 113 (81.9%) | 25 (18.1%) |
Female Fertility in Stantonville
Fertility by Age in Stantonville
| Age Bracket | Women with Births | Births / 1,000 Women |
| 15 to 19 years | 0 (0.0%) | 0.0 |
| 20 to 34 years | 0 (0.0%) | 0.0 |
| 35 to 50 years | 0 (0.0%) | 0.0 |
| Total | 0 (0.0%) | 0.0 |
Fertility by Age by Marriage Status in Stantonville
| Age Bracket | Married | Unmarried |
| 15 to 19 years | 0 (0.0%) | 0 (0.0%) |
| 20 to 34 years | 0 (0.0%) | 0 (0.0%) |
| 35 to 50 years | 0 (0.0%) | 0 (0.0%) |
| Total | 0 (0.0%) | 0 (0.0%) |
Fertility by Education in Stantonville
| Educational Attainment | Women with Births | Births / 1,000 Women |
| Less than High School | 0 (0.0%) | 0.0 |
| High School Diploma | 0 (0.0%) | 0.0 |
| College or Associate's Degree | 0 (0.0%) | 0.0 |
| Bachelor's Degree | 0 (0.0%) | 0.0 |
| Graduate Degree | 0 (0.0%) | 0.0 |
| Total | 0 (0.0%) | 0.0 |
Fertility by Education by Marriage Status in Stantonville
| Educational Attainment | Married | Unmarried |
| Less than High School | 0 (0.0%) | 0 (0.0%) |
| High School Diploma | 0 (0.0%) | 0 (0.0%) |
| College or Associate's Degree | 0 (0.0%) | 0 (0.0%) |
| Bachelor's Degree | 0 (0.0%) | 0 (0.0%) |
| Graduate Degree | 0 (0.0%) | 0 (0.0%) |
| Total | 0 (0.0%) | 0 (0.0%) |
Employment Characteristics in Stantonville
Employment by Class of Employer in Stantonville
Among the 145 employed individuals in Stantonville, private company employees (110 | 75.9%), self-employed (not incorporated) (18 | 12.4%), and local government employees (15 | 10.3%) make up the most common classes of employment.
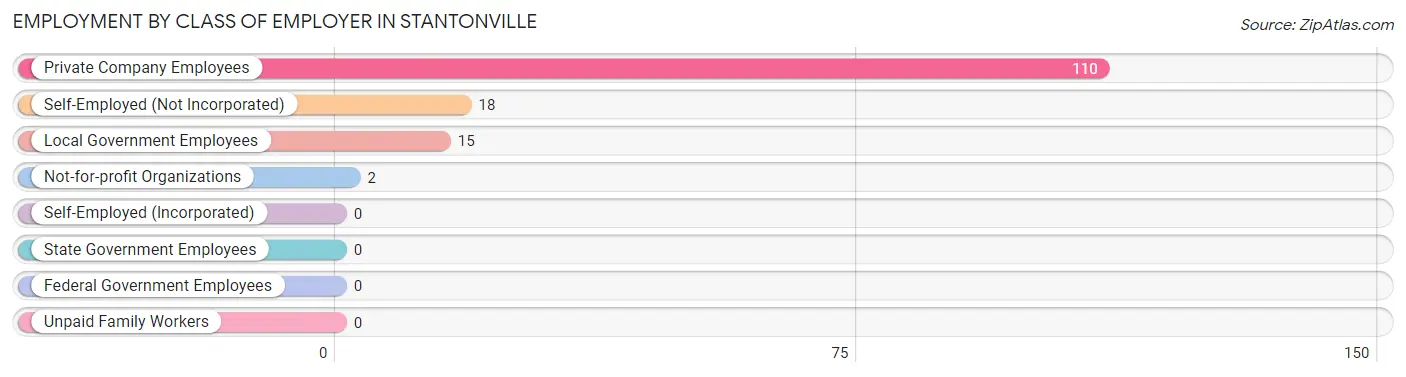
| Employer Class | # Employees | % Employees |
| Private Company Employees | 110 | 75.9% |
| Self-Employed (Incorporated) | 0 | 0.0% |
| Self-Employed (Not Incorporated) | 18 | 12.4% |
| Not-for-profit Organizations | 2 | 1.4% |
| Local Government Employees | 15 | 10.3% |
| State Government Employees | 0 | 0.0% |
| Federal Government Employees | 0 | 0.0% |
| Unpaid Family Workers | 0 | 0.0% |
| Total | 145 | 100.0% |
Employment Status by Age in Stantonville
According to the labor force statistics for Stantonville, out of the total population over 16 years of age (341), 44.6% or 152 individuals are in the labor force, with 0.7% or 1 of them unemployed. The age group with the highest labor force participation rate is 20 to 24 years, with 93.5% or 43 individuals in the labor force. Within the labor force, the 30 to 34 years age range has the highest percentage of unemployed individuals, with 50.0% or 1 of them being unemployed.
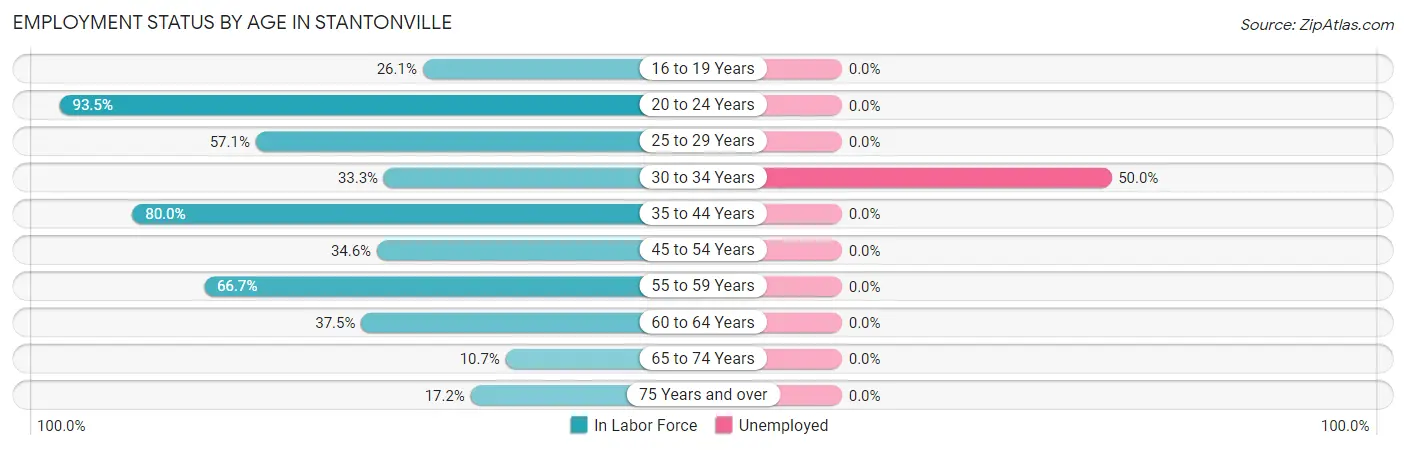
| Age Bracket | In Labor Force | Unemployed |
| 16 to 19 Years | 6 (26.1%) | 0 (0.0%) |
| 20 to 24 Years | 43 (93.5%) | 0 (0.0%) |
| 25 to 29 Years | 8 (57.1%) | 0 (0.0%) |
| 30 to 34 Years | 2 (33.3%) | 1 (50.0%) |
| 35 to 44 Years | 36 (80.0%) | 0 (0.0%) |
| 45 to 54 Years | 28 (34.6%) | 0 (0.0%) |
| 55 to 59 Years | 6 (66.7%) | 0 (0.0%) |
| 60 to 64 Years | 12 (37.5%) | 0 (0.0%) |
| 65 to 74 Years | 6 (10.7%) | 0 (0.0%) |
| 75 Years and over | 5 (17.2%) | 0 (0.0%) |
| Total | 152 (44.6%) | 1 (0.7%) |
Employment Status by Educational Attainment in Stantonville
According to labor force statistics for Stantonville, 49.2% of individuals (92) out of the total population between 25 and 64 years of age (187) are in the labor force, with 1.1% or 1 of them being unemployed. The group with the highest labor force participation rate are those with the educational attainment of bachelor's degree or higher, with 100.0% or 12 individuals in the labor force. Within the labor force, individuals with bachelor's degree or higher education have the highest percentage of unemployment, with 8.3% or 1 of them being unemployed.
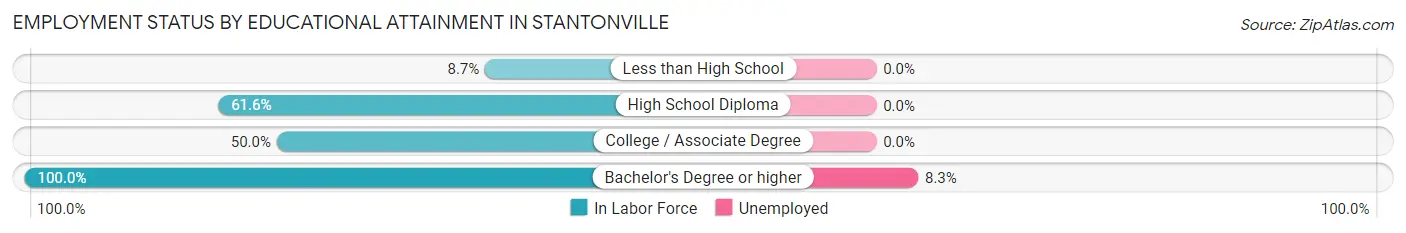
| Educational Attainment | In Labor Force | Unemployed |
| Less than High School | 4 (8.7%) | 0 (0.0%) |
| High School Diploma | 61 (61.6%) | 0 (0.0%) |
| College / Associate Degree | 15 (50.0%) | 0 (0.0%) |
| Bachelor's Degree or higher | 12 (100.0%) | 1 (8.3%) |
| Total | 92 (49.2%) | 2 (1.1%) |
Employment Occupations by Sex in Stantonville
Management, Business, Science and Arts Occupations
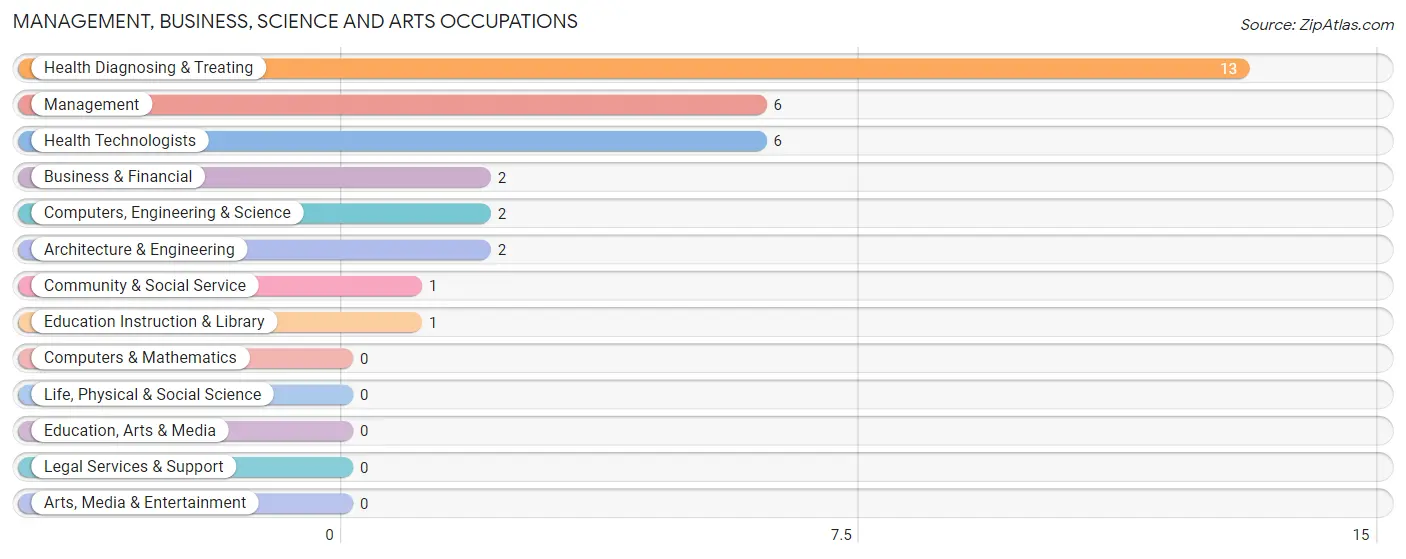
The most common Management, Business, Science and Arts occupations in Stantonville are Health Diagnosing & Treating (13 | 8.6%), Management (6 | 4.0%), Health Technologists (6 | 4.0%), Business & Financial (2 | 1.3%), and Computers, Engineering & Science (2 | 1.3%).
Management, Business, Science and Arts Occupations by Sex
Within the Management, Business, Science and Arts occupations in Stantonville, the most male-oriented occupations are Management (100.0%), Business & Financial (100.0%), and Computers, Engineering & Science (100.0%), while the most female-oriented occupations are Community & Social Service (100.0%), Education Instruction & Library (100.0%), and Health Diagnosing & Treating (100.0%).
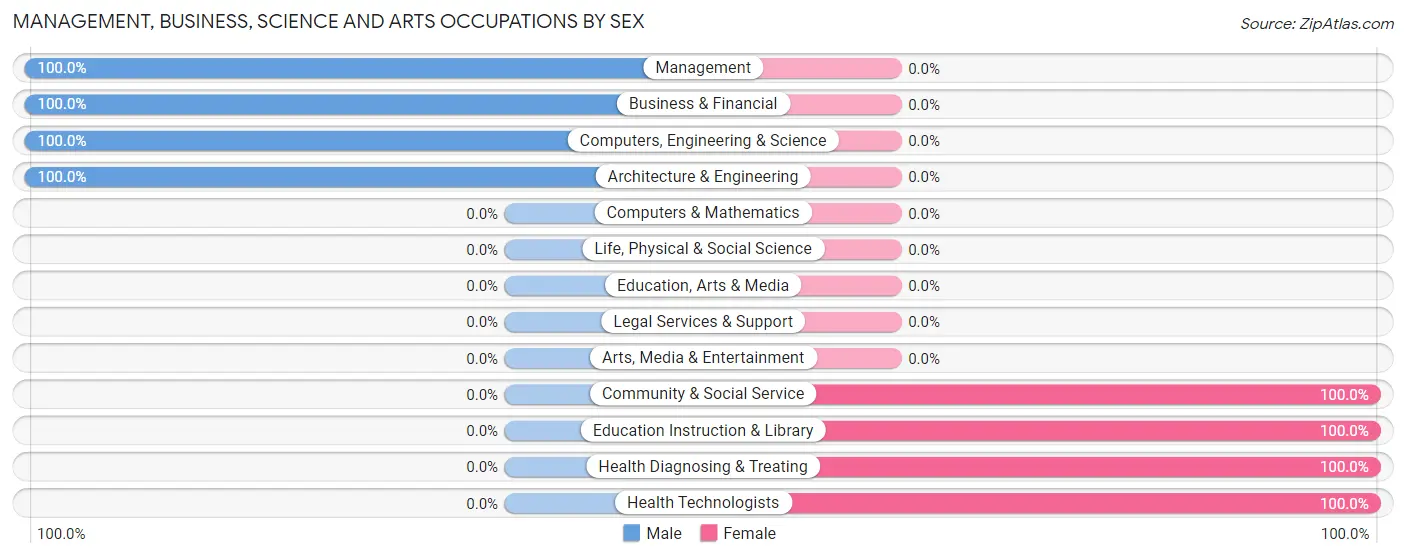
| Occupation | Male | Female |
| Management | 6 (100.0%) | 0 (0.0%) |
| Business & Financial | 2 (100.0%) | 0 (0.0%) |
| Computers, Engineering & Science | 2 (100.0%) | 0 (0.0%) |
| Computers & Mathematics | 0 (0.0%) | 0 (0.0%) |
| Architecture & Engineering | 2 (100.0%) | 0 (0.0%) |
| Life, Physical & Social Science | 0 (0.0%) | 0 (0.0%) |
| Community & Social Service | 0 (0.0%) | 1 (100.0%) |
| Education, Arts & Media | 0 (0.0%) | 0 (0.0%) |
| Legal Services & Support | 0 (0.0%) | 0 (0.0%) |
| Education Instruction & Library | 0 (0.0%) | 1 (100.0%) |
| Arts, Media & Entertainment | 0 (0.0%) | 0 (0.0%) |
| Health Diagnosing & Treating | 0 (0.0%) | 13 (100.0%) |
| Health Technologists | 0 (0.0%) | 6 (100.0%) |
| Total (Category) | 10 (41.7%) | 14 (58.3%) |
| Total (Overall) | 100 (66.2%) | 51 (33.8%) |
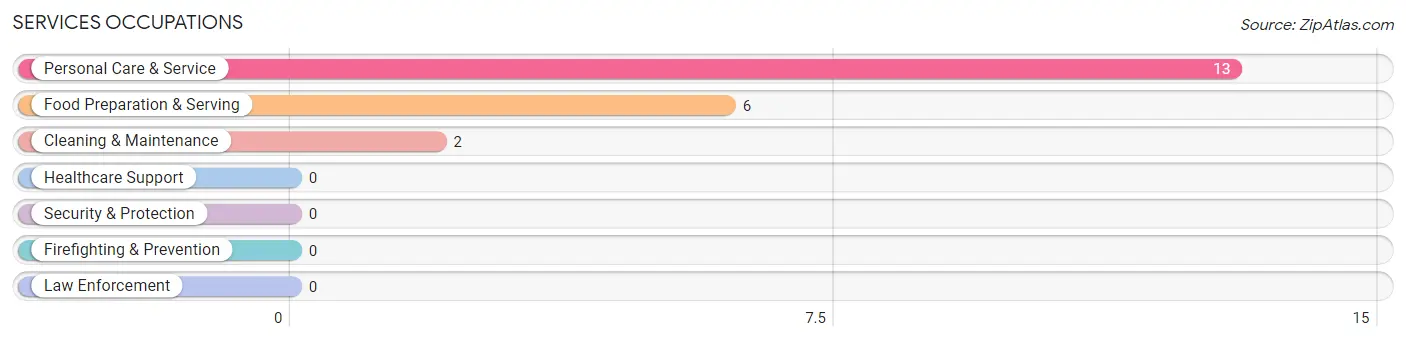
Services Occupations
The most common Services occupations in Stantonville are Personal Care & Service (13 | 8.6%), Food Preparation & Serving (6 | 4.0%), and Cleaning & Maintenance (2 | 1.3%).
Services Occupations by Sex
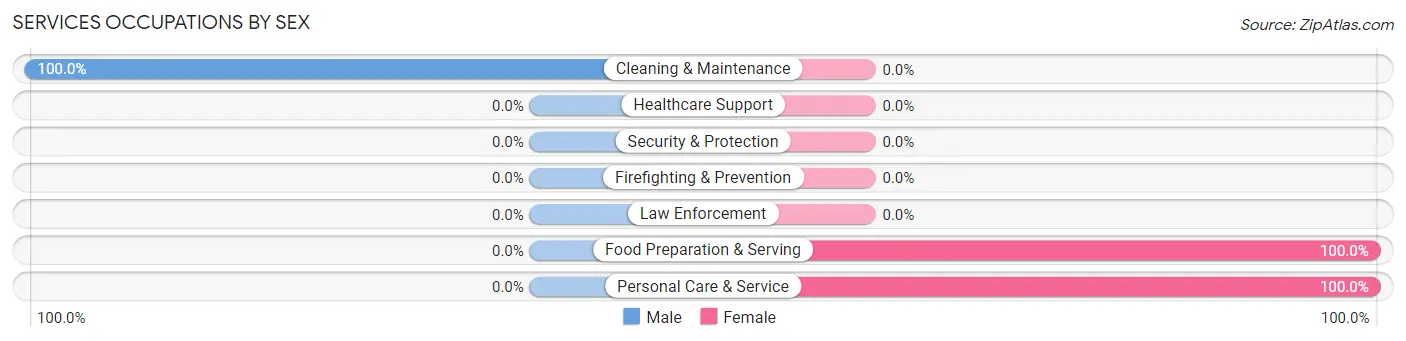
| Occupation | Male | Female |
| Healthcare Support | 0 (0.0%) | 0 (0.0%) |
| Security & Protection | 0 (0.0%) | 0 (0.0%) |
| Firefighting & Prevention | 0 (0.0%) | 0 (0.0%) |
| Law Enforcement | 0 (0.0%) | 0 (0.0%) |
| Food Preparation & Serving | 0 (0.0%) | 6 (100.0%) |
| Cleaning & Maintenance | 2 (100.0%) | 0 (0.0%) |
| Personal Care & Service | 0 (0.0%) | 13 (100.0%) |
| Total (Category) | 2 (9.5%) | 19 (90.5%) |
| Total (Overall) | 100 (66.2%) | 51 (33.8%) |
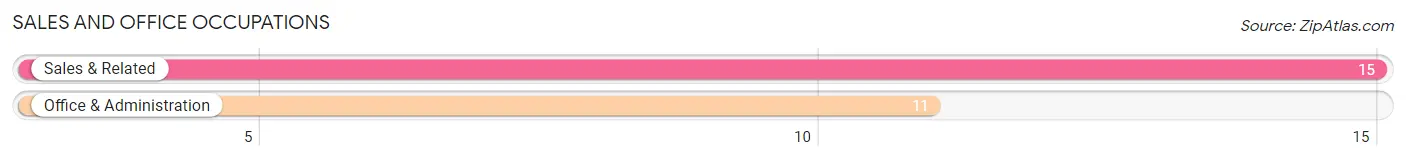
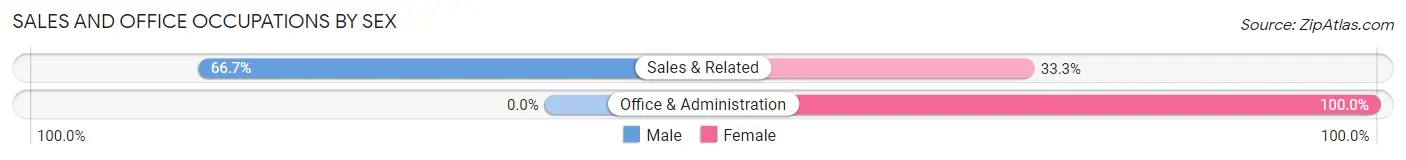
Sales and Office Occupations
The most common Sales and Office occupations in Stantonville are Sales & Related (15 | 9.9%), and Office & Administration (11 | 7.3%).
Sales and Office Occupations by Sex
| Occupation | Male | Female |
| Sales & Related | 10 (66.7%) | 5 (33.3%) |
| Office & Administration | 0 (0.0%) | 11 (100.0%) |
| Total (Category) | 10 (38.5%) | 16 (61.5%) |
| Total (Overall) | 100 (66.2%) | 51 (33.8%) |
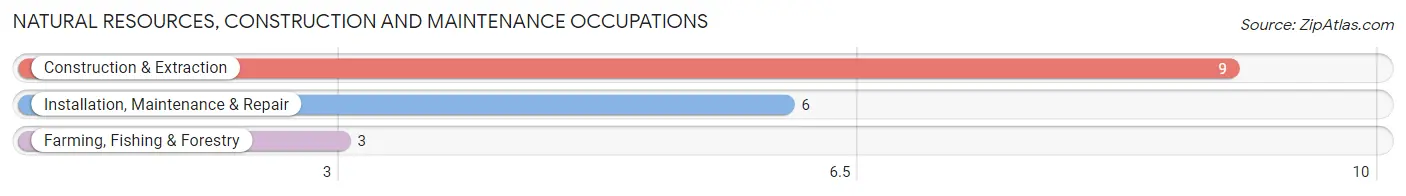
Natural Resources, Construction and Maintenance Occupations
The most common Natural Resources, Construction and Maintenance occupations in Stantonville are Construction & Extraction (9 | 6.0%), Installation, Maintenance & Repair (6 | 4.0%), and Farming, Fishing & Forestry (3 | 2.0%).
Natural Resources, Construction and Maintenance Occupations by Sex
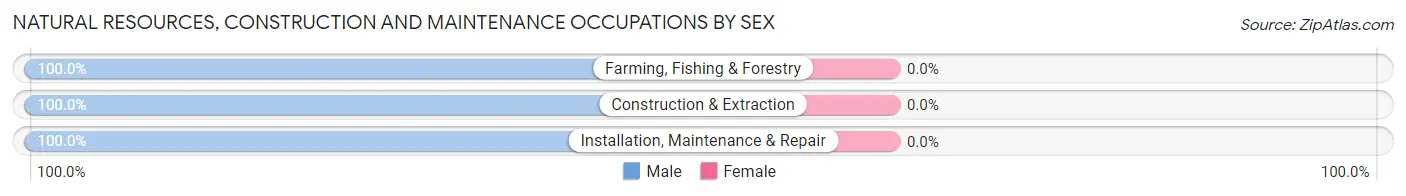
| Occupation | Male | Female |
| Farming, Fishing & Forestry | 3 (100.0%) | 0 (0.0%) |
| Construction & Extraction | 9 (100.0%) | 0 (0.0%) |
| Installation, Maintenance & Repair | 6 (100.0%) | 0 (0.0%) |
| Total (Category) | 18 (100.0%) | 0 (0.0%) |
| Total (Overall) | 100 (66.2%) | 51 (33.8%) |
Production, Transportation and Moving Occupations
The most common Production, Transportation and Moving occupations in Stantonville are Material Moving (39 | 25.8%), Production (14 | 9.3%), and Transportation (9 | 6.0%).
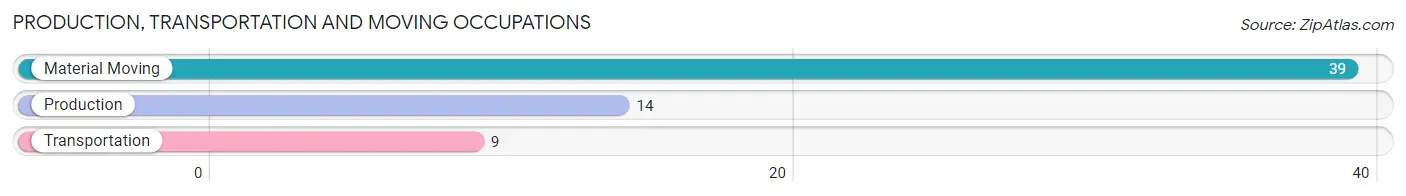
Production, Transportation and Moving Occupations by Sex
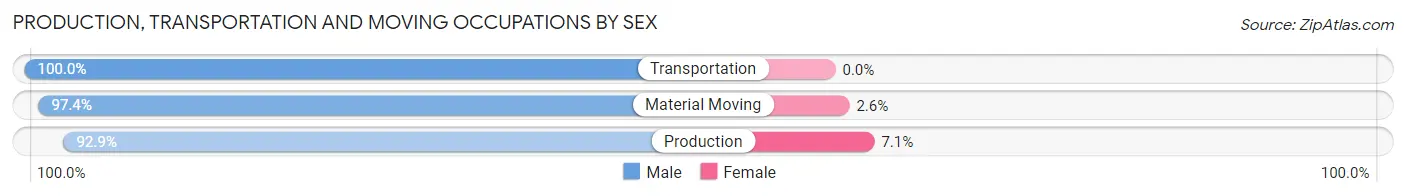
| Occupation | Male | Female |
| Production | 13 (92.9%) | 1 (7.1%) |
| Transportation | 9 (100.0%) | 0 (0.0%) |
| Material Moving | 38 (97.4%) | 1 (2.6%) |
| Total (Category) | 60 (96.8%) | 2 (3.2%) |
| Total (Overall) | 100 (66.2%) | 51 (33.8%) |
Employment Industries by Sex in Stantonville
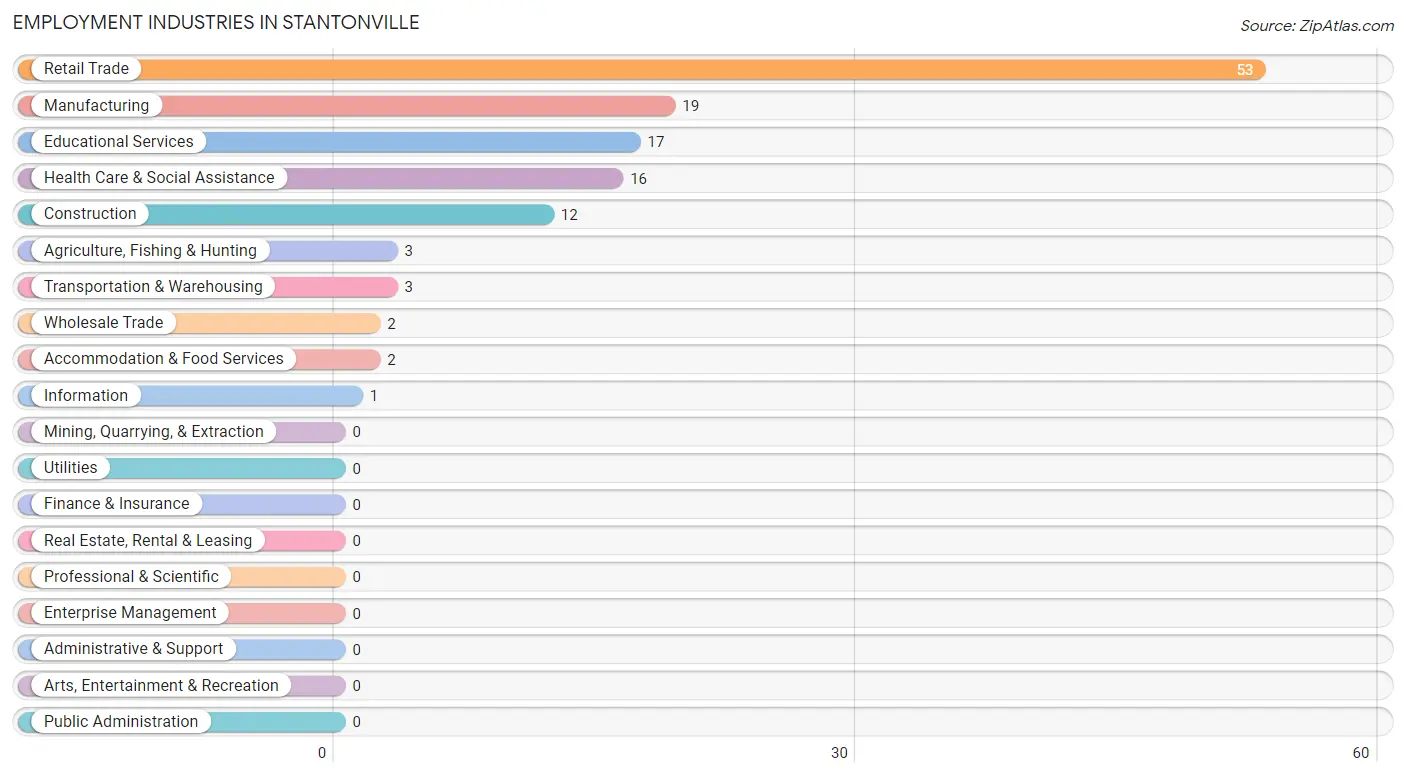
Employment Industries in Stantonville
The major employment industries in Stantonville include Retail Trade (53 | 35.1%), Manufacturing (19 | 12.6%), Educational Services (17 | 11.3%), Health Care & Social Assistance (16 | 10.6%), and Construction (12 | 8.0%).
Employment Industries by Sex in Stantonville
The Stantonville industries that see more men than women are Agriculture, Fishing & Hunting (100.0%), Construction (100.0%), and Wholesale Trade (100.0%), whereas the industries that tend to have a higher number of women are Information (100.0%), Health Care & Social Assistance (100.0%), and Accommodation & Food Services (100.0%).
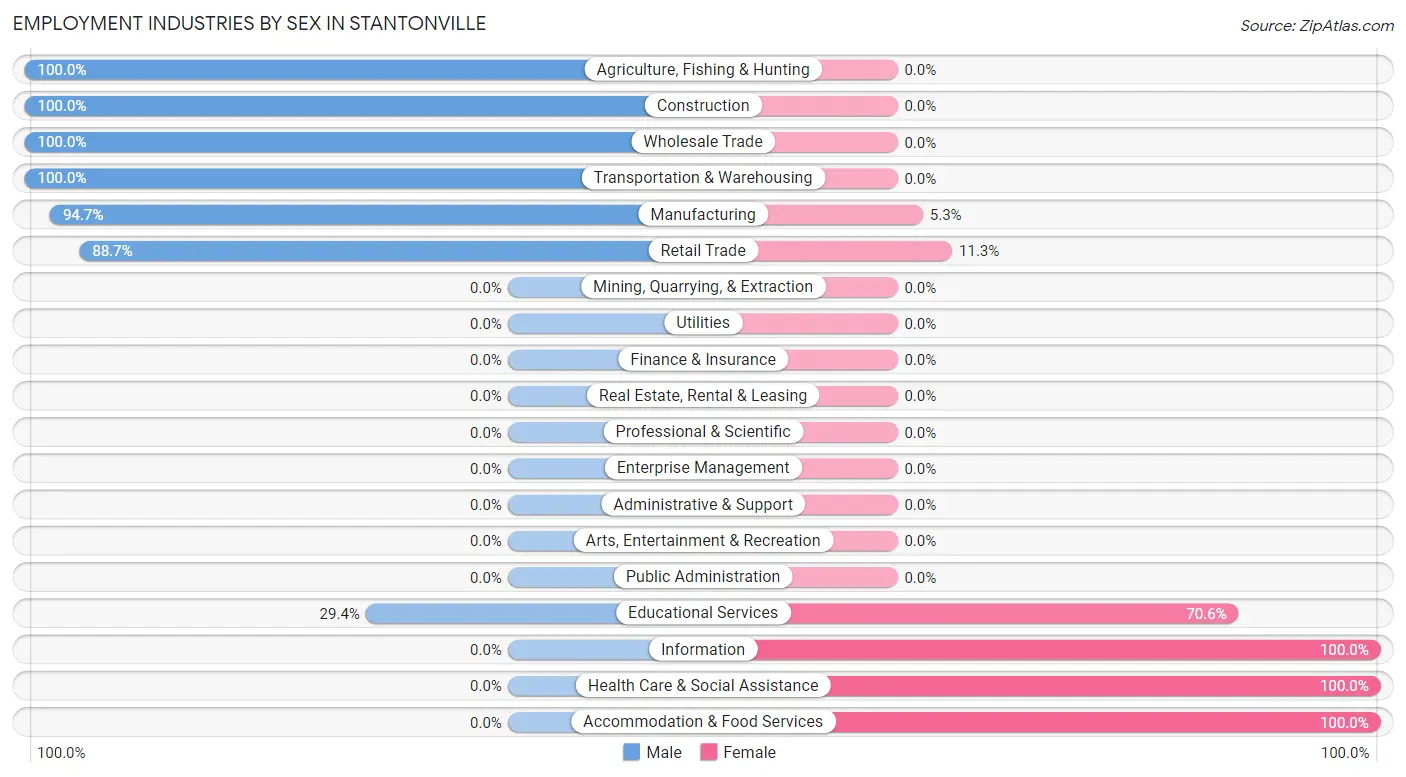
| Industry | Male | Female |
| Agriculture, Fishing & Hunting | 3 (100.0%) | 0 (0.0%) |
| Mining, Quarrying, & Extraction | 0 (0.0%) | 0 (0.0%) |
| Construction | 12 (100.0%) | 0 (0.0%) |
| Manufacturing | 18 (94.7%) | 1 (5.3%) |
| Wholesale Trade | 2 (100.0%) | 0 (0.0%) |
| Retail Trade | 47 (88.7%) | 6 (11.3%) |
| Transportation & Warehousing | 3 (100.0%) | 0 (0.0%) |
| Utilities | 0 (0.0%) | 0 (0.0%) |
| Information | 0 (0.0%) | 1 (100.0%) |
| Finance & Insurance | 0 (0.0%) | 0 (0.0%) |
| Real Estate, Rental & Leasing | 0 (0.0%) | 0 (0.0%) |
| Professional & Scientific | 0 (0.0%) | 0 (0.0%) |
| Enterprise Management | 0 (0.0%) | 0 (0.0%) |
| Administrative & Support | 0 (0.0%) | 0 (0.0%) |
| Educational Services | 5 (29.4%) | 12 (70.6%) |
| Health Care & Social Assistance | 0 (0.0%) | 16 (100.0%) |
| Arts, Entertainment & Recreation | 0 (0.0%) | 0 (0.0%) |
| Accommodation & Food Services | 0 (0.0%) | 2 (100.0%) |
| Public Administration | 0 (0.0%) | 0 (0.0%) |
| Total | 100 (66.2%) | 51 (33.8%) |
Education in Stantonville
School Enrollment in Stantonville
The most common levels of schooling among the 99 students in Stantonville are college / undergraduate (44 | 44.4%), high school (20 | 20.2%), and nursery / preschool (11 | 11.1%).
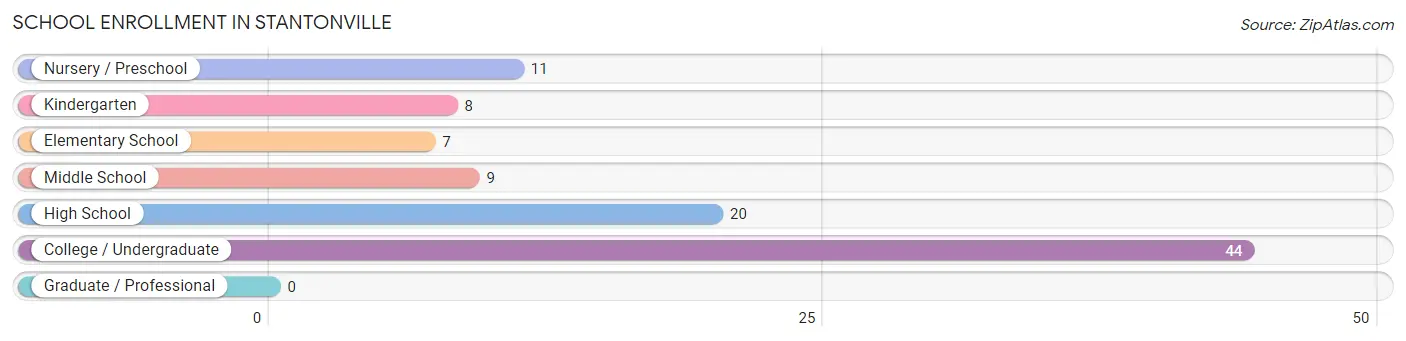
| School Level | # Students | % Students |
| Nursery / Preschool | 11 | 11.1% |
| Kindergarten | 8 | 8.1% |
| Elementary School | 7 | 7.1% |
| Middle School | 9 | 9.1% |
| High School | 20 | 20.2% |
| College / Undergraduate | 44 | 44.4% |
| Graduate / Professional | 0 | 0.0% |
| Total | 99 | 100.0% |
School Enrollment by Age by Funding Source in Stantonville
Out of a total of 99 students who are enrolled in schools in Stantonville, 42 (42.4%) attend a private institution, while the remaining 57 (57.6%) are enrolled in public schools. The age group of 20 to 24 year olds has the highest likelihood of being enrolled in private schools, with 40 (100.0% in the age bracket) enrolled. Conversely, the age group of 3 to 4 year olds has the lowest likelihood of being enrolled in a private school, with 2 (100.0% in the age bracket) attending a public institution.
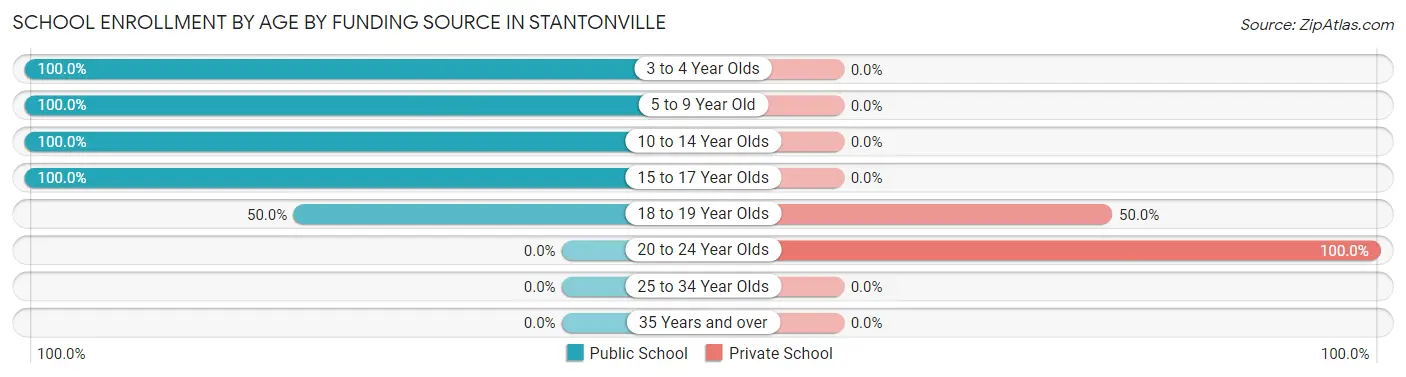
| Age Bracket | Public School | Private School |
| 3 to 4 Year Olds | 2 (100.0%) | 0 (0.0%) |
| 5 to 9 Year Old | 24 (100.0%) | 0 (0.0%) |
| 10 to 14 Year Olds | 19 (100.0%) | 0 (0.0%) |
| 15 to 17 Year Olds | 10 (100.0%) | 0 (0.0%) |
| 18 to 19 Year Olds | 2 (50.0%) | 2 (50.0%) |
| 20 to 24 Year Olds | 0 (0.0%) | 40 (100.0%) |
| 25 to 34 Year Olds | 0 (0.0%) | 0 (0.0%) |
| 35 Years and over | 0 (0.0%) | 0 (0.0%) |
| Total | 57 (57.6%) | 42 (42.4%) |
Educational Attainment by Field of Study in Stantonville
Education (18 | 50.0%), liberal arts & history (8 | 22.2%), business (4 | 11.1%), engineering (3 | 8.3%), and multidisciplinary studies (2 | 5.6%) are the most common fields of study among 36 individuals in Stantonville who have obtained a bachelor's degree or higher.
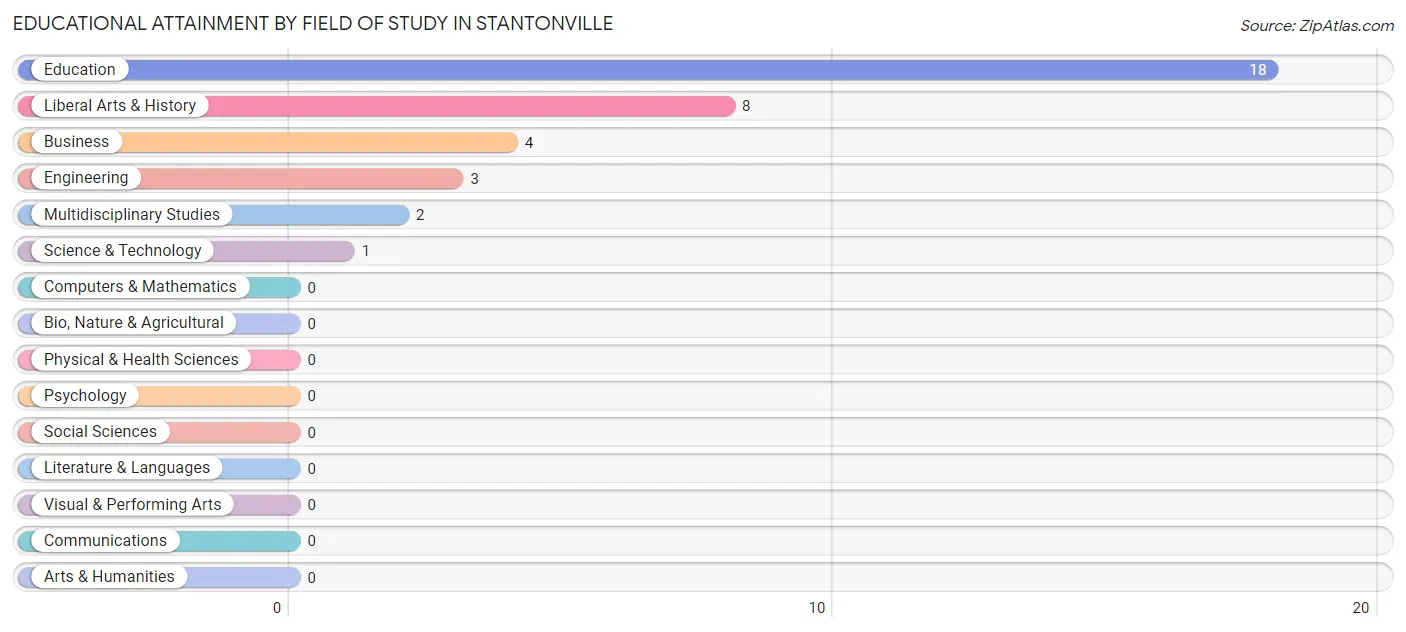
| Field of Study | # Graduates | % Graduates |
| Computers & Mathematics | 0 | 0.0% |
| Bio, Nature & Agricultural | 0 | 0.0% |
| Physical & Health Sciences | 0 | 0.0% |
| Psychology | 0 | 0.0% |
| Social Sciences | 0 | 0.0% |
| Engineering | 3 | 8.3% |
| Multidisciplinary Studies | 2 | 5.6% |
| Science & Technology | 1 | 2.8% |
| Business | 4 | 11.1% |
| Education | 18 | 50.0% |
| Literature & Languages | 0 | 0.0% |
| Liberal Arts & History | 8 | 22.2% |
| Visual & Performing Arts | 0 | 0.0% |
| Communications | 0 | 0.0% |
| Arts & Humanities | 0 | 0.0% |
| Total | 36 | 100.0% |
Transportation & Commute in Stantonville
Vehicle Availability by Sex in Stantonville
The most prevalent vehicle ownership categories in Stantonville are males with 3 vehicles (58, accounting for 59.2%) and females with 3 vehicles (13, making up 123.4%).
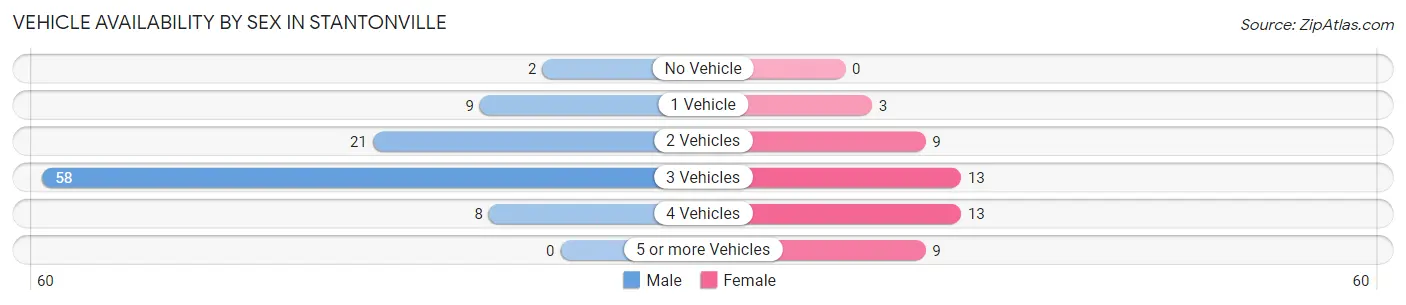
| Vehicles Available | Male | Female |
| No Vehicle | 2 (2.0%) | 0 (0.0%) |
| 1 Vehicle | 9 (9.2%) | 3 (6.4%) |
| 2 Vehicles | 21 (21.4%) | 9 (19.2%) |
| 3 Vehicles | 58 (59.2%) | 13 (27.7%) |
| 4 Vehicles | 8 (8.2%) | 13 (27.7%) |
| 5 or more Vehicles | 0 (0.0%) | 9 (19.2%) |
| Total | 98 (100.0%) | 47 (100.0%) |
Commute Time in Stantonville
The most frequently occuring commute durations in Stantonville are 20 to 24 minutes (49 commuters, 33.8%), 5 to 9 minutes (21 commuters, 14.5%), and 15 to 19 minutes (16 commuters, 11.0%).
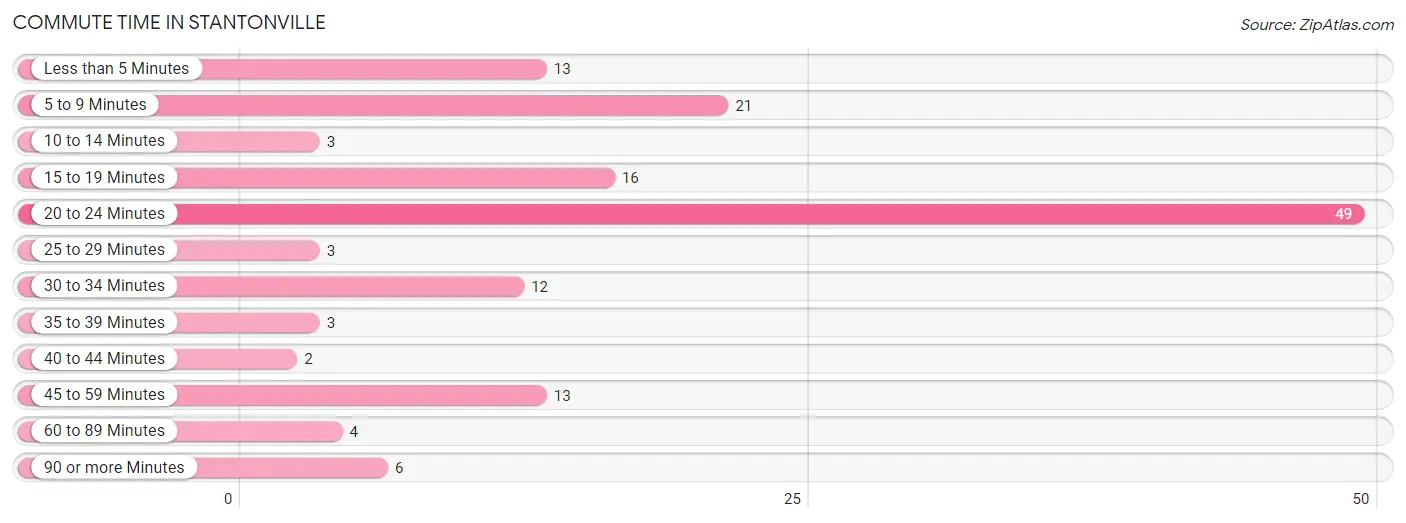
| Commute Time | # Commuters | % Commuters |
| Less than 5 Minutes | 13 | 9.0% |
| 5 to 9 Minutes | 21 | 14.5% |
| 10 to 14 Minutes | 3 | 2.1% |
| 15 to 19 Minutes | 16 | 11.0% |
| 20 to 24 Minutes | 49 | 33.8% |
| 25 to 29 Minutes | 3 | 2.1% |
| 30 to 34 Minutes | 12 | 8.3% |
| 35 to 39 Minutes | 3 | 2.1% |
| 40 to 44 Minutes | 2 | 1.4% |
| 45 to 59 Minutes | 13 | 9.0% |
| 60 to 89 Minutes | 4 | 2.8% |
| 90 or more Minutes | 6 | 4.1% |
Commute Time by Sex in Stantonville
The most common commute times in Stantonville are 20 to 24 minutes (46 commuters, 46.9%) for males and less than 5 minutes (13 commuters, 27.7%) for females.
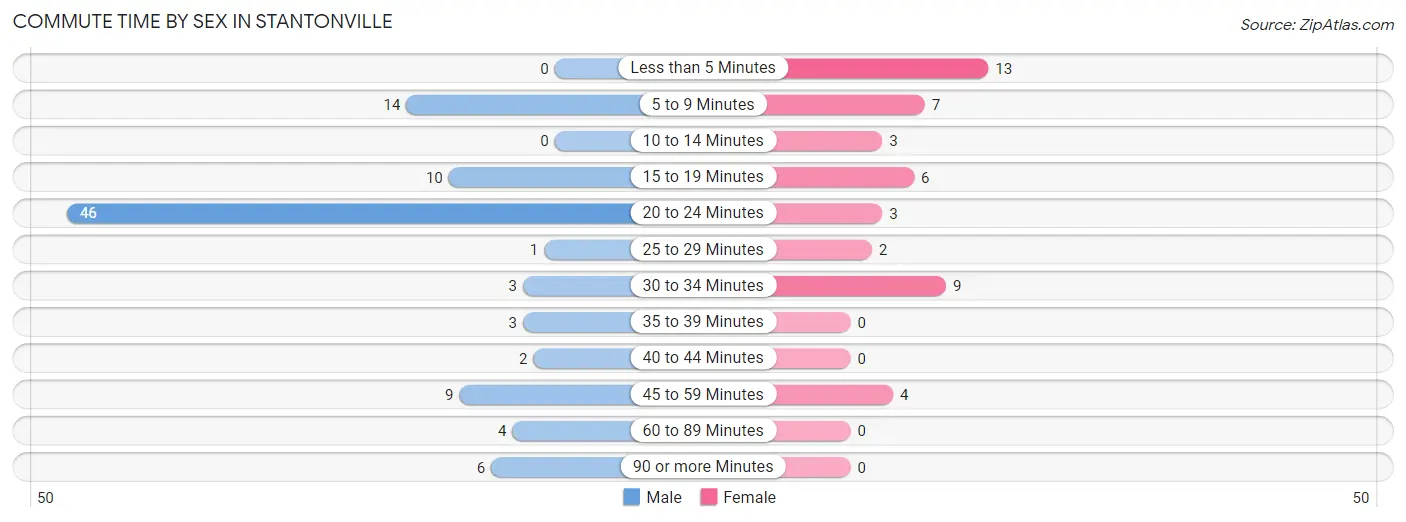
| Commute Time | Male | Female |
| Less than 5 Minutes | 0 (0.0%) | 13 (27.7%) |
| 5 to 9 Minutes | 14 (14.3%) | 7 (14.9%) |
| 10 to 14 Minutes | 0 (0.0%) | 3 (6.4%) |
| 15 to 19 Minutes | 10 (10.2%) | 6 (12.8%) |
| 20 to 24 Minutes | 46 (46.9%) | 3 (6.4%) |
| 25 to 29 Minutes | 1 (1.0%) | 2 (4.3%) |
| 30 to 34 Minutes | 3 (3.1%) | 9 (19.2%) |
| 35 to 39 Minutes | 3 (3.1%) | 0 (0.0%) |
| 40 to 44 Minutes | 2 (2.0%) | 0 (0.0%) |
| 45 to 59 Minutes | 9 (9.2%) | 4 (8.5%) |
| 60 to 89 Minutes | 4 (4.1%) | 0 (0.0%) |
| 90 or more Minutes | 6 (6.1%) | 0 (0.0%) |
Time of Departure to Work by Sex in Stantonville
The most frequent times of departure to work in Stantonville are 8:30 AM to 8:59 AM (37, 37.8%) for males and 8:30 AM to 8:59 AM (13, 27.7%) for females.
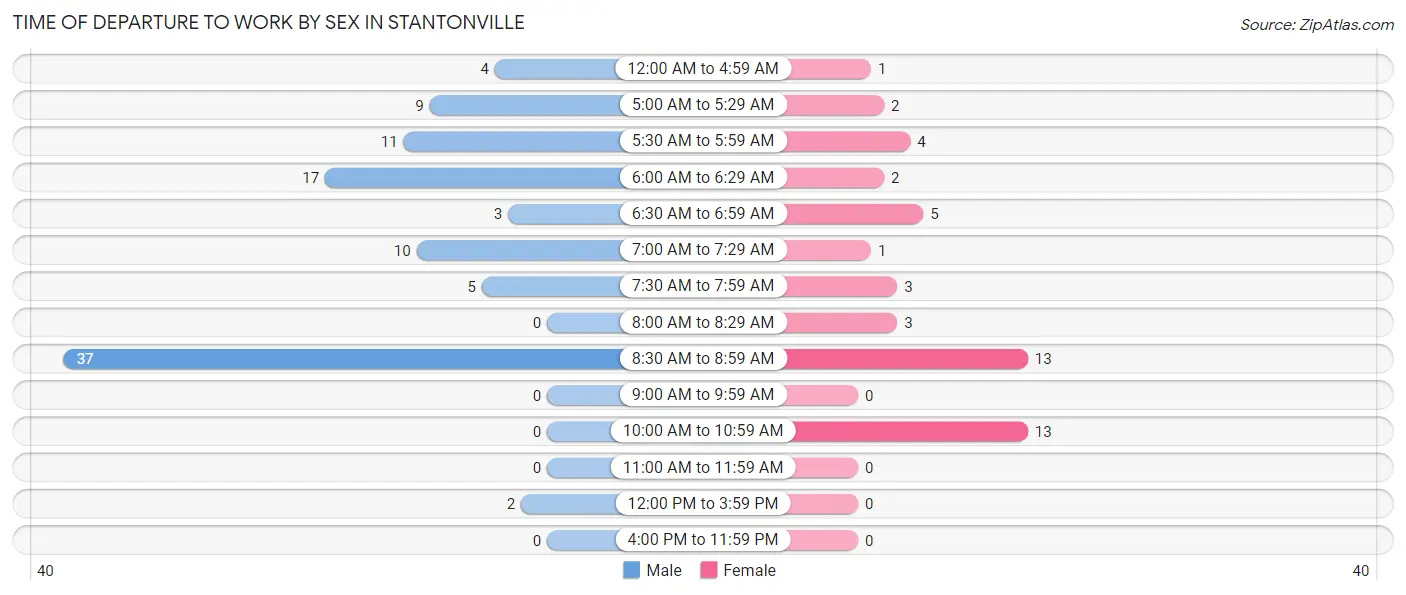
| Time of Departure | Male | Female |
| 12:00 AM to 4:59 AM | 4 (4.1%) | 1 (2.1%) |
| 5:00 AM to 5:29 AM | 9 (9.2%) | 2 (4.3%) |
| 5:30 AM to 5:59 AM | 11 (11.2%) | 4 (8.5%) |
| 6:00 AM to 6:29 AM | 17 (17.3%) | 2 (4.3%) |
| 6:30 AM to 6:59 AM | 3 (3.1%) | 5 (10.6%) |
| 7:00 AM to 7:29 AM | 10 (10.2%) | 1 (2.1%) |
| 7:30 AM to 7:59 AM | 5 (5.1%) | 3 (6.4%) |
| 8:00 AM to 8:29 AM | 0 (0.0%) | 3 (6.4%) |
| 8:30 AM to 8:59 AM | 37 (37.8%) | 13 (27.7%) |
| 9:00 AM to 9:59 AM | 0 (0.0%) | 0 (0.0%) |
| 10:00 AM to 10:59 AM | 0 (0.0%) | 13 (27.7%) |
| 11:00 AM to 11:59 AM | 0 (0.0%) | 0 (0.0%) |
| 12:00 PM to 3:59 PM | 2 (2.0%) | 0 (0.0%) |
| 4:00 PM to 11:59 PM | 0 (0.0%) | 0 (0.0%) |
| Total | 98 (100.0%) | 47 (100.0%) |
Housing Occupancy in Stantonville
Occupancy by Ownership in Stantonville
Of the total 138 dwellings in Stantonville, owner-occupied units account for 118 (85.5%), while renter-occupied units make up 20 (14.5%).
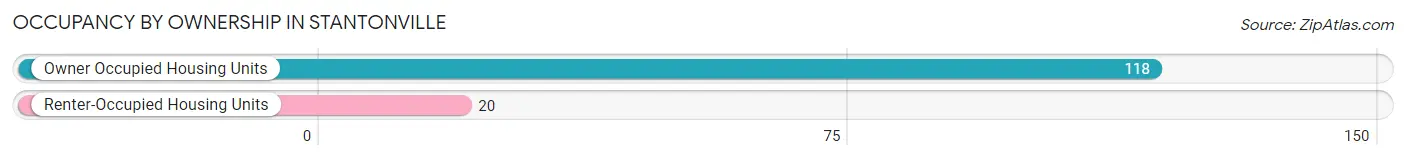
| Occupancy | # Housing Units | % Housing Units |
| Owner Occupied Housing Units | 118 | 85.5% |
| Renter-Occupied Housing Units | 20 | 14.5% |
| Total Occupied Housing Units | 138 | 100.0% |
Occupancy by Household Size in Stantonville
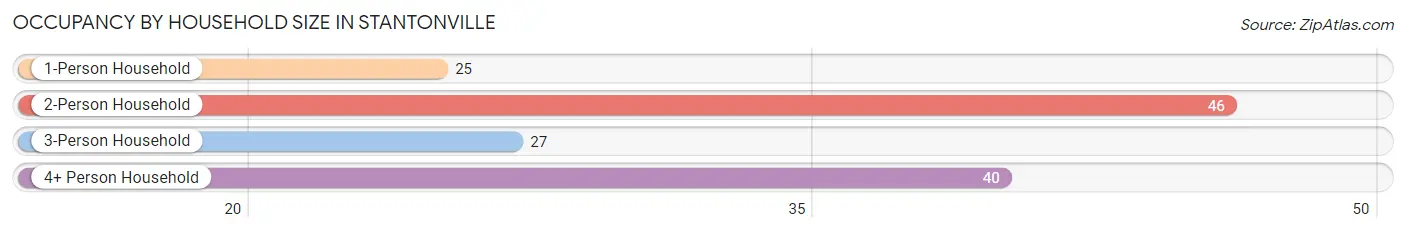
| Household Size | # Housing Units | % Housing Units |
| 1-Person Household | 25 | 18.1% |
| 2-Person Household | 46 | 33.3% |
| 3-Person Household | 27 | 19.6% |
| 4+ Person Household | 40 | 29.0% |
| Total Housing Units | 138 | 100.0% |
Occupancy by Ownership by Household Size in Stantonville
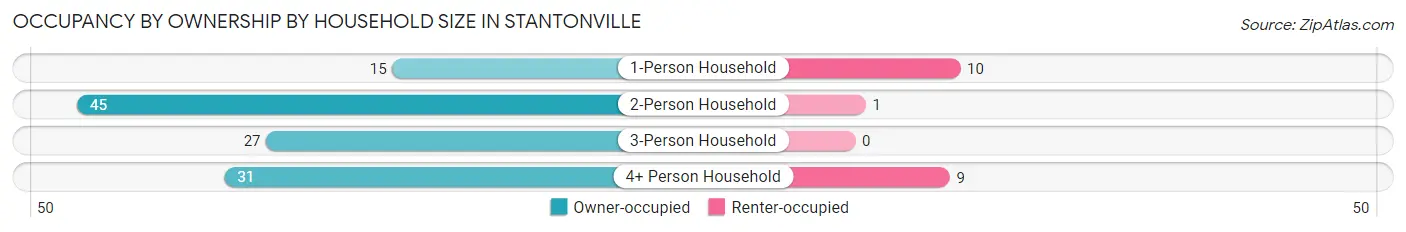
| Household Size | Owner-occupied | Renter-occupied |
| 1-Person Household | 15 (60.0%) | 10 (40.0%) |
| 2-Person Household | 45 (97.8%) | 1 (2.2%) |
| 3-Person Household | 27 (100.0%) | 0 (0.0%) |
| 4+ Person Household | 31 (77.5%) | 9 (22.5%) |
| Total Housing Units | 118 (85.5%) | 20 (14.5%) |
Occupancy by Educational Attainment in Stantonville
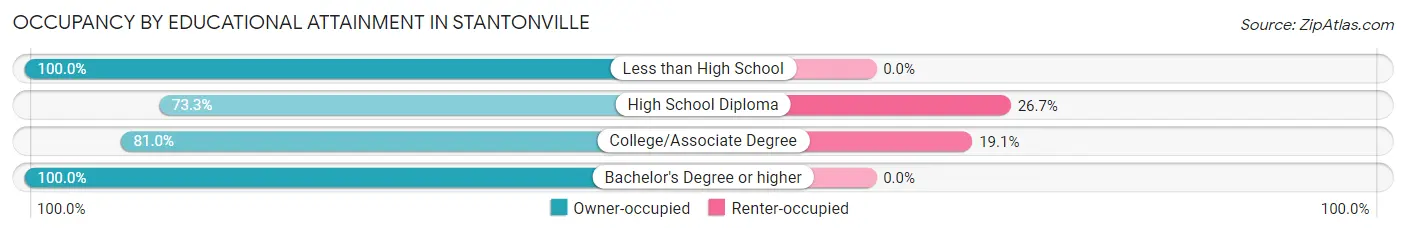
| Household Size | Owner-occupied | Renter-occupied |
| Less than High School | 37 (100.0%) | 0 (0.0%) |
| High School Diploma | 44 (73.3%) | 16 (26.7%) |
| College/Associate Degree | 17 (80.9%) | 4 (19.1%) |
| Bachelor's Degree or higher | 20 (100.0%) | 0 (0.0%) |
Occupancy by Age of Householder in Stantonville
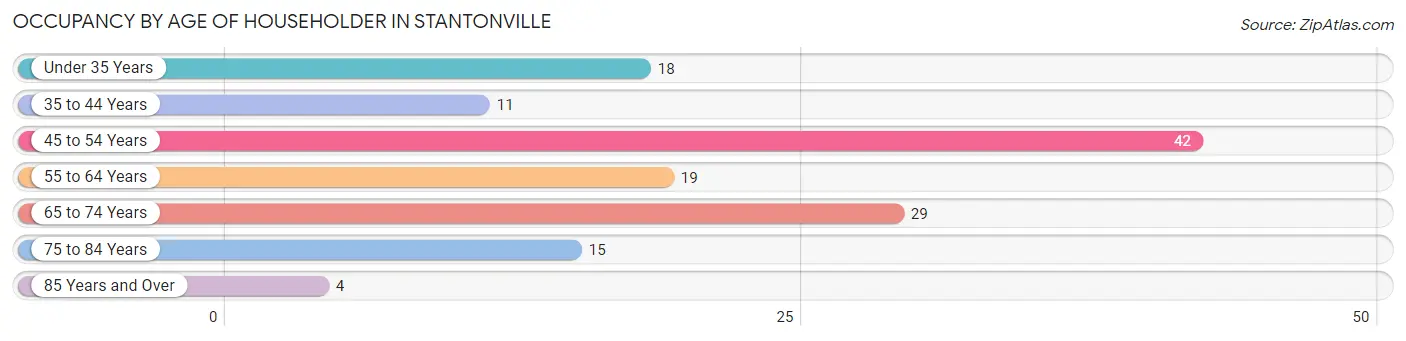
| Age Bracket | # Households | % Households |
| Under 35 Years | 18 | 13.0% |
| 35 to 44 Years | 11 | 8.0% |
| 45 to 54 Years | 42 | 30.4% |
| 55 to 64 Years | 19 | 13.8% |
| 65 to 74 Years | 29 | 21.0% |
| 75 to 84 Years | 15 | 10.9% |
| 85 Years and Over | 4 | 2.9% |
| Total | 138 | 100.0% |
Housing Finances in Stantonville
Median Income by Occupancy in Stantonville
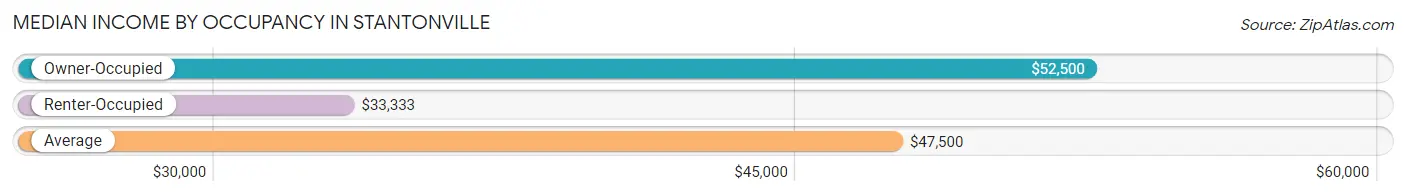
| Occupancy Type | # Households | Median Income |
| Owner-Occupied | 118 (85.5%) | $52,500 |
| Renter-Occupied | 20 (14.5%) | $33,333 |
| Average | 138 (100.0%) | $47,500 |
Occupancy by Householder Income Bracket in Stantonville
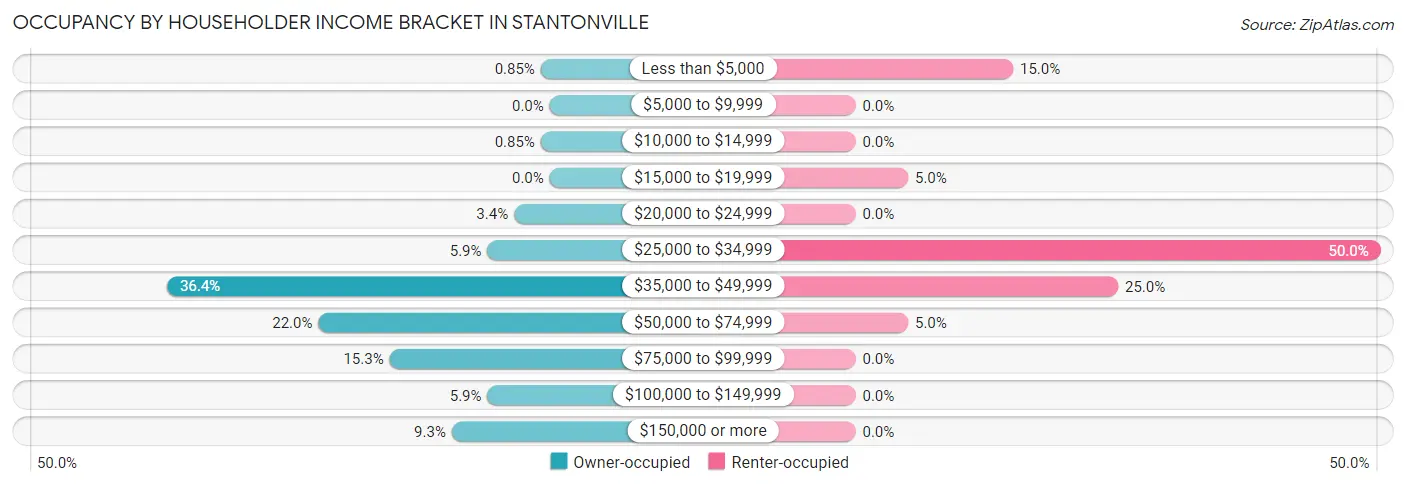
| Income Bracket | Owner-occupied | Renter-occupied |
| Less than $5,000 | 1 (0.9%) | 3 (15.0%) |
| $5,000 to $9,999 | 0 (0.0%) | 0 (0.0%) |
| $10,000 to $14,999 | 1 (0.9%) | 0 (0.0%) |
| $15,000 to $19,999 | 0 (0.0%) | 1 (5.0%) |
| $20,000 to $24,999 | 4 (3.4%) | 0 (0.0%) |
| $25,000 to $34,999 | 7 (5.9%) | 10 (50.0%) |
| $35,000 to $49,999 | 43 (36.4%) | 5 (25.0%) |
| $50,000 to $74,999 | 26 (22.0%) | 1 (5.0%) |
| $75,000 to $99,999 | 18 (15.2%) | 0 (0.0%) |
| $100,000 to $149,999 | 7 (5.9%) | 0 (0.0%) |
| $150,000 or more | 11 (9.3%) | 0 (0.0%) |
| Total | 118 (100.0%) | 20 (100.0%) |
Monthly Housing Cost Tiers in Stantonville
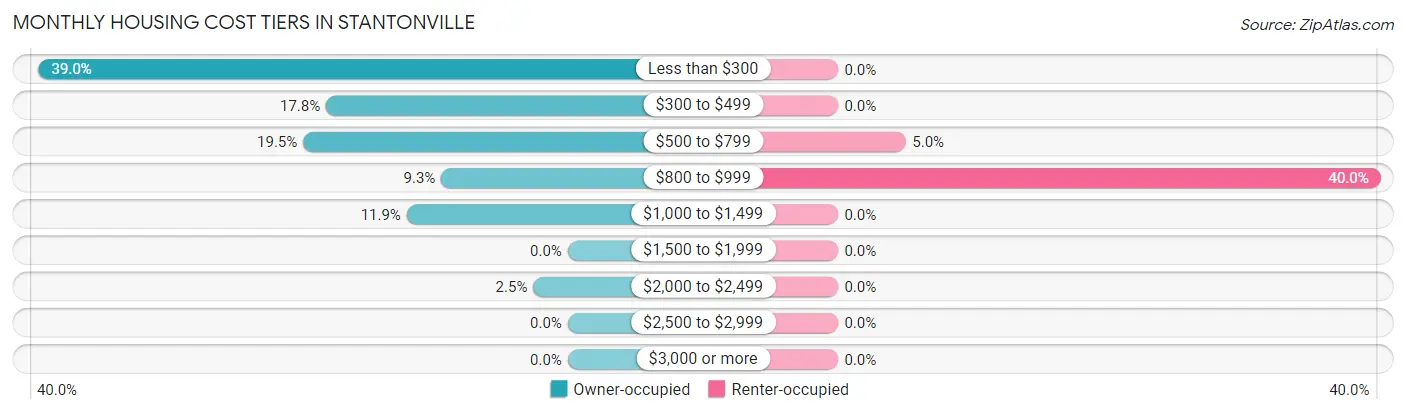
| Monthly Cost | Owner-occupied | Renter-occupied |
| Less than $300 | 46 (39.0%) | 0 (0.0%) |
| $300 to $499 | 21 (17.8%) | 0 (0.0%) |
| $500 to $799 | 23 (19.5%) | 1 (5.0%) |
| $800 to $999 | 11 (9.3%) | 8 (40.0%) |
| $1,000 to $1,499 | 14 (11.9%) | 0 (0.0%) |
| $1,500 to $1,999 | 0 (0.0%) | 0 (0.0%) |
| $2,000 to $2,499 | 3 (2.5%) | 0 (0.0%) |
| $2,500 to $2,999 | 0 (0.0%) | 0 (0.0%) |
| $3,000 or more | 0 (0.0%) | 0 (0.0%) |
| Total | 118 (100.0%) | 20 (100.0%) |
Physical Housing Characteristics in Stantonville
Housing Structures in Stantonville
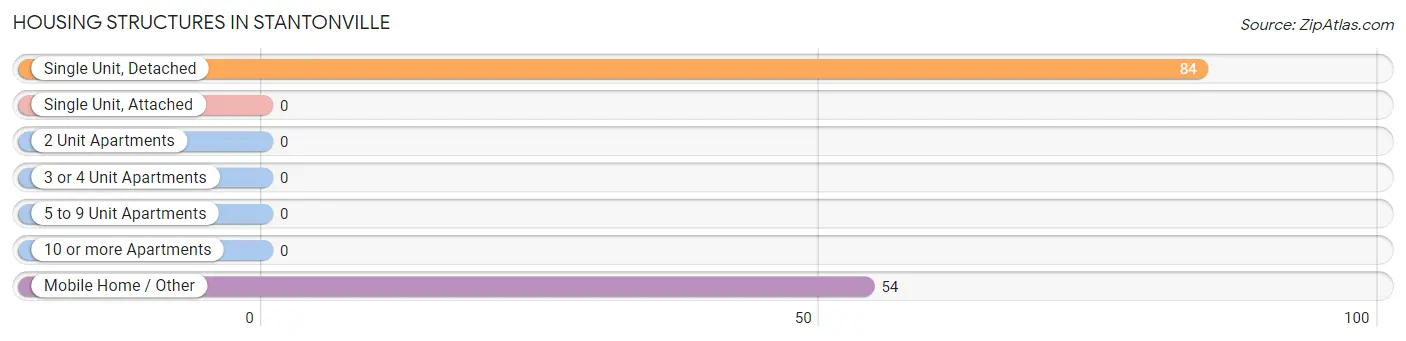
| Structure Type | # Housing Units | % Housing Units |
| Single Unit, Detached | 84 | 60.9% |
| Single Unit, Attached | 0 | 0.0% |
| 2 Unit Apartments | 0 | 0.0% |
| 3 or 4 Unit Apartments | 0 | 0.0% |
| 5 to 9 Unit Apartments | 0 | 0.0% |
| 10 or more Apartments | 0 | 0.0% |
| Mobile Home / Other | 54 | 39.1% |
| Total | 138 | 100.0% |
Housing Structures by Occupancy in Stantonville
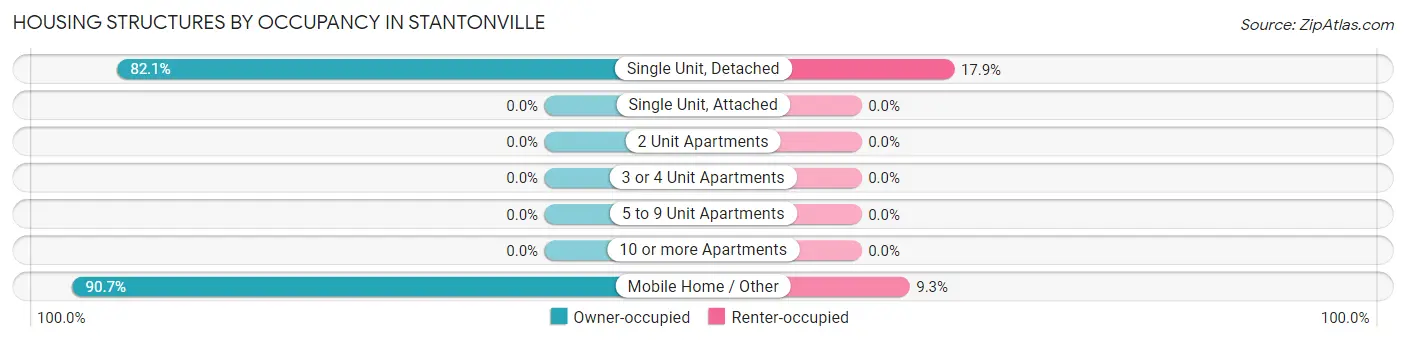
| Structure Type | Owner-occupied | Renter-occupied |
| Single Unit, Detached | 69 (82.1%) | 15 (17.9%) |
| Single Unit, Attached | 0 (0.0%) | 0 (0.0%) |
| 2 Unit Apartments | 0 (0.0%) | 0 (0.0%) |
| 3 or 4 Unit Apartments | 0 (0.0%) | 0 (0.0%) |
| 5 to 9 Unit Apartments | 0 (0.0%) | 0 (0.0%) |
| 10 or more Apartments | 0 (0.0%) | 0 (0.0%) |
| Mobile Home / Other | 49 (90.7%) | 5 (9.3%) |
| Total | 118 (85.5%) | 20 (14.5%) |
Housing Structures by Number of Rooms in Stantonville
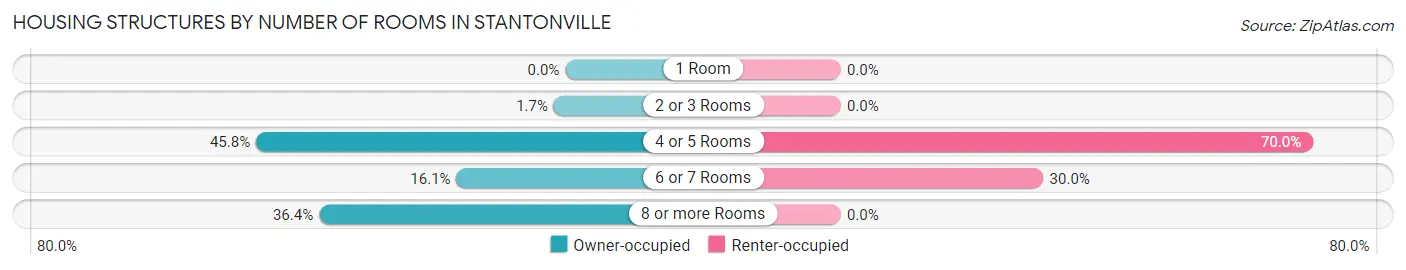
| Number of Rooms | Owner-occupied | Renter-occupied |
| 1 Room | 0 (0.0%) | 0 (0.0%) |
| 2 or 3 Rooms | 2 (1.7%) | 0 (0.0%) |
| 4 or 5 Rooms | 54 (45.8%) | 14 (70.0%) |
| 6 or 7 Rooms | 19 (16.1%) | 6 (30.0%) |
| 8 or more Rooms | 43 (36.4%) | 0 (0.0%) |
| Total | 118 (100.0%) | 20 (100.0%) |
Housing Structure by Heating Type in Stantonville
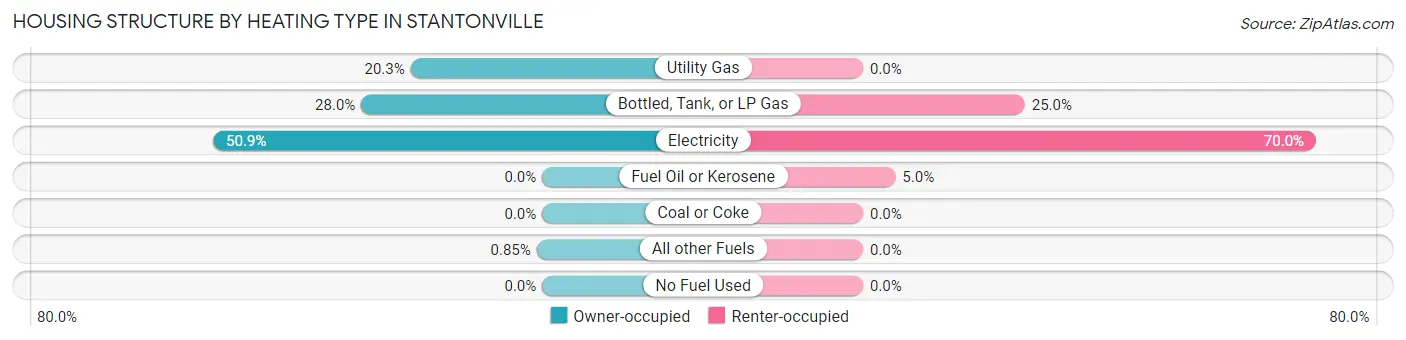
| Heating Type | Owner-occupied | Renter-occupied |
| Utility Gas | 24 (20.3%) | 0 (0.0%) |
| Bottled, Tank, or LP Gas | 33 (28.0%) | 5 (25.0%) |
| Electricity | 60 (50.8%) | 14 (70.0%) |
| Fuel Oil or Kerosene | 0 (0.0%) | 1 (5.0%) |
| Coal or Coke | 0 (0.0%) | 0 (0.0%) |
| All other Fuels | 1 (0.9%) | 0 (0.0%) |
| No Fuel Used | 0 (0.0%) | 0 (0.0%) |
| Total | 118 (100.0%) | 20 (100.0%) |
Household Vehicle Usage in Stantonville
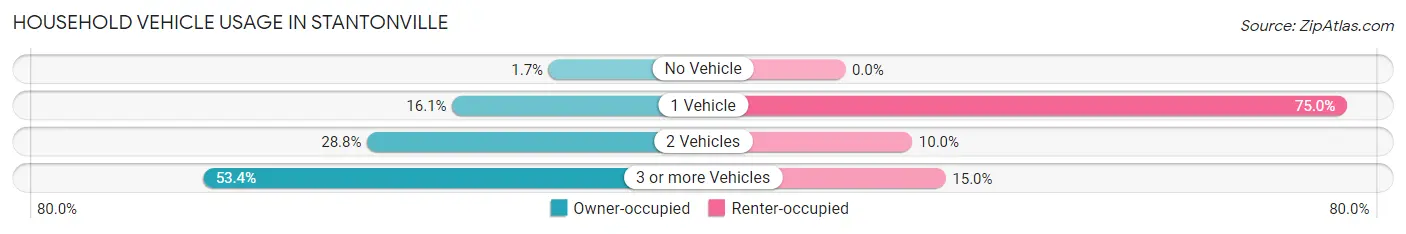
| Vehicles per Household | Owner-occupied | Renter-occupied |
| No Vehicle | 2 (1.7%) | 0 (0.0%) |
| 1 Vehicle | 19 (16.1%) | 15 (75.0%) |
| 2 Vehicles | 34 (28.8%) | 2 (10.0%) |
| 3 or more Vehicles | 63 (53.4%) | 3 (15.0%) |
| Total | 118 (100.0%) | 20 (100.0%) |
Real Estate & Mortgages in Stantonville
Real Estate and Mortgage Overview in Stantonville
| Characteristic | Without Mortgage | With Mortgage |
| Housing Units | 89 | 29 |
| Median Property Value | - | - |
| Median Household Income | $48,125 | $8 |
| Monthly Housing Costs | $297 | $0 |
| Real Estate Taxes | $350 | $5 |
Property Value by Mortgage Status in Stantonville
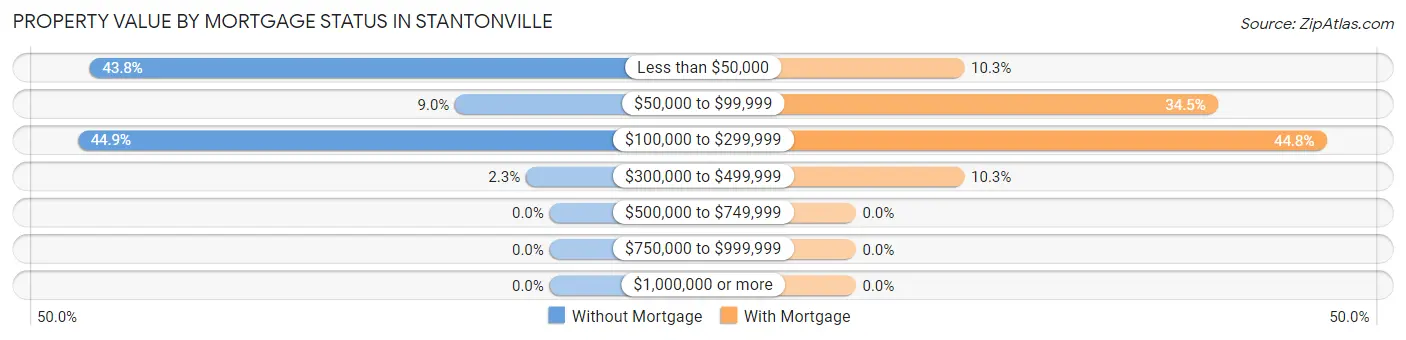
| Property Value | Without Mortgage | With Mortgage |
| Less than $50,000 | 39 (43.8%) | 3 (10.3%) |
| $50,000 to $99,999 | 8 (9.0%) | 10 (34.5%) |
| $100,000 to $299,999 | 40 (44.9%) | 13 (44.8%) |
| $300,000 to $499,999 | 2 (2.2%) | 3 (10.3%) |
| $500,000 to $749,999 | 0 (0.0%) | 0 (0.0%) |
| $750,000 to $999,999 | 0 (0.0%) | 0 (0.0%) |
| $1,000,000 or more | 0 (0.0%) | 0 (0.0%) |
| Total | 89 (100.0%) | 29 (100.0%) |
Household Income by Mortgage Status in Stantonville
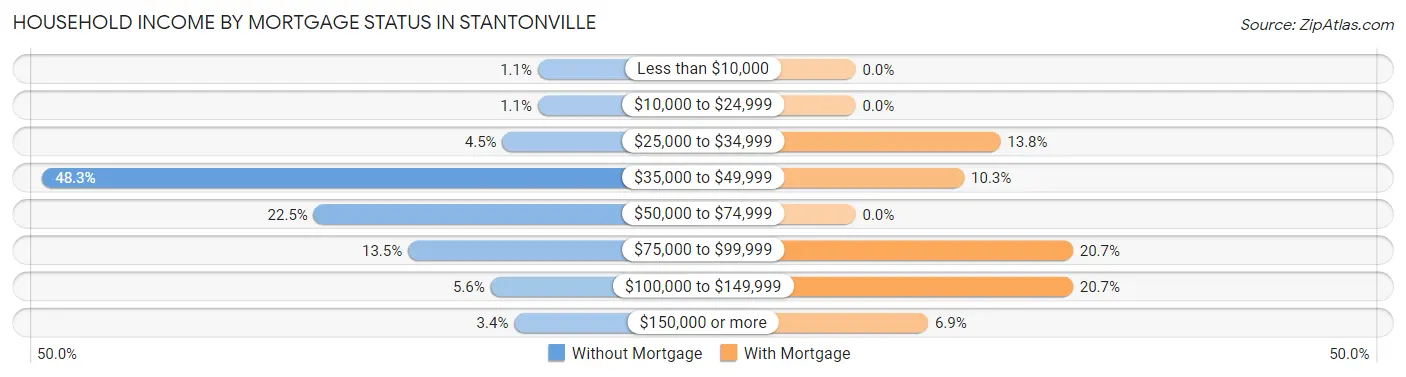
| Household Income | Without Mortgage | With Mortgage |
| Less than $10,000 | 1 (1.1%) | 0 (0.0%) |
| $10,000 to $24,999 | 1 (1.1%) | 0 (0.0%) |
| $25,000 to $34,999 | 4 (4.5%) | 4 (13.8%) |
| $35,000 to $49,999 | 43 (48.3%) | 3 (10.3%) |
| $50,000 to $74,999 | 20 (22.5%) | 0 (0.0%) |
| $75,000 to $99,999 | 12 (13.5%) | 6 (20.7%) |
| $100,000 to $149,999 | 5 (5.6%) | 6 (20.7%) |
| $150,000 or more | 3 (3.4%) | 2 (6.9%) |
| Total | 89 (100.0%) | 29 (100.0%) |
Property Value to Household Income Ratio in Stantonville
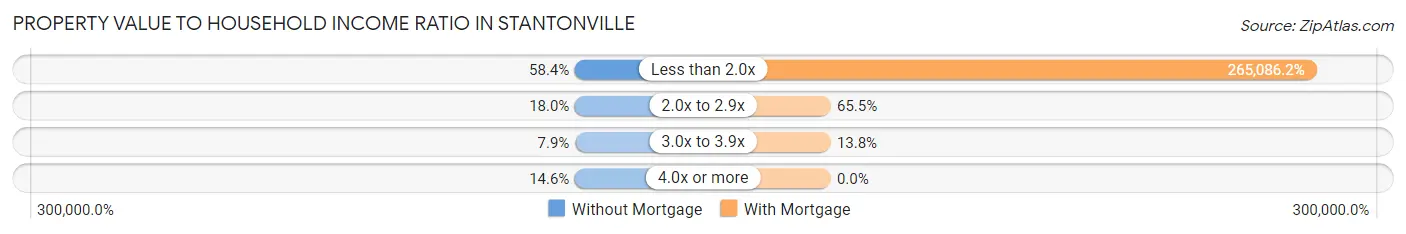
| Value-to-Income Ratio | Without Mortgage | With Mortgage |
| Less than 2.0x | 52 (58.4%) | 76,875 (265,086.2%) |
| 2.0x to 2.9x | 16 (18.0%) | 19 (65.5%) |
| 3.0x to 3.9x | 7 (7.9%) | 4 (13.8%) |
| 4.0x or more | 13 (14.6%) | 0 (0.0%) |
| Total | 89 (100.0%) | 29 (100.0%) |
Real Estate Taxes by Mortgage Status in Stantonville
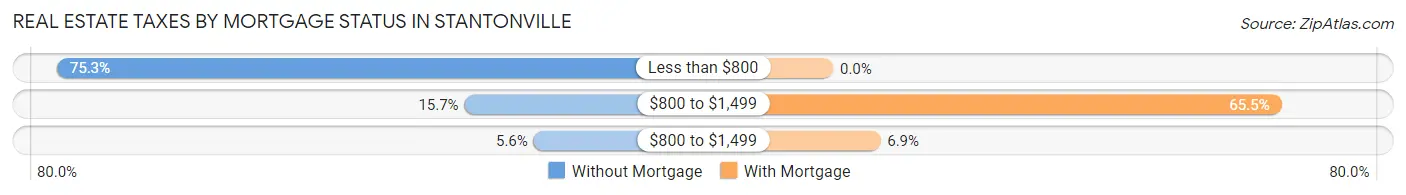
| Property Taxes | Without Mortgage | With Mortgage |
| Less than $800 | 67 (75.3%) | 0 (0.0%) |
| $800 to $1,499 | 14 (15.7%) | 19 (65.5%) |
| $800 to $1,499 | 5 (5.6%) | 2 (6.9%) |
| Total | 89 (100.0%) | 29 (100.0%) |
Health & Disability in Stantonville
Health Insurance Coverage by Age in Stantonville
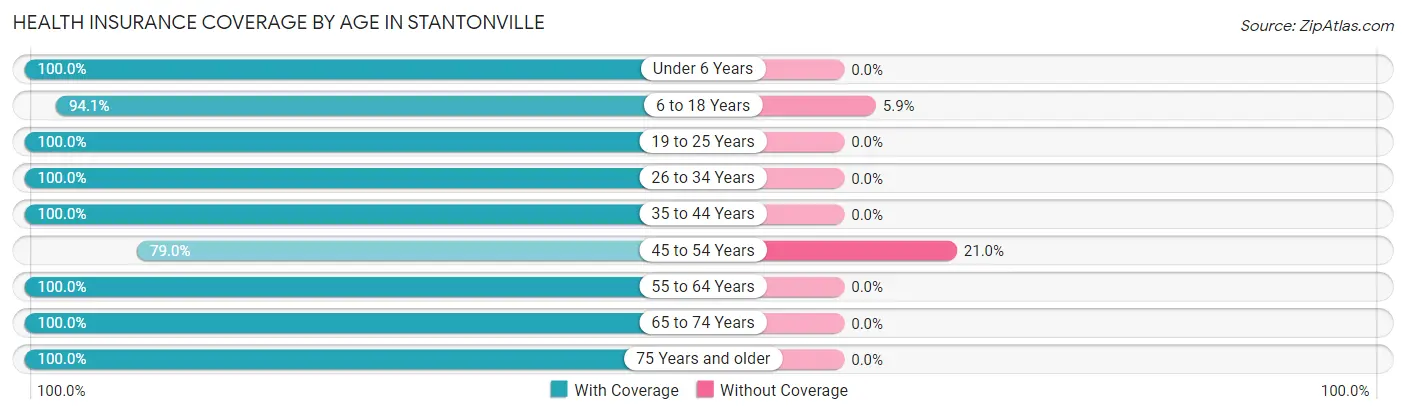
| Age Bracket | With Coverage | Without Coverage |
| Under 6 Years | 27 (100.0%) | 0 (0.0%) |
| 6 to 18 Years | 48 (94.1%) | 3 (5.9%) |
| 19 to 25 Years | 54 (100.0%) | 0 (0.0%) |
| 26 to 34 Years | 16 (100.0%) | 0 (0.0%) |
| 35 to 44 Years | 45 (100.0%) | 0 (0.0%) |
| 45 to 54 Years | 64 (79.0%) | 17 (21.0%) |
| 55 to 64 Years | 41 (100.0%) | 0 (0.0%) |
| 65 to 74 Years | 56 (100.0%) | 0 (0.0%) |
| 75 Years and older | 29 (100.0%) | 0 (0.0%) |
| Total | 380 (95.0%) | 20 (5.0%) |
Health Insurance Coverage by Citizenship Status in Stantonville
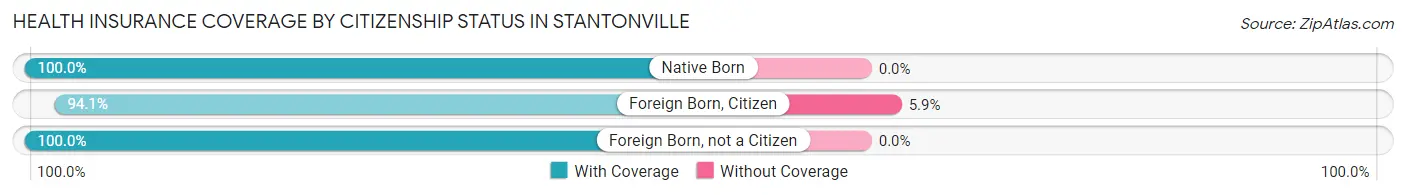
| Citizenship Status | With Coverage | Without Coverage |
| Native Born | 27 (100.0%) | 0 (0.0%) |
| Foreign Born, Citizen | 48 (94.1%) | 3 (5.9%) |
| Foreign Born, not a Citizen | 54 (100.0%) | 0 (0.0%) |
Health Insurance Coverage by Household Income in Stantonville
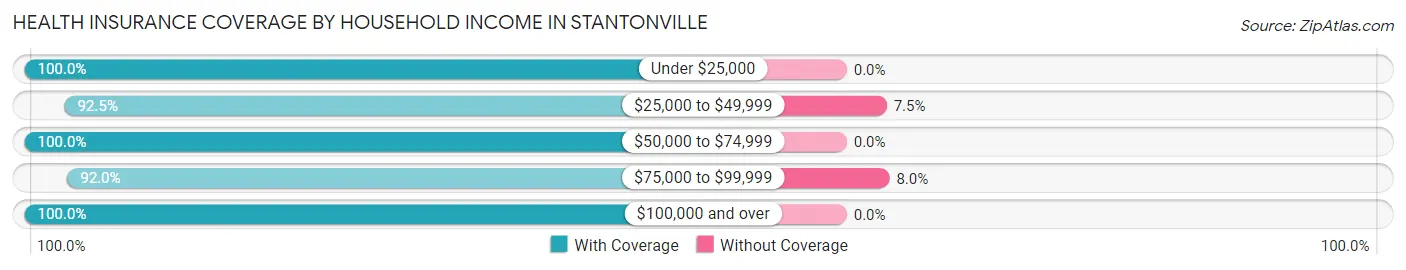
| Household Income | With Coverage | Without Coverage |
| Under $25,000 | 13 (100.0%) | 0 (0.0%) |
| $25,000 to $49,999 | 198 (92.5%) | 16 (7.5%) |
| $50,000 to $74,999 | 63 (100.0%) | 0 (0.0%) |
| $75,000 to $99,999 | 46 (92.0%) | 4 (8.0%) |
| $100,000 and over | 60 (100.0%) | 0 (0.0%) |
Public vs Private Health Insurance Coverage by Age in Stantonville
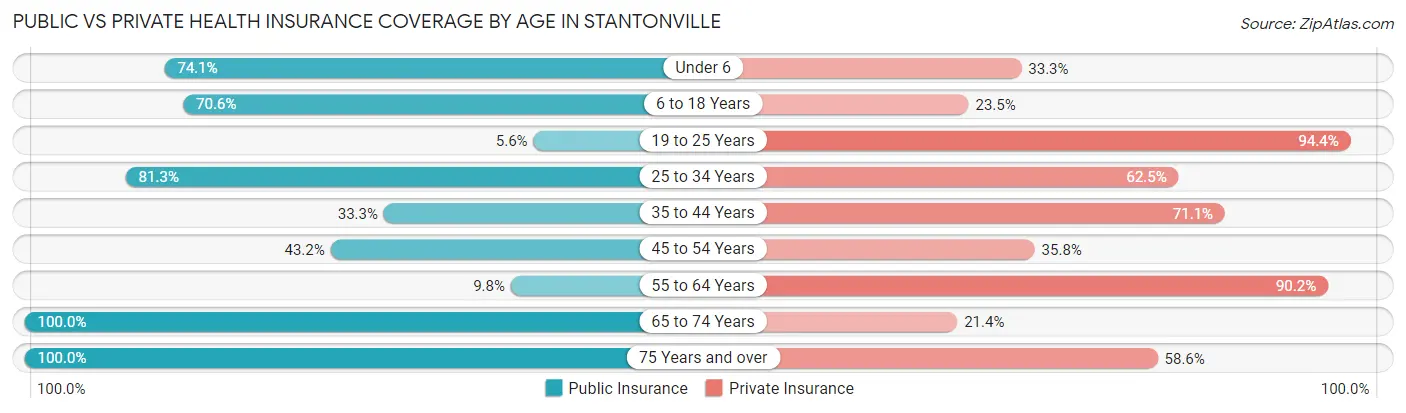
| Age Bracket | Public Insurance | Private Insurance |
| Under 6 | 20 (74.1%) | 9 (33.3%) |
| 6 to 18 Years | 36 (70.6%) | 12 (23.5%) |
| 19 to 25 Years | 3 (5.6%) | 51 (94.4%) |
| 25 to 34 Years | 13 (81.2%) | 10 (62.5%) |
| 35 to 44 Years | 15 (33.3%) | 32 (71.1%) |
| 45 to 54 Years | 35 (43.2%) | 29 (35.8%) |
| 55 to 64 Years | 4 (9.8%) | 37 (90.2%) |
| 65 to 74 Years | 56 (100.0%) | 12 (21.4%) |
| 75 Years and over | 29 (100.0%) | 17 (58.6%) |
| Total | 211 (52.7%) | 209 (52.2%) |
Disability Status by Sex by Age in Stantonville
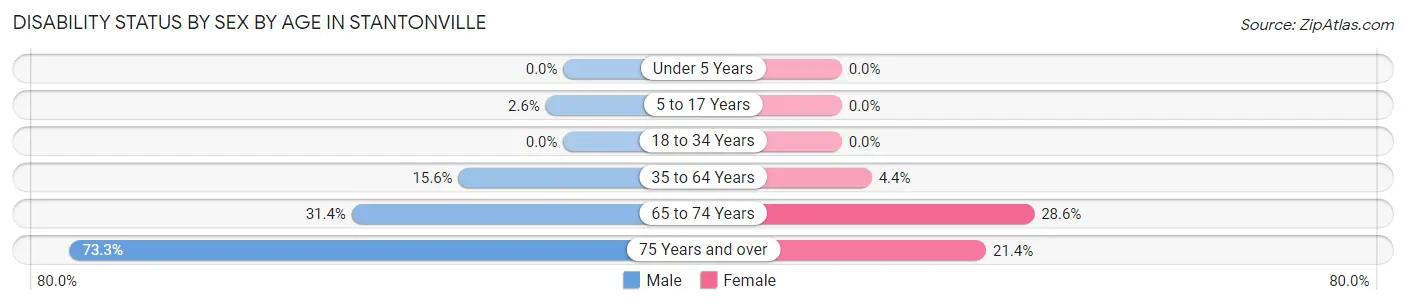
| Age Bracket | Male | Female |
| Under 5 Years | 0 (0.0%) | 0 (0.0%) |
| 5 to 17 Years | 1 (2.6%) | 0 (0.0%) |
| 18 to 34 Years | 0 (0.0%) | 0 (0.0%) |
| 35 to 64 Years | 12 (15.6%) | 4 (4.4%) |
| 65 to 74 Years | 11 (31.4%) | 6 (28.6%) |
| 75 Years and over | 11 (73.3%) | 3 (21.4%) |
Disability Class by Sex by Age in Stantonville
Disability Class: Hearing Difficulty
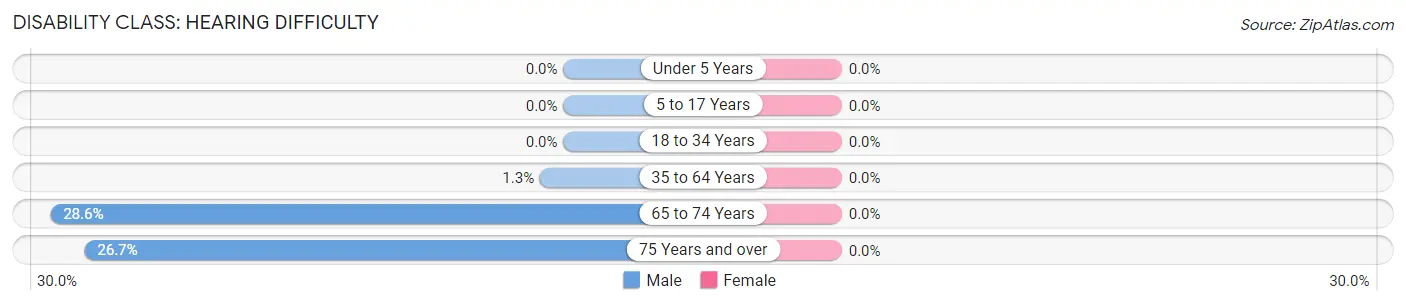
| Age Bracket | Male | Female |
| Under 5 Years | 0 (0.0%) | 0 (0.0%) |
| 5 to 17 Years | 0 (0.0%) | 0 (0.0%) |
| 18 to 34 Years | 0 (0.0%) | 0 (0.0%) |
| 35 to 64 Years | 1 (1.3%) | 0 (0.0%) |
| 65 to 74 Years | 10 (28.6%) | 0 (0.0%) |
| 75 Years and over | 4 (26.7%) | 0 (0.0%) |
Disability Class: Vision Difficulty
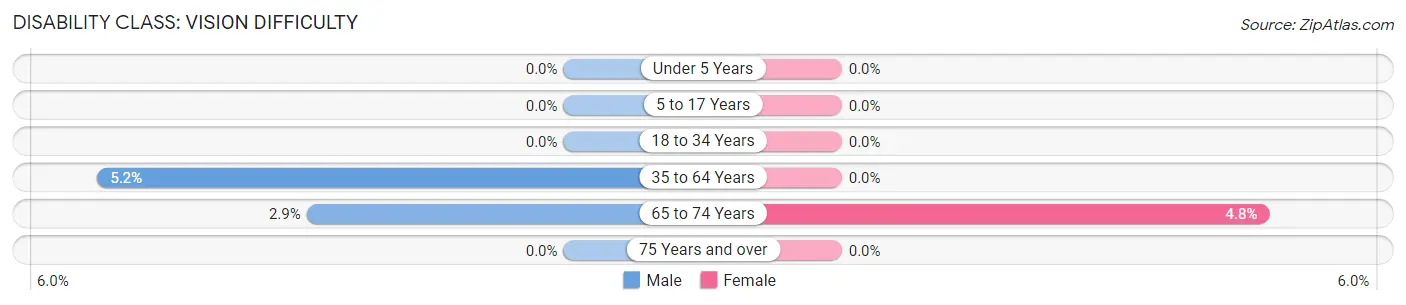
| Age Bracket | Male | Female |
| Under 5 Years | 0 (0.0%) | 0 (0.0%) |
| 5 to 17 Years | 0 (0.0%) | 0 (0.0%) |
| 18 to 34 Years | 0 (0.0%) | 0 (0.0%) |
| 35 to 64 Years | 4 (5.2%) | 0 (0.0%) |
| 65 to 74 Years | 1 (2.9%) | 1 (4.8%) |
| 75 Years and over | 0 (0.0%) | 0 (0.0%) |
Disability Class: Cognitive Difficulty
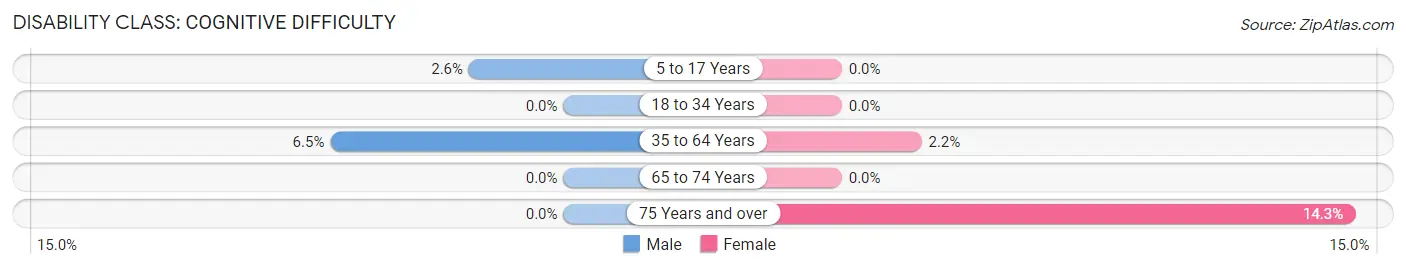
| Age Bracket | Male | Female |
| 5 to 17 Years | 1 (2.6%) | 0 (0.0%) |
| 18 to 34 Years | 0 (0.0%) | 0 (0.0%) |
| 35 to 64 Years | 5 (6.5%) | 2 (2.2%) |
| 65 to 74 Years | 0 (0.0%) | 0 (0.0%) |
| 75 Years and over | 0 (0.0%) | 2 (14.3%) |
Disability Class: Ambulatory Difficulty
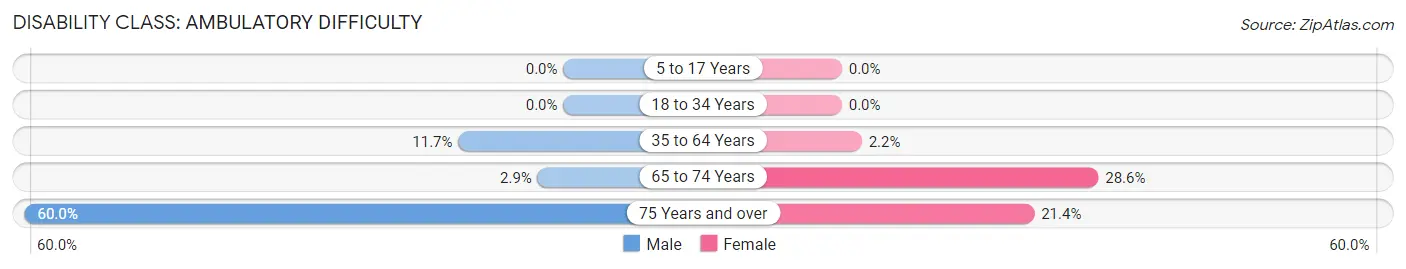
| Age Bracket | Male | Female |
| 5 to 17 Years | 0 (0.0%) | 0 (0.0%) |
| 18 to 34 Years | 0 (0.0%) | 0 (0.0%) |
| 35 to 64 Years | 9 (11.7%) | 2 (2.2%) |
| 65 to 74 Years | 1 (2.9%) | 6 (28.6%) |
| 75 Years and over | 9 (60.0%) | 3 (21.4%) |
Disability Class: Self-Care Difficulty
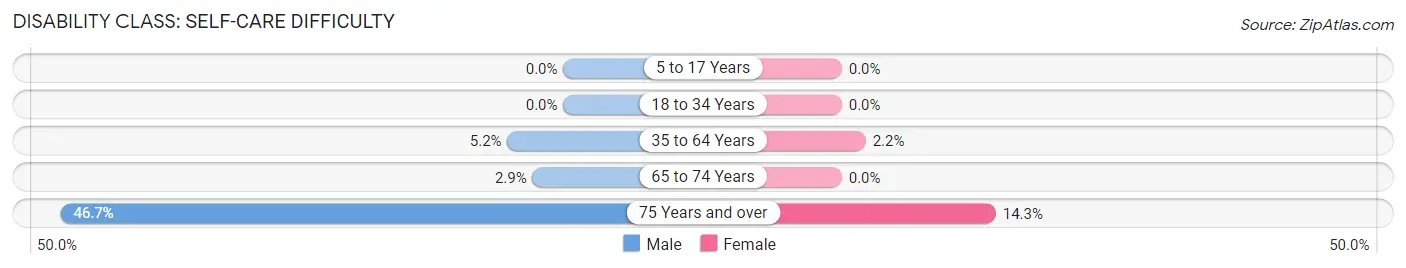
| Age Bracket | Male | Female |
| 5 to 17 Years | 0 (0.0%) | 0 (0.0%) |
| 18 to 34 Years | 0 (0.0%) | 0 (0.0%) |
| 35 to 64 Years | 4 (5.2%) | 2 (2.2%) |
| 65 to 74 Years | 1 (2.9%) | 0 (0.0%) |
| 75 Years and over | 7 (46.7%) | 2 (14.3%) |
Technology Access in Stantonville
Computing Device Access in Stantonville
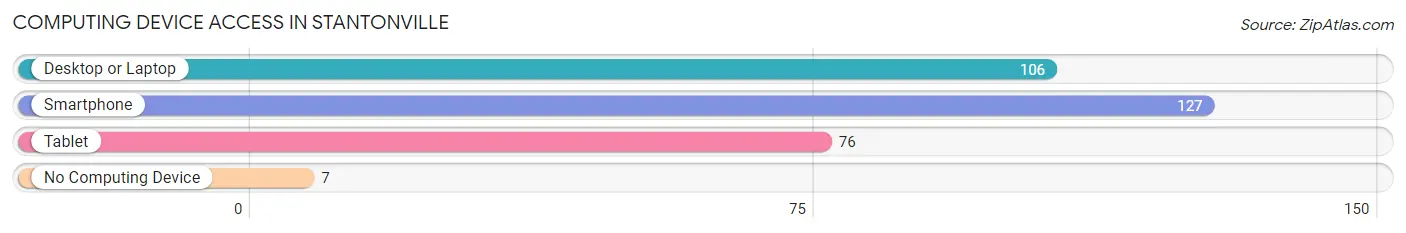
| Device Type | # Households | % Households |
| Desktop or Laptop | 106 | 76.8% |
| Smartphone | 127 | 92.0% |
| Tablet | 76 | 55.1% |
| No Computing Device | 7 | 5.1% |
| Total | 138 | 100.0% |
Internet Access in Stantonville
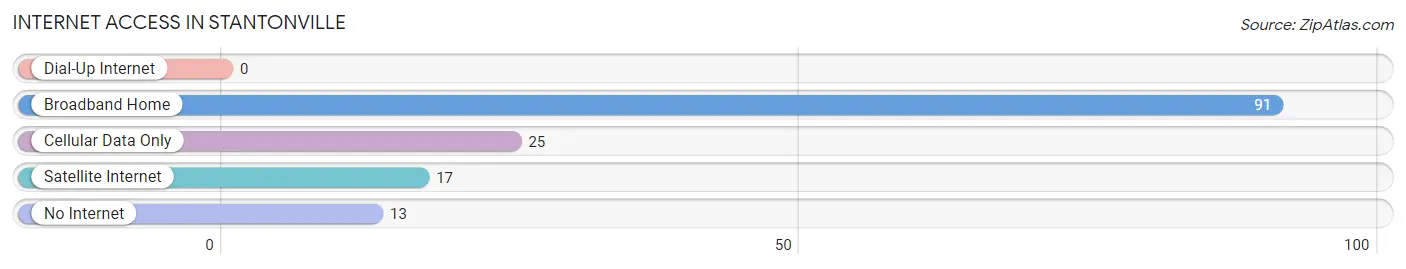
| Internet Type | # Households | % Households |
| Dial-Up Internet | 0 | 0.0% |
| Broadband Home | 91 | 65.9% |
| Cellular Data Only | 25 | 18.1% |
| Satellite Internet | 17 | 12.3% |
| No Internet | 13 | 9.4% |
| Total | 138 | 100.0% |
Stantonville Summary
Stantonville is a small town located in McNairy County, Tennessee. It is situated in the southwestern part of the state, approximately halfway between Memphis and Nashville. The town was founded in 1820 and has a population of approximately 1,000 people.
History
Stantonville was founded in 1820 by William Stanton, a Revolutionary War veteran. He purchased the land from the Chickasaw Indians and named the town after himself. The town was originally a farming community, but it soon became a trading post for the surrounding area. In 1845, the town was incorporated and the first post office was established.
In the late 19th century, Stantonville began to grow and prosper. The town was home to several businesses, including a sawmill, a gristmill, a cotton gin, and a blacksmith shop. The town also had a school, a church, and a general store.
In the early 20th century, Stantonville experienced a period of decline. The Great Depression caused many of the businesses to close and the population began to decline. However, the town was able to survive and in the 1950s, the population began to increase again.
Geography
Stantonville is located in the southwestern part of Tennessee, approximately halfway between Memphis and Nashville. The town is situated in McNairy County, which is part of the Jackson Purchase region of the state. The town is located on the banks of the Hatchie River, which is a tributary of the Mississippi River.
The town is surrounded by rolling hills and farmland. The climate is mild and humid, with hot summers and mild winters. The average annual temperature is around 70 degrees Fahrenheit.
Economy
Stantonville’s economy is largely based on agriculture. The town is home to several farms, which produce a variety of crops, including corn, soybeans, cotton, and wheat. The town also has several small businesses, including a grocery store, a hardware store, and a restaurant.
The town is also home to several manufacturing companies, which produce a variety of products, including furniture, clothing, and automotive parts. The town is also home to a number of service-based businesses, such as auto repair shops, beauty salons, and medical offices.
Demographics
As of the 2010 census, the population of Stantonville was 1,000 people. The racial makeup of the town was 97.2% White, 0.7% African American, 0.3% Native American, 0.2% Asian, and 1.6% from other races. The median household income was $35,000 and the median age was 40 years.
Stantonville is a small town with a rich history and a bright future. The town is home to a diverse population and a thriving economy. The town is a great place to live, work, and raise a family.
Common Questions
What is Per Capita Income in Stantonville?
Per Capita income in Stantonville is $23,416.
What is the Median Family Income in Stantonville?
Median Family Income in Stantonville is $47,031.
What is the Median Household income in Stantonville?
Median Household Income in Stantonville is $47,500.
What is Inequality or Gini Index in Stantonville?
Inequality or Gini Index in Stantonville is 0.32.
What is the Total Population of Stantonville?
Total Population of Stantonville is 400.
What is the Total Male Population of Stantonville?
Total Male Population of Stantonville is 228.
What is the Total Female Population of Stantonville?
Total Female Population of Stantonville is 172.
What is the Ratio of Males per 100 Females in Stantonville?
There are 132.56 Males per 100 Females in Stantonville.
What is the Ratio of Females per 100 Males in Stantonville?
There are 75.44 Females per 100 Males in Stantonville.
What is the Median Population Age in Stantonville?
Median Population Age in Stantonville is 45.5 Years.
What is the Average Family Size in Stantonville
Average Family Size in Stantonville is 3.2 People.
What is the Average Household Size in Stantonville
Average Household Size in Stantonville is 2.9 People.
How Large is the Labor Force in Stantonville?
There are 152 People in the Labor Forcein in Stantonville.
What is the Percentage of People in the Labor Force in Stantonville?
44.6% of People are in the Labor Force in Stantonville.
What is the Unemployment Rate in Stantonville?
Unemployment Rate in Stantonville is 0.7%.