Spring City, TN Map & Demographics
Spring City Map
Spring City Overview
$27,213
PER CAPITA INCOME
$70,291
AVG FAMILY INCOME
$36,190
AVG HOUSEHOLD INCOME
25.2%
WAGE / INCOME GAP [ % ]
74.8¢/ $1
WAGE / INCOME GAP [ $ ]
0.51
INEQUALITY / GINI INDEX
2,294
TOTAL POPULATION
1,235
MALE POPULATION
1,059
FEMALE POPULATION
116.62
MALES / 100 FEMALES
85.75
FEMALES / 100 MALES
48.1
MEDIAN AGE
3.1
AVG FAMILY SIZE
2.2
AVG HOUSEHOLD SIZE
886
LABOR FORCE [ PEOPLE ]
48.3%
PERCENT IN LABOR FORCE
10.6%
UNEMPLOYMENT RATE
Spring City Zip Codes
Spring City Area Codes
Income in Spring City
Income Overview in Spring City
Per Capita Income in Spring City is $27,213, while median incomes of families and households are $70,291 and $36,190 respectively.
| Characteristic | Number | Measure |
| Per Capita Income | 2,294 | $27,213 |
| Median Family Income | 530 | $70,291 |
| Mean Family Income | 530 | $81,806 |
| Median Household Income | 1,012 | $36,190 |
| Mean Household Income | 1,012 | $57,566 |
| Income Deficit | 530 | $0 |
| Wage / Income Gap (%) | 2,294 | 25.16% |
| Wage / Income Gap ($) | 2,294 | 74.84¢ per $1 |
| Gini / Inequality Index | 2,294 | 0.51 |
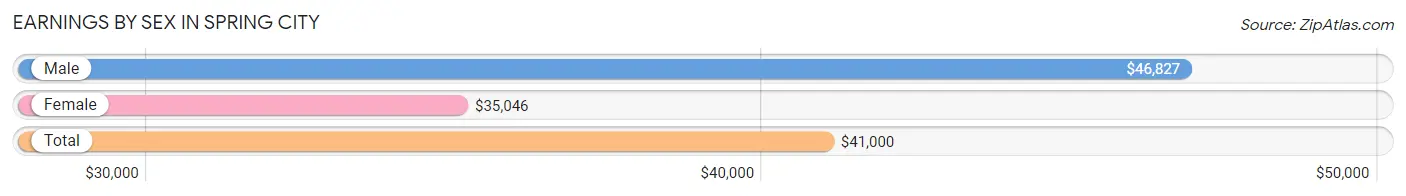
Earnings by Sex in Spring City
Average Earnings in Spring City are $41,000, $46,827 for men and $35,046 for women, a difference of 25.2%.
| Sex | Number | Average Earnings |
| Male | 499 (57.5%) | $46,827 |
| Female | 369 (42.5%) | $35,046 |
| Total | 868 (100.0%) | $41,000 |
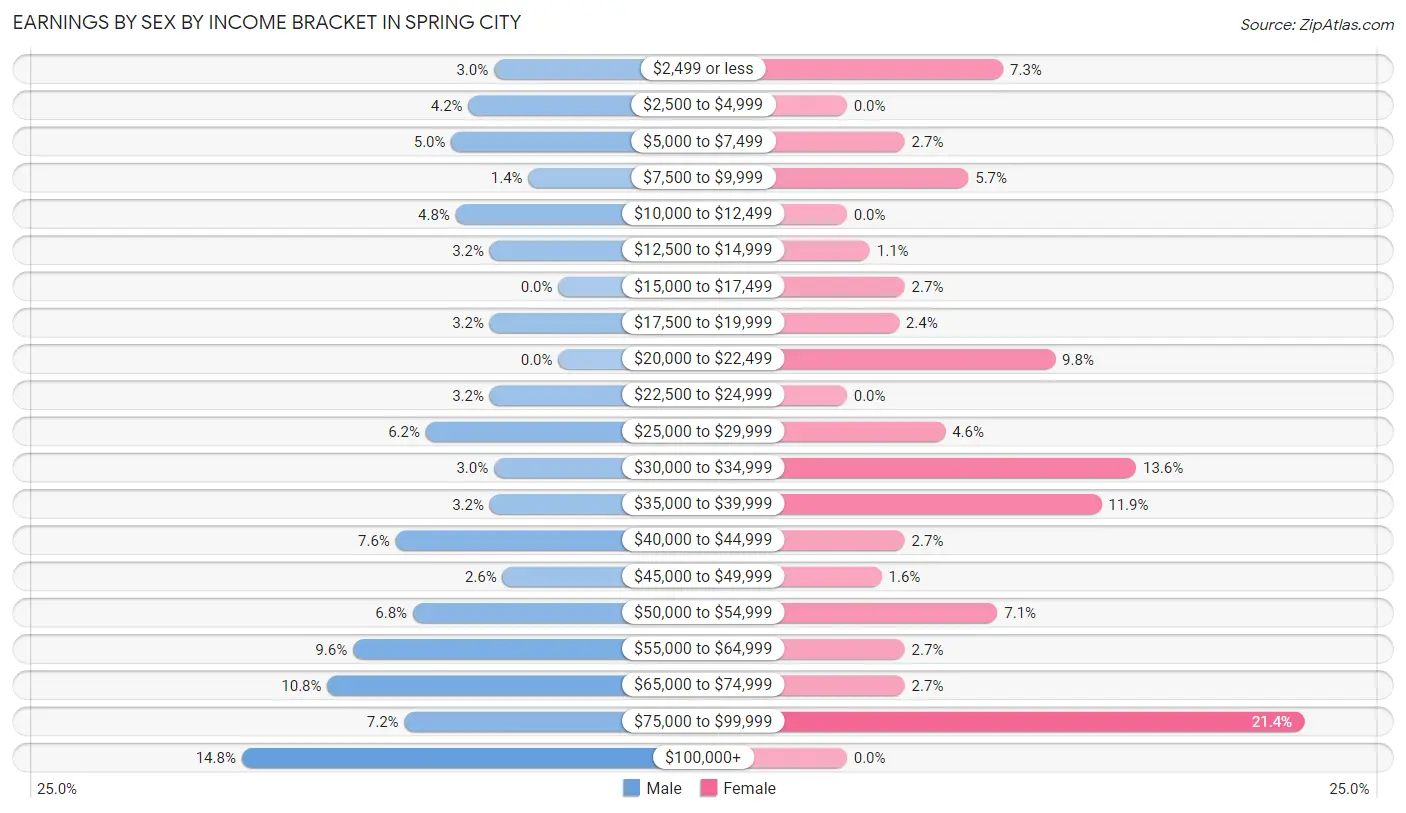
Earnings by Sex by Income Bracket in Spring City
The most common earnings brackets in Spring City are $100,000+ for men (74 | 14.8%) and $75,000 to $99,999 for women (79 | 21.4%).
| Income | Male | Female |
| $2,499 or less | 15 (3.0%) | 27 (7.3%) |
| $2,500 to $4,999 | 21 (4.2%) | 0 (0.0%) |
| $5,000 to $7,499 | 25 (5.0%) | 10 (2.7%) |
| $7,500 to $9,999 | 7 (1.4%) | 21 (5.7%) |
| $10,000 to $12,499 | 24 (4.8%) | 0 (0.0%) |
| $12,500 to $14,999 | 16 (3.2%) | 4 (1.1%) |
| $15,000 to $17,499 | 0 (0.0%) | 10 (2.7%) |
| $17,500 to $19,999 | 16 (3.2%) | 9 (2.4%) |
| $20,000 to $22,499 | 0 (0.0%) | 36 (9.8%) |
| $22,500 to $24,999 | 16 (3.2%) | 0 (0.0%) |
| $25,000 to $29,999 | 31 (6.2%) | 17 (4.6%) |
| $30,000 to $34,999 | 15 (3.0%) | 50 (13.6%) |
| $35,000 to $39,999 | 16 (3.2%) | 44 (11.9%) |
| $40,000 to $44,999 | 38 (7.6%) | 10 (2.7%) |
| $45,000 to $49,999 | 13 (2.6%) | 6 (1.6%) |
| $50,000 to $54,999 | 34 (6.8%) | 26 (7.0%) |
| $55,000 to $64,999 | 48 (9.6%) | 10 (2.7%) |
| $65,000 to $74,999 | 54 (10.8%) | 10 (2.7%) |
| $75,000 to $99,999 | 36 (7.2%) | 79 (21.4%) |
| $100,000+ | 74 (14.8%) | 0 (0.0%) |
| Total | 499 (100.0%) | 369 (100.0%) |
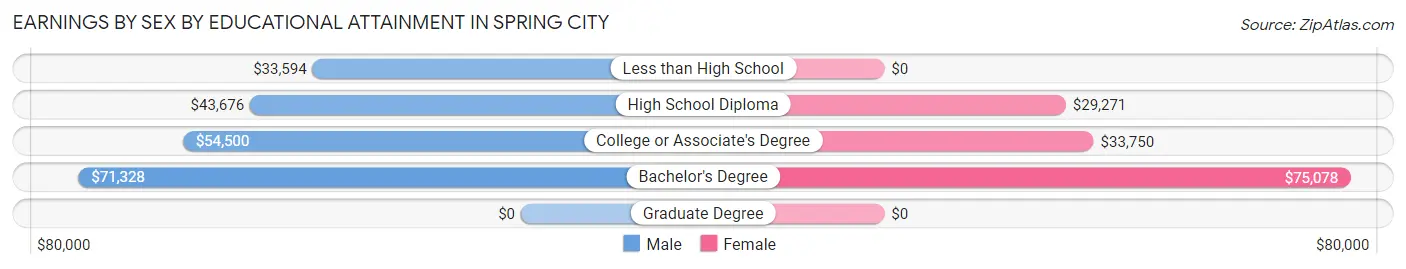
Earnings by Sex by Educational Attainment in Spring City
Average earnings in Spring City are $51,806 for men and $36,667 for women, a difference of 29.2%. Men with an educational attainment of bachelor's degree enjoy the highest average annual earnings of $71,328, while those with less than high school education earn the least with $33,594. Women with an educational attainment of bachelor's degree earn the most with the average annual earnings of $75,078, while those with high school diploma education have the smallest earnings of $29,271.
| Educational Attainment | Male Income | Female Income |
| Less than High School | $33,594 | $0 |
| High School Diploma | $43,676 | $29,271 |
| College or Associate's Degree | $54,500 | $33,750 |
| Bachelor's Degree | $71,328 | $75,078 |
| Graduate Degree | - | - |
| Total | $51,806 | $36,667 |
Family Income in Spring City
Family Income Brackets in Spring City
According to the Spring City family income data, there are 119 families falling into the $50,000 to $74,999 income range, which is the most common income bracket and makes up 22.5% of all families. Conversely, the less than $10,000 income bracket is the least frequent group with only 6 families (1.1%) belonging to this category.
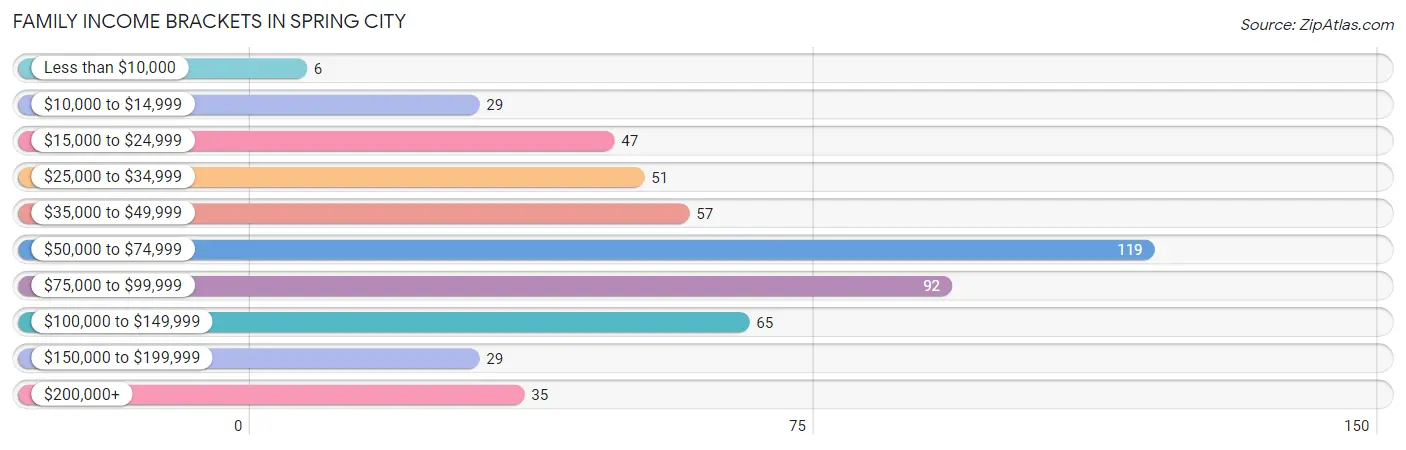
| Income Bracket | # Families | % Families |
| Less than $10,000 | 6 | 1.1% |
| $10,000 to $14,999 | 29 | 5.5% |
| $15,000 to $24,999 | 47 | 8.9% |
| $25,000 to $34,999 | 51 | 9.6% |
| $35,000 to $49,999 | 57 | 10.8% |
| $50,000 to $74,999 | 119 | 22.5% |
| $75,000 to $99,999 | 92 | 17.4% |
| $100,000 to $149,999 | 65 | 12.3% |
| $150,000 to $199,999 | 29 | 5.5% |
| $200,000+ | 35 | 6.6% |
Family Income by Famaliy Size in Spring City
5-person families (51 | 9.6%) account for the highest median family income in Spring City with $92,679 per family, while 2-person families (241 | 45.5%) have the highest median income of $20,375 per family member.
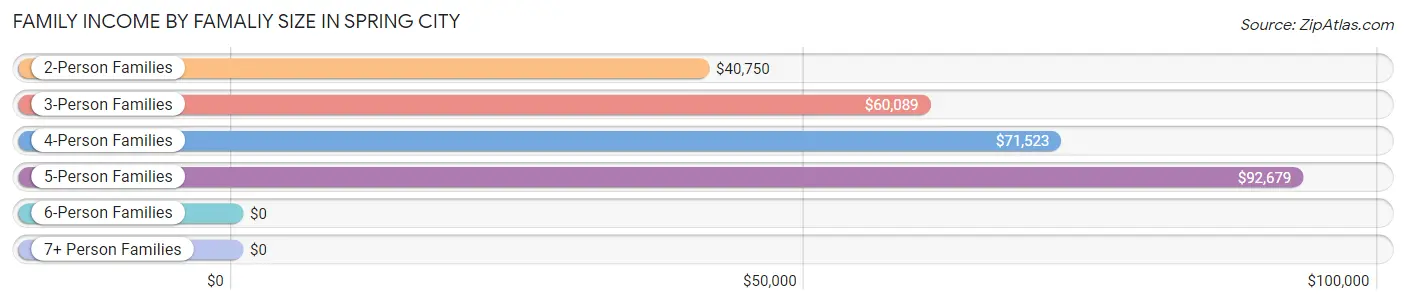
| Income Bracket | # Families | Median Income |
| 2-Person Families | 241 (45.5%) | $40,750 |
| 3-Person Families | 103 (19.4%) | $60,089 |
| 4-Person Families | 103 (19.4%) | $71,523 |
| 5-Person Families | 51 (9.6%) | $92,679 |
| 6-Person Families | 21 (4.0%) | $0 |
| 7+ Person Families | 11 (2.1%) | $0 |
| Total | 530 (100.0%) | $70,291 |
Family Income by Number of Earners in Spring City
The median family income in Spring City is $70,291, with families comprising 3+ earners (50) having the highest median family income of $156,250, while families with no earners (132) have the lowest median family income of $28,167, accounting for 9.4% and 24.9% of families, respectively.
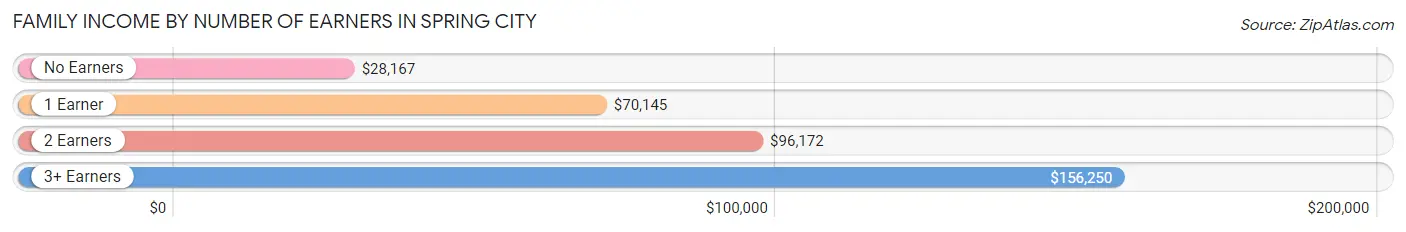
| Number of Earners | # Families | Median Income |
| No Earners | 132 (24.9%) | $28,167 |
| 1 Earner | 195 (36.8%) | $70,145 |
| 2 Earners | 153 (28.9%) | $96,172 |
| 3+ Earners | 50 (9.4%) | $156,250 |
| Total | 530 (100.0%) | $70,291 |
Household Income in Spring City
Household Income Brackets in Spring City
With 171 households falling in the category, the $10,000 to $14,999 income range is the most frequent in Spring City, accounting for 16.9% of all households. In contrast, only 35 households (3.5%) fall into the $200,000+ income bracket, making it the least populous group.
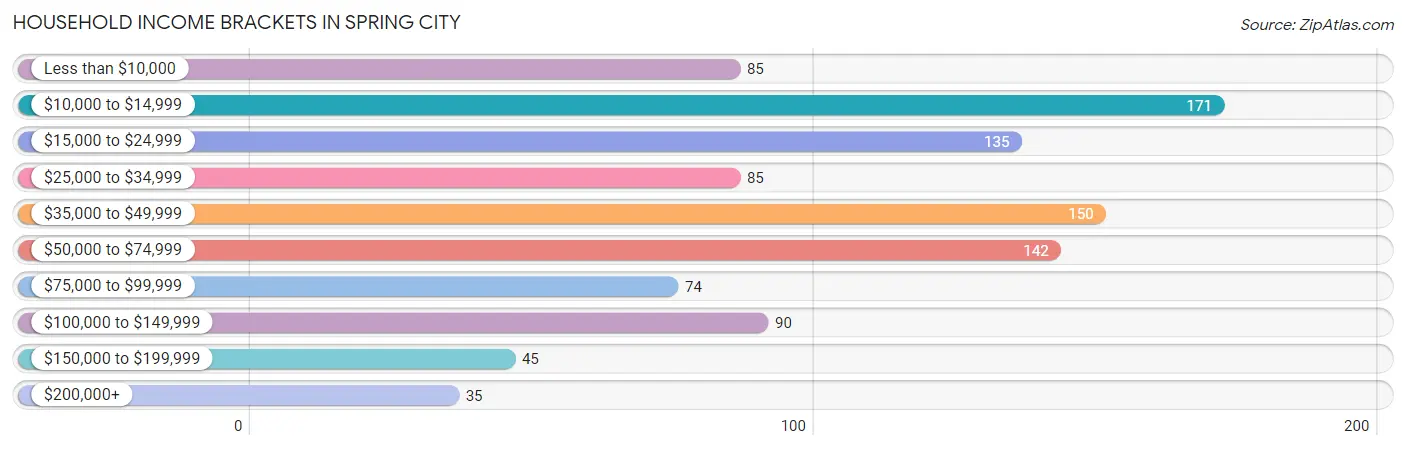
| Income Bracket | # Households | % Households |
| Less than $10,000 | 85 | 8.4% |
| $10,000 to $14,999 | 171 | 16.9% |
| $15,000 to $24,999 | 135 | 13.3% |
| $25,000 to $34,999 | 85 | 8.4% |
| $35,000 to $49,999 | 150 | 14.8% |
| $50,000 to $74,999 | 142 | 14.0% |
| $75,000 to $99,999 | 74 | 7.3% |
| $100,000 to $149,999 | 90 | 8.9% |
| $150,000 to $199,999 | 45 | 4.4% |
| $200,000+ | 35 | 3.5% |
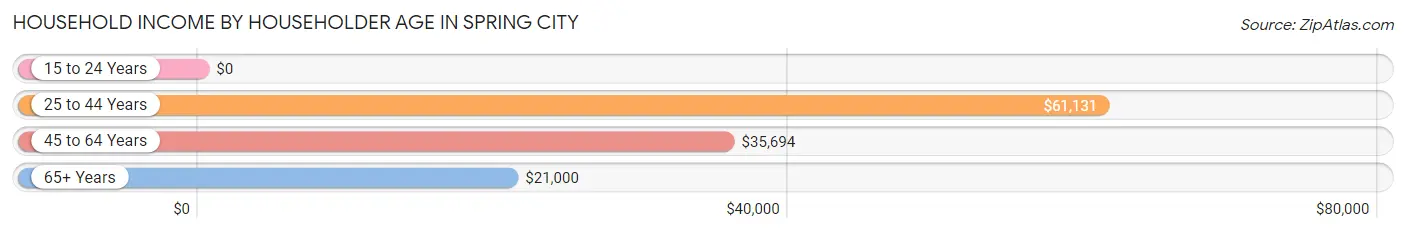
Household Income by Householder Age in Spring City
The median household income in Spring City is $36,190, with the highest median household income of $61,131 found in the 25 to 44 years age bracket for the primary householder. A total of 271 households (26.8%) fall into this category.
| Income Bracket | # Households | Median Income |
| 15 to 24 Years | 0 (0.0%) | $0 |
| 25 to 44 Years | 271 (26.8%) | $61,131 |
| 45 to 64 Years | 389 (38.4%) | $35,694 |
| 65+ Years | 352 (34.8%) | $21,000 |
| Total | 1,012 (100.0%) | $36,190 |
Poverty in Spring City
Income Below Poverty by Sex and Age in Spring City
With 17.4% poverty level for males and 22.2% for females among the residents of Spring City, 18 to 24 year old males and 15 year old females are the most vulnerable to poverty, with 25 males (39.1%) and 14 females (38.9%) in their respective age groups living below the poverty level.
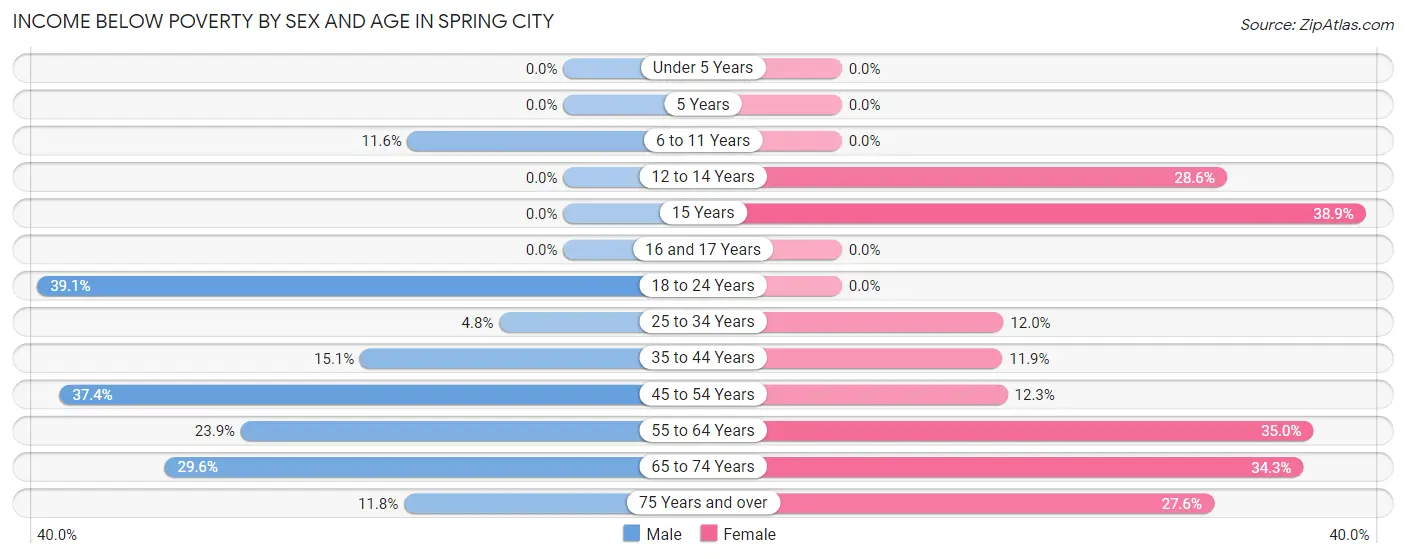
| Age Bracket | Male | Female |
| Under 5 Years | 0 (0.0%) | 0 (0.0%) |
| 5 Years | 0 (0.0%) | 0 (0.0%) |
| 6 to 11 Years | 17 (11.6%) | 0 (0.0%) |
| 12 to 14 Years | 0 (0.0%) | 6 (28.6%) |
| 15 Years | 0 (0.0%) | 14 (38.9%) |
| 16 and 17 Years | 0 (0.0%) | 0 (0.0%) |
| 18 to 24 Years | 25 (39.1%) | 0 (0.0%) |
| 25 to 34 Years | 7 (4.8%) | 12 (12.0%) |
| 35 to 44 Years | 16 (15.1%) | 18 (11.9%) |
| 45 to 54 Years | 55 (37.4%) | 16 (12.3%) |
| 55 to 64 Years | 45 (23.9%) | 63 (35.0%) |
| 65 to 74 Years | 37 (29.6%) | 74 (34.3%) |
| 75 Years and over | 11 (11.8%) | 29 (27.6%) |
| Total | 213 (17.4%) | 232 (22.2%) |
Income Above Poverty by Sex and Age in Spring City
According to the poverty statistics in Spring City, males aged under 5 years and females aged under 5 years are the age groups that are most secure financially, with 100.0% of males and 100.0% of females in these age groups living above the poverty line.
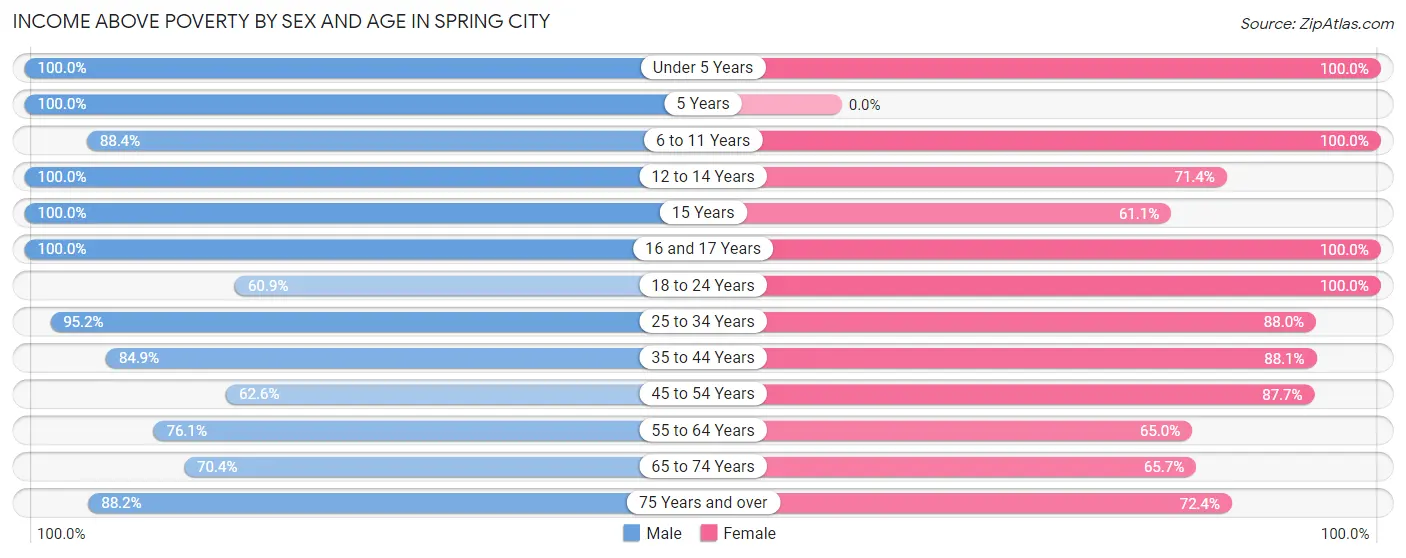
| Age Bracket | Male | Female |
| Under 5 Years | 114 (100.0%) | 17 (100.0%) |
| 5 Years | 12 (100.0%) | 0 (0.0%) |
| 6 to 11 Years | 130 (88.4%) | 49 (100.0%) |
| 12 to 14 Years | 47 (100.0%) | 15 (71.4%) |
| 15 Years | 12 (100.0%) | 22 (61.1%) |
| 16 and 17 Years | 19 (100.0%) | 11 (100.0%) |
| 18 to 24 Years | 39 (60.9%) | 28 (100.0%) |
| 25 to 34 Years | 140 (95.2%) | 88 (88.0%) |
| 35 to 44 Years | 90 (84.9%) | 133 (88.1%) |
| 45 to 54 Years | 92 (62.6%) | 114 (87.7%) |
| 55 to 64 Years | 143 (76.1%) | 117 (65.0%) |
| 65 to 74 Years | 88 (70.4%) | 142 (65.7%) |
| 75 Years and over | 82 (88.2%) | 76 (72.4%) |
| Total | 1,008 (82.6%) | 812 (77.8%) |
Income Below Poverty Among Married-Couple Families in Spring City
The poverty statistics for married-couple families in Spring City show that 9.7% or 36 of the total 373 families live below the poverty line. Families with 3 or 4 children have the highest poverty rate of 11.3%, comprising of 6 families. On the other hand, families with 5 or more children have the lowest poverty rate of 0.0%, which includes 0 families.
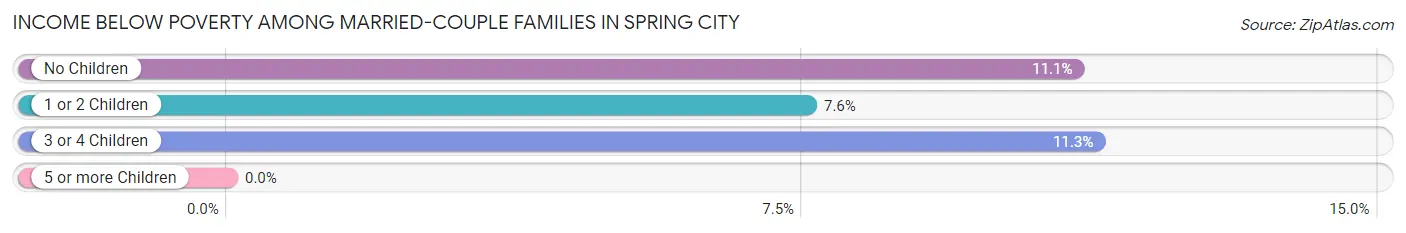
| Children | Above Poverty | Below Poverty |
| No Children | 169 (88.9%) | 21 (11.1%) |
| 1 or 2 Children | 110 (92.4%) | 9 (7.6%) |
| 3 or 4 Children | 47 (88.7%) | 6 (11.3%) |
| 5 or more Children | 11 (100.0%) | 0 (0.0%) |
| Total | 337 (90.3%) | 36 (9.7%) |
Income Below Poverty Among Single-Parent Households in Spring City
According to the poverty data in Spring City, 7.3% or 3 single-father households and 27.6% or 32 single-mother households are living below the poverty line. Among single-father households, those with no children have the highest poverty rate, with 3 households (13.6%) experiencing poverty. Likewise, among single-mother households, those with no children have the highest poverty rate, with 32 households (47.1%) falling below the poverty line.
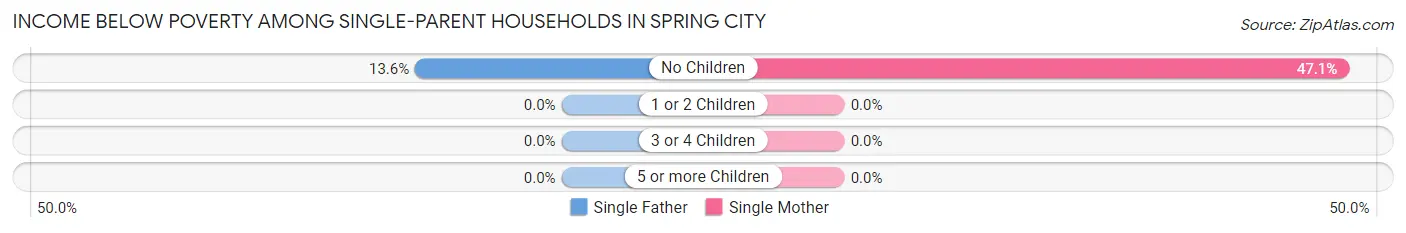
| Children | Single Father | Single Mother |
| No Children | 3 (13.6%) | 32 (47.1%) |
| 1 or 2 Children | 0 (0.0%) | 0 (0.0%) |
| 3 or 4 Children | 0 (0.0%) | 0 (0.0%) |
| 5 or more Children | 0 (0.0%) | 0 (0.0%) |
| Total | 3 (7.3%) | 32 (27.6%) |
Income Below Poverty Among Married-Couple vs Single-Parent Households in Spring City
The poverty data for Spring City shows that 36 of the married-couple family households (9.7%) and 35 of the single-parent households (22.3%) are living below the poverty level. Within the married-couple family households, those with 3 or 4 children have the highest poverty rate, with 6 households (11.3%) falling below the poverty line. Among the single-parent households, those with no children have the highest poverty rate, with 35 household (38.9%) living below poverty.
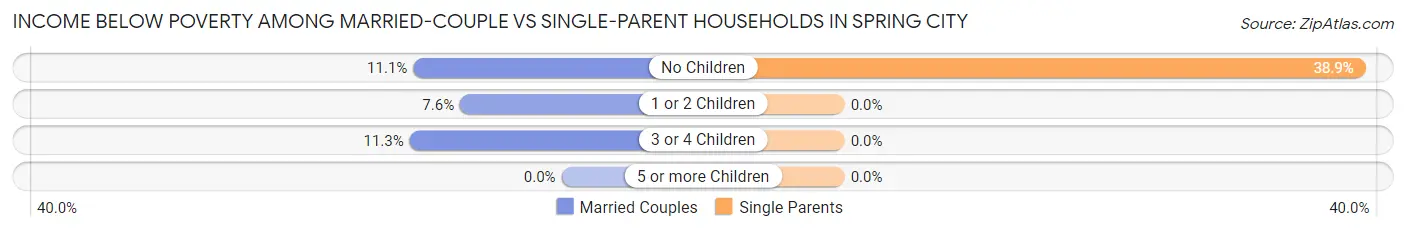
| Children | Married-Couple Families | Single-Parent Households |
| No Children | 21 (11.1%) | 35 (38.9%) |
| 1 or 2 Children | 9 (7.6%) | 0 (0.0%) |
| 3 or 4 Children | 6 (11.3%) | 0 (0.0%) |
| 5 or more Children | 0 (0.0%) | 0 (0.0%) |
| Total | 36 (9.7%) | 35 (22.3%) |
Race in Spring City
The most populous races in Spring City are White / Caucasian (2,165 | 94.4%), Black / African American (74 | 3.2%), and Two or more Races (49 | 2.1%).
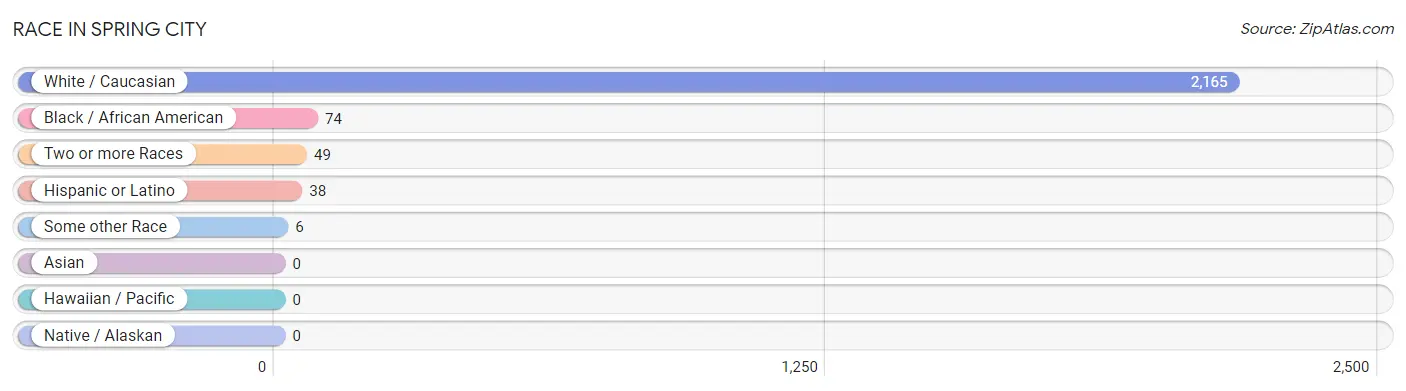
| Race | # Population | % Population |
| Asian | 0 | 0.0% |
| Black / African American | 74 | 3.2% |
| Hawaiian / Pacific | 0 | 0.0% |
| Hispanic or Latino | 38 | 1.7% |
| Native / Alaskan | 0 | 0.0% |
| White / Caucasian | 2,165 | 94.4% |
| Two or more Races | 49 | 2.1% |
| Some other Race | 6 | 0.3% |
| Total | 2,294 | 100.0% |
Ancestry in Spring City
The most populous ancestries reported in Spring City are German (350 | 15.3%), English (250 | 10.9%), American (237 | 10.3%), Irish (214 | 9.3%), and Scottish (160 | 7.0%), together accounting for 52.8% of all Spring City residents.
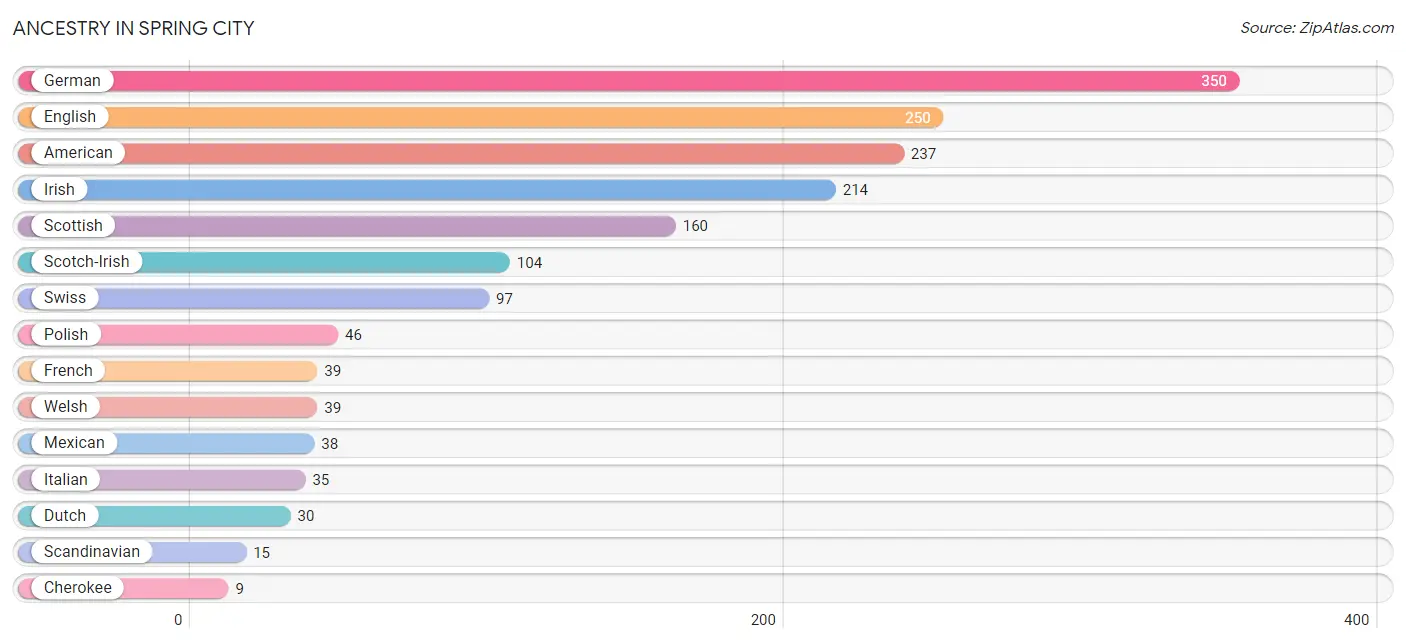
| Ancestry | # Population | % Population |
| American | 237 | 10.3% |
| British | 5 | 0.2% |
| Cherokee | 9 | 0.4% |
| Dutch | 30 | 1.3% |
| English | 250 | 10.9% |
| European | 6 | 0.3% |
| French | 39 | 1.7% |
| French Canadian | 4 | 0.2% |
| German | 350 | 15.3% |
| Inupiat | 3 | 0.1% |
| Irish | 214 | 9.3% |
| Italian | 35 | 1.5% |
| Mexican | 38 | 1.7% |
| Polish | 46 | 2.0% |
| Scandinavian | 15 | 0.6% |
| Scotch-Irish | 104 | 4.5% |
| Scottish | 160 | 7.0% |
| Swiss | 97 | 4.2% |
| Welsh | 39 | 1.7% | View All 19 Rows |
Immigrants in Spring City

| Immigration Origin | # Population | % Population | View All 0 Rows |
Sex and Age in Spring City
Sex and Age in Spring City
The most populous age groups in Spring City are 5 to 9 Years (115 | 9.3%) for men and 65 to 69 Years (113 | 10.7%) for women.
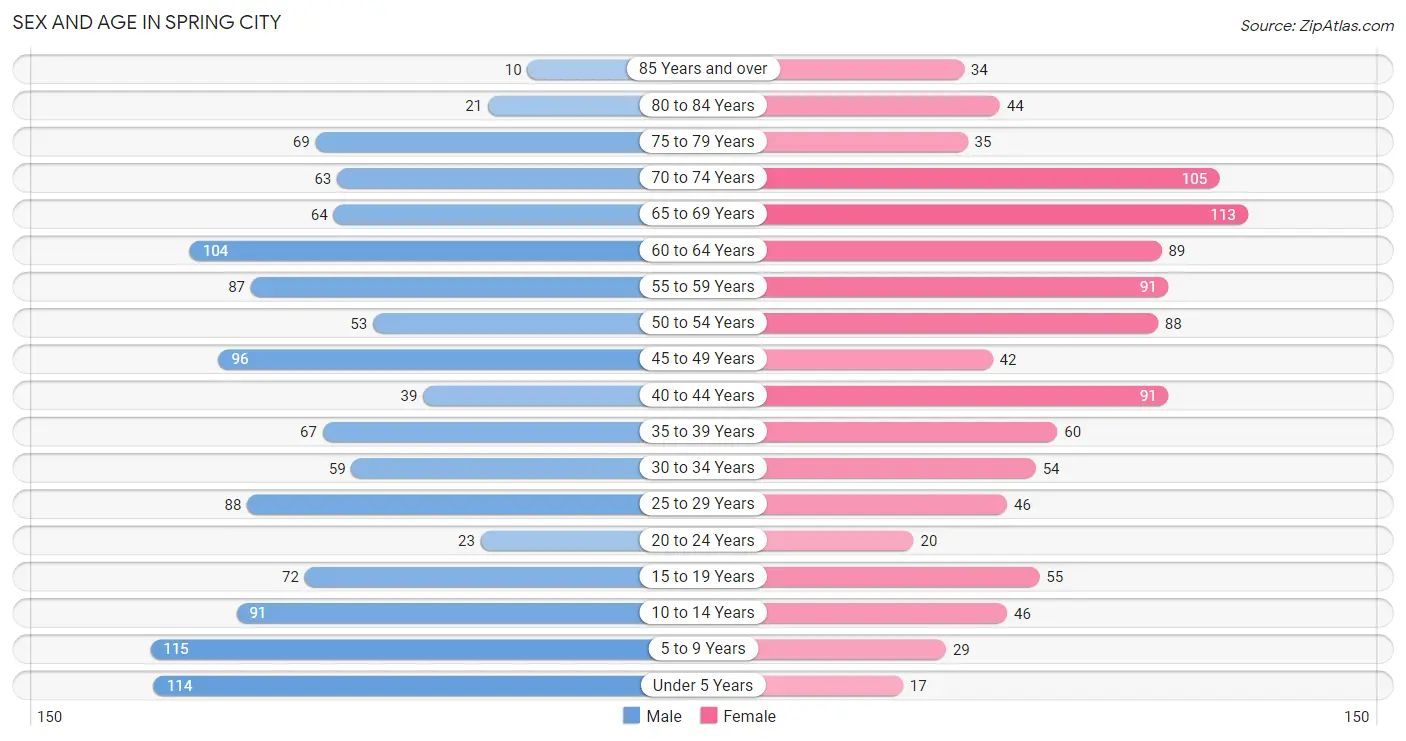
| Age Bracket | Male | Female |
| Under 5 Years | 114 (9.2%) | 17 (1.6%) |
| 5 to 9 Years | 115 (9.3%) | 29 (2.7%) |
| 10 to 14 Years | 91 (7.4%) | 46 (4.3%) |
| 15 to 19 Years | 72 (5.8%) | 55 (5.2%) |
| 20 to 24 Years | 23 (1.9%) | 20 (1.9%) |
| 25 to 29 Years | 88 (7.1%) | 46 (4.3%) |
| 30 to 34 Years | 59 (4.8%) | 54 (5.1%) |
| 35 to 39 Years | 67 (5.4%) | 60 (5.7%) |
| 40 to 44 Years | 39 (3.2%) | 91 (8.6%) |
| 45 to 49 Years | 96 (7.8%) | 42 (4.0%) |
| 50 to 54 Years | 53 (4.3%) | 88 (8.3%) |
| 55 to 59 Years | 87 (7.0%) | 91 (8.6%) |
| 60 to 64 Years | 104 (8.4%) | 89 (8.4%) |
| 65 to 69 Years | 64 (5.2%) | 113 (10.7%) |
| 70 to 74 Years | 63 (5.1%) | 105 (9.9%) |
| 75 to 79 Years | 69 (5.6%) | 35 (3.3%) |
| 80 to 84 Years | 21 (1.7%) | 44 (4.2%) |
| 85 Years and over | 10 (0.8%) | 34 (3.2%) |
| Total | 1,235 (100.0%) | 1,059 (100.0%) |
Families and Households in Spring City
Median Family Size in Spring City
The median family size in Spring City is 3.09 persons per family, with married-couple families (373 | 70.4%) accounting for the largest median family size of 3.32 persons per family. On the other hand, single male/father families (41 | 7.7%) represent the smallest median family size with 2.41 persons per family.
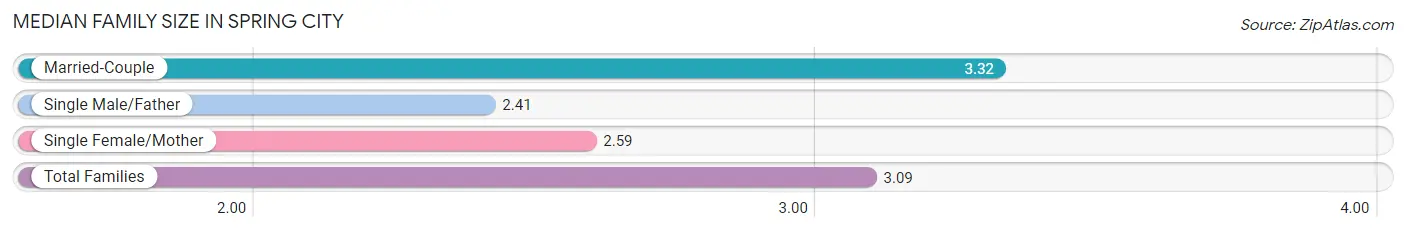
| Family Type | # Families | Family Size |
| Married-Couple | 373 (70.4%) | 3.32 |
| Single Male/Father | 41 (7.7%) | 2.41 |
| Single Female/Mother | 116 (21.9%) | 2.59 |
| Total Families | 530 (100.0%) | 3.09 |
Median Household Size in Spring City
The median household size in Spring City is 2.17 persons per household, with married-couple households (373 | 36.9%) accounting for the largest median household size of 3.34 persons per household. non-family households (482 | 47.6%) represent the smallest median household size with 1.08 persons per household.
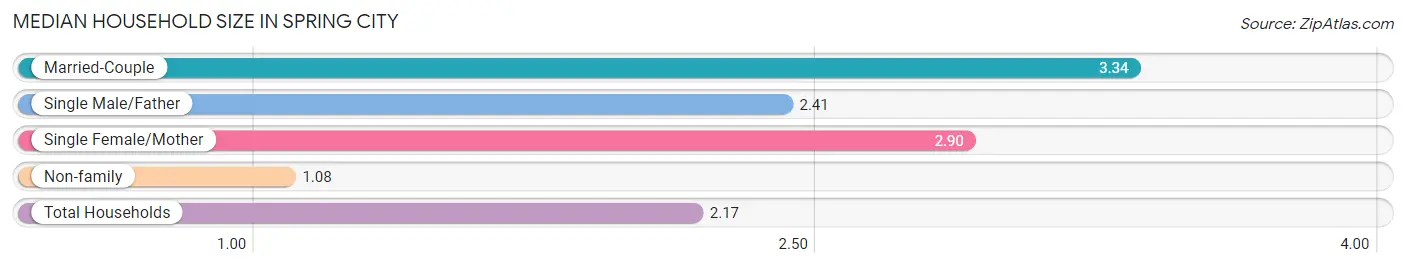
| Household Type | # Households | Household Size |
| Married-Couple | 373 (36.9%) | 3.34 |
| Single Male/Father | 41 (4.1%) | 2.41 |
| Single Female/Mother | 116 (11.5%) | 2.90 |
| Non-family | 482 (47.6%) | 1.08 |
| Total Households | 1,012 (100.0%) | 2.17 |
Household Size by Marriage Status in Spring City
Out of a total of 1,012 households in Spring City, 530 (52.4%) are family households, while 482 (47.6%) are nonfamily households. The most numerous type of family households are 2-person households, comprising 218, and the most common type of nonfamily households are 1-person households, comprising 424.
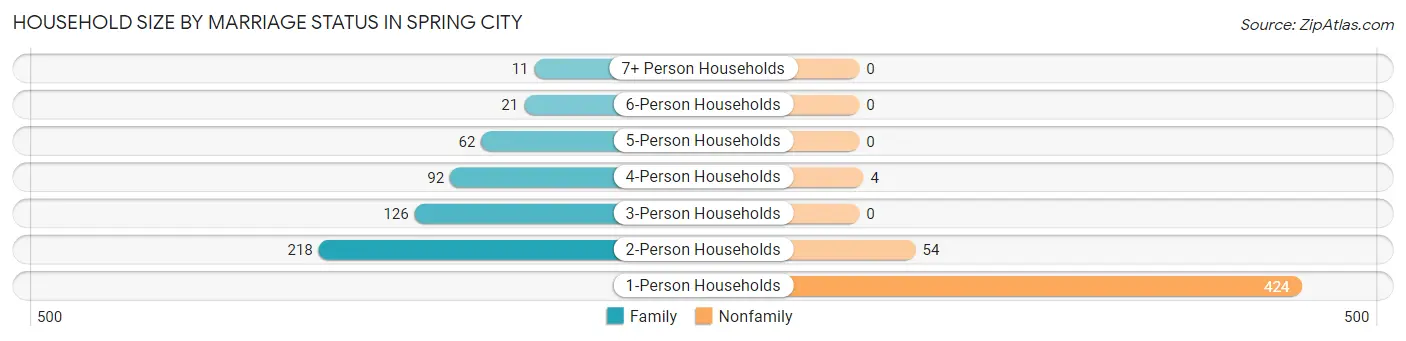
| Household Size | Family Households | Nonfamily Households |
| 1-Person Households | - | 424 (41.9%) |
| 2-Person Households | 218 (21.5%) | 54 (5.3%) |
| 3-Person Households | 126 (12.4%) | 0 (0.0%) |
| 4-Person Households | 92 (9.1%) | 4 (0.4%) |
| 5-Person Households | 62 (6.1%) | 0 (0.0%) |
| 6-Person Households | 21 (2.1%) | 0 (0.0%) |
| 7+ Person Households | 11 (1.1%) | 0 (0.0%) |
| Total | 530 (52.4%) | 482 (47.6%) |
Female Fertility in Spring City
Fertility by Age in Spring City
Average fertility rate in Spring City is 47.0 births per 1,000 women. Women in the age bracket of 20 to 34 years have the highest fertility rate with 158.0 births per 1,000 women. Women in the age bracket of 20 to 34 years acount for 100.0% of all women with births.
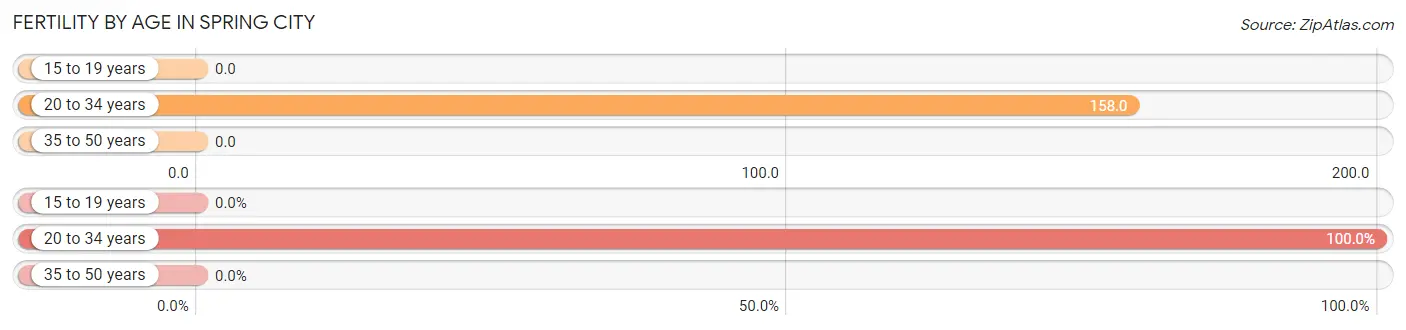
| Age Bracket | Women with Births | Births / 1,000 Women |
| 15 to 19 years | 0 (0.0%) | 0.0 |
| 20 to 34 years | 19 (100.0%) | 158.0 |
| 35 to 50 years | 0 (0.0%) | 0.0 |
| Total | 19 (100.0%) | 47.0 |
Fertility by Age by Marriage Status in Spring City
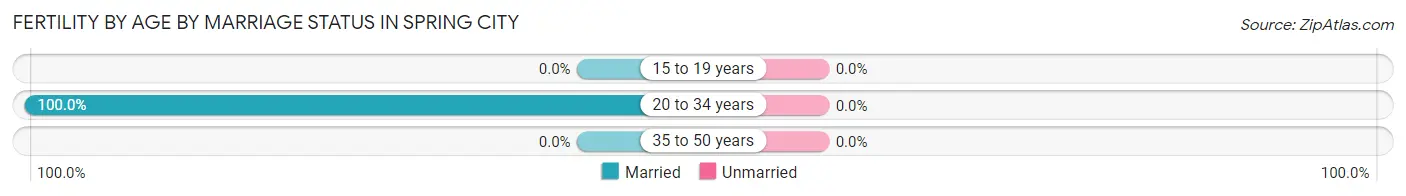
| Age Bracket | Married | Unmarried |
| 15 to 19 years | 0 (0.0%) | 0 (0.0%) |
| 20 to 34 years | 19 (100.0%) | 0 (0.0%) |
| 35 to 50 years | 0 (0.0%) | 0 (0.0%) |
| Total | 19 (100.0%) | 0 (0.0%) |
Fertility by Education in Spring City
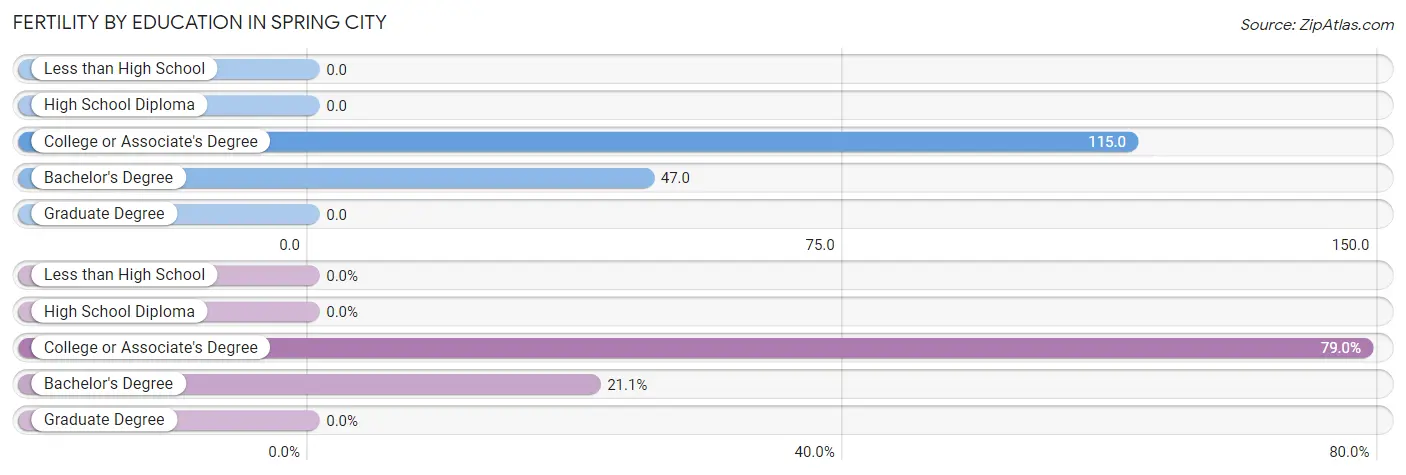
| Educational Attainment | Women with Births | Births / 1,000 Women |
| Less than High School | 0 (0.0%) | 0.0 |
| High School Diploma | 0 (0.0%) | 0.0 |
| College or Associate's Degree | 15 (78.9%) | 115.0 |
| Bachelor's Degree | 4 (21.0%) | 47.0 |
| Graduate Degree | 0 (0.0%) | 0.0 |
| Total | 19 (100.0%) | 47.0 |
Fertility by Education by Marriage Status in Spring City
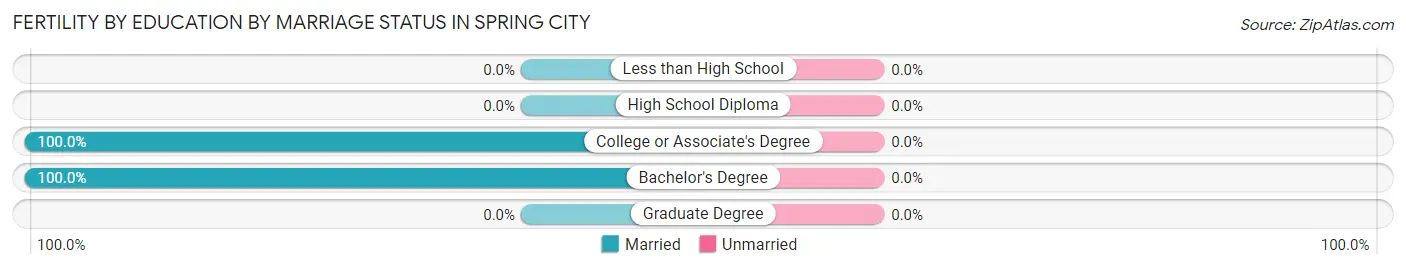
| Educational Attainment | Married | Unmarried |
| Less than High School | 0 (0.0%) | 0 (0.0%) |
| High School Diploma | 0 (0.0%) | 0 (0.0%) |
| College or Associate's Degree | 15 (100.0%) | 0 (0.0%) |
| Bachelor's Degree | 4 (100.0%) | 0 (0.0%) |
| Graduate Degree | 0 (0.0%) | 0 (0.0%) |
| Total | 19 (100.0%) | 0 (0.0%) |
Employment Characteristics in Spring City
Employment by Class of Employer in Spring City
Among the 736 employed individuals in Spring City, private company employees (408 | 55.4%), not-for-profit organizations (118 | 16.0%), and federal government employees (73 | 9.9%) make up the most common classes of employment.
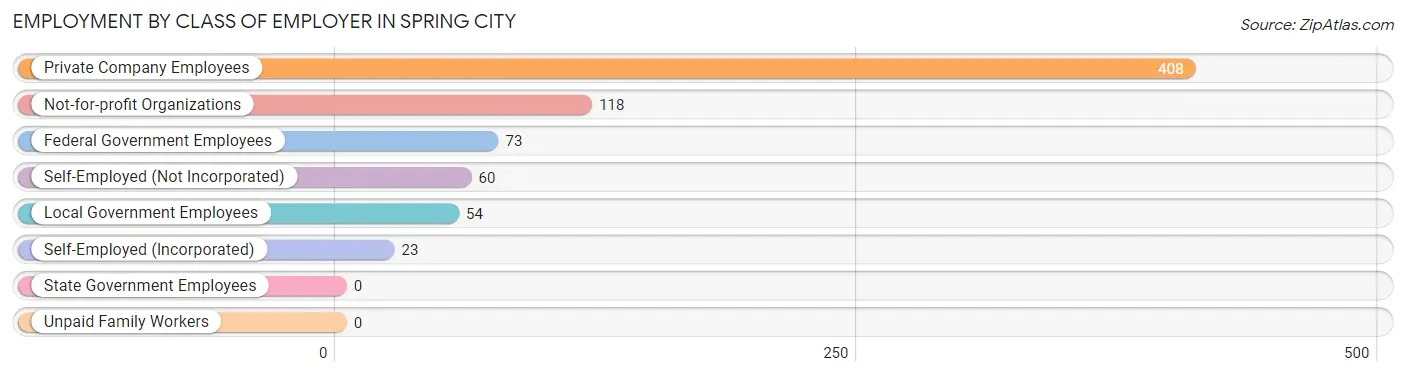
| Employer Class | # Employees | % Employees |
| Private Company Employees | 408 | 55.4% |
| Self-Employed (Incorporated) | 23 | 3.1% |
| Self-Employed (Not Incorporated) | 60 | 8.2% |
| Not-for-profit Organizations | 118 | 16.0% |
| Local Government Employees | 54 | 7.3% |
| State Government Employees | 0 | 0.0% |
| Federal Government Employees | 73 | 9.9% |
| Unpaid Family Workers | 0 | 0.0% |
| Total | 736 | 100.0% |
Employment Status by Age in Spring City
According to the labor force statistics for Spring City, out of the total population over 16 years of age (1,834), 48.3% or 886 individuals are in the labor force, with 10.6% or 94 of them unemployed. The age group with the highest labor force participation rate is 35 to 44 years, with 86.8% or 223 individuals in the labor force. Within the labor force, the 16 to 19 years age range has the highest percentage of unemployed individuals, with 59.5% or 25 of them being unemployed.
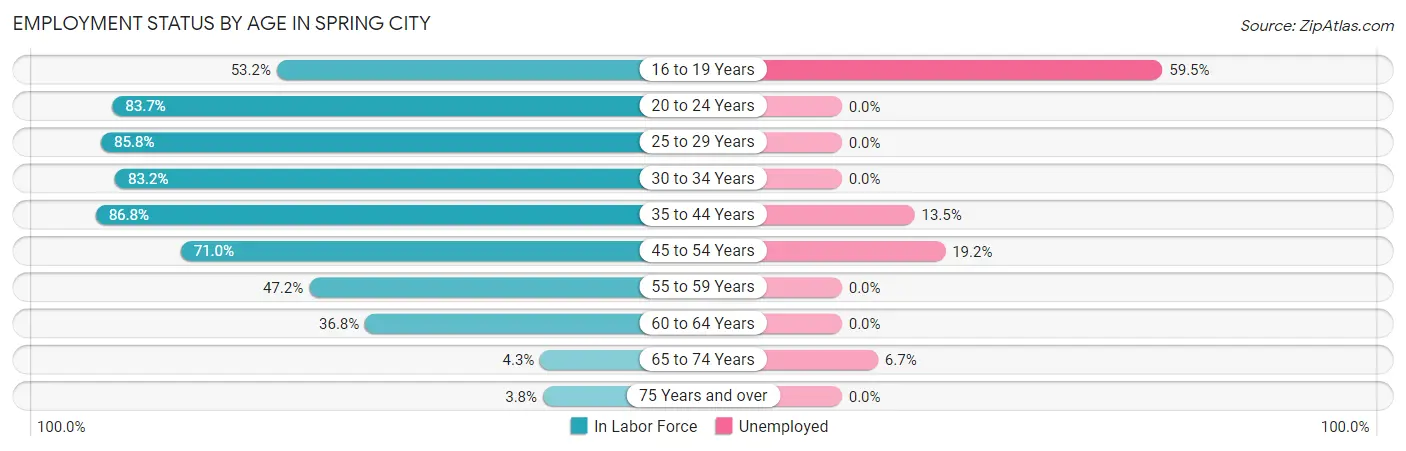
| Age Bracket | In Labor Force | Unemployed |
| 16 to 19 Years | 42 (53.2%) | 25 (59.5%) |
| 20 to 24 Years | 36 (83.7%) | 0 (0.0%) |
| 25 to 29 Years | 115 (85.8%) | 0 (0.0%) |
| 30 to 34 Years | 94 (83.2%) | 0 (0.0%) |
| 35 to 44 Years | 223 (86.8%) | 30 (13.5%) |
| 45 to 54 Years | 198 (71.0%) | 38 (19.2%) |
| 55 to 59 Years | 84 (47.2%) | 0 (0.0%) |
| 60 to 64 Years | 71 (36.8%) | 0 (0.0%) |
| 65 to 74 Years | 15 (4.3%) | 1 (6.7%) |
| 75 Years and over | 8 (3.8%) | 0 (0.0%) |
| Total | 886 (48.3%) | 94 (10.6%) |
Employment Status by Educational Attainment in Spring City
According to labor force statistics for Spring City, 68.0% of individuals (785) out of the total population between 25 and 64 years of age (1,154) are in the labor force, with 8.7% or 68 of them being unemployed. The group with the highest labor force participation rate are those with the educational attainment of bachelor's degree or higher, with 90.5% or 171 individuals in the labor force. Within the labor force, individuals with high school diploma education have the highest percentage of unemployment, with 16.7% or 53 of them being unemployed.
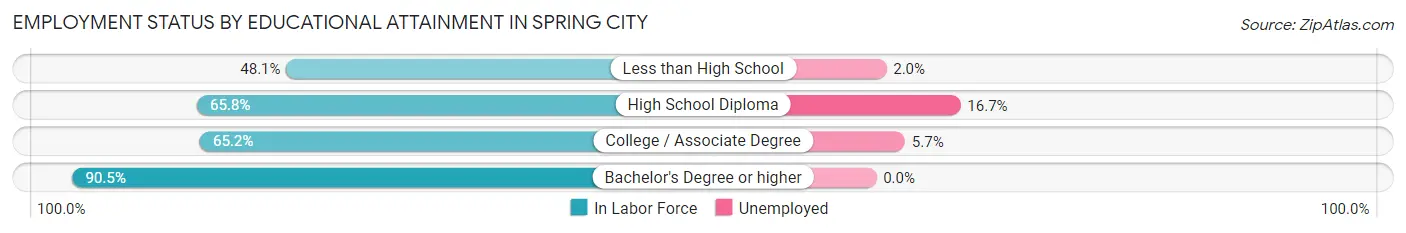
| Educational Attainment | In Labor Force | Unemployed |
| Less than High School | 50 (48.1%) | 2 (2.0%) |
| High School Diploma | 317 (65.8%) | 80 (16.7%) |
| College / Associate Degree | 247 (65.2%) | 22 (5.7%) |
| Bachelor's Degree or higher | 171 (90.5%) | 0 (0.0%) |
| Total | 785 (68.0%) | 100 (8.7%) |
Employment Occupations by Sex in Spring City
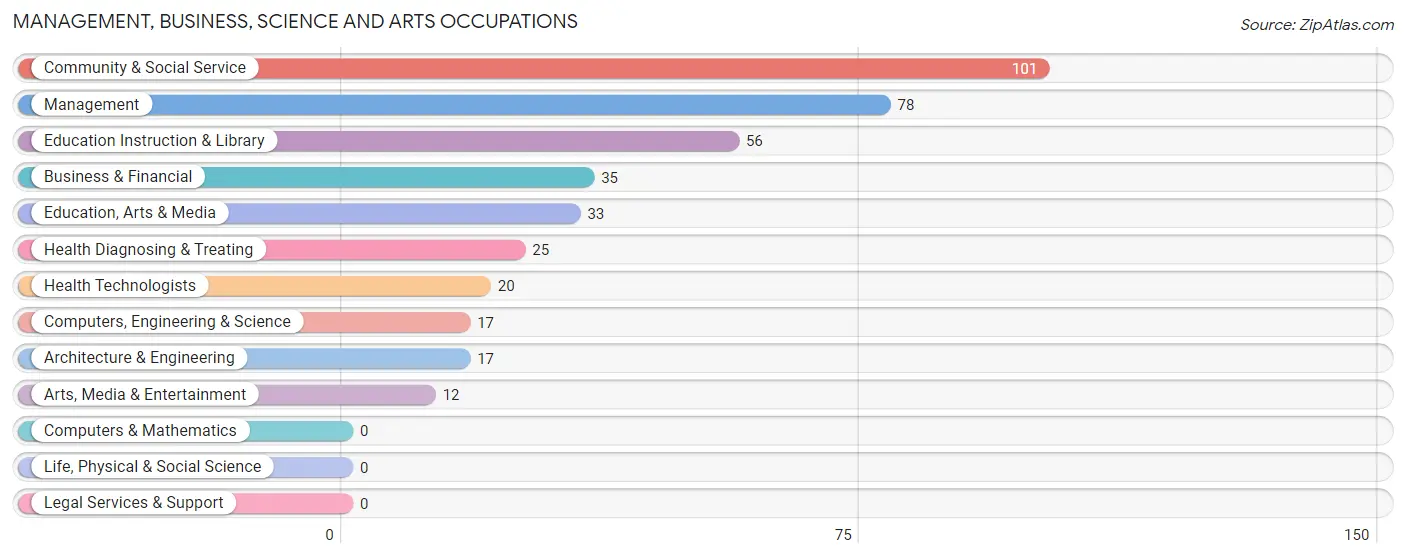
Management, Business, Science and Arts Occupations
The most common Management, Business, Science and Arts occupations in Spring City are Community & Social Service (101 | 12.8%), Management (78 | 9.9%), Education Instruction & Library (56 | 7.1%), Business & Financial (35 | 4.4%), and Education, Arts & Media (33 | 4.2%).
Management, Business, Science and Arts Occupations by Sex
Within the Management, Business, Science and Arts occupations in Spring City, the most male-oriented occupations are Education Instruction & Library (57.1%), Management (43.6%), and Community & Social Service (37.6%), while the most female-oriented occupations are Business & Financial (100.0%), Computers, Engineering & Science (100.0%), and Architecture & Engineering (100.0%).
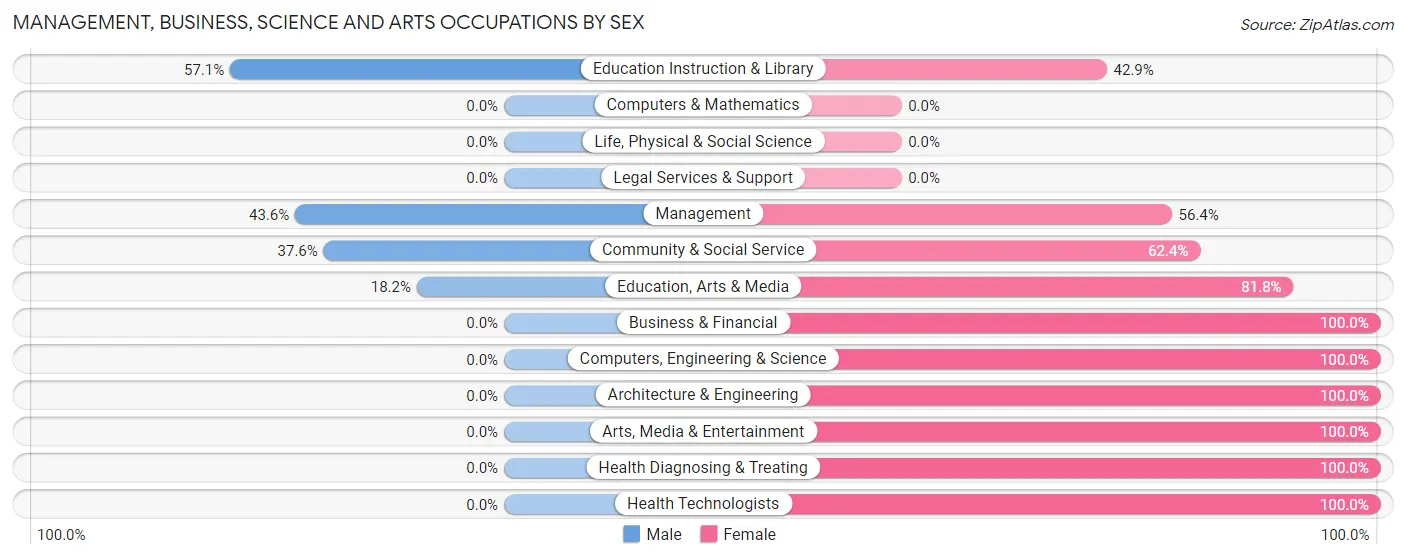
| Occupation | Male | Female |
| Management | 34 (43.6%) | 44 (56.4%) |
| Business & Financial | 0 (0.0%) | 35 (100.0%) |
| Computers, Engineering & Science | 0 (0.0%) | 17 (100.0%) |
| Computers & Mathematics | 0 (0.0%) | 0 (0.0%) |
| Architecture & Engineering | 0 (0.0%) | 17 (100.0%) |
| Life, Physical & Social Science | 0 (0.0%) | 0 (0.0%) |
| Community & Social Service | 38 (37.6%) | 63 (62.4%) |
| Education, Arts & Media | 6 (18.2%) | 27 (81.8%) |
| Legal Services & Support | 0 (0.0%) | 0 (0.0%) |
| Education Instruction & Library | 32 (57.1%) | 24 (42.9%) |
| Arts, Media & Entertainment | 0 (0.0%) | 12 (100.0%) |
| Health Diagnosing & Treating | 0 (0.0%) | 25 (100.0%) |
| Health Technologists | 0 (0.0%) | 20 (100.0%) |
| Total (Category) | 72 (28.1%) | 184 (71.9%) |
| Total (Overall) | 460 (58.1%) | 332 (41.9%) |
Services Occupations
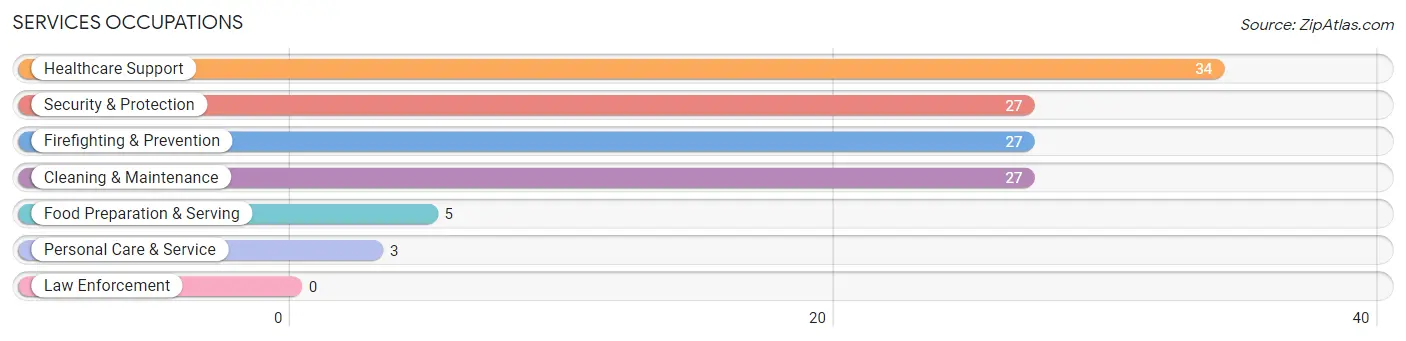
The most common Services occupations in Spring City are Healthcare Support (34 | 4.3%), Security & Protection (27 | 3.4%), Firefighting & Prevention (27 | 3.4%), Cleaning & Maintenance (27 | 3.4%), and Food Preparation & Serving (5 | 0.6%).
Services Occupations by Sex
Within the Services occupations in Spring City, the most male-oriented occupations are Cleaning & Maintenance (77.8%), Security & Protection (66.7%), and Firefighting & Prevention (66.7%), while the most female-oriented occupations are Healthcare Support (100.0%), Personal Care & Service (100.0%), and Food Preparation & Serving (40.0%).
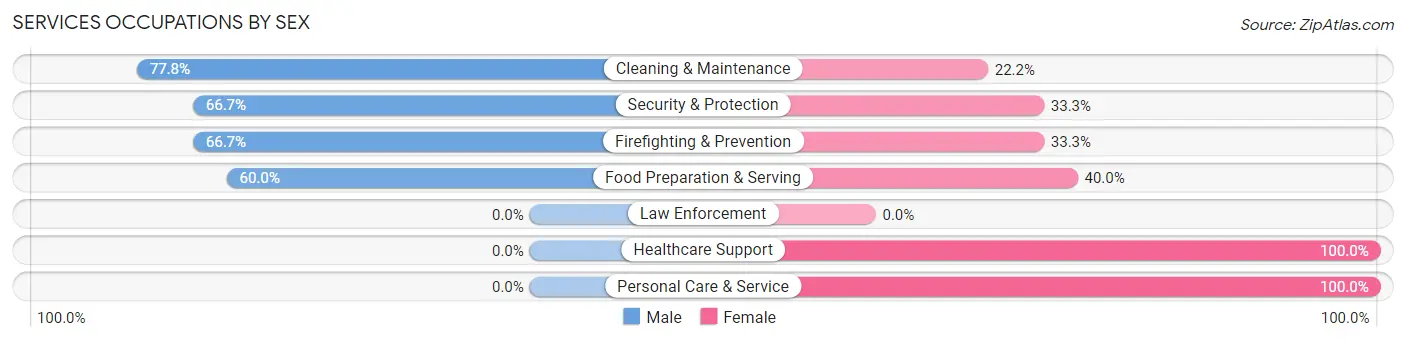
| Occupation | Male | Female |
| Healthcare Support | 0 (0.0%) | 34 (100.0%) |
| Security & Protection | 18 (66.7%) | 9 (33.3%) |
| Firefighting & Prevention | 18 (66.7%) | 9 (33.3%) |
| Law Enforcement | 0 (0.0%) | 0 (0.0%) |
| Food Preparation & Serving | 3 (60.0%) | 2 (40.0%) |
| Cleaning & Maintenance | 21 (77.8%) | 6 (22.2%) |
| Personal Care & Service | 0 (0.0%) | 3 (100.0%) |
| Total (Category) | 42 (43.8%) | 54 (56.2%) |
| Total (Overall) | 460 (58.1%) | 332 (41.9%) |
Sales and Office Occupations
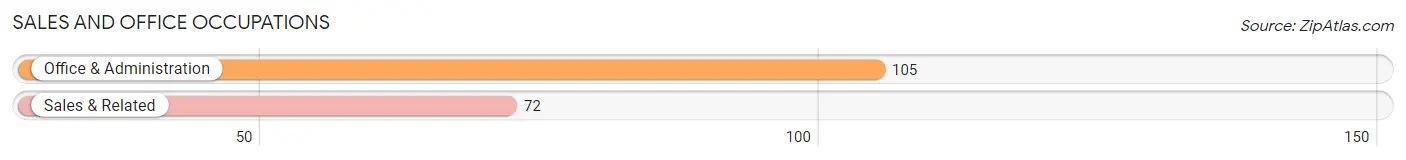
The most common Sales and Office occupations in Spring City are Office & Administration (105 | 13.3%), and Sales & Related (72 | 9.1%).
Sales and Office Occupations by Sex
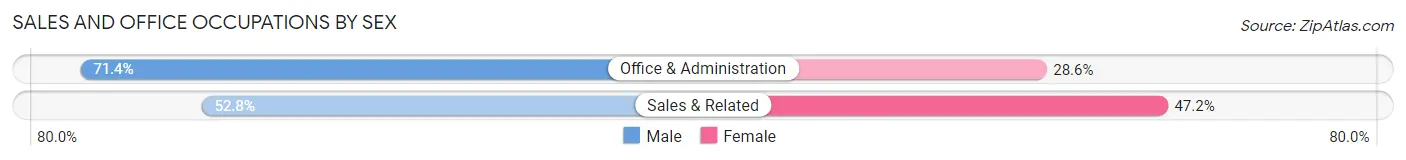
| Occupation | Male | Female |
| Sales & Related | 38 (52.8%) | 34 (47.2%) |
| Office & Administration | 75 (71.4%) | 30 (28.6%) |
| Total (Category) | 113 (63.8%) | 64 (36.2%) |
| Total (Overall) | 460 (58.1%) | 332 (41.9%) |
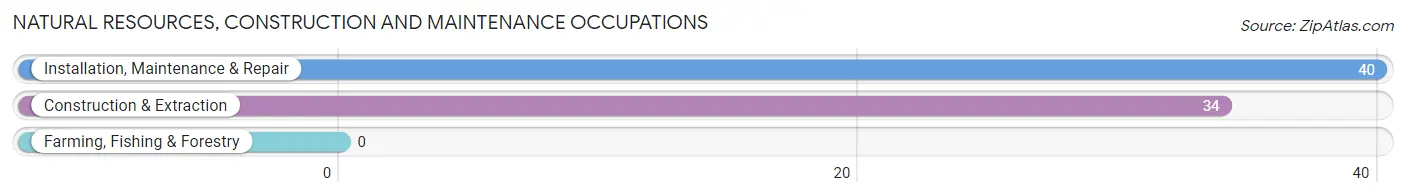
Natural Resources, Construction and Maintenance Occupations
The most common Natural Resources, Construction and Maintenance occupations in Spring City are Installation, Maintenance & Repair (40 | 5.1%), and Construction & Extraction (34 | 4.3%).
Natural Resources, Construction and Maintenance Occupations by Sex
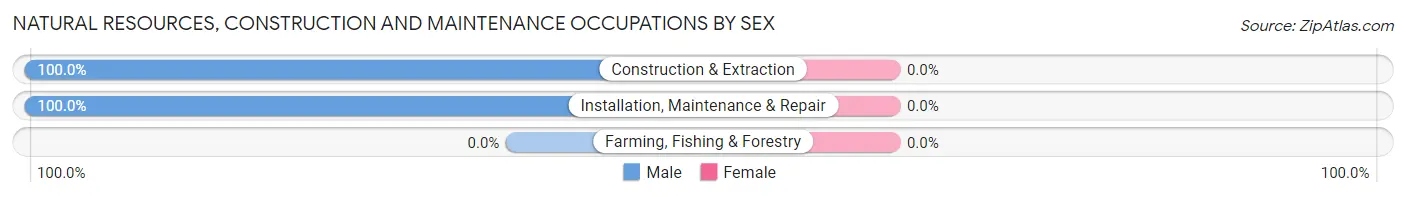
| Occupation | Male | Female |
| Farming, Fishing & Forestry | 0 (0.0%) | 0 (0.0%) |
| Construction & Extraction | 34 (100.0%) | 0 (0.0%) |
| Installation, Maintenance & Repair | 40 (100.0%) | 0 (0.0%) |
| Total (Category) | 74 (100.0%) | 0 (0.0%) |
| Total (Overall) | 460 (58.1%) | 332 (41.9%) |
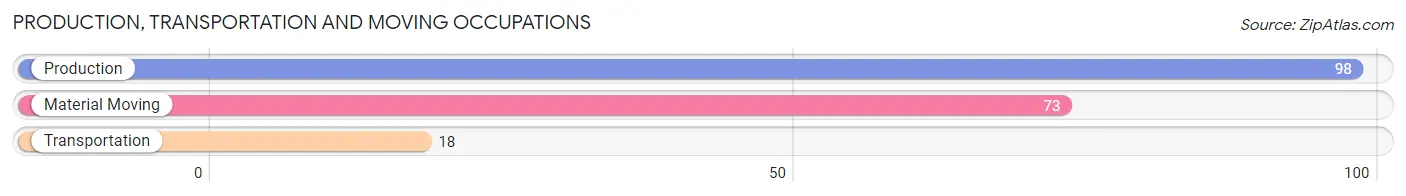
Production, Transportation and Moving Occupations
The most common Production, Transportation and Moving occupations in Spring City are Production (98 | 12.4%), Material Moving (73 | 9.2%), and Transportation (18 | 2.3%).
Production, Transportation and Moving Occupations by Sex
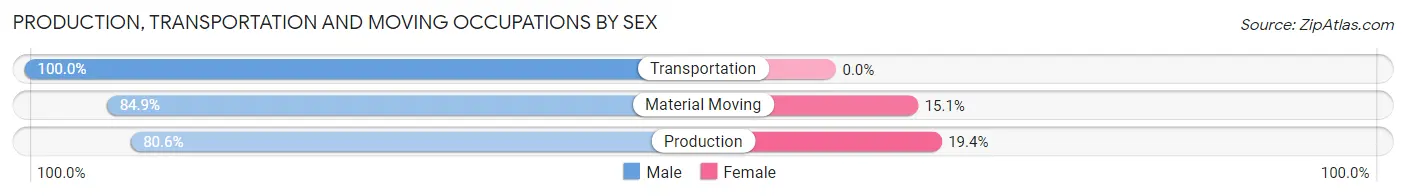
| Occupation | Male | Female |
| Production | 79 (80.6%) | 19 (19.4%) |
| Transportation | 18 (100.0%) | 0 (0.0%) |
| Material Moving | 62 (84.9%) | 11 (15.1%) |
| Total (Category) | 159 (84.1%) | 30 (15.9%) |
| Total (Overall) | 460 (58.1%) | 332 (41.9%) |
Employment Industries by Sex in Spring City
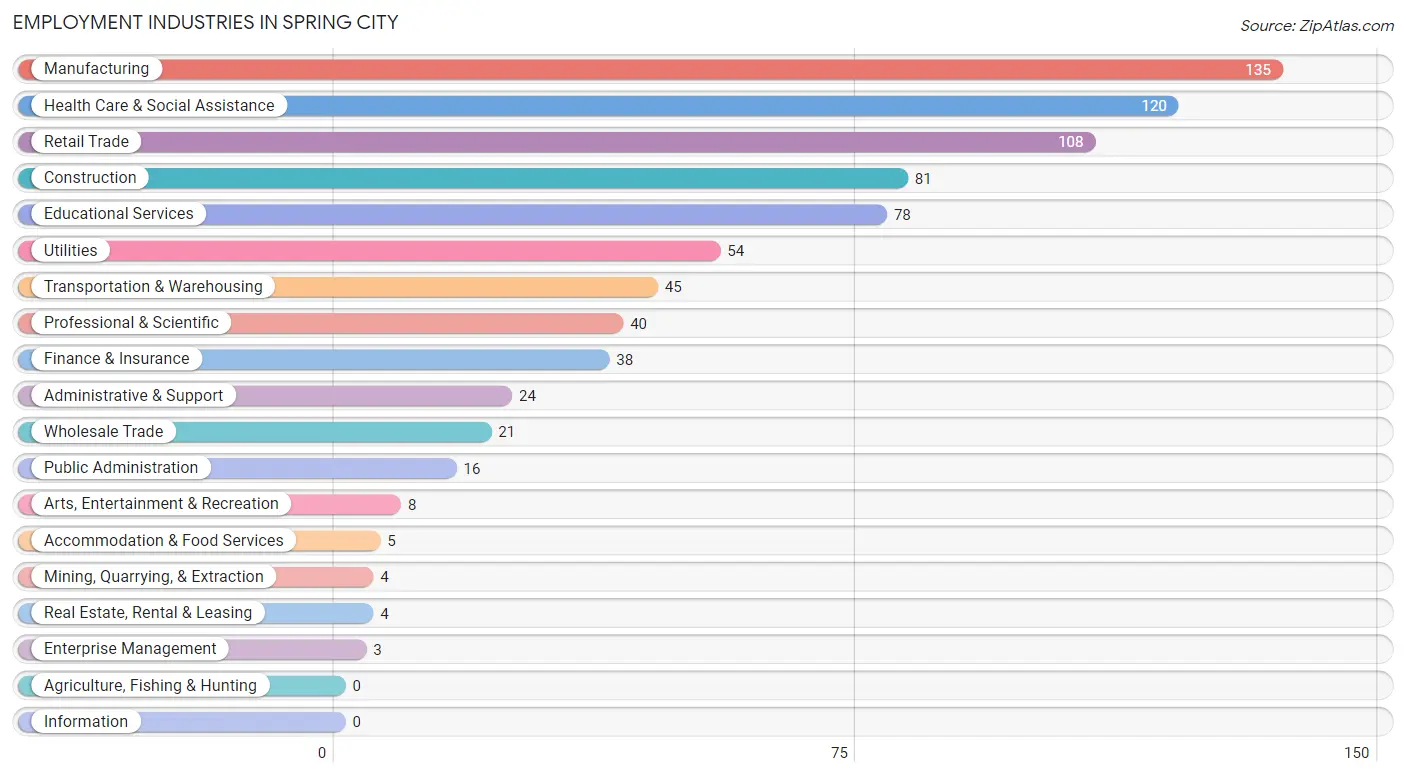
Employment Industries in Spring City
The major employment industries in Spring City include Manufacturing (135 | 17.1%), Health Care & Social Assistance (120 | 15.1%), Retail Trade (108 | 13.6%), Construction (81 | 10.2%), and Educational Services (78 | 9.9%).
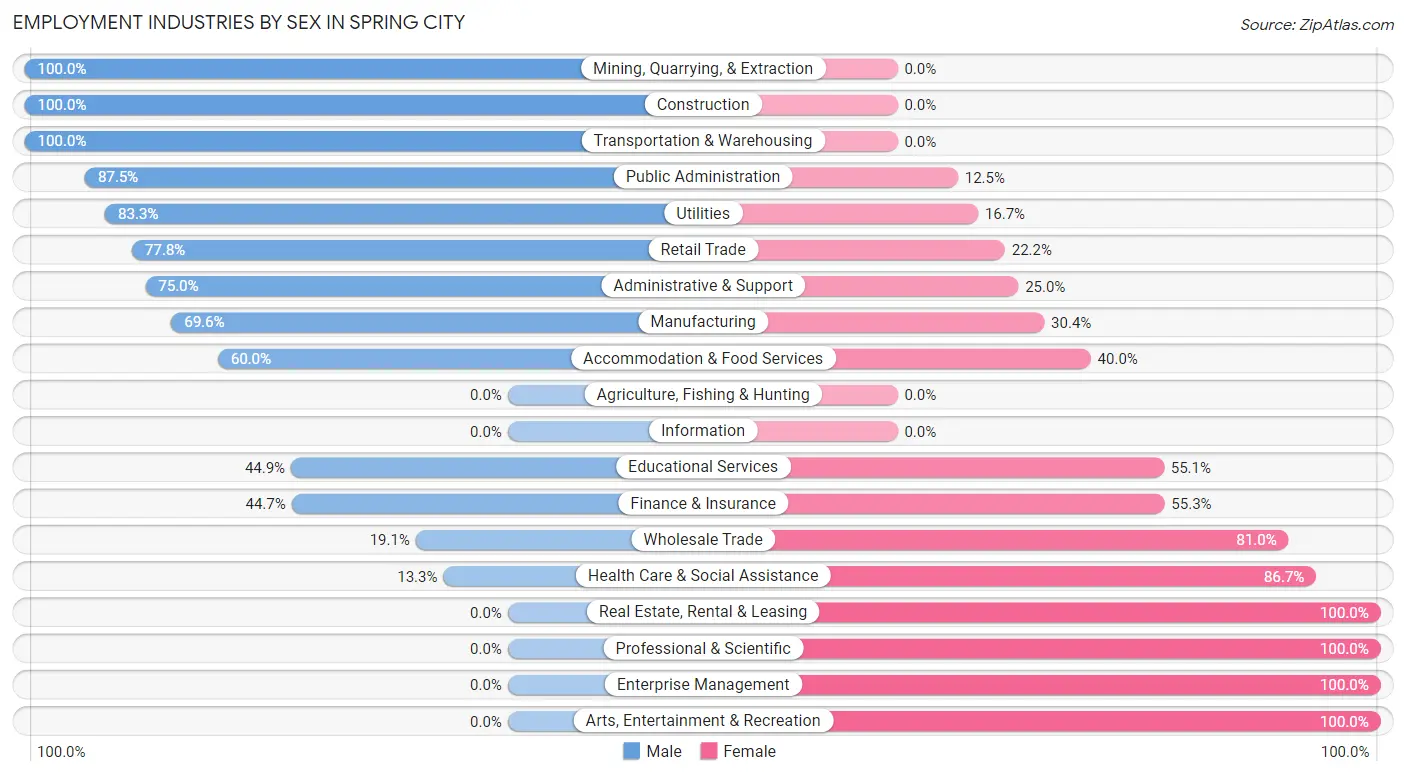
Employment Industries by Sex in Spring City
The Spring City industries that see more men than women are Mining, Quarrying, & Extraction (100.0%), Construction (100.0%), and Transportation & Warehousing (100.0%), whereas the industries that tend to have a higher number of women are Real Estate, Rental & Leasing (100.0%), Professional & Scientific (100.0%), and Enterprise Management (100.0%).
| Industry | Male | Female |
| Agriculture, Fishing & Hunting | 0 (0.0%) | 0 (0.0%) |
| Mining, Quarrying, & Extraction | 4 (100.0%) | 0 (0.0%) |
| Construction | 81 (100.0%) | 0 (0.0%) |
| Manufacturing | 94 (69.6%) | 41 (30.4%) |
| Wholesale Trade | 4 (19.1%) | 17 (80.9%) |
| Retail Trade | 84 (77.8%) | 24 (22.2%) |
| Transportation & Warehousing | 45 (100.0%) | 0 (0.0%) |
| Utilities | 45 (83.3%) | 9 (16.7%) |
| Information | 0 (0.0%) | 0 (0.0%) |
| Finance & Insurance | 17 (44.7%) | 21 (55.3%) |
| Real Estate, Rental & Leasing | 0 (0.0%) | 4 (100.0%) |
| Professional & Scientific | 0 (0.0%) | 40 (100.0%) |
| Enterprise Management | 0 (0.0%) | 3 (100.0%) |
| Administrative & Support | 18 (75.0%) | 6 (25.0%) |
| Educational Services | 35 (44.9%) | 43 (55.1%) |
| Health Care & Social Assistance | 16 (13.3%) | 104 (86.7%) |
| Arts, Entertainment & Recreation | 0 (0.0%) | 8 (100.0%) |
| Accommodation & Food Services | 3 (60.0%) | 2 (40.0%) |
| Public Administration | 14 (87.5%) | 2 (12.5%) |
| Total | 460 (58.1%) | 332 (41.9%) |
Education in Spring City
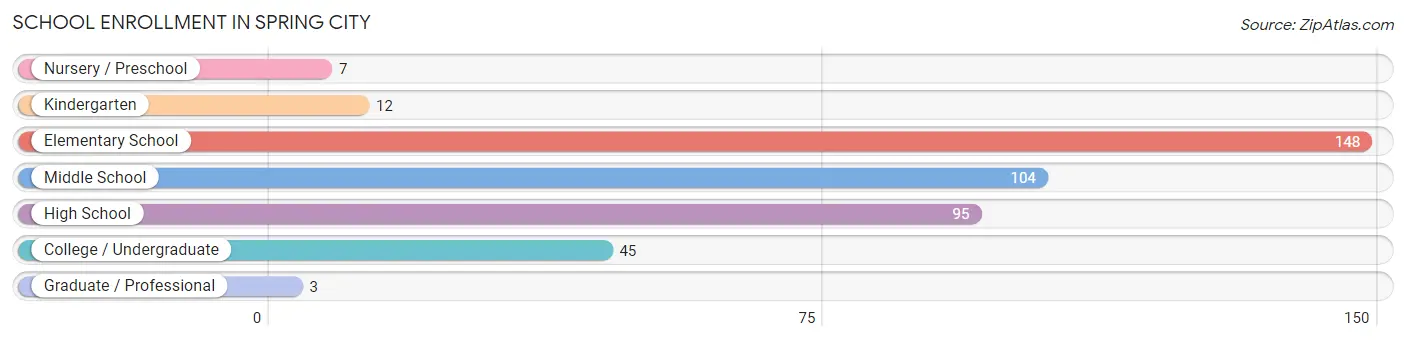
School Enrollment in Spring City
The most common levels of schooling among the 414 students in Spring City are elementary school (148 | 35.7%), middle school (104 | 25.1%), and high school (95 | 23.0%).
| School Level | # Students | % Students |
| Nursery / Preschool | 7 | 1.7% |
| Kindergarten | 12 | 2.9% |
| Elementary School | 148 | 35.7% |
| Middle School | 104 | 25.1% |
| High School | 95 | 23.0% |
| College / Undergraduate | 45 | 10.9% |
| Graduate / Professional | 3 | 0.7% |
| Total | 414 | 100.0% |
School Enrollment by Age by Funding Source in Spring City
Out of a total of 414 students who are enrolled in schools in Spring City, 114 (27.5%) attend a private institution, while the remaining 300 (72.5%) are enrolled in public schools. The age group of 25 to 34 year olds has the highest likelihood of being enrolled in private schools, with 6 (66.7% in the age bracket) enrolled. Conversely, the age group of 3 to 4 year olds has the lowest likelihood of being enrolled in a private school, with 7 (100.0% in the age bracket) attending a public institution.
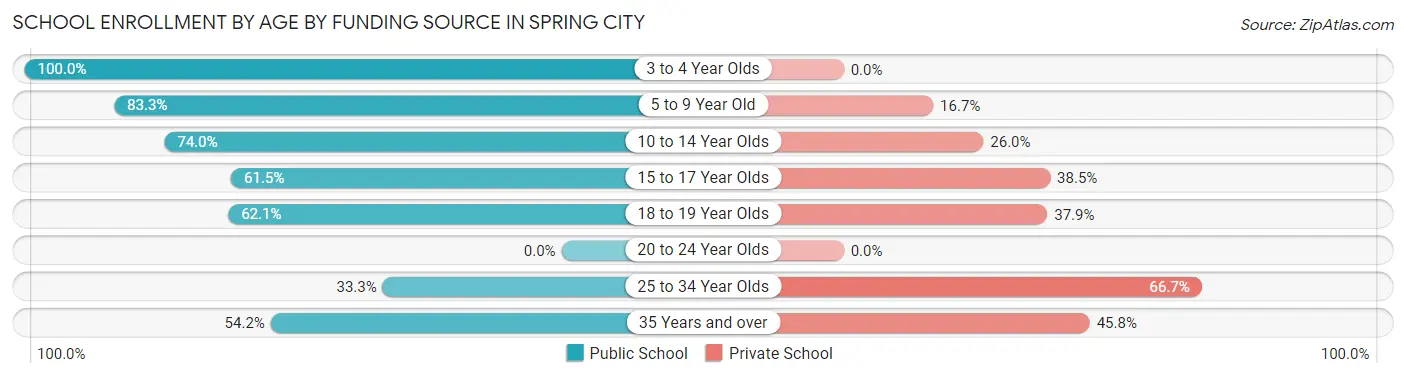
| Age Bracket | Public School | Private School |
| 3 to 4 Year Olds | 7 (100.0%) | 0 (0.0%) |
| 5 to 9 Year Old | 120 (83.3%) | 24 (16.7%) |
| 10 to 14 Year Olds | 91 (74.0%) | 32 (26.0%) |
| 15 to 17 Year Olds | 48 (61.5%) | 30 (38.5%) |
| 18 to 19 Year Olds | 18 (62.1%) | 11 (37.9%) |
| 20 to 24 Year Olds | 0 (0.0%) | 0 (0.0%) |
| 25 to 34 Year Olds | 3 (33.3%) | 6 (66.7%) |
| 35 Years and over | 13 (54.2%) | 11 (45.8%) |
| Total | 300 (72.5%) | 114 (27.5%) |
Educational Attainment by Field of Study in Spring City
Business (72 | 30.5%), education (53 | 22.5%), science & technology (33 | 14.0%), social sciences (18 | 7.6%), and liberal arts & history (18 | 7.6%) are the most common fields of study among 236 individuals in Spring City who have obtained a bachelor's degree or higher.
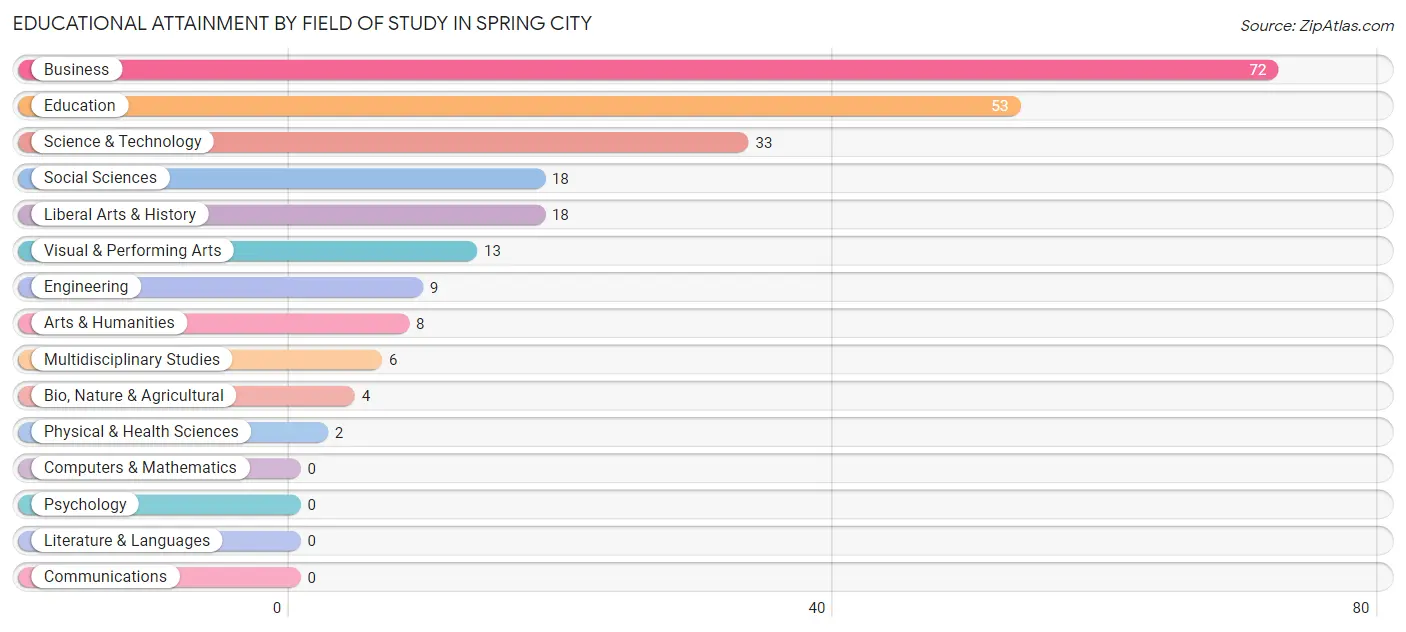
| Field of Study | # Graduates | % Graduates |
| Computers & Mathematics | 0 | 0.0% |
| Bio, Nature & Agricultural | 4 | 1.7% |
| Physical & Health Sciences | 2 | 0.9% |
| Psychology | 0 | 0.0% |
| Social Sciences | 18 | 7.6% |
| Engineering | 9 | 3.8% |
| Multidisciplinary Studies | 6 | 2.5% |
| Science & Technology | 33 | 14.0% |
| Business | 72 | 30.5% |
| Education | 53 | 22.5% |
| Literature & Languages | 0 | 0.0% |
| Liberal Arts & History | 18 | 7.6% |
| Visual & Performing Arts | 13 | 5.5% |
| Communications | 0 | 0.0% |
| Arts & Humanities | 8 | 3.4% |
| Total | 236 | 100.0% |
Transportation & Commute in Spring City
Vehicle Availability by Sex in Spring City
The most prevalent vehicle ownership categories in Spring City are males with 3 vehicles (136, accounting for 32.9%) and females with 3 vehicles (60, making up 42.2%).
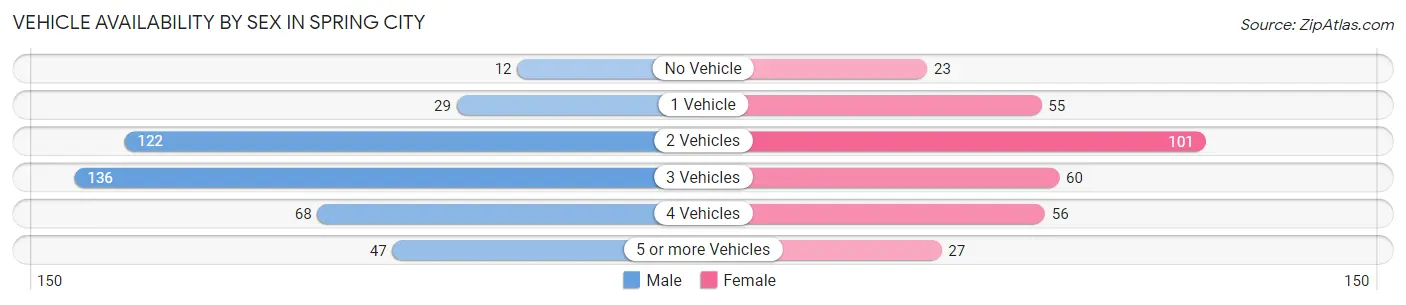
| Vehicles Available | Male | Female |
| No Vehicle | 12 (2.9%) | 23 (7.1%) |
| 1 Vehicle | 29 (7.0%) | 55 (17.1%) |
| 2 Vehicles | 122 (29.5%) | 101 (31.4%) |
| 3 Vehicles | 136 (32.9%) | 60 (18.6%) |
| 4 Vehicles | 68 (16.4%) | 56 (17.4%) |
| 5 or more Vehicles | 47 (11.4%) | 27 (8.4%) |
| Total | 414 (100.0%) | 322 (100.0%) |
Commute Time in Spring City
The most frequently occuring commute durations in Spring City are 20 to 24 minutes (108 commuters, 15.6%), 25 to 29 minutes (89 commuters, 12.9%), and 5 to 9 minutes (88 commuters, 12.7%).
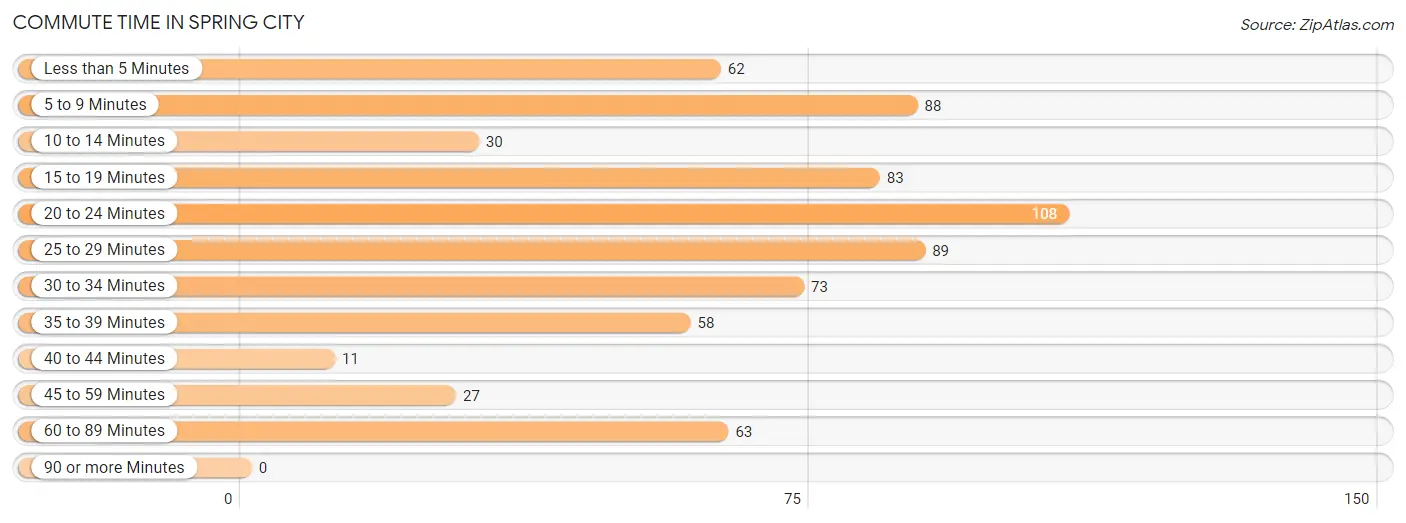
| Commute Time | # Commuters | % Commuters |
| Less than 5 Minutes | 62 | 9.0% |
| 5 to 9 Minutes | 88 | 12.7% |
| 10 to 14 Minutes | 30 | 4.3% |
| 15 to 19 Minutes | 83 | 12.0% |
| 20 to 24 Minutes | 108 | 15.6% |
| 25 to 29 Minutes | 89 | 12.9% |
| 30 to 34 Minutes | 73 | 10.5% |
| 35 to 39 Minutes | 58 | 8.4% |
| 40 to 44 Minutes | 11 | 1.6% |
| 45 to 59 Minutes | 27 | 3.9% |
| 60 to 89 Minutes | 63 | 9.1% |
| 90 or more Minutes | 0 | 0.0% |
Commute Time by Sex in Spring City
The most common commute times in Spring City are 20 to 24 minutes (81 commuters, 20.3%) for males and 15 to 19 minutes (55 commuters, 18.8%) for females.
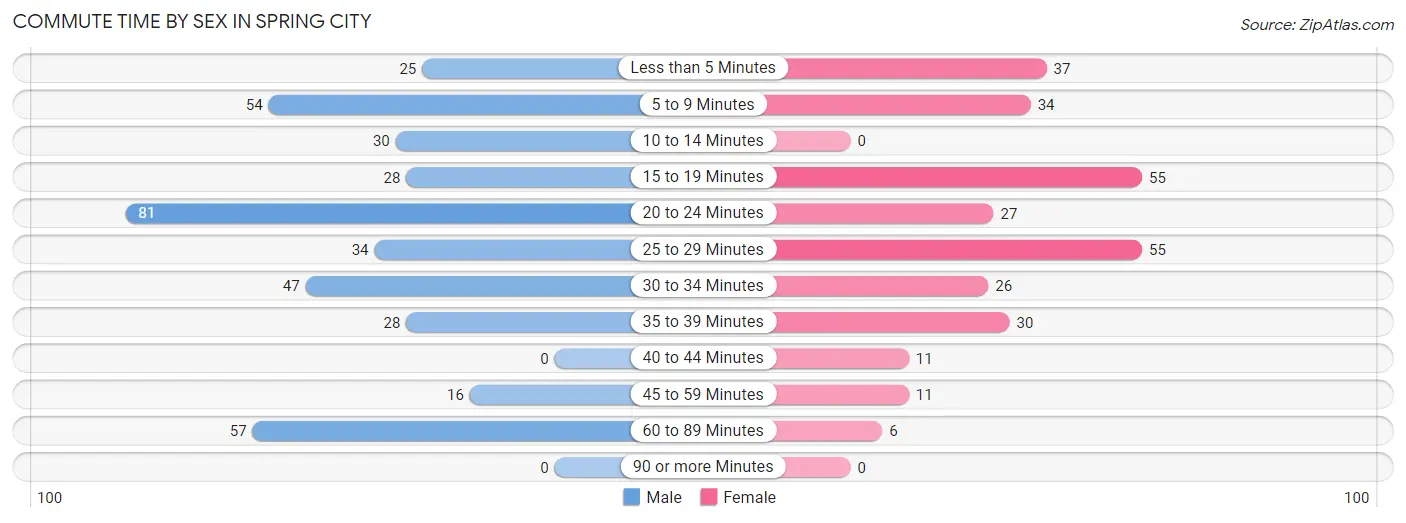
| Commute Time | Male | Female |
| Less than 5 Minutes | 25 (6.2%) | 37 (12.7%) |
| 5 to 9 Minutes | 54 (13.5%) | 34 (11.6%) |
| 10 to 14 Minutes | 30 (7.5%) | 0 (0.0%) |
| 15 to 19 Minutes | 28 (7.0%) | 55 (18.8%) |
| 20 to 24 Minutes | 81 (20.3%) | 27 (9.2%) |
| 25 to 29 Minutes | 34 (8.5%) | 55 (18.8%) |
| 30 to 34 Minutes | 47 (11.7%) | 26 (8.9%) |
| 35 to 39 Minutes | 28 (7.0%) | 30 (10.3%) |
| 40 to 44 Minutes | 0 (0.0%) | 11 (3.8%) |
| 45 to 59 Minutes | 16 (4.0%) | 11 (3.8%) |
| 60 to 89 Minutes | 57 (14.2%) | 6 (2.1%) |
| 90 or more Minutes | 0 (0.0%) | 0 (0.0%) |
Time of Departure to Work by Sex in Spring City
The most frequent times of departure to work in Spring City are 4:00 PM to 11:59 PM (79, 19.8%) for males and 7:00 AM to 7:29 AM (69, 23.6%) for females.
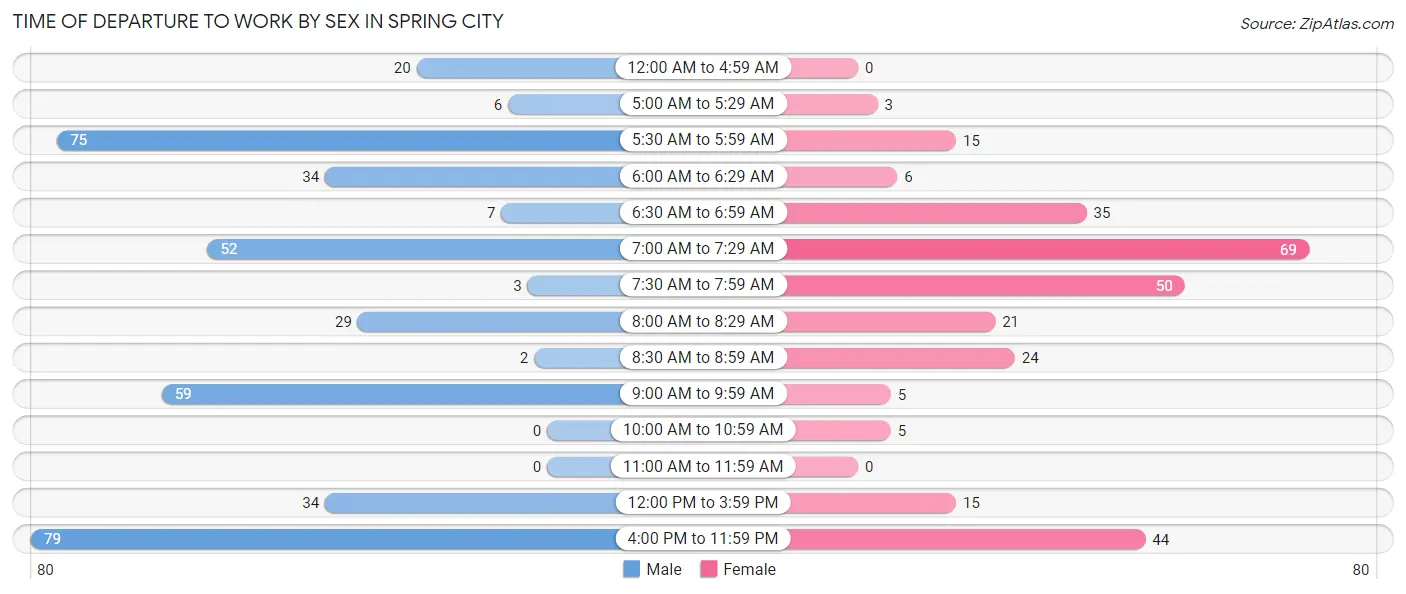
| Time of Departure | Male | Female |
| 12:00 AM to 4:59 AM | 20 (5.0%) | 0 (0.0%) |
| 5:00 AM to 5:29 AM | 6 (1.5%) | 3 (1.0%) |
| 5:30 AM to 5:59 AM | 75 (18.8%) | 15 (5.1%) |
| 6:00 AM to 6:29 AM | 34 (8.5%) | 6 (2.1%) |
| 6:30 AM to 6:59 AM | 7 (1.8%) | 35 (12.0%) |
| 7:00 AM to 7:29 AM | 52 (13.0%) | 69 (23.6%) |
| 7:30 AM to 7:59 AM | 3 (0.7%) | 50 (17.1%) |
| 8:00 AM to 8:29 AM | 29 (7.2%) | 21 (7.2%) |
| 8:30 AM to 8:59 AM | 2 (0.5%) | 24 (8.2%) |
| 9:00 AM to 9:59 AM | 59 (14.7%) | 5 (1.7%) |
| 10:00 AM to 10:59 AM | 0 (0.0%) | 5 (1.7%) |
| 11:00 AM to 11:59 AM | 0 (0.0%) | 0 (0.0%) |
| 12:00 PM to 3:59 PM | 34 (8.5%) | 15 (5.1%) |
| 4:00 PM to 11:59 PM | 79 (19.8%) | 44 (15.1%) |
| Total | 400 (100.0%) | 292 (100.0%) |
Housing Occupancy in Spring City
Occupancy by Ownership in Spring City
Of the total 1,012 dwellings in Spring City, owner-occupied units account for 689 (68.1%), while renter-occupied units make up 323 (31.9%).
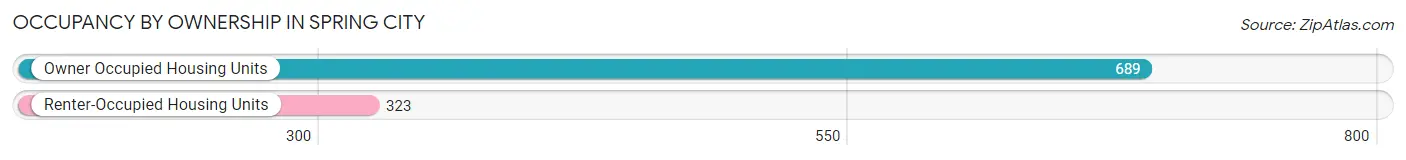
| Occupancy | # Housing Units | % Housing Units |
| Owner Occupied Housing Units | 689 | 68.1% |
| Renter-Occupied Housing Units | 323 | 31.9% |
| Total Occupied Housing Units | 1,012 | 100.0% |
Occupancy by Household Size in Spring City
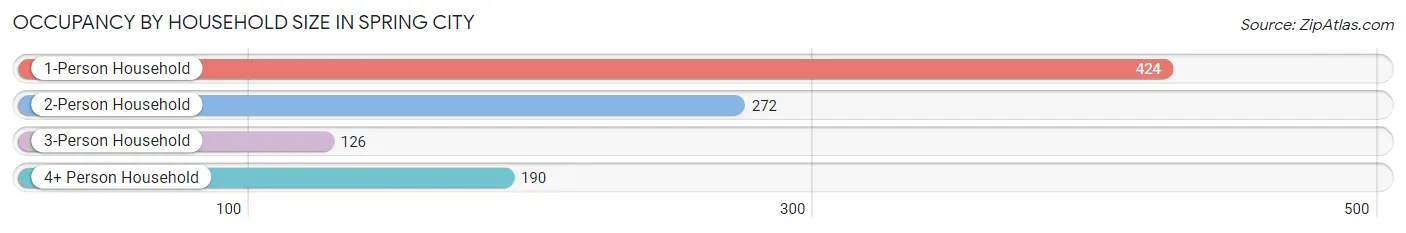
| Household Size | # Housing Units | % Housing Units |
| 1-Person Household | 424 | 41.9% |
| 2-Person Household | 272 | 26.9% |
| 3-Person Household | 126 | 12.4% |
| 4+ Person Household | 190 | 18.8% |
| Total Housing Units | 1,012 | 100.0% |
Occupancy by Ownership by Household Size in Spring City
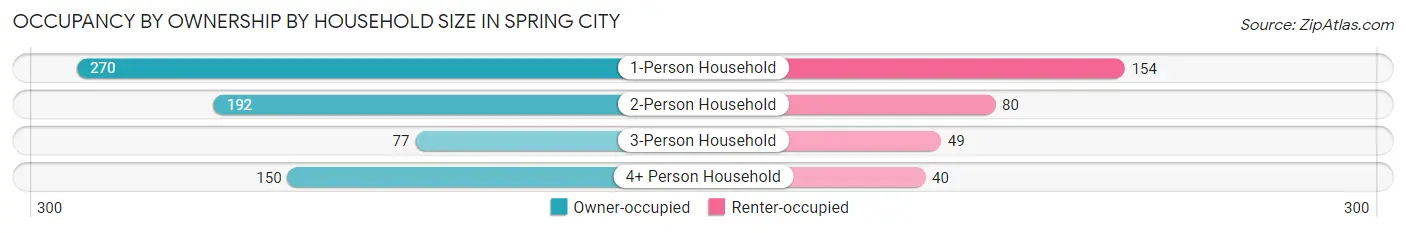
| Household Size | Owner-occupied | Renter-occupied |
| 1-Person Household | 270 (63.7%) | 154 (36.3%) |
| 2-Person Household | 192 (70.6%) | 80 (29.4%) |
| 3-Person Household | 77 (61.1%) | 49 (38.9%) |
| 4+ Person Household | 150 (78.9%) | 40 (21.0%) |
| Total Housing Units | 689 (68.1%) | 323 (31.9%) |
Occupancy by Educational Attainment in Spring City
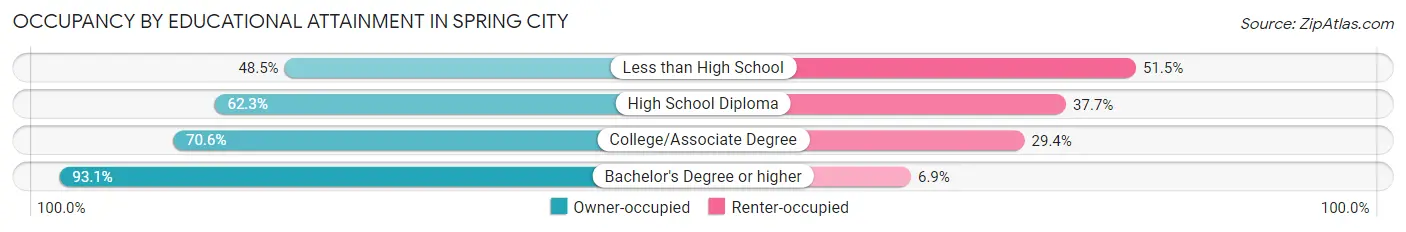
| Household Size | Owner-occupied | Renter-occupied |
| Less than High School | 80 (48.5%) | 85 (51.5%) |
| High School Diploma | 235 (62.3%) | 142 (37.7%) |
| College/Associate Degree | 199 (70.6%) | 83 (29.4%) |
| Bachelor's Degree or higher | 175 (93.1%) | 13 (6.9%) |
Occupancy by Age of Householder in Spring City
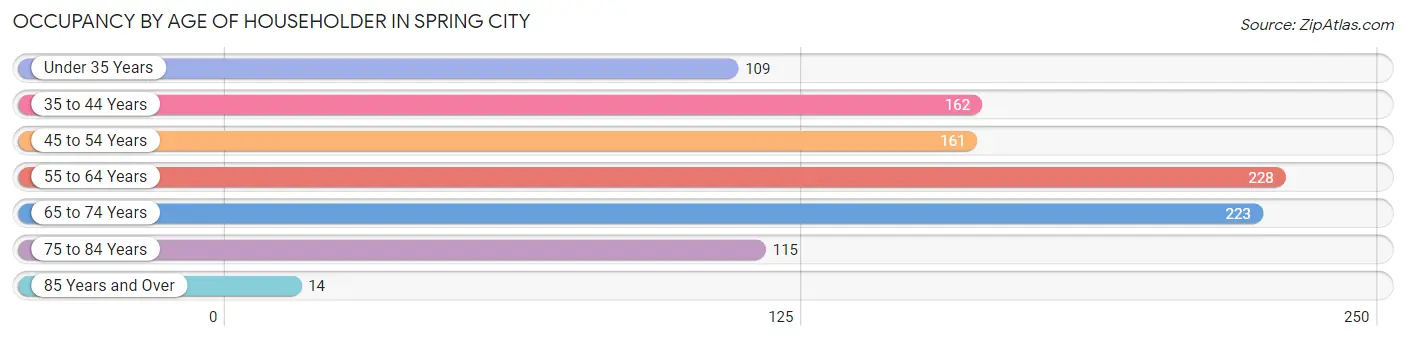
| Age Bracket | # Households | % Households |
| Under 35 Years | 109 | 10.8% |
| 35 to 44 Years | 162 | 16.0% |
| 45 to 54 Years | 161 | 15.9% |
| 55 to 64 Years | 228 | 22.5% |
| 65 to 74 Years | 223 | 22.0% |
| 75 to 84 Years | 115 | 11.4% |
| 85 Years and Over | 14 | 1.4% |
| Total | 1,012 | 100.0% |
Housing Finances in Spring City
Median Income by Occupancy in Spring City
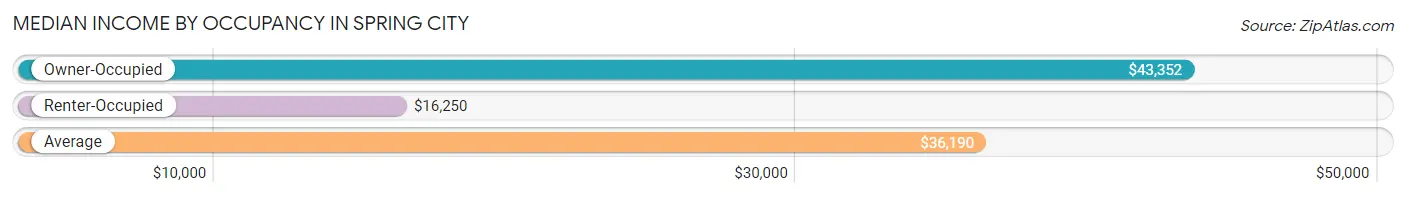
| Occupancy Type | # Households | Median Income |
| Owner-Occupied | 689 (68.1%) | $43,352 |
| Renter-Occupied | 323 (31.9%) | $16,250 |
| Average | 1,012 (100.0%) | $36,190 |
Occupancy by Householder Income Bracket in Spring City
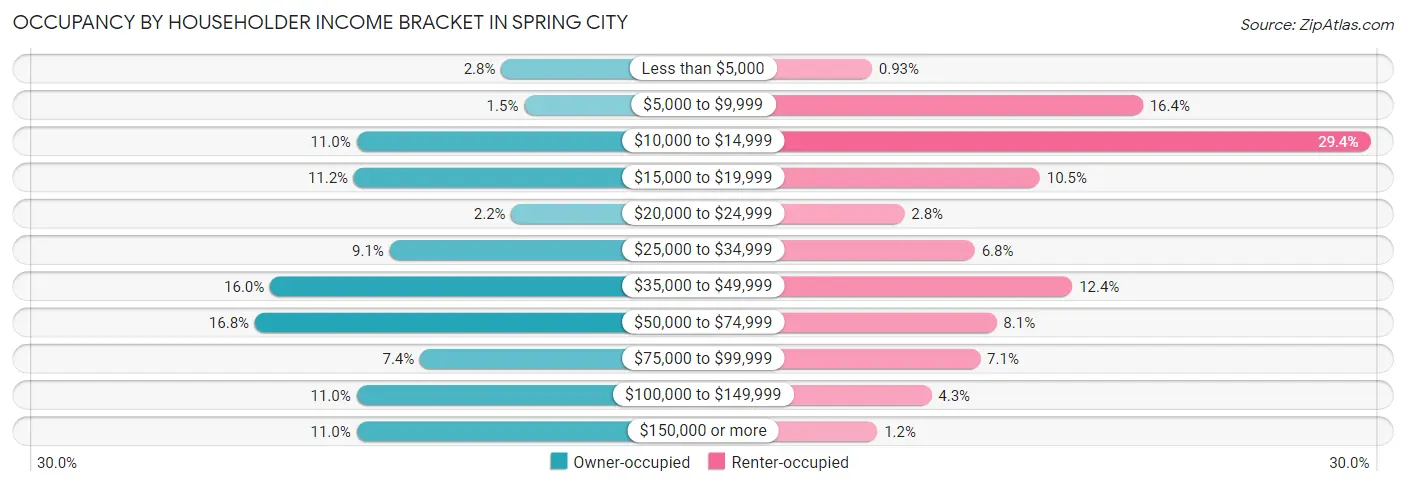
| Income Bracket | Owner-occupied | Renter-occupied |
| Less than $5,000 | 19 (2.8%) | 3 (0.9%) |
| $5,000 to $9,999 | 10 (1.5%) | 53 (16.4%) |
| $10,000 to $14,999 | 76 (11.0%) | 95 (29.4%) |
| $15,000 to $19,999 | 77 (11.2%) | 34 (10.5%) |
| $20,000 to $24,999 | 15 (2.2%) | 9 (2.8%) |
| $25,000 to $34,999 | 63 (9.1%) | 22 (6.8%) |
| $35,000 to $49,999 | 110 (16.0%) | 40 (12.4%) |
| $50,000 to $74,999 | 116 (16.8%) | 26 (8.1%) |
| $75,000 to $99,999 | 51 (7.4%) | 23 (7.1%) |
| $100,000 to $149,999 | 76 (11.0%) | 14 (4.3%) |
| $150,000 or more | 76 (11.0%) | 4 (1.2%) |
| Total | 689 (100.0%) | 323 (100.0%) |
Monthly Housing Cost Tiers in Spring City
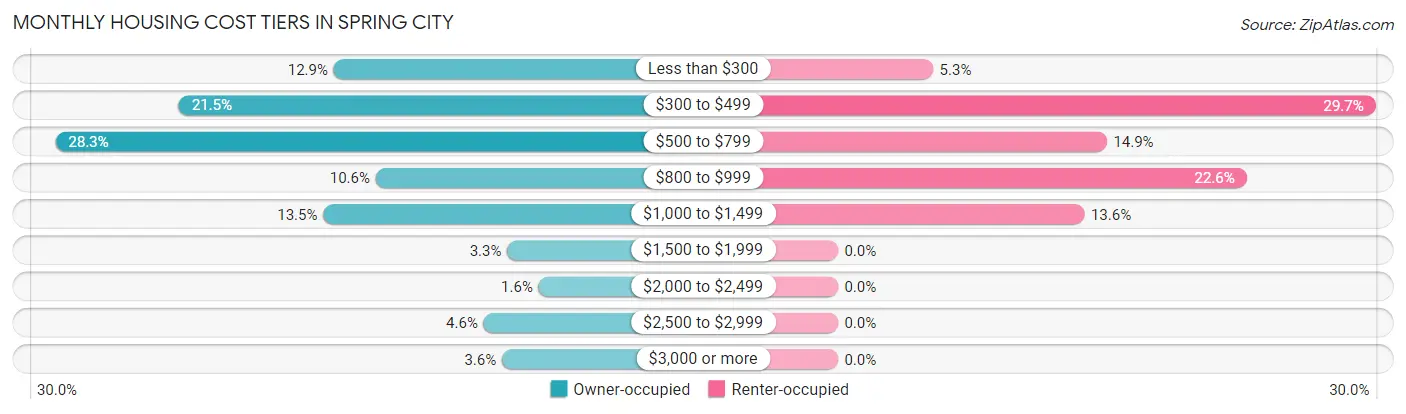
| Monthly Cost | Owner-occupied | Renter-occupied |
| Less than $300 | 89 (12.9%) | 17 (5.3%) |
| $300 to $499 | 148 (21.5%) | 96 (29.7%) |
| $500 to $799 | 195 (28.3%) | 48 (14.9%) |
| $800 to $999 | 73 (10.6%) | 73 (22.6%) |
| $1,000 to $1,499 | 93 (13.5%) | 44 (13.6%) |
| $1,500 to $1,999 | 23 (3.3%) | 0 (0.0%) |
| $2,000 to $2,499 | 11 (1.6%) | 0 (0.0%) |
| $2,500 to $2,999 | 32 (4.6%) | 0 (0.0%) |
| $3,000 or more | 25 (3.6%) | 0 (0.0%) |
| Total | 689 (100.0%) | 323 (100.0%) |
Physical Housing Characteristics in Spring City
Housing Structures in Spring City
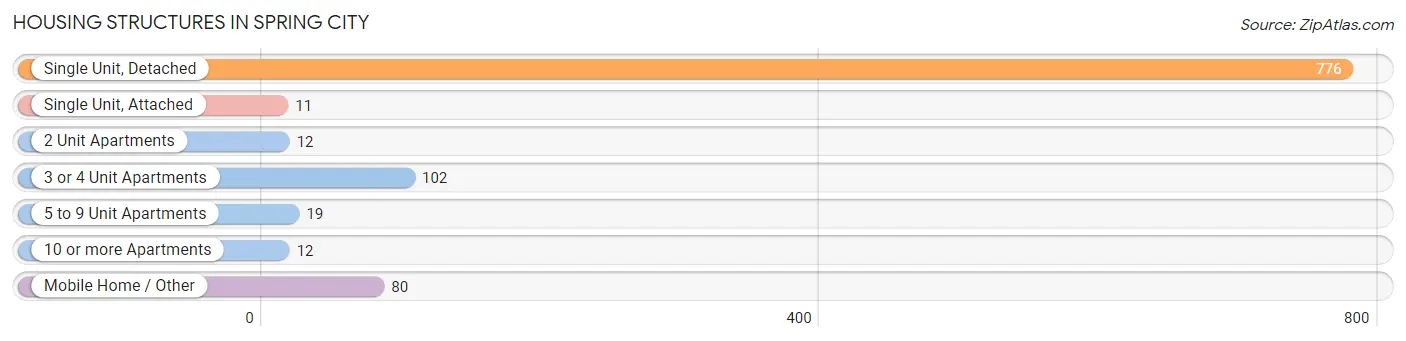
| Structure Type | # Housing Units | % Housing Units |
| Single Unit, Detached | 776 | 76.7% |
| Single Unit, Attached | 11 | 1.1% |
| 2 Unit Apartments | 12 | 1.2% |
| 3 or 4 Unit Apartments | 102 | 10.1% |
| 5 to 9 Unit Apartments | 19 | 1.9% |
| 10 or more Apartments | 12 | 1.2% |
| Mobile Home / Other | 80 | 7.9% |
| Total | 1,012 | 100.0% |
Housing Structures by Occupancy in Spring City
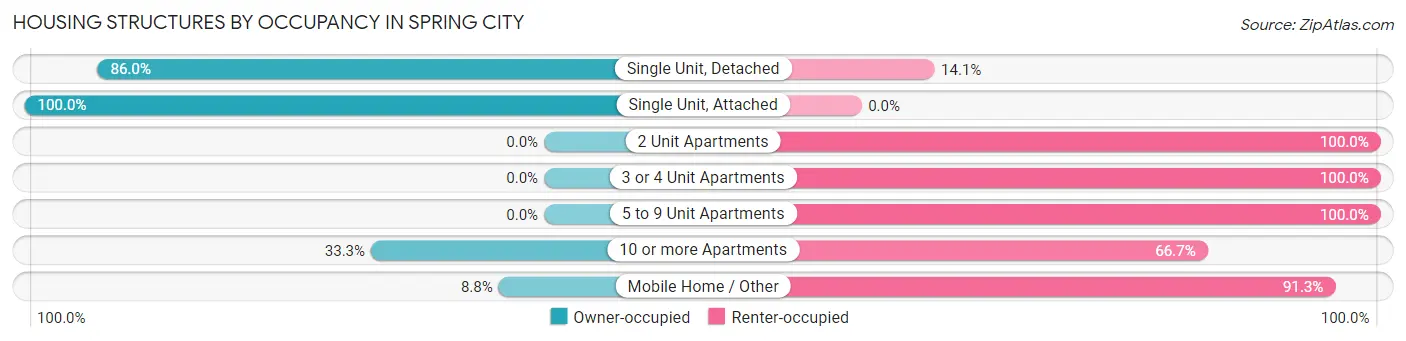
| Structure Type | Owner-occupied | Renter-occupied |
| Single Unit, Detached | 667 (86.0%) | 109 (14.1%) |
| Single Unit, Attached | 11 (100.0%) | 0 (0.0%) |
| 2 Unit Apartments | 0 (0.0%) | 12 (100.0%) |
| 3 or 4 Unit Apartments | 0 (0.0%) | 102 (100.0%) |
| 5 to 9 Unit Apartments | 0 (0.0%) | 19 (100.0%) |
| 10 or more Apartments | 4 (33.3%) | 8 (66.7%) |
| Mobile Home / Other | 7 (8.7%) | 73 (91.2%) |
| Total | 689 (68.1%) | 323 (31.9%) |
Housing Structures by Number of Rooms in Spring City
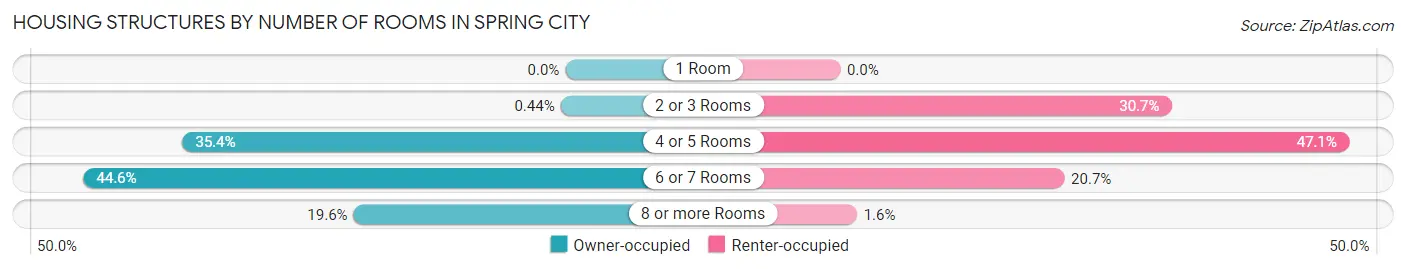
| Number of Rooms | Owner-occupied | Renter-occupied |
| 1 Room | 0 (0.0%) | 0 (0.0%) |
| 2 or 3 Rooms | 3 (0.4%) | 99 (30.6%) |
| 4 or 5 Rooms | 244 (35.4%) | 152 (47.1%) |
| 6 or 7 Rooms | 307 (44.6%) | 67 (20.7%) |
| 8 or more Rooms | 135 (19.6%) | 5 (1.5%) |
| Total | 689 (100.0%) | 323 (100.0%) |
Housing Structure by Heating Type in Spring City
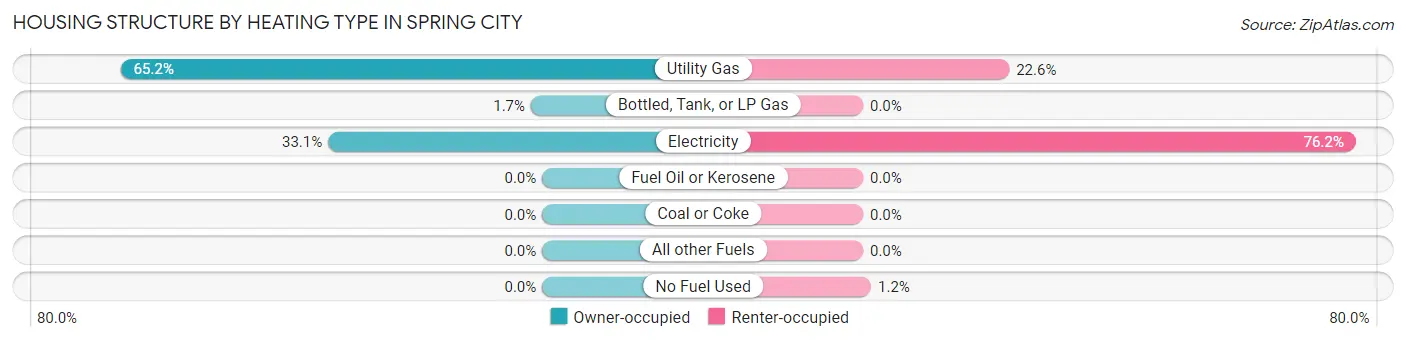
| Heating Type | Owner-occupied | Renter-occupied |
| Utility Gas | 449 (65.2%) | 73 (22.6%) |
| Bottled, Tank, or LP Gas | 12 (1.7%) | 0 (0.0%) |
| Electricity | 228 (33.1%) | 246 (76.2%) |
| Fuel Oil or Kerosene | 0 (0.0%) | 0 (0.0%) |
| Coal or Coke | 0 (0.0%) | 0 (0.0%) |
| All other Fuels | 0 (0.0%) | 0 (0.0%) |
| No Fuel Used | 0 (0.0%) | 4 (1.2%) |
| Total | 689 (100.0%) | 323 (100.0%) |
Household Vehicle Usage in Spring City
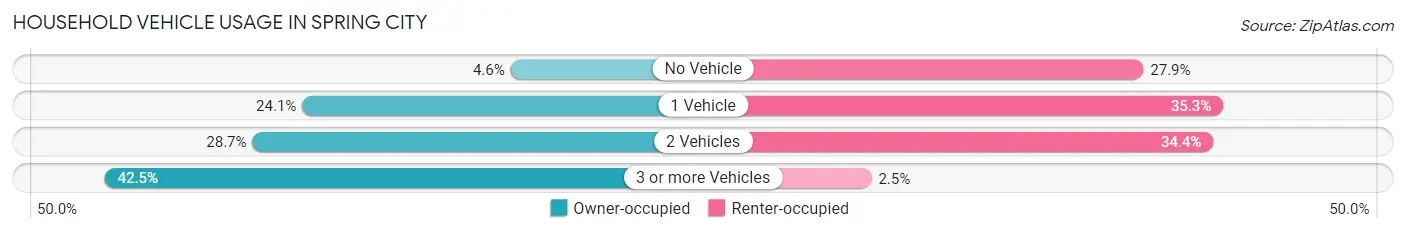
| Vehicles per Household | Owner-occupied | Renter-occupied |
| No Vehicle | 32 (4.6%) | 90 (27.9%) |
| 1 Vehicle | 166 (24.1%) | 114 (35.3%) |
| 2 Vehicles | 198 (28.7%) | 111 (34.4%) |
| 3 or more Vehicles | 293 (42.5%) | 8 (2.5%) |
| Total | 689 (100.0%) | 323 (100.0%) |
Real Estate & Mortgages in Spring City
Real Estate and Mortgage Overview in Spring City
| Characteristic | Without Mortgage | With Mortgage |
| Housing Units | 335 | 354 |
| Median Property Value | $117,600 | $170,600 |
| Median Household Income | $35,684 | $53 |
| Monthly Housing Costs | $412 | $25 |
| Real Estate Taxes | $1,052 | $0 |
Property Value by Mortgage Status in Spring City
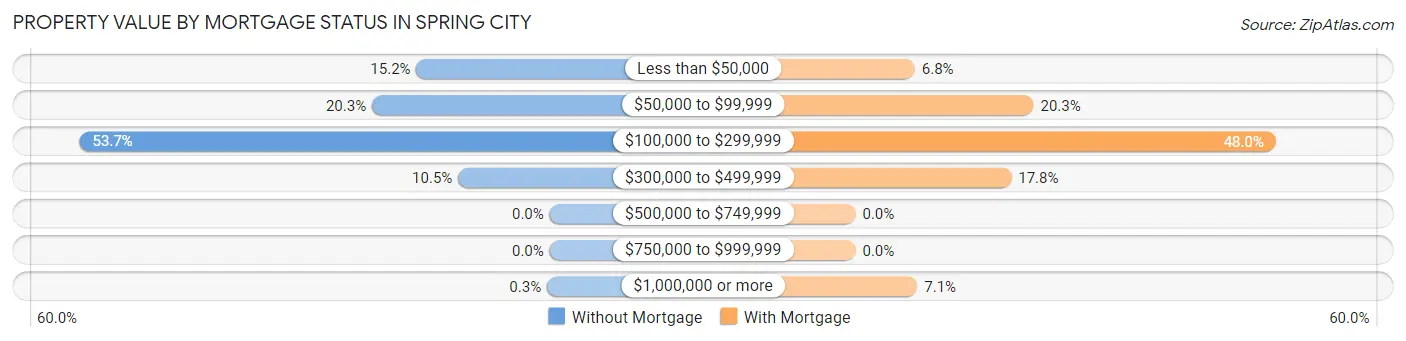
| Property Value | Without Mortgage | With Mortgage |
| Less than $50,000 | 51 (15.2%) | 24 (6.8%) |
| $50,000 to $99,999 | 68 (20.3%) | 72 (20.3%) |
| $100,000 to $299,999 | 180 (53.7%) | 170 (48.0%) |
| $300,000 to $499,999 | 35 (10.4%) | 63 (17.8%) |
| $500,000 to $749,999 | 0 (0.0%) | 0 (0.0%) |
| $750,000 to $999,999 | 0 (0.0%) | 0 (0.0%) |
| $1,000,000 or more | 1 (0.3%) | 25 (7.1%) |
| Total | 335 (100.0%) | 354 (100.0%) |
Household Income by Mortgage Status in Spring City
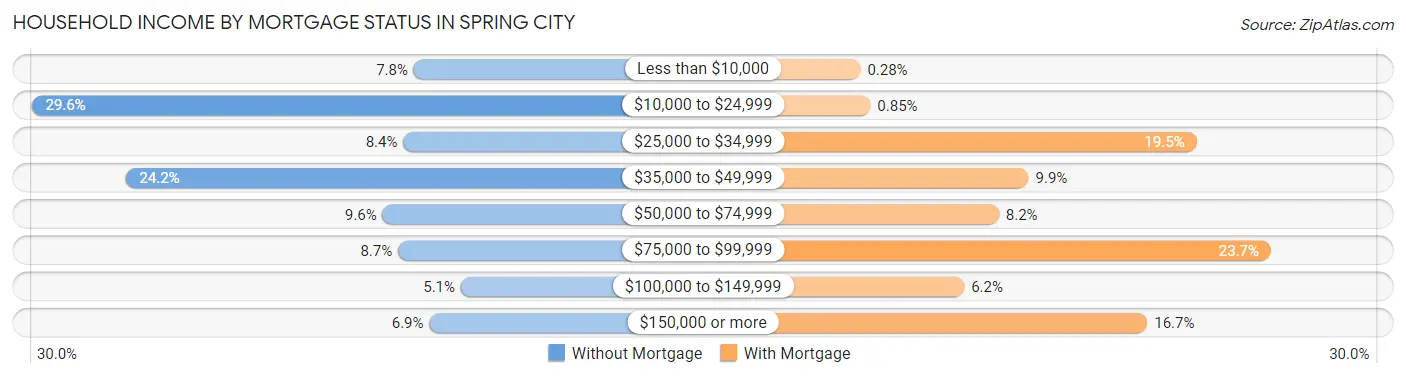
| Household Income | Without Mortgage | With Mortgage |
| Less than $10,000 | 26 (7.8%) | 1 (0.3%) |
| $10,000 to $24,999 | 99 (29.5%) | 3 (0.9%) |
| $25,000 to $34,999 | 28 (8.4%) | 69 (19.5%) |
| $35,000 to $49,999 | 81 (24.2%) | 35 (9.9%) |
| $50,000 to $74,999 | 32 (9.6%) | 29 (8.2%) |
| $75,000 to $99,999 | 29 (8.7%) | 84 (23.7%) |
| $100,000 to $149,999 | 17 (5.1%) | 22 (6.2%) |
| $150,000 or more | 23 (6.9%) | 59 (16.7%) |
| Total | 335 (100.0%) | 354 (100.0%) |
Property Value to Household Income Ratio in Spring City
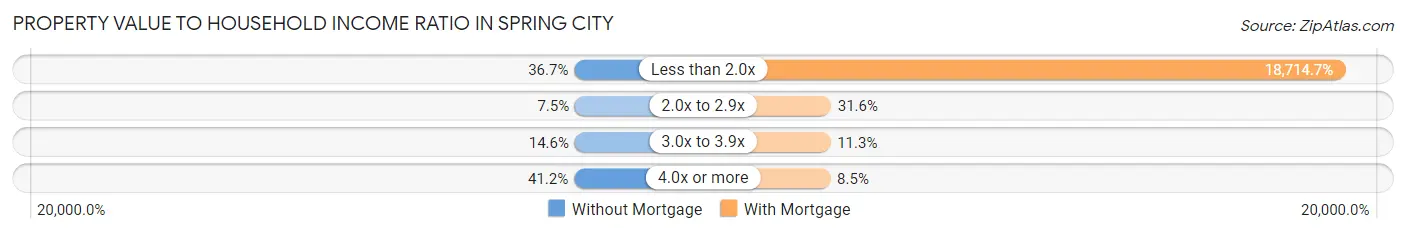
| Value-to-Income Ratio | Without Mortgage | With Mortgage |
| Less than 2.0x | 123 (36.7%) | 66,250 (18,714.7%) |
| 2.0x to 2.9x | 25 (7.5%) | 112 (31.6%) |
| 3.0x to 3.9x | 49 (14.6%) | 40 (11.3%) |
| 4.0x or more | 138 (41.2%) | 30 (8.5%) |
| Total | 335 (100.0%) | 354 (100.0%) |
Real Estate Taxes by Mortgage Status in Spring City
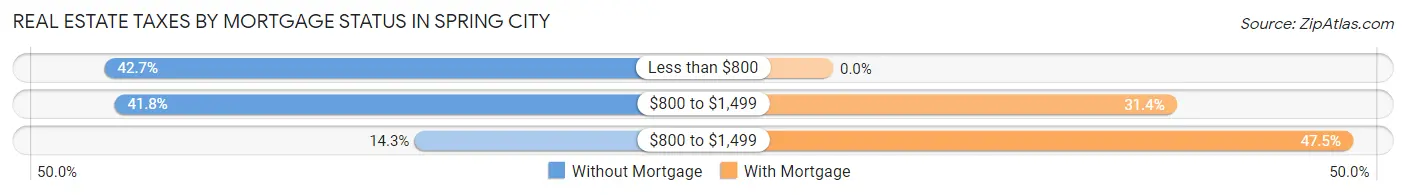
| Property Taxes | Without Mortgage | With Mortgage |
| Less than $800 | 143 (42.7%) | 0 (0.0%) |
| $800 to $1,499 | 140 (41.8%) | 111 (31.4%) |
| $800 to $1,499 | 48 (14.3%) | 168 (47.5%) |
| Total | 335 (100.0%) | 354 (100.0%) |
Health & Disability in Spring City
Health Insurance Coverage by Age in Spring City
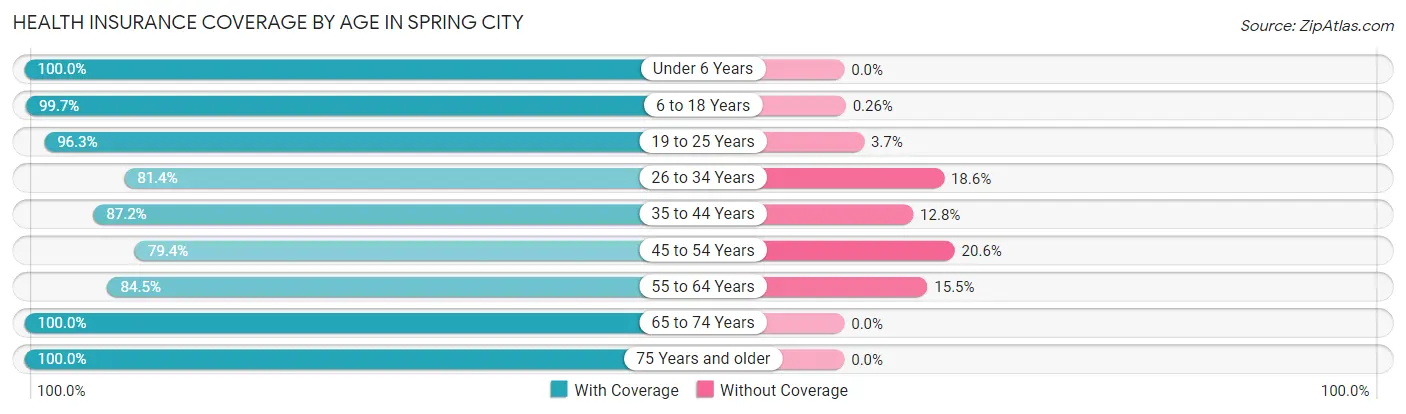
| Age Bracket | With Coverage | Without Coverage |
| Under 6 Years | 143 (100.0%) | 0 (0.0%) |
| 6 to 18 Years | 377 (99.7%) | 1 (0.3%) |
| 19 to 25 Years | 105 (96.3%) | 4 (3.7%) |
| 26 to 34 Years | 162 (81.4%) | 37 (18.6%) |
| 35 to 44 Years | 224 (87.2%) | 33 (12.8%) |
| 45 to 54 Years | 220 (79.4%) | 57 (20.6%) |
| 55 to 64 Years | 311 (84.5%) | 57 (15.5%) |
| 65 to 74 Years | 341 (100.0%) | 0 (0.0%) |
| 75 Years and older | 198 (100.0%) | 0 (0.0%) |
| Total | 2,081 (91.7%) | 189 (8.3%) |
Health Insurance Coverage by Citizenship Status in Spring City
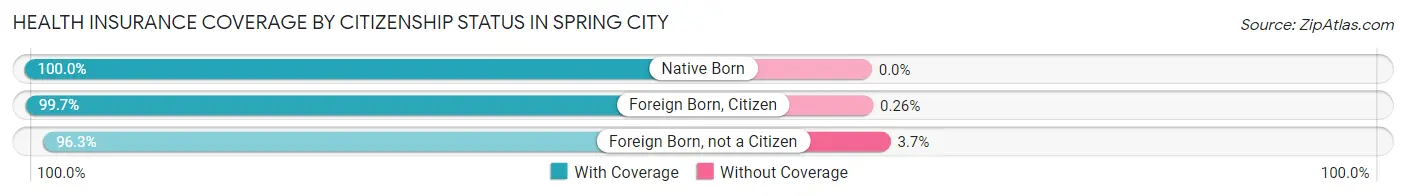
| Citizenship Status | With Coverage | Without Coverage |
| Native Born | 143 (100.0%) | 0 (0.0%) |
| Foreign Born, Citizen | 377 (99.7%) | 1 (0.3%) |
| Foreign Born, not a Citizen | 105 (96.3%) | 4 (3.7%) |
Health Insurance Coverage by Household Income in Spring City
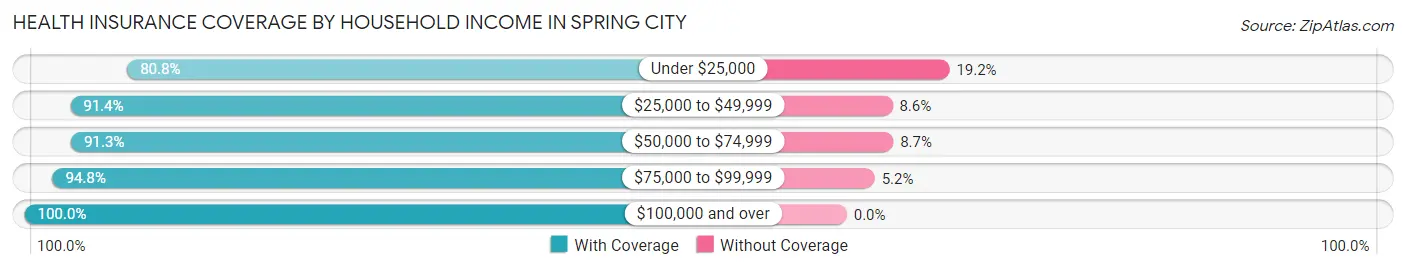
| Household Income | With Coverage | Without Coverage |
| Under $25,000 | 420 (80.8%) | 100 (19.2%) |
| $25,000 to $49,999 | 363 (91.4%) | 34 (8.6%) |
| $50,000 to $74,999 | 441 (91.3%) | 42 (8.7%) |
| $75,000 to $99,999 | 235 (94.8%) | 13 (5.2%) |
| $100,000 and over | 552 (100.0%) | 0 (0.0%) |
Public vs Private Health Insurance Coverage by Age in Spring City
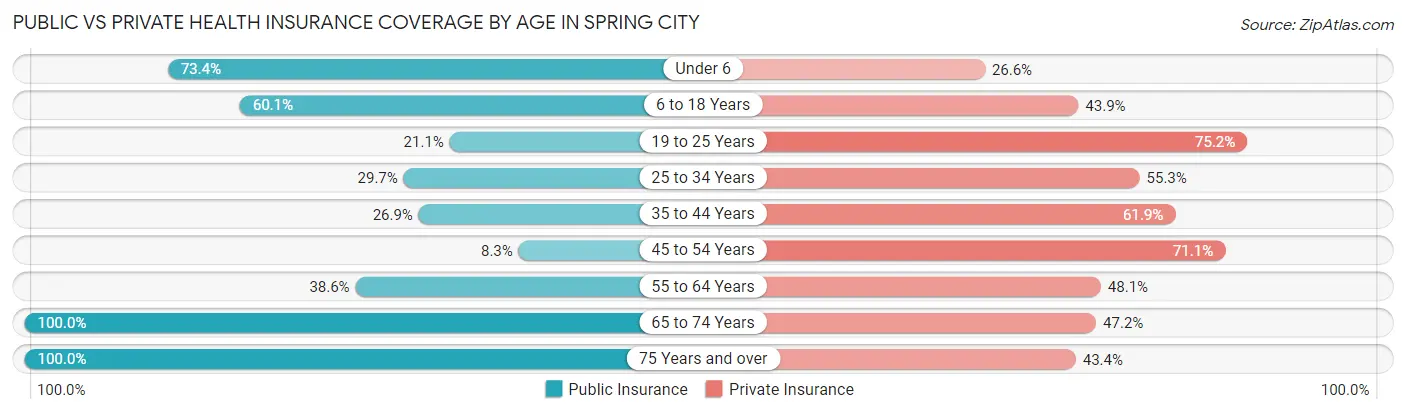
| Age Bracket | Public Insurance | Private Insurance |
| Under 6 | 105 (73.4%) | 38 (26.6%) |
| 6 to 18 Years | 227 (60.1%) | 166 (43.9%) |
| 19 to 25 Years | 23 (21.1%) | 82 (75.2%) |
| 25 to 34 Years | 59 (29.6%) | 110 (55.3%) |
| 35 to 44 Years | 69 (26.9%) | 159 (61.9%) |
| 45 to 54 Years | 23 (8.3%) | 197 (71.1%) |
| 55 to 64 Years | 142 (38.6%) | 177 (48.1%) |
| 65 to 74 Years | 341 (100.0%) | 161 (47.2%) |
| 75 Years and over | 198 (100.0%) | 86 (43.4%) |
| Total | 1,187 (52.3%) | 1,176 (51.8%) |
Disability Status by Sex by Age in Spring City
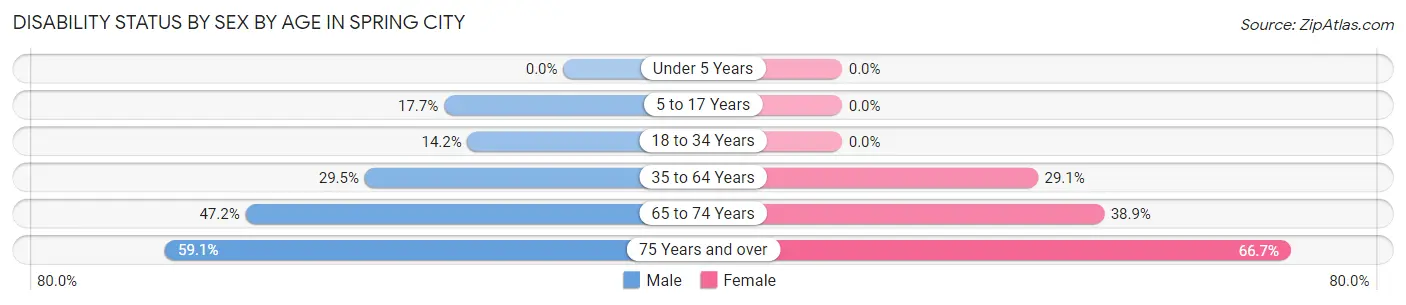
| Age Bracket | Male | Female |
| Under 5 Years | 0 (0.0%) | 0 (0.0%) |
| 5 to 17 Years | 42 (17.7%) | 0 (0.0%) |
| 18 to 34 Years | 30 (14.2%) | 0 (0.0%) |
| 35 to 64 Years | 130 (29.5%) | 134 (29.1%) |
| 65 to 74 Years | 59 (47.2%) | 84 (38.9%) |
| 75 Years and over | 55 (59.1%) | 70 (66.7%) |
Disability Class by Sex by Age in Spring City
Disability Class: Hearing Difficulty
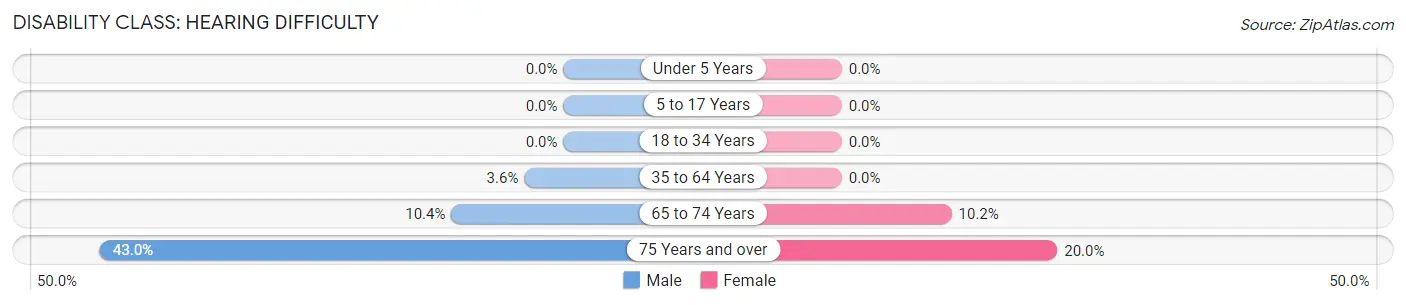
| Age Bracket | Male | Female |
| Under 5 Years | 0 (0.0%) | 0 (0.0%) |
| 5 to 17 Years | 0 (0.0%) | 0 (0.0%) |
| 18 to 34 Years | 0 (0.0%) | 0 (0.0%) |
| 35 to 64 Years | 16 (3.6%) | 0 (0.0%) |
| 65 to 74 Years | 13 (10.4%) | 22 (10.2%) |
| 75 Years and over | 40 (43.0%) | 21 (20.0%) |
Disability Class: Vision Difficulty
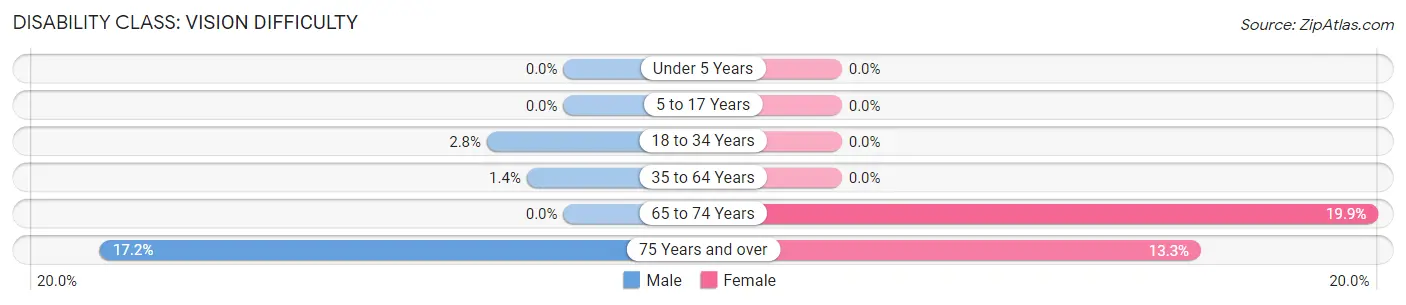
| Age Bracket | Male | Female |
| Under 5 Years | 0 (0.0%) | 0 (0.0%) |
| 5 to 17 Years | 0 (0.0%) | 0 (0.0%) |
| 18 to 34 Years | 6 (2.8%) | 0 (0.0%) |
| 35 to 64 Years | 6 (1.4%) | 0 (0.0%) |
| 65 to 74 Years | 0 (0.0%) | 43 (19.9%) |
| 75 Years and over | 16 (17.2%) | 14 (13.3%) |
Disability Class: Cognitive Difficulty
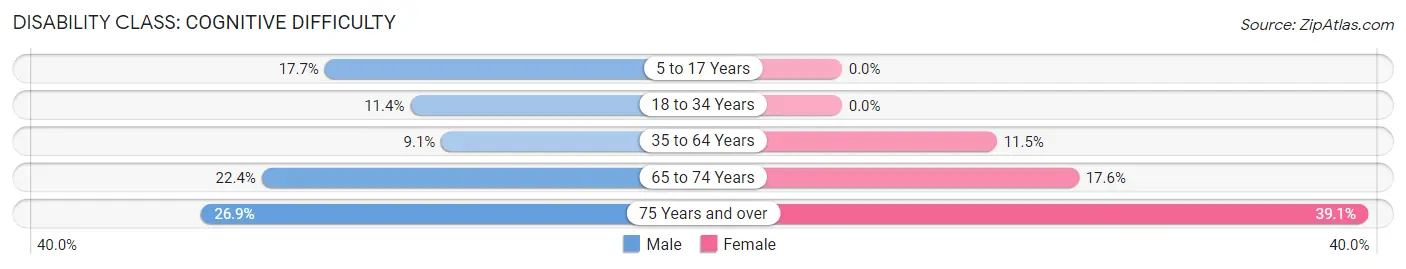
| Age Bracket | Male | Female |
| 5 to 17 Years | 42 (17.7%) | 0 (0.0%) |
| 18 to 34 Years | 24 (11.4%) | 0 (0.0%) |
| 35 to 64 Years | 40 (9.1%) | 53 (11.5%) |
| 65 to 74 Years | 28 (22.4%) | 38 (17.6%) |
| 75 Years and over | 25 (26.9%) | 41 (39.1%) |
Disability Class: Ambulatory Difficulty

| Age Bracket | Male | Female |
| 5 to 17 Years | 0 (0.0%) | 0 (0.0%) |
| 18 to 34 Years | 7 (3.3%) | 0 (0.0%) |
| 35 to 64 Years | 96 (21.8%) | 107 (23.2%) |
| 65 to 74 Years | 46 (36.8%) | 53 (24.5%) |
| 75 Years and over | 47 (50.5%) | 51 (48.6%) |
Disability Class: Self-Care Difficulty
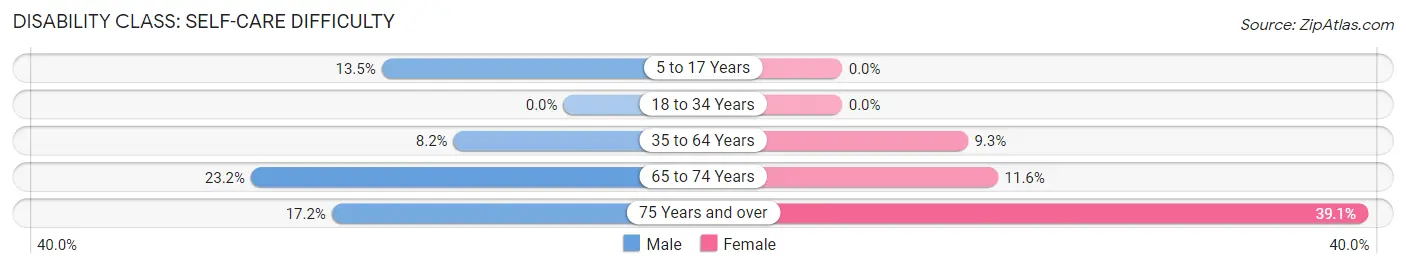
| Age Bracket | Male | Female |
| 5 to 17 Years | 32 (13.5%) | 0 (0.0%) |
| 18 to 34 Years | 0 (0.0%) | 0 (0.0%) |
| 35 to 64 Years | 36 (8.2%) | 43 (9.3%) |
| 65 to 74 Years | 29 (23.2%) | 25 (11.6%) |
| 75 Years and over | 16 (17.2%) | 41 (39.1%) |
Technology Access in Spring City
Computing Device Access in Spring City
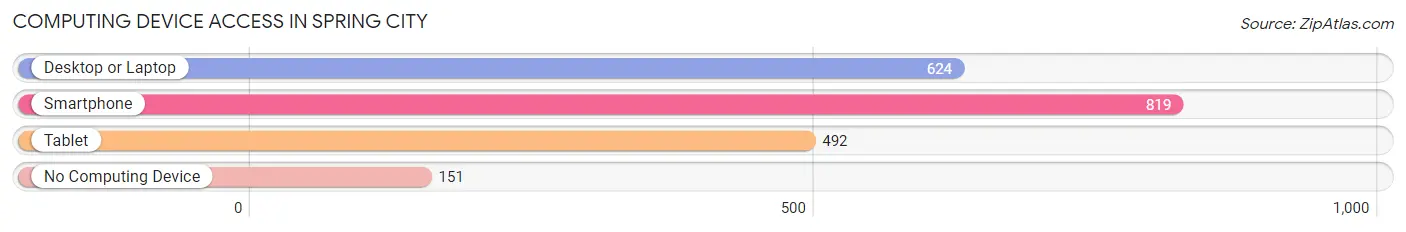
| Device Type | # Households | % Households |
| Desktop or Laptop | 624 | 61.7% |
| Smartphone | 819 | 80.9% |
| Tablet | 492 | 48.6% |
| No Computing Device | 151 | 14.9% |
| Total | 1,012 | 100.0% |
Internet Access in Spring City
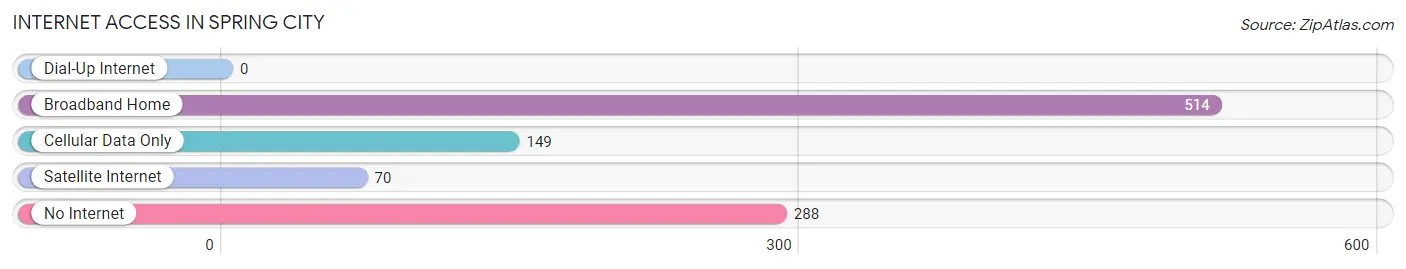
| Internet Type | # Households | % Households |
| Dial-Up Internet | 0 | 0.0% |
| Broadband Home | 514 | 50.8% |
| Cellular Data Only | 149 | 14.7% |
| Satellite Internet | 70 | 6.9% |
| No Internet | 288 | 28.5% |
| Total | 1,012 | 100.0% |
Spring City Summary
City of Spring City Tennessee
Spring City is a small town located in Rhea County, Tennessee. It is situated on the banks of the Tennessee River, about 25 miles north of Chattanooga. The town was founded in 1820 and has a population of approximately 2,000 people.
History
The town of Spring City was founded in 1820 by a group of settlers from North Carolina. The town was named after the nearby spring, which provided the settlers with a reliable source of water. The town quickly grew and by the mid-1800s, it had become a thriving community with a variety of businesses, including a sawmill, gristmill, and a cotton gin.
In the late 1800s, the town began to decline as the railroad bypassed it and the population began to move away. However, in the early 1900s, the town experienced a resurgence as the Tennessee Valley Authority (TVA) began to build dams and power plants in the area. This brought new jobs and economic growth to the town, and it soon became a popular tourist destination.
Geography
Spring City is located in Rhea County, Tennessee, on the banks of the Tennessee River. The town is situated in a valley surrounded by hills and mountains. The town is located about 25 miles north of Chattanooga and is accessible by US Highway 27.
The climate in Spring City is mild and humid, with temperatures ranging from the mid-50s in the winter to the mid-80s in the summer. The town receives an average of 45 inches of rain per year.
Economy
The economy of Spring City is largely based on tourism. The town is home to several attractions, including the Spring City Museum, the Spring City Golf Course, and the Spring City Country Club. The town also has several restaurants, shops, and other businesses.
The town is also home to several manufacturing companies, including a furniture factory and a plastics factory. The town is also home to a number of small businesses, including a grocery store, a hardware store, and a pharmacy.
Demographics
As of the 2010 census, the population of Spring City was 2,000. The racial makeup of the town was 95.2% White, 1.2% African American, 0.7% Native American, 0.3% Asian, and 2.6% from other races. The median household income was $35,000, and the median age was 40.
Conclusion
Spring City is a small town located in Rhea County, Tennessee. It was founded in 1820 and has a population of approximately 2,000 people. The town is situated on the banks of the Tennessee River and is accessible by US Highway 27. The economy of Spring City is largely based on tourism, and the town is home to several attractions, manufacturing companies, and small businesses. The racial makeup of the town is 95.2% White, 1.2% African American, 0.7% Native American, 0.3% Asian, and 2.6% from other races. The median household income is $35,000, and the median age is 40.
Common Questions
What is Per Capita Income in Spring City?
Per Capita income in Spring City is $27,213.
What is the Median Family Income in Spring City?
Median Family Income in Spring City is $70,291.
What is the Median Household income in Spring City?
Median Household Income in Spring City is $36,190.
What is Income or Wage Gap in Spring City?
Income or Wage Gap in Spring City is 25.2%.
Women in Spring City earn 74.8 cents for every dollar earned by a man.
What is Inequality or Gini Index in Spring City?
Inequality or Gini Index in Spring City is 0.51.
What is the Total Population of Spring City?
Total Population of Spring City is 2,294.
What is the Total Male Population of Spring City?
Total Male Population of Spring City is 1,235.
What is the Total Female Population of Spring City?
Total Female Population of Spring City is 1,059.
What is the Ratio of Males per 100 Females in Spring City?
There are 116.62 Males per 100 Females in Spring City.
What is the Ratio of Females per 100 Males in Spring City?
There are 85.75 Females per 100 Males in Spring City.
What is the Median Population Age in Spring City?
Median Population Age in Spring City is 48.1 Years.
What is the Average Family Size in Spring City
Average Family Size in Spring City is 3.1 People.
What is the Average Household Size in Spring City
Average Household Size in Spring City is 2.2 People.
How Large is the Labor Force in Spring City?
There are 886 People in the Labor Forcein in Spring City.
What is the Percentage of People in the Labor Force in Spring City?
48.3% of People are in the Labor Force in Spring City.
What is the Unemployment Rate in Spring City?
Unemployment Rate in Spring City is 10.6%.