Rutledge, TN Map & Demographics
Rutledge Map
Rutledge Overview
$25,315
PER CAPITA INCOME
$67,986
AVG FAMILY INCOME
$30,739
AVG HOUSEHOLD INCOME
40.7%
WAGE / INCOME GAP [ % ]
59.3¢/ $1
WAGE / INCOME GAP [ $ ]
0.57
INEQUALITY / GINI INDEX
1,550
TOTAL POPULATION
768
MALE POPULATION
782
FEMALE POPULATION
98.21
MALES / 100 FEMALES
101.82
FEMALES / 100 MALES
45.1
MEDIAN AGE
3.6
AVG FAMILY SIZE
2.4
AVG HOUSEHOLD SIZE
617
LABOR FORCE [ PEOPLE ]
47.0%
PERCENT IN LABOR FORCE
3.9%
UNEMPLOYMENT RATE
Rutledge Zip Codes
Rutledge Area Codes
Income in Rutledge
Income Overview in Rutledge
Per Capita Income in Rutledge is $25,315, while median incomes of families and households are $67,986 and $30,739 respectively.
| Characteristic | Number | Measure |
| Per Capita Income | 1,550 | $25,315 |
| Median Family Income | 279 | $67,986 |
| Mean Family Income | 279 | $79,716 |
| Median Household Income | 583 | $30,739 |
| Mean Household Income | 583 | $55,567 |
| Income Deficit | 279 | $0 |
| Wage / Income Gap (%) | 1,550 | 40.68% |
| Wage / Income Gap ($) | 1,550 | 59.32¢ per $1 |
| Gini / Inequality Index | 1,550 | 0.57 |
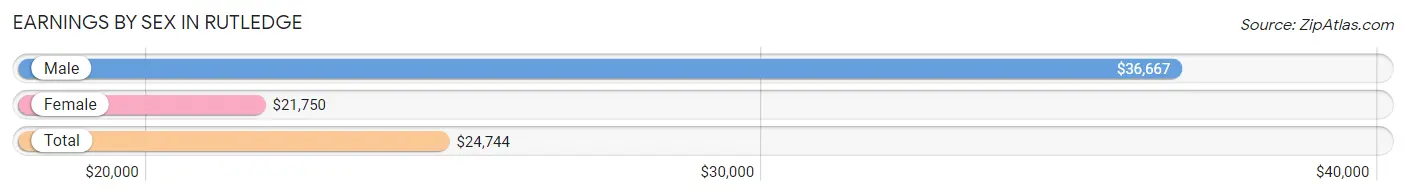
Earnings by Sex in Rutledge
Average Earnings in Rutledge are $24,744, $36,667 for men and $21,750 for women, a difference of 40.7%.
| Sex | Number | Average Earnings |
| Male | 320 (49.5%) | $36,667 |
| Female | 326 (50.5%) | $21,750 |
| Total | 646 (100.0%) | $24,744 |
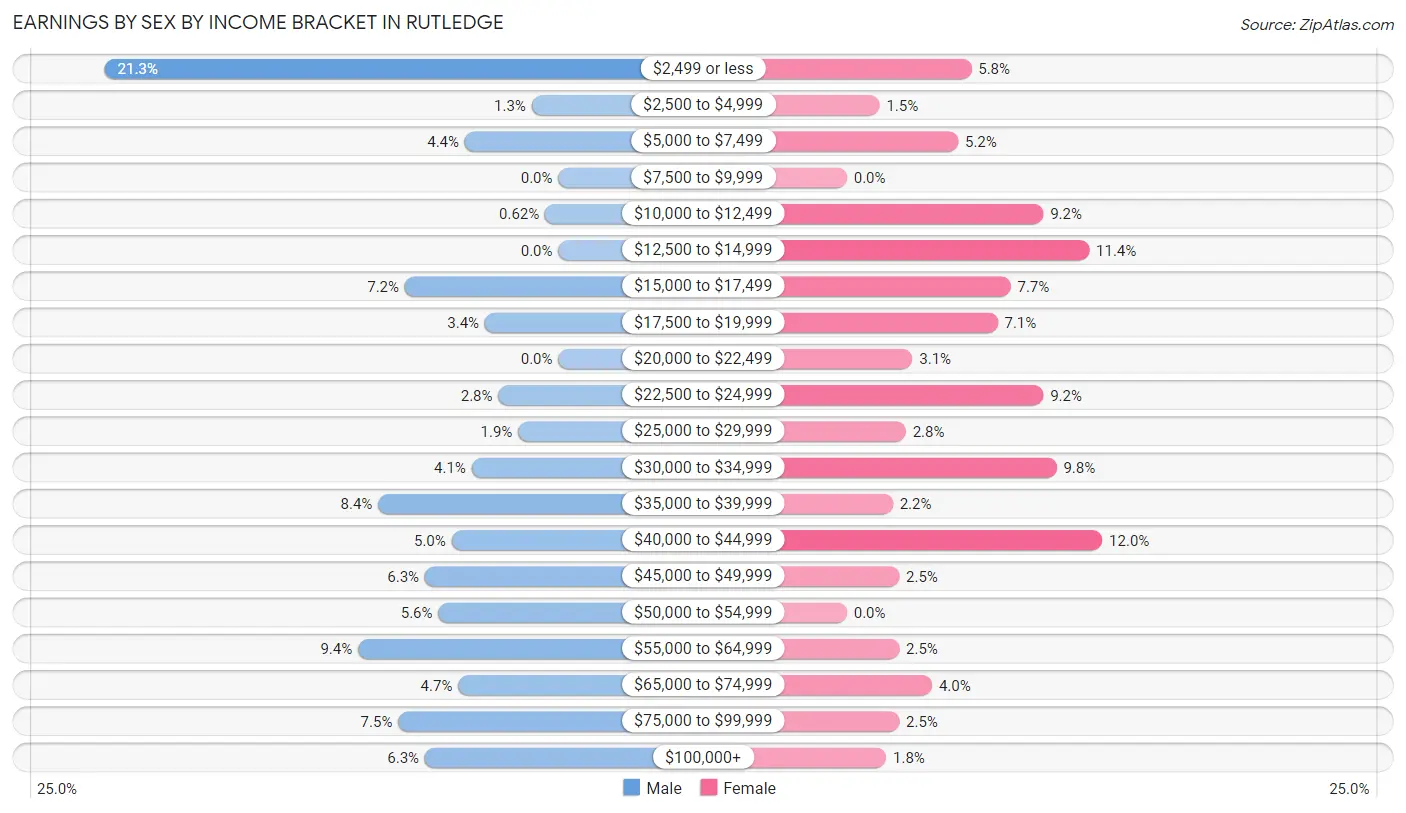
Earnings by Sex by Income Bracket in Rutledge
The most common earnings brackets in Rutledge are $2,499 or less for men (68 | 21.2%) and $40,000 to $44,999 for women (39 | 12.0%).
| Income | Male | Female |
| $2,499 or less | 68 (21.2%) | 19 (5.8%) |
| $2,500 to $4,999 | 4 (1.3%) | 5 (1.5%) |
| $5,000 to $7,499 | 14 (4.4%) | 17 (5.2%) |
| $7,500 to $9,999 | 0 (0.0%) | 0 (0.0%) |
| $10,000 to $12,499 | 2 (0.6%) | 30 (9.2%) |
| $12,500 to $14,999 | 0 (0.0%) | 37 (11.4%) |
| $15,000 to $17,499 | 23 (7.2%) | 25 (7.7%) |
| $17,500 to $19,999 | 11 (3.4%) | 23 (7.1%) |
| $20,000 to $22,499 | 0 (0.0%) | 10 (3.1%) |
| $22,500 to $24,999 | 9 (2.8%) | 30 (9.2%) |
| $25,000 to $29,999 | 6 (1.9%) | 9 (2.8%) |
| $30,000 to $34,999 | 13 (4.1%) | 32 (9.8%) |
| $35,000 to $39,999 | 27 (8.4%) | 7 (2.1%) |
| $40,000 to $44,999 | 16 (5.0%) | 39 (12.0%) |
| $45,000 to $49,999 | 20 (6.2%) | 8 (2.5%) |
| $50,000 to $54,999 | 18 (5.6%) | 0 (0.0%) |
| $55,000 to $64,999 | 30 (9.4%) | 8 (2.5%) |
| $65,000 to $74,999 | 15 (4.7%) | 13 (4.0%) |
| $75,000 to $99,999 | 24 (7.5%) | 8 (2.5%) |
| $100,000+ | 20 (6.2%) | 6 (1.8%) |
| Total | 320 (100.0%) | 326 (100.0%) |
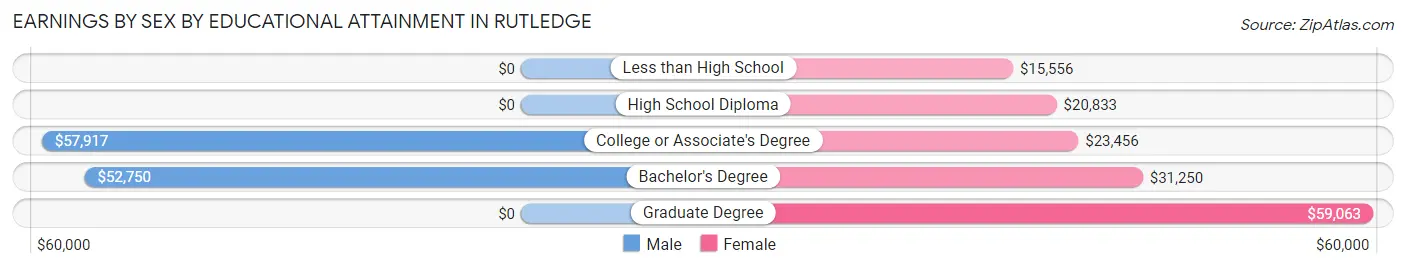
Earnings by Sex by Educational Attainment in Rutledge
Average earnings in Rutledge are $36,750 for men and $22,868 for women, a difference of 37.8%. Men with an educational attainment of college or associate's degree enjoy the highest average annual earnings of $57,917, while those with bachelor's degree education earn the least with $52,750. Women with an educational attainment of graduate degree earn the most with the average annual earnings of $59,063, while those with less than high school education have the smallest earnings of $15,556.
| Educational Attainment | Male Income | Female Income |
| Less than High School | - | - |
| High School Diploma | - | - |
| College or Associate's Degree | $57,917 | $23,456 |
| Bachelor's Degree | $52,750 | $31,250 |
| Graduate Degree | - | - |
| Total | $36,750 | $22,868 |
Family Income in Rutledge
Family Income Brackets in Rutledge
According to the Rutledge family income data, there are 58 families falling into the $75,000 to $99,999 income range, which is the most common income bracket and makes up 20.8% of all families.
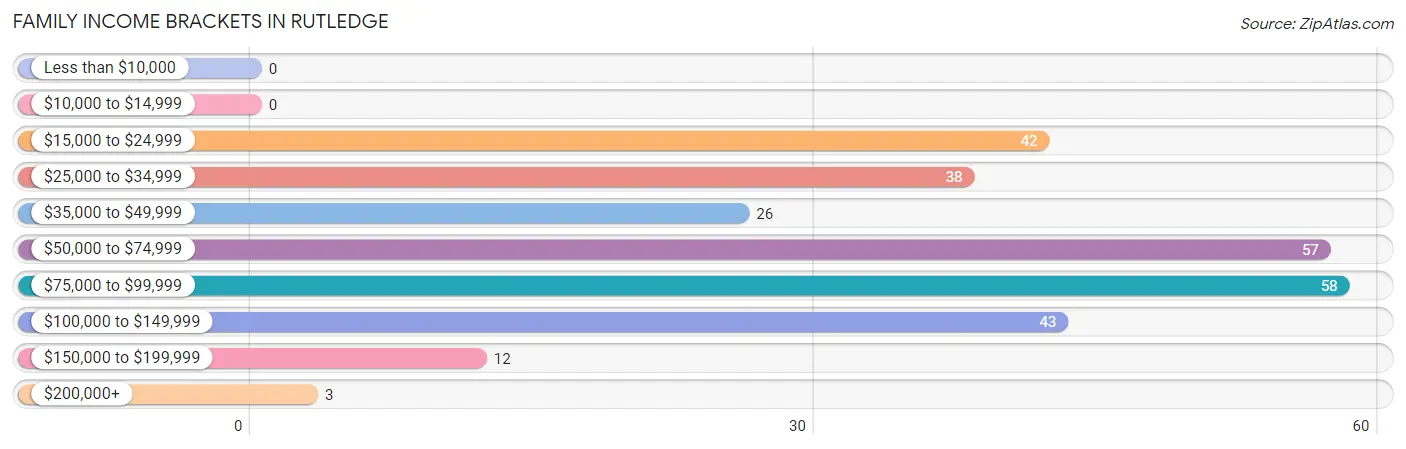
| Income Bracket | # Families | % Families |
| Less than $10,000 | 0 | 0.0% |
| $10,000 to $14,999 | 0 | 0.0% |
| $15,000 to $24,999 | 42 | 15.1% |
| $25,000 to $34,999 | 38 | 13.6% |
| $35,000 to $49,999 | 26 | 9.3% |
| $50,000 to $74,999 | 57 | 20.4% |
| $75,000 to $99,999 | 58 | 20.8% |
| $100,000 to $149,999 | 43 | 15.4% |
| $150,000 to $199,999 | 12 | 4.3% |
| $200,000+ | 3 | 1.1% |
Family Income by Famaliy Size in Rutledge
6-person families (15 | 5.4%) account for the highest median family income in Rutledge with $92,750 per family, while 2-person families (168 | 60.2%) have the highest median income of $28,542 per family member.
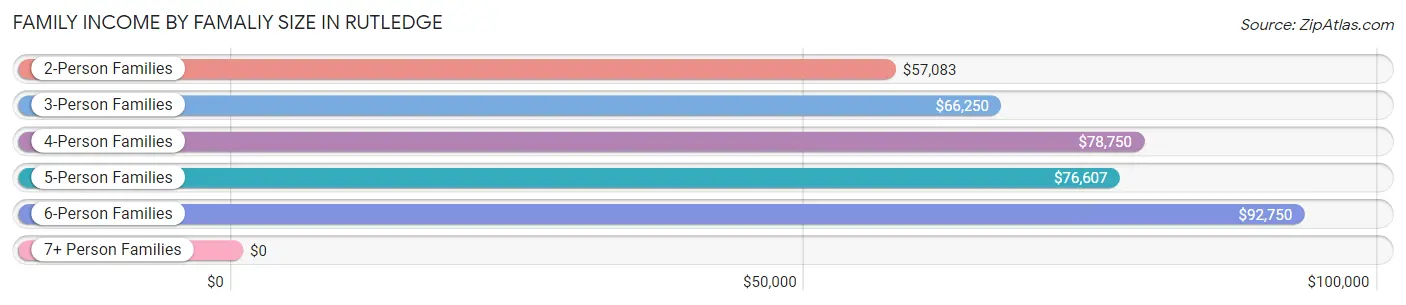
| Income Bracket | # Families | Median Income |
| 2-Person Families | 168 (60.2%) | $57,083 |
| 3-Person Families | 42 (15.0%) | $66,250 |
| 4-Person Families | 23 (8.2%) | $78,750 |
| 5-Person Families | 29 (10.4%) | $76,607 |
| 6-Person Families | 15 (5.4%) | $92,750 |
| 7+ Person Families | 2 (0.7%) | $0 |
| Total | 279 (100.0%) | $67,986 |
Family Income by Number of Earners in Rutledge
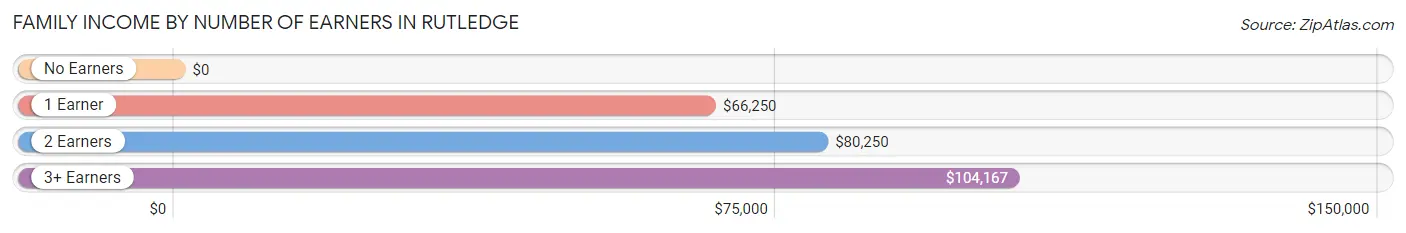
| Number of Earners | # Families | Median Income |
| No Earners | 54 (19.4%) | $0 |
| 1 Earner | 110 (39.4%) | $66,250 |
| 2 Earners | 87 (31.2%) | $80,250 |
| 3+ Earners | 28 (10.0%) | $104,167 |
| Total | 279 (100.0%) | $67,986 |
Household Income in Rutledge
Household Income Brackets in Rutledge
With 115 households falling in the category, the $15,000 to $24,999 income range is the most frequent in Rutledge, accounting for 19.7% of all households. In contrast, only 5 households (0.9%) fall into the $200,000+ income bracket, making it the least populous group.
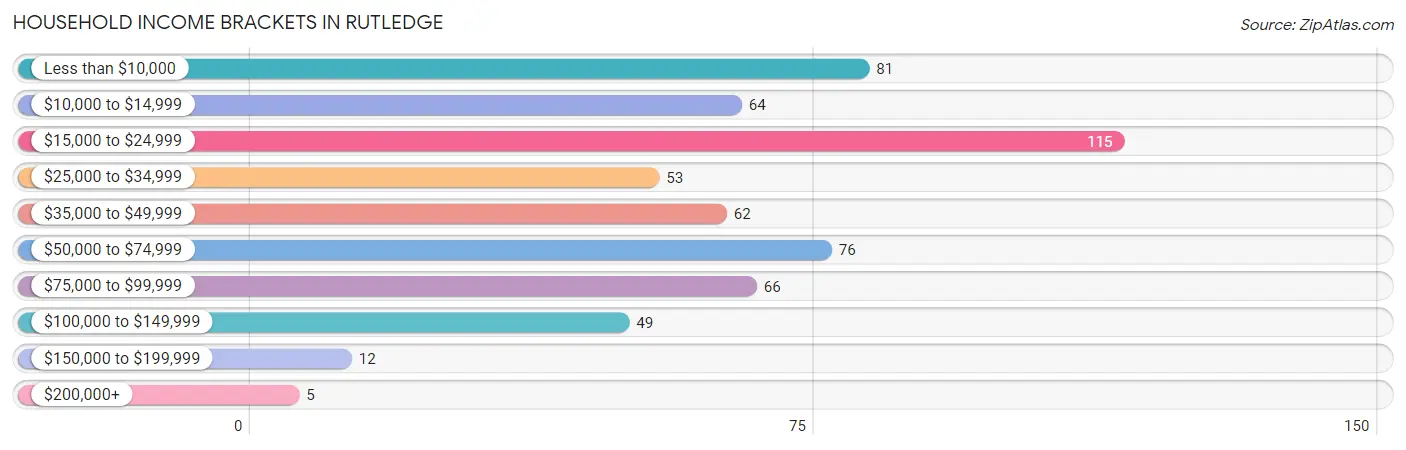
| Income Bracket | # Households | % Households |
| Less than $10,000 | 81 | 13.9% |
| $10,000 to $14,999 | 64 | 11.0% |
| $15,000 to $24,999 | 115 | 19.7% |
| $25,000 to $34,999 | 53 | 9.1% |
| $35,000 to $49,999 | 62 | 10.6% |
| $50,000 to $74,999 | 76 | 13.0% |
| $75,000 to $99,999 | 66 | 11.3% |
| $100,000 to $149,999 | 49 | 8.4% |
| $150,000 to $199,999 | 12 | 2.1% |
| $200,000+ | 5 | 0.9% |
Household Income by Householder Age in Rutledge
The median household income in Rutledge is $30,739, with the highest median household income of $108,333 found in the 15 to 24 years age bracket for the primary householder. A total of 20 households (3.4%) fall into this category. Meanwhile, the 25 to 44 years age bracket for the primary householder has the lowest median household income of $0, with 125 households (21.4%) in this group.
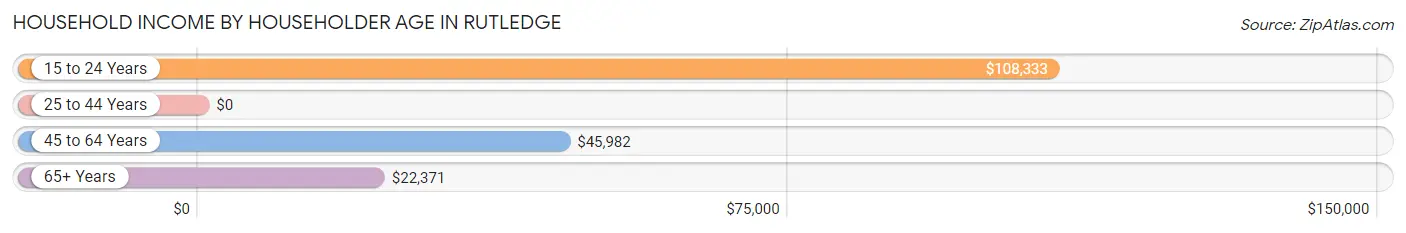
| Income Bracket | # Households | Median Income |
| 15 to 24 Years | 20 (3.4%) | $108,333 |
| 25 to 44 Years | 125 (21.4%) | $0 |
| 45 to 64 Years | 233 (40.0%) | $45,982 |
| 65+ Years | 205 (35.2%) | $22,371 |
| Total | 583 (100.0%) | $30,739 |
Poverty in Rutledge
Income Below Poverty by Sex and Age in Rutledge
With 16.2% poverty level for males and 23.5% for females among the residents of Rutledge, 25 to 34 year old males and 12 to 14 year old females are the most vulnerable to poverty, with 57 males (51.8%) and 27 females (64.3%) in their respective age groups living below the poverty level.
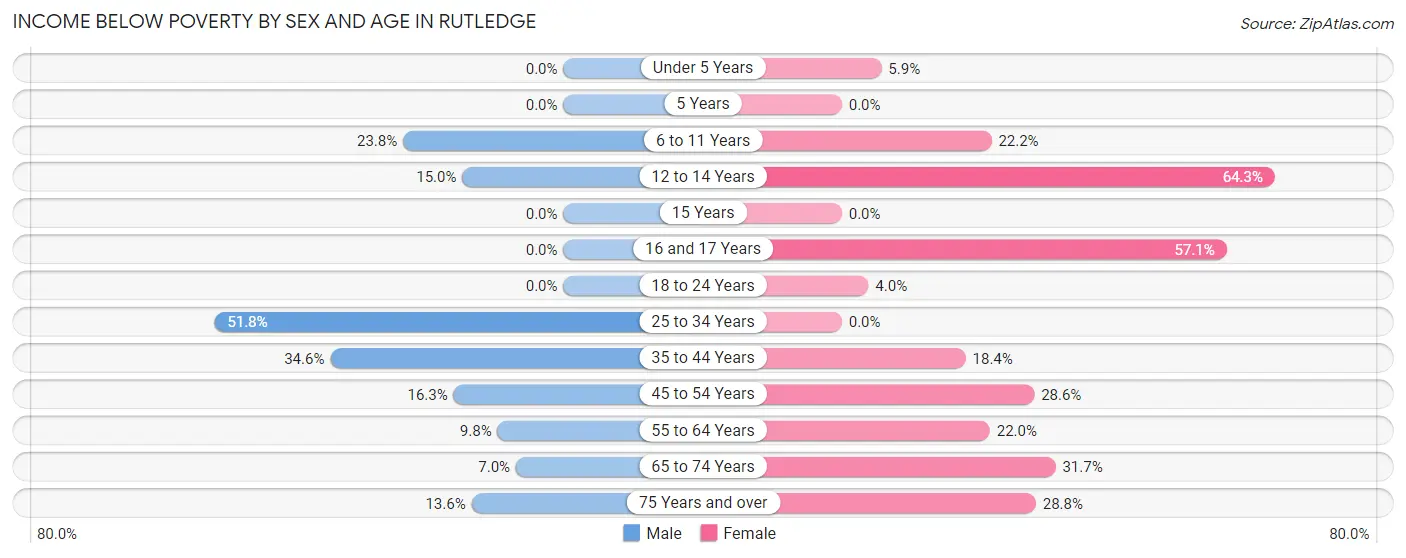
| Age Bracket | Male | Female |
| Under 5 Years | 0 (0.0%) | 2 (5.9%) |
| 5 Years | 0 (0.0%) | 0 (0.0%) |
| 6 to 11 Years | 10 (23.8%) | 6 (22.2%) |
| 12 to 14 Years | 3 (15.0%) | 27 (64.3%) |
| 15 Years | 0 (0.0%) | 0 (0.0%) |
| 16 and 17 Years | 0 (0.0%) | 12 (57.1%) |
| 18 to 24 Years | 0 (0.0%) | 3 (4.0%) |
| 25 to 34 Years | 57 (51.8%) | 0 (0.0%) |
| 35 to 44 Years | 9 (34.6%) | 16 (18.4%) |
| 45 to 54 Years | 15 (16.3%) | 28 (28.6%) |
| 55 to 64 Years | 9 (9.8%) | 20 (22.0%) |
| 65 to 74 Years | 5 (7.0%) | 33 (31.7%) |
| 75 Years and over | 6 (13.6%) | 17 (28.8%) |
| Total | 114 (16.2%) | 164 (23.5%) |
Income Above Poverty by Sex and Age in Rutledge
According to the poverty statistics in Rutledge, males aged under 5 years and females aged 15 years are the age groups that are most secure financially, with 100.0% of males and 100.0% of females in these age groups living above the poverty line.
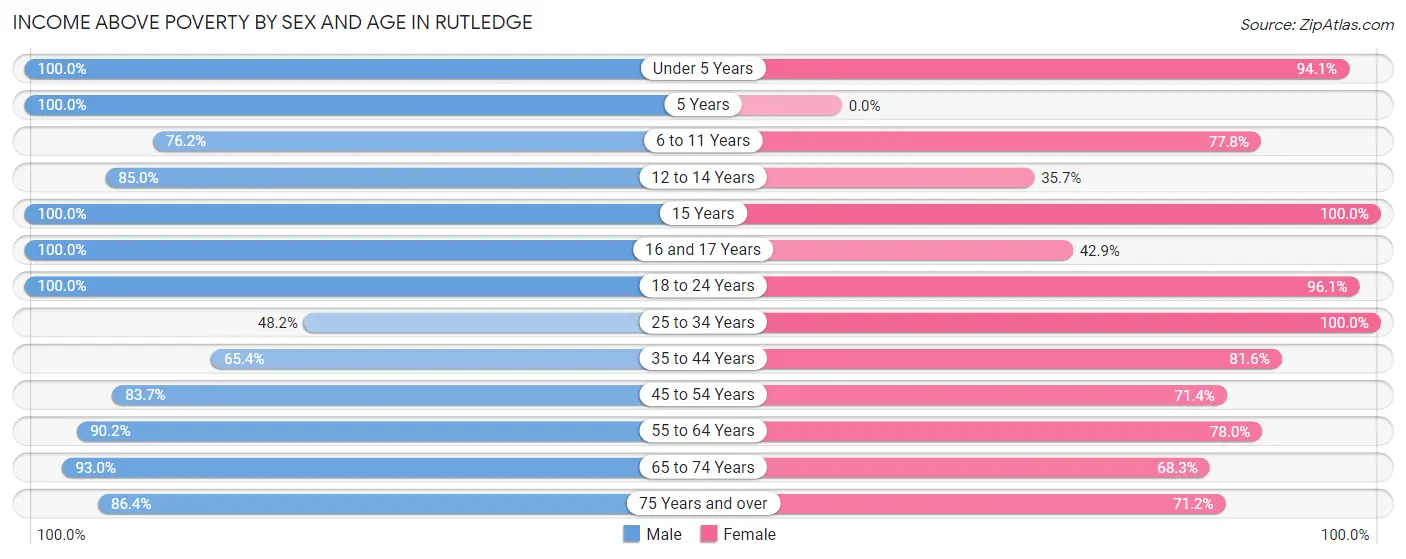
| Age Bracket | Male | Female |
| Under 5 Years | 25 (100.0%) | 32 (94.1%) |
| 5 Years | 15 (100.0%) | 0 (0.0%) |
| 6 to 11 Years | 32 (76.2%) | 21 (77.8%) |
| 12 to 14 Years | 17 (85.0%) | 15 (35.7%) |
| 15 Years | 7 (100.0%) | 15 (100.0%) |
| 16 and 17 Years | 101 (100.0%) | 9 (42.9%) |
| 18 to 24 Years | 61 (100.0%) | 73 (96.1%) |
| 25 to 34 Years | 53 (48.2%) | 45 (100.0%) |
| 35 to 44 Years | 17 (65.4%) | 71 (81.6%) |
| 45 to 54 Years | 77 (83.7%) | 70 (71.4%) |
| 55 to 64 Years | 83 (90.2%) | 71 (78.0%) |
| 65 to 74 Years | 66 (93.0%) | 71 (68.3%) |
| 75 Years and over | 38 (86.4%) | 42 (71.2%) |
| Total | 592 (83.9%) | 535 (76.5%) |
Income Below Poverty Among Married-Couple Families in Rutledge
The poverty statistics for married-couple families in Rutledge show that 9.3% or 19 of the total 205 families live below the poverty line. Families with 5 or more children have the highest poverty rate of 100.0%, comprising of 2 families. On the other hand, families with no children have the lowest poverty rate of 5.1%, which includes 7 families.
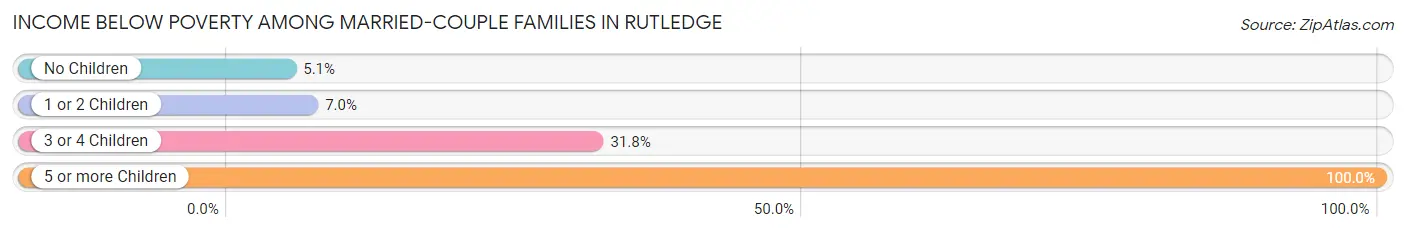
| Children | Above Poverty | Below Poverty |
| No Children | 131 (94.9%) | 7 (5.1%) |
| 1 or 2 Children | 40 (93.0%) | 3 (7.0%) |
| 3 or 4 Children | 15 (68.2%) | 7 (31.8%) |
| 5 or more Children | 0 (0.0%) | 2 (100.0%) |
| Total | 186 (90.7%) | 19 (9.3%) |
Income Below Poverty Among Single-Parent Households in Rutledge
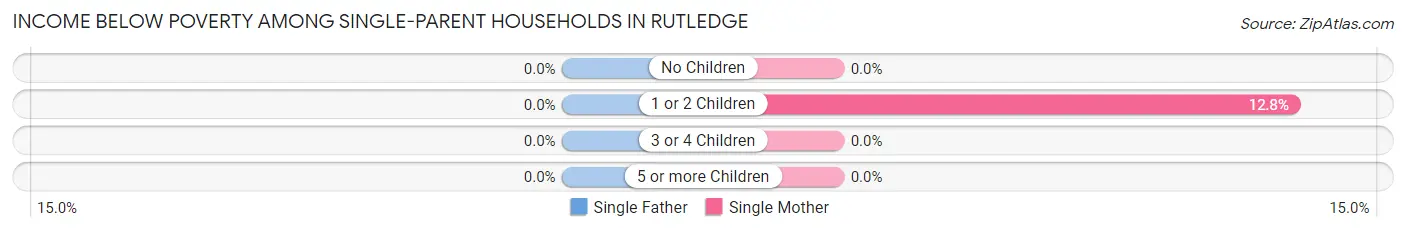
| Children | Single Father | Single Mother |
| No Children | 0 (0.0%) | 0 (0.0%) |
| 1 or 2 Children | 0 (0.0%) | 6 (12.8%) |
| 3 or 4 Children | 0 (0.0%) | 0 (0.0%) |
| 5 or more Children | 0 (0.0%) | 0 (0.0%) |
| Total | 0 (0.0%) | 6 (10.7%) |
Income Below Poverty Among Married-Couple vs Single-Parent Households in Rutledge
The poverty data for Rutledge shows that 19 of the married-couple family households (9.3%) and 6 of the single-parent households (8.1%) are living below the poverty level. Within the married-couple family households, those with 5 or more children have the highest poverty rate, with 2 households (100.0%) falling below the poverty line. Among the single-parent households, those with 1 or 2 children have the highest poverty rate, with 6 household (11.3%) living below poverty.
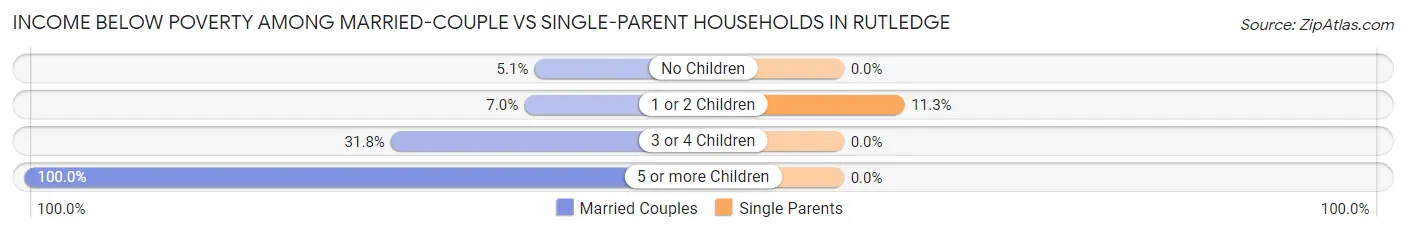
| Children | Married-Couple Families | Single-Parent Households |
| No Children | 7 (5.1%) | 0 (0.0%) |
| 1 or 2 Children | 3 (7.0%) | 6 (11.3%) |
| 3 or 4 Children | 7 (31.8%) | 0 (0.0%) |
| 5 or more Children | 2 (100.0%) | 0 (0.0%) |
| Total | 19 (9.3%) | 6 (8.1%) |
Race in Rutledge
The most populous races in Rutledge are White / Caucasian (1,451 | 93.6%), Two or more Races (56 | 3.6%), and Hispanic or Latino (46 | 3.0%).
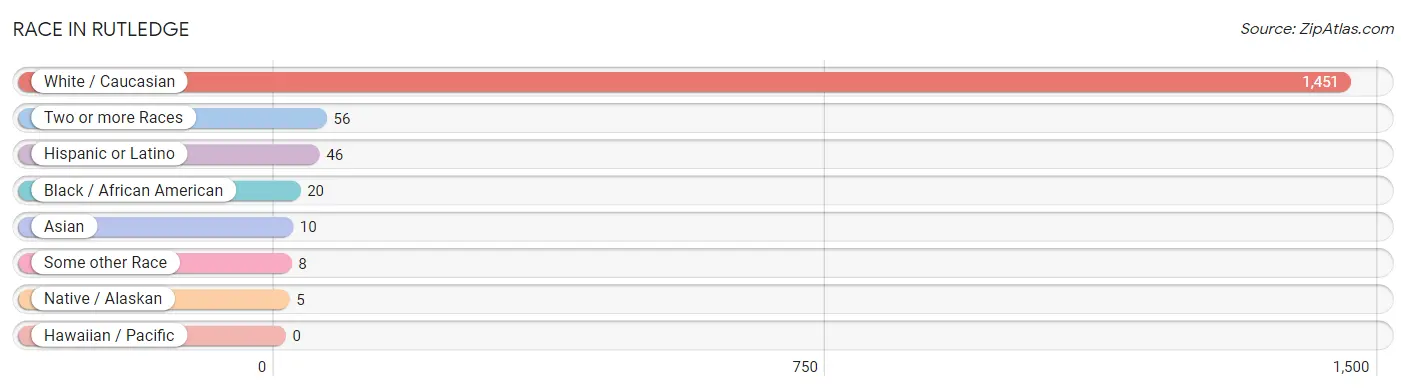
| Race | # Population | % Population |
| Asian | 10 | 0.6% |
| Black / African American | 20 | 1.3% |
| Hawaiian / Pacific | 0 | 0.0% |
| Hispanic or Latino | 46 | 3.0% |
| Native / Alaskan | 5 | 0.3% |
| White / Caucasian | 1,451 | 93.6% |
| Two or more Races | 56 | 3.6% |
| Some other Race | 8 | 0.5% |
| Total | 1,550 | 100.0% |
Ancestry in Rutledge
The most populous ancestries reported in Rutledge are American (333 | 21.5%), Irish (179 | 11.6%), English (173 | 11.2%), German (131 | 8.5%), and European (45 | 2.9%), together accounting for 55.5% of all Rutledge residents.
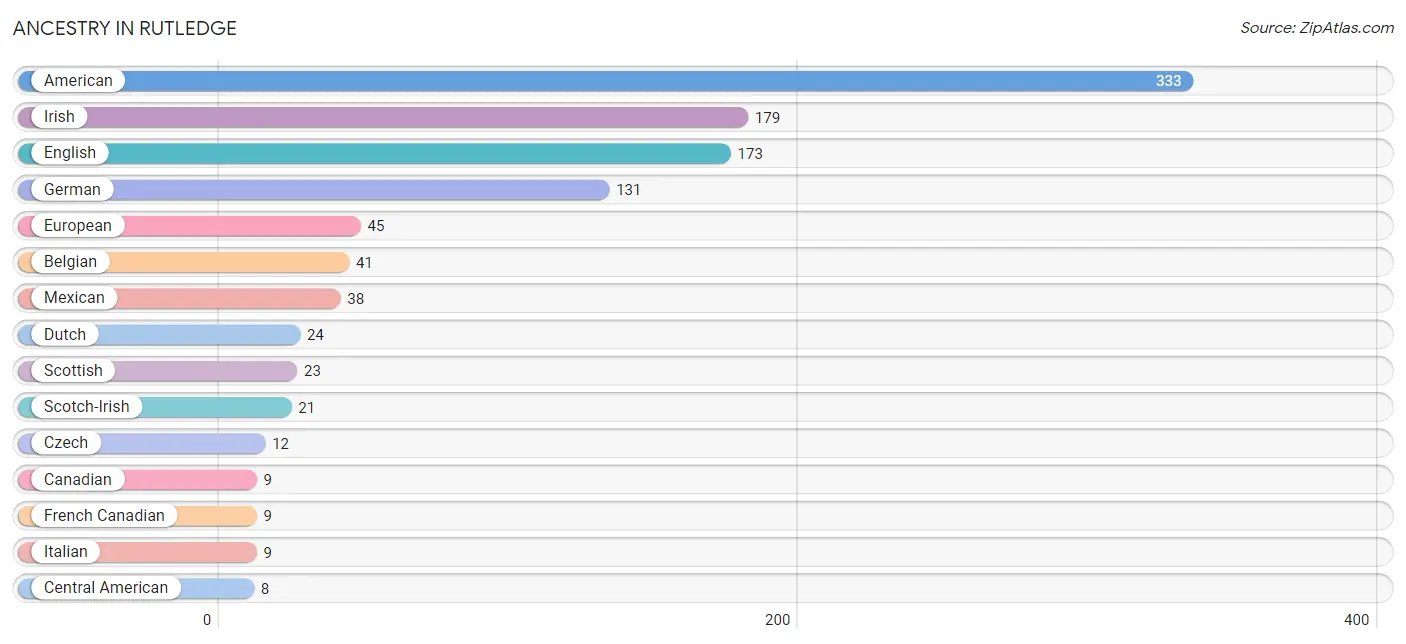
| Ancestry | # Population | % Population |
| American | 333 | 21.5% |
| Belgian | 41 | 2.6% |
| Canadian | 9 | 0.6% |
| Central American | 8 | 0.5% |
| Cherokee | 5 | 0.3% |
| Czech | 12 | 0.8% |
| Dutch | 24 | 1.5% |
| English | 173 | 11.2% |
| European | 45 | 2.9% |
| French Canadian | 9 | 0.6% |
| German | 131 | 8.5% |
| Honduran | 8 | 0.5% |
| Hungarian | 4 | 0.3% |
| Irish | 179 | 11.6% |
| Italian | 9 | 0.6% |
| Malaysian | 2 | 0.1% |
| Mexican | 38 | 2.5% |
| Scotch-Irish | 21 | 1.3% |
| Scottish | 23 | 1.5% |
| Thai | 8 | 0.5% |
| Welsh | 3 | 0.2% | View All 21 Rows |
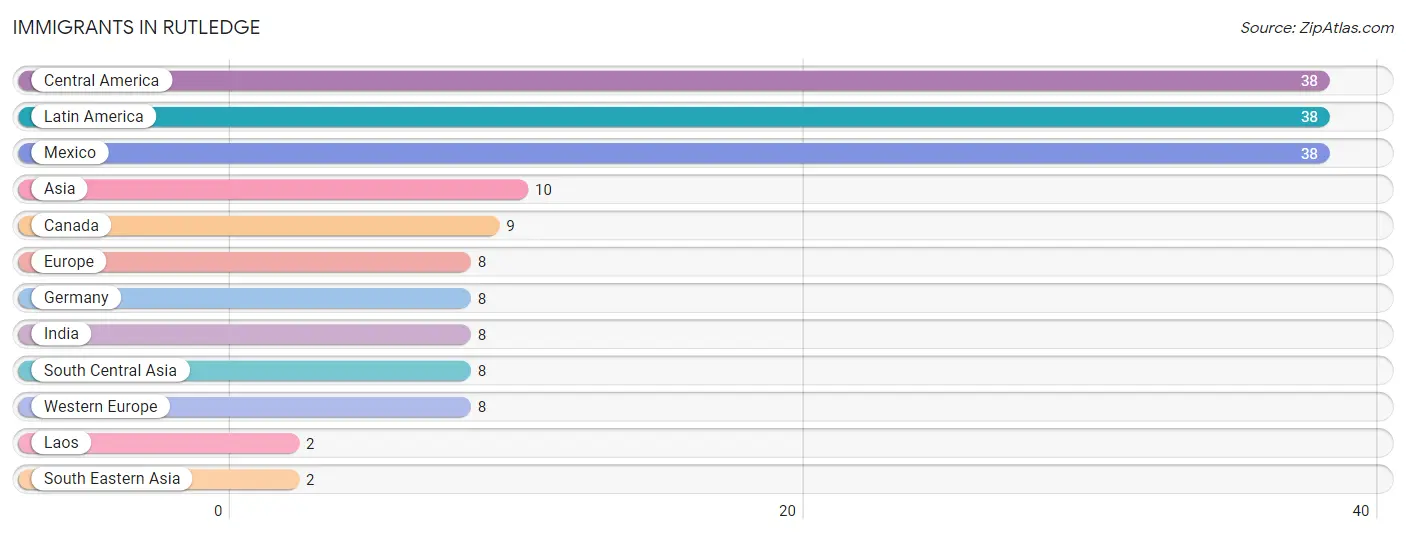
Immigrants in Rutledge
The most numerous immigrant groups reported in Rutledge came from Central America (38 | 2.5%), Latin America (38 | 2.5%), Mexico (38 | 2.5%), Asia (10 | 0.6%), and Canada (9 | 0.6%), together accounting for 8.6% of all Rutledge residents.
| Immigration Origin | # Population | % Population |
| Asia | 10 | 0.6% |
| Canada | 9 | 0.6% |
| Central America | 38 | 2.5% |
| Europe | 8 | 0.5% |
| Germany | 8 | 0.5% |
| India | 8 | 0.5% |
| Laos | 2 | 0.1% |
| Latin America | 38 | 2.5% |
| Mexico | 38 | 2.5% |
| South Central Asia | 8 | 0.5% |
| South Eastern Asia | 2 | 0.1% |
| Western Europe | 8 | 0.5% | View All 12 Rows |
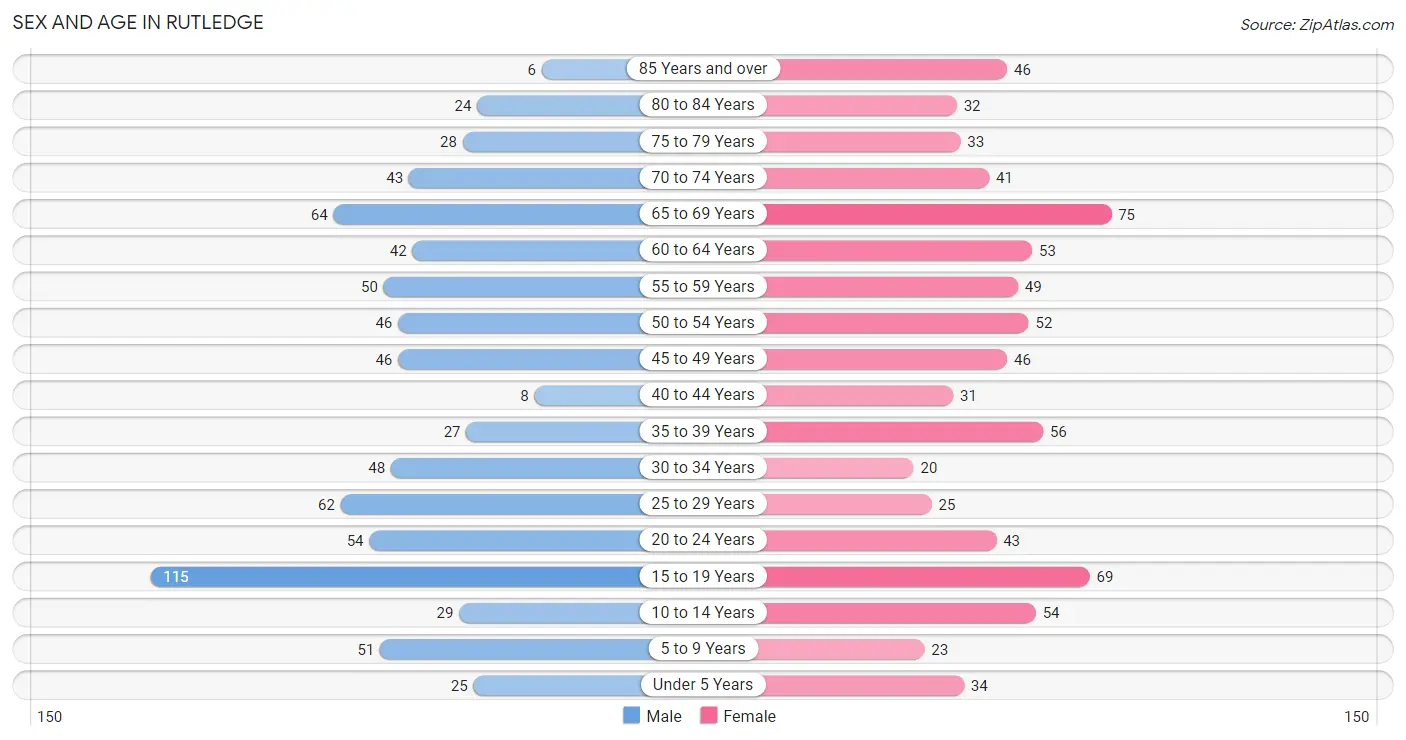
Sex and Age in Rutledge
Sex and Age in Rutledge
The most populous age groups in Rutledge are 15 to 19 Years (115 | 15.0%) for men and 65 to 69 Years (75 | 9.6%) for women.
| Age Bracket | Male | Female |
| Under 5 Years | 25 (3.3%) | 34 (4.3%) |
| 5 to 9 Years | 51 (6.6%) | 23 (2.9%) |
| 10 to 14 Years | 29 (3.8%) | 54 (6.9%) |
| 15 to 19 Years | 115 (15.0%) | 69 (8.8%) |
| 20 to 24 Years | 54 (7.0%) | 43 (5.5%) |
| 25 to 29 Years | 62 (8.1%) | 25 (3.2%) |
| 30 to 34 Years | 48 (6.2%) | 20 (2.6%) |
| 35 to 39 Years | 27 (3.5%) | 56 (7.2%) |
| 40 to 44 Years | 8 (1.0%) | 31 (4.0%) |
| 45 to 49 Years | 46 (6.0%) | 46 (5.9%) |
| 50 to 54 Years | 46 (6.0%) | 52 (6.7%) |
| 55 to 59 Years | 50 (6.5%) | 49 (6.3%) |
| 60 to 64 Years | 42 (5.5%) | 53 (6.8%) |
| 65 to 69 Years | 64 (8.3%) | 75 (9.6%) |
| 70 to 74 Years | 43 (5.6%) | 41 (5.2%) |
| 75 to 79 Years | 28 (3.6%) | 33 (4.2%) |
| 80 to 84 Years | 24 (3.1%) | 32 (4.1%) |
| 85 Years and over | 6 (0.8%) | 46 (5.9%) |
| Total | 768 (100.0%) | 782 (100.0%) |
Families and Households in Rutledge
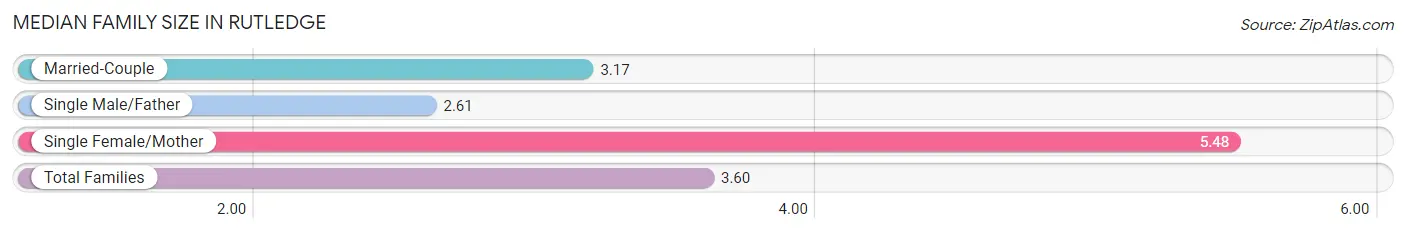
Median Family Size in Rutledge
The median family size in Rutledge is 3.60 persons per family, with single female/mother families (56 | 20.1%) accounting for the largest median family size of 5.48 persons per family. On the other hand, single male/father families (18 | 6.5%) represent the smallest median family size with 2.61 persons per family.
| Family Type | # Families | Family Size |
| Married-Couple | 205 (73.5%) | 3.17 |
| Single Male/Father | 18 (6.5%) | 2.61 |
| Single Female/Mother | 56 (20.1%) | 5.48 |
| Total Families | 279 (100.0%) | 3.60 |
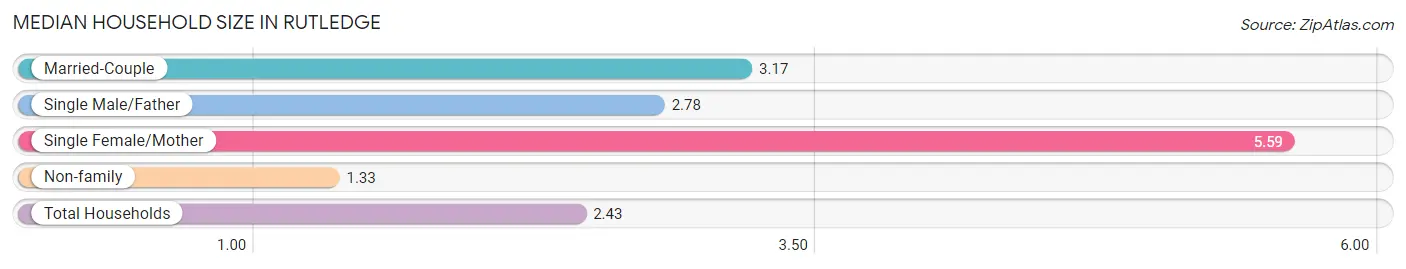
Median Household Size in Rutledge
The median household size in Rutledge is 2.43 persons per household, with single female/mother households (56 | 9.6%) accounting for the largest median household size of 5.59 persons per household. non-family households (304 | 52.1%) represent the smallest median household size with 1.33 persons per household.
| Household Type | # Households | Household Size |
| Married-Couple | 205 (35.2%) | 3.17 |
| Single Male/Father | 18 (3.1%) | 2.78 |
| Single Female/Mother | 56 (9.6%) | 5.59 |
| Non-family | 304 (52.1%) | 1.33 |
| Total Households | 583 (100.0%) | 2.43 |
Household Size by Marriage Status in Rutledge
Out of a total of 583 households in Rutledge, 279 (47.9%) are family households, while 304 (52.1%) are nonfamily households. The most numerous type of family households are 2-person households, comprising 162, and the most common type of nonfamily households are 1-person households, comprising 252.
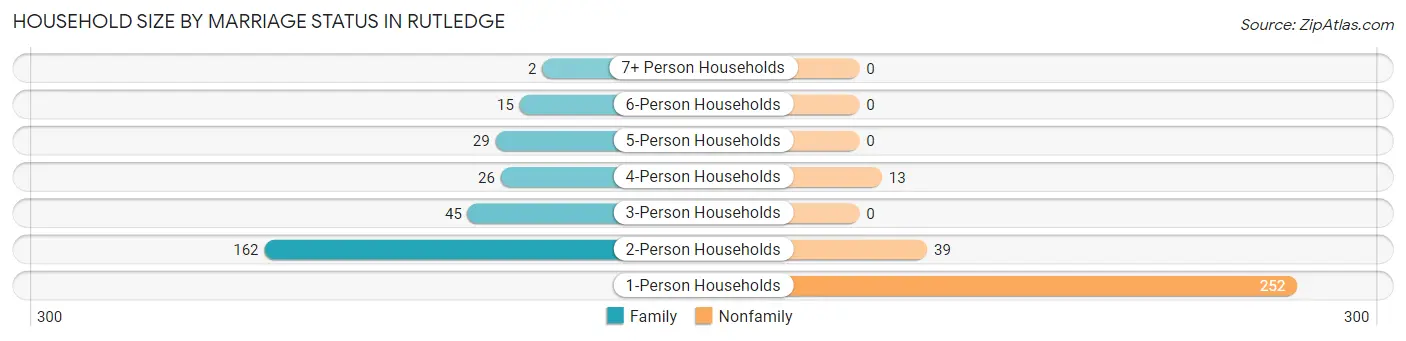
| Household Size | Family Households | Nonfamily Households |
| 1-Person Households | - | 252 (43.2%) |
| 2-Person Households | 162 (27.8%) | 39 (6.7%) |
| 3-Person Households | 45 (7.7%) | 0 (0.0%) |
| 4-Person Households | 26 (4.5%) | 13 (2.2%) |
| 5-Person Households | 29 (5.0%) | 0 (0.0%) |
| 6-Person Households | 15 (2.6%) | 0 (0.0%) |
| 7+ Person Households | 2 (0.3%) | 0 (0.0%) |
| Total | 279 (47.9%) | 304 (52.1%) |
Female Fertility in Rutledge
Fertility by Age in Rutledge
Average fertility rate in Rutledge is 51.0 births per 1,000 women. Women in the age bracket of 20 to 34 years have the highest fertility rate with 91.0 births per 1,000 women. Women in the age bracket of 20 to 34 years acount for 53.3% of all women with births.
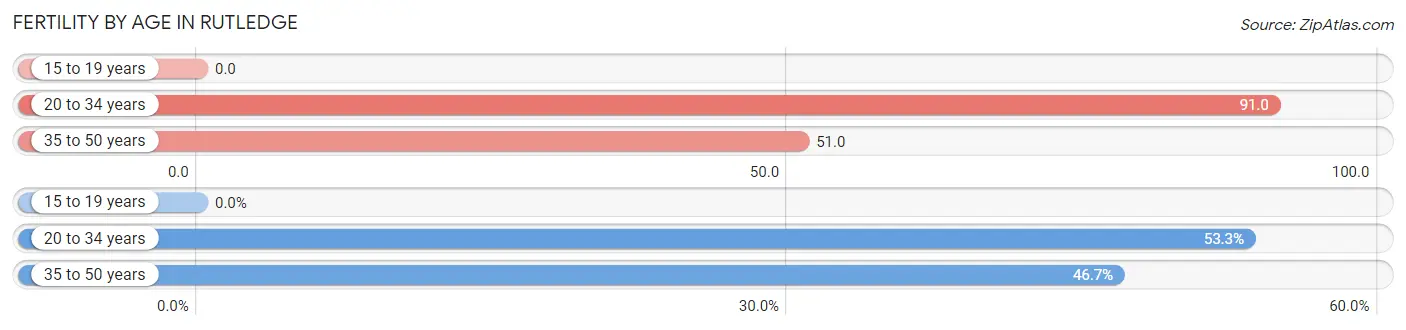
| Age Bracket | Women with Births | Births / 1,000 Women |
| 15 to 19 years | 0 (0.0%) | 0.0 |
| 20 to 34 years | 8 (53.3%) | 91.0 |
| 35 to 50 years | 7 (46.7%) | 51.0 |
| Total | 15 (100.0%) | 51.0 |
Fertility by Age by Marriage Status in Rutledge
46.7% of women with births (15) in Rutledge are married. The highest percentage of unmarried women with births falls into 20 to 34 years age bracket with 100.0% of them unmarried at the time of birth, while the lowest percentage of unmarried women with births belong to 35 to 50 years age bracket with 0.0% of them unmarried.
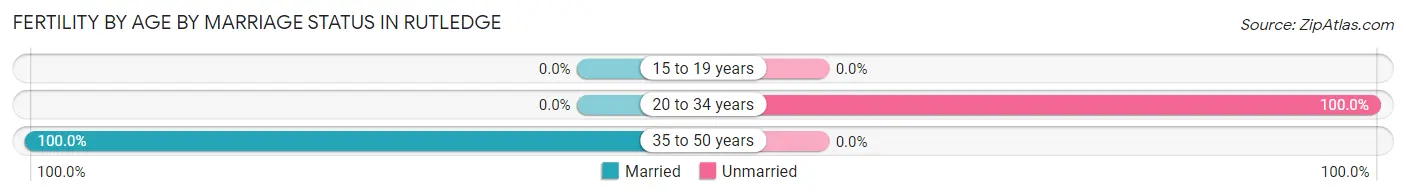
| Age Bracket | Married | Unmarried |
| 15 to 19 years | 0 (0.0%) | 0 (0.0%) |
| 20 to 34 years | 0 (0.0%) | 8 (100.0%) |
| 35 to 50 years | 7 (100.0%) | 0 (0.0%) |
| Total | 7 (46.7%) | 8 (53.3%) |
Fertility by Education in Rutledge
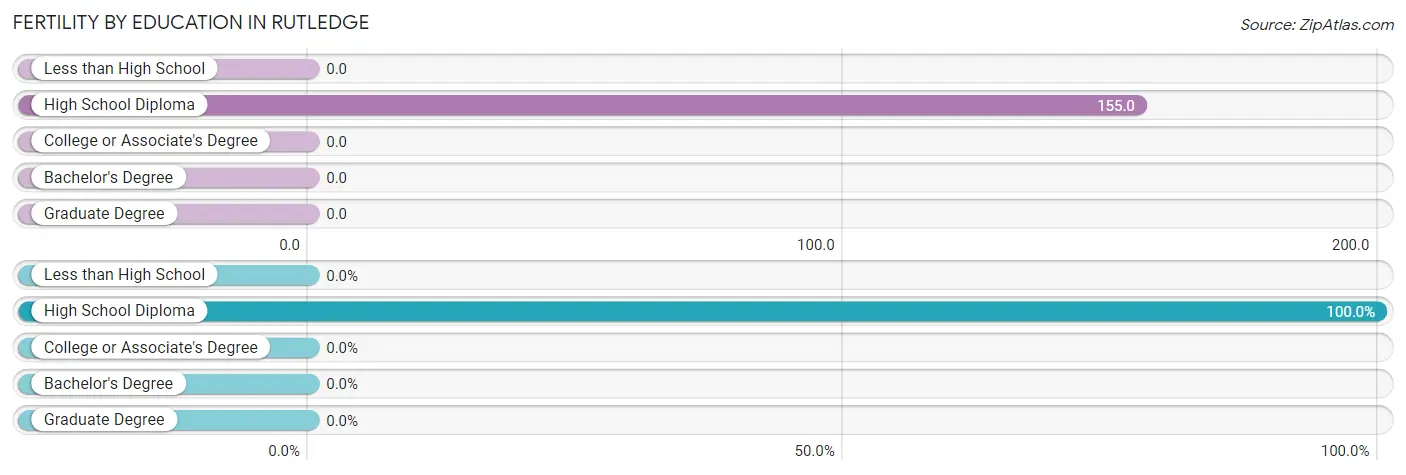
| Educational Attainment | Women with Births | Births / 1,000 Women |
| Less than High School | 0 (0.0%) | 0.0 |
| High School Diploma | 15 (100.0%) | 155.0 |
| College or Associate's Degree | 0 (0.0%) | 0.0 |
| Bachelor's Degree | 0 (0.0%) | 0.0 |
| Graduate Degree | 0 (0.0%) | 0.0 |
| Total | 15 (100.0%) | 51.0 |
Fertility by Education by Marriage Status in Rutledge
53.3% of women with births in Rutledge are unmarried. Women with the educational attainment of high school diploma are most likely to be married with 46.7% of them married at childbirth, while women with the educational attainment of high school diploma are least likely to be married with 53.3% of them unmarried at childbirth.
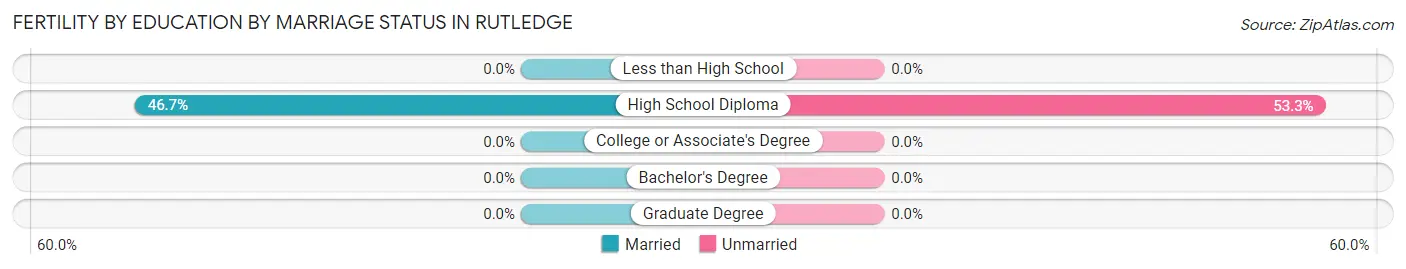
| Educational Attainment | Married | Unmarried |
| Less than High School | 0 (0.0%) | 0 (0.0%) |
| High School Diploma | 7 (46.7%) | 8 (53.3%) |
| College or Associate's Degree | 0 (0.0%) | 0 (0.0%) |
| Bachelor's Degree | 0 (0.0%) | 0 (0.0%) |
| Graduate Degree | 0 (0.0%) | 0 (0.0%) |
| Total | 7 (46.7%) | 8 (53.3%) |
Employment Characteristics in Rutledge
Employment by Class of Employer in Rutledge
Among the 567 employed individuals in Rutledge, private company employees (367 | 64.7%), self-employed (not incorporated) (80 | 14.1%), and not-for-profit organizations (55 | 9.7%) make up the most common classes of employment.
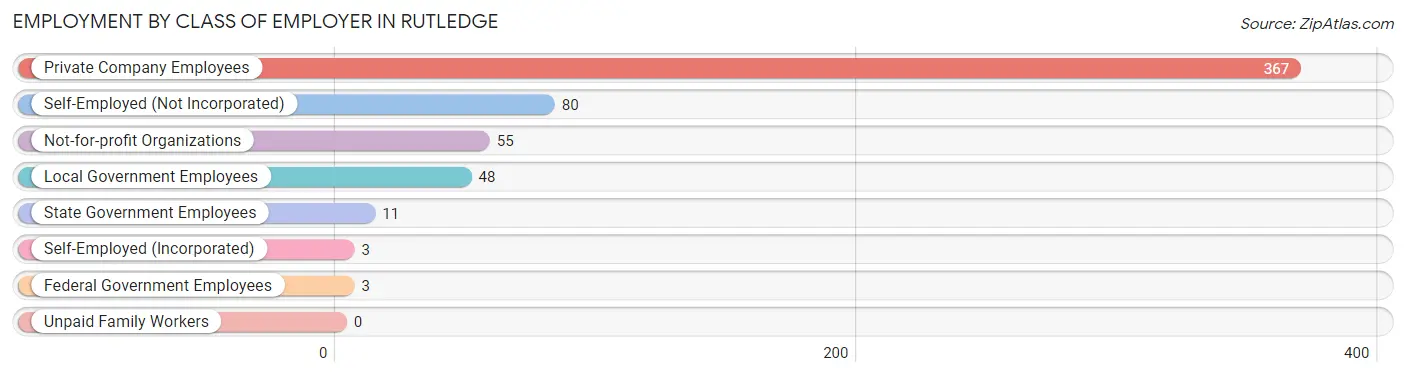
| Employer Class | # Employees | % Employees |
| Private Company Employees | 367 | 64.7% |
| Self-Employed (Incorporated) | 3 | 0.5% |
| Self-Employed (Not Incorporated) | 80 | 14.1% |
| Not-for-profit Organizations | 55 | 9.7% |
| Local Government Employees | 48 | 8.5% |
| State Government Employees | 11 | 1.9% |
| Federal Government Employees | 3 | 0.5% |
| Unpaid Family Workers | 0 | 0.0% |
| Total | 567 | 100.0% |
Employment Status by Age in Rutledge
According to the labor force statistics for Rutledge, out of the total population over 16 years of age (1,312), 47.0% or 617 individuals are in the labor force, with 3.9% or 24 of them unemployed. The age group with the highest labor force participation rate is 20 to 24 years, with 89.7% or 87 individuals in the labor force. Within the labor force, the 16 to 19 years age range has the highest percentage of unemployed individuals, with 20.0% or 4 of them being unemployed.
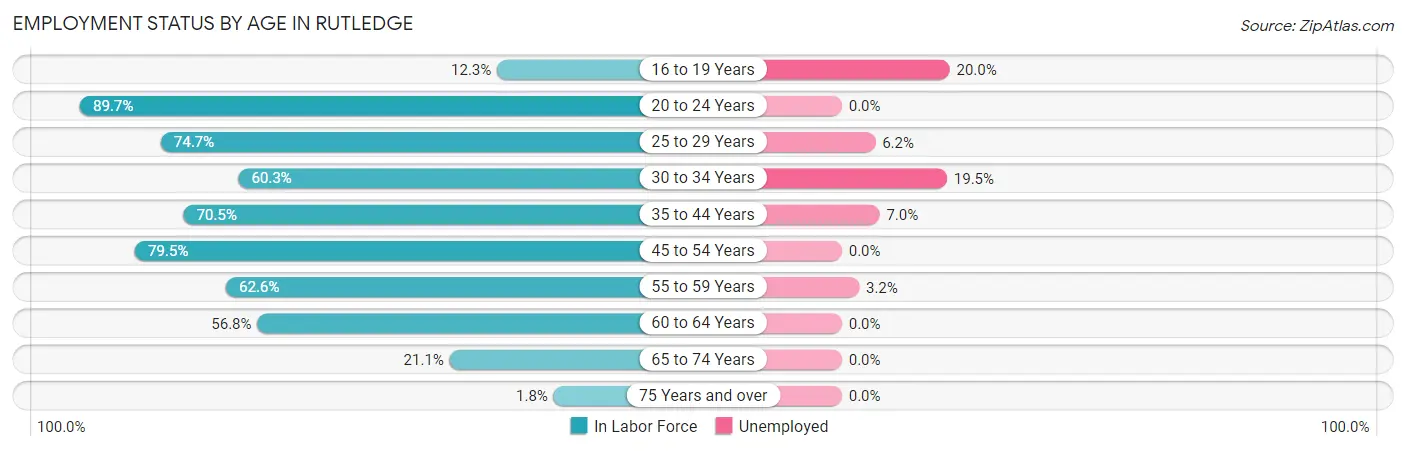
| Age Bracket | In Labor Force | Unemployed |
| 16 to 19 Years | 20 (12.3%) | 4 (20.0%) |
| 20 to 24 Years | 87 (89.7%) | 0 (0.0%) |
| 25 to 29 Years | 65 (74.7%) | 4 (6.2%) |
| 30 to 34 Years | 41 (60.3%) | 8 (19.5%) |
| 35 to 44 Years | 86 (70.5%) | 6 (7.0%) |
| 45 to 54 Years | 151 (79.5%) | 0 (0.0%) |
| 55 to 59 Years | 62 (62.6%) | 2 (3.2%) |
| 60 to 64 Years | 54 (56.8%) | 0 (0.0%) |
| 65 to 74 Years | 47 (21.1%) | 0 (0.0%) |
| 75 Years and over | 3 (1.8%) | 0 (0.0%) |
| Total | 617 (47.0%) | 24 (3.9%) |
Employment Status by Educational Attainment in Rutledge
According to labor force statistics for Rutledge, 69.4% of individuals (459) out of the total population between 25 and 64 years of age (661) are in the labor force, with 4.4% or 20 of them being unemployed. The group with the highest labor force participation rate are those with the educational attainment of bachelor's degree or higher, with 100.0% or 93 individuals in the labor force. Within the labor force, individuals with bachelor's degree or higher education have the highest percentage of unemployment, with 7.5% or 7 of them being unemployed.
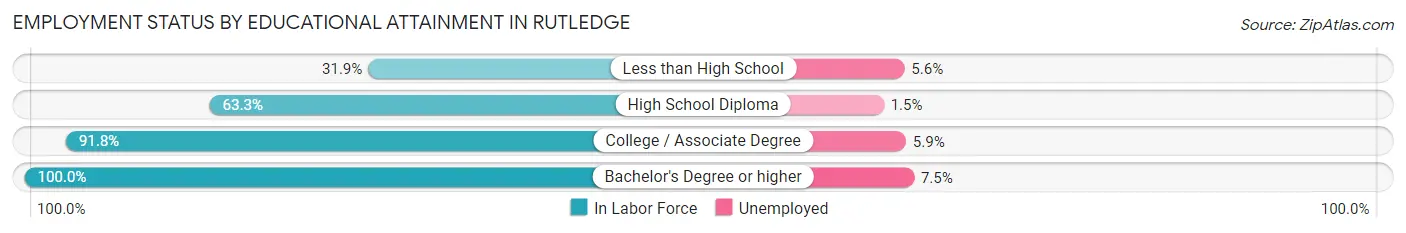
| Educational Attainment | In Labor Force | Unemployed |
| Less than High School | 36 (31.9%) | 6 (5.6%) |
| High School Diploma | 195 (63.3%) | 5 (1.5%) |
| College / Associate Degree | 135 (91.8%) | 9 (5.9%) |
| Bachelor's Degree or higher | 93 (100.0%) | 7 (7.5%) |
| Total | 459 (69.4%) | 29 (4.4%) |
Employment Occupations by Sex in Rutledge
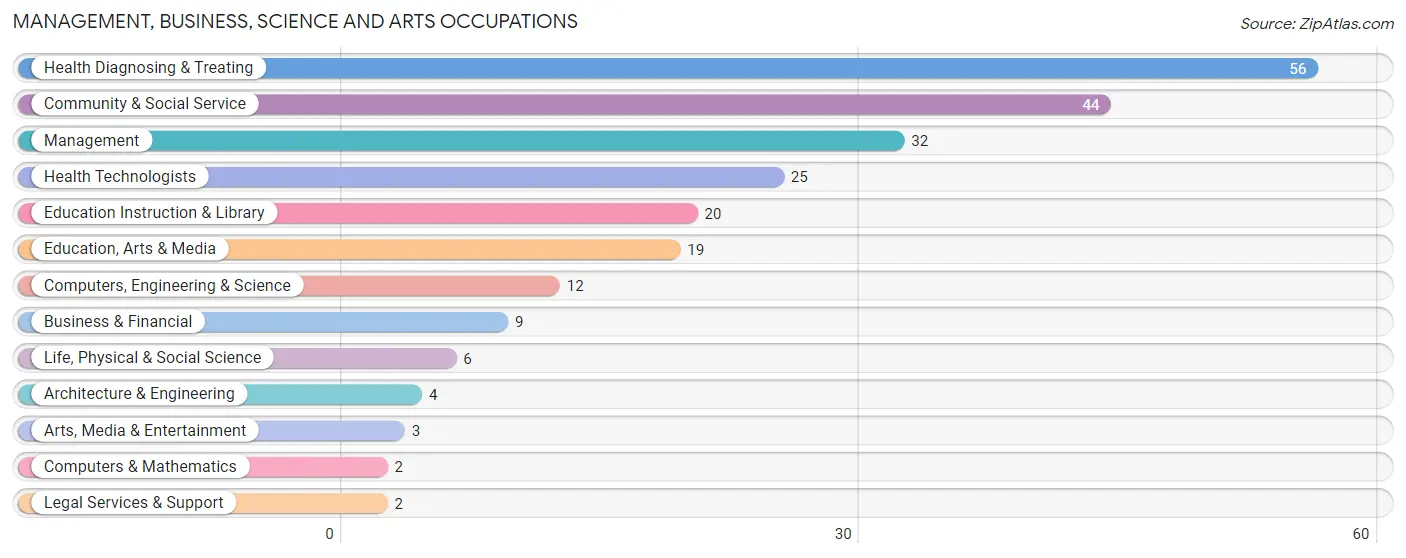
Management, Business, Science and Arts Occupations
The most common Management, Business, Science and Arts occupations in Rutledge are Health Diagnosing & Treating (56 | 9.5%), Community & Social Service (44 | 7.4%), Management (32 | 5.4%), Health Technologists (25 | 4.2%), and Education Instruction & Library (20 | 3.4%).
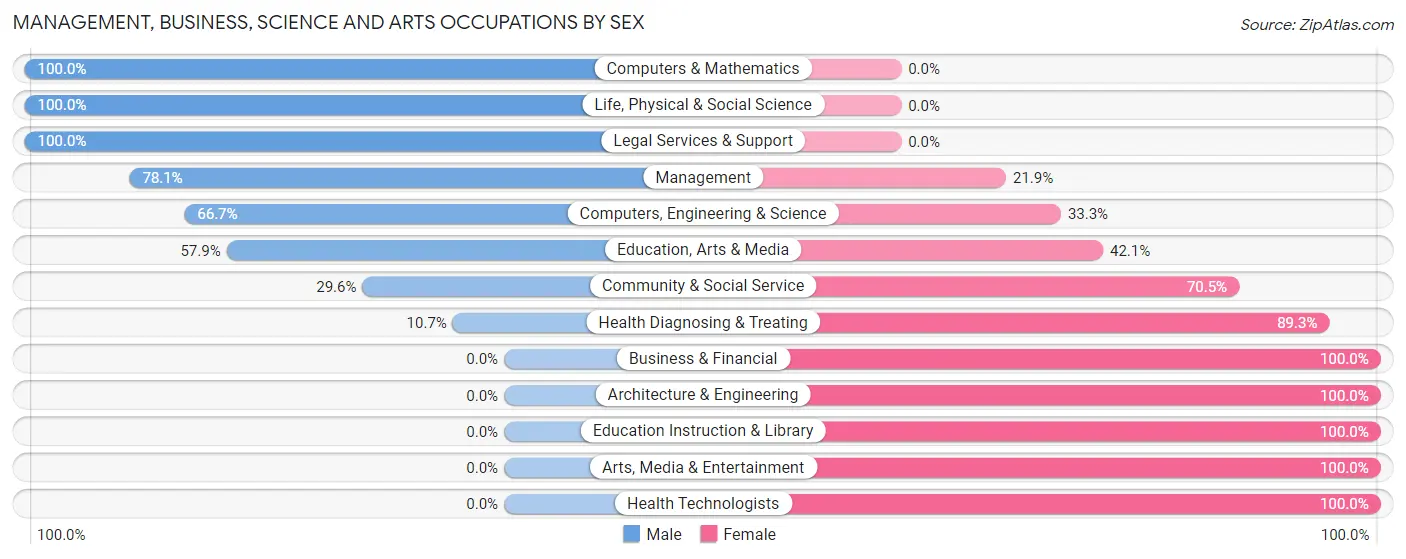
Management, Business, Science and Arts Occupations by Sex
Within the Management, Business, Science and Arts occupations in Rutledge, the most male-oriented occupations are Computers & Mathematics (100.0%), Life, Physical & Social Science (100.0%), and Legal Services & Support (100.0%), while the most female-oriented occupations are Business & Financial (100.0%), Architecture & Engineering (100.0%), and Education Instruction & Library (100.0%).
| Occupation | Male | Female |
| Management | 25 (78.1%) | 7 (21.9%) |
| Business & Financial | 0 (0.0%) | 9 (100.0%) |
| Computers, Engineering & Science | 8 (66.7%) | 4 (33.3%) |
| Computers & Mathematics | 2 (100.0%) | 0 (0.0%) |
| Architecture & Engineering | 0 (0.0%) | 4 (100.0%) |
| Life, Physical & Social Science | 6 (100.0%) | 0 (0.0%) |
| Community & Social Service | 13 (29.5%) | 31 (70.5%) |
| Education, Arts & Media | 11 (57.9%) | 8 (42.1%) |
| Legal Services & Support | 2 (100.0%) | 0 (0.0%) |
| Education Instruction & Library | 0 (0.0%) | 20 (100.0%) |
| Arts, Media & Entertainment | 0 (0.0%) | 3 (100.0%) |
| Health Diagnosing & Treating | 6 (10.7%) | 50 (89.3%) |
| Health Technologists | 0 (0.0%) | 25 (100.0%) |
| Total (Category) | 52 (34.0%) | 101 (66.0%) |
| Total (Overall) | 298 (50.3%) | 294 (49.7%) |
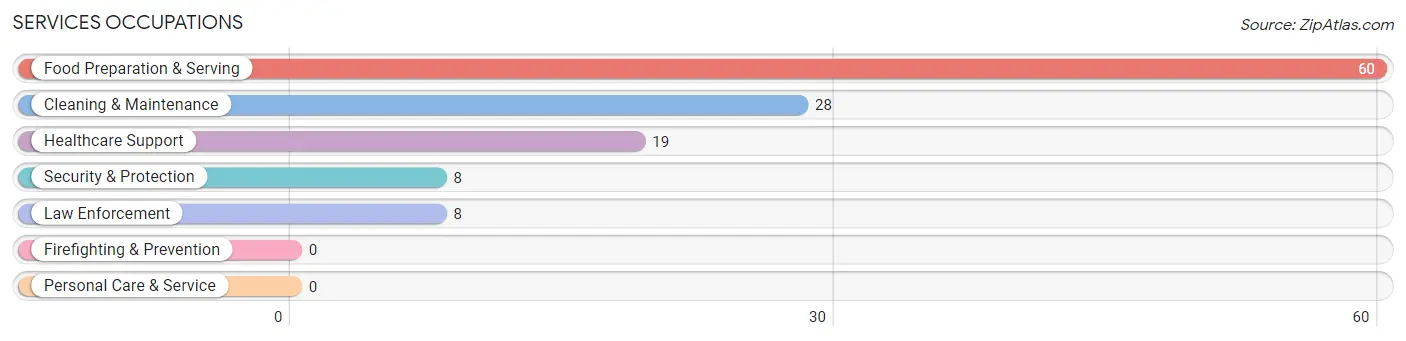
Services Occupations
The most common Services occupations in Rutledge are Food Preparation & Serving (60 | 10.1%), Cleaning & Maintenance (28 | 4.7%), Healthcare Support (19 | 3.2%), Security & Protection (8 | 1.3%), and Law Enforcement (8 | 1.3%).
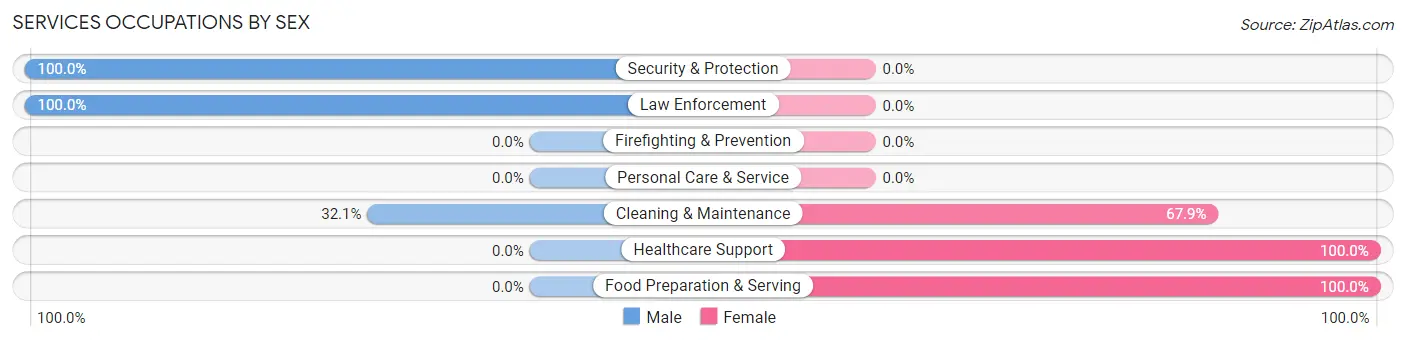
Services Occupations by Sex
Within the Services occupations in Rutledge, the most male-oriented occupations are Security & Protection (100.0%), Law Enforcement (100.0%), and Cleaning & Maintenance (32.1%), while the most female-oriented occupations are Healthcare Support (100.0%), Food Preparation & Serving (100.0%), and Cleaning & Maintenance (67.9%).
| Occupation | Male | Female |
| Healthcare Support | 0 (0.0%) | 19 (100.0%) |
| Security & Protection | 8 (100.0%) | 0 (0.0%) |
| Firefighting & Prevention | 0 (0.0%) | 0 (0.0%) |
| Law Enforcement | 8 (100.0%) | 0 (0.0%) |
| Food Preparation & Serving | 0 (0.0%) | 60 (100.0%) |
| Cleaning & Maintenance | 9 (32.1%) | 19 (67.9%) |
| Personal Care & Service | 0 (0.0%) | 0 (0.0%) |
| Total (Category) | 17 (14.8%) | 98 (85.2%) |
| Total (Overall) | 298 (50.3%) | 294 (49.7%) |
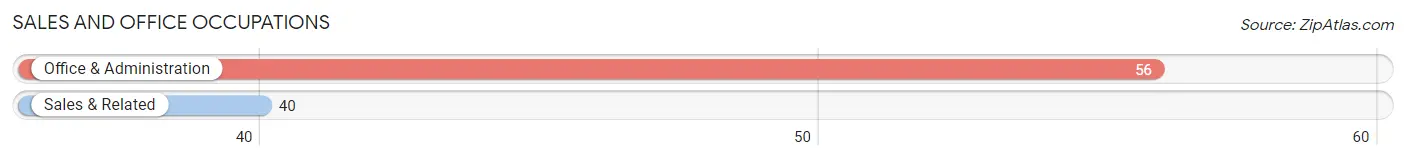
Sales and Office Occupations
The most common Sales and Office occupations in Rutledge are Office & Administration (56 | 9.5%), and Sales & Related (40 | 6.8%).
Sales and Office Occupations by Sex
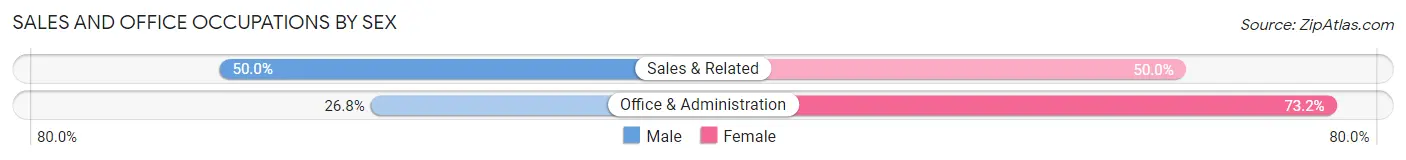
| Occupation | Male | Female |
| Sales & Related | 20 (50.0%) | 20 (50.0%) |
| Office & Administration | 15 (26.8%) | 41 (73.2%) |
| Total (Category) | 35 (36.5%) | 61 (63.5%) |
| Total (Overall) | 298 (50.3%) | 294 (49.7%) |
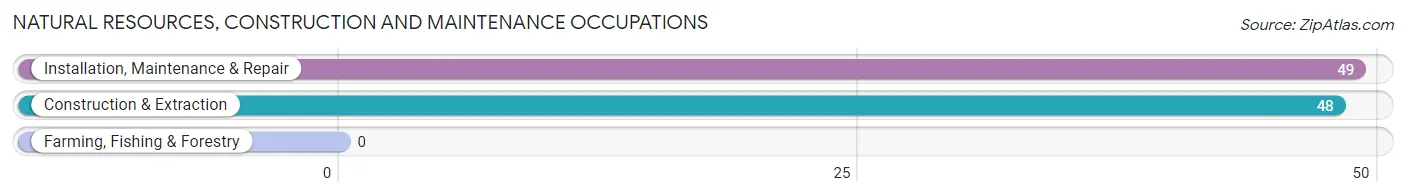
Natural Resources, Construction and Maintenance Occupations
The most common Natural Resources, Construction and Maintenance occupations in Rutledge are Installation, Maintenance & Repair (49 | 8.3%), and Construction & Extraction (48 | 8.1%).
Natural Resources, Construction and Maintenance Occupations by Sex
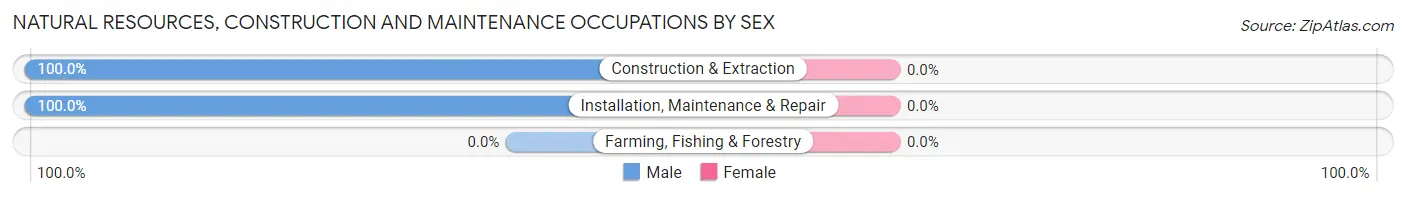
| Occupation | Male | Female |
| Farming, Fishing & Forestry | 0 (0.0%) | 0 (0.0%) |
| Construction & Extraction | 48 (100.0%) | 0 (0.0%) |
| Installation, Maintenance & Repair | 49 (100.0%) | 0 (0.0%) |
| Total (Category) | 97 (100.0%) | 0 (0.0%) |
| Total (Overall) | 298 (50.3%) | 294 (49.7%) |
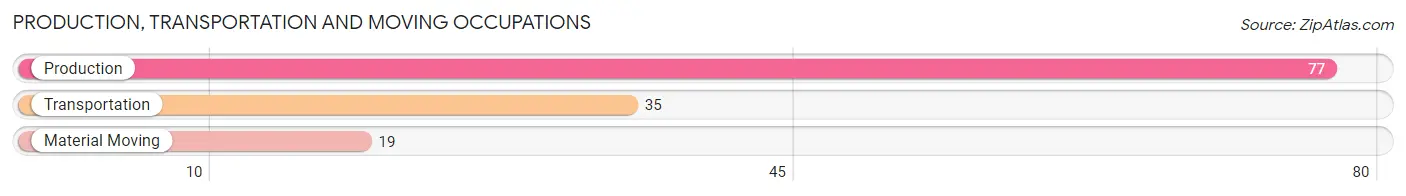
Production, Transportation and Moving Occupations
The most common Production, Transportation and Moving occupations in Rutledge are Production (77 | 13.0%), Transportation (35 | 5.9%), and Material Moving (19 | 3.2%).
Production, Transportation and Moving Occupations by Sex
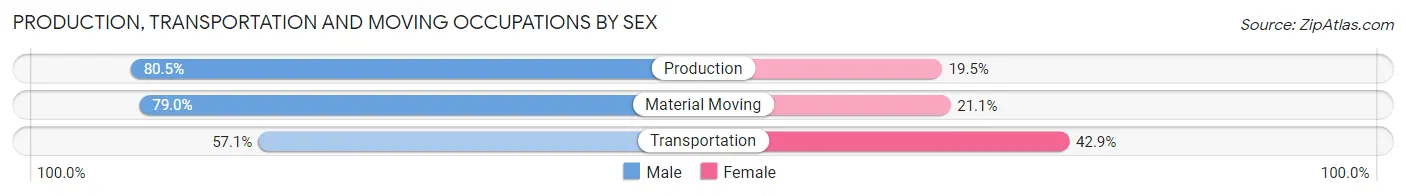
| Occupation | Male | Female |
| Production | 62 (80.5%) | 15 (19.5%) |
| Transportation | 20 (57.1%) | 15 (42.9%) |
| Material Moving | 15 (78.9%) | 4 (21.0%) |
| Total (Category) | 97 (74.1%) | 34 (26.0%) |
| Total (Overall) | 298 (50.3%) | 294 (49.7%) |
Employment Industries by Sex in Rutledge
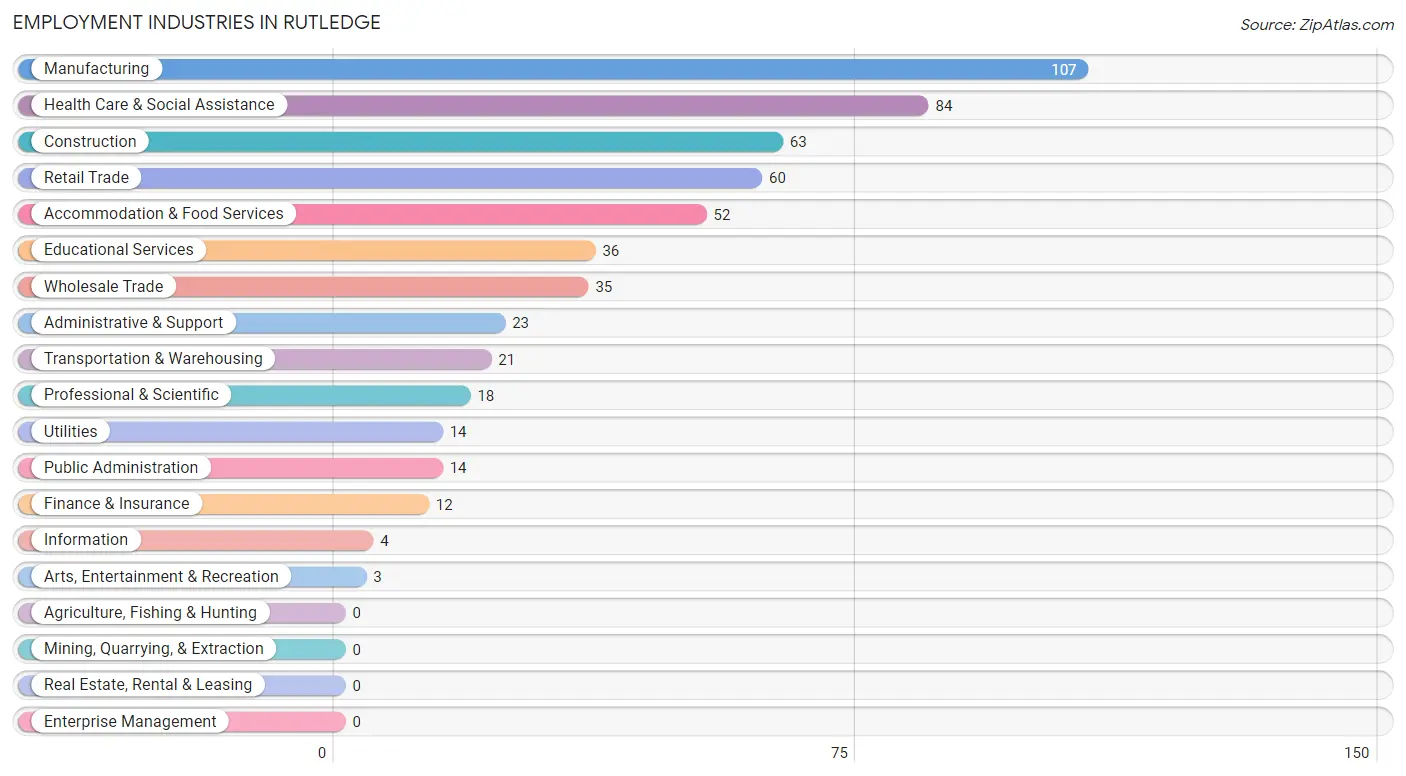
Employment Industries in Rutledge
The major employment industries in Rutledge include Manufacturing (107 | 18.1%), Health Care & Social Assistance (84 | 14.2%), Construction (63 | 10.6%), Retail Trade (60 | 10.1%), and Accommodation & Food Services (52 | 8.8%).
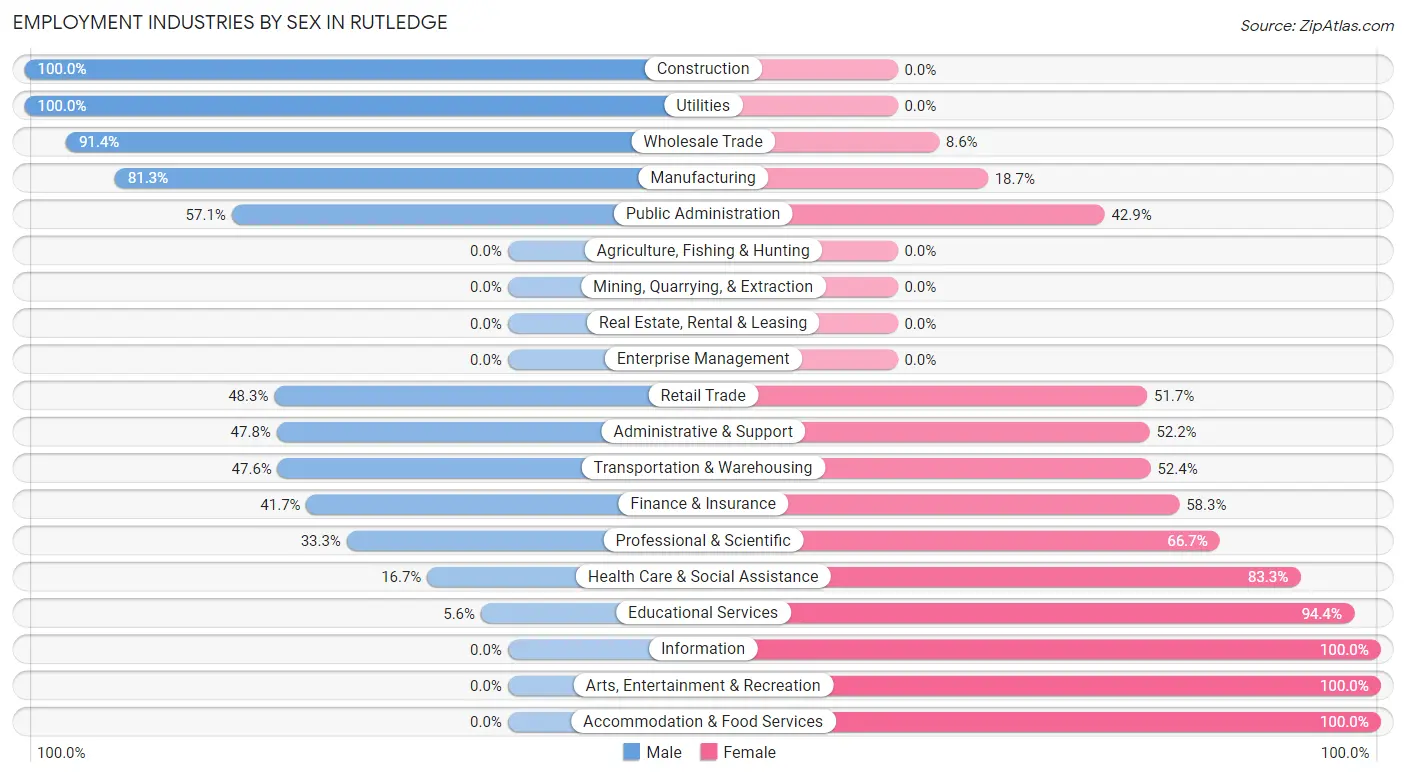
Employment Industries by Sex in Rutledge
The Rutledge industries that see more men than women are Construction (100.0%), Utilities (100.0%), and Wholesale Trade (91.4%), whereas the industries that tend to have a higher number of women are Information (100.0%), Arts, Entertainment & Recreation (100.0%), and Accommodation & Food Services (100.0%).
| Industry | Male | Female |
| Agriculture, Fishing & Hunting | 0 (0.0%) | 0 (0.0%) |
| Mining, Quarrying, & Extraction | 0 (0.0%) | 0 (0.0%) |
| Construction | 63 (100.0%) | 0 (0.0%) |
| Manufacturing | 87 (81.3%) | 20 (18.7%) |
| Wholesale Trade | 32 (91.4%) | 3 (8.6%) |
| Retail Trade | 29 (48.3%) | 31 (51.7%) |
| Transportation & Warehousing | 10 (47.6%) | 11 (52.4%) |
| Utilities | 14 (100.0%) | 0 (0.0%) |
| Information | 0 (0.0%) | 4 (100.0%) |
| Finance & Insurance | 5 (41.7%) | 7 (58.3%) |
| Real Estate, Rental & Leasing | 0 (0.0%) | 0 (0.0%) |
| Professional & Scientific | 6 (33.3%) | 12 (66.7%) |
| Enterprise Management | 0 (0.0%) | 0 (0.0%) |
| Administrative & Support | 11 (47.8%) | 12 (52.2%) |
| Educational Services | 2 (5.6%) | 34 (94.4%) |
| Health Care & Social Assistance | 14 (16.7%) | 70 (83.3%) |
| Arts, Entertainment & Recreation | 0 (0.0%) | 3 (100.0%) |
| Accommodation & Food Services | 0 (0.0%) | 52 (100.0%) |
| Public Administration | 8 (57.1%) | 6 (42.9%) |
| Total | 298 (50.3%) | 294 (49.7%) |
Education in Rutledge
School Enrollment in Rutledge
The most common levels of schooling among the 344 students in Rutledge are high school (178 | 51.7%), middle school (65 | 18.9%), and elementary school (48 | 14.0%).
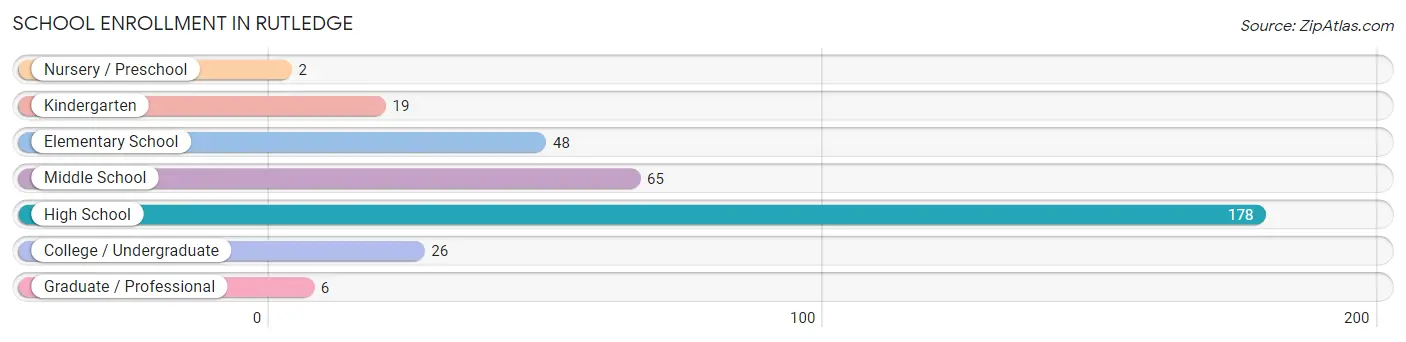
| School Level | # Students | % Students |
| Nursery / Preschool | 2 | 0.6% |
| Kindergarten | 19 | 5.5% |
| Elementary School | 48 | 14.0% |
| Middle School | 65 | 18.9% |
| High School | 178 | 51.7% |
| College / Undergraduate | 26 | 7.6% |
| Graduate / Professional | 6 | 1.7% |
| Total | 344 | 100.0% |
School Enrollment by Age by Funding Source in Rutledge
Out of a total of 344 students who are enrolled in schools in Rutledge, 24 (7.0%) attend a private institution, while the remaining 320 (93.0%) are enrolled in public schools. The age group of 20 to 24 year olds has the highest likelihood of being enrolled in private schools, with 6 (40.0% in the age bracket) enrolled. Conversely, the age group of 3 to 4 year olds has the lowest likelihood of being enrolled in a private school, with 2 (100.0% in the age bracket) attending a public institution.
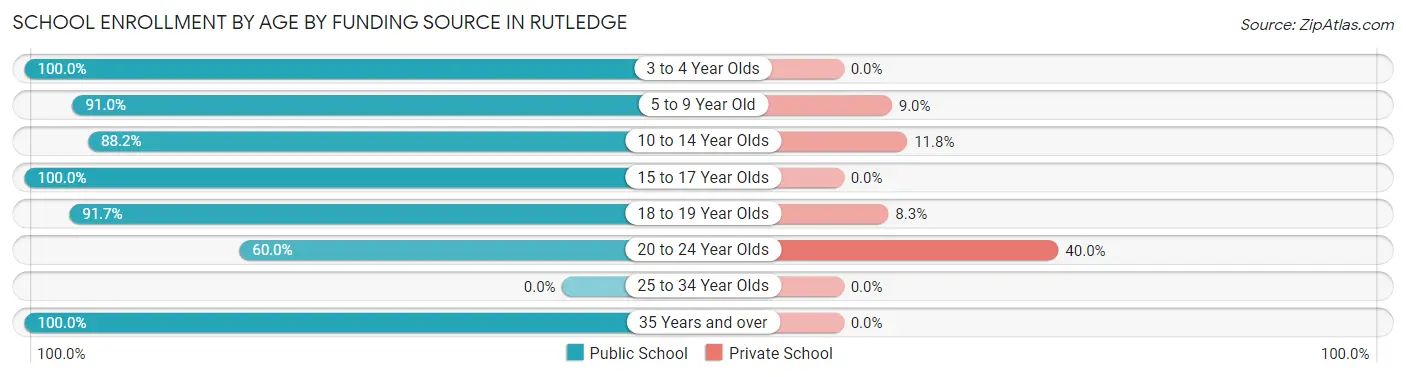
| Age Bracket | Public School | Private School |
| 3 to 4 Year Olds | 2 (100.0%) | 0 (0.0%) |
| 5 to 9 Year Old | 61 (91.0%) | 6 (9.0%) |
| 10 to 14 Year Olds | 67 (88.2%) | 9 (11.8%) |
| 15 to 17 Year Olds | 144 (100.0%) | 0 (0.0%) |
| 18 to 19 Year Olds | 33 (91.7%) | 3 (8.3%) |
| 20 to 24 Year Olds | 9 (60.0%) | 6 (40.0%) |
| 25 to 34 Year Olds | 0 (0.0%) | 0 (0.0%) |
| 35 Years and over | 4 (100.0%) | 0 (0.0%) |
| Total | 320 (93.0%) | 24 (7.0%) |
Educational Attainment by Field of Study in Rutledge
Business (33 | 28.0%), education (27 | 22.9%), arts & humanities (13 | 11.0%), science & technology (11 | 9.3%), and engineering (8 | 6.8%) are the most common fields of study among 118 individuals in Rutledge who have obtained a bachelor's degree or higher.
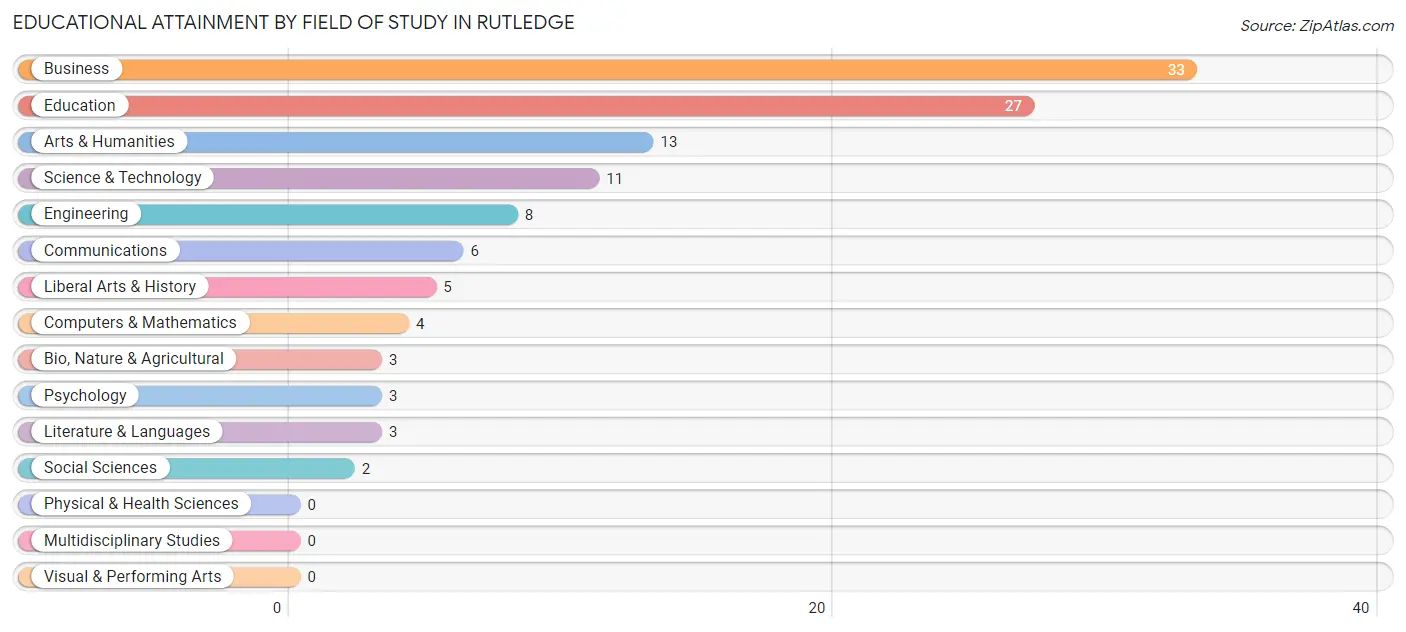
| Field of Study | # Graduates | % Graduates |
| Computers & Mathematics | 4 | 3.4% |
| Bio, Nature & Agricultural | 3 | 2.5% |
| Physical & Health Sciences | 0 | 0.0% |
| Psychology | 3 | 2.5% |
| Social Sciences | 2 | 1.7% |
| Engineering | 8 | 6.8% |
| Multidisciplinary Studies | 0 | 0.0% |
| Science & Technology | 11 | 9.3% |
| Business | 33 | 28.0% |
| Education | 27 | 22.9% |
| Literature & Languages | 3 | 2.5% |
| Liberal Arts & History | 5 | 4.2% |
| Visual & Performing Arts | 0 | 0.0% |
| Communications | 6 | 5.1% |
| Arts & Humanities | 13 | 11.0% |
| Total | 118 | 100.0% |
Transportation & Commute in Rutledge
Vehicle Availability by Sex in Rutledge
The most prevalent vehicle ownership categories in Rutledge are males with 2 vehicles (91, accounting for 32.3%) and females with 2 vehicles (82, making up 31.9%).
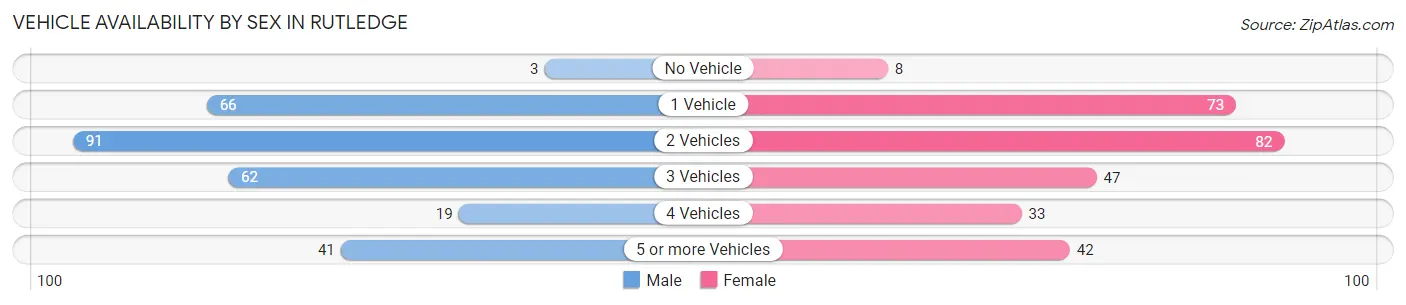
| Vehicles Available | Male | Female |
| No Vehicle | 3 (1.1%) | 8 (2.8%) |
| 1 Vehicle | 66 (23.4%) | 73 (25.6%) |
| 2 Vehicles | 91 (32.3%) | 82 (28.8%) |
| 3 Vehicles | 62 (22.0%) | 47 (16.5%) |
| 4 Vehicles | 19 (6.7%) | 33 (11.6%) |
| 5 or more Vehicles | 41 (14.5%) | 42 (14.7%) |
| Total | 282 (100.0%) | 285 (100.0%) |
Commute Time in Rutledge
The most frequently occuring commute durations in Rutledge are 5 to 9 minutes (115 commuters, 21.7%), 45 to 59 minutes (100 commuters, 18.8%), and 30 to 34 minutes (65 commuters, 12.2%).
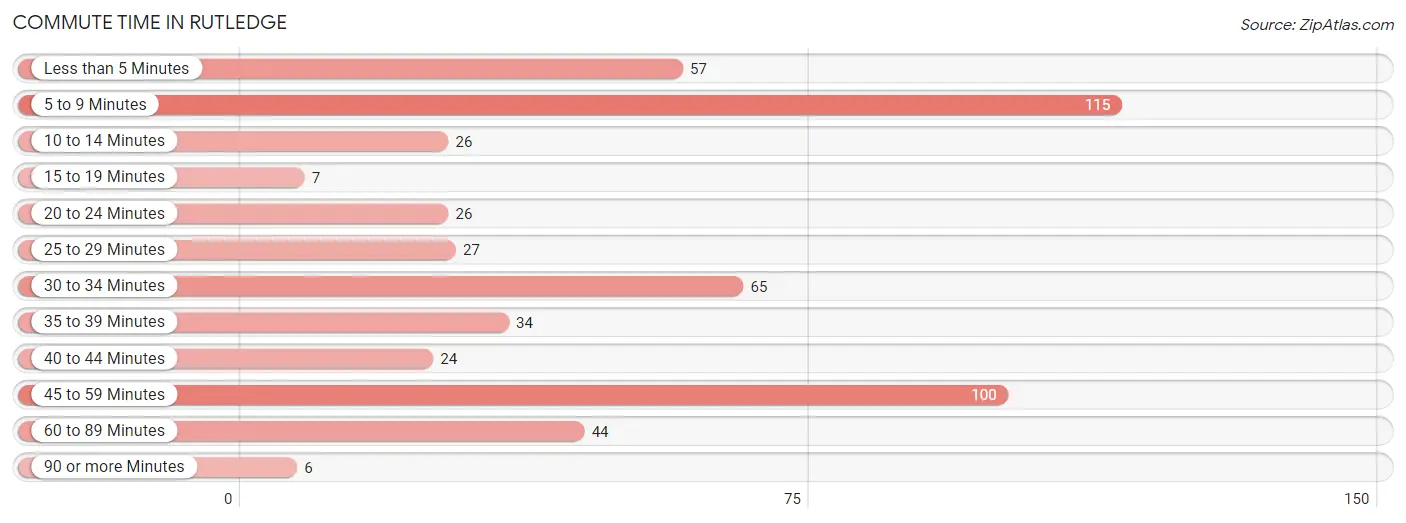
| Commute Time | # Commuters | % Commuters |
| Less than 5 Minutes | 57 | 10.7% |
| 5 to 9 Minutes | 115 | 21.7% |
| 10 to 14 Minutes | 26 | 4.9% |
| 15 to 19 Minutes | 7 | 1.3% |
| 20 to 24 Minutes | 26 | 4.9% |
| 25 to 29 Minutes | 27 | 5.1% |
| 30 to 34 Minutes | 65 | 12.2% |
| 35 to 39 Minutes | 34 | 6.4% |
| 40 to 44 Minutes | 24 | 4.5% |
| 45 to 59 Minutes | 100 | 18.8% |
| 60 to 89 Minutes | 44 | 8.3% |
| 90 or more Minutes | 6 | 1.1% |
Commute Time by Sex in Rutledge
The most common commute times in Rutledge are 5 to 9 minutes (57 commuters, 22.2%) for males and 5 to 9 minutes (58 commuters, 21.2%) for females.
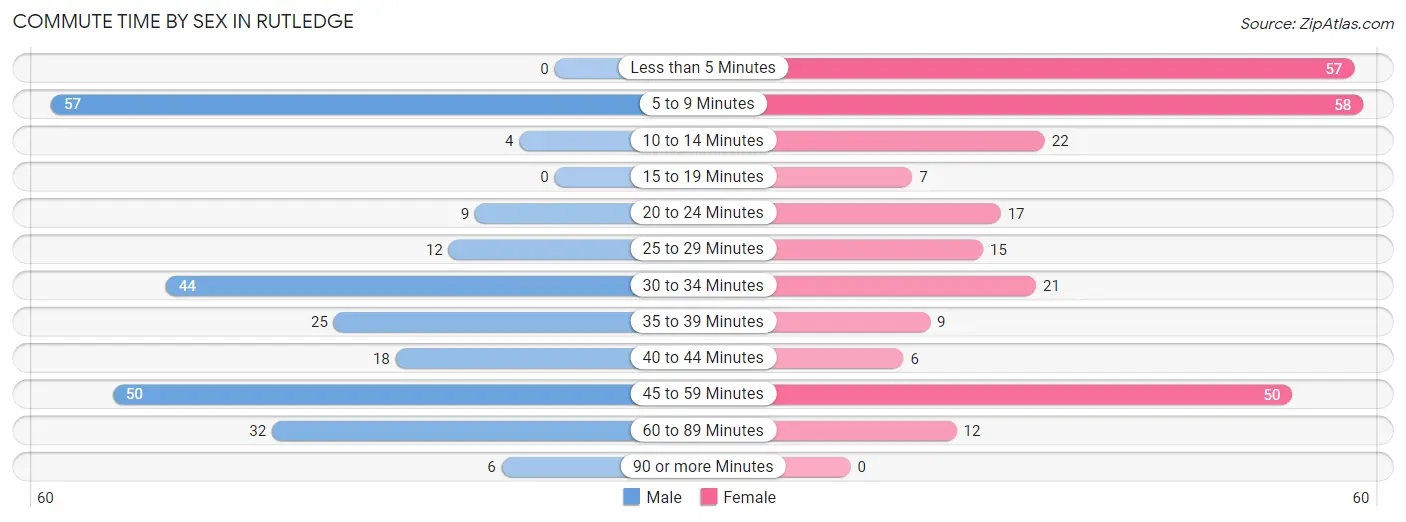
| Commute Time | Male | Female |
| Less than 5 Minutes | 0 (0.0%) | 57 (20.8%) |
| 5 to 9 Minutes | 57 (22.2%) | 58 (21.2%) |
| 10 to 14 Minutes | 4 (1.6%) | 22 (8.0%) |
| 15 to 19 Minutes | 0 (0.0%) | 7 (2.5%) |
| 20 to 24 Minutes | 9 (3.5%) | 17 (6.2%) |
| 25 to 29 Minutes | 12 (4.7%) | 15 (5.5%) |
| 30 to 34 Minutes | 44 (17.1%) | 21 (7.7%) |
| 35 to 39 Minutes | 25 (9.7%) | 9 (3.3%) |
| 40 to 44 Minutes | 18 (7.0%) | 6 (2.2%) |
| 45 to 59 Minutes | 50 (19.5%) | 50 (18.2%) |
| 60 to 89 Minutes | 32 (12.4%) | 12 (4.4%) |
| 90 or more Minutes | 6 (2.3%) | 0 (0.0%) |
Time of Departure to Work by Sex in Rutledge
The most frequent times of departure to work in Rutledge are 7:00 AM to 7:29 AM (73, 28.4%) for males and 7:30 AM to 7:59 AM (71, 25.9%) for females.
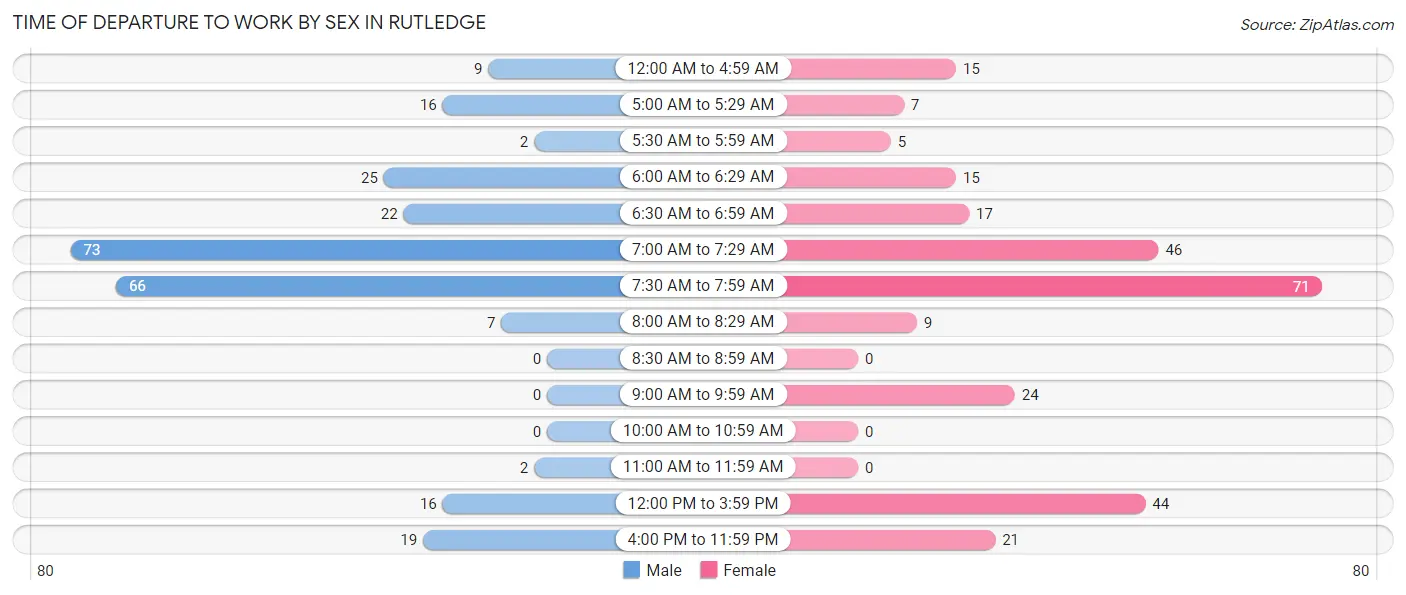
| Time of Departure | Male | Female |
| 12:00 AM to 4:59 AM | 9 (3.5%) | 15 (5.5%) |
| 5:00 AM to 5:29 AM | 16 (6.2%) | 7 (2.5%) |
| 5:30 AM to 5:59 AM | 2 (0.8%) | 5 (1.8%) |
| 6:00 AM to 6:29 AM | 25 (9.7%) | 15 (5.5%) |
| 6:30 AM to 6:59 AM | 22 (8.6%) | 17 (6.2%) |
| 7:00 AM to 7:29 AM | 73 (28.4%) | 46 (16.8%) |
| 7:30 AM to 7:59 AM | 66 (25.7%) | 71 (25.9%) |
| 8:00 AM to 8:29 AM | 7 (2.7%) | 9 (3.3%) |
| 8:30 AM to 8:59 AM | 0 (0.0%) | 0 (0.0%) |
| 9:00 AM to 9:59 AM | 0 (0.0%) | 24 (8.8%) |
| 10:00 AM to 10:59 AM | 0 (0.0%) | 0 (0.0%) |
| 11:00 AM to 11:59 AM | 2 (0.8%) | 0 (0.0%) |
| 12:00 PM to 3:59 PM | 16 (6.2%) | 44 (16.1%) |
| 4:00 PM to 11:59 PM | 19 (7.4%) | 21 (7.7%) |
| Total | 257 (100.0%) | 274 (100.0%) |
Housing Occupancy in Rutledge
Occupancy by Ownership in Rutledge
Of the total 583 dwellings in Rutledge, owner-occupied units account for 292 (50.1%), while renter-occupied units make up 291 (49.9%).
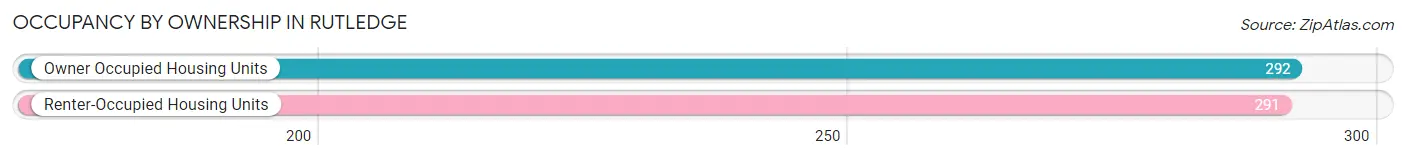
| Occupancy | # Housing Units | % Housing Units |
| Owner Occupied Housing Units | 292 | 50.1% |
| Renter-Occupied Housing Units | 291 | 49.9% |
| Total Occupied Housing Units | 583 | 100.0% |
Occupancy by Household Size in Rutledge
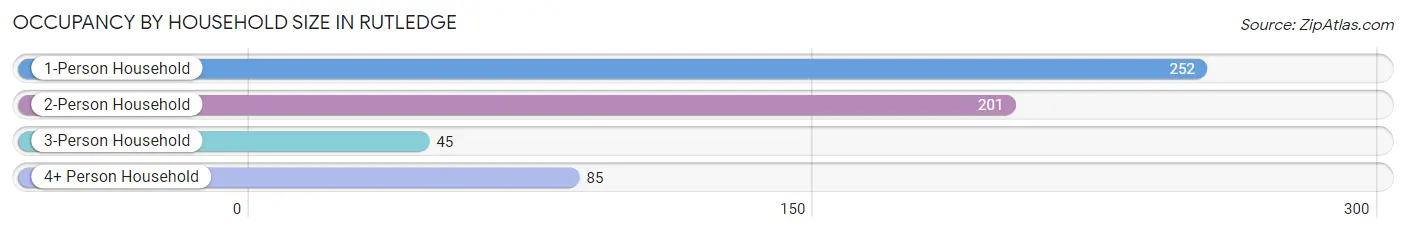
| Household Size | # Housing Units | % Housing Units |
| 1-Person Household | 252 | 43.2% |
| 2-Person Household | 201 | 34.5% |
| 3-Person Household | 45 | 7.7% |
| 4+ Person Household | 85 | 14.6% |
| Total Housing Units | 583 | 100.0% |
Occupancy by Ownership by Household Size in Rutledge
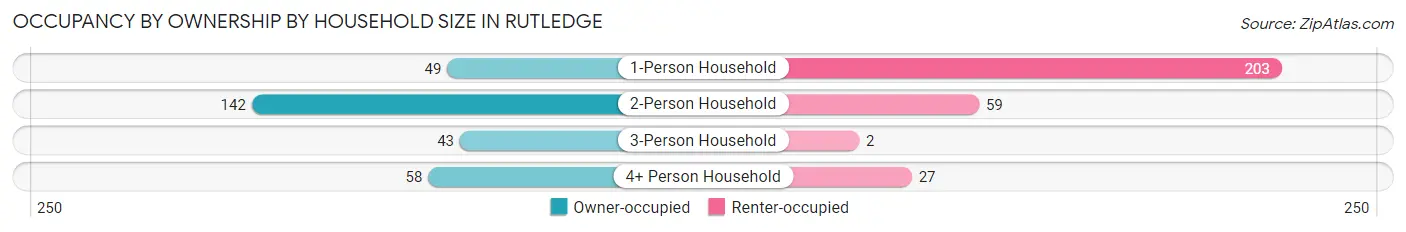
| Household Size | Owner-occupied | Renter-occupied |
| 1-Person Household | 49 (19.4%) | 203 (80.6%) |
| 2-Person Household | 142 (70.7%) | 59 (29.3%) |
| 3-Person Household | 43 (95.6%) | 2 (4.4%) |
| 4+ Person Household | 58 (68.2%) | 27 (31.8%) |
| Total Housing Units | 292 (50.1%) | 291 (49.9%) |
Occupancy by Educational Attainment in Rutledge
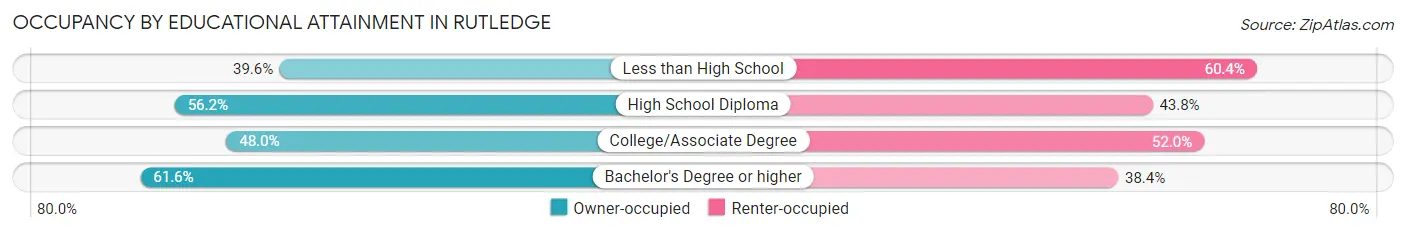
| Household Size | Owner-occupied | Renter-occupied |
| Less than High School | 67 (39.6%) | 102 (60.4%) |
| High School Diploma | 100 (56.2%) | 78 (43.8%) |
| College/Associate Degree | 72 (48.0%) | 78 (52.0%) |
| Bachelor's Degree or higher | 53 (61.6%) | 33 (38.4%) |
Occupancy by Age of Householder in Rutledge
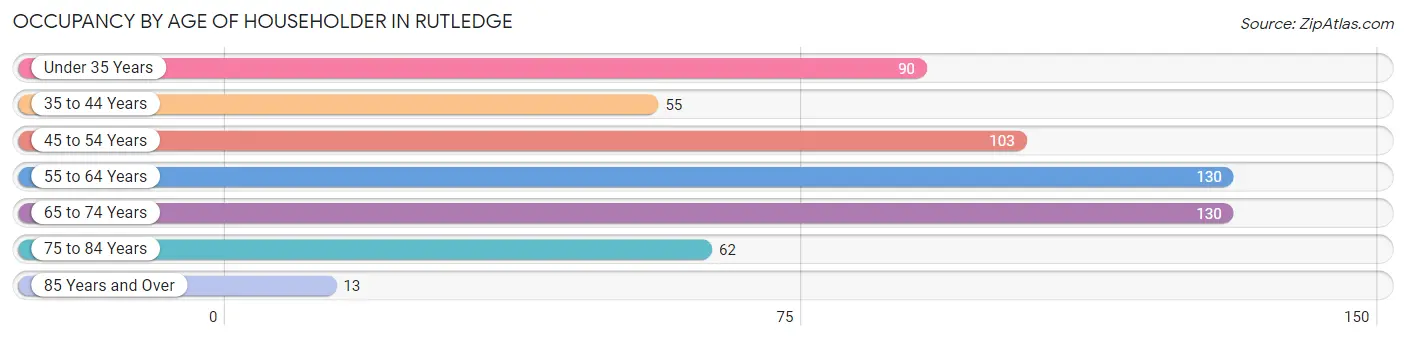
| Age Bracket | # Households | % Households |
| Under 35 Years | 90 | 15.4% |
| 35 to 44 Years | 55 | 9.4% |
| 45 to 54 Years | 103 | 17.7% |
| 55 to 64 Years | 130 | 22.3% |
| 65 to 74 Years | 130 | 22.3% |
| 75 to 84 Years | 62 | 10.6% |
| 85 Years and Over | 13 | 2.2% |
| Total | 583 | 100.0% |
Housing Finances in Rutledge
Median Income by Occupancy in Rutledge
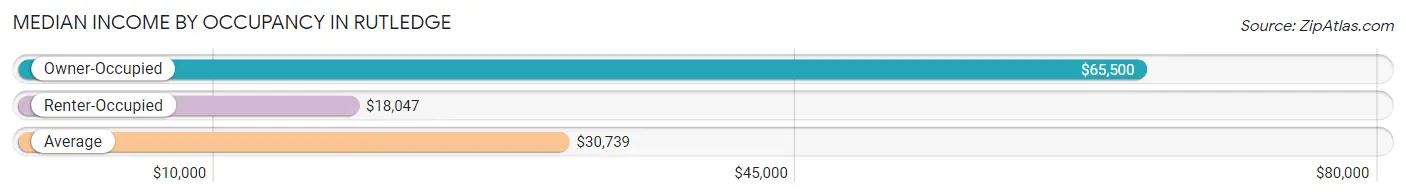
| Occupancy Type | # Households | Median Income |
| Owner-Occupied | 292 (50.1%) | $65,500 |
| Renter-Occupied | 291 (49.9%) | $18,047 |
| Average | 583 (100.0%) | $30,739 |
Occupancy by Householder Income Bracket in Rutledge
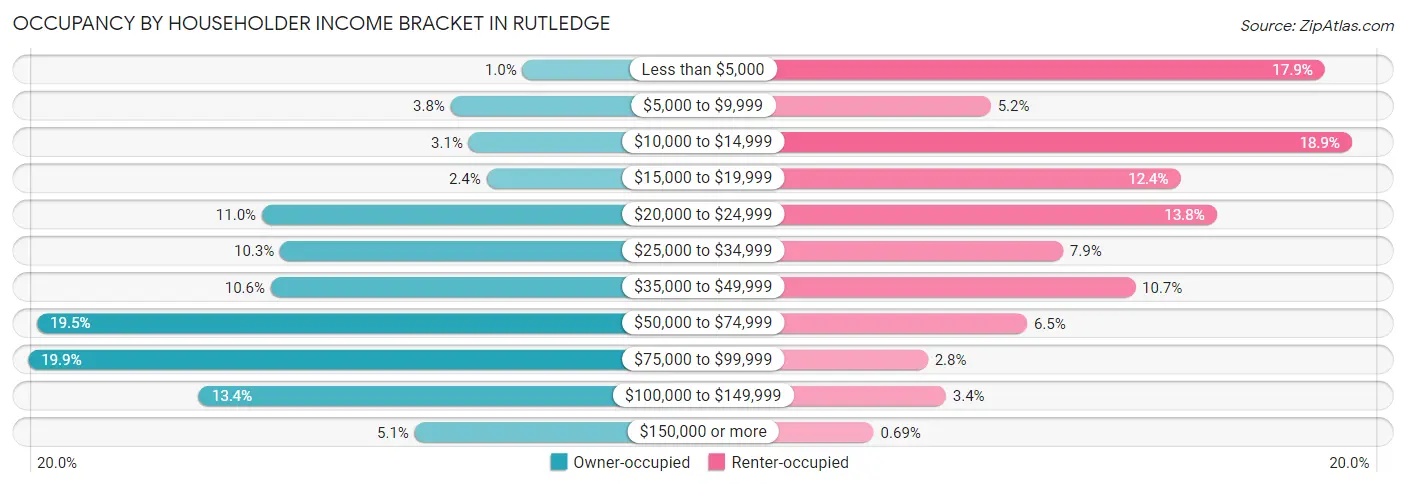
| Income Bracket | Owner-occupied | Renter-occupied |
| Less than $5,000 | 3 (1.0%) | 52 (17.9%) |
| $5,000 to $9,999 | 11 (3.8%) | 15 (5.1%) |
| $10,000 to $14,999 | 9 (3.1%) | 55 (18.9%) |
| $15,000 to $19,999 | 7 (2.4%) | 36 (12.4%) |
| $20,000 to $24,999 | 32 (11.0%) | 40 (13.8%) |
| $25,000 to $34,999 | 30 (10.3%) | 23 (7.9%) |
| $35,000 to $49,999 | 31 (10.6%) | 31 (10.6%) |
| $50,000 to $74,999 | 57 (19.5%) | 19 (6.5%) |
| $75,000 to $99,999 | 58 (19.9%) | 8 (2.8%) |
| $100,000 to $149,999 | 39 (13.4%) | 10 (3.4%) |
| $150,000 or more | 15 (5.1%) | 2 (0.7%) |
| Total | 292 (100.0%) | 291 (100.0%) |
Monthly Housing Cost Tiers in Rutledge
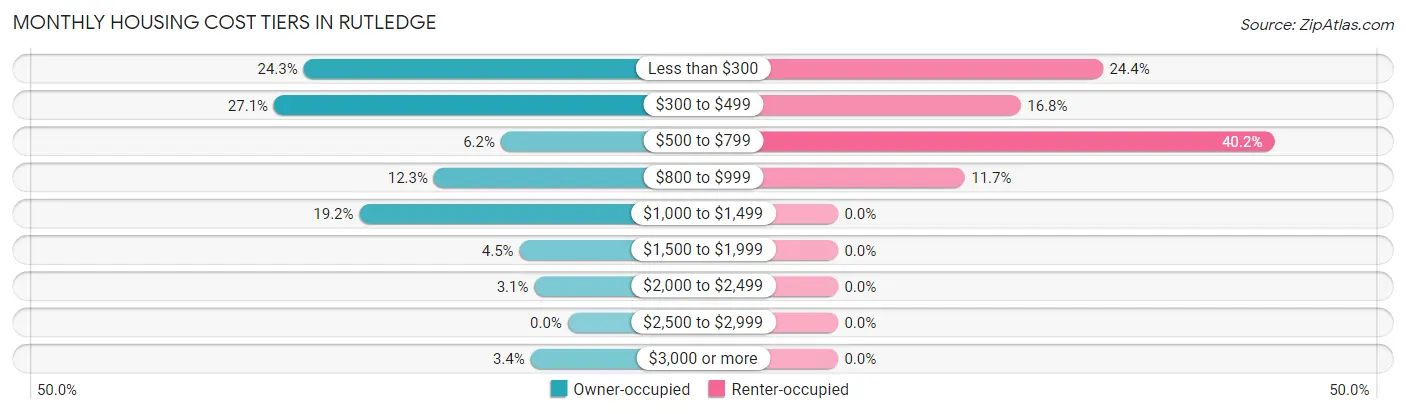
| Monthly Cost | Owner-occupied | Renter-occupied |
| Less than $300 | 71 (24.3%) | 71 (24.4%) |
| $300 to $499 | 79 (27.1%) | 49 (16.8%) |
| $500 to $799 | 18 (6.2%) | 117 (40.2%) |
| $800 to $999 | 36 (12.3%) | 34 (11.7%) |
| $1,000 to $1,499 | 56 (19.2%) | 0 (0.0%) |
| $1,500 to $1,999 | 13 (4.4%) | 0 (0.0%) |
| $2,000 to $2,499 | 9 (3.1%) | 0 (0.0%) |
| $2,500 to $2,999 | 0 (0.0%) | 0 (0.0%) |
| $3,000 or more | 10 (3.4%) | 0 (0.0%) |
| Total | 292 (100.0%) | 291 (100.0%) |
Physical Housing Characteristics in Rutledge
Housing Structures in Rutledge
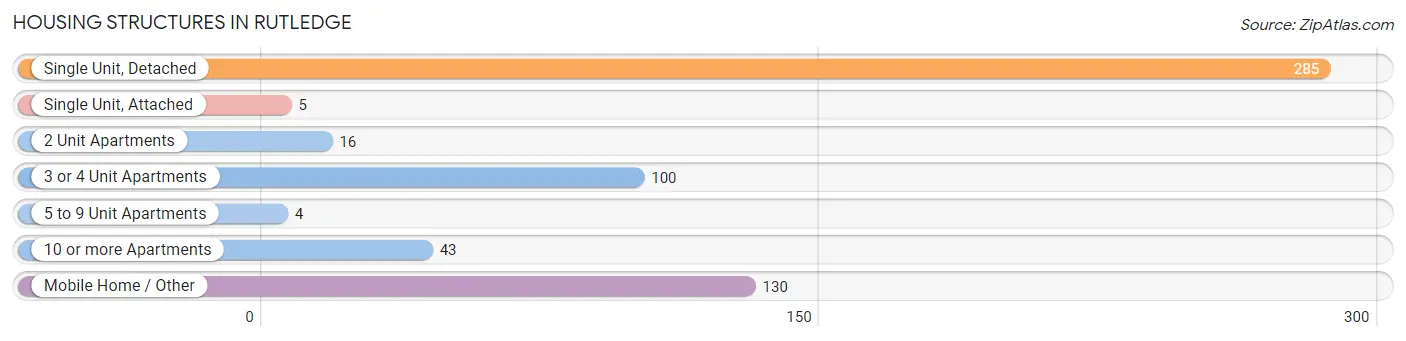
| Structure Type | # Housing Units | % Housing Units |
| Single Unit, Detached | 285 | 48.9% |
| Single Unit, Attached | 5 | 0.9% |
| 2 Unit Apartments | 16 | 2.7% |
| 3 or 4 Unit Apartments | 100 | 17.2% |
| 5 to 9 Unit Apartments | 4 | 0.7% |
| 10 or more Apartments | 43 | 7.4% |
| Mobile Home / Other | 130 | 22.3% |
| Total | 583 | 100.0% |
Housing Structures by Occupancy in Rutledge
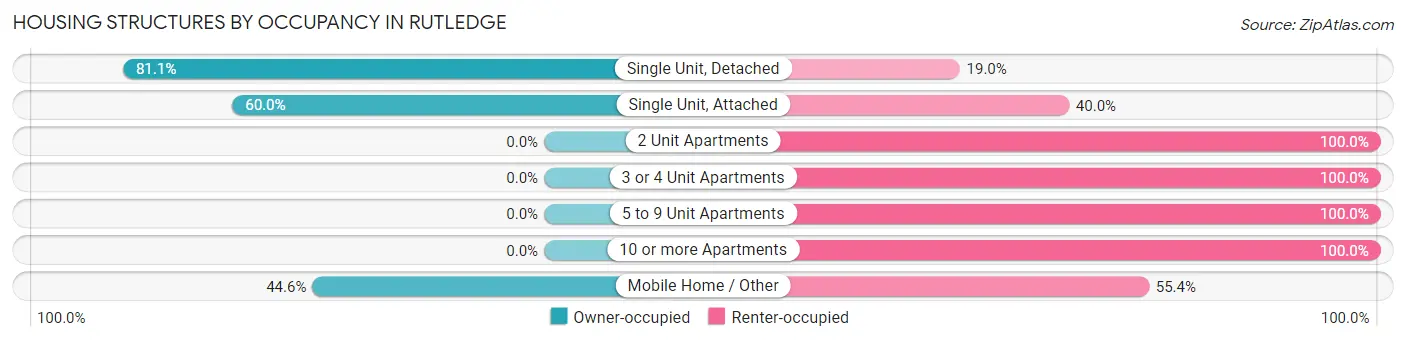
| Structure Type | Owner-occupied | Renter-occupied |
| Single Unit, Detached | 231 (81.0%) | 54 (19.0%) |
| Single Unit, Attached | 3 (60.0%) | 2 (40.0%) |
| 2 Unit Apartments | 0 (0.0%) | 16 (100.0%) |
| 3 or 4 Unit Apartments | 0 (0.0%) | 100 (100.0%) |
| 5 to 9 Unit Apartments | 0 (0.0%) | 4 (100.0%) |
| 10 or more Apartments | 0 (0.0%) | 43 (100.0%) |
| Mobile Home / Other | 58 (44.6%) | 72 (55.4%) |
| Total | 292 (50.1%) | 291 (49.9%) |
Housing Structures by Number of Rooms in Rutledge
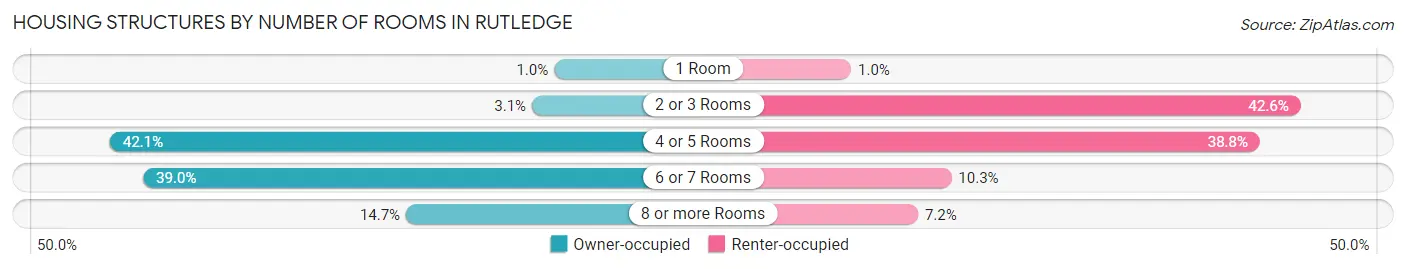
| Number of Rooms | Owner-occupied | Renter-occupied |
| 1 Room | 3 (1.0%) | 3 (1.0%) |
| 2 or 3 Rooms | 9 (3.1%) | 124 (42.6%) |
| 4 or 5 Rooms | 123 (42.1%) | 113 (38.8%) |
| 6 or 7 Rooms | 114 (39.0%) | 30 (10.3%) |
| 8 or more Rooms | 43 (14.7%) | 21 (7.2%) |
| Total | 292 (100.0%) | 291 (100.0%) |
Housing Structure by Heating Type in Rutledge
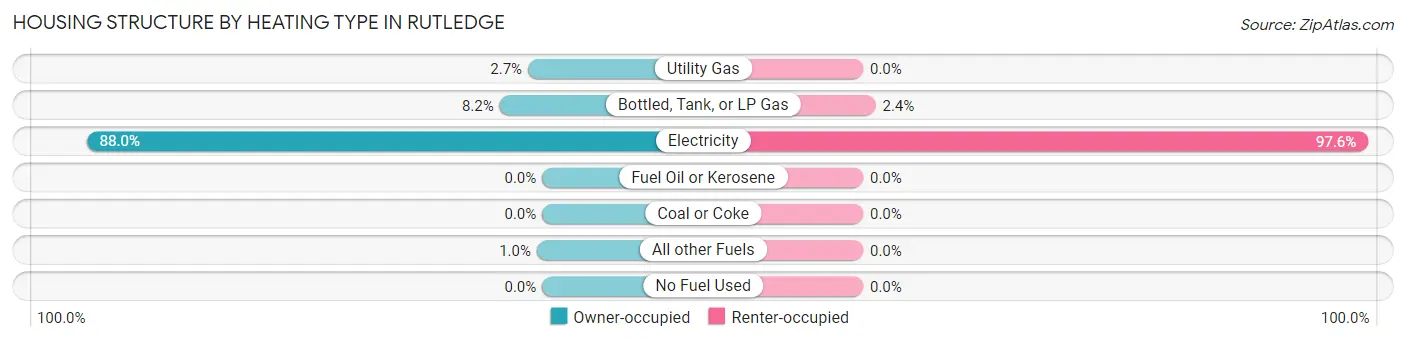
| Heating Type | Owner-occupied | Renter-occupied |
| Utility Gas | 8 (2.7%) | 0 (0.0%) |
| Bottled, Tank, or LP Gas | 24 (8.2%) | 7 (2.4%) |
| Electricity | 257 (88.0%) | 284 (97.6%) |
| Fuel Oil or Kerosene | 0 (0.0%) | 0 (0.0%) |
| Coal or Coke | 0 (0.0%) | 0 (0.0%) |
| All other Fuels | 3 (1.0%) | 0 (0.0%) |
| No Fuel Used | 0 (0.0%) | 0 (0.0%) |
| Total | 292 (100.0%) | 291 (100.0%) |
Household Vehicle Usage in Rutledge
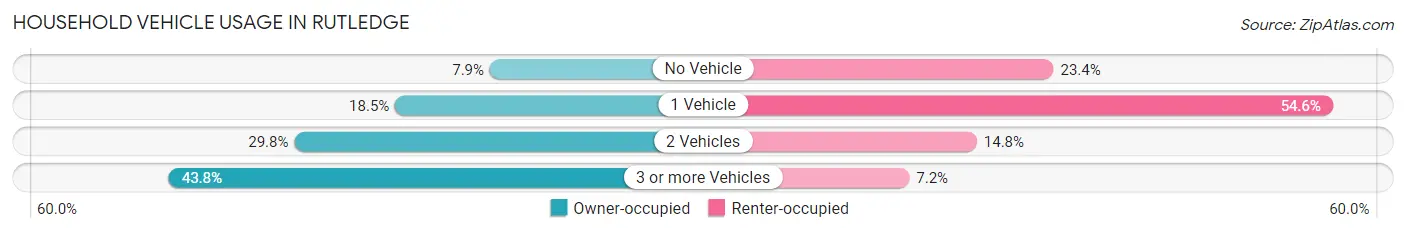
| Vehicles per Household | Owner-occupied | Renter-occupied |
| No Vehicle | 23 (7.9%) | 68 (23.4%) |
| 1 Vehicle | 54 (18.5%) | 159 (54.6%) |
| 2 Vehicles | 87 (29.8%) | 43 (14.8%) |
| 3 or more Vehicles | 128 (43.8%) | 21 (7.2%) |
| Total | 292 (100.0%) | 291 (100.0%) |
Real Estate & Mortgages in Rutledge
Real Estate and Mortgage Overview in Rutledge
| Characteristic | Without Mortgage | With Mortgage |
| Housing Units | 147 | 145 |
| Median Property Value | $98,100 | $154,400 |
| Median Household Income | $40,781 | $15 |
| Monthly Housing Costs | $306 | $10 |
| Real Estate Taxes | $500 | $3 |
Property Value by Mortgage Status in Rutledge
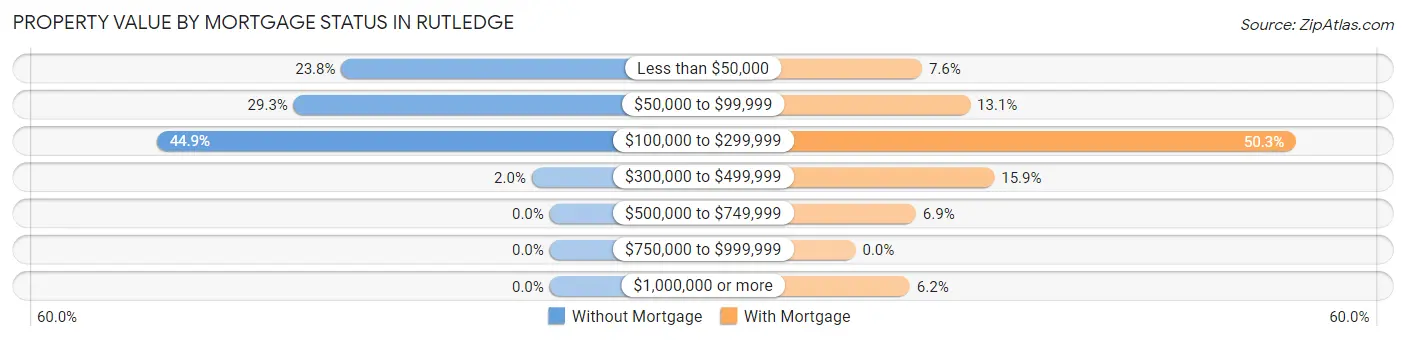
| Property Value | Without Mortgage | With Mortgage |
| Less than $50,000 | 35 (23.8%) | 11 (7.6%) |
| $50,000 to $99,999 | 43 (29.2%) | 19 (13.1%) |
| $100,000 to $299,999 | 66 (44.9%) | 73 (50.3%) |
| $300,000 to $499,999 | 3 (2.0%) | 23 (15.9%) |
| $500,000 to $749,999 | 0 (0.0%) | 10 (6.9%) |
| $750,000 to $999,999 | 0 (0.0%) | 0 (0.0%) |
| $1,000,000 or more | 0 (0.0%) | 9 (6.2%) |
| Total | 147 (100.0%) | 145 (100.0%) |
Household Income by Mortgage Status in Rutledge
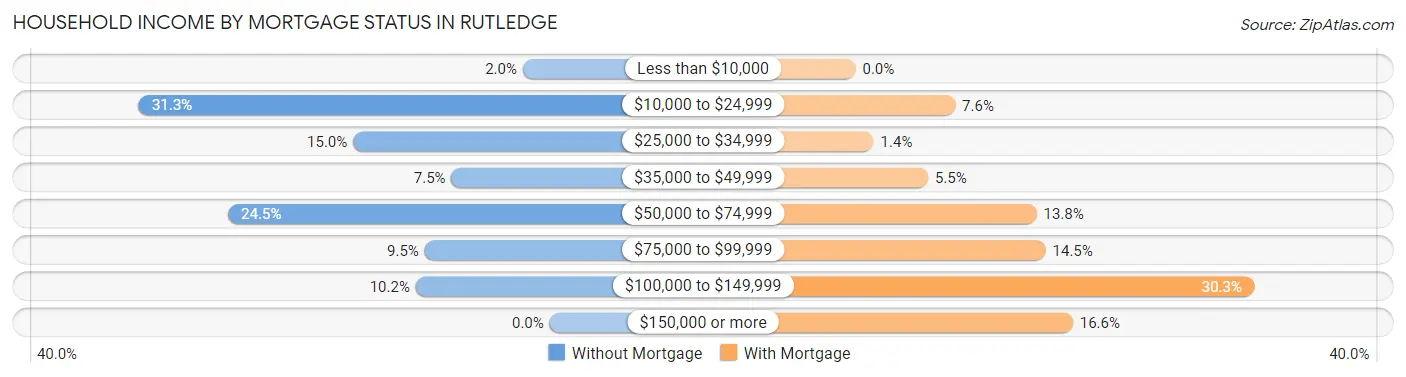
| Household Income | Without Mortgage | With Mortgage |
| Less than $10,000 | 3 (2.0%) | 0 (0.0%) |
| $10,000 to $24,999 | 46 (31.3%) | 11 (7.6%) |
| $25,000 to $34,999 | 22 (15.0%) | 2 (1.4%) |
| $35,000 to $49,999 | 11 (7.5%) | 8 (5.5%) |
| $50,000 to $74,999 | 36 (24.5%) | 20 (13.8%) |
| $75,000 to $99,999 | 14 (9.5%) | 21 (14.5%) |
| $100,000 to $149,999 | 15 (10.2%) | 44 (30.3%) |
| $150,000 or more | 0 (0.0%) | 24 (16.6%) |
| Total | 147 (100.0%) | 145 (100.0%) |
Property Value to Household Income Ratio in Rutledge
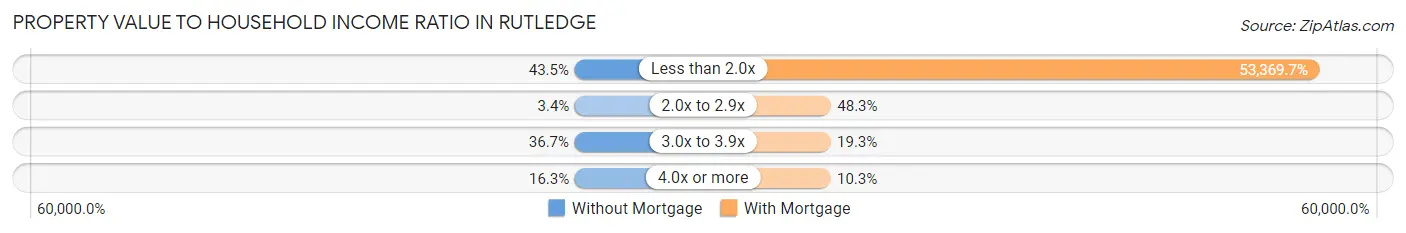
| Value-to-Income Ratio | Without Mortgage | With Mortgage |
| Less than 2.0x | 64 (43.5%) | 77,386 (53,369.7%) |
| 2.0x to 2.9x | 5 (3.4%) | 70 (48.3%) |
| 3.0x to 3.9x | 54 (36.7%) | 28 (19.3%) |
| 4.0x or more | 24 (16.3%) | 15 (10.3%) |
| Total | 147 (100.0%) | 145 (100.0%) |
Real Estate Taxes by Mortgage Status in Rutledge
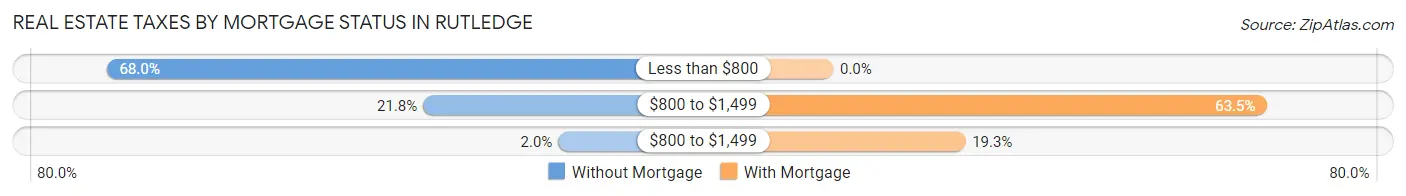
| Property Taxes | Without Mortgage | With Mortgage |
| Less than $800 | 100 (68.0%) | 0 (0.0%) |
| $800 to $1,499 | 32 (21.8%) | 92 (63.4%) |
| $800 to $1,499 | 3 (2.0%) | 28 (19.3%) |
| Total | 147 (100.0%) | 145 (100.0%) |
Health & Disability in Rutledge
Health Insurance Coverage by Age in Rutledge
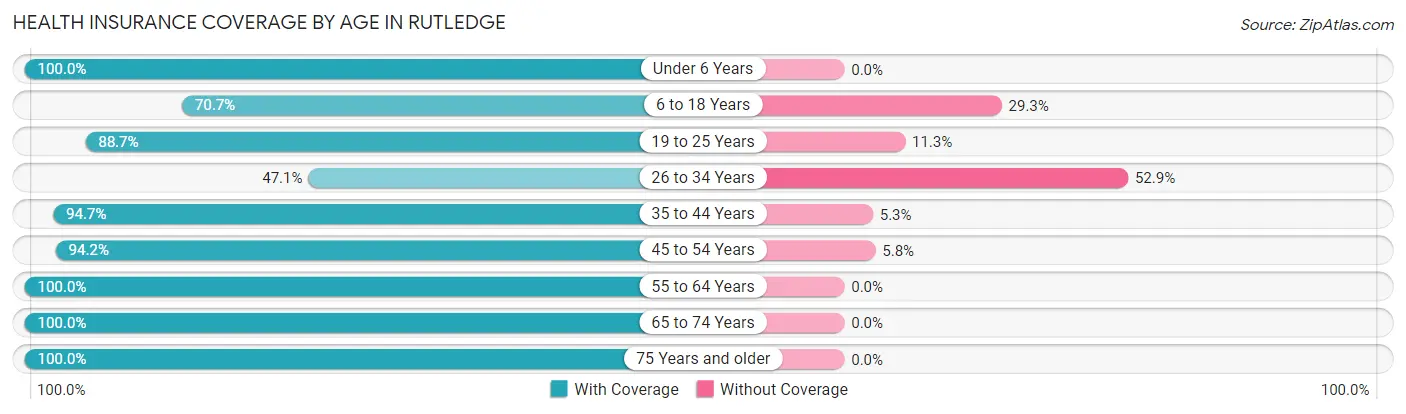
| Age Bracket | With Coverage | Without Coverage |
| Under 6 Years | 74 (100.0%) | 0 (0.0%) |
| 6 to 18 Years | 224 (70.7%) | 93 (29.3%) |
| 19 to 25 Years | 94 (88.7%) | 12 (11.3%) |
| 26 to 34 Years | 73 (47.1%) | 82 (52.9%) |
| 35 to 44 Years | 107 (94.7%) | 6 (5.3%) |
| 45 to 54 Years | 179 (94.2%) | 11 (5.8%) |
| 55 to 64 Years | 183 (100.0%) | 0 (0.0%) |
| 65 to 74 Years | 175 (100.0%) | 0 (0.0%) |
| 75 Years and older | 103 (100.0%) | 0 (0.0%) |
| Total | 1,212 (85.6%) | 204 (14.4%) |
Health Insurance Coverage by Citizenship Status in Rutledge
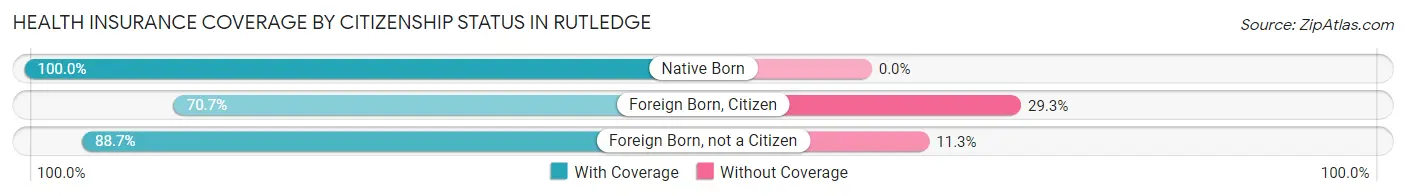
| Citizenship Status | With Coverage | Without Coverage |
| Native Born | 74 (100.0%) | 0 (0.0%) |
| Foreign Born, Citizen | 224 (70.7%) | 93 (29.3%) |
| Foreign Born, not a Citizen | 94 (88.7%) | 12 (11.3%) |
Health Insurance Coverage by Household Income in Rutledge
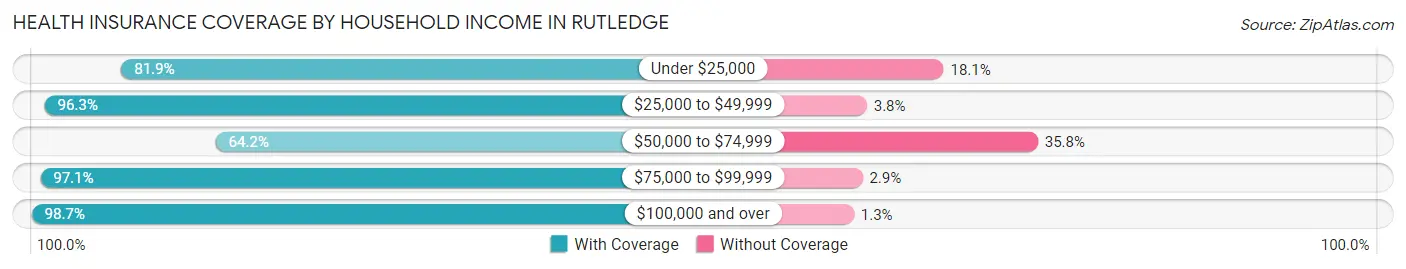
| Household Income | With Coverage | Without Coverage |
| Under $25,000 | 280 (81.9%) | 62 (18.1%) |
| $25,000 to $49,999 | 257 (96.3%) | 10 (3.7%) |
| $50,000 to $74,999 | 219 (64.2%) | 122 (35.8%) |
| $75,000 to $99,999 | 231 (97.1%) | 7 (2.9%) |
| $100,000 and over | 225 (98.7%) | 3 (1.3%) |
Public vs Private Health Insurance Coverage by Age in Rutledge
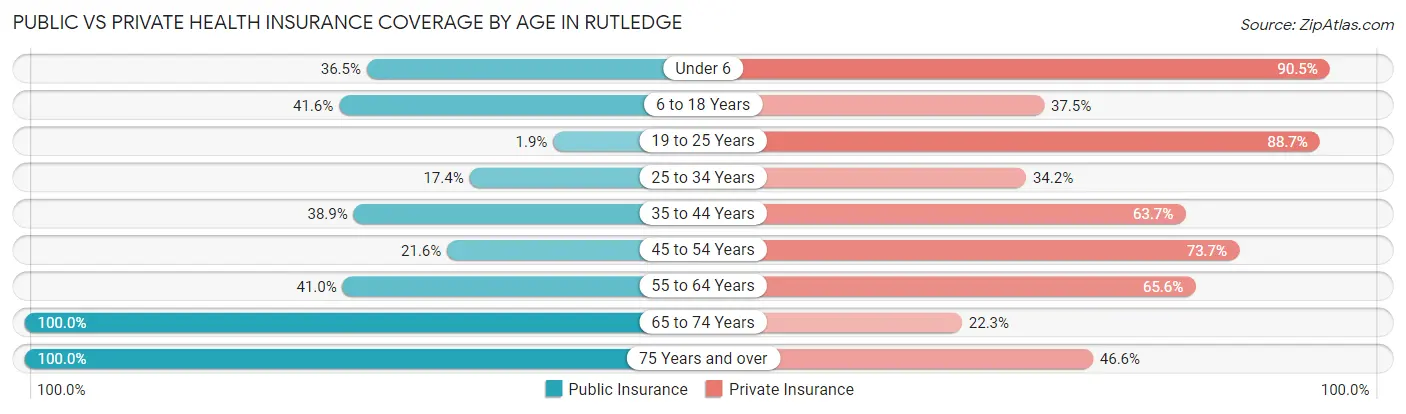
| Age Bracket | Public Insurance | Private Insurance |
| Under 6 | 27 (36.5%) | 67 (90.5%) |
| 6 to 18 Years | 132 (41.6%) | 119 (37.5%) |
| 19 to 25 Years | 2 (1.9%) | 94 (88.7%) |
| 25 to 34 Years | 27 (17.4%) | 53 (34.2%) |
| 35 to 44 Years | 44 (38.9%) | 72 (63.7%) |
| 45 to 54 Years | 41 (21.6%) | 140 (73.7%) |
| 55 to 64 Years | 75 (41.0%) | 120 (65.6%) |
| 65 to 74 Years | 175 (100.0%) | 39 (22.3%) |
| 75 Years and over | 103 (100.0%) | 48 (46.6%) |
| Total | 626 (44.2%) | 752 (53.1%) |
Disability Status by Sex by Age in Rutledge
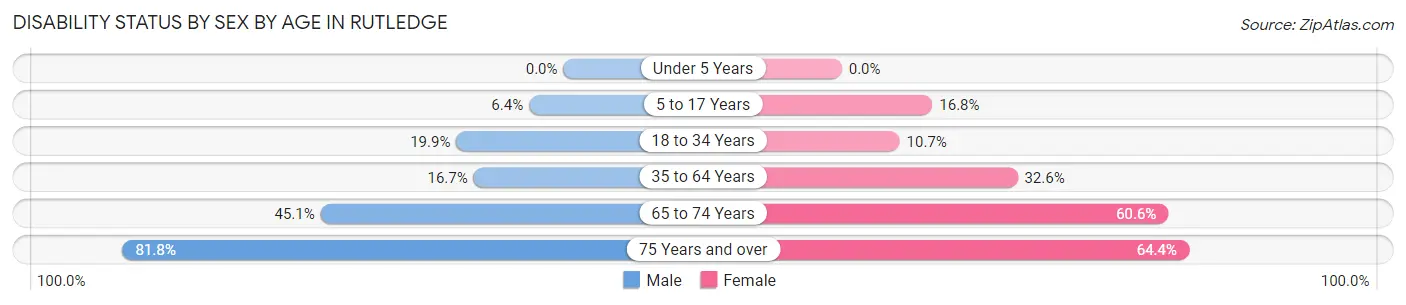
| Age Bracket | Male | Female |
| Under 5 Years | 0 (0.0%) | 0 (0.0%) |
| 5 to 17 Years | 12 (6.4%) | 19 (16.8%) |
| 18 to 34 Years | 34 (19.9%) | 13 (10.7%) |
| 35 to 64 Years | 35 (16.7%) | 90 (32.6%) |
| 65 to 74 Years | 32 (45.1%) | 63 (60.6%) |
| 75 Years and over | 36 (81.8%) | 38 (64.4%) |
Disability Class by Sex by Age in Rutledge
Disability Class: Hearing Difficulty
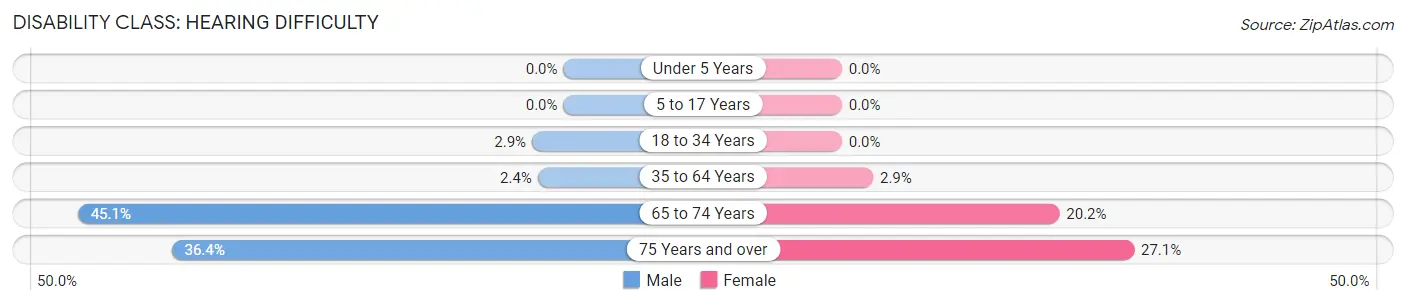
| Age Bracket | Male | Female |
| Under 5 Years | 0 (0.0%) | 0 (0.0%) |
| 5 to 17 Years | 0 (0.0%) | 0 (0.0%) |
| 18 to 34 Years | 5 (2.9%) | 0 (0.0%) |
| 35 to 64 Years | 5 (2.4%) | 8 (2.9%) |
| 65 to 74 Years | 32 (45.1%) | 21 (20.2%) |
| 75 Years and over | 16 (36.4%) | 16 (27.1%) |
Disability Class: Vision Difficulty
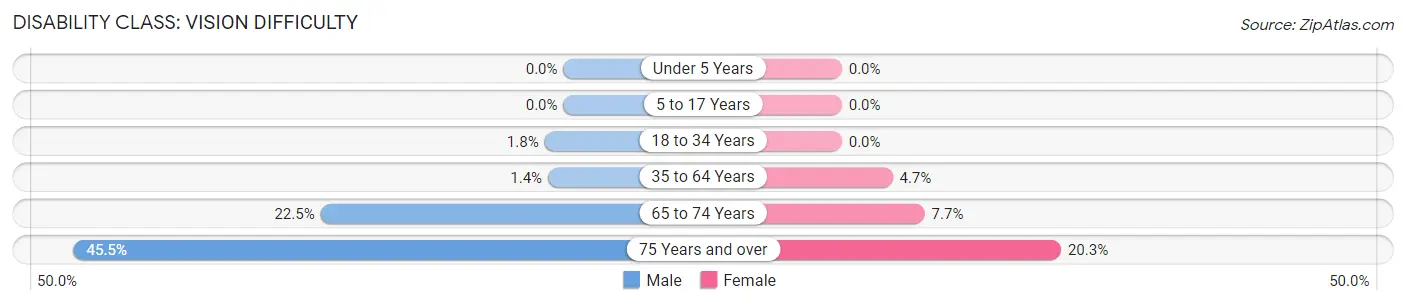
| Age Bracket | Male | Female |
| Under 5 Years | 0 (0.0%) | 0 (0.0%) |
| 5 to 17 Years | 0 (0.0%) | 0 (0.0%) |
| 18 to 34 Years | 3 (1.8%) | 0 (0.0%) |
| 35 to 64 Years | 3 (1.4%) | 13 (4.7%) |
| 65 to 74 Years | 16 (22.5%) | 8 (7.7%) |
| 75 Years and over | 20 (45.5%) | 12 (20.3%) |
Disability Class: Cognitive Difficulty
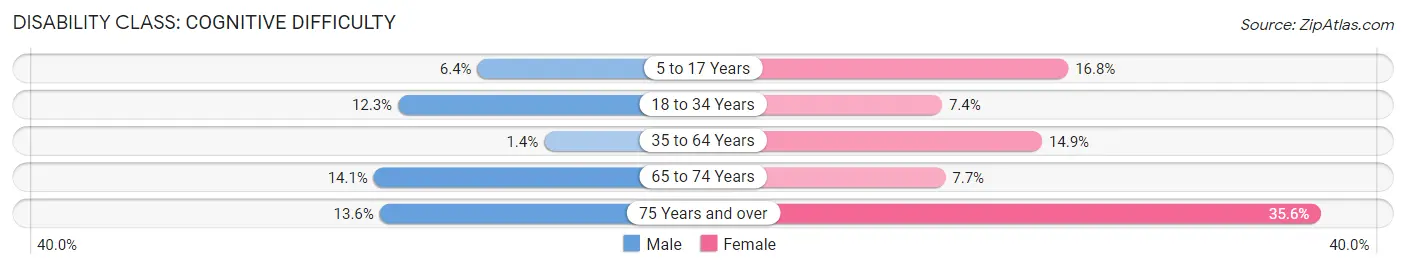
| Age Bracket | Male | Female |
| 5 to 17 Years | 12 (6.4%) | 19 (16.8%) |
| 18 to 34 Years | 21 (12.3%) | 9 (7.4%) |
| 35 to 64 Years | 3 (1.4%) | 41 (14.9%) |
| 65 to 74 Years | 10 (14.1%) | 8 (7.7%) |
| 75 Years and over | 6 (13.6%) | 21 (35.6%) |
Disability Class: Ambulatory Difficulty
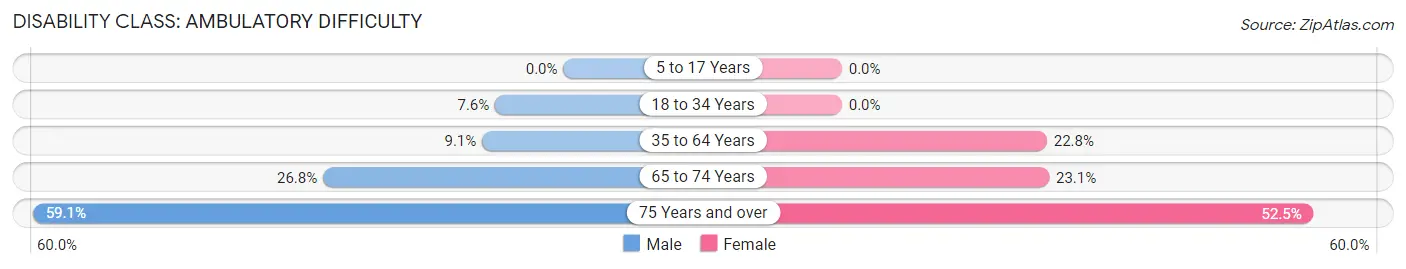
| Age Bracket | Male | Female |
| 5 to 17 Years | 0 (0.0%) | 0 (0.0%) |
| 18 to 34 Years | 13 (7.6%) | 0 (0.0%) |
| 35 to 64 Years | 19 (9.0%) | 63 (22.8%) |
| 65 to 74 Years | 19 (26.8%) | 24 (23.1%) |
| 75 Years and over | 26 (59.1%) | 31 (52.5%) |
Disability Class: Self-Care Difficulty
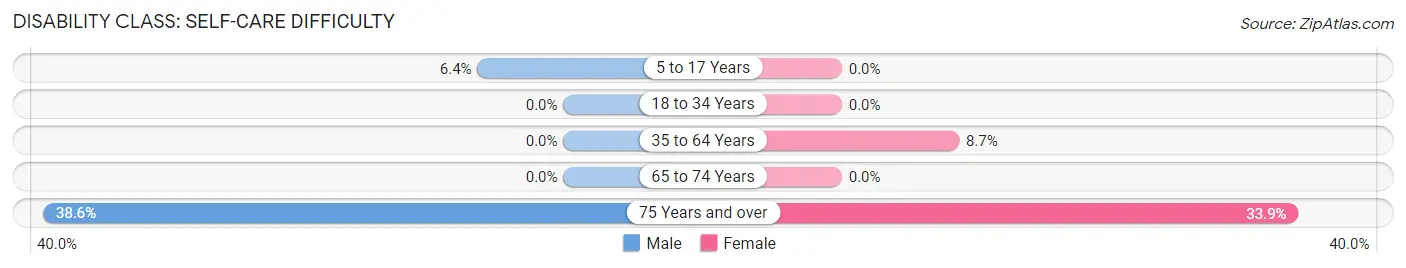
| Age Bracket | Male | Female |
| 5 to 17 Years | 12 (6.4%) | 0 (0.0%) |
| 18 to 34 Years | 0 (0.0%) | 0 (0.0%) |
| 35 to 64 Years | 0 (0.0%) | 24 (8.7%) |
| 65 to 74 Years | 0 (0.0%) | 0 (0.0%) |
| 75 Years and over | 17 (38.6%) | 20 (33.9%) |
Technology Access in Rutledge
Computing Device Access in Rutledge
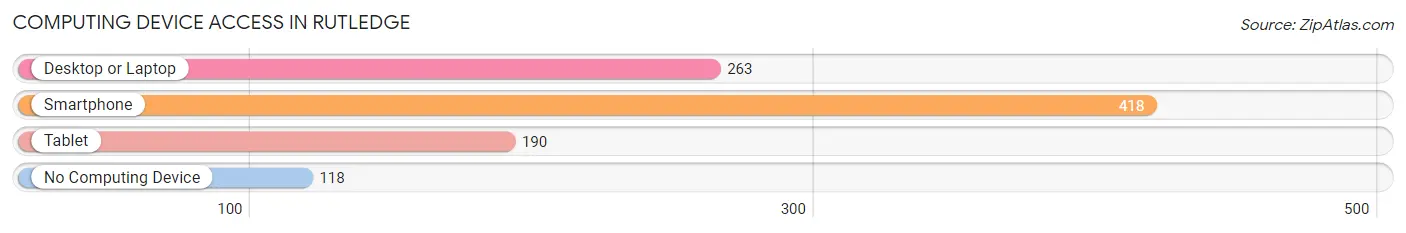
| Device Type | # Households | % Households |
| Desktop or Laptop | 263 | 45.1% |
| Smartphone | 418 | 71.7% |
| Tablet | 190 | 32.6% |
| No Computing Device | 118 | 20.2% |
| Total | 583 | 100.0% |
Internet Access in Rutledge
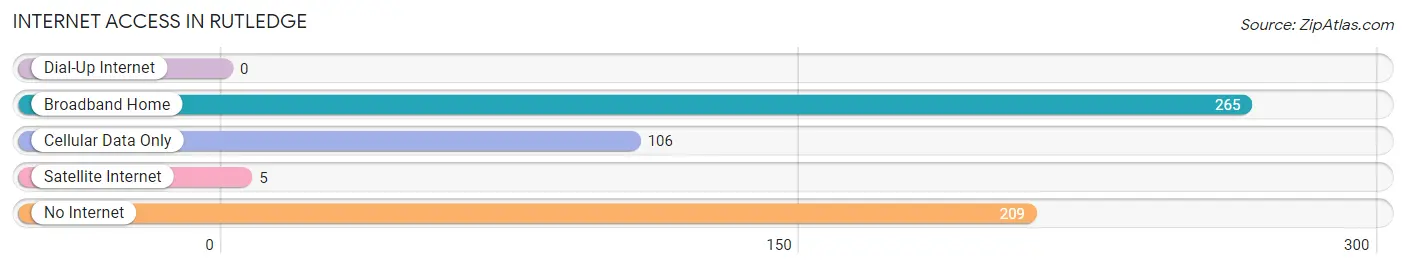
| Internet Type | # Households | % Households |
| Dial-Up Internet | 0 | 0.0% |
| Broadband Home | 265 | 45.5% |
| Cellular Data Only | 106 | 18.2% |
| Satellite Internet | 5 | 0.9% |
| No Internet | 209 | 35.8% |
| Total | 583 | 100.0% |
Rutledge Summary
Rutledge is a small town located in Grainger County, Tennessee. It is situated in the foothills of the Great Smoky Mountains, about 25 miles northeast of Knoxville. The town was founded in 1820 and has a population of approximately 1,500 people.
History
Rutledge was founded in 1820 by William Rutledge, a Revolutionary War veteran. He purchased the land from the Cherokee Indians and named the town after himself. The town was originally known as Rutledgeville, but the name was later shortened to Rutledge.
In the early days, Rutledge was a small farming community. The town was home to several gristmills, sawmills, and a cotton gin. The town also had a post office, a general store, and a blacksmith shop.
In the late 1800s, Rutledge began to grow and prosper. The town was home to several churches, a school, and a hotel. The town also had a railroad station, which connected it to the larger cities of Knoxville and Chattanooga.
In the early 1900s, Rutledge experienced a period of decline. The railroad station closed and the town's population began to decline. However, in the late 20th century, Rutledge began to experience a resurgence. The town was revitalized with the opening of a new post office, a library, and a community center.
Geography
Rutledge is located in the foothills of the Great Smoky Mountains, about 25 miles northeast of Knoxville. The town is situated in a valley surrounded by hills and mountains. The town is located along the banks of the Holston River.
The climate in Rutledge is mild and humid. The average temperature in the summer is around 80 degrees Fahrenheit, and the average temperature in the winter is around 40 degrees Fahrenheit.
Economy
Rutledge is a small, rural town with a limited economy. The town is home to several small businesses, including a grocery store, a hardware store, and a few restaurants. The town also has a few manufacturing plants, including a furniture factory and a textile mill.
The town is also home to several farms, which produce a variety of crops, including corn, soybeans, and hay. The town also has a few small wineries, which produce a variety of wines.
Demographics
Rutledge has a population of approximately 1,500 people. The town is predominantly white, with a small African American population. The median household income in Rutledge is around $35,000. The town has a low unemployment rate and a high rate of homeownership.
Common Questions
What is Per Capita Income in Rutledge?
Per Capita income in Rutledge is $25,315.
What is the Median Family Income in Rutledge?
Median Family Income in Rutledge is $67,986.
What is the Median Household income in Rutledge?
Median Household Income in Rutledge is $30,739.
What is Income or Wage Gap in Rutledge?
Income or Wage Gap in Rutledge is 40.7%.
Women in Rutledge earn 59.3 cents for every dollar earned by a man.
What is Inequality or Gini Index in Rutledge?
Inequality or Gini Index in Rutledge is 0.57.
What is the Total Population of Rutledge?
Total Population of Rutledge is 1,550.
What is the Total Male Population of Rutledge?
Total Male Population of Rutledge is 768.
What is the Total Female Population of Rutledge?
Total Female Population of Rutledge is 782.
What is the Ratio of Males per 100 Females in Rutledge?
There are 98.21 Males per 100 Females in Rutledge.
What is the Ratio of Females per 100 Males in Rutledge?
There are 101.82 Females per 100 Males in Rutledge.
What is the Median Population Age in Rutledge?
Median Population Age in Rutledge is 45.1 Years.
What is the Average Family Size in Rutledge
Average Family Size in Rutledge is 3.6 People.
What is the Average Household Size in Rutledge
Average Household Size in Rutledge is 2.4 People.
How Large is the Labor Force in Rutledge?
There are 617 People in the Labor Forcein in Rutledge.
What is the Percentage of People in the Labor Force in Rutledge?
47.0% of People are in the Labor Force in Rutledge.
What is the Unemployment Rate in Rutledge?
Unemployment Rate in Rutledge is 3.9%.