Rutherford, TN Map & Demographics
Rutherford Map
Rutherford Overview
$22,710
PER CAPITA INCOME
$58,750
AVG FAMILY INCOME
$46,161
AVG HOUSEHOLD INCOME
26.5%
WAGE / INCOME GAP [ % ]
73.5¢/ $1
WAGE / INCOME GAP [ $ ]
0.39
INEQUALITY / GINI INDEX
1,221
TOTAL POPULATION
616
MALE POPULATION
605
FEMALE POPULATION
101.82
MALES / 100 FEMALES
98.21
FEMALES / 100 MALES
35.4
MEDIAN AGE
3.3
AVG FAMILY SIZE
2.6
AVG HOUSEHOLD SIZE
511
LABOR FORCE [ PEOPLE ]
56.1%
PERCENT IN LABOR FORCE
4.1%
UNEMPLOYMENT RATE
Rutherford Zip Codes
Rutherford Area Codes
Income in Rutherford
Income Overview in Rutherford
Per Capita Income in Rutherford is $22,710, while median incomes of families and households are $58,750 and $46,161 respectively.
| Characteristic | Number | Measure |
| Per Capita Income | 1,221 | $22,710 |
| Median Family Income | 318 | $58,750 |
| Mean Family Income | 318 | $68,164 |
| Median Household Income | 473 | $46,161 |
| Mean Household Income | 473 | $58,112 |
| Income Deficit | 318 | $0 |
| Wage / Income Gap (%) | 1,221 | 26.52% |
| Wage / Income Gap ($) | 1,221 | 73.48¢ per $1 |
| Gini / Inequality Index | 1,221 | 0.39 |
Earnings by Sex in Rutherford
Average Earnings in Rutherford are $33,973, $37,955 for men and $27,891 for women, a difference of 26.5%.
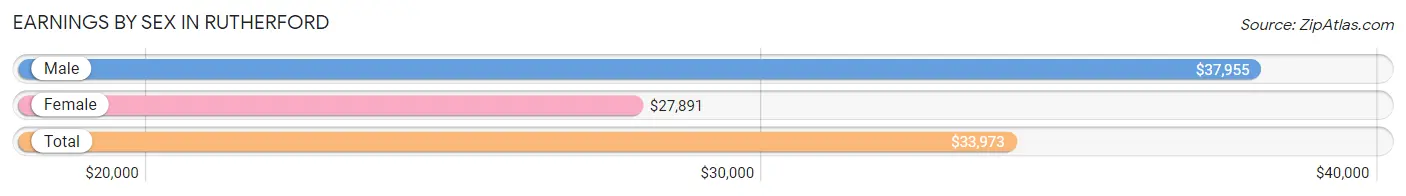
| Sex | Number | Average Earnings |
| Male | 276 (49.0%) | $37,955 |
| Female | 287 (51.0%) | $27,891 |
| Total | 563 (100.0%) | $33,973 |
Earnings by Sex by Income Bracket in Rutherford
The most common earnings brackets in Rutherford are $55,000 to $64,999 for men (38 | 13.8%) and $35,000 to $39,999 for women (37 | 12.9%).
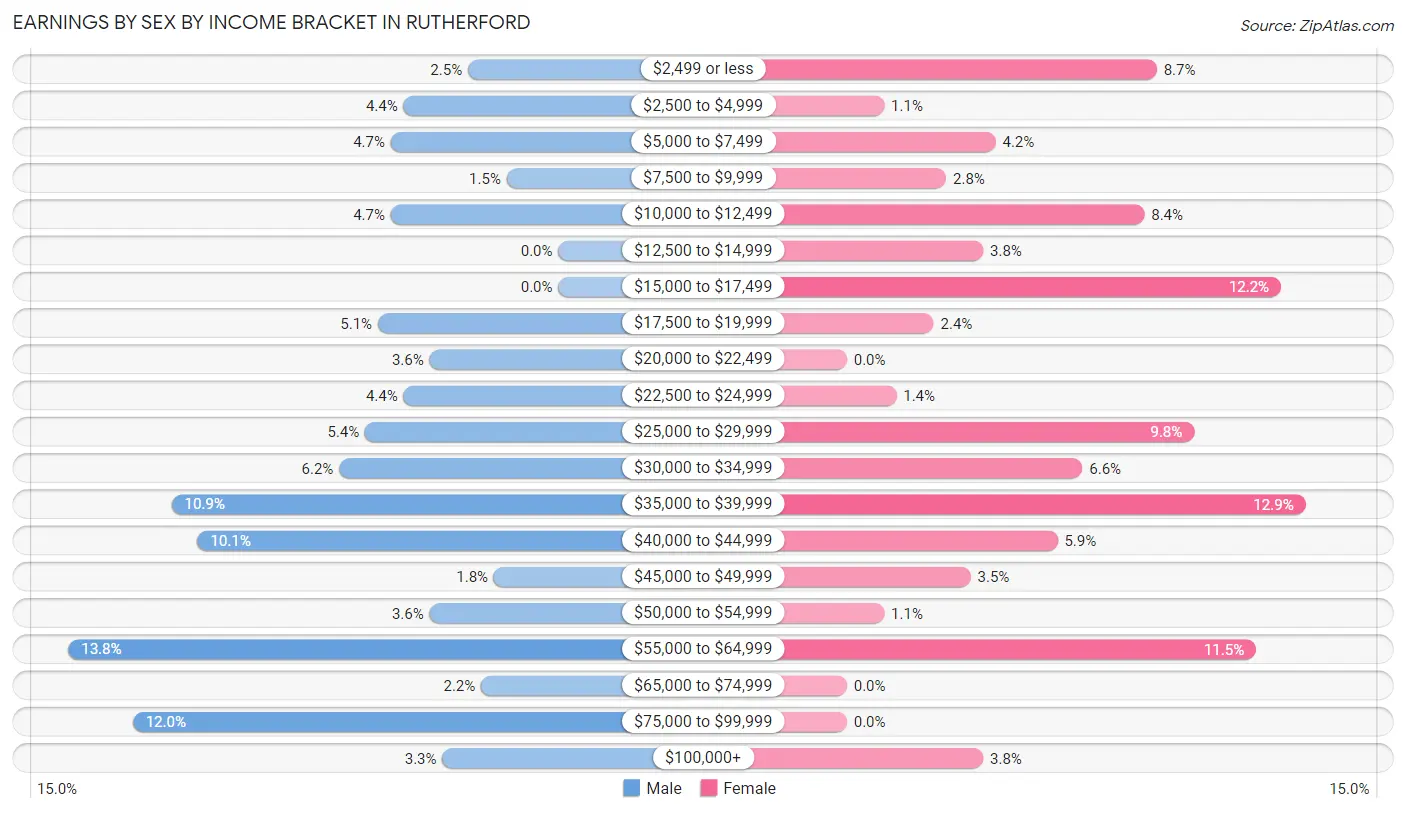
| Income | Male | Female |
| $2,499 or less | 7 (2.5%) | 25 (8.7%) |
| $2,500 to $4,999 | 12 (4.3%) | 3 (1.1%) |
| $5,000 to $7,499 | 13 (4.7%) | 12 (4.2%) |
| $7,500 to $9,999 | 4 (1.5%) | 8 (2.8%) |
| $10,000 to $12,499 | 13 (4.7%) | 24 (8.4%) |
| $12,500 to $14,999 | 0 (0.0%) | 11 (3.8%) |
| $15,000 to $17,499 | 0 (0.0%) | 35 (12.2%) |
| $17,500 to $19,999 | 14 (5.1%) | 7 (2.4%) |
| $20,000 to $22,499 | 10 (3.6%) | 0 (0.0%) |
| $22,500 to $24,999 | 12 (4.3%) | 4 (1.4%) |
| $25,000 to $29,999 | 15 (5.4%) | 28 (9.8%) |
| $30,000 to $34,999 | 17 (6.2%) | 19 (6.6%) |
| $35,000 to $39,999 | 30 (10.9%) | 37 (12.9%) |
| $40,000 to $44,999 | 28 (10.1%) | 17 (5.9%) |
| $45,000 to $49,999 | 5 (1.8%) | 10 (3.5%) |
| $50,000 to $54,999 | 10 (3.6%) | 3 (1.1%) |
| $55,000 to $64,999 | 38 (13.8%) | 33 (11.5%) |
| $65,000 to $74,999 | 6 (2.2%) | 0 (0.0%) |
| $75,000 to $99,999 | 33 (12.0%) | 0 (0.0%) |
| $100,000+ | 9 (3.3%) | 11 (3.8%) |
| Total | 276 (100.0%) | 287 (100.0%) |
Earnings by Sex by Educational Attainment in Rutherford
Average earnings in Rutherford are $40,739 for men and $28,000 for women, a difference of 31.3%. Men with an educational attainment of bachelor's degree enjoy the highest average annual earnings of $88,375, while those with less than high school education earn the least with $35,769. Women with an educational attainment of less than high school earn the most with the average annual earnings of $36,429, while those with college or associate's degree education have the smallest earnings of $16,813.
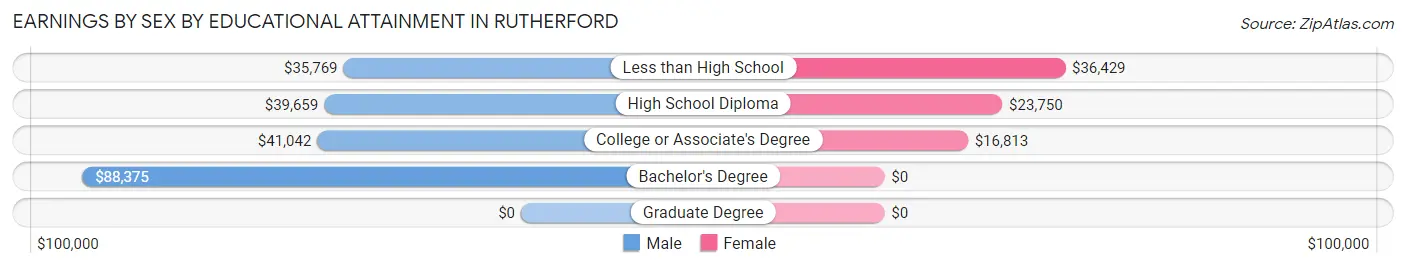
| Educational Attainment | Male Income | Female Income |
| Less than High School | $35,769 | $36,429 |
| High School Diploma | $39,659 | $23,750 |
| College or Associate's Degree | $41,042 | $16,813 |
| Bachelor's Degree | $88,375 | $0 |
| Graduate Degree | - | - |
| Total | $40,739 | $28,000 |
Family Income in Rutherford
Family Income Brackets in Rutherford
According to the Rutherford family income data, there are 80 families falling into the $50,000 to $74,999 income range, which is the most common income bracket and makes up 25.2% of all families. Conversely, the $150,000 to $199,999 income bracket is the least frequent group with only 7 families (2.2%) belonging to this category.
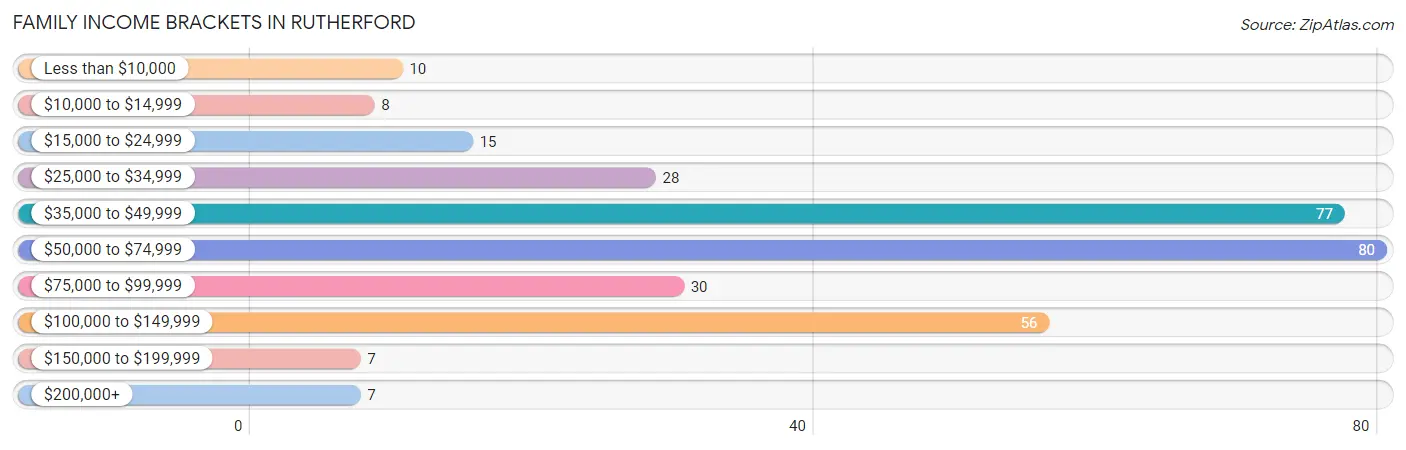
| Income Bracket | # Families | % Families |
| Less than $10,000 | 10 | 3.1% |
| $10,000 to $14,999 | 8 | 2.5% |
| $15,000 to $24,999 | 15 | 4.7% |
| $25,000 to $34,999 | 28 | 8.8% |
| $35,000 to $49,999 | 77 | 24.2% |
| $50,000 to $74,999 | 80 | 25.2% |
| $75,000 to $99,999 | 30 | 9.4% |
| $100,000 to $149,999 | 56 | 17.6% |
| $150,000 to $199,999 | 7 | 2.2% |
| $200,000+ | 7 | 2.2% |
Family Income by Famaliy Size in Rutherford
3-person families (81 | 25.5%) account for the highest median family income in Rutherford with $66,161 per family, while 2-person families (157 | 49.4%) have the highest median income of $23,403 per family member.
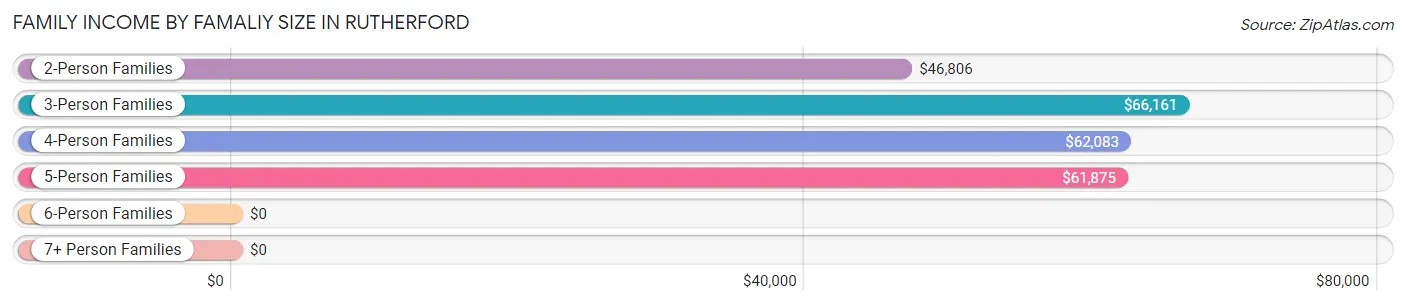
| Income Bracket | # Families | Median Income |
| 2-Person Families | 157 (49.4%) | $46,806 |
| 3-Person Families | 81 (25.5%) | $66,161 |
| 4-Person Families | 37 (11.6%) | $62,083 |
| 5-Person Families | 24 (7.5%) | $61,875 |
| 6-Person Families | 10 (3.1%) | $0 |
| 7+ Person Families | 9 (2.8%) | $0 |
| Total | 318 (100.0%) | $58,750 |
Family Income by Number of Earners in Rutherford
The median family income in Rutherford is $58,750, with families comprising 3+ earners (30) having the highest median family income of $118,571, while families with 1 earner (133) have the lowest median family income of $37,303, accounting for 9.4% and 41.8% of families, respectively.
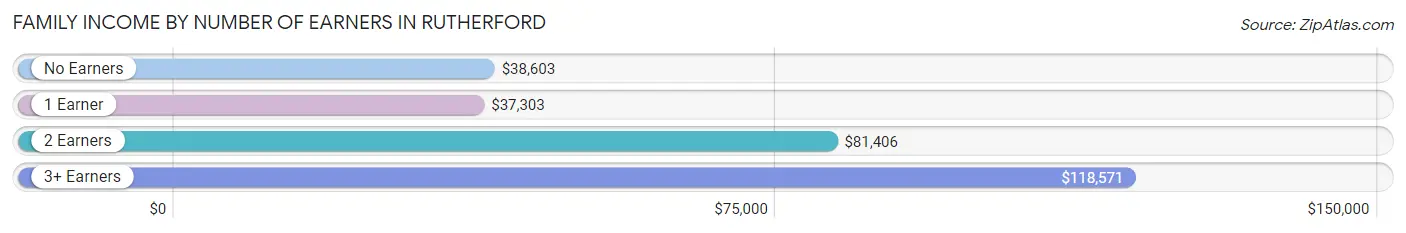
| Number of Earners | # Families | Median Income |
| No Earners | 37 (11.6%) | $38,603 |
| 1 Earner | 133 (41.8%) | $37,303 |
| 2 Earners | 118 (37.1%) | $81,406 |
| 3+ Earners | 30 (9.4%) | $118,571 |
| Total | 318 (100.0%) | $58,750 |
Household Income in Rutherford
Household Income Brackets in Rutherford
With 113 households falling in the category, the $35,000 to $49,999 income range is the most frequent in Rutherford, accounting for 23.9% of all households. In contrast, only 7 households (1.5%) fall into the $150,000 to $199,999 income bracket, making it the least populous group.
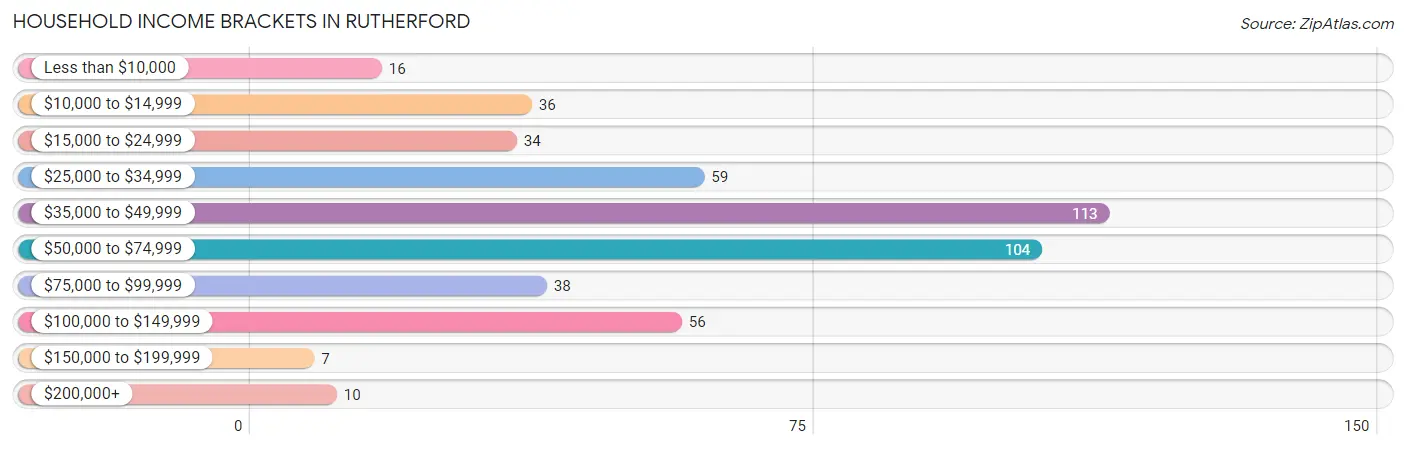
| Income Bracket | # Households | % Households |
| Less than $10,000 | 16 | 3.4% |
| $10,000 to $14,999 | 36 | 7.6% |
| $15,000 to $24,999 | 34 | 7.2% |
| $25,000 to $34,999 | 59 | 12.5% |
| $35,000 to $49,999 | 113 | 23.9% |
| $50,000 to $74,999 | 104 | 22.0% |
| $75,000 to $99,999 | 38 | 8.0% |
| $100,000 to $149,999 | 56 | 11.8% |
| $150,000 to $199,999 | 7 | 1.5% |
| $200,000+ | 10 | 2.1% |
Household Income by Householder Age in Rutherford
The median household income in Rutherford is $46,161, with the highest median household income of $60,000 found in the 45 to 64 years age bracket for the primary householder. A total of 120 households (25.4%) fall into this category. Meanwhile, the 15 to 24 years age bracket for the primary householder has the lowest median household income of $0, with 10 households (2.1%) in this group.
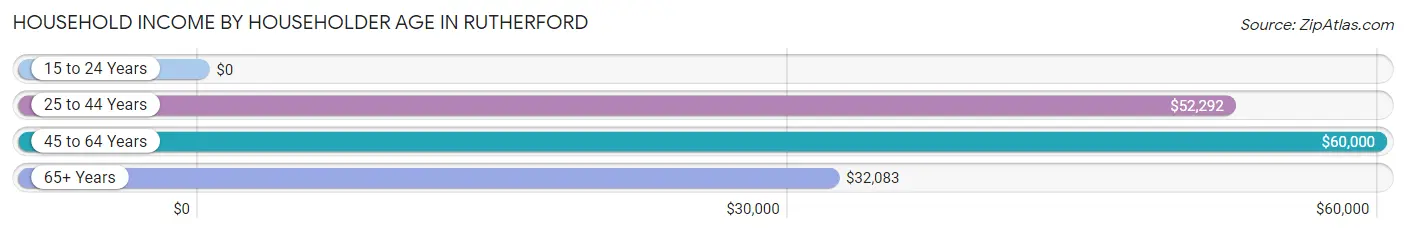
| Income Bracket | # Households | Median Income |
| 15 to 24 Years | 10 (2.1%) | $0 |
| 25 to 44 Years | 189 (40.0%) | $52,292 |
| 45 to 64 Years | 120 (25.4%) | $60,000 |
| 65+ Years | 154 (32.6%) | $32,083 |
| Total | 473 (100.0%) | $46,161 |
Poverty in Rutherford
Income Below Poverty by Sex and Age in Rutherford
With 11.5% poverty level for males and 8.8% for females among the residents of Rutherford, 65 to 74 year old males and 55 to 64 year old females are the most vulnerable to poverty, with 21 males (25.0%) and 9 females (25.0%) in their respective age groups living below the poverty level.
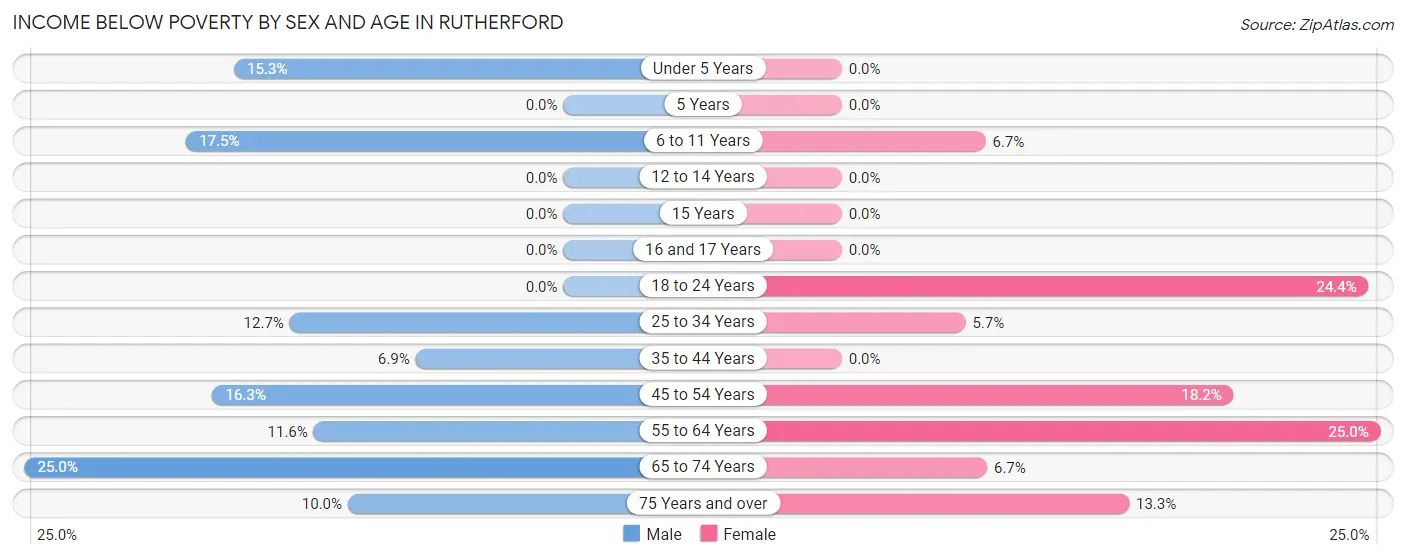
| Age Bracket | Male | Female |
| Under 5 Years | 11 (15.3%) | 0 (0.0%) |
| 5 Years | 0 (0.0%) | 0 (0.0%) |
| 6 to 11 Years | 7 (17.5%) | 4 (6.7%) |
| 12 to 14 Years | 0 (0.0%) | 0 (0.0%) |
| 15 Years | 0 (0.0%) | 0 (0.0%) |
| 16 and 17 Years | 0 (0.0%) | 0 (0.0%) |
| 18 to 24 Years | 0 (0.0%) | 11 (24.4%) |
| 25 to 34 Years | 8 (12.7%) | 7 (5.7%) |
| 35 to 44 Years | 7 (6.9%) | 0 (0.0%) |
| 45 to 54 Years | 7 (16.3%) | 10 (18.2%) |
| 55 to 64 Years | 8 (11.6%) | 9 (25.0%) |
| 65 to 74 Years | 21 (25.0%) | 6 (6.7%) |
| 75 Years and over | 2 (10.0%) | 6 (13.3%) |
| Total | 71 (11.5%) | 53 (8.8%) |
Income Above Poverty by Sex and Age in Rutherford
According to the poverty statistics in Rutherford, males aged 5 years and females aged under 5 years are the age groups that are most secure financially, with 100.0% of males and 100.0% of females in these age groups living above the poverty line.
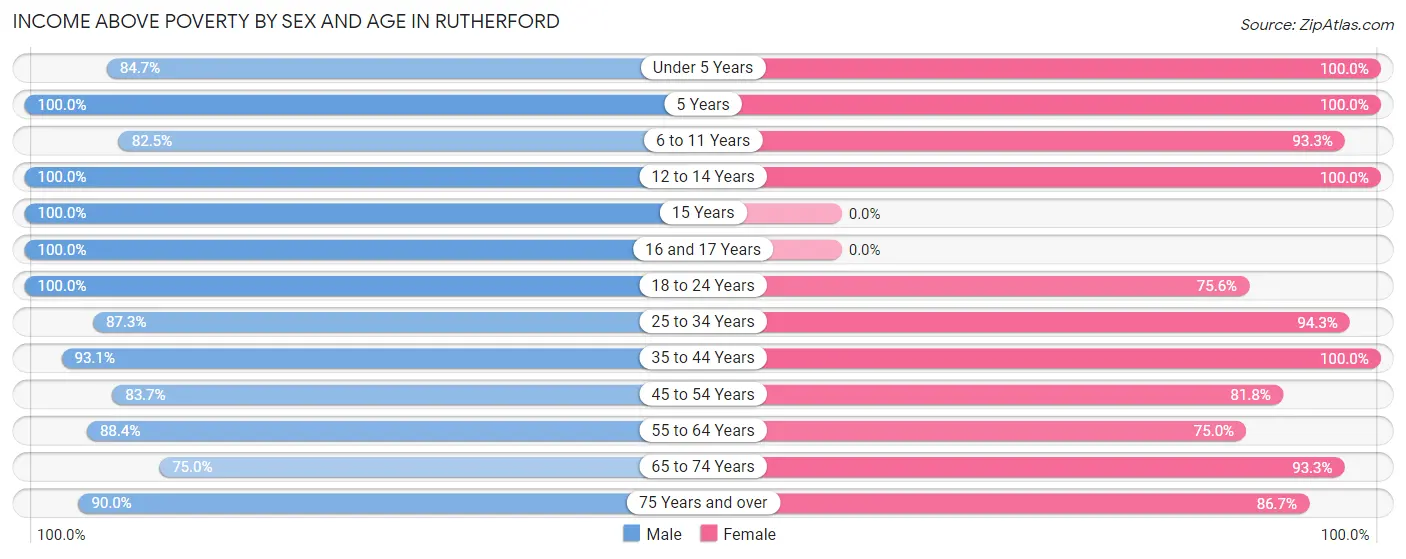
| Age Bracket | Male | Female |
| Under 5 Years | 61 (84.7%) | 32 (100.0%) |
| 5 Years | 8 (100.0%) | 13 (100.0%) |
| 6 to 11 Years | 33 (82.5%) | 56 (93.3%) |
| 12 to 14 Years | 16 (100.0%) | 30 (100.0%) |
| 15 Years | 34 (100.0%) | 0 (0.0%) |
| 16 and 17 Years | 31 (100.0%) | 0 (0.0%) |
| 18 to 24 Years | 34 (100.0%) | 34 (75.6%) |
| 25 to 34 Years | 55 (87.3%) | 115 (94.3%) |
| 35 to 44 Years | 95 (93.1%) | 73 (100.0%) |
| 45 to 54 Years | 36 (83.7%) | 45 (81.8%) |
| 55 to 64 Years | 61 (88.4%) | 27 (75.0%) |
| 65 to 74 Years | 63 (75.0%) | 83 (93.3%) |
| 75 Years and over | 18 (90.0%) | 39 (86.7%) |
| Total | 545 (88.5%) | 547 (91.2%) |
Income Below Poverty Among Married-Couple Families in Rutherford
The poverty statistics for married-couple families in Rutherford show that 5.7% or 13 of the total 230 families live below the poverty line. Families with no children have the highest poverty rate of 10.0%, comprising of 13 families. On the other hand, families with 1 or 2 children have the lowest poverty rate of 0.0%, which includes 0 families.
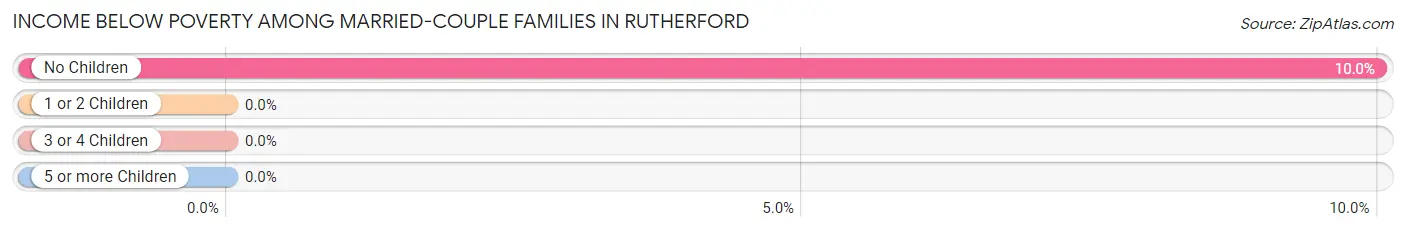
| Children | Above Poverty | Below Poverty |
| No Children | 117 (90.0%) | 13 (10.0%) |
| 1 or 2 Children | 70 (100.0%) | 0 (0.0%) |
| 3 or 4 Children | 30 (100.0%) | 0 (0.0%) |
| 5 or more Children | 0 (0.0%) | 0 (0.0%) |
| Total | 217 (94.4%) | 13 (5.7%) |
Income Below Poverty Among Single-Parent Households in Rutherford
According to the poverty data in Rutherford, 41.2% or 7 single-father households and 15.5% or 11 single-mother households are living below the poverty line. Among single-father households, those with 1 or 2 children have the highest poverty rate, with 7 households (53.8%) experiencing poverty. Likewise, among single-mother households, those with 1 or 2 children have the highest poverty rate, with 11 households (22.0%) falling below the poverty line.
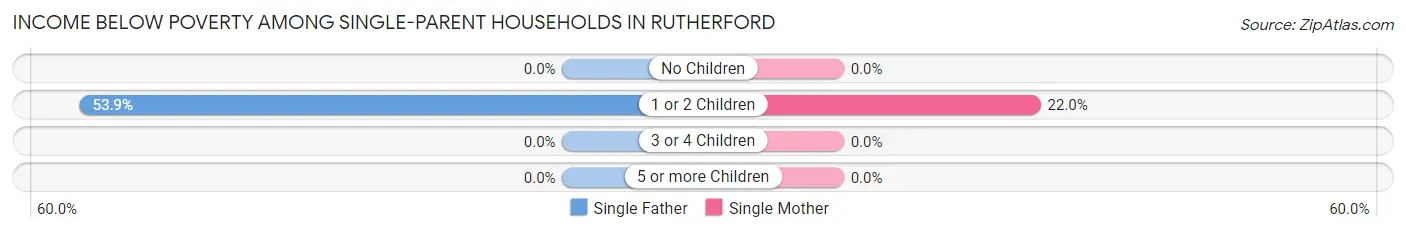
| Children | Single Father | Single Mother |
| No Children | 0 (0.0%) | 0 (0.0%) |
| 1 or 2 Children | 7 (53.8%) | 11 (22.0%) |
| 3 or 4 Children | 0 (0.0%) | 0 (0.0%) |
| 5 or more Children | 0 (0.0%) | 0 (0.0%) |
| Total | 7 (41.2%) | 11 (15.5%) |
Income Below Poverty Among Married-Couple vs Single-Parent Households in Rutherford
The poverty data for Rutherford shows that 13 of the married-couple family households (5.7%) and 18 of the single-parent households (20.4%) are living below the poverty level. Within the married-couple family households, those with no children have the highest poverty rate, with 13 households (10.0%) falling below the poverty line. Among the single-parent households, those with 1 or 2 children have the highest poverty rate, with 18 household (28.6%) living below poverty.
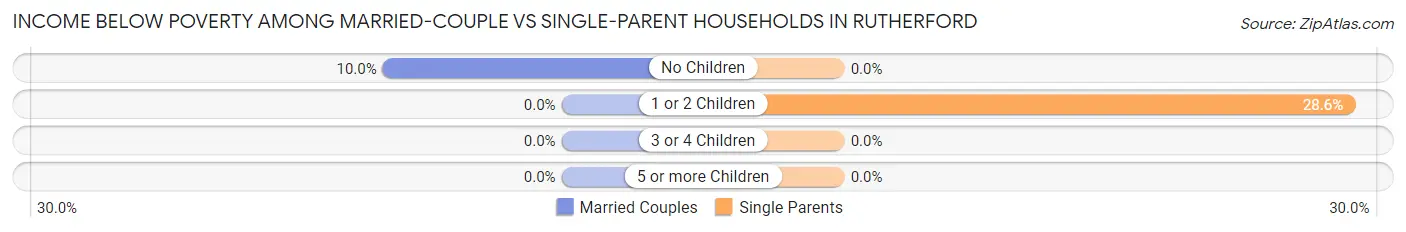
| Children | Married-Couple Families | Single-Parent Households |
| No Children | 13 (10.0%) | 0 (0.0%) |
| 1 or 2 Children | 0 (0.0%) | 18 (28.6%) |
| 3 or 4 Children | 0 (0.0%) | 0 (0.0%) |
| 5 or more Children | 0 (0.0%) | 0 (0.0%) |
| Total | 13 (5.7%) | 18 (20.4%) |
Race in Rutherford
The most populous races in Rutherford are White / Caucasian (1,084 | 88.8%), Two or more Races (92 | 7.5%), and Black / African American (29 | 2.4%).
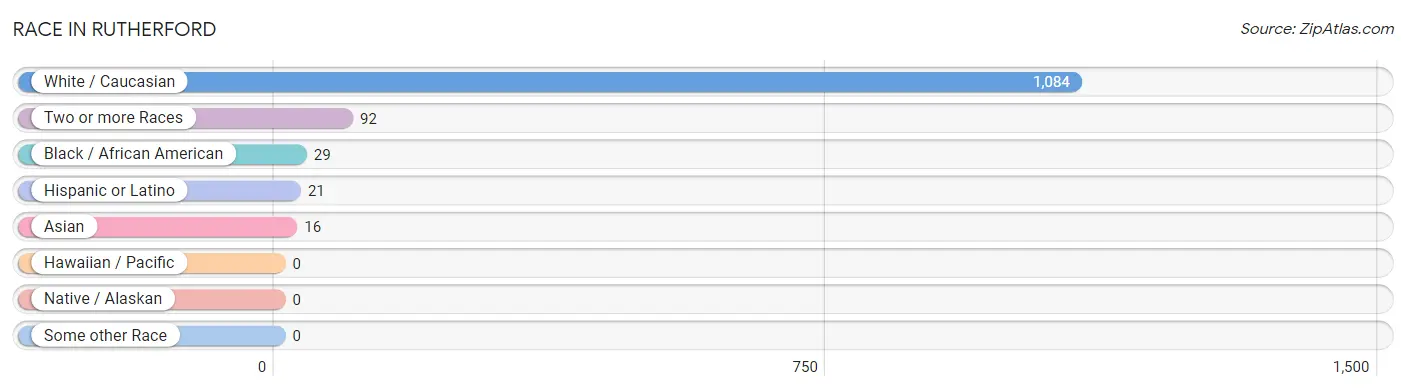
| Race | # Population | % Population |
| Asian | 16 | 1.3% |
| Black / African American | 29 | 2.4% |
| Hawaiian / Pacific | 0 | 0.0% |
| Hispanic or Latino | 21 | 1.7% |
| Native / Alaskan | 0 | 0.0% |
| White / Caucasian | 1,084 | 88.8% |
| Two or more Races | 92 | 7.5% |
| Some other Race | 0 | 0.0% |
| Total | 1,221 | 100.0% |
Ancestry in Rutherford
The most populous ancestries reported in Rutherford are American (256 | 21.0%), German (180 | 14.7%), Irish (131 | 10.7%), English (81 | 6.6%), and Italian (70 | 5.7%), together accounting for 58.8% of all Rutherford residents.
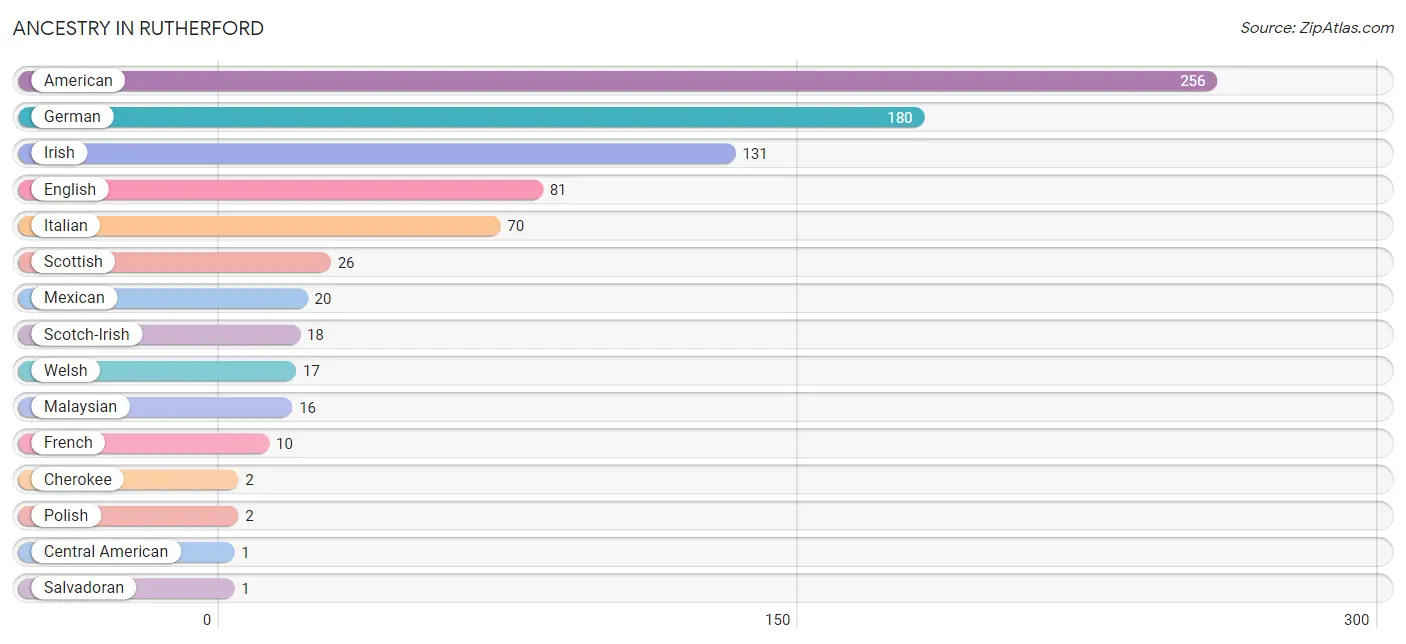
| Ancestry | # Population | % Population |
| American | 256 | 21.0% |
| Central American | 1 | 0.1% |
| Cherokee | 2 | 0.2% |
| English | 81 | 6.6% |
| French | 10 | 0.8% |
| German | 180 | 14.7% |
| Irish | 131 | 10.7% |
| Italian | 70 | 5.7% |
| Malaysian | 16 | 1.3% |
| Mexican | 20 | 1.6% |
| Polish | 2 | 0.2% |
| Salvadoran | 1 | 0.1% |
| Scotch-Irish | 18 | 1.5% |
| Scottish | 26 | 2.1% |
| Welsh | 17 | 1.4% | View All 15 Rows |
Immigrants in Rutherford
The most numerous immigrant groups reported in Rutherford came from Asia (11 | 0.9%), Laos (11 | 0.9%), South Eastern Asia (11 | 0.9%), Central America (7 | 0.6%), and Latin America (7 | 0.6%), together accounting for 3.8% of all Rutherford residents.
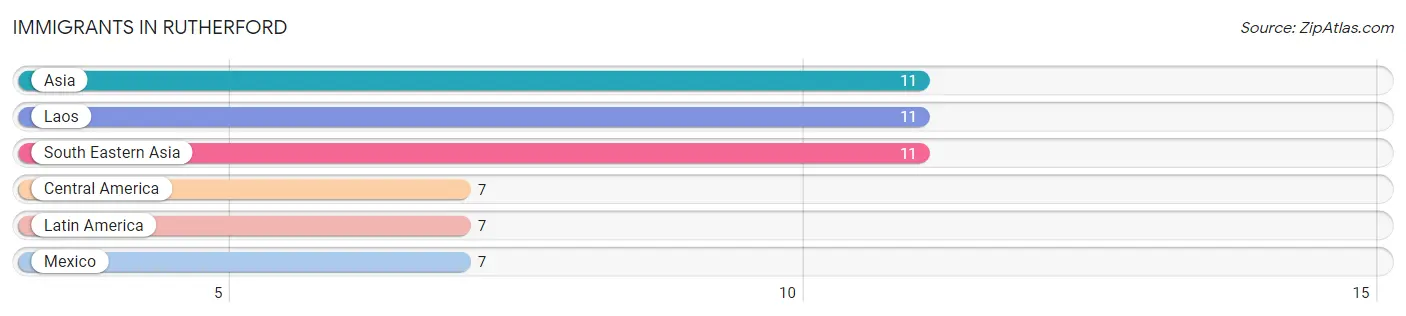
| Immigration Origin | # Population | % Population |
| Asia | 11 | 0.9% |
| Central America | 7 | 0.6% |
| Laos | 11 | 0.9% |
| Latin America | 7 | 0.6% |
| Mexico | 7 | 0.6% |
| South Eastern Asia | 11 | 0.9% | View All 6 Rows |
Sex and Age in Rutherford
Sex and Age in Rutherford
The most populous age groups in Rutherford are 15 to 19 Years (76 | 12.3%) for men and 30 to 34 Years (75 | 12.4%) for women.
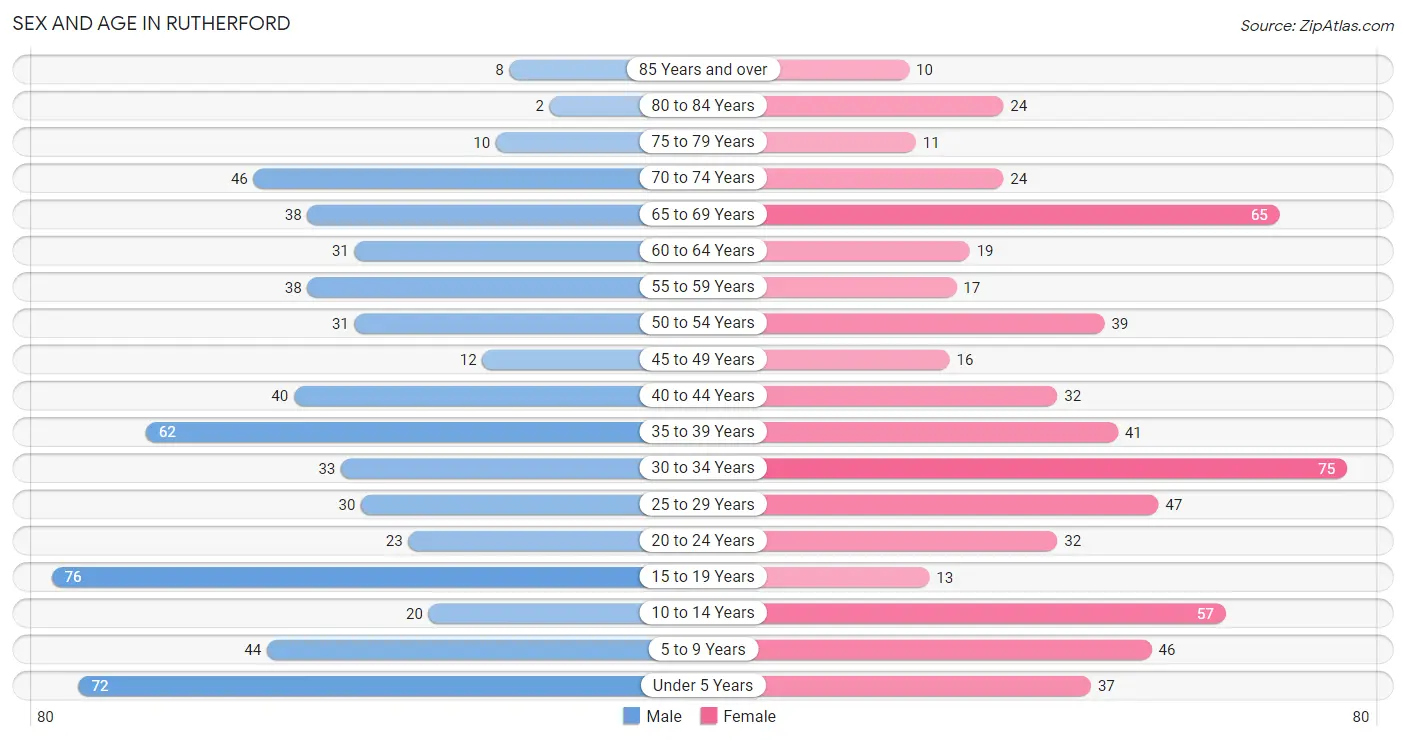
| Age Bracket | Male | Female |
| Under 5 Years | 72 (11.7%) | 37 (6.1%) |
| 5 to 9 Years | 44 (7.1%) | 46 (7.6%) |
| 10 to 14 Years | 20 (3.3%) | 57 (9.4%) |
| 15 to 19 Years | 76 (12.3%) | 13 (2.1%) |
| 20 to 24 Years | 23 (3.7%) | 32 (5.3%) |
| 25 to 29 Years | 30 (4.9%) | 47 (7.8%) |
| 30 to 34 Years | 33 (5.4%) | 75 (12.4%) |
| 35 to 39 Years | 62 (10.1%) | 41 (6.8%) |
| 40 to 44 Years | 40 (6.5%) | 32 (5.3%) |
| 45 to 49 Years | 12 (1.9%) | 16 (2.6%) |
| 50 to 54 Years | 31 (5.0%) | 39 (6.5%) |
| 55 to 59 Years | 38 (6.2%) | 17 (2.8%) |
| 60 to 64 Years | 31 (5.0%) | 19 (3.1%) |
| 65 to 69 Years | 38 (6.2%) | 65 (10.7%) |
| 70 to 74 Years | 46 (7.5%) | 24 (4.0%) |
| 75 to 79 Years | 10 (1.6%) | 11 (1.8%) |
| 80 to 84 Years | 2 (0.3%) | 24 (4.0%) |
| 85 Years and over | 8 (1.3%) | 10 (1.7%) |
| Total | 616 (100.0%) | 605 (100.0%) |
Families and Households in Rutherford
Median Family Size in Rutherford
The median family size in Rutherford is 3.28 persons per family, with married-couple families (230 | 72.3%) accounting for the largest median family size of 3.34 persons per family. On the other hand, single male/father families (17 | 5.3%) represent the smallest median family size with 2.71 persons per family.
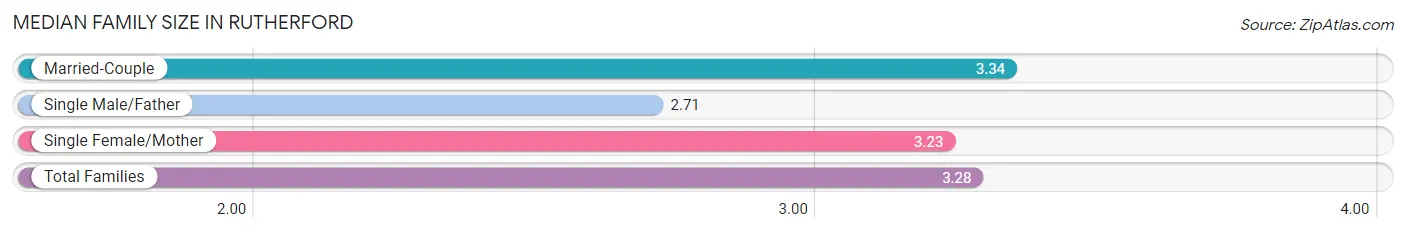
| Family Type | # Families | Family Size |
| Married-Couple | 230 (72.3%) | 3.34 |
| Single Male/Father | 17 (5.3%) | 2.71 |
| Single Female/Mother | 71 (22.3%) | 3.23 |
| Total Families | 318 (100.0%) | 3.28 |
Median Household Size in Rutherford
The median household size in Rutherford is 2.58 persons per household, with married-couple households (230 | 48.6%) accounting for the largest median household size of 3.37 persons per household. non-family households (155 | 32.8%) represent the smallest median household size with 1.05 persons per household.
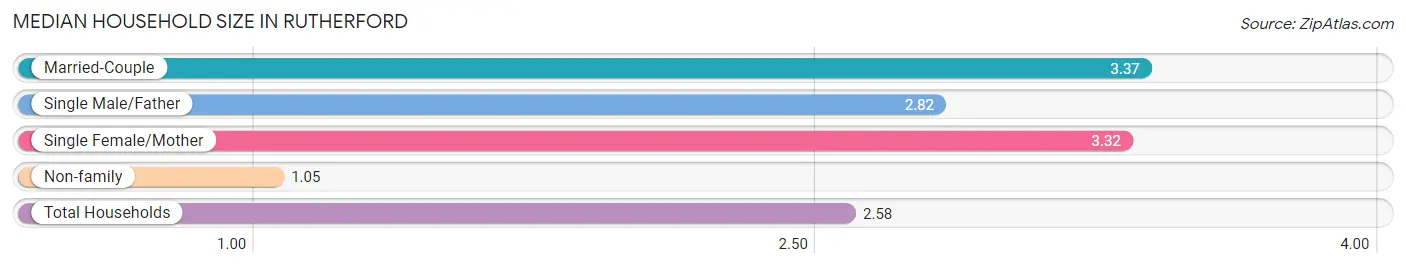
| Household Type | # Households | Household Size |
| Married-Couple | 230 (48.6%) | 3.37 |
| Single Male/Father | 17 (3.6%) | 2.82 |
| Single Female/Mother | 71 (15.0%) | 3.32 |
| Non-family | 155 (32.8%) | 1.05 |
| Total Households | 473 (100.0%) | 2.58 |
Household Size by Marriage Status in Rutherford
Out of a total of 473 households in Rutherford, 318 (67.2%) are family households, while 155 (32.8%) are nonfamily households. The most numerous type of family households are 2-person households, comprising 145, and the most common type of nonfamily households are 1-person households, comprising 148.
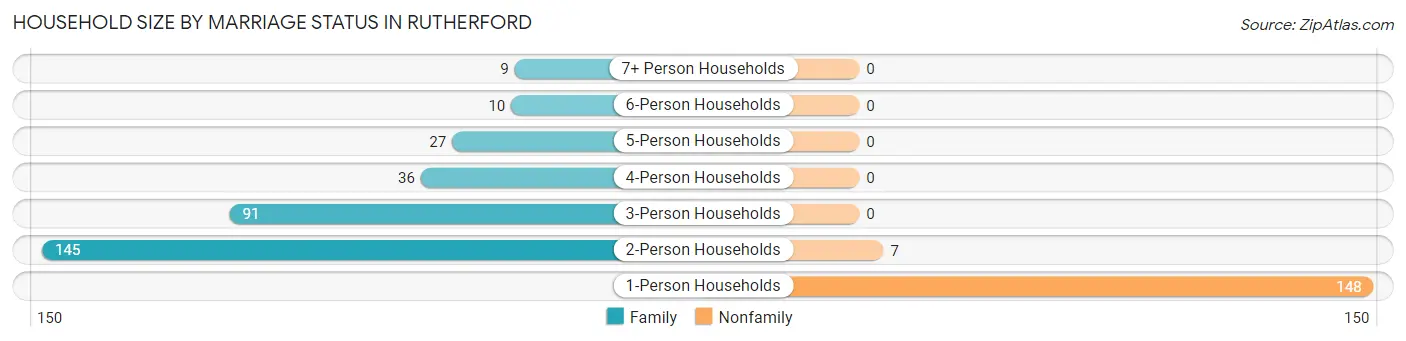
| Household Size | Family Households | Nonfamily Households |
| 1-Person Households | - | 148 (31.3%) |
| 2-Person Households | 145 (30.7%) | 7 (1.5%) |
| 3-Person Households | 91 (19.2%) | 0 (0.0%) |
| 4-Person Households | 36 (7.6%) | 0 (0.0%) |
| 5-Person Households | 27 (5.7%) | 0 (0.0%) |
| 6-Person Households | 10 (2.1%) | 0 (0.0%) |
| 7+ Person Households | 9 (1.9%) | 0 (0.0%) |
| Total | 318 (67.2%) | 155 (32.8%) |
Female Fertility in Rutherford
Fertility by Age in Rutherford
Average fertility rate in Rutherford is 109.0 births per 1,000 women. Women in the age bracket of 20 to 34 years have the highest fertility rate with 182.0 births per 1,000 women. Women in the age bracket of 20 to 34 years acount for 100.0% of all women with births.
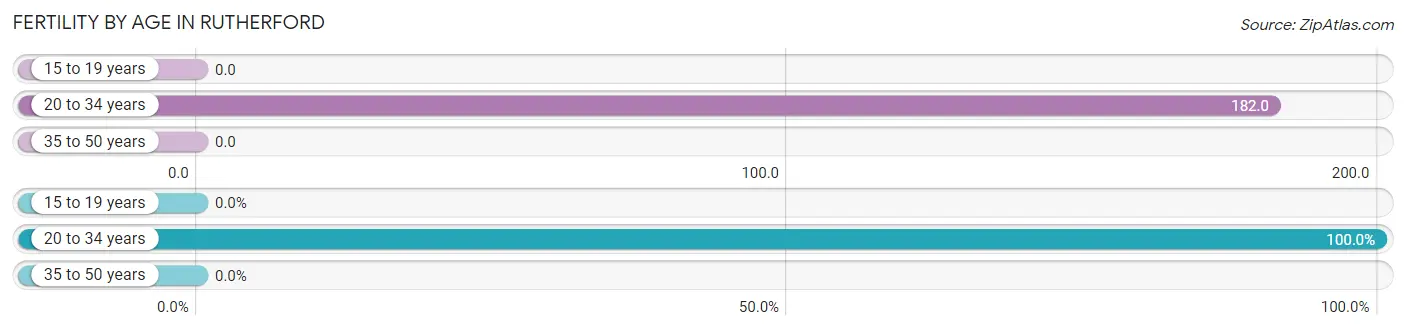
| Age Bracket | Women with Births | Births / 1,000 Women |
| 15 to 19 years | 0 (0.0%) | 0.0 |
| 20 to 34 years | 28 (100.0%) | 182.0 |
| 35 to 50 years | 0 (0.0%) | 0.0 |
| Total | 28 (100.0%) | 109.0 |
Fertility by Age by Marriage Status in Rutherford
53.6% of women with births (28) in Rutherford are married. The highest percentage of unmarried women with births falls into 20 to 34 years age bracket with 46.4% of them unmarried at the time of birth, while the lowest percentage of unmarried women with births belong to 20 to 34 years age bracket with 46.4% of them unmarried.
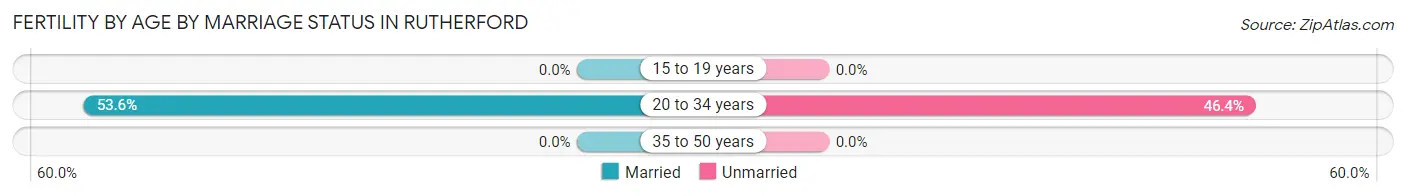
| Age Bracket | Married | Unmarried |
| 15 to 19 years | 0 (0.0%) | 0 (0.0%) |
| 20 to 34 years | 15 (53.6%) | 13 (46.4%) |
| 35 to 50 years | 0 (0.0%) | 0 (0.0%) |
| Total | 15 (53.6%) | 13 (46.4%) |
Fertility by Education in Rutherford
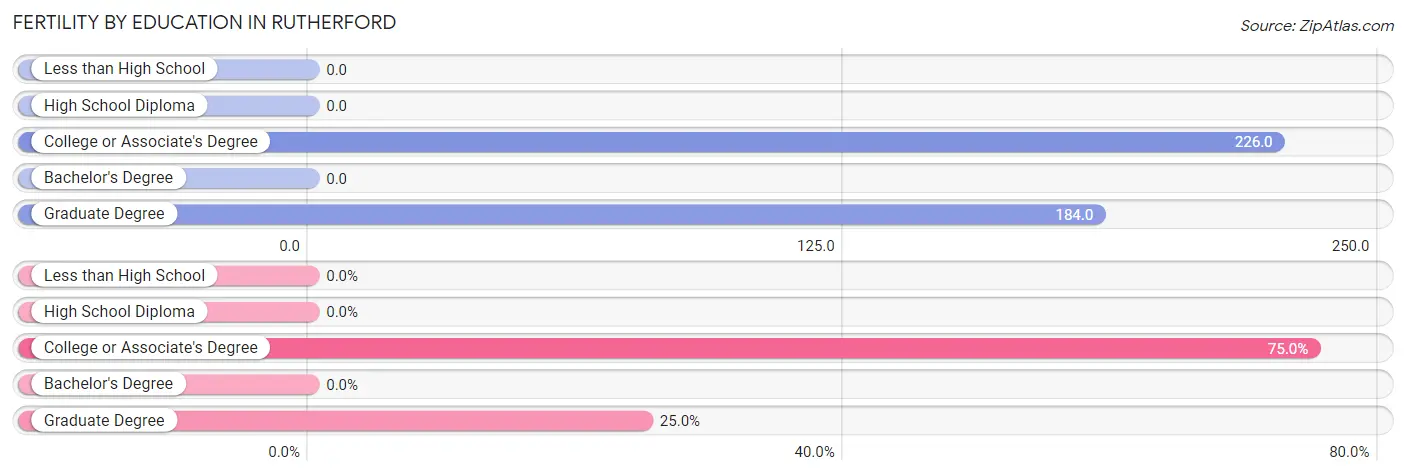
| Educational Attainment | Women with Births | Births / 1,000 Women |
| Less than High School | 0 (0.0%) | 0.0 |
| High School Diploma | 0 (0.0%) | 0.0 |
| College or Associate's Degree | 21 (75.0%) | 226.0 |
| Bachelor's Degree | 0 (0.0%) | 0.0 |
| Graduate Degree | 7 (25.0%) | 184.0 |
| Total | 28 (100.0%) | 109.0 |
Fertility by Education by Marriage Status in Rutherford
46.4% of women with births in Rutherford are unmarried. Women with the educational attainment of graduate degree are most likely to be married with 100.0% of them married at childbirth, while women with the educational attainment of college or associate's degree are least likely to be married with 61.9% of them unmarried at childbirth.
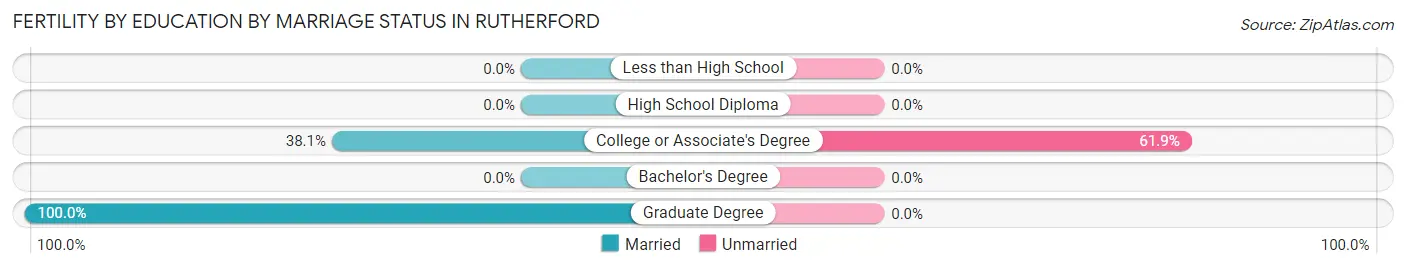
| Educational Attainment | Married | Unmarried |
| Less than High School | 0 (0.0%) | 0 (0.0%) |
| High School Diploma | 0 (0.0%) | 0 (0.0%) |
| College or Associate's Degree | 8 (38.1%) | 13 (61.9%) |
| Bachelor's Degree | 0 (0.0%) | 0 (0.0%) |
| Graduate Degree | 7 (100.0%) | 0 (0.0%) |
| Total | 15 (53.6%) | 13 (46.4%) |
Employment Characteristics in Rutherford
Employment by Class of Employer in Rutherford
Among the 490 employed individuals in Rutherford, private company employees (316 | 64.5%), local government employees (85 | 17.3%), and self-employed (not incorporated) (42 | 8.6%) make up the most common classes of employment.
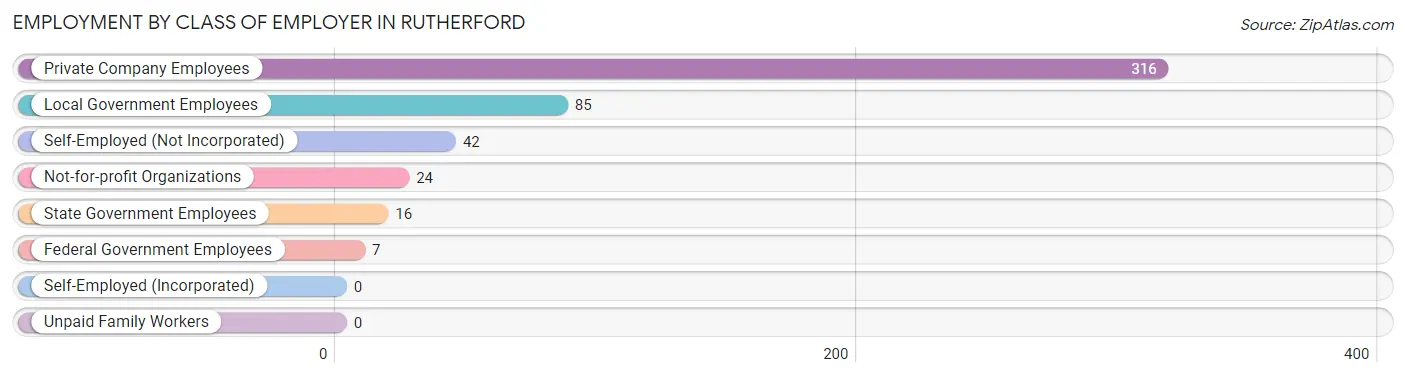
| Employer Class | # Employees | % Employees |
| Private Company Employees | 316 | 64.5% |
| Self-Employed (Incorporated) | 0 | 0.0% |
| Self-Employed (Not Incorporated) | 42 | 8.6% |
| Not-for-profit Organizations | 24 | 4.9% |
| Local Government Employees | 85 | 17.3% |
| State Government Employees | 16 | 3.3% |
| Federal Government Employees | 7 | 1.4% |
| Unpaid Family Workers | 0 | 0.0% |
| Total | 490 | 100.0% |
Employment Status by Age in Rutherford
According to the labor force statistics for Rutherford, out of the total population over 16 years of age (911), 56.1% or 511 individuals are in the labor force, with 4.1% or 21 of them unemployed. The age group with the highest labor force participation rate is 30 to 34 years, with 90.7% or 98 individuals in the labor force. Within the labor force, the 20 to 24 years age range has the highest percentage of unemployed individuals, with 31.0% or 9 of them being unemployed.
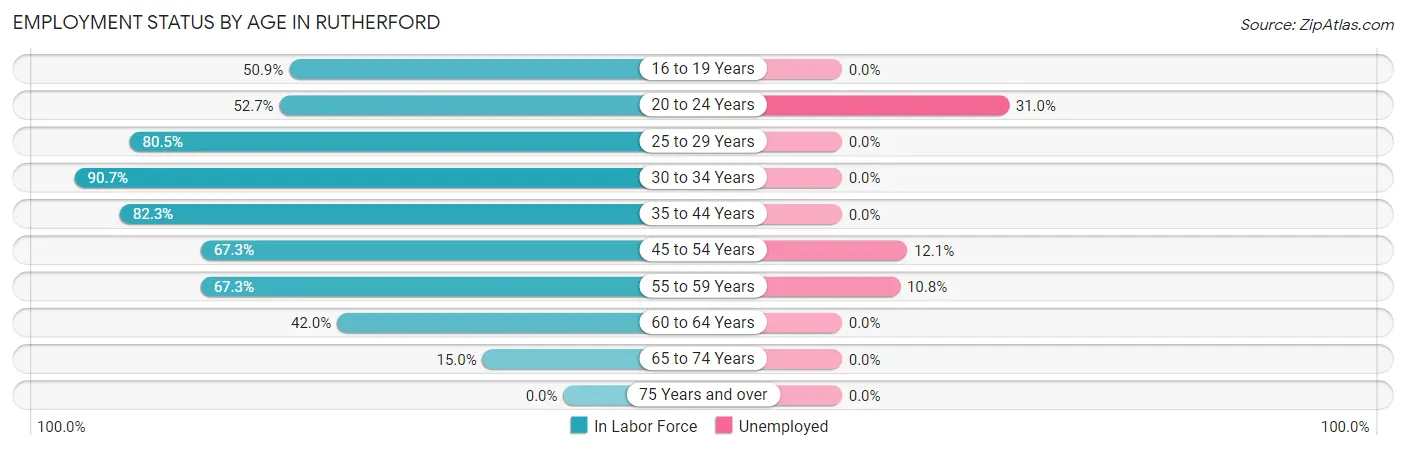
| Age Bracket | In Labor Force | Unemployed |
| 16 to 19 Years | 28 (50.9%) | 0 (0.0%) |
| 20 to 24 Years | 29 (52.7%) | 9 (31.0%) |
| 25 to 29 Years | 62 (80.5%) | 0 (0.0%) |
| 30 to 34 Years | 98 (90.7%) | 0 (0.0%) |
| 35 to 44 Years | 144 (82.3%) | 0 (0.0%) |
| 45 to 54 Years | 66 (67.3%) | 8 (12.1%) |
| 55 to 59 Years | 37 (67.3%) | 4 (10.8%) |
| 60 to 64 Years | 21 (42.0%) | 0 (0.0%) |
| 65 to 74 Years | 26 (15.0%) | 0 (0.0%) |
| 75 Years and over | 0 (0.0%) | 0 (0.0%) |
| Total | 511 (56.1%) | 21 (4.1%) |
Employment Status by Educational Attainment in Rutherford
According to labor force statistics for Rutherford, 76.0% of individuals (428) out of the total population between 25 and 64 years of age (563) are in the labor force, with 2.8% or 12 of them being unemployed. The group with the highest labor force participation rate are those with the educational attainment of bachelor's degree or higher, with 85.3% or 81 individuals in the labor force. Within the labor force, individuals with less than high school education have the highest percentage of unemployment, with 16.3% or 8 of them being unemployed.
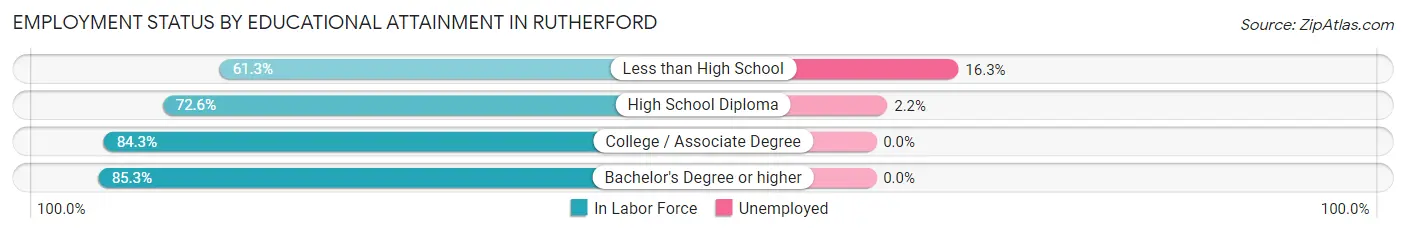
| Educational Attainment | In Labor Force | Unemployed |
| Less than High School | 49 (61.3%) | 13 (16.3%) |
| High School Diploma | 180 (72.6%) | 5 (2.2%) |
| College / Associate Degree | 118 (84.3%) | 0 (0.0%) |
| Bachelor's Degree or higher | 81 (85.3%) | 0 (0.0%) |
| Total | 428 (76.0%) | 16 (2.8%) |
Employment Occupations by Sex in Rutherford
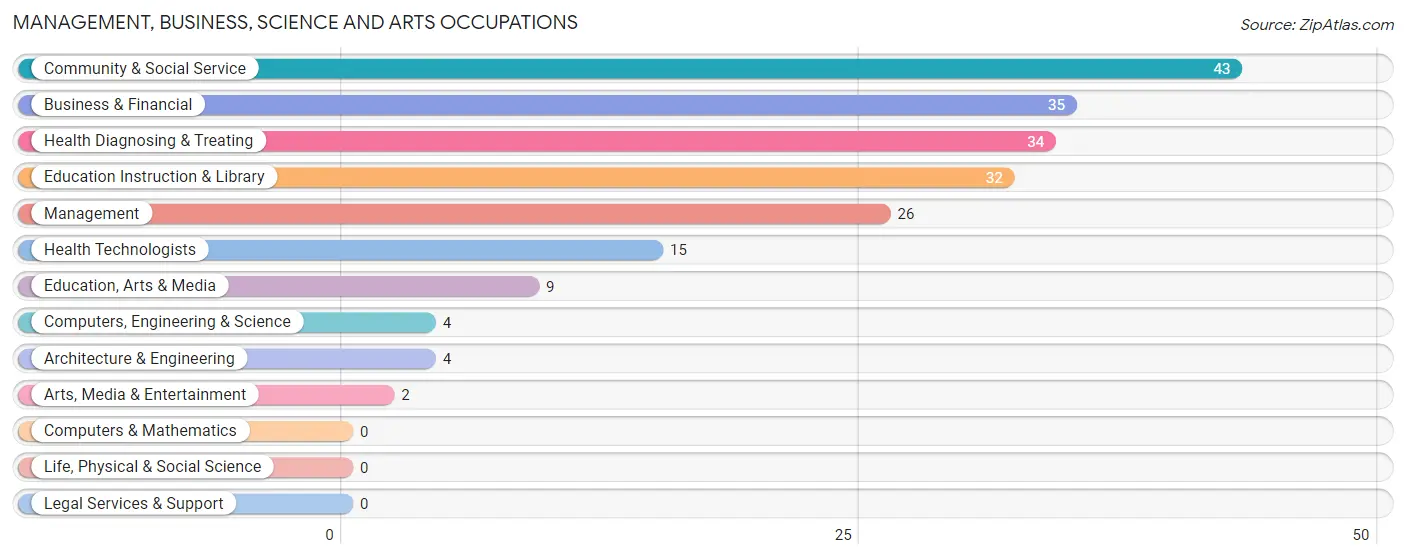
Management, Business, Science and Arts Occupations
The most common Management, Business, Science and Arts occupations in Rutherford are Community & Social Service (43 | 8.8%), Business & Financial (35 | 7.1%), Health Diagnosing & Treating (34 | 6.9%), Education Instruction & Library (32 | 6.5%), and Management (26 | 5.3%).
Management, Business, Science and Arts Occupations by Sex
Within the Management, Business, Science and Arts occupations in Rutherford, the most male-oriented occupations are Computers, Engineering & Science (100.0%), Architecture & Engineering (100.0%), and Arts, Media & Entertainment (100.0%), while the most female-oriented occupations are Education Instruction & Library (100.0%), Health Diagnosing & Treating (100.0%), and Health Technologists (100.0%).
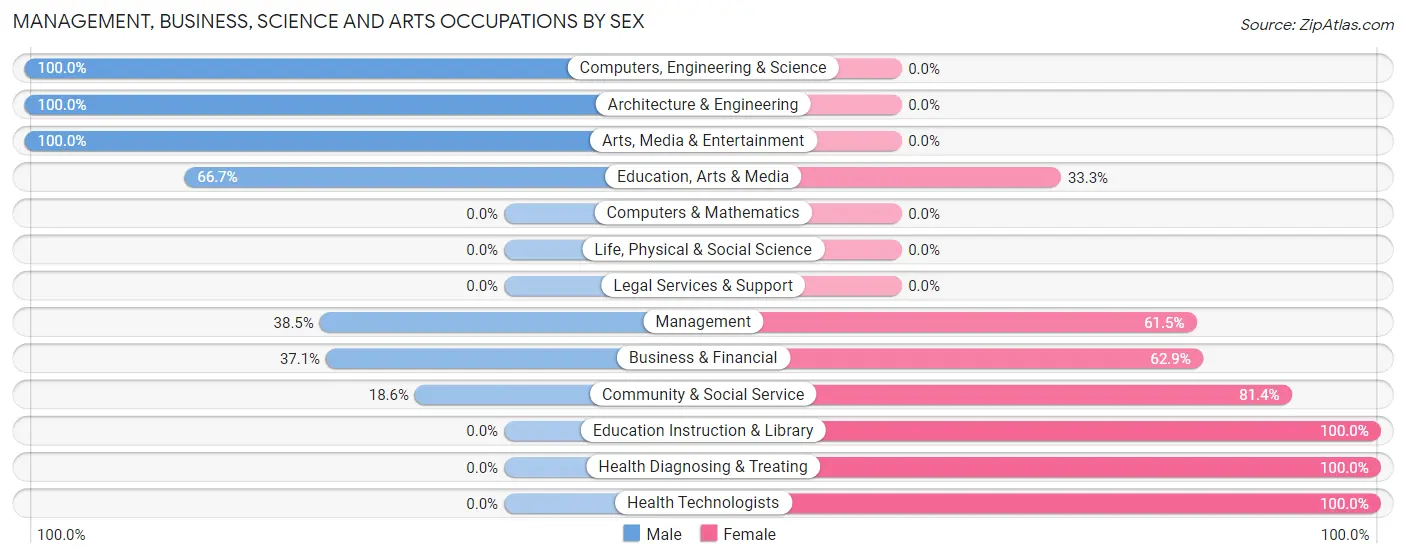
| Occupation | Male | Female |
| Management | 10 (38.5%) | 16 (61.5%) |
| Business & Financial | 13 (37.1%) | 22 (62.9%) |
| Computers, Engineering & Science | 4 (100.0%) | 0 (0.0%) |
| Computers & Mathematics | 0 (0.0%) | 0 (0.0%) |
| Architecture & Engineering | 4 (100.0%) | 0 (0.0%) |
| Life, Physical & Social Science | 0 (0.0%) | 0 (0.0%) |
| Community & Social Service | 8 (18.6%) | 35 (81.4%) |
| Education, Arts & Media | 6 (66.7%) | 3 (33.3%) |
| Legal Services & Support | 0 (0.0%) | 0 (0.0%) |
| Education Instruction & Library | 0 (0.0%) | 32 (100.0%) |
| Arts, Media & Entertainment | 2 (100.0%) | 0 (0.0%) |
| Health Diagnosing & Treating | 0 (0.0%) | 34 (100.0%) |
| Health Technologists | 0 (0.0%) | 15 (100.0%) |
| Total (Category) | 35 (24.6%) | 107 (75.3%) |
| Total (Overall) | 250 (51.0%) | 240 (49.0%) |
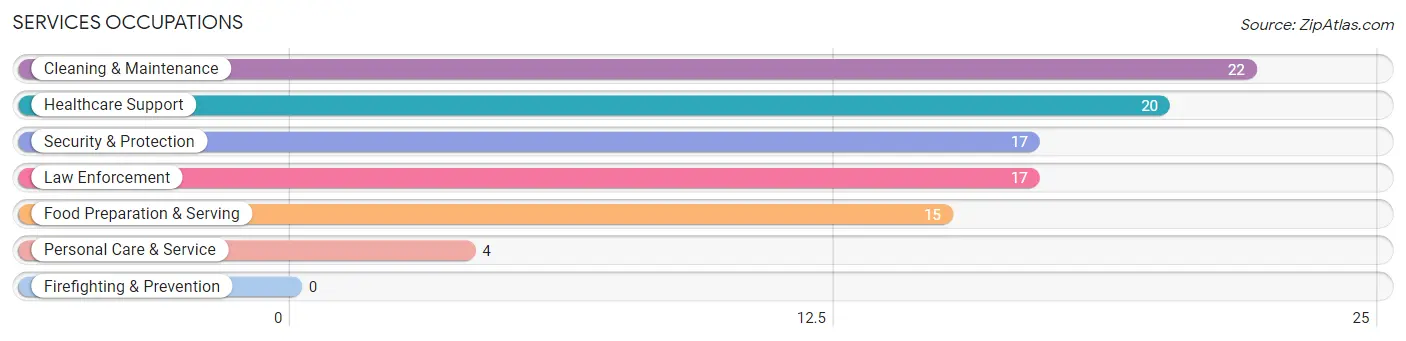
Services Occupations
The most common Services occupations in Rutherford are Cleaning & Maintenance (22 | 4.5%), Healthcare Support (20 | 4.1%), Security & Protection (17 | 3.5%), Law Enforcement (17 | 3.5%), and Food Preparation & Serving (15 | 3.1%).
Services Occupations by Sex
Within the Services occupations in Rutherford, the most male-oriented occupations are Security & Protection (100.0%), Law Enforcement (100.0%), and Cleaning & Maintenance (63.6%), while the most female-oriented occupations are Personal Care & Service (100.0%), Food Preparation & Serving (73.3%), and Healthcare Support (45.0%).
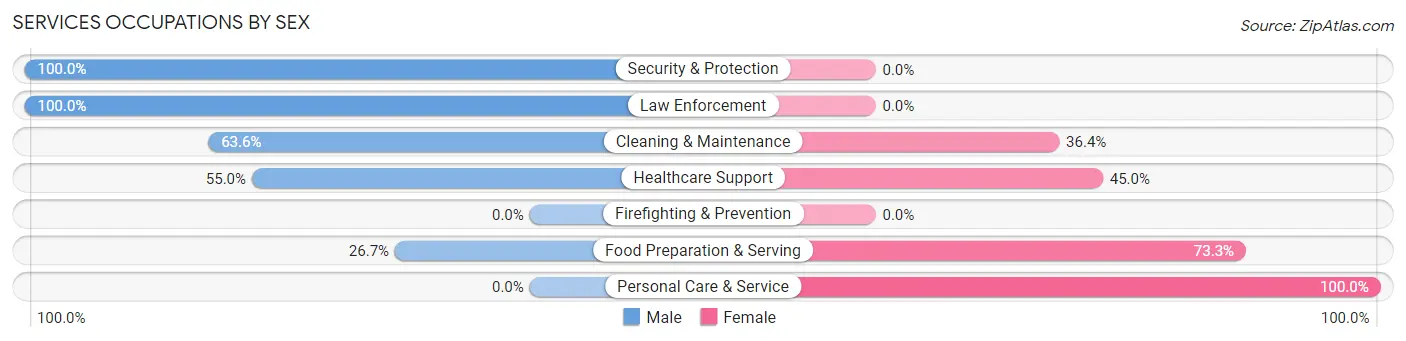
| Occupation | Male | Female |
| Healthcare Support | 11 (55.0%) | 9 (45.0%) |
| Security & Protection | 17 (100.0%) | 0 (0.0%) |
| Firefighting & Prevention | 0 (0.0%) | 0 (0.0%) |
| Law Enforcement | 17 (100.0%) | 0 (0.0%) |
| Food Preparation & Serving | 4 (26.7%) | 11 (73.3%) |
| Cleaning & Maintenance | 14 (63.6%) | 8 (36.4%) |
| Personal Care & Service | 0 (0.0%) | 4 (100.0%) |
| Total (Category) | 46 (59.0%) | 32 (41.0%) |
| Total (Overall) | 250 (51.0%) | 240 (49.0%) |
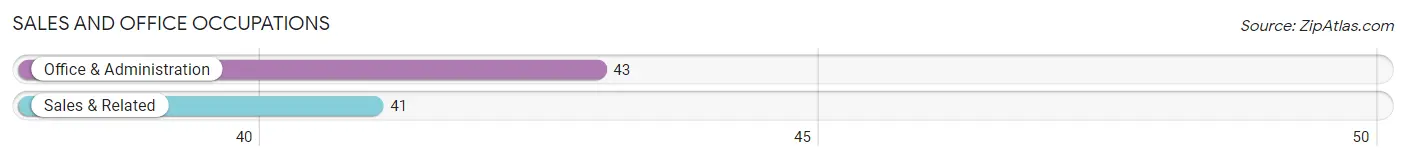
Sales and Office Occupations
The most common Sales and Office occupations in Rutherford are Office & Administration (43 | 8.8%), and Sales & Related (41 | 8.4%).
Sales and Office Occupations by Sex
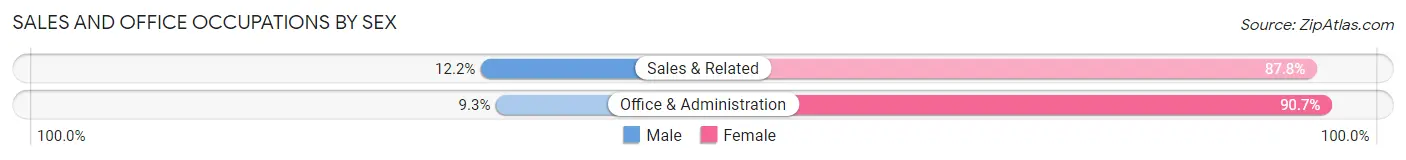
| Occupation | Male | Female |
| Sales & Related | 5 (12.2%) | 36 (87.8%) |
| Office & Administration | 4 (9.3%) | 39 (90.7%) |
| Total (Category) | 9 (10.7%) | 75 (89.3%) |
| Total (Overall) | 250 (51.0%) | 240 (49.0%) |
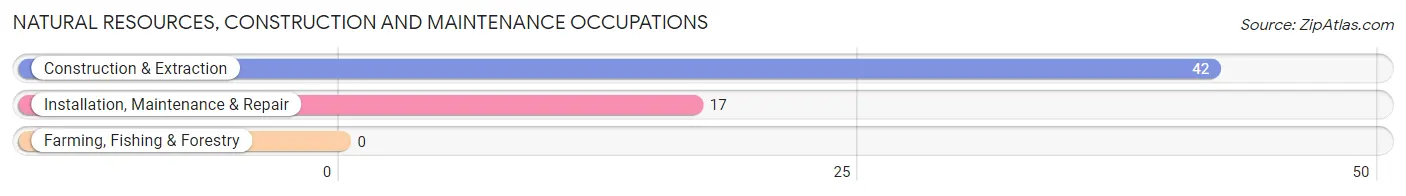
Natural Resources, Construction and Maintenance Occupations
The most common Natural Resources, Construction and Maintenance occupations in Rutherford are Construction & Extraction (42 | 8.6%), and Installation, Maintenance & Repair (17 | 3.5%).
Natural Resources, Construction and Maintenance Occupations by Sex
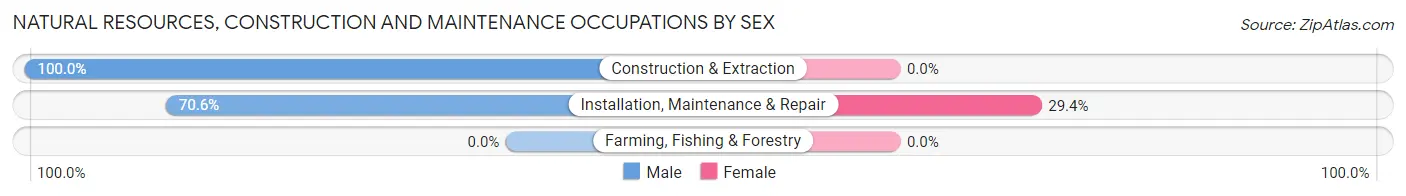
| Occupation | Male | Female |
| Farming, Fishing & Forestry | 0 (0.0%) | 0 (0.0%) |
| Construction & Extraction | 42 (100.0%) | 0 (0.0%) |
| Installation, Maintenance & Repair | 12 (70.6%) | 5 (29.4%) |
| Total (Category) | 54 (91.5%) | 5 (8.5%) |
| Total (Overall) | 250 (51.0%) | 240 (49.0%) |
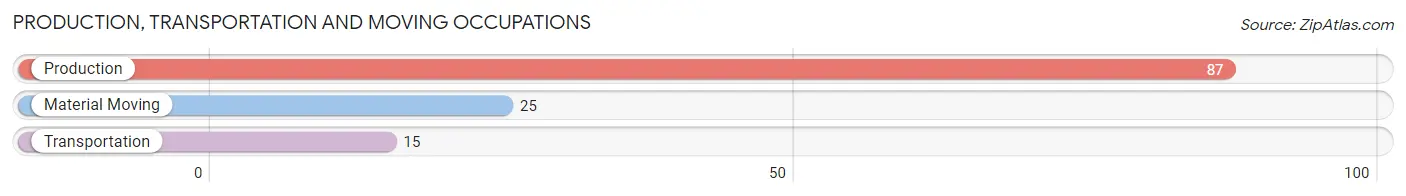
Production, Transportation and Moving Occupations
The most common Production, Transportation and Moving occupations in Rutherford are Production (87 | 17.8%), Material Moving (25 | 5.1%), and Transportation (15 | 3.1%).
Production, Transportation and Moving Occupations by Sex
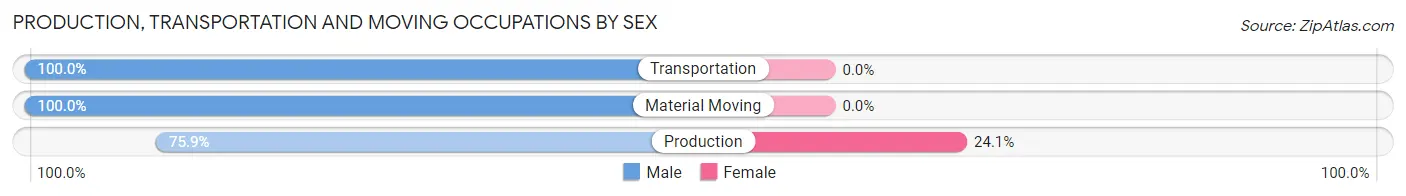
| Occupation | Male | Female |
| Production | 66 (75.9%) | 21 (24.1%) |
| Transportation | 15 (100.0%) | 0 (0.0%) |
| Material Moving | 25 (100.0%) | 0 (0.0%) |
| Total (Category) | 106 (83.5%) | 21 (16.5%) |
| Total (Overall) | 250 (51.0%) | 240 (49.0%) |
Employment Industries by Sex in Rutherford
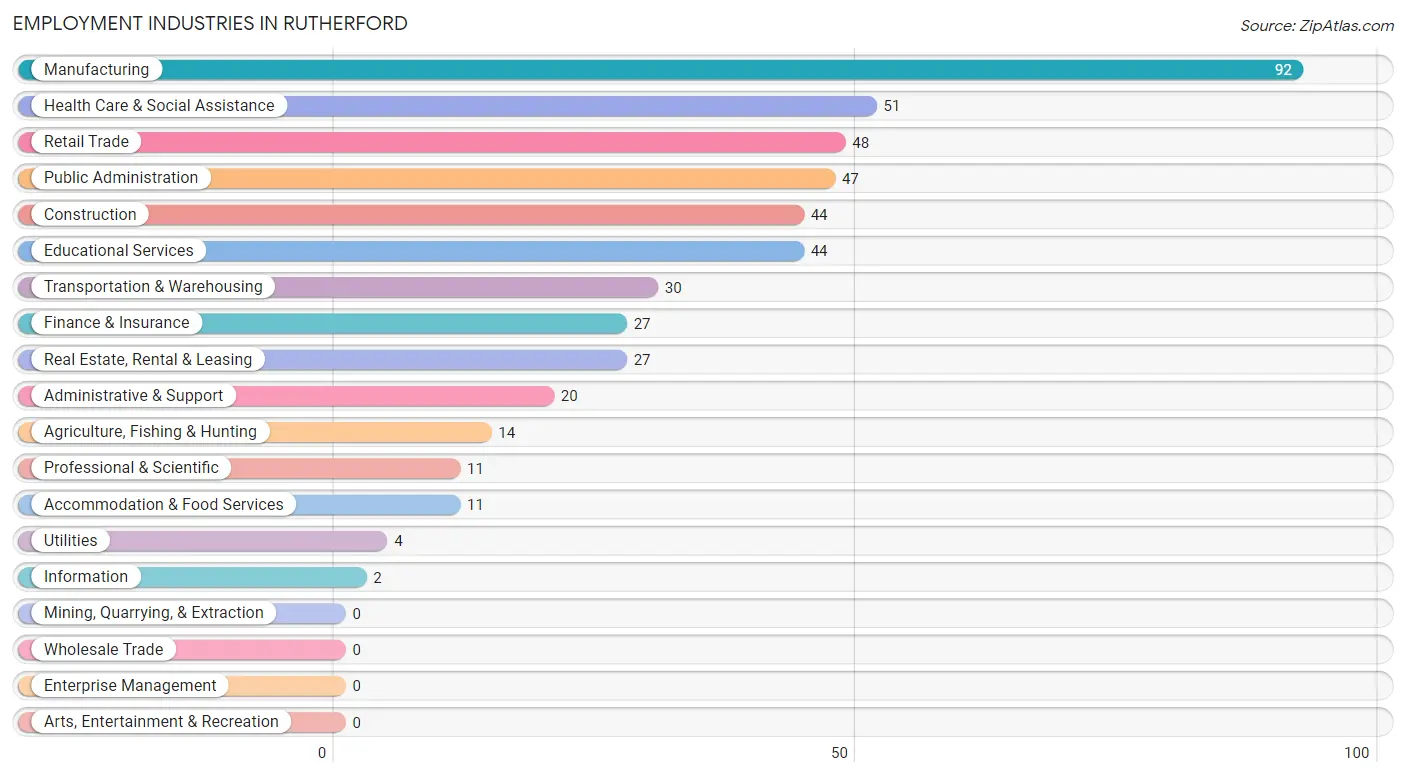
Employment Industries in Rutherford
The major employment industries in Rutherford include Manufacturing (92 | 18.8%), Health Care & Social Assistance (51 | 10.4%), Retail Trade (48 | 9.8%), Public Administration (47 | 9.6%), and Construction (44 | 9.0%).
Employment Industries by Sex in Rutherford
The Rutherford industries that see more men than women are Utilities (100.0%), Information (100.0%), and Professional & Scientific (100.0%), whereas the industries that tend to have a higher number of women are Educational Services (100.0%), Accommodation & Food Services (100.0%), and Health Care & Social Assistance (92.2%).
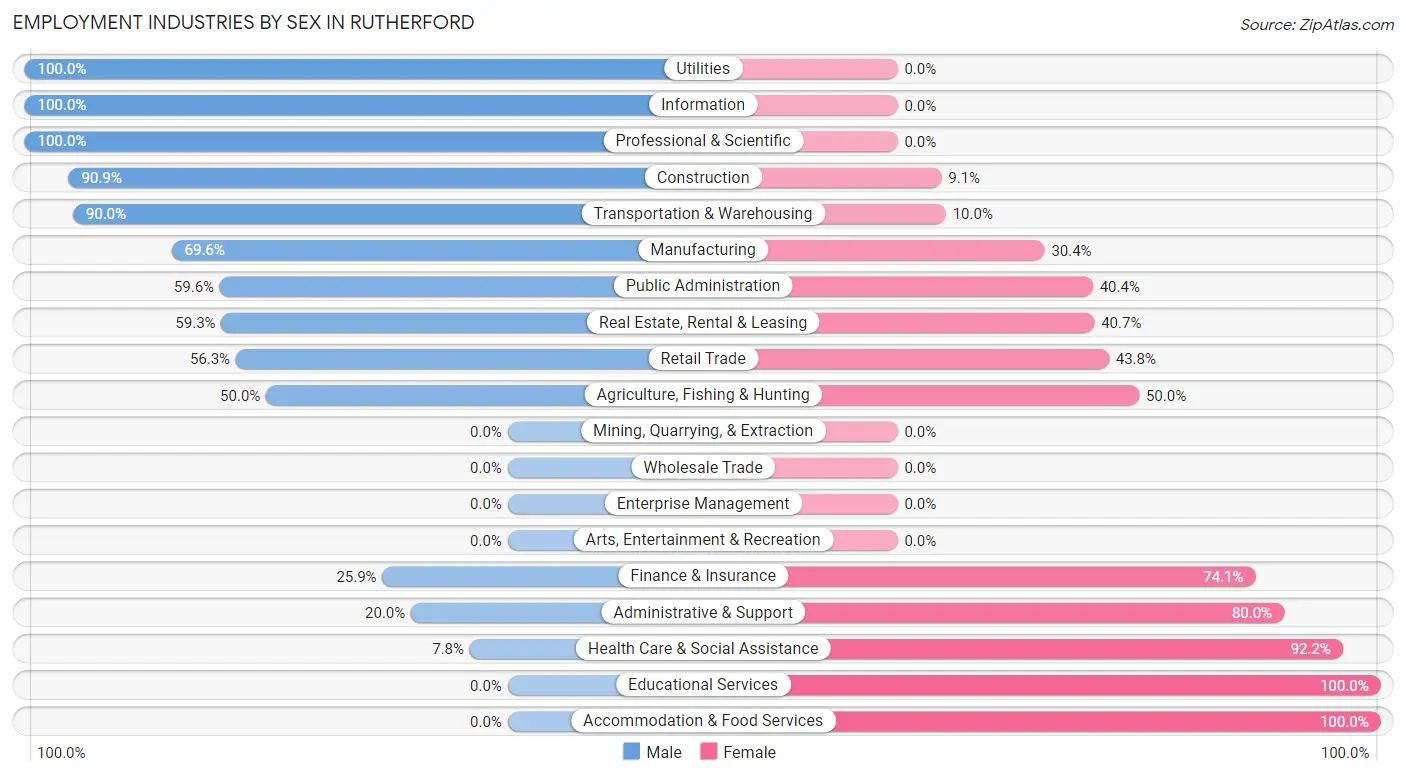
| Industry | Male | Female |
| Agriculture, Fishing & Hunting | 7 (50.0%) | 7 (50.0%) |
| Mining, Quarrying, & Extraction | 0 (0.0%) | 0 (0.0%) |
| Construction | 40 (90.9%) | 4 (9.1%) |
| Manufacturing | 64 (69.6%) | 28 (30.4%) |
| Wholesale Trade | 0 (0.0%) | 0 (0.0%) |
| Retail Trade | 27 (56.2%) | 21 (43.8%) |
| Transportation & Warehousing | 27 (90.0%) | 3 (10.0%) |
| Utilities | 4 (100.0%) | 0 (0.0%) |
| Information | 2 (100.0%) | 0 (0.0%) |
| Finance & Insurance | 7 (25.9%) | 20 (74.1%) |
| Real Estate, Rental & Leasing | 16 (59.3%) | 11 (40.7%) |
| Professional & Scientific | 11 (100.0%) | 0 (0.0%) |
| Enterprise Management | 0 (0.0%) | 0 (0.0%) |
| Administrative & Support | 4 (20.0%) | 16 (80.0%) |
| Educational Services | 0 (0.0%) | 44 (100.0%) |
| Health Care & Social Assistance | 4 (7.8%) | 47 (92.2%) |
| Arts, Entertainment & Recreation | 0 (0.0%) | 0 (0.0%) |
| Accommodation & Food Services | 0 (0.0%) | 11 (100.0%) |
| Public Administration | 28 (59.6%) | 19 (40.4%) |
| Total | 250 (51.0%) | 240 (49.0%) |
Education in Rutherford
School Enrollment in Rutherford
The most common levels of schooling among the 300 students in Rutherford are high school (85 | 28.3%), elementary school (66 | 22.0%), and middle school (39 | 13.0%).
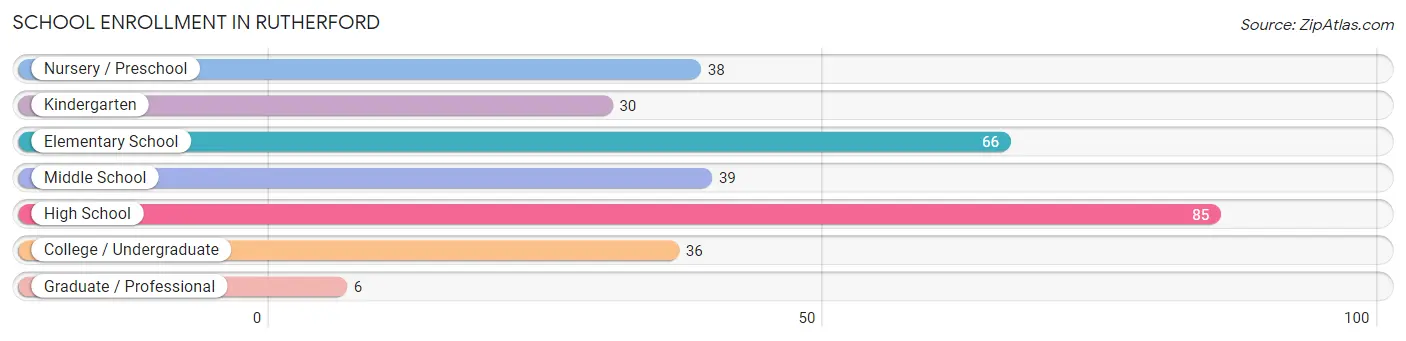
| School Level | # Students | % Students |
| Nursery / Preschool | 38 | 12.7% |
| Kindergarten | 30 | 10.0% |
| Elementary School | 66 | 22.0% |
| Middle School | 39 | 13.0% |
| High School | 85 | 28.3% |
| College / Undergraduate | 36 | 12.0% |
| Graduate / Professional | 6 | 2.0% |
| Total | 300 | 100.0% |
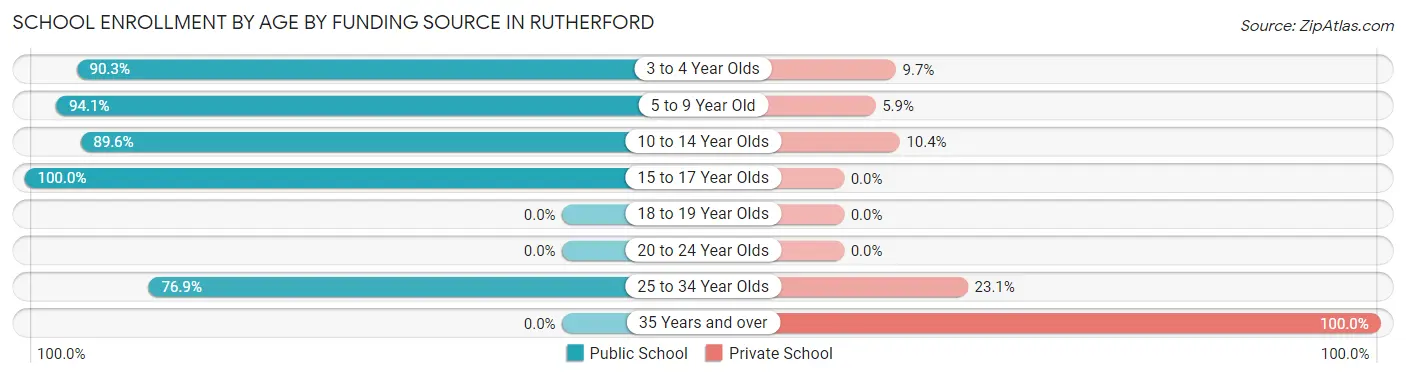
School Enrollment by Age by Funding Source in Rutherford
Out of a total of 300 students who are enrolled in schools in Rutherford, 38 (12.7%) attend a private institution, while the remaining 262 (87.3%) are enrolled in public schools. The age group of 35 years and over has the highest likelihood of being enrolled in private schools, with 16 (100.0% in the age bracket) enrolled. Conversely, the age group of 15 to 17 year olds has the lowest likelihood of being enrolled in a private school, with 65 (100.0% in the age bracket) attending a public institution.
| Age Bracket | Public School | Private School |
| 3 to 4 Year Olds | 28 (90.3%) | 3 (9.7%) |
| 5 to 9 Year Old | 80 (94.1%) | 5 (5.9%) |
| 10 to 14 Year Olds | 69 (89.6%) | 8 (10.4%) |
| 15 to 17 Year Olds | 65 (100.0%) | 0 (0.0%) |
| 18 to 19 Year Olds | 0 (0.0%) | 0 (0.0%) |
| 20 to 24 Year Olds | 0 (0.0%) | 0 (0.0%) |
| 25 to 34 Year Olds | 20 (76.9%) | 6 (23.1%) |
| 35 Years and over | 0 (0.0%) | 16 (100.0%) |
| Total | 262 (87.3%) | 38 (12.7%) |
Educational Attainment by Field of Study in Rutherford
Business (36 | 32.7%), science & technology (23 | 20.9%), education (19 | 17.3%), liberal arts & history (12 | 10.9%), and arts & humanities (11 | 10.0%) are the most common fields of study among 110 individuals in Rutherford who have obtained a bachelor's degree or higher.
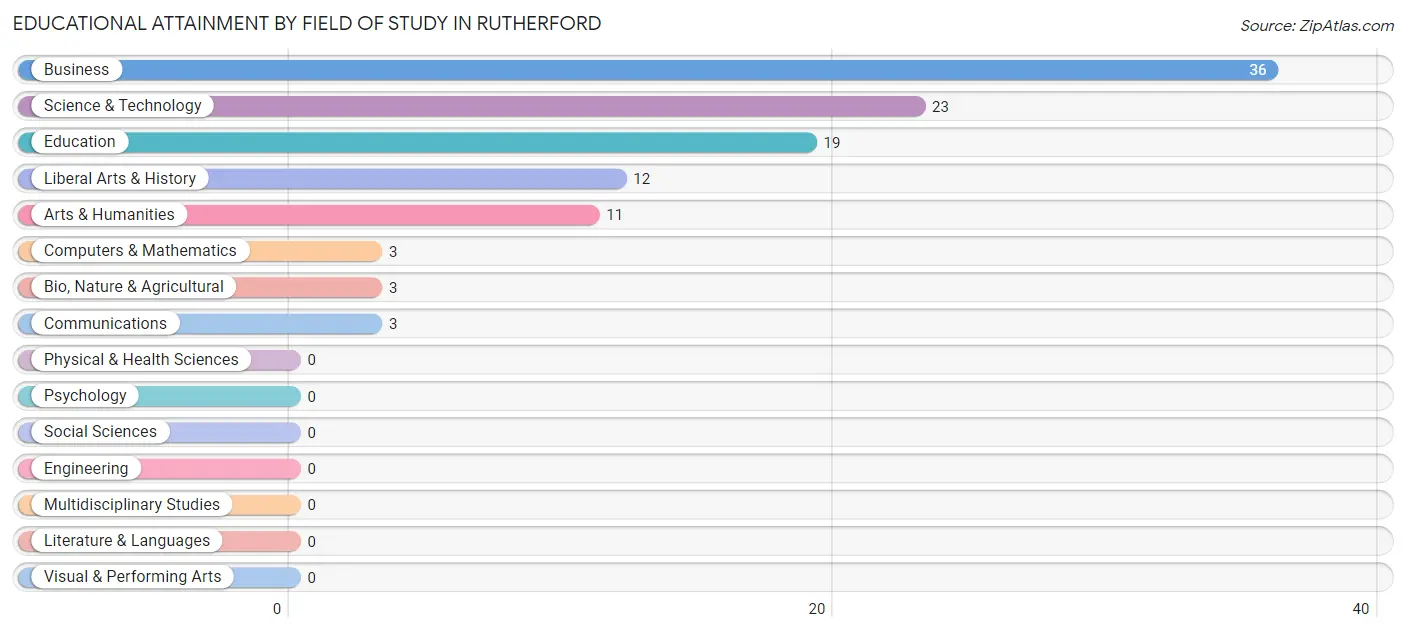
| Field of Study | # Graduates | % Graduates |
| Computers & Mathematics | 3 | 2.7% |
| Bio, Nature & Agricultural | 3 | 2.7% |
| Physical & Health Sciences | 0 | 0.0% |
| Psychology | 0 | 0.0% |
| Social Sciences | 0 | 0.0% |
| Engineering | 0 | 0.0% |
| Multidisciplinary Studies | 0 | 0.0% |
| Science & Technology | 23 | 20.9% |
| Business | 36 | 32.7% |
| Education | 19 | 17.3% |
| Literature & Languages | 0 | 0.0% |
| Liberal Arts & History | 12 | 10.9% |
| Visual & Performing Arts | 0 | 0.0% |
| Communications | 3 | 2.7% |
| Arts & Humanities | 11 | 10.0% |
| Total | 110 | 100.0% |
Transportation & Commute in Rutherford
Vehicle Availability by Sex in Rutherford
The most prevalent vehicle ownership categories in Rutherford are males with 2 vehicles (100, accounting for 40.0%) and females with 2 vehicles (110, making up 41.7%).
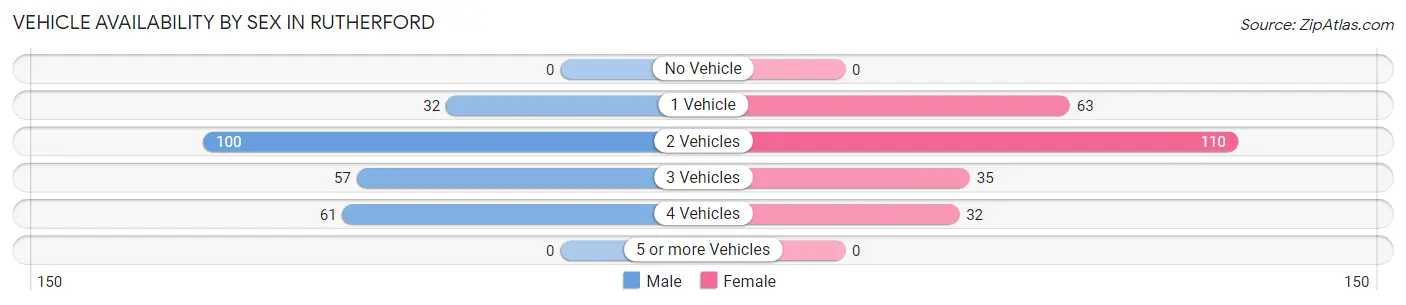
| Vehicles Available | Male | Female |
| No Vehicle | 0 (0.0%) | 0 (0.0%) |
| 1 Vehicle | 32 (12.8%) | 63 (26.3%) |
| 2 Vehicles | 100 (40.0%) | 110 (45.8%) |
| 3 Vehicles | 57 (22.8%) | 35 (14.6%) |
| 4 Vehicles | 61 (24.4%) | 32 (13.3%) |
| 5 or more Vehicles | 0 (0.0%) | 0 (0.0%) |
| Total | 250 (100.0%) | 240 (100.0%) |
Commute Time in Rutherford
The most frequently occuring commute durations in Rutherford are 30 to 34 minutes (116 commuters, 23.9%), 5 to 9 minutes (72 commuters, 14.8%), and 15 to 19 minutes (55 commuters, 11.3%).
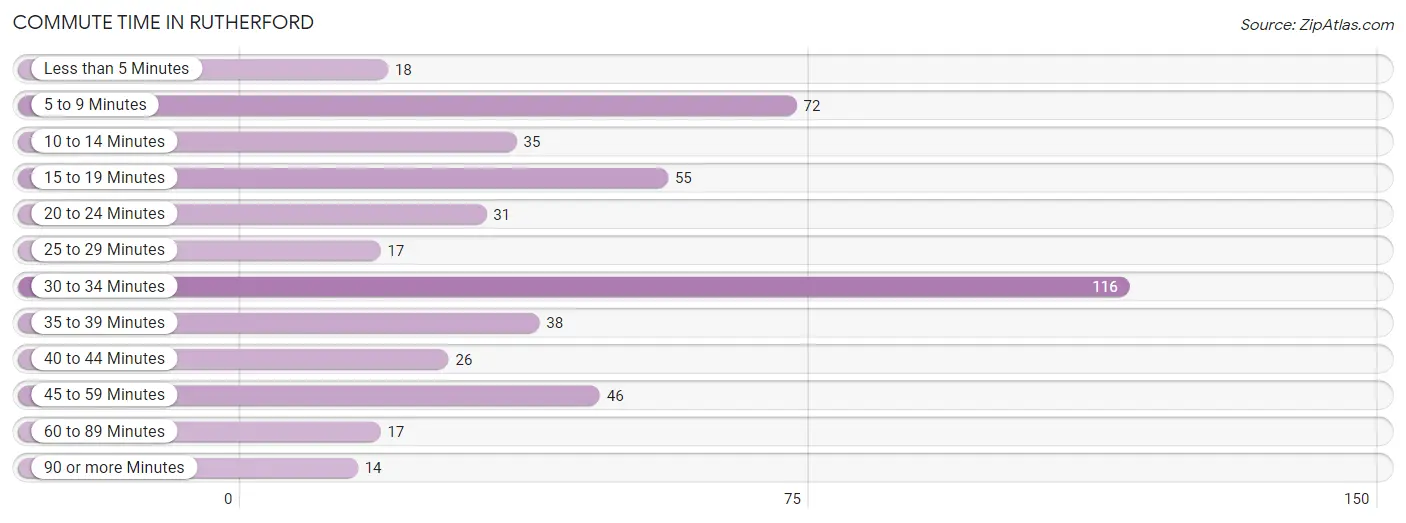
| Commute Time | # Commuters | % Commuters |
| Less than 5 Minutes | 18 | 3.7% |
| 5 to 9 Minutes | 72 | 14.8% |
| 10 to 14 Minutes | 35 | 7.2% |
| 15 to 19 Minutes | 55 | 11.3% |
| 20 to 24 Minutes | 31 | 6.4% |
| 25 to 29 Minutes | 17 | 3.5% |
| 30 to 34 Minutes | 116 | 23.9% |
| 35 to 39 Minutes | 38 | 7.8% |
| 40 to 44 Minutes | 26 | 5.4% |
| 45 to 59 Minutes | 46 | 9.5% |
| 60 to 89 Minutes | 17 | 3.5% |
| 90 or more Minutes | 14 | 2.9% |
Commute Time by Sex in Rutherford
The most common commute times in Rutherford are 5 to 9 minutes (59 commuters, 23.9%) for males and 30 to 34 minutes (59 commuters, 24.8%) for females.
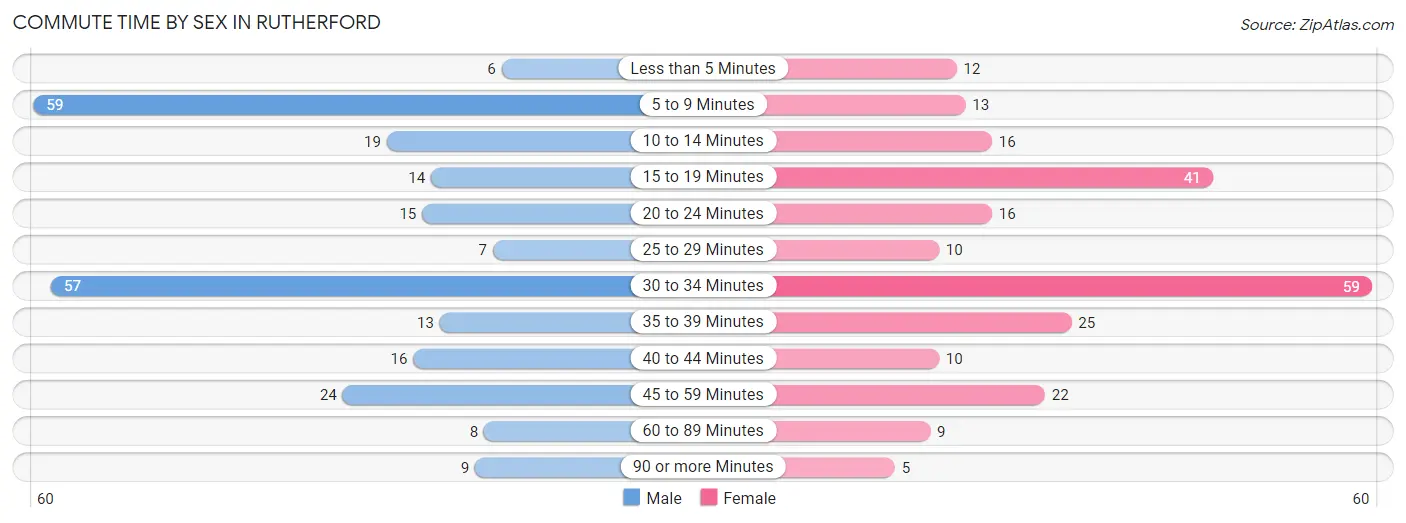
| Commute Time | Male | Female |
| Less than 5 Minutes | 6 (2.4%) | 12 (5.0%) |
| 5 to 9 Minutes | 59 (23.9%) | 13 (5.5%) |
| 10 to 14 Minutes | 19 (7.7%) | 16 (6.7%) |
| 15 to 19 Minutes | 14 (5.7%) | 41 (17.2%) |
| 20 to 24 Minutes | 15 (6.1%) | 16 (6.7%) |
| 25 to 29 Minutes | 7 (2.8%) | 10 (4.2%) |
| 30 to 34 Minutes | 57 (23.1%) | 59 (24.8%) |
| 35 to 39 Minutes | 13 (5.3%) | 25 (10.5%) |
| 40 to 44 Minutes | 16 (6.5%) | 10 (4.2%) |
| 45 to 59 Minutes | 24 (9.7%) | 22 (9.2%) |
| 60 to 89 Minutes | 8 (3.2%) | 9 (3.8%) |
| 90 or more Minutes | 9 (3.6%) | 5 (2.1%) |
Time of Departure to Work by Sex in Rutherford
The most frequent times of departure to work in Rutherford are 6:30 AM to 6:59 AM (48, 19.4%) for males and 7:00 AM to 7:29 AM (55, 23.1%) for females.
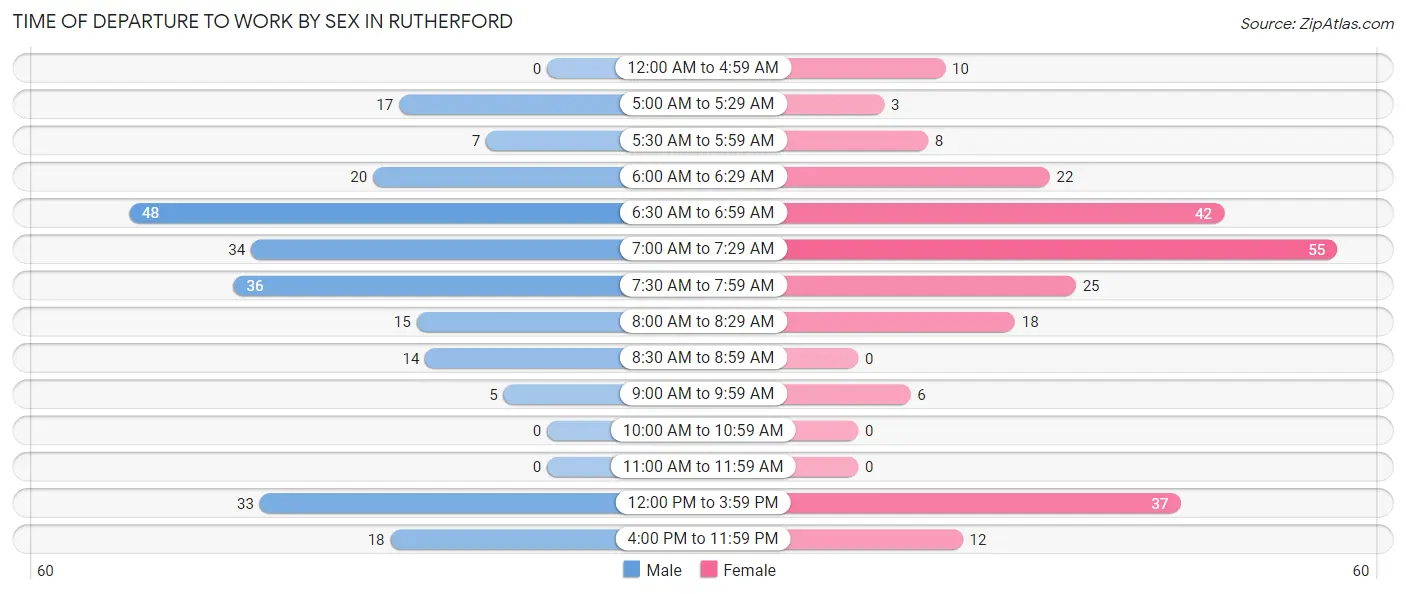
| Time of Departure | Male | Female |
| 12:00 AM to 4:59 AM | 0 (0.0%) | 10 (4.2%) |
| 5:00 AM to 5:29 AM | 17 (6.9%) | 3 (1.3%) |
| 5:30 AM to 5:59 AM | 7 (2.8%) | 8 (3.4%) |
| 6:00 AM to 6:29 AM | 20 (8.1%) | 22 (9.2%) |
| 6:30 AM to 6:59 AM | 48 (19.4%) | 42 (17.6%) |
| 7:00 AM to 7:29 AM | 34 (13.8%) | 55 (23.1%) |
| 7:30 AM to 7:59 AM | 36 (14.6%) | 25 (10.5%) |
| 8:00 AM to 8:29 AM | 15 (6.1%) | 18 (7.6%) |
| 8:30 AM to 8:59 AM | 14 (5.7%) | 0 (0.0%) |
| 9:00 AM to 9:59 AM | 5 (2.0%) | 6 (2.5%) |
| 10:00 AM to 10:59 AM | 0 (0.0%) | 0 (0.0%) |
| 11:00 AM to 11:59 AM | 0 (0.0%) | 0 (0.0%) |
| 12:00 PM to 3:59 PM | 33 (13.4%) | 37 (15.5%) |
| 4:00 PM to 11:59 PM | 18 (7.3%) | 12 (5.0%) |
| Total | 247 (100.0%) | 238 (100.0%) |
Housing Occupancy in Rutherford
Occupancy by Ownership in Rutherford
Of the total 473 dwellings in Rutherford, owner-occupied units account for 354 (74.8%), while renter-occupied units make up 119 (25.2%).
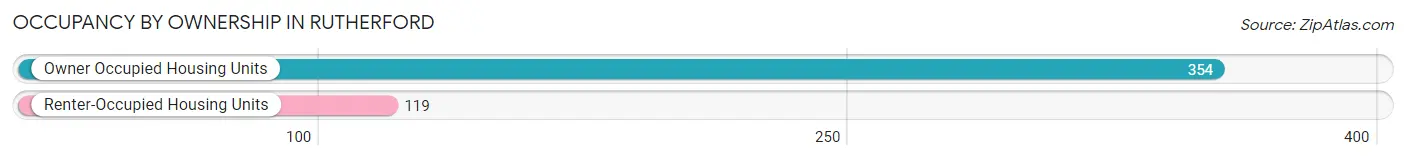
| Occupancy | # Housing Units | % Housing Units |
| Owner Occupied Housing Units | 354 | 74.8% |
| Renter-Occupied Housing Units | 119 | 25.2% |
| Total Occupied Housing Units | 473 | 100.0% |
Occupancy by Household Size in Rutherford
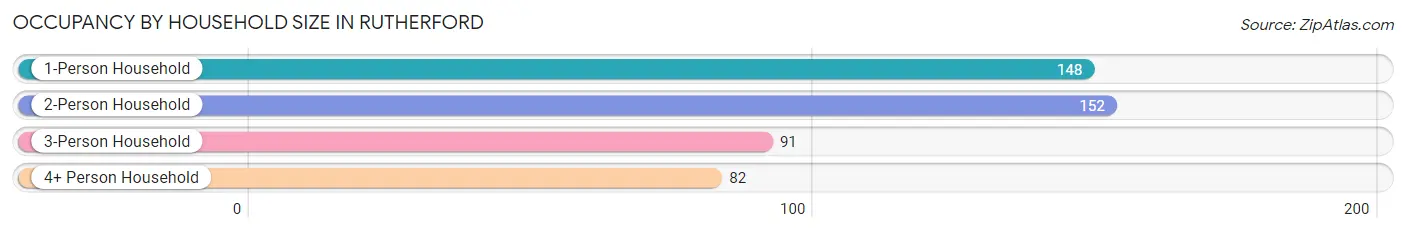
| Household Size | # Housing Units | % Housing Units |
| 1-Person Household | 148 | 31.3% |
| 2-Person Household | 152 | 32.1% |
| 3-Person Household | 91 | 19.2% |
| 4+ Person Household | 82 | 17.3% |
| Total Housing Units | 473 | 100.0% |
Occupancy by Ownership by Household Size in Rutherford
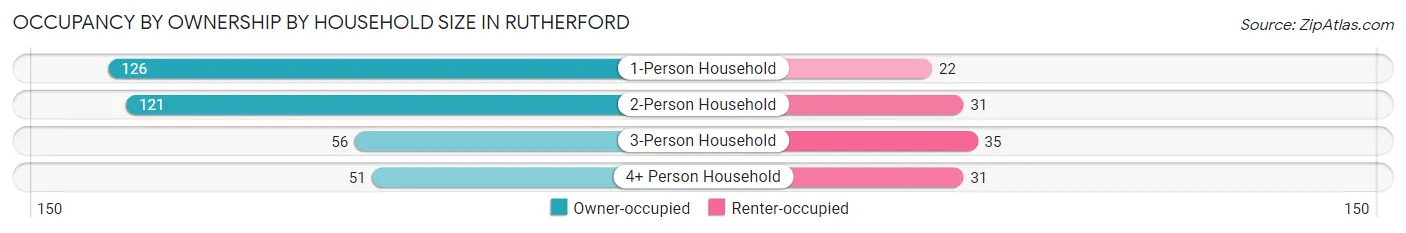
| Household Size | Owner-occupied | Renter-occupied |
| 1-Person Household | 126 (85.1%) | 22 (14.9%) |
| 2-Person Household | 121 (79.6%) | 31 (20.4%) |
| 3-Person Household | 56 (61.5%) | 35 (38.5%) |
| 4+ Person Household | 51 (62.2%) | 31 (37.8%) |
| Total Housing Units | 354 (74.8%) | 119 (25.2%) |
Occupancy by Educational Attainment in Rutherford
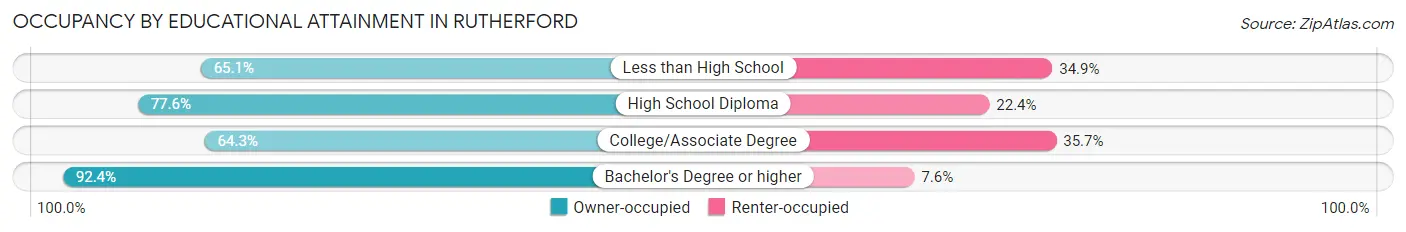
| Household Size | Owner-occupied | Renter-occupied |
| Less than High School | 41 (65.1%) | 22 (34.9%) |
| High School Diploma | 159 (77.6%) | 46 (22.4%) |
| College/Associate Degree | 81 (64.3%) | 45 (35.7%) |
| Bachelor's Degree or higher | 73 (92.4%) | 6 (7.6%) |
Occupancy by Age of Householder in Rutherford
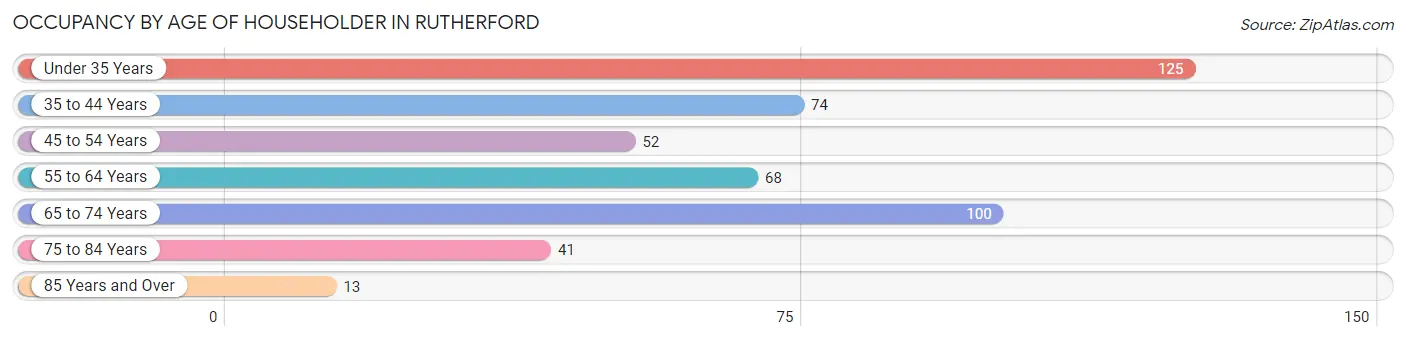
| Age Bracket | # Households | % Households |
| Under 35 Years | 125 | 26.4% |
| 35 to 44 Years | 74 | 15.6% |
| 45 to 54 Years | 52 | 11.0% |
| 55 to 64 Years | 68 | 14.4% |
| 65 to 74 Years | 100 | 21.1% |
| 75 to 84 Years | 41 | 8.7% |
| 85 Years and Over | 13 | 2.8% |
| Total | 473 | 100.0% |
Housing Finances in Rutherford
Median Income by Occupancy in Rutherford
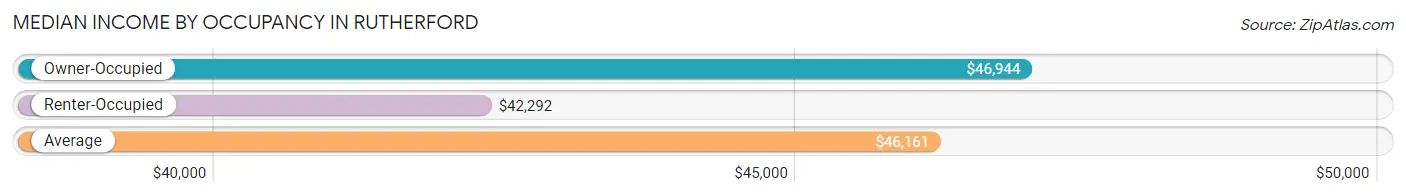
| Occupancy Type | # Households | Median Income |
| Owner-Occupied | 354 (74.8%) | $46,944 |
| Renter-Occupied | 119 (25.2%) | $42,292 |
| Average | 473 (100.0%) | $46,161 |
Occupancy by Householder Income Bracket in Rutherford
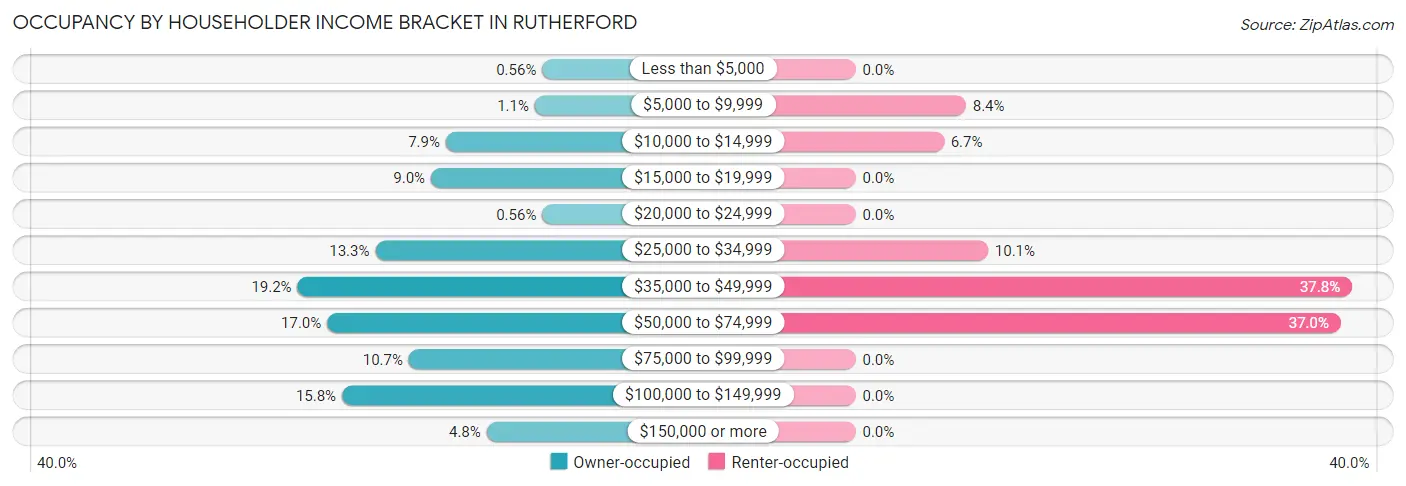
| Income Bracket | Owner-occupied | Renter-occupied |
| Less than $5,000 | 2 (0.6%) | 0 (0.0%) |
| $5,000 to $9,999 | 4 (1.1%) | 10 (8.4%) |
| $10,000 to $14,999 | 28 (7.9%) | 8 (6.7%) |
| $15,000 to $19,999 | 32 (9.0%) | 0 (0.0%) |
| $20,000 to $24,999 | 2 (0.6%) | 0 (0.0%) |
| $25,000 to $34,999 | 47 (13.3%) | 12 (10.1%) |
| $35,000 to $49,999 | 68 (19.2%) | 45 (37.8%) |
| $50,000 to $74,999 | 60 (17.0%) | 44 (37.0%) |
| $75,000 to $99,999 | 38 (10.7%) | 0 (0.0%) |
| $100,000 to $149,999 | 56 (15.8%) | 0 (0.0%) |
| $150,000 or more | 17 (4.8%) | 0 (0.0%) |
| Total | 354 (100.0%) | 119 (100.0%) |
Monthly Housing Cost Tiers in Rutherford
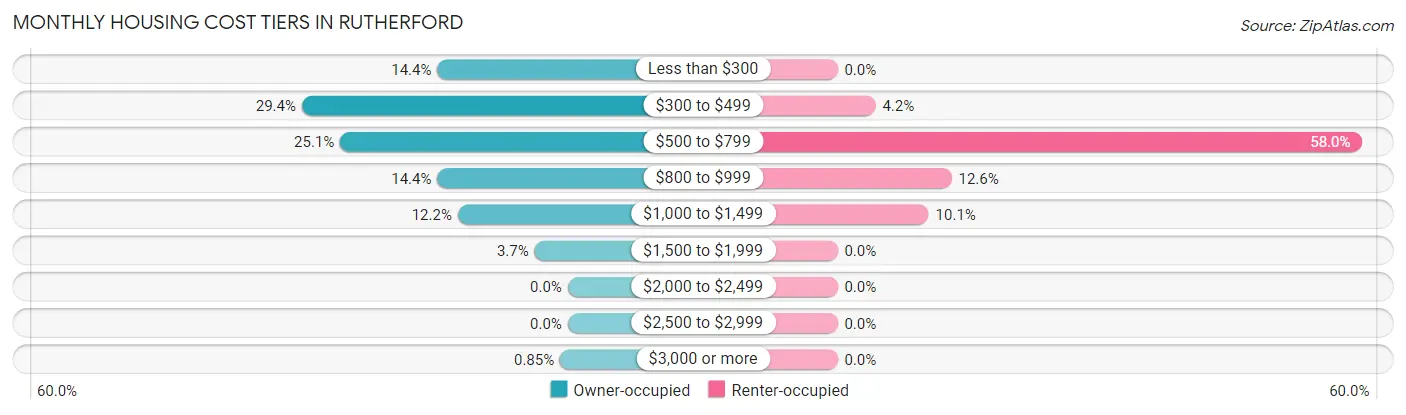
| Monthly Cost | Owner-occupied | Renter-occupied |
| Less than $300 | 51 (14.4%) | 0 (0.0%) |
| $300 to $499 | 104 (29.4%) | 5 (4.2%) |
| $500 to $799 | 89 (25.1%) | 69 (58.0%) |
| $800 to $999 | 51 (14.4%) | 15 (12.6%) |
| $1,000 to $1,499 | 43 (12.1%) | 12 (10.1%) |
| $1,500 to $1,999 | 13 (3.7%) | 0 (0.0%) |
| $2,000 to $2,499 | 0 (0.0%) | 0 (0.0%) |
| $2,500 to $2,999 | 0 (0.0%) | 0 (0.0%) |
| $3,000 or more | 3 (0.9%) | 0 (0.0%) |
| Total | 354 (100.0%) | 119 (100.0%) |
Physical Housing Characteristics in Rutherford
Housing Structures in Rutherford
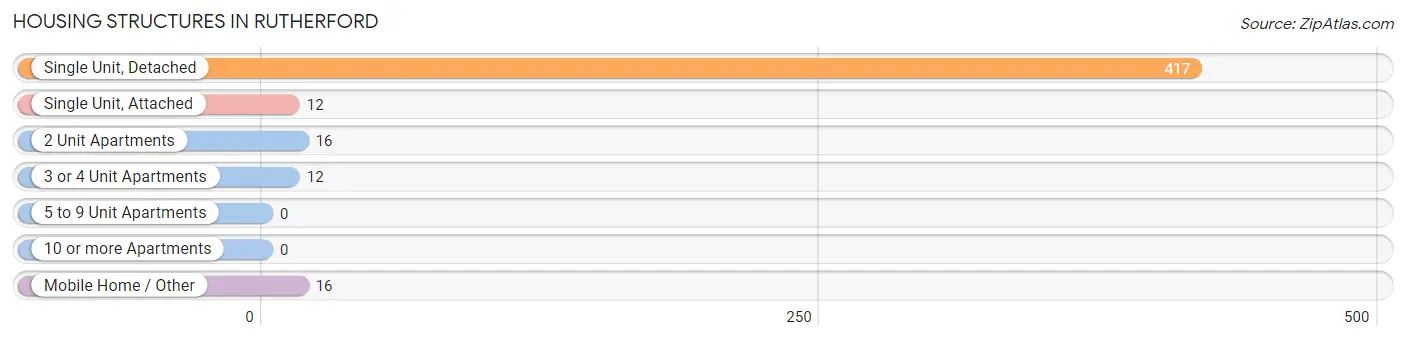
| Structure Type | # Housing Units | % Housing Units |
| Single Unit, Detached | 417 | 88.2% |
| Single Unit, Attached | 12 | 2.5% |
| 2 Unit Apartments | 16 | 3.4% |
| 3 or 4 Unit Apartments | 12 | 2.5% |
| 5 to 9 Unit Apartments | 0 | 0.0% |
| 10 or more Apartments | 0 | 0.0% |
| Mobile Home / Other | 16 | 3.4% |
| Total | 473 | 100.0% |
Housing Structures by Occupancy in Rutherford
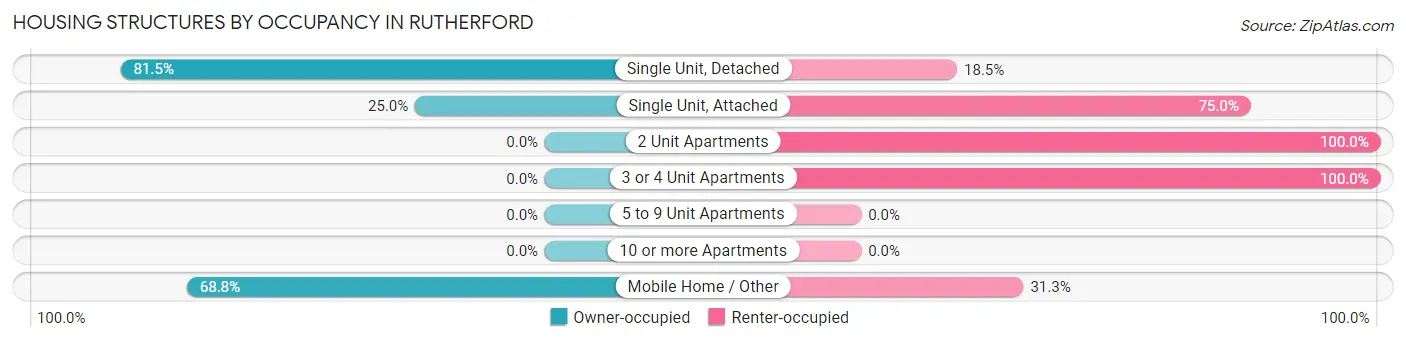
| Structure Type | Owner-occupied | Renter-occupied |
| Single Unit, Detached | 340 (81.5%) | 77 (18.5%) |
| Single Unit, Attached | 3 (25.0%) | 9 (75.0%) |
| 2 Unit Apartments | 0 (0.0%) | 16 (100.0%) |
| 3 or 4 Unit Apartments | 0 (0.0%) | 12 (100.0%) |
| 5 to 9 Unit Apartments | 0 (0.0%) | 0 (0.0%) |
| 10 or more Apartments | 0 (0.0%) | 0 (0.0%) |
| Mobile Home / Other | 11 (68.8%) | 5 (31.2%) |
| Total | 354 (74.8%) | 119 (25.2%) |
Housing Structures by Number of Rooms in Rutherford
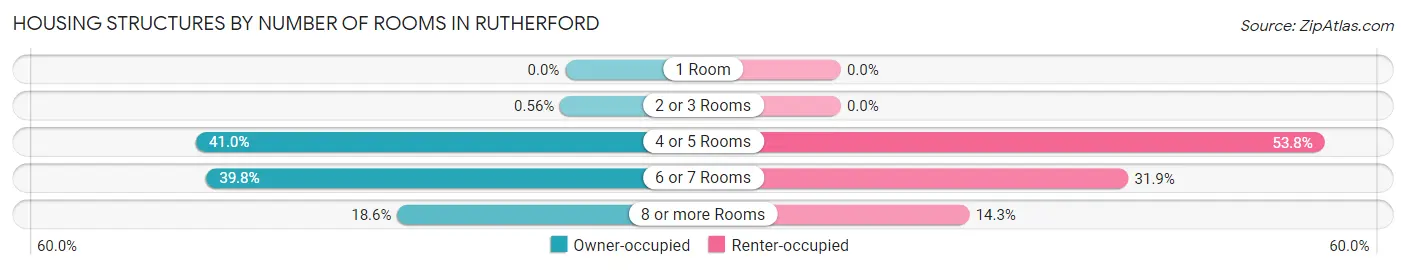
| Number of Rooms | Owner-occupied | Renter-occupied |
| 1 Room | 0 (0.0%) | 0 (0.0%) |
| 2 or 3 Rooms | 2 (0.6%) | 0 (0.0%) |
| 4 or 5 Rooms | 145 (41.0%) | 64 (53.8%) |
| 6 or 7 Rooms | 141 (39.8%) | 38 (31.9%) |
| 8 or more Rooms | 66 (18.6%) | 17 (14.3%) |
| Total | 354 (100.0%) | 119 (100.0%) |
Housing Structure by Heating Type in Rutherford
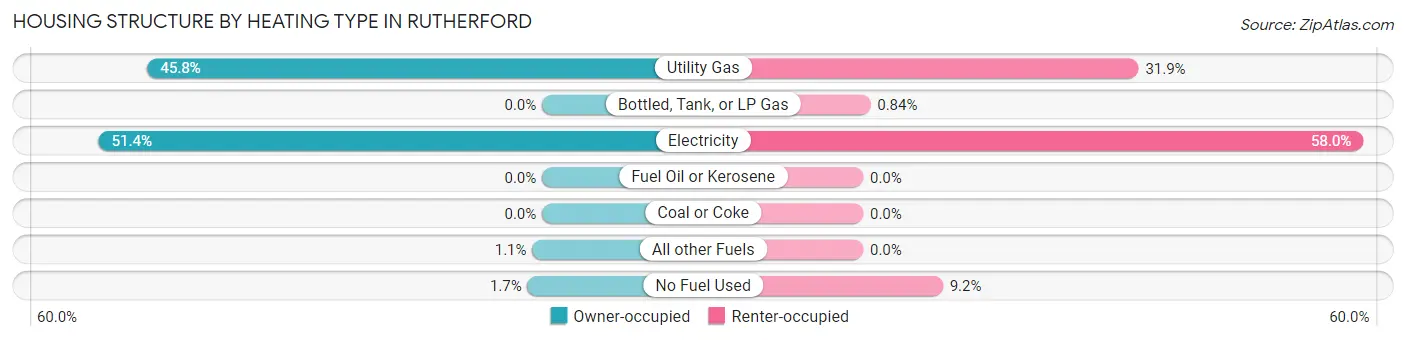
| Heating Type | Owner-occupied | Renter-occupied |
| Utility Gas | 162 (45.8%) | 38 (31.9%) |
| Bottled, Tank, or LP Gas | 0 (0.0%) | 1 (0.8%) |
| Electricity | 182 (51.4%) | 69 (58.0%) |
| Fuel Oil or Kerosene | 0 (0.0%) | 0 (0.0%) |
| Coal or Coke | 0 (0.0%) | 0 (0.0%) |
| All other Fuels | 4 (1.1%) | 0 (0.0%) |
| No Fuel Used | 6 (1.7%) | 11 (9.2%) |
| Total | 354 (100.0%) | 119 (100.0%) |
Household Vehicle Usage in Rutherford
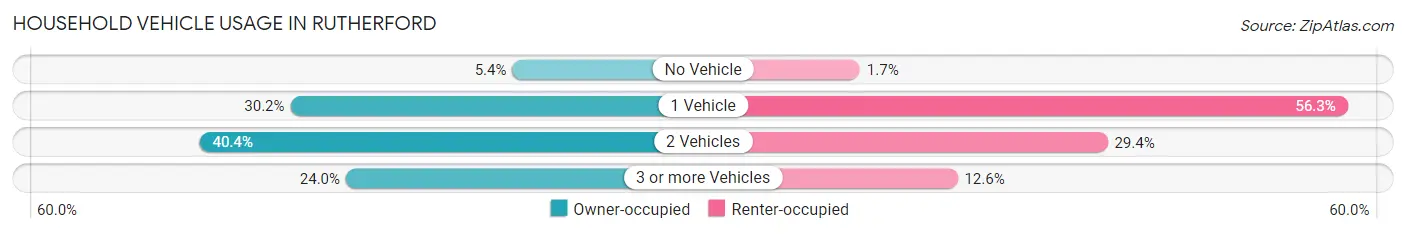
| Vehicles per Household | Owner-occupied | Renter-occupied |
| No Vehicle | 19 (5.4%) | 2 (1.7%) |
| 1 Vehicle | 107 (30.2%) | 67 (56.3%) |
| 2 Vehicles | 143 (40.4%) | 35 (29.4%) |
| 3 or more Vehicles | 85 (24.0%) | 15 (12.6%) |
| Total | 354 (100.0%) | 119 (100.0%) |
Real Estate & Mortgages in Rutherford
Real Estate and Mortgage Overview in Rutherford
| Characteristic | Without Mortgage | With Mortgage |
| Housing Units | 182 | 172 |
| Median Property Value | $78,700 | $86,200 |
| Median Household Income | $32,500 | $10 |
| Monthly Housing Costs | $384 | $3 |
| Real Estate Taxes | $758 | $4 |
Property Value by Mortgage Status in Rutherford
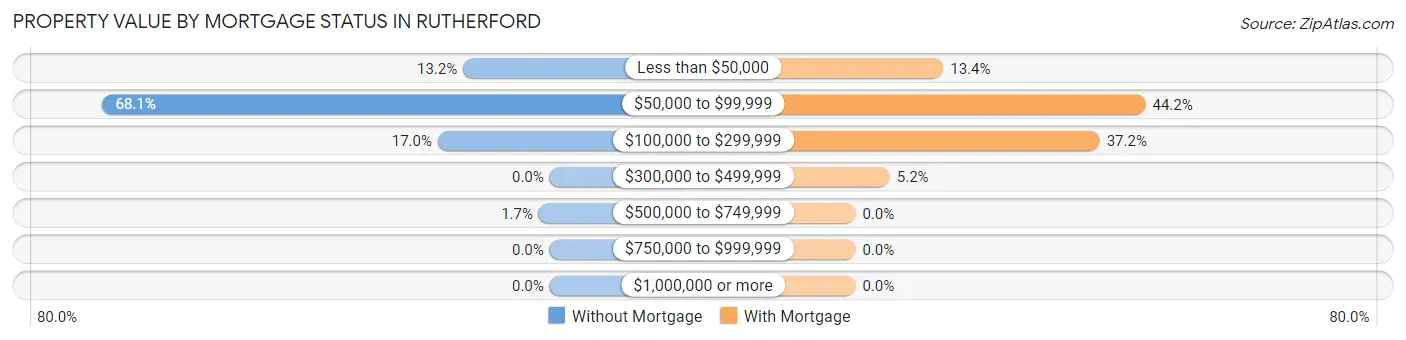
| Property Value | Without Mortgage | With Mortgage |
| Less than $50,000 | 24 (13.2%) | 23 (13.4%) |
| $50,000 to $99,999 | 124 (68.1%) | 76 (44.2%) |
| $100,000 to $299,999 | 31 (17.0%) | 64 (37.2%) |
| $300,000 to $499,999 | 0 (0.0%) | 9 (5.2%) |
| $500,000 to $749,999 | 3 (1.7%) | 0 (0.0%) |
| $750,000 to $999,999 | 0 (0.0%) | 0 (0.0%) |
| $1,000,000 or more | 0 (0.0%) | 0 (0.0%) |
| Total | 182 (100.0%) | 172 (100.0%) |
Household Income by Mortgage Status in Rutherford
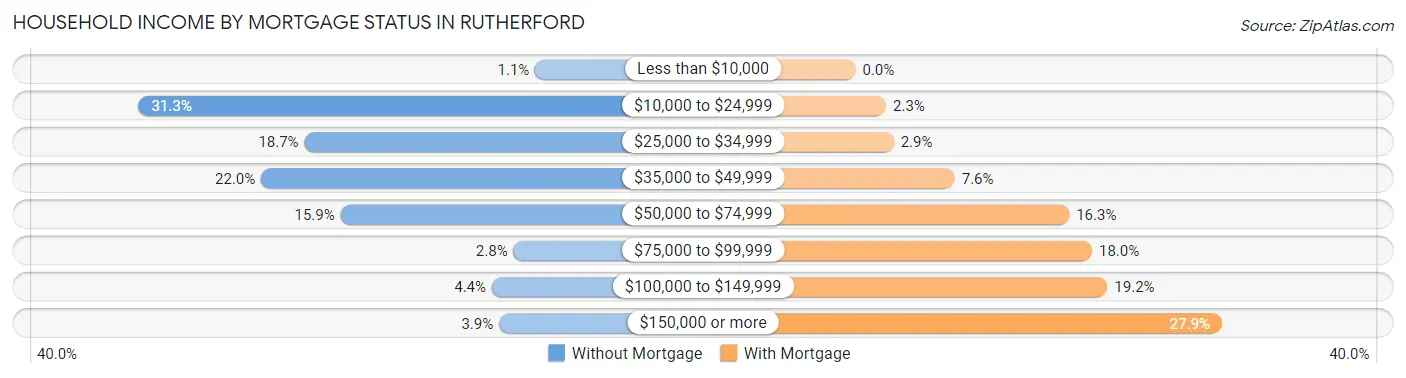
| Household Income | Without Mortgage | With Mortgage |
| Less than $10,000 | 2 (1.1%) | 0 (0.0%) |
| $10,000 to $24,999 | 57 (31.3%) | 4 (2.3%) |
| $25,000 to $34,999 | 34 (18.7%) | 5 (2.9%) |
| $35,000 to $49,999 | 40 (22.0%) | 13 (7.6%) |
| $50,000 to $74,999 | 29 (15.9%) | 28 (16.3%) |
| $75,000 to $99,999 | 5 (2.8%) | 31 (18.0%) |
| $100,000 to $149,999 | 8 (4.4%) | 33 (19.2%) |
| $150,000 or more | 7 (3.8%) | 48 (27.9%) |
| Total | 182 (100.0%) | 172 (100.0%) |
Property Value to Household Income Ratio in Rutherford
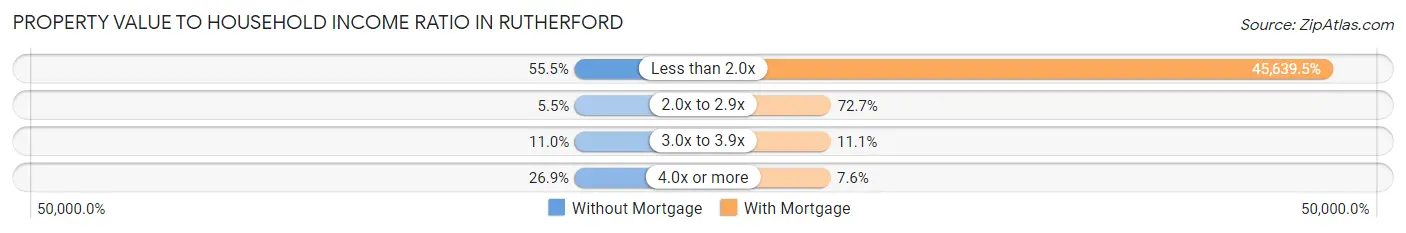
| Value-to-Income Ratio | Without Mortgage | With Mortgage |
| Less than 2.0x | 101 (55.5%) | 78,500 (45,639.5%) |
| 2.0x to 2.9x | 10 (5.5%) | 125 (72.7%) |
| 3.0x to 3.9x | 20 (11.0%) | 19 (11.1%) |
| 4.0x or more | 49 (26.9%) | 13 (7.6%) |
| Total | 182 (100.0%) | 172 (100.0%) |
Real Estate Taxes by Mortgage Status in Rutherford
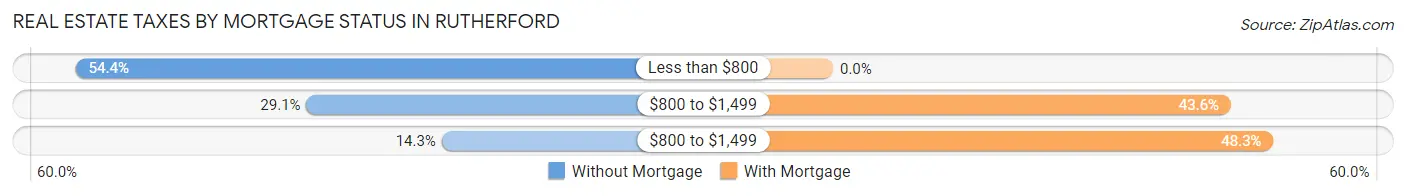
| Property Taxes | Without Mortgage | With Mortgage |
| Less than $800 | 99 (54.4%) | 0 (0.0%) |
| $800 to $1,499 | 53 (29.1%) | 75 (43.6%) |
| $800 to $1,499 | 26 (14.3%) | 83 (48.3%) |
| Total | 182 (100.0%) | 172 (100.0%) |
Health & Disability in Rutherford
Health Insurance Coverage by Age in Rutherford
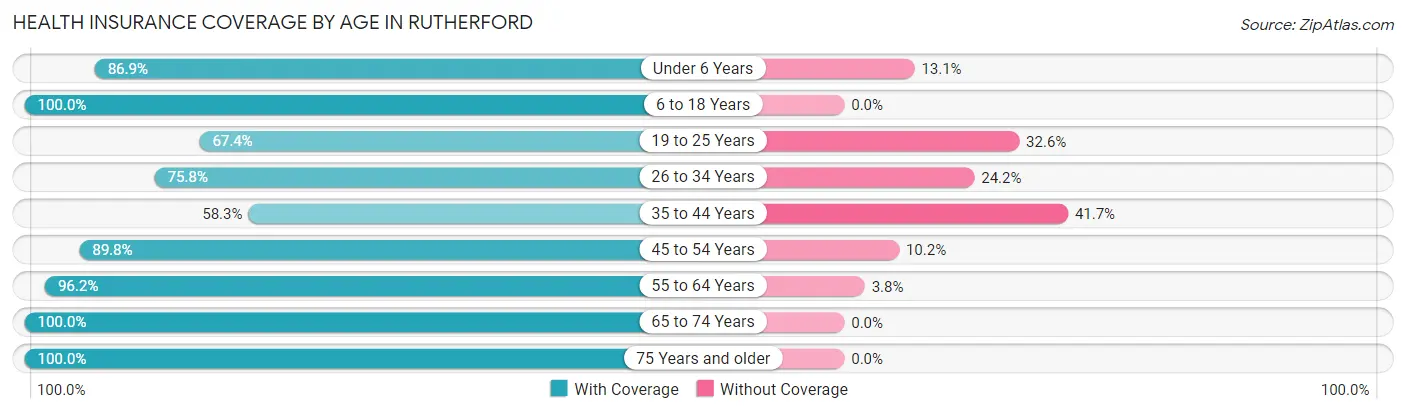
| Age Bracket | With Coverage | Without Coverage |
| Under 6 Years | 113 (86.9%) | 17 (13.1%) |
| 6 to 18 Years | 218 (100.0%) | 0 (0.0%) |
| 19 to 25 Years | 62 (67.4%) | 30 (32.6%) |
| 26 to 34 Years | 125 (75.8%) | 40 (24.2%) |
| 35 to 44 Years | 102 (58.3%) | 73 (41.7%) |
| 45 to 54 Years | 88 (89.8%) | 10 (10.2%) |
| 55 to 64 Years | 101 (96.2%) | 4 (3.8%) |
| 65 to 74 Years | 173 (100.0%) | 0 (0.0%) |
| 75 Years and older | 65 (100.0%) | 0 (0.0%) |
| Total | 1,047 (85.8%) | 174 (14.2%) |
Health Insurance Coverage by Citizenship Status in Rutherford
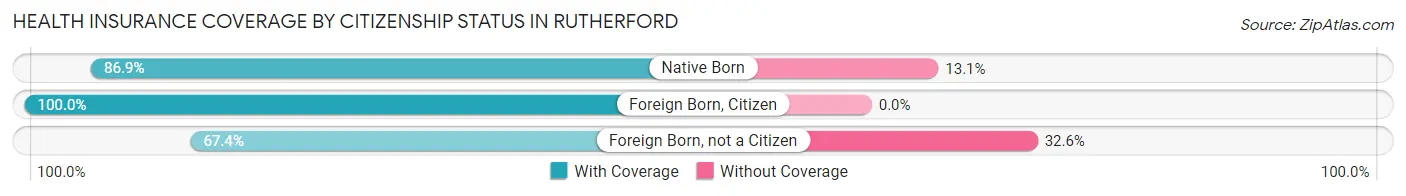
| Citizenship Status | With Coverage | Without Coverage |
| Native Born | 113 (86.9%) | 17 (13.1%) |
| Foreign Born, Citizen | 218 (100.0%) | 0 (0.0%) |
| Foreign Born, not a Citizen | 62 (67.4%) | 30 (32.6%) |
Health Insurance Coverage by Household Income in Rutherford
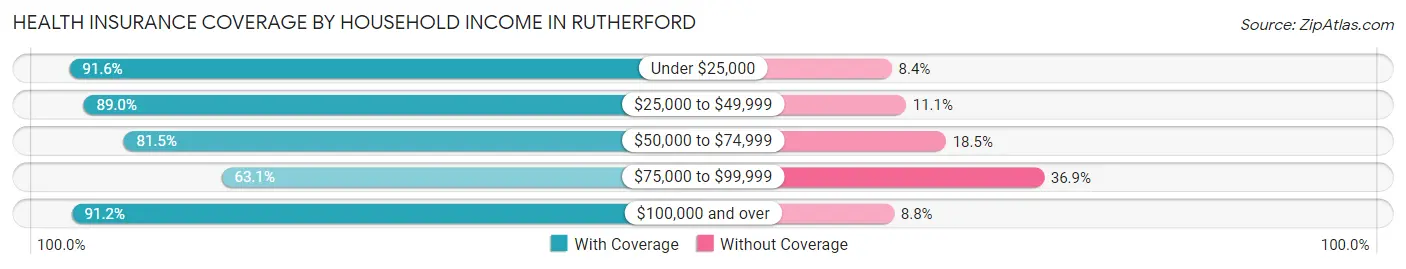
| Household Income | With Coverage | Without Coverage |
| Under $25,000 | 120 (91.6%) | 11 (8.4%) |
| $25,000 to $49,999 | 346 (88.9%) | 43 (11.1%) |
| $50,000 to $74,999 | 290 (81.5%) | 66 (18.5%) |
| $75,000 to $99,999 | 53 (63.1%) | 31 (36.9%) |
| $100,000 and over | 238 (91.2%) | 23 (8.8%) |
Public vs Private Health Insurance Coverage by Age in Rutherford
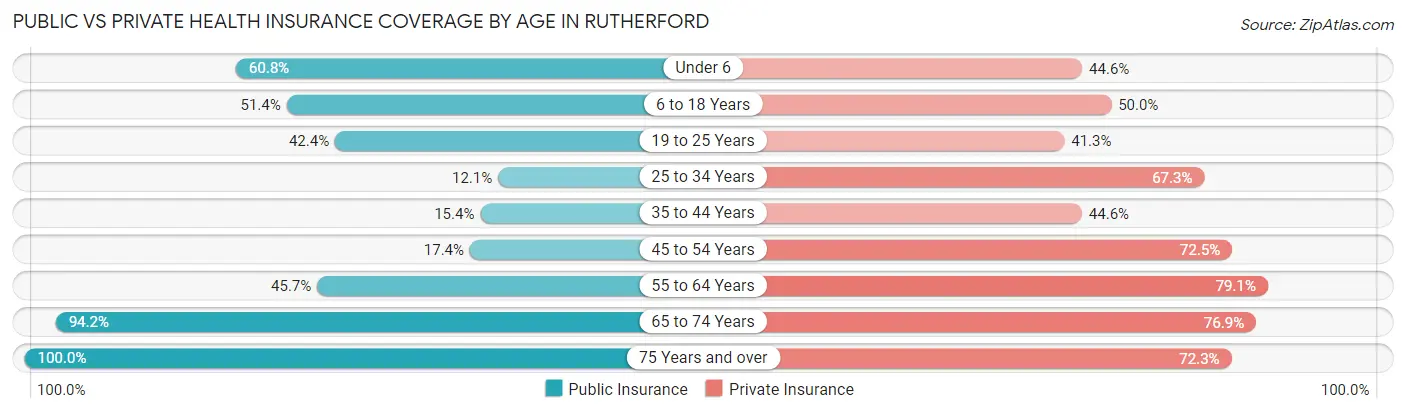
| Age Bracket | Public Insurance | Private Insurance |
| Under 6 | 79 (60.8%) | 58 (44.6%) |
| 6 to 18 Years | 112 (51.4%) | 109 (50.0%) |
| 19 to 25 Years | 39 (42.4%) | 38 (41.3%) |
| 25 to 34 Years | 20 (12.1%) | 111 (67.3%) |
| 35 to 44 Years | 27 (15.4%) | 78 (44.6%) |
| 45 to 54 Years | 17 (17.3%) | 71 (72.5%) |
| 55 to 64 Years | 48 (45.7%) | 83 (79.0%) |
| 65 to 74 Years | 163 (94.2%) | 133 (76.9%) |
| 75 Years and over | 65 (100.0%) | 47 (72.3%) |
| Total | 570 (46.7%) | 728 (59.6%) |
Disability Status by Sex by Age in Rutherford
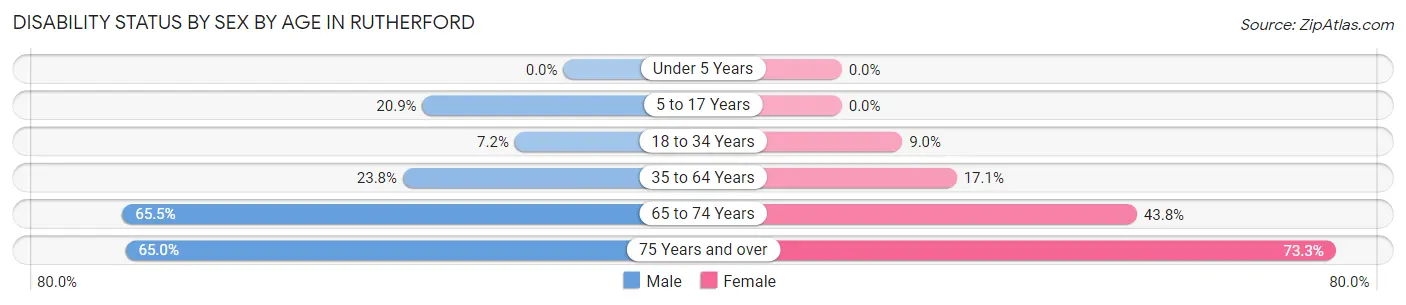
| Age Bracket | Male | Female |
| Under 5 Years | 0 (0.0%) | 0 (0.0%) |
| 5 to 17 Years | 27 (20.9%) | 0 (0.0%) |
| 18 to 34 Years | 7 (7.2%) | 15 (9.0%) |
| 35 to 64 Years | 51 (23.8%) | 28 (17.1%) |
| 65 to 74 Years | 55 (65.5%) | 39 (43.8%) |
| 75 Years and over | 13 (65.0%) | 33 (73.3%) |
Disability Class by Sex by Age in Rutherford
Disability Class: Hearing Difficulty
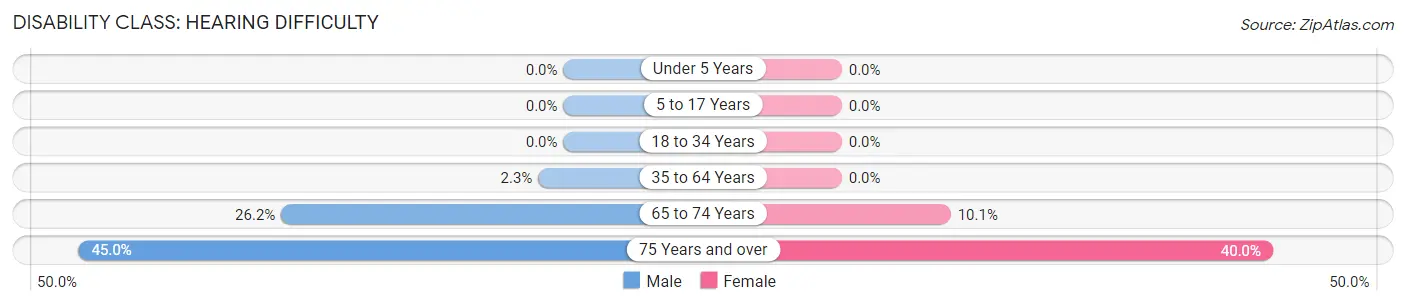
| Age Bracket | Male | Female |
| Under 5 Years | 0 (0.0%) | 0 (0.0%) |
| 5 to 17 Years | 0 (0.0%) | 0 (0.0%) |
| 18 to 34 Years | 0 (0.0%) | 0 (0.0%) |
| 35 to 64 Years | 5 (2.3%) | 0 (0.0%) |
| 65 to 74 Years | 22 (26.2%) | 9 (10.1%) |
| 75 Years and over | 9 (45.0%) | 18 (40.0%) |
Disability Class: Vision Difficulty
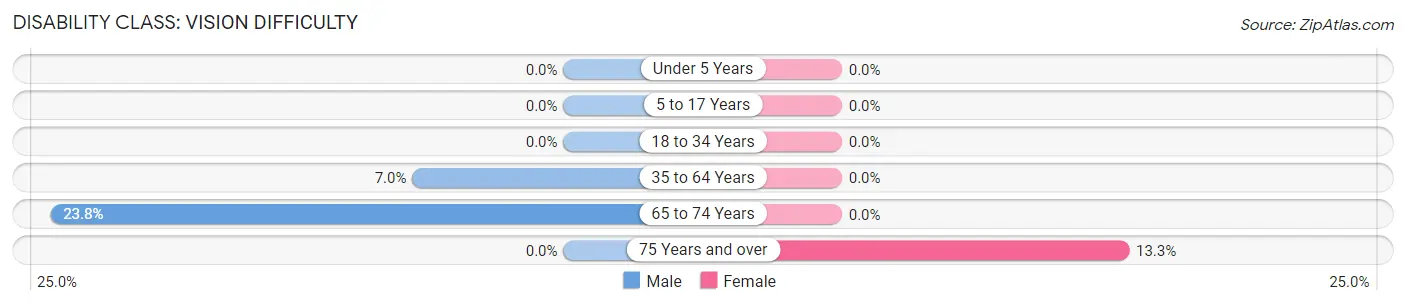
| Age Bracket | Male | Female |
| Under 5 Years | 0 (0.0%) | 0 (0.0%) |
| 5 to 17 Years | 0 (0.0%) | 0 (0.0%) |
| 18 to 34 Years | 0 (0.0%) | 0 (0.0%) |
| 35 to 64 Years | 15 (7.0%) | 0 (0.0%) |
| 65 to 74 Years | 20 (23.8%) | 0 (0.0%) |
| 75 Years and over | 0 (0.0%) | 6 (13.3%) |
Disability Class: Cognitive Difficulty
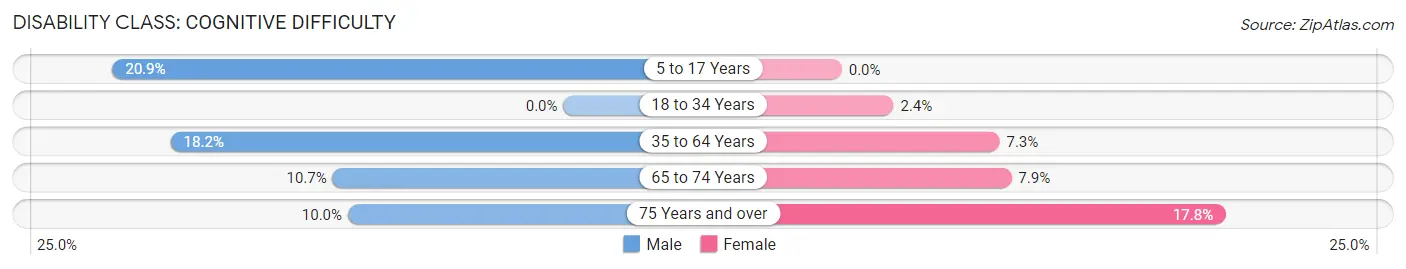
| Age Bracket | Male | Female |
| 5 to 17 Years | 27 (20.9%) | 0 (0.0%) |
| 18 to 34 Years | 0 (0.0%) | 4 (2.4%) |
| 35 to 64 Years | 39 (18.2%) | 12 (7.3%) |
| 65 to 74 Years | 9 (10.7%) | 7 (7.9%) |
| 75 Years and over | 2 (10.0%) | 8 (17.8%) |
Disability Class: Ambulatory Difficulty
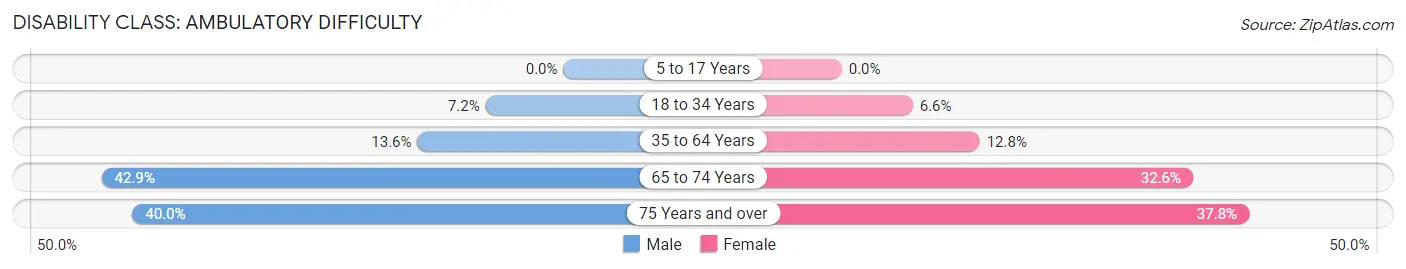
| Age Bracket | Male | Female |
| 5 to 17 Years | 0 (0.0%) | 0 (0.0%) |
| 18 to 34 Years | 7 (7.2%) | 11 (6.6%) |
| 35 to 64 Years | 29 (13.6%) | 21 (12.8%) |
| 65 to 74 Years | 36 (42.9%) | 29 (32.6%) |
| 75 Years and over | 8 (40.0%) | 17 (37.8%) |
Disability Class: Self-Care Difficulty
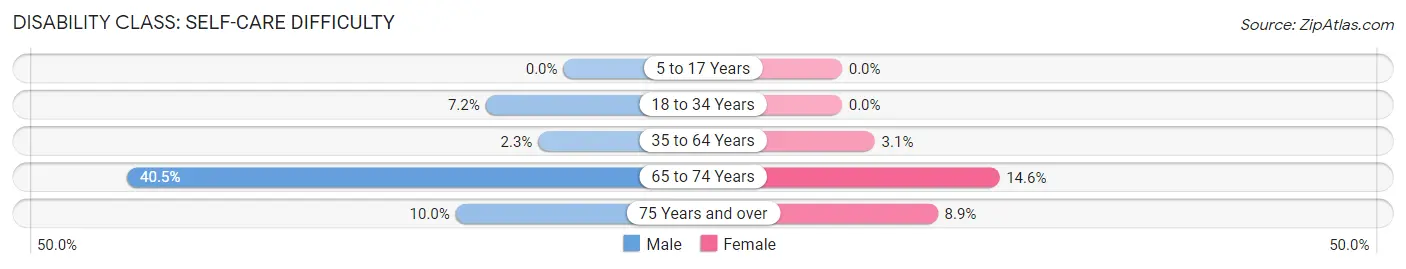
| Age Bracket | Male | Female |
| 5 to 17 Years | 0 (0.0%) | 0 (0.0%) |
| 18 to 34 Years | 7 (7.2%) | 0 (0.0%) |
| 35 to 64 Years | 5 (2.3%) | 5 (3.0%) |
| 65 to 74 Years | 34 (40.5%) | 13 (14.6%) |
| 75 Years and over | 2 (10.0%) | 4 (8.9%) |
Technology Access in Rutherford
Computing Device Access in Rutherford
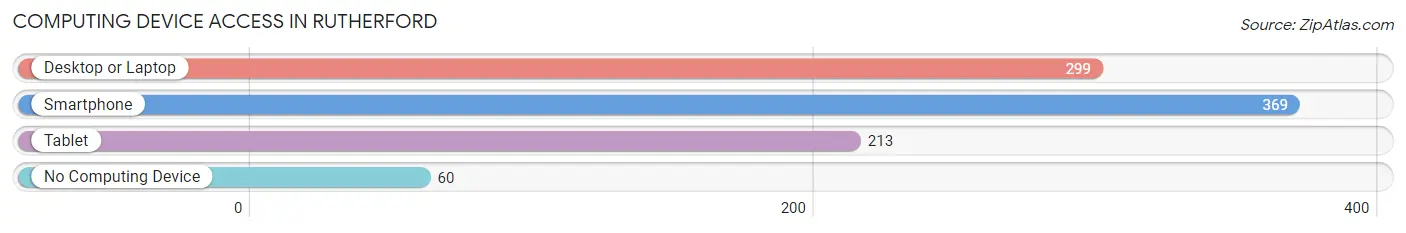
| Device Type | # Households | % Households |
| Desktop or Laptop | 299 | 63.2% |
| Smartphone | 369 | 78.0% |
| Tablet | 213 | 45.0% |
| No Computing Device | 60 | 12.7% |
| Total | 473 | 100.0% |
Internet Access in Rutherford
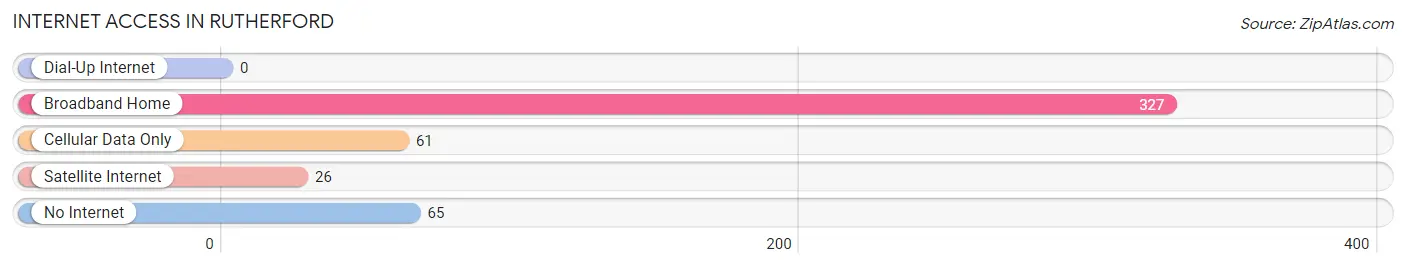
| Internet Type | # Households | % Households |
| Dial-Up Internet | 0 | 0.0% |
| Broadband Home | 327 | 69.1% |
| Cellular Data Only | 61 | 12.9% |
| Satellite Internet | 26 | 5.5% |
| No Internet | 65 | 13.7% |
| Total | 473 | 100.0% |
Rutherford Summary
Rutherford, Tennessee is a small town located in the heart of Middle Tennessee. It is situated in Rutherford County, which is part of the Nashville metropolitan area. The town has a population of approximately 8,000 people and is known for its rural charm and friendly atmosphere.
History
Rutherford was founded in 1803 by William Lytle, a Revolutionary War veteran. He named the town after his friend, General Griffith Rutherford, who was a hero of the Battle of Kings Mountain. The town was incorporated in 1810 and quickly became a thriving agricultural center. In the late 19th century, the town was a major producer of cotton and tobacco.
In the early 20th century, Rutherford began to experience a period of growth and development. The town was connected to the railroad in 1910, and the first bank was established in 1912. The town also saw the construction of several new schools and churches.
Geography
Rutherford is located in the center of Rutherford County, approximately 30 miles southeast of Nashville. The town is situated in a valley surrounded by rolling hills and is bordered by the Stones River to the north and the Duck River to the south. The town is located at an elevation of 645 feet above sea level.
Economy
Rutherford’s economy is largely based on agriculture and manufacturing. The town is home to several large farms that produce a variety of crops, including corn, soybeans, and cotton. The town is also home to several manufacturing companies, including a furniture factory and a plastics plant.
Demographics
As of the 2010 census, the population of Rutherford was 8,000. The town is predominantly white, with African Americans making up approximately 10% of the population. The median household income is $41,000, and the median home value is $150,000.
Rutherford is a small town with a rich history and a friendly atmosphere. It is a great place to live and work, and it offers a variety of activities and attractions for visitors and residents alike. The town is a great place to raise a family, and it is a great place to call home.
Common Questions
What is Per Capita Income in Rutherford?
Per Capita income in Rutherford is $22,710.
What is the Median Family Income in Rutherford?
Median Family Income in Rutherford is $58,750.
What is the Median Household income in Rutherford?
Median Household Income in Rutherford is $46,161.
What is Income or Wage Gap in Rutherford?
Income or Wage Gap in Rutherford is 26.5%.
Women in Rutherford earn 73.5 cents for every dollar earned by a man.
What is Inequality or Gini Index in Rutherford?
Inequality or Gini Index in Rutherford is 0.39.
What is the Total Population of Rutherford?
Total Population of Rutherford is 1,221.
What is the Total Male Population of Rutherford?
Total Male Population of Rutherford is 616.
What is the Total Female Population of Rutherford?
Total Female Population of Rutherford is 605.
What is the Ratio of Males per 100 Females in Rutherford?
There are 101.82 Males per 100 Females in Rutherford.
What is the Ratio of Females per 100 Males in Rutherford?
There are 98.21 Females per 100 Males in Rutherford.
What is the Median Population Age in Rutherford?
Median Population Age in Rutherford is 35.4 Years.
What is the Average Family Size in Rutherford
Average Family Size in Rutherford is 3.3 People.
What is the Average Household Size in Rutherford
Average Household Size in Rutherford is 2.6 People.
How Large is the Labor Force in Rutherford?
There are 511 People in the Labor Forcein in Rutherford.
What is the Percentage of People in the Labor Force in Rutherford?
56.1% of People are in the Labor Force in Rutherford.
What is the Unemployment Rate in Rutherford?
Unemployment Rate in Rutherford is 4.1%.