Roan Mountain, TN Map & Demographics
Roan Mountain Map
Roan Mountain Overview
$30,671
PER CAPITA INCOME
$72,045
AVG FAMILY INCOME
$51,111
AVG HOUSEHOLD INCOME
3.4%
WAGE / INCOME GAP [ % ]
96.6¢/ $1
WAGE / INCOME GAP [ $ ]
0.50
INEQUALITY / GINI INDEX
984
TOTAL POPULATION
558
MALE POPULATION
426
FEMALE POPULATION
130.99
MALES / 100 FEMALES
76.34
FEMALES / 100 MALES
43.2
MEDIAN AGE
3.0
AVG FAMILY SIZE
2.4
AVG HOUSEHOLD SIZE
432
LABOR FORCE [ PEOPLE ]
48.1%
PERCENT IN LABOR FORCE
4.2%
UNEMPLOYMENT RATE
Roan Mountain Zip Codes
Roan Mountain Area Codes
Income in Roan Mountain
Income Overview in Roan Mountain
Per Capita Income in Roan Mountain is $30,671, while median incomes of families and households are $72,045 and $51,111 respectively.
| Characteristic | Number | Measure |
| Per Capita Income | 984 | $30,671 |
| Median Family Income | 258 | $72,045 |
| Mean Family Income | 258 | $90,106 |
| Median Household Income | 368 | $51,111 |
| Mean Household Income | 368 | $72,677 |
| Income Deficit | 258 | $0 |
| Wage / Income Gap (%) | 984 | 3.39% |
| Wage / Income Gap ($) | 984 | 96.61¢ per $1 |
| Gini / Inequality Index | 984 | 0.50 |
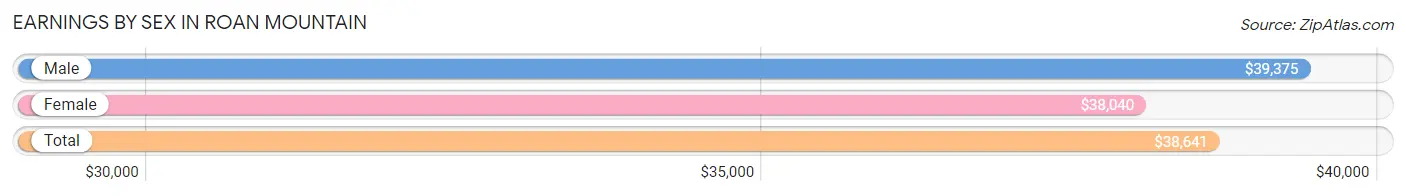
Earnings by Sex in Roan Mountain
Average Earnings in Roan Mountain are $38,641, $39,375 for men and $38,040 for women, a difference of 3.4%.
| Sex | Number | Average Earnings |
| Male | 340 (70.1%) | $39,375 |
| Female | 145 (29.9%) | $38,040 |
| Total | 485 (100.0%) | $38,641 |
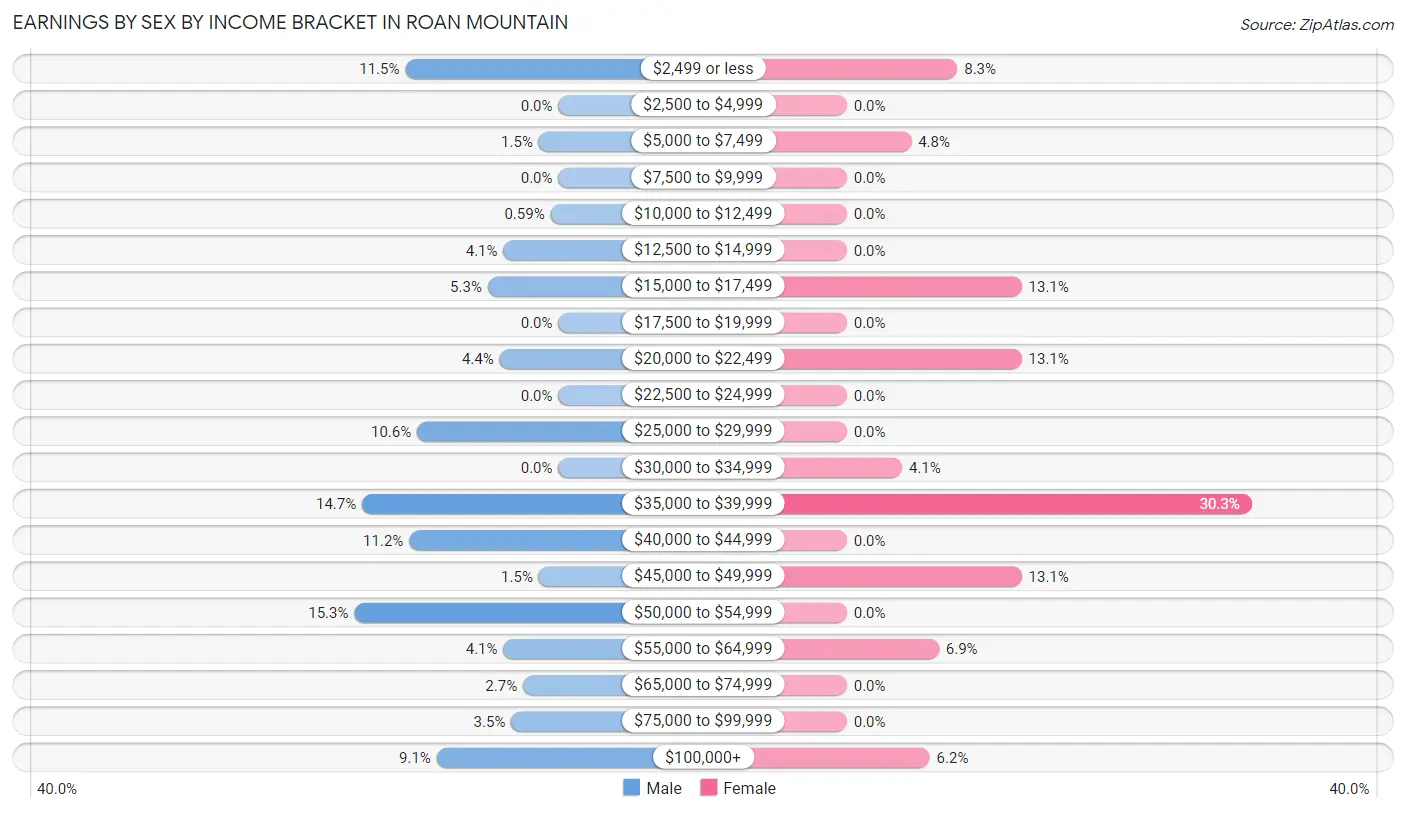
Earnings by Sex by Income Bracket in Roan Mountain
The most common earnings brackets in Roan Mountain are $50,000 to $54,999 for men (52 | 15.3%) and $35,000 to $39,999 for women (44 | 30.3%).
| Income | Male | Female |
| $2,499 or less | 39 (11.5%) | 12 (8.3%) |
| $2,500 to $4,999 | 0 (0.0%) | 0 (0.0%) |
| $5,000 to $7,499 | 5 (1.5%) | 7 (4.8%) |
| $7,500 to $9,999 | 0 (0.0%) | 0 (0.0%) |
| $10,000 to $12,499 | 2 (0.6%) | 0 (0.0%) |
| $12,500 to $14,999 | 14 (4.1%) | 0 (0.0%) |
| $15,000 to $17,499 | 18 (5.3%) | 19 (13.1%) |
| $17,500 to $19,999 | 0 (0.0%) | 0 (0.0%) |
| $20,000 to $22,499 | 15 (4.4%) | 19 (13.1%) |
| $22,500 to $24,999 | 0 (0.0%) | 0 (0.0%) |
| $25,000 to $29,999 | 36 (10.6%) | 0 (0.0%) |
| $30,000 to $34,999 | 0 (0.0%) | 6 (4.1%) |
| $35,000 to $39,999 | 50 (14.7%) | 44 (30.3%) |
| $40,000 to $44,999 | 38 (11.2%) | 0 (0.0%) |
| $45,000 to $49,999 | 5 (1.5%) | 19 (13.1%) |
| $50,000 to $54,999 | 52 (15.3%) | 0 (0.0%) |
| $55,000 to $64,999 | 14 (4.1%) | 10 (6.9%) |
| $65,000 to $74,999 | 9 (2.6%) | 0 (0.0%) |
| $75,000 to $99,999 | 12 (3.5%) | 0 (0.0%) |
| $100,000+ | 31 (9.1%) | 9 (6.2%) |
| Total | 340 (100.0%) | 145 (100.0%) |
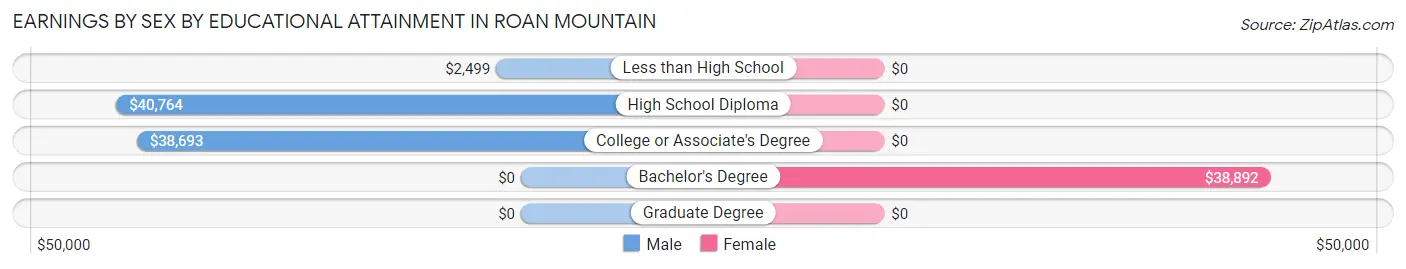
Earnings by Sex by Educational Attainment in Roan Mountain
Average earnings in Roan Mountain are $40,417 for men and $39,119 for women, a difference of 3.2%. Men with an educational attainment of high school diploma enjoy the highest average annual earnings of $40,764, while those with less than high school education earn the least with $2,499. Women with an educational attainment of bachelor's degree earn the most with the average annual earnings of $38,892, while those with bachelor's degree education have the smallest earnings of $38,892.
| Educational Attainment | Male Income | Female Income |
| Less than High School | $2,499 | $0 |
| High School Diploma | $40,764 | $0 |
| College or Associate's Degree | $38,693 | $0 |
| Bachelor's Degree | - | - |
| Graduate Degree | - | - |
| Total | $40,417 | $39,119 |
Family Income in Roan Mountain
Family Income Brackets in Roan Mountain
According to the Roan Mountain family income data, there are 67 families falling into the $75,000 to $99,999 income range, which is the most common income bracket and makes up 26.0% of all families.
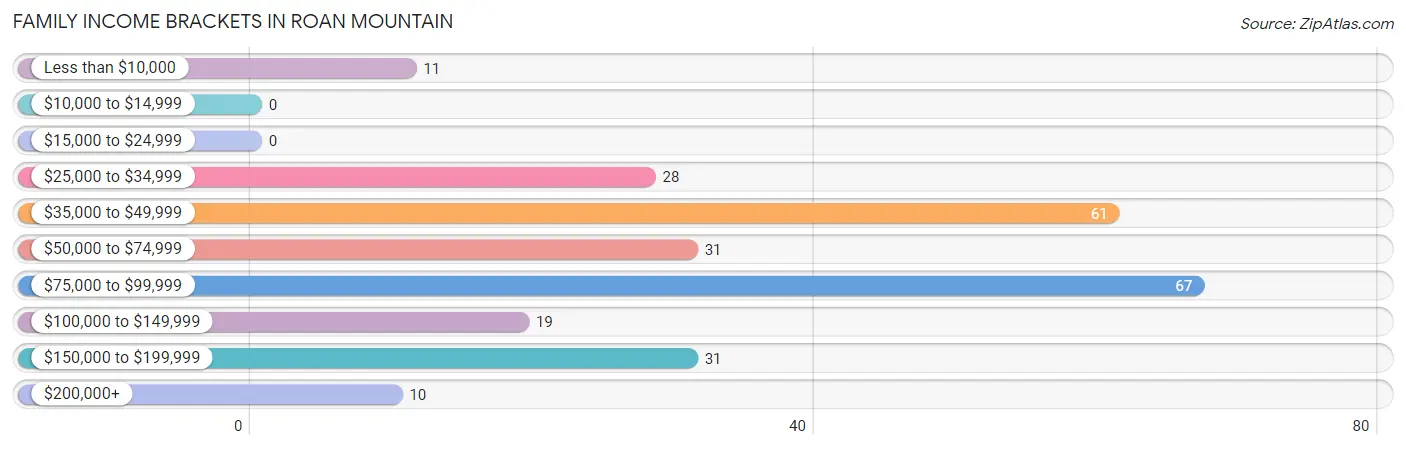
| Income Bracket | # Families | % Families |
| Less than $10,000 | 11 | 4.3% |
| $10,000 to $14,999 | 0 | 0.0% |
| $15,000 to $24,999 | 0 | 0.0% |
| $25,000 to $34,999 | 28 | 10.9% |
| $35,000 to $49,999 | 61 | 23.6% |
| $50,000 to $74,999 | 31 | 12.0% |
| $75,000 to $99,999 | 67 | 26.0% |
| $100,000 to $149,999 | 19 | 7.4% |
| $150,000 to $199,999 | 31 | 12.0% |
| $200,000+ | 10 | 3.9% |
Family Income by Famaliy Size in Roan Mountain
3-person families (59 | 22.9%) account for the highest median family income in Roan Mountain with $155,179 per family, while 3-person families (59 | 22.9%) have the highest median income of $51,726 per family member.
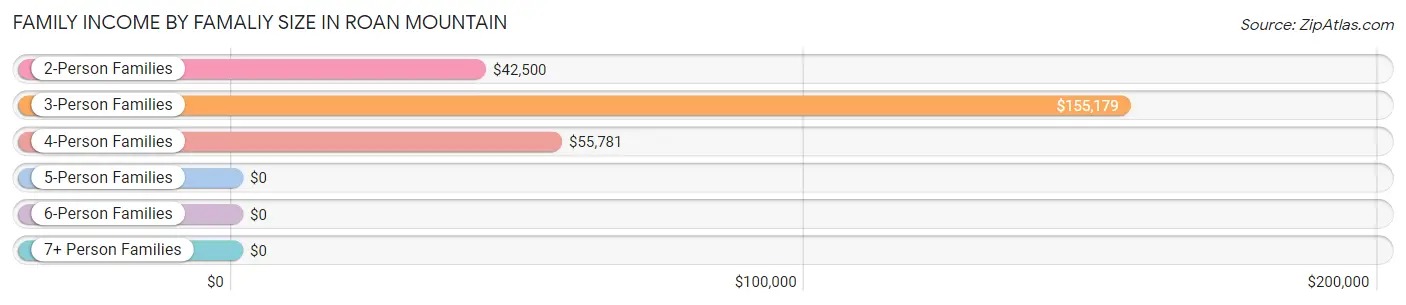
| Income Bracket | # Families | Median Income |
| 2-Person Families | 142 (55.0%) | $42,500 |
| 3-Person Families | 59 (22.9%) | $155,179 |
| 4-Person Families | 27 (10.5%) | $55,781 |
| 5-Person Families | 11 (4.3%) | $0 |
| 6-Person Families | 19 (7.4%) | $0 |
| 7+ Person Families | 0 (0.0%) | $0 |
| Total | 258 (100.0%) | $72,045 |
Family Income by Number of Earners in Roan Mountain
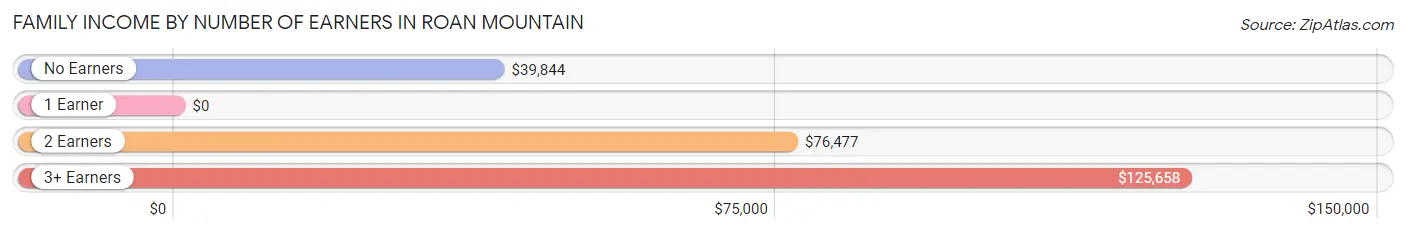
| Number of Earners | # Families | Median Income |
| No Earners | 87 (33.7%) | $39,844 |
| 1 Earner | 73 (28.3%) | $0 |
| 2 Earners | 50 (19.4%) | $76,477 |
| 3+ Earners | 48 (18.6%) | $125,658 |
| Total | 258 (100.0%) | $72,045 |
Household Income in Roan Mountain
Household Income Brackets in Roan Mountain
With 74 households falling in the category, the $75,000 to $99,999 income range is the most frequent in Roan Mountain, accounting for 20.1% of all households.
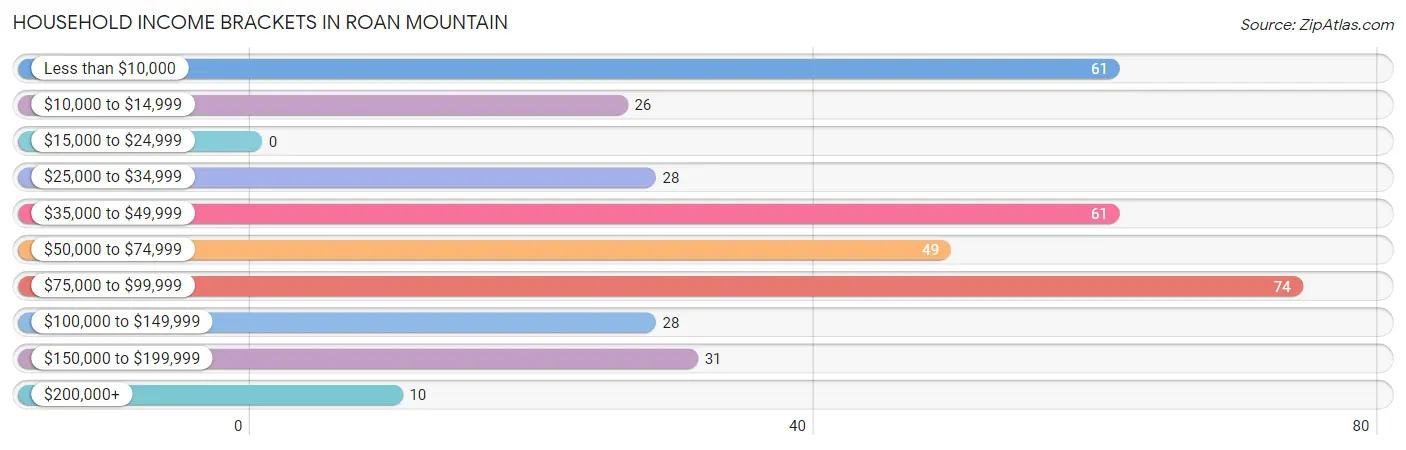
| Income Bracket | # Households | % Households |
| Less than $10,000 | 61 | 16.6% |
| $10,000 to $14,999 | 26 | 7.1% |
| $15,000 to $24,999 | 0 | 0.0% |
| $25,000 to $34,999 | 28 | 7.6% |
| $35,000 to $49,999 | 61 | 16.6% |
| $50,000 to $74,999 | 49 | 13.3% |
| $75,000 to $99,999 | 74 | 20.1% |
| $100,000 to $149,999 | 28 | 7.6% |
| $150,000 to $199,999 | 31 | 8.4% |
| $200,000+ | 10 | 2.7% |
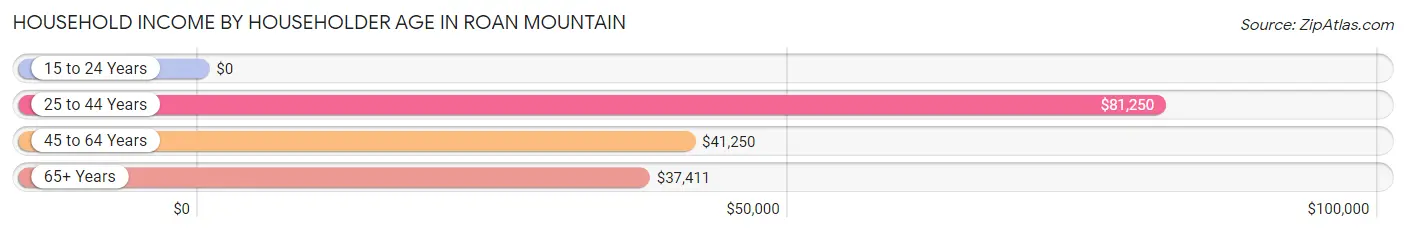
Household Income by Householder Age in Roan Mountain
The median household income in Roan Mountain is $51,111, with the highest median household income of $81,250 found in the 25 to 44 years age bracket for the primary householder. A total of 98 households (26.6%) fall into this category.
| Income Bracket | # Households | Median Income |
| 15 to 24 Years | 0 (0.0%) | $0 |
| 25 to 44 Years | 98 (26.6%) | $81,250 |
| 45 to 64 Years | 169 (45.9%) | $41,250 |
| 65+ Years | 101 (27.5%) | $37,411 |
| Total | 368 (100.0%) | $51,111 |
Poverty in Roan Mountain
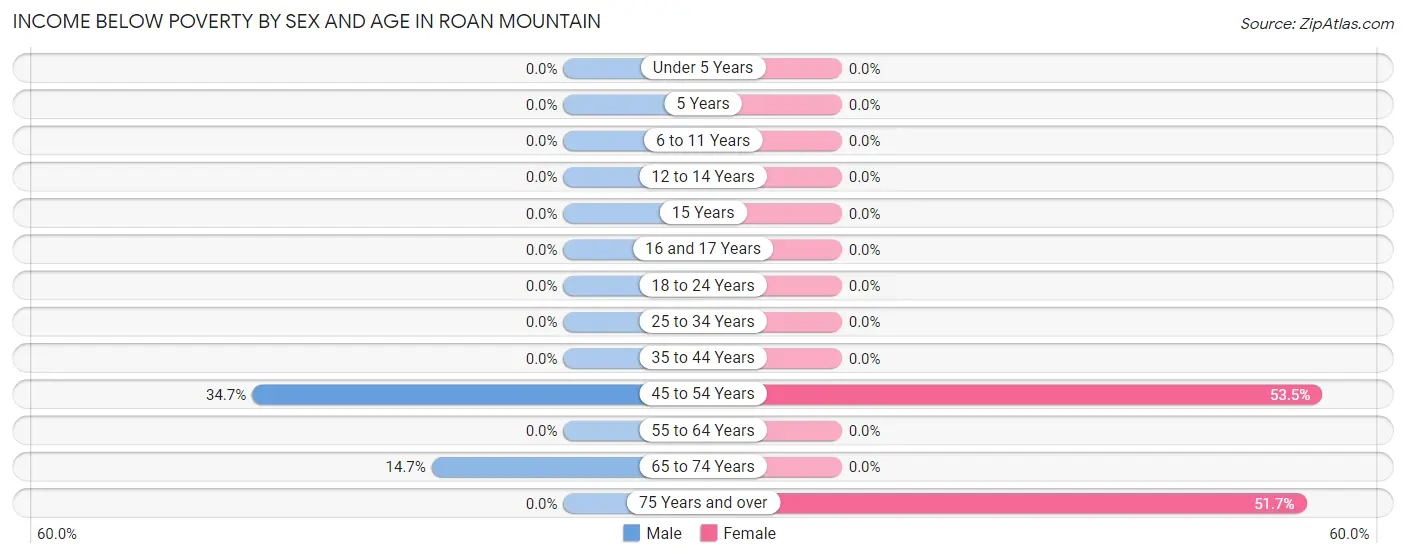
Income Below Poverty by Sex and Age in Roan Mountain
With 8.0% poverty level for males and 14.3% for females among the residents of Roan Mountain, 45 to 54 year old males and 45 to 54 year old females are the most vulnerable to poverty, with 26 males (34.7%) and 46 females (53.5%) in their respective age groups living below the poverty level.
| Age Bracket | Male | Female |
| Under 5 Years | 0 (0.0%) | 0 (0.0%) |
| 5 Years | 0 (0.0%) | 0 (0.0%) |
| 6 to 11 Years | 0 (0.0%) | 0 (0.0%) |
| 12 to 14 Years | 0 (0.0%) | 0 (0.0%) |
| 15 Years | 0 (0.0%) | 0 (0.0%) |
| 16 and 17 Years | 0 (0.0%) | 0 (0.0%) |
| 18 to 24 Years | 0 (0.0%) | 0 (0.0%) |
| 25 to 34 Years | 0 (0.0%) | 0 (0.0%) |
| 35 to 44 Years | 0 (0.0%) | 0 (0.0%) |
| 45 to 54 Years | 26 (34.7%) | 46 (53.5%) |
| 55 to 64 Years | 0 (0.0%) | 0 (0.0%) |
| 65 to 74 Years | 11 (14.7%) | 0 (0.0%) |
| 75 Years and over | 0 (0.0%) | 15 (51.7%) |
| Total | 37 (8.0%) | 61 (14.3%) |
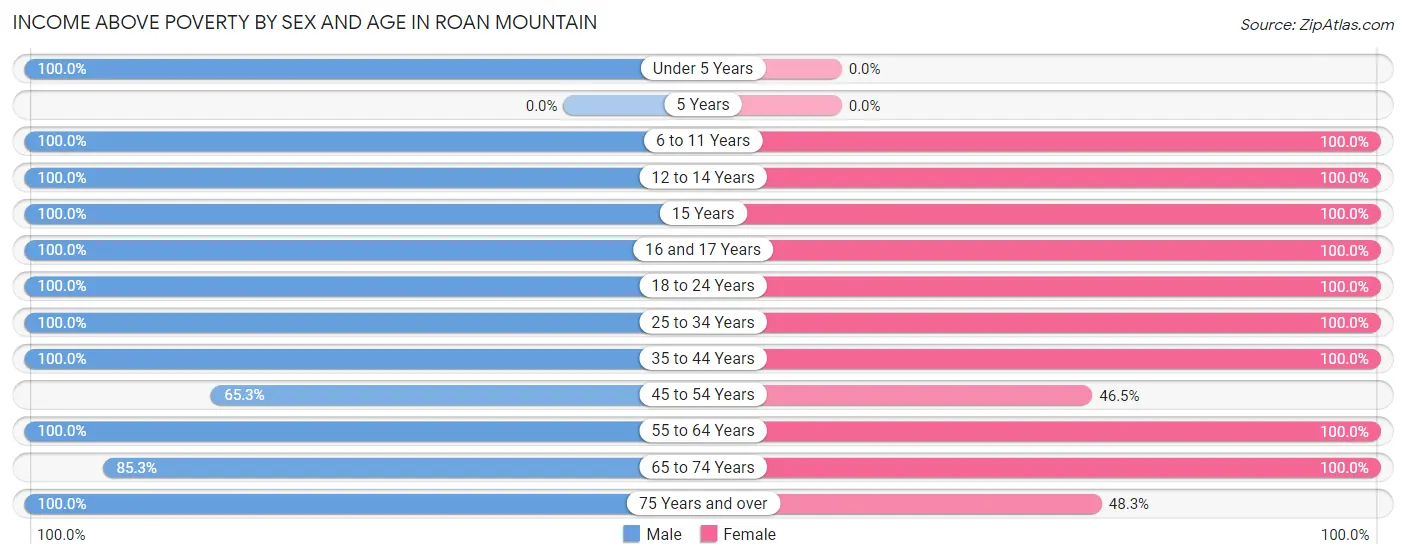
Income Above Poverty by Sex and Age in Roan Mountain
According to the poverty statistics in Roan Mountain, males aged under 5 years and females aged 6 to 11 years are the age groups that are most secure financially, with 100.0% of males and 100.0% of females in these age groups living above the poverty line.
| Age Bracket | Male | Female |
| Under 5 Years | 6 (100.0%) | 0 (0.0%) |
| 5 Years | 0 (0.0%) | 0 (0.0%) |
| 6 to 11 Years | 7 (100.0%) | 19 (100.0%) |
| 12 to 14 Years | 20 (100.0%) | 11 (100.0%) |
| 15 Years | 12 (100.0%) | 11 (100.0%) |
| 16 and 17 Years | 10 (100.0%) | 54 (100.0%) |
| 18 to 24 Years | 30 (100.0%) | 26 (100.0%) |
| 25 to 34 Years | 38 (100.0%) | 66 (100.0%) |
| 35 to 44 Years | 73 (100.0%) | 52 (100.0%) |
| 45 to 54 Years | 49 (65.3%) | 40 (46.5%) |
| 55 to 64 Years | 72 (100.0%) | 12 (100.0%) |
| 65 to 74 Years | 64 (85.3%) | 60 (100.0%) |
| 75 Years and over | 43 (100.0%) | 14 (48.3%) |
| Total | 424 (92.0%) | 365 (85.7%) |
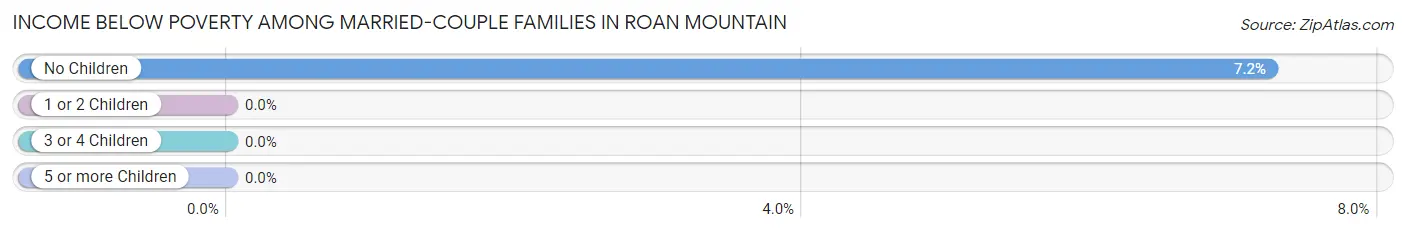
Income Below Poverty Among Married-Couple Families in Roan Mountain
The poverty statistics for married-couple families in Roan Mountain show that 5.1% or 11 of the total 215 families live below the poverty line. Families with no children have the highest poverty rate of 7.2%, comprising of 11 families. On the other hand, families with 1 or 2 children have the lowest poverty rate of 0.0%, which includes 0 families.
| Children | Above Poverty | Below Poverty |
| No Children | 141 (92.8%) | 11 (7.2%) |
| 1 or 2 Children | 52 (100.0%) | 0 (0.0%) |
| 3 or 4 Children | 11 (100.0%) | 0 (0.0%) |
| 5 or more Children | 0 (0.0%) | 0 (0.0%) |
| Total | 204 (94.9%) | 11 (5.1%) |
Income Below Poverty Among Single-Parent Households in Roan Mountain
| Children | Single Father | Single Mother |
| No Children | 0 (0.0%) | 0 (0.0%) |
| 1 or 2 Children | 0 (0.0%) | 0 (0.0%) |
| 3 or 4 Children | 0 (0.0%) | 0 (0.0%) |
| 5 or more Children | 0 (0.0%) | 0 (0.0%) |
| Total | 0 (0.0%) | 0 (0.0%) |
Income Below Poverty Among Married-Couple vs Single-Parent Households in Roan Mountain
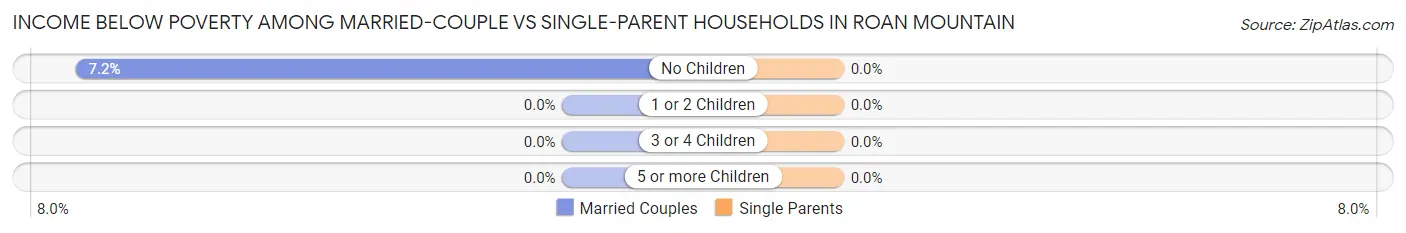
| Children | Married-Couple Families | Single-Parent Households |
| No Children | 11 (7.2%) | 0 (0.0%) |
| 1 or 2 Children | 0 (0.0%) | 0 (0.0%) |
| 3 or 4 Children | 0 (0.0%) | 0 (0.0%) |
| 5 or more Children | 0 (0.0%) | 0 (0.0%) |
| Total | 11 (5.1%) | 0 (0.0%) |
Race in Roan Mountain
The most populous races in Roan Mountain are White / Caucasian (945 | 96.0%), Black / African American (24 | 2.4%), and Hispanic or Latino (22 | 2.2%).
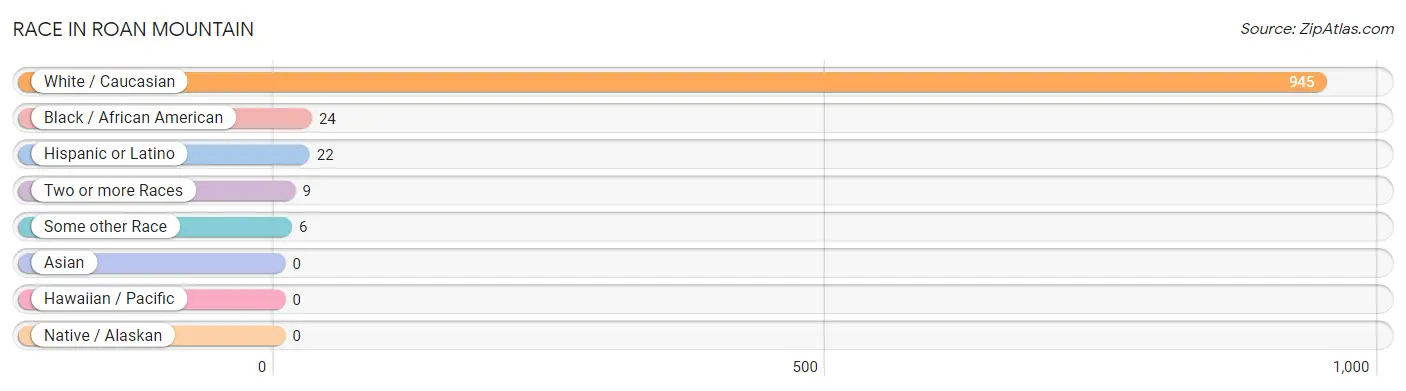
| Race | # Population | % Population |
| Asian | 0 | 0.0% |
| Black / African American | 24 | 2.4% |
| Hawaiian / Pacific | 0 | 0.0% |
| Hispanic or Latino | 22 | 2.2% |
| Native / Alaskan | 0 | 0.0% |
| White / Caucasian | 945 | 96.0% |
| Two or more Races | 9 | 0.9% |
| Some other Race | 6 | 0.6% |
| Total | 984 | 100.0% |
Ancestry in Roan Mountain
The most populous ancestries reported in Roan Mountain are American (173 | 17.6%), German (147 | 14.9%), English (77 | 7.8%), Dutch (63 | 6.4%), and Irish (28 | 2.9%), together accounting for 49.6% of all Roan Mountain residents.
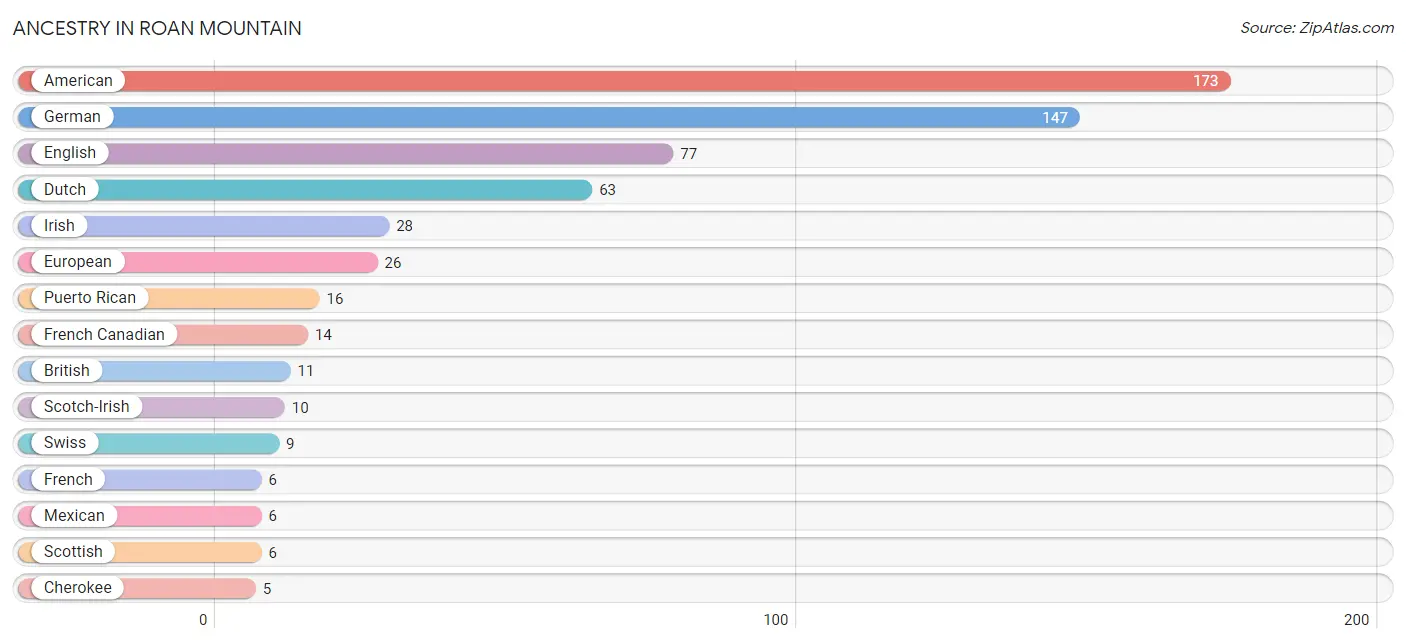
| Ancestry | # Population | % Population |
| American | 173 | 17.6% |
| British | 11 | 1.1% |
| Cherokee | 5 | 0.5% |
| Dutch | 63 | 6.4% |
| English | 77 | 7.8% |
| European | 26 | 2.6% |
| French | 6 | 0.6% |
| French Canadian | 14 | 1.4% |
| German | 147 | 14.9% |
| Irish | 28 | 2.9% |
| Italian | 4 | 0.4% |
| Mexican | 6 | 0.6% |
| Puerto Rican | 16 | 1.6% |
| Scotch-Irish | 10 | 1.0% |
| Scottish | 6 | 0.6% |
| Swiss | 9 | 0.9% | View All 16 Rows |
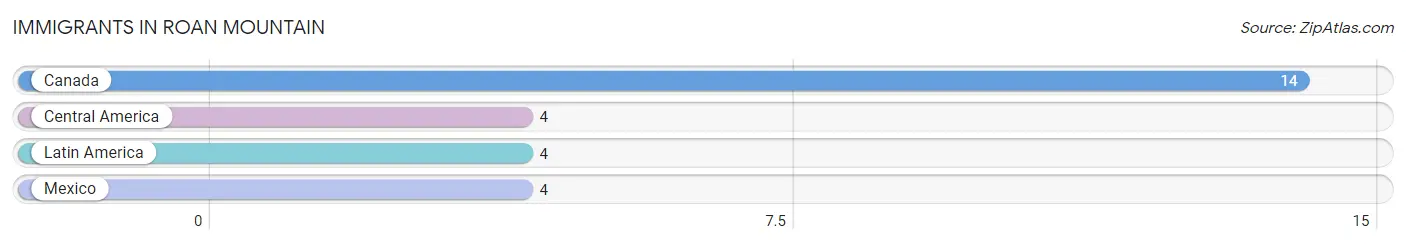
Immigrants in Roan Mountain
The most numerous immigrant groups reported in Roan Mountain came from Canada (14 | 1.4%), Central America (4 | 0.4%), Latin America (4 | 0.4%), and Mexico (4 | 0.4%), together accounting for 2.6% of all Roan Mountain residents.
| Immigration Origin | # Population | % Population |
| Canada | 14 | 1.4% |
| Central America | 4 | 0.4% |
| Latin America | 4 | 0.4% |
| Mexico | 4 | 0.4% | View All 4 Rows |
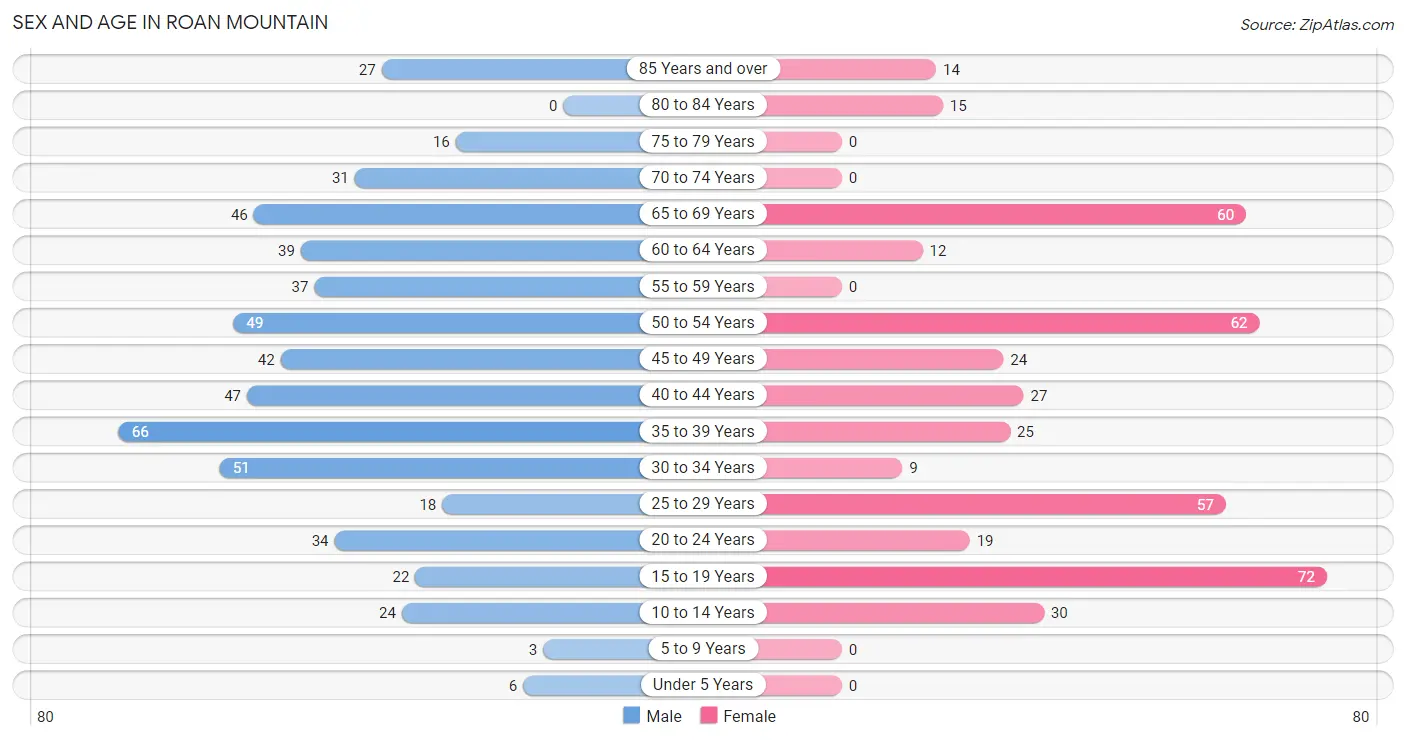
Sex and Age in Roan Mountain
Sex and Age in Roan Mountain
The most populous age groups in Roan Mountain are 35 to 39 Years (66 | 11.8%) for men and 15 to 19 Years (72 | 16.9%) for women.
| Age Bracket | Male | Female |
| Under 5 Years | 6 (1.1%) | 0 (0.0%) |
| 5 to 9 Years | 3 (0.5%) | 0 (0.0%) |
| 10 to 14 Years | 24 (4.3%) | 30 (7.0%) |
| 15 to 19 Years | 22 (3.9%) | 72 (16.9%) |
| 20 to 24 Years | 34 (6.1%) | 19 (4.5%) |
| 25 to 29 Years | 18 (3.2%) | 57 (13.4%) |
| 30 to 34 Years | 51 (9.1%) | 9 (2.1%) |
| 35 to 39 Years | 66 (11.8%) | 25 (5.9%) |
| 40 to 44 Years | 47 (8.4%) | 27 (6.3%) |
| 45 to 49 Years | 42 (7.5%) | 24 (5.6%) |
| 50 to 54 Years | 49 (8.8%) | 62 (14.5%) |
| 55 to 59 Years | 37 (6.6%) | 0 (0.0%) |
| 60 to 64 Years | 39 (7.0%) | 12 (2.8%) |
| 65 to 69 Years | 46 (8.2%) | 60 (14.1%) |
| 70 to 74 Years | 31 (5.6%) | 0 (0.0%) |
| 75 to 79 Years | 16 (2.9%) | 0 (0.0%) |
| 80 to 84 Years | 0 (0.0%) | 15 (3.5%) |
| 85 Years and over | 27 (4.8%) | 14 (3.3%) |
| Total | 558 (100.0%) | 426 (100.0%) |
Families and Households in Roan Mountain
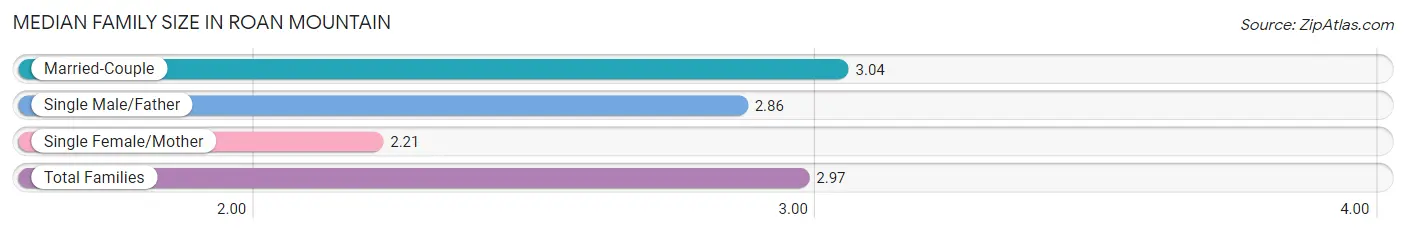
Median Family Size in Roan Mountain
The median family size in Roan Mountain is 2.97 persons per family, with married-couple families (215 | 83.3%) accounting for the largest median family size of 3.04 persons per family. On the other hand, single female/mother families (14 | 5.4%) represent the smallest median family size with 2.21 persons per family.
| Family Type | # Families | Family Size |
| Married-Couple | 215 (83.3%) | 3.04 |
| Single Male/Father | 29 (11.2%) | 2.86 |
| Single Female/Mother | 14 (5.4%) | 2.21 |
| Total Families | 258 (100.0%) | 2.97 |
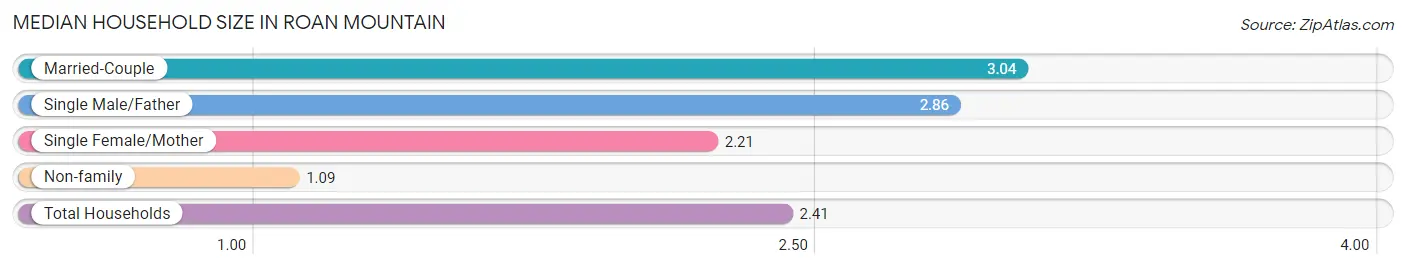
Median Household Size in Roan Mountain
The median household size in Roan Mountain is 2.41 persons per household, with married-couple households (215 | 58.4%) accounting for the largest median household size of 3.04 persons per household. non-family households (110 | 29.9%) represent the smallest median household size with 1.09 persons per household.
| Household Type | # Households | Household Size |
| Married-Couple | 215 (58.4%) | 3.04 |
| Single Male/Father | 29 (7.9%) | 2.86 |
| Single Female/Mother | 14 (3.8%) | 2.21 |
| Non-family | 110 (29.9%) | 1.09 |
| Total Households | 368 (100.0%) | 2.41 |
Household Size by Marriage Status in Roan Mountain
Out of a total of 368 households in Roan Mountain, 258 (70.1%) are family households, while 110 (29.9%) are nonfamily households. The most numerous type of family households are 2-person households, comprising 142, and the most common type of nonfamily households are 1-person households, comprising 101.
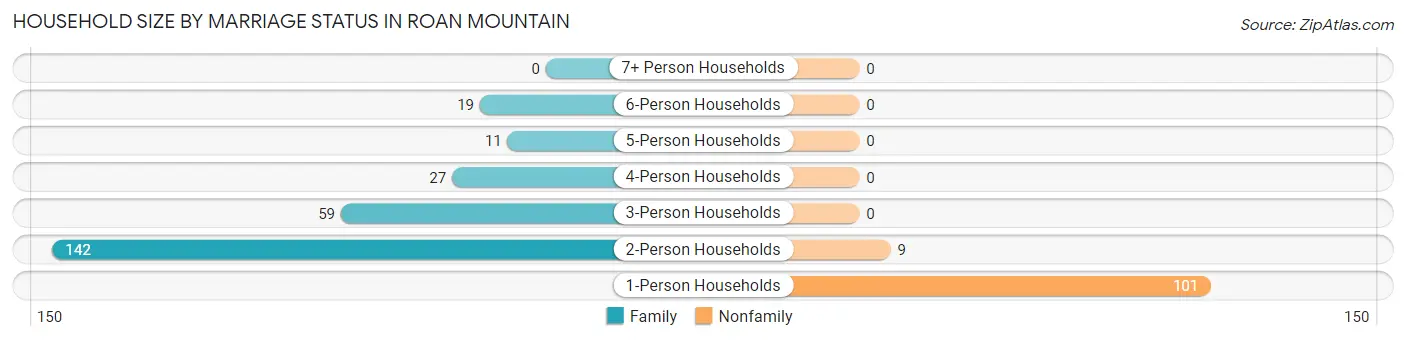
| Household Size | Family Households | Nonfamily Households |
| 1-Person Households | - | 101 (27.5%) |
| 2-Person Households | 142 (38.6%) | 9 (2.5%) |
| 3-Person Households | 59 (16.0%) | 0 (0.0%) |
| 4-Person Households | 27 (7.3%) | 0 (0.0%) |
| 5-Person Households | 11 (3.0%) | 0 (0.0%) |
| 6-Person Households | 19 (5.2%) | 0 (0.0%) |
| 7+ Person Households | 0 (0.0%) | 0 (0.0%) |
| Total | 258 (70.1%) | 110 (29.9%) |
Female Fertility in Roan Mountain
Fertility by Age in Roan Mountain
| Age Bracket | Women with Births | Births / 1,000 Women |
| 15 to 19 years | 0 (0.0%) | 0.0 |
| 20 to 34 years | 0 (0.0%) | 0.0 |
| 35 to 50 years | 0 (0.0%) | 0.0 |
| Total | 0 (0.0%) | 0.0 |
Fertility by Age by Marriage Status in Roan Mountain
| Age Bracket | Married | Unmarried |
| 15 to 19 years | 0 (0.0%) | 0 (0.0%) |
| 20 to 34 years | 0 (0.0%) | 0 (0.0%) |
| 35 to 50 years | 0 (0.0%) | 0 (0.0%) |
| Total | 0 (0.0%) | 0 (0.0%) |
Fertility by Education in Roan Mountain
| Educational Attainment | Women with Births | Births / 1,000 Women |
| Less than High School | 0 (0.0%) | 0.0 |
| High School Diploma | 0 (0.0%) | 0.0 |
| College or Associate's Degree | 0 (0.0%) | 0.0 |
| Bachelor's Degree | 0 (0.0%) | 0.0 |
| Graduate Degree | 0 (0.0%) | 0.0 |
| Total | 0 (0.0%) | 0.0 |
Fertility by Education by Marriage Status in Roan Mountain
| Educational Attainment | Married | Unmarried |
| Less than High School | 0 (0.0%) | 0 (0.0%) |
| High School Diploma | 0 (0.0%) | 0 (0.0%) |
| College or Associate's Degree | 0 (0.0%) | 0 (0.0%) |
| Bachelor's Degree | 0 (0.0%) | 0 (0.0%) |
| Graduate Degree | 0 (0.0%) | 0 (0.0%) |
| Total | 0 (0.0%) | 0 (0.0%) |
Employment Characteristics in Roan Mountain
Employment by Class of Employer in Roan Mountain
Among the 414 employed individuals in Roan Mountain, private company employees (267 | 64.5%), local government employees (92 | 22.2%), and not-for-profit organizations (23 | 5.6%) make up the most common classes of employment.
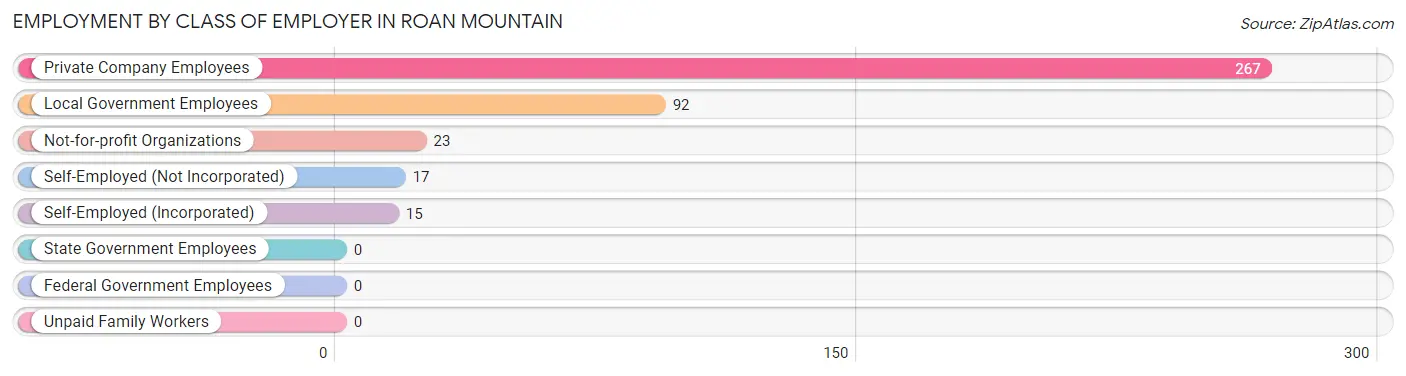
| Employer Class | # Employees | % Employees |
| Private Company Employees | 267 | 64.5% |
| Self-Employed (Incorporated) | 15 | 3.6% |
| Self-Employed (Not Incorporated) | 17 | 4.1% |
| Not-for-profit Organizations | 23 | 5.6% |
| Local Government Employees | 92 | 22.2% |
| State Government Employees | 0 | 0.0% |
| Federal Government Employees | 0 | 0.0% |
| Unpaid Family Workers | 0 | 0.0% |
| Total | 414 | 100.0% |
Employment Status by Age in Roan Mountain
According to the labor force statistics for Roan Mountain, out of the total population over 16 years of age (898), 48.1% or 432 individuals are in the labor force, with 4.2% or 18 of them unemployed. The age group with the highest labor force participation rate is 60 to 64 years, with 100.0% or 51 individuals in the labor force. Within the labor force, the 45 to 54 years age range has the highest percentage of unemployed individuals, with 12.9% or 11 of them being unemployed.
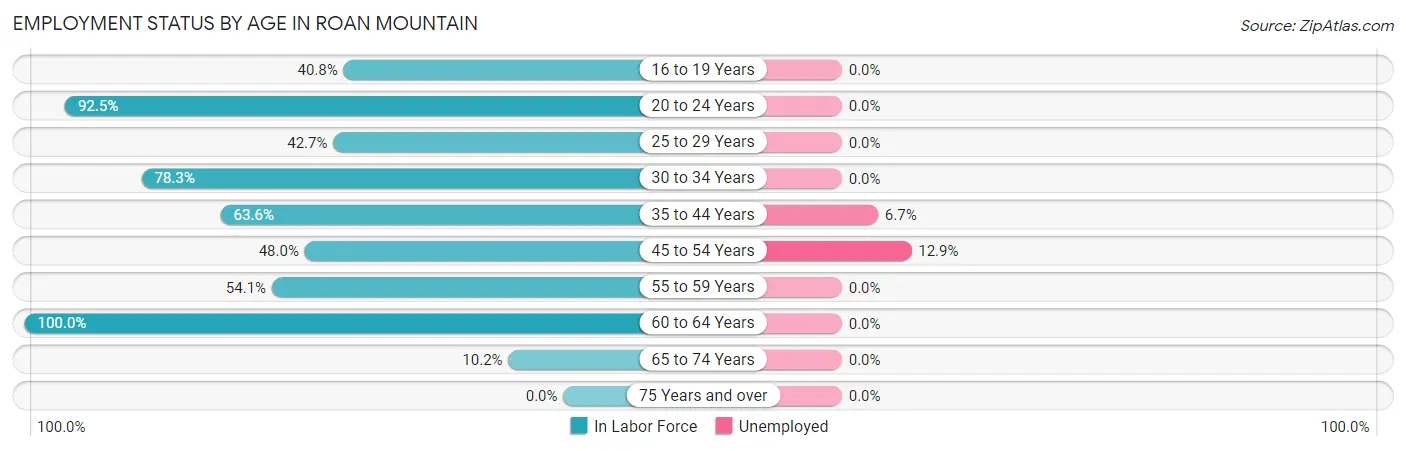
| Age Bracket | In Labor Force | Unemployed |
| 16 to 19 Years | 29 (40.8%) | 0 (0.0%) |
| 20 to 24 Years | 49 (92.5%) | 0 (0.0%) |
| 25 to 29 Years | 32 (42.7%) | 0 (0.0%) |
| 30 to 34 Years | 47 (78.3%) | 0 (0.0%) |
| 35 to 44 Years | 105 (63.6%) | 7 (6.7%) |
| 45 to 54 Years | 85 (48.0%) | 11 (12.9%) |
| 55 to 59 Years | 20 (54.1%) | 0 (0.0%) |
| 60 to 64 Years | 51 (100.0%) | 0 (0.0%) |
| 65 to 74 Years | 14 (10.2%) | 0 (0.0%) |
| 75 Years and over | 0 (0.0%) | 0 (0.0%) |
| Total | 432 (48.1%) | 18 (4.2%) |
Employment Status by Educational Attainment in Roan Mountain
According to labor force statistics for Roan Mountain, 60.2% of individuals (340) out of the total population between 25 and 64 years of age (565) are in the labor force, with 5.3% or 18 of them being unemployed. The group with the highest labor force participation rate are those with the educational attainment of bachelor's degree or higher, with 88.5% or 131 individuals in the labor force. Within the labor force, individuals with high school diploma education have the highest percentage of unemployment, with 15.9% or 18 of them being unemployed.
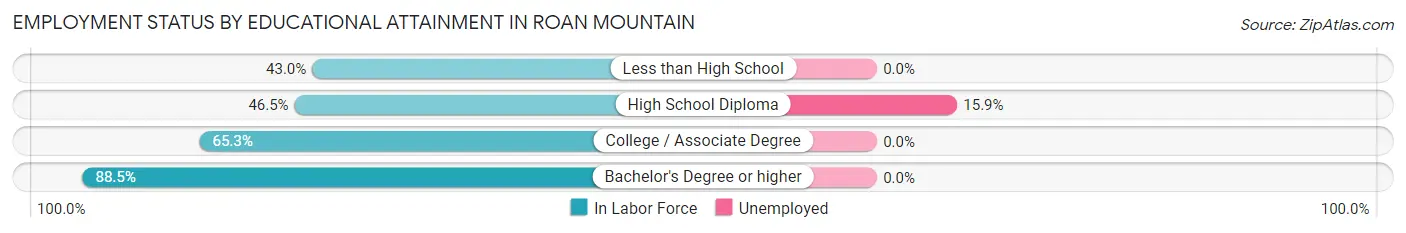
| Educational Attainment | In Labor Force | Unemployed |
| Less than High School | 34 (43.0%) | 0 (0.0%) |
| High School Diploma | 113 (46.5%) | 39 (15.9%) |
| College / Associate Degree | 62 (65.3%) | 0 (0.0%) |
| Bachelor's Degree or higher | 131 (88.5%) | 0 (0.0%) |
| Total | 340 (60.2%) | 30 (5.3%) |
Employment Occupations by Sex in Roan Mountain
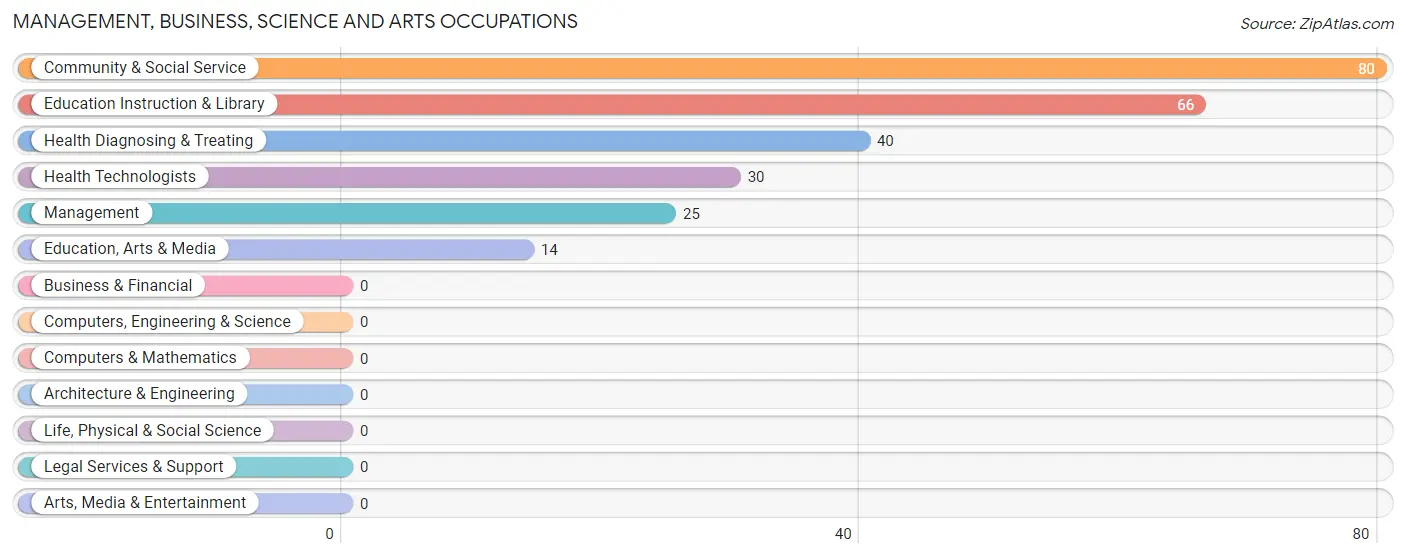
Management, Business, Science and Arts Occupations
The most common Management, Business, Science and Arts occupations in Roan Mountain are Community & Social Service (80 | 19.3%), Education Instruction & Library (66 | 15.9%), Health Diagnosing & Treating (40 | 9.7%), Health Technologists (30 | 7.2%), and Management (25 | 6.0%).
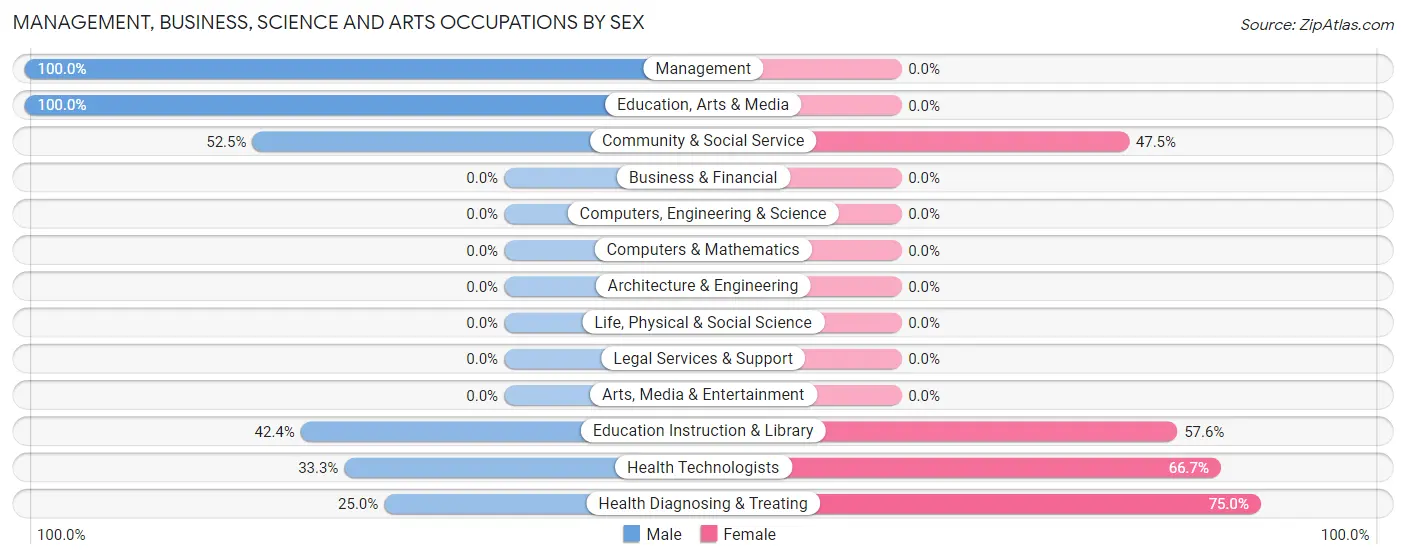
Management, Business, Science and Arts Occupations by Sex
Within the Management, Business, Science and Arts occupations in Roan Mountain, the most male-oriented occupations are Management (100.0%), Education, Arts & Media (100.0%), and Community & Social Service (52.5%), while the most female-oriented occupations are Health Diagnosing & Treating (75.0%), Health Technologists (66.7%), and Education Instruction & Library (57.6%).
| Occupation | Male | Female |
| Management | 25 (100.0%) | 0 (0.0%) |
| Business & Financial | 0 (0.0%) | 0 (0.0%) |
| Computers, Engineering & Science | 0 (0.0%) | 0 (0.0%) |
| Computers & Mathematics | 0 (0.0%) | 0 (0.0%) |
| Architecture & Engineering | 0 (0.0%) | 0 (0.0%) |
| Life, Physical & Social Science | 0 (0.0%) | 0 (0.0%) |
| Community & Social Service | 42 (52.5%) | 38 (47.5%) |
| Education, Arts & Media | 14 (100.0%) | 0 (0.0%) |
| Legal Services & Support | 0 (0.0%) | 0 (0.0%) |
| Education Instruction & Library | 28 (42.4%) | 38 (57.6%) |
| Arts, Media & Entertainment | 0 (0.0%) | 0 (0.0%) |
| Health Diagnosing & Treating | 10 (25.0%) | 30 (75.0%) |
| Health Technologists | 10 (33.3%) | 20 (66.7%) |
| Total (Category) | 77 (53.1%) | 68 (46.9%) |
| Total (Overall) | 269 (65.0%) | 145 (35.0%) |
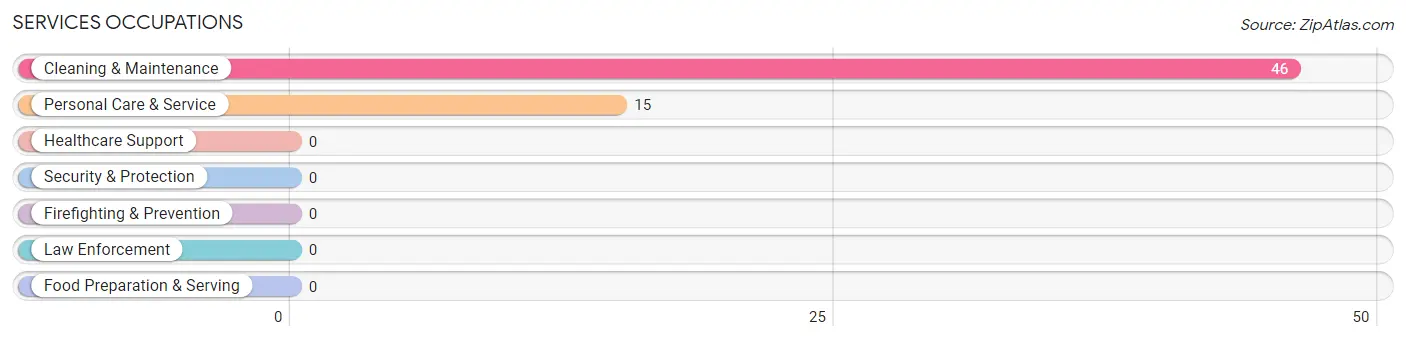
Services Occupations
The most common Services occupations in Roan Mountain are Cleaning & Maintenance (46 | 11.1%), and Personal Care & Service (15 | 3.6%).
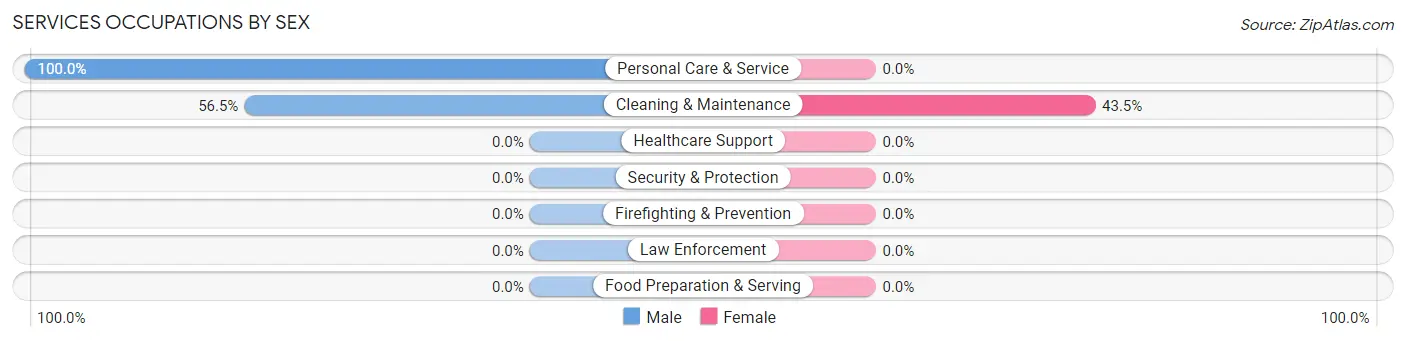
Services Occupations by Sex
| Occupation | Male | Female |
| Healthcare Support | 0 (0.0%) | 0 (0.0%) |
| Security & Protection | 0 (0.0%) | 0 (0.0%) |
| Firefighting & Prevention | 0 (0.0%) | 0 (0.0%) |
| Law Enforcement | 0 (0.0%) | 0 (0.0%) |
| Food Preparation & Serving | 0 (0.0%) | 0 (0.0%) |
| Cleaning & Maintenance | 26 (56.5%) | 20 (43.5%) |
| Personal Care & Service | 15 (100.0%) | 0 (0.0%) |
| Total (Category) | 41 (67.2%) | 20 (32.8%) |
| Total (Overall) | 269 (65.0%) | 145 (35.0%) |
Sales and Office Occupations
The most common Sales and Office occupations in Roan Mountain are Sales & Related (17 | 4.1%), and Office & Administration (12 | 2.9%).
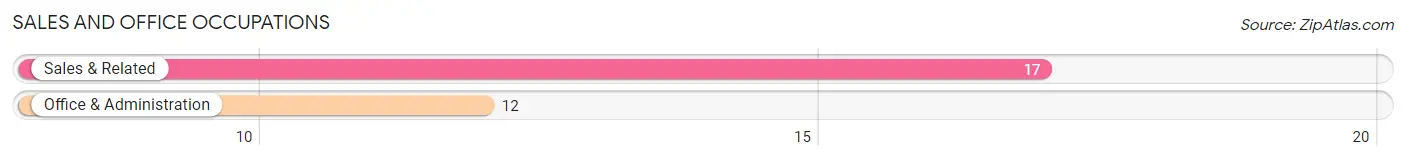
Sales and Office Occupations by Sex
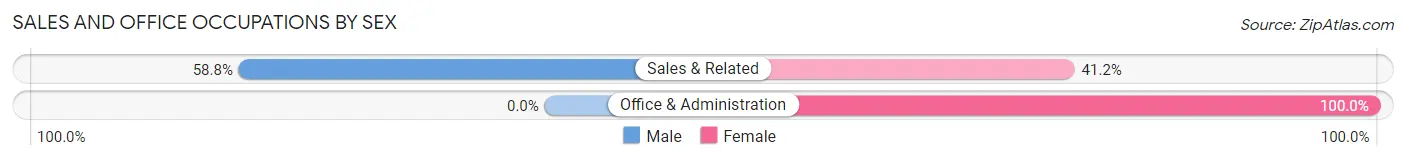
| Occupation | Male | Female |
| Sales & Related | 10 (58.8%) | 7 (41.2%) |
| Office & Administration | 0 (0.0%) | 12 (100.0%) |
| Total (Category) | 10 (34.5%) | 19 (65.5%) |
| Total (Overall) | 269 (65.0%) | 145 (35.0%) |
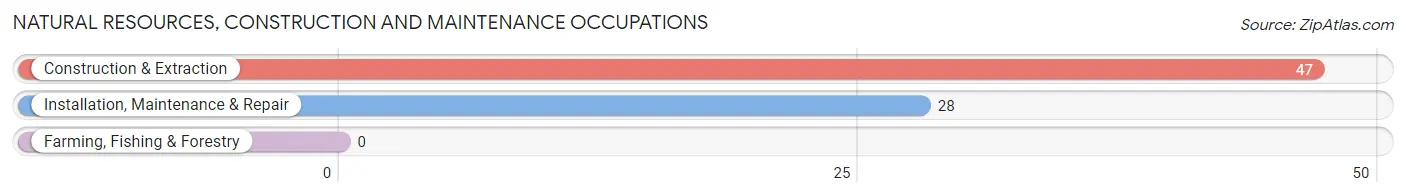
Natural Resources, Construction and Maintenance Occupations
The most common Natural Resources, Construction and Maintenance occupations in Roan Mountain are Construction & Extraction (47 | 11.4%), and Installation, Maintenance & Repair (28 | 6.8%).
Natural Resources, Construction and Maintenance Occupations by Sex
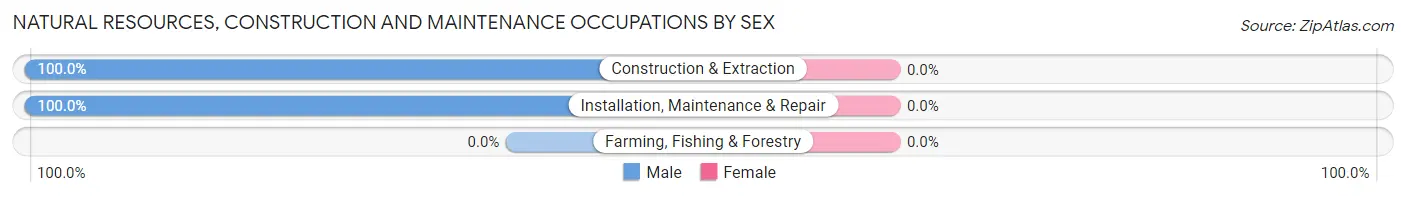
| Occupation | Male | Female |
| Farming, Fishing & Forestry | 0 (0.0%) | 0 (0.0%) |
| Construction & Extraction | 47 (100.0%) | 0 (0.0%) |
| Installation, Maintenance & Repair | 28 (100.0%) | 0 (0.0%) |
| Total (Category) | 75 (100.0%) | 0 (0.0%) |
| Total (Overall) | 269 (65.0%) | 145 (35.0%) |
Production, Transportation and Moving Occupations
The most common Production, Transportation and Moving occupations in Roan Mountain are Production (71 | 17.2%), Material Moving (19 | 4.6%), and Transportation (14 | 3.4%).
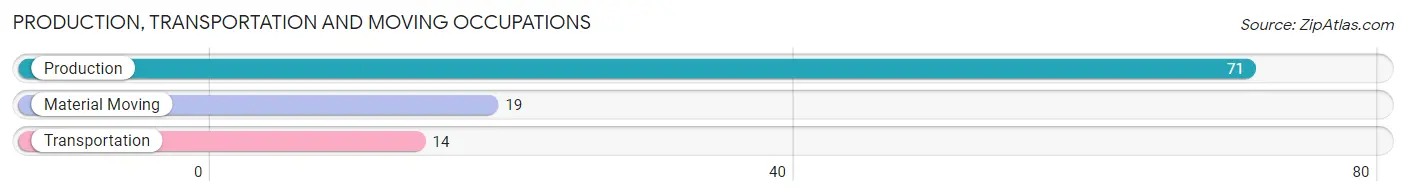
Production, Transportation and Moving Occupations by Sex
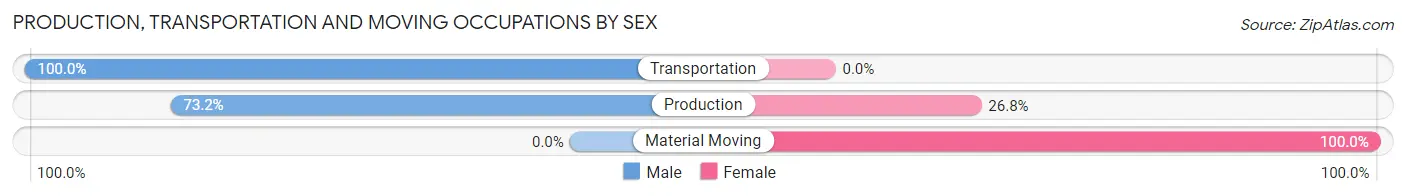
| Occupation | Male | Female |
| Production | 52 (73.2%) | 19 (26.8%) |
| Transportation | 14 (100.0%) | 0 (0.0%) |
| Material Moving | 0 (0.0%) | 19 (100.0%) |
| Total (Category) | 66 (63.5%) | 38 (36.5%) |
| Total (Overall) | 269 (65.0%) | 145 (35.0%) |
Employment Industries by Sex in Roan Mountain
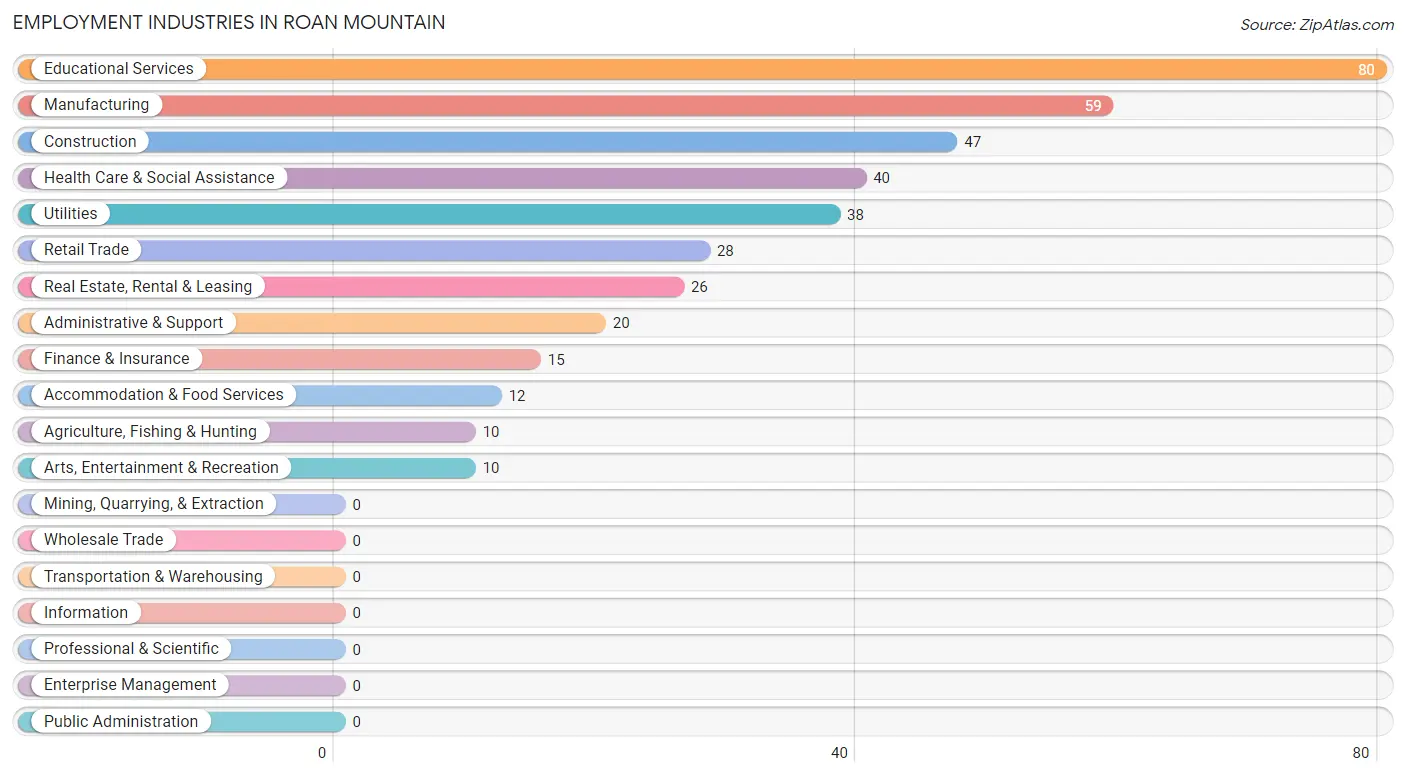
Employment Industries in Roan Mountain
The major employment industries in Roan Mountain include Educational Services (80 | 19.3%), Manufacturing (59 | 14.2%), Construction (47 | 11.4%), Health Care & Social Assistance (40 | 9.7%), and Utilities (38 | 9.2%).
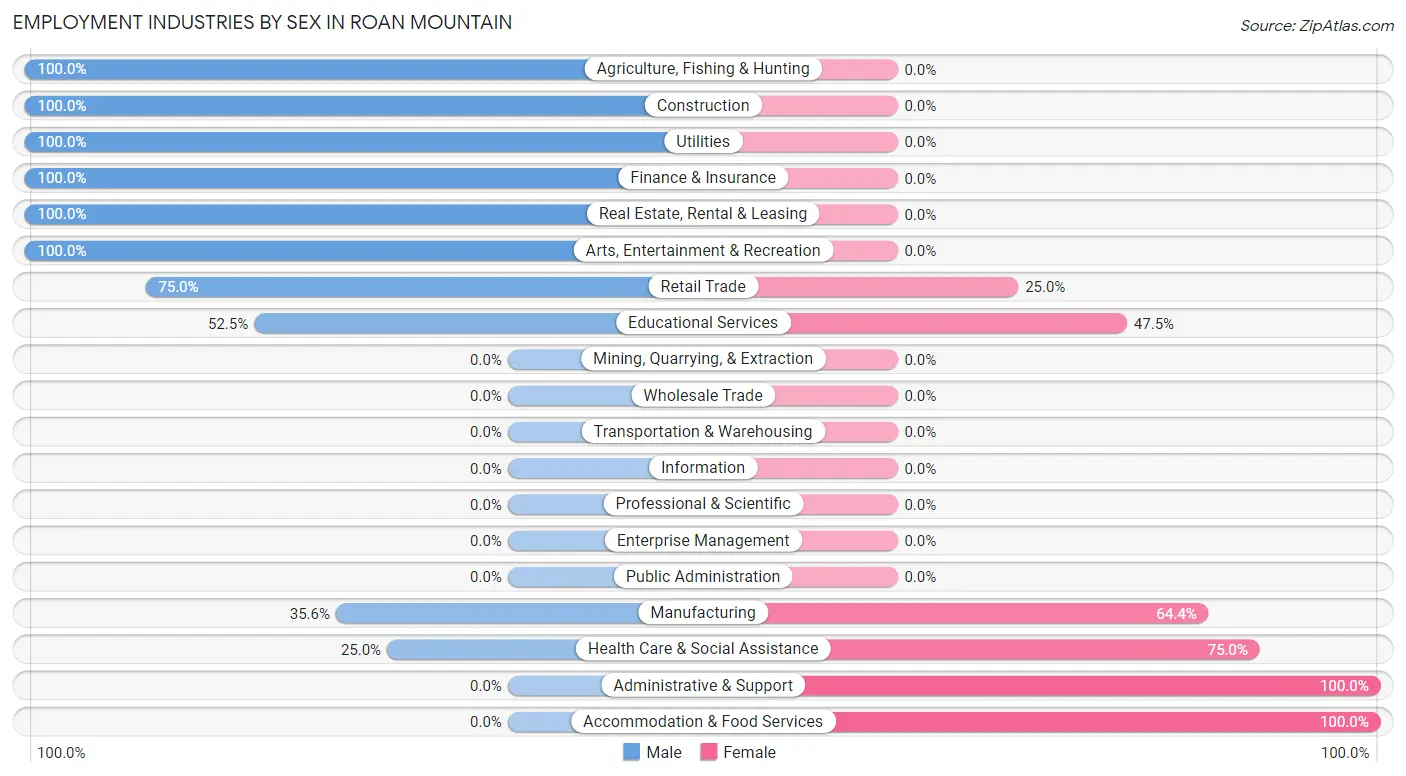
Employment Industries by Sex in Roan Mountain
The Roan Mountain industries that see more men than women are Agriculture, Fishing & Hunting (100.0%), Construction (100.0%), and Utilities (100.0%), whereas the industries that tend to have a higher number of women are Administrative & Support (100.0%), Accommodation & Food Services (100.0%), and Health Care & Social Assistance (75.0%).
| Industry | Male | Female |
| Agriculture, Fishing & Hunting | 10 (100.0%) | 0 (0.0%) |
| Mining, Quarrying, & Extraction | 0 (0.0%) | 0 (0.0%) |
| Construction | 47 (100.0%) | 0 (0.0%) |
| Manufacturing | 21 (35.6%) | 38 (64.4%) |
| Wholesale Trade | 0 (0.0%) | 0 (0.0%) |
| Retail Trade | 21 (75.0%) | 7 (25.0%) |
| Transportation & Warehousing | 0 (0.0%) | 0 (0.0%) |
| Utilities | 38 (100.0%) | 0 (0.0%) |
| Information | 0 (0.0%) | 0 (0.0%) |
| Finance & Insurance | 15 (100.0%) | 0 (0.0%) |
| Real Estate, Rental & Leasing | 26 (100.0%) | 0 (0.0%) |
| Professional & Scientific | 0 (0.0%) | 0 (0.0%) |
| Enterprise Management | 0 (0.0%) | 0 (0.0%) |
| Administrative & Support | 0 (0.0%) | 20 (100.0%) |
| Educational Services | 42 (52.5%) | 38 (47.5%) |
| Health Care & Social Assistance | 10 (25.0%) | 30 (75.0%) |
| Arts, Entertainment & Recreation | 10 (100.0%) | 0 (0.0%) |
| Accommodation & Food Services | 0 (0.0%) | 12 (100.0%) |
| Public Administration | 0 (0.0%) | 0 (0.0%) |
| Total | 269 (65.0%) | 145 (35.0%) |
Education in Roan Mountain
School Enrollment in Roan Mountain
The most common levels of schooling among the 160 students in Roan Mountain are high school (103 | 64.4%), middle school (41 | 25.6%), and graduate / professional (9 | 5.6%).
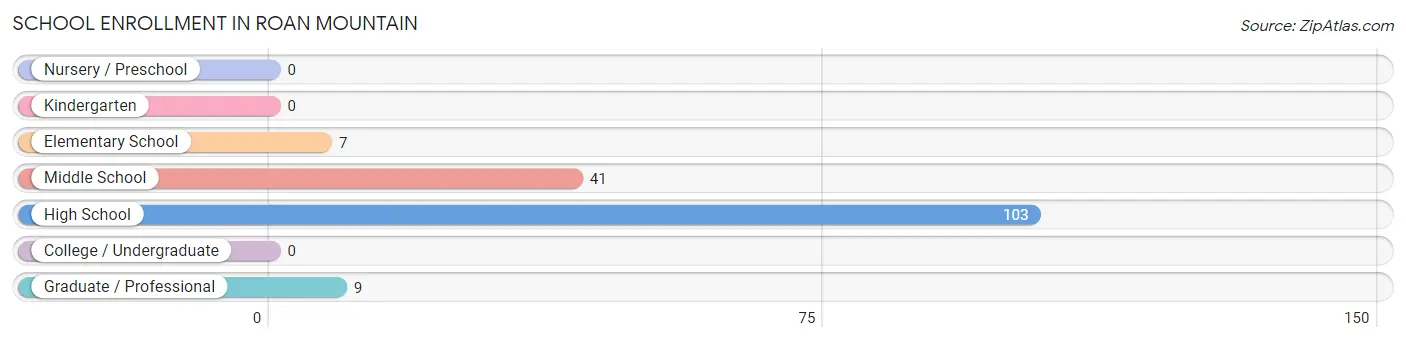
| School Level | # Students | % Students |
| Nursery / Preschool | 0 | 0.0% |
| Kindergarten | 0 | 0.0% |
| Elementary School | 7 | 4.4% |
| Middle School | 41 | 25.6% |
| High School | 103 | 64.4% |
| College / Undergraduate | 0 | 0.0% |
| Graduate / Professional | 9 | 5.6% |
| Total | 160 | 100.0% |
School Enrollment by Age by Funding Source in Roan Mountain
Out of a total of 160 students who are enrolled in schools in Roan Mountain, 25 (15.6%) attend a private institution, while the remaining 135 (84.4%) are enrolled in public schools. The age group of 5 to 9 year old has the highest likelihood of being enrolled in private schools, with 3 (100.0% in the age bracket) enrolled. Conversely, the age group of 15 to 17 year olds has the lowest likelihood of being enrolled in a private school, with 87 (100.0% in the age bracket) attending a public institution.
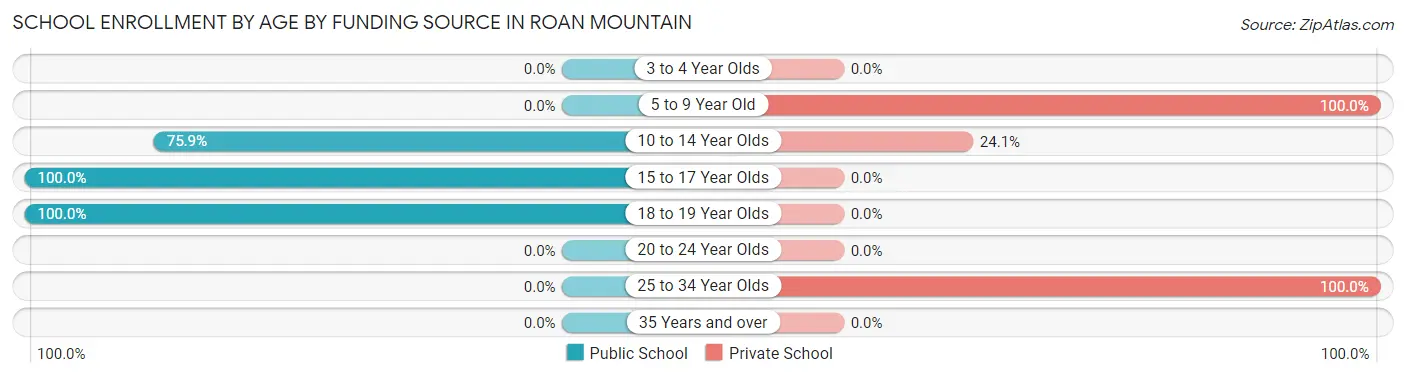
| Age Bracket | Public School | Private School |
| 3 to 4 Year Olds | 0 (0.0%) | 0 (0.0%) |
| 5 to 9 Year Old | 0 (0.0%) | 3 (100.0%) |
| 10 to 14 Year Olds | 41 (75.9%) | 13 (24.1%) |
| 15 to 17 Year Olds | 87 (100.0%) | 0 (0.0%) |
| 18 to 19 Year Olds | 7 (100.0%) | 0 (0.0%) |
| 20 to 24 Year Olds | 0 (0.0%) | 0 (0.0%) |
| 25 to 34 Year Olds | 0 (0.0%) | 9 (100.0%) |
| 35 Years and over | 0 (0.0%) | 0 (0.0%) |
| Total | 135 (84.4%) | 25 (15.6%) |
Educational Attainment by Field of Study in Roan Mountain
Education (58 | 31.2%), science & technology (47 | 25.3%), liberal arts & history (25 | 13.4%), bio, nature & agricultural (19 | 10.2%), and psychology (19 | 10.2%) are the most common fields of study among 186 individuals in Roan Mountain who have obtained a bachelor's degree or higher.
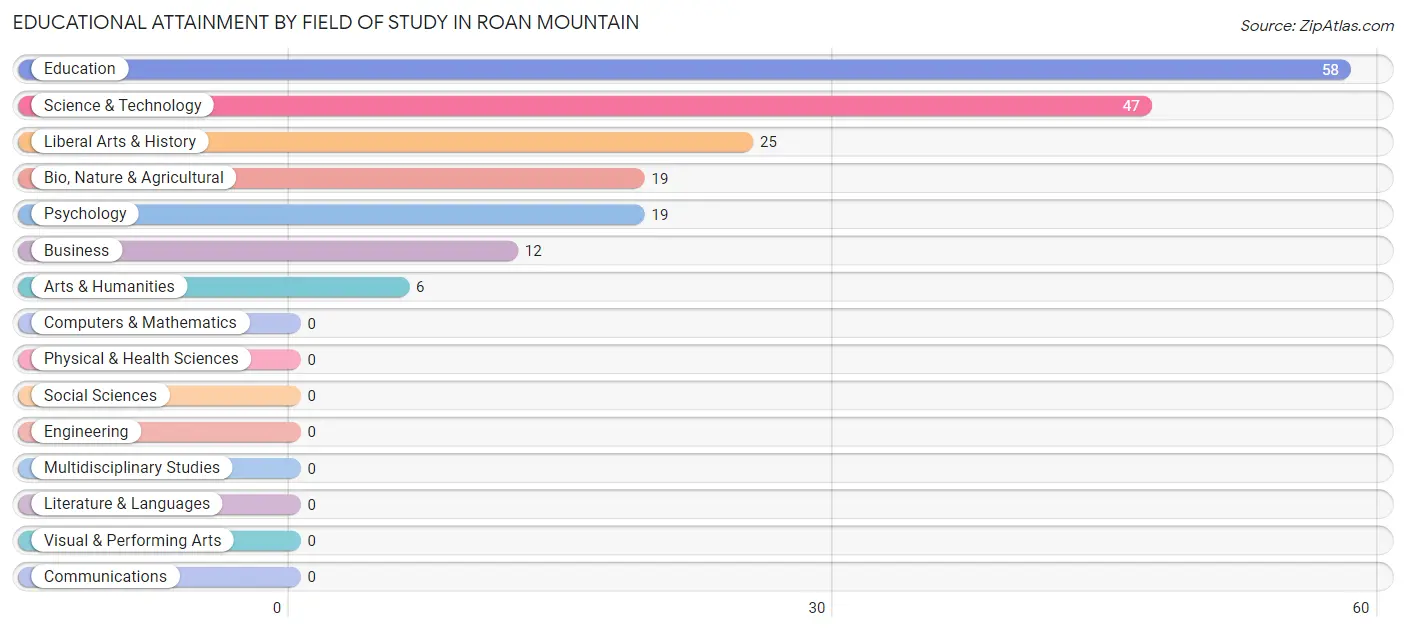
| Field of Study | # Graduates | % Graduates |
| Computers & Mathematics | 0 | 0.0% |
| Bio, Nature & Agricultural | 19 | 10.2% |
| Physical & Health Sciences | 0 | 0.0% |
| Psychology | 19 | 10.2% |
| Social Sciences | 0 | 0.0% |
| Engineering | 0 | 0.0% |
| Multidisciplinary Studies | 0 | 0.0% |
| Science & Technology | 47 | 25.3% |
| Business | 12 | 6.5% |
| Education | 58 | 31.2% |
| Literature & Languages | 0 | 0.0% |
| Liberal Arts & History | 25 | 13.4% |
| Visual & Performing Arts | 0 | 0.0% |
| Communications | 0 | 0.0% |
| Arts & Humanities | 6 | 3.2% |
| Total | 186 | 100.0% |
Transportation & Commute in Roan Mountain
Vehicle Availability by Sex in Roan Mountain
The most prevalent vehicle ownership categories in Roan Mountain are males with 2 vehicles (116, accounting for 43.1%) and females with 2 vehicles (50, making up 80.0%).
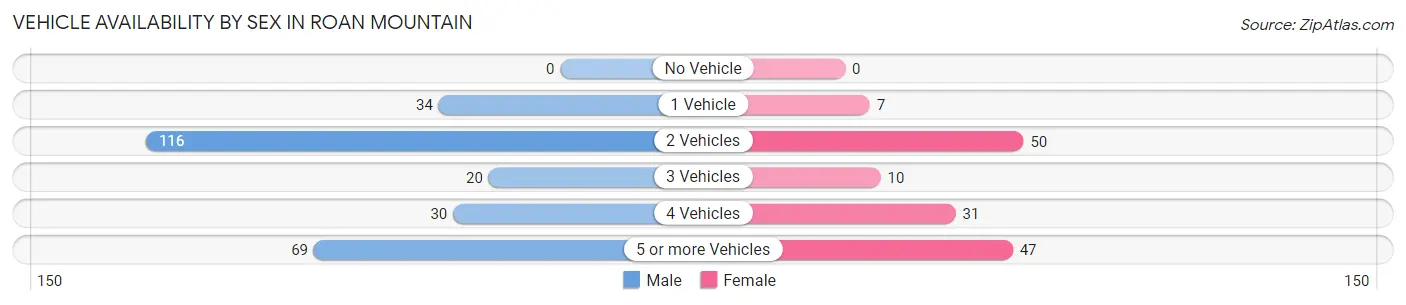
| Vehicles Available | Male | Female |
| No Vehicle | 0 (0.0%) | 0 (0.0%) |
| 1 Vehicle | 34 (12.6%) | 7 (4.8%) |
| 2 Vehicles | 116 (43.1%) | 50 (34.5%) |
| 3 Vehicles | 20 (7.4%) | 10 (6.9%) |
| 4 Vehicles | 30 (11.2%) | 31 (21.4%) |
| 5 or more Vehicles | 69 (25.7%) | 47 (32.4%) |
| Total | 269 (100.0%) | 145 (100.0%) |
Commute Time in Roan Mountain
The most frequently occuring commute durations in Roan Mountain are 30 to 34 minutes (125 commuters, 31.5%), 45 to 59 minutes (82 commuters, 20.6%), and 20 to 24 minutes (63 commuters, 15.9%).
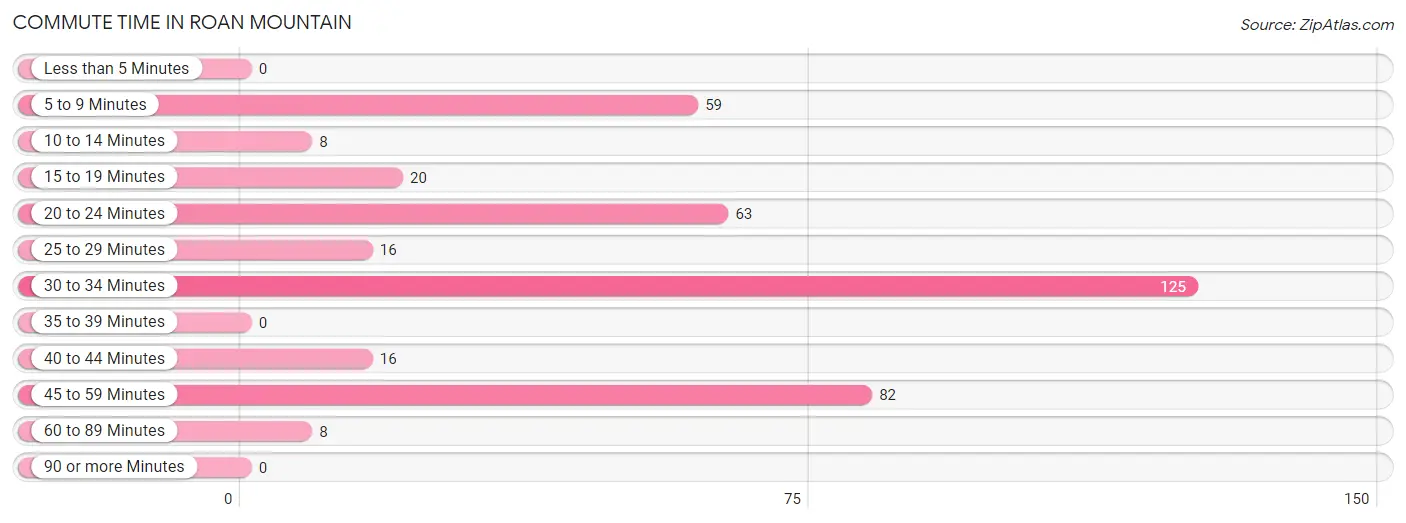
| Commute Time | # Commuters | % Commuters |
| Less than 5 Minutes | 0 | 0.0% |
| 5 to 9 Minutes | 59 | 14.9% |
| 10 to 14 Minutes | 8 | 2.0% |
| 15 to 19 Minutes | 20 | 5.0% |
| 20 to 24 Minutes | 63 | 15.9% |
| 25 to 29 Minutes | 16 | 4.0% |
| 30 to 34 Minutes | 125 | 31.5% |
| 35 to 39 Minutes | 0 | 0.0% |
| 40 to 44 Minutes | 16 | 4.0% |
| 45 to 59 Minutes | 82 | 20.6% |
| 60 to 89 Minutes | 8 | 2.0% |
| 90 or more Minutes | 0 | 0.0% |
Commute Time by Sex in Roan Mountain
The most common commute times in Roan Mountain are 30 to 34 minutes (79 commuters, 31.4%) for males and 45 to 59 minutes (49 commuters, 33.8%) for females.
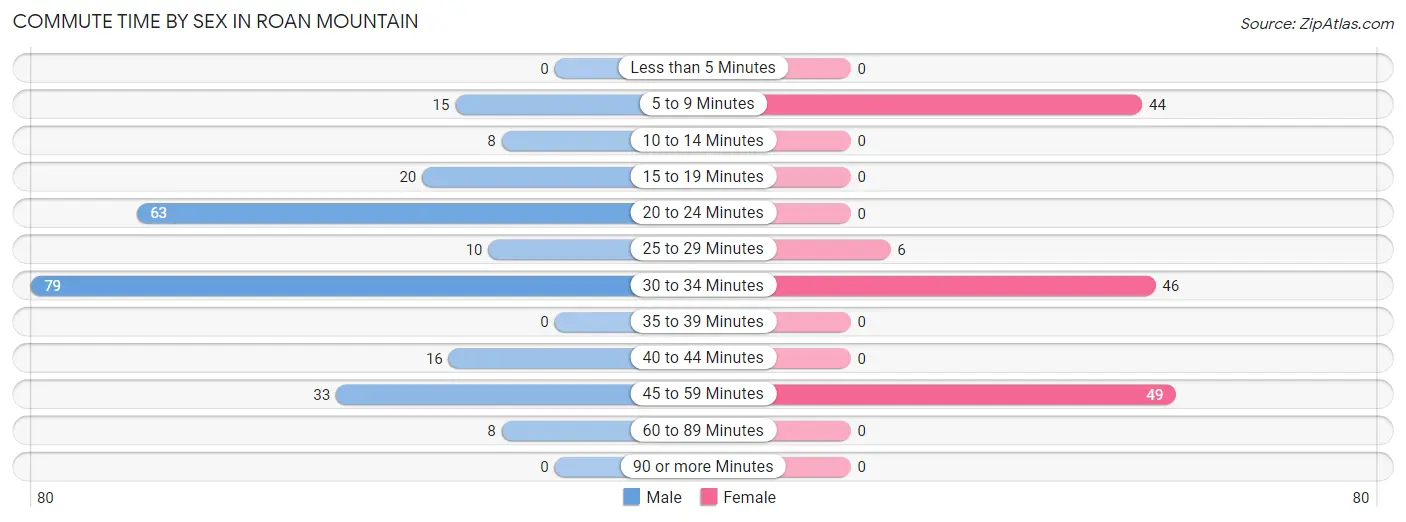
| Commute Time | Male | Female |
| Less than 5 Minutes | 0 (0.0%) | 0 (0.0%) |
| 5 to 9 Minutes | 15 (5.9%) | 44 (30.3%) |
| 10 to 14 Minutes | 8 (3.2%) | 0 (0.0%) |
| 15 to 19 Minutes | 20 (7.9%) | 0 (0.0%) |
| 20 to 24 Minutes | 63 (25.0%) | 0 (0.0%) |
| 25 to 29 Minutes | 10 (4.0%) | 6 (4.1%) |
| 30 to 34 Minutes | 79 (31.4%) | 46 (31.7%) |
| 35 to 39 Minutes | 0 (0.0%) | 0 (0.0%) |
| 40 to 44 Minutes | 16 (6.4%) | 0 (0.0%) |
| 45 to 59 Minutes | 33 (13.1%) | 49 (33.8%) |
| 60 to 89 Minutes | 8 (3.2%) | 0 (0.0%) |
| 90 or more Minutes | 0 (0.0%) | 0 (0.0%) |
Time of Departure to Work by Sex in Roan Mountain
The most frequent times of departure to work in Roan Mountain are 7:00 AM to 7:29 AM (52, 20.6%) for males and 7:00 AM to 7:29 AM (69, 47.6%) for females.
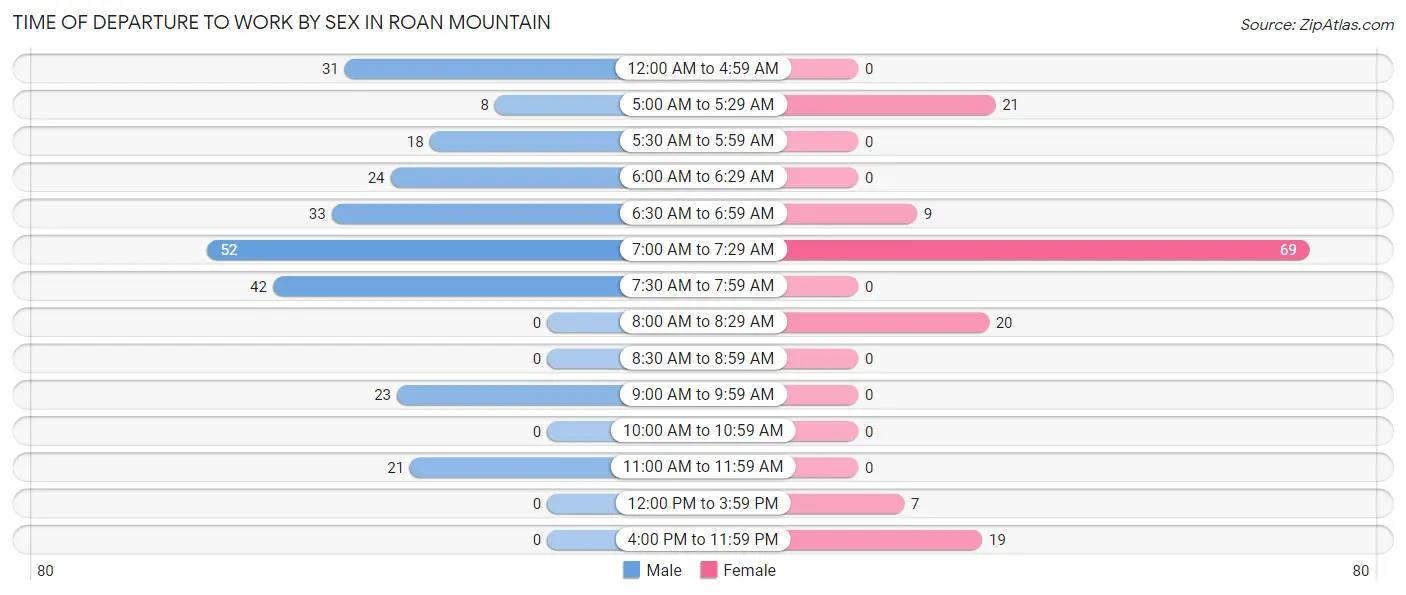
| Time of Departure | Male | Female |
| 12:00 AM to 4:59 AM | 31 (12.3%) | 0 (0.0%) |
| 5:00 AM to 5:29 AM | 8 (3.2%) | 21 (14.5%) |
| 5:30 AM to 5:59 AM | 18 (7.1%) | 0 (0.0%) |
| 6:00 AM to 6:29 AM | 24 (9.5%) | 0 (0.0%) |
| 6:30 AM to 6:59 AM | 33 (13.1%) | 9 (6.2%) |
| 7:00 AM to 7:29 AM | 52 (20.6%) | 69 (47.6%) |
| 7:30 AM to 7:59 AM | 42 (16.7%) | 0 (0.0%) |
| 8:00 AM to 8:29 AM | 0 (0.0%) | 20 (13.8%) |
| 8:30 AM to 8:59 AM | 0 (0.0%) | 0 (0.0%) |
| 9:00 AM to 9:59 AM | 23 (9.1%) | 0 (0.0%) |
| 10:00 AM to 10:59 AM | 0 (0.0%) | 0 (0.0%) |
| 11:00 AM to 11:59 AM | 21 (8.3%) | 0 (0.0%) |
| 12:00 PM to 3:59 PM | 0 (0.0%) | 7 (4.8%) |
| 4:00 PM to 11:59 PM | 0 (0.0%) | 19 (13.1%) |
| Total | 252 (100.0%) | 145 (100.0%) |
Housing Occupancy in Roan Mountain
Occupancy by Ownership in Roan Mountain
Of the total 368 dwellings in Roan Mountain, owner-occupied units account for 316 (85.9%), while renter-occupied units make up 52 (14.1%).
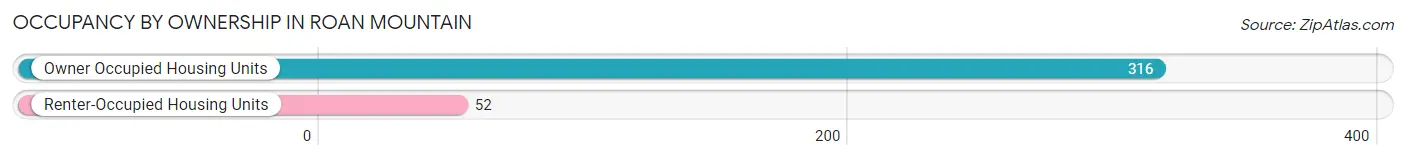
| Occupancy | # Housing Units | % Housing Units |
| Owner Occupied Housing Units | 316 | 85.9% |
| Renter-Occupied Housing Units | 52 | 14.1% |
| Total Occupied Housing Units | 368 | 100.0% |
Occupancy by Household Size in Roan Mountain
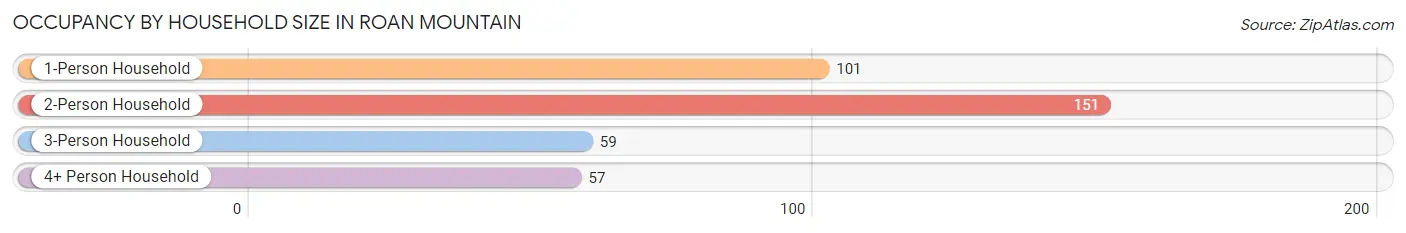
| Household Size | # Housing Units | % Housing Units |
| 1-Person Household | 101 | 27.5% |
| 2-Person Household | 151 | 41.0% |
| 3-Person Household | 59 | 16.0% |
| 4+ Person Household | 57 | 15.5% |
| Total Housing Units | 368 | 100.0% |
Occupancy by Ownership by Household Size in Roan Mountain
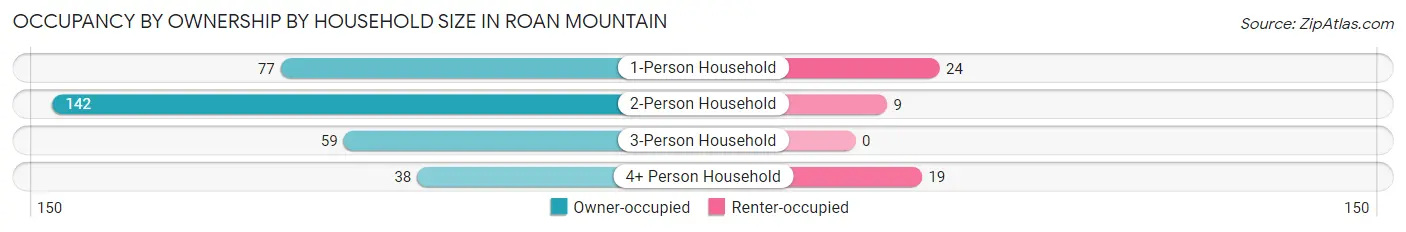
| Household Size | Owner-occupied | Renter-occupied |
| 1-Person Household | 77 (76.2%) | 24 (23.8%) |
| 2-Person Household | 142 (94.0%) | 9 (6.0%) |
| 3-Person Household | 59 (100.0%) | 0 (0.0%) |
| 4+ Person Household | 38 (66.7%) | 19 (33.3%) |
| Total Housing Units | 316 (85.9%) | 52 (14.1%) |
Occupancy by Educational Attainment in Roan Mountain
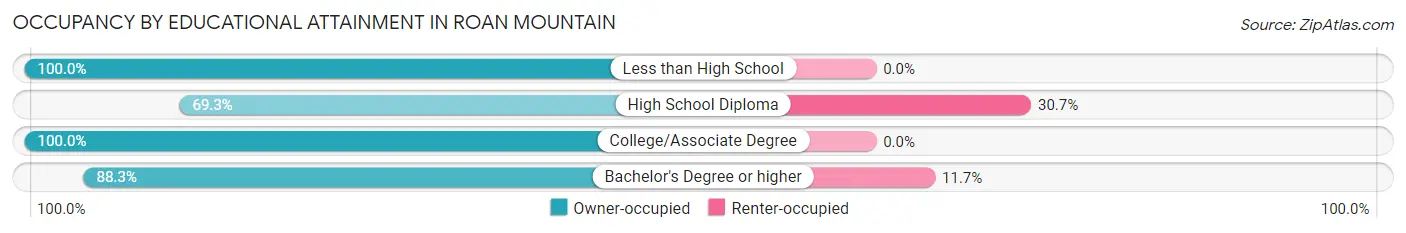
| Household Size | Owner-occupied | Renter-occupied |
| Less than High School | 64 (100.0%) | 0 (0.0%) |
| High School Diploma | 97 (69.3%) | 43 (30.7%) |
| College/Associate Degree | 87 (100.0%) | 0 (0.0%) |
| Bachelor's Degree or higher | 68 (88.3%) | 9 (11.7%) |
Occupancy by Age of Householder in Roan Mountain
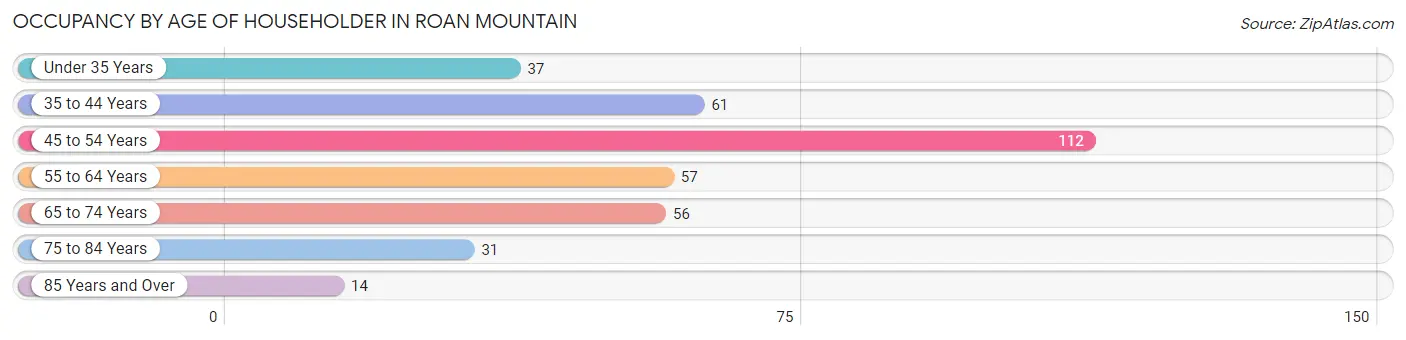
| Age Bracket | # Households | % Households |
| Under 35 Years | 37 | 10.1% |
| 35 to 44 Years | 61 | 16.6% |
| 45 to 54 Years | 112 | 30.4% |
| 55 to 64 Years | 57 | 15.5% |
| 65 to 74 Years | 56 | 15.2% |
| 75 to 84 Years | 31 | 8.4% |
| 85 Years and Over | 14 | 3.8% |
| Total | 368 | 100.0% |
Housing Finances in Roan Mountain
Median Income by Occupancy in Roan Mountain
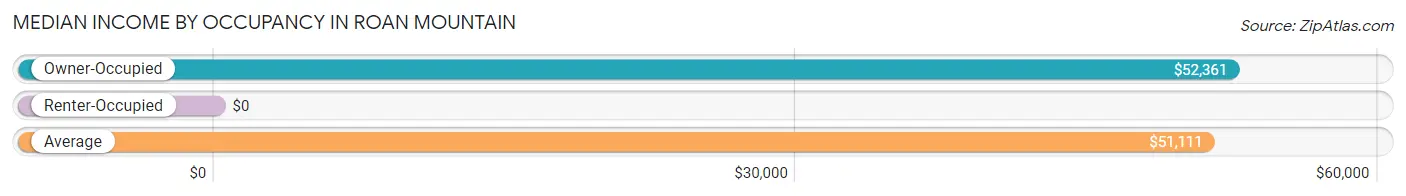
| Occupancy Type | # Households | Median Income |
| Owner-Occupied | 316 (85.9%) | $52,361 |
| Renter-Occupied | 52 (14.1%) | $0 |
| Average | 368 (100.0%) | $51,111 |
Occupancy by Householder Income Bracket in Roan Mountain
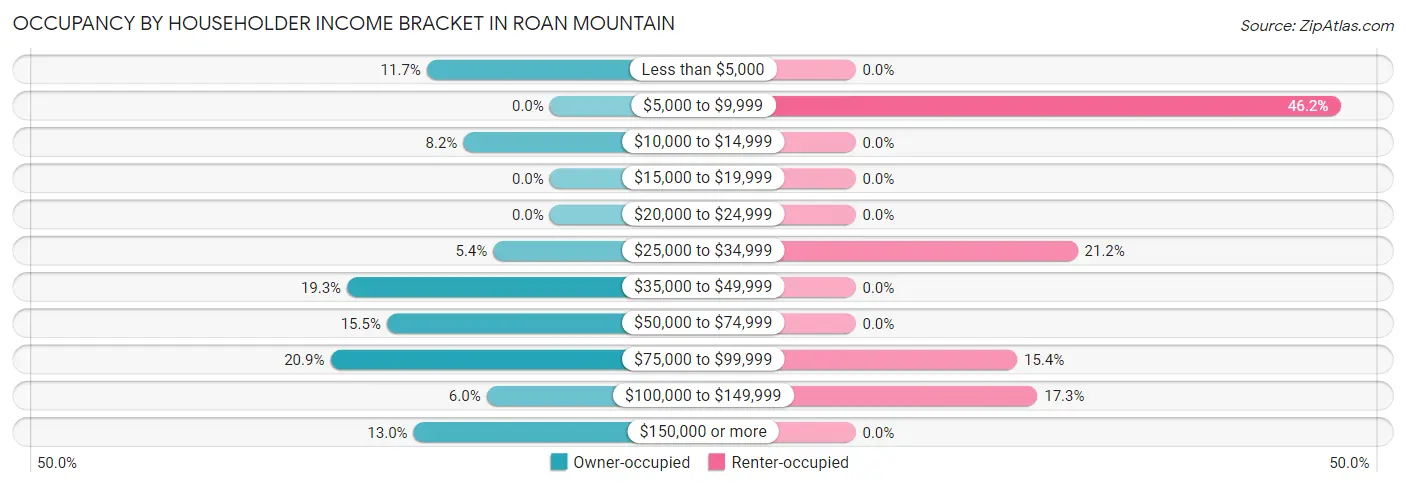
| Income Bracket | Owner-occupied | Renter-occupied |
| Less than $5,000 | 37 (11.7%) | 0 (0.0%) |
| $5,000 to $9,999 | 0 (0.0%) | 24 (46.2%) |
| $10,000 to $14,999 | 26 (8.2%) | 0 (0.0%) |
| $15,000 to $19,999 | 0 (0.0%) | 0 (0.0%) |
| $20,000 to $24,999 | 0 (0.0%) | 0 (0.0%) |
| $25,000 to $34,999 | 17 (5.4%) | 11 (21.1%) |
| $35,000 to $49,999 | 61 (19.3%) | 0 (0.0%) |
| $50,000 to $74,999 | 49 (15.5%) | 0 (0.0%) |
| $75,000 to $99,999 | 66 (20.9%) | 8 (15.4%) |
| $100,000 to $149,999 | 19 (6.0%) | 9 (17.3%) |
| $150,000 or more | 41 (13.0%) | 0 (0.0%) |
| Total | 316 (100.0%) | 52 (100.0%) |
Monthly Housing Cost Tiers in Roan Mountain
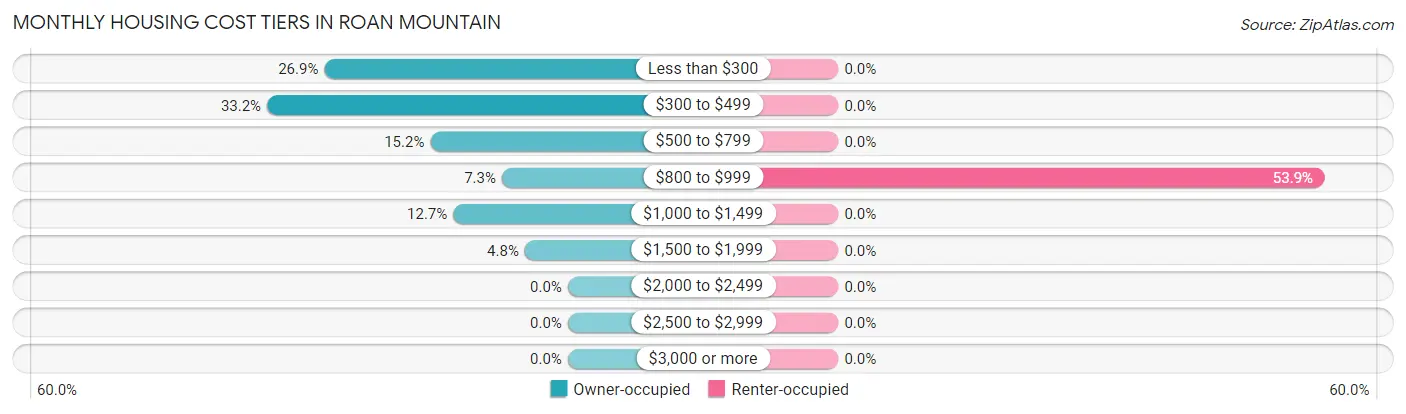
| Monthly Cost | Owner-occupied | Renter-occupied |
| Less than $300 | 85 (26.9%) | 0 (0.0%) |
| $300 to $499 | 105 (33.2%) | 0 (0.0%) |
| $500 to $799 | 48 (15.2%) | 0 (0.0%) |
| $800 to $999 | 23 (7.3%) | 28 (53.8%) |
| $1,000 to $1,499 | 40 (12.7%) | 0 (0.0%) |
| $1,500 to $1,999 | 15 (4.8%) | 0 (0.0%) |
| $2,000 to $2,499 | 0 (0.0%) | 0 (0.0%) |
| $2,500 to $2,999 | 0 (0.0%) | 0 (0.0%) |
| $3,000 or more | 0 (0.0%) | 0 (0.0%) |
| Total | 316 (100.0%) | 52 (100.0%) |
Physical Housing Characteristics in Roan Mountain
Housing Structures in Roan Mountain
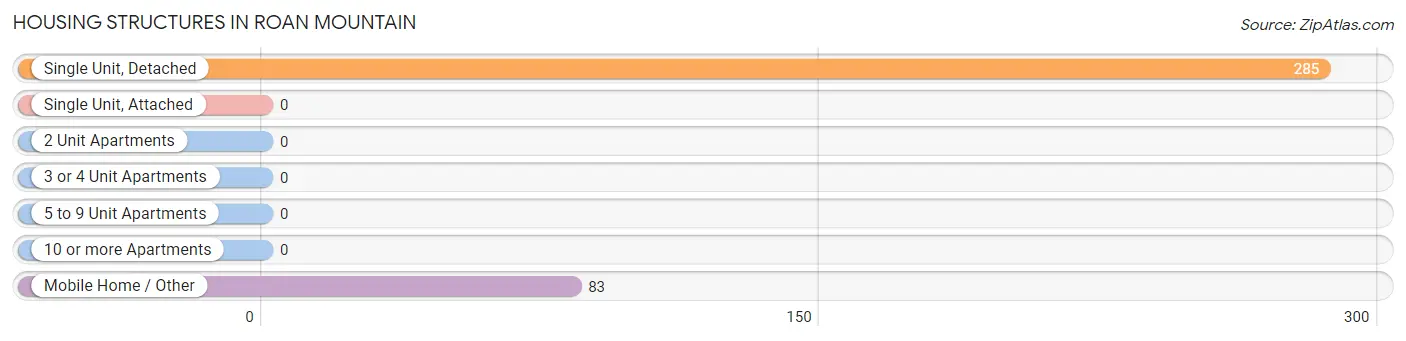
| Structure Type | # Housing Units | % Housing Units |
| Single Unit, Detached | 285 | 77.4% |
| Single Unit, Attached | 0 | 0.0% |
| 2 Unit Apartments | 0 | 0.0% |
| 3 or 4 Unit Apartments | 0 | 0.0% |
| 5 to 9 Unit Apartments | 0 | 0.0% |
| 10 or more Apartments | 0 | 0.0% |
| Mobile Home / Other | 83 | 22.6% |
| Total | 368 | 100.0% |
Housing Structures by Occupancy in Roan Mountain
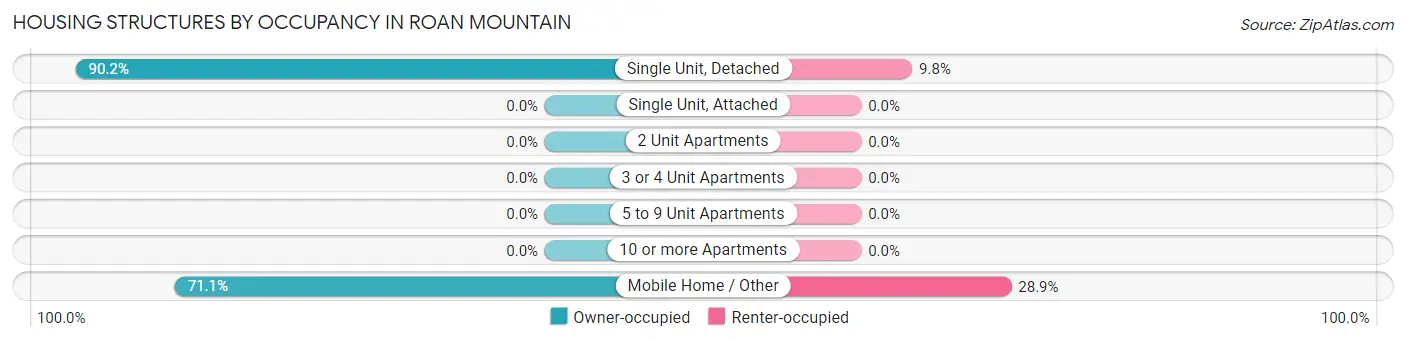
| Structure Type | Owner-occupied | Renter-occupied |
| Single Unit, Detached | 257 (90.2%) | 28 (9.8%) |
| Single Unit, Attached | 0 (0.0%) | 0 (0.0%) |
| 2 Unit Apartments | 0 (0.0%) | 0 (0.0%) |
| 3 or 4 Unit Apartments | 0 (0.0%) | 0 (0.0%) |
| 5 to 9 Unit Apartments | 0 (0.0%) | 0 (0.0%) |
| 10 or more Apartments | 0 (0.0%) | 0 (0.0%) |
| Mobile Home / Other | 59 (71.1%) | 24 (28.9%) |
| Total | 316 (85.9%) | 52 (14.1%) |
Housing Structures by Number of Rooms in Roan Mountain
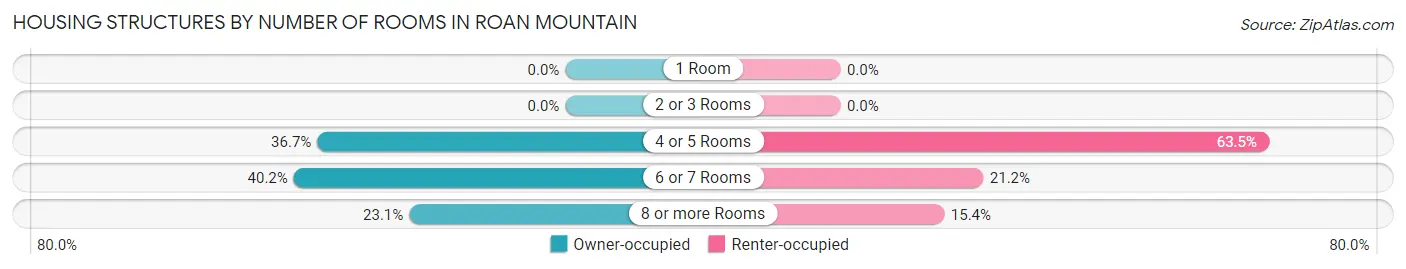
| Number of Rooms | Owner-occupied | Renter-occupied |
| 1 Room | 0 (0.0%) | 0 (0.0%) |
| 2 or 3 Rooms | 0 (0.0%) | 0 (0.0%) |
| 4 or 5 Rooms | 116 (36.7%) | 33 (63.5%) |
| 6 or 7 Rooms | 127 (40.2%) | 11 (21.1%) |
| 8 or more Rooms | 73 (23.1%) | 8 (15.4%) |
| Total | 316 (100.0%) | 52 (100.0%) |
Housing Structure by Heating Type in Roan Mountain
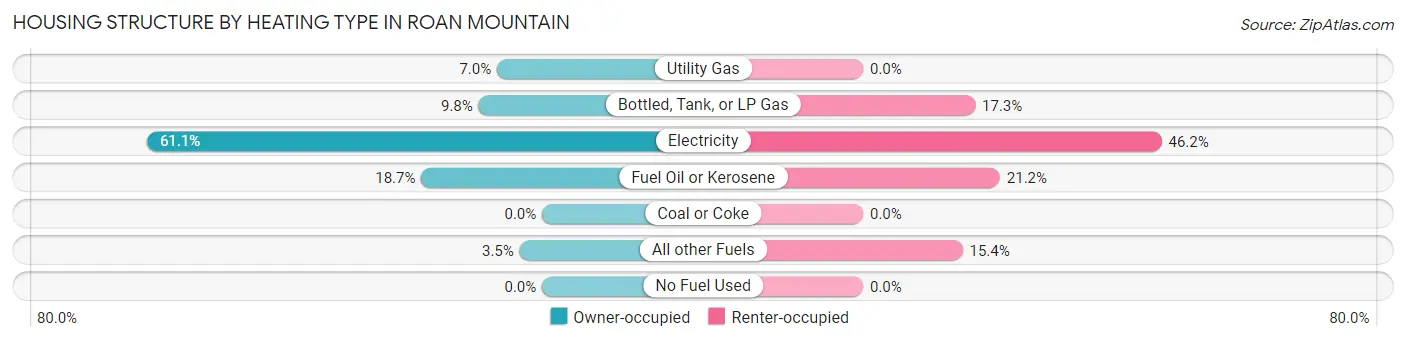
| Heating Type | Owner-occupied | Renter-occupied |
| Utility Gas | 22 (7.0%) | 0 (0.0%) |
| Bottled, Tank, or LP Gas | 31 (9.8%) | 9 (17.3%) |
| Electricity | 193 (61.1%) | 24 (46.2%) |
| Fuel Oil or Kerosene | 59 (18.7%) | 11 (21.1%) |
| Coal or Coke | 0 (0.0%) | 0 (0.0%) |
| All other Fuels | 11 (3.5%) | 8 (15.4%) |
| No Fuel Used | 0 (0.0%) | 0 (0.0%) |
| Total | 316 (100.0%) | 52 (100.0%) |
Household Vehicle Usage in Roan Mountain
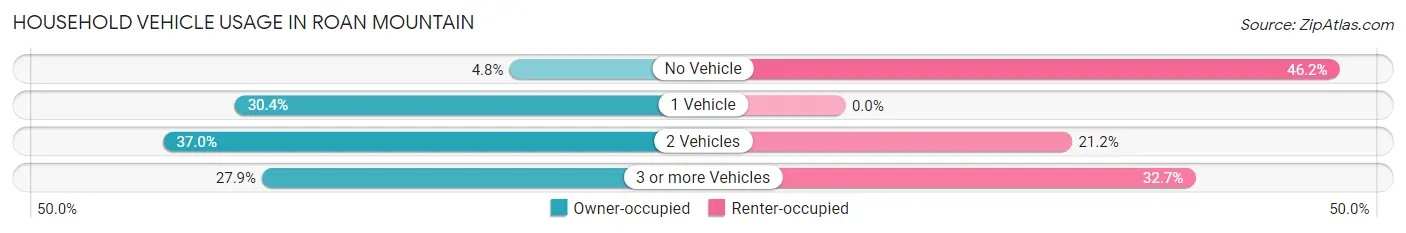
| Vehicles per Household | Owner-occupied | Renter-occupied |
| No Vehicle | 15 (4.8%) | 24 (46.2%) |
| 1 Vehicle | 96 (30.4%) | 0 (0.0%) |
| 2 Vehicles | 117 (37.0%) | 11 (21.1%) |
| 3 or more Vehicles | 88 (27.9%) | 17 (32.7%) |
| Total | 316 (100.0%) | 52 (100.0%) |
Real Estate & Mortgages in Roan Mountain
Real Estate and Mortgage Overview in Roan Mountain
| Characteristic | Without Mortgage | With Mortgage |
| Housing Units | 216 | 100 |
| Median Property Value | $143,300 | $138,700 |
| Median Household Income | $44,375 | $21 |
| Monthly Housing Costs | $323 | $0 |
| Real Estate Taxes | $825 | $0 |
Property Value by Mortgage Status in Roan Mountain
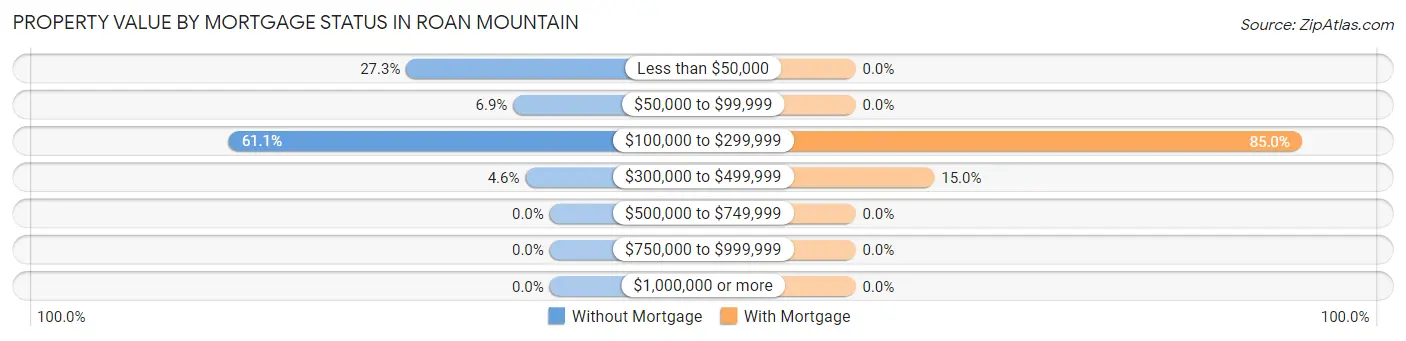
| Property Value | Without Mortgage | With Mortgage |
| Less than $50,000 | 59 (27.3%) | 0 (0.0%) |
| $50,000 to $99,999 | 15 (6.9%) | 0 (0.0%) |
| $100,000 to $299,999 | 132 (61.1%) | 85 (85.0%) |
| $300,000 to $499,999 | 10 (4.6%) | 15 (15.0%) |
| $500,000 to $749,999 | 0 (0.0%) | 0 (0.0%) |
| $750,000 to $999,999 | 0 (0.0%) | 0 (0.0%) |
| $1,000,000 or more | 0 (0.0%) | 0 (0.0%) |
| Total | 216 (100.0%) | 100 (100.0%) |
Household Income by Mortgage Status in Roan Mountain
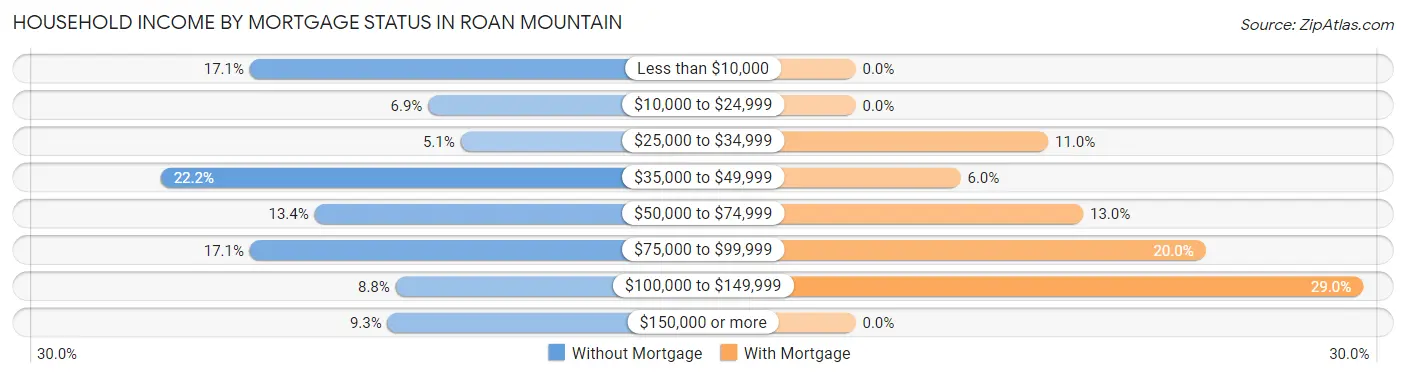
| Household Income | Without Mortgage | With Mortgage |
| Less than $10,000 | 37 (17.1%) | 0 (0.0%) |
| $10,000 to $24,999 | 15 (6.9%) | 0 (0.0%) |
| $25,000 to $34,999 | 11 (5.1%) | 11 (11.0%) |
| $35,000 to $49,999 | 48 (22.2%) | 6 (6.0%) |
| $50,000 to $74,999 | 29 (13.4%) | 13 (13.0%) |
| $75,000 to $99,999 | 37 (17.1%) | 20 (20.0%) |
| $100,000 to $149,999 | 19 (8.8%) | 29 (29.0%) |
| $150,000 or more | 20 (9.3%) | 0 (0.0%) |
| Total | 216 (100.0%) | 100 (100.0%) |
Property Value to Household Income Ratio in Roan Mountain
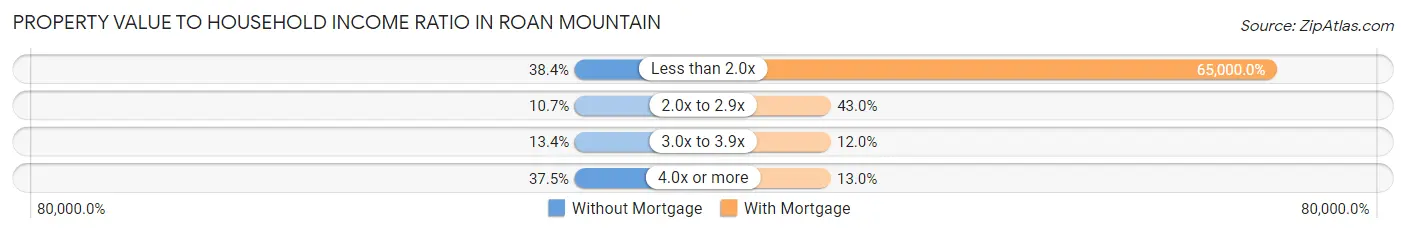
| Value-to-Income Ratio | Without Mortgage | With Mortgage |
| Less than 2.0x | 83 (38.4%) | 65,000 (65,000.0%) |
| 2.0x to 2.9x | 23 (10.6%) | 43 (43.0%) |
| 3.0x to 3.9x | 29 (13.4%) | 12 (12.0%) |
| 4.0x or more | 81 (37.5%) | 13 (13.0%) |
| Total | 216 (100.0%) | 100 (100.0%) |
Real Estate Taxes by Mortgage Status in Roan Mountain
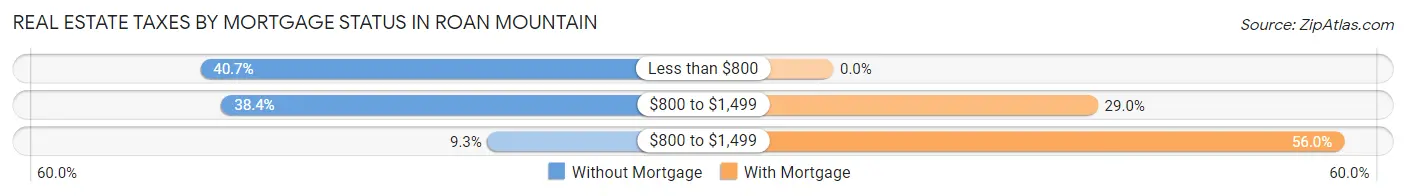
| Property Taxes | Without Mortgage | With Mortgage |
| Less than $800 | 88 (40.7%) | 0 (0.0%) |
| $800 to $1,499 | 83 (38.4%) | 29 (29.0%) |
| $800 to $1,499 | 20 (9.3%) | 56 (56.0%) |
| Total | 216 (100.0%) | 100 (100.0%) |
Health & Disability in Roan Mountain
Health Insurance Coverage by Age in Roan Mountain
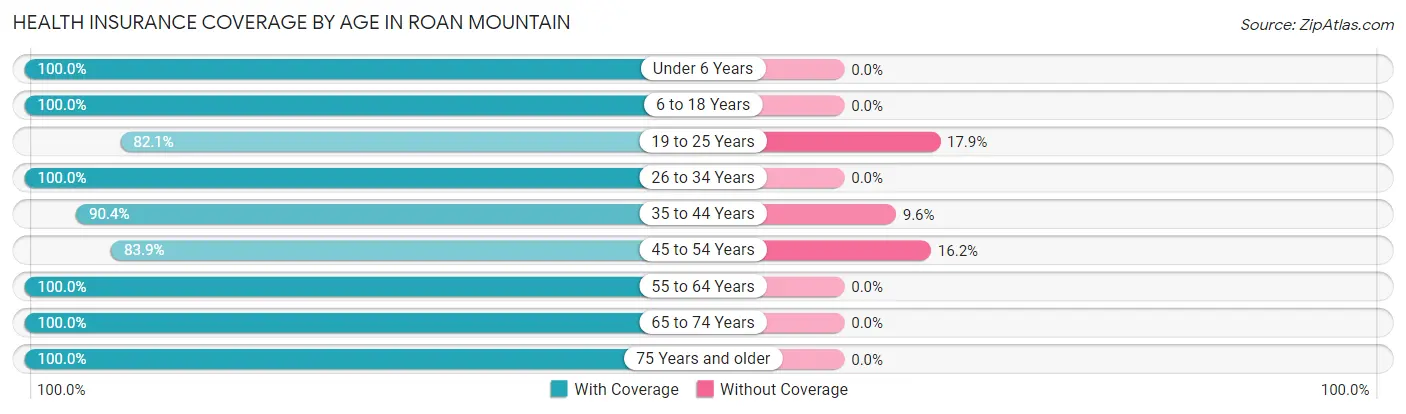
| Age Bracket | With Coverage | Without Coverage |
| Under 6 Years | 6 (100.0%) | 0 (0.0%) |
| 6 to 18 Years | 144 (100.0%) | 0 (0.0%) |
| 19 to 25 Years | 46 (82.1%) | 10 (17.9%) |
| 26 to 34 Years | 104 (100.0%) | 0 (0.0%) |
| 35 to 44 Years | 113 (90.4%) | 12 (9.6%) |
| 45 to 54 Years | 135 (83.9%) | 26 (16.2%) |
| 55 to 64 Years | 84 (100.0%) | 0 (0.0%) |
| 65 to 74 Years | 135 (100.0%) | 0 (0.0%) |
| 75 Years and older | 72 (100.0%) | 0 (0.0%) |
| Total | 839 (94.6%) | 48 (5.4%) |
Health Insurance Coverage by Citizenship Status in Roan Mountain
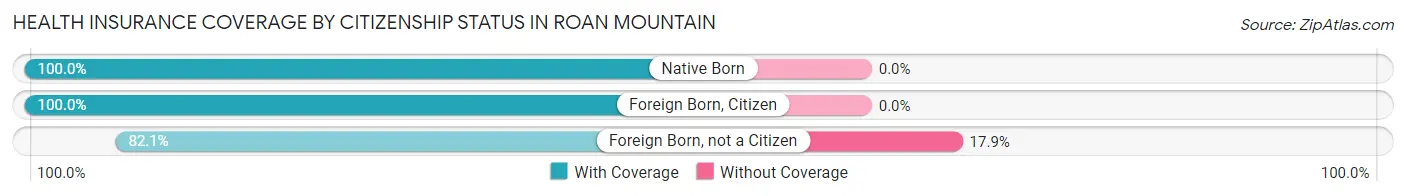
| Citizenship Status | With Coverage | Without Coverage |
| Native Born | 6 (100.0%) | 0 (0.0%) |
| Foreign Born, Citizen | 144 (100.0%) | 0 (0.0%) |
| Foreign Born, not a Citizen | 46 (82.1%) | 10 (17.9%) |
Health Insurance Coverage by Household Income in Roan Mountain
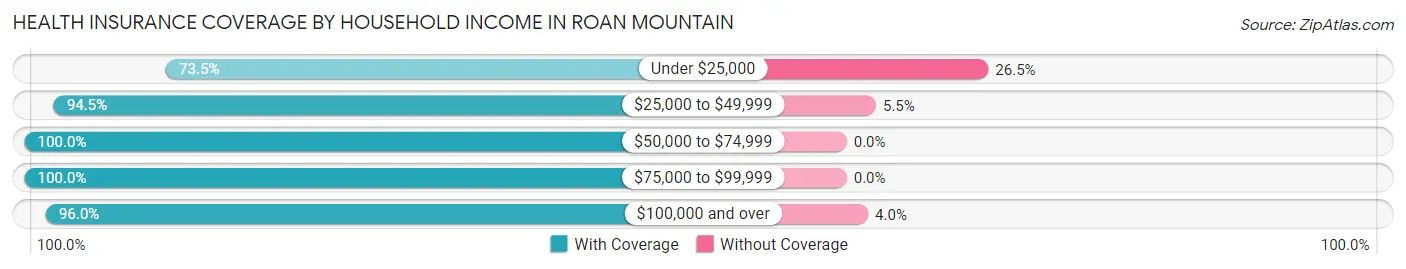
| Household Income | With Coverage | Without Coverage |
| Under $25,000 | 72 (73.5%) | 26 (26.5%) |
| $25,000 to $49,999 | 207 (94.5%) | 12 (5.5%) |
| $50,000 to $74,999 | 124 (100.0%) | 0 (0.0%) |
| $75,000 to $99,999 | 196 (100.0%) | 0 (0.0%) |
| $100,000 and over | 240 (96.0%) | 10 (4.0%) |
Public vs Private Health Insurance Coverage by Age in Roan Mountain
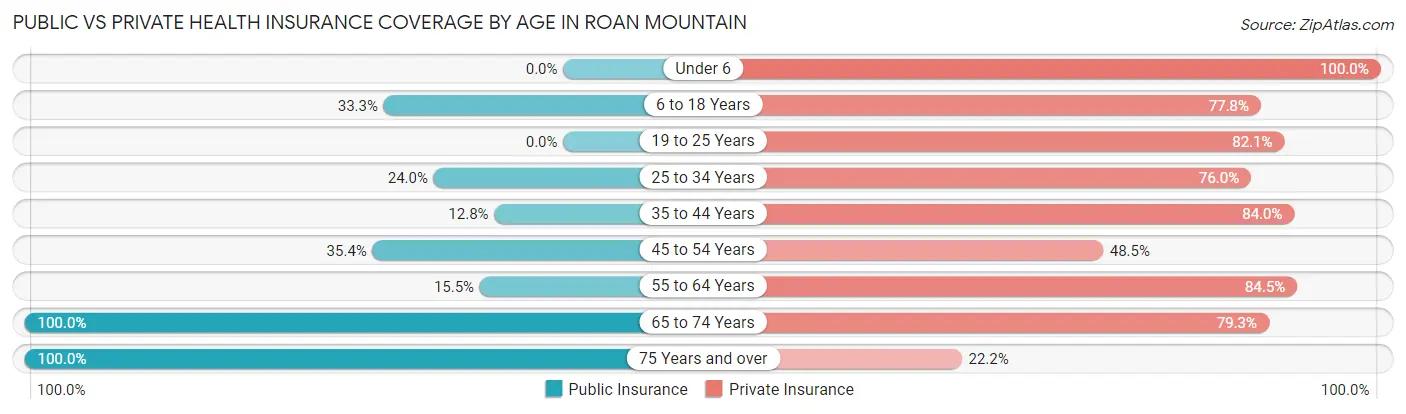
| Age Bracket | Public Insurance | Private Insurance |
| Under 6 | 0 (0.0%) | 6 (100.0%) |
| 6 to 18 Years | 48 (33.3%) | 112 (77.8%) |
| 19 to 25 Years | 0 (0.0%) | 46 (82.1%) |
| 25 to 34 Years | 25 (24.0%) | 79 (76.0%) |
| 35 to 44 Years | 16 (12.8%) | 105 (84.0%) |
| 45 to 54 Years | 57 (35.4%) | 78 (48.4%) |
| 55 to 64 Years | 13 (15.5%) | 71 (84.5%) |
| 65 to 74 Years | 135 (100.0%) | 107 (79.3%) |
| 75 Years and over | 72 (100.0%) | 16 (22.2%) |
| Total | 366 (41.3%) | 620 (69.9%) |
Disability Status by Sex by Age in Roan Mountain
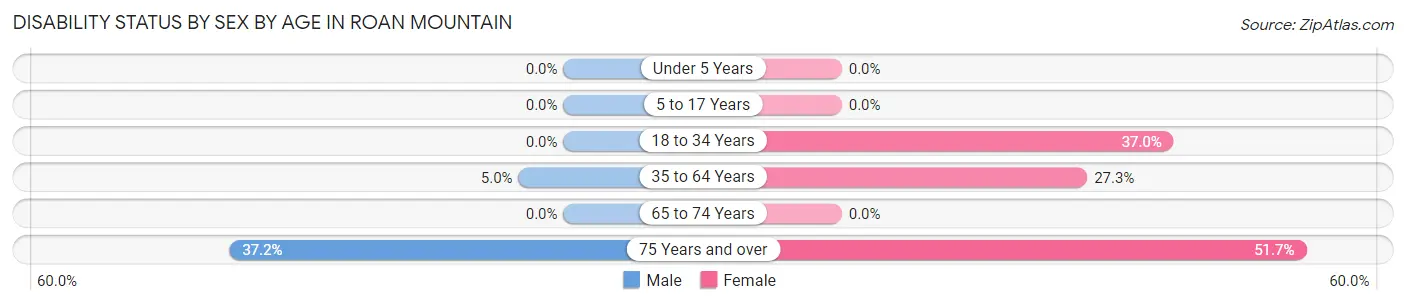
| Age Bracket | Male | Female |
| Under 5 Years | 0 (0.0%) | 0 (0.0%) |
| 5 to 17 Years | 0 (0.0%) | 0 (0.0%) |
| 18 to 34 Years | 0 (0.0%) | 34 (37.0%) |
| 35 to 64 Years | 11 (5.0%) | 41 (27.3%) |
| 65 to 74 Years | 0 (0.0%) | 0 (0.0%) |
| 75 Years and over | 16 (37.2%) | 15 (51.7%) |
Disability Class by Sex by Age in Roan Mountain
Disability Class: Hearing Difficulty
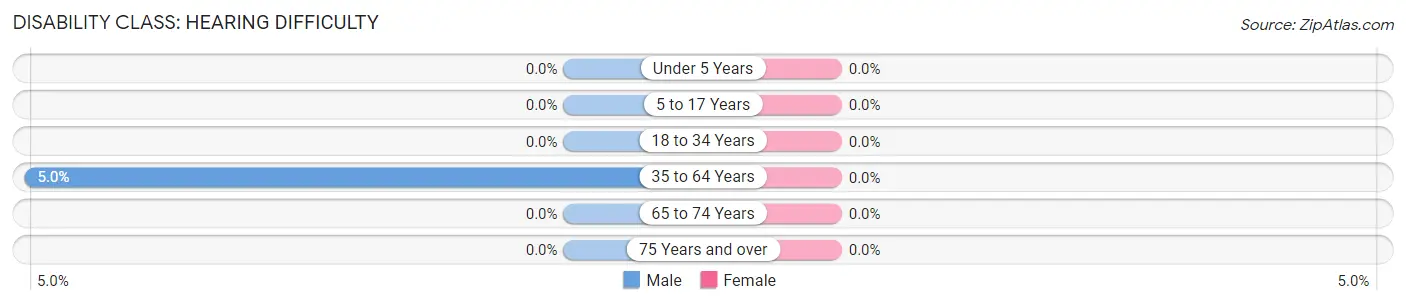
| Age Bracket | Male | Female |
| Under 5 Years | 0 (0.0%) | 0 (0.0%) |
| 5 to 17 Years | 0 (0.0%) | 0 (0.0%) |
| 18 to 34 Years | 0 (0.0%) | 0 (0.0%) |
| 35 to 64 Years | 11 (5.0%) | 0 (0.0%) |
| 65 to 74 Years | 0 (0.0%) | 0 (0.0%) |
| 75 Years and over | 0 (0.0%) | 0 (0.0%) |
Disability Class: Vision Difficulty
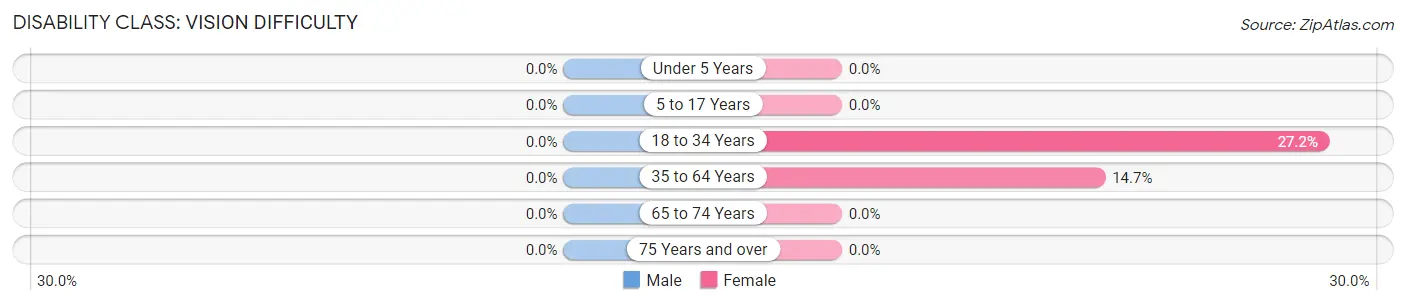
| Age Bracket | Male | Female |
| Under 5 Years | 0 (0.0%) | 0 (0.0%) |
| 5 to 17 Years | 0 (0.0%) | 0 (0.0%) |
| 18 to 34 Years | 0 (0.0%) | 25 (27.2%) |
| 35 to 64 Years | 0 (0.0%) | 22 (14.7%) |
| 65 to 74 Years | 0 (0.0%) | 0 (0.0%) |
| 75 Years and over | 0 (0.0%) | 0 (0.0%) |
Disability Class: Cognitive Difficulty
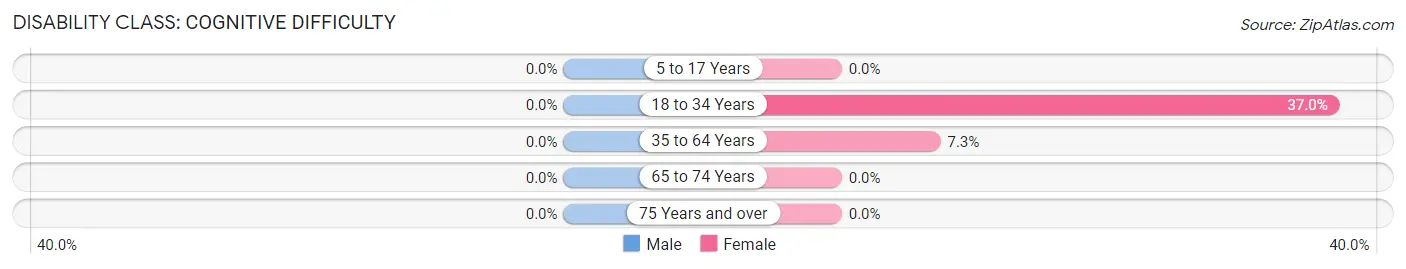
| Age Bracket | Male | Female |
| 5 to 17 Years | 0 (0.0%) | 0 (0.0%) |
| 18 to 34 Years | 0 (0.0%) | 34 (37.0%) |
| 35 to 64 Years | 0 (0.0%) | 11 (7.3%) |
| 65 to 74 Years | 0 (0.0%) | 0 (0.0%) |
| 75 Years and over | 0 (0.0%) | 0 (0.0%) |
Disability Class: Ambulatory Difficulty
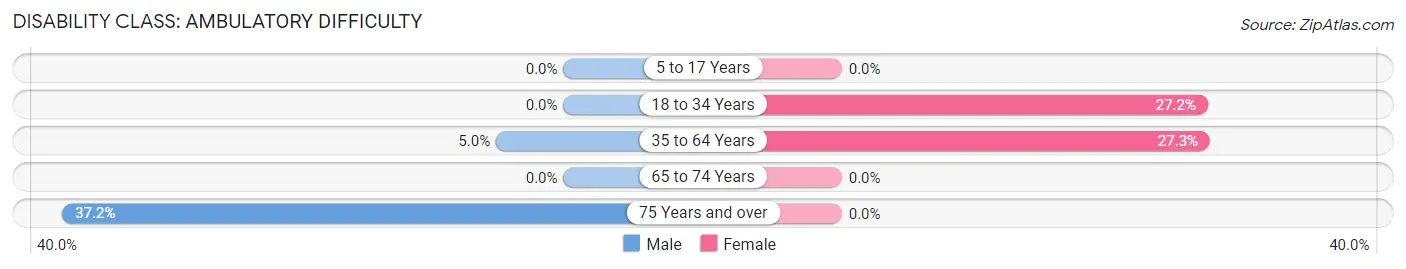
| Age Bracket | Male | Female |
| 5 to 17 Years | 0 (0.0%) | 0 (0.0%) |
| 18 to 34 Years | 0 (0.0%) | 25 (27.2%) |
| 35 to 64 Years | 11 (5.0%) | 41 (27.3%) |
| 65 to 74 Years | 0 (0.0%) | 0 (0.0%) |
| 75 Years and over | 16 (37.2%) | 0 (0.0%) |
Disability Class: Self-Care Difficulty
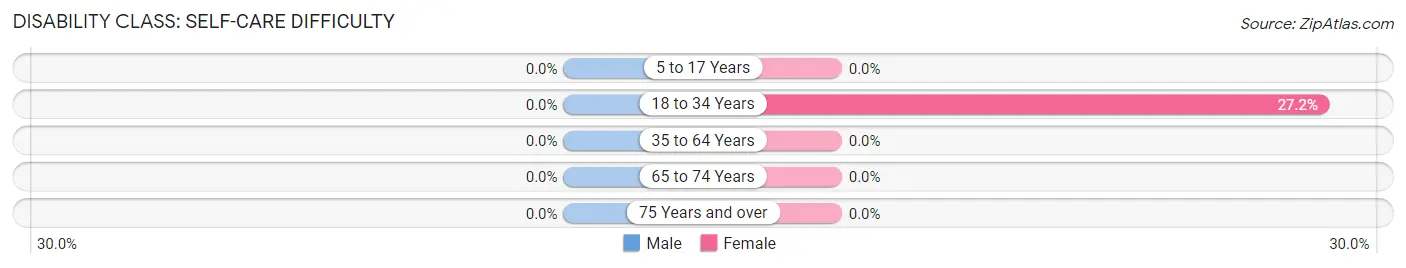
| Age Bracket | Male | Female |
| 5 to 17 Years | 0 (0.0%) | 0 (0.0%) |
| 18 to 34 Years | 0 (0.0%) | 25 (27.2%) |
| 35 to 64 Years | 0 (0.0%) | 0 (0.0%) |
| 65 to 74 Years | 0 (0.0%) | 0 (0.0%) |
| 75 Years and over | 0 (0.0%) | 0 (0.0%) |
Technology Access in Roan Mountain
Computing Device Access in Roan Mountain
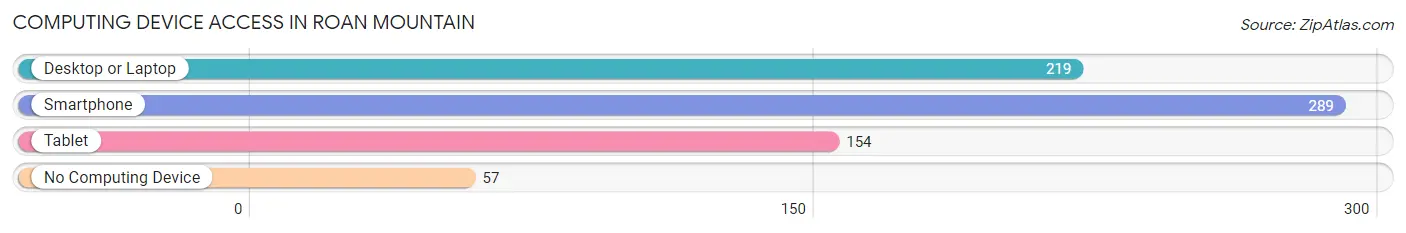
| Device Type | # Households | % Households |
| Desktop or Laptop | 219 | 59.5% |
| Smartphone | 289 | 78.5% |
| Tablet | 154 | 41.8% |
| No Computing Device | 57 | 15.5% |
| Total | 368 | 100.0% |
Internet Access in Roan Mountain
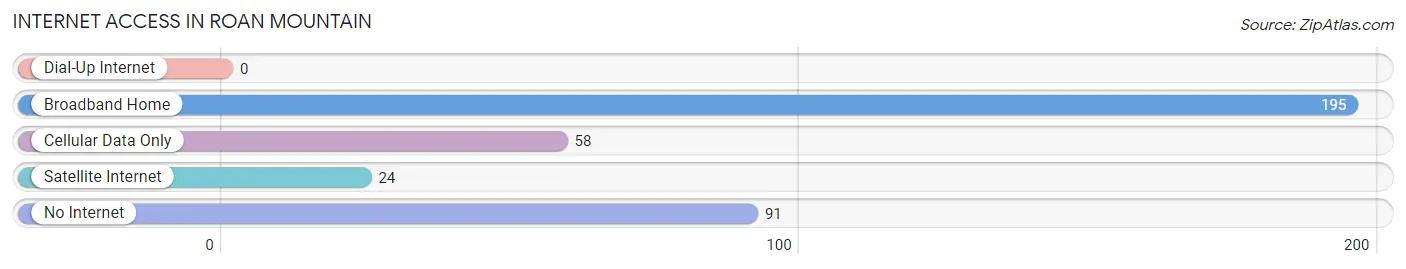
| Internet Type | # Households | % Households |
| Dial-Up Internet | 0 | 0.0% |
| Broadband Home | 195 | 53.0% |
| Cellular Data Only | 58 | 15.8% |
| Satellite Internet | 24 | 6.5% |
| No Internet | 91 | 24.7% |
| Total | 368 | 100.0% |
Roan Mountain Summary
Roan Mountain, Tennessee is a small town located in the Appalachian Mountains of East Tennessee. It is situated in the Cherokee National Forest and is part of the Appalachian Trail. The town is known for its beautiful scenery and outdoor activities, such as hiking, fishing, and camping. Roan Mountain is also home to the world’s largest natural rhododendron garden.
History
The area that is now Roan Mountain was first settled in the late 1700s by settlers from North Carolina. The town was originally known as “Roaring Creek” and was later renamed “Roan Mountain” after the nearby Roan Mountain. The town was officially incorporated in 1891.
In the early 1900s, the town was a popular tourist destination due to its scenic beauty and outdoor activities. The town was also home to several resorts, including the Roan Mountain Inn, which was built in the early 1900s and is still in operation today.
Geography
Roan Mountain is located in the Appalachian Mountains of East Tennessee. It is situated in the Cherokee National Forest and is part of the Appalachian Trail. The town is located at an elevation of 2,637 feet and is surrounded by the Unaka Mountains. The town is located near the North Carolina border and is approximately 30 miles from Johnson City, Tennessee.
Economy
The economy of Roan Mountain is largely based on tourism. The town is home to several resorts, including the Roan Mountain Inn, which is a popular destination for hikers and campers. The town is also home to several restaurants, shops, and other businesses that cater to tourists.
Demographics
As of the 2010 census, the population of Roan Mountain was 1,092. The median age of the population was 44.7 years, and the median household income was $30,938. The town is predominantly white, with 95.3% of the population identifying as white. The town is also home to a small Hispanic population, with 2.2% of the population identifying as Hispanic or Latino.
Roan Mountain is a small town with a rich history and beautiful scenery. It is a popular destination for outdoor enthusiasts and tourists alike. The town is home to several resorts, restaurants, and other businesses that cater to tourists. The town is predominantly white, with a small Hispanic population. The median household income is lower than the national average, but the town is still a popular destination for tourists and outdoor enthusiasts.
Common Questions
What is Per Capita Income in Roan Mountain?
Per Capita income in Roan Mountain is $30,671.
What is the Median Family Income in Roan Mountain?
Median Family Income in Roan Mountain is $72,045.
What is the Median Household income in Roan Mountain?
Median Household Income in Roan Mountain is $51,111.
What is Income or Wage Gap in Roan Mountain?
Income or Wage Gap in Roan Mountain is 3.4%.
Women in Roan Mountain earn 96.6 cents for every dollar earned by a man.
What is Inequality or Gini Index in Roan Mountain?
Inequality or Gini Index in Roan Mountain is 0.50.
What is the Total Population of Roan Mountain?
Total Population of Roan Mountain is 984.
What is the Total Male Population of Roan Mountain?
Total Male Population of Roan Mountain is 558.
What is the Total Female Population of Roan Mountain?
Total Female Population of Roan Mountain is 426.
What is the Ratio of Males per 100 Females in Roan Mountain?
There are 130.99 Males per 100 Females in Roan Mountain.
What is the Ratio of Females per 100 Males in Roan Mountain?
There are 76.34 Females per 100 Males in Roan Mountain.
What is the Median Population Age in Roan Mountain?
Median Population Age in Roan Mountain is 43.2 Years.
What is the Average Family Size in Roan Mountain
Average Family Size in Roan Mountain is 3.0 People.
What is the Average Household Size in Roan Mountain
Average Household Size in Roan Mountain is 2.4 People.
How Large is the Labor Force in Roan Mountain?
There are 432 People in the Labor Forcein in Roan Mountain.
What is the Percentage of People in the Labor Force in Roan Mountain?
48.1% of People are in the Labor Force in Roan Mountain.
What is the Unemployment Rate in Roan Mountain?
Unemployment Rate in Roan Mountain is 4.2%.