Pelham, TN Map & Demographics
Pelham Map
Pelham Overview
$34,817
PER CAPITA INCOME
$167,736
AVG FAMILY INCOME
73.0%
WAGE / INCOME GAP [ % ]
27.0¢/ $1
WAGE / INCOME GAP [ $ ]
0.41
INEQUALITY / GINI INDEX
419
TOTAL POPULATION
177
MALE POPULATION
242
FEMALE POPULATION
73.14
MALES / 100 FEMALES
136.72
FEMALES / 100 MALES
37.4
MEDIAN AGE
3.9
AVG FAMILY SIZE
3.1
AVG HOUSEHOLD SIZE
224
LABOR FORCE [ PEOPLE ]
68.9%
PERCENT IN LABOR FORCE
Pelham Zip Codes
Pelham Area Codes
Income in Pelham
Income Overview in Pelham
| Characteristic | Number | Measure |
| Per Capita Income | 419 | $34,817 |
| Median Family Income | 83 | $167,736 |
| Mean Family Income | 83 | $153,204 |
| Median Household Income | 135 | $0 |
| Mean Household Income | 135 | $113,556 |
| Income Deficit | 83 | $0 |
| Wage / Income Gap (%) | 419 | 72.96% |
| Wage / Income Gap ($) | 419 | 27.04¢ per $1 |
| Gini / Inequality Index | 419 | 0.41 |
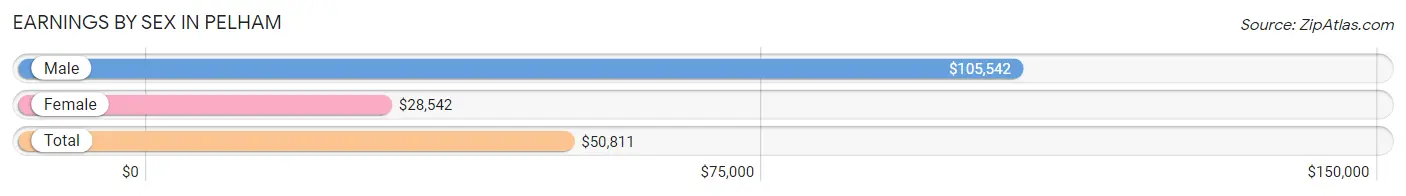
Earnings by Sex in Pelham
Average Earnings in Pelham are $50,811, $105,542 for men and $28,542 for women, a difference of 73.0%.
| Sex | Number | Average Earnings |
| Male | 71 (31.7%) | $105,542 |
| Female | 153 (68.3%) | $28,542 |
| Total | 224 (100.0%) | $50,811 |
Earnings by Sex by Income Bracket in Pelham
The most common earnings brackets in Pelham are $100,000+ for men (42 | 59.2%) and $50,000 to $54,999 for women (37 | 24.2%).
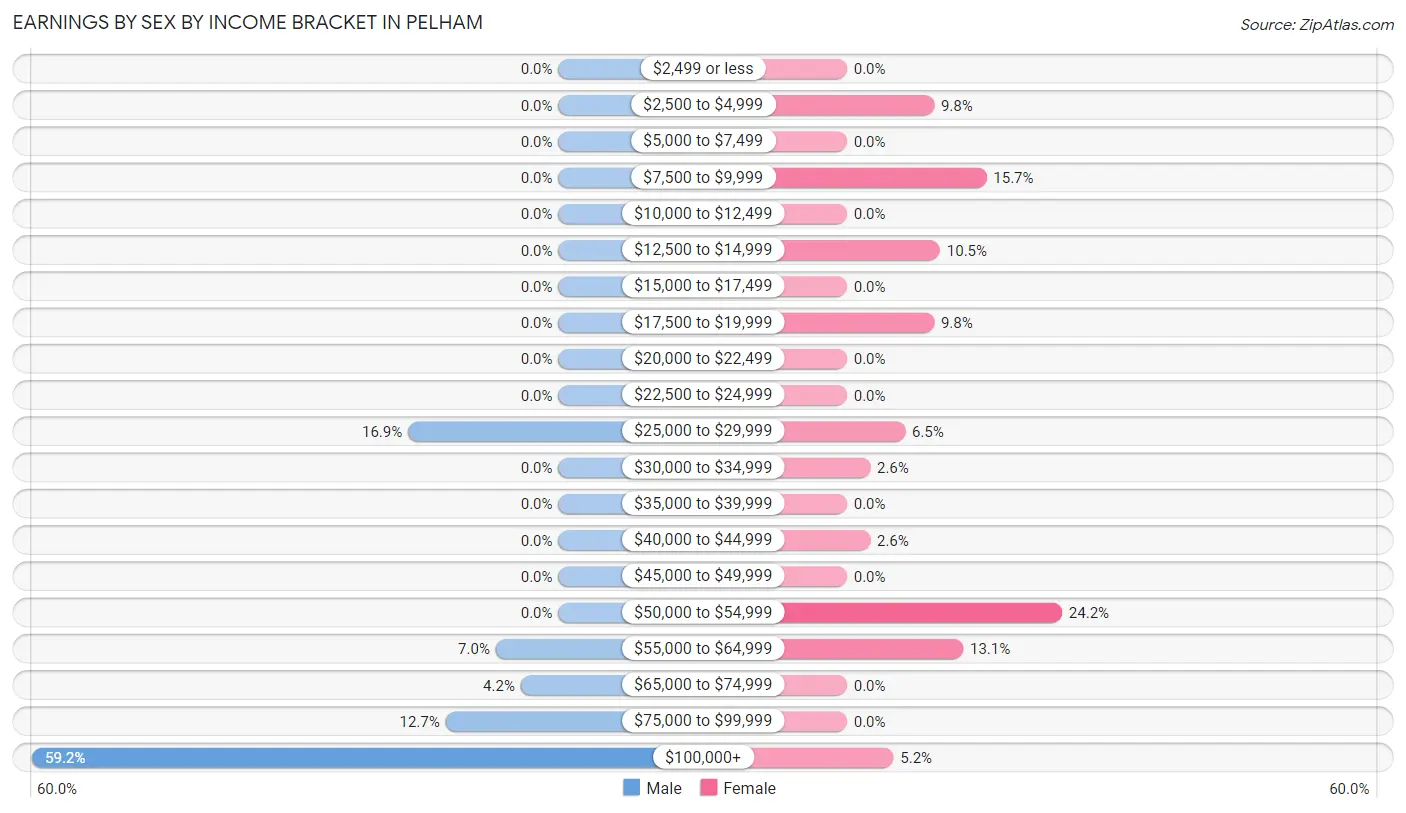
| Income | Male | Female |
| $2,499 or less | 0 (0.0%) | 0 (0.0%) |
| $2,500 to $4,999 | 0 (0.0%) | 15 (9.8%) |
| $5,000 to $7,499 | 0 (0.0%) | 0 (0.0%) |
| $7,500 to $9,999 | 0 (0.0%) | 24 (15.7%) |
| $10,000 to $12,499 | 0 (0.0%) | 0 (0.0%) |
| $12,500 to $14,999 | 0 (0.0%) | 16 (10.5%) |
| $15,000 to $17,499 | 0 (0.0%) | 0 (0.0%) |
| $17,500 to $19,999 | 0 (0.0%) | 15 (9.8%) |
| $20,000 to $22,499 | 0 (0.0%) | 0 (0.0%) |
| $22,500 to $24,999 | 0 (0.0%) | 0 (0.0%) |
| $25,000 to $29,999 | 12 (16.9%) | 10 (6.5%) |
| $30,000 to $34,999 | 0 (0.0%) | 4 (2.6%) |
| $35,000 to $39,999 | 0 (0.0%) | 0 (0.0%) |
| $40,000 to $44,999 | 0 (0.0%) | 4 (2.6%) |
| $45,000 to $49,999 | 0 (0.0%) | 0 (0.0%) |
| $50,000 to $54,999 | 0 (0.0%) | 37 (24.2%) |
| $55,000 to $64,999 | 5 (7.0%) | 20 (13.1%) |
| $65,000 to $74,999 | 3 (4.2%) | 0 (0.0%) |
| $75,000 to $99,999 | 9 (12.7%) | 0 (0.0%) |
| $100,000+ | 42 (59.2%) | 8 (5.2%) |
| Total | 71 (100.0%) | 153 (100.0%) |
Earnings by Sex by Educational Attainment in Pelham
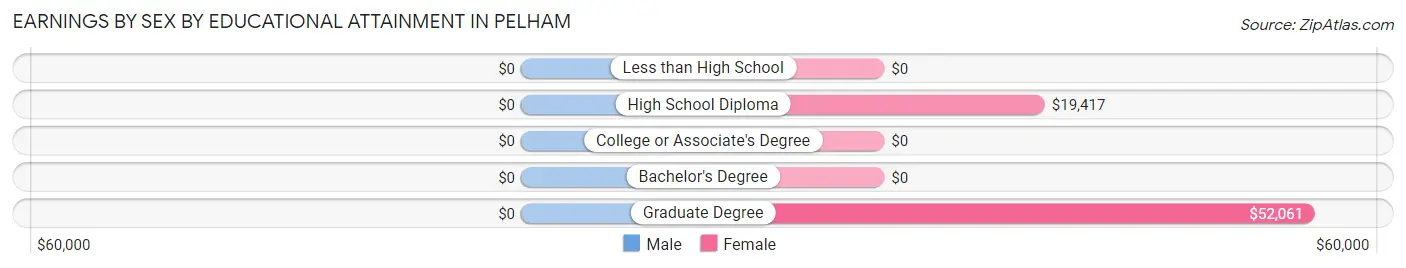
| Educational Attainment | Male Income | Female Income |
| Less than High School | - | - |
| High School Diploma | - | - |
| College or Associate's Degree | - | - |
| Bachelor's Degree | - | - |
| Graduate Degree | - | - |
| Total | $105,542 | $50,878 |
Family Income in Pelham
Family Income Brackets in Pelham
According to the Pelham family income data, there are 37 families falling into the $150,000 to $199,999 income range, which is the most common income bracket and makes up 44.6% of all families.
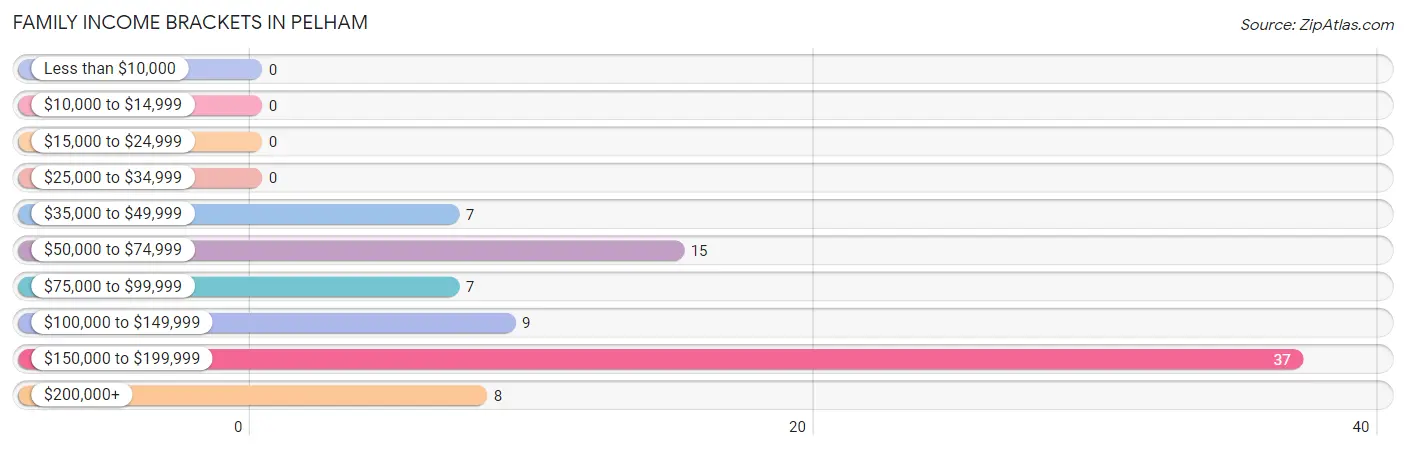
| Income Bracket | # Families | % Families |
| Less than $10,000 | 0 | 0.0% |
| $10,000 to $14,999 | 0 | 0.0% |
| $15,000 to $24,999 | 0 | 0.0% |
| $25,000 to $34,999 | 0 | 0.0% |
| $35,000 to $49,999 | 7 | 8.4% |
| $50,000 to $74,999 | 15 | 18.1% |
| $75,000 to $99,999 | 7 | 8.4% |
| $100,000 to $149,999 | 9 | 10.8% |
| $150,000 to $199,999 | 37 | 44.6% |
| $200,000+ | 8 | 9.6% |
Family Income by Famaliy Size in Pelham
5-person families (61 | 73.5%) account for the highest median family income in Pelham with $167,939 per family, while 5-person families (61 | 73.5%) have the highest median income of $33,588 per family member.
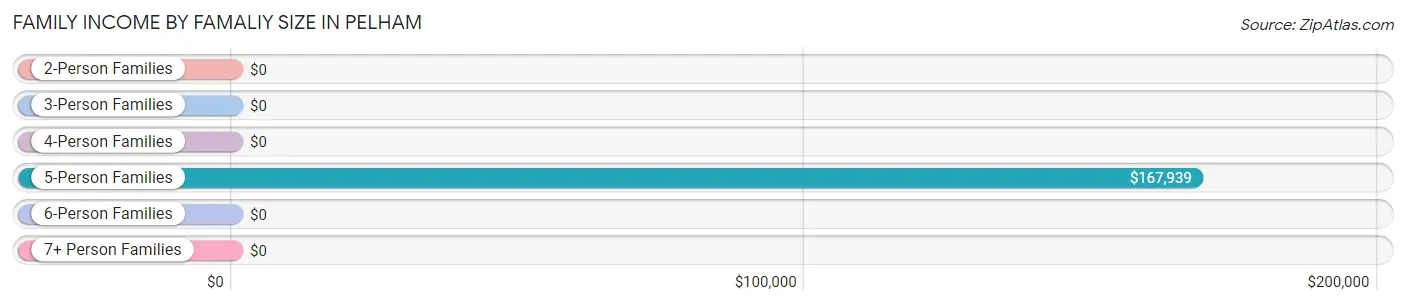
| Income Bracket | # Families | Median Income |
| 2-Person Families | 4 (4.8%) | $0 |
| 3-Person Families | 18 (21.7%) | $0 |
| 4-Person Families | 0 (0.0%) | $0 |
| 5-Person Families | 61 (73.5%) | $167,939 |
| 6-Person Families | 0 (0.0%) | $0 |
| 7+ Person Families | 0 (0.0%) | $0 |
| Total | 83 (100.0%) | $167,736 |
Family Income by Number of Earners in Pelham
| Number of Earners | # Families | Median Income |
| No Earners | 7 (8.4%) | $0 |
| 1 Earner | 0 (0.0%) | $0 |
| 2 Earners | 24 (28.9%) | $0 |
| 3+ Earners | 52 (62.6%) | $0 |
| Total | 83 (100.0%) | $167,736 |
Household Income in Pelham
Household Income Brackets in Pelham
With 42 households falling in the category, the $50,000 to $74,999 income range is the most frequent in Pelham, accounting for 31.1% of all households.
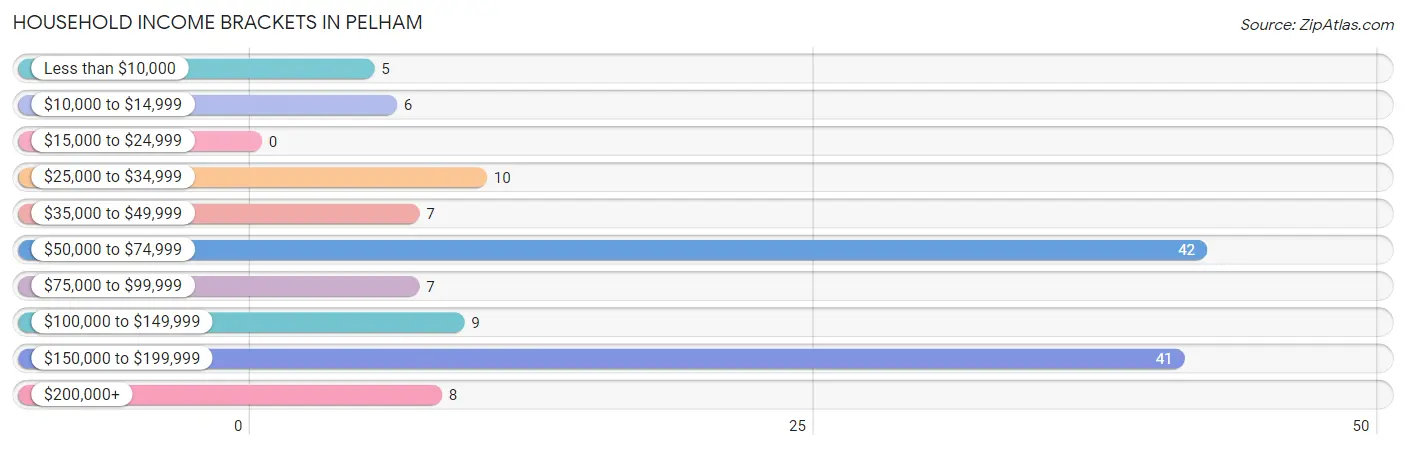
| Income Bracket | # Households | % Households |
| Less than $10,000 | 5 | 3.7% |
| $10,000 to $14,999 | 6 | 4.4% |
| $15,000 to $24,999 | 0 | 0.0% |
| $25,000 to $34,999 | 10 | 7.4% |
| $35,000 to $49,999 | 7 | 5.2% |
| $50,000 to $74,999 | 42 | 31.1% |
| $75,000 to $99,999 | 7 | 5.2% |
| $100,000 to $149,999 | 9 | 6.7% |
| $150,000 to $199,999 | 41 | 30.4% |
| $200,000+ | 8 | 5.9% |
Household Income by Householder Age in Pelham
The median household income in Pelham is $0, with the highest median household income of $168,041 found in the 25 to 44 years age bracket for the primary householder. A total of 74 households (54.8%) fall into this category.
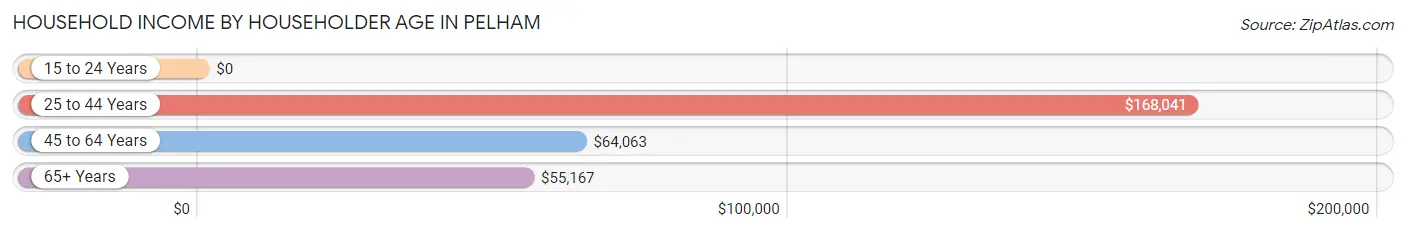
| Income Bracket | # Households | Median Income |
| 15 to 24 Years | 0 (0.0%) | $0 |
| 25 to 44 Years | 74 (54.8%) | $168,041 |
| 45 to 64 Years | 33 (24.4%) | $64,063 |
| 65+ Years | 28 (20.7%) | $55,167 |
| Total | 135 (100.0%) | $0 |
Poverty in Pelham
Income Below Poverty by Sex and Age in Pelham
With 3.3% poverty level for males and 2.5% for females among the residents of Pelham, 25 to 34 year old males and 25 to 34 year old females are the most vulnerable to poverty, with 5 males (38.5%) and 6 females (100.0%) in their respective age groups living below the poverty level.
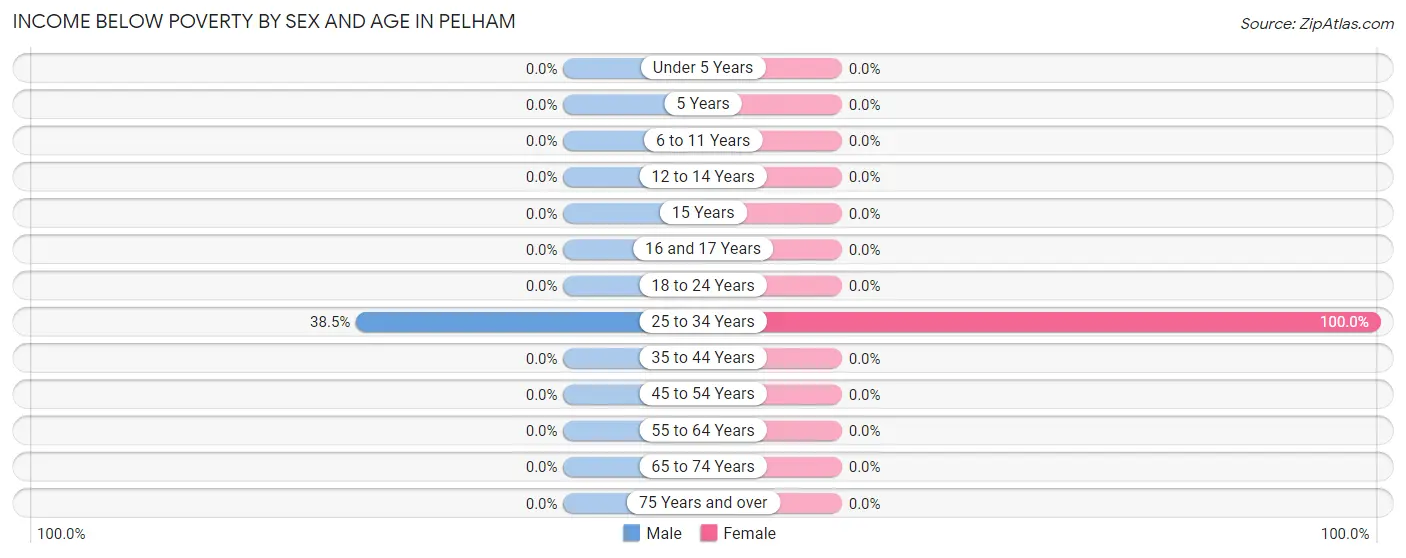
| Age Bracket | Male | Female |
| Under 5 Years | 0 (0.0%) | 0 (0.0%) |
| 5 Years | 0 (0.0%) | 0 (0.0%) |
| 6 to 11 Years | 0 (0.0%) | 0 (0.0%) |
| 12 to 14 Years | 0 (0.0%) | 0 (0.0%) |
| 15 Years | 0 (0.0%) | 0 (0.0%) |
| 16 and 17 Years | 0 (0.0%) | 0 (0.0%) |
| 18 to 24 Years | 0 (0.0%) | 0 (0.0%) |
| 25 to 34 Years | 5 (38.5%) | 6 (100.0%) |
| 35 to 44 Years | 0 (0.0%) | 0 (0.0%) |
| 45 to 54 Years | 0 (0.0%) | 0 (0.0%) |
| 55 to 64 Years | 0 (0.0%) | 0 (0.0%) |
| 65 to 74 Years | 0 (0.0%) | 0 (0.0%) |
| 75 Years and over | 0 (0.0%) | 0 (0.0%) |
| Total | 5 (3.3%) | 6 (2.5%) |
Income Above Poverty by Sex and Age in Pelham
According to the poverty statistics in Pelham, males aged 6 to 11 years and females aged under 5 years are the age groups that are most secure financially, with 100.0% of males and 100.0% of females in these age groups living above the poverty line.
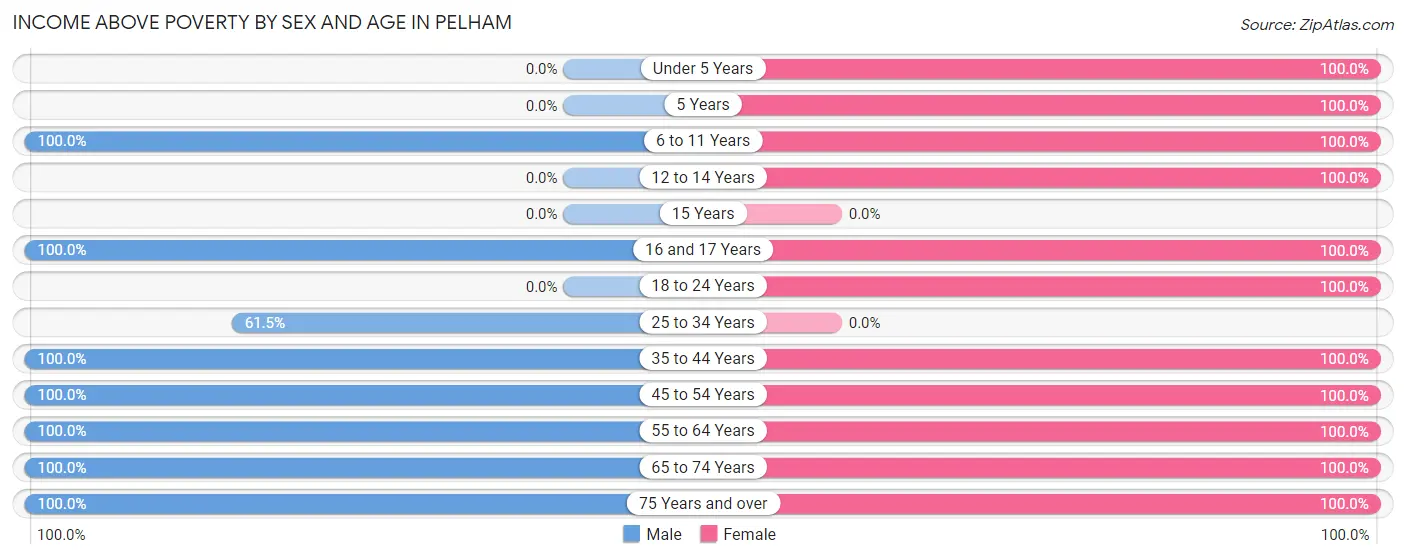
| Age Bracket | Male | Female |
| Under 5 Years | 0 (0.0%) | 8 (100.0%) |
| 5 Years | 0 (0.0%) | 12 (100.0%) |
| 6 to 11 Years | 6 (100.0%) | 13 (100.0%) |
| 12 to 14 Years | 0 (0.0%) | 28 (100.0%) |
| 15 Years | 0 (0.0%) | 0 (0.0%) |
| 16 and 17 Years | 41 (100.0%) | 10 (100.0%) |
| 18 to 24 Years | 0 (0.0%) | 39 (100.0%) |
| 25 to 34 Years | 8 (61.5%) | 0 (0.0%) |
| 35 to 44 Years | 21 (100.0%) | 72 (100.0%) |
| 45 to 54 Years | 39 (100.0%) | 12 (100.0%) |
| 55 to 64 Years | 8 (100.0%) | 30 (100.0%) |
| 65 to 74 Years | 15 (100.0%) | 6 (100.0%) |
| 75 Years and over | 7 (100.0%) | 6 (100.0%) |
| Total | 145 (96.7%) | 236 (97.5%) |
Income Below Poverty Among Married-Couple Families in Pelham
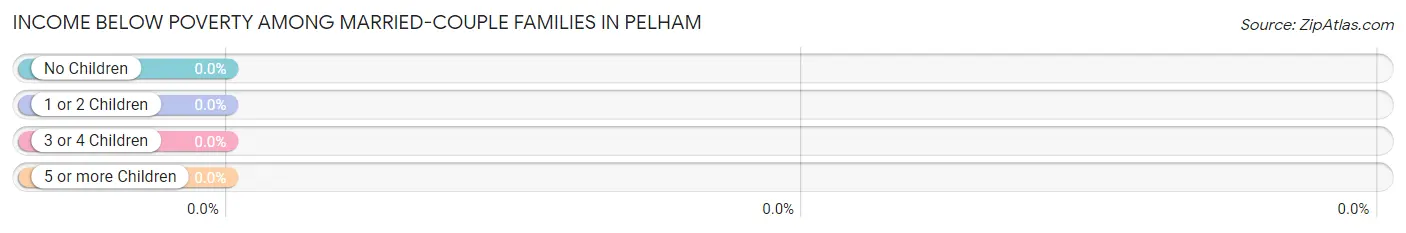
| Children | Above Poverty | Below Poverty |
| No Children | 11 (100.0%) | 0 (0.0%) |
| 1 or 2 Children | 63 (100.0%) | 0 (0.0%) |
| 3 or 4 Children | 9 (100.0%) | 0 (0.0%) |
| 5 or more Children | 0 (0.0%) | 0 (0.0%) |
| Total | 83 (100.0%) | 0 (0.0%) |
Income Below Poverty Among Single-Parent Households in Pelham
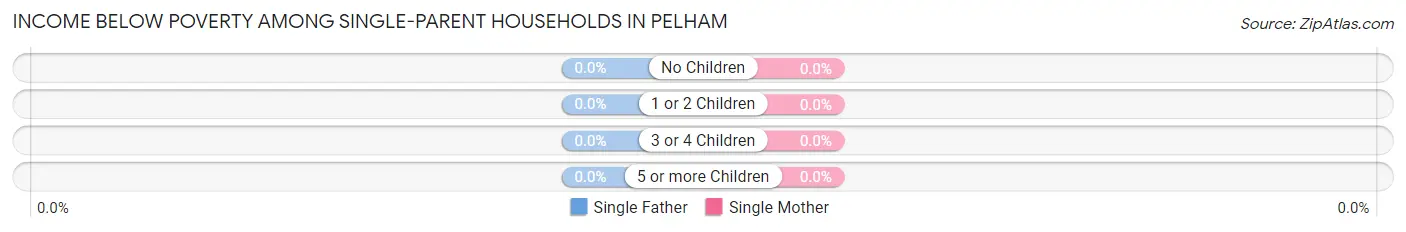
| Children | Single Father | Single Mother |
| No Children | 0 (0.0%) | 0 (0.0%) |
| 1 or 2 Children | 0 (0.0%) | 0 (0.0%) |
| 3 or 4 Children | 0 (0.0%) | 0 (0.0%) |
| 5 or more Children | 0 (0.0%) | 0 (0.0%) |
| Total | 0 (0.0%) | 0 (0.0%) |
Income Below Poverty Among Married-Couple vs Single-Parent Households in Pelham
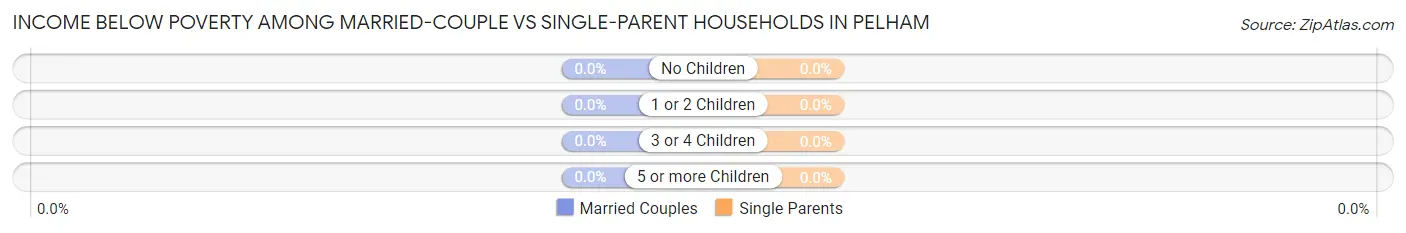
| Children | Married-Couple Families | Single-Parent Households |
| No Children | 0 (0.0%) | 0 (0.0%) |
| 1 or 2 Children | 0 (0.0%) | 0 (0.0%) |
| 3 or 4 Children | 0 (0.0%) | 0 (0.0%) |
| 5 or more Children | 0 (0.0%) | 0 (0.0%) |
| Total | 0 (0.0%) | 0 (0.0%) |
Race in Pelham
The most populous races in Pelham are White / Caucasian (418 | 99.8%), and Black / African American (1 | 0.2%).
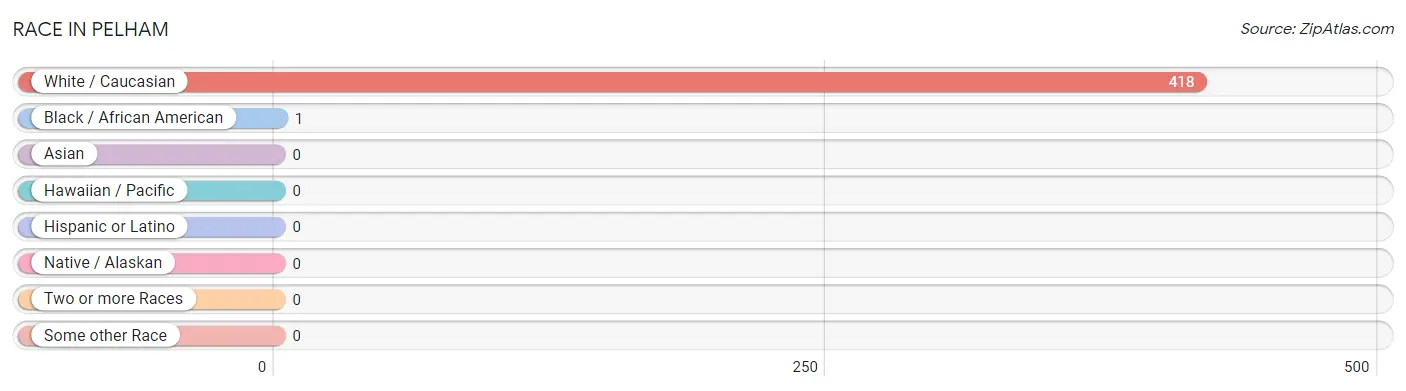
| Race | # Population | % Population |
| Asian | 0 | 0.0% |
| Black / African American | 1 | 0.2% |
| Hawaiian / Pacific | 0 | 0.0% |
| Hispanic or Latino | 0 | 0.0% |
| Native / Alaskan | 0 | 0.0% |
| White / Caucasian | 418 | 99.8% |
| Two or more Races | 0 | 0.0% |
| Some other Race | 0 | 0.0% |
| Total | 419 | 100.0% |
Ancestry in Pelham
The most populous ancestries reported in Pelham are Irish (82 | 19.6%), American (67 | 16.0%), Scottish (16 | 3.8%), Welsh (16 | 3.8%), and English (15 | 3.6%), together accounting for 46.8% of all Pelham residents.
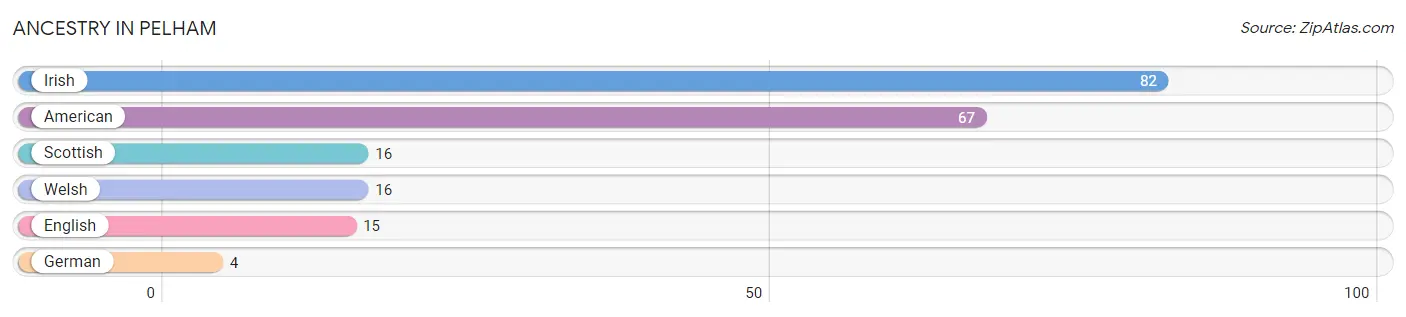
| Ancestry | # Population | % Population |
| American | 67 | 16.0% |
| English | 15 | 3.6% |
| German | 4 | 0.9% |
| Irish | 82 | 19.6% |
| Scottish | 16 | 3.8% |
| Welsh | 16 | 3.8% | View All 6 Rows |
Immigrants in Pelham

| Immigration Origin | # Population | % Population | View All 0 Rows |
Sex and Age in Pelham
Sex and Age in Pelham
The most populous age groups in Pelham are 15 to 19 Years (41 | 23.2%) for men and 10 to 14 Years (41 | 16.9%) for women.
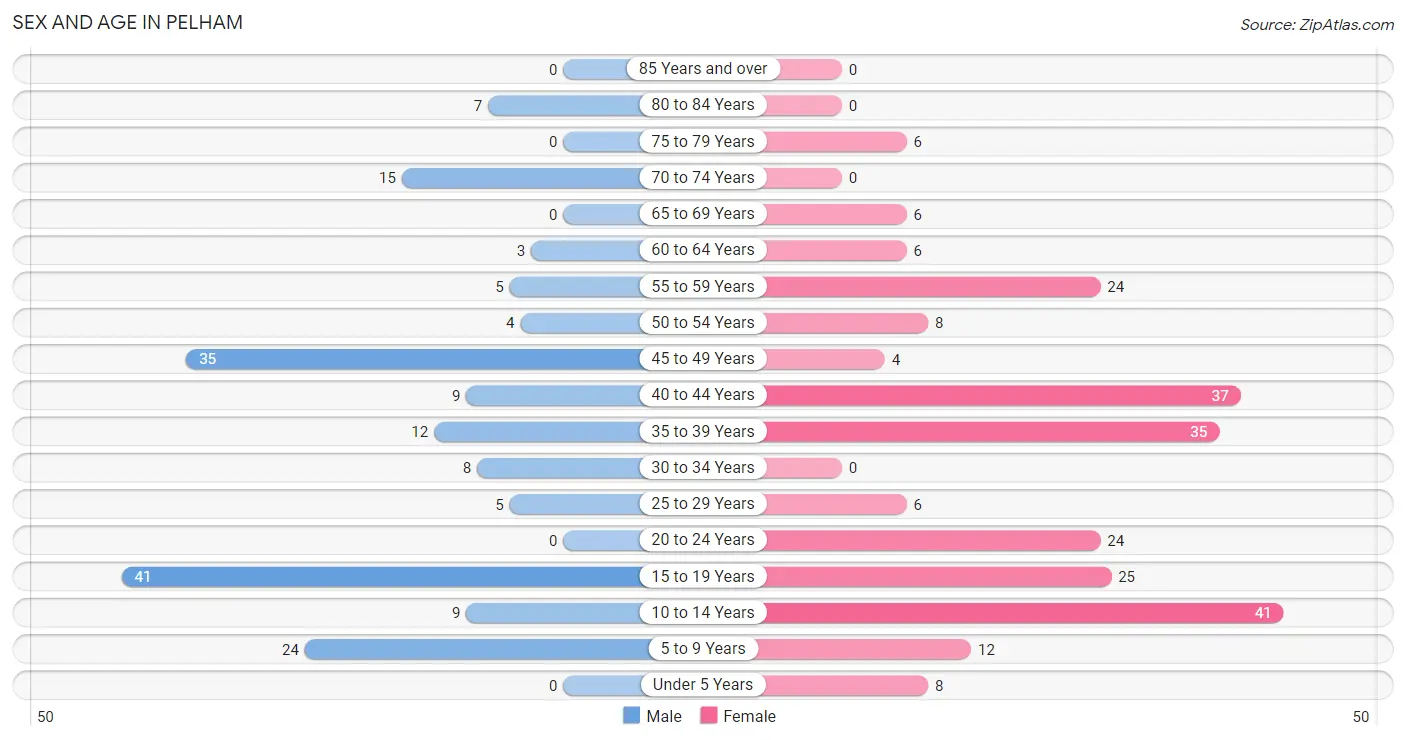
| Age Bracket | Male | Female |
| Under 5 Years | 0 (0.0%) | 8 (3.3%) |
| 5 to 9 Years | 24 (13.6%) | 12 (5.0%) |
| 10 to 14 Years | 9 (5.1%) | 41 (16.9%) |
| 15 to 19 Years | 41 (23.2%) | 25 (10.3%) |
| 20 to 24 Years | 0 (0.0%) | 24 (9.9%) |
| 25 to 29 Years | 5 (2.8%) | 6 (2.5%) |
| 30 to 34 Years | 8 (4.5%) | 0 (0.0%) |
| 35 to 39 Years | 12 (6.8%) | 35 (14.5%) |
| 40 to 44 Years | 9 (5.1%) | 37 (15.3%) |
| 45 to 49 Years | 35 (19.8%) | 4 (1.7%) |
| 50 to 54 Years | 4 (2.3%) | 8 (3.3%) |
| 55 to 59 Years | 5 (2.8%) | 24 (9.9%) |
| 60 to 64 Years | 3 (1.7%) | 6 (2.5%) |
| 65 to 69 Years | 0 (0.0%) | 6 (2.5%) |
| 70 to 74 Years | 15 (8.5%) | 0 (0.0%) |
| 75 to 79 Years | 0 (0.0%) | 6 (2.5%) |
| 80 to 84 Years | 7 (4.0%) | 0 (0.0%) |
| 85 Years and over | 0 (0.0%) | 0 (0.0%) |
| Total | 177 (100.0%) | 242 (100.0%) |
Families and Households in Pelham
Median Family Size in Pelham
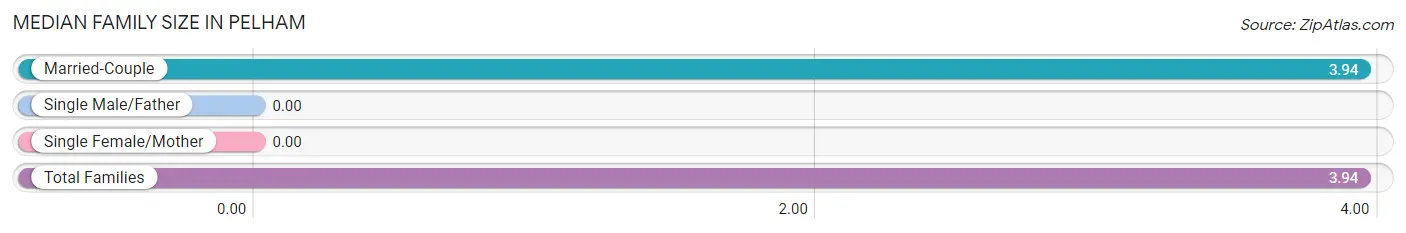
| Family Type | # Families | Family Size |
| Married-Couple | 83 (100.0%) | 3.94 |
| Single Male/Father | 0 (0.0%) | - |
| Single Female/Mother | 0 (0.0%) | - |
| Total Families | 83 (100.0%) | 3.94 |
Median Household Size in Pelham
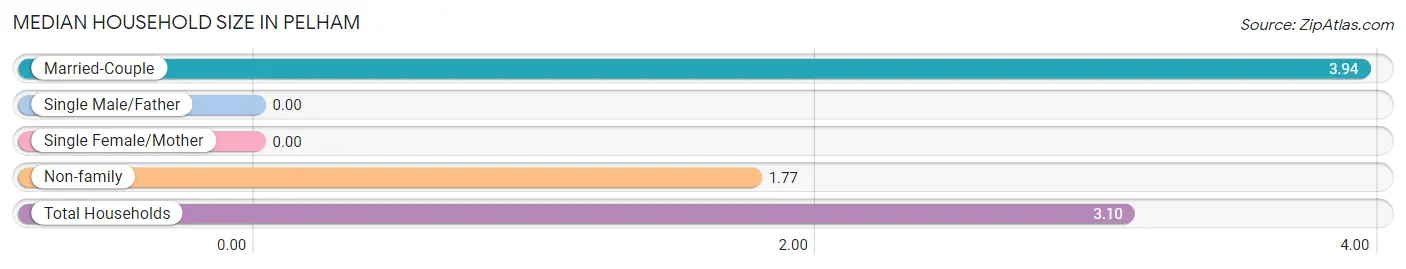
| Household Type | # Households | Household Size |
| Married-Couple | 83 (61.5%) | 3.94 |
| Single Male/Father | 0 (0.0%) | - |
| Single Female/Mother | 0 (0.0%) | - |
| Non-family | 52 (38.5%) | 1.77 |
| Total Households | 135 (100.0%) | 3.10 |
Household Size by Marriage Status in Pelham
Out of a total of 135 households in Pelham, 83 (61.5%) are family households, while 52 (38.5%) are nonfamily households. The most numerous type of family households are 5-person households, comprising 61, and the most common type of nonfamily households are 1-person households, comprising 43.
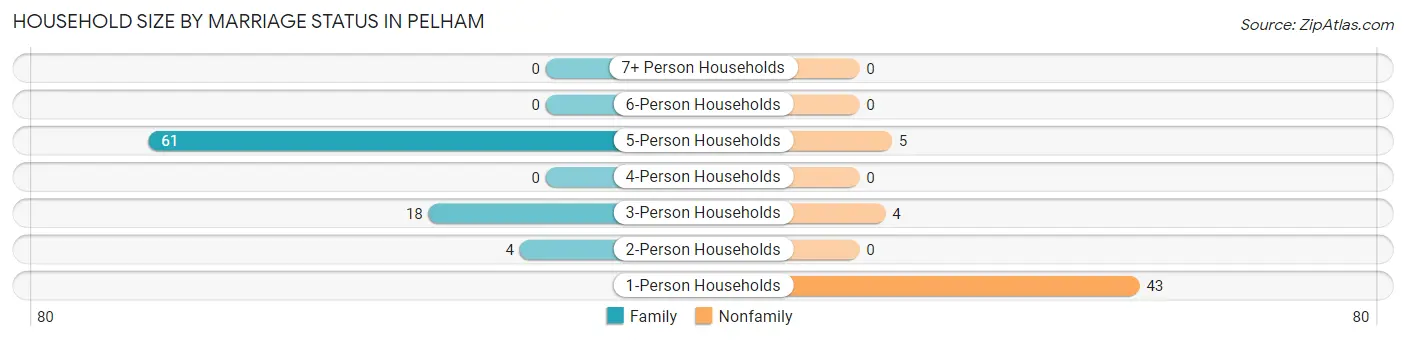
| Household Size | Family Households | Nonfamily Households |
| 1-Person Households | - | 43 (31.9%) |
| 2-Person Households | 4 (3.0%) | 0 (0.0%) |
| 3-Person Households | 18 (13.3%) | 4 (3.0%) |
| 4-Person Households | 0 (0.0%) | 0 (0.0%) |
| 5-Person Households | 61 (45.2%) | 5 (3.7%) |
| 6-Person Households | 0 (0.0%) | 0 (0.0%) |
| 7+ Person Households | 0 (0.0%) | 0 (0.0%) |
| Total | 83 (61.5%) | 52 (38.5%) |
Female Fertility in Pelham
Fertility by Age in Pelham
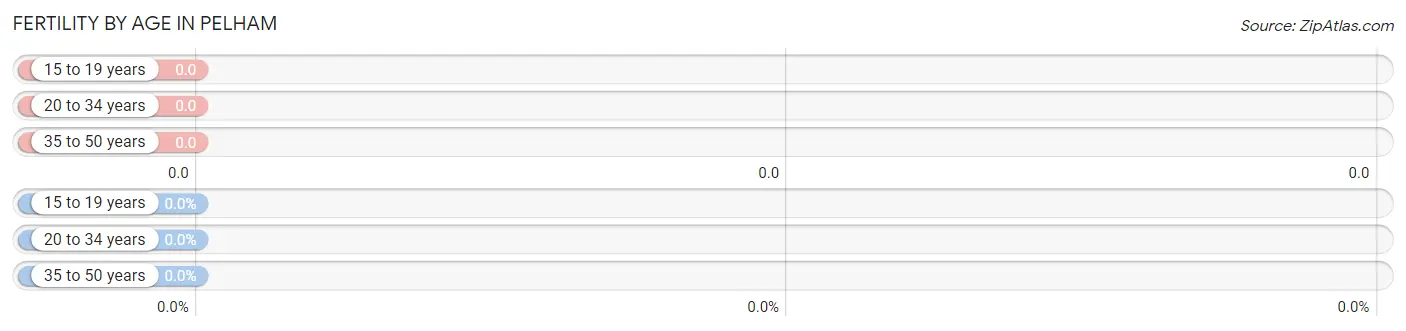
| Age Bracket | Women with Births | Births / 1,000 Women |
| 15 to 19 years | 0 (0.0%) | 0.0 |
| 20 to 34 years | 0 (0.0%) | 0.0 |
| 35 to 50 years | 0 (0.0%) | 0.0 |
| Total | 0 (0.0%) | 0.0 |
Fertility by Age by Marriage Status in Pelham
| Age Bracket | Married | Unmarried |
| 15 to 19 years | 0 (0.0%) | 0 (0.0%) |
| 20 to 34 years | 0 (0.0%) | 0 (0.0%) |
| 35 to 50 years | 0 (0.0%) | 0 (0.0%) |
| Total | 0 (0.0%) | 0 (0.0%) |
Fertility by Education in Pelham
| Educational Attainment | Women with Births | Births / 1,000 Women |
| Less than High School | 0 (0.0%) | 0.0 |
| High School Diploma | 0 (0.0%) | 0.0 |
| College or Associate's Degree | 0 (0.0%) | 0.0 |
| Bachelor's Degree | 0 (0.0%) | 0.0 |
| Graduate Degree | 0 (0.0%) | 0.0 |
| Total | 0 (0.0%) | 0.0 |
Fertility by Education by Marriage Status in Pelham
| Educational Attainment | Married | Unmarried |
| Less than High School | 0 (0.0%) | 0 (0.0%) |
| High School Diploma | 0 (0.0%) | 0 (0.0%) |
| College or Associate's Degree | 0 (0.0%) | 0 (0.0%) |
| Bachelor's Degree | 0 (0.0%) | 0 (0.0%) |
| Graduate Degree | 0 (0.0%) | 0 (0.0%) |
| Total | 0 (0.0%) | 0 (0.0%) |
Employment Characteristics in Pelham
Employment by Class of Employer in Pelham
Among the 224 employed individuals in Pelham, private company employees (104 | 46.4%), local government employees (72 | 32.1%), and self-employed (not incorporated) (24 | 10.7%) make up the most common classes of employment.
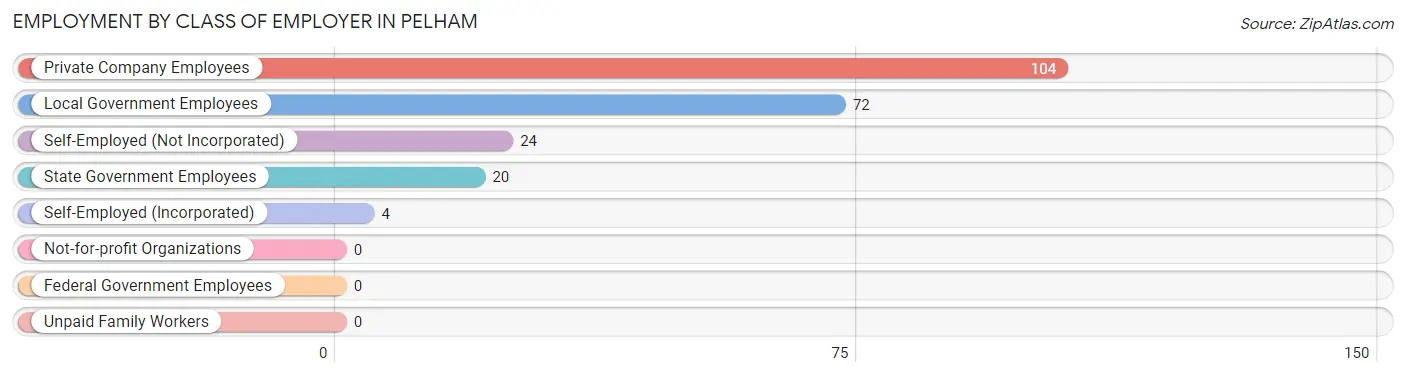
| Employer Class | # Employees | % Employees |
| Private Company Employees | 104 | 46.4% |
| Self-Employed (Incorporated) | 4 | 1.8% |
| Self-Employed (Not Incorporated) | 24 | 10.7% |
| Not-for-profit Organizations | 0 | 0.0% |
| Local Government Employees | 72 | 32.1% |
| State Government Employees | 20 | 8.9% |
| Federal Government Employees | 0 | 0.0% |
| Unpaid Family Workers | 0 | 0.0% |
| Total | 224 | 100.0% |
Employment Status by Age in Pelham
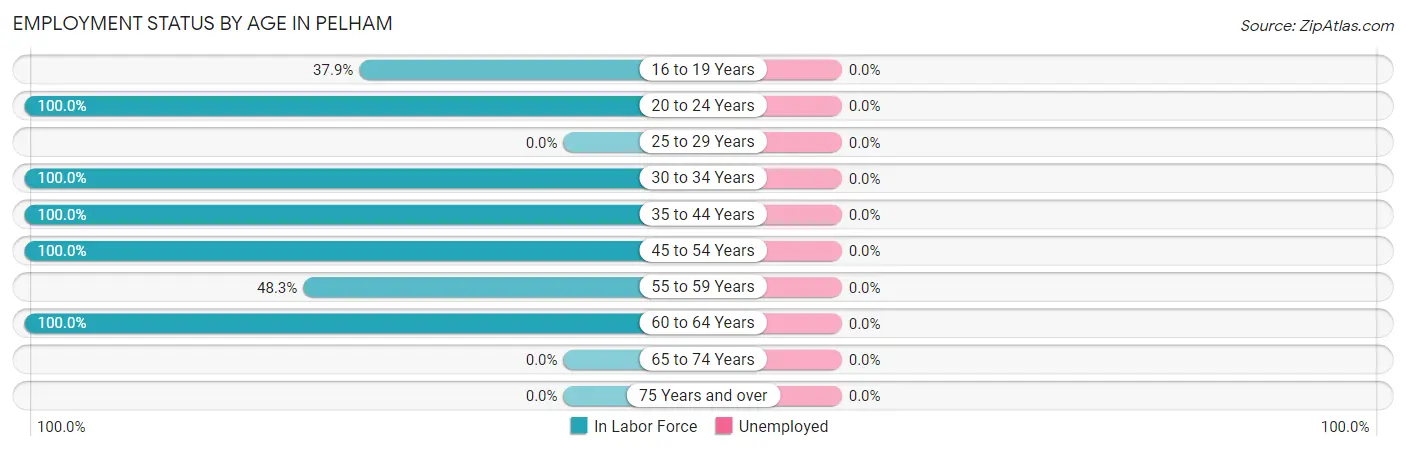
| Age Bracket | In Labor Force | Unemployed |
| 16 to 19 Years | 25 (37.9%) | 0 (0.0%) |
| 20 to 24 Years | 24 (100.0%) | 0 (0.0%) |
| 25 to 29 Years | 0 (0.0%) | 0 (0.0%) |
| 30 to 34 Years | 8 (100.0%) | 0 (0.0%) |
| 35 to 44 Years | 93 (100.0%) | 0 (0.0%) |
| 45 to 54 Years | 51 (100.0%) | 0 (0.0%) |
| 55 to 59 Years | 14 (48.3%) | 0 (0.0%) |
| 60 to 64 Years | 9 (100.0%) | 0 (0.0%) |
| 65 to 74 Years | 0 (0.0%) | 0 (0.0%) |
| 75 Years and over | 0 (0.0%) | 0 (0.0%) |
| Total | 224 (68.9%) | 0 (0.0%) |
Employment Status by Educational Attainment in Pelham
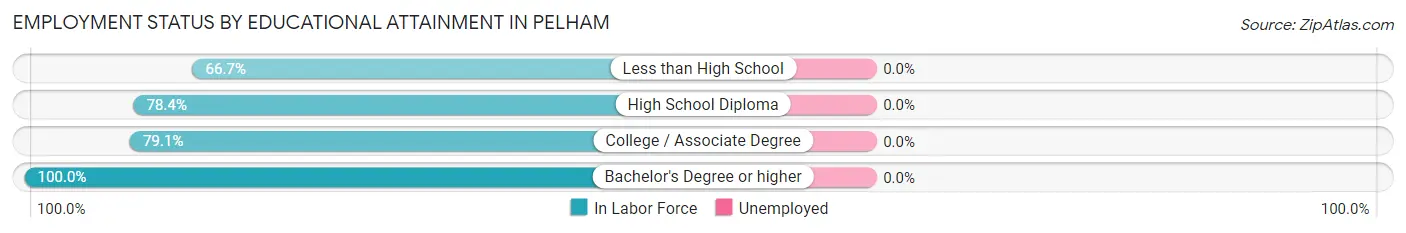
| Educational Attainment | In Labor Force | Unemployed |
| Less than High School | 12 (66.7%) | 0 (0.0%) |
| High School Diploma | 40 (78.4%) | 0 (0.0%) |
| College / Associate Degree | 34 (79.1%) | 0 (0.0%) |
| Bachelor's Degree or higher | 89 (100.0%) | 0 (0.0%) |
| Total | 175 (87.1%) | 0 (0.0%) |
Employment Occupations by Sex in Pelham
Management, Business, Science and Arts Occupations
The most common Management, Business, Science and Arts occupations in Pelham are Management (71 | 31.7%), Community & Social Service (31 | 13.8%), Education Instruction & Library (31 | 13.8%), Health Diagnosing & Treating (8 | 3.6%), and Health Technologists (8 | 3.6%).
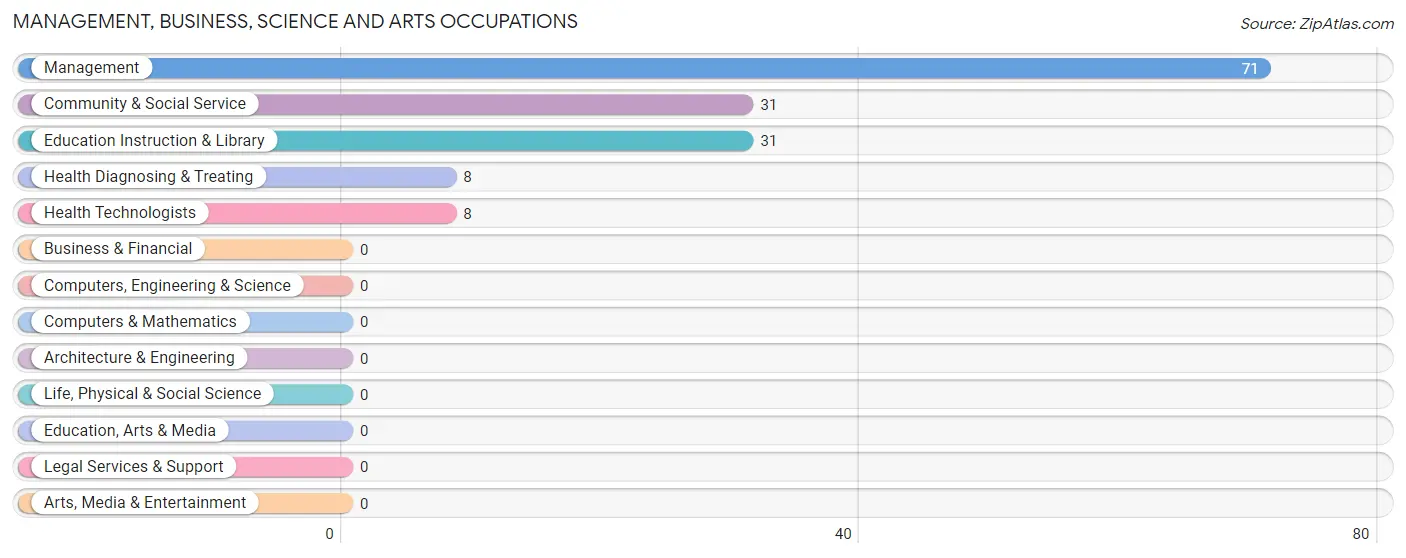
Management, Business, Science and Arts Occupations by Sex
Within the Management, Business, Science and Arts occupations in Pelham, the most male-oriented occupations are Management (42.2%), Community & Social Service (35.5%), and Education Instruction & Library (35.5%), while the most female-oriented occupations are Health Diagnosing & Treating (100.0%), Health Technologists (100.0%), and Community & Social Service (64.5%).
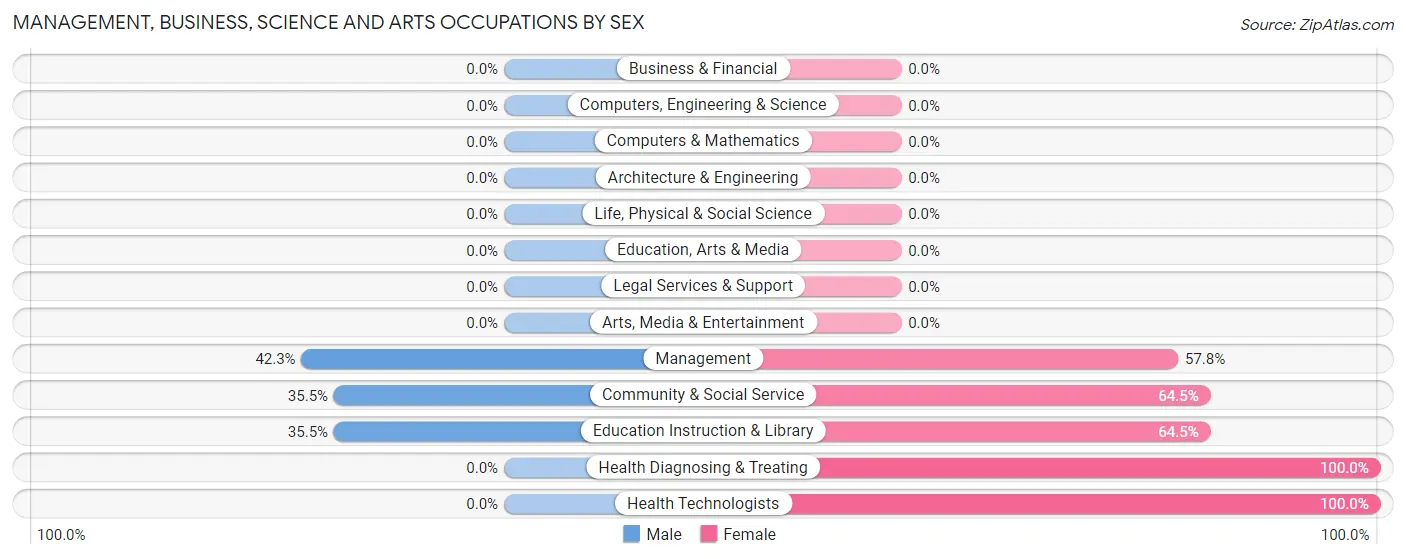
| Occupation | Male | Female |
| Management | 30 (42.2%) | 41 (57.8%) |
| Business & Financial | 0 (0.0%) | 0 (0.0%) |
| Computers, Engineering & Science | 0 (0.0%) | 0 (0.0%) |
| Computers & Mathematics | 0 (0.0%) | 0 (0.0%) |
| Architecture & Engineering | 0 (0.0%) | 0 (0.0%) |
| Life, Physical & Social Science | 0 (0.0%) | 0 (0.0%) |
| Community & Social Service | 11 (35.5%) | 20 (64.5%) |
| Education, Arts & Media | 0 (0.0%) | 0 (0.0%) |
| Legal Services & Support | 0 (0.0%) | 0 (0.0%) |
| Education Instruction & Library | 11 (35.5%) | 20 (64.5%) |
| Arts, Media & Entertainment | 0 (0.0%) | 0 (0.0%) |
| Health Diagnosing & Treating | 0 (0.0%) | 8 (100.0%) |
| Health Technologists | 0 (0.0%) | 8 (100.0%) |
| Total (Category) | 41 (37.3%) | 69 (62.7%) |
| Total (Overall) | 71 (31.7%) | 153 (68.3%) |
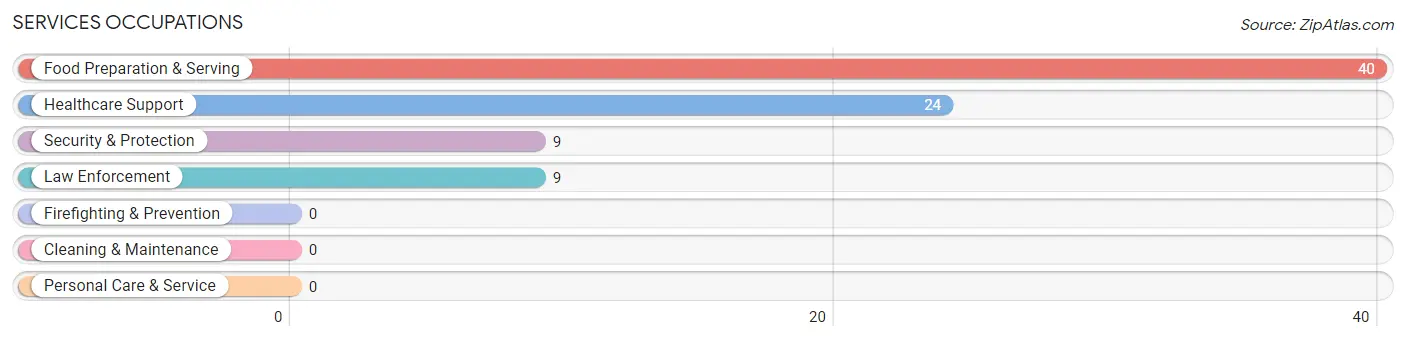
Services Occupations
The most common Services occupations in Pelham are Food Preparation & Serving (40 | 17.9%), Healthcare Support (24 | 10.7%), Security & Protection (9 | 4.0%), and Law Enforcement (9 | 4.0%).
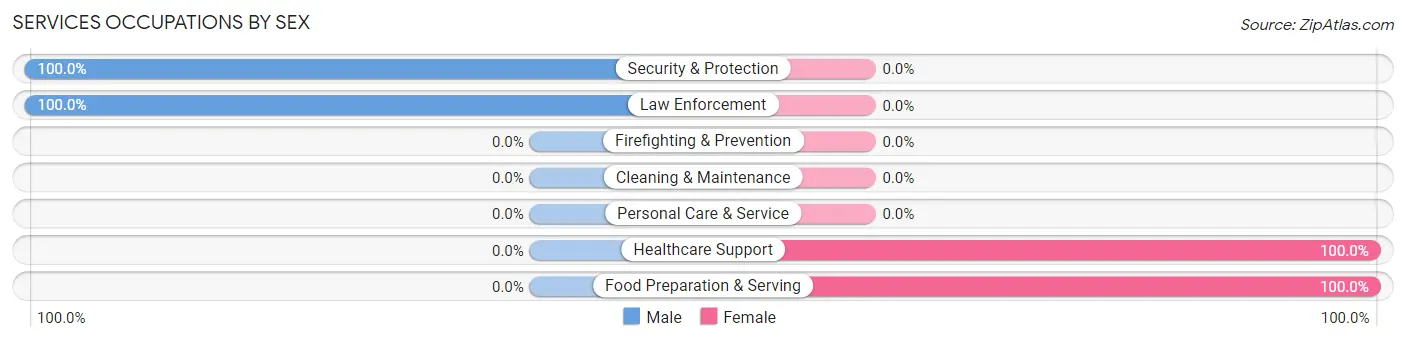
Services Occupations by Sex
Within the Services occupations in Pelham, the most male-oriented occupations are Security & Protection (100.0%), and Law Enforcement (100.0%), while the most female-oriented occupations are Healthcare Support (100.0%), and Food Preparation & Serving (100.0%).
| Occupation | Male | Female |
| Healthcare Support | 0 (0.0%) | 24 (100.0%) |
| Security & Protection | 9 (100.0%) | 0 (0.0%) |
| Firefighting & Prevention | 0 (0.0%) | 0 (0.0%) |
| Law Enforcement | 9 (100.0%) | 0 (0.0%) |
| Food Preparation & Serving | 0 (0.0%) | 40 (100.0%) |
| Cleaning & Maintenance | 0 (0.0%) | 0 (0.0%) |
| Personal Care & Service | 0 (0.0%) | 0 (0.0%) |
| Total (Category) | 9 (12.3%) | 64 (87.7%) |
| Total (Overall) | 71 (31.7%) | 153 (68.3%) |
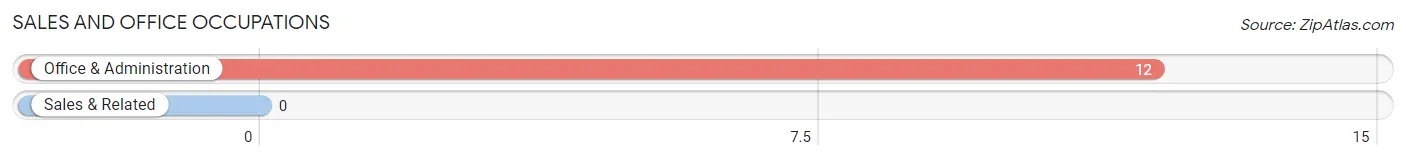
Sales and Office Occupations
The most common Sales and Office occupations in Pelham are , and Office & Administration (12 | 5.4%).
Sales and Office Occupations by Sex
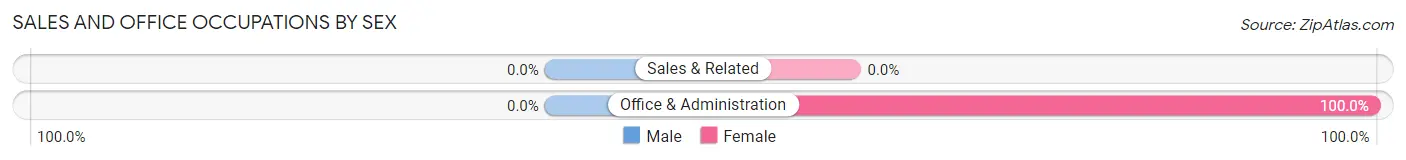
| Occupation | Male | Female |
| Sales & Related | 0 (0.0%) | 0 (0.0%) |
| Office & Administration | 0 (0.0%) | 12 (100.0%) |
| Total (Category) | 0 (0.0%) | 12 (100.0%) |
| Total (Overall) | 71 (31.7%) | 153 (68.3%) |
Natural Resources, Construction and Maintenance Occupations
The most common Natural Resources, Construction and Maintenance occupations in Pelham are , and Construction & Extraction (16 | 7.1%).
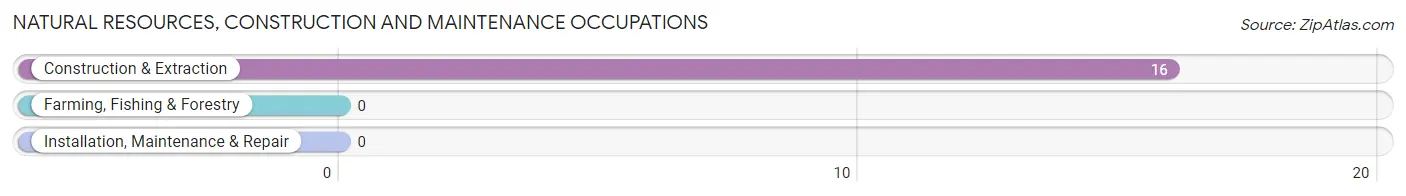
Natural Resources, Construction and Maintenance Occupations by Sex
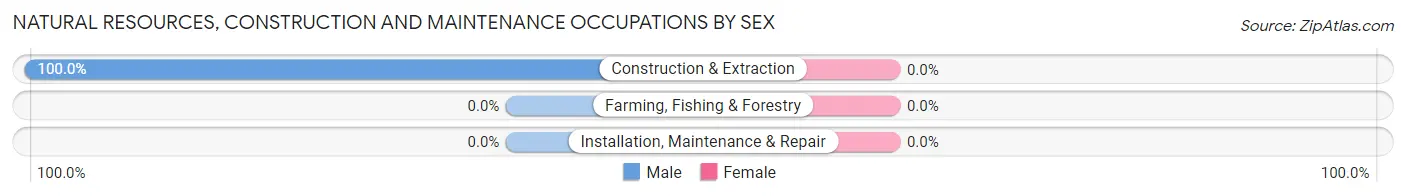
| Occupation | Male | Female |
| Farming, Fishing & Forestry | 0 (0.0%) | 0 (0.0%) |
| Construction & Extraction | 16 (100.0%) | 0 (0.0%) |
| Installation, Maintenance & Repair | 0 (0.0%) | 0 (0.0%) |
| Total (Category) | 16 (100.0%) | 0 (0.0%) |
| Total (Overall) | 71 (31.7%) | 153 (68.3%) |
Production, Transportation and Moving Occupations
The most common Production, Transportation and Moving occupations in Pelham are , and Production (13 | 5.8%).
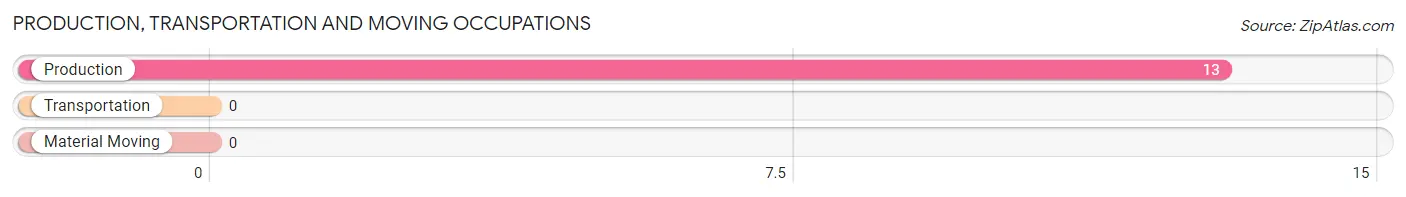
Production, Transportation and Moving Occupations by Sex
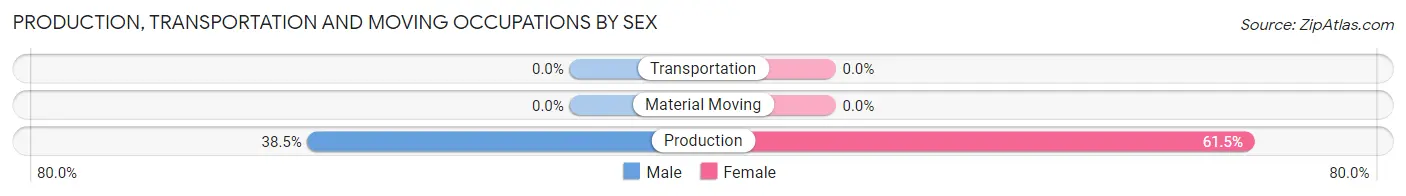
| Occupation | Male | Female |
| Production | 5 (38.5%) | 8 (61.5%) |
| Transportation | 0 (0.0%) | 0 (0.0%) |
| Material Moving | 0 (0.0%) | 0 (0.0%) |
| Total (Category) | 5 (38.5%) | 8 (61.5%) |
| Total (Overall) | 71 (31.7%) | 153 (68.3%) |
Employment Industries by Sex in Pelham
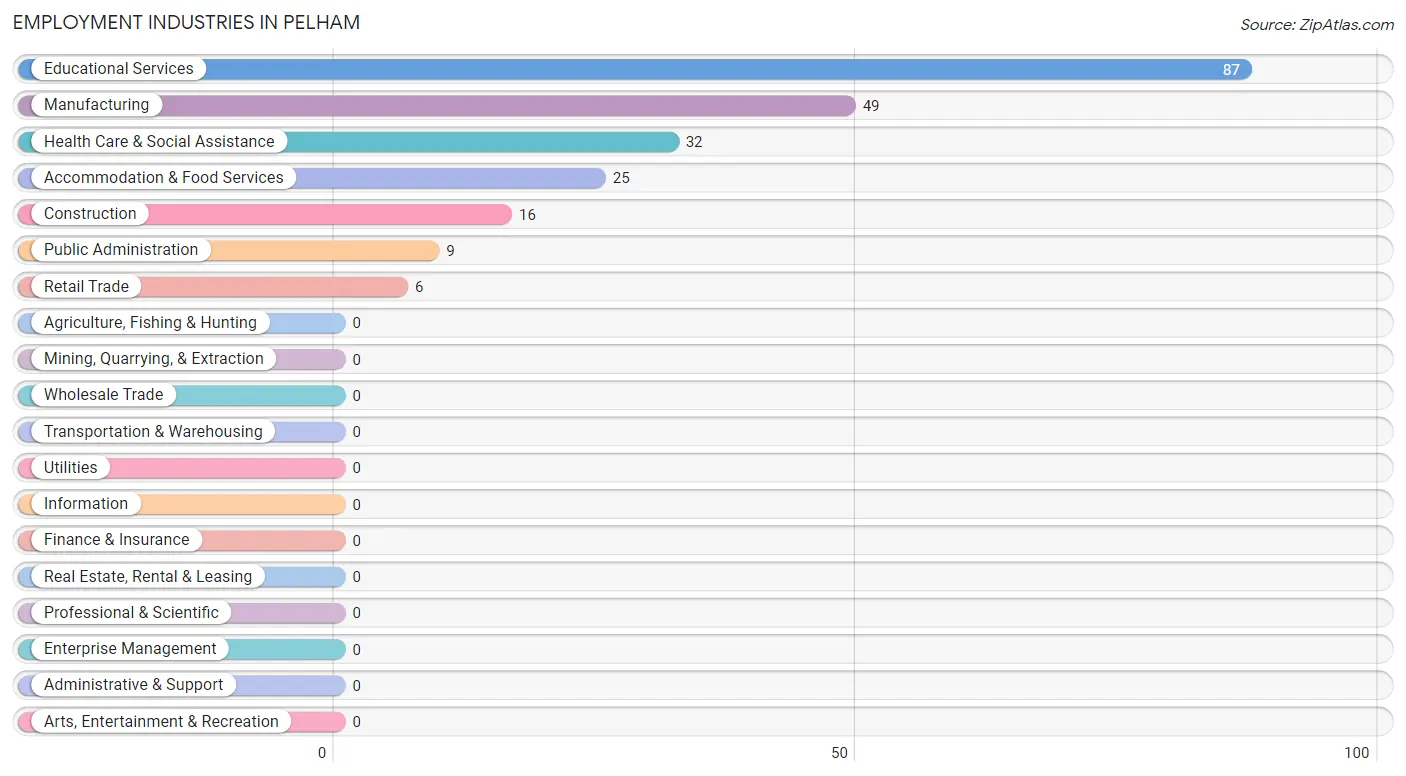
Employment Industries in Pelham
The major employment industries in Pelham include Educational Services (87 | 38.8%), Manufacturing (49 | 21.9%), Health Care & Social Assistance (32 | 14.3%), Accommodation & Food Services (25 | 11.2%), and Construction (16 | 7.1%).
Employment Industries by Sex in Pelham
The Pelham industries that see more men than women are Construction (100.0%), Public Administration (100.0%), and Manufacturing (71.4%), whereas the industries that tend to have a higher number of women are Retail Trade (100.0%), Health Care & Social Assistance (100.0%), and Accommodation & Food Services (100.0%).
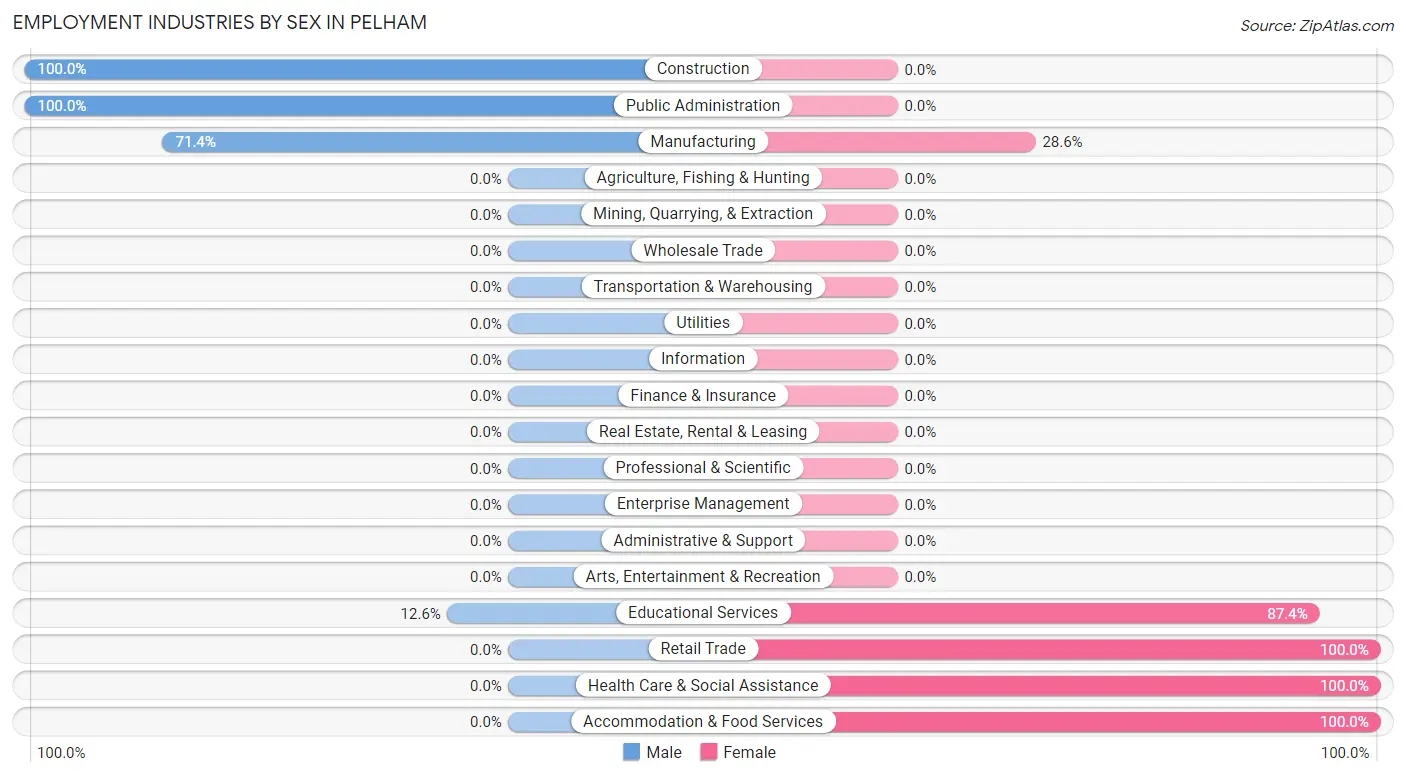
| Industry | Male | Female |
| Agriculture, Fishing & Hunting | 0 (0.0%) | 0 (0.0%) |
| Mining, Quarrying, & Extraction | 0 (0.0%) | 0 (0.0%) |
| Construction | 16 (100.0%) | 0 (0.0%) |
| Manufacturing | 35 (71.4%) | 14 (28.6%) |
| Wholesale Trade | 0 (0.0%) | 0 (0.0%) |
| Retail Trade | 0 (0.0%) | 6 (100.0%) |
| Transportation & Warehousing | 0 (0.0%) | 0 (0.0%) |
| Utilities | 0 (0.0%) | 0 (0.0%) |
| Information | 0 (0.0%) | 0 (0.0%) |
| Finance & Insurance | 0 (0.0%) | 0 (0.0%) |
| Real Estate, Rental & Leasing | 0 (0.0%) | 0 (0.0%) |
| Professional & Scientific | 0 (0.0%) | 0 (0.0%) |
| Enterprise Management | 0 (0.0%) | 0 (0.0%) |
| Administrative & Support | 0 (0.0%) | 0 (0.0%) |
| Educational Services | 11 (12.6%) | 76 (87.4%) |
| Health Care & Social Assistance | 0 (0.0%) | 32 (100.0%) |
| Arts, Entertainment & Recreation | 0 (0.0%) | 0 (0.0%) |
| Accommodation & Food Services | 0 (0.0%) | 25 (100.0%) |
| Public Administration | 9 (100.0%) | 0 (0.0%) |
| Total | 71 (31.7%) | 153 (68.3%) |
Education in Pelham
School Enrollment in Pelham
The most common levels of schooling among the 167 students in Pelham are high school (51 | 30.5%), college / undergraduate (39 | 23.4%), and middle school (37 | 22.2%).
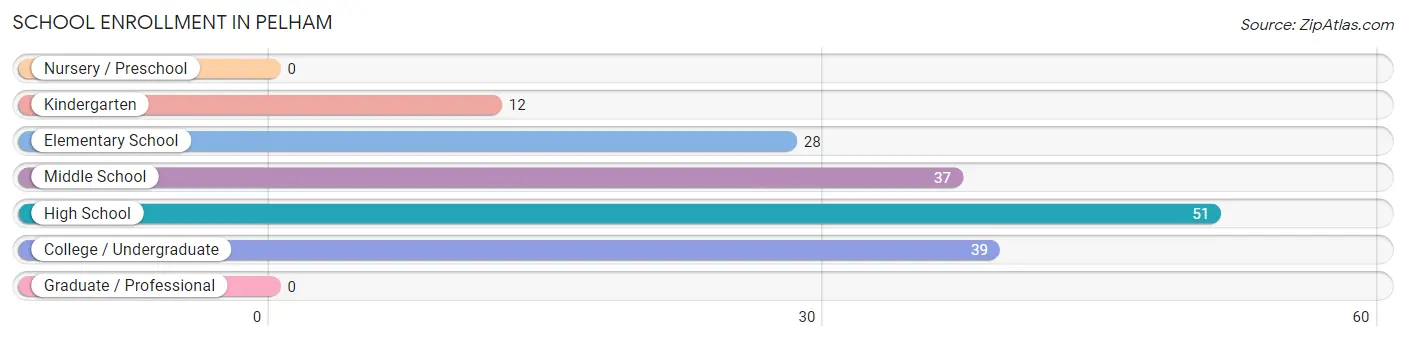
| School Level | # Students | % Students |
| Nursery / Preschool | 0 | 0.0% |
| Kindergarten | 12 | 7.2% |
| Elementary School | 28 | 16.8% |
| Middle School | 37 | 22.2% |
| High School | 51 | 30.5% |
| College / Undergraduate | 39 | 23.4% |
| Graduate / Professional | 0 | 0.0% |
| Total | 167 | 100.0% |
School Enrollment by Age by Funding Source in Pelham
Out of a total of 167 students who are enrolled in schools in Pelham, 6 (3.6%) attend a private institution, while the remaining 161 (96.4%) are enrolled in public schools. The age group of 5 to 9 year old has the highest likelihood of being enrolled in private schools, with 6 (22.2% in the age bracket) enrolled. Conversely, the age group of 10 to 14 year olds has the lowest likelihood of being enrolled in a private school, with 50 (100.0% in the age bracket) attending a public institution.
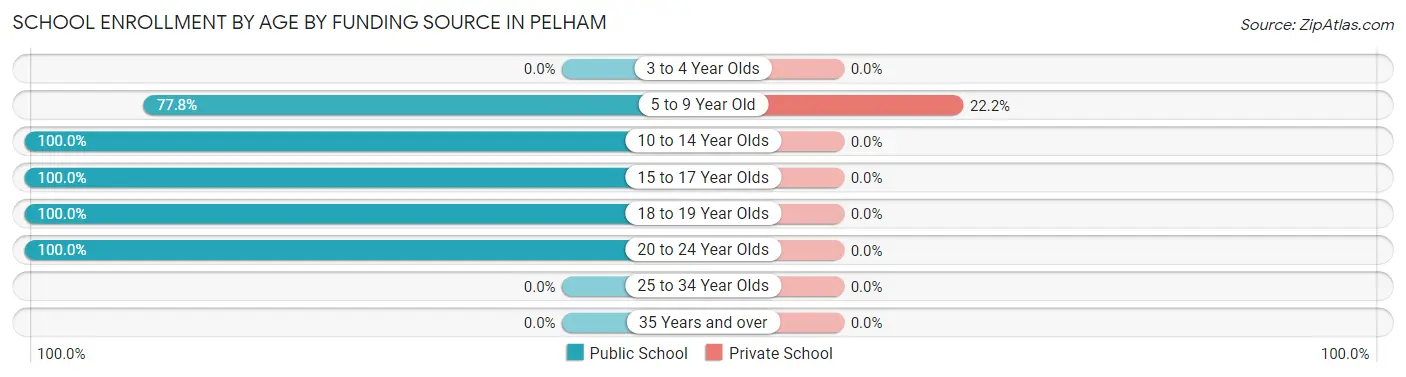
| Age Bracket | Public School | Private School |
| 3 to 4 Year Olds | 0 (0.0%) | 0 (0.0%) |
| 5 to 9 Year Old | 21 (77.8%) | 6 (22.2%) |
| 10 to 14 Year Olds | 50 (100.0%) | 0 (0.0%) |
| 15 to 17 Year Olds | 51 (100.0%) | 0 (0.0%) |
| 18 to 19 Year Olds | 15 (100.0%) | 0 (0.0%) |
| 20 to 24 Year Olds | 24 (100.0%) | 0 (0.0%) |
| 25 to 34 Year Olds | 0 (0.0%) | 0 (0.0%) |
| 35 Years and over | 0 (0.0%) | 0 (0.0%) |
| Total | 161 (96.4%) | 6 (3.6%) |
Educational Attainment by Field of Study in Pelham
Education (64 | 67.4%), bio, nature & agricultural (25 | 26.3%), and literature & languages (6 | 6.3%) are the most common fields of study among 95 individuals in Pelham who have obtained a bachelor's degree or higher.
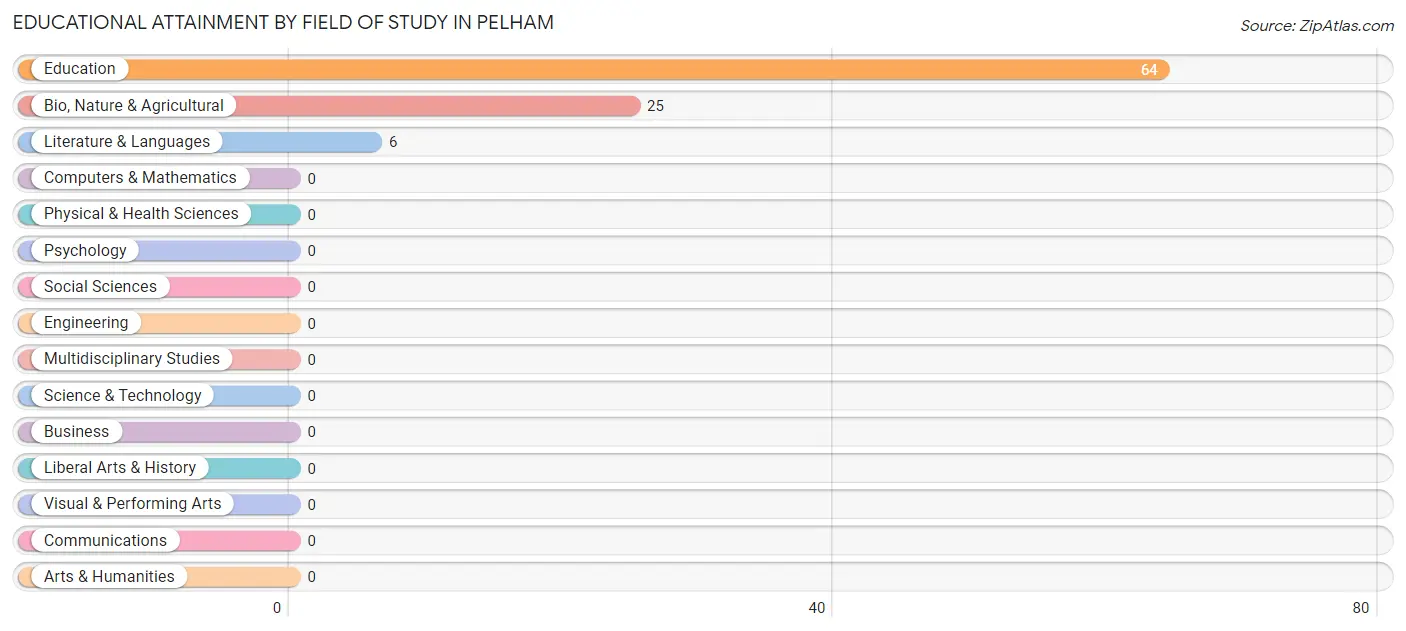
| Field of Study | # Graduates | % Graduates |
| Computers & Mathematics | 0 | 0.0% |
| Bio, Nature & Agricultural | 25 | 26.3% |
| Physical & Health Sciences | 0 | 0.0% |
| Psychology | 0 | 0.0% |
| Social Sciences | 0 | 0.0% |
| Engineering | 0 | 0.0% |
| Multidisciplinary Studies | 0 | 0.0% |
| Science & Technology | 0 | 0.0% |
| Business | 0 | 0.0% |
| Education | 64 | 67.4% |
| Literature & Languages | 6 | 6.3% |
| Liberal Arts & History | 0 | 0.0% |
| Visual & Performing Arts | 0 | 0.0% |
| Communications | 0 | 0.0% |
| Arts & Humanities | 0 | 0.0% |
| Total | 95 | 100.0% |
Transportation & Commute in Pelham
Vehicle Availability by Sex in Pelham
The most prevalent vehicle ownership categories in Pelham are males with 5 or more vehicles (42, accounting for 59.2%) and females with 5 or more vehicles (101, making up 27.5%).
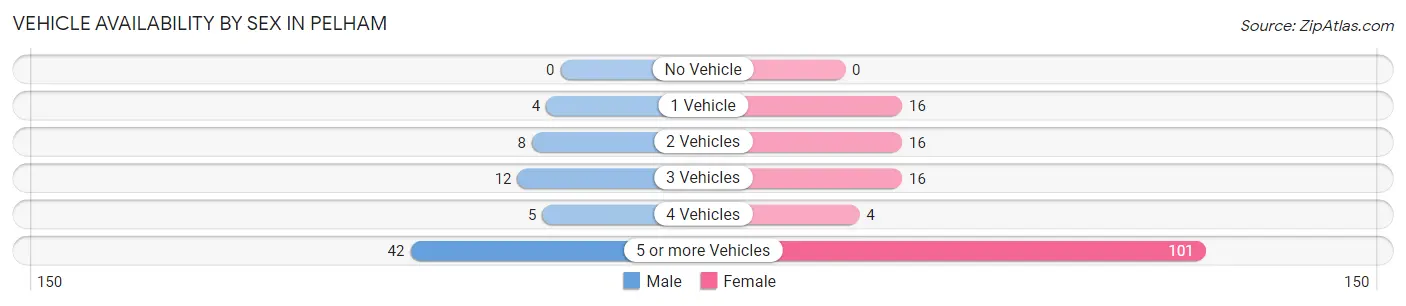
| Vehicles Available | Male | Female |
| No Vehicle | 0 (0.0%) | 0 (0.0%) |
| 1 Vehicle | 4 (5.6%) | 16 (10.5%) |
| 2 Vehicles | 8 (11.3%) | 16 (10.5%) |
| 3 Vehicles | 12 (16.9%) | 16 (10.5%) |
| 4 Vehicles | 5 (7.0%) | 4 (2.6%) |
| 5 or more Vehicles | 42 (59.2%) | 101 (66.0%) |
| Total | 71 (100.0%) | 153 (100.0%) |
Commute Time in Pelham
The most frequently occuring commute durations in Pelham are 25 to 29 minutes (58 commuters, 25.9%), 45 to 59 minutes (53 commuters, 23.7%), and 15 to 19 minutes (30 commuters, 13.4%).
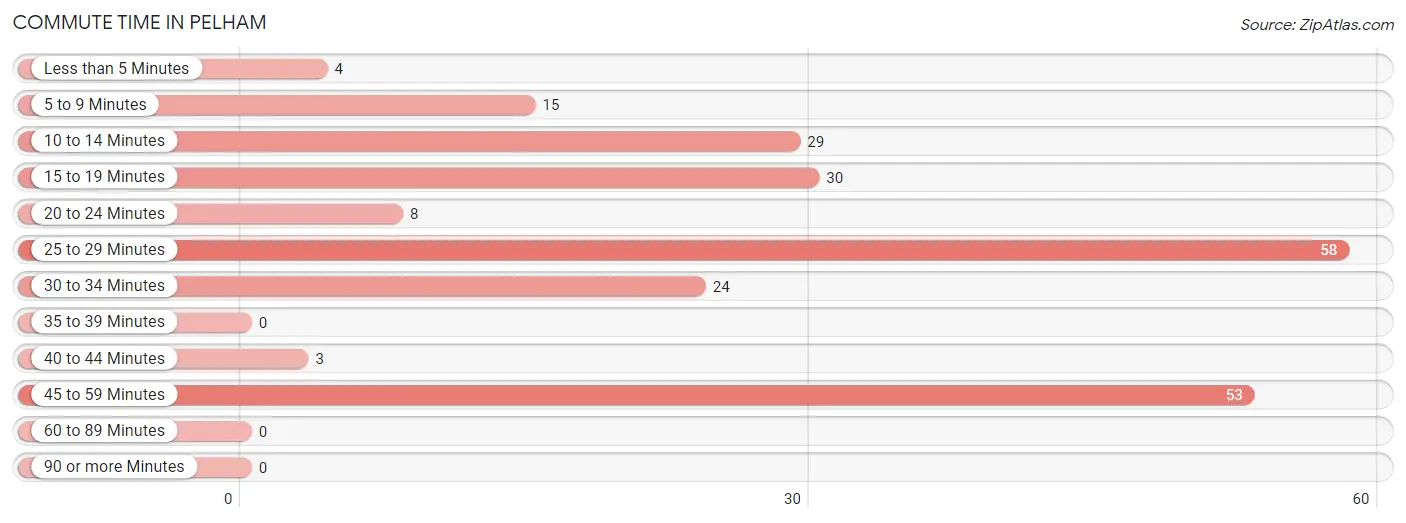
| Commute Time | # Commuters | % Commuters |
| Less than 5 Minutes | 4 | 1.8% |
| 5 to 9 Minutes | 15 | 6.7% |
| 10 to 14 Minutes | 29 | 13.0% |
| 15 to 19 Minutes | 30 | 13.4% |
| 20 to 24 Minutes | 8 | 3.6% |
| 25 to 29 Minutes | 58 | 25.9% |
| 30 to 34 Minutes | 24 | 10.7% |
| 35 to 39 Minutes | 0 | 0.0% |
| 40 to 44 Minutes | 3 | 1.3% |
| 45 to 59 Minutes | 53 | 23.7% |
| 60 to 89 Minutes | 0 | 0.0% |
| 90 or more Minutes | 0 | 0.0% |
Commute Time by Sex in Pelham
The most common commute times in Pelham are 15 to 19 minutes (30 commuters, 42.2%) for males and 25 to 29 minutes (53 commuters, 34.6%) for females.
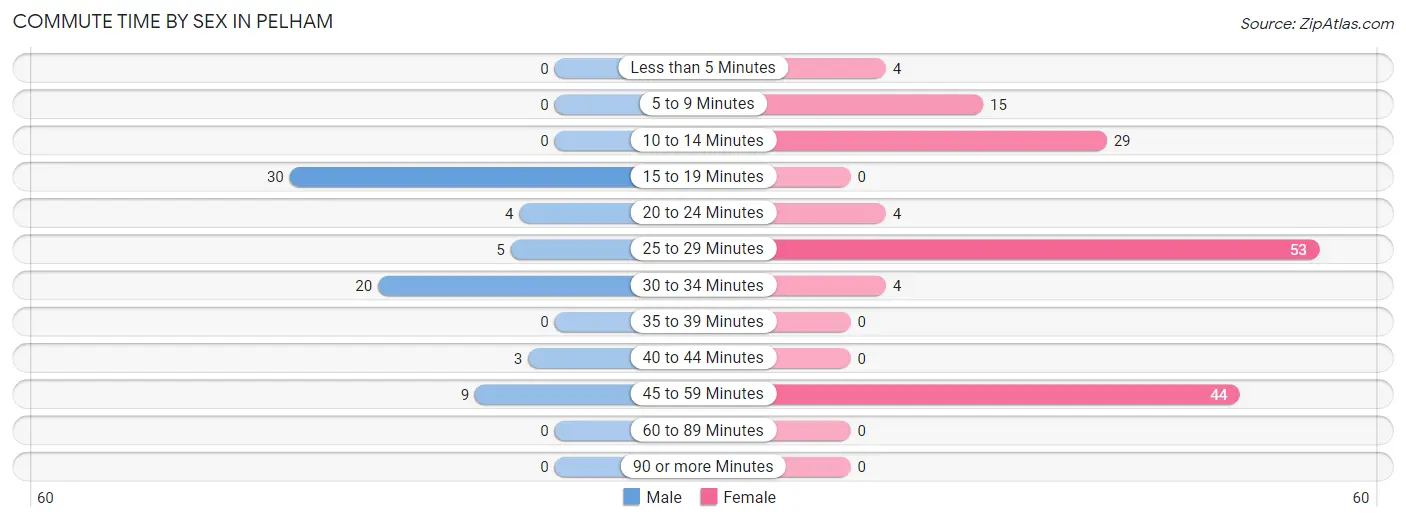
| Commute Time | Male | Female |
| Less than 5 Minutes | 0 (0.0%) | 4 (2.6%) |
| 5 to 9 Minutes | 0 (0.0%) | 15 (9.8%) |
| 10 to 14 Minutes | 0 (0.0%) | 29 (19.0%) |
| 15 to 19 Minutes | 30 (42.2%) | 0 (0.0%) |
| 20 to 24 Minutes | 4 (5.6%) | 4 (2.6%) |
| 25 to 29 Minutes | 5 (7.0%) | 53 (34.6%) |
| 30 to 34 Minutes | 20 (28.2%) | 4 (2.6%) |
| 35 to 39 Minutes | 0 (0.0%) | 0 (0.0%) |
| 40 to 44 Minutes | 3 (4.2%) | 0 (0.0%) |
| 45 to 59 Minutes | 9 (12.7%) | 44 (28.8%) |
| 60 to 89 Minutes | 0 (0.0%) | 0 (0.0%) |
| 90 or more Minutes | 0 (0.0%) | 0 (0.0%) |
Time of Departure to Work by Sex in Pelham
The most frequent times of departure to work in Pelham are 6:30 AM to 6:59 AM (41, 57.8%) for males and 7:30 AM to 7:59 AM (37, 24.2%) for females.
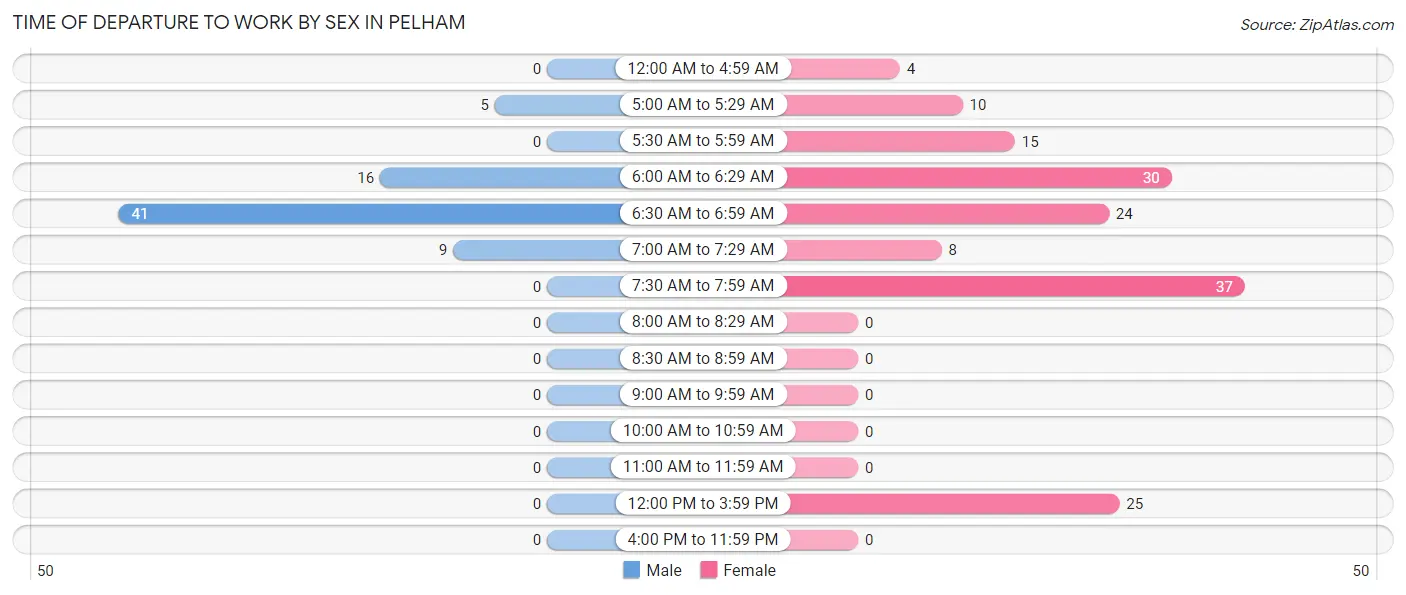
| Time of Departure | Male | Female |
| 12:00 AM to 4:59 AM | 0 (0.0%) | 4 (2.6%) |
| 5:00 AM to 5:29 AM | 5 (7.0%) | 10 (6.5%) |
| 5:30 AM to 5:59 AM | 0 (0.0%) | 15 (9.8%) |
| 6:00 AM to 6:29 AM | 16 (22.5%) | 30 (19.6%) |
| 6:30 AM to 6:59 AM | 41 (57.8%) | 24 (15.7%) |
| 7:00 AM to 7:29 AM | 9 (12.7%) | 8 (5.2%) |
| 7:30 AM to 7:59 AM | 0 (0.0%) | 37 (24.2%) |
| 8:00 AM to 8:29 AM | 0 (0.0%) | 0 (0.0%) |
| 8:30 AM to 8:59 AM | 0 (0.0%) | 0 (0.0%) |
| 9:00 AM to 9:59 AM | 0 (0.0%) | 0 (0.0%) |
| 10:00 AM to 10:59 AM | 0 (0.0%) | 0 (0.0%) |
| 11:00 AM to 11:59 AM | 0 (0.0%) | 0 (0.0%) |
| 12:00 PM to 3:59 PM | 0 (0.0%) | 25 (16.3%) |
| 4:00 PM to 11:59 PM | 0 (0.0%) | 0 (0.0%) |
| Total | 71 (100.0%) | 153 (100.0%) |
Housing Occupancy in Pelham
Occupancy by Ownership in Pelham
Of the total 135 dwellings in Pelham, owner-occupied units account for 80 (59.3%), while renter-occupied units make up 55 (40.7%).
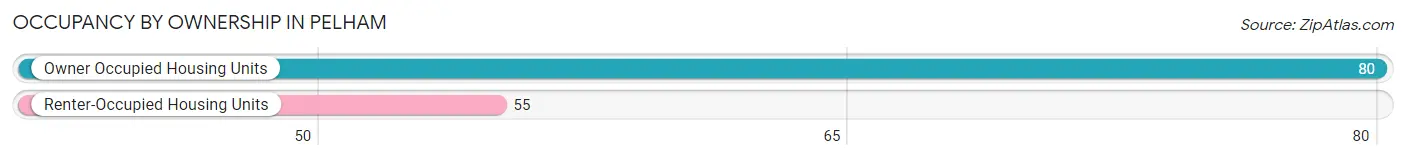
| Occupancy | # Housing Units | % Housing Units |
| Owner Occupied Housing Units | 80 | 59.3% |
| Renter-Occupied Housing Units | 55 | 40.7% |
| Total Occupied Housing Units | 135 | 100.0% |
Occupancy by Household Size in Pelham
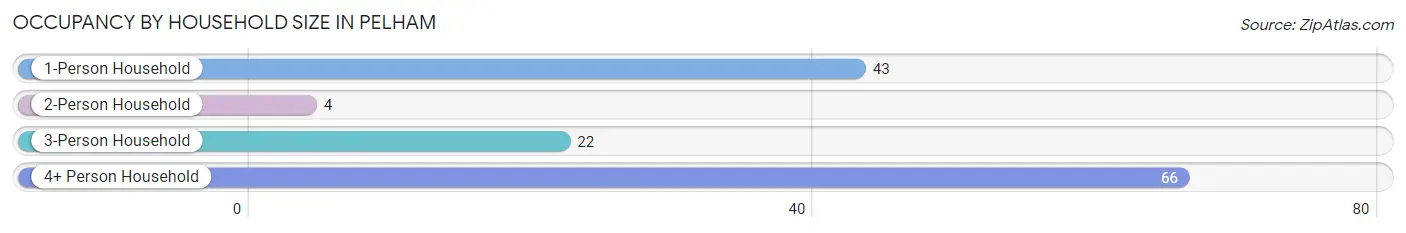
| Household Size | # Housing Units | % Housing Units |
| 1-Person Household | 43 | 31.9% |
| 2-Person Household | 4 | 3.0% |
| 3-Person Household | 22 | 16.3% |
| 4+ Person Household | 66 | 48.9% |
| Total Housing Units | 135 | 100.0% |
Occupancy by Ownership by Household Size in Pelham
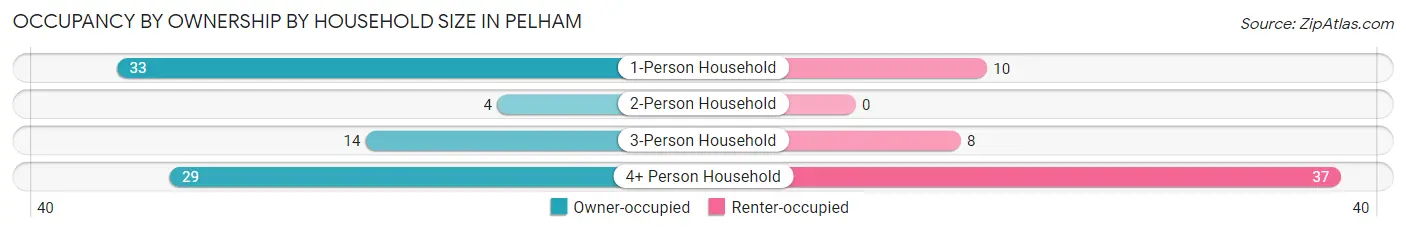
| Household Size | Owner-occupied | Renter-occupied |
| 1-Person Household | 33 (76.7%) | 10 (23.3%) |
| 2-Person Household | 4 (100.0%) | 0 (0.0%) |
| 3-Person Household | 14 (63.6%) | 8 (36.4%) |
| 4+ Person Household | 29 (43.9%) | 37 (56.1%) |
| Total Housing Units | 80 (59.3%) | 55 (40.7%) |
Occupancy by Educational Attainment in Pelham
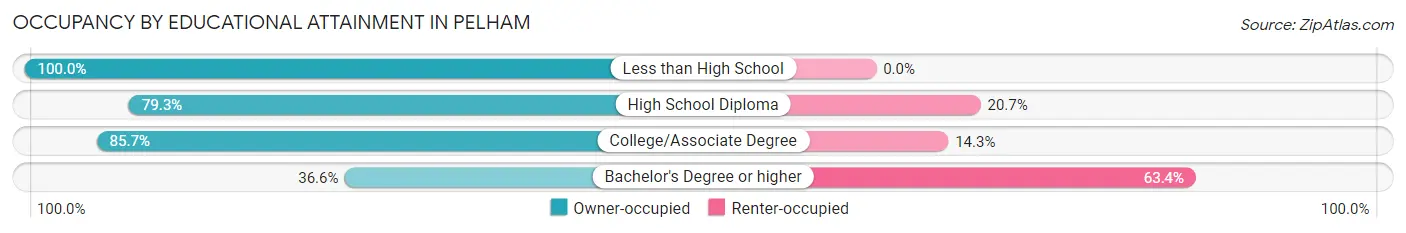
| Household Size | Owner-occupied | Renter-occupied |
| Less than High School | 7 (100.0%) | 0 (0.0%) |
| High School Diploma | 23 (79.3%) | 6 (20.7%) |
| College/Associate Degree | 24 (85.7%) | 4 (14.3%) |
| Bachelor's Degree or higher | 26 (36.6%) | 45 (63.4%) |
Occupancy by Age of Householder in Pelham
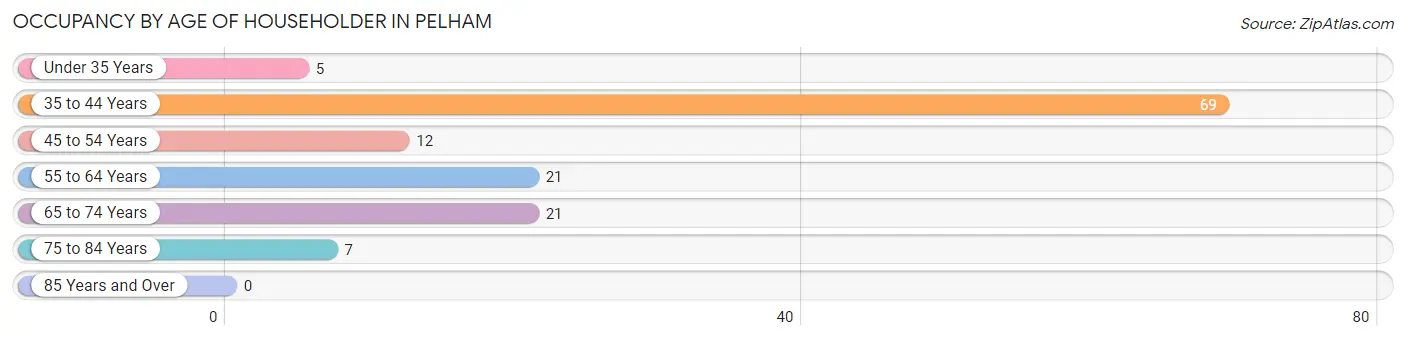
| Age Bracket | # Households | % Households |
| Under 35 Years | 5 | 3.7% |
| 35 to 44 Years | 69 | 51.1% |
| 45 to 54 Years | 12 | 8.9% |
| 55 to 64 Years | 21 | 15.6% |
| 65 to 74 Years | 21 | 15.6% |
| 75 to 84 Years | 7 | 5.2% |
| 85 Years and Over | 0 | 0.0% |
| Total | 135 | 100.0% |
Housing Finances in Pelham
Median Income by Occupancy in Pelham
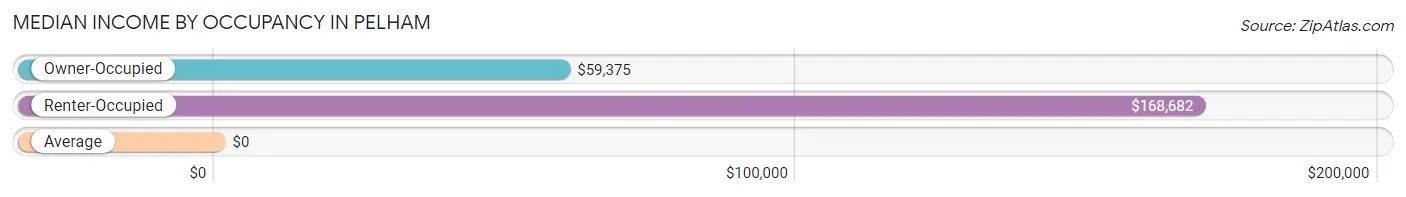
| Occupancy Type | # Households | Median Income |
| Owner-Occupied | 80 (59.3%) | $59,375 |
| Renter-Occupied | 55 (40.7%) | $168,682 |
| Average | 135 (100.0%) | $0 |
Occupancy by Householder Income Bracket in Pelham
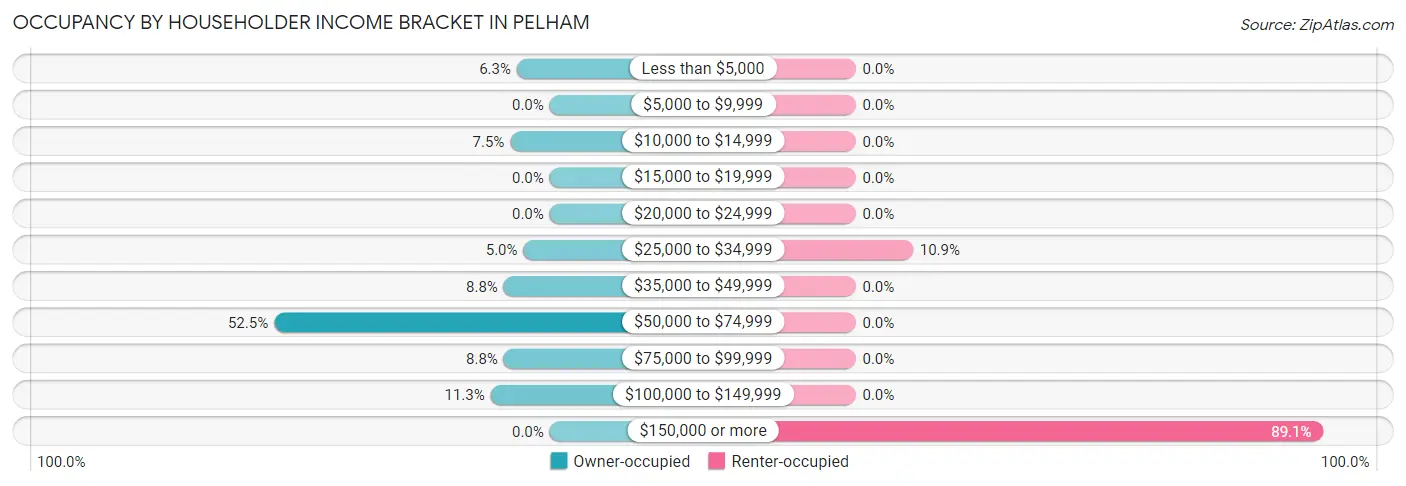
| Income Bracket | Owner-occupied | Renter-occupied |
| Less than $5,000 | 5 (6.2%) | 0 (0.0%) |
| $5,000 to $9,999 | 0 (0.0%) | 0 (0.0%) |
| $10,000 to $14,999 | 6 (7.5%) | 0 (0.0%) |
| $15,000 to $19,999 | 0 (0.0%) | 0 (0.0%) |
| $20,000 to $24,999 | 0 (0.0%) | 0 (0.0%) |
| $25,000 to $34,999 | 4 (5.0%) | 6 (10.9%) |
| $35,000 to $49,999 | 7 (8.7%) | 0 (0.0%) |
| $50,000 to $74,999 | 42 (52.5%) | 0 (0.0%) |
| $75,000 to $99,999 | 7 (8.7%) | 0 (0.0%) |
| $100,000 to $149,999 | 9 (11.3%) | 0 (0.0%) |
| $150,000 or more | 0 (0.0%) | 49 (89.1%) |
| Total | 80 (100.0%) | 55 (100.0%) |
Monthly Housing Cost Tiers in Pelham
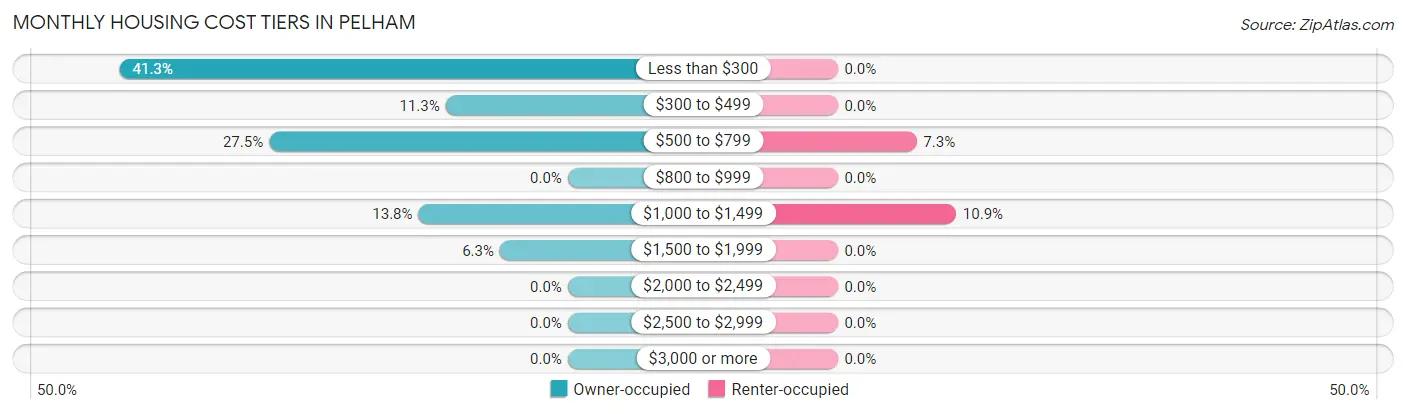
| Monthly Cost | Owner-occupied | Renter-occupied |
| Less than $300 | 33 (41.2%) | 0 (0.0%) |
| $300 to $499 | 9 (11.3%) | 0 (0.0%) |
| $500 to $799 | 22 (27.5%) | 4 (7.3%) |
| $800 to $999 | 0 (0.0%) | 0 (0.0%) |
| $1,000 to $1,499 | 11 (13.8%) | 6 (10.9%) |
| $1,500 to $1,999 | 5 (6.2%) | 0 (0.0%) |
| $2,000 to $2,499 | 0 (0.0%) | 0 (0.0%) |
| $2,500 to $2,999 | 0 (0.0%) | 0 (0.0%) |
| $3,000 or more | 0 (0.0%) | 0 (0.0%) |
| Total | 80 (100.0%) | 55 (100.0%) |
Physical Housing Characteristics in Pelham
Housing Structures in Pelham
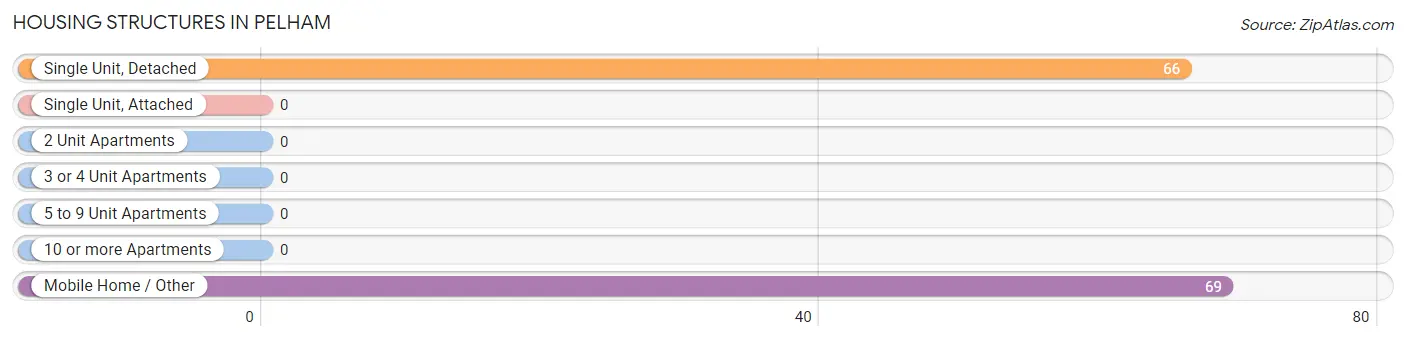
| Structure Type | # Housing Units | % Housing Units |
| Single Unit, Detached | 66 | 48.9% |
| Single Unit, Attached | 0 | 0.0% |
| 2 Unit Apartments | 0 | 0.0% |
| 3 or 4 Unit Apartments | 0 | 0.0% |
| 5 to 9 Unit Apartments | 0 | 0.0% |
| 10 or more Apartments | 0 | 0.0% |
| Mobile Home / Other | 69 | 51.1% |
| Total | 135 | 100.0% |
Housing Structures by Occupancy in Pelham
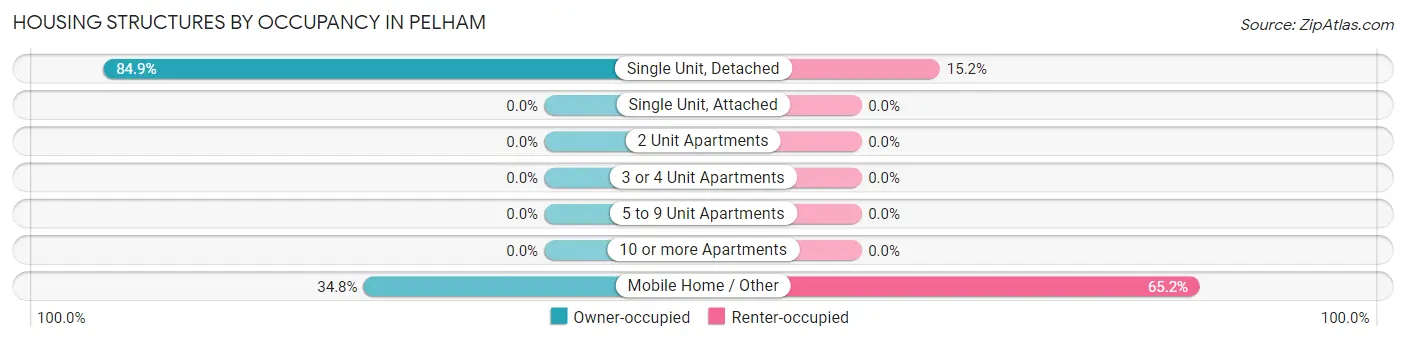
| Structure Type | Owner-occupied | Renter-occupied |
| Single Unit, Detached | 56 (84.9%) | 10 (15.1%) |
| Single Unit, Attached | 0 (0.0%) | 0 (0.0%) |
| 2 Unit Apartments | 0 (0.0%) | 0 (0.0%) |
| 3 or 4 Unit Apartments | 0 (0.0%) | 0 (0.0%) |
| 5 to 9 Unit Apartments | 0 (0.0%) | 0 (0.0%) |
| 10 or more Apartments | 0 (0.0%) | 0 (0.0%) |
| Mobile Home / Other | 24 (34.8%) | 45 (65.2%) |
| Total | 80 (59.3%) | 55 (40.7%) |
Housing Structures by Number of Rooms in Pelham
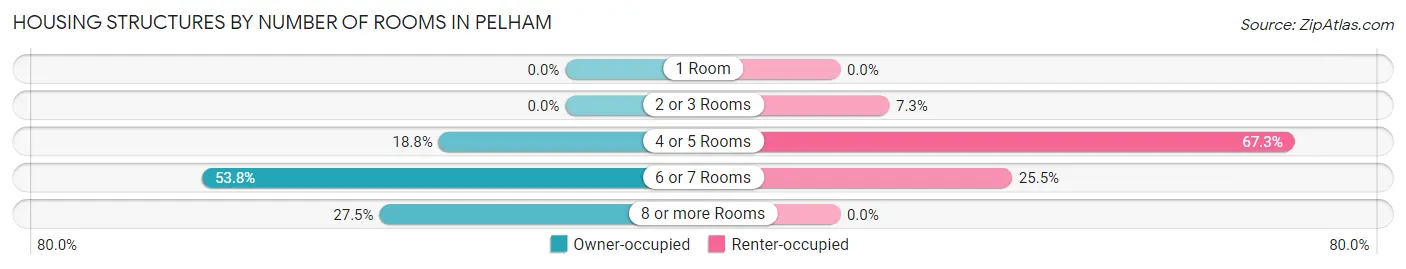
| Number of Rooms | Owner-occupied | Renter-occupied |
| 1 Room | 0 (0.0%) | 0 (0.0%) |
| 2 or 3 Rooms | 0 (0.0%) | 4 (7.3%) |
| 4 or 5 Rooms | 15 (18.8%) | 37 (67.3%) |
| 6 or 7 Rooms | 43 (53.7%) | 14 (25.5%) |
| 8 or more Rooms | 22 (27.5%) | 0 (0.0%) |
| Total | 80 (100.0%) | 55 (100.0%) |
Housing Structure by Heating Type in Pelham
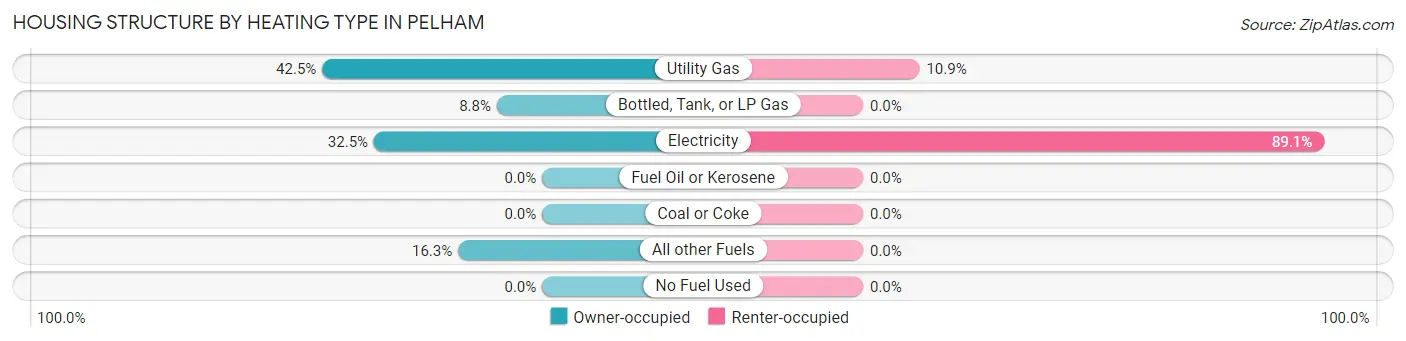
| Heating Type | Owner-occupied | Renter-occupied |
| Utility Gas | 34 (42.5%) | 6 (10.9%) |
| Bottled, Tank, or LP Gas | 7 (8.7%) | 0 (0.0%) |
| Electricity | 26 (32.5%) | 49 (89.1%) |
| Fuel Oil or Kerosene | 0 (0.0%) | 0 (0.0%) |
| Coal or Coke | 0 (0.0%) | 0 (0.0%) |
| All other Fuels | 13 (16.3%) | 0 (0.0%) |
| No Fuel Used | 0 (0.0%) | 0 (0.0%) |
| Total | 80 (100.0%) | 55 (100.0%) |
Household Vehicle Usage in Pelham
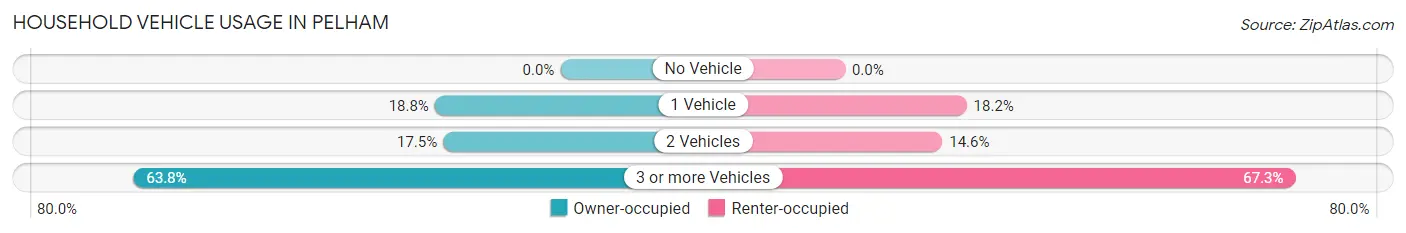
| Vehicles per Household | Owner-occupied | Renter-occupied |
| No Vehicle | 0 (0.0%) | 0 (0.0%) |
| 1 Vehicle | 15 (18.8%) | 10 (18.2%) |
| 2 Vehicles | 14 (17.5%) | 8 (14.5%) |
| 3 or more Vehicles | 51 (63.7%) | 37 (67.3%) |
| Total | 80 (100.0%) | 55 (100.0%) |
Real Estate & Mortgages in Pelham
Real Estate and Mortgage Overview in Pelham
| Characteristic | Without Mortgage | With Mortgage |
| Housing Units | 69 | 11 |
| Median Property Value | - | - |
| Median Household Income | $57,083 | $0 |
| Monthly Housing Costs | $308 | $0 |
| Real Estate Taxes | $423 | $0 |
Property Value by Mortgage Status in Pelham
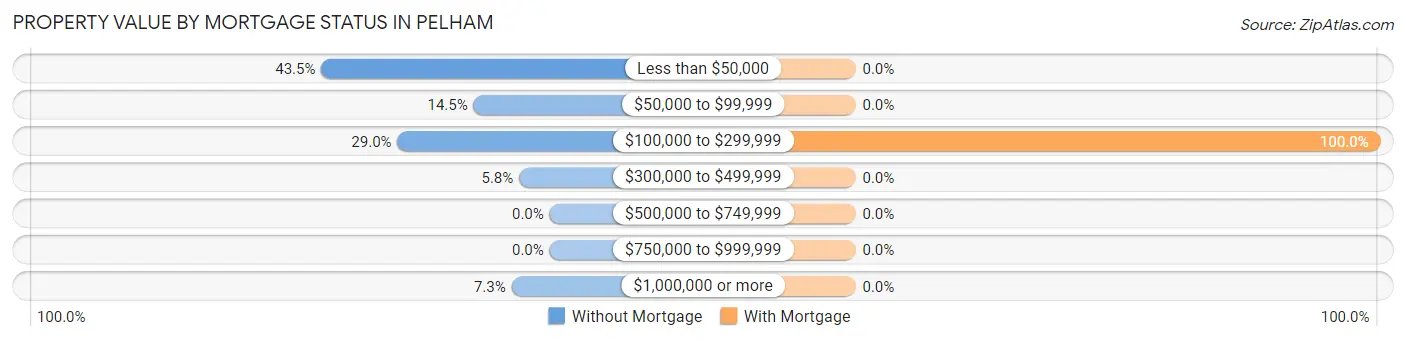
| Property Value | Without Mortgage | With Mortgage |
| Less than $50,000 | 30 (43.5%) | 0 (0.0%) |
| $50,000 to $99,999 | 10 (14.5%) | 0 (0.0%) |
| $100,000 to $299,999 | 20 (29.0%) | 11 (100.0%) |
| $300,000 to $499,999 | 4 (5.8%) | 0 (0.0%) |
| $500,000 to $749,999 | 0 (0.0%) | 0 (0.0%) |
| $750,000 to $999,999 | 0 (0.0%) | 0 (0.0%) |
| $1,000,000 or more | 5 (7.2%) | 0 (0.0%) |
| Total | 69 (100.0%) | 11 (100.0%) |
Household Income by Mortgage Status in Pelham
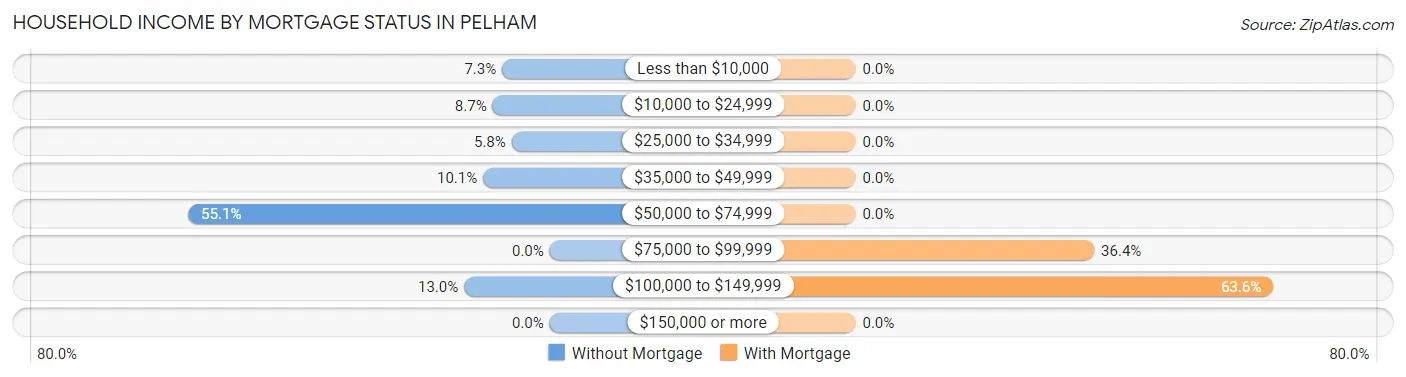
| Household Income | Without Mortgage | With Mortgage |
| Less than $10,000 | 5 (7.2%) | 0 (0.0%) |
| $10,000 to $24,999 | 6 (8.7%) | 0 (0.0%) |
| $25,000 to $34,999 | 4 (5.8%) | 0 (0.0%) |
| $35,000 to $49,999 | 7 (10.1%) | 0 (0.0%) |
| $50,000 to $74,999 | 38 (55.1%) | 0 (0.0%) |
| $75,000 to $99,999 | 0 (0.0%) | 4 (36.4%) |
| $100,000 to $149,999 | 9 (13.0%) | 7 (63.6%) |
| $150,000 or more | 0 (0.0%) | 0 (0.0%) |
| Total | 69 (100.0%) | 11 (100.0%) |
Property Value to Household Income Ratio in Pelham
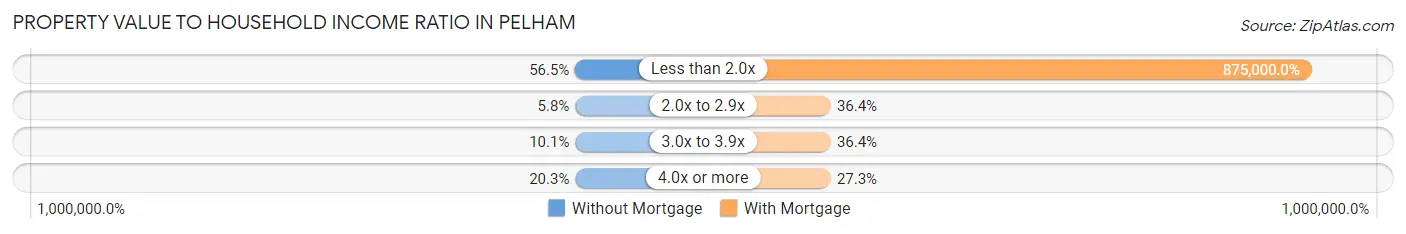
| Value-to-Income Ratio | Without Mortgage | With Mortgage |
| Less than 2.0x | 39 (56.5%) | 96,250 (875,000.0%) |
| 2.0x to 2.9x | 4 (5.8%) | 4 (36.4%) |
| 3.0x to 3.9x | 7 (10.1%) | 4 (36.4%) |
| 4.0x or more | 14 (20.3%) | 3 (27.3%) |
| Total | 69 (100.0%) | 11 (100.0%) |
Real Estate Taxes by Mortgage Status in Pelham
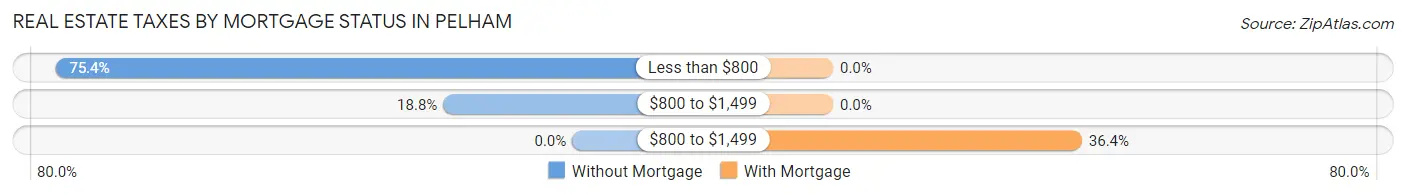
| Property Taxes | Without Mortgage | With Mortgage |
| Less than $800 | 52 (75.4%) | 0 (0.0%) |
| $800 to $1,499 | 13 (18.8%) | 0 (0.0%) |
| $800 to $1,499 | 0 (0.0%) | 4 (36.4%) |
| Total | 69 (100.0%) | 11 (100.0%) |
Health & Disability in Pelham
Health Insurance Coverage by Age in Pelham
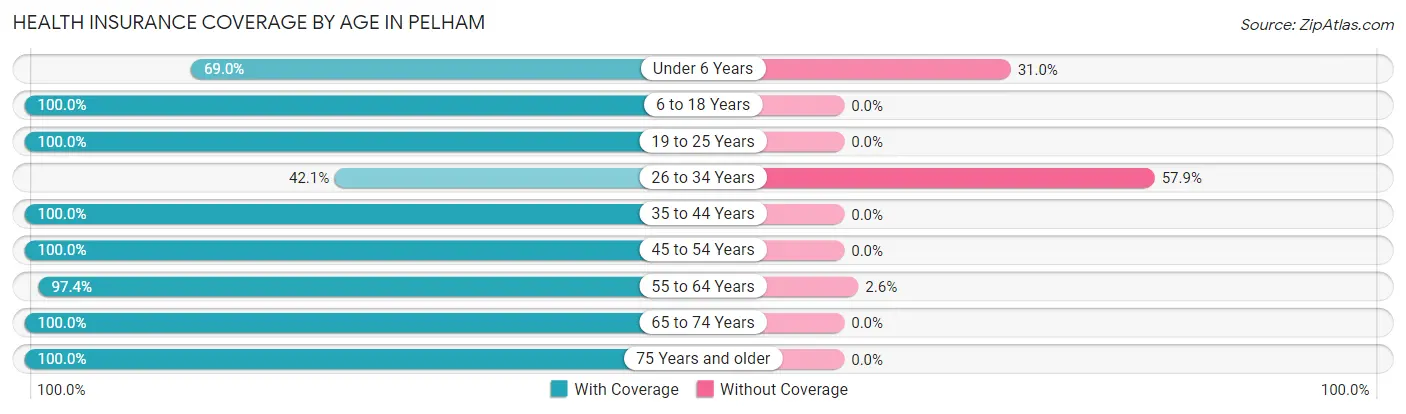
| Age Bracket | With Coverage | Without Coverage |
| Under 6 Years | 20 (69.0%) | 9 (31.0%) |
| 6 to 18 Years | 131 (100.0%) | 0 (0.0%) |
| 19 to 25 Years | 24 (100.0%) | 0 (0.0%) |
| 26 to 34 Years | 8 (42.1%) | 11 (57.9%) |
| 35 to 44 Years | 93 (100.0%) | 0 (0.0%) |
| 45 to 54 Years | 51 (100.0%) | 0 (0.0%) |
| 55 to 64 Years | 37 (97.4%) | 1 (2.6%) |
| 65 to 74 Years | 21 (100.0%) | 0 (0.0%) |
| 75 Years and older | 13 (100.0%) | 0 (0.0%) |
| Total | 398 (95.0%) | 21 (5.0%) |
Health Insurance Coverage by Citizenship Status in Pelham
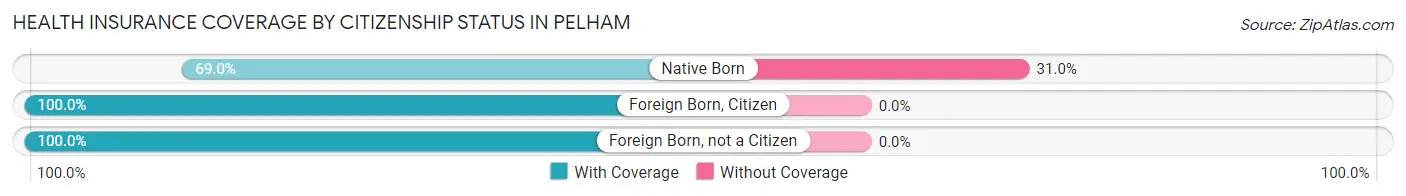
| Citizenship Status | With Coverage | Without Coverage |
| Native Born | 20 (69.0%) | 9 (31.0%) |
| Foreign Born, Citizen | 131 (100.0%) | 0 (0.0%) |
| Foreign Born, not a Citizen | 24 (100.0%) | 0 (0.0%) |
Health Insurance Coverage by Household Income in Pelham
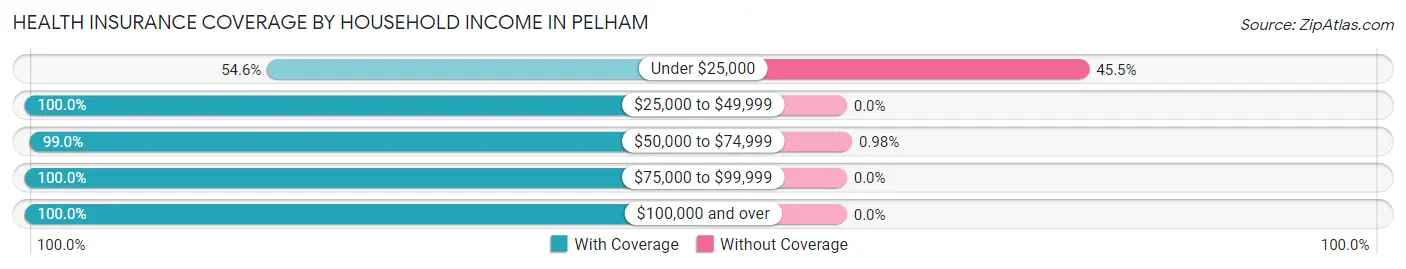
| Household Income | With Coverage | Without Coverage |
| Under $25,000 | 24 (54.5%) | 20 (45.5%) |
| $25,000 to $49,999 | 33 (100.0%) | 0 (0.0%) |
| $50,000 to $74,999 | 101 (99.0%) | 1 (1.0%) |
| $75,000 to $99,999 | 22 (100.0%) | 0 (0.0%) |
| $100,000 and over | 218 (100.0%) | 0 (0.0%) |
Public vs Private Health Insurance Coverage by Age in Pelham
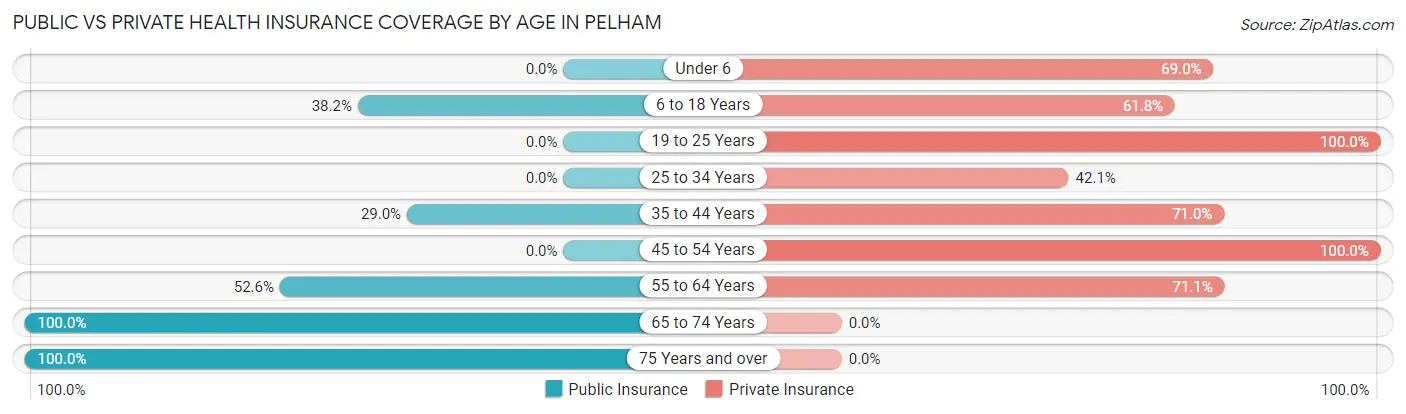
| Age Bracket | Public Insurance | Private Insurance |
| Under 6 | 0 (0.0%) | 20 (69.0%) |
| 6 to 18 Years | 50 (38.2%) | 81 (61.8%) |
| 19 to 25 Years | 0 (0.0%) | 24 (100.0%) |
| 25 to 34 Years | 0 (0.0%) | 8 (42.1%) |
| 35 to 44 Years | 27 (29.0%) | 66 (71.0%) |
| 45 to 54 Years | 0 (0.0%) | 51 (100.0%) |
| 55 to 64 Years | 20 (52.6%) | 27 (71.1%) |
| 65 to 74 Years | 21 (100.0%) | 0 (0.0%) |
| 75 Years and over | 13 (100.0%) | 0 (0.0%) |
| Total | 131 (31.3%) | 277 (66.1%) |
Disability Status by Sex by Age in Pelham
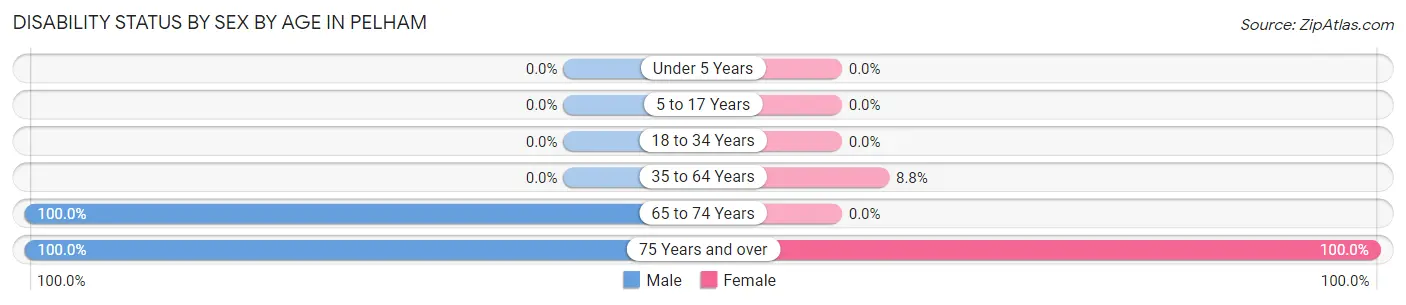
| Age Bracket | Male | Female |
| Under 5 Years | 0 (0.0%) | 0 (0.0%) |
| 5 to 17 Years | 0 (0.0%) | 0 (0.0%) |
| 18 to 34 Years | 0 (0.0%) | 0 (0.0%) |
| 35 to 64 Years | 0 (0.0%) | 10 (8.8%) |
| 65 to 74 Years | 15 (100.0%) | 0 (0.0%) |
| 75 Years and over | 7 (100.0%) | 6 (100.0%) |
Disability Class by Sex by Age in Pelham
Disability Class: Hearing Difficulty
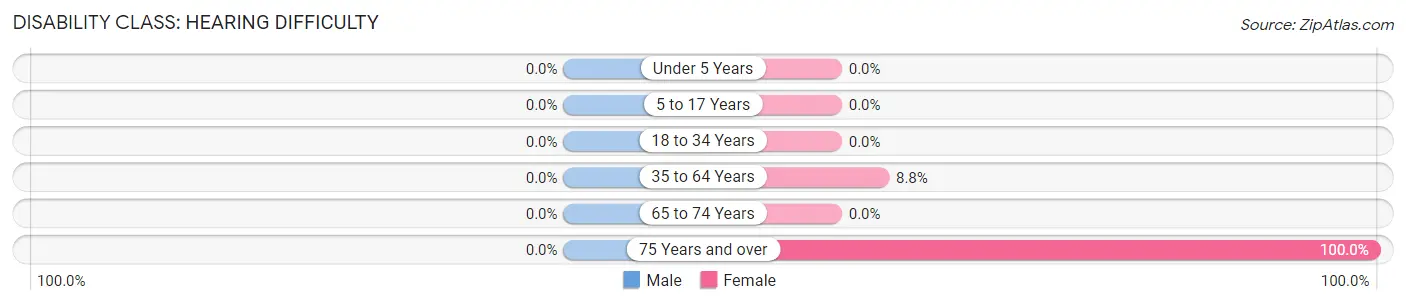
| Age Bracket | Male | Female |
| Under 5 Years | 0 (0.0%) | 0 (0.0%) |
| 5 to 17 Years | 0 (0.0%) | 0 (0.0%) |
| 18 to 34 Years | 0 (0.0%) | 0 (0.0%) |
| 35 to 64 Years | 0 (0.0%) | 10 (8.8%) |
| 65 to 74 Years | 0 (0.0%) | 0 (0.0%) |
| 75 Years and over | 0 (0.0%) | 6 (100.0%) |
Disability Class: Vision Difficulty
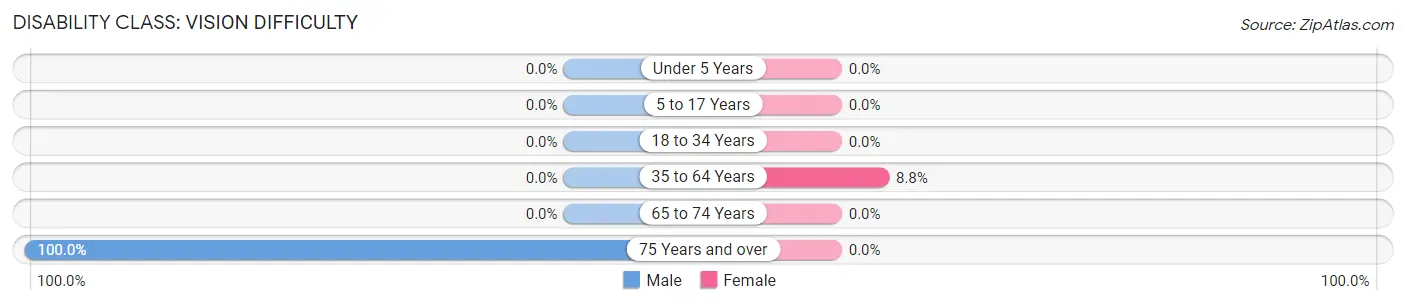
| Age Bracket | Male | Female |
| Under 5 Years | 0 (0.0%) | 0 (0.0%) |
| 5 to 17 Years | 0 (0.0%) | 0 (0.0%) |
| 18 to 34 Years | 0 (0.0%) | 0 (0.0%) |
| 35 to 64 Years | 0 (0.0%) | 10 (8.8%) |
| 65 to 74 Years | 0 (0.0%) | 0 (0.0%) |
| 75 Years and over | 7 (100.0%) | 0 (0.0%) |
Disability Class: Cognitive Difficulty
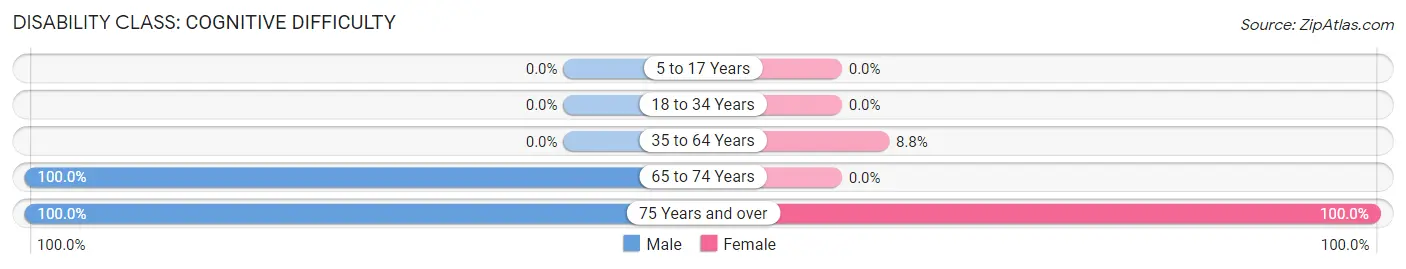
| Age Bracket | Male | Female |
| 5 to 17 Years | 0 (0.0%) | 0 (0.0%) |
| 18 to 34 Years | 0 (0.0%) | 0 (0.0%) |
| 35 to 64 Years | 0 (0.0%) | 10 (8.8%) |
| 65 to 74 Years | 15 (100.0%) | 0 (0.0%) |
| 75 Years and over | 7 (100.0%) | 6 (100.0%) |
Disability Class: Ambulatory Difficulty
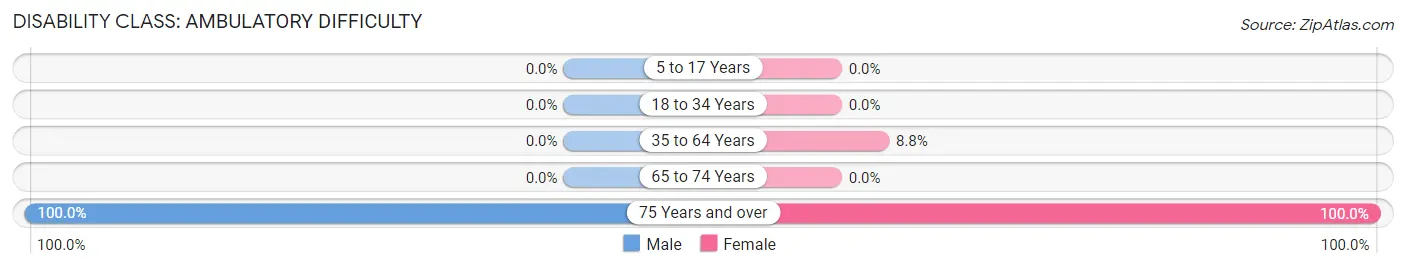
| Age Bracket | Male | Female |
| 5 to 17 Years | 0 (0.0%) | 0 (0.0%) |
| 18 to 34 Years | 0 (0.0%) | 0 (0.0%) |
| 35 to 64 Years | 0 (0.0%) | 10 (8.8%) |
| 65 to 74 Years | 0 (0.0%) | 0 (0.0%) |
| 75 Years and over | 7 (100.0%) | 6 (100.0%) |
Disability Class: Self-Care Difficulty
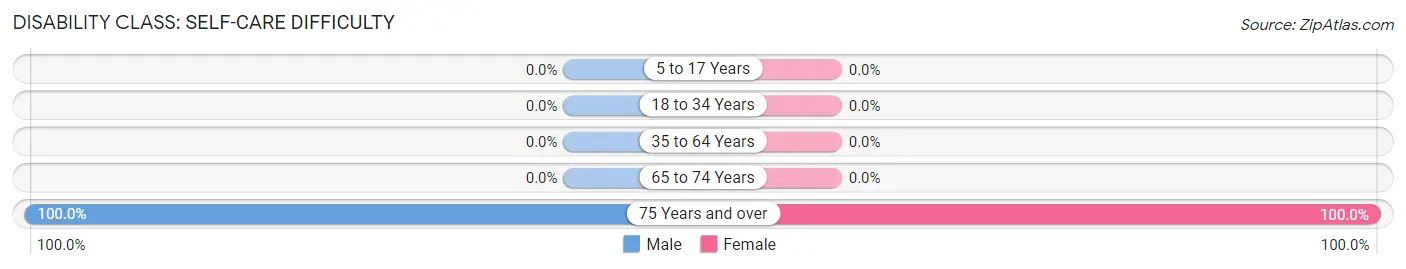
| Age Bracket | Male | Female |
| 5 to 17 Years | 0 (0.0%) | 0 (0.0%) |
| 18 to 34 Years | 0 (0.0%) | 0 (0.0%) |
| 35 to 64 Years | 0 (0.0%) | 0 (0.0%) |
| 65 to 74 Years | 0 (0.0%) | 0 (0.0%) |
| 75 Years and over | 7 (100.0%) | 6 (100.0%) |
Technology Access in Pelham
Computing Device Access in Pelham
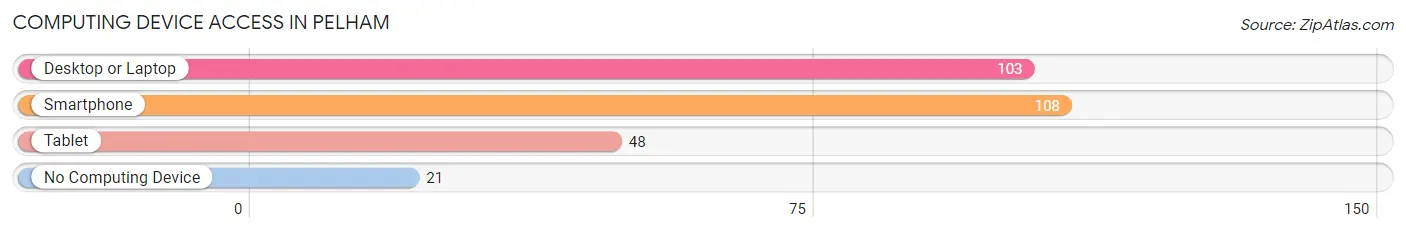
| Device Type | # Households | % Households |
| Desktop or Laptop | 103 | 76.3% |
| Smartphone | 108 | 80.0% |
| Tablet | 48 | 35.6% |
| No Computing Device | 21 | 15.6% |
| Total | 135 | 100.0% |
Internet Access in Pelham
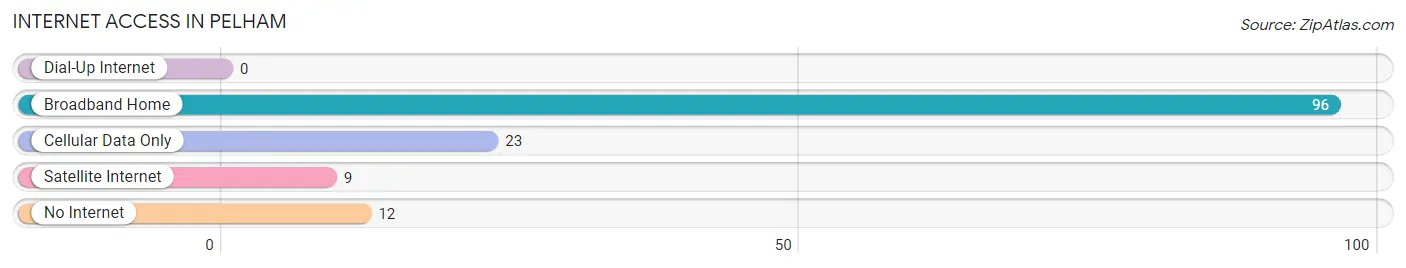
| Internet Type | # Households | % Households |
| Dial-Up Internet | 0 | 0.0% |
| Broadband Home | 96 | 71.1% |
| Cellular Data Only | 23 | 17.0% |
| Satellite Internet | 9 | 6.7% |
| No Internet | 12 | 8.9% |
| Total | 135 | 100.0% |
Pelham Summary
Pelham, Tennessee is a small town located in Grundy County, in the southeastern part of the state. It is situated in the foothills of the Cumberland Plateau, and is surrounded by the Sequatchie Valley. The town has a population of approximately 1,000 people, and is part of the Chattanooga metropolitan area.
History
Pelham was founded in 1845 by a group of settlers from North Carolina. The town was named after the Pelham family, who were among the first settlers. The town was originally a farming community, and the main crops grown were corn, wheat, and cotton. In the late 19th century, the town began to grow and develop, and by the early 20th century, it had become a thriving community.
In the early 1900s, the town was home to several businesses, including a general store, a blacksmith shop, a sawmill, and a gristmill. The town also had a post office, a bank, and a hotel. In the 1920s, the town was connected to the rest of the state by the Tennessee Central Railway.
Geography
Pelham is located in the southeastern part of Tennessee, in Grundy County. It is situated in the foothills of the Cumberland Plateau, and is surrounded by the Sequatchie Valley. The town is located about 25 miles from Chattanooga, and is about 90 miles from Nashville.
The town is situated at an elevation of 1,000 feet above sea level, and has a total area of 1.2 square miles. The town is located in a humid subtropical climate zone, and has hot, humid summers and mild winters.
Economy
The economy of Pelham is largely based on agriculture. The town is home to several farms, and the main crops grown are corn, wheat, and cotton. The town also has several small businesses, including a general store, a blacksmith shop, and a sawmill.
The town is also home to several manufacturing companies, including a furniture factory and a paper mill. The town is also home to several restaurants, and there are several tourist attractions in the area, including a golf course and a state park.
Demographics
As of the 2010 census, the population of Pelham was 1,000 people. The racial makeup of the town was 97.2% White, 0.7% African American, 0.3% Native American, 0.2% Asian, and 1.6% from other races. The median household income was $31,250, and the median family income was $37,500.
The town is home to several churches, including the First Baptist Church, the Church of God, and the Church of Jesus Christ of Latter-day Saints. The town also has a public library, and a community center.
Conclusion
Pelham, Tennessee is a small town located in Grundy County, in the southeastern part of the state. It is situated in the foothills of the Cumberland Plateau, and is surrounded by the Sequatchie Valley. The town has a population of approximately 1,000 people, and is part of the Chattanooga metropolitan area. The economy of the town is largely based on agriculture, and the town is also home to several small businesses and manufacturing companies. The town is home to several churches, and has a public library and a community center.
Common Questions
What is Per Capita Income in Pelham?
Per Capita income in Pelham is $34,817.
What is the Median Family Income in Pelham?
Median Family Income in Pelham is $167,736.
What is Income or Wage Gap in Pelham?
Income or Wage Gap in Pelham is 73.0%.
Women in Pelham earn 27.0 cents for every dollar earned by a man.
What is Inequality or Gini Index in Pelham?
Inequality or Gini Index in Pelham is 0.41.
What is the Total Population of Pelham?
Total Population of Pelham is 419.
What is the Total Male Population of Pelham?
Total Male Population of Pelham is 177.
What is the Total Female Population of Pelham?
Total Female Population of Pelham is 242.
What is the Ratio of Males per 100 Females in Pelham?
There are 73.14 Males per 100 Females in Pelham.
What is the Ratio of Females per 100 Males in Pelham?
There are 136.72 Females per 100 Males in Pelham.
What is the Median Population Age in Pelham?
Median Population Age in Pelham is 37.4 Years.
What is the Average Family Size in Pelham
Average Family Size in Pelham is 3.9 People.
What is the Average Household Size in Pelham
Average Household Size in Pelham is 3.1 People.
How Large is the Labor Force in Pelham?
There are 224 People in the Labor Forcein in Pelham.
What is the Percentage of People in the Labor Force in Pelham?
68.9% of People are in the Labor Force in Pelham.