Oliver Springs, TN Map & Demographics
Oliver Springs Map
Oliver Springs Overview
$23,477
PER CAPITA INCOME
$55,556
AVG FAMILY INCOME
$47,690
AVG HOUSEHOLD INCOME
39.8%
WAGE / INCOME GAP [ % ]
60.2¢/ $1
WAGE / INCOME GAP [ $ ]
0.44
INEQUALITY / GINI INDEX
3,727
TOTAL POPULATION
1,946
MALE POPULATION
1,781
FEMALE POPULATION
109.26
MALES / 100 FEMALES
91.52
FEMALES / 100 MALES
45.2
MEDIAN AGE
3.1
AVG FAMILY SIZE
2.4
AVG HOUSEHOLD SIZE
1,219
LABOR FORCE [ PEOPLE ]
41.3%
PERCENT IN LABOR FORCE
6.1%
UNEMPLOYMENT RATE
Oliver Springs Zip Codes
Income in Oliver Springs
Income Overview in Oliver Springs
Per Capita Income in Oliver Springs is $23,477, while median incomes of families and households are $55,556 and $47,690 respectively.
| Characteristic | Number | Measure |
| Per Capita Income | 3,727 | $23,477 |
| Median Family Income | 934 | $55,556 |
| Mean Family Income | 934 | $60,740 |
| Median Household Income | 1,525 | $47,690 |
| Mean Household Income | 1,525 | $55,655 |
| Income Deficit | 934 | $0 |
| Wage / Income Gap (%) | 3,727 | 39.79% |
| Wage / Income Gap ($) | 3,727 | 60.21¢ per $1 |
| Gini / Inequality Index | 3,727 | 0.44 |
Earnings by Sex in Oliver Springs
Average Earnings in Oliver Springs are $33,561, $45,833 for men and $27,594 for women, a difference of 39.8%.
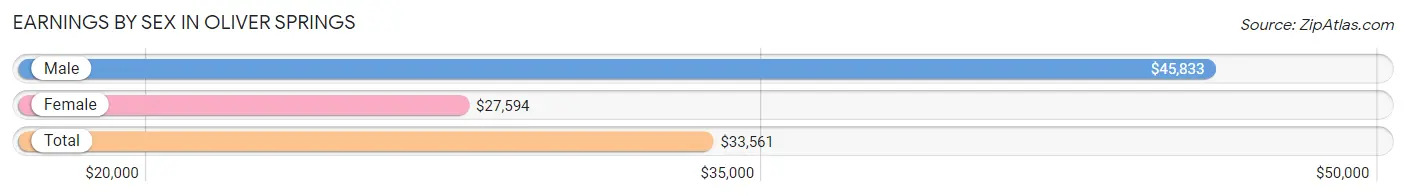
| Sex | Number | Average Earnings |
| Male | 706 (57.1%) | $45,833 |
| Female | 530 (42.9%) | $27,594 |
| Total | 1,236 (100.0%) | $33,561 |
Earnings by Sex by Income Bracket in Oliver Springs
The most common earnings brackets in Oliver Springs are $55,000 to $64,999 for men (171 | 24.2%) and $30,000 to $34,999 for women (61 | 11.5%).
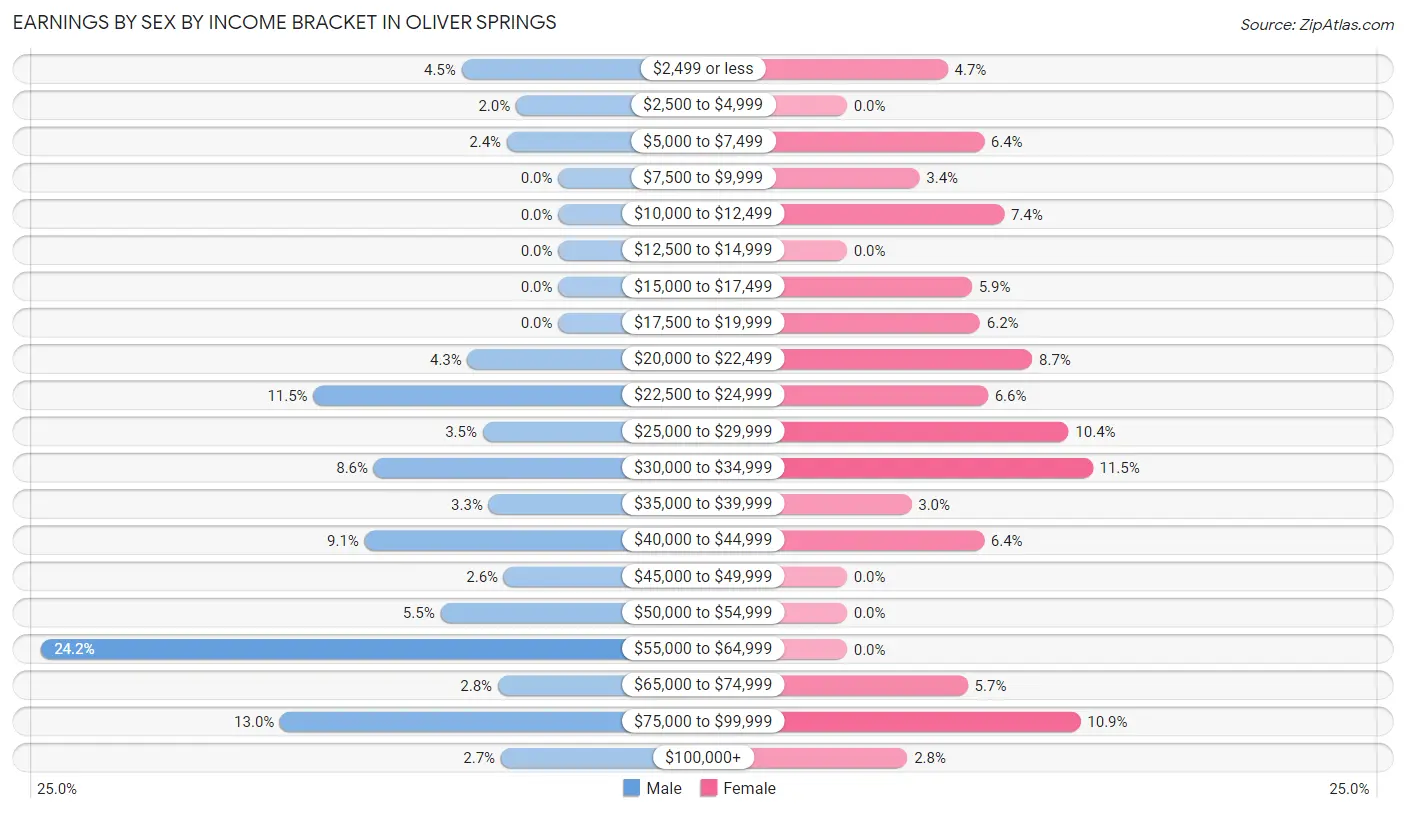
| Income | Male | Female |
| $2,499 or less | 32 (4.5%) | 25 (4.7%) |
| $2,500 to $4,999 | 14 (2.0%) | 0 (0.0%) |
| $5,000 to $7,499 | 17 (2.4%) | 34 (6.4%) |
| $7,500 to $9,999 | 0 (0.0%) | 18 (3.4%) |
| $10,000 to $12,499 | 0 (0.0%) | 39 (7.4%) |
| $12,500 to $14,999 | 0 (0.0%) | 0 (0.0%) |
| $15,000 to $17,499 | 0 (0.0%) | 31 (5.9%) |
| $17,500 to $19,999 | 0 (0.0%) | 33 (6.2%) |
| $20,000 to $22,499 | 30 (4.3%) | 46 (8.7%) |
| $22,500 to $24,999 | 81 (11.5%) | 35 (6.6%) |
| $25,000 to $29,999 | 25 (3.5%) | 55 (10.4%) |
| $30,000 to $34,999 | 61 (8.6%) | 61 (11.5%) |
| $35,000 to $39,999 | 23 (3.3%) | 16 (3.0%) |
| $40,000 to $44,999 | 64 (9.1%) | 34 (6.4%) |
| $45,000 to $49,999 | 18 (2.5%) | 0 (0.0%) |
| $50,000 to $54,999 | 39 (5.5%) | 0 (0.0%) |
| $55,000 to $64,999 | 171 (24.2%) | 0 (0.0%) |
| $65,000 to $74,999 | 20 (2.8%) | 30 (5.7%) |
| $75,000 to $99,999 | 92 (13.0%) | 58 (10.9%) |
| $100,000+ | 19 (2.7%) | 15 (2.8%) |
| Total | 706 (100.0%) | 530 (100.0%) |
Earnings by Sex by Educational Attainment in Oliver Springs
Average earnings in Oliver Springs are $47,222 for men and $28,137 for women, a difference of 40.4%. Men with an educational attainment of college or associate's degree enjoy the highest average annual earnings of $76,447, while those with high school diploma education earn the least with $32,012. Women with an educational attainment of college or associate's degree earn the most with the average annual earnings of $24,596, while those with college or associate's degree education have the smallest earnings of $24,596.
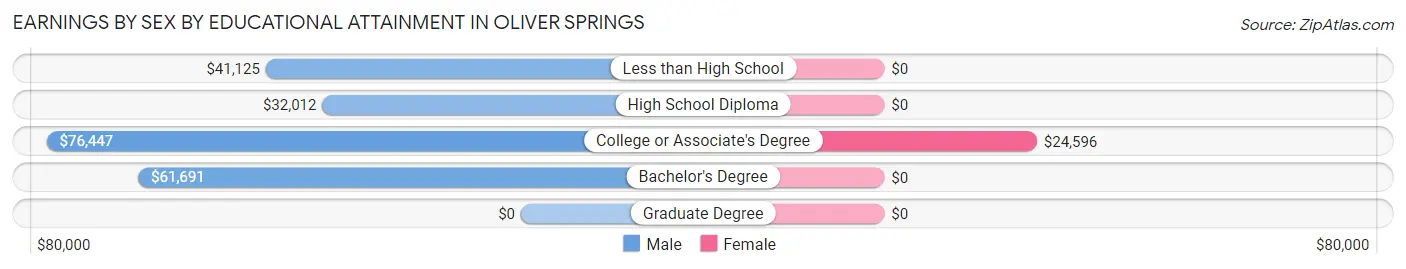
| Educational Attainment | Male Income | Female Income |
| Less than High School | $41,125 | $0 |
| High School Diploma | $32,012 | $0 |
| College or Associate's Degree | $76,447 | $24,596 |
| Bachelor's Degree | $61,691 | $0 |
| Graduate Degree | - | - |
| Total | $47,222 | $28,137 |
Family Income in Oliver Springs
Family Income Brackets in Oliver Springs
According to the Oliver Springs family income data, there are 226 families falling into the $75,000 to $99,999 income range, which is the most common income bracket and makes up 24.2% of all families.
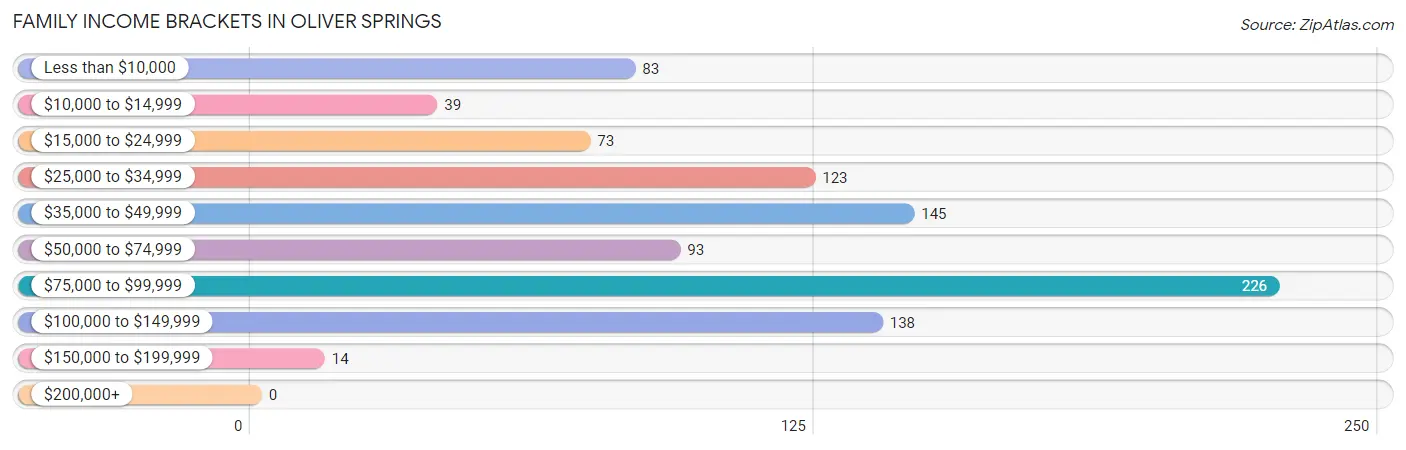
| Income Bracket | # Families | % Families |
| Less than $10,000 | 83 | 8.9% |
| $10,000 to $14,999 | 39 | 4.2% |
| $15,000 to $24,999 | 73 | 7.8% |
| $25,000 to $34,999 | 123 | 13.2% |
| $35,000 to $49,999 | 145 | 15.5% |
| $50,000 to $74,999 | 93 | 10.0% |
| $75,000 to $99,999 | 226 | 24.2% |
| $100,000 to $149,999 | 138 | 14.8% |
| $150,000 to $199,999 | 14 | 1.5% |
| $200,000+ | 0 | 0.0% |
Family Income by Famaliy Size in Oliver Springs
2-person families (391 | 41.9%) account for the highest median family income in Oliver Springs with $63,482 per family, while 2-person families (391 | 41.9%) have the highest median income of $31,741 per family member.
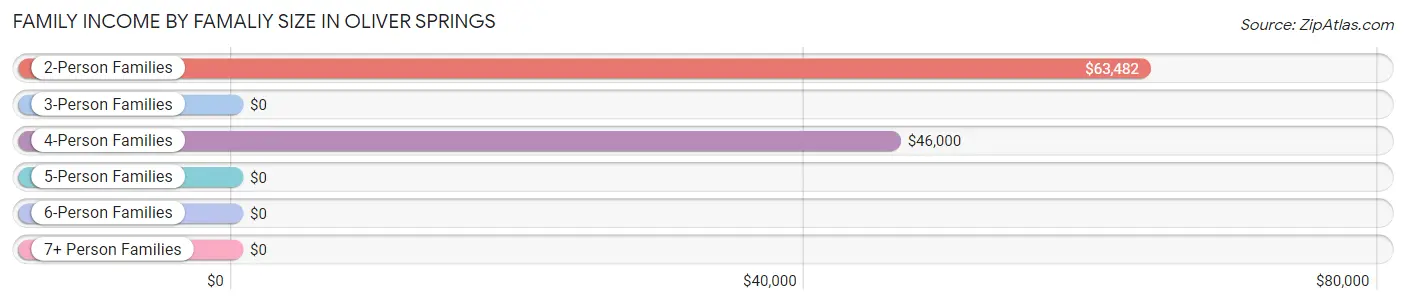
| Income Bracket | # Families | Median Income |
| 2-Person Families | 391 (41.9%) | $63,482 |
| 3-Person Families | 260 (27.8%) | $0 |
| 4-Person Families | 216 (23.1%) | $46,000 |
| 5-Person Families | 44 (4.7%) | $0 |
| 6-Person Families | 0 (0.0%) | $0 |
| 7+ Person Families | 23 (2.5%) | $0 |
| Total | 934 (100.0%) | $55,556 |
Family Income by Number of Earners in Oliver Springs
The median family income in Oliver Springs is $55,556, with families comprising 3+ earners (84) having the highest median family income of $105,326, while families with no earners (336) have the lowest median family income of $43,523, accounting for 9.0% and 36.0% of families, respectively.
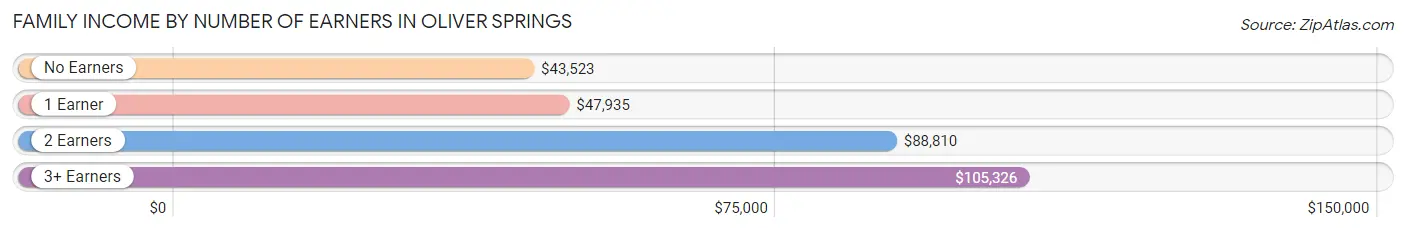
| Number of Earners | # Families | Median Income |
| No Earners | 336 (36.0%) | $43,523 |
| 1 Earner | 428 (45.8%) | $47,935 |
| 2 Earners | 86 (9.2%) | $88,810 |
| 3+ Earners | 84 (9.0%) | $105,326 |
| Total | 934 (100.0%) | $55,556 |
Household Income in Oliver Springs
Household Income Brackets in Oliver Springs
With 328 households falling in the category, the $75,000 to $99,999 income range is the most frequent in Oliver Springs, accounting for 21.5% of all households. In contrast, only 14 households (0.9%) fall into the $150,000 to $199,999 income bracket, making it the least populous group.
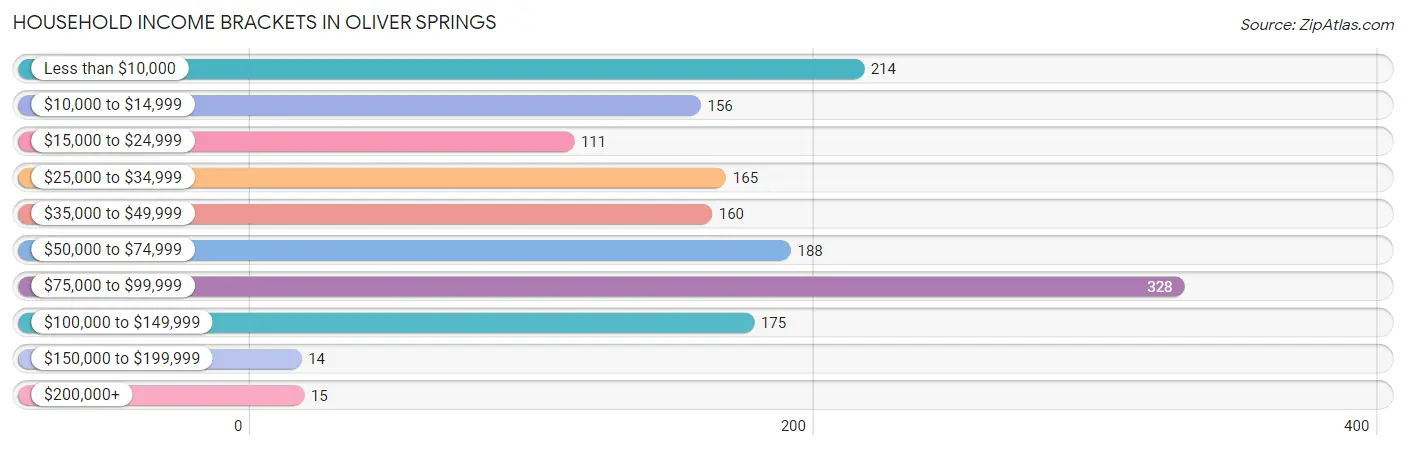
| Income Bracket | # Households | % Households |
| Less than $10,000 | 214 | 14.0% |
| $10,000 to $14,999 | 156 | 10.2% |
| $15,000 to $24,999 | 111 | 7.3% |
| $25,000 to $34,999 | 165 | 10.8% |
| $35,000 to $49,999 | 160 | 10.5% |
| $50,000 to $74,999 | 188 | 12.3% |
| $75,000 to $99,999 | 328 | 21.5% |
| $100,000 to $149,999 | 175 | 11.5% |
| $150,000 to $199,999 | 14 | 0.9% |
| $200,000+ | 15 | 1.0% |
Household Income by Householder Age in Oliver Springs
The median household income in Oliver Springs is $47,690, with the highest median household income of $62,692 found in the 45 to 64 years age bracket for the primary householder. A total of 374 households (24.5%) fall into this category. Meanwhile, the 25 to 44 years age bracket for the primary householder has the lowest median household income of $33,513, with 409 households (26.8%) in this group.
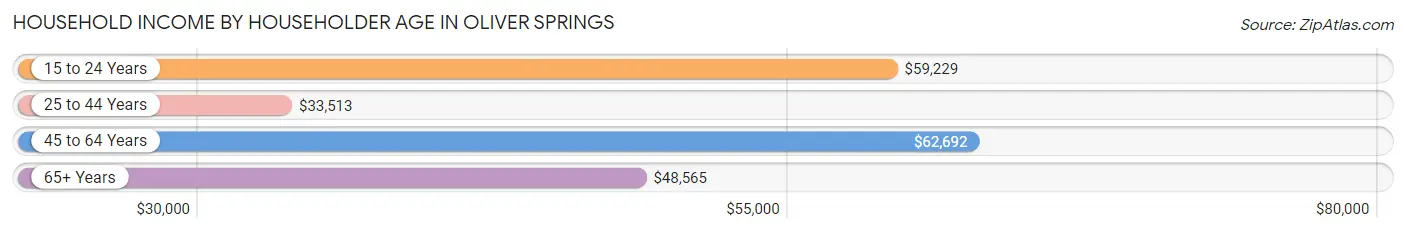
| Income Bracket | # Households | Median Income |
| 15 to 24 Years | 95 (6.2%) | $59,229 |
| 25 to 44 Years | 409 (26.8%) | $33,513 |
| 45 to 64 Years | 374 (24.5%) | $62,692 |
| 65+ Years | 647 (42.4%) | $48,565 |
| Total | 1,525 (100.0%) | $47,690 |
Poverty in Oliver Springs
Income Below Poverty by Sex and Age in Oliver Springs
With 22.7% poverty level for males and 14.9% for females among the residents of Oliver Springs, 6 to 11 year old males and 35 to 44 year old females are the most vulnerable to poverty, with 218 males (62.8%) and 96 females (45.5%) in their respective age groups living below the poverty level.
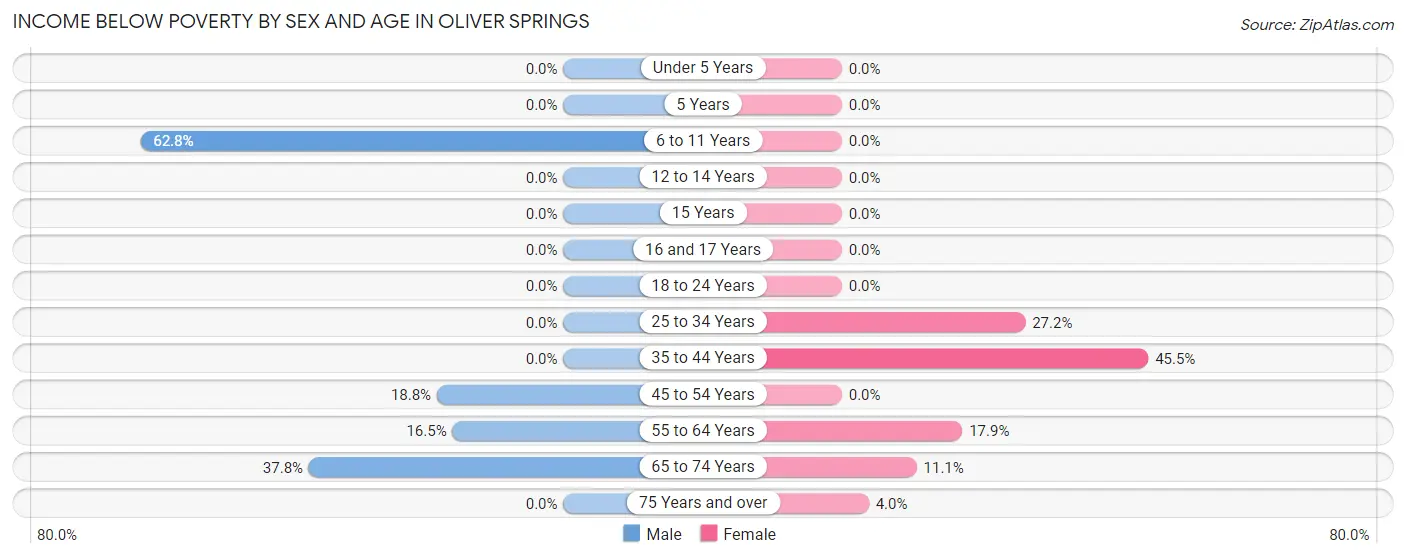
| Age Bracket | Male | Female |
| Under 5 Years | 0 (0.0%) | 0 (0.0%) |
| 5 Years | 0 (0.0%) | 0 (0.0%) |
| 6 to 11 Years | 218 (62.8%) | 0 (0.0%) |
| 12 to 14 Years | 0 (0.0%) | 0 (0.0%) |
| 15 Years | 0 (0.0%) | 0 (0.0%) |
| 16 and 17 Years | 0 (0.0%) | 0 (0.0%) |
| 18 to 24 Years | 0 (0.0%) | 0 (0.0%) |
| 25 to 34 Years | 0 (0.0%) | 76 (27.2%) |
| 35 to 44 Years | 0 (0.0%) | 96 (45.5%) |
| 45 to 54 Years | 52 (18.8%) | 0 (0.0%) |
| 55 to 64 Years | 39 (16.5%) | 69 (17.9%) |
| 65 to 74 Years | 133 (37.8%) | 14 (11.1%) |
| 75 Years and over | 0 (0.0%) | 10 (4.0%) |
| Total | 442 (22.7%) | 265 (14.9%) |
Income Above Poverty by Sex and Age in Oliver Springs
According to the poverty statistics in Oliver Springs, males aged under 5 years and females aged under 5 years are the age groups that are most secure financially, with 100.0% of males and 100.0% of females in these age groups living above the poverty line.
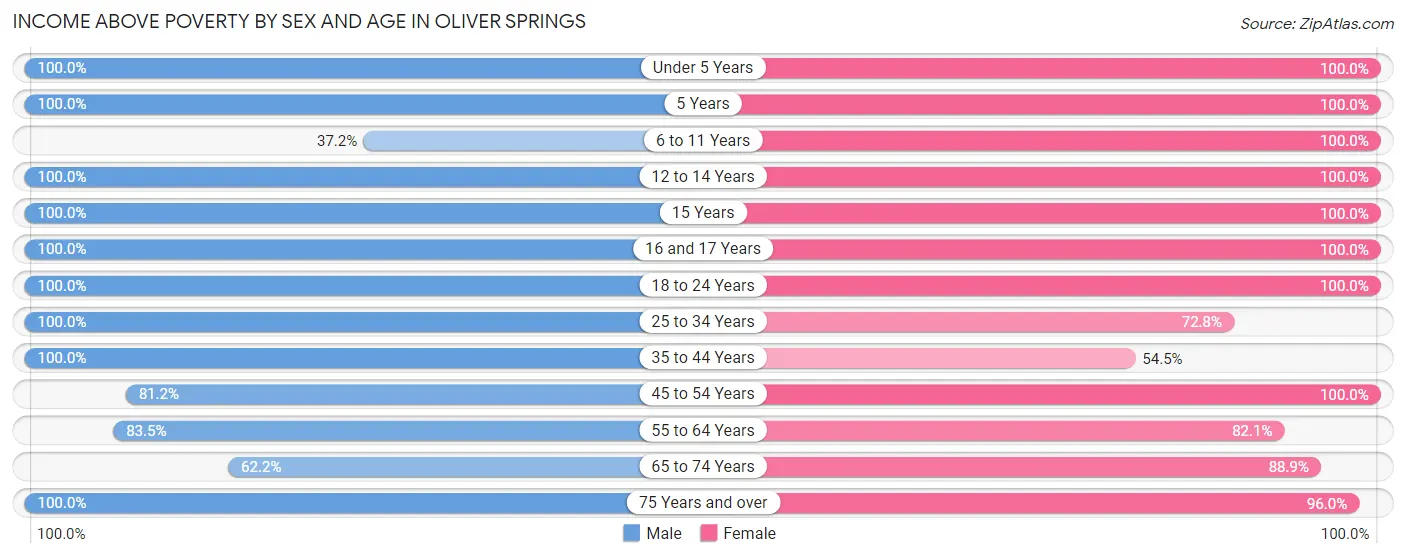
| Age Bracket | Male | Female |
| Under 5 Years | 29 (100.0%) | 25 (100.0%) |
| 5 Years | 15 (100.0%) | 15 (100.0%) |
| 6 to 11 Years | 129 (37.2%) | 83 (100.0%) |
| 12 to 14 Years | 79 (100.0%) | 95 (100.0%) |
| 15 Years | 45 (100.0%) | 43 (100.0%) |
| 16 and 17 Years | 57 (100.0%) | 25 (100.0%) |
| 18 to 24 Years | 82 (100.0%) | 125 (100.0%) |
| 25 to 34 Years | 163 (100.0%) | 203 (72.8%) |
| 35 to 44 Years | 110 (100.0%) | 115 (54.5%) |
| 45 to 54 Years | 225 (81.2%) | 118 (100.0%) |
| 55 to 64 Years | 198 (83.5%) | 317 (82.1%) |
| 65 to 74 Years | 219 (62.2%) | 112 (88.9%) |
| 75 Years and over | 153 (100.0%) | 240 (96.0%) |
| Total | 1,504 (77.3%) | 1,516 (85.1%) |
Income Below Poverty Among Married-Couple Families in Oliver Springs
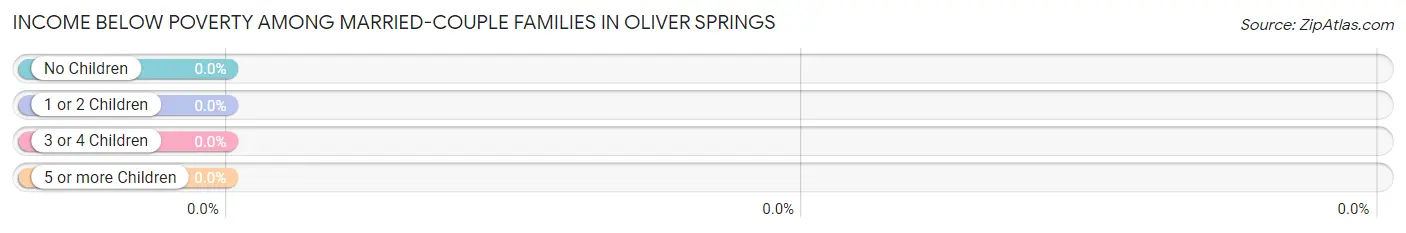
| Children | Above Poverty | Below Poverty |
| No Children | 387 (100.0%) | 0 (0.0%) |
| 1 or 2 Children | 234 (100.0%) | 0 (0.0%) |
| 3 or 4 Children | 23 (100.0%) | 0 (0.0%) |
| 5 or more Children | 0 (0.0%) | 0 (0.0%) |
| Total | 644 (100.0%) | 0 (0.0%) |
Income Below Poverty Among Single-Parent Households in Oliver Springs
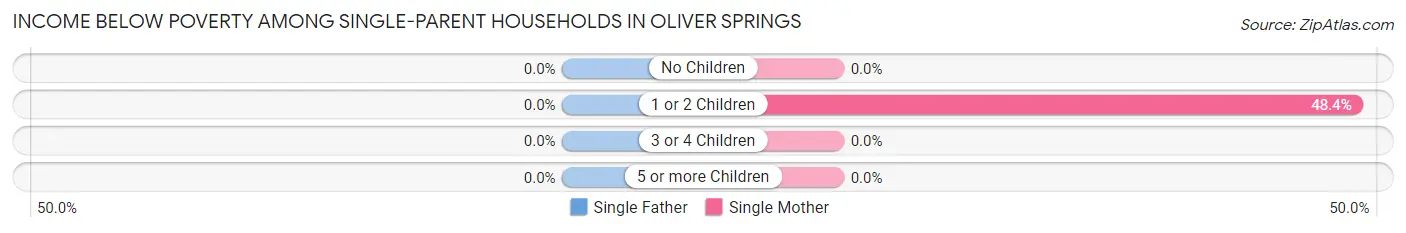
| Children | Single Father | Single Mother |
| No Children | 0 (0.0%) | 0 (0.0%) |
| 1 or 2 Children | 0 (0.0%) | 122 (48.4%) |
| 3 or 4 Children | 0 (0.0%) | 0 (0.0%) |
| 5 or more Children | 0 (0.0%) | 0 (0.0%) |
| Total | 0 (0.0%) | 122 (42.1%) |
Income Below Poverty Among Married-Couple vs Single-Parent Households in Oliver Springs
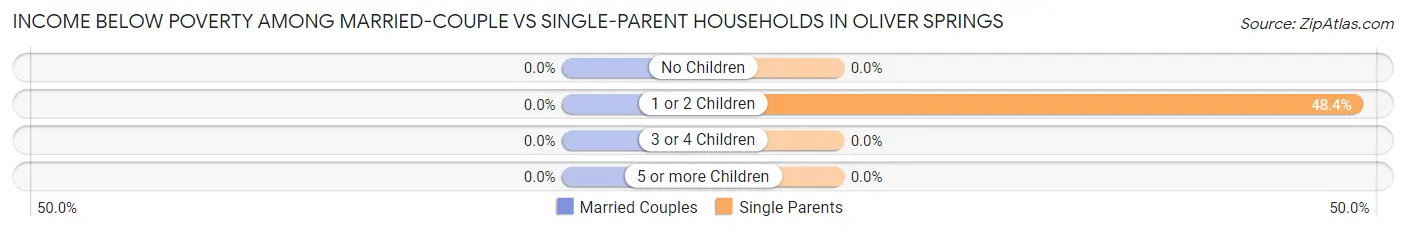
| Children | Married-Couple Families | Single-Parent Households |
| No Children | 0 (0.0%) | 0 (0.0%) |
| 1 or 2 Children | 0 (0.0%) | 122 (48.4%) |
| 3 or 4 Children | 0 (0.0%) | 0 (0.0%) |
| 5 or more Children | 0 (0.0%) | 0 (0.0%) |
| Total | 0 (0.0%) | 122 (42.1%) |
Race in Oliver Springs
The most populous races in Oliver Springs are White / Caucasian (3,516 | 94.3%), Some other Race (108 | 2.9%), and Two or more Races (103 | 2.8%).
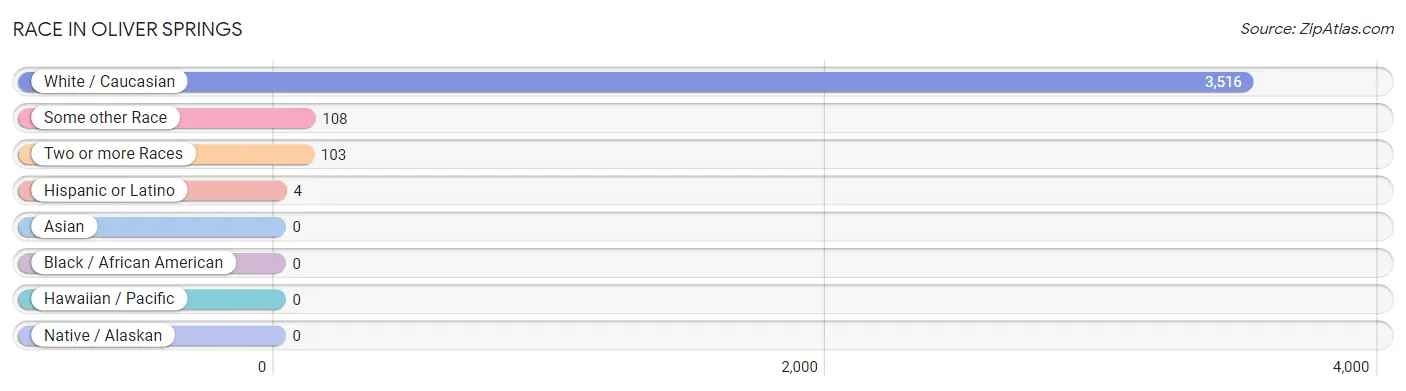
| Race | # Population | % Population |
| Asian | 0 | 0.0% |
| Black / African American | 0 | 0.0% |
| Hawaiian / Pacific | 0 | 0.0% |
| Hispanic or Latino | 4 | 0.1% |
| Native / Alaskan | 0 | 0.0% |
| White / Caucasian | 3,516 | 94.3% |
| Two or more Races | 103 | 2.8% |
| Some other Race | 108 | 2.9% |
| Total | 3,727 | 100.0% |
Ancestry in Oliver Springs
The most populous ancestries reported in Oliver Springs are American (646 | 17.3%), Irish (379 | 10.2%), European (249 | 6.7%), German (229 | 6.1%), and English (182 | 4.9%), together accounting for 45.2% of all Oliver Springs residents.
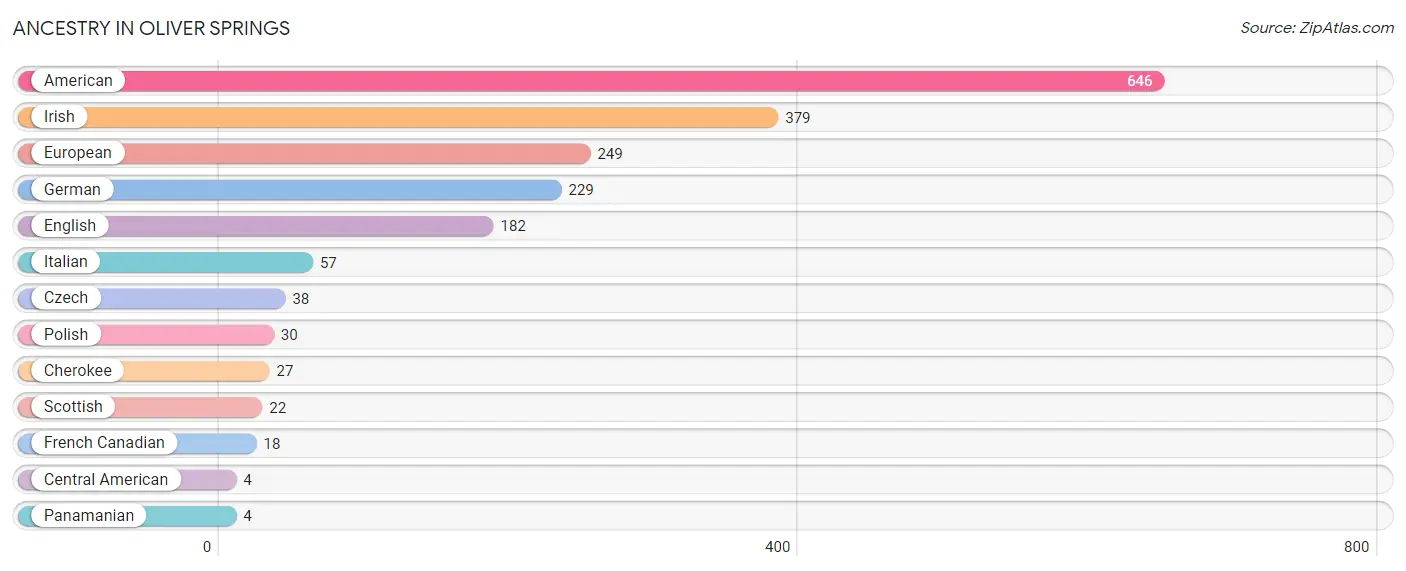
| Ancestry | # Population | % Population |
| American | 646 | 17.3% |
| Central American | 4 | 0.1% |
| Cherokee | 27 | 0.7% |
| Czech | 38 | 1.0% |
| English | 182 | 4.9% |
| European | 249 | 6.7% |
| French Canadian | 18 | 0.5% |
| German | 229 | 6.1% |
| Irish | 379 | 10.2% |
| Italian | 57 | 1.5% |
| Panamanian | 4 | 0.1% |
| Polish | 30 | 0.8% |
| Scottish | 22 | 0.6% | View All 13 Rows |
Immigrants in Oliver Springs
The most numerous immigrant groups reported in Oliver Springs came from Central America (1 | 0.0%), Latin America (1 | 0.0%), and Panama (1 | 0.0%), together accounting for 0.1% of all Oliver Springs residents.
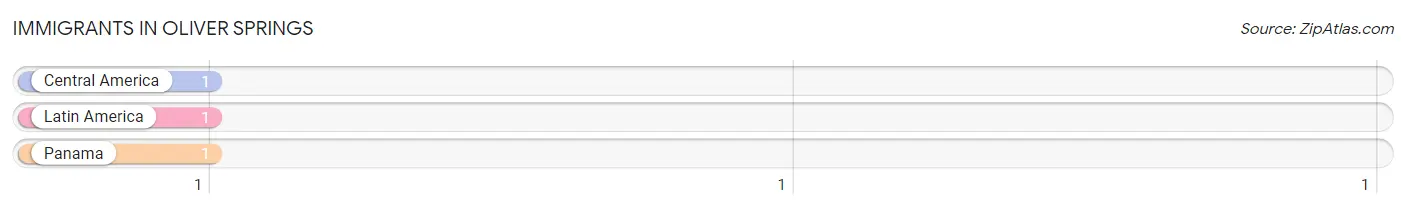
| Immigration Origin | # Population | % Population |
| Central America | 1 | 0.0% |
| Latin America | 1 | 0.0% |
| Panama | 1 | 0.0% | View All 3 Rows |
Sex and Age in Oliver Springs
Sex and Age in Oliver Springs
The most populous age groups in Oliver Springs are 10 to 14 Years (234 | 12.0%) for men and 60 to 64 Years (257 | 14.4%) for women.
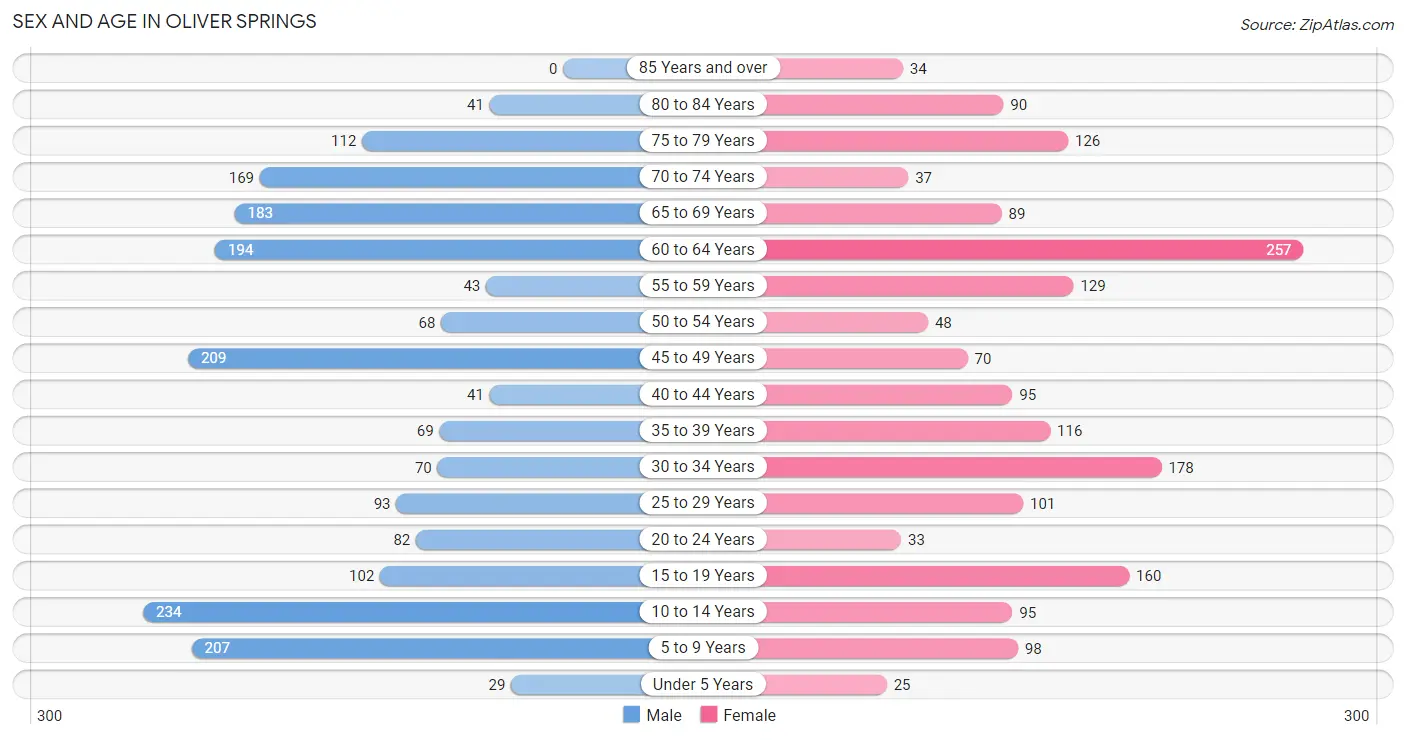
| Age Bracket | Male | Female |
| Under 5 Years | 29 (1.5%) | 25 (1.4%) |
| 5 to 9 Years | 207 (10.6%) | 98 (5.5%) |
| 10 to 14 Years | 234 (12.0%) | 95 (5.3%) |
| 15 to 19 Years | 102 (5.2%) | 160 (9.0%) |
| 20 to 24 Years | 82 (4.2%) | 33 (1.8%) |
| 25 to 29 Years | 93 (4.8%) | 101 (5.7%) |
| 30 to 34 Years | 70 (3.6%) | 178 (10.0%) |
| 35 to 39 Years | 69 (3.5%) | 116 (6.5%) |
| 40 to 44 Years | 41 (2.1%) | 95 (5.3%) |
| 45 to 49 Years | 209 (10.7%) | 70 (3.9%) |
| 50 to 54 Years | 68 (3.5%) | 48 (2.7%) |
| 55 to 59 Years | 43 (2.2%) | 129 (7.2%) |
| 60 to 64 Years | 194 (10.0%) | 257 (14.4%) |
| 65 to 69 Years | 183 (9.4%) | 89 (5.0%) |
| 70 to 74 Years | 169 (8.7%) | 37 (2.1%) |
| 75 to 79 Years | 112 (5.8%) | 126 (7.1%) |
| 80 to 84 Years | 41 (2.1%) | 90 (5.1%) |
| 85 Years and over | 0 (0.0%) | 34 (1.9%) |
| Total | 1,946 (100.0%) | 1,781 (100.0%) |
Families and Households in Oliver Springs
Median Family Size in Oliver Springs
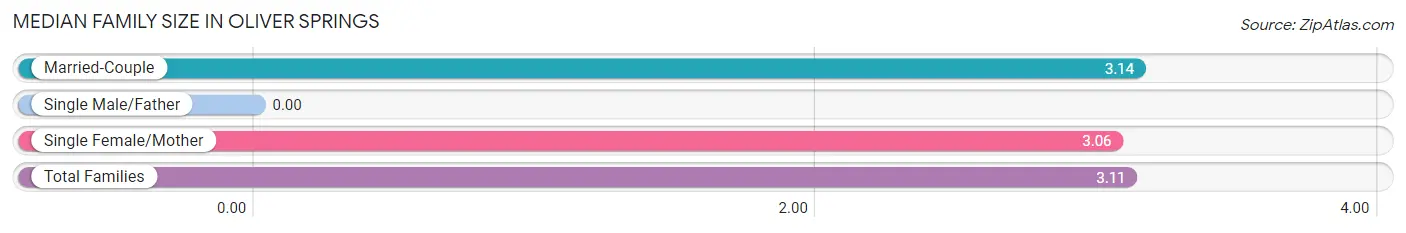
| Family Type | # Families | Family Size |
| Married-Couple | 644 (69.0%) | 3.14 |
| Single Male/Father | 0 (0.0%) | - |
| Single Female/Mother | 290 (31.0%) | 3.06 |
| Total Families | 934 (100.0%) | 3.11 |
Median Household Size in Oliver Springs
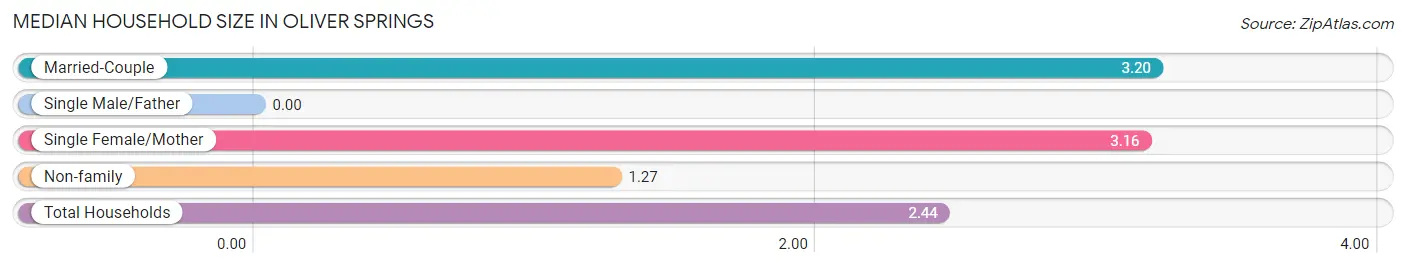
| Household Type | # Households | Household Size |
| Married-Couple | 644 (42.2%) | 3.20 |
| Single Male/Father | 0 (0.0%) | - |
| Single Female/Mother | 290 (19.0%) | 3.16 |
| Non-family | 591 (38.8%) | 1.27 |
| Total Households | 1,525 (100.0%) | 2.44 |
Household Size by Marriage Status in Oliver Springs
Out of a total of 1,525 households in Oliver Springs, 934 (61.3%) are family households, while 591 (38.8%) are nonfamily households. The most numerous type of family households are 2-person households, comprising 365, and the most common type of nonfamily households are 1-person households, comprising 435.
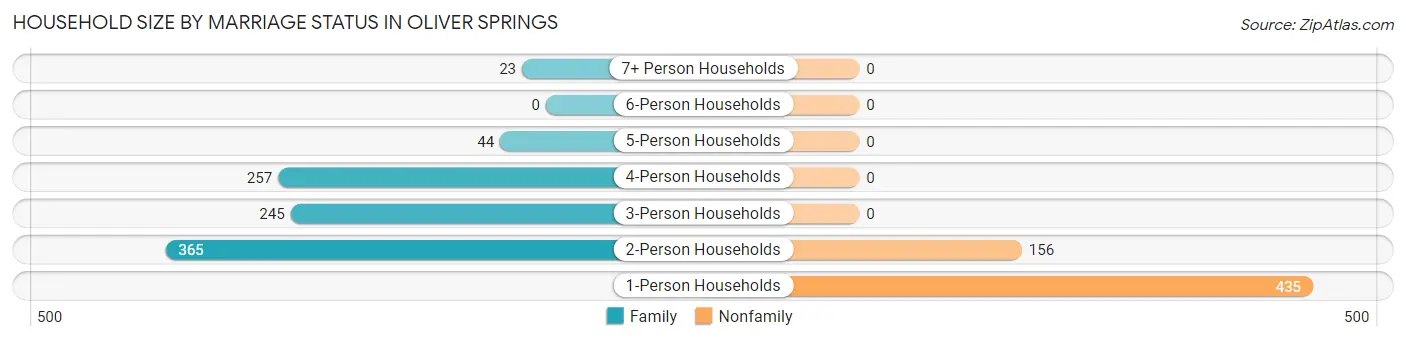
| Household Size | Family Households | Nonfamily Households |
| 1-Person Households | - | 435 (28.5%) |
| 2-Person Households | 365 (23.9%) | 156 (10.2%) |
| 3-Person Households | 245 (16.1%) | 0 (0.0%) |
| 4-Person Households | 257 (16.9%) | 0 (0.0%) |
| 5-Person Households | 44 (2.9%) | 0 (0.0%) |
| 6-Person Households | 0 (0.0%) | 0 (0.0%) |
| 7+ Person Households | 23 (1.5%) | 0 (0.0%) |
| Total | 934 (61.3%) | 591 (38.8%) |
Female Fertility in Oliver Springs
Fertility by Age in Oliver Springs
Average fertility rate in Oliver Springs is 20.0 births per 1,000 women. Women in the age bracket of 20 to 34 years have the highest fertility rate with 48.0 births per 1,000 women. Women in the age bracket of 20 to 34 years acount for 100.0% of all women with births.
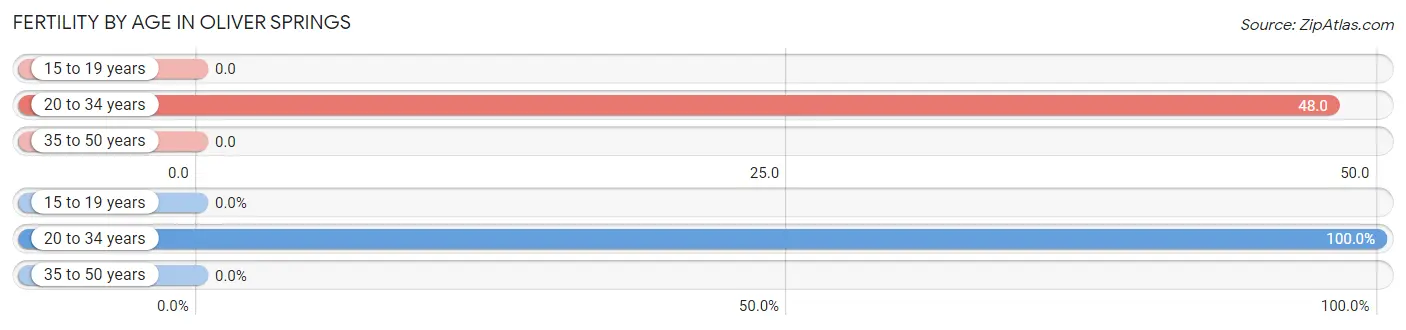
| Age Bracket | Women with Births | Births / 1,000 Women |
| 15 to 19 years | 0 (0.0%) | 0.0 |
| 20 to 34 years | 15 (100.0%) | 48.0 |
| 35 to 50 years | 0 (0.0%) | 0.0 |
| Total | 15 (100.0%) | 20.0 |
Fertility by Age by Marriage Status in Oliver Springs
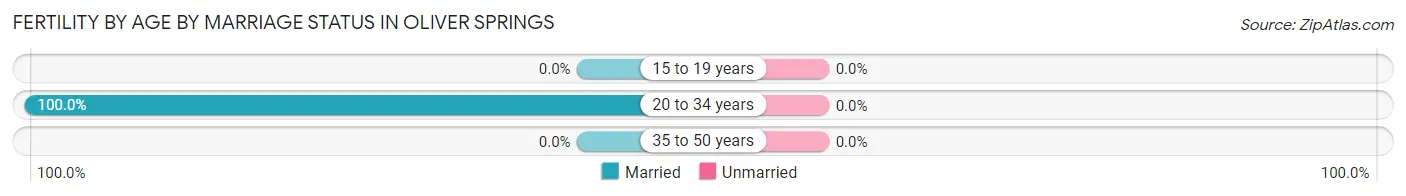
| Age Bracket | Married | Unmarried |
| 15 to 19 years | 0 (0.0%) | 0 (0.0%) |
| 20 to 34 years | 15 (100.0%) | 0 (0.0%) |
| 35 to 50 years | 0 (0.0%) | 0 (0.0%) |
| Total | 15 (100.0%) | 0 (0.0%) |
Fertility by Education in Oliver Springs
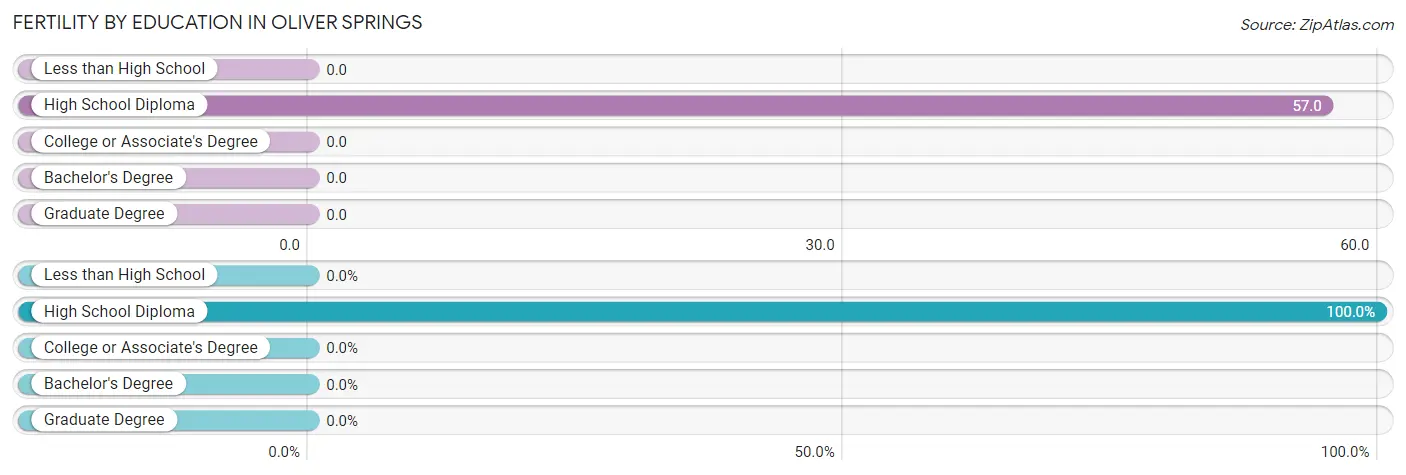
| Educational Attainment | Women with Births | Births / 1,000 Women |
| Less than High School | 0 (0.0%) | 0.0 |
| High School Diploma | 15 (100.0%) | 57.0 |
| College or Associate's Degree | 0 (0.0%) | 0.0 |
| Bachelor's Degree | 0 (0.0%) | 0.0 |
| Graduate Degree | 0 (0.0%) | 0.0 |
| Total | 15 (100.0%) | 20.0 |
Fertility by Education by Marriage Status in Oliver Springs
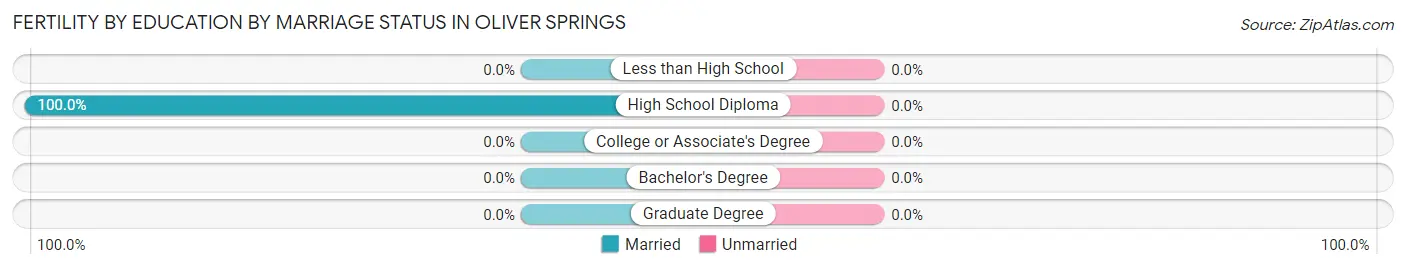
| Educational Attainment | Married | Unmarried |
| Less than High School | 0 (0.0%) | 0 (0.0%) |
| High School Diploma | 15 (100.0%) | 0 (0.0%) |
| College or Associate's Degree | 0 (0.0%) | 0 (0.0%) |
| Bachelor's Degree | 0 (0.0%) | 0 (0.0%) |
| Graduate Degree | 0 (0.0%) | 0 (0.0%) |
| Total | 15 (100.0%) | 0 (0.0%) |
Employment Characteristics in Oliver Springs
Employment by Class of Employer in Oliver Springs
Among the 1,087 employed individuals in Oliver Springs, private company employees (694 | 63.8%), self-employed (not incorporated) (179 | 16.5%), and not-for-profit organizations (67 | 6.2%) make up the most common classes of employment.
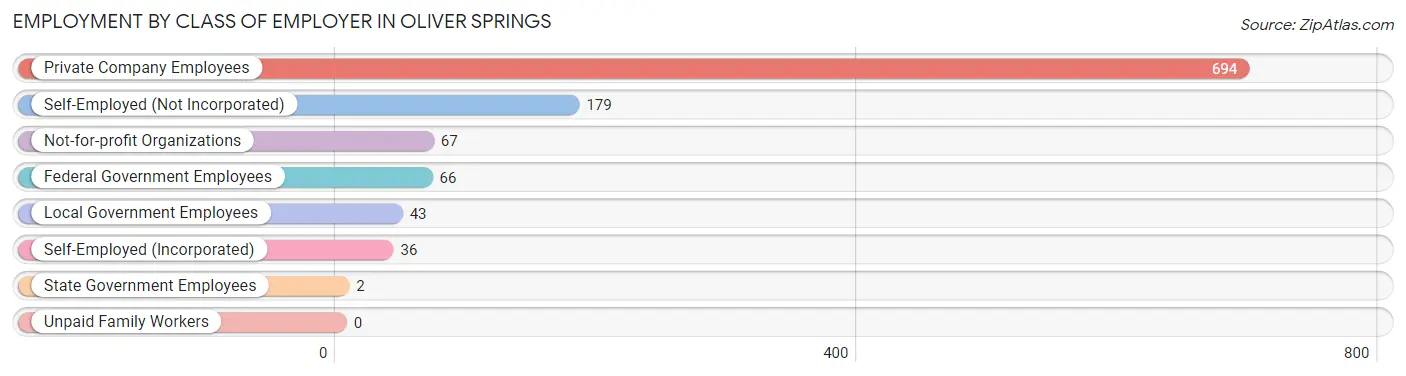
| Employer Class | # Employees | % Employees |
| Private Company Employees | 694 | 63.8% |
| Self-Employed (Incorporated) | 36 | 3.3% |
| Self-Employed (Not Incorporated) | 179 | 16.5% |
| Not-for-profit Organizations | 67 | 6.2% |
| Local Government Employees | 43 | 4.0% |
| State Government Employees | 2 | 0.2% |
| Federal Government Employees | 66 | 6.1% |
| Unpaid Family Workers | 0 | 0.0% |
| Total | 1,087 | 100.0% |
Employment Status by Age in Oliver Springs
According to the labor force statistics for Oliver Springs, out of the total population over 16 years of age (2,951), 41.3% or 1,219 individuals are in the labor force, with 6.1% or 74 of them unemployed. The age group with the highest labor force participation rate is 20 to 24 years, with 100.0% or 115 individuals in the labor force. Within the labor force, the 25 to 29 years age range has the highest percentage of unemployed individuals, with 19.1% or 37 of them being unemployed.
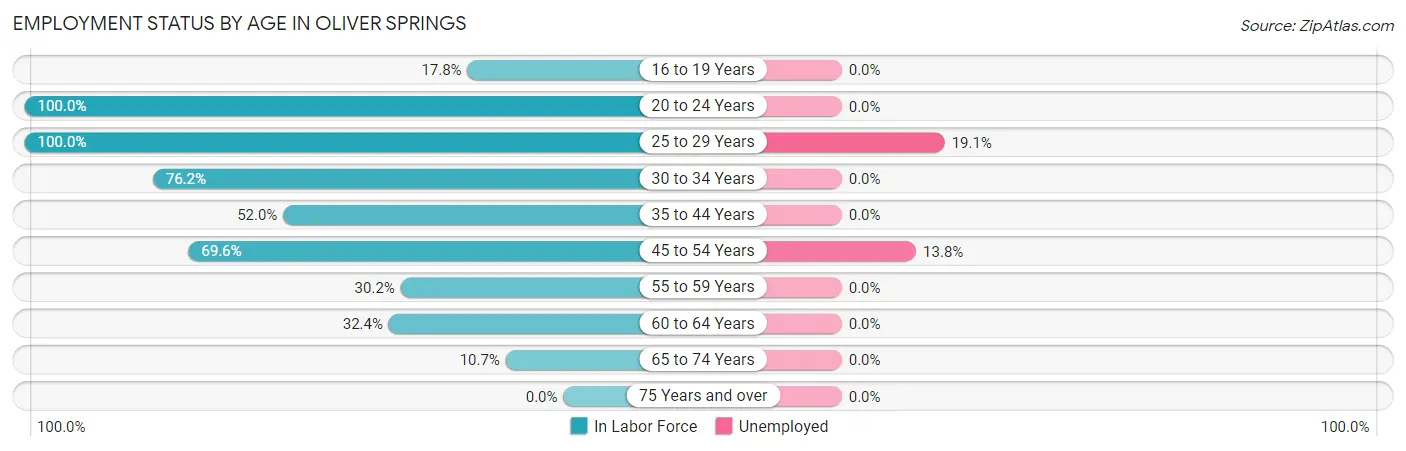
| Age Bracket | In Labor Force | Unemployed |
| 16 to 19 Years | 31 (17.8%) | 0 (0.0%) |
| 20 to 24 Years | 115 (100.0%) | 0 (0.0%) |
| 25 to 29 Years | 194 (100.0%) | 37 (19.1%) |
| 30 to 34 Years | 189 (76.2%) | 0 (0.0%) |
| 35 to 44 Years | 167 (52.0%) | 0 (0.0%) |
| 45 to 54 Years | 275 (69.6%) | 38 (13.8%) |
| 55 to 59 Years | 52 (30.2%) | 0 (0.0%) |
| 60 to 64 Years | 146 (32.4%) | 0 (0.0%) |
| 65 to 74 Years | 51 (10.7%) | 0 (0.0%) |
| 75 Years and over | 0 (0.0%) | 0 (0.0%) |
| Total | 1,219 (41.3%) | 74 (6.1%) |
Employment Status by Educational Attainment in Oliver Springs
According to labor force statistics for Oliver Springs, 57.4% of individuals (1,022) out of the total population between 25 and 64 years of age (1,781) are in the labor force, with 7.3% or 75 of them being unemployed. The group with the highest labor force participation rate are those with the educational attainment of less than high school, with 78.4% or 131 individuals in the labor force. Within the labor force, individuals with high school diploma education have the highest percentage of unemployment, with 9.2% or 37 of them being unemployed.
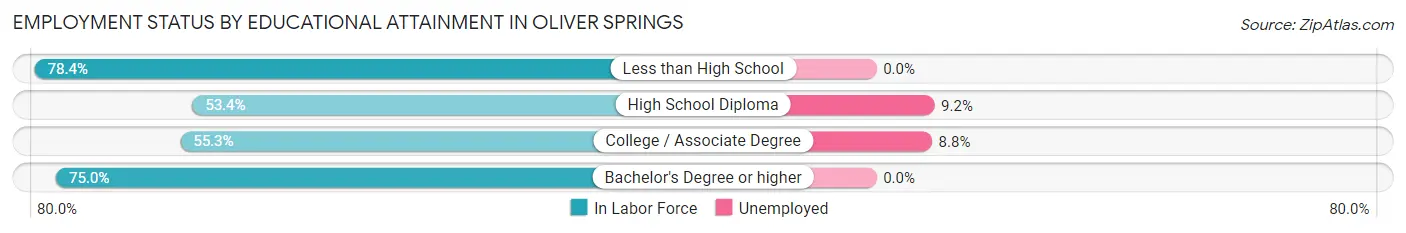
| Educational Attainment | In Labor Force | Unemployed |
| Less than High School | 131 (78.4%) | 0 (0.0%) |
| High School Diploma | 404 (53.4%) | 70 (9.2%) |
| College / Associate Degree | 434 (55.3%) | 69 (8.8%) |
| Bachelor's Degree or higher | 54 (75.0%) | 0 (0.0%) |
| Total | 1,022 (57.4%) | 130 (7.3%) |
Employment Occupations by Sex in Oliver Springs
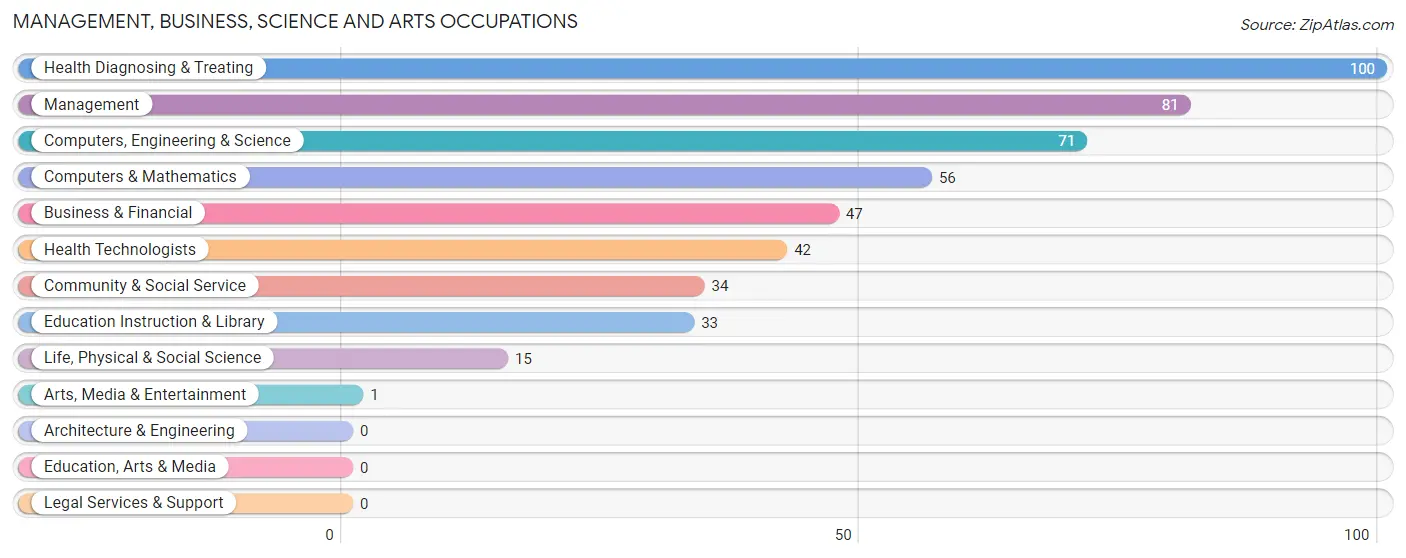
Management, Business, Science and Arts Occupations
The most common Management, Business, Science and Arts occupations in Oliver Springs are Health Diagnosing & Treating (100 | 8.7%), Management (81 | 7.1%), Computers, Engineering & Science (71 | 6.2%), Computers & Mathematics (56 | 4.9%), and Business & Financial (47 | 4.1%).
Management, Business, Science and Arts Occupations by Sex
Within the Management, Business, Science and Arts occupations in Oliver Springs, the most male-oriented occupations are Management (100.0%), Computers & Mathematics (100.0%), and Computers, Engineering & Science (78.9%), while the most female-oriented occupations are Life, Physical & Social Science (100.0%), Community & Social Service (100.0%), and Education Instruction & Library (100.0%).
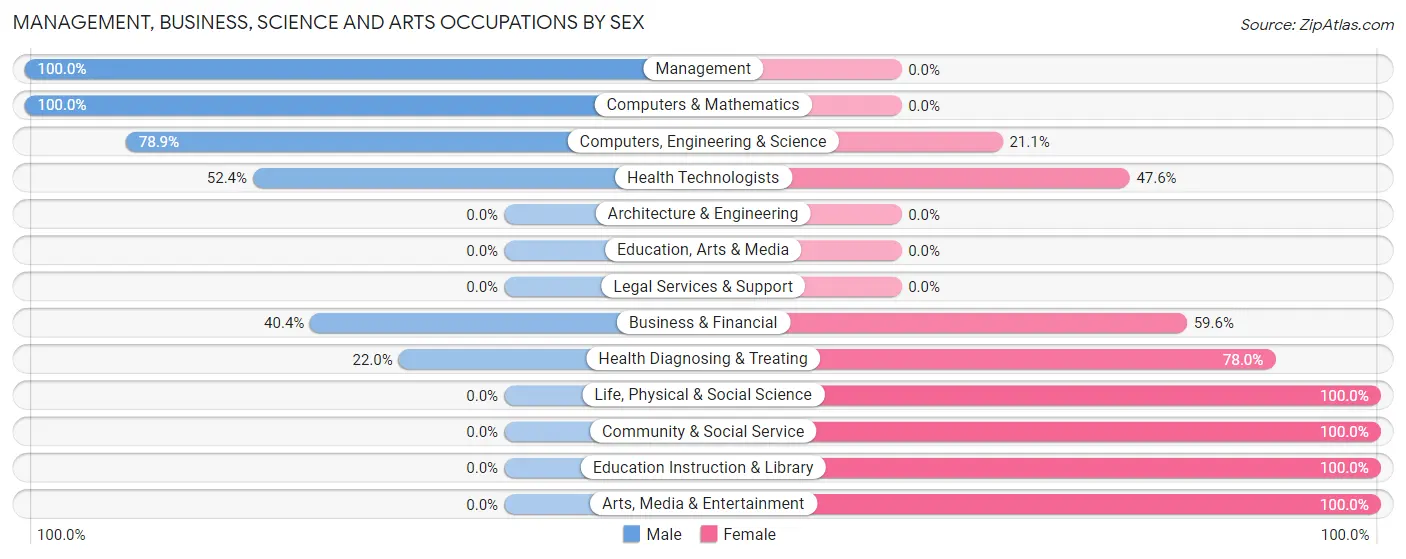
| Occupation | Male | Female |
| Management | 81 (100.0%) | 0 (0.0%) |
| Business & Financial | 19 (40.4%) | 28 (59.6%) |
| Computers, Engineering & Science | 56 (78.9%) | 15 (21.1%) |
| Computers & Mathematics | 56 (100.0%) | 0 (0.0%) |
| Architecture & Engineering | 0 (0.0%) | 0 (0.0%) |
| Life, Physical & Social Science | 0 (0.0%) | 15 (100.0%) |
| Community & Social Service | 0 (0.0%) | 34 (100.0%) |
| Education, Arts & Media | 0 (0.0%) | 0 (0.0%) |
| Legal Services & Support | 0 (0.0%) | 0 (0.0%) |
| Education Instruction & Library | 0 (0.0%) | 33 (100.0%) |
| Arts, Media & Entertainment | 0 (0.0%) | 1 (100.0%) |
| Health Diagnosing & Treating | 22 (22.0%) | 78 (78.0%) |
| Health Technologists | 22 (52.4%) | 20 (47.6%) |
| Total (Category) | 178 (53.4%) | 155 (46.6%) |
| Total (Overall) | 673 (58.8%) | 472 (41.2%) |
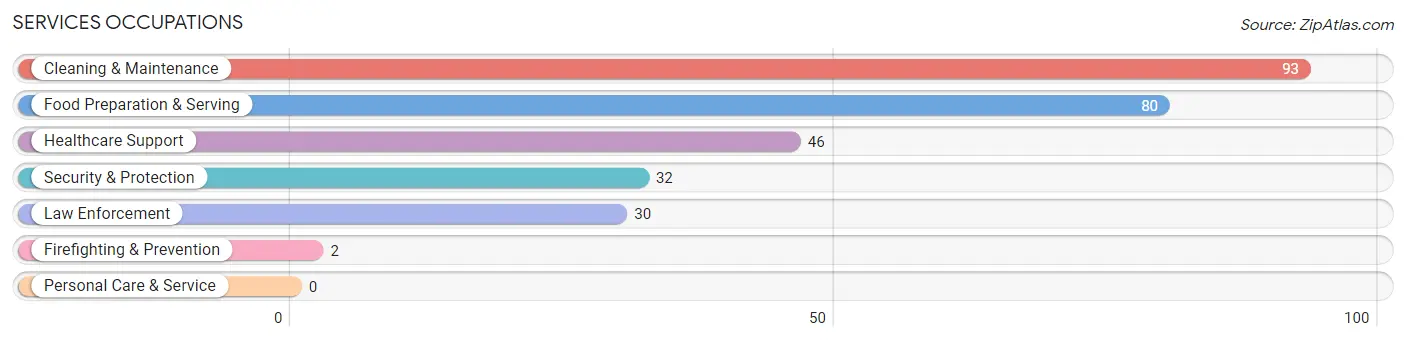
Services Occupations
The most common Services occupations in Oliver Springs are Cleaning & Maintenance (93 | 8.1%), Food Preparation & Serving (80 | 7.0%), Healthcare Support (46 | 4.0%), Security & Protection (32 | 2.8%), and Law Enforcement (30 | 2.6%).
Services Occupations by Sex
Within the Services occupations in Oliver Springs, the most male-oriented occupations are Law Enforcement (100.0%), Security & Protection (93.8%), and Food Preparation & Serving (51.2%), while the most female-oriented occupations are Healthcare Support (100.0%), Firefighting & Prevention (100.0%), and Cleaning & Maintenance (72.0%).
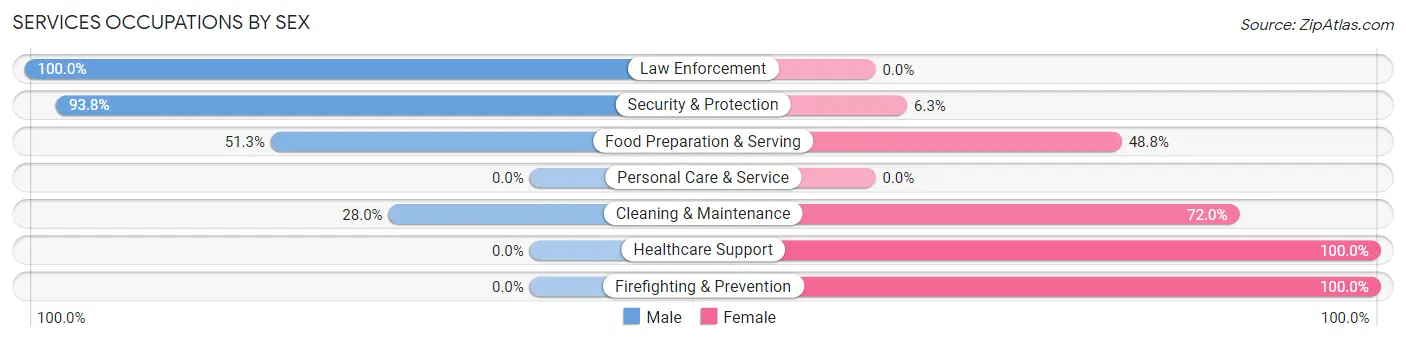
| Occupation | Male | Female |
| Healthcare Support | 0 (0.0%) | 46 (100.0%) |
| Security & Protection | 30 (93.8%) | 2 (6.2%) |
| Firefighting & Prevention | 0 (0.0%) | 2 (100.0%) |
| Law Enforcement | 30 (100.0%) | 0 (0.0%) |
| Food Preparation & Serving | 41 (51.2%) | 39 (48.7%) |
| Cleaning & Maintenance | 26 (28.0%) | 67 (72.0%) |
| Personal Care & Service | 0 (0.0%) | 0 (0.0%) |
| Total (Category) | 97 (38.7%) | 154 (61.4%) |
| Total (Overall) | 673 (58.8%) | 472 (41.2%) |
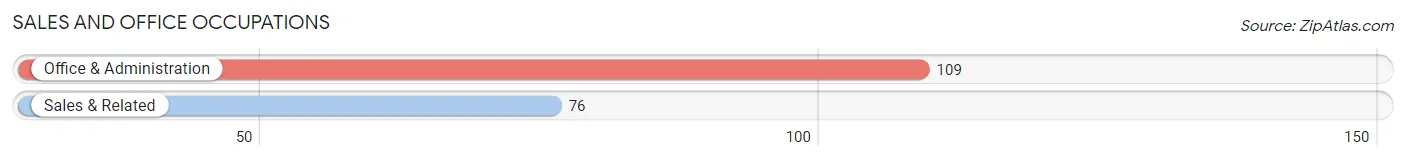
Sales and Office Occupations
The most common Sales and Office occupations in Oliver Springs are Office & Administration (109 | 9.5%), and Sales & Related (76 | 6.6%).
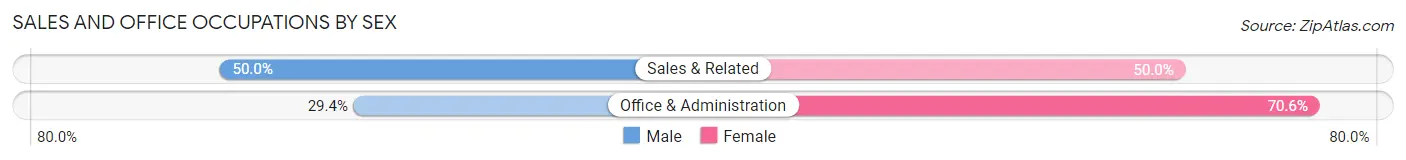
Sales and Office Occupations by Sex
| Occupation | Male | Female |
| Sales & Related | 38 (50.0%) | 38 (50.0%) |
| Office & Administration | 32 (29.4%) | 77 (70.6%) |
| Total (Category) | 70 (37.8%) | 115 (62.2%) |
| Total (Overall) | 673 (58.8%) | 472 (41.2%) |
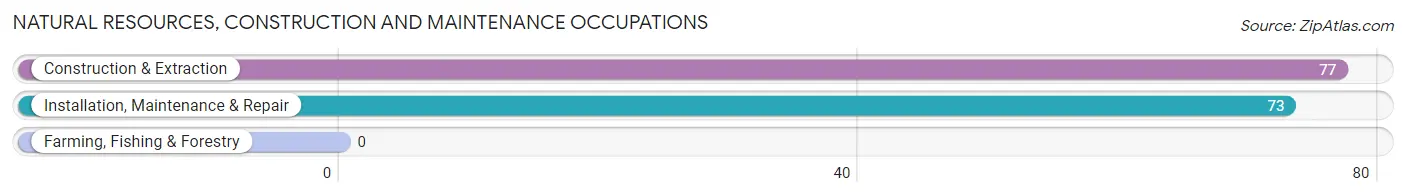
Natural Resources, Construction and Maintenance Occupations
The most common Natural Resources, Construction and Maintenance occupations in Oliver Springs are Construction & Extraction (77 | 6.7%), and Installation, Maintenance & Repair (73 | 6.4%).
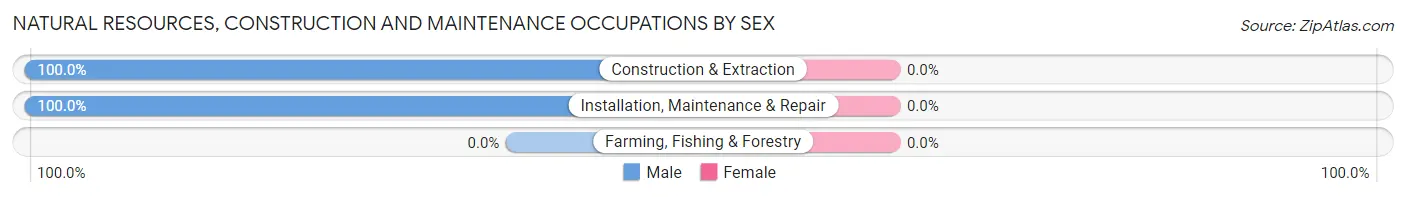
Natural Resources, Construction and Maintenance Occupations by Sex
| Occupation | Male | Female |
| Farming, Fishing & Forestry | 0 (0.0%) | 0 (0.0%) |
| Construction & Extraction | 77 (100.0%) | 0 (0.0%) |
| Installation, Maintenance & Repair | 73 (100.0%) | 0 (0.0%) |
| Total (Category) | 150 (100.0%) | 0 (0.0%) |
| Total (Overall) | 673 (58.8%) | 472 (41.2%) |
Production, Transportation and Moving Occupations
The most common Production, Transportation and Moving occupations in Oliver Springs are Production (116 | 10.1%), Material Moving (72 | 6.3%), and Transportation (38 | 3.3%).
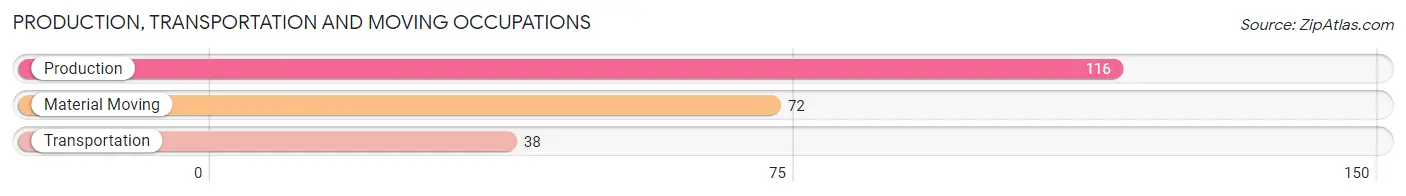
Production, Transportation and Moving Occupations by Sex
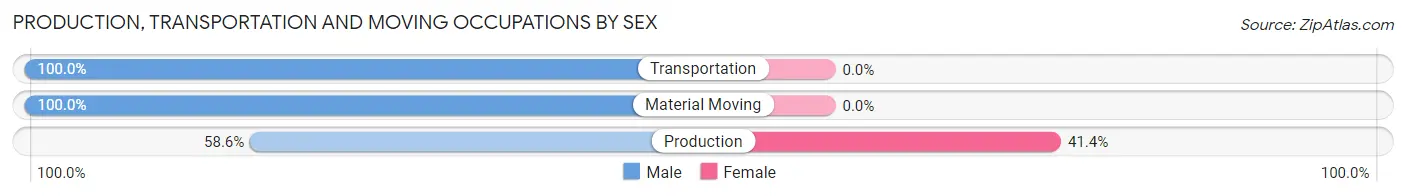
| Occupation | Male | Female |
| Production | 68 (58.6%) | 48 (41.4%) |
| Transportation | 38 (100.0%) | 0 (0.0%) |
| Material Moving | 72 (100.0%) | 0 (0.0%) |
| Total (Category) | 178 (78.8%) | 48 (21.2%) |
| Total (Overall) | 673 (58.8%) | 472 (41.2%) |
Employment Industries by Sex in Oliver Springs
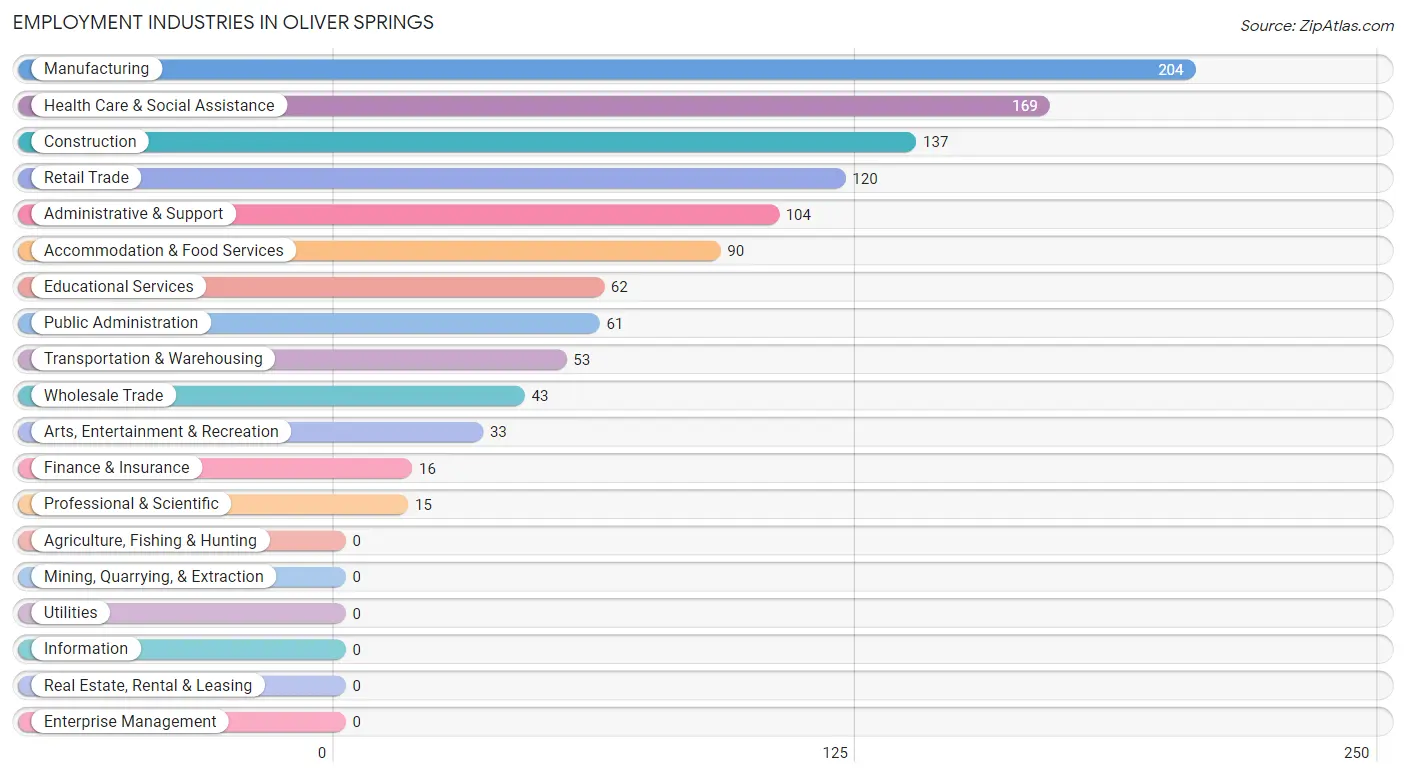
Employment Industries in Oliver Springs
The major employment industries in Oliver Springs include Manufacturing (204 | 17.8%), Health Care & Social Assistance (169 | 14.8%), Construction (137 | 12.0%), Retail Trade (120 | 10.5%), and Administrative & Support (104 | 9.1%).
Employment Industries by Sex in Oliver Springs
The Oliver Springs industries that see more men than women are Construction (100.0%), Wholesale Trade (100.0%), and Transportation & Warehousing (100.0%), whereas the industries that tend to have a higher number of women are Finance & Insurance (100.0%), Professional & Scientific (100.0%), and Educational Services (100.0%).
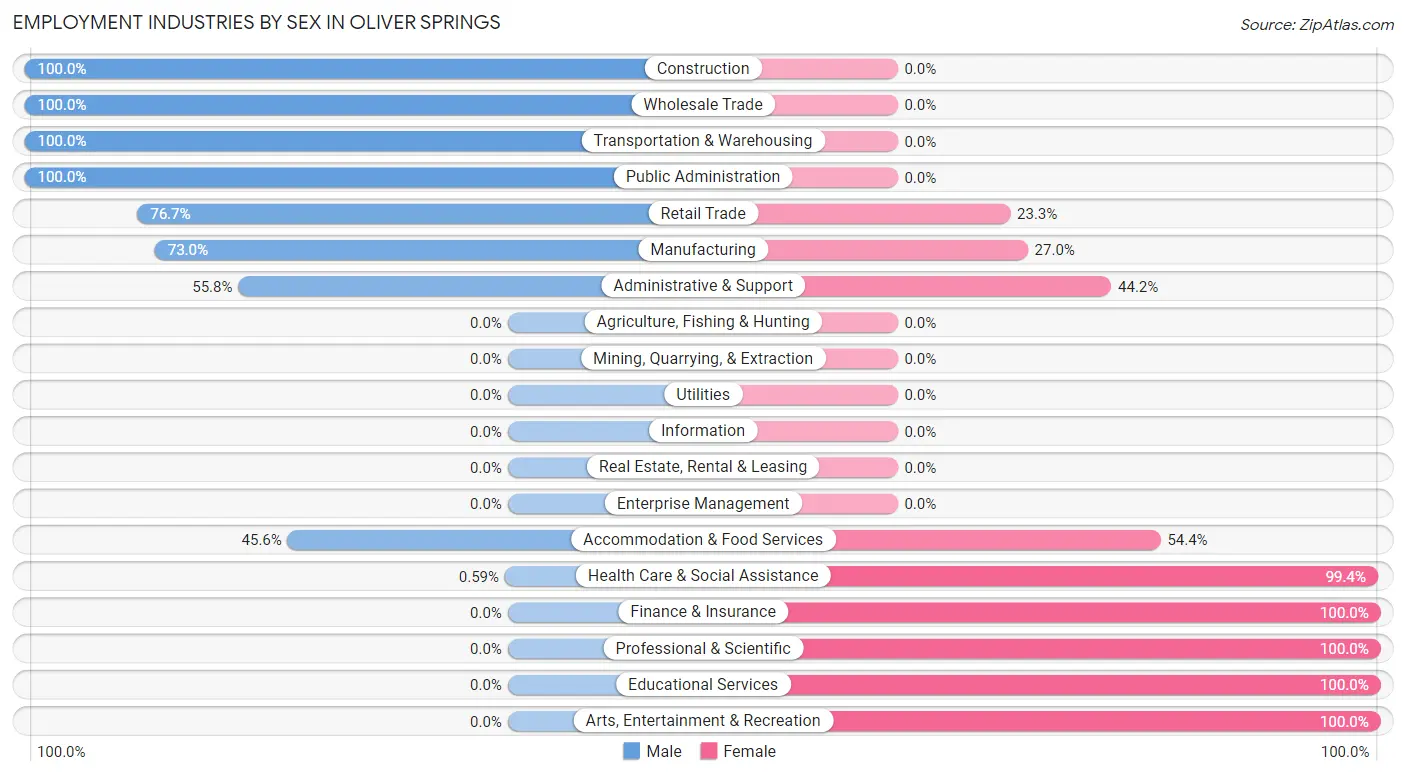
| Industry | Male | Female |
| Agriculture, Fishing & Hunting | 0 (0.0%) | 0 (0.0%) |
| Mining, Quarrying, & Extraction | 0 (0.0%) | 0 (0.0%) |
| Construction | 137 (100.0%) | 0 (0.0%) |
| Manufacturing | 149 (73.0%) | 55 (27.0%) |
| Wholesale Trade | 43 (100.0%) | 0 (0.0%) |
| Retail Trade | 92 (76.7%) | 28 (23.3%) |
| Transportation & Warehousing | 53 (100.0%) | 0 (0.0%) |
| Utilities | 0 (0.0%) | 0 (0.0%) |
| Information | 0 (0.0%) | 0 (0.0%) |
| Finance & Insurance | 0 (0.0%) | 16 (100.0%) |
| Real Estate, Rental & Leasing | 0 (0.0%) | 0 (0.0%) |
| Professional & Scientific | 0 (0.0%) | 15 (100.0%) |
| Enterprise Management | 0 (0.0%) | 0 (0.0%) |
| Administrative & Support | 58 (55.8%) | 46 (44.2%) |
| Educational Services | 0 (0.0%) | 62 (100.0%) |
| Health Care & Social Assistance | 1 (0.6%) | 168 (99.4%) |
| Arts, Entertainment & Recreation | 0 (0.0%) | 33 (100.0%) |
| Accommodation & Food Services | 41 (45.6%) | 49 (54.4%) |
| Public Administration | 61 (100.0%) | 0 (0.0%) |
| Total | 673 (58.8%) | 472 (41.2%) |
Education in Oliver Springs
School Enrollment in Oliver Springs
The most common levels of schooling among the 870 students in Oliver Springs are high school (313 | 36.0%), elementary school (275 | 31.6%), and college / undergraduate (151 | 17.4%).
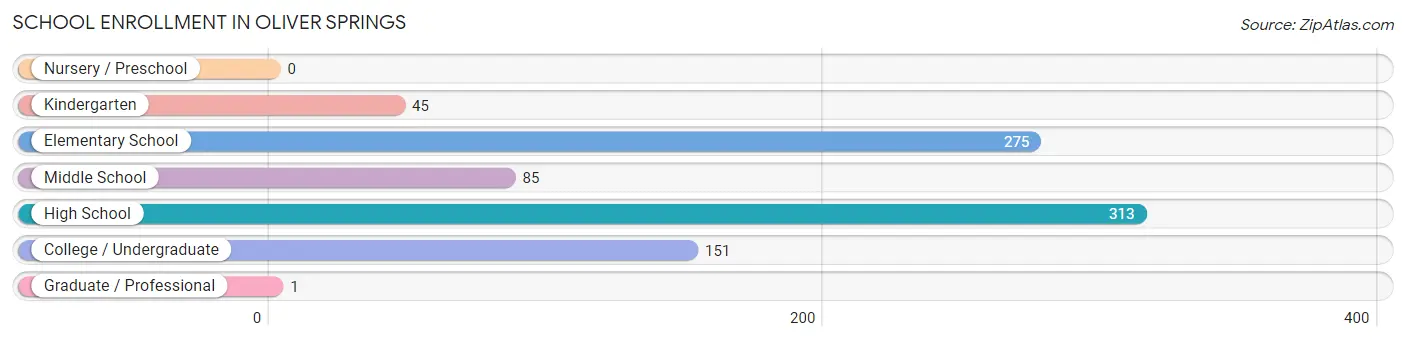
| School Level | # Students | % Students |
| Nursery / Preschool | 0 | 0.0% |
| Kindergarten | 45 | 5.2% |
| Elementary School | 275 | 31.6% |
| Middle School | 85 | 9.8% |
| High School | 313 | 36.0% |
| College / Undergraduate | 151 | 17.4% |
| Graduate / Professional | 1 | 0.1% |
| Total | 870 | 100.0% |
School Enrollment by Age by Funding Source in Oliver Springs
Out of a total of 870 students who are enrolled in schools in Oliver Springs, 124 (14.3%) attend a private institution, while the remaining 746 (85.7%) are enrolled in public schools. The age group of 5 to 9 year old has the highest likelihood of being enrolled in private schools, with 69 (31.5% in the age bracket) enrolled. Conversely, the age group of 18 to 19 year olds has the lowest likelihood of being enrolled in a private school, with 25 (100.0% in the age bracket) attending a public institution.
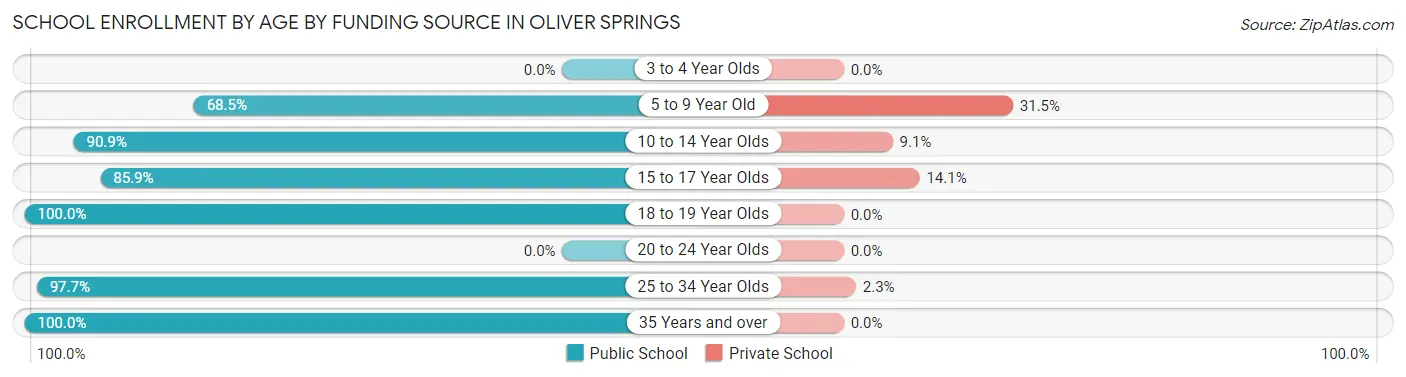
| Age Bracket | Public School | Private School |
| 3 to 4 Year Olds | 0 (0.0%) | 0 (0.0%) |
| 5 to 9 Year Old | 150 (68.5%) | 69 (31.5%) |
| 10 to 14 Year Olds | 299 (90.9%) | 30 (9.1%) |
| 15 to 17 Year Olds | 146 (85.9%) | 24 (14.1%) |
| 18 to 19 Year Olds | 25 (100.0%) | 0 (0.0%) |
| 20 to 24 Year Olds | 0 (0.0%) | 0 (0.0%) |
| 25 to 34 Year Olds | 43 (97.7%) | 1 (2.3%) |
| 35 Years and over | 83 (100.0%) | 0 (0.0%) |
| Total | 746 (85.7%) | 124 (14.3%) |
Educational Attainment by Field of Study in Oliver Springs
Computers & mathematics (56 | 29.9%), science & technology (39 | 20.9%), bio, nature & agricultural (31 | 16.6%), education (28 | 15.0%), and business (18 | 9.6%) are the most common fields of study among 187 individuals in Oliver Springs who have obtained a bachelor's degree or higher.
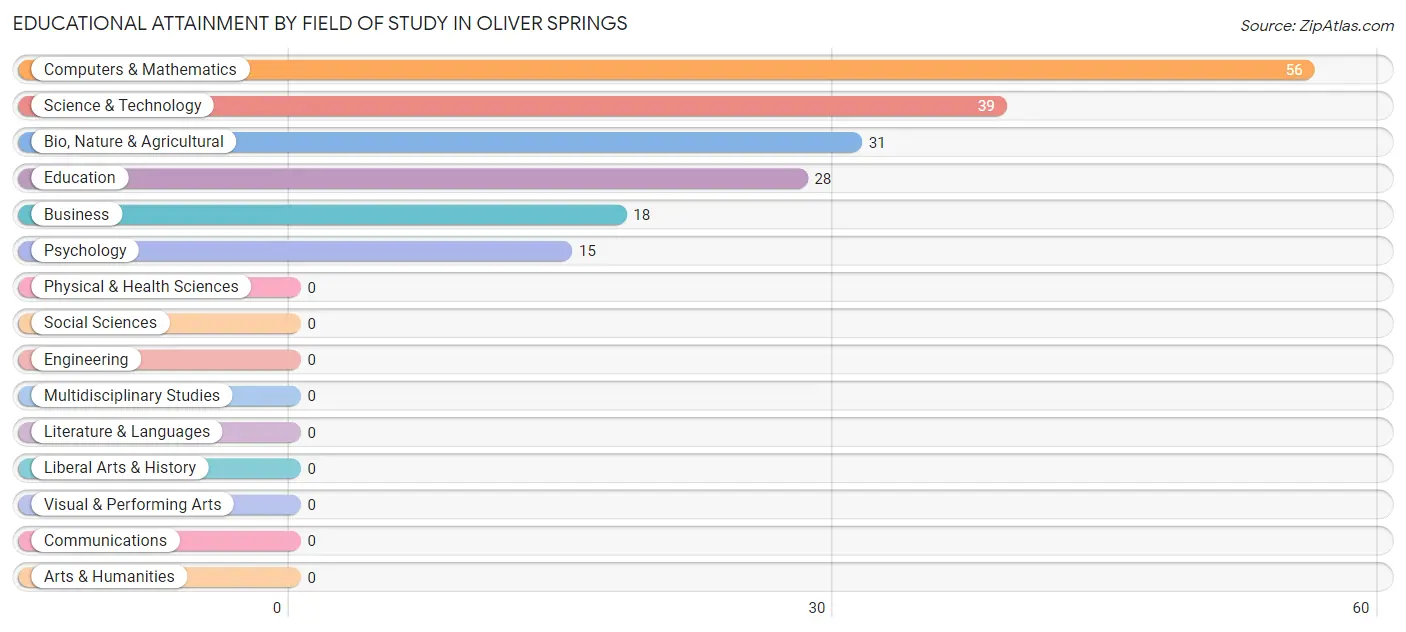
| Field of Study | # Graduates | % Graduates |
| Computers & Mathematics | 56 | 29.9% |
| Bio, Nature & Agricultural | 31 | 16.6% |
| Physical & Health Sciences | 0 | 0.0% |
| Psychology | 15 | 8.0% |
| Social Sciences | 0 | 0.0% |
| Engineering | 0 | 0.0% |
| Multidisciplinary Studies | 0 | 0.0% |
| Science & Technology | 39 | 20.9% |
| Business | 18 | 9.6% |
| Education | 28 | 15.0% |
| Literature & Languages | 0 | 0.0% |
| Liberal Arts & History | 0 | 0.0% |
| Visual & Performing Arts | 0 | 0.0% |
| Communications | 0 | 0.0% |
| Arts & Humanities | 0 | 0.0% |
| Total | 187 | 100.0% |
Transportation & Commute in Oliver Springs
Vehicle Availability by Sex in Oliver Springs
The most prevalent vehicle ownership categories in Oliver Springs are males with 2 vehicles (272, accounting for 40.4%) and females with 2 vehicles (138, making up 65.7%).
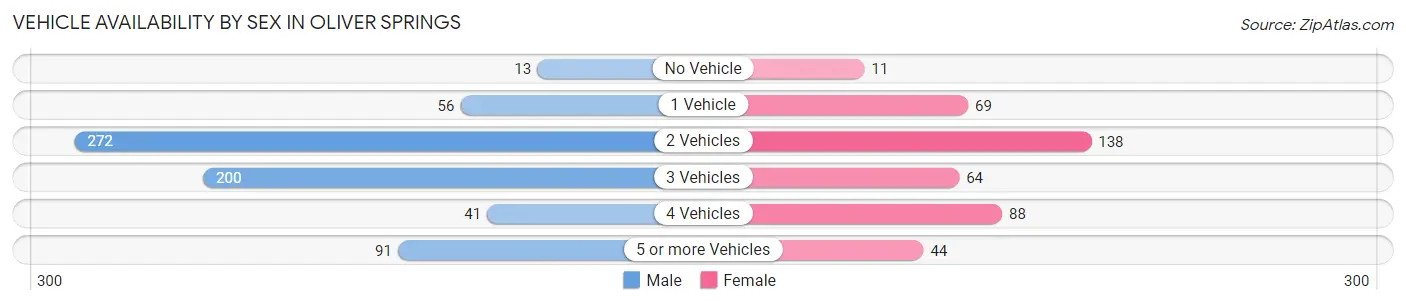
| Vehicles Available | Male | Female |
| No Vehicle | 13 (1.9%) | 11 (2.7%) |
| 1 Vehicle | 56 (8.3%) | 69 (16.7%) |
| 2 Vehicles | 272 (40.4%) | 138 (33.3%) |
| 3 Vehicles | 200 (29.7%) | 64 (15.5%) |
| 4 Vehicles | 41 (6.1%) | 88 (21.3%) |
| 5 or more Vehicles | 91 (13.5%) | 44 (10.6%) |
| Total | 673 (100.0%) | 414 (100.0%) |
Commute Time in Oliver Springs
The most frequently occuring commute durations in Oliver Springs are 20 to 24 minutes (219 commuters, 20.8%), 45 to 59 minutes (143 commuters, 13.6%), and 15 to 19 minutes (131 commuters, 12.4%).
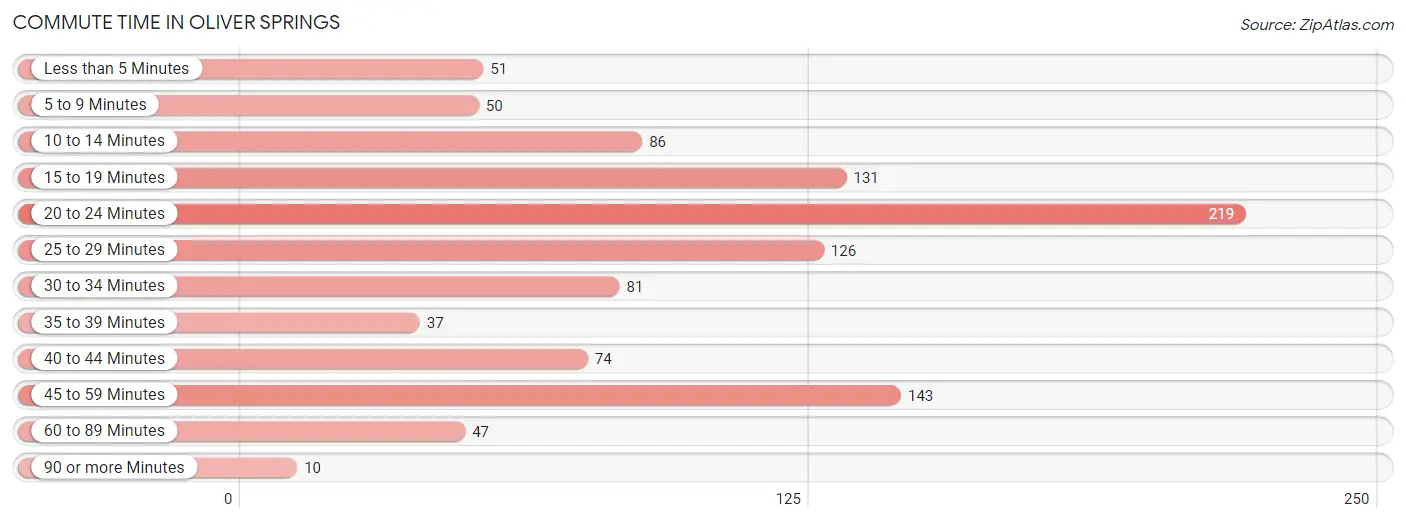
| Commute Time | # Commuters | % Commuters |
| Less than 5 Minutes | 51 | 4.8% |
| 5 to 9 Minutes | 50 | 4.7% |
| 10 to 14 Minutes | 86 | 8.2% |
| 15 to 19 Minutes | 131 | 12.4% |
| 20 to 24 Minutes | 219 | 20.8% |
| 25 to 29 Minutes | 126 | 11.9% |
| 30 to 34 Minutes | 81 | 7.7% |
| 35 to 39 Minutes | 37 | 3.5% |
| 40 to 44 Minutes | 74 | 7.0% |
| 45 to 59 Minutes | 143 | 13.6% |
| 60 to 89 Minutes | 47 | 4.4% |
| 90 or more Minutes | 10 | 0.9% |
Commute Time by Sex in Oliver Springs
The most common commute times in Oliver Springs are 20 to 24 minutes (201 commuters, 30.7%) for males and 10 to 14 minutes (74 commuters, 18.4%) for females.
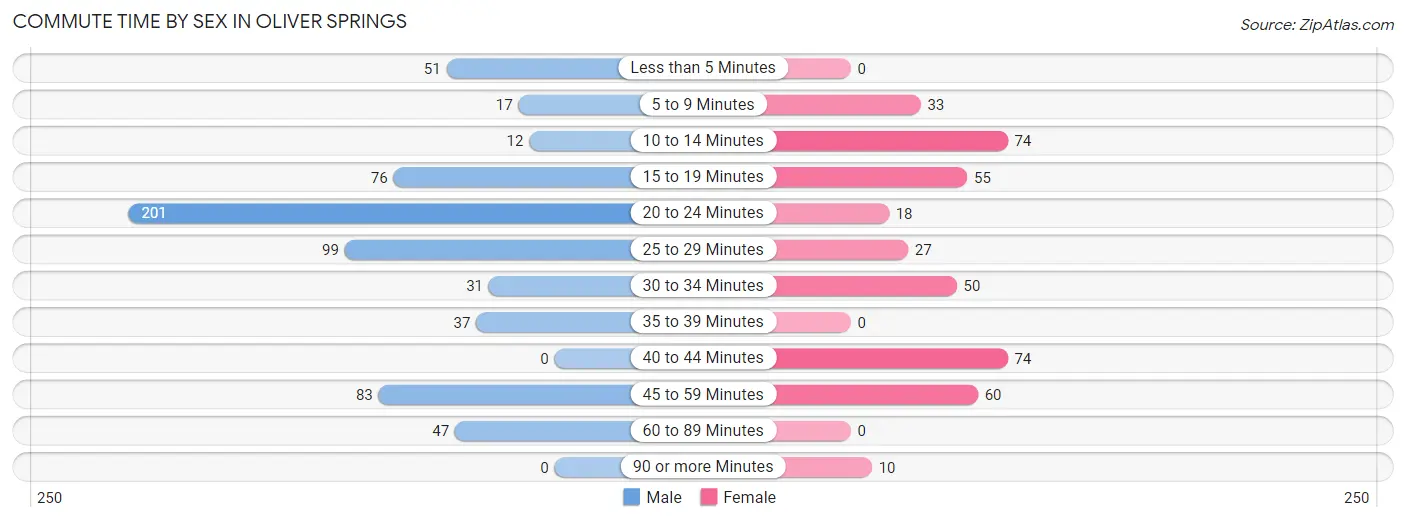
| Commute Time | Male | Female |
| Less than 5 Minutes | 51 (7.8%) | 0 (0.0%) |
| 5 to 9 Minutes | 17 (2.6%) | 33 (8.2%) |
| 10 to 14 Minutes | 12 (1.8%) | 74 (18.4%) |
| 15 to 19 Minutes | 76 (11.6%) | 55 (13.7%) |
| 20 to 24 Minutes | 201 (30.7%) | 18 (4.5%) |
| 25 to 29 Minutes | 99 (15.1%) | 27 (6.7%) |
| 30 to 34 Minutes | 31 (4.7%) | 50 (12.5%) |
| 35 to 39 Minutes | 37 (5.7%) | 0 (0.0%) |
| 40 to 44 Minutes | 0 (0.0%) | 74 (18.4%) |
| 45 to 59 Minutes | 83 (12.7%) | 60 (15.0%) |
| 60 to 89 Minutes | 47 (7.2%) | 0 (0.0%) |
| 90 or more Minutes | 0 (0.0%) | 10 (2.5%) |
Time of Departure to Work by Sex in Oliver Springs
The most frequent times of departure to work in Oliver Springs are 12:00 AM to 4:59 AM (91, 13.9%) for males and 7:00 AM to 7:29 AM (97, 24.2%) for females.
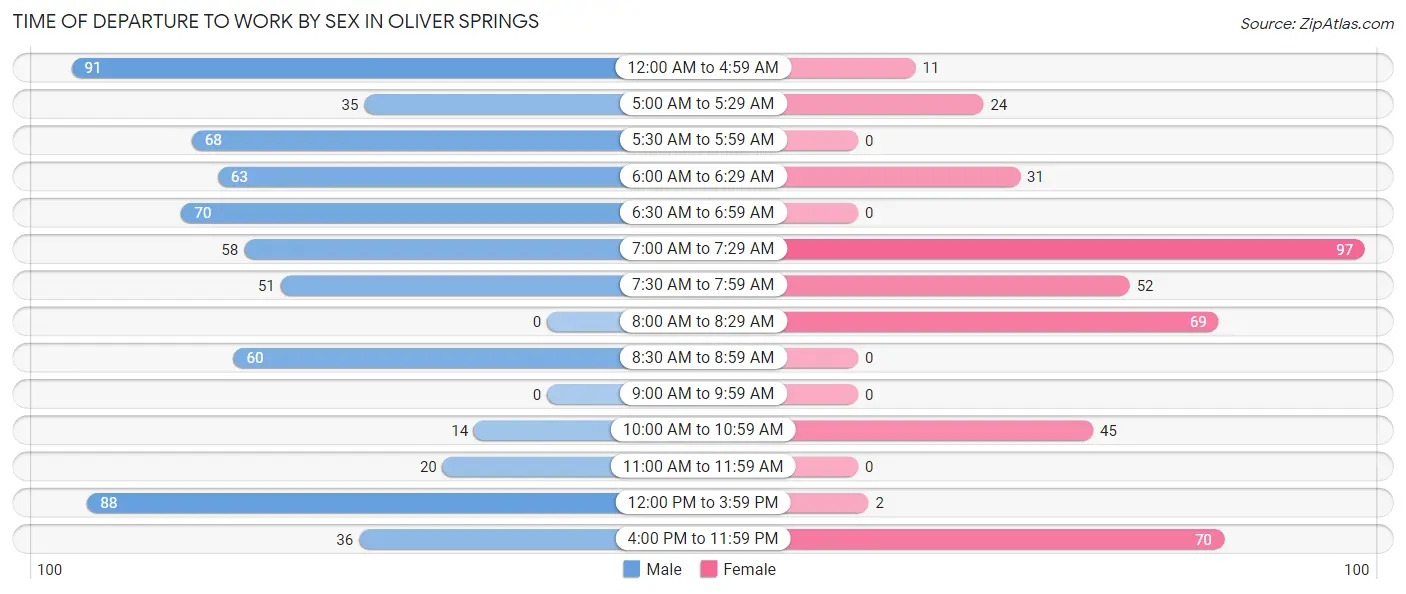
| Time of Departure | Male | Female |
| 12:00 AM to 4:59 AM | 91 (13.9%) | 11 (2.7%) |
| 5:00 AM to 5:29 AM | 35 (5.3%) | 24 (6.0%) |
| 5:30 AM to 5:59 AM | 68 (10.4%) | 0 (0.0%) |
| 6:00 AM to 6:29 AM | 63 (9.6%) | 31 (7.7%) |
| 6:30 AM to 6:59 AM | 70 (10.7%) | 0 (0.0%) |
| 7:00 AM to 7:29 AM | 58 (8.9%) | 97 (24.2%) |
| 7:30 AM to 7:59 AM | 51 (7.8%) | 52 (13.0%) |
| 8:00 AM to 8:29 AM | 0 (0.0%) | 69 (17.2%) |
| 8:30 AM to 8:59 AM | 60 (9.2%) | 0 (0.0%) |
| 9:00 AM to 9:59 AM | 0 (0.0%) | 0 (0.0%) |
| 10:00 AM to 10:59 AM | 14 (2.1%) | 45 (11.2%) |
| 11:00 AM to 11:59 AM | 20 (3.1%) | 0 (0.0%) |
| 12:00 PM to 3:59 PM | 88 (13.5%) | 2 (0.5%) |
| 4:00 PM to 11:59 PM | 36 (5.5%) | 70 (17.5%) |
| Total | 654 (100.0%) | 401 (100.0%) |
Housing Occupancy in Oliver Springs
Occupancy by Ownership in Oliver Springs
Of the total 1,525 dwellings in Oliver Springs, owner-occupied units account for 1,090 (71.5%), while renter-occupied units make up 435 (28.5%).
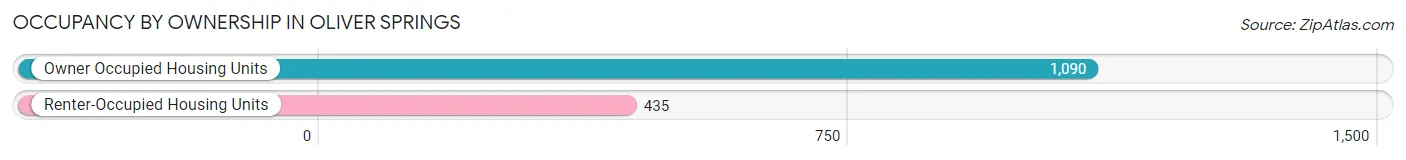
| Occupancy | # Housing Units | % Housing Units |
| Owner Occupied Housing Units | 1,090 | 71.5% |
| Renter-Occupied Housing Units | 435 | 28.5% |
| Total Occupied Housing Units | 1,525 | 100.0% |
Occupancy by Household Size in Oliver Springs
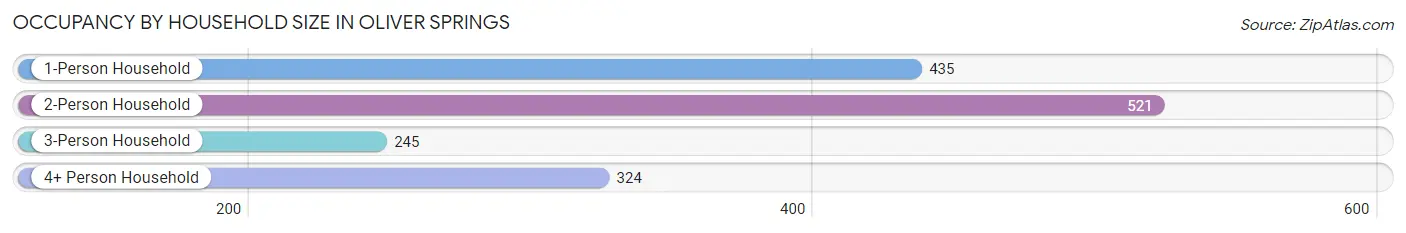
| Household Size | # Housing Units | % Housing Units |
| 1-Person Household | 435 | 28.5% |
| 2-Person Household | 521 | 34.2% |
| 3-Person Household | 245 | 16.1% |
| 4+ Person Household | 324 | 21.2% |
| Total Housing Units | 1,525 | 100.0% |
Occupancy by Ownership by Household Size in Oliver Springs
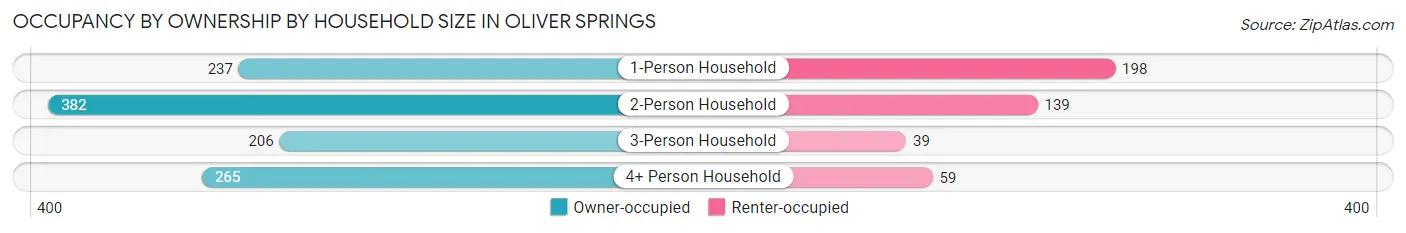
| Household Size | Owner-occupied | Renter-occupied |
| 1-Person Household | 237 (54.5%) | 198 (45.5%) |
| 2-Person Household | 382 (73.3%) | 139 (26.7%) |
| 3-Person Household | 206 (84.1%) | 39 (15.9%) |
| 4+ Person Household | 265 (81.8%) | 59 (18.2%) |
| Total Housing Units | 1,090 (71.5%) | 435 (28.5%) |
Occupancy by Educational Attainment in Oliver Springs
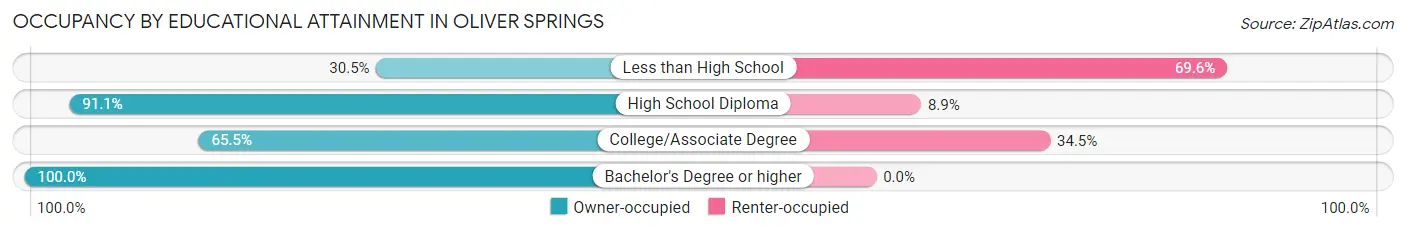
| Household Size | Owner-occupied | Renter-occupied |
| Less than High School | 67 (30.4%) | 153 (69.6%) |
| High School Diploma | 451 (91.1%) | 44 (8.9%) |
| College/Associate Degree | 452 (65.5%) | 238 (34.5%) |
| Bachelor's Degree or higher | 120 (100.0%) | 0 (0.0%) |
Occupancy by Age of Householder in Oliver Springs
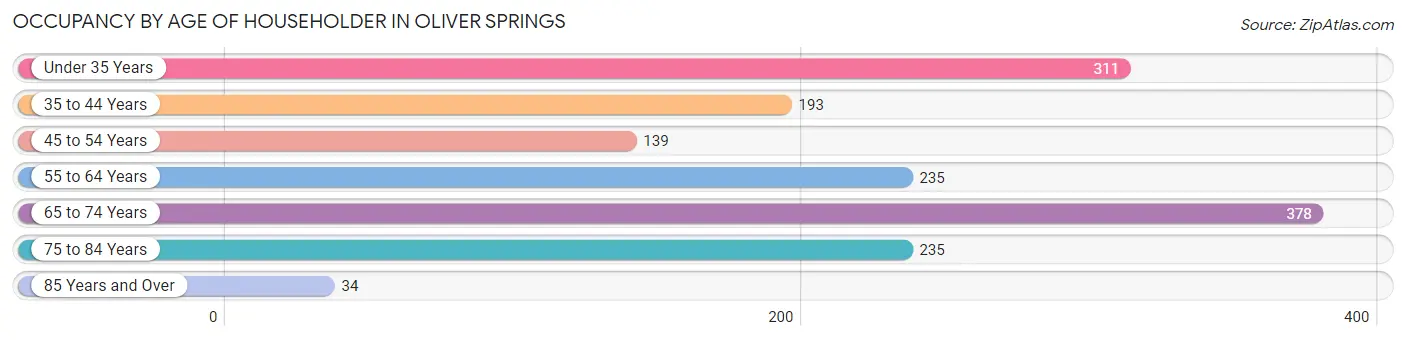
| Age Bracket | # Households | % Households |
| Under 35 Years | 311 | 20.4% |
| 35 to 44 Years | 193 | 12.7% |
| 45 to 54 Years | 139 | 9.1% |
| 55 to 64 Years | 235 | 15.4% |
| 65 to 74 Years | 378 | 24.8% |
| 75 to 84 Years | 235 | 15.4% |
| 85 Years and Over | 34 | 2.2% |
| Total | 1,525 | 100.0% |
Housing Finances in Oliver Springs
Median Income by Occupancy in Oliver Springs
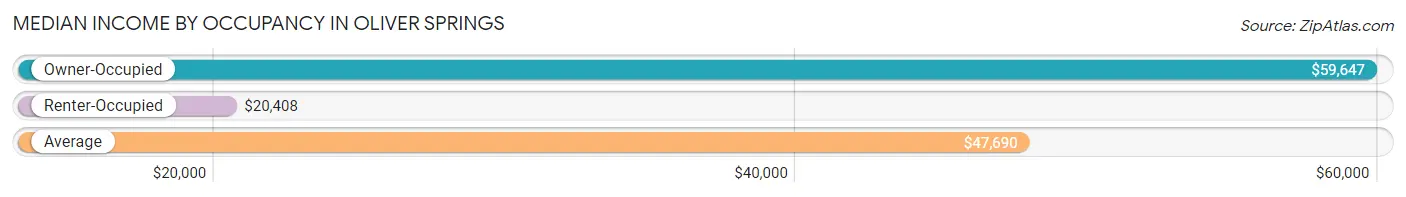
| Occupancy Type | # Households | Median Income |
| Owner-Occupied | 1,090 (71.5%) | $59,647 |
| Renter-Occupied | 435 (28.5%) | $20,408 |
| Average | 1,525 (100.0%) | $47,690 |
Occupancy by Householder Income Bracket in Oliver Springs
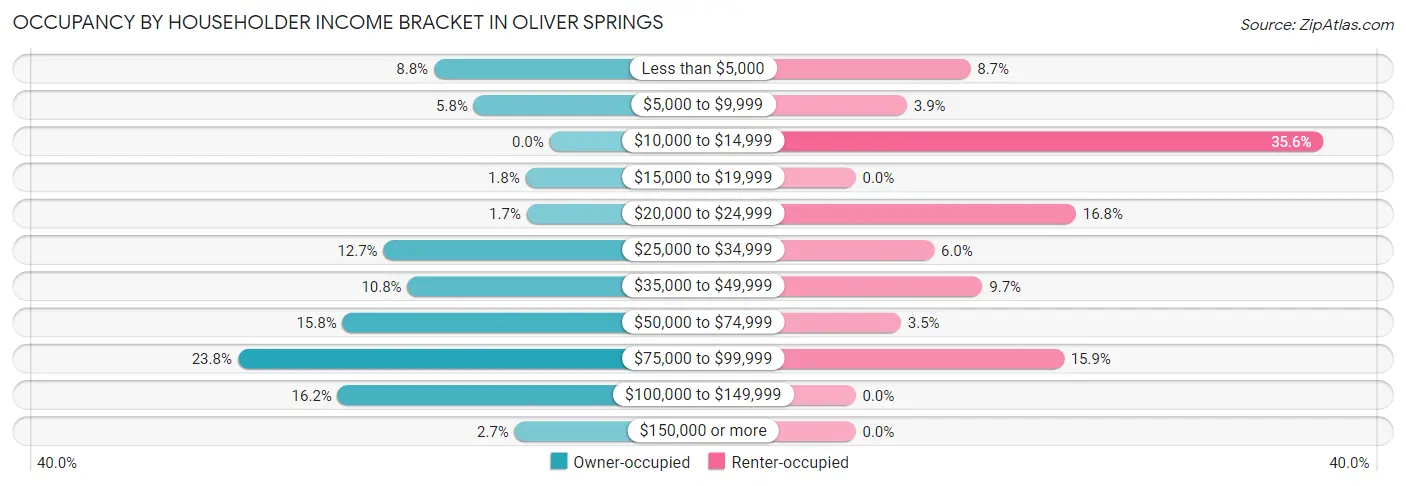
| Income Bracket | Owner-occupied | Renter-occupied |
| Less than $5,000 | 96 (8.8%) | 38 (8.7%) |
| $5,000 to $9,999 | 63 (5.8%) | 17 (3.9%) |
| $10,000 to $14,999 | 0 (0.0%) | 155 (35.6%) |
| $15,000 to $19,999 | 20 (1.8%) | 0 (0.0%) |
| $20,000 to $24,999 | 19 (1.7%) | 73 (16.8%) |
| $25,000 to $34,999 | 138 (12.7%) | 26 (6.0%) |
| $35,000 to $49,999 | 118 (10.8%) | 42 (9.7%) |
| $50,000 to $74,999 | 172 (15.8%) | 15 (3.5%) |
| $75,000 to $99,999 | 259 (23.8%) | 69 (15.9%) |
| $100,000 to $149,999 | 176 (16.2%) | 0 (0.0%) |
| $150,000 or more | 29 (2.7%) | 0 (0.0%) |
| Total | 1,090 (100.0%) | 435 (100.0%) |
Monthly Housing Cost Tiers in Oliver Springs
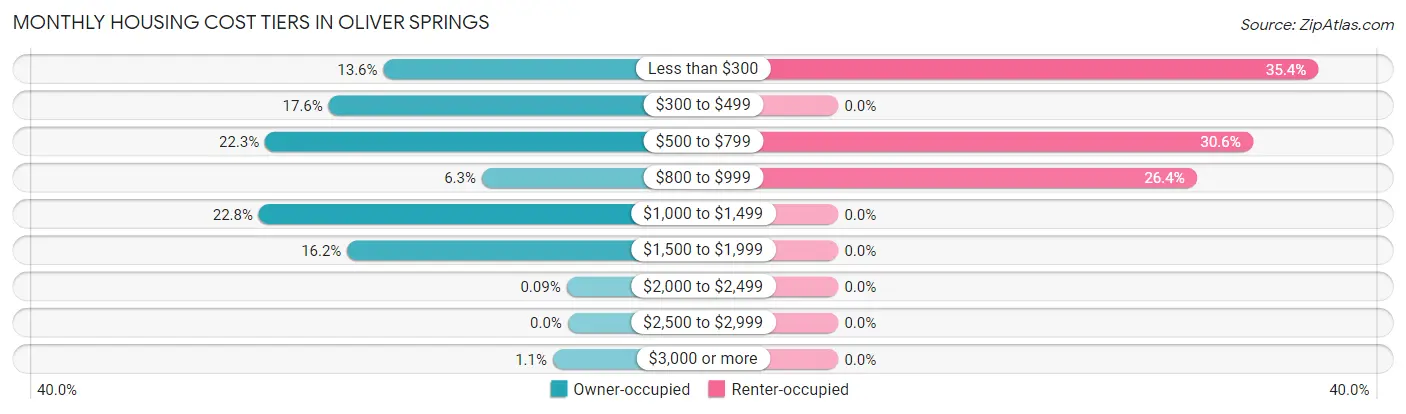
| Monthly Cost | Owner-occupied | Renter-occupied |
| Less than $300 | 148 (13.6%) | 154 (35.4%) |
| $300 to $499 | 192 (17.6%) | 0 (0.0%) |
| $500 to $799 | 243 (22.3%) | 133 (30.6%) |
| $800 to $999 | 69 (6.3%) | 115 (26.4%) |
| $1,000 to $1,499 | 248 (22.8%) | 0 (0.0%) |
| $1,500 to $1,999 | 177 (16.2%) | 0 (0.0%) |
| $2,000 to $2,499 | 1 (0.1%) | 0 (0.0%) |
| $2,500 to $2,999 | 0 (0.0%) | 0 (0.0%) |
| $3,000 or more | 12 (1.1%) | 0 (0.0%) |
| Total | 1,090 (100.0%) | 435 (100.0%) |
Physical Housing Characteristics in Oliver Springs
Housing Structures in Oliver Springs
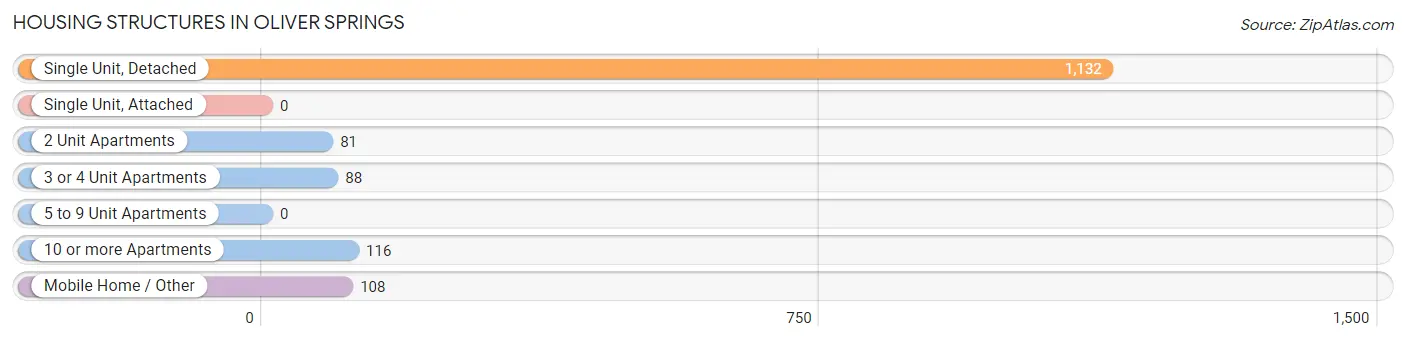
| Structure Type | # Housing Units | % Housing Units |
| Single Unit, Detached | 1,132 | 74.2% |
| Single Unit, Attached | 0 | 0.0% |
| 2 Unit Apartments | 81 | 5.3% |
| 3 or 4 Unit Apartments | 88 | 5.8% |
| 5 to 9 Unit Apartments | 0 | 0.0% |
| 10 or more Apartments | 116 | 7.6% |
| Mobile Home / Other | 108 | 7.1% |
| Total | 1,525 | 100.0% |
Housing Structures by Occupancy in Oliver Springs
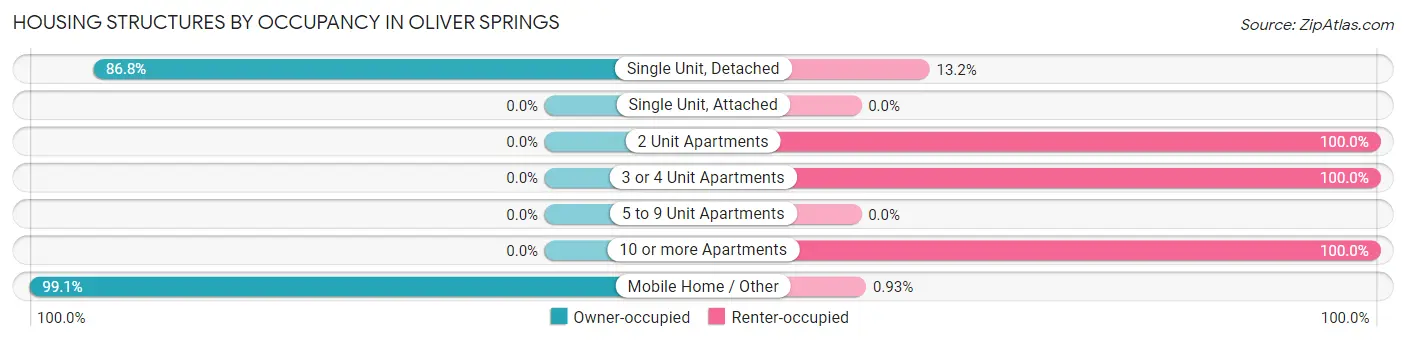
| Structure Type | Owner-occupied | Renter-occupied |
| Single Unit, Detached | 983 (86.8%) | 149 (13.2%) |
| Single Unit, Attached | 0 (0.0%) | 0 (0.0%) |
| 2 Unit Apartments | 0 (0.0%) | 81 (100.0%) |
| 3 or 4 Unit Apartments | 0 (0.0%) | 88 (100.0%) |
| 5 to 9 Unit Apartments | 0 (0.0%) | 0 (0.0%) |
| 10 or more Apartments | 0 (0.0%) | 116 (100.0%) |
| Mobile Home / Other | 107 (99.1%) | 1 (0.9%) |
| Total | 1,090 (71.5%) | 435 (28.5%) |
Housing Structures by Number of Rooms in Oliver Springs
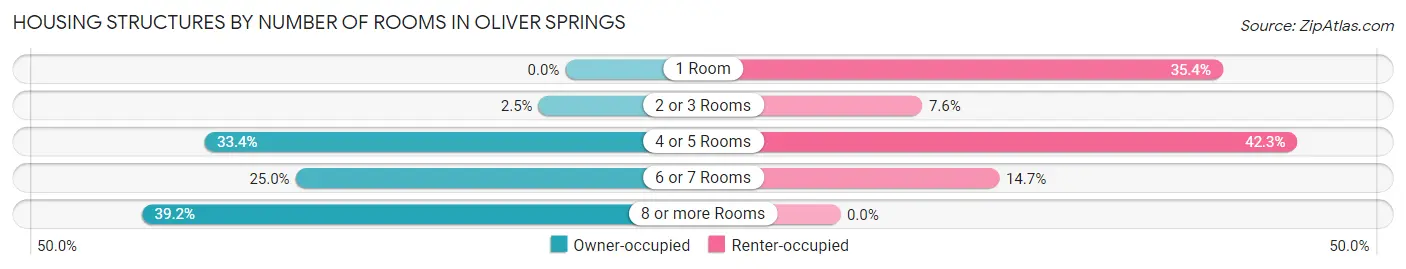
| Number of Rooms | Owner-occupied | Renter-occupied |
| 1 Room | 0 (0.0%) | 154 (35.4%) |
| 2 or 3 Rooms | 27 (2.5%) | 33 (7.6%) |
| 4 or 5 Rooms | 364 (33.4%) | 184 (42.3%) |
| 6 or 7 Rooms | 272 (24.9%) | 64 (14.7%) |
| 8 or more Rooms | 427 (39.2%) | 0 (0.0%) |
| Total | 1,090 (100.0%) | 435 (100.0%) |
Housing Structure by Heating Type in Oliver Springs
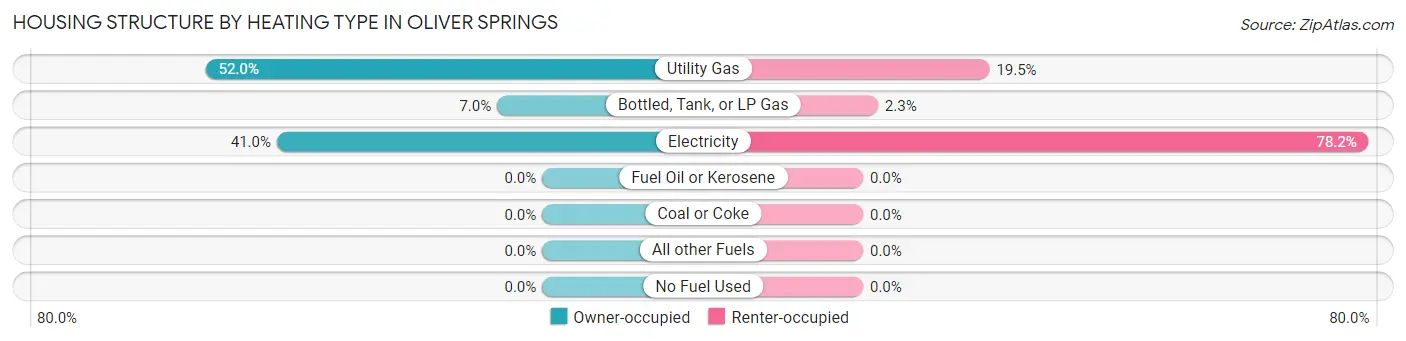
| Heating Type | Owner-occupied | Renter-occupied |
| Utility Gas | 567 (52.0%) | 85 (19.5%) |
| Bottled, Tank, or LP Gas | 76 (7.0%) | 10 (2.3%) |
| Electricity | 447 (41.0%) | 340 (78.2%) |
| Fuel Oil or Kerosene | 0 (0.0%) | 0 (0.0%) |
| Coal or Coke | 0 (0.0%) | 0 (0.0%) |
| All other Fuels | 0 (0.0%) | 0 (0.0%) |
| No Fuel Used | 0 (0.0%) | 0 (0.0%) |
| Total | 1,090 (100.0%) | 435 (100.0%) |
Household Vehicle Usage in Oliver Springs
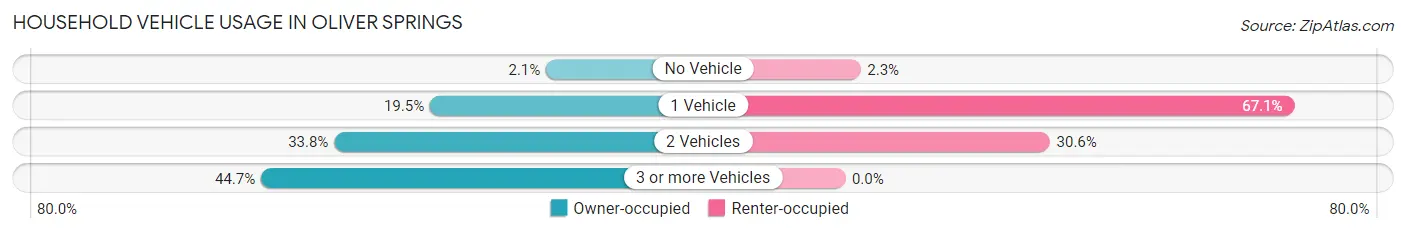
| Vehicles per Household | Owner-occupied | Renter-occupied |
| No Vehicle | 23 (2.1%) | 10 (2.3%) |
| 1 Vehicle | 212 (19.5%) | 292 (67.1%) |
| 2 Vehicles | 368 (33.8%) | 133 (30.6%) |
| 3 or more Vehicles | 487 (44.7%) | 0 (0.0%) |
| Total | 1,090 (100.0%) | 435 (100.0%) |
Real Estate & Mortgages in Oliver Springs
Real Estate and Mortgage Overview in Oliver Springs
| Characteristic | Without Mortgage | With Mortgage |
| Housing Units | 549 | 541 |
| Median Property Value | $139,000 | $178,700 |
| Median Household Income | $66,326 | $14 |
| Monthly Housing Costs | $411 | $12 |
| Real Estate Taxes | $1,136 | $0 |
Property Value by Mortgage Status in Oliver Springs
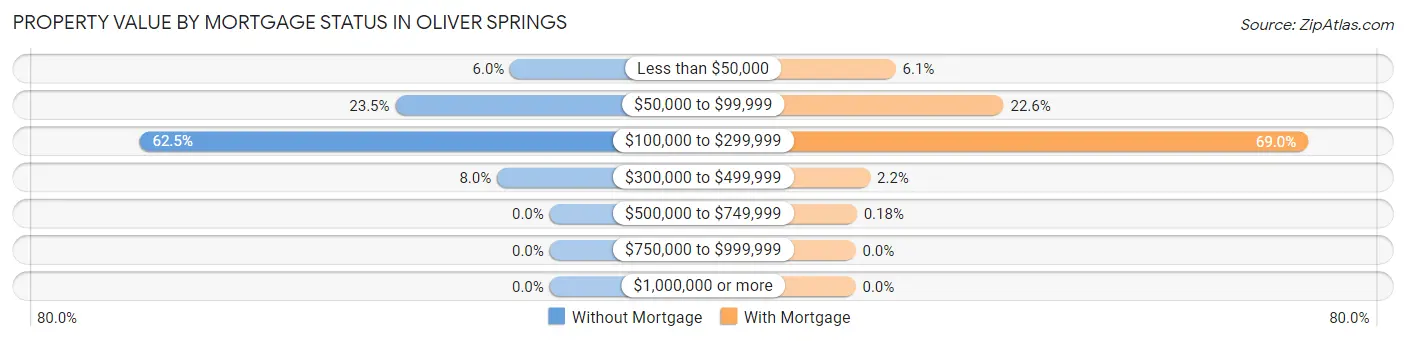
| Property Value | Without Mortgage | With Mortgage |
| Less than $50,000 | 33 (6.0%) | 33 (6.1%) |
| $50,000 to $99,999 | 129 (23.5%) | 122 (22.6%) |
| $100,000 to $299,999 | 343 (62.5%) | 373 (69.0%) |
| $300,000 to $499,999 | 44 (8.0%) | 12 (2.2%) |
| $500,000 to $749,999 | 0 (0.0%) | 1 (0.2%) |
| $750,000 to $999,999 | 0 (0.0%) | 0 (0.0%) |
| $1,000,000 or more | 0 (0.0%) | 0 (0.0%) |
| Total | 549 (100.0%) | 541 (100.0%) |
Household Income by Mortgage Status in Oliver Springs
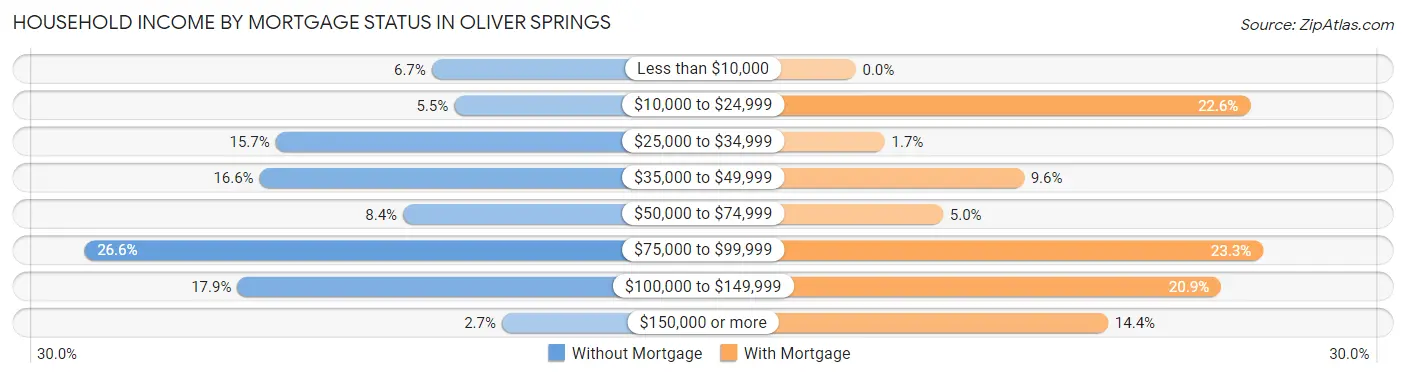
| Household Income | Without Mortgage | With Mortgage |
| Less than $10,000 | 37 (6.7%) | 0 (0.0%) |
| $10,000 to $24,999 | 30 (5.5%) | 122 (22.6%) |
| $25,000 to $34,999 | 86 (15.7%) | 9 (1.7%) |
| $35,000 to $49,999 | 91 (16.6%) | 52 (9.6%) |
| $50,000 to $74,999 | 46 (8.4%) | 27 (5.0%) |
| $75,000 to $99,999 | 146 (26.6%) | 126 (23.3%) |
| $100,000 to $149,999 | 98 (17.8%) | 113 (20.9%) |
| $150,000 or more | 15 (2.7%) | 78 (14.4%) |
| Total | 549 (100.0%) | 541 (100.0%) |
Property Value to Household Income Ratio in Oliver Springs
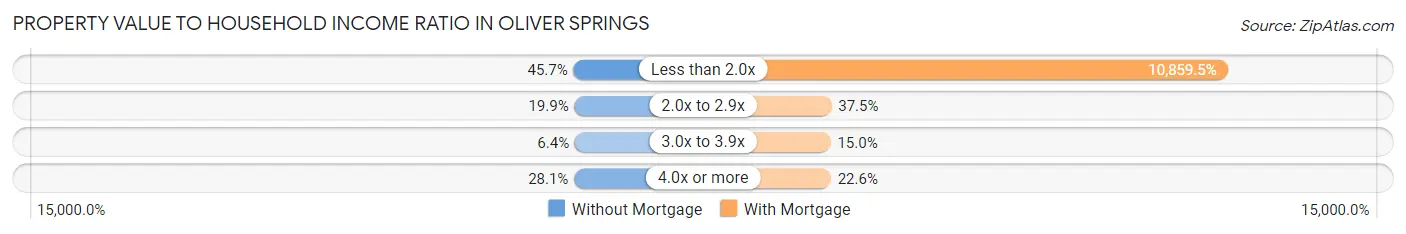
| Value-to-Income Ratio | Without Mortgage | With Mortgage |
| Less than 2.0x | 251 (45.7%) | 58,750 (10,859.5%) |
| 2.0x to 2.9x | 109 (19.9%) | 203 (37.5%) |
| 3.0x to 3.9x | 35 (6.4%) | 81 (15.0%) |
| 4.0x or more | 154 (28.1%) | 122 (22.6%) |
| Total | 549 (100.0%) | 541 (100.0%) |
Real Estate Taxes by Mortgage Status in Oliver Springs
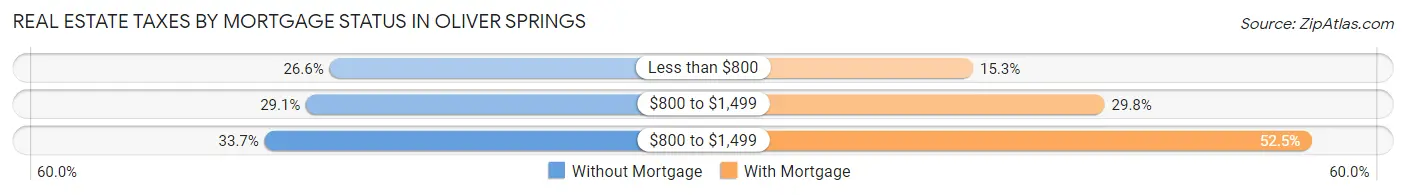
| Property Taxes | Without Mortgage | With Mortgage |
| Less than $800 | 146 (26.6%) | 83 (15.3%) |
| $800 to $1,499 | 160 (29.1%) | 161 (29.8%) |
| $800 to $1,499 | 185 (33.7%) | 284 (52.5%) |
| Total | 549 (100.0%) | 541 (100.0%) |
Health & Disability in Oliver Springs
Health Insurance Coverage by Age in Oliver Springs
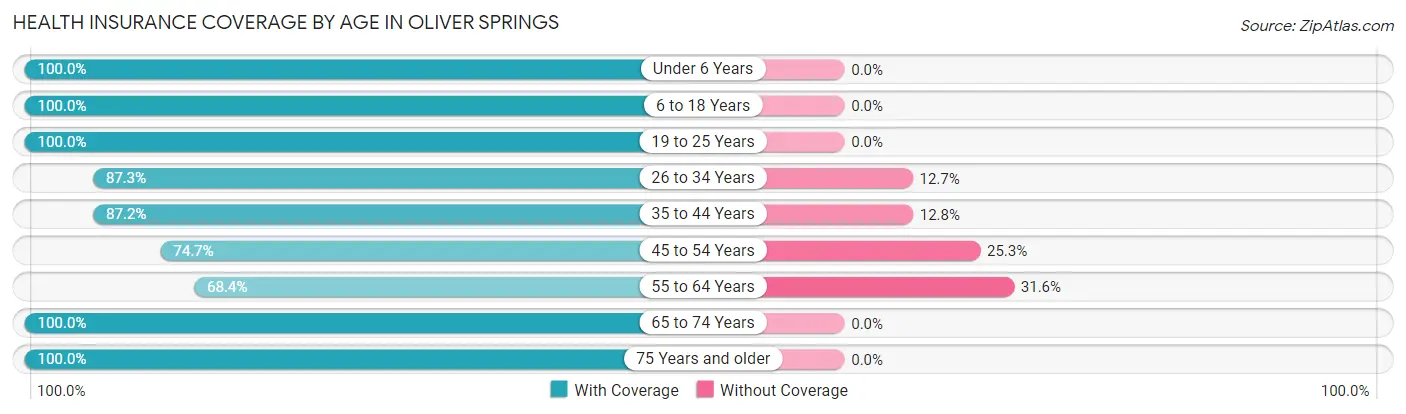
| Age Bracket | With Coverage | Without Coverage |
| Under 6 Years | 84 (100.0%) | 0 (0.0%) |
| 6 to 18 Years | 835 (100.0%) | 0 (0.0%) |
| 19 to 25 Years | 195 (100.0%) | 0 (0.0%) |
| 26 to 34 Years | 343 (87.3%) | 50 (12.7%) |
| 35 to 44 Years | 280 (87.2%) | 41 (12.8%) |
| 45 to 54 Years | 295 (74.7%) | 100 (25.3%) |
| 55 to 64 Years | 426 (68.4%) | 197 (31.6%) |
| 65 to 74 Years | 478 (100.0%) | 0 (0.0%) |
| 75 Years and older | 403 (100.0%) | 0 (0.0%) |
| Total | 3,339 (89.6%) | 388 (10.4%) |
Health Insurance Coverage by Citizenship Status in Oliver Springs
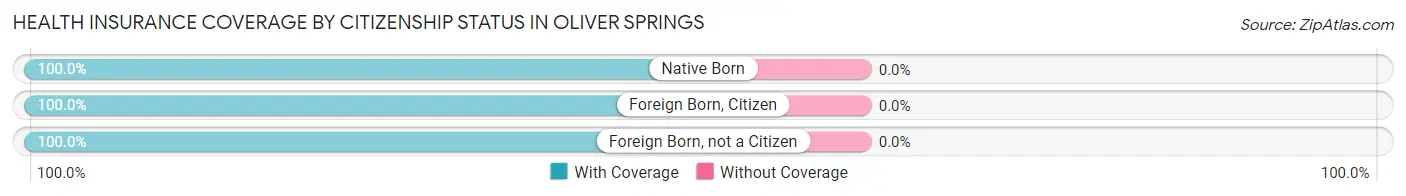
| Citizenship Status | With Coverage | Without Coverage |
| Native Born | 84 (100.0%) | 0 (0.0%) |
| Foreign Born, Citizen | 835 (100.0%) | 0 (0.0%) |
| Foreign Born, not a Citizen | 195 (100.0%) | 0 (0.0%) |
Health Insurance Coverage by Household Income in Oliver Springs
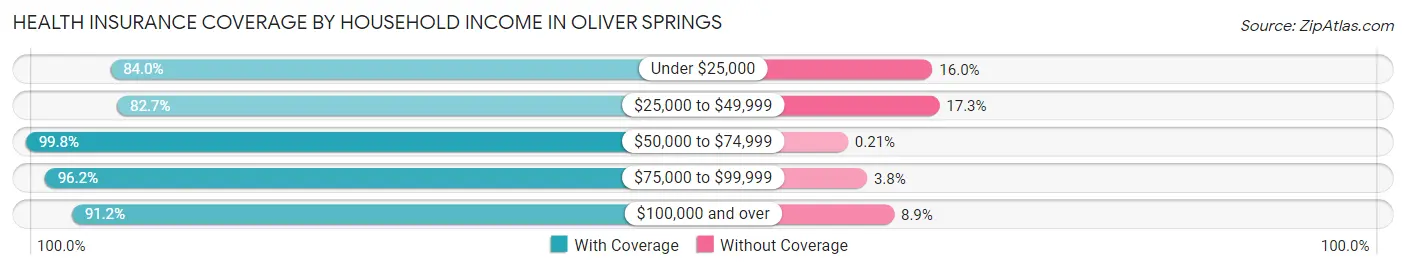
| Household Income | With Coverage | Without Coverage |
| Under $25,000 | 738 (84.0%) | 141 (16.0%) |
| $25,000 to $49,999 | 777 (82.7%) | 163 (17.3%) |
| $50,000 to $74,999 | 485 (99.8%) | 1 (0.2%) |
| $75,000 to $99,999 | 814 (96.2%) | 32 (3.8%) |
| $100,000 and over | 525 (91.1%) | 51 (8.8%) |
Public vs Private Health Insurance Coverage by Age in Oliver Springs
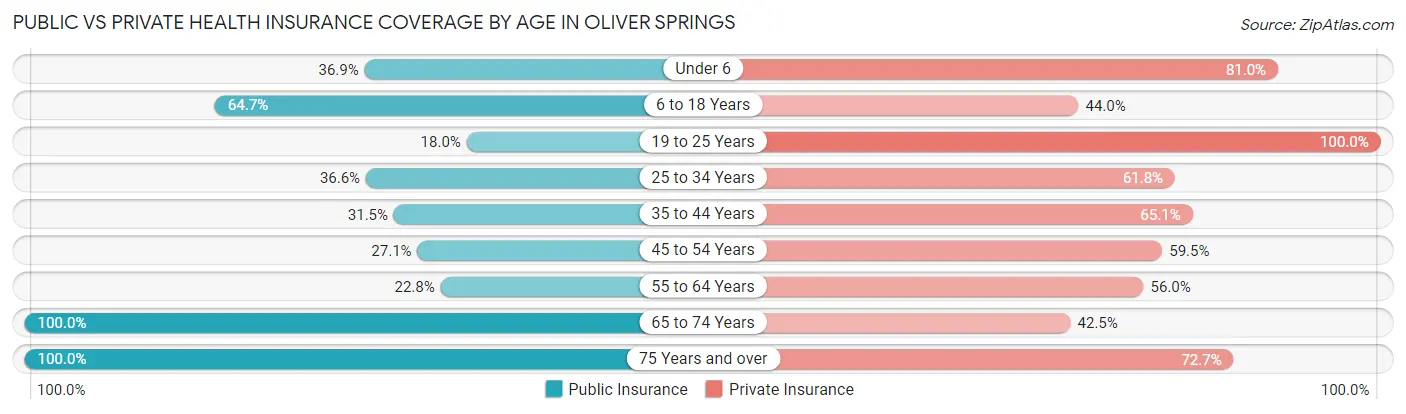
| Age Bracket | Public Insurance | Private Insurance |
| Under 6 | 31 (36.9%) | 68 (80.9%) |
| 6 to 18 Years | 540 (64.7%) | 367 (44.0%) |
| 19 to 25 Years | 35 (17.9%) | 195 (100.0%) |
| 25 to 34 Years | 144 (36.6%) | 243 (61.8%) |
| 35 to 44 Years | 101 (31.5%) | 209 (65.1%) |
| 45 to 54 Years | 107 (27.1%) | 235 (59.5%) |
| 55 to 64 Years | 142 (22.8%) | 349 (56.0%) |
| 65 to 74 Years | 478 (100.0%) | 203 (42.5%) |
| 75 Years and over | 403 (100.0%) | 293 (72.7%) |
| Total | 1,981 (53.1%) | 2,162 (58.0%) |
Disability Status by Sex by Age in Oliver Springs
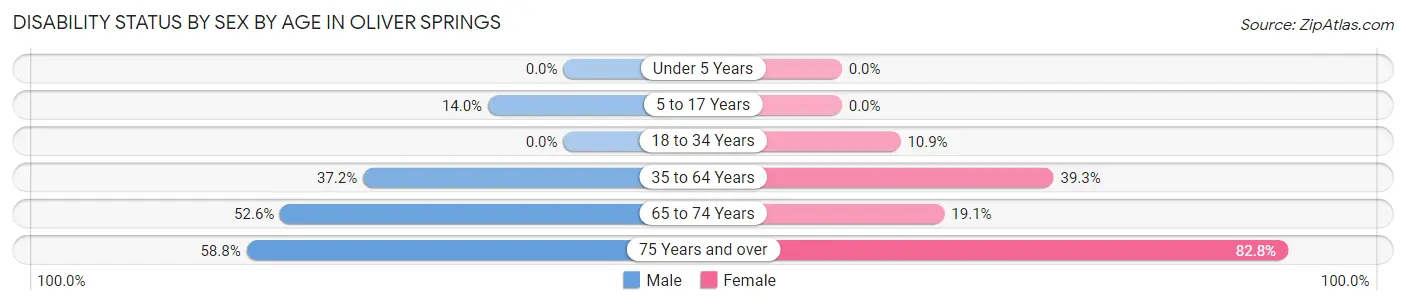
| Age Bracket | Male | Female |
| Under 5 Years | 0 (0.0%) | 0 (0.0%) |
| 5 to 17 Years | 76 (14.0%) | 0 (0.0%) |
| 18 to 34 Years | 0 (0.0%) | 44 (10.9%) |
| 35 to 64 Years | 232 (37.2%) | 281 (39.3%) |
| 65 to 74 Years | 185 (52.6%) | 24 (19.1%) |
| 75 Years and over | 90 (58.8%) | 207 (82.8%) |
Disability Class by Sex by Age in Oliver Springs
Disability Class: Hearing Difficulty
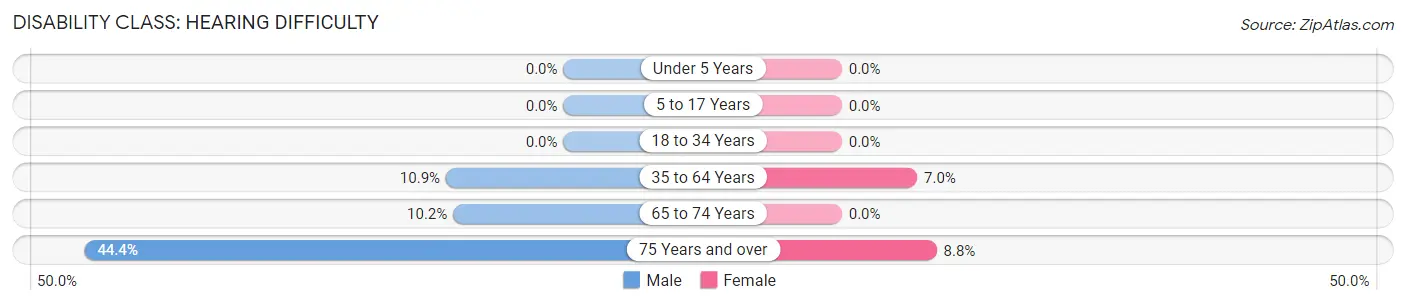
| Age Bracket | Male | Female |
| Under 5 Years | 0 (0.0%) | 0 (0.0%) |
| 5 to 17 Years | 0 (0.0%) | 0 (0.0%) |
| 18 to 34 Years | 0 (0.0%) | 0 (0.0%) |
| 35 to 64 Years | 68 (10.9%) | 50 (7.0%) |
| 65 to 74 Years | 36 (10.2%) | 0 (0.0%) |
| 75 Years and over | 68 (44.4%) | 22 (8.8%) |
Disability Class: Vision Difficulty
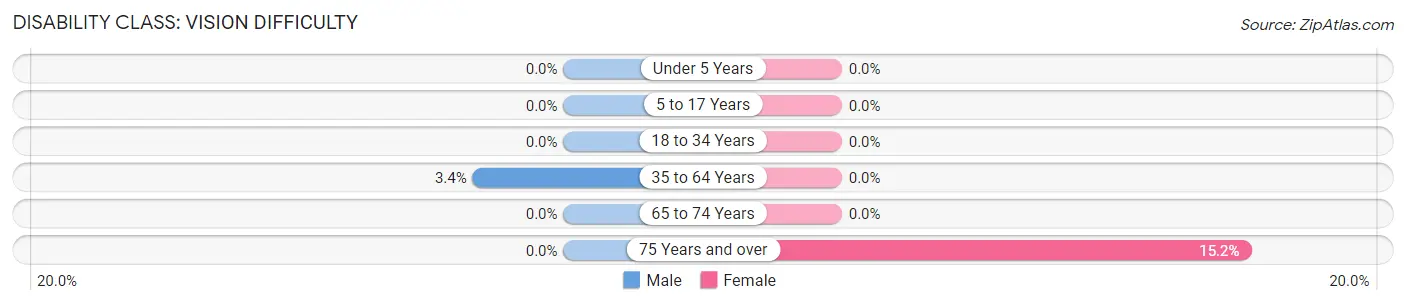
| Age Bracket | Male | Female |
| Under 5 Years | 0 (0.0%) | 0 (0.0%) |
| 5 to 17 Years | 0 (0.0%) | 0 (0.0%) |
| 18 to 34 Years | 0 (0.0%) | 0 (0.0%) |
| 35 to 64 Years | 21 (3.4%) | 0 (0.0%) |
| 65 to 74 Years | 0 (0.0%) | 0 (0.0%) |
| 75 Years and over | 0 (0.0%) | 38 (15.2%) |
Disability Class: Cognitive Difficulty
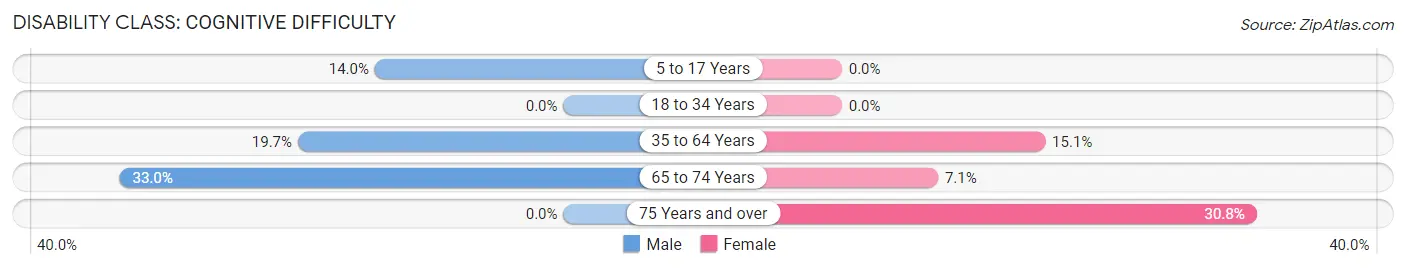
| Age Bracket | Male | Female |
| 5 to 17 Years | 76 (14.0%) | 0 (0.0%) |
| 18 to 34 Years | 0 (0.0%) | 0 (0.0%) |
| 35 to 64 Years | 123 (19.7%) | 108 (15.1%) |
| 65 to 74 Years | 116 (33.0%) | 9 (7.1%) |
| 75 Years and over | 0 (0.0%) | 77 (30.8%) |
Disability Class: Ambulatory Difficulty
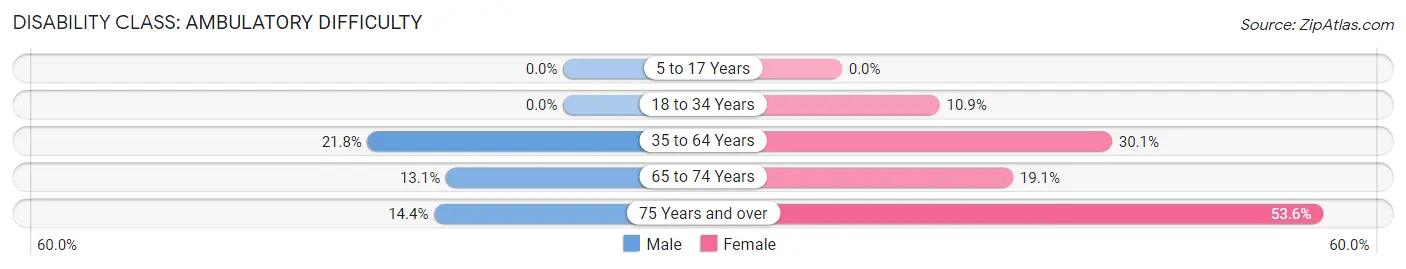
| Age Bracket | Male | Female |
| 5 to 17 Years | 0 (0.0%) | 0 (0.0%) |
| 18 to 34 Years | 0 (0.0%) | 44 (10.9%) |
| 35 to 64 Years | 136 (21.8%) | 215 (30.1%) |
| 65 to 74 Years | 46 (13.1%) | 24 (19.1%) |
| 75 Years and over | 22 (14.4%) | 134 (53.6%) |
Disability Class: Self-Care Difficulty
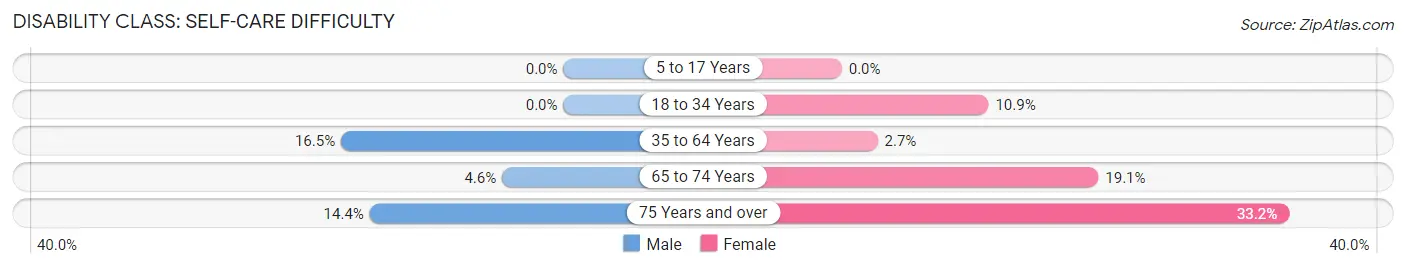
| Age Bracket | Male | Female |
| 5 to 17 Years | 0 (0.0%) | 0 (0.0%) |
| 18 to 34 Years | 0 (0.0%) | 44 (10.9%) |
| 35 to 64 Years | 103 (16.5%) | 19 (2.7%) |
| 65 to 74 Years | 16 (4.5%) | 24 (19.1%) |
| 75 Years and over | 22 (14.4%) | 83 (33.2%) |
Technology Access in Oliver Springs
Computing Device Access in Oliver Springs
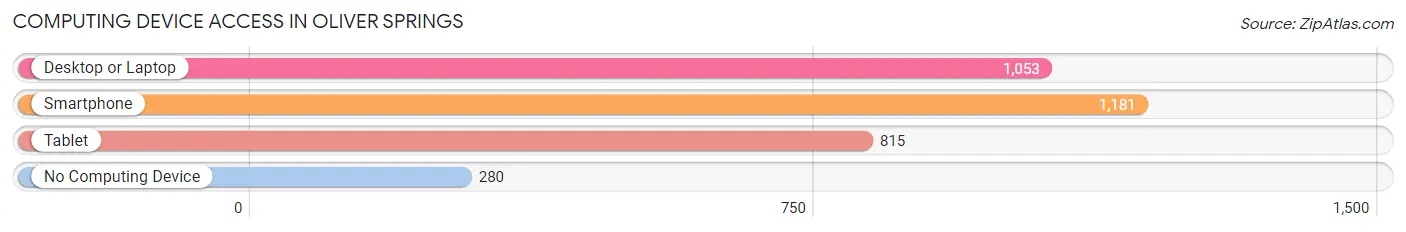
| Device Type | # Households | % Households |
| Desktop or Laptop | 1,053 | 69.1% |
| Smartphone | 1,181 | 77.4% |
| Tablet | 815 | 53.4% |
| No Computing Device | 280 | 18.4% |
| Total | 1,525 | 100.0% |
Internet Access in Oliver Springs
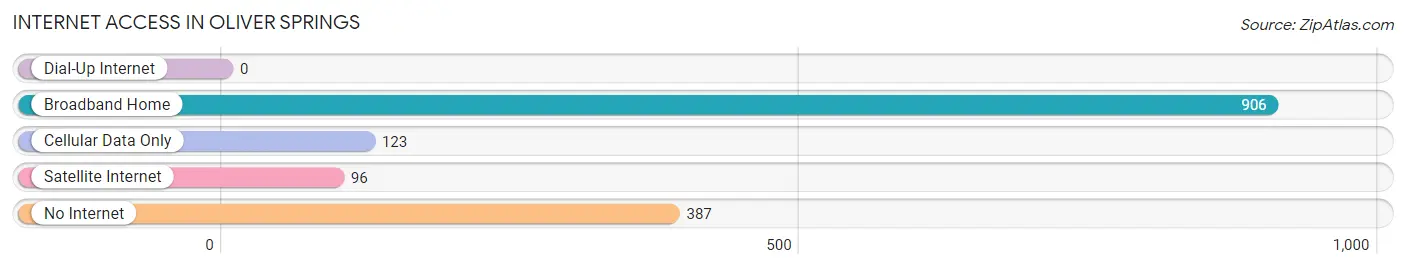
| Internet Type | # Households | % Households |
| Dial-Up Internet | 0 | 0.0% |
| Broadband Home | 906 | 59.4% |
| Cellular Data Only | 123 | 8.1% |
| Satellite Internet | 96 | 6.3% |
| No Internet | 387 | 25.4% |
| Total | 1,525 | 100.0% |
Oliver Springs Summary
Oliver Springs is a small town located in the foothills of the Appalachian Mountains in eastern Tennessee. It is situated in the northern part of Roane County, approximately 25 miles west of Knoxville. The town was founded in 1808 and named after Oliver Springs, a local landowner. The population of Oliver Springs was 2,717 at the 2010 census.
Geography
Oliver Springs is located at 35°51'25"N 84°25'17"W (35.856944, -84.421389). The town is situated in the northern part of Roane County, approximately 25 miles west of Knoxville. The town is located in the foothills of the Appalachian Mountains and is surrounded by the Clinch River and its tributaries. The town is located at an elevation of 890 feet above sea level.
Climate
Oliver Springs has a humid subtropical climate, with hot, humid summers and mild winters. The average annual temperature is 57.2°F, with an average high of 79.2°F in July and an average low of 35.2°F in January. The average annual precipitation is 45.2 inches, with an average of 4.2 inches of snowfall per year.
History
Oliver Springs was founded in 1808 and named after Oliver Springs, a local landowner. The town was originally a farming community, but in the late 19th century, the coal industry began to take off in the area. The town was incorporated in 1891 and the first post office was established in 1892.
In the early 20th century, Oliver Springs was a major coal mining center. The town was home to several coal mines, including the Oliver Springs Coal Company, the Oliver Springs Coal and Coke Company, and the Oliver Springs Coal and Iron Company. The coal industry in Oliver Springs declined in the mid-20th century, and the last coal mine in the town closed in the 1970s.
Economy
Today, Oliver Springs is a small, rural town with a population of 2,717. The town's economy is largely based on agriculture and tourism. The town is home to several small businesses, including restaurants, retail stores, and a few manufacturing companies. The town is also home to the Oliver Springs Golf Course, which is a popular destination for golfers from around the region.
Demographics
As of the 2010 census, the population of Oliver Springs was 2,717. The racial makeup of the town was 95.2% White, 2.2% African American, 0.3% Native American, 0.2% Asian, 0.1% Pacific Islander, 0.7% from other races, and 1.3% from two or more races. Hispanic or Latino of any race were 1.7% of the population.
The median income for a household in Oliver Springs was $30,938, and the median income for a family was $37,917. The per capita income for the town was $17,845. About 17.2% of families and 20.2% of the population were below the poverty line, including 28.2% of those under age 18 and 16.2% of those age 65 or over.
Common Questions
What is Per Capita Income in Oliver Springs?
Per Capita income in Oliver Springs is $23,477.
What is the Median Family Income in Oliver Springs?
Median Family Income in Oliver Springs is $55,556.
What is the Median Household income in Oliver Springs?
Median Household Income in Oliver Springs is $47,690.
What is Income or Wage Gap in Oliver Springs?
Income or Wage Gap in Oliver Springs is 39.8%.
Women in Oliver Springs earn 60.2 cents for every dollar earned by a man.
What is Inequality or Gini Index in Oliver Springs?
Inequality or Gini Index in Oliver Springs is 0.44.
What is the Total Population of Oliver Springs?
Total Population of Oliver Springs is 3,727.
What is the Total Male Population of Oliver Springs?
Total Male Population of Oliver Springs is 1,946.
What is the Total Female Population of Oliver Springs?
Total Female Population of Oliver Springs is 1,781.
What is the Ratio of Males per 100 Females in Oliver Springs?
There are 109.26 Males per 100 Females in Oliver Springs.
What is the Ratio of Females per 100 Males in Oliver Springs?
There are 91.52 Females per 100 Males in Oliver Springs.
What is the Median Population Age in Oliver Springs?
Median Population Age in Oliver Springs is 45.2 Years.
What is the Average Family Size in Oliver Springs
Average Family Size in Oliver Springs is 3.1 People.
What is the Average Household Size in Oliver Springs
Average Household Size in Oliver Springs is 2.4 People.
How Large is the Labor Force in Oliver Springs?
There are 1,219 People in the Labor Forcein in Oliver Springs.
What is the Percentage of People in the Labor Force in Oliver Springs?
41.3% of People are in the Labor Force in Oliver Springs.
What is the Unemployment Rate in Oliver Springs?
Unemployment Rate in Oliver Springs is 6.1%.