Oakdale, TN Map & Demographics
Oakdale Map
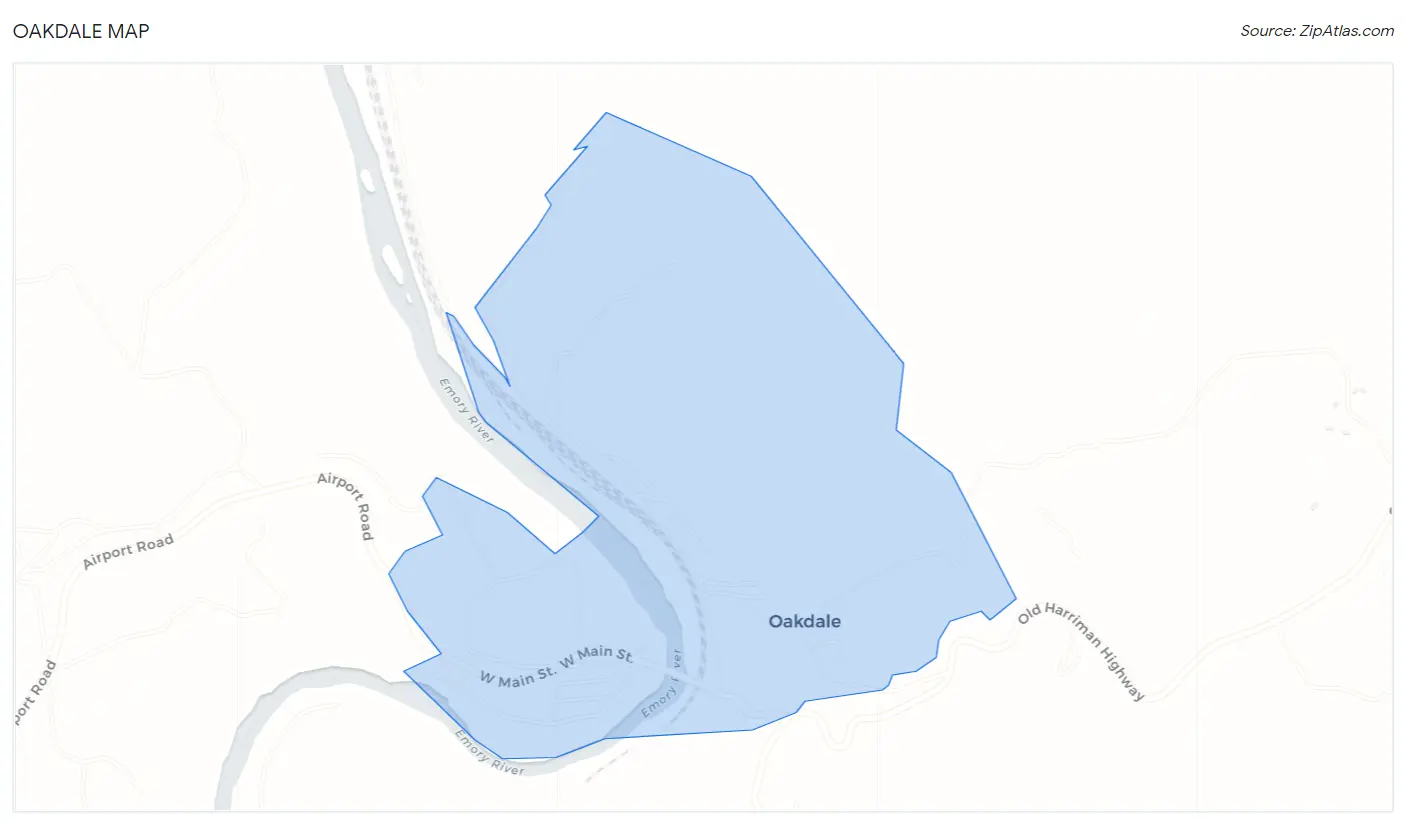
Oakdale Overview
$18,746
PER CAPITA INCOME
$52,750
AVG FAMILY INCOME
$49,063
AVG HOUSEHOLD INCOME
34.0%
WAGE / INCOME GAP [ % ]
66.0¢/ $1
WAGE / INCOME GAP [ $ ]
0.34
INEQUALITY / GINI INDEX
230
TOTAL POPULATION
103
MALE POPULATION
127
FEMALE POPULATION
81.10
MALES / 100 FEMALES
123.30
FEMALES / 100 MALES
41.3
MEDIAN AGE
3.1
AVG FAMILY SIZE
3.2
AVG HOUSEHOLD SIZE
93
LABOR FORCE [ PEOPLE ]
48.2%
PERCENT IN LABOR FORCE
5.4%
UNEMPLOYMENT RATE
Oakdale Zip Codes
Oakdale Area Codes
Income in Oakdale
Income Overview in Oakdale
Per Capita Income in Oakdale is $18,746, while median incomes of families and households are $52,750 and $49,063 respectively.
| Characteristic | Number | Measure |
| Per Capita Income | 230 | $18,746 |
| Median Family Income | 55 | $52,750 |
| Mean Family Income | 55 | $59,335 |
| Median Household Income | 72 | $49,063 |
| Mean Household Income | 72 | $56,572 |
| Income Deficit | 55 | $0 |
| Wage / Income Gap (%) | 230 | 34.04% |
| Wage / Income Gap ($) | 230 | 65.96¢ per $1 |
| Gini / Inequality Index | 230 | 0.34 |
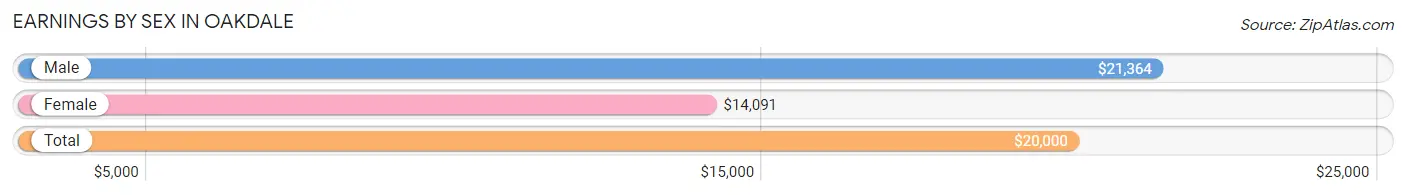
Earnings by Sex in Oakdale
Average Earnings in Oakdale are $20,000, $21,364 for men and $14,091 for women, a difference of 34.0%.
| Sex | Number | Average Earnings |
| Male | 54 (48.2%) | $21,364 |
| Female | 58 (51.8%) | $14,091 |
| Total | 112 (100.0%) | $20,000 |
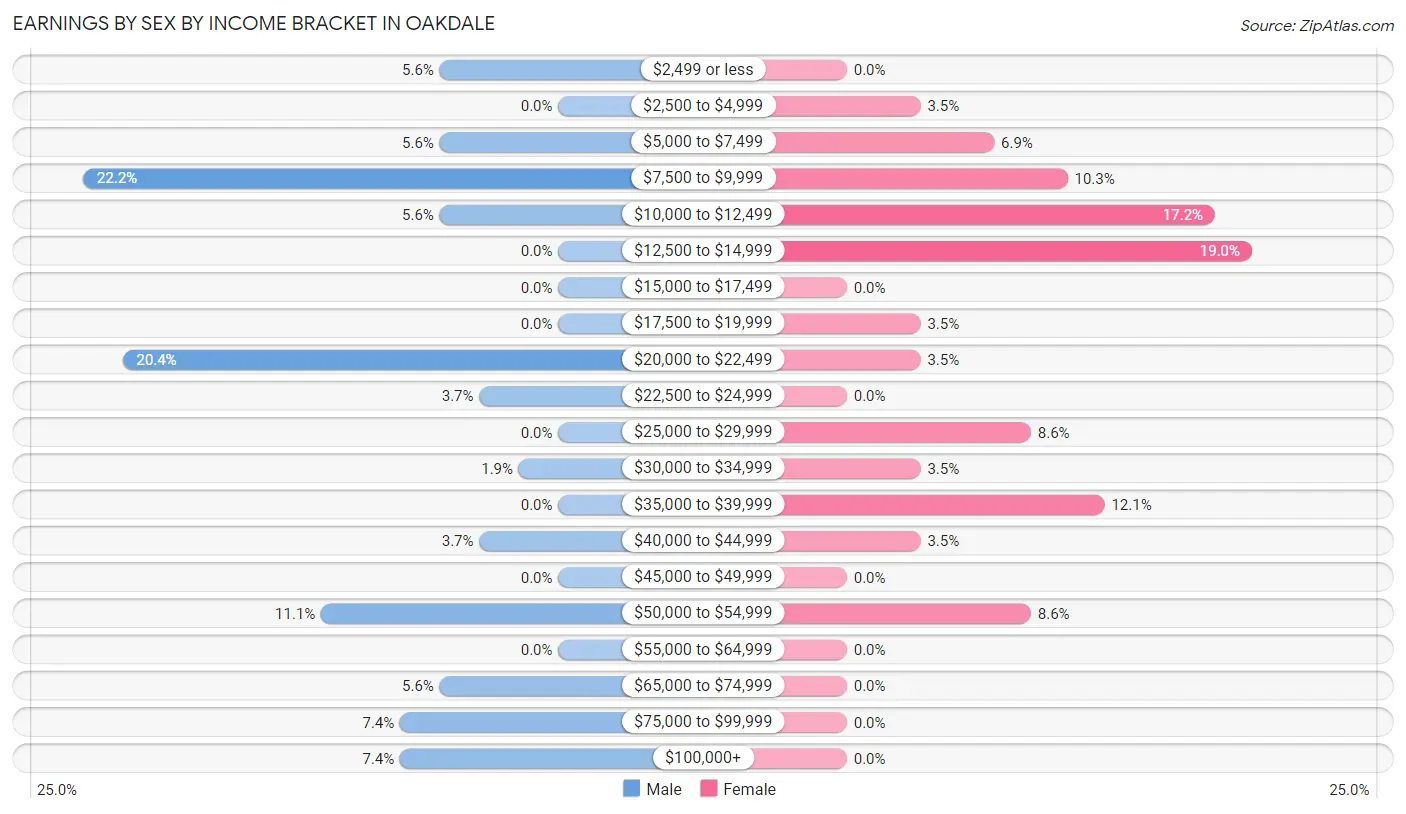
Earnings by Sex by Income Bracket in Oakdale
The most common earnings brackets in Oakdale are $7,500 to $9,999 for men (12 | 22.2%) and $12,500 to $14,999 for women (11 | 19.0%).
| Income | Male | Female |
| $2,499 or less | 3 (5.6%) | 0 (0.0%) |
| $2,500 to $4,999 | 0 (0.0%) | 2 (3.5%) |
| $5,000 to $7,499 | 3 (5.6%) | 4 (6.9%) |
| $7,500 to $9,999 | 12 (22.2%) | 6 (10.3%) |
| $10,000 to $12,499 | 3 (5.6%) | 10 (17.2%) |
| $12,500 to $14,999 | 0 (0.0%) | 11 (19.0%) |
| $15,000 to $17,499 | 0 (0.0%) | 0 (0.0%) |
| $17,500 to $19,999 | 0 (0.0%) | 2 (3.5%) |
| $20,000 to $22,499 | 11 (20.4%) | 2 (3.5%) |
| $22,500 to $24,999 | 2 (3.7%) | 0 (0.0%) |
| $25,000 to $29,999 | 0 (0.0%) | 5 (8.6%) |
| $30,000 to $34,999 | 1 (1.8%) | 2 (3.5%) |
| $35,000 to $39,999 | 0 (0.0%) | 7 (12.1%) |
| $40,000 to $44,999 | 2 (3.7%) | 2 (3.5%) |
| $45,000 to $49,999 | 0 (0.0%) | 0 (0.0%) |
| $50,000 to $54,999 | 6 (11.1%) | 5 (8.6%) |
| $55,000 to $64,999 | 0 (0.0%) | 0 (0.0%) |
| $65,000 to $74,999 | 3 (5.6%) | 0 (0.0%) |
| $75,000 to $99,999 | 4 (7.4%) | 0 (0.0%) |
| $100,000+ | 4 (7.4%) | 0 (0.0%) |
| Total | 54 (100.0%) | 58 (100.0%) |
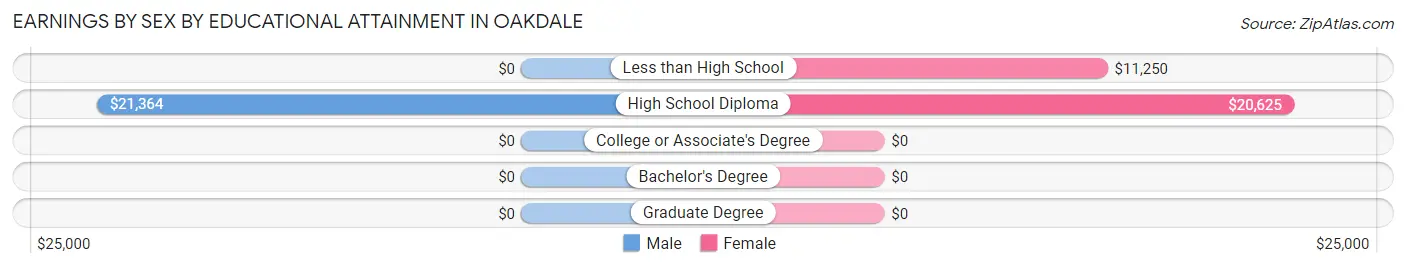
Earnings by Sex by Educational Attainment in Oakdale
| Educational Attainment | Male Income | Female Income |
| Less than High School | - | - |
| High School Diploma | $21,364 | $20,625 |
| College or Associate's Degree | - | - |
| Bachelor's Degree | - | - |
| Graduate Degree | - | - |
| Total | - | - |
Family Income in Oakdale
Family Income Brackets in Oakdale
According to the Oakdale family income data, there are 13 families falling into the $50,000 to $74,999 income range, which is the most common income bracket and makes up 23.6% of all families.
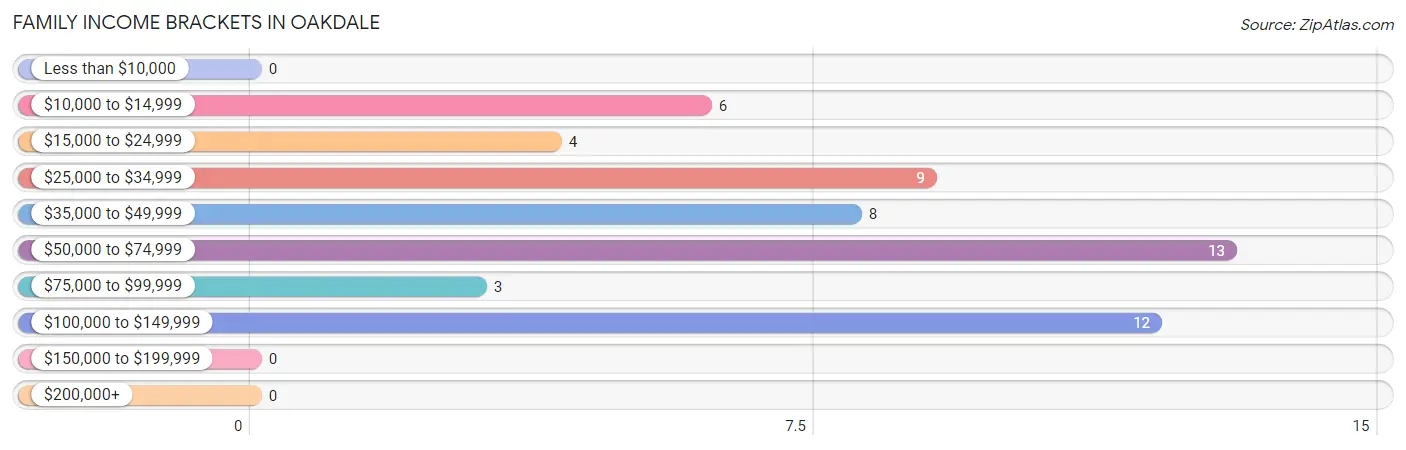
| Income Bracket | # Families | % Families |
| Less than $10,000 | 0 | 0.0% |
| $10,000 to $14,999 | 6 | 10.9% |
| $15,000 to $24,999 | 4 | 7.3% |
| $25,000 to $34,999 | 9 | 16.4% |
| $35,000 to $49,999 | 8 | 14.5% |
| $50,000 to $74,999 | 13 | 23.6% |
| $75,000 to $99,999 | 3 | 5.5% |
| $100,000 to $149,999 | 12 | 21.8% |
| $150,000 to $199,999 | 0 | 0.0% |
| $200,000+ | 0 | 0.0% |
Family Income by Famaliy Size in Oakdale
5-person families (9 | 16.4%) account for the highest median family income in Oakdale with $114,583 per family, while 2-person families (27 | 49.1%) have the highest median income of $23,906 per family member.
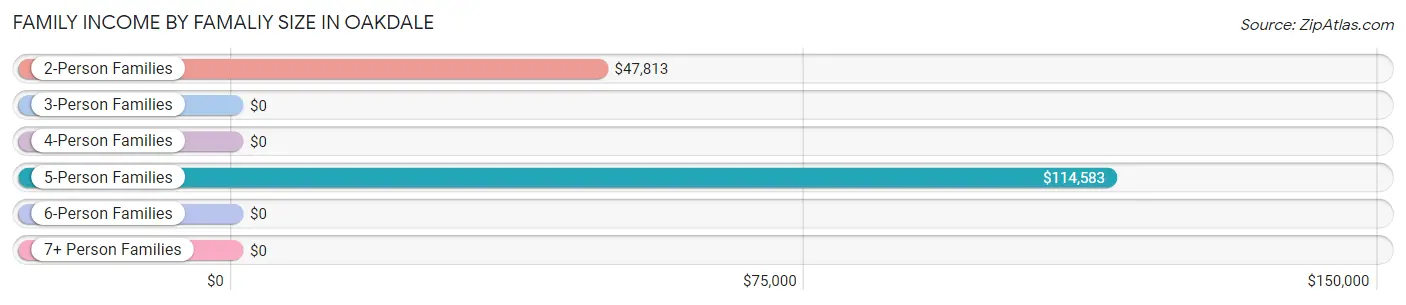
| Income Bracket | # Families | Median Income |
| 2-Person Families | 27 (49.1%) | $47,813 |
| 3-Person Families | 12 (21.8%) | $0 |
| 4-Person Families | 7 (12.7%) | $0 |
| 5-Person Families | 9 (16.4%) | $114,583 |
| 6-Person Families | 0 (0.0%) | $0 |
| 7+ Person Families | 0 (0.0%) | $0 |
| Total | 55 (100.0%) | $52,750 |
Family Income by Number of Earners in Oakdale
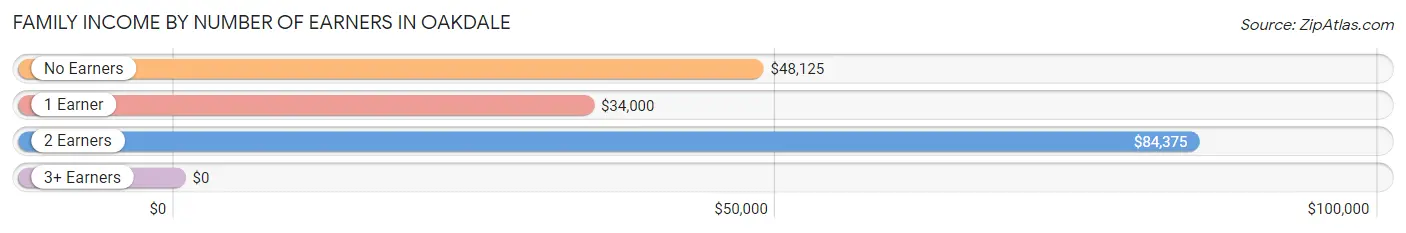
| Number of Earners | # Families | Median Income |
| No Earners | 12 (21.8%) | $48,125 |
| 1 Earner | 20 (36.4%) | $34,000 |
| 2 Earners | 17 (30.9%) | $84,375 |
| 3+ Earners | 6 (10.9%) | $0 |
| Total | 55 (100.0%) | $52,750 |
Household Income in Oakdale
Household Income Brackets in Oakdale
With 14 households falling in the category, the $25,000 to $34,999 income range is the most frequent in Oakdale, accounting for 19.4% of all households.
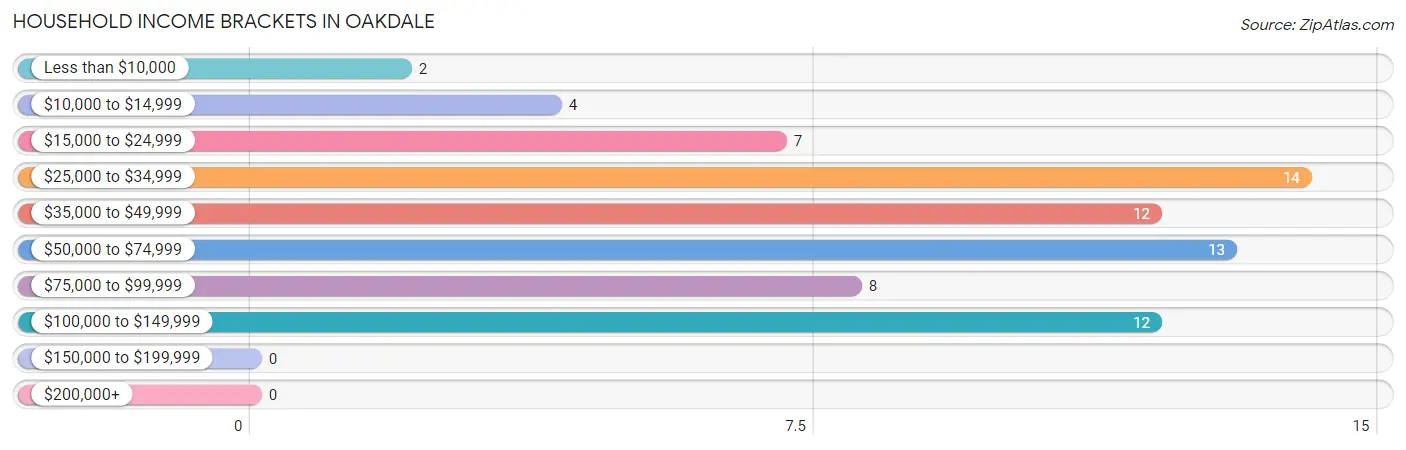
| Income Bracket | # Households | % Households |
| Less than $10,000 | 2 | 2.8% |
| $10,000 to $14,999 | 4 | 5.6% |
| $15,000 to $24,999 | 7 | 9.7% |
| $25,000 to $34,999 | 14 | 19.4% |
| $35,000 to $49,999 | 12 | 16.7% |
| $50,000 to $74,999 | 13 | 18.1% |
| $75,000 to $99,999 | 8 | 11.1% |
| $100,000 to $149,999 | 12 | 16.7% |
| $150,000 to $199,999 | 0 | 0.0% |
| $200,000+ | 0 | 0.0% |
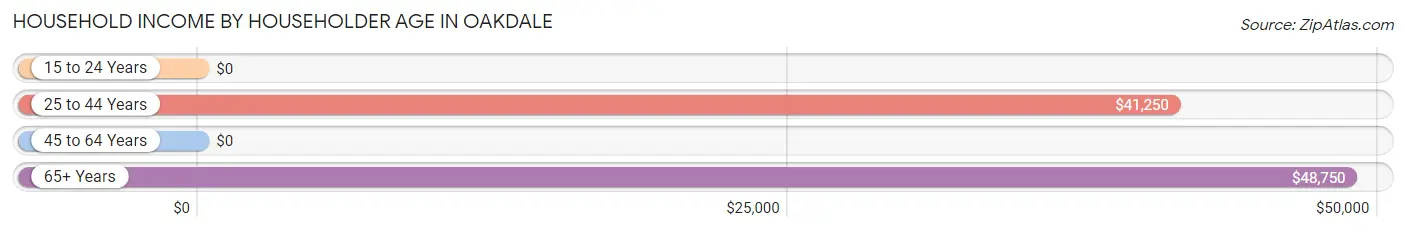
Household Income by Householder Age in Oakdale
The median household income in Oakdale is $49,063, with the highest median household income of $48,750 found in the 65+ years age bracket for the primary householder. A total of 24 households (33.3%) fall into this category. Meanwhile, the 15 to 24 years age bracket for the primary householder has the lowest median household income of $0, with 2 households (2.8%) in this group.
| Income Bracket | # Households | Median Income |
| 15 to 24 Years | 2 (2.8%) | $0 |
| 25 to 44 Years | 14 (19.4%) | $41,250 |
| 45 to 64 Years | 32 (44.4%) | $0 |
| 65+ Years | 24 (33.3%) | $48,750 |
| Total | 72 (100.0%) | $49,063 |
Poverty in Oakdale
Income Below Poverty by Sex and Age in Oakdale
With 9.2% poverty level for males and 15.4% for females among the residents of Oakdale, 16 and 17 year old males and 12 to 14 year old females are the most vulnerable to poverty, with 2 males (40.0%) and 5 females (62.5%) in their respective age groups living below the poverty level.
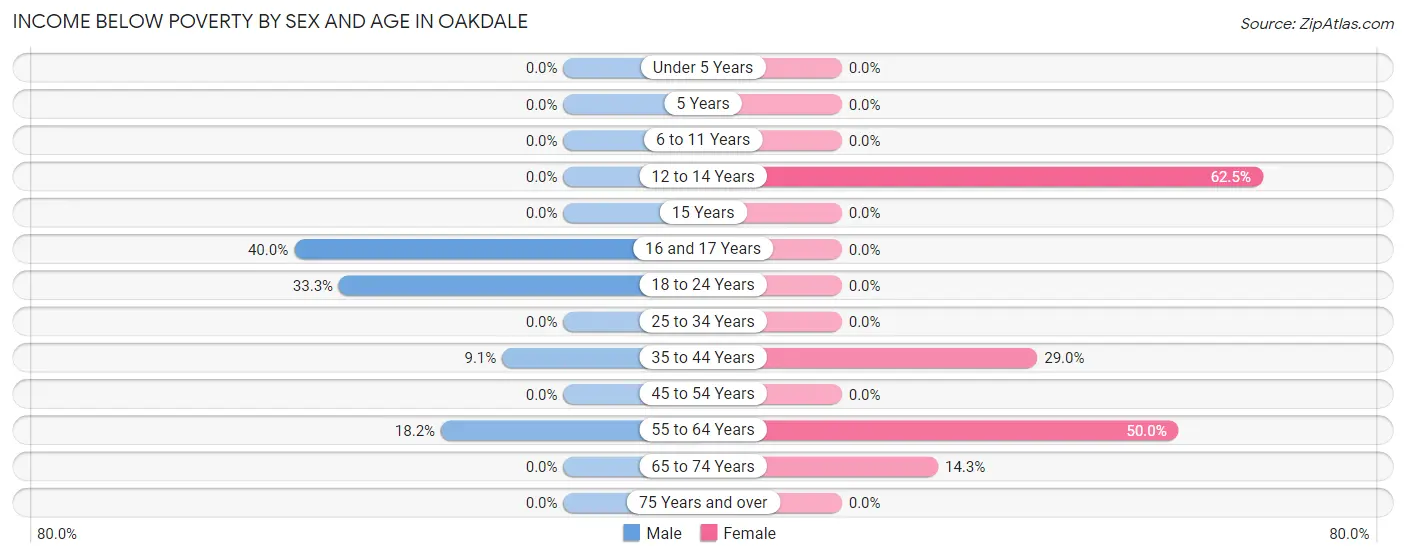
| Age Bracket | Male | Female |
| Under 5 Years | 0 (0.0%) | 0 (0.0%) |
| 5 Years | 0 (0.0%) | 0 (0.0%) |
| 6 to 11 Years | 0 (0.0%) | 0 (0.0%) |
| 12 to 14 Years | 0 (0.0%) | 5 (62.5%) |
| 15 Years | 0 (0.0%) | 0 (0.0%) |
| 16 and 17 Years | 2 (40.0%) | 0 (0.0%) |
| 18 to 24 Years | 3 (33.3%) | 0 (0.0%) |
| 25 to 34 Years | 0 (0.0%) | 0 (0.0%) |
| 35 to 44 Years | 2 (9.1%) | 9 (29.0%) |
| 45 to 54 Years | 0 (0.0%) | 0 (0.0%) |
| 55 to 64 Years | 2 (18.2%) | 2 (50.0%) |
| 65 to 74 Years | 0 (0.0%) | 2 (14.3%) |
| 75 Years and over | 0 (0.0%) | 0 (0.0%) |
| Total | 9 (9.2%) | 18 (15.4%) |
Income Above Poverty by Sex and Age in Oakdale
According to the poverty statistics in Oakdale, males aged 5 years and females aged under 5 years are the age groups that are most secure financially, with 100.0% of males and 100.0% of females in these age groups living above the poverty line.
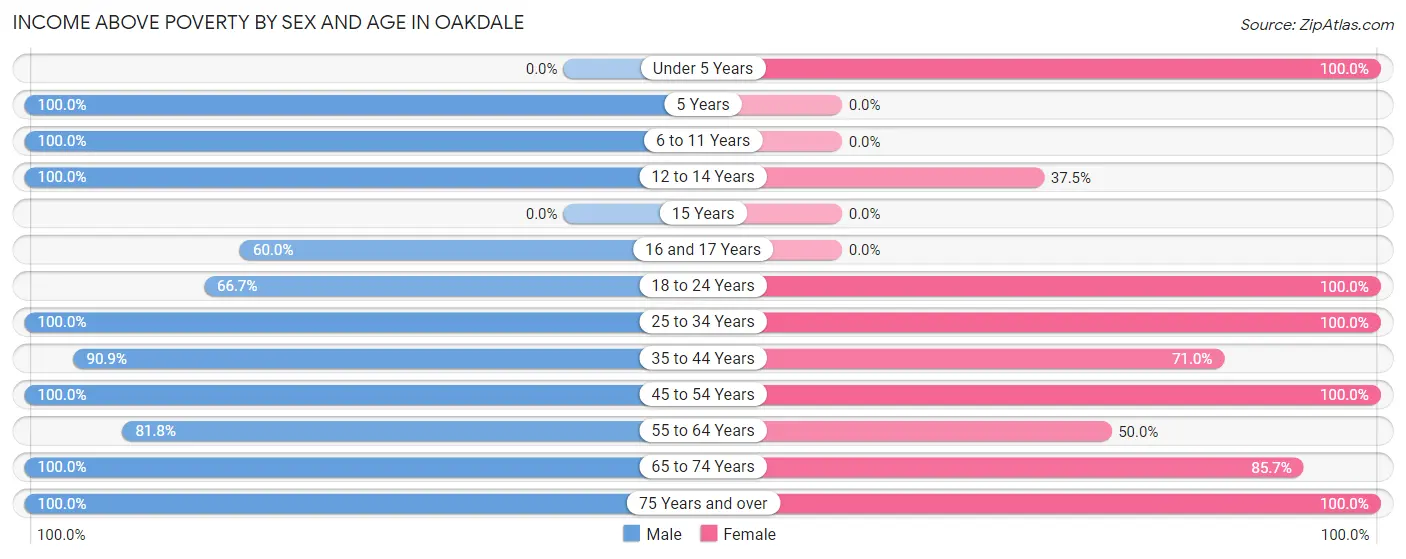
| Age Bracket | Male | Female |
| Under 5 Years | 0 (0.0%) | 2 (100.0%) |
| 5 Years | 1 (100.0%) | 0 (0.0%) |
| 6 to 11 Years | 9 (100.0%) | 0 (0.0%) |
| 12 to 14 Years | 2 (100.0%) | 3 (37.5%) |
| 15 Years | 0 (0.0%) | 0 (0.0%) |
| 16 and 17 Years | 3 (60.0%) | 0 (0.0%) |
| 18 to 24 Years | 6 (66.7%) | 8 (100.0%) |
| 25 to 34 Years | 3 (100.0%) | 13 (100.0%) |
| 35 to 44 Years | 20 (90.9%) | 22 (71.0%) |
| 45 to 54 Years | 25 (100.0%) | 27 (100.0%) |
| 55 to 64 Years | 9 (81.8%) | 2 (50.0%) |
| 65 to 74 Years | 6 (100.0%) | 12 (85.7%) |
| 75 Years and over | 5 (100.0%) | 10 (100.0%) |
| Total | 89 (90.8%) | 99 (84.6%) |
Income Below Poverty Among Married-Couple Families in Oakdale
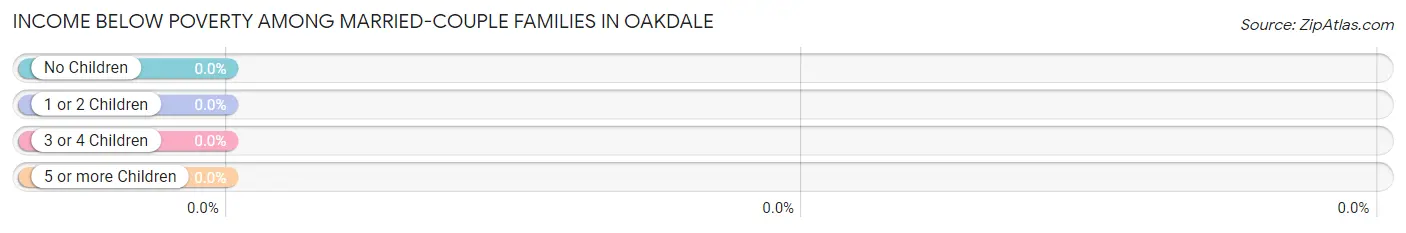
| Children | Above Poverty | Below Poverty |
| No Children | 20 (100.0%) | 0 (0.0%) |
| 1 or 2 Children | 9 (100.0%) | 0 (0.0%) |
| 3 or 4 Children | 0 (0.0%) | 0 (0.0%) |
| 5 or more Children | 0 (0.0%) | 0 (0.0%) |
| Total | 29 (100.0%) | 0 (0.0%) |
Income Below Poverty Among Single-Parent Households in Oakdale
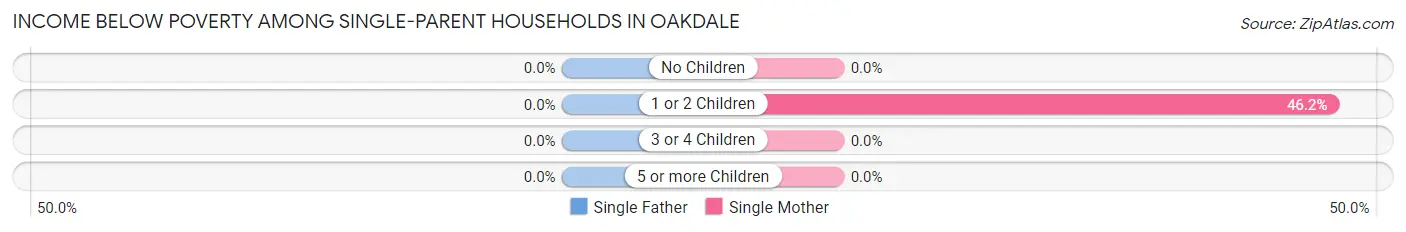
| Children | Single Father | Single Mother |
| No Children | 0 (0.0%) | 0 (0.0%) |
| 1 or 2 Children | 0 (0.0%) | 6 (46.2%) |
| 3 or 4 Children | 0 (0.0%) | 0 (0.0%) |
| 5 or more Children | 0 (0.0%) | 0 (0.0%) |
| Total | 0 (0.0%) | 6 (31.6%) |
Income Below Poverty Among Married-Couple vs Single-Parent Households in Oakdale
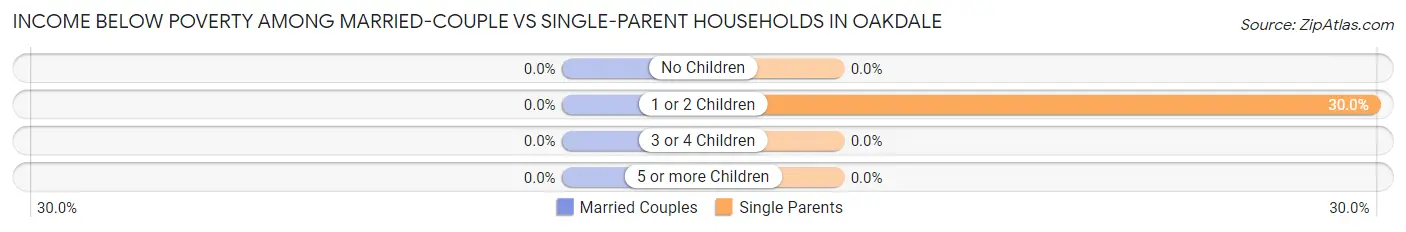
| Children | Married-Couple Families | Single-Parent Households |
| No Children | 0 (0.0%) | 0 (0.0%) |
| 1 or 2 Children | 0 (0.0%) | 6 (30.0%) |
| 3 or 4 Children | 0 (0.0%) | 0 (0.0%) |
| 5 or more Children | 0 (0.0%) | 0 (0.0%) |
| Total | 0 (0.0%) | 6 (23.1%) |
Race in Oakdale
The most populous races in Oakdale are White / Caucasian (219 | 95.2%), Hispanic or Latino (10 | 4.3%), and Two or more Races (10 | 4.3%).
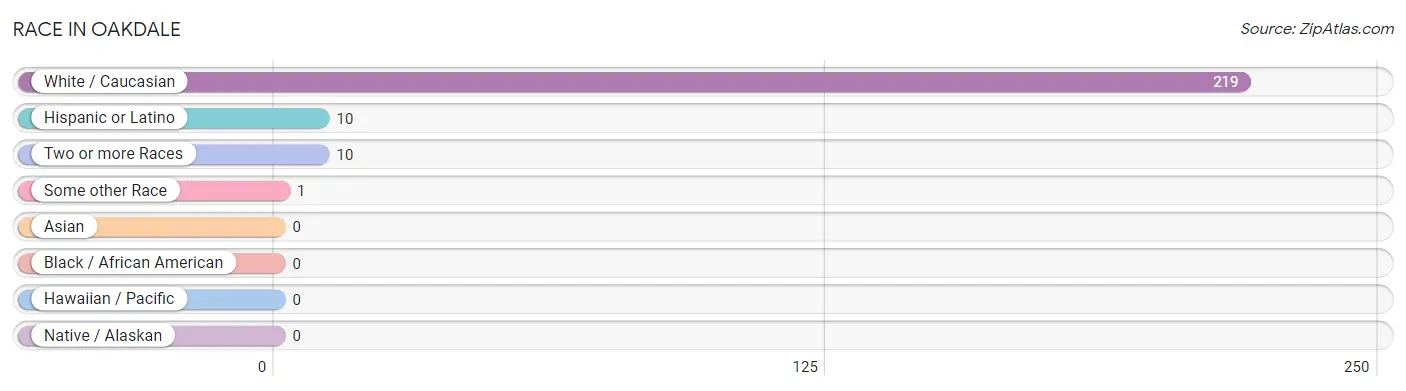
| Race | # Population | % Population |
| Asian | 0 | 0.0% |
| Black / African American | 0 | 0.0% |
| Hawaiian / Pacific | 0 | 0.0% |
| Hispanic or Latino | 10 | 4.3% |
| Native / Alaskan | 0 | 0.0% |
| White / Caucasian | 219 | 95.2% |
| Two or more Races | 10 | 4.3% |
| Some other Race | 1 | 0.4% |
| Total | 230 | 100.0% |
Ancestry in Oakdale
The most populous ancestries reported in Oakdale are German (80 | 34.8%), English (40 | 17.4%), American (28 | 12.2%), Dutch (10 | 4.3%), and Irish (9 | 3.9%), together accounting for 72.6% of all Oakdale residents.
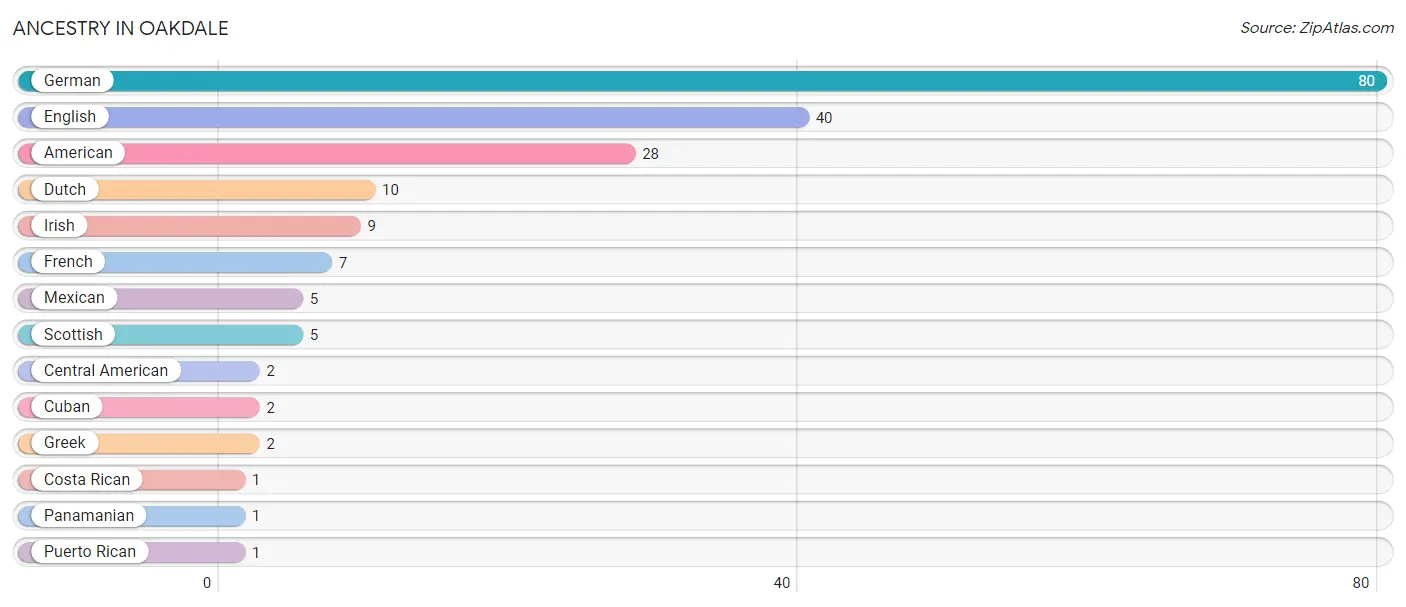
| Ancestry | # Population | % Population |
| American | 28 | 12.2% |
| Central American | 2 | 0.9% |
| Costa Rican | 1 | 0.4% |
| Cuban | 2 | 0.9% |
| Dutch | 10 | 4.3% |
| English | 40 | 17.4% |
| French | 7 | 3.0% |
| German | 80 | 34.8% |
| Greek | 2 | 0.9% |
| Irish | 9 | 3.9% |
| Mexican | 5 | 2.2% |
| Panamanian | 1 | 0.4% |
| Puerto Rican | 1 | 0.4% |
| Scottish | 5 | 2.2% | View All 14 Rows |
Immigrants in Oakdale
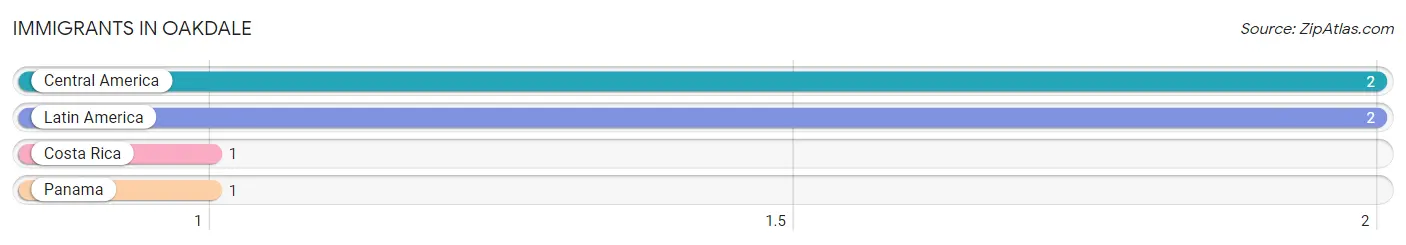
The most numerous immigrant groups reported in Oakdale came from Central America (2 | 0.9%), Latin America (2 | 0.9%), Costa Rica (1 | 0.4%), and Panama (1 | 0.4%), together accounting for 2.6% of all Oakdale residents.
| Immigration Origin | # Population | % Population |
| Central America | 2 | 0.9% |
| Costa Rica | 1 | 0.4% |
| Latin America | 2 | 0.9% |
| Panama | 1 | 0.4% | View All 4 Rows |
Sex and Age in Oakdale
Sex and Age in Oakdale
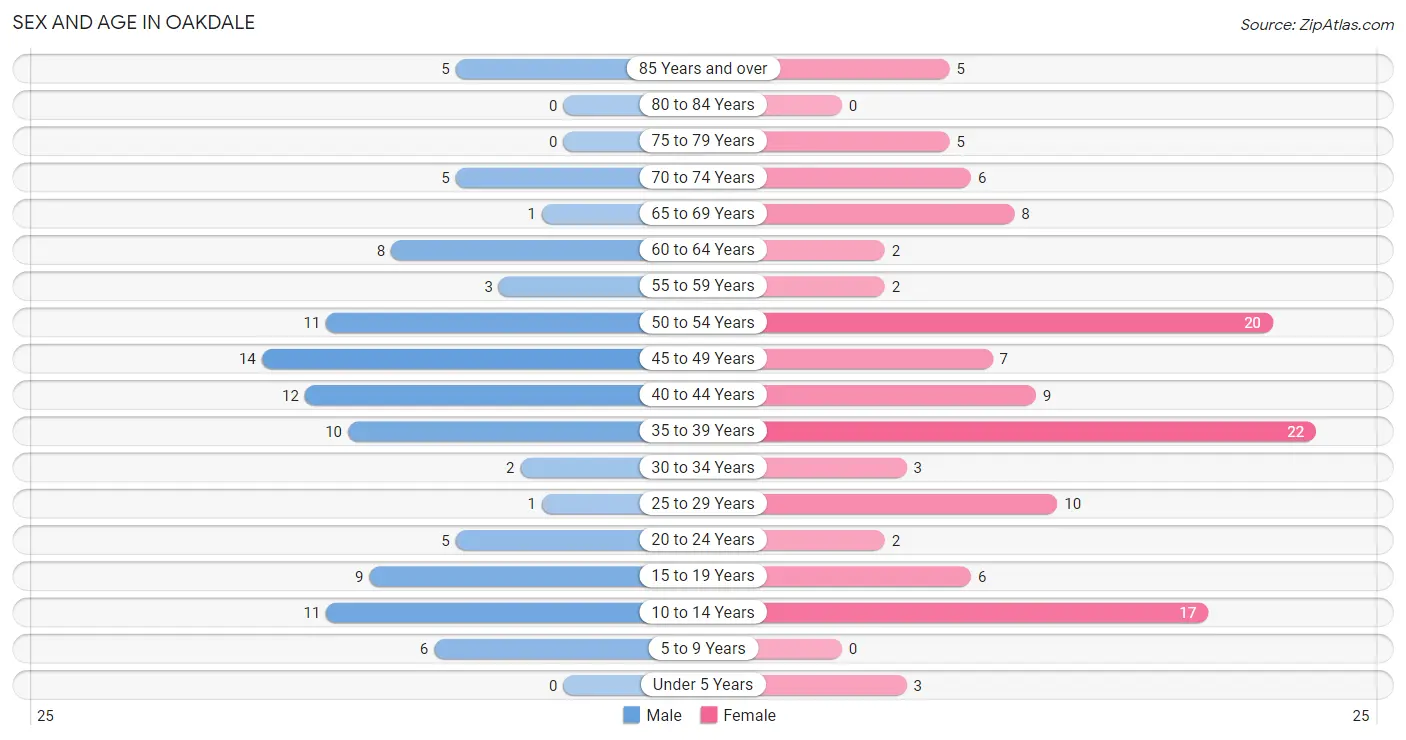
The most populous age groups in Oakdale are 45 to 49 Years (14 | 13.6%) for men and 35 to 39 Years (22 | 17.3%) for women.
| Age Bracket | Male | Female |
| Under 5 Years | 0 (0.0%) | 3 (2.4%) |
| 5 to 9 Years | 6 (5.8%) | 0 (0.0%) |
| 10 to 14 Years | 11 (10.7%) | 17 (13.4%) |
| 15 to 19 Years | 9 (8.7%) | 6 (4.7%) |
| 20 to 24 Years | 5 (4.9%) | 2 (1.6%) |
| 25 to 29 Years | 1 (1.0%) | 10 (7.9%) |
| 30 to 34 Years | 2 (1.9%) | 3 (2.4%) |
| 35 to 39 Years | 10 (9.7%) | 22 (17.3%) |
| 40 to 44 Years | 12 (11.7%) | 9 (7.1%) |
| 45 to 49 Years | 14 (13.6%) | 7 (5.5%) |
| 50 to 54 Years | 11 (10.7%) | 20 (15.8%) |
| 55 to 59 Years | 3 (2.9%) | 2 (1.6%) |
| 60 to 64 Years | 8 (7.8%) | 2 (1.6%) |
| 65 to 69 Years | 1 (1.0%) | 8 (6.3%) |
| 70 to 74 Years | 5 (4.9%) | 6 (4.7%) |
| 75 to 79 Years | 0 (0.0%) | 5 (3.9%) |
| 80 to 84 Years | 0 (0.0%) | 0 (0.0%) |
| 85 Years and over | 5 (4.9%) | 5 (3.9%) |
| Total | 103 (100.0%) | 127 (100.0%) |
Families and Households in Oakdale
Median Family Size in Oakdale
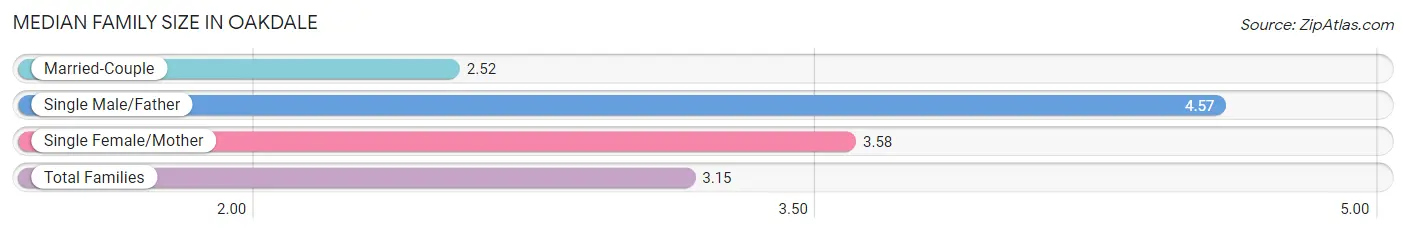
The median family size in Oakdale is 3.15 persons per family, with single male/father families (7 | 12.7%) accounting for the largest median family size of 4.57 persons per family. On the other hand, married-couple families (29 | 52.7%) represent the smallest median family size with 2.52 persons per family.
| Family Type | # Families | Family Size |
| Married-Couple | 29 (52.7%) | 2.52 |
| Single Male/Father | 7 (12.7%) | 4.57 |
| Single Female/Mother | 19 (34.5%) | 3.58 |
| Total Families | 55 (100.0%) | 3.15 |
Median Household Size in Oakdale
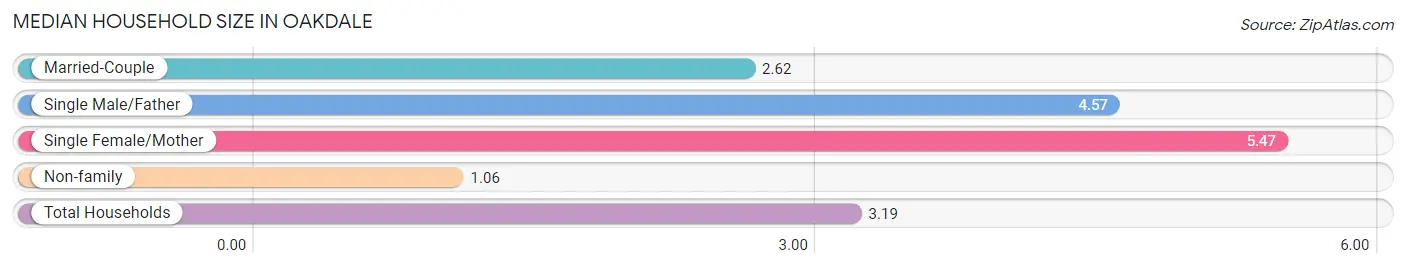
The median household size in Oakdale is 3.19 persons per household, with single female/mother households (19 | 26.4%) accounting for the largest median household size of 5.47 persons per household. non-family households (17 | 23.6%) represent the smallest median household size with 1.06 persons per household.
| Household Type | # Households | Household Size |
| Married-Couple | 29 (40.3%) | 2.62 |
| Single Male/Father | 7 (9.7%) | 4.57 |
| Single Female/Mother | 19 (26.4%) | 5.47 |
| Non-family | 17 (23.6%) | 1.06 |
| Total Households | 72 (100.0%) | 3.19 |
Household Size by Marriage Status in Oakdale
Out of a total of 72 households in Oakdale, 55 (76.4%) are family households, while 17 (23.6%) are nonfamily households. The most numerous type of family households are 5-person households, comprising 20, and the most common type of nonfamily households are 1-person households, comprising 15.
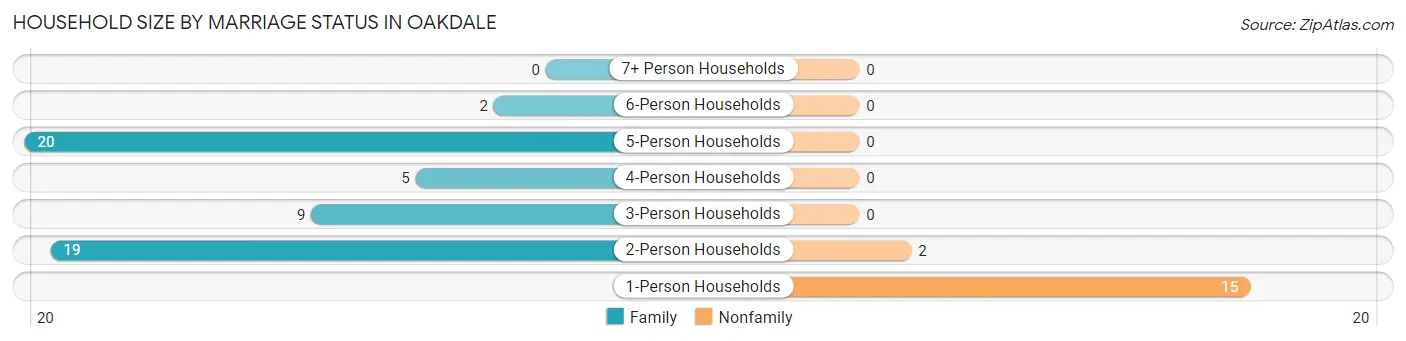
| Household Size | Family Households | Nonfamily Households |
| 1-Person Households | - | 15 (20.8%) |
| 2-Person Households | 19 (26.4%) | 2 (2.8%) |
| 3-Person Households | 9 (12.5%) | 0 (0.0%) |
| 4-Person Households | 5 (6.9%) | 0 (0.0%) |
| 5-Person Households | 20 (27.8%) | 0 (0.0%) |
| 6-Person Households | 2 (2.8%) | 0 (0.0%) |
| 7+ Person Households | 0 (0.0%) | 0 (0.0%) |
| Total | 55 (76.4%) | 17 (23.6%) |
Female Fertility in Oakdale
Fertility by Age in Oakdale
| Age Bracket | Women with Births | Births / 1,000 Women |
| 15 to 19 years | 0 (0.0%) | 0.0 |
| 20 to 34 years | 0 (0.0%) | 0.0 |
| 35 to 50 years | 0 (0.0%) | 0.0 |
| Total | 0 (0.0%) | 0.0 |
Fertility by Age by Marriage Status in Oakdale
| Age Bracket | Married | Unmarried |
| 15 to 19 years | 0 (0.0%) | 0 (0.0%) |
| 20 to 34 years | 0 (0.0%) | 0 (0.0%) |
| 35 to 50 years | 0 (0.0%) | 0 (0.0%) |
| Total | 0 (0.0%) | 0 (0.0%) |
Fertility by Education in Oakdale
| Educational Attainment | Women with Births | Births / 1,000 Women |
| Less than High School | 0 (0.0%) | 0.0 |
| High School Diploma | 0 (0.0%) | 0.0 |
| College or Associate's Degree | 0 (0.0%) | 0.0 |
| Bachelor's Degree | 0 (0.0%) | 0.0 |
| Graduate Degree | 0 (0.0%) | 0.0 |
| Total | 0 (0.0%) | 0.0 |
Fertility by Education by Marriage Status in Oakdale
| Educational Attainment | Married | Unmarried |
| Less than High School | 0 (0.0%) | 0 (0.0%) |
| High School Diploma | 0 (0.0%) | 0 (0.0%) |
| College or Associate's Degree | 0 (0.0%) | 0 (0.0%) |
| Bachelor's Degree | 0 (0.0%) | 0 (0.0%) |
| Graduate Degree | 0 (0.0%) | 0 (0.0%) |
| Total | 0 (0.0%) | 0 (0.0%) |
Employment Characteristics in Oakdale
Employment by Class of Employer in Oakdale
Among the 86 employed individuals in Oakdale, private company employees (74 | 86.1%), local government employees (11 | 12.8%), and federal government employees (1 | 1.2%) make up the most common classes of employment.
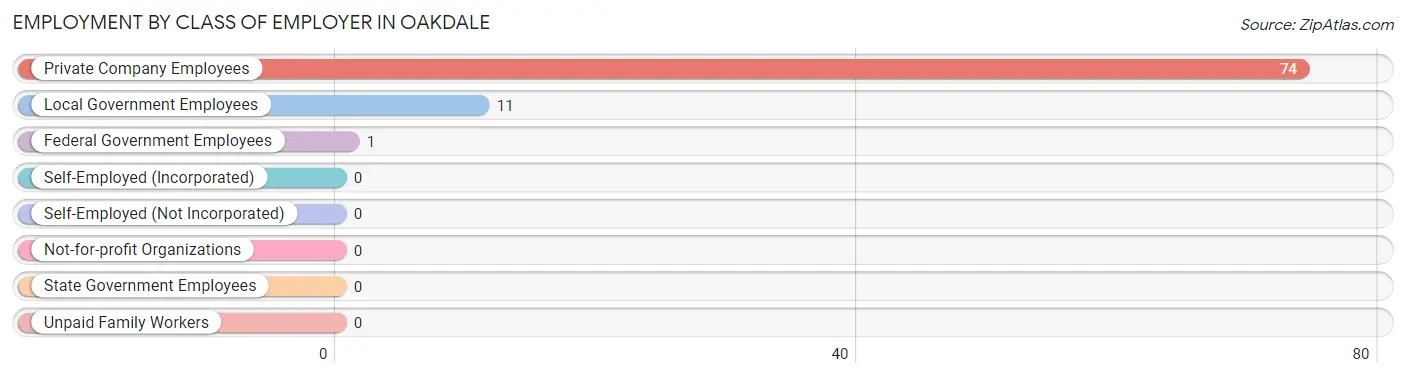
| Employer Class | # Employees | % Employees |
| Private Company Employees | 74 | 86.1% |
| Self-Employed (Incorporated) | 0 | 0.0% |
| Self-Employed (Not Incorporated) | 0 | 0.0% |
| Not-for-profit Organizations | 0 | 0.0% |
| Local Government Employees | 11 | 12.8% |
| State Government Employees | 0 | 0.0% |
| Federal Government Employees | 1 | 1.2% |
| Unpaid Family Workers | 0 | 0.0% |
| Total | 86 | 100.0% |
Employment Status by Age in Oakdale
According to the labor force statistics for Oakdale, out of the total population over 16 years of age (193), 48.2% or 93 individuals are in the labor force, with 5.4% or 5 of them unemployed. The age group with the highest labor force participation rate is 20 to 24 years, with 100.0% or 7 individuals in the labor force. Within the labor force, the 35 to 44 years age range has the highest percentage of unemployed individuals, with 17.2% or 5 of them being unemployed.
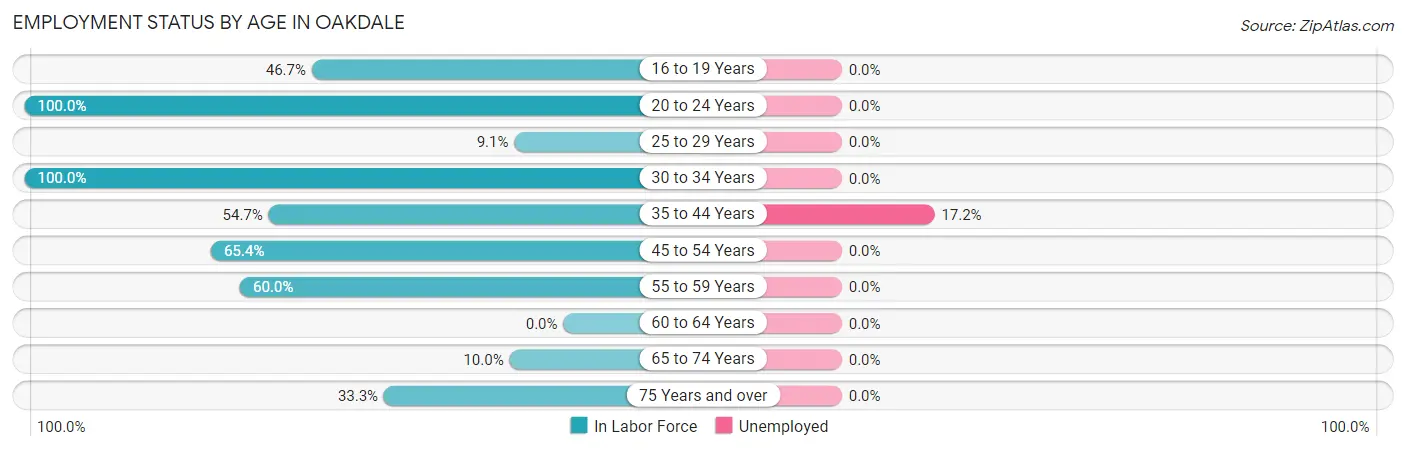
| Age Bracket | In Labor Force | Unemployed |
| 16 to 19 Years | 7 (46.7%) | 0 (0.0%) |
| 20 to 24 Years | 7 (100.0%) | 0 (0.0%) |
| 25 to 29 Years | 1 (9.1%) | 0 (0.0%) |
| 30 to 34 Years | 5 (100.0%) | 0 (0.0%) |
| 35 to 44 Years | 29 (54.7%) | 5 (17.2%) |
| 45 to 54 Years | 34 (65.4%) | 0 (0.0%) |
| 55 to 59 Years | 3 (60.0%) | 0 (0.0%) |
| 60 to 64 Years | 0 (0.0%) | 0 (0.0%) |
| 65 to 74 Years | 2 (10.0%) | 0 (0.0%) |
| 75 Years and over | 5 (33.3%) | 0 (0.0%) |
| Total | 93 (48.2%) | 5 (5.4%) |
Employment Status by Educational Attainment in Oakdale
According to labor force statistics for Oakdale, 52.9% of individuals (72) out of the total population between 25 and 64 years of age (136) are in the labor force, with 6.9% or 5 of them being unemployed. The group with the highest labor force participation rate are those with the educational attainment of bachelor's degree or higher, with 66.7% or 2 individuals in the labor force. Within the labor force, individuals with high school diploma education have the highest percentage of unemployment, with 8.9% or 4 of them being unemployed.
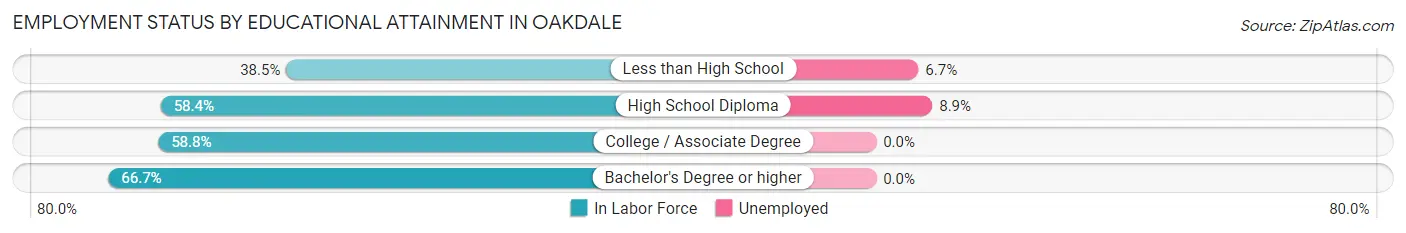
| Educational Attainment | In Labor Force | Unemployed |
| Less than High School | 15 (38.5%) | 3 (6.7%) |
| High School Diploma | 45 (58.4%) | 7 (8.9%) |
| College / Associate Degree | 10 (58.8%) | 0 (0.0%) |
| Bachelor's Degree or higher | 2 (66.7%) | 0 (0.0%) |
| Total | 72 (52.9%) | 9 (6.9%) |
Employment Occupations by Sex in Oakdale
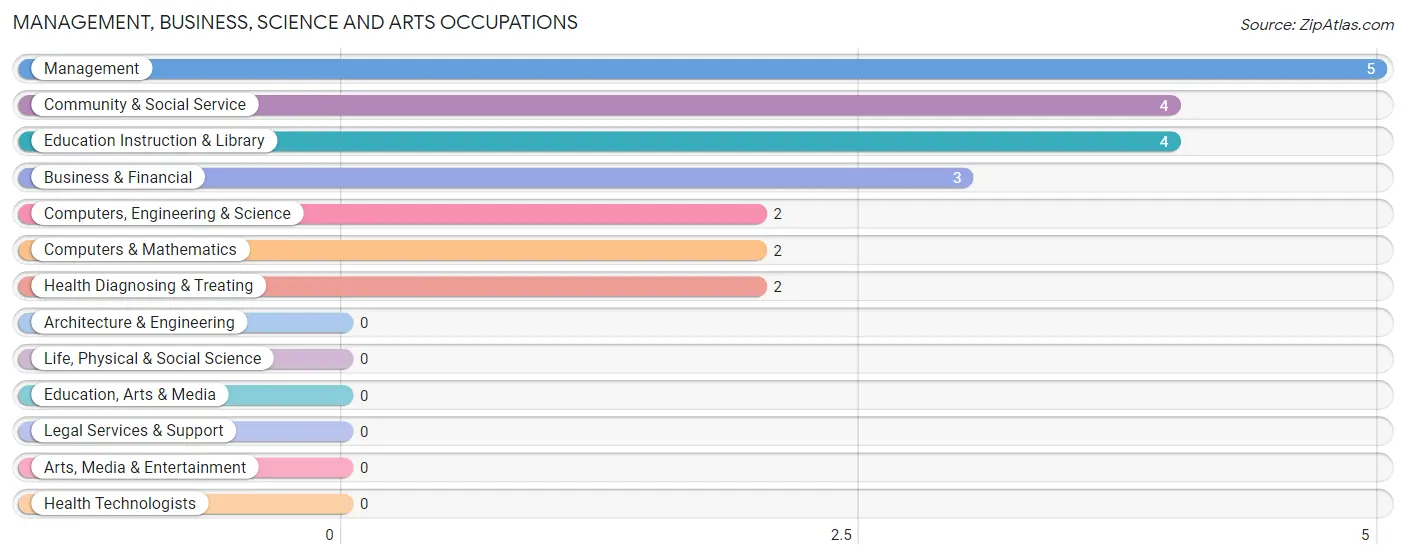
Management, Business, Science and Arts Occupations
The most common Management, Business, Science and Arts occupations in Oakdale are Management (5 | 5.7%), Community & Social Service (4 | 4.5%), Education Instruction & Library (4 | 4.5%), Business & Financial (3 | 3.4%), and Computers, Engineering & Science (2 | 2.3%).
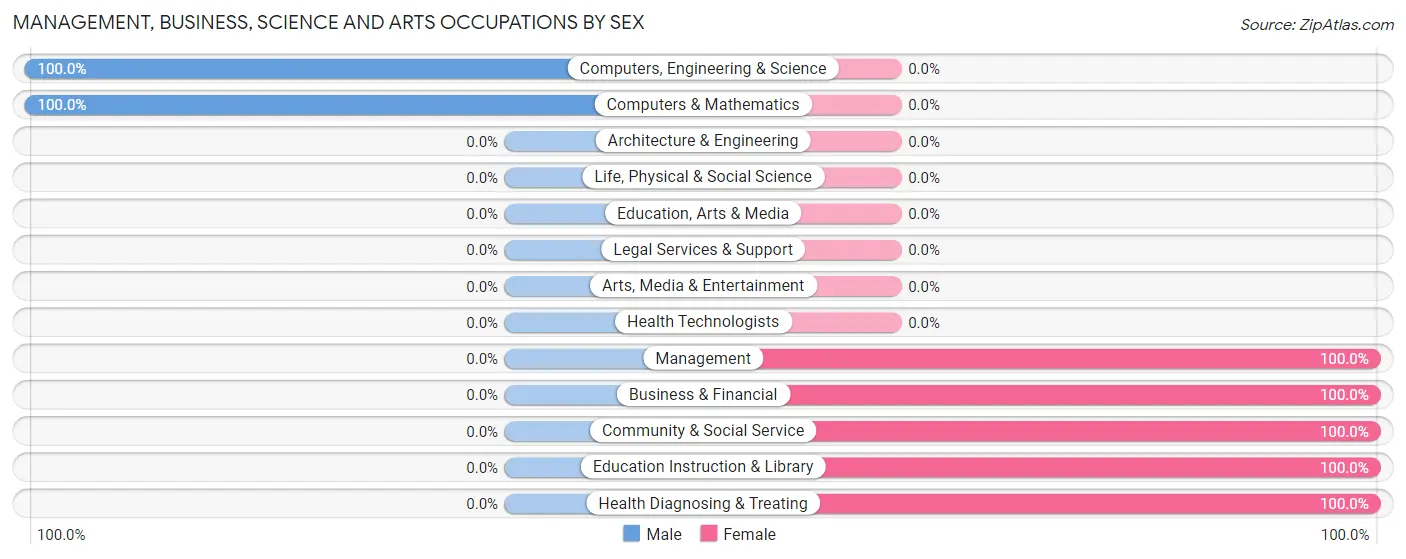
Management, Business, Science and Arts Occupations by Sex
Within the Management, Business, Science and Arts occupations in Oakdale, the most male-oriented occupations are Computers, Engineering & Science (100.0%), and Computers & Mathematics (100.0%), while the most female-oriented occupations are Management (100.0%), Business & Financial (100.0%), and Community & Social Service (100.0%).
| Occupation | Male | Female |
| Management | 0 (0.0%) | 5 (100.0%) |
| Business & Financial | 0 (0.0%) | 3 (100.0%) |
| Computers, Engineering & Science | 2 (100.0%) | 0 (0.0%) |
| Computers & Mathematics | 2 (100.0%) | 0 (0.0%) |
| Architecture & Engineering | 0 (0.0%) | 0 (0.0%) |
| Life, Physical & Social Science | 0 (0.0%) | 0 (0.0%) |
| Community & Social Service | 0 (0.0%) | 4 (100.0%) |
| Education, Arts & Media | 0 (0.0%) | 0 (0.0%) |
| Legal Services & Support | 0 (0.0%) | 0 (0.0%) |
| Education Instruction & Library | 0 (0.0%) | 4 (100.0%) |
| Arts, Media & Entertainment | 0 (0.0%) | 0 (0.0%) |
| Health Diagnosing & Treating | 0 (0.0%) | 2 (100.0%) |
| Health Technologists | 0 (0.0%) | 0 (0.0%) |
| Total (Category) | 2 (12.5%) | 14 (87.5%) |
| Total (Overall) | 39 (44.3%) | 49 (55.7%) |
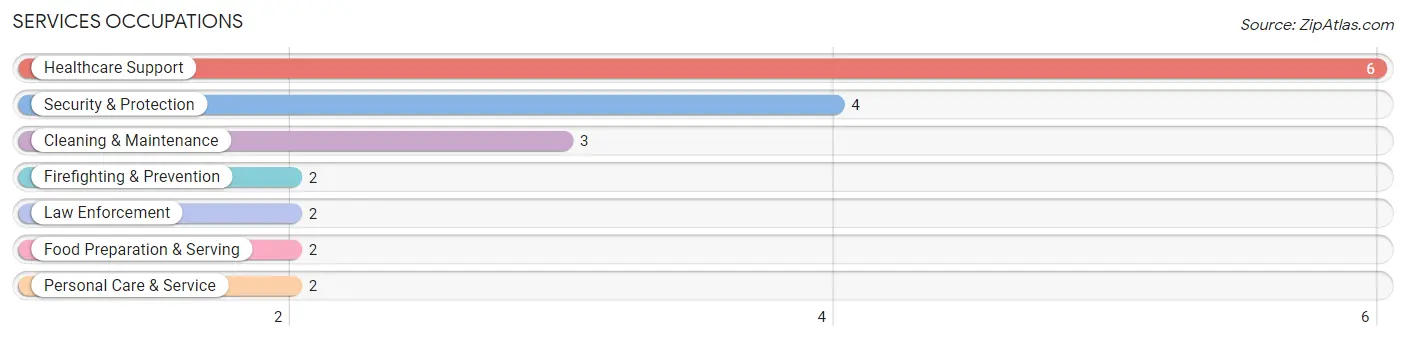
Services Occupations
The most common Services occupations in Oakdale are Healthcare Support (6 | 6.8%), Security & Protection (4 | 4.5%), Cleaning & Maintenance (3 | 3.4%), Firefighting & Prevention (2 | 2.3%), and Law Enforcement (2 | 2.3%).
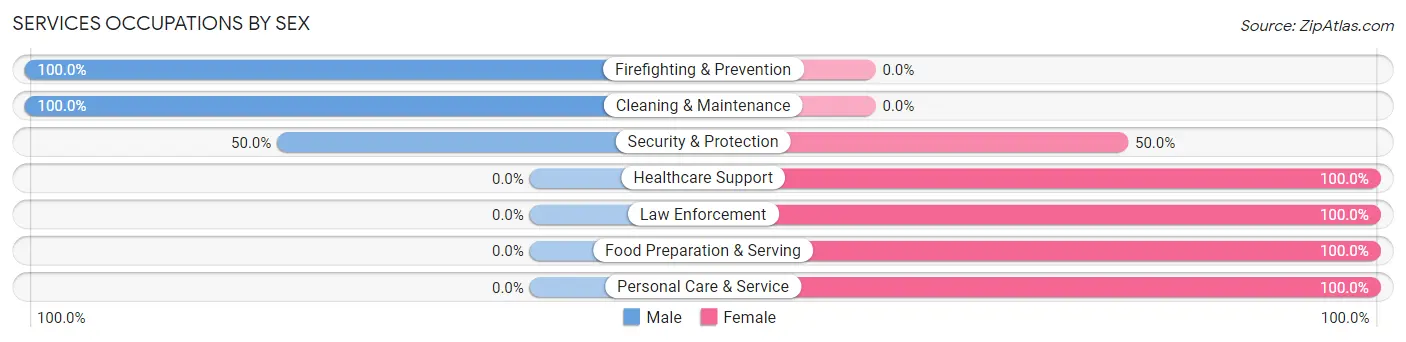
Services Occupations by Sex
Within the Services occupations in Oakdale, the most male-oriented occupations are Firefighting & Prevention (100.0%), Cleaning & Maintenance (100.0%), and Security & Protection (50.0%), while the most female-oriented occupations are Healthcare Support (100.0%), Law Enforcement (100.0%), and Food Preparation & Serving (100.0%).
| Occupation | Male | Female |
| Healthcare Support | 0 (0.0%) | 6 (100.0%) |
| Security & Protection | 2 (50.0%) | 2 (50.0%) |
| Firefighting & Prevention | 2 (100.0%) | 0 (0.0%) |
| Law Enforcement | 0 (0.0%) | 2 (100.0%) |
| Food Preparation & Serving | 0 (0.0%) | 2 (100.0%) |
| Cleaning & Maintenance | 3 (100.0%) | 0 (0.0%) |
| Personal Care & Service | 0 (0.0%) | 2 (100.0%) |
| Total (Category) | 5 (29.4%) | 12 (70.6%) |
| Total (Overall) | 39 (44.3%) | 49 (55.7%) |
Sales and Office Occupations
The most common Sales and Office occupations in Oakdale are Sales & Related (5 | 5.7%), and Office & Administration (4 | 4.5%).
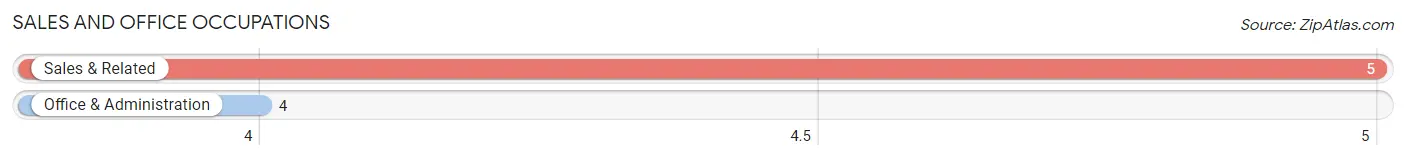
Sales and Office Occupations by Sex

| Occupation | Male | Female |
| Sales & Related | 1 (20.0%) | 4 (80.0%) |
| Office & Administration | 0 (0.0%) | 4 (100.0%) |
| Total (Category) | 1 (11.1%) | 8 (88.9%) |
| Total (Overall) | 39 (44.3%) | 49 (55.7%) |
Natural Resources, Construction and Maintenance Occupations
The most common Natural Resources, Construction and Maintenance occupations in Oakdale are , and Construction & Extraction (10 | 11.4%).
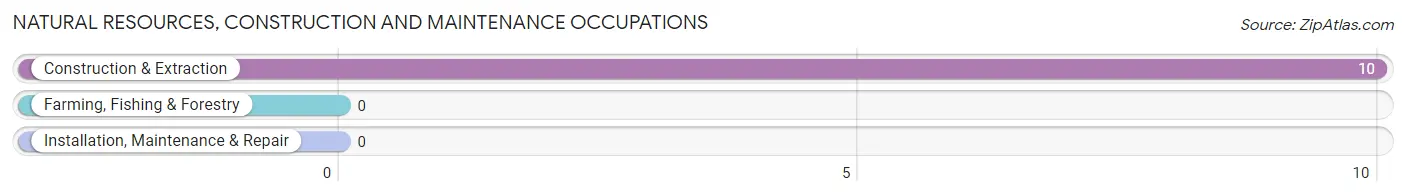
Natural Resources, Construction and Maintenance Occupations by Sex
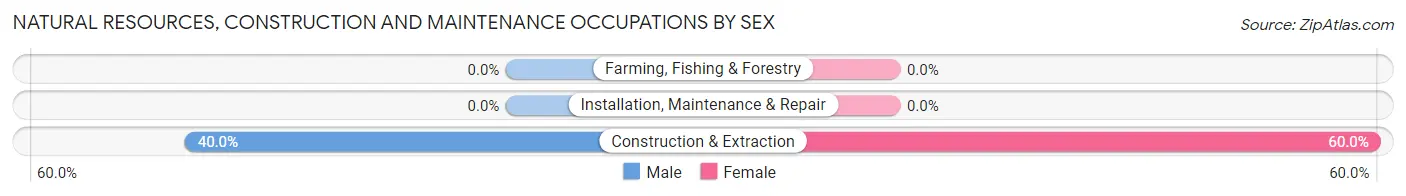
| Occupation | Male | Female |
| Farming, Fishing & Forestry | 0 (0.0%) | 0 (0.0%) |
| Construction & Extraction | 4 (40.0%) | 6 (60.0%) |
| Installation, Maintenance & Repair | 0 (0.0%) | 0 (0.0%) |
| Total (Category) | 4 (40.0%) | 6 (60.0%) |
| Total (Overall) | 39 (44.3%) | 49 (55.7%) |
Production, Transportation and Moving Occupations
The most common Production, Transportation and Moving occupations in Oakdale are Production (28 | 31.8%), Material Moving (7 | 8.0%), and Transportation (1 | 1.1%).
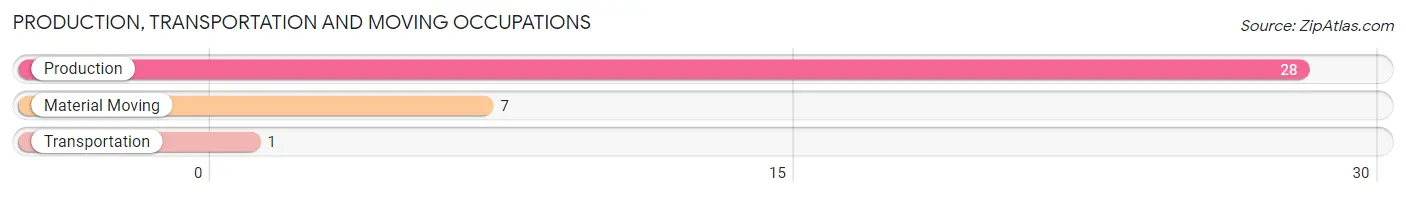
Production, Transportation and Moving Occupations by Sex
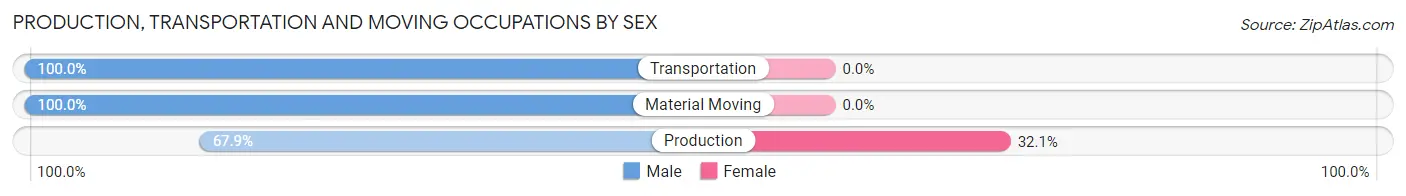
| Occupation | Male | Female |
| Production | 19 (67.9%) | 9 (32.1%) |
| Transportation | 1 (100.0%) | 0 (0.0%) |
| Material Moving | 7 (100.0%) | 0 (0.0%) |
| Total (Category) | 27 (75.0%) | 9 (25.0%) |
| Total (Overall) | 39 (44.3%) | 49 (55.7%) |
Employment Industries by Sex in Oakdale
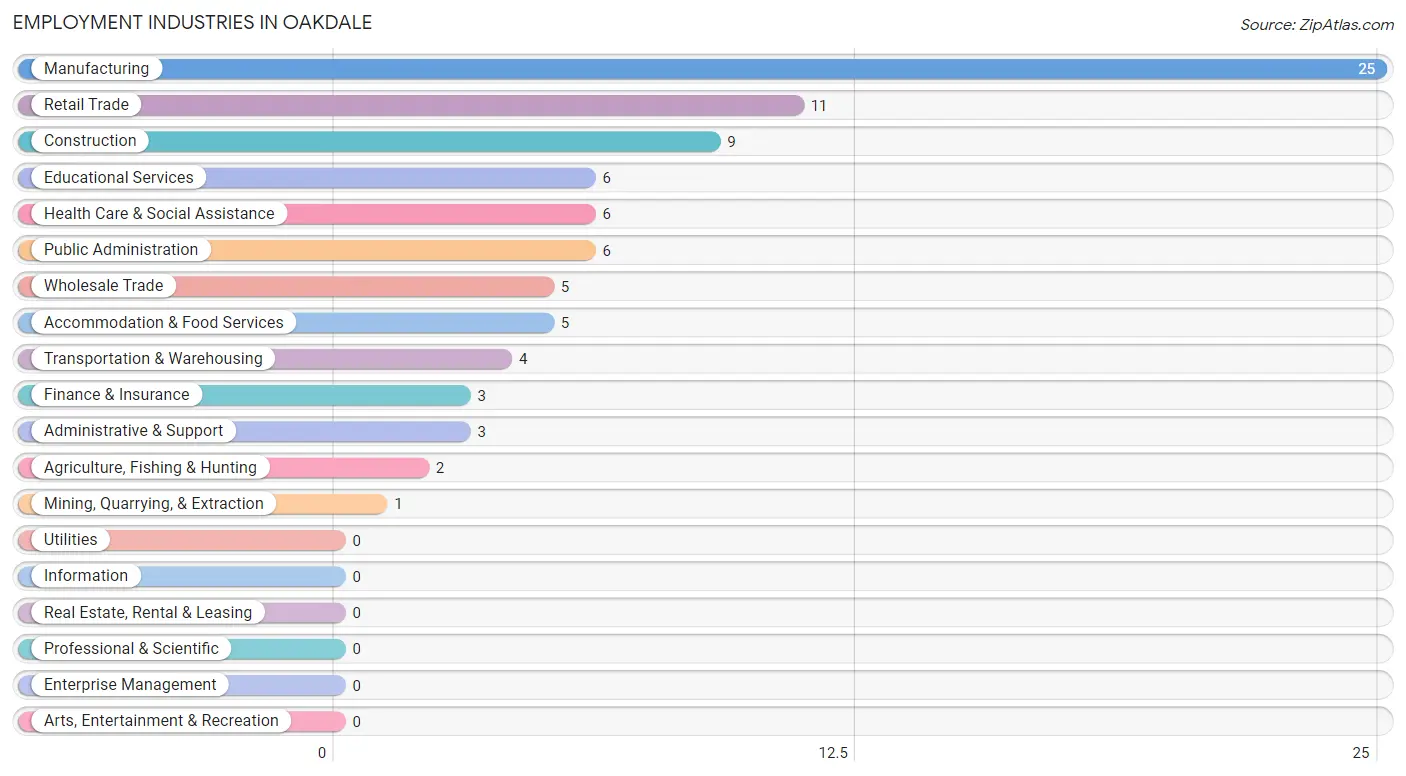
Employment Industries in Oakdale
The major employment industries in Oakdale include Manufacturing (25 | 28.4%), Retail Trade (11 | 12.5%), Construction (9 | 10.2%), Educational Services (6 | 6.8%), and Health Care & Social Assistance (6 | 6.8%).
Employment Industries by Sex in Oakdale
The Oakdale industries that see more men than women are Agriculture, Fishing & Hunting (100.0%), Mining, Quarrying, & Extraction (100.0%), and Administrative & Support (100.0%), whereas the industries that tend to have a higher number of women are Wholesale Trade (100.0%), Transportation & Warehousing (100.0%), and Finance & Insurance (100.0%).
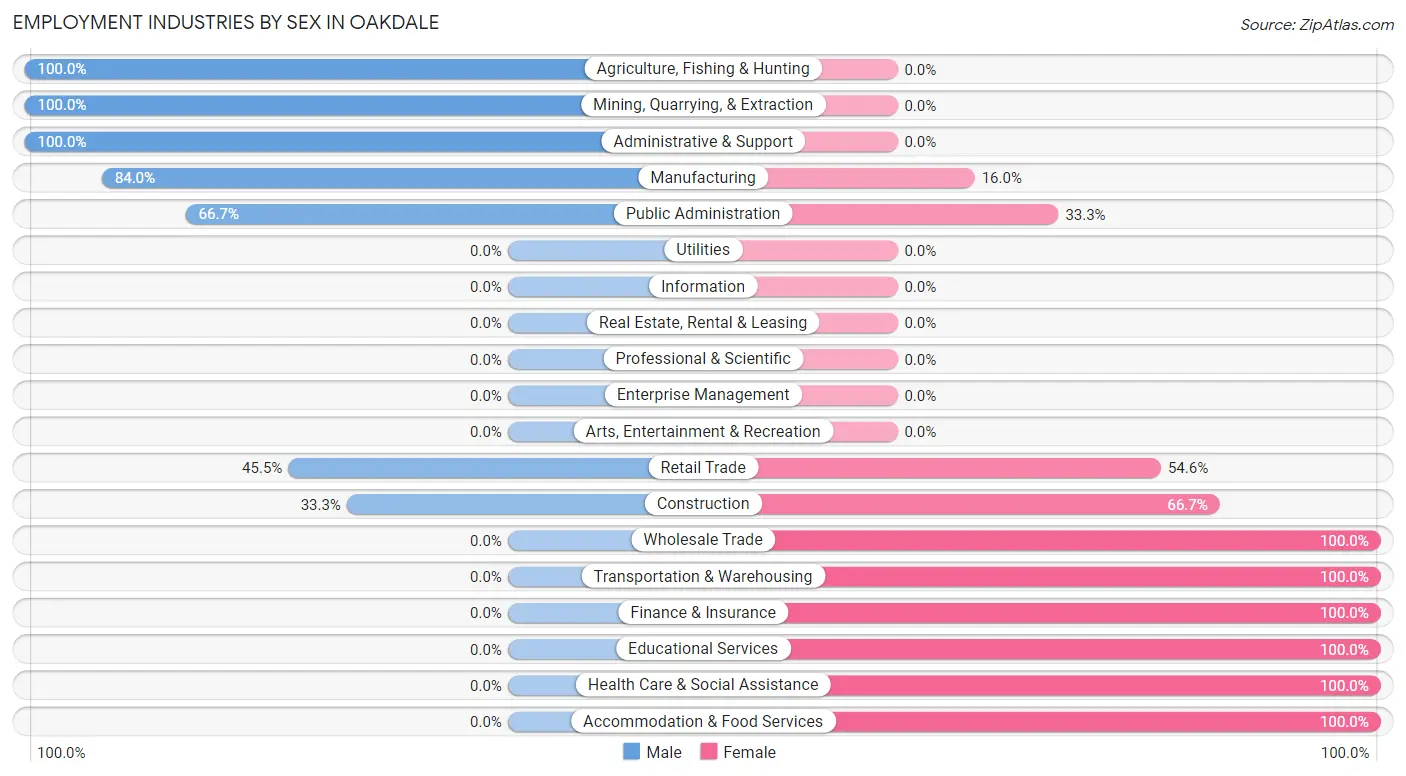
| Industry | Male | Female |
| Agriculture, Fishing & Hunting | 2 (100.0%) | 0 (0.0%) |
| Mining, Quarrying, & Extraction | 1 (100.0%) | 0 (0.0%) |
| Construction | 3 (33.3%) | 6 (66.7%) |
| Manufacturing | 21 (84.0%) | 4 (16.0%) |
| Wholesale Trade | 0 (0.0%) | 5 (100.0%) |
| Retail Trade | 5 (45.5%) | 6 (54.5%) |
| Transportation & Warehousing | 0 (0.0%) | 4 (100.0%) |
| Utilities | 0 (0.0%) | 0 (0.0%) |
| Information | 0 (0.0%) | 0 (0.0%) |
| Finance & Insurance | 0 (0.0%) | 3 (100.0%) |
| Real Estate, Rental & Leasing | 0 (0.0%) | 0 (0.0%) |
| Professional & Scientific | 0 (0.0%) | 0 (0.0%) |
| Enterprise Management | 0 (0.0%) | 0 (0.0%) |
| Administrative & Support | 3 (100.0%) | 0 (0.0%) |
| Educational Services | 0 (0.0%) | 6 (100.0%) |
| Health Care & Social Assistance | 0 (0.0%) | 6 (100.0%) |
| Arts, Entertainment & Recreation | 0 (0.0%) | 0 (0.0%) |
| Accommodation & Food Services | 0 (0.0%) | 5 (100.0%) |
| Public Administration | 4 (66.7%) | 2 (33.3%) |
| Total | 39 (44.3%) | 49 (55.7%) |
Education in Oakdale
School Enrollment in Oakdale
The most common levels of schooling among the 59 students in Oakdale are high school (18 | 30.5%), middle school (16 | 27.1%), and college / undergraduate (14 | 23.7%).
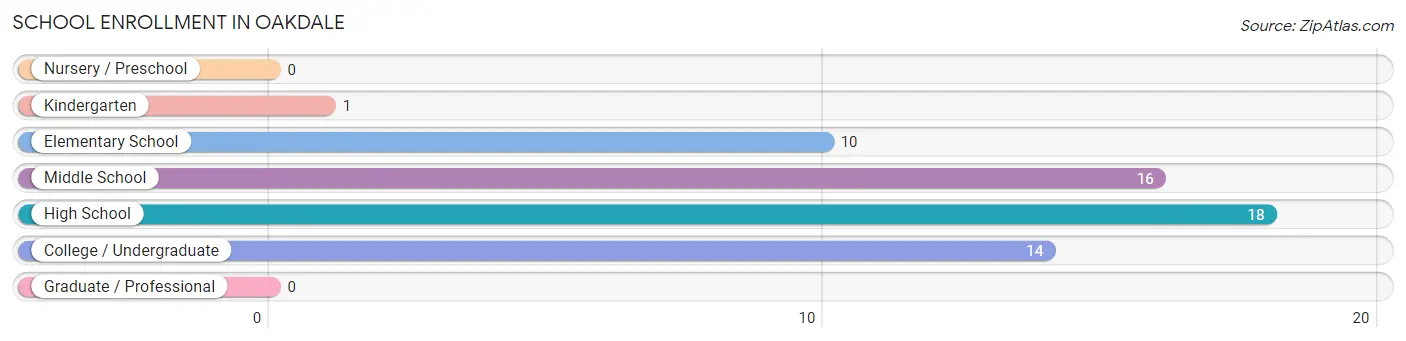
| School Level | # Students | % Students |
| Nursery / Preschool | 0 | 0.0% |
| Kindergarten | 1 | 1.7% |
| Elementary School | 10 | 17.0% |
| Middle School | 16 | 27.1% |
| High School | 18 | 30.5% |
| College / Undergraduate | 14 | 23.7% |
| Graduate / Professional | 0 | 0.0% |
| Total | 59 | 100.0% |
School Enrollment by Age by Funding Source in Oakdale
Out of a total of 59 students who are enrolled in schools in Oakdale, 1 (1.7%) attend a private institution, while the remaining 58 (98.3%) are enrolled in public schools. The age group of 18 to 19 year olds has the highest likelihood of being enrolled in private schools, with 1 (10.0% in the age bracket) enrolled. Conversely, the age group of 5 to 9 year old has the lowest likelihood of being enrolled in a private school, with 6 (100.0% in the age bracket) attending a public institution.
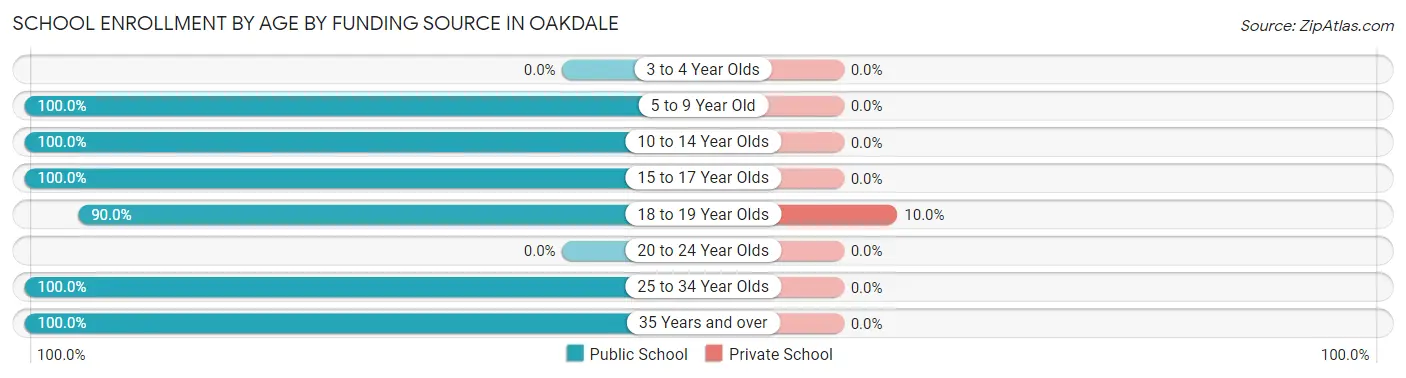
| Age Bracket | Public School | Private School |
| 3 to 4 Year Olds | 0 (0.0%) | 0 (0.0%) |
| 5 to 9 Year Old | 6 (100.0%) | 0 (0.0%) |
| 10 to 14 Year Olds | 28 (100.0%) | 0 (0.0%) |
| 15 to 17 Year Olds | 5 (100.0%) | 0 (0.0%) |
| 18 to 19 Year Olds | 9 (90.0%) | 1 (10.0%) |
| 20 to 24 Year Olds | 0 (0.0%) | 0 (0.0%) |
| 25 to 34 Year Olds | 3 (100.0%) | 0 (0.0%) |
| 35 Years and over | 7 (100.0%) | 0 (0.0%) |
| Total | 58 (98.3%) | 1 (1.7%) |
Educational Attainment by Field of Study in Oakdale
Education (4 | 80.0%), and literature & languages (1 | 20.0%) are the most common fields of study among 5 individuals in Oakdale who have obtained a bachelor's degree or higher.
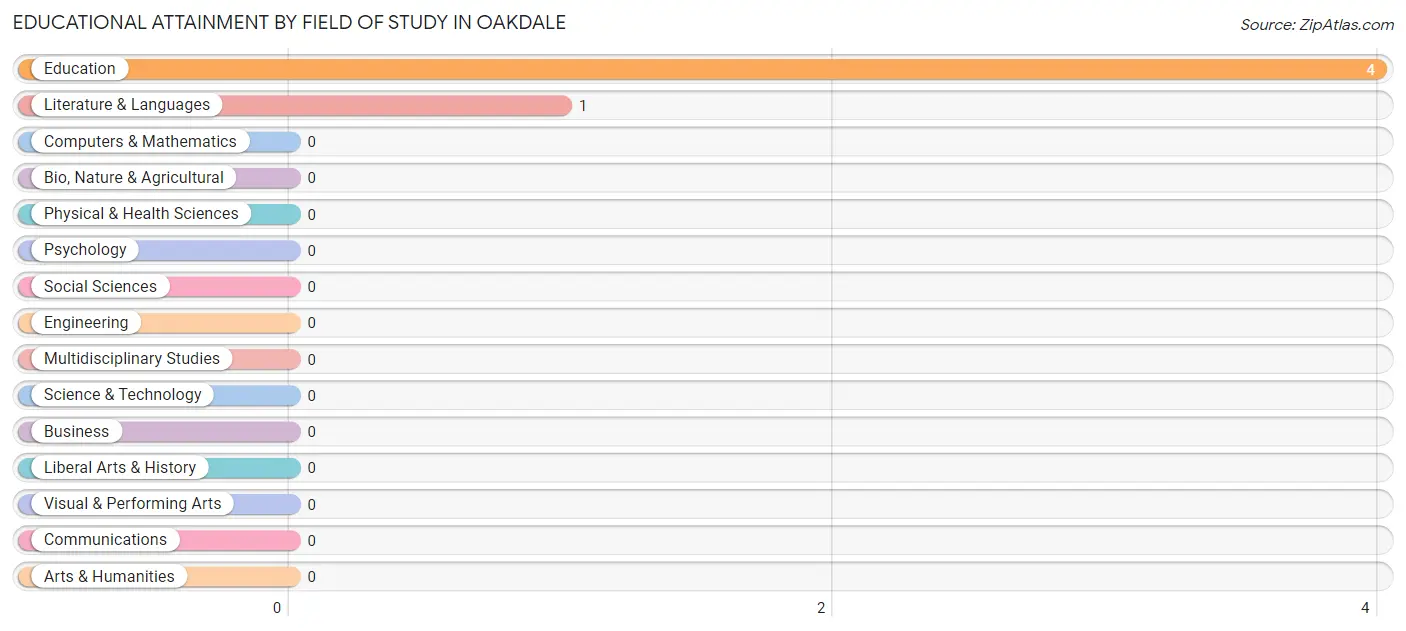
| Field of Study | # Graduates | % Graduates |
| Computers & Mathematics | 0 | 0.0% |
| Bio, Nature & Agricultural | 0 | 0.0% |
| Physical & Health Sciences | 0 | 0.0% |
| Psychology | 0 | 0.0% |
| Social Sciences | 0 | 0.0% |
| Engineering | 0 | 0.0% |
| Multidisciplinary Studies | 0 | 0.0% |
| Science & Technology | 0 | 0.0% |
| Business | 0 | 0.0% |
| Education | 4 | 80.0% |
| Literature & Languages | 1 | 20.0% |
| Liberal Arts & History | 0 | 0.0% |
| Visual & Performing Arts | 0 | 0.0% |
| Communications | 0 | 0.0% |
| Arts & Humanities | 0 | 0.0% |
| Total | 5 | 100.0% |
Transportation & Commute in Oakdale
Vehicle Availability by Sex in Oakdale
The most prevalent vehicle ownership categories in Oakdale are males with 2 vehicles (19, accounting for 51.3%) and females with 2 vehicles (19, making up 38.8%).
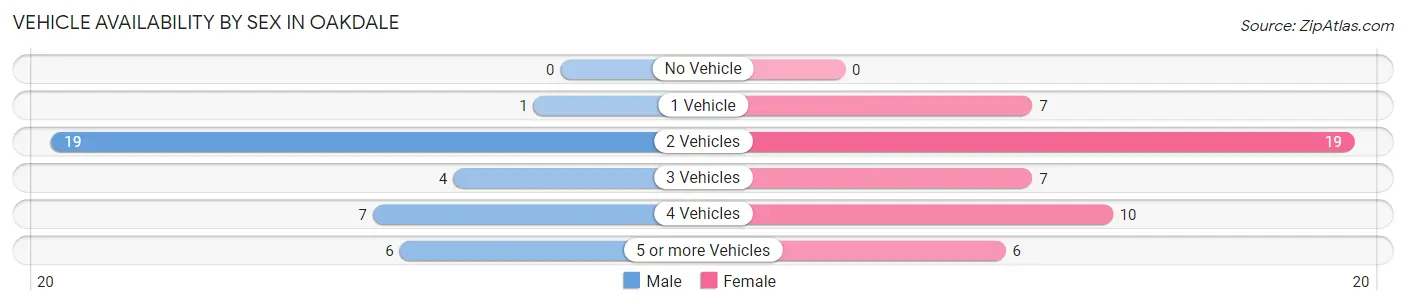
| Vehicles Available | Male | Female |
| No Vehicle | 0 (0.0%) | 0 (0.0%) |
| 1 Vehicle | 1 (2.7%) | 7 (14.3%) |
| 2 Vehicles | 19 (51.3%) | 19 (38.8%) |
| 3 Vehicles | 4 (10.8%) | 7 (14.3%) |
| 4 Vehicles | 7 (18.9%) | 10 (20.4%) |
| 5 or more Vehicles | 6 (16.2%) | 6 (12.2%) |
| Total | 37 (100.0%) | 49 (100.0%) |
Commute Time in Oakdale
The most frequently occuring commute durations in Oakdale are 15 to 19 minutes (20 commuters, 23.3%), 30 to 34 minutes (14 commuters, 16.3%), and 20 to 24 minutes (12 commuters, 14.0%).
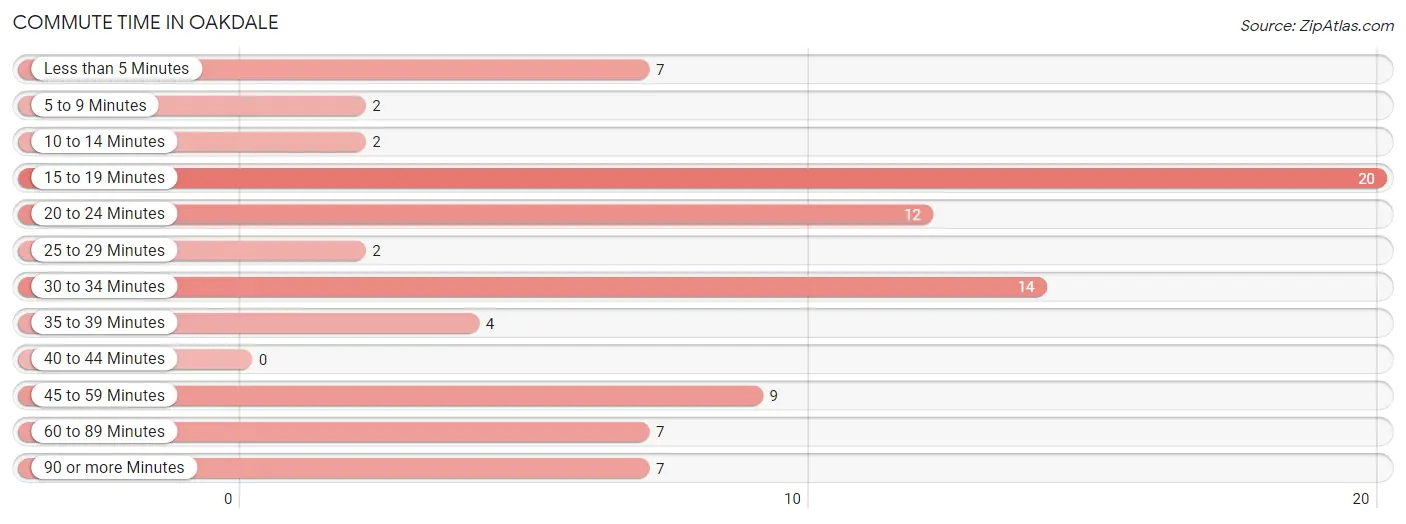
| Commute Time | # Commuters | % Commuters |
| Less than 5 Minutes | 7 | 8.1% |
| 5 to 9 Minutes | 2 | 2.3% |
| 10 to 14 Minutes | 2 | 2.3% |
| 15 to 19 Minutes | 20 | 23.3% |
| 20 to 24 Minutes | 12 | 14.0% |
| 25 to 29 Minutes | 2 | 2.3% |
| 30 to 34 Minutes | 14 | 16.3% |
| 35 to 39 Minutes | 4 | 4.6% |
| 40 to 44 Minutes | 0 | 0.0% |
| 45 to 59 Minutes | 9 | 10.5% |
| 60 to 89 Minutes | 7 | 8.1% |
| 90 or more Minutes | 7 | 8.1% |
Commute Time by Sex in Oakdale
The most common commute times in Oakdale are 15 to 19 minutes (7 commuters, 18.9%) for males and 15 to 19 minutes (13 commuters, 26.5%) for females.
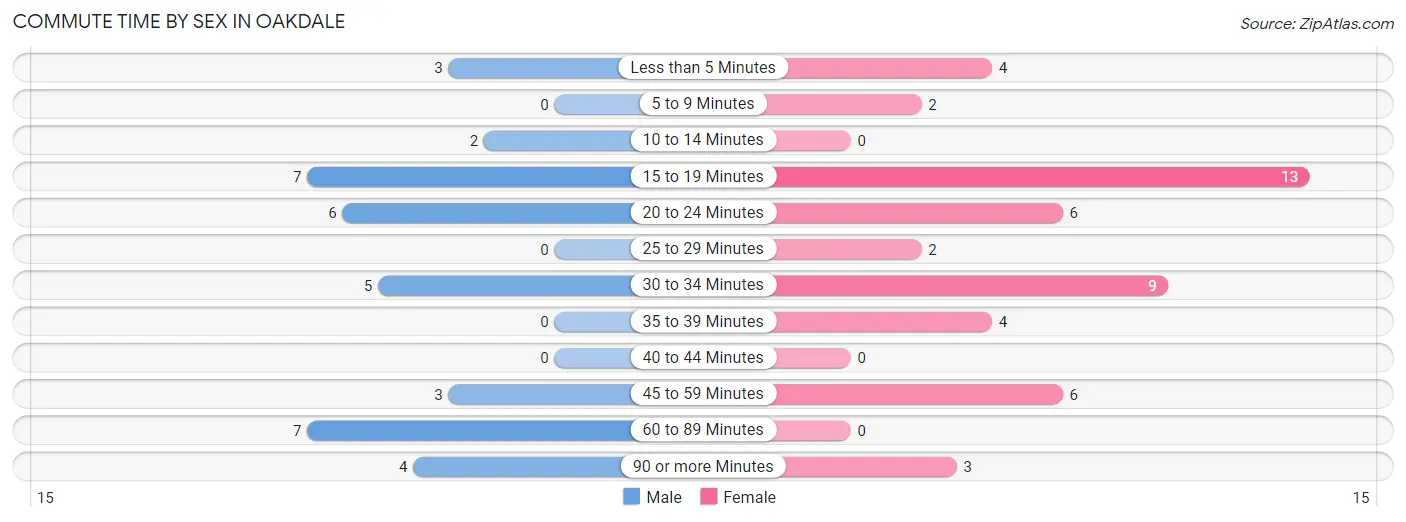
| Commute Time | Male | Female |
| Less than 5 Minutes | 3 (8.1%) | 4 (8.2%) |
| 5 to 9 Minutes | 0 (0.0%) | 2 (4.1%) |
| 10 to 14 Minutes | 2 (5.4%) | 0 (0.0%) |
| 15 to 19 Minutes | 7 (18.9%) | 13 (26.5%) |
| 20 to 24 Minutes | 6 (16.2%) | 6 (12.2%) |
| 25 to 29 Minutes | 0 (0.0%) | 2 (4.1%) |
| 30 to 34 Minutes | 5 (13.5%) | 9 (18.4%) |
| 35 to 39 Minutes | 0 (0.0%) | 4 (8.2%) |
| 40 to 44 Minutes | 0 (0.0%) | 0 (0.0%) |
| 45 to 59 Minutes | 3 (8.1%) | 6 (12.2%) |
| 60 to 89 Minutes | 7 (18.9%) | 0 (0.0%) |
| 90 or more Minutes | 4 (10.8%) | 3 (6.1%) |
Time of Departure to Work by Sex in Oakdale
The most frequent times of departure to work in Oakdale are 4:00 PM to 11:59 PM (11, 29.7%) for males and 7:30 AM to 7:59 AM (10, 20.4%) for females.
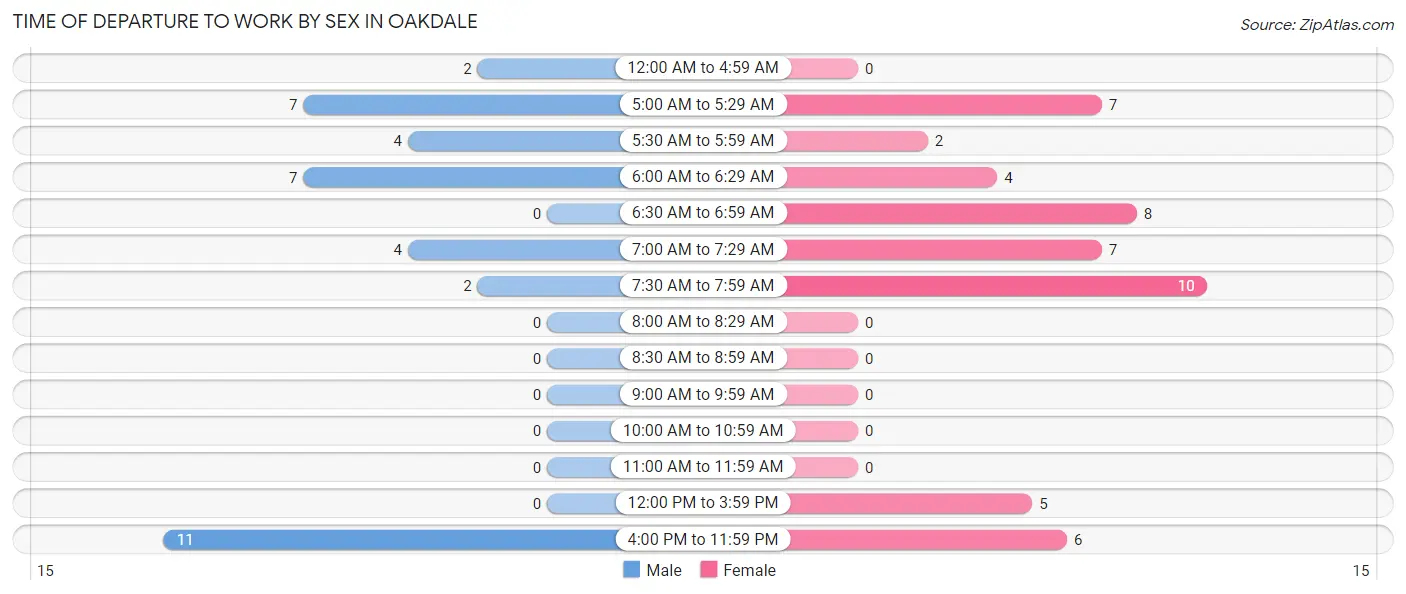
| Time of Departure | Male | Female |
| 12:00 AM to 4:59 AM | 2 (5.4%) | 0 (0.0%) |
| 5:00 AM to 5:29 AM | 7 (18.9%) | 7 (14.3%) |
| 5:30 AM to 5:59 AM | 4 (10.8%) | 2 (4.1%) |
| 6:00 AM to 6:29 AM | 7 (18.9%) | 4 (8.2%) |
| 6:30 AM to 6:59 AM | 0 (0.0%) | 8 (16.3%) |
| 7:00 AM to 7:29 AM | 4 (10.8%) | 7 (14.3%) |
| 7:30 AM to 7:59 AM | 2 (5.4%) | 10 (20.4%) |
| 8:00 AM to 8:29 AM | 0 (0.0%) | 0 (0.0%) |
| 8:30 AM to 8:59 AM | 0 (0.0%) | 0 (0.0%) |
| 9:00 AM to 9:59 AM | 0 (0.0%) | 0 (0.0%) |
| 10:00 AM to 10:59 AM | 0 (0.0%) | 0 (0.0%) |
| 11:00 AM to 11:59 AM | 0 (0.0%) | 0 (0.0%) |
| 12:00 PM to 3:59 PM | 0 (0.0%) | 5 (10.2%) |
| 4:00 PM to 11:59 PM | 11 (29.7%) | 6 (12.2%) |
| Total | 37 (100.0%) | 49 (100.0%) |
Housing Occupancy in Oakdale
Occupancy by Ownership in Oakdale
Of the total 72 dwellings in Oakdale, owner-occupied units account for 58 (80.6%), while renter-occupied units make up 14 (19.4%).
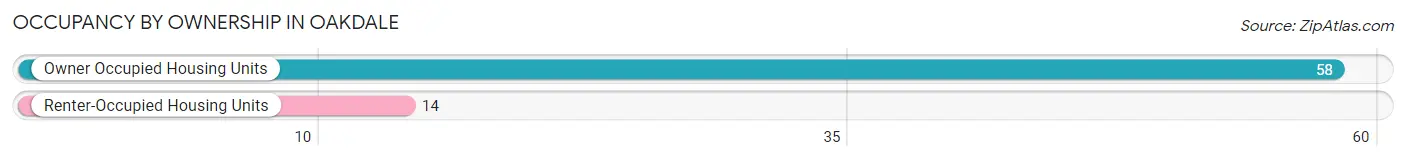
| Occupancy | # Housing Units | % Housing Units |
| Owner Occupied Housing Units | 58 | 80.6% |
| Renter-Occupied Housing Units | 14 | 19.4% |
| Total Occupied Housing Units | 72 | 100.0% |
Occupancy by Household Size in Oakdale
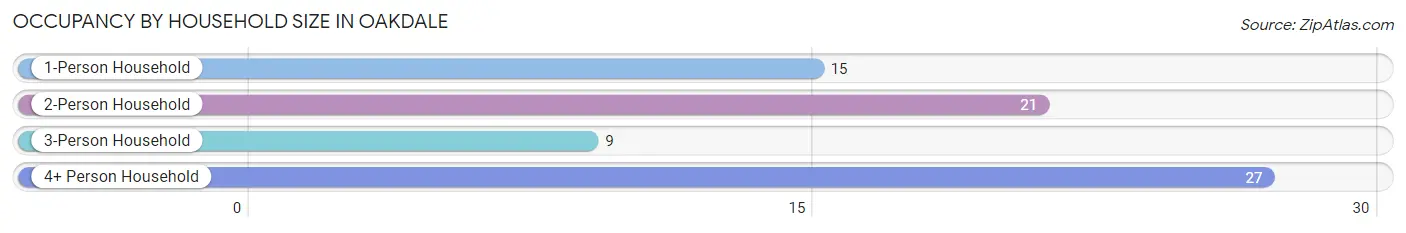
| Household Size | # Housing Units | % Housing Units |
| 1-Person Household | 15 | 20.8% |
| 2-Person Household | 21 | 29.2% |
| 3-Person Household | 9 | 12.5% |
| 4+ Person Household | 27 | 37.5% |
| Total Housing Units | 72 | 100.0% |
Occupancy by Ownership by Household Size in Oakdale
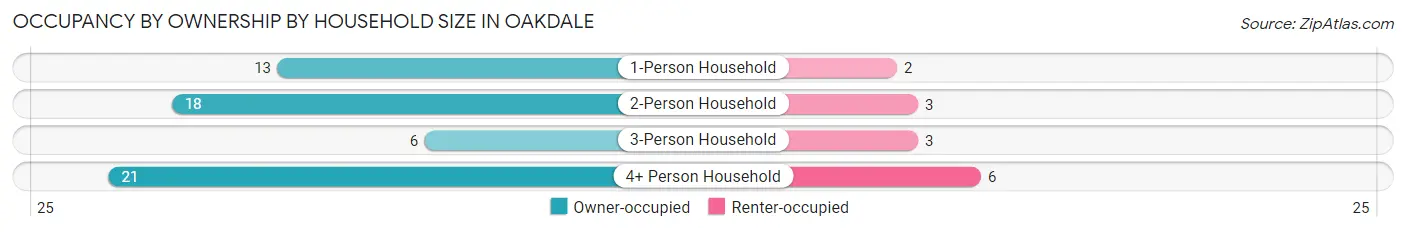
| Household Size | Owner-occupied | Renter-occupied |
| 1-Person Household | 13 (86.7%) | 2 (13.3%) |
| 2-Person Household | 18 (85.7%) | 3 (14.3%) |
| 3-Person Household | 6 (66.7%) | 3 (33.3%) |
| 4+ Person Household | 21 (77.8%) | 6 (22.2%) |
| Total Housing Units | 58 (80.6%) | 14 (19.4%) |
Occupancy by Educational Attainment in Oakdale
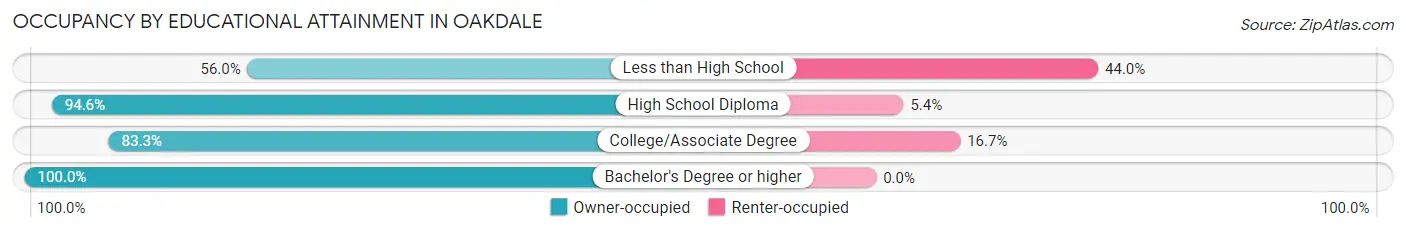
| Household Size | Owner-occupied | Renter-occupied |
| Less than High School | 14 (56.0%) | 11 (44.0%) |
| High School Diploma | 35 (94.6%) | 2 (5.4%) |
| College/Associate Degree | 5 (83.3%) | 1 (16.7%) |
| Bachelor's Degree or higher | 4 (100.0%) | 0 (0.0%) |
Occupancy by Age of Householder in Oakdale
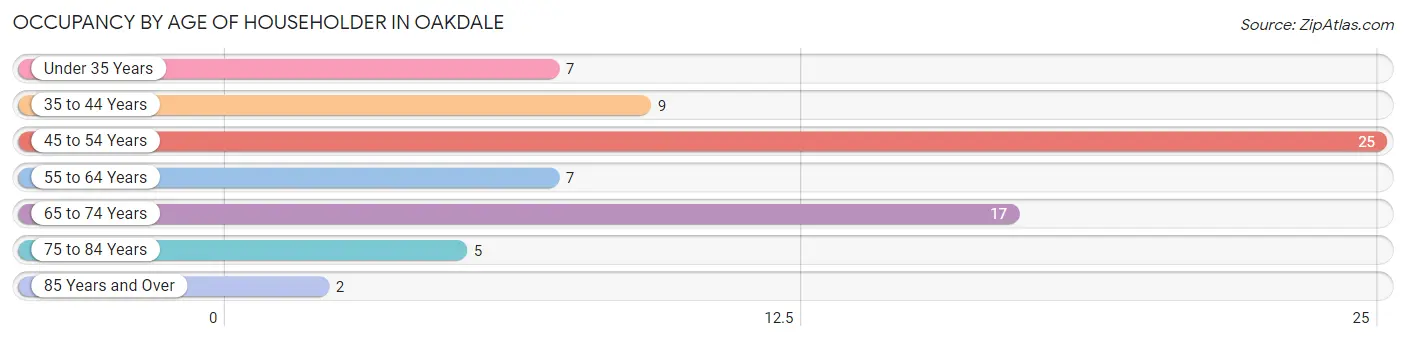
| Age Bracket | # Households | % Households |
| Under 35 Years | 7 | 9.7% |
| 35 to 44 Years | 9 | 12.5% |
| 45 to 54 Years | 25 | 34.7% |
| 55 to 64 Years | 7 | 9.7% |
| 65 to 74 Years | 17 | 23.6% |
| 75 to 84 Years | 5 | 6.9% |
| 85 Years and Over | 2 | 2.8% |
| Total | 72 | 100.0% |
Housing Finances in Oakdale
Median Income by Occupancy in Oakdale
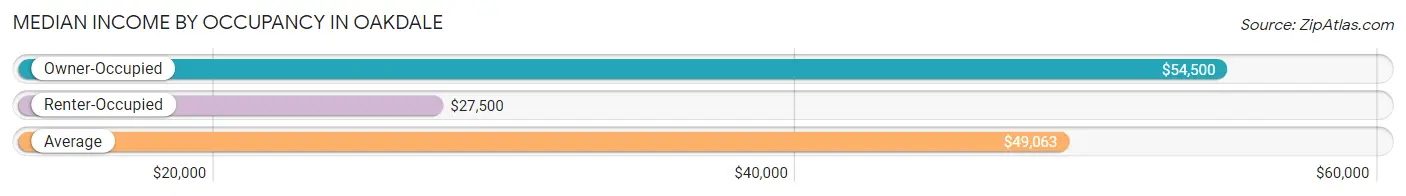
| Occupancy Type | # Households | Median Income |
| Owner-Occupied | 58 (80.6%) | $54,500 |
| Renter-Occupied | 14 (19.4%) | $27,500 |
| Average | 72 (100.0%) | $49,063 |
Occupancy by Householder Income Bracket in Oakdale
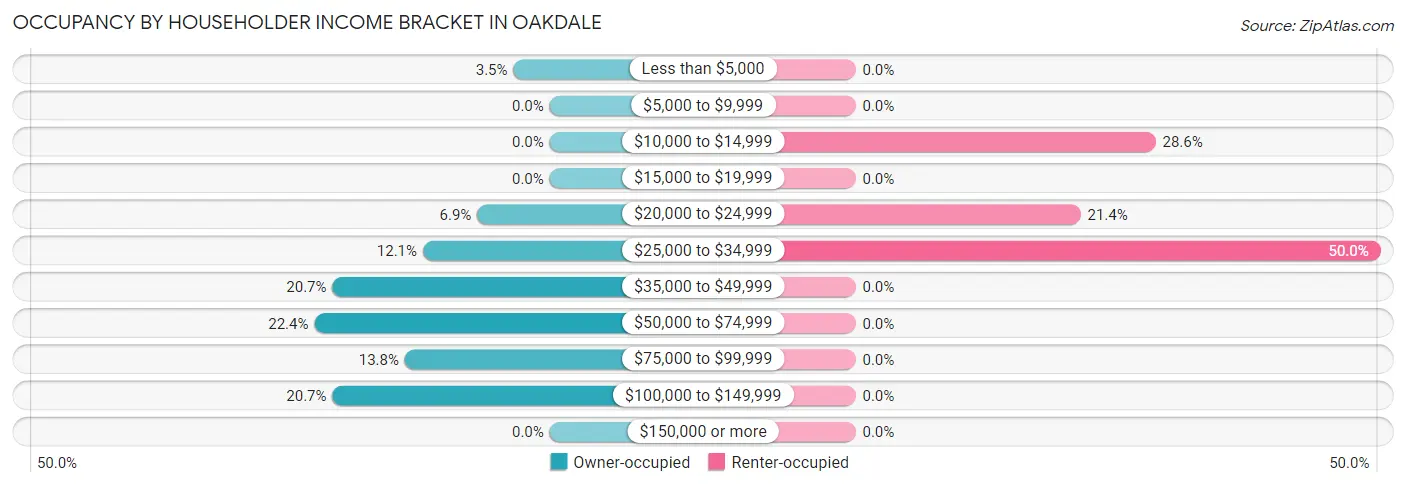
| Income Bracket | Owner-occupied | Renter-occupied |
| Less than $5,000 | 2 (3.5%) | 0 (0.0%) |
| $5,000 to $9,999 | 0 (0.0%) | 0 (0.0%) |
| $10,000 to $14,999 | 0 (0.0%) | 4 (28.6%) |
| $15,000 to $19,999 | 0 (0.0%) | 0 (0.0%) |
| $20,000 to $24,999 | 4 (6.9%) | 3 (21.4%) |
| $25,000 to $34,999 | 7 (12.1%) | 7 (50.0%) |
| $35,000 to $49,999 | 12 (20.7%) | 0 (0.0%) |
| $50,000 to $74,999 | 13 (22.4%) | 0 (0.0%) |
| $75,000 to $99,999 | 8 (13.8%) | 0 (0.0%) |
| $100,000 to $149,999 | 12 (20.7%) | 0 (0.0%) |
| $150,000 or more | 0 (0.0%) | 0 (0.0%) |
| Total | 58 (100.0%) | 14 (100.0%) |
Monthly Housing Cost Tiers in Oakdale
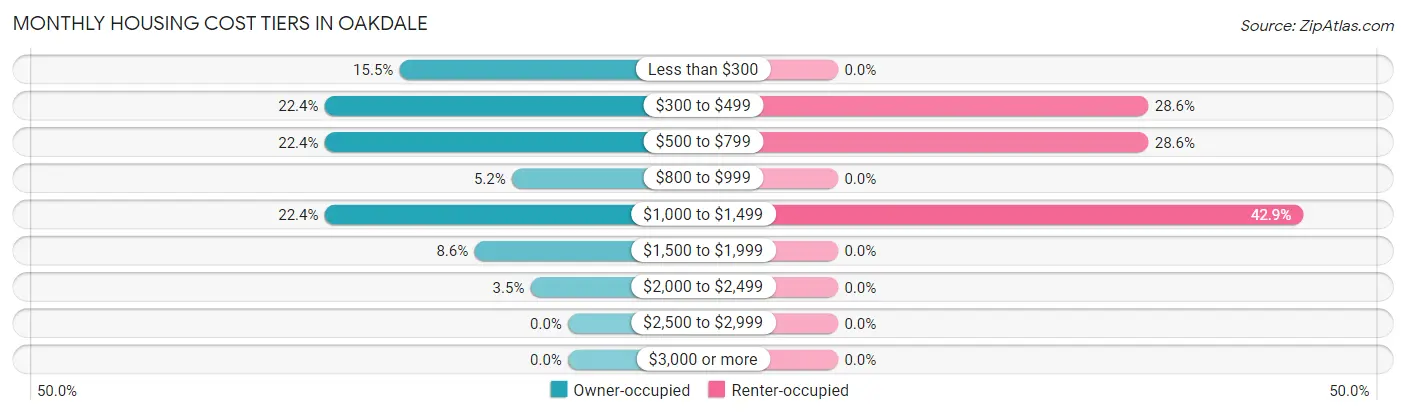
| Monthly Cost | Owner-occupied | Renter-occupied |
| Less than $300 | 9 (15.5%) | 0 (0.0%) |
| $300 to $499 | 13 (22.4%) | 4 (28.6%) |
| $500 to $799 | 13 (22.4%) | 4 (28.6%) |
| $800 to $999 | 3 (5.2%) | 0 (0.0%) |
| $1,000 to $1,499 | 13 (22.4%) | 6 (42.9%) |
| $1,500 to $1,999 | 5 (8.6%) | 0 (0.0%) |
| $2,000 to $2,499 | 2 (3.5%) | 0 (0.0%) |
| $2,500 to $2,999 | 0 (0.0%) | 0 (0.0%) |
| $3,000 or more | 0 (0.0%) | 0 (0.0%) |
| Total | 58 (100.0%) | 14 (100.0%) |
Physical Housing Characteristics in Oakdale
Housing Structures in Oakdale
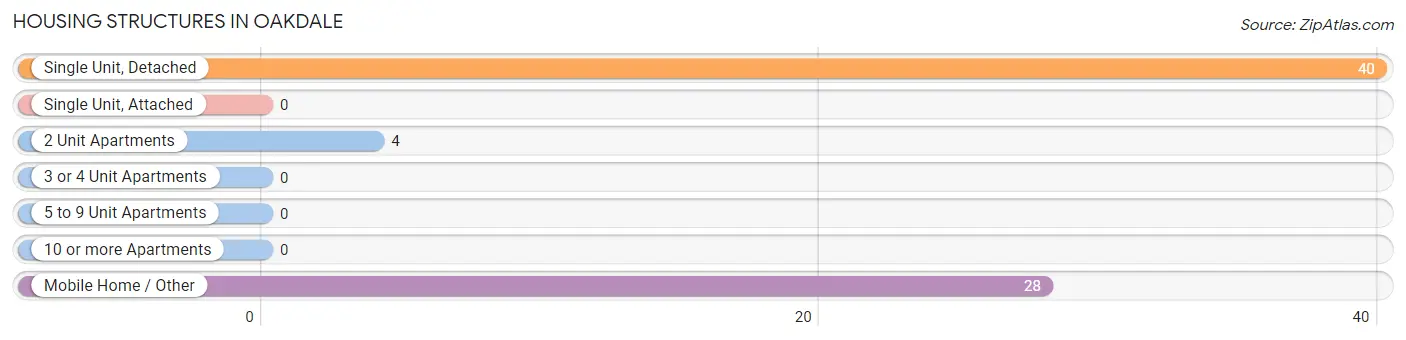
| Structure Type | # Housing Units | % Housing Units |
| Single Unit, Detached | 40 | 55.6% |
| Single Unit, Attached | 0 | 0.0% |
| 2 Unit Apartments | 4 | 5.6% |
| 3 or 4 Unit Apartments | 0 | 0.0% |
| 5 to 9 Unit Apartments | 0 | 0.0% |
| 10 or more Apartments | 0 | 0.0% |
| Mobile Home / Other | 28 | 38.9% |
| Total | 72 | 100.0% |
Housing Structures by Occupancy in Oakdale
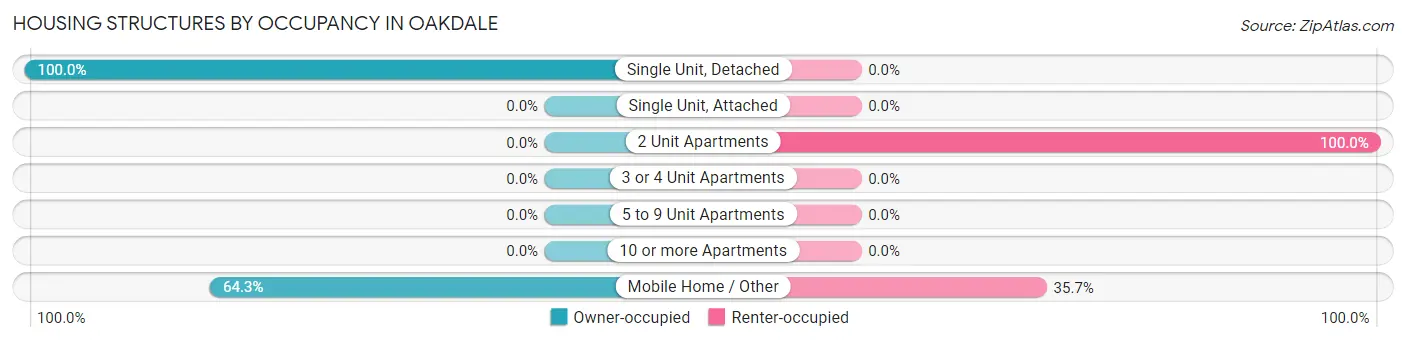
| Structure Type | Owner-occupied | Renter-occupied |
| Single Unit, Detached | 40 (100.0%) | 0 (0.0%) |
| Single Unit, Attached | 0 (0.0%) | 0 (0.0%) |
| 2 Unit Apartments | 0 (0.0%) | 4 (100.0%) |
| 3 or 4 Unit Apartments | 0 (0.0%) | 0 (0.0%) |
| 5 to 9 Unit Apartments | 0 (0.0%) | 0 (0.0%) |
| 10 or more Apartments | 0 (0.0%) | 0 (0.0%) |
| Mobile Home / Other | 18 (64.3%) | 10 (35.7%) |
| Total | 58 (80.6%) | 14 (19.4%) |
Housing Structures by Number of Rooms in Oakdale
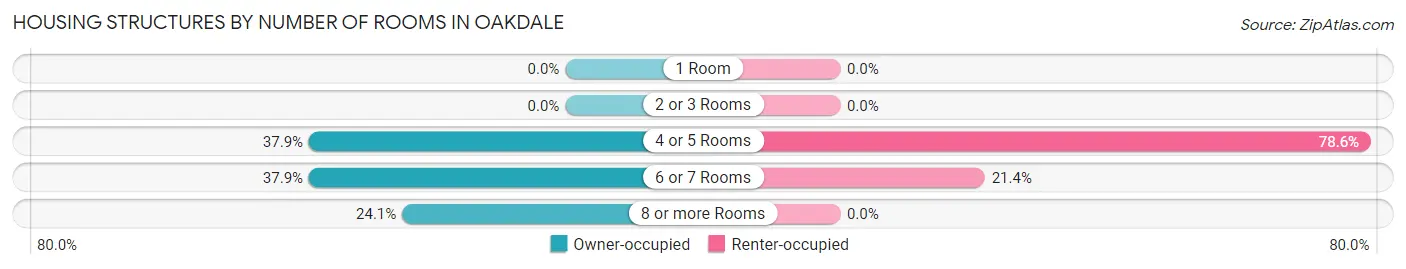
| Number of Rooms | Owner-occupied | Renter-occupied |
| 1 Room | 0 (0.0%) | 0 (0.0%) |
| 2 or 3 Rooms | 0 (0.0%) | 0 (0.0%) |
| 4 or 5 Rooms | 22 (37.9%) | 11 (78.6%) |
| 6 or 7 Rooms | 22 (37.9%) | 3 (21.4%) |
| 8 or more Rooms | 14 (24.1%) | 0 (0.0%) |
| Total | 58 (100.0%) | 14 (100.0%) |
Housing Structure by Heating Type in Oakdale
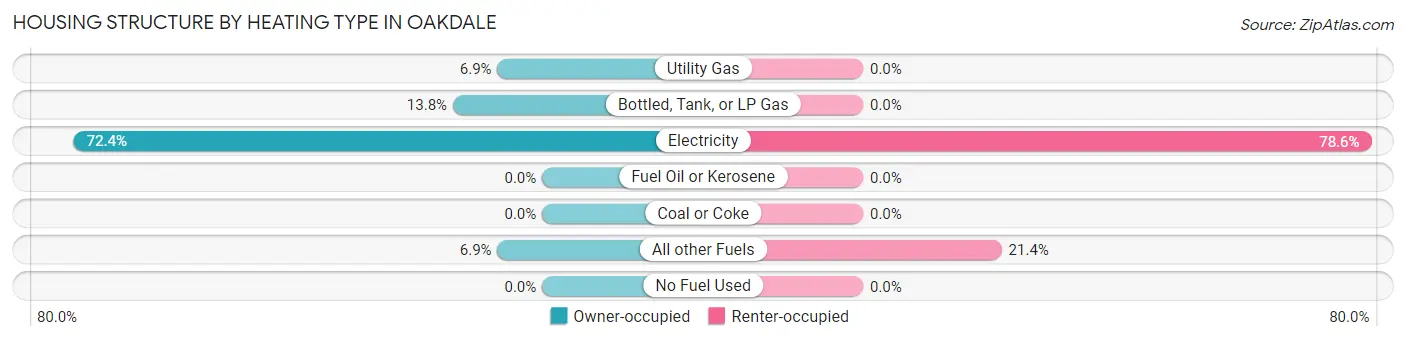
| Heating Type | Owner-occupied | Renter-occupied |
| Utility Gas | 4 (6.9%) | 0 (0.0%) |
| Bottled, Tank, or LP Gas | 8 (13.8%) | 0 (0.0%) |
| Electricity | 42 (72.4%) | 11 (78.6%) |
| Fuel Oil or Kerosene | 0 (0.0%) | 0 (0.0%) |
| Coal or Coke | 0 (0.0%) | 0 (0.0%) |
| All other Fuels | 4 (6.9%) | 3 (21.4%) |
| No Fuel Used | 0 (0.0%) | 0 (0.0%) |
| Total | 58 (100.0%) | 14 (100.0%) |
Household Vehicle Usage in Oakdale
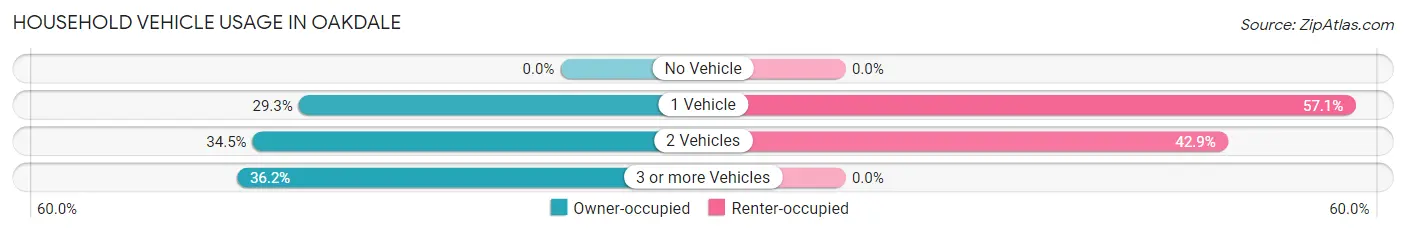
| Vehicles per Household | Owner-occupied | Renter-occupied |
| No Vehicle | 0 (0.0%) | 0 (0.0%) |
| 1 Vehicle | 17 (29.3%) | 8 (57.1%) |
| 2 Vehicles | 20 (34.5%) | 6 (42.9%) |
| 3 or more Vehicles | 21 (36.2%) | 0 (0.0%) |
| Total | 58 (100.0%) | 14 (100.0%) |
Real Estate & Mortgages in Oakdale
Real Estate and Mortgage Overview in Oakdale
| Characteristic | Without Mortgage | With Mortgage |
| Housing Units | 29 | 29 |
| Median Property Value | $90,800 | $93,800 |
| Median Household Income | $47,813 | $0 |
| Monthly Housing Costs | $363 | $0 |
| Real Estate Taxes | $700 | $5 |
Property Value by Mortgage Status in Oakdale
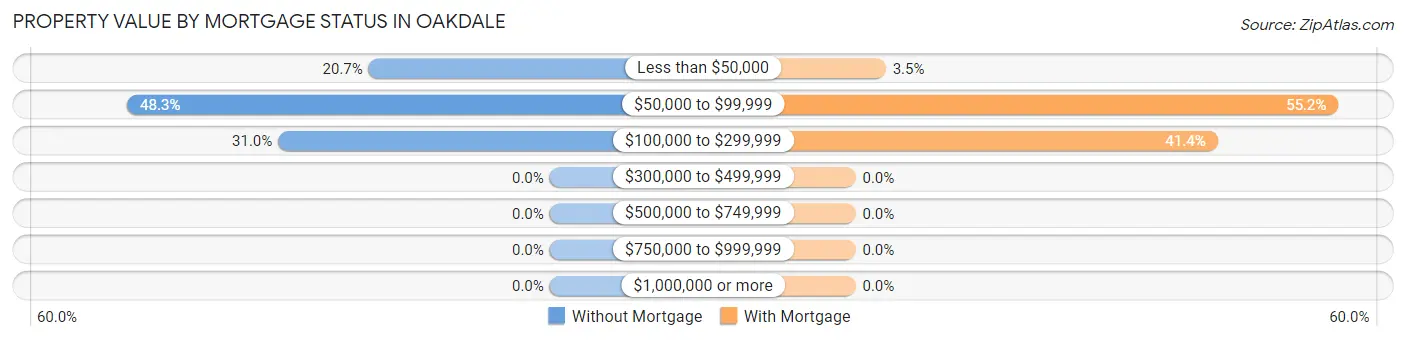
| Property Value | Without Mortgage | With Mortgage |
| Less than $50,000 | 6 (20.7%) | 1 (3.5%) |
| $50,000 to $99,999 | 14 (48.3%) | 16 (55.2%) |
| $100,000 to $299,999 | 9 (31.0%) | 12 (41.4%) |
| $300,000 to $499,999 | 0 (0.0%) | 0 (0.0%) |
| $500,000 to $749,999 | 0 (0.0%) | 0 (0.0%) |
| $750,000 to $999,999 | 0 (0.0%) | 0 (0.0%) |
| $1,000,000 or more | 0 (0.0%) | 0 (0.0%) |
| Total | 29 (100.0%) | 29 (100.0%) |
Household Income by Mortgage Status in Oakdale
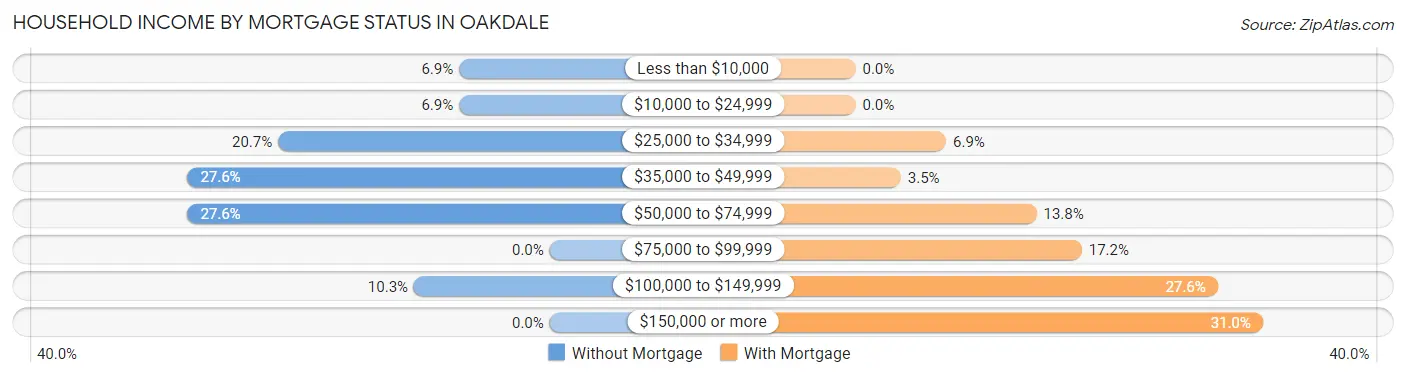
| Household Income | Without Mortgage | With Mortgage |
| Less than $10,000 | 2 (6.9%) | 0 (0.0%) |
| $10,000 to $24,999 | 2 (6.9%) | 0 (0.0%) |
| $25,000 to $34,999 | 6 (20.7%) | 2 (6.9%) |
| $35,000 to $49,999 | 8 (27.6%) | 1 (3.5%) |
| $50,000 to $74,999 | 8 (27.6%) | 4 (13.8%) |
| $75,000 to $99,999 | 0 (0.0%) | 5 (17.2%) |
| $100,000 to $149,999 | 3 (10.3%) | 8 (27.6%) |
| $150,000 or more | 0 (0.0%) | 9 (31.0%) |
| Total | 29 (100.0%) | 29 (100.0%) |
Property Value to Household Income Ratio in Oakdale
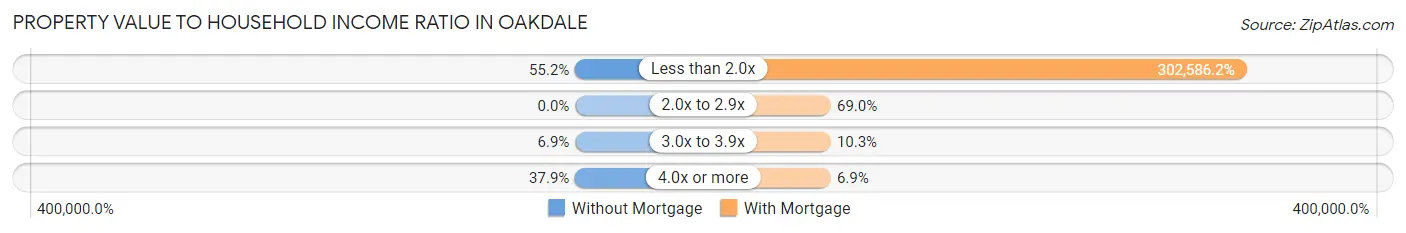
| Value-to-Income Ratio | Without Mortgage | With Mortgage |
| Less than 2.0x | 16 (55.2%) | 87,750 (302,586.2%) |
| 2.0x to 2.9x | 0 (0.0%) | 20 (69.0%) |
| 3.0x to 3.9x | 2 (6.9%) | 3 (10.3%) |
| 4.0x or more | 11 (37.9%) | 2 (6.9%) |
| Total | 29 (100.0%) | 29 (100.0%) |
Real Estate Taxes by Mortgage Status in Oakdale
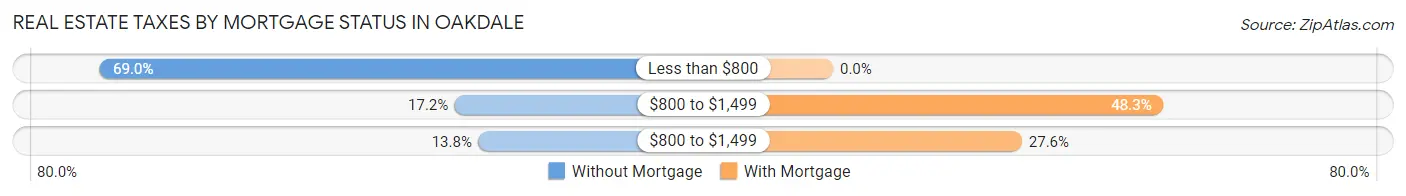
| Property Taxes | Without Mortgage | With Mortgage |
| Less than $800 | 20 (69.0%) | 0 (0.0%) |
| $800 to $1,499 | 5 (17.2%) | 14 (48.3%) |
| $800 to $1,499 | 4 (13.8%) | 8 (27.6%) |
| Total | 29 (100.0%) | 29 (100.0%) |
Health & Disability in Oakdale
Health Insurance Coverage by Age in Oakdale
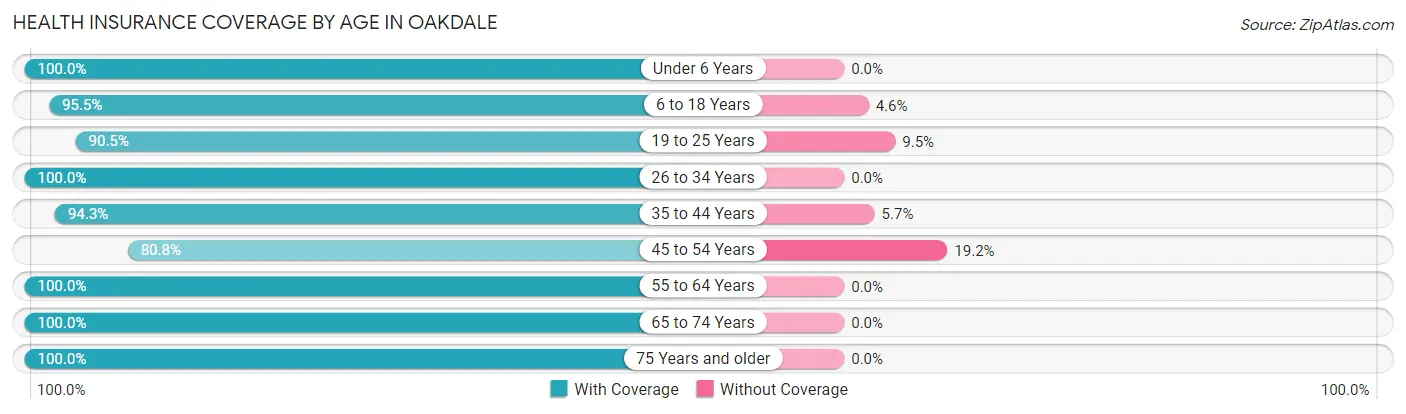
| Age Bracket | With Coverage | Without Coverage |
| Under 6 Years | 4 (100.0%) | 0 (0.0%) |
| 6 to 18 Years | 42 (95.5%) | 2 (4.5%) |
| 19 to 25 Years | 19 (90.5%) | 2 (9.5%) |
| 26 to 34 Years | 6 (100.0%) | 0 (0.0%) |
| 35 to 44 Years | 50 (94.3%) | 3 (5.7%) |
| 45 to 54 Years | 42 (80.8%) | 10 (19.2%) |
| 55 to 64 Years | 15 (100.0%) | 0 (0.0%) |
| 65 to 74 Years | 20 (100.0%) | 0 (0.0%) |
| 75 Years and older | 15 (100.0%) | 0 (0.0%) |
| Total | 213 (92.6%) | 17 (7.4%) |
Health Insurance Coverage by Citizenship Status in Oakdale
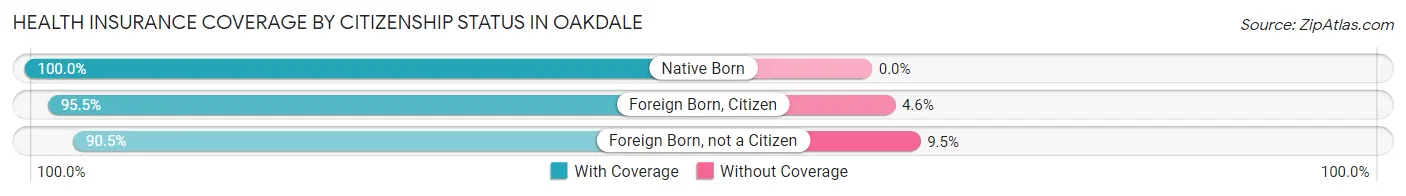
| Citizenship Status | With Coverage | Without Coverage |
| Native Born | 4 (100.0%) | 0 (0.0%) |
| Foreign Born, Citizen | 42 (95.5%) | 2 (4.5%) |
| Foreign Born, not a Citizen | 19 (90.5%) | 2 (9.5%) |
Health Insurance Coverage by Household Income in Oakdale
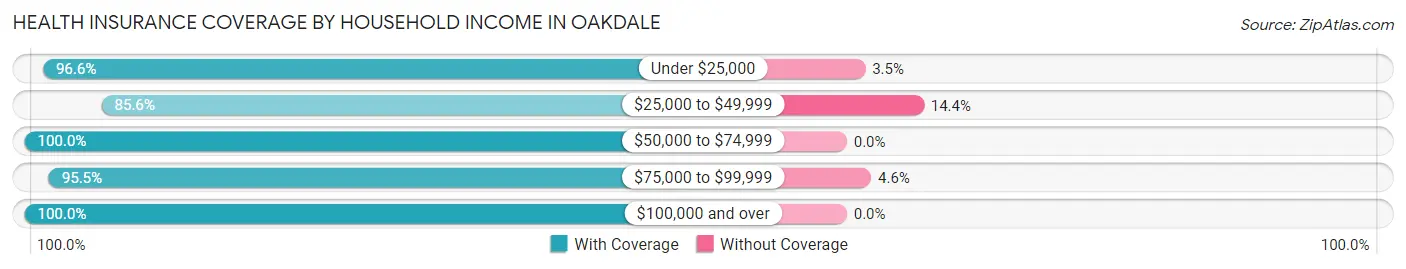
| Household Income | With Coverage | Without Coverage |
| Under $25,000 | 28 (96.6%) | 1 (3.5%) |
| $25,000 to $49,999 | 83 (85.6%) | 14 (14.4%) |
| $50,000 to $74,999 | 21 (100.0%) | 0 (0.0%) |
| $75,000 to $99,999 | 42 (95.5%) | 2 (4.5%) |
| $100,000 and over | 39 (100.0%) | 0 (0.0%) |
Public vs Private Health Insurance Coverage by Age in Oakdale
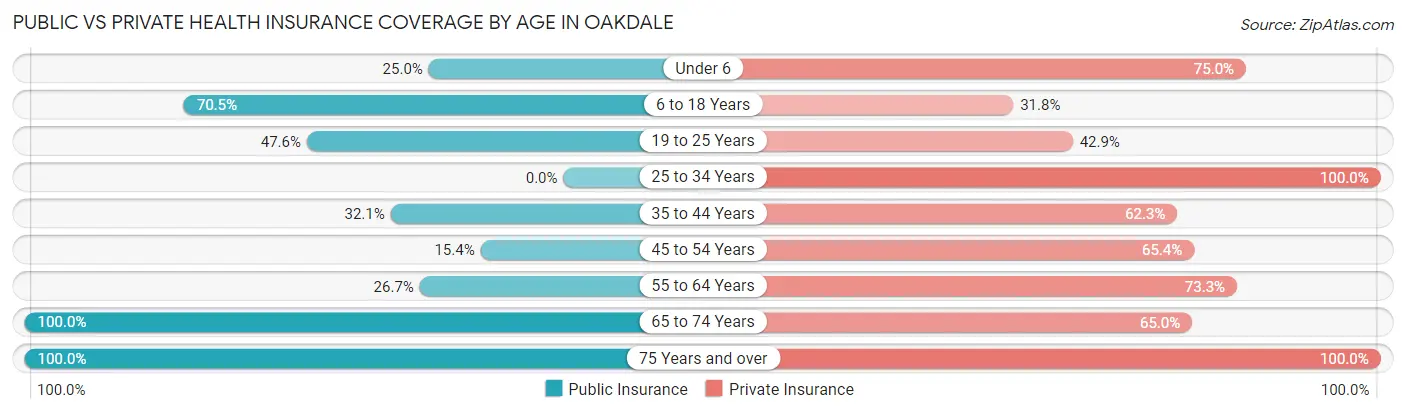
| Age Bracket | Public Insurance | Private Insurance |
| Under 6 | 1 (25.0%) | 3 (75.0%) |
| 6 to 18 Years | 31 (70.5%) | 14 (31.8%) |
| 19 to 25 Years | 10 (47.6%) | 9 (42.9%) |
| 25 to 34 Years | 0 (0.0%) | 6 (100.0%) |
| 35 to 44 Years | 17 (32.1%) | 33 (62.3%) |
| 45 to 54 Years | 8 (15.4%) | 34 (65.4%) |
| 55 to 64 Years | 4 (26.7%) | 11 (73.3%) |
| 65 to 74 Years | 20 (100.0%) | 13 (65.0%) |
| 75 Years and over | 15 (100.0%) | 15 (100.0%) |
| Total | 106 (46.1%) | 138 (60.0%) |
Disability Status by Sex by Age in Oakdale
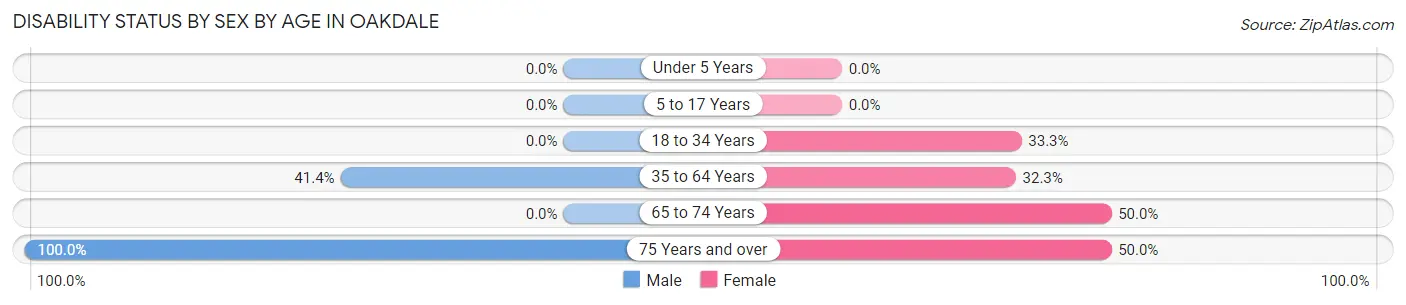
| Age Bracket | Male | Female |
| Under 5 Years | 0 (0.0%) | 0 (0.0%) |
| 5 to 17 Years | 0 (0.0%) | 0 (0.0%) |
| 18 to 34 Years | 0 (0.0%) | 7 (33.3%) |
| 35 to 64 Years | 24 (41.4%) | 20 (32.3%) |
| 65 to 74 Years | 0 (0.0%) | 7 (50.0%) |
| 75 Years and over | 5 (100.0%) | 5 (50.0%) |
Disability Class by Sex by Age in Oakdale
Disability Class: Hearing Difficulty
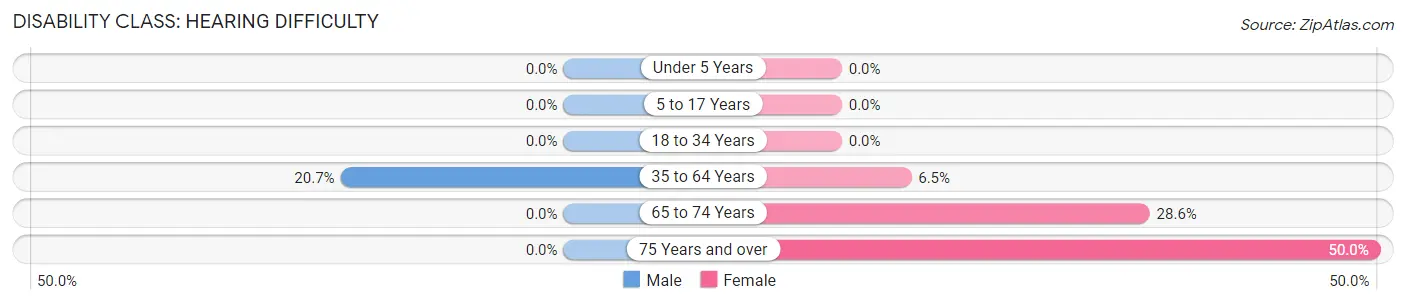
| Age Bracket | Male | Female |
| Under 5 Years | 0 (0.0%) | 0 (0.0%) |
| 5 to 17 Years | 0 (0.0%) | 0 (0.0%) |
| 18 to 34 Years | 0 (0.0%) | 0 (0.0%) |
| 35 to 64 Years | 12 (20.7%) | 4 (6.5%) |
| 65 to 74 Years | 0 (0.0%) | 4 (28.6%) |
| 75 Years and over | 0 (0.0%) | 5 (50.0%) |
Disability Class: Vision Difficulty
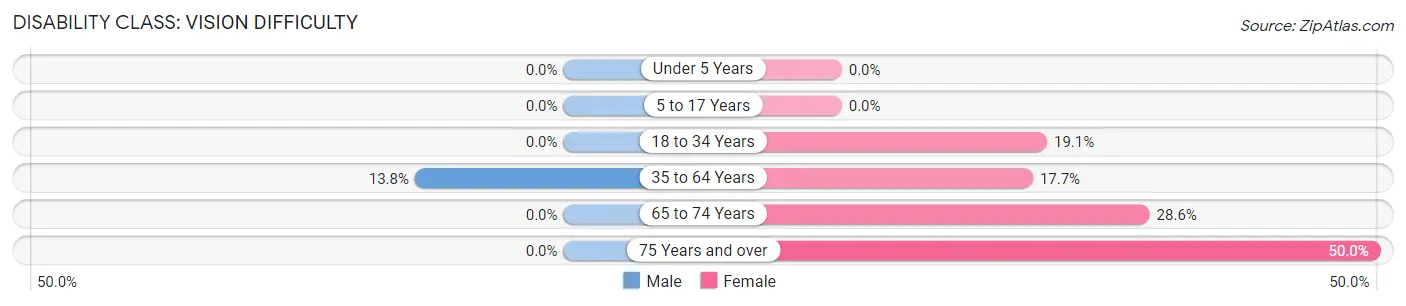
| Age Bracket | Male | Female |
| Under 5 Years | 0 (0.0%) | 0 (0.0%) |
| 5 to 17 Years | 0 (0.0%) | 0 (0.0%) |
| 18 to 34 Years | 0 (0.0%) | 4 (19.1%) |
| 35 to 64 Years | 8 (13.8%) | 11 (17.7%) |
| 65 to 74 Years | 0 (0.0%) | 4 (28.6%) |
| 75 Years and over | 0 (0.0%) | 5 (50.0%) |
Disability Class: Cognitive Difficulty
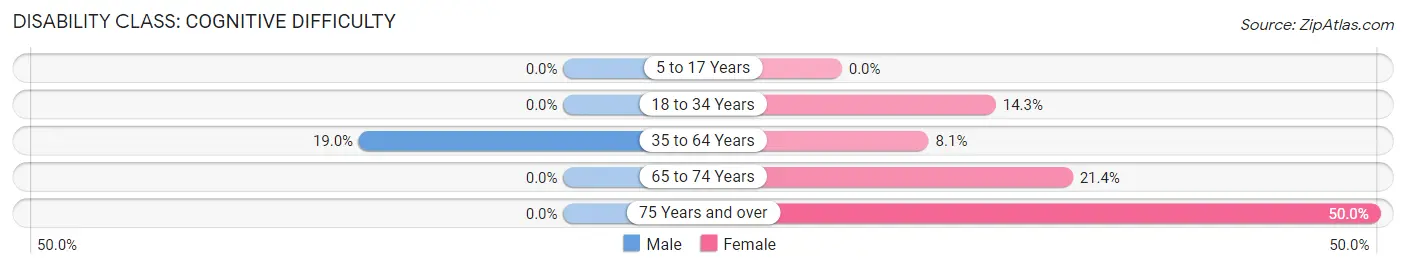
| Age Bracket | Male | Female |
| 5 to 17 Years | 0 (0.0%) | 0 (0.0%) |
| 18 to 34 Years | 0 (0.0%) | 3 (14.3%) |
| 35 to 64 Years | 11 (19.0%) | 5 (8.1%) |
| 65 to 74 Years | 0 (0.0%) | 3 (21.4%) |
| 75 Years and over | 0 (0.0%) | 5 (50.0%) |
Disability Class: Ambulatory Difficulty
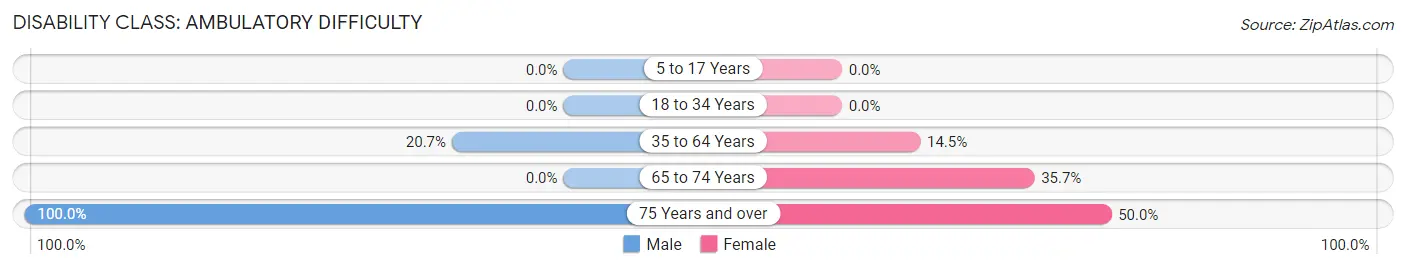
| Age Bracket | Male | Female |
| 5 to 17 Years | 0 (0.0%) | 0 (0.0%) |
| 18 to 34 Years | 0 (0.0%) | 0 (0.0%) |
| 35 to 64 Years | 12 (20.7%) | 9 (14.5%) |
| 65 to 74 Years | 0 (0.0%) | 5 (35.7%) |
| 75 Years and over | 5 (100.0%) | 5 (50.0%) |
Disability Class: Self-Care Difficulty
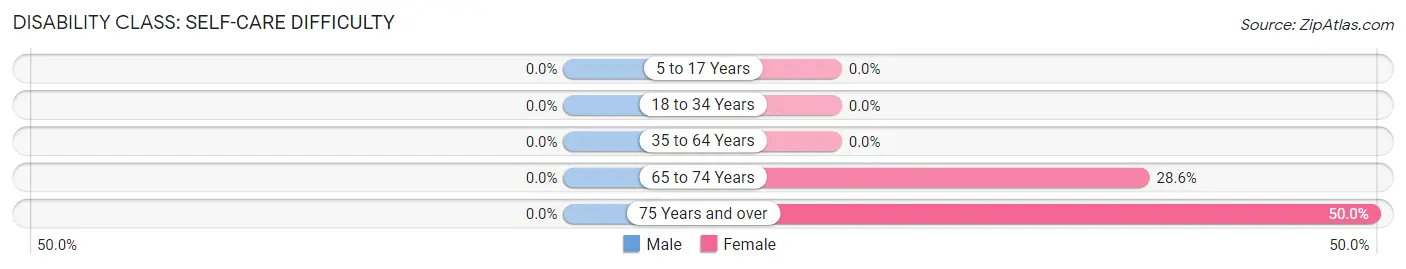
| Age Bracket | Male | Female |
| 5 to 17 Years | 0 (0.0%) | 0 (0.0%) |
| 18 to 34 Years | 0 (0.0%) | 0 (0.0%) |
| 35 to 64 Years | 0 (0.0%) | 0 (0.0%) |
| 65 to 74 Years | 0 (0.0%) | 4 (28.6%) |
| 75 Years and over | 0 (0.0%) | 5 (50.0%) |
Technology Access in Oakdale
Computing Device Access in Oakdale
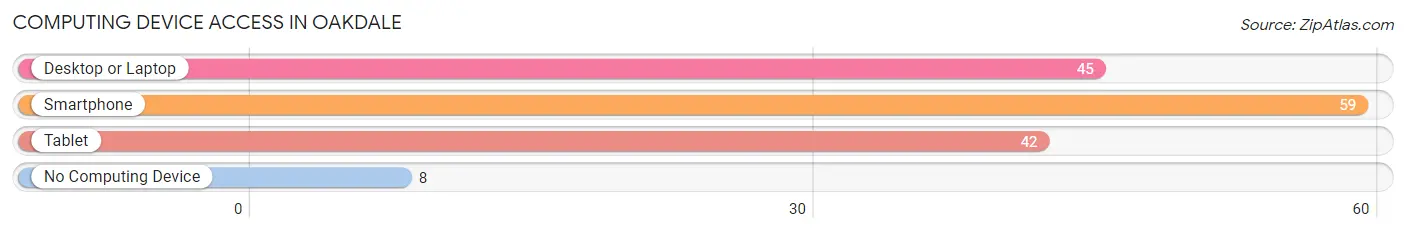
| Device Type | # Households | % Households |
| Desktop or Laptop | 45 | 62.5% |
| Smartphone | 59 | 81.9% |
| Tablet | 42 | 58.3% |
| No Computing Device | 8 | 11.1% |
| Total | 72 | 100.0% |
Internet Access in Oakdale
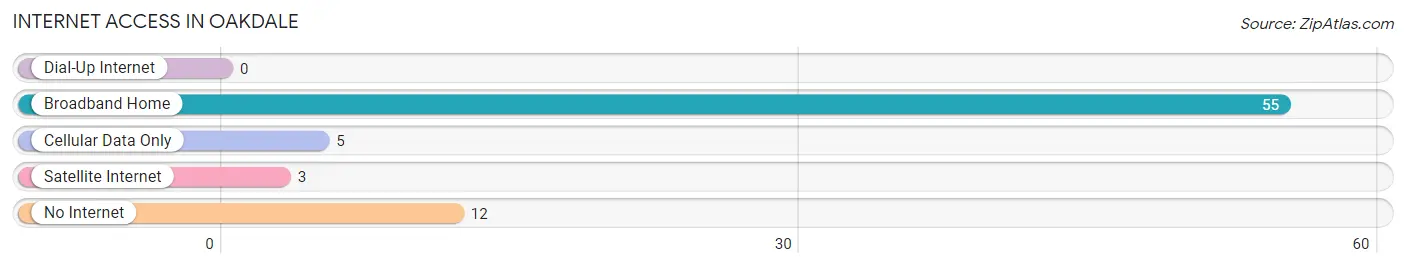
| Internet Type | # Households | % Households |
| Dial-Up Internet | 0 | 0.0% |
| Broadband Home | 55 | 76.4% |
| Cellular Data Only | 5 | 6.9% |
| Satellite Internet | 3 | 4.2% |
| No Internet | 12 | 16.7% |
| Total | 72 | 100.0% |
Oakdale Summary
Oakdale, Tennessee is a small town located in Morgan County, Tennessee. It is situated in the foothills of the Cumberland Mountains, and is part of the Knoxville Metropolitan Statistical Area. The town has a population of approximately 1,000 people, and is known for its rural charm and friendly atmosphere.
History
Oakdale was founded in 1820 by a group of settlers from North Carolina. The town was originally known as “Oak Grove”, but was later changed to Oakdale. The town was named after the many oak trees that grew in the area. The town was incorporated in 1872, and the first post office was established in 1873.
In the late 19th century, Oakdale was a thriving agricultural community. The town was home to several cotton gins, a grist mill, and a sawmill. The town also had a number of stores, churches, and a school.
In the early 20th century, Oakdale experienced a period of growth and prosperity. The town was home to several businesses, including a bank, a hotel, a movie theater, and a number of stores. The town also had a number of churches, and a high school.
Geography
Oakdale is located in the foothills of the Cumberland Mountains, and is part of the Knoxville Metropolitan Statistical Area. The town is situated at an elevation of 1,000 feet above sea level. The town is located approximately 25 miles from Knoxville, and is accessible via Interstate 40.
The town is situated in a valley, and is surrounded by rolling hills and mountains. The town is located near the Emory River, and is home to several parks and recreational areas.
Economy
Oakdale’s economy is largely based on agriculture and tourism. The town is home to several farms, and is known for its production of corn, soybeans, and hay. The town is also home to several wineries, and is a popular destination for wine tasting.
The town is also home to several small businesses, including restaurants, shops, and a number of service-based businesses. The town is also home to a number of manufacturing companies, including a furniture factory and a plastics factory.
Demographics
As of the 2010 census, Oakdale had a population of 1,000 people. The town is predominantly white, with approximately 95% of the population identifying as white. The town is also home to a small Hispanic population, with approximately 4% of the population identifying as Hispanic. The town is also home to a small African American population, with approximately 1% of the population identifying as African American.
The median household income in Oakdale is approximately $35,000, and the median home value is approximately $90,000. The town has a poverty rate of approximately 15%, and the unemployment rate is approximately 5%.
Conclusion
Oakdale, Tennessee is a small town located in Morgan County, Tennessee. The town has a population of approximately 1,000 people, and is known for its rural charm and friendly atmosphere. The town’s economy is largely based on agriculture and tourism, and the town is home to several small businesses. The town is predominantly white, with approximately 95% of the population identifying as white. The median household income in Oakdale is approximately $35,000, and the median home value is approximately $90,000.
Common Questions
What is Per Capita Income in Oakdale?
Per Capita income in Oakdale is $18,746.
What is the Median Family Income in Oakdale?
Median Family Income in Oakdale is $52,750.
What is the Median Household income in Oakdale?
Median Household Income in Oakdale is $49,063.
What is Income or Wage Gap in Oakdale?
Income or Wage Gap in Oakdale is 34.0%.
Women in Oakdale earn 66.0 cents for every dollar earned by a man.
What is Inequality or Gini Index in Oakdale?
Inequality or Gini Index in Oakdale is 0.34.
What is the Total Population of Oakdale?
Total Population of Oakdale is 230.
What is the Total Male Population of Oakdale?
Total Male Population of Oakdale is 103.
What is the Total Female Population of Oakdale?
Total Female Population of Oakdale is 127.
What is the Ratio of Males per 100 Females in Oakdale?
There are 81.10 Males per 100 Females in Oakdale.
What is the Ratio of Females per 100 Males in Oakdale?
There are 123.30 Females per 100 Males in Oakdale.
What is the Median Population Age in Oakdale?
Median Population Age in Oakdale is 41.3 Years.
What is the Average Family Size in Oakdale
Average Family Size in Oakdale is 3.1 People.
What is the Average Household Size in Oakdale
Average Household Size in Oakdale is 3.2 People.
How Large is the Labor Force in Oakdale?
There are 93 People in the Labor Forcein in Oakdale.
What is the Percentage of People in the Labor Force in Oakdale?
48.2% of People are in the Labor Force in Oakdale.
What is the Unemployment Rate in Oakdale?
Unemployment Rate in Oakdale is 5.4%.