Niota, TN Map & Demographics
Niota Map
Niota Overview
$26,871
PER CAPITA INCOME
$63,750
AVG FAMILY INCOME
$53,333
AVG HOUSEHOLD INCOME
12.5%
WAGE / INCOME GAP [ % ]
87.5¢/ $1
WAGE / INCOME GAP [ $ ]
0.38
INEQUALITY / GINI INDEX
705
TOTAL POPULATION
383
MALE POPULATION
322
FEMALE POPULATION
118.94
MALES / 100 FEMALES
84.07
FEMALES / 100 MALES
42.0
MEDIAN AGE
2.9
AVG FAMILY SIZE
2.2
AVG HOUSEHOLD SIZE
391
LABOR FORCE [ PEOPLE ]
65.1%
PERCENT IN LABOR FORCE
9.2%
UNEMPLOYMENT RATE
Niota Zip Codes
Niota Area Codes
Income in Niota
Income Overview in Niota
Per Capita Income in Niota is $26,871, while median incomes of families and households are $63,750 and $53,333 respectively.
| Characteristic | Number | Measure |
| Per Capita Income | 705 | $26,871 |
| Median Family Income | 172 | $63,750 |
| Mean Family Income | 172 | $72,502 |
| Median Household Income | 316 | $53,333 |
| Mean Household Income | 316 | $60,593 |
| Income Deficit | 172 | $0 |
| Wage / Income Gap (%) | 705 | 12.49% |
| Wage / Income Gap ($) | 705 | 87.51¢ per $1 |
| Gini / Inequality Index | 705 | 0.38 |
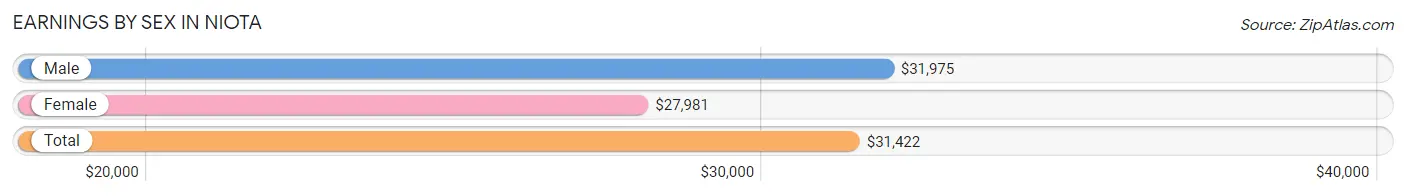
Earnings by Sex in Niota
Average Earnings in Niota are $31,422, $31,975 for men and $27,981 for women, a difference of 12.5%.
| Sex | Number | Average Earnings |
| Male | 251 (64.4%) | $31,975 |
| Female | 139 (35.6%) | $27,981 |
| Total | 390 (100.0%) | $31,422 |
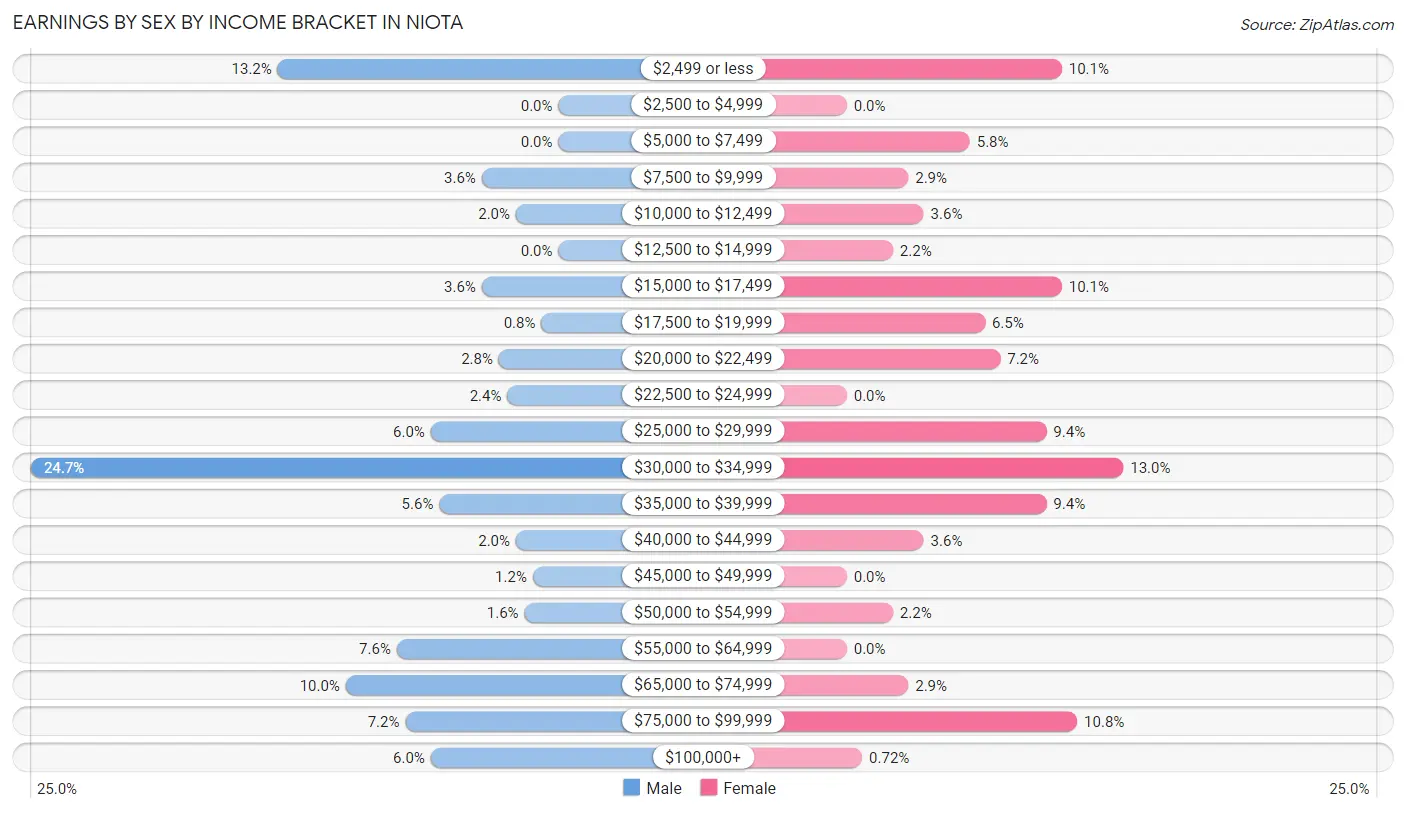
Earnings by Sex by Income Bracket in Niota
The most common earnings brackets in Niota are $30,000 to $34,999 for men (62 | 24.7%) and $30,000 to $34,999 for women (18 | 13.0%).
| Income | Male | Female |
| $2,499 or less | 33 (13.2%) | 14 (10.1%) |
| $2,500 to $4,999 | 0 (0.0%) | 0 (0.0%) |
| $5,000 to $7,499 | 0 (0.0%) | 8 (5.8%) |
| $7,500 to $9,999 | 9 (3.6%) | 4 (2.9%) |
| $10,000 to $12,499 | 5 (2.0%) | 5 (3.6%) |
| $12,500 to $14,999 | 0 (0.0%) | 3 (2.2%) |
| $15,000 to $17,499 | 9 (3.6%) | 14 (10.1%) |
| $17,500 to $19,999 | 2 (0.8%) | 9 (6.5%) |
| $20,000 to $22,499 | 7 (2.8%) | 10 (7.2%) |
| $22,500 to $24,999 | 6 (2.4%) | 0 (0.0%) |
| $25,000 to $29,999 | 15 (6.0%) | 13 (9.3%) |
| $30,000 to $34,999 | 62 (24.7%) | 18 (13.0%) |
| $35,000 to $39,999 | 14 (5.6%) | 13 (9.3%) |
| $40,000 to $44,999 | 5 (2.0%) | 5 (3.6%) |
| $45,000 to $49,999 | 3 (1.2%) | 0 (0.0%) |
| $50,000 to $54,999 | 4 (1.6%) | 3 (2.2%) |
| $55,000 to $64,999 | 19 (7.6%) | 0 (0.0%) |
| $65,000 to $74,999 | 25 (10.0%) | 4 (2.9%) |
| $75,000 to $99,999 | 18 (7.2%) | 15 (10.8%) |
| $100,000+ | 15 (6.0%) | 1 (0.7%) |
| Total | 251 (100.0%) | 139 (100.0%) |
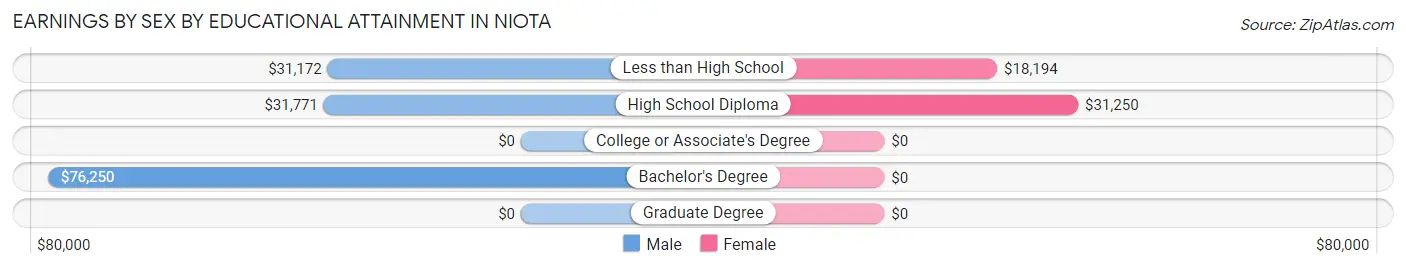
Earnings by Sex by Educational Attainment in Niota
Average earnings in Niota are $32,368 for men and $28,750 for women, a difference of 11.2%. Men with an educational attainment of bachelor's degree enjoy the highest average annual earnings of $76,250, while those with less than high school education earn the least with $31,172. Women with an educational attainment of high school diploma earn the most with the average annual earnings of $31,250, while those with less than high school education have the smallest earnings of $18,194.
| Educational Attainment | Male Income | Female Income |
| Less than High School | $31,172 | $18,194 |
| High School Diploma | $31,771 | $31,250 |
| College or Associate's Degree | - | - |
| Bachelor's Degree | $76,250 | $0 |
| Graduate Degree | - | - |
| Total | $32,368 | $28,750 |
Family Income in Niota
Family Income Brackets in Niota
According to the Niota family income data, there are 35 families falling into the $50,000 to $74,999 income range, which is the most common income bracket and makes up 20.3% of all families.
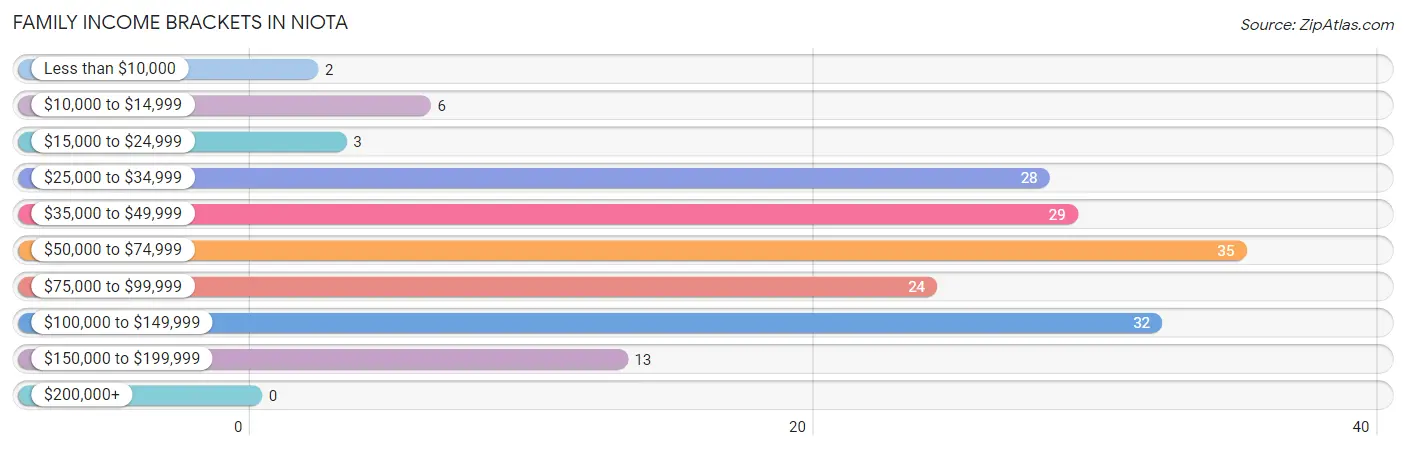
| Income Bracket | # Families | % Families |
| Less than $10,000 | 2 | 1.2% |
| $10,000 to $14,999 | 6 | 3.5% |
| $15,000 to $24,999 | 3 | 1.7% |
| $25,000 to $34,999 | 28 | 16.3% |
| $35,000 to $49,999 | 29 | 16.9% |
| $50,000 to $74,999 | 35 | 20.3% |
| $75,000 to $99,999 | 24 | 14.0% |
| $100,000 to $149,999 | 32 | 18.6% |
| $150,000 to $199,999 | 13 | 7.6% |
| $200,000+ | 0 | 0.0% |
Family Income by Famaliy Size in Niota
4-person families (46 | 26.7%) account for the highest median family income in Niota with $81,875 per family, while 2-person families (92 | 53.5%) have the highest median income of $26,562 per family member.
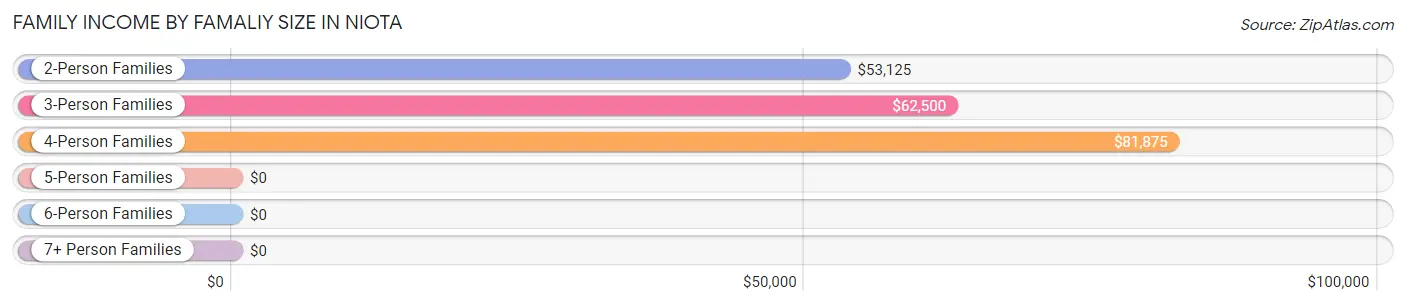
| Income Bracket | # Families | Median Income |
| 2-Person Families | 92 (53.5%) | $53,125 |
| 3-Person Families | 22 (12.8%) | $62,500 |
| 4-Person Families | 46 (26.7%) | $81,875 |
| 5-Person Families | 8 (4.6%) | $0 |
| 6-Person Families | 0 (0.0%) | $0 |
| 7+ Person Families | 4 (2.3%) | $0 |
| Total | 172 (100.0%) | $63,750 |
Family Income by Number of Earners in Niota
The median family income in Niota is $63,750, with families comprising 2 earners (57) having the highest median family income of $91,250, while families with no earners (36) have the lowest median family income of $43,750, accounting for 33.1% and 20.9% of families, respectively.
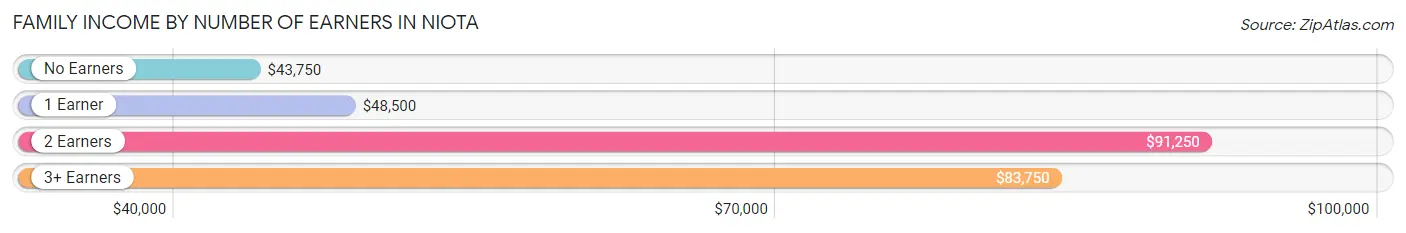
| Number of Earners | # Families | Median Income |
| No Earners | 36 (20.9%) | $43,750 |
| 1 Earner | 64 (37.2%) | $48,500 |
| 2 Earners | 57 (33.1%) | $91,250 |
| 3+ Earners | 15 (8.7%) | $83,750 |
| Total | 172 (100.0%) | $63,750 |
Household Income in Niota
Household Income Brackets in Niota
With 69 households falling in the category, the $50,000 to $74,999 income range is the most frequent in Niota, accounting for 21.8% of all households.
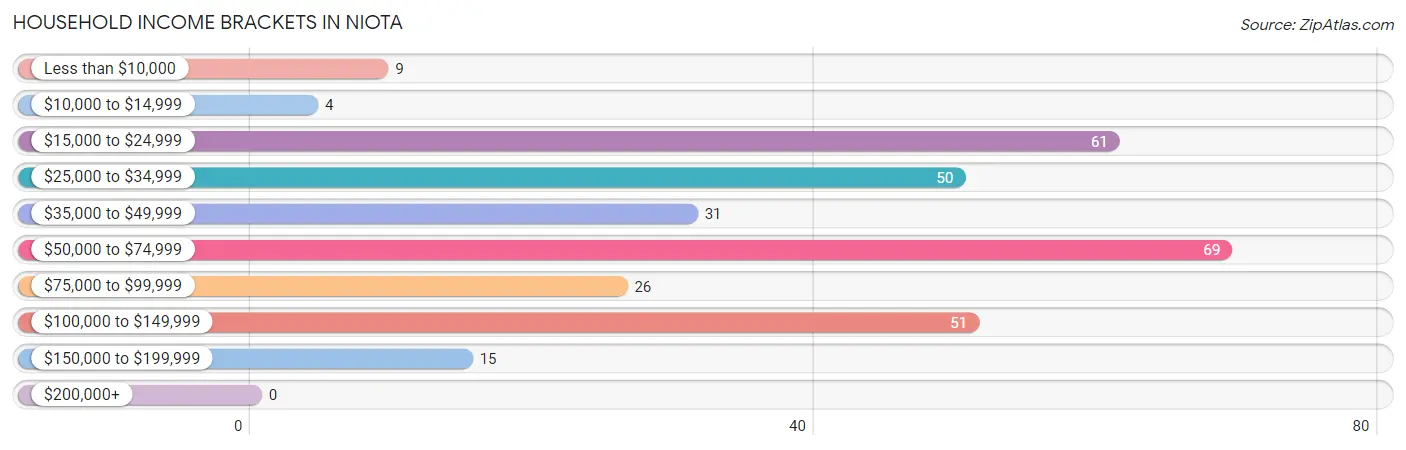
| Income Bracket | # Households | % Households |
| Less than $10,000 | 9 | 2.8% |
| $10,000 to $14,999 | 4 | 1.3% |
| $15,000 to $24,999 | 61 | 19.3% |
| $25,000 to $34,999 | 50 | 15.8% |
| $35,000 to $49,999 | 31 | 9.8% |
| $50,000 to $74,999 | 69 | 21.8% |
| $75,000 to $99,999 | 26 | 8.2% |
| $100,000 to $149,999 | 51 | 16.1% |
| $150,000 to $199,999 | 15 | 4.7% |
| $200,000+ | 0 | 0.0% |
Household Income by Householder Age in Niota
The median household income in Niota is $53,333, with the highest median household income of $68,393 found in the 25 to 44 years age bracket for the primary householder. A total of 95 households (30.1%) fall into this category. Meanwhile, the 15 to 24 years age bracket for the primary householder has the lowest median household income of $30,500, with 12 households (3.8%) in this group.
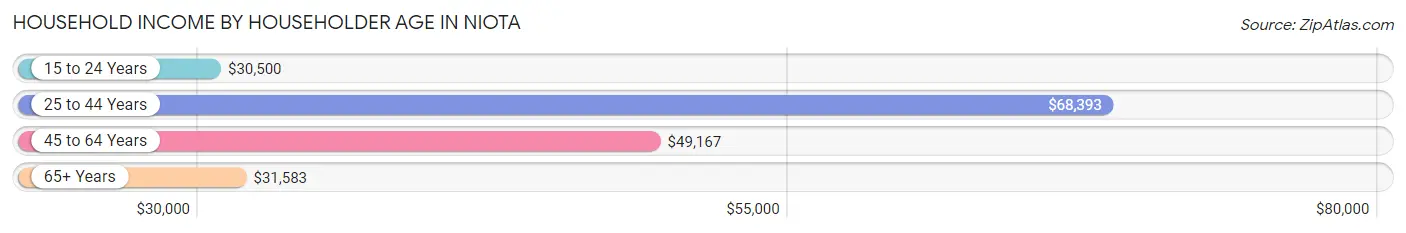
| Income Bracket | # Households | Median Income |
| 15 to 24 Years | 12 (3.8%) | $30,500 |
| 25 to 44 Years | 95 (30.1%) | $68,393 |
| 45 to 64 Years | 118 (37.3%) | $49,167 |
| 65+ Years | 91 (28.8%) | $31,583 |
| Total | 316 (100.0%) | $53,333 |
Poverty in Niota
Income Below Poverty by Sex and Age in Niota
With 7.6% poverty level for males and 7.1% for females among the residents of Niota, 18 to 24 year old males and 55 to 64 year old females are the most vulnerable to poverty, with 8 males (36.4%) and 10 females (28.6%) in their respective age groups living below the poverty level.
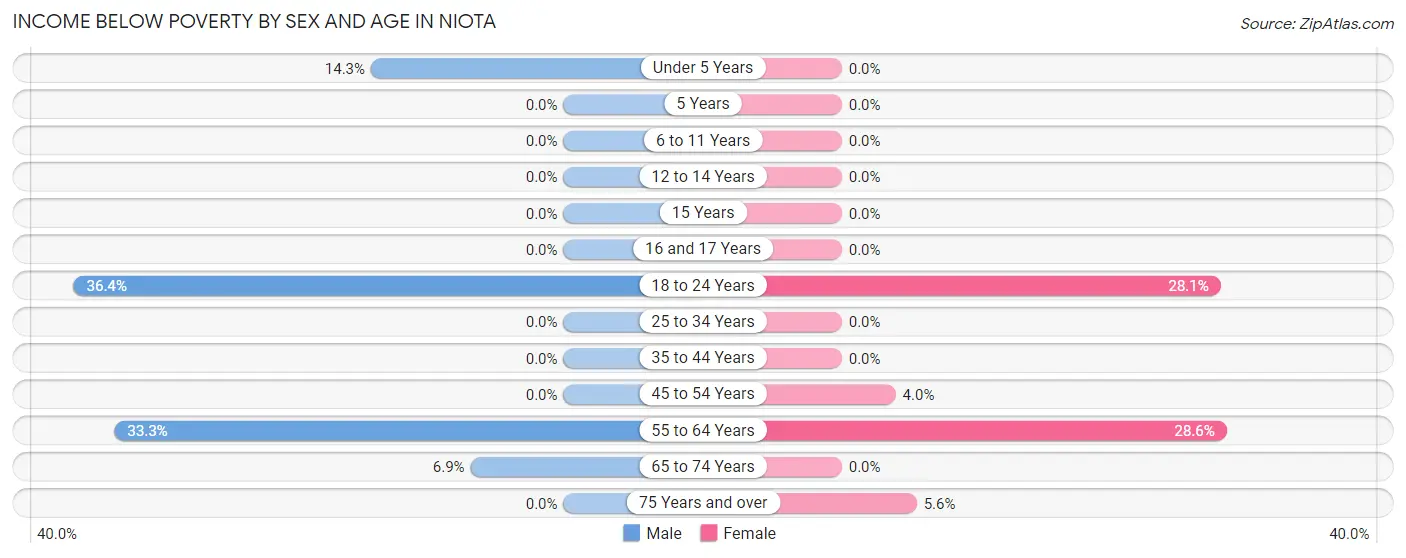
| Age Bracket | Male | Female |
| Under 5 Years | 2 (14.3%) | 0 (0.0%) |
| 5 Years | 0 (0.0%) | 0 (0.0%) |
| 6 to 11 Years | 0 (0.0%) | 0 (0.0%) |
| 12 to 14 Years | 0 (0.0%) | 0 (0.0%) |
| 15 Years | 0 (0.0%) | 0 (0.0%) |
| 16 and 17 Years | 0 (0.0%) | 0 (0.0%) |
| 18 to 24 Years | 8 (36.4%) | 9 (28.1%) |
| 25 to 34 Years | 0 (0.0%) | 0 (0.0%) |
| 35 to 44 Years | 0 (0.0%) | 0 (0.0%) |
| 45 to 54 Years | 0 (0.0%) | 2 (4.0%) |
| 55 to 64 Years | 17 (33.3%) | 10 (28.6%) |
| 65 to 74 Years | 2 (6.9%) | 0 (0.0%) |
| 75 Years and over | 0 (0.0%) | 2 (5.6%) |
| Total | 29 (7.6%) | 23 (7.1%) |
Income Above Poverty by Sex and Age in Niota
According to the poverty statistics in Niota, males aged 5 years and females aged under 5 years are the age groups that are most secure financially, with 100.0% of males and 100.0% of females in these age groups living above the poverty line.
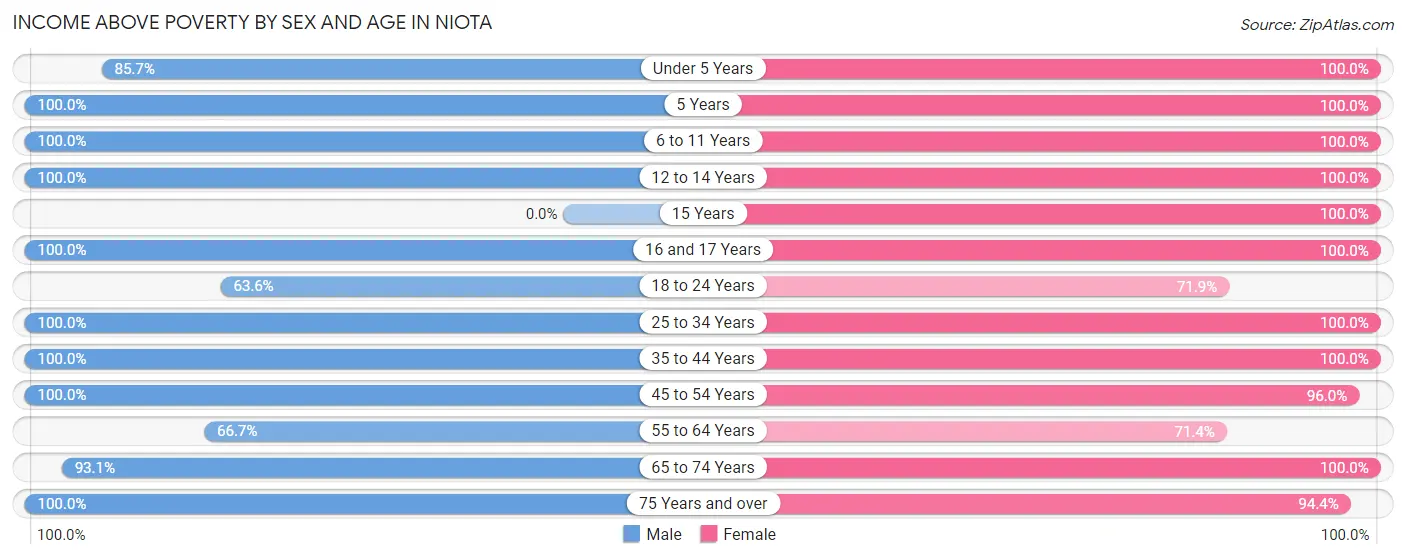
| Age Bracket | Male | Female |
| Under 5 Years | 12 (85.7%) | 23 (100.0%) |
| 5 Years | 3 (100.0%) | 3 (100.0%) |
| 6 to 11 Years | 20 (100.0%) | 15 (100.0%) |
| 12 to 14 Years | 11 (100.0%) | 10 (100.0%) |
| 15 Years | 0 (0.0%) | 2 (100.0%) |
| 16 and 17 Years | 17 (100.0%) | 12 (100.0%) |
| 18 to 24 Years | 14 (63.6%) | 23 (71.9%) |
| 25 to 34 Years | 52 (100.0%) | 35 (100.0%) |
| 35 to 44 Years | 81 (100.0%) | 41 (100.0%) |
| 45 to 54 Years | 49 (100.0%) | 48 (96.0%) |
| 55 to 64 Years | 34 (66.7%) | 25 (71.4%) |
| 65 to 74 Years | 27 (93.1%) | 28 (100.0%) |
| 75 Years and over | 31 (100.0%) | 34 (94.4%) |
| Total | 351 (92.4%) | 299 (92.9%) |
Income Below Poverty Among Married-Couple Families in Niota
The poverty statistics for married-couple families in Niota show that 1.4% or 2 of the total 139 families live below the poverty line. Families with 1 or 2 children have the highest poverty rate of 3.3%, comprising of 2 families. On the other hand, families with no children have the lowest poverty rate of 0.0%, which includes 0 families.
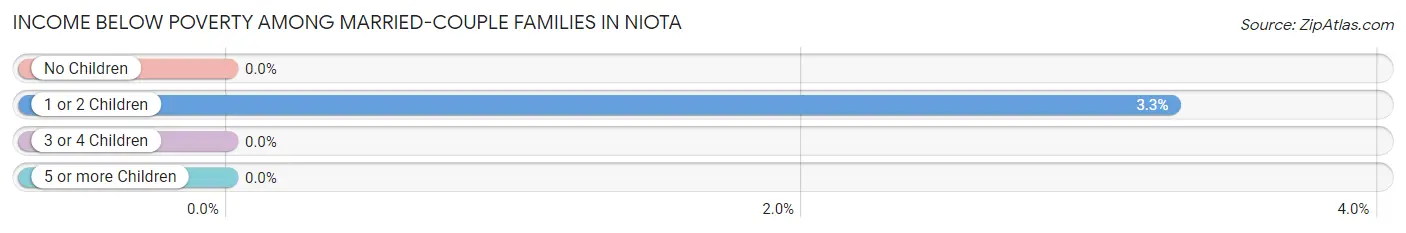
| Children | Above Poverty | Below Poverty |
| No Children | 70 (100.0%) | 0 (0.0%) |
| 1 or 2 Children | 59 (96.7%) | 2 (3.3%) |
| 3 or 4 Children | 8 (100.0%) | 0 (0.0%) |
| 5 or more Children | 0 (0.0%) | 0 (0.0%) |
| Total | 137 (98.6%) | 2 (1.4%) |
Income Below Poverty Among Single-Parent Households in Niota
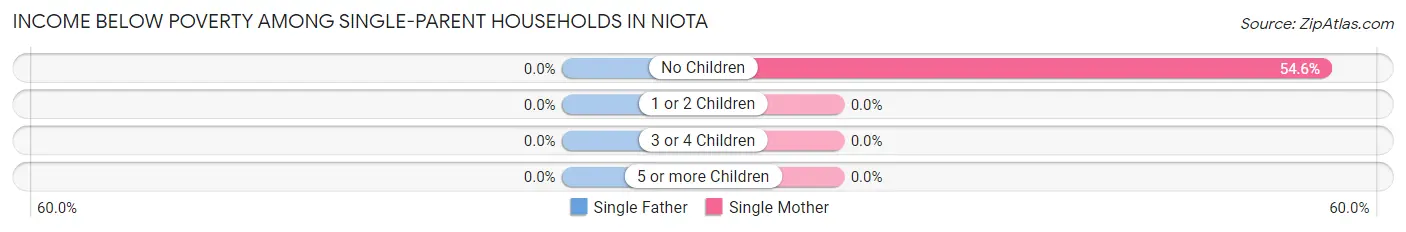
| Children | Single Father | Single Mother |
| No Children | 0 (0.0%) | 6 (54.5%) |
| 1 or 2 Children | 0 (0.0%) | 0 (0.0%) |
| 3 or 4 Children | 0 (0.0%) | 0 (0.0%) |
| 5 or more Children | 0 (0.0%) | 0 (0.0%) |
| Total | 0 (0.0%) | 6 (33.3%) |
Income Below Poverty Among Married-Couple vs Single-Parent Households in Niota
The poverty data for Niota shows that 2 of the married-couple family households (1.4%) and 6 of the single-parent households (18.2%) are living below the poverty level. Within the married-couple family households, those with 1 or 2 children have the highest poverty rate, with 2 households (3.3%) falling below the poverty line. Among the single-parent households, those with no children have the highest poverty rate, with 6 household (54.5%) living below poverty.
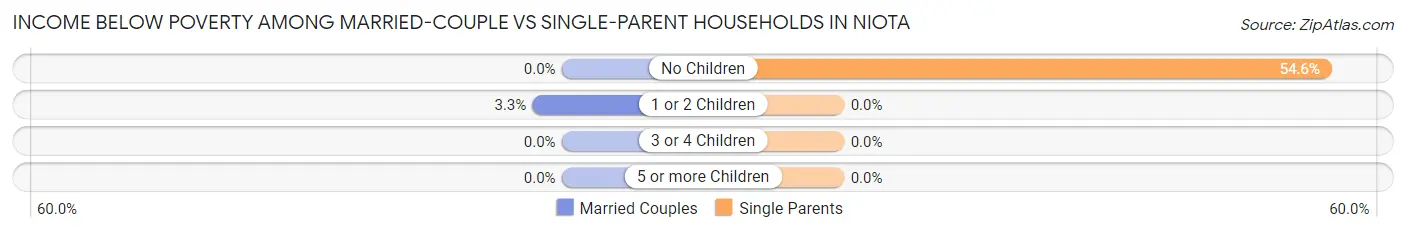
| Children | Married-Couple Families | Single-Parent Households |
| No Children | 0 (0.0%) | 6 (54.5%) |
| 1 or 2 Children | 2 (3.3%) | 0 (0.0%) |
| 3 or 4 Children | 0 (0.0%) | 0 (0.0%) |
| 5 or more Children | 0 (0.0%) | 0 (0.0%) |
| Total | 2 (1.4%) | 6 (18.2%) |
Race in Niota
The most populous races in Niota are White / Caucasian (553 | 78.4%), Two or more Races (66 | 9.4%), and Black / African American (47 | 6.7%).
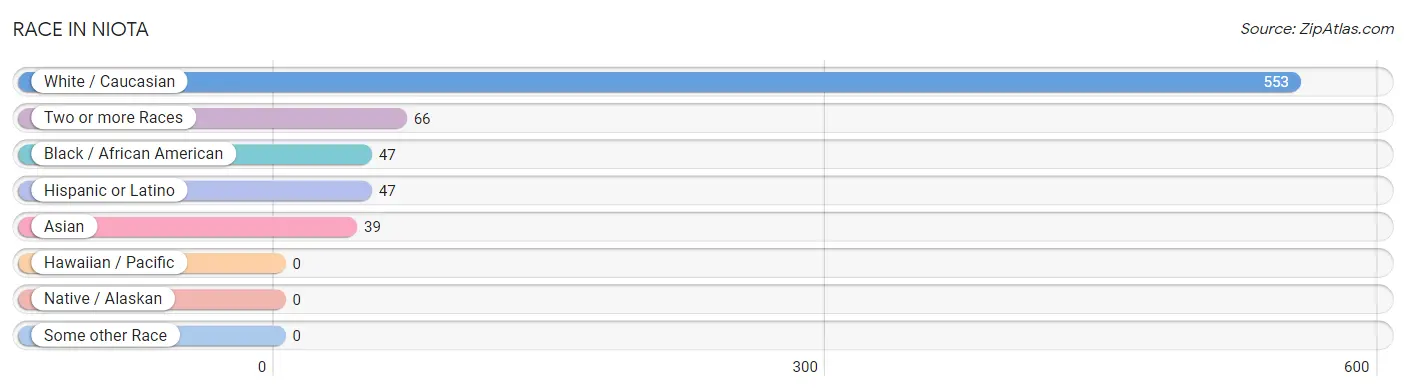
| Race | # Population | % Population |
| Asian | 39 | 5.5% |
| Black / African American | 47 | 6.7% |
| Hawaiian / Pacific | 0 | 0.0% |
| Hispanic or Latino | 47 | 6.7% |
| Native / Alaskan | 0 | 0.0% |
| White / Caucasian | 553 | 78.4% |
| Two or more Races | 66 | 9.4% |
| Some other Race | 0 | 0.0% |
| Total | 705 | 100.0% |
Ancestry in Niota
The most populous ancestries reported in Niota are Irish (98 | 13.9%), English (83 | 11.8%), German (78 | 11.1%), American (64 | 9.1%), and Central American (36 | 5.1%), together accounting for 50.9% of all Niota residents.
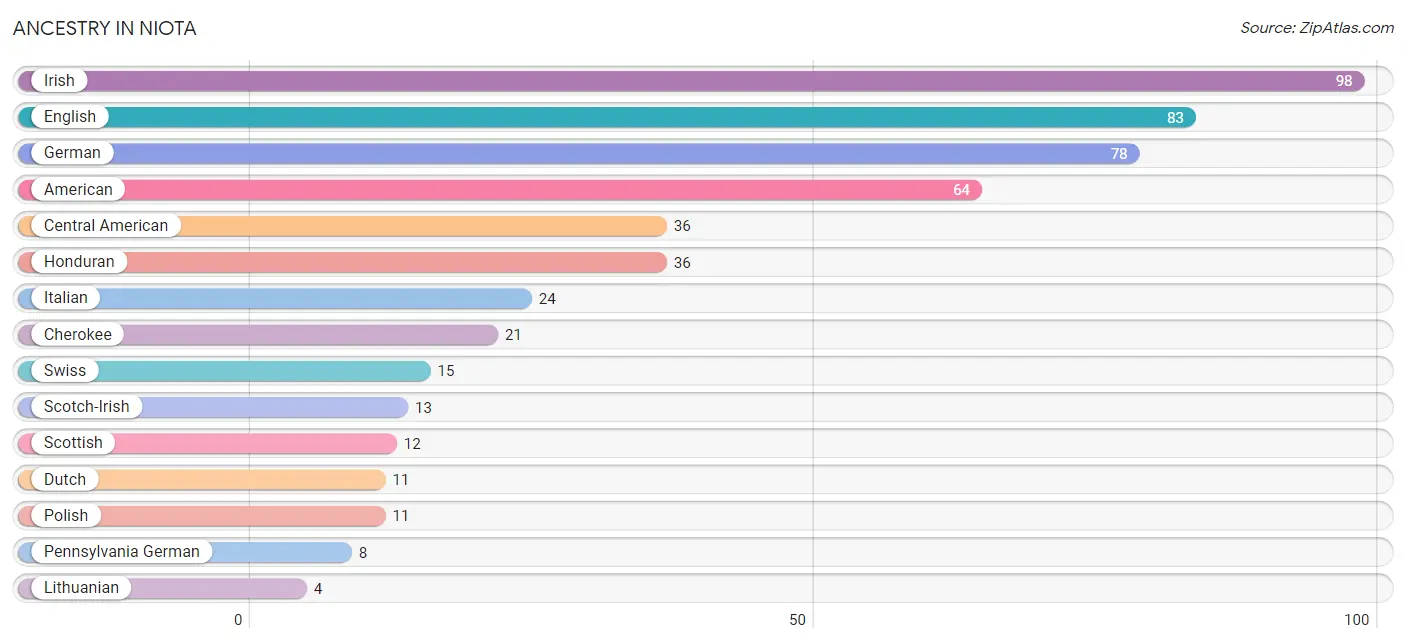
| Ancestry | # Population | % Population |
| American | 64 | 9.1% |
| Central American | 36 | 5.1% |
| Central American Indian | 2 | 0.3% |
| Cherokee | 21 | 3.0% |
| Dutch | 11 | 1.6% |
| Eastern European | 2 | 0.3% |
| English | 83 | 11.8% |
| European | 1 | 0.1% |
| French Canadian | 2 | 0.3% |
| German | 78 | 11.1% |
| Honduran | 36 | 5.1% |
| Irish | 98 | 13.9% |
| Italian | 24 | 3.4% |
| Lithuanian | 4 | 0.6% |
| Mexican | 2 | 0.3% |
| Mexican American Indian | 2 | 0.3% |
| Pennsylvania German | 8 | 1.1% |
| Polish | 11 | 1.6% |
| Scotch-Irish | 13 | 1.8% |
| Scottish | 12 | 1.7% |
| Swiss | 15 | 2.1% |
| Welsh | 3 | 0.4% | View All 22 Rows |
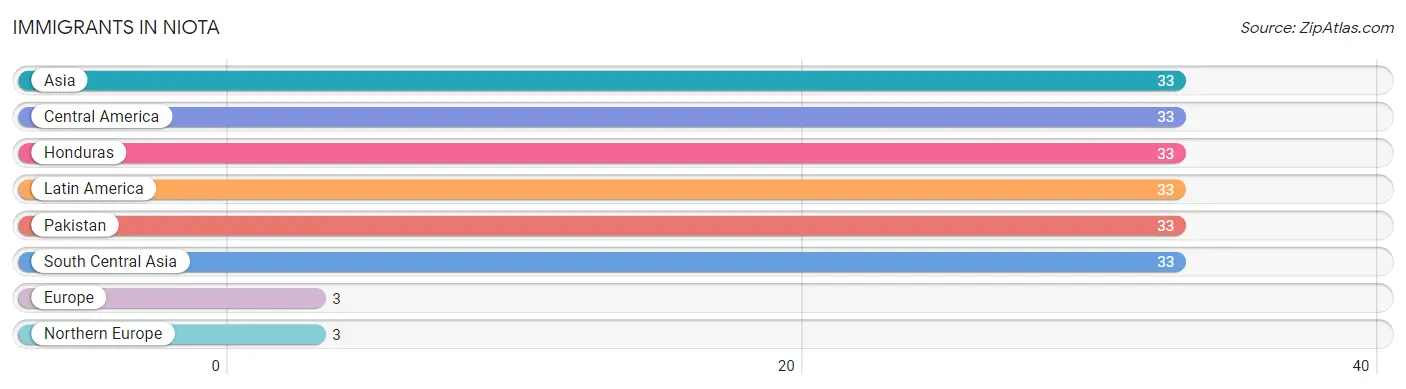
Immigrants in Niota
The most numerous immigrant groups reported in Niota came from Asia (33 | 4.7%), Central America (33 | 4.7%), Honduras (33 | 4.7%), Latin America (33 | 4.7%), and Pakistan (33 | 4.7%), together accounting for 23.4% of all Niota residents.
| Immigration Origin | # Population | % Population |
| Asia | 33 | 4.7% |
| Central America | 33 | 4.7% |
| Europe | 3 | 0.4% |
| Honduras | 33 | 4.7% |
| Latin America | 33 | 4.7% |
| Northern Europe | 3 | 0.4% |
| Pakistan | 33 | 4.7% |
| South Central Asia | 33 | 4.7% | View All 8 Rows |
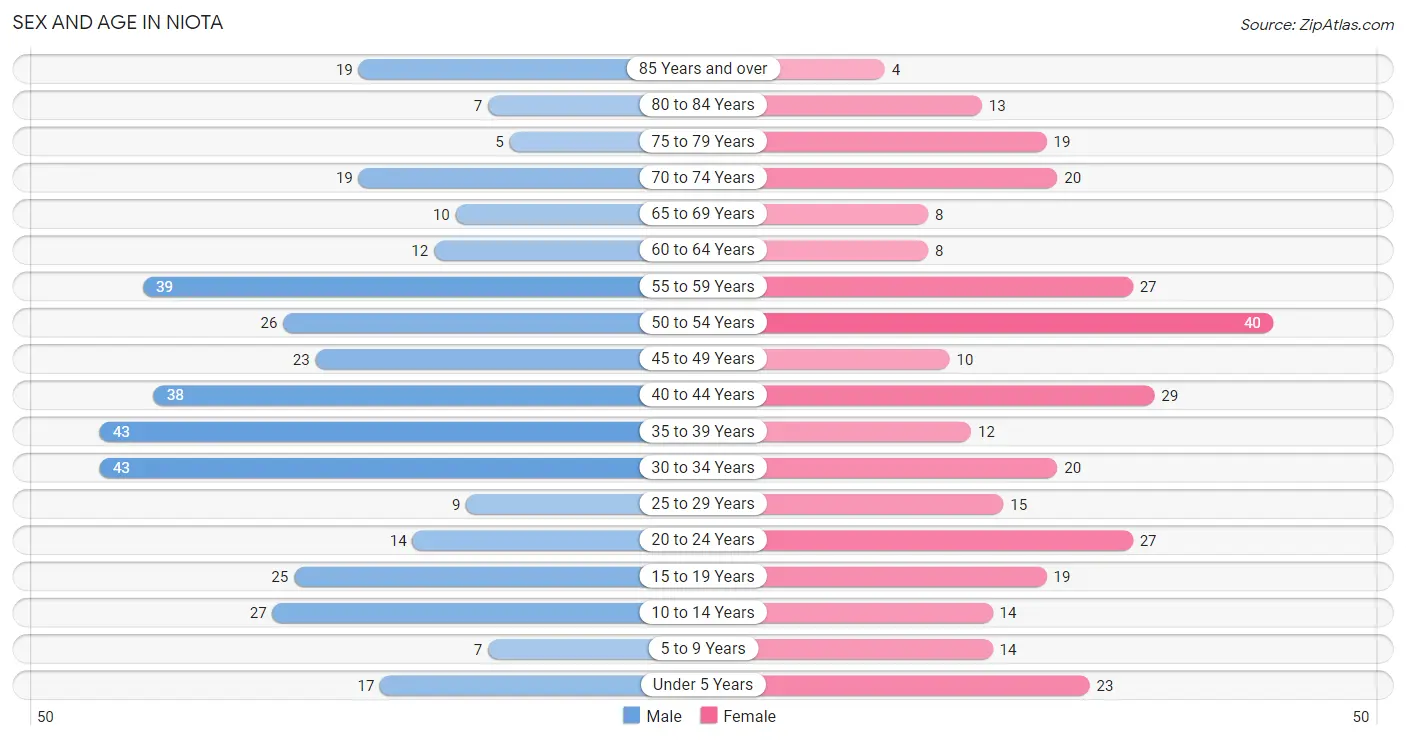
Sex and Age in Niota
Sex and Age in Niota
The most populous age groups in Niota are 30 to 34 Years (43 | 11.2%) for men and 50 to 54 Years (40 | 12.4%) for women.
| Age Bracket | Male | Female |
| Under 5 Years | 17 (4.4%) | 23 (7.1%) |
| 5 to 9 Years | 7 (1.8%) | 14 (4.3%) |
| 10 to 14 Years | 27 (7.0%) | 14 (4.3%) |
| 15 to 19 Years | 25 (6.5%) | 19 (5.9%) |
| 20 to 24 Years | 14 (3.7%) | 27 (8.4%) |
| 25 to 29 Years | 9 (2.4%) | 15 (4.7%) |
| 30 to 34 Years | 43 (11.2%) | 20 (6.2%) |
| 35 to 39 Years | 43 (11.2%) | 12 (3.7%) |
| 40 to 44 Years | 38 (9.9%) | 29 (9.0%) |
| 45 to 49 Years | 23 (6.0%) | 10 (3.1%) |
| 50 to 54 Years | 26 (6.8%) | 40 (12.4%) |
| 55 to 59 Years | 39 (10.2%) | 27 (8.4%) |
| 60 to 64 Years | 12 (3.1%) | 8 (2.5%) |
| 65 to 69 Years | 10 (2.6%) | 8 (2.5%) |
| 70 to 74 Years | 19 (5.0%) | 20 (6.2%) |
| 75 to 79 Years | 5 (1.3%) | 19 (5.9%) |
| 80 to 84 Years | 7 (1.8%) | 13 (4.0%) |
| 85 Years and over | 19 (5.0%) | 4 (1.2%) |
| Total | 383 (100.0%) | 322 (100.0%) |
Families and Households in Niota
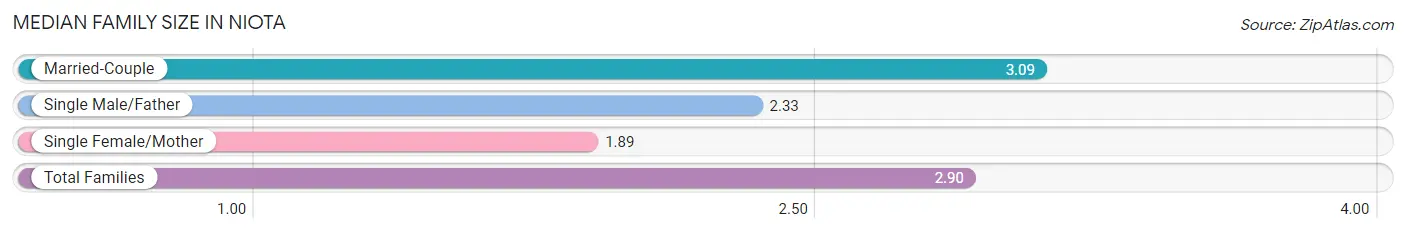
Median Family Size in Niota
The median family size in Niota is 2.90 persons per family, with married-couple families (139 | 80.8%) accounting for the largest median family size of 3.09 persons per family. On the other hand, single female/mother families (18 | 10.5%) represent the smallest median family size with 1.89 persons per family.
| Family Type | # Families | Family Size |
| Married-Couple | 139 (80.8%) | 3.09 |
| Single Male/Father | 15 (8.7%) | 2.33 |
| Single Female/Mother | 18 (10.5%) | 1.89 |
| Total Families | 172 (100.0%) | 2.90 |
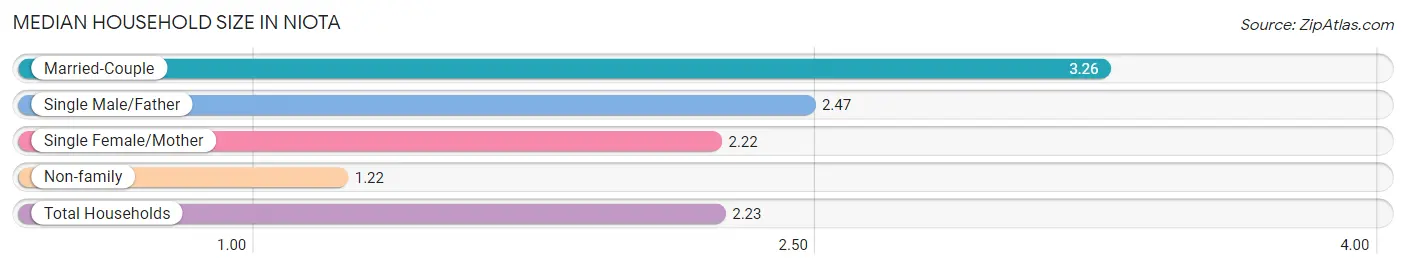
Median Household Size in Niota
The median household size in Niota is 2.23 persons per household, with married-couple households (139 | 44.0%) accounting for the largest median household size of 3.26 persons per household. non-family households (144 | 45.6%) represent the smallest median household size with 1.22 persons per household.
| Household Type | # Households | Household Size |
| Married-Couple | 139 (44.0%) | 3.26 |
| Single Male/Father | 15 (4.8%) | 2.47 |
| Single Female/Mother | 18 (5.7%) | 2.22 |
| Non-family | 144 (45.6%) | 1.22 |
| Total Households | 316 (100.0%) | 2.23 |
Household Size by Marriage Status in Niota
Out of a total of 316 households in Niota, 172 (54.4%) are family households, while 144 (45.6%) are nonfamily households. The most numerous type of family households are 2-person households, comprising 86, and the most common type of nonfamily households are 1-person households, comprising 109.
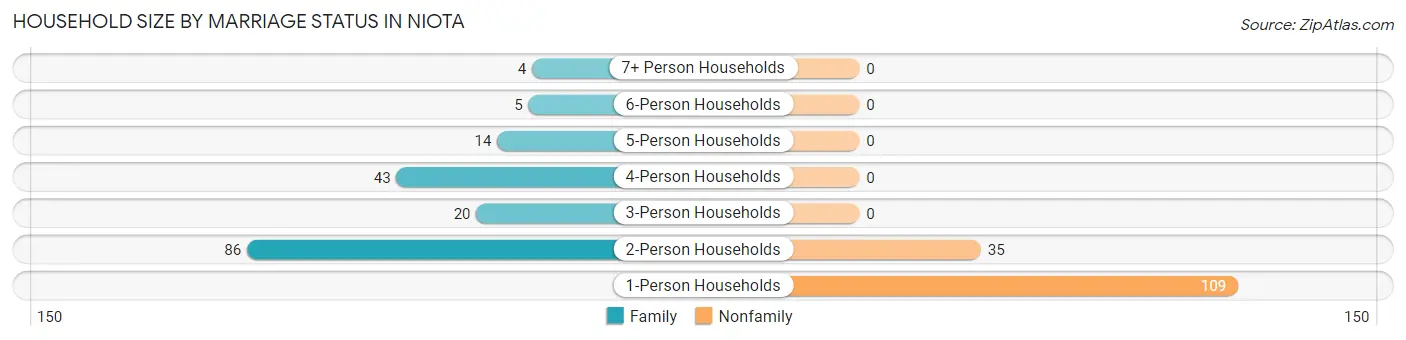
| Household Size | Family Households | Nonfamily Households |
| 1-Person Households | - | 109 (34.5%) |
| 2-Person Households | 86 (27.2%) | 35 (11.1%) |
| 3-Person Households | 20 (6.3%) | 0 (0.0%) |
| 4-Person Households | 43 (13.6%) | 0 (0.0%) |
| 5-Person Households | 14 (4.4%) | 0 (0.0%) |
| 6-Person Households | 5 (1.6%) | 0 (0.0%) |
| 7+ Person Households | 4 (1.3%) | 0 (0.0%) |
| Total | 172 (54.4%) | 144 (45.6%) |
Female Fertility in Niota
Fertility by Age in Niota
Average fertility rate in Niota is 34.0 births per 1,000 women. Women in the age bracket of 20 to 34 years have the highest fertility rate with 81.0 births per 1,000 women. Women in the age bracket of 20 to 34 years acount for 100.0% of all women with births.
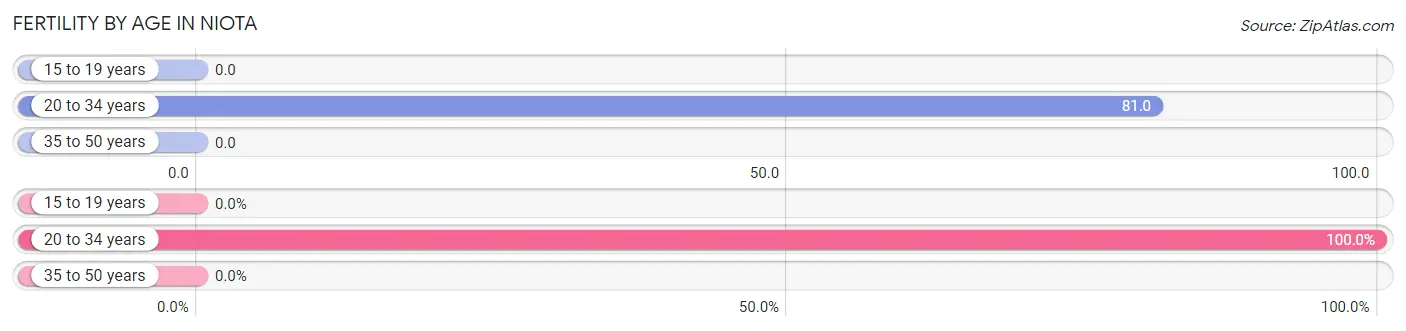
| Age Bracket | Women with Births | Births / 1,000 Women |
| 15 to 19 years | 0 (0.0%) | 0.0 |
| 20 to 34 years | 5 (100.0%) | 81.0 |
| 35 to 50 years | 0 (0.0%) | 0.0 |
| Total | 5 (100.0%) | 34.0 |
Fertility by Age by Marriage Status in Niota
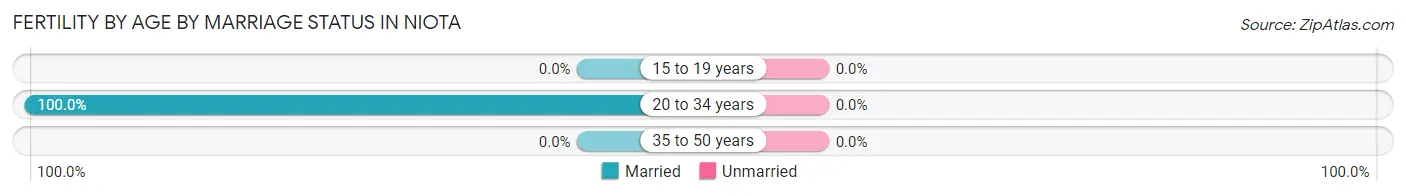
| Age Bracket | Married | Unmarried |
| 15 to 19 years | 0 (0.0%) | 0 (0.0%) |
| 20 to 34 years | 5 (100.0%) | 0 (0.0%) |
| 35 to 50 years | 0 (0.0%) | 0 (0.0%) |
| Total | 5 (100.0%) | 0 (0.0%) |
Fertility by Education in Niota
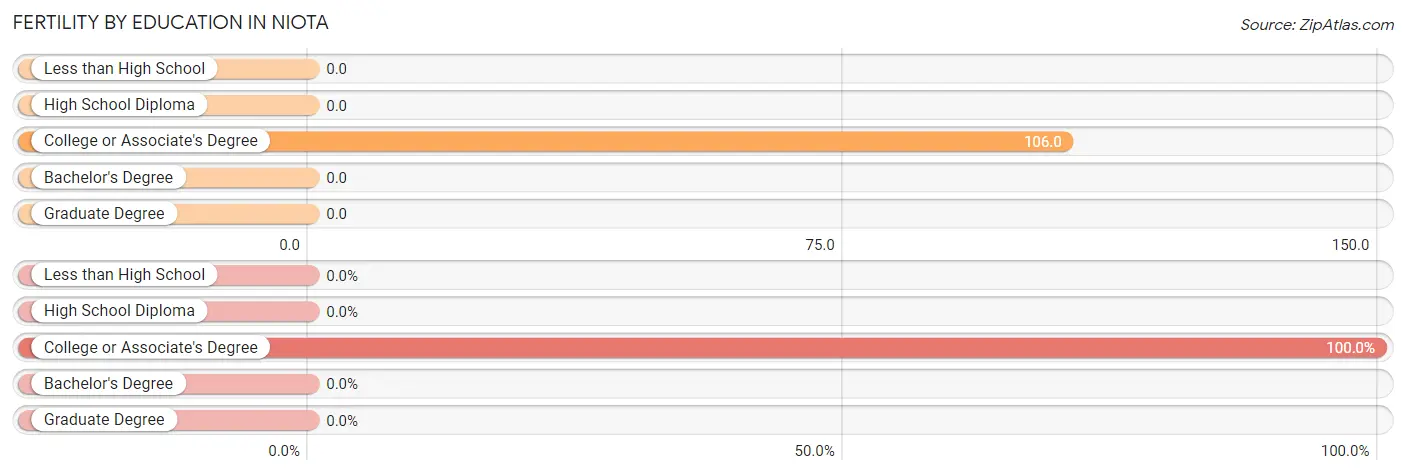
| Educational Attainment | Women with Births | Births / 1,000 Women |
| Less than High School | 0 (0.0%) | 0.0 |
| High School Diploma | 0 (0.0%) | 0.0 |
| College or Associate's Degree | 5 (100.0%) | 106.0 |
| Bachelor's Degree | 0 (0.0%) | 0.0 |
| Graduate Degree | 0 (0.0%) | 0.0 |
| Total | 5 (100.0%) | 34.0 |
Fertility by Education by Marriage Status in Niota
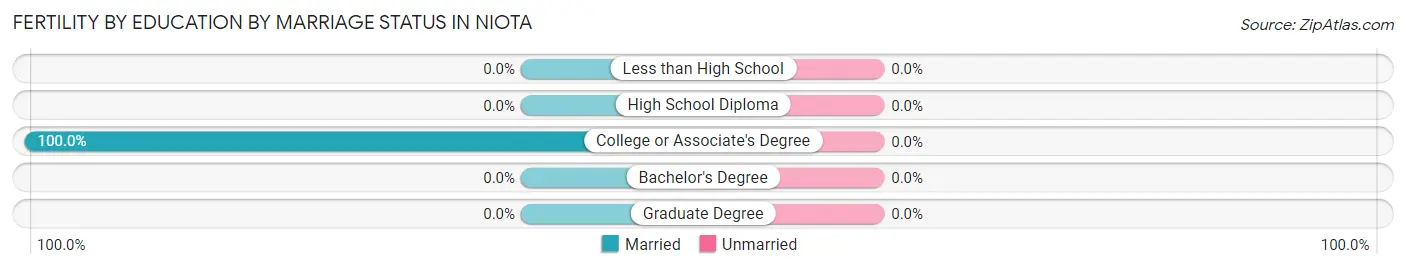
| Educational Attainment | Married | Unmarried |
| Less than High School | 0 (0.0%) | 0 (0.0%) |
| High School Diploma | 0 (0.0%) | 0 (0.0%) |
| College or Associate's Degree | 5 (100.0%) | 0 (0.0%) |
| Bachelor's Degree | 0 (0.0%) | 0 (0.0%) |
| Graduate Degree | 0 (0.0%) | 0 (0.0%) |
| Total | 5 (100.0%) | 0 (0.0%) |
Employment Characteristics in Niota
Employment by Class of Employer in Niota
Among the 348 employed individuals in Niota, private company employees (271 | 77.9%), self-employed (not incorporated) (32 | 9.2%), and not-for-profit organizations (20 | 5.8%) make up the most common classes of employment.
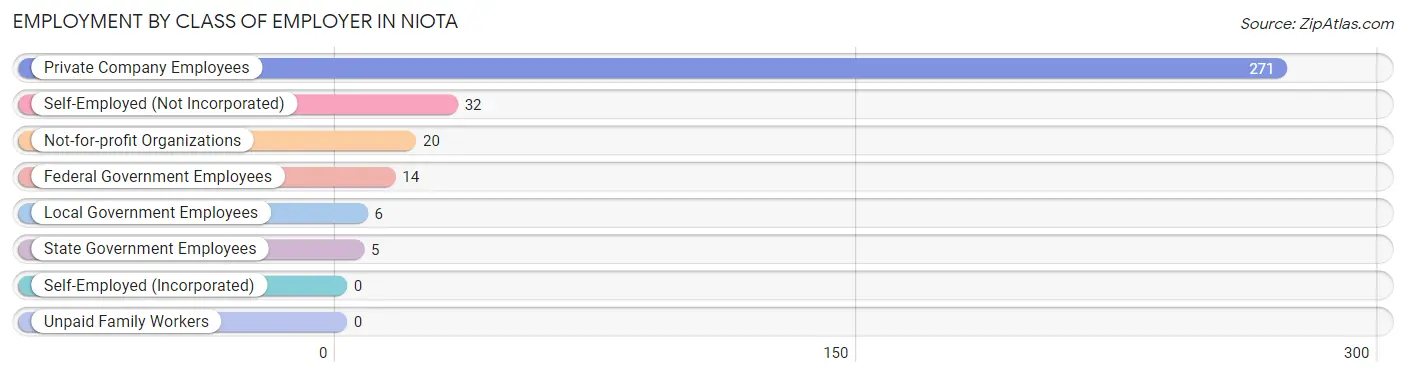
| Employer Class | # Employees | % Employees |
| Private Company Employees | 271 | 77.9% |
| Self-Employed (Incorporated) | 0 | 0.0% |
| Self-Employed (Not Incorporated) | 32 | 9.2% |
| Not-for-profit Organizations | 20 | 5.8% |
| Local Government Employees | 6 | 1.7% |
| State Government Employees | 5 | 1.4% |
| Federal Government Employees | 14 | 4.0% |
| Unpaid Family Workers | 0 | 0.0% |
| Total | 348 | 100.0% |
Employment Status by Age in Niota
According to the labor force statistics for Niota, out of the total population over 16 years of age (601), 65.1% or 391 individuals are in the labor force, with 9.2% or 36 of them unemployed. The age group with the highest labor force participation rate is 35 to 44 years, with 90.2% or 110 individuals in the labor force. Within the labor force, the 16 to 19 years age range has the highest percentage of unemployed individuals, with 38.7% or 12 of them being unemployed.
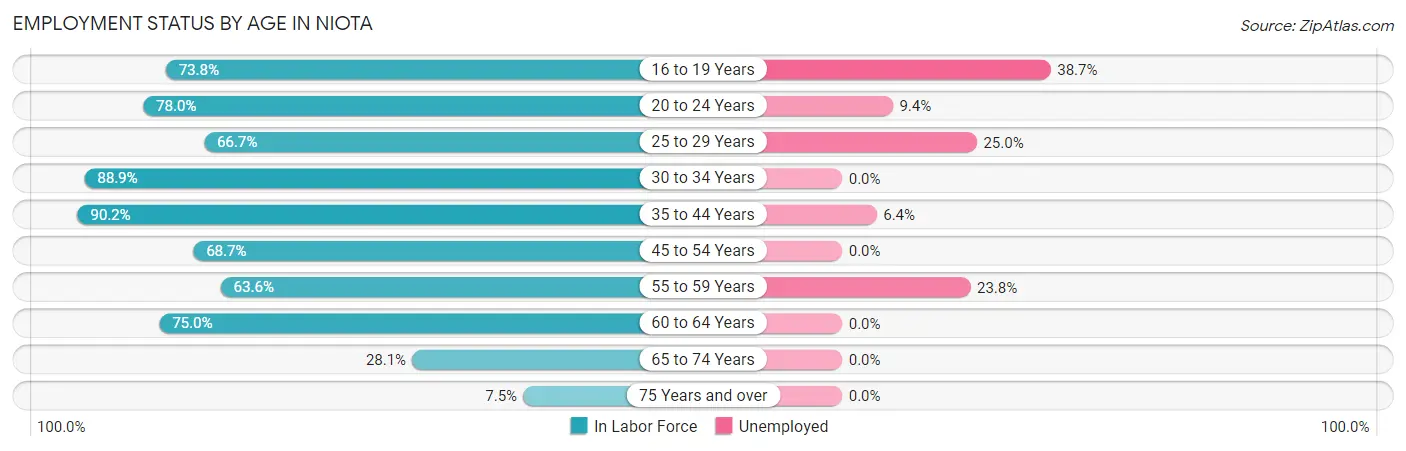
| Age Bracket | In Labor Force | Unemployed |
| 16 to 19 Years | 31 (73.8%) | 12 (38.7%) |
| 20 to 24 Years | 32 (78.0%) | 3 (9.4%) |
| 25 to 29 Years | 16 (66.7%) | 4 (25.0%) |
| 30 to 34 Years | 56 (88.9%) | 0 (0.0%) |
| 35 to 44 Years | 110 (90.2%) | 7 (6.4%) |
| 45 to 54 Years | 68 (68.7%) | 0 (0.0%) |
| 55 to 59 Years | 42 (63.6%) | 10 (23.8%) |
| 60 to 64 Years | 15 (75.0%) | 0 (0.0%) |
| 65 to 74 Years | 16 (28.1%) | 0 (0.0%) |
| 75 Years and over | 5 (7.5%) | 0 (0.0%) |
| Total | 391 (65.1%) | 36 (9.2%) |
Employment Status by Educational Attainment in Niota
According to labor force statistics for Niota, 77.9% of individuals (307) out of the total population between 25 and 64 years of age (394) are in the labor force, with 6.8% or 21 of them being unemployed. The group with the highest labor force participation rate are those with the educational attainment of bachelor's degree or higher, with 92.7% or 38 individuals in the labor force. Within the labor force, individuals with less than high school education have the highest percentage of unemployment, with 13.3% or 6 of them being unemployed.
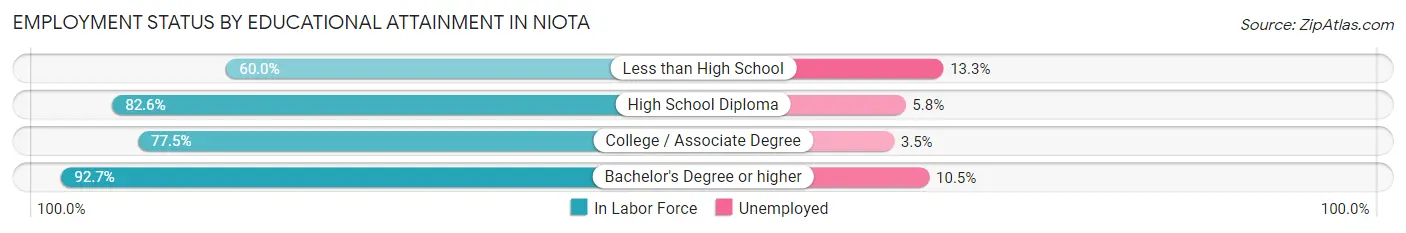
| Educational Attainment | In Labor Force | Unemployed |
| Less than High School | 45 (60.0%) | 10 (13.3%) |
| High School Diploma | 138 (82.6%) | 10 (5.8%) |
| College / Associate Degree | 86 (77.5%) | 4 (3.5%) |
| Bachelor's Degree or higher | 38 (92.7%) | 4 (10.5%) |
| Total | 307 (77.9%) | 27 (6.8%) |
Employment Occupations by Sex in Niota
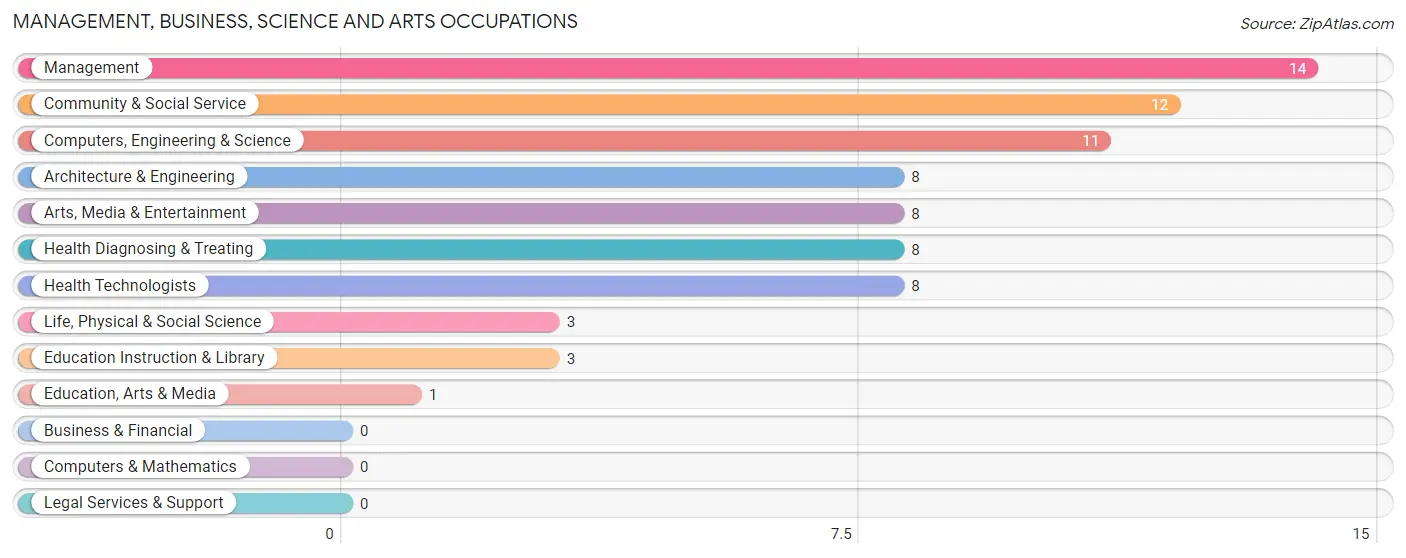
Management, Business, Science and Arts Occupations
The most common Management, Business, Science and Arts occupations in Niota are Management (14 | 3.9%), Community & Social Service (12 | 3.4%), Computers, Engineering & Science (11 | 3.1%), Architecture & Engineering (8 | 2.2%), and Arts, Media & Entertainment (8 | 2.2%).
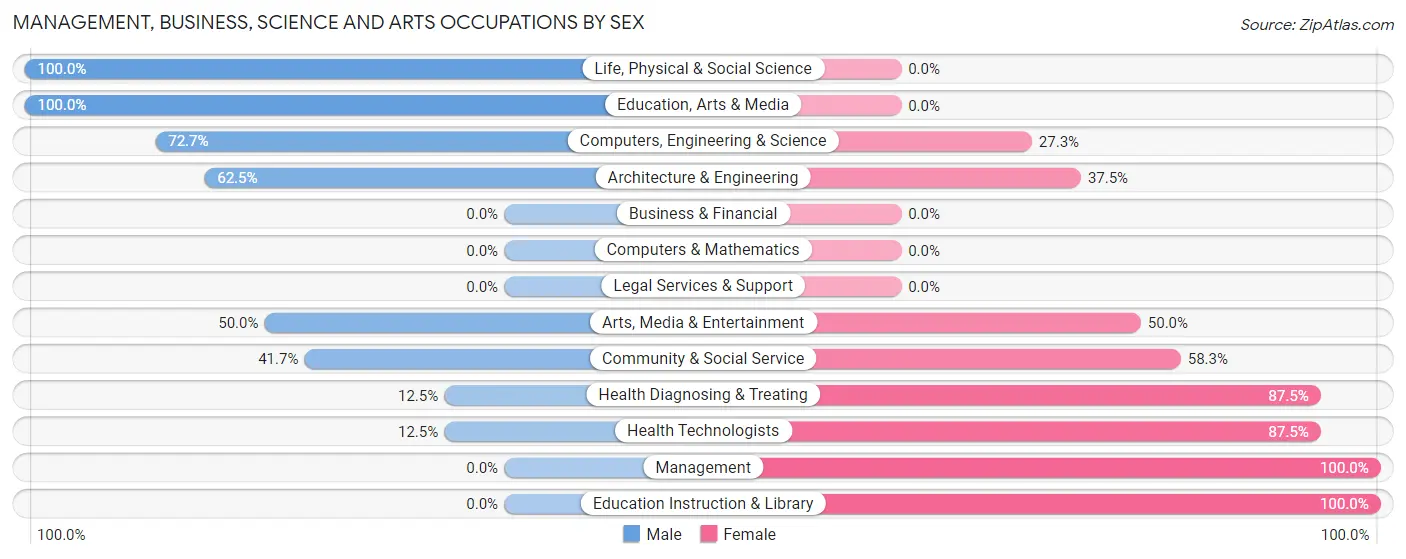
Management, Business, Science and Arts Occupations by Sex
Within the Management, Business, Science and Arts occupations in Niota, the most male-oriented occupations are Life, Physical & Social Science (100.0%), Education, Arts & Media (100.0%), and Computers, Engineering & Science (72.7%), while the most female-oriented occupations are Management (100.0%), Education Instruction & Library (100.0%), and Health Diagnosing & Treating (87.5%).
| Occupation | Male | Female |
| Management | 0 (0.0%) | 14 (100.0%) |
| Business & Financial | 0 (0.0%) | 0 (0.0%) |
| Computers, Engineering & Science | 8 (72.7%) | 3 (27.3%) |
| Computers & Mathematics | 0 (0.0%) | 0 (0.0%) |
| Architecture & Engineering | 5 (62.5%) | 3 (37.5%) |
| Life, Physical & Social Science | 3 (100.0%) | 0 (0.0%) |
| Community & Social Service | 5 (41.7%) | 7 (58.3%) |
| Education, Arts & Media | 1 (100.0%) | 0 (0.0%) |
| Legal Services & Support | 0 (0.0%) | 0 (0.0%) |
| Education Instruction & Library | 0 (0.0%) | 3 (100.0%) |
| Arts, Media & Entertainment | 4 (50.0%) | 4 (50.0%) |
| Health Diagnosing & Treating | 1 (12.5%) | 7 (87.5%) |
| Health Technologists | 1 (12.5%) | 7 (87.5%) |
| Total (Category) | 14 (31.1%) | 31 (68.9%) |
| Total (Overall) | 233 (65.6%) | 122 (34.4%) |
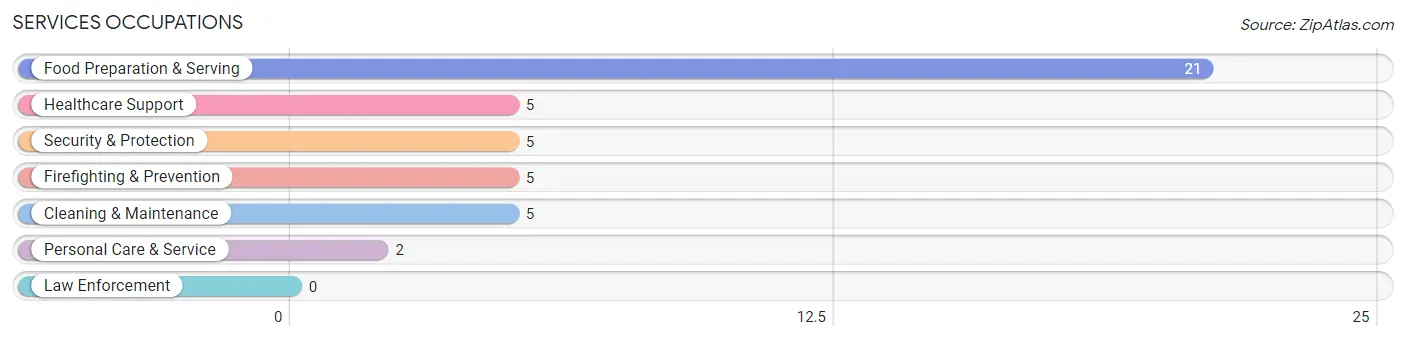
Services Occupations
The most common Services occupations in Niota are Food Preparation & Serving (21 | 5.9%), Healthcare Support (5 | 1.4%), Security & Protection (5 | 1.4%), Firefighting & Prevention (5 | 1.4%), and Cleaning & Maintenance (5 | 1.4%).
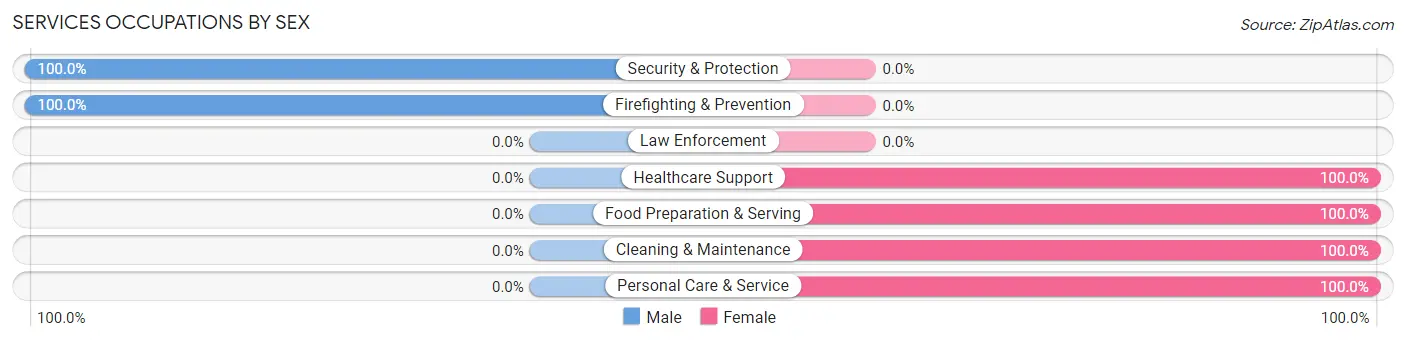
Services Occupations by Sex
Within the Services occupations in Niota, the most male-oriented occupations are Security & Protection (100.0%), and Firefighting & Prevention (100.0%), while the most female-oriented occupations are Healthcare Support (100.0%), Food Preparation & Serving (100.0%), and Cleaning & Maintenance (100.0%).
| Occupation | Male | Female |
| Healthcare Support | 0 (0.0%) | 5 (100.0%) |
| Security & Protection | 5 (100.0%) | 0 (0.0%) |
| Firefighting & Prevention | 5 (100.0%) | 0 (0.0%) |
| Law Enforcement | 0 (0.0%) | 0 (0.0%) |
| Food Preparation & Serving | 0 (0.0%) | 21 (100.0%) |
| Cleaning & Maintenance | 0 (0.0%) | 5 (100.0%) |
| Personal Care & Service | 0 (0.0%) | 2 (100.0%) |
| Total (Category) | 5 (13.2%) | 33 (86.8%) |
| Total (Overall) | 233 (65.6%) | 122 (34.4%) |
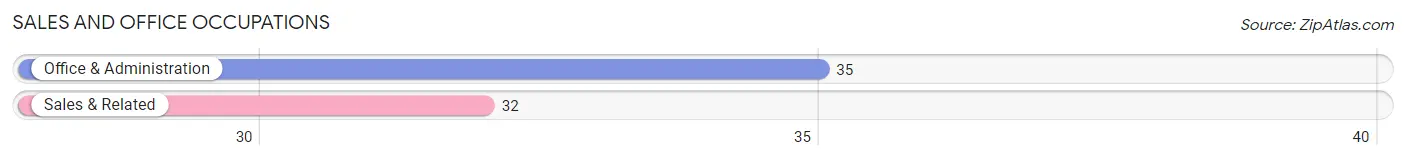
Sales and Office Occupations
The most common Sales and Office occupations in Niota are Office & Administration (35 | 9.9%), and Sales & Related (32 | 9.0%).
Sales and Office Occupations by Sex
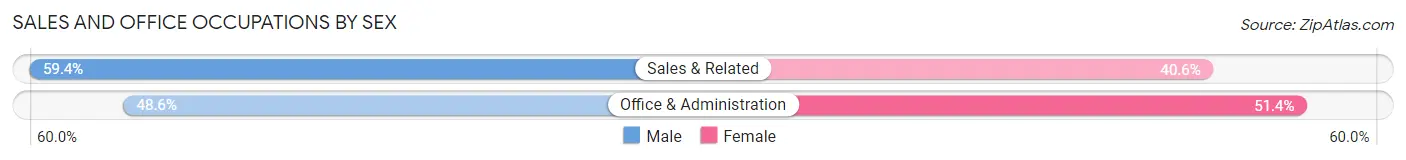
| Occupation | Male | Female |
| Sales & Related | 19 (59.4%) | 13 (40.6%) |
| Office & Administration | 17 (48.6%) | 18 (51.4%) |
| Total (Category) | 36 (53.7%) | 31 (46.3%) |
| Total (Overall) | 233 (65.6%) | 122 (34.4%) |
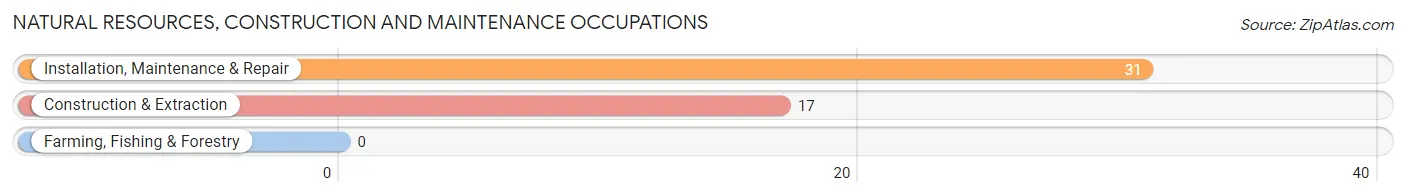
Natural Resources, Construction and Maintenance Occupations
The most common Natural Resources, Construction and Maintenance occupations in Niota are Installation, Maintenance & Repair (31 | 8.7%), and Construction & Extraction (17 | 4.8%).
Natural Resources, Construction and Maintenance Occupations by Sex
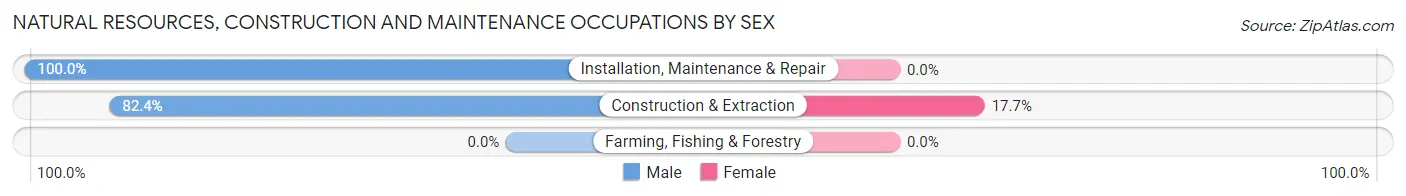
| Occupation | Male | Female |
| Farming, Fishing & Forestry | 0 (0.0%) | 0 (0.0%) |
| Construction & Extraction | 14 (82.4%) | 3 (17.6%) |
| Installation, Maintenance & Repair | 31 (100.0%) | 0 (0.0%) |
| Total (Category) | 45 (93.8%) | 3 (6.2%) |
| Total (Overall) | 233 (65.6%) | 122 (34.4%) |
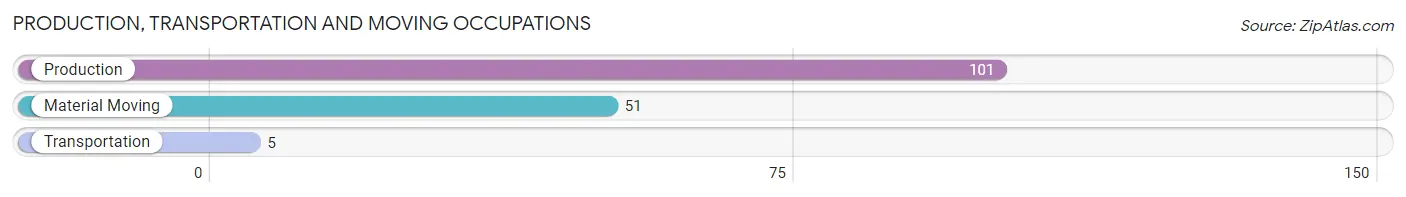
Production, Transportation and Moving Occupations
The most common Production, Transportation and Moving occupations in Niota are Production (101 | 28.4%), Material Moving (51 | 14.4%), and Transportation (5 | 1.4%).
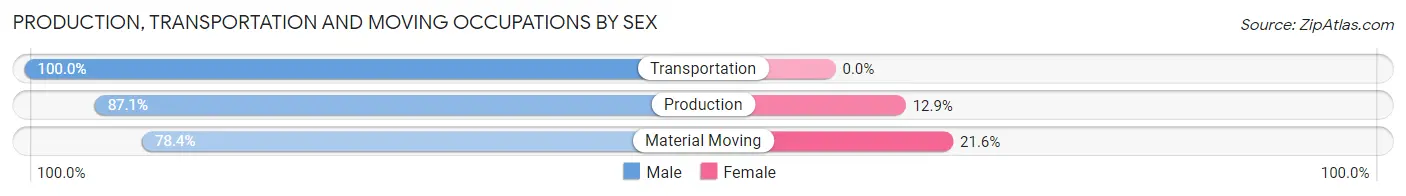
Production, Transportation and Moving Occupations by Sex
| Occupation | Male | Female |
| Production | 88 (87.1%) | 13 (12.9%) |
| Transportation | 5 (100.0%) | 0 (0.0%) |
| Material Moving | 40 (78.4%) | 11 (21.6%) |
| Total (Category) | 133 (84.7%) | 24 (15.3%) |
| Total (Overall) | 233 (65.6%) | 122 (34.4%) |
Employment Industries by Sex in Niota
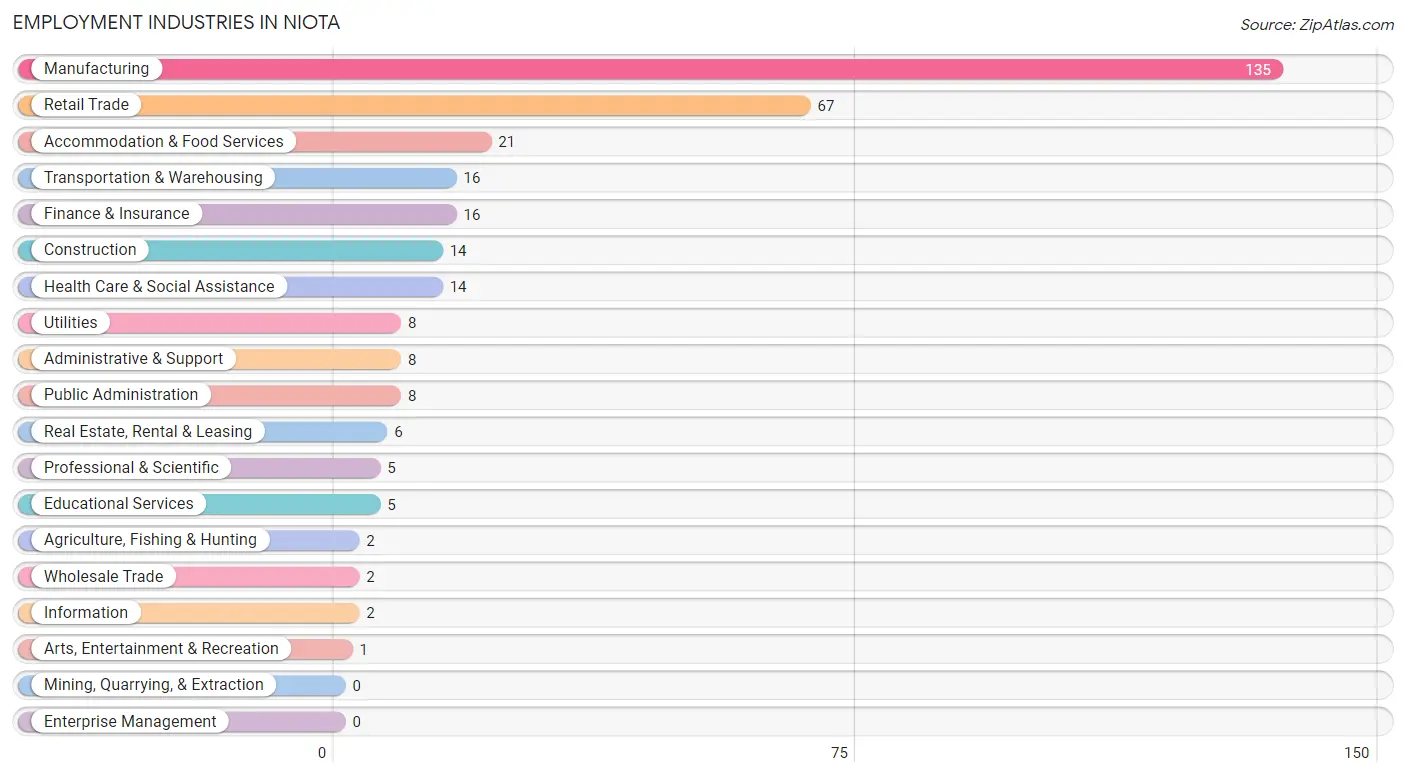
Employment Industries in Niota
The major employment industries in Niota include Manufacturing (135 | 38.0%), Retail Trade (67 | 18.9%), Accommodation & Food Services (21 | 5.9%), Transportation & Warehousing (16 | 4.5%), and Finance & Insurance (16 | 4.5%).
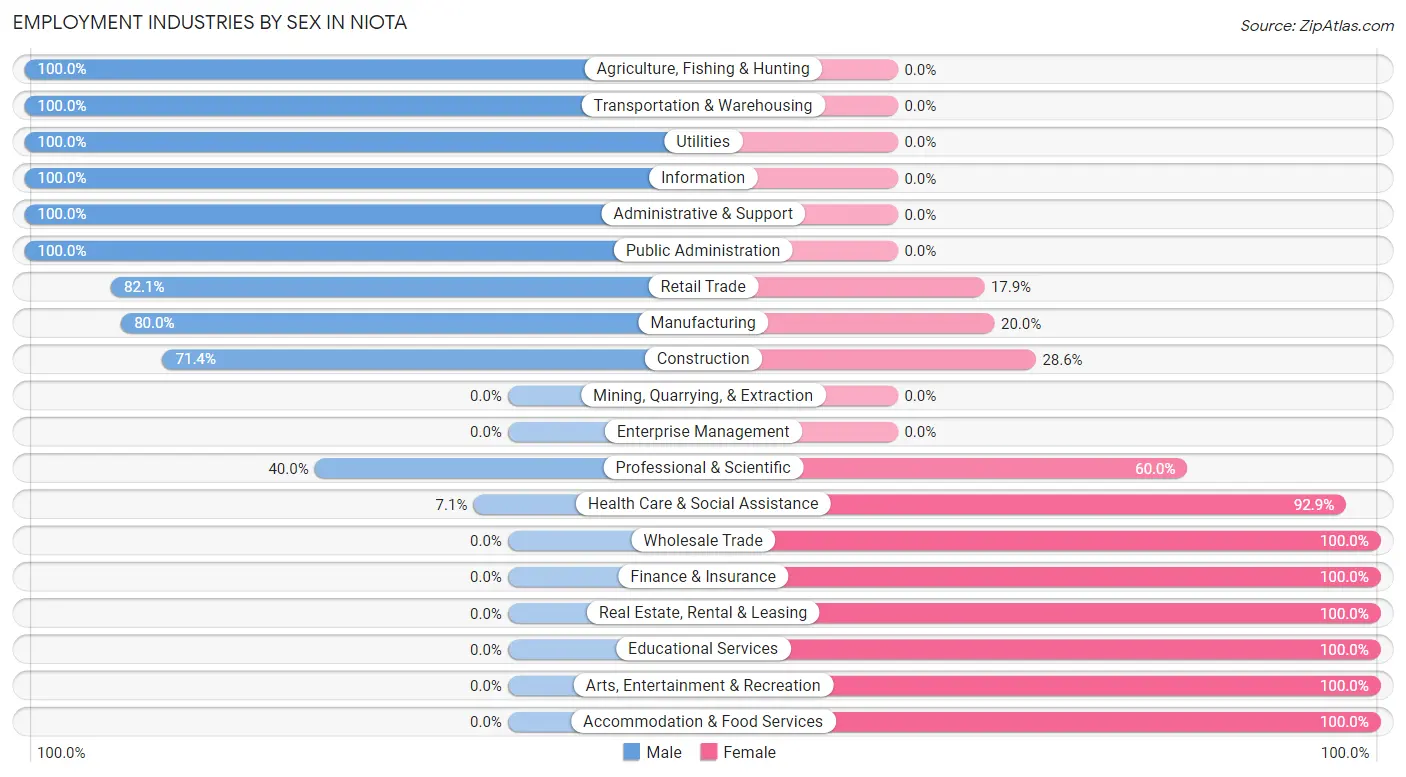
Employment Industries by Sex in Niota
The Niota industries that see more men than women are Agriculture, Fishing & Hunting (100.0%), Transportation & Warehousing (100.0%), and Utilities (100.0%), whereas the industries that tend to have a higher number of women are Wholesale Trade (100.0%), Finance & Insurance (100.0%), and Real Estate, Rental & Leasing (100.0%).
| Industry | Male | Female |
| Agriculture, Fishing & Hunting | 2 (100.0%) | 0 (0.0%) |
| Mining, Quarrying, & Extraction | 0 (0.0%) | 0 (0.0%) |
| Construction | 10 (71.4%) | 4 (28.6%) |
| Manufacturing | 108 (80.0%) | 27 (20.0%) |
| Wholesale Trade | 0 (0.0%) | 2 (100.0%) |
| Retail Trade | 55 (82.1%) | 12 (17.9%) |
| Transportation & Warehousing | 16 (100.0%) | 0 (0.0%) |
| Utilities | 8 (100.0%) | 0 (0.0%) |
| Information | 2 (100.0%) | 0 (0.0%) |
| Finance & Insurance | 0 (0.0%) | 16 (100.0%) |
| Real Estate, Rental & Leasing | 0 (0.0%) | 6 (100.0%) |
| Professional & Scientific | 2 (40.0%) | 3 (60.0%) |
| Enterprise Management | 0 (0.0%) | 0 (0.0%) |
| Administrative & Support | 8 (100.0%) | 0 (0.0%) |
| Educational Services | 0 (0.0%) | 5 (100.0%) |
| Health Care & Social Assistance | 1 (7.1%) | 13 (92.9%) |
| Arts, Entertainment & Recreation | 0 (0.0%) | 1 (100.0%) |
| Accommodation & Food Services | 0 (0.0%) | 21 (100.0%) |
| Public Administration | 8 (100.0%) | 0 (0.0%) |
| Total | 233 (65.6%) | 122 (34.4%) |
Education in Niota
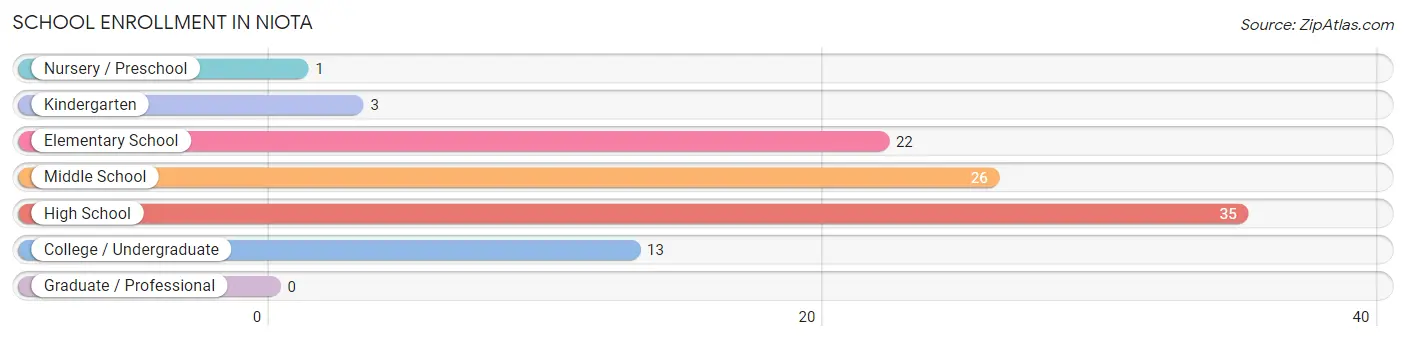
School Enrollment in Niota
The most common levels of schooling among the 100 students in Niota are high school (35 | 35.0%), middle school (26 | 26.0%), and elementary school (22 | 22.0%).
| School Level | # Students | % Students |
| Nursery / Preschool | 1 | 1.0% |
| Kindergarten | 3 | 3.0% |
| Elementary School | 22 | 22.0% |
| Middle School | 26 | 26.0% |
| High School | 35 | 35.0% |
| College / Undergraduate | 13 | 13.0% |
| Graduate / Professional | 0 | 0.0% |
| Total | 100 | 100.0% |
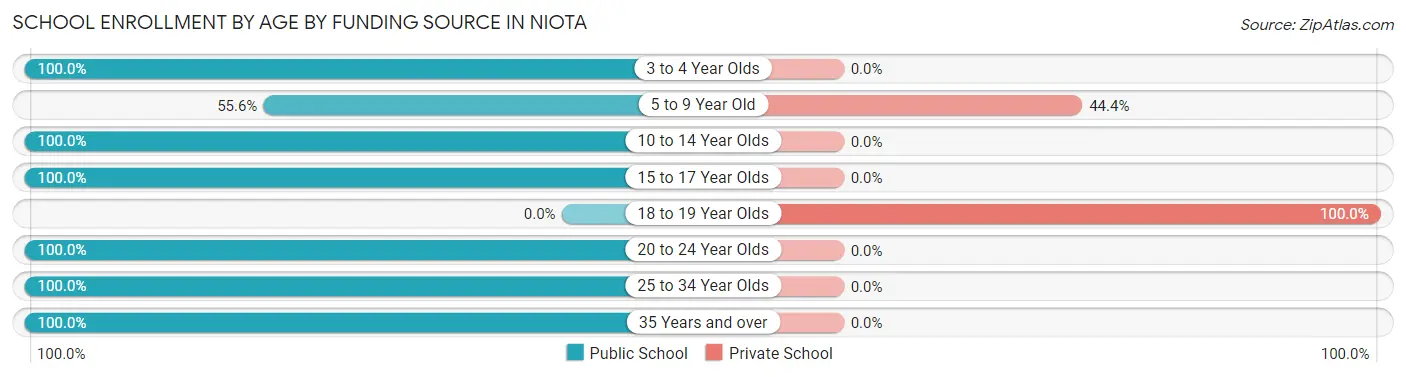
School Enrollment by Age by Funding Source in Niota
Out of a total of 100 students who are enrolled in schools in Niota, 13 (13.0%) attend a private institution, while the remaining 87 (87.0%) are enrolled in public schools. The age group of 18 to 19 year olds has the highest likelihood of being enrolled in private schools, with 5 (100.0% in the age bracket) enrolled. Conversely, the age group of 3 to 4 year olds has the lowest likelihood of being enrolled in a private school, with 1 (100.0% in the age bracket) attending a public institution.
| Age Bracket | Public School | Private School |
| 3 to 4 Year Olds | 1 (100.0%) | 0 (0.0%) |
| 5 to 9 Year Old | 10 (55.6%) | 8 (44.4%) |
| 10 to 14 Year Olds | 41 (100.0%) | 0 (0.0%) |
| 15 to 17 Year Olds | 24 (100.0%) | 0 (0.0%) |
| 18 to 19 Year Olds | 0 (0.0%) | 5 (100.0%) |
| 20 to 24 Year Olds | 7 (100.0%) | 0 (0.0%) |
| 25 to 34 Year Olds | 2 (100.0%) | 0 (0.0%) |
| 35 Years and over | 2 (100.0%) | 0 (0.0%) |
| Total | 87 (87.0%) | 13 (13.0%) |
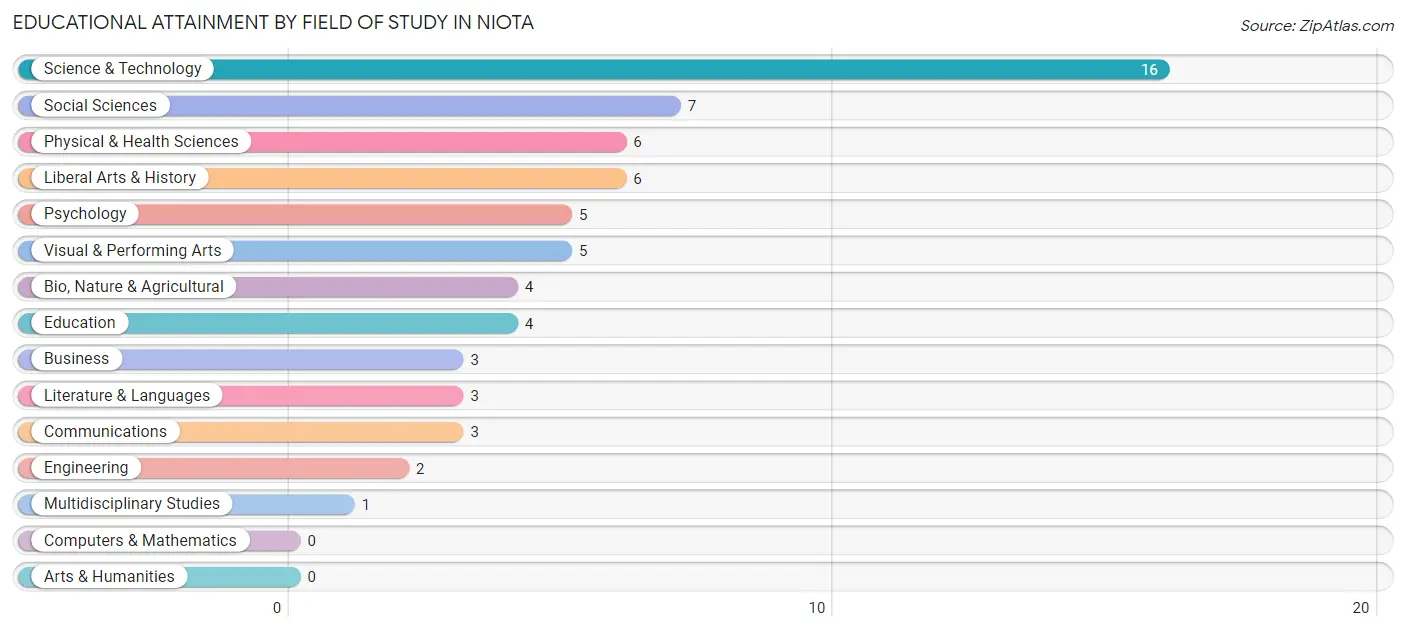
Educational Attainment by Field of Study in Niota
Science & technology (16 | 24.6%), social sciences (7 | 10.8%), physical & health sciences (6 | 9.2%), liberal arts & history (6 | 9.2%), and psychology (5 | 7.7%) are the most common fields of study among 65 individuals in Niota who have obtained a bachelor's degree or higher.
| Field of Study | # Graduates | % Graduates |
| Computers & Mathematics | 0 | 0.0% |
| Bio, Nature & Agricultural | 4 | 6.1% |
| Physical & Health Sciences | 6 | 9.2% |
| Psychology | 5 | 7.7% |
| Social Sciences | 7 | 10.8% |
| Engineering | 2 | 3.1% |
| Multidisciplinary Studies | 1 | 1.5% |
| Science & Technology | 16 | 24.6% |
| Business | 3 | 4.6% |
| Education | 4 | 6.1% |
| Literature & Languages | 3 | 4.6% |
| Liberal Arts & History | 6 | 9.2% |
| Visual & Performing Arts | 5 | 7.7% |
| Communications | 3 | 4.6% |
| Arts & Humanities | 0 | 0.0% |
| Total | 65 | 100.0% |
Transportation & Commute in Niota
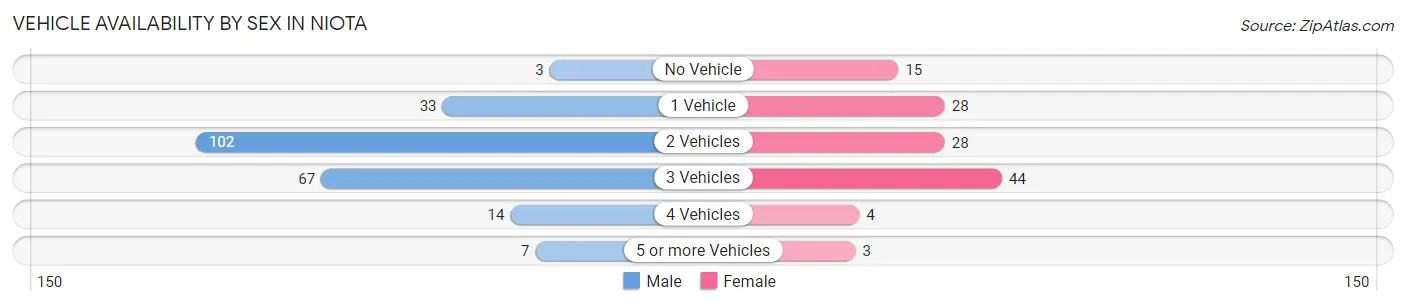
Vehicle Availability by Sex in Niota
The most prevalent vehicle ownership categories in Niota are males with 2 vehicles (102, accounting for 45.1%) and females with 2 vehicles (28, making up 83.6%).
| Vehicles Available | Male | Female |
| No Vehicle | 3 (1.3%) | 15 (12.3%) |
| 1 Vehicle | 33 (14.6%) | 28 (23.0%) |
| 2 Vehicles | 102 (45.1%) | 28 (23.0%) |
| 3 Vehicles | 67 (29.6%) | 44 (36.1%) |
| 4 Vehicles | 14 (6.2%) | 4 (3.3%) |
| 5 or more Vehicles | 7 (3.1%) | 3 (2.5%) |
| Total | 226 (100.0%) | 122 (100.0%) |
Commute Time in Niota
The most frequently occuring commute durations in Niota are 20 to 24 minutes (66 commuters, 19.4%), 10 to 14 minutes (65 commuters, 19.1%), and 15 to 19 minutes (57 commuters, 16.8%).
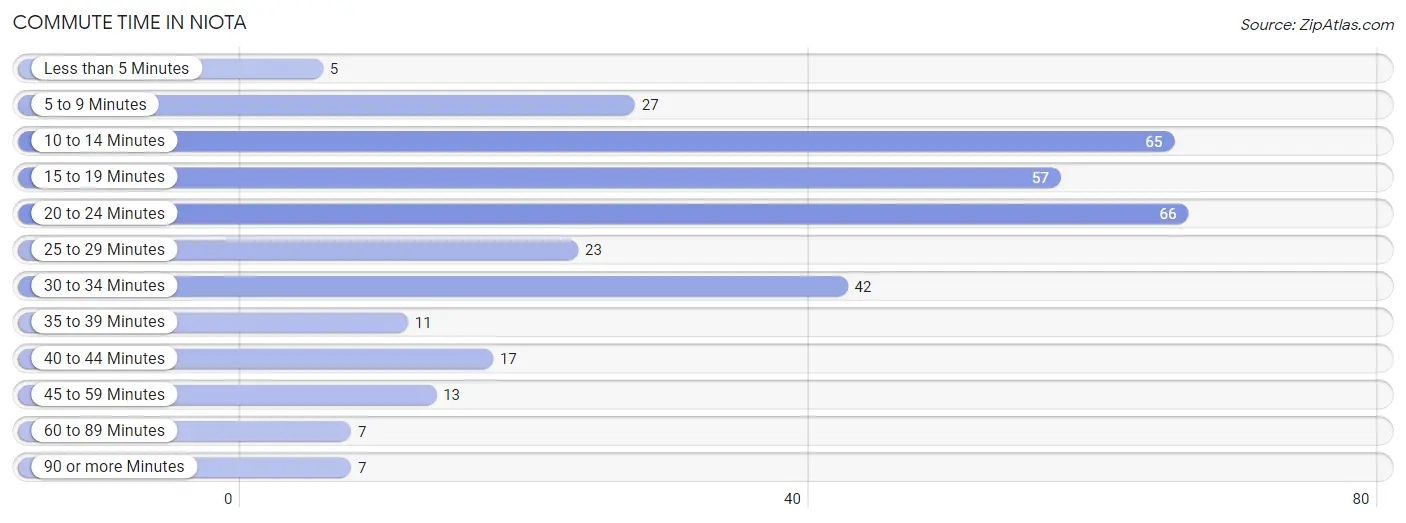
| Commute Time | # Commuters | % Commuters |
| Less than 5 Minutes | 5 | 1.5% |
| 5 to 9 Minutes | 27 | 7.9% |
| 10 to 14 Minutes | 65 | 19.1% |
| 15 to 19 Minutes | 57 | 16.8% |
| 20 to 24 Minutes | 66 | 19.4% |
| 25 to 29 Minutes | 23 | 6.8% |
| 30 to 34 Minutes | 42 | 12.3% |
| 35 to 39 Minutes | 11 | 3.2% |
| 40 to 44 Minutes | 17 | 5.0% |
| 45 to 59 Minutes | 13 | 3.8% |
| 60 to 89 Minutes | 7 | 2.1% |
| 90 or more Minutes | 7 | 2.1% |
Commute Time by Sex in Niota
The most common commute times in Niota are 10 to 14 minutes (52 commuters, 23.0%) for males and 20 to 24 minutes (18 commuters, 15.8%) for females.
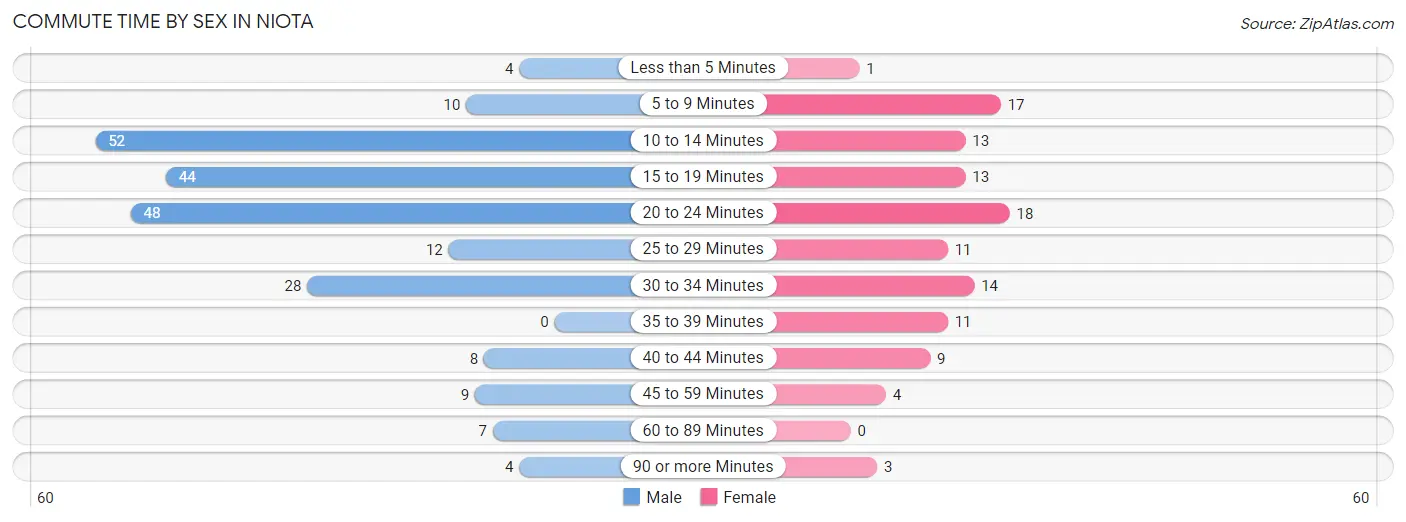
| Commute Time | Male | Female |
| Less than 5 Minutes | 4 (1.8%) | 1 (0.9%) |
| 5 to 9 Minutes | 10 (4.4%) | 17 (14.9%) |
| 10 to 14 Minutes | 52 (23.0%) | 13 (11.4%) |
| 15 to 19 Minutes | 44 (19.5%) | 13 (11.4%) |
| 20 to 24 Minutes | 48 (21.2%) | 18 (15.8%) |
| 25 to 29 Minutes | 12 (5.3%) | 11 (9.7%) |
| 30 to 34 Minutes | 28 (12.4%) | 14 (12.3%) |
| 35 to 39 Minutes | 0 (0.0%) | 11 (9.7%) |
| 40 to 44 Minutes | 8 (3.5%) | 9 (7.9%) |
| 45 to 59 Minutes | 9 (4.0%) | 4 (3.5%) |
| 60 to 89 Minutes | 7 (3.1%) | 0 (0.0%) |
| 90 or more Minutes | 4 (1.8%) | 3 (2.6%) |
Time of Departure to Work by Sex in Niota
The most frequent times of departure to work in Niota are 6:00 AM to 6:29 AM (43, 19.0%) for males and 7:00 AM to 7:29 AM (20, 17.5%) for females.
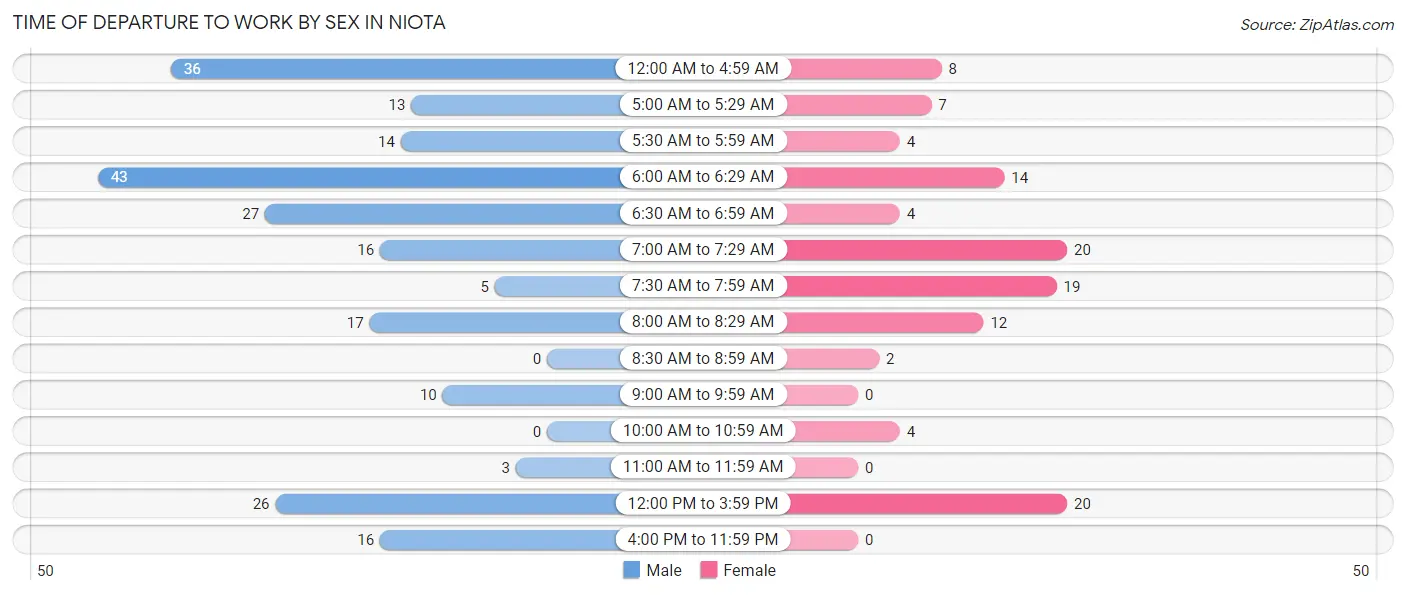
| Time of Departure | Male | Female |
| 12:00 AM to 4:59 AM | 36 (15.9%) | 8 (7.0%) |
| 5:00 AM to 5:29 AM | 13 (5.8%) | 7 (6.1%) |
| 5:30 AM to 5:59 AM | 14 (6.2%) | 4 (3.5%) |
| 6:00 AM to 6:29 AM | 43 (19.0%) | 14 (12.3%) |
| 6:30 AM to 6:59 AM | 27 (11.9%) | 4 (3.5%) |
| 7:00 AM to 7:29 AM | 16 (7.1%) | 20 (17.5%) |
| 7:30 AM to 7:59 AM | 5 (2.2%) | 19 (16.7%) |
| 8:00 AM to 8:29 AM | 17 (7.5%) | 12 (10.5%) |
| 8:30 AM to 8:59 AM | 0 (0.0%) | 2 (1.8%) |
| 9:00 AM to 9:59 AM | 10 (4.4%) | 0 (0.0%) |
| 10:00 AM to 10:59 AM | 0 (0.0%) | 4 (3.5%) |
| 11:00 AM to 11:59 AM | 3 (1.3%) | 0 (0.0%) |
| 12:00 PM to 3:59 PM | 26 (11.5%) | 20 (17.5%) |
| 4:00 PM to 11:59 PM | 16 (7.1%) | 0 (0.0%) |
| Total | 226 (100.0%) | 114 (100.0%) |
Housing Occupancy in Niota
Occupancy by Ownership in Niota
Of the total 316 dwellings in Niota, owner-occupied units account for 224 (70.9%), while renter-occupied units make up 92 (29.1%).
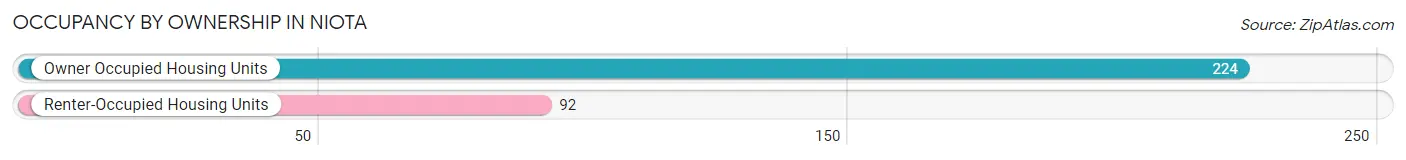
| Occupancy | # Housing Units | % Housing Units |
| Owner Occupied Housing Units | 224 | 70.9% |
| Renter-Occupied Housing Units | 92 | 29.1% |
| Total Occupied Housing Units | 316 | 100.0% |
Occupancy by Household Size in Niota
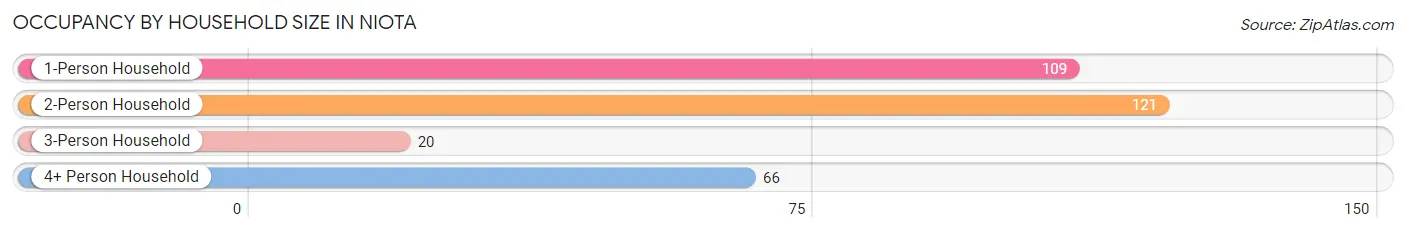
| Household Size | # Housing Units | % Housing Units |
| 1-Person Household | 109 | 34.5% |
| 2-Person Household | 121 | 38.3% |
| 3-Person Household | 20 | 6.3% |
| 4+ Person Household | 66 | 20.9% |
| Total Housing Units | 316 | 100.0% |
Occupancy by Ownership by Household Size in Niota
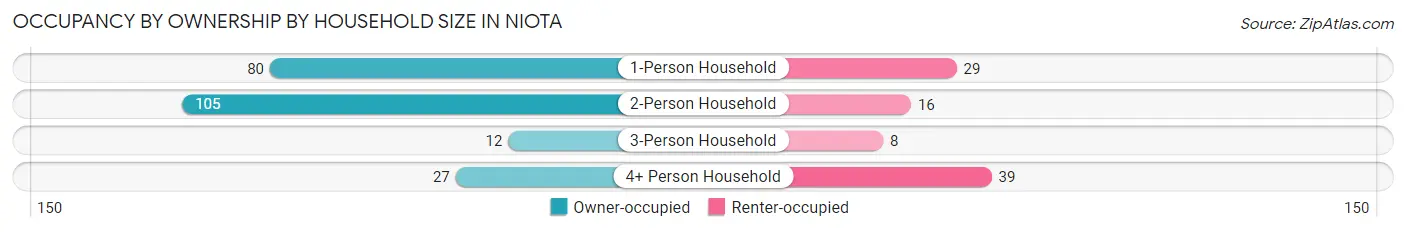
| Household Size | Owner-occupied | Renter-occupied |
| 1-Person Household | 80 (73.4%) | 29 (26.6%) |
| 2-Person Household | 105 (86.8%) | 16 (13.2%) |
| 3-Person Household | 12 (60.0%) | 8 (40.0%) |
| 4+ Person Household | 27 (40.9%) | 39 (59.1%) |
| Total Housing Units | 224 (70.9%) | 92 (29.1%) |
Occupancy by Educational Attainment in Niota
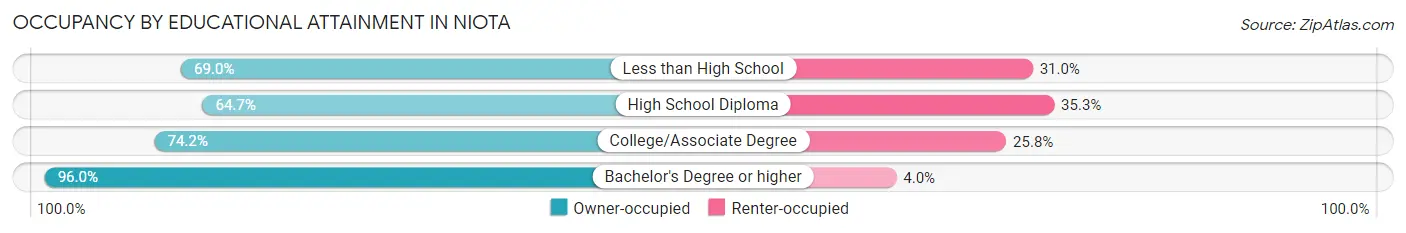
| Household Size | Owner-occupied | Renter-occupied |
| Less than High School | 40 (69.0%) | 18 (31.0%) |
| High School Diploma | 88 (64.7%) | 48 (35.3%) |
| College/Associate Degree | 72 (74.2%) | 25 (25.8%) |
| Bachelor's Degree or higher | 24 (96.0%) | 1 (4.0%) |
Occupancy by Age of Householder in Niota
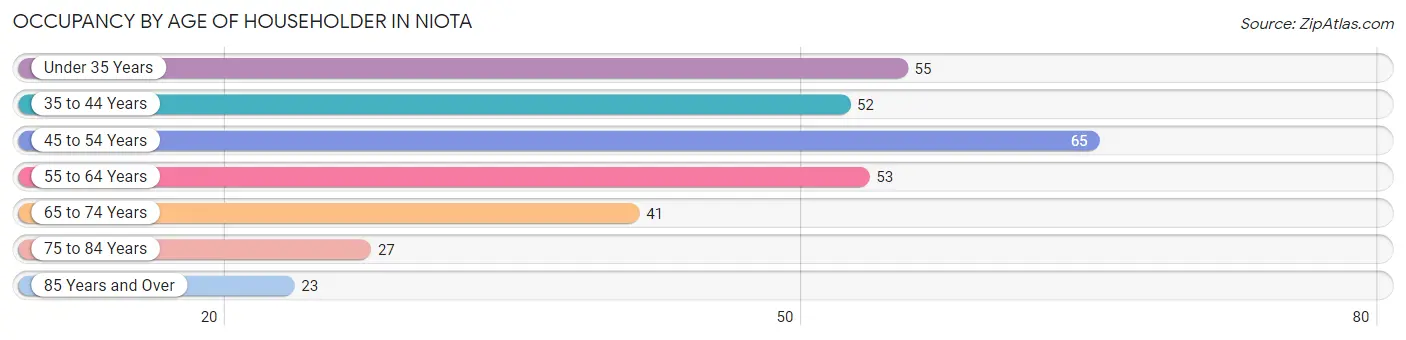
| Age Bracket | # Households | % Households |
| Under 35 Years | 55 | 17.4% |
| 35 to 44 Years | 52 | 16.5% |
| 45 to 54 Years | 65 | 20.6% |
| 55 to 64 Years | 53 | 16.8% |
| 65 to 74 Years | 41 | 13.0% |
| 75 to 84 Years | 27 | 8.5% |
| 85 Years and Over | 23 | 7.3% |
| Total | 316 | 100.0% |
Housing Finances in Niota
Median Income by Occupancy in Niota
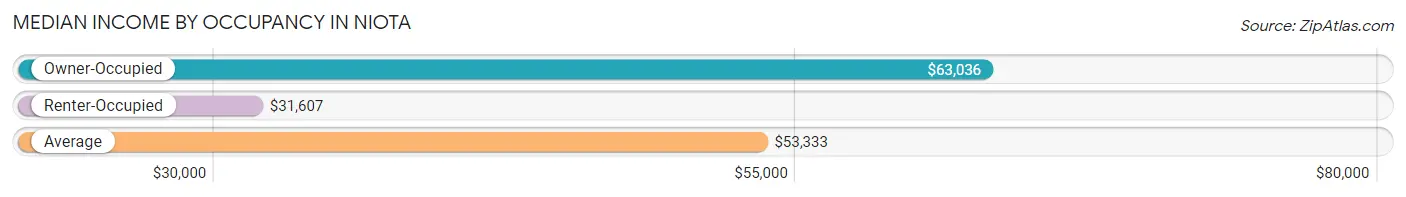
| Occupancy Type | # Households | Median Income |
| Owner-Occupied | 224 (70.9%) | $63,036 |
| Renter-Occupied | 92 (29.1%) | $31,607 |
| Average | 316 (100.0%) | $53,333 |
Occupancy by Householder Income Bracket in Niota
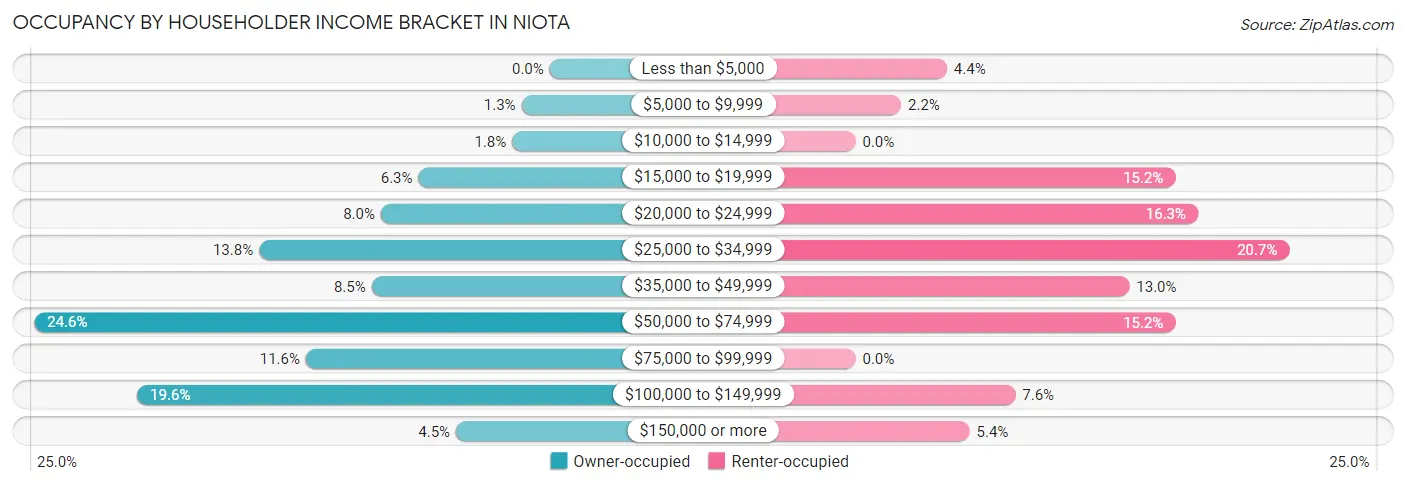
| Income Bracket | Owner-occupied | Renter-occupied |
| Less than $5,000 | 0 (0.0%) | 4 (4.3%) |
| $5,000 to $9,999 | 3 (1.3%) | 2 (2.2%) |
| $10,000 to $14,999 | 4 (1.8%) | 0 (0.0%) |
| $15,000 to $19,999 | 14 (6.2%) | 14 (15.2%) |
| $20,000 to $24,999 | 18 (8.0%) | 15 (16.3%) |
| $25,000 to $34,999 | 31 (13.8%) | 19 (20.6%) |
| $35,000 to $49,999 | 19 (8.5%) | 12 (13.0%) |
| $50,000 to $74,999 | 55 (24.5%) | 14 (15.2%) |
| $75,000 to $99,999 | 26 (11.6%) | 0 (0.0%) |
| $100,000 to $149,999 | 44 (19.6%) | 7 (7.6%) |
| $150,000 or more | 10 (4.5%) | 5 (5.4%) |
| Total | 224 (100.0%) | 92 (100.0%) |
Monthly Housing Cost Tiers in Niota
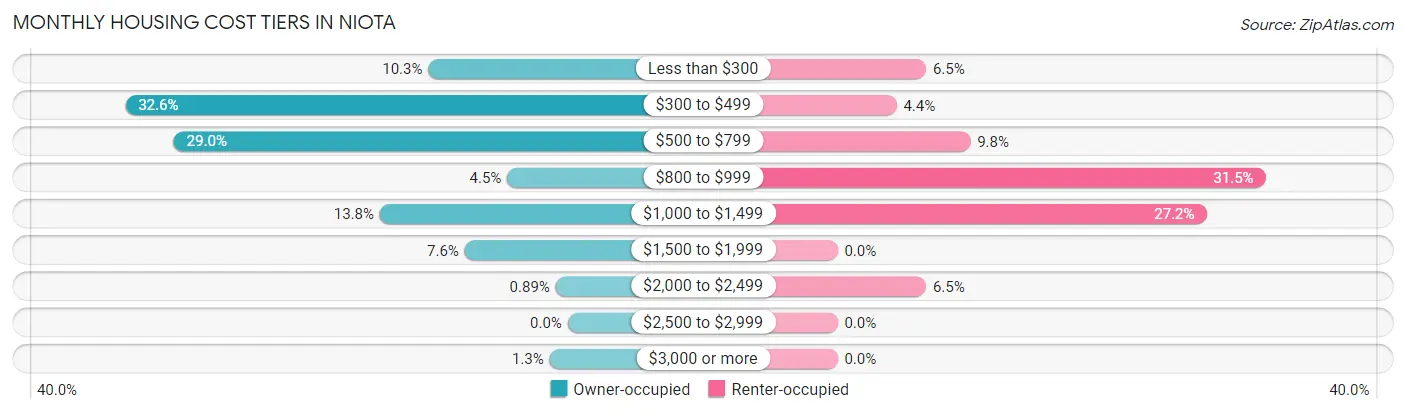
| Monthly Cost | Owner-occupied | Renter-occupied |
| Less than $300 | 23 (10.3%) | 6 (6.5%) |
| $300 to $499 | 73 (32.6%) | 4 (4.3%) |
| $500 to $799 | 65 (29.0%) | 9 (9.8%) |
| $800 to $999 | 10 (4.5%) | 29 (31.5%) |
| $1,000 to $1,499 | 31 (13.8%) | 25 (27.2%) |
| $1,500 to $1,999 | 17 (7.6%) | 0 (0.0%) |
| $2,000 to $2,499 | 2 (0.9%) | 6 (6.5%) |
| $2,500 to $2,999 | 0 (0.0%) | 0 (0.0%) |
| $3,000 or more | 3 (1.3%) | 0 (0.0%) |
| Total | 224 (100.0%) | 92 (100.0%) |
Physical Housing Characteristics in Niota
Housing Structures in Niota
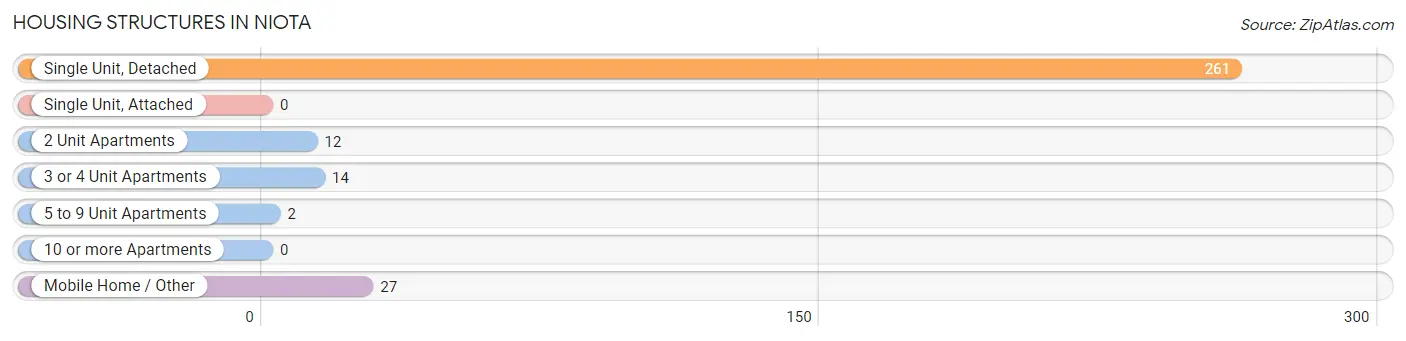
| Structure Type | # Housing Units | % Housing Units |
| Single Unit, Detached | 261 | 82.6% |
| Single Unit, Attached | 0 | 0.0% |
| 2 Unit Apartments | 12 | 3.8% |
| 3 or 4 Unit Apartments | 14 | 4.4% |
| 5 to 9 Unit Apartments | 2 | 0.6% |
| 10 or more Apartments | 0 | 0.0% |
| Mobile Home / Other | 27 | 8.5% |
| Total | 316 | 100.0% |
Housing Structures by Occupancy in Niota
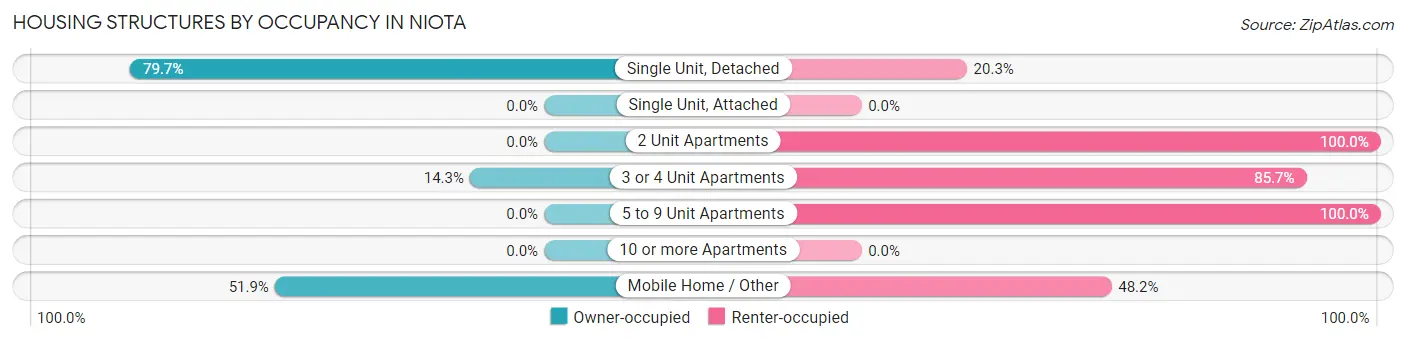
| Structure Type | Owner-occupied | Renter-occupied |
| Single Unit, Detached | 208 (79.7%) | 53 (20.3%) |
| Single Unit, Attached | 0 (0.0%) | 0 (0.0%) |
| 2 Unit Apartments | 0 (0.0%) | 12 (100.0%) |
| 3 or 4 Unit Apartments | 2 (14.3%) | 12 (85.7%) |
| 5 to 9 Unit Apartments | 0 (0.0%) | 2 (100.0%) |
| 10 or more Apartments | 0 (0.0%) | 0 (0.0%) |
| Mobile Home / Other | 14 (51.8%) | 13 (48.1%) |
| Total | 224 (70.9%) | 92 (29.1%) |
Housing Structures by Number of Rooms in Niota
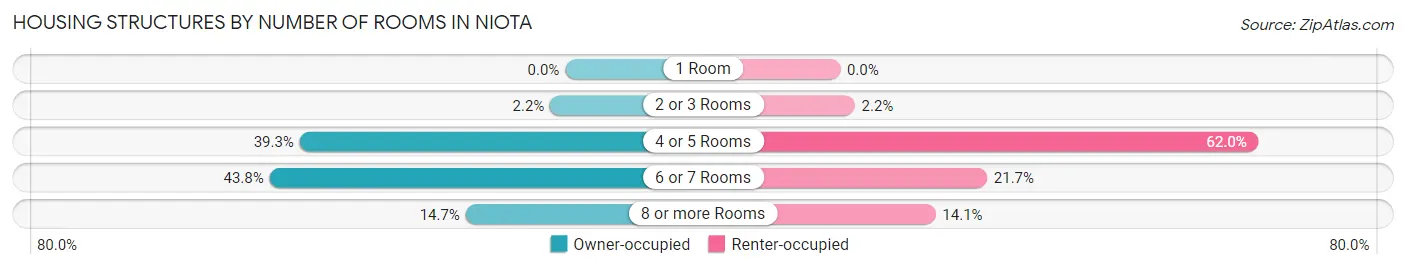
| Number of Rooms | Owner-occupied | Renter-occupied |
| 1 Room | 0 (0.0%) | 0 (0.0%) |
| 2 or 3 Rooms | 5 (2.2%) | 2 (2.2%) |
| 4 or 5 Rooms | 88 (39.3%) | 57 (62.0%) |
| 6 or 7 Rooms | 98 (43.8%) | 20 (21.7%) |
| 8 or more Rooms | 33 (14.7%) | 13 (14.1%) |
| Total | 224 (100.0%) | 92 (100.0%) |
Housing Structure by Heating Type in Niota
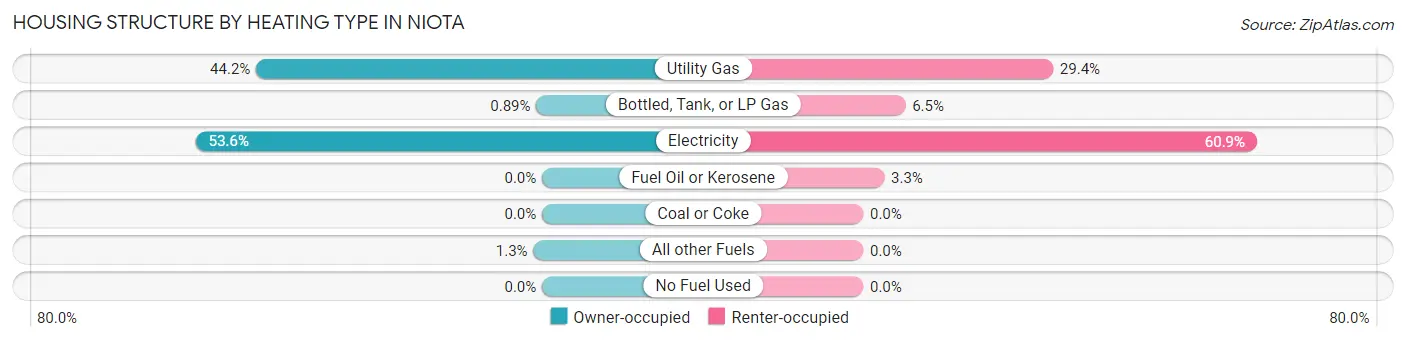
| Heating Type | Owner-occupied | Renter-occupied |
| Utility Gas | 99 (44.2%) | 27 (29.3%) |
| Bottled, Tank, or LP Gas | 2 (0.9%) | 6 (6.5%) |
| Electricity | 120 (53.6%) | 56 (60.9%) |
| Fuel Oil or Kerosene | 0 (0.0%) | 3 (3.3%) |
| Coal or Coke | 0 (0.0%) | 0 (0.0%) |
| All other Fuels | 3 (1.3%) | 0 (0.0%) |
| No Fuel Used | 0 (0.0%) | 0 (0.0%) |
| Total | 224 (100.0%) | 92 (100.0%) |
Household Vehicle Usage in Niota
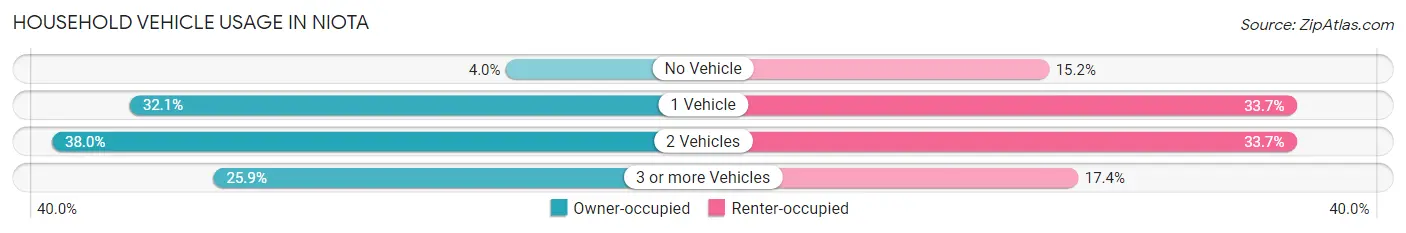
| Vehicles per Household | Owner-occupied | Renter-occupied |
| No Vehicle | 9 (4.0%) | 14 (15.2%) |
| 1 Vehicle | 72 (32.1%) | 31 (33.7%) |
| 2 Vehicles | 85 (38.0%) | 31 (33.7%) |
| 3 or more Vehicles | 58 (25.9%) | 16 (17.4%) |
| Total | 224 (100.0%) | 92 (100.0%) |
Real Estate & Mortgages in Niota
Real Estate and Mortgage Overview in Niota
| Characteristic | Without Mortgage | With Mortgage |
| Housing Units | 100 | 124 |
| Median Property Value | $94,800 | $96,700 |
| Median Household Income | - | - |
| Monthly Housing Costs | $336 | $3 |
| Real Estate Taxes | $589 | $7 |
Property Value by Mortgage Status in Niota
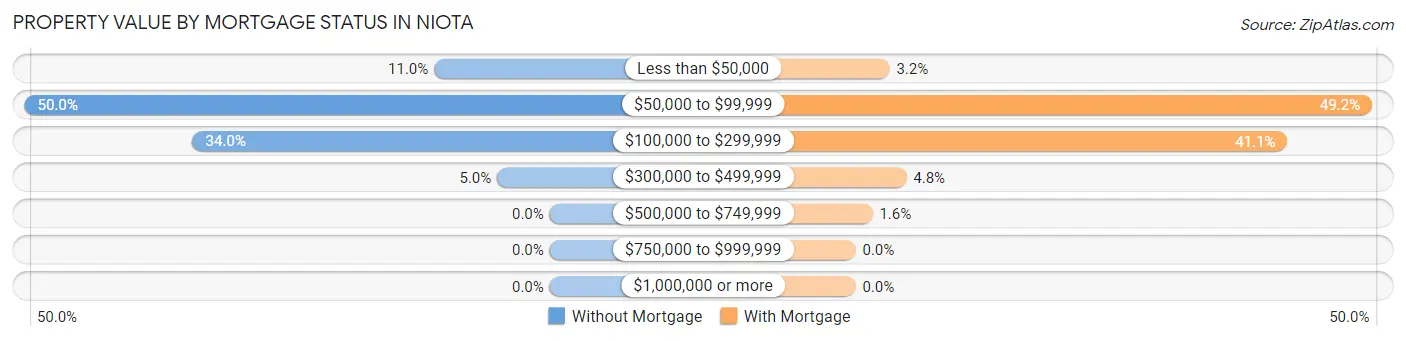
| Property Value | Without Mortgage | With Mortgage |
| Less than $50,000 | 11 (11.0%) | 4 (3.2%) |
| $50,000 to $99,999 | 50 (50.0%) | 61 (49.2%) |
| $100,000 to $299,999 | 34 (34.0%) | 51 (41.1%) |
| $300,000 to $499,999 | 5 (5.0%) | 6 (4.8%) |
| $500,000 to $749,999 | 0 (0.0%) | 2 (1.6%) |
| $750,000 to $999,999 | 0 (0.0%) | 0 (0.0%) |
| $1,000,000 or more | 0 (0.0%) | 0 (0.0%) |
| Total | 100 (100.0%) | 124 (100.0%) |
Household Income by Mortgage Status in Niota
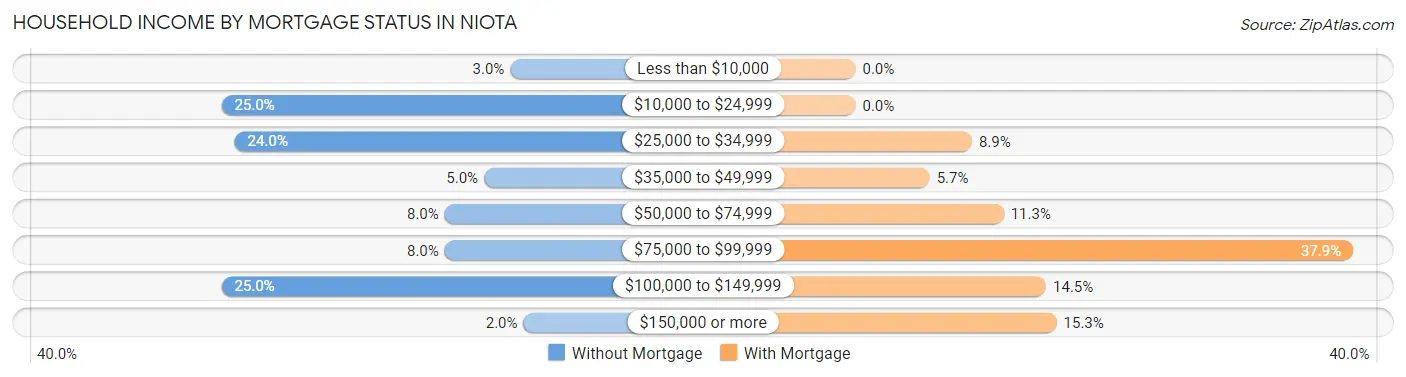
| Household Income | Without Mortgage | With Mortgage |
| Less than $10,000 | 3 (3.0%) | 0 (0.0%) |
| $10,000 to $24,999 | 25 (25.0%) | 0 (0.0%) |
| $25,000 to $34,999 | 24 (24.0%) | 11 (8.9%) |
| $35,000 to $49,999 | 5 (5.0%) | 7 (5.7%) |
| $50,000 to $74,999 | 8 (8.0%) | 14 (11.3%) |
| $75,000 to $99,999 | 8 (8.0%) | 47 (37.9%) |
| $100,000 to $149,999 | 25 (25.0%) | 18 (14.5%) |
| $150,000 or more | 2 (2.0%) | 19 (15.3%) |
| Total | 100 (100.0%) | 124 (100.0%) |
Property Value to Household Income Ratio in Niota
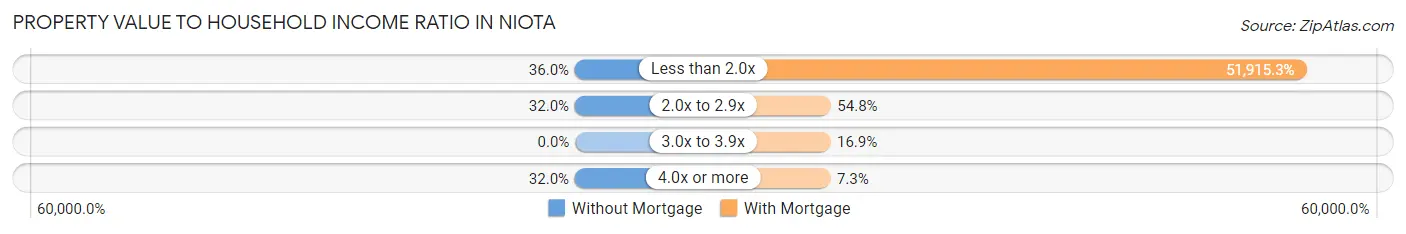
| Value-to-Income Ratio | Without Mortgage | With Mortgage |
| Less than 2.0x | 36 (36.0%) | 64,375 (51,915.3%) |
| 2.0x to 2.9x | 32 (32.0%) | 68 (54.8%) |
| 3.0x to 3.9x | 0 (0.0%) | 21 (16.9%) |
| 4.0x or more | 32 (32.0%) | 9 (7.3%) |
| Total | 100 (100.0%) | 124 (100.0%) |
Real Estate Taxes by Mortgage Status in Niota
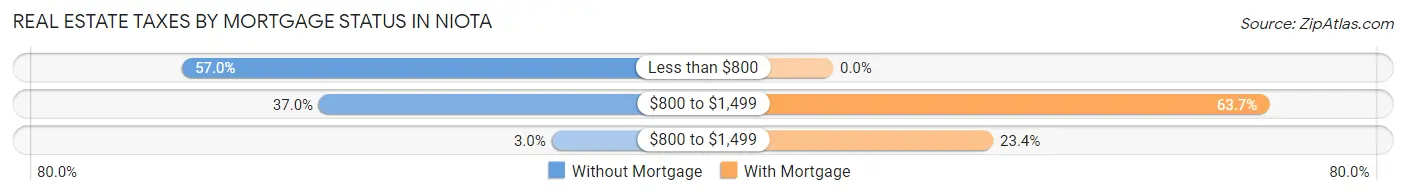
| Property Taxes | Without Mortgage | With Mortgage |
| Less than $800 | 57 (57.0%) | 0 (0.0%) |
| $800 to $1,499 | 37 (37.0%) | 79 (63.7%) |
| $800 to $1,499 | 3 (3.0%) | 29 (23.4%) |
| Total | 100 (100.0%) | 124 (100.0%) |
Health & Disability in Niota
Health Insurance Coverage by Age in Niota
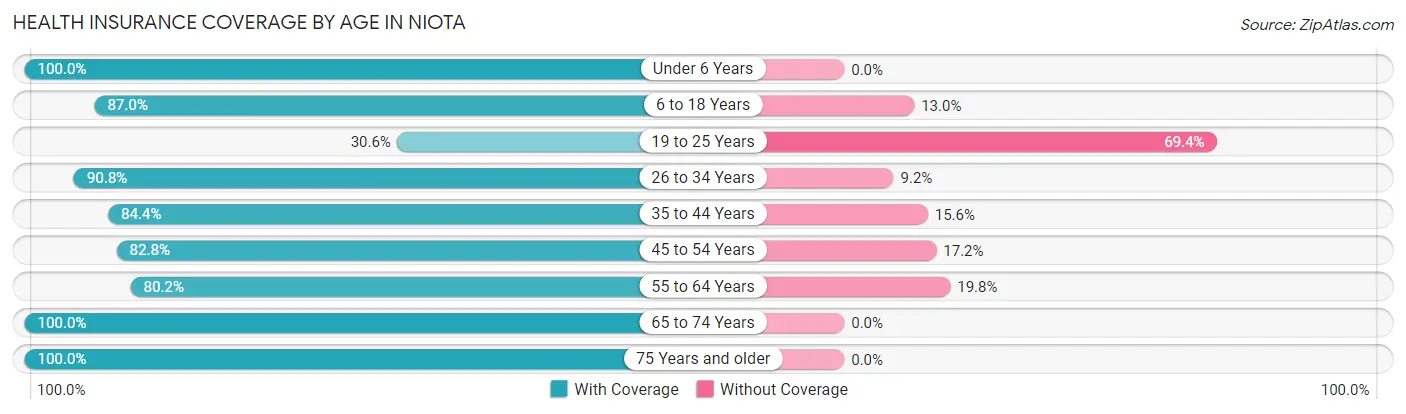
| Age Bracket | With Coverage | Without Coverage |
| Under 6 Years | 46 (100.0%) | 0 (0.0%) |
| 6 to 18 Years | 80 (87.0%) | 12 (13.0%) |
| 19 to 25 Years | 15 (30.6%) | 34 (69.4%) |
| 26 to 34 Years | 79 (90.8%) | 8 (9.2%) |
| 35 to 44 Years | 103 (84.4%) | 19 (15.6%) |
| 45 to 54 Years | 82 (82.8%) | 17 (17.2%) |
| 55 to 64 Years | 69 (80.2%) | 17 (19.8%) |
| 65 to 74 Years | 57 (100.0%) | 0 (0.0%) |
| 75 Years and older | 67 (100.0%) | 0 (0.0%) |
| Total | 598 (84.8%) | 107 (15.2%) |
Health Insurance Coverage by Citizenship Status in Niota
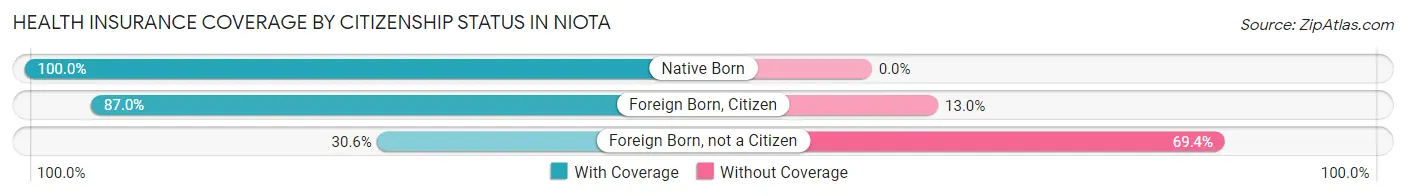
| Citizenship Status | With Coverage | Without Coverage |
| Native Born | 46 (100.0%) | 0 (0.0%) |
| Foreign Born, Citizen | 80 (87.0%) | 12 (13.0%) |
| Foreign Born, not a Citizen | 15 (30.6%) | 34 (69.4%) |
Health Insurance Coverage by Household Income in Niota
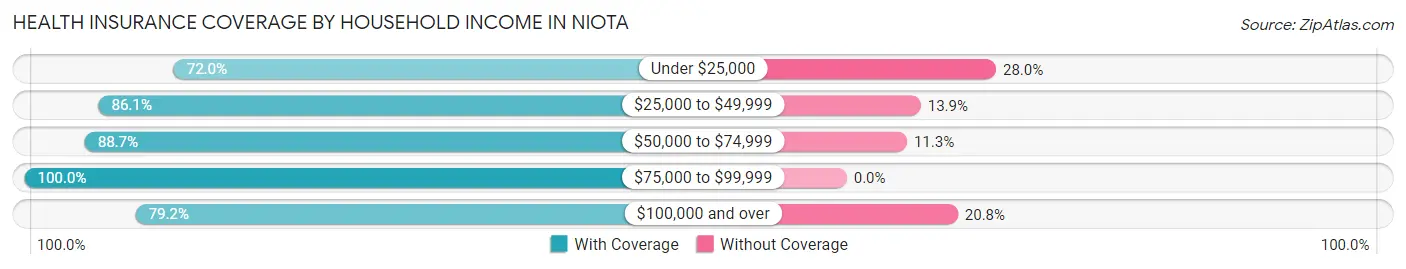
| Household Income | With Coverage | Without Coverage |
| Under $25,000 | 67 (72.0%) | 26 (28.0%) |
| $25,000 to $49,999 | 143 (86.1%) | 23 (13.9%) |
| $50,000 to $74,999 | 173 (88.7%) | 22 (11.3%) |
| $75,000 to $99,999 | 78 (100.0%) | 0 (0.0%) |
| $100,000 and over | 137 (79.2%) | 36 (20.8%) |
Public vs Private Health Insurance Coverage by Age in Niota
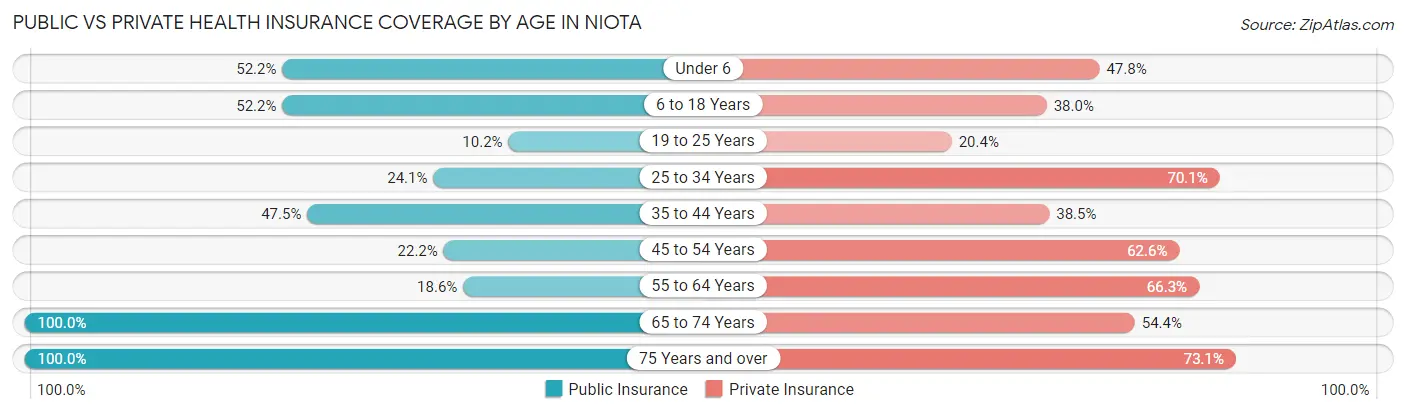
| Age Bracket | Public Insurance | Private Insurance |
| Under 6 | 24 (52.2%) | 22 (47.8%) |
| 6 to 18 Years | 48 (52.2%) | 35 (38.0%) |
| 19 to 25 Years | 5 (10.2%) | 10 (20.4%) |
| 25 to 34 Years | 21 (24.1%) | 61 (70.1%) |
| 35 to 44 Years | 58 (47.5%) | 47 (38.5%) |
| 45 to 54 Years | 22 (22.2%) | 62 (62.6%) |
| 55 to 64 Years | 16 (18.6%) | 57 (66.3%) |
| 65 to 74 Years | 57 (100.0%) | 31 (54.4%) |
| 75 Years and over | 67 (100.0%) | 49 (73.1%) |
| Total | 318 (45.1%) | 374 (53.0%) |
Disability Status by Sex by Age in Niota
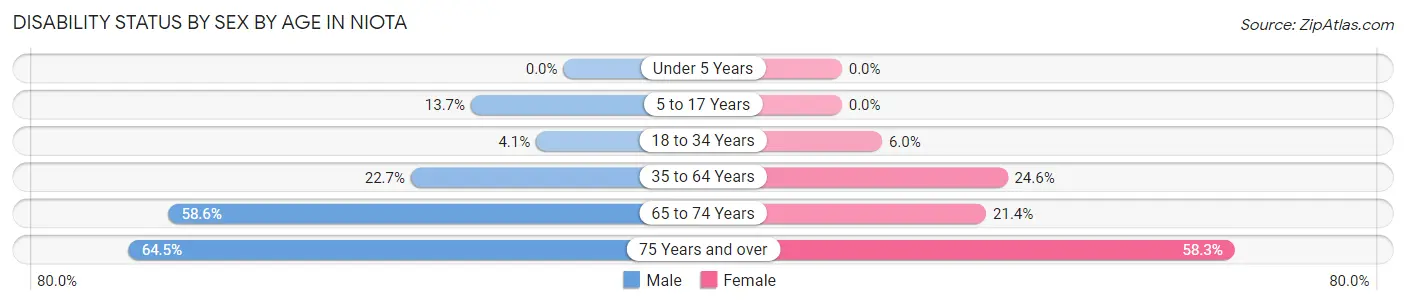
| Age Bracket | Male | Female |
| Under 5 Years | 0 (0.0%) | 0 (0.0%) |
| 5 to 17 Years | 7 (13.7%) | 0 (0.0%) |
| 18 to 34 Years | 3 (4.1%) | 4 (6.0%) |
| 35 to 64 Years | 41 (22.7%) | 31 (24.6%) |
| 65 to 74 Years | 17 (58.6%) | 6 (21.4%) |
| 75 Years and over | 20 (64.5%) | 21 (58.3%) |
Disability Class by Sex by Age in Niota
Disability Class: Hearing Difficulty
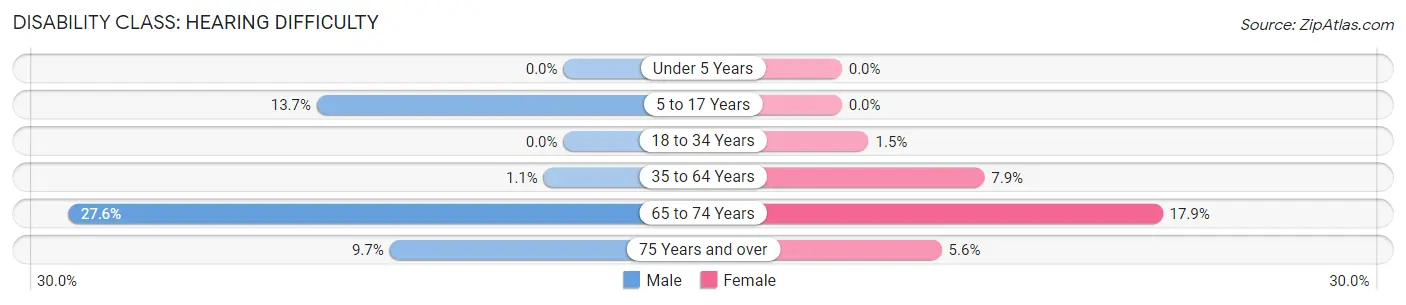
| Age Bracket | Male | Female |
| Under 5 Years | 0 (0.0%) | 0 (0.0%) |
| 5 to 17 Years | 7 (13.7%) | 0 (0.0%) |
| 18 to 34 Years | 0 (0.0%) | 1 (1.5%) |
| 35 to 64 Years | 2 (1.1%) | 10 (7.9%) |
| 65 to 74 Years | 8 (27.6%) | 5 (17.9%) |
| 75 Years and over | 3 (9.7%) | 2 (5.6%) |
Disability Class: Vision Difficulty
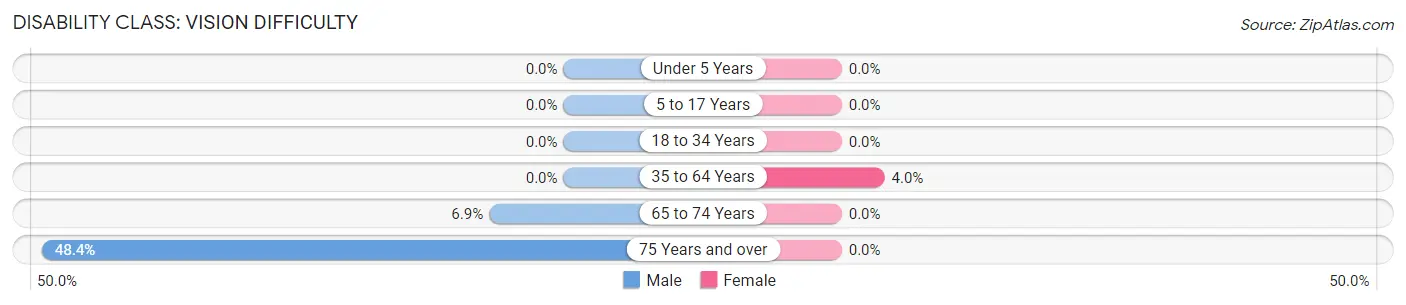
| Age Bracket | Male | Female |
| Under 5 Years | 0 (0.0%) | 0 (0.0%) |
| 5 to 17 Years | 0 (0.0%) | 0 (0.0%) |
| 18 to 34 Years | 0 (0.0%) | 0 (0.0%) |
| 35 to 64 Years | 0 (0.0%) | 5 (4.0%) |
| 65 to 74 Years | 2 (6.9%) | 0 (0.0%) |
| 75 Years and over | 15 (48.4%) | 0 (0.0%) |
Disability Class: Cognitive Difficulty
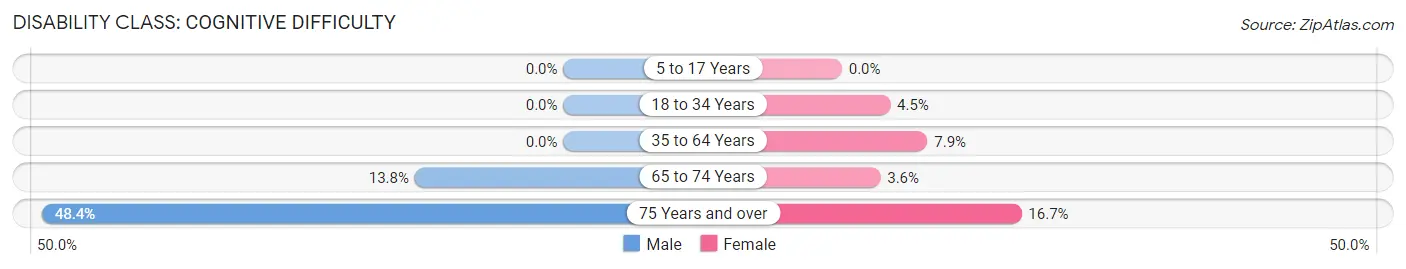
| Age Bracket | Male | Female |
| 5 to 17 Years | 0 (0.0%) | 0 (0.0%) |
| 18 to 34 Years | 0 (0.0%) | 3 (4.5%) |
| 35 to 64 Years | 0 (0.0%) | 10 (7.9%) |
| 65 to 74 Years | 4 (13.8%) | 1 (3.6%) |
| 75 Years and over | 15 (48.4%) | 6 (16.7%) |
Disability Class: Ambulatory Difficulty
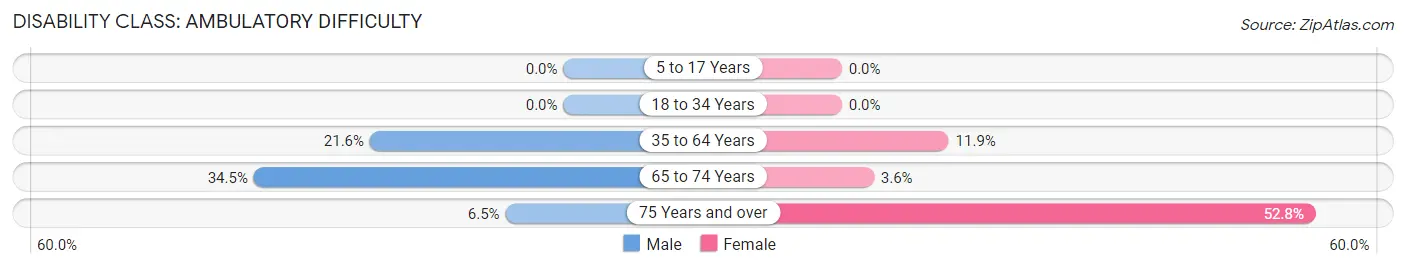
| Age Bracket | Male | Female |
| 5 to 17 Years | 0 (0.0%) | 0 (0.0%) |
| 18 to 34 Years | 0 (0.0%) | 0 (0.0%) |
| 35 to 64 Years | 39 (21.5%) | 15 (11.9%) |
| 65 to 74 Years | 10 (34.5%) | 1 (3.6%) |
| 75 Years and over | 2 (6.5%) | 19 (52.8%) |
Disability Class: Self-Care Difficulty
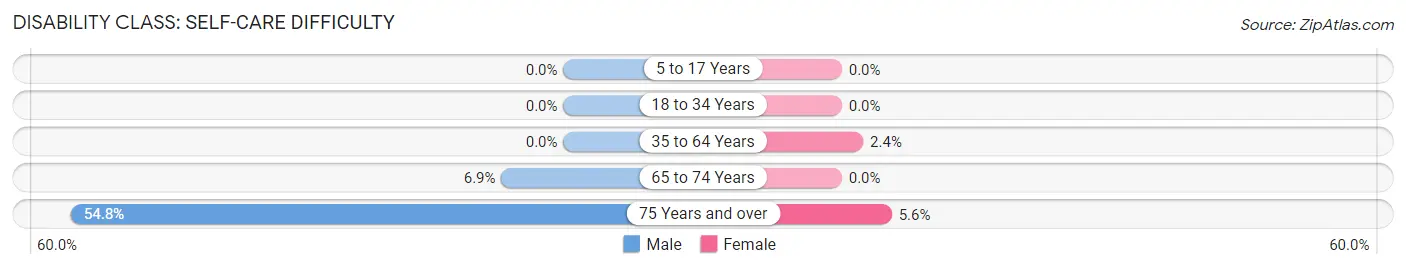
| Age Bracket | Male | Female |
| 5 to 17 Years | 0 (0.0%) | 0 (0.0%) |
| 18 to 34 Years | 0 (0.0%) | 0 (0.0%) |
| 35 to 64 Years | 0 (0.0%) | 3 (2.4%) |
| 65 to 74 Years | 2 (6.9%) | 0 (0.0%) |
| 75 Years and over | 17 (54.8%) | 2 (5.6%) |
Technology Access in Niota
Computing Device Access in Niota
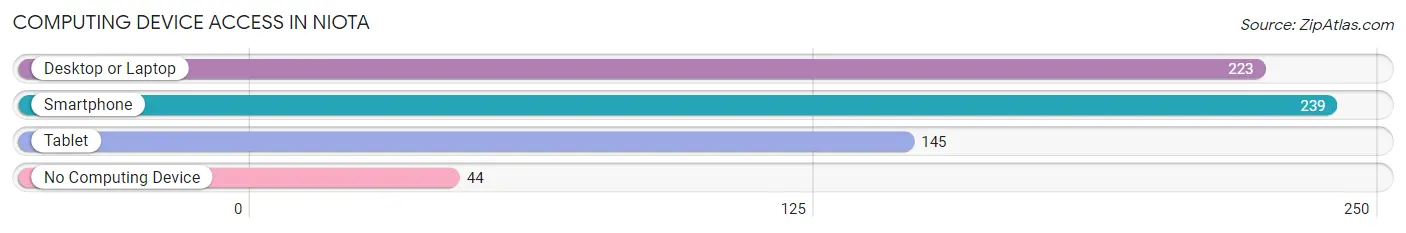
| Device Type | # Households | % Households |
| Desktop or Laptop | 223 | 70.6% |
| Smartphone | 239 | 75.6% |
| Tablet | 145 | 45.9% |
| No Computing Device | 44 | 13.9% |
| Total | 316 | 100.0% |
Internet Access in Niota
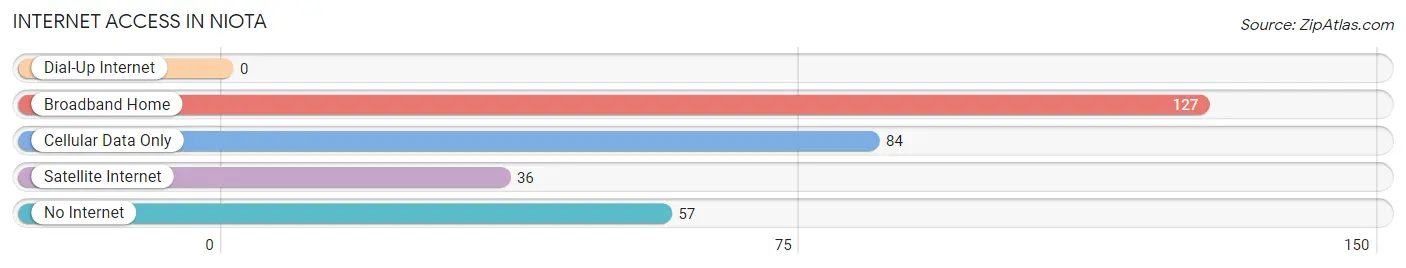
| Internet Type | # Households | % Households |
| Dial-Up Internet | 0 | 0.0% |
| Broadband Home | 127 | 40.2% |
| Cellular Data Only | 84 | 26.6% |
| Satellite Internet | 36 | 11.4% |
| No Internet | 57 | 18.0% |
| Total | 316 | 100.0% |
Niota Summary
Niota is a small town located in McMinn County, Tennessee. It is situated in the foothills of the Appalachian Mountains, approximately 25 miles north of Chattanooga. The town was founded in 1820 and was named after the Cherokee Indian Chief Niota. The population of Niota was 1,845 in the 2010 census.
Geography
Niota is located at 35°30'N 84°45'W. It is situated in the foothills of the Appalachian Mountains, approximately 25 miles north of Chattanooga. The town is located on the banks of the Hiwassee River, which is a tributary of the Tennessee River. The town is surrounded by rolling hills and is home to several small lakes and streams. The climate in Niota is mild and humid, with temperatures ranging from the low 30s in the winter to the mid-80s in the summer.
Economy
Niota’s economy is largely based on agriculture and manufacturing. The town is home to several small farms, which produce a variety of crops, including corn, soybeans, wheat, and hay. The town is also home to several small manufacturing companies, which produce a variety of products, including furniture, clothing, and automotive parts.
Demographics
As of the 2010 census, Niota had a population of 1,845. The racial makeup of the town was 95.2% White, 0.7% African American, 0.3% Native American, 0.2% Asian, 0.1% Pacific Islander, 1.7% from other races, and 1.8% from two or more races. Hispanic or Latino of any race were 3.2% of the population.
The median income for a household in Niota was $30,938, and the median income for a family was $37,917. The per capita income for the town was $15,945. About 17.2% of families and 20.2% of the population were below the poverty line, including 28.3% of those under age 18 and 14.2% of those age 65 or over.
History
Niota was founded in 1820 and was named after the Cherokee Indian Chief Niota. The town was originally a trading post for the Cherokee Indians and was a stop on the Trail of Tears. The town was also a major stop on the Hiwassee Railroad, which ran from Chattanooga to Knoxville. The railroad was a major factor in the growth of the town, as it allowed for the transportation of goods and people.
In the late 19th century, Niota was a major center for the timber industry. The town was home to several sawmills and lumber companies, which provided employment for many of the town’s residents. The timber industry declined in the early 20th century, but the town continued to grow and prosper.
Today, Niota is a small, rural town with a population of just over 1,800. The town is home to several small businesses, including a grocery store, a hardware store, and several restaurants. The town is also home to several churches, a library, and a museum. Niota is a quiet, peaceful town with a strong sense of community and a rich history.
Common Questions
What is Per Capita Income in Niota?
Per Capita income in Niota is $26,871.
What is the Median Family Income in Niota?
Median Family Income in Niota is $63,750.
What is the Median Household income in Niota?
Median Household Income in Niota is $53,333.
What is Income or Wage Gap in Niota?
Income or Wage Gap in Niota is 12.5%.
Women in Niota earn 87.5 cents for every dollar earned by a man.
What is Inequality or Gini Index in Niota?
Inequality or Gini Index in Niota is 0.38.
What is the Total Population of Niota?
Total Population of Niota is 705.
What is the Total Male Population of Niota?
Total Male Population of Niota is 383.
What is the Total Female Population of Niota?
Total Female Population of Niota is 322.
What is the Ratio of Males per 100 Females in Niota?
There are 118.94 Males per 100 Females in Niota.
What is the Ratio of Females per 100 Males in Niota?
There are 84.07 Females per 100 Males in Niota.
What is the Median Population Age in Niota?
Median Population Age in Niota is 42.0 Years.
What is the Average Family Size in Niota
Average Family Size in Niota is 2.9 People.
What is the Average Household Size in Niota
Average Household Size in Niota is 2.2 People.
How Large is the Labor Force in Niota?
There are 391 People in the Labor Forcein in Niota.
What is the Percentage of People in the Labor Force in Niota?
65.1% of People are in the Labor Force in Niota.
What is the Unemployment Rate in Niota?
Unemployment Rate in Niota is 9.2%.