Morrison, TN Map & Demographics
Morrison Map
Morrison Overview
$19,739
PER CAPITA INCOME
$47,143
AVG FAMILY INCOME
$34,318
AVG HOUSEHOLD INCOME
13.9%
WAGE / INCOME GAP [ % ]
86.1¢/ $1
WAGE / INCOME GAP [ $ ]
0.42
INEQUALITY / GINI INDEX
717
TOTAL POPULATION
384
MALE POPULATION
333
FEMALE POPULATION
115.32
MALES / 100 FEMALES
86.72
FEMALES / 100 MALES
40.5
MEDIAN AGE
3.3
AVG FAMILY SIZE
2.8
AVG HOUSEHOLD SIZE
300
LABOR FORCE [ PEOPLE ]
56.2%
PERCENT IN LABOR FORCE
5.7%
UNEMPLOYMENT RATE
Morrison Zip Codes
Morrison Area Codes
Income in Morrison
Income Overview in Morrison
Per Capita Income in Morrison is $19,739, while median incomes of families and households are $47,143 and $34,318 respectively.
| Characteristic | Number | Measure |
| Per Capita Income | 717 | $19,739 |
| Median Family Income | 176 | $47,143 |
| Mean Family Income | 176 | $59,447 |
| Median Household Income | 260 | $34,318 |
| Mean Household Income | 260 | $51,913 |
| Income Deficit | 176 | $0 |
| Wage / Income Gap (%) | 717 | 13.92% |
| Wage / Income Gap ($) | 717 | 86.08¢ per $1 |
| Gini / Inequality Index | 717 | 0.42 |
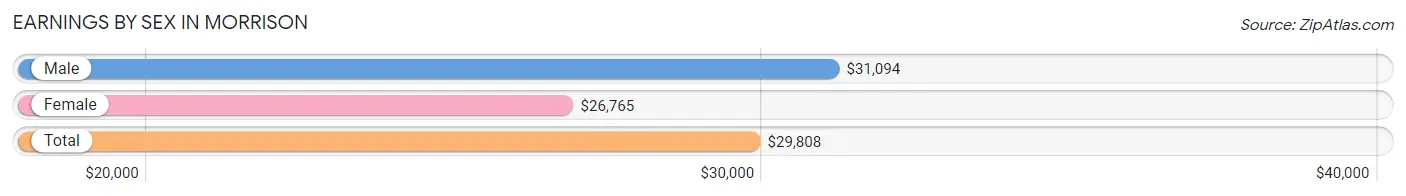
Earnings by Sex in Morrison
Average Earnings in Morrison are $29,808, $31,094 for men and $26,765 for women, a difference of 13.9%.
| Sex | Number | Average Earnings |
| Male | 170 (58.2%) | $31,094 |
| Female | 122 (41.8%) | $26,765 |
| Total | 292 (100.0%) | $29,808 |
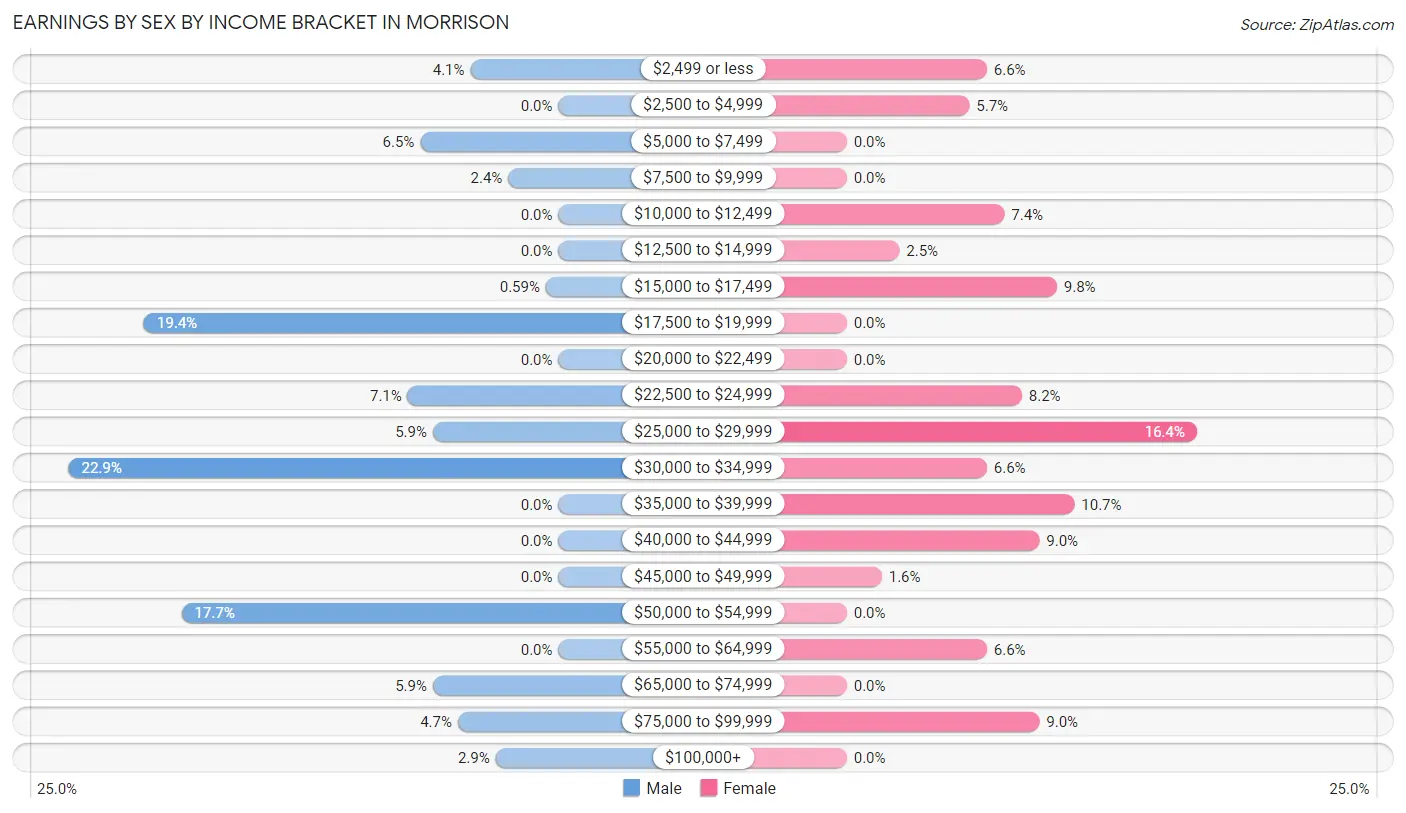
Earnings by Sex by Income Bracket in Morrison
The most common earnings brackets in Morrison are $30,000 to $34,999 for men (39 | 22.9%) and $25,000 to $29,999 for women (20 | 16.4%).
| Income | Male | Female |
| $2,499 or less | 7 (4.1%) | 8 (6.6%) |
| $2,500 to $4,999 | 0 (0.0%) | 7 (5.7%) |
| $5,000 to $7,499 | 11 (6.5%) | 0 (0.0%) |
| $7,500 to $9,999 | 4 (2.4%) | 0 (0.0%) |
| $10,000 to $12,499 | 0 (0.0%) | 9 (7.4%) |
| $12,500 to $14,999 | 0 (0.0%) | 3 (2.5%) |
| $15,000 to $17,499 | 1 (0.6%) | 12 (9.8%) |
| $17,500 to $19,999 | 33 (19.4%) | 0 (0.0%) |
| $20,000 to $22,499 | 0 (0.0%) | 0 (0.0%) |
| $22,500 to $24,999 | 12 (7.1%) | 10 (8.2%) |
| $25,000 to $29,999 | 10 (5.9%) | 20 (16.4%) |
| $30,000 to $34,999 | 39 (22.9%) | 8 (6.6%) |
| $35,000 to $39,999 | 0 (0.0%) | 13 (10.7%) |
| $40,000 to $44,999 | 0 (0.0%) | 11 (9.0%) |
| $45,000 to $49,999 | 0 (0.0%) | 2 (1.6%) |
| $50,000 to $54,999 | 30 (17.6%) | 0 (0.0%) |
| $55,000 to $64,999 | 0 (0.0%) | 8 (6.6%) |
| $65,000 to $74,999 | 10 (5.9%) | 0 (0.0%) |
| $75,000 to $99,999 | 8 (4.7%) | 11 (9.0%) |
| $100,000+ | 5 (2.9%) | 0 (0.0%) |
| Total | 170 (100.0%) | 122 (100.0%) |
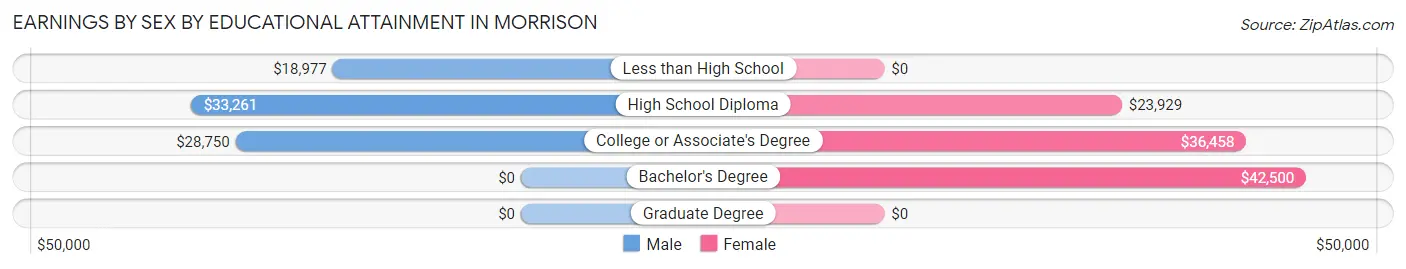
Earnings by Sex by Educational Attainment in Morrison
Average earnings in Morrison are $30,469 for men and $30,938 for women, a difference of 1.5%. Men with an educational attainment of high school diploma enjoy the highest average annual earnings of $33,261, while those with less than high school education earn the least with $18,977. Women with an educational attainment of bachelor's degree earn the most with the average annual earnings of $42,500, while those with high school diploma education have the smallest earnings of $23,929.
| Educational Attainment | Male Income | Female Income |
| Less than High School | $18,977 | $0 |
| High School Diploma | $33,261 | $23,929 |
| College or Associate's Degree | $28,750 | $36,458 |
| Bachelor's Degree | - | - |
| Graduate Degree | - | - |
| Total | $30,469 | $30,938 |
Family Income in Morrison
Family Income Brackets in Morrison
According to the Morrison family income data, there are 46 families falling into the $25,000 to $34,999 income range, which is the most common income bracket and makes up 26.1% of all families.
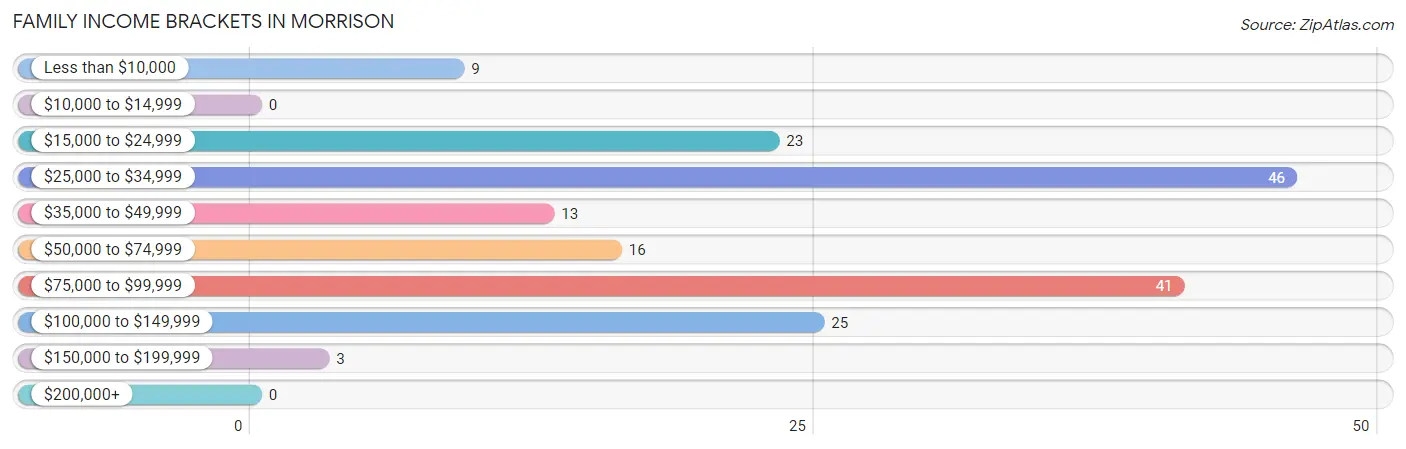
| Income Bracket | # Families | % Families |
| Less than $10,000 | 9 | 5.1% |
| $10,000 to $14,999 | 0 | 0.0% |
| $15,000 to $24,999 | 23 | 13.1% |
| $25,000 to $34,999 | 46 | 26.1% |
| $35,000 to $49,999 | 13 | 7.4% |
| $50,000 to $74,999 | 16 | 9.1% |
| $75,000 to $99,999 | 41 | 23.3% |
| $100,000 to $149,999 | 25 | 14.2% |
| $150,000 to $199,999 | 3 | 1.7% |
| $200,000+ | 0 | 0.0% |
Family Income by Famaliy Size in Morrison
3-person families (64 | 36.4%) account for the highest median family income in Morrison with $71,500 per family, while 2-person families (68 | 38.6%) have the highest median income of $25,625 per family member.
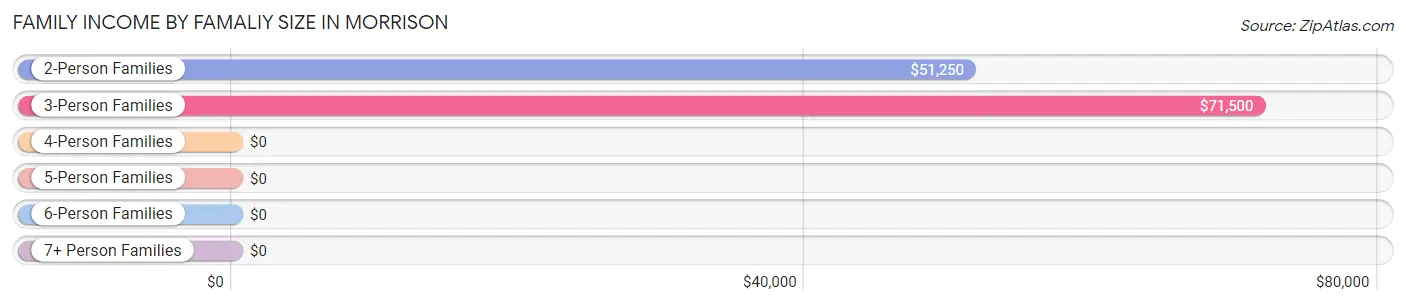
| Income Bracket | # Families | Median Income |
| 2-Person Families | 68 (38.6%) | $51,250 |
| 3-Person Families | 64 (36.4%) | $71,500 |
| 4-Person Families | 20 (11.4%) | $0 |
| 5-Person Families | 12 (6.8%) | $0 |
| 6-Person Families | 4 (2.3%) | $0 |
| 7+ Person Families | 8 (4.5%) | $0 |
| Total | 176 (100.0%) | $47,143 |
Family Income by Number of Earners in Morrison
The median family income in Morrison is $47,143, with families comprising 3+ earners (9) having the highest median family income of $110,625, while families with no earners (50) have the lowest median family income of $30,313, accounting for 5.1% and 28.4% of families, respectively.
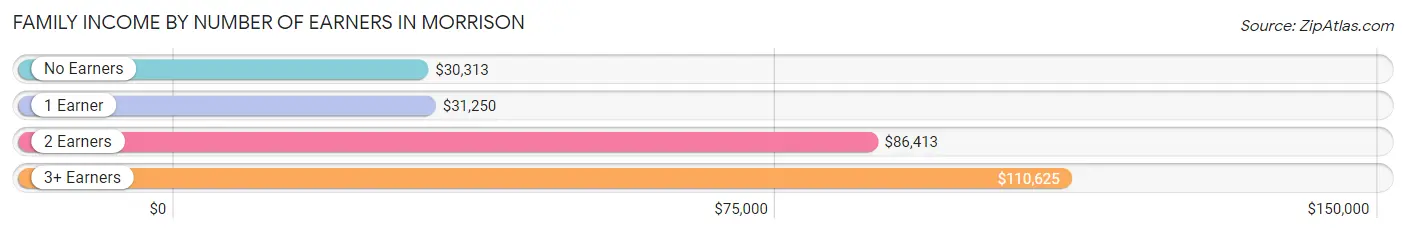
| Number of Earners | # Families | Median Income |
| No Earners | 50 (28.4%) | $30,313 |
| 1 Earner | 49 (27.8%) | $31,250 |
| 2 Earners | 68 (38.6%) | $86,413 |
| 3+ Earners | 9 (5.1%) | $110,625 |
| Total | 176 (100.0%) | $47,143 |
Household Income in Morrison
Household Income Brackets in Morrison
With 67 households falling in the category, the $25,000 to $34,999 income range is the most frequent in Morrison, accounting for 25.8% of all households. In contrast, only 3 households (1.1%) fall into the $150,000 to $199,999 income bracket, making it the least populous group.
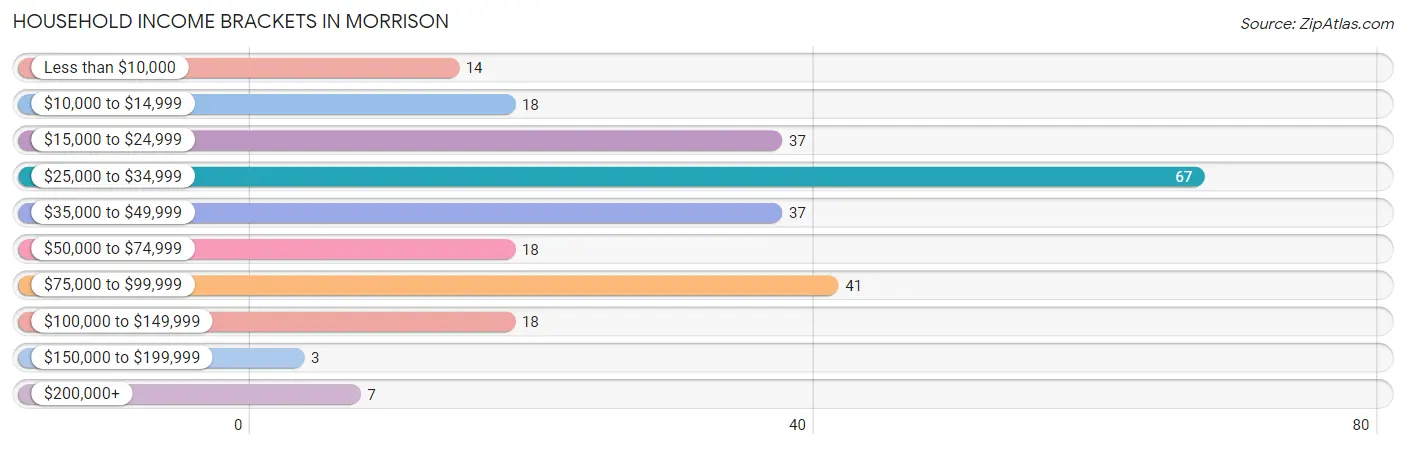
| Income Bracket | # Households | % Households |
| Less than $10,000 | 14 | 5.4% |
| $10,000 to $14,999 | 18 | 6.9% |
| $15,000 to $24,999 | 37 | 14.2% |
| $25,000 to $34,999 | 67 | 25.8% |
| $35,000 to $49,999 | 37 | 14.2% |
| $50,000 to $74,999 | 18 | 6.9% |
| $75,000 to $99,999 | 41 | 15.8% |
| $100,000 to $149,999 | 18 | 6.9% |
| $150,000 to $199,999 | 3 | 1.2% |
| $200,000+ | 7 | 2.7% |
Household Income by Householder Age in Morrison
The median household income in Morrison is $34,318, with the highest median household income of $36,250 found in the 65+ years age bracket for the primary householder. A total of 50 households (19.2%) fall into this category. Meanwhile, the 15 to 24 years age bracket for the primary householder has the lowest median household income of $0, with 23 households (8.8%) in this group.
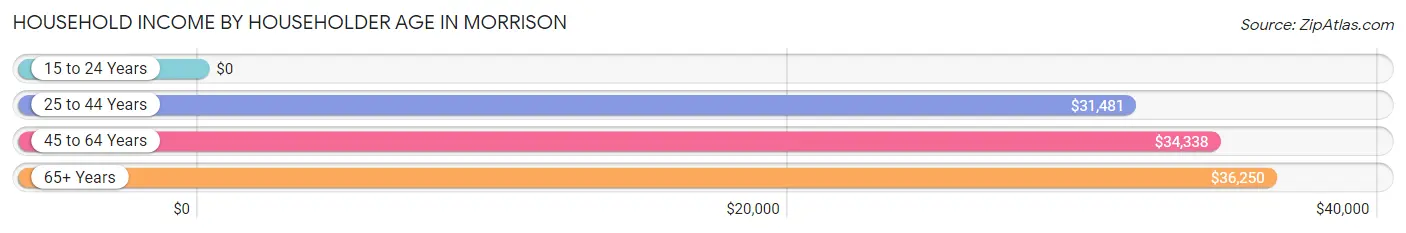
| Income Bracket | # Households | Median Income |
| 15 to 24 Years | 23 (8.8%) | $0 |
| 25 to 44 Years | 84 (32.3%) | $31,481 |
| 45 to 64 Years | 103 (39.6%) | $34,338 |
| 65+ Years | 50 (19.2%) | $36,250 |
| Total | 260 (100.0%) | $34,318 |
Poverty in Morrison
Income Below Poverty by Sex and Age in Morrison
With 34.5% poverty level for males and 38.4% for females among the residents of Morrison, 12 to 14 year old males and 5 year old females are the most vulnerable to poverty, with 5 males (100.0%) and 10 females (100.0%) in their respective age groups living below the poverty level.
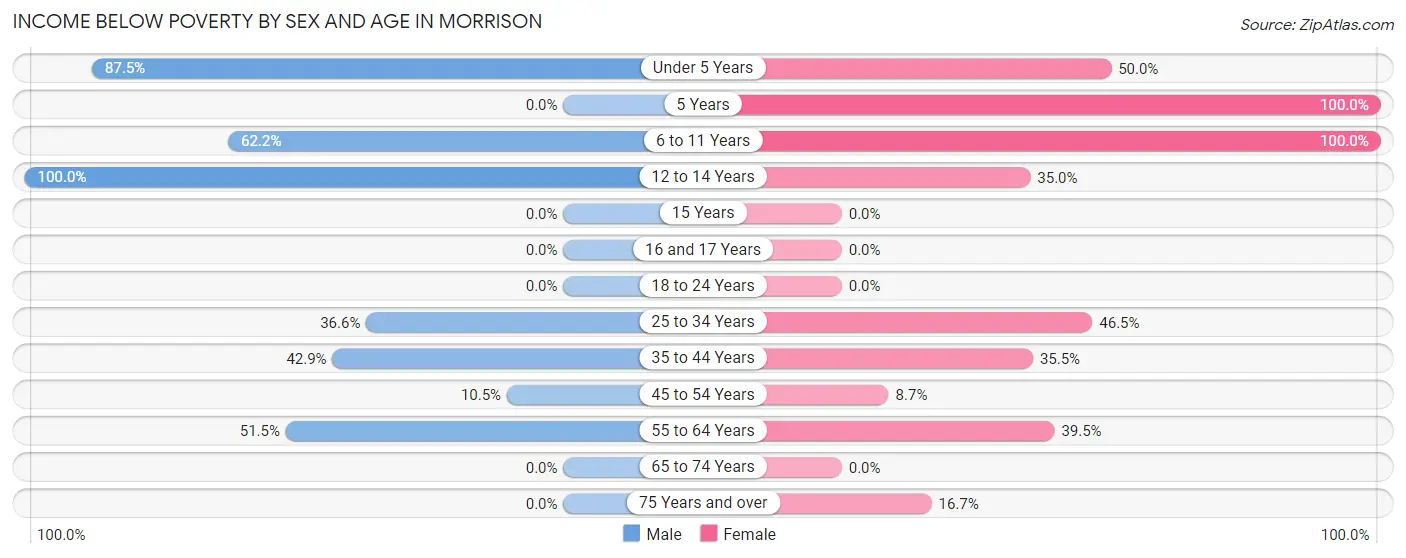
| Age Bracket | Male | Female |
| Under 5 Years | 28 (87.5%) | 6 (50.0%) |
| 5 Years | 0 (0.0%) | 10 (100.0%) |
| 6 to 11 Years | 28 (62.2%) | 41 (100.0%) |
| 12 to 14 Years | 5 (100.0%) | 7 (35.0%) |
| 15 Years | 0 (0.0%) | 0 (0.0%) |
| 16 and 17 Years | 0 (0.0%) | 0 (0.0%) |
| 18 to 24 Years | 0 (0.0%) | 0 (0.0%) |
| 25 to 34 Years | 15 (36.6%) | 20 (46.5%) |
| 35 to 44 Years | 9 (42.9%) | 22 (35.5%) |
| 45 to 54 Years | 9 (10.5%) | 2 (8.7%) |
| 55 to 64 Years | 34 (51.5%) | 15 (39.5%) |
| 65 to 74 Years | 0 (0.0%) | 0 (0.0%) |
| 75 Years and over | 0 (0.0%) | 5 (16.7%) |
| Total | 128 (34.5%) | 128 (38.4%) |
Income Above Poverty by Sex and Age in Morrison
According to the poverty statistics in Morrison, males aged 18 to 24 years and females aged 15 years are the age groups that are most secure financially, with 100.0% of males and 100.0% of females in these age groups living above the poverty line.
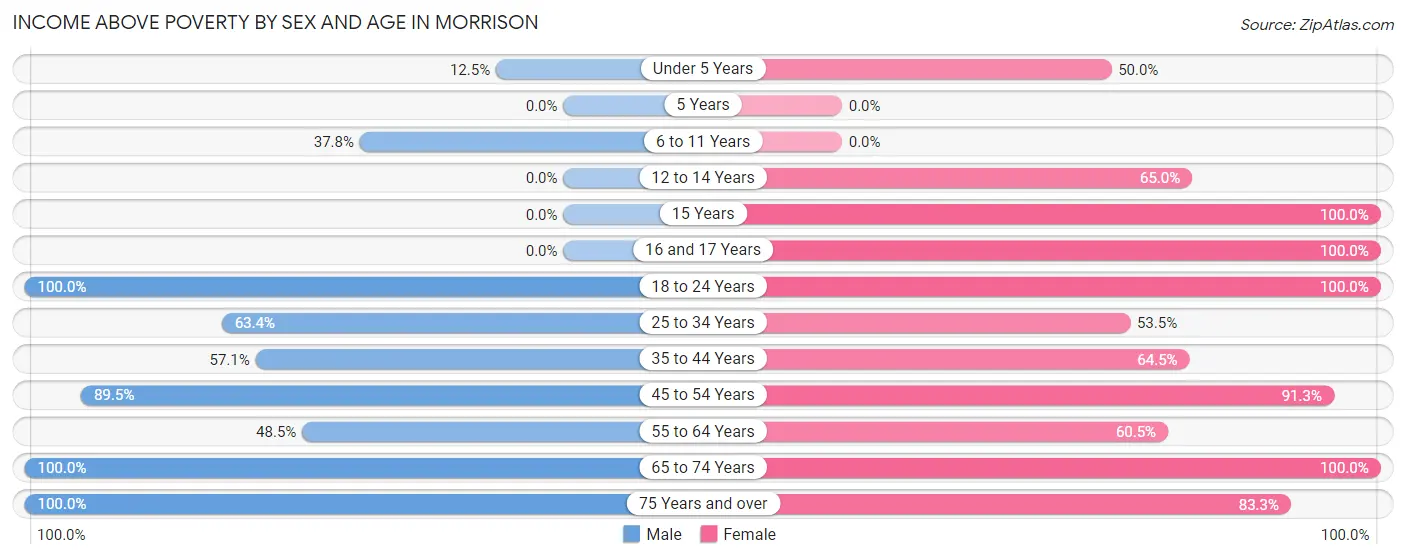
| Age Bracket | Male | Female |
| Under 5 Years | 4 (12.5%) | 6 (50.0%) |
| 5 Years | 0 (0.0%) | 0 (0.0%) |
| 6 to 11 Years | 17 (37.8%) | 0 (0.0%) |
| 12 to 14 Years | 0 (0.0%) | 13 (65.0%) |
| 15 Years | 0 (0.0%) | 5 (100.0%) |
| 16 and 17 Years | 0 (0.0%) | 2 (100.0%) |
| 18 to 24 Years | 38 (100.0%) | 20 (100.0%) |
| 25 to 34 Years | 26 (63.4%) | 23 (53.5%) |
| 35 to 44 Years | 12 (57.1%) | 40 (64.5%) |
| 45 to 54 Years | 77 (89.5%) | 21 (91.3%) |
| 55 to 64 Years | 32 (48.5%) | 23 (60.5%) |
| 65 to 74 Years | 27 (100.0%) | 27 (100.0%) |
| 75 Years and over | 10 (100.0%) | 25 (83.3%) |
| Total | 243 (65.5%) | 205 (61.6%) |
Income Below Poverty Among Married-Couple Families in Morrison
The poverty statistics for married-couple families in Morrison show that 27.2% or 31 of the total 114 families live below the poverty line. Families with 3 or 4 children have the highest poverty rate of 100.0%, comprising of 13 families. On the other hand, families with 1 or 2 children have the lowest poverty rate of 16.2%, which includes 6 families.
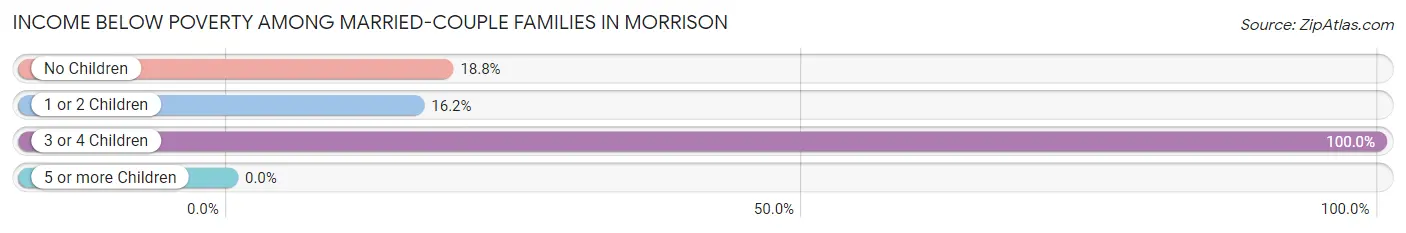
| Children | Above Poverty | Below Poverty |
| No Children | 52 (81.2%) | 12 (18.8%) |
| 1 or 2 Children | 31 (83.8%) | 6 (16.2%) |
| 3 or 4 Children | 0 (0.0%) | 13 (100.0%) |
| 5 or more Children | 0 (0.0%) | 0 (0.0%) |
| Total | 83 (72.8%) | 31 (27.2%) |
Income Below Poverty Among Single-Parent Households in Morrison
According to the poverty data in Morrison, 11.5% or 3 single-father households and 22.2% or 8 single-mother households are living below the poverty line. Among single-father households, those with 1 or 2 children have the highest poverty rate, with 3 households (100.0%) experiencing poverty. Likewise, among single-mother households, those with 5 or more children have the highest poverty rate, with 8 households (100.0%) falling below the poverty line.
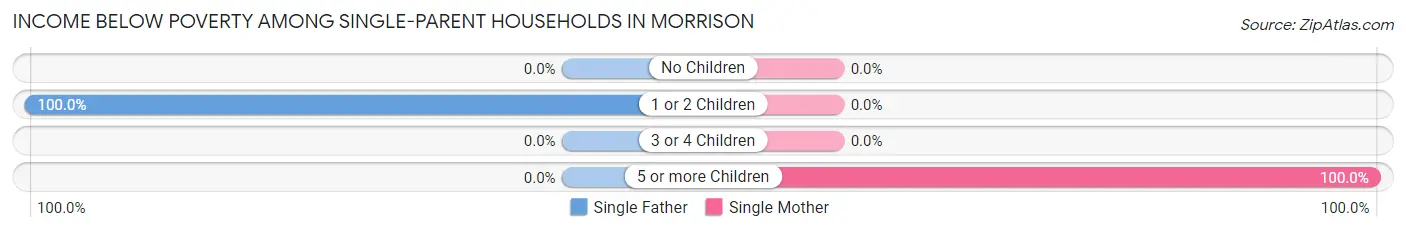
| Children | Single Father | Single Mother |
| No Children | 0 (0.0%) | 0 (0.0%) |
| 1 or 2 Children | 3 (100.0%) | 0 (0.0%) |
| 3 or 4 Children | 0 (0.0%) | 0 (0.0%) |
| 5 or more Children | 0 (0.0%) | 8 (100.0%) |
| Total | 3 (11.5%) | 8 (22.2%) |
Income Below Poverty Among Married-Couple vs Single-Parent Households in Morrison
The poverty data for Morrison shows that 31 of the married-couple family households (27.2%) and 11 of the single-parent households (17.7%) are living below the poverty level. Within the married-couple family households, those with 3 or 4 children have the highest poverty rate, with 13 households (100.0%) falling below the poverty line. Among the single-parent households, those with 5 or more children have the highest poverty rate, with 8 household (100.0%) living below poverty.
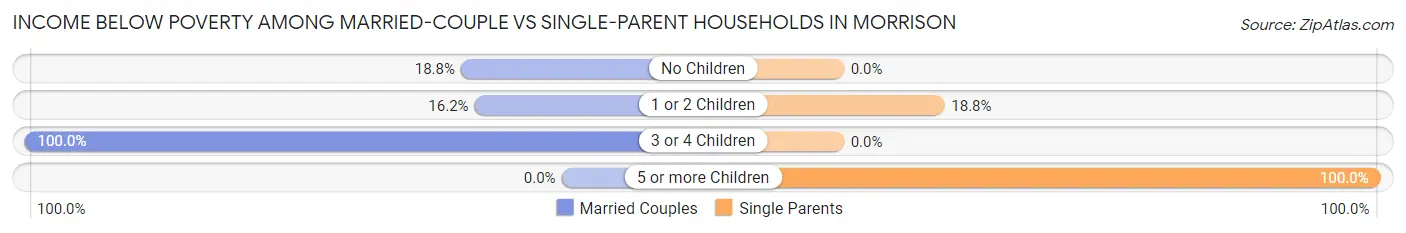
| Children | Married-Couple Families | Single-Parent Households |
| No Children | 12 (18.8%) | 0 (0.0%) |
| 1 or 2 Children | 6 (16.2%) | 3 (18.8%) |
| 3 or 4 Children | 13 (100.0%) | 0 (0.0%) |
| 5 or more Children | 0 (0.0%) | 8 (100.0%) |
| Total | 31 (27.2%) | 11 (17.7%) |
Race in Morrison
The most populous races in Morrison are White / Caucasian (532 | 74.2%), Hispanic or Latino (159 | 22.2%), and Two or more Races (68 | 9.5%).
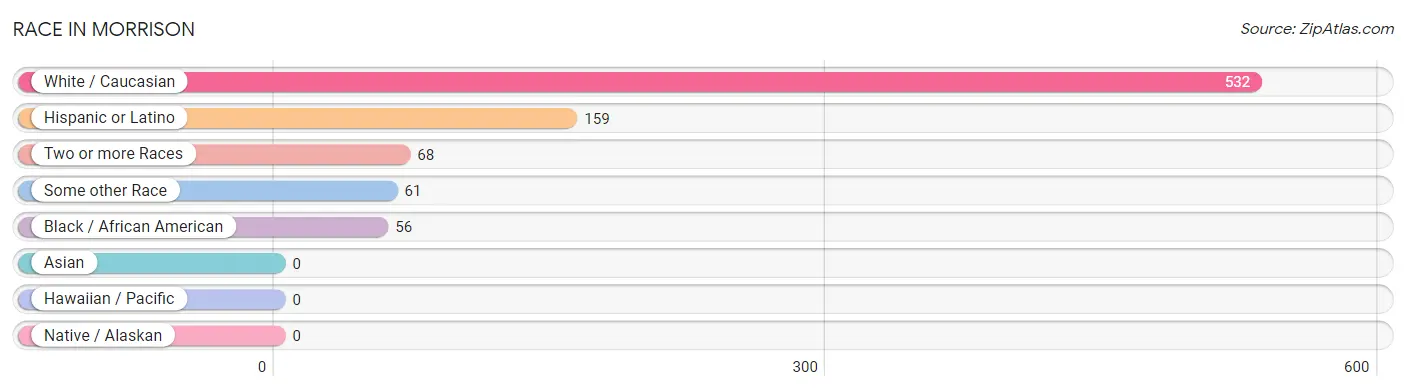
| Race | # Population | % Population |
| Asian | 0 | 0.0% |
| Black / African American | 56 | 7.8% |
| Hawaiian / Pacific | 0 | 0.0% |
| Hispanic or Latino | 159 | 22.2% |
| Native / Alaskan | 0 | 0.0% |
| White / Caucasian | 532 | 74.2% |
| Two or more Races | 68 | 9.5% |
| Some other Race | 61 | 8.5% |
| Total | 717 | 100.0% |
Ancestry in Morrison
The most populous ancestries reported in Morrison are Mexican (148 | 20.6%), American (144 | 20.1%), Irish (39 | 5.4%), Italian (25 | 3.5%), and English (14 | 1.9%), together accounting for 51.6% of all Morrison residents.
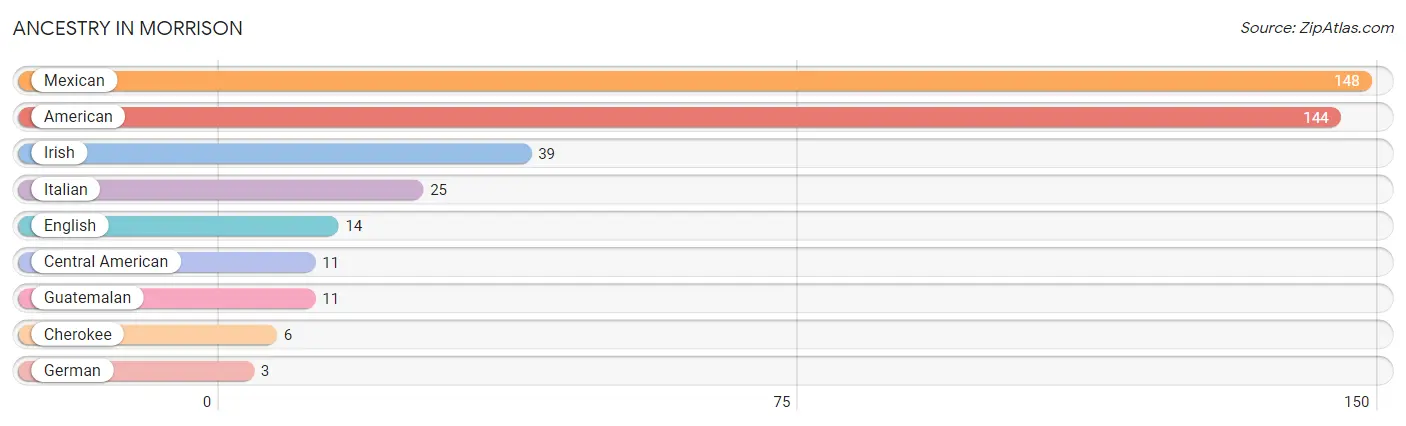
| Ancestry | # Population | % Population |
| American | 144 | 20.1% |
| Central American | 11 | 1.5% |
| Cherokee | 6 | 0.8% |
| English | 14 | 1.9% |
| German | 3 | 0.4% |
| Guatemalan | 11 | 1.5% |
| Irish | 39 | 5.4% |
| Italian | 25 | 3.5% |
| Mexican | 148 | 20.6% | View All 9 Rows |
Immigrants in Morrison
The most numerous immigrant groups reported in Morrison came from Central America (76 | 10.6%), Latin America (76 | 10.6%), and Mexico (76 | 10.6%), together accounting for 31.8% of all Morrison residents.
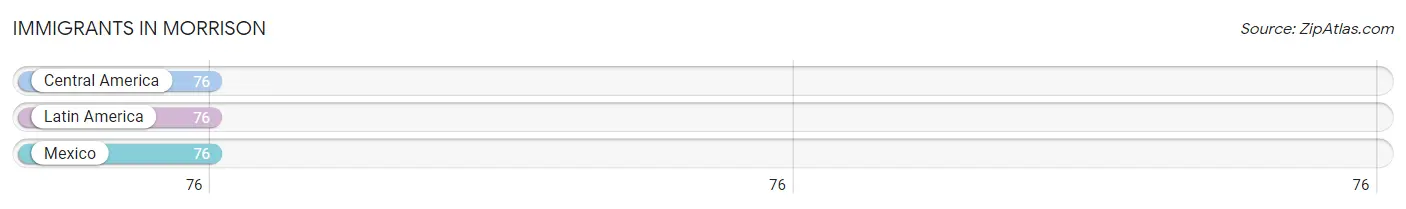
| Immigration Origin | # Population | % Population |
| Central America | 76 | 10.6% |
| Latin America | 76 | 10.6% |
| Mexico | 76 | 10.6% | View All 3 Rows |
Sex and Age in Morrison
Sex and Age in Morrison
The most populous age groups in Morrison are 60 to 64 Years (60 | 15.6%) for men and 5 to 9 Years (51 | 15.3%) for women.
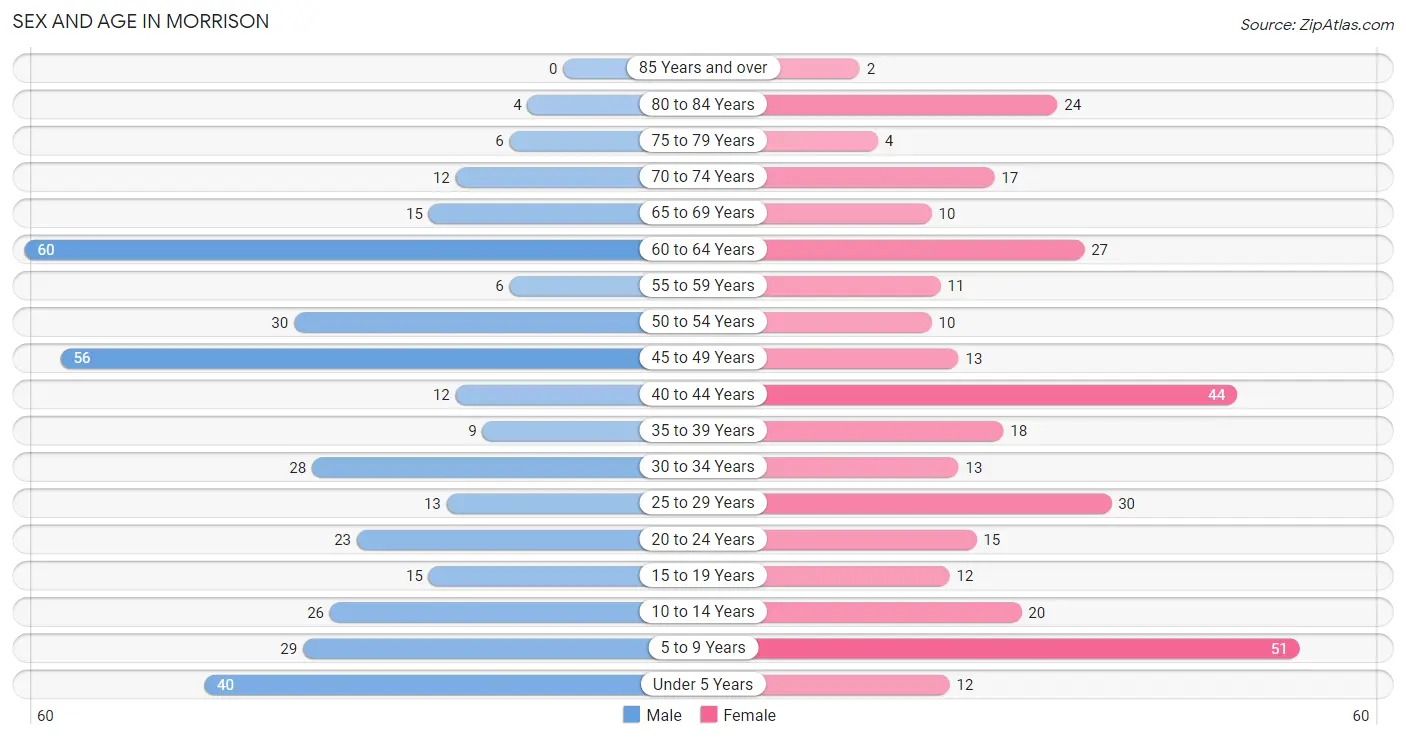
| Age Bracket | Male | Female |
| Under 5 Years | 40 (10.4%) | 12 (3.6%) |
| 5 to 9 Years | 29 (7.5%) | 51 (15.3%) |
| 10 to 14 Years | 26 (6.8%) | 20 (6.0%) |
| 15 to 19 Years | 15 (3.9%) | 12 (3.6%) |
| 20 to 24 Years | 23 (6.0%) | 15 (4.5%) |
| 25 to 29 Years | 13 (3.4%) | 30 (9.0%) |
| 30 to 34 Years | 28 (7.3%) | 13 (3.9%) |
| 35 to 39 Years | 9 (2.3%) | 18 (5.4%) |
| 40 to 44 Years | 12 (3.1%) | 44 (13.2%) |
| 45 to 49 Years | 56 (14.6%) | 13 (3.9%) |
| 50 to 54 Years | 30 (7.8%) | 10 (3.0%) |
| 55 to 59 Years | 6 (1.6%) | 11 (3.3%) |
| 60 to 64 Years | 60 (15.6%) | 27 (8.1%) |
| 65 to 69 Years | 15 (3.9%) | 10 (3.0%) |
| 70 to 74 Years | 12 (3.1%) | 17 (5.1%) |
| 75 to 79 Years | 6 (1.6%) | 4 (1.2%) |
| 80 to 84 Years | 4 (1.0%) | 24 (7.2%) |
| 85 Years and over | 0 (0.0%) | 2 (0.6%) |
| Total | 384 (100.0%) | 333 (100.0%) |
Families and Households in Morrison
Median Family Size in Morrison
The median family size in Morrison is 3.27 persons per family, with single female/mother families (36 | 20.4%) accounting for the largest median family size of 3.86 persons per family. On the other hand, single male/father families (26 | 14.8%) represent the smallest median family size with 1.96 persons per family.
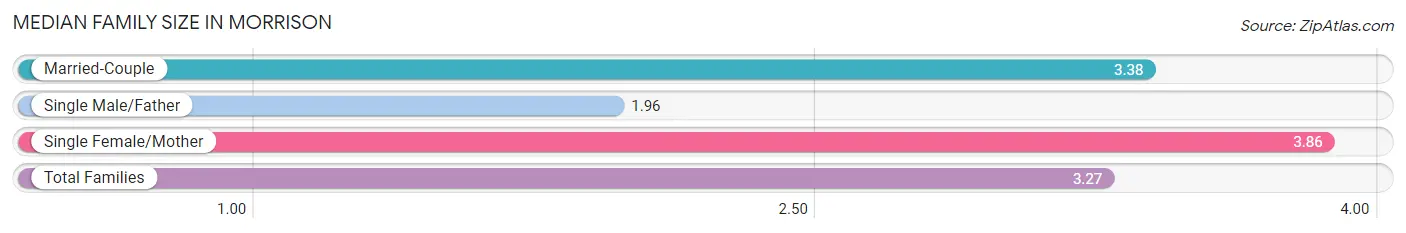
| Family Type | # Families | Family Size |
| Married-Couple | 114 (64.8%) | 3.38 |
| Single Male/Father | 26 (14.8%) | 1.96 |
| Single Female/Mother | 36 (20.4%) | 3.86 |
| Total Families | 176 (100.0%) | 3.27 |
Median Household Size in Morrison
The median household size in Morrison is 2.76 persons per household, with single female/mother households (36 | 13.9%) accounting for the largest median household size of 4.72 persons per household. non-family households (84 | 32.3%) represent the smallest median household size with 1.29 persons per household.
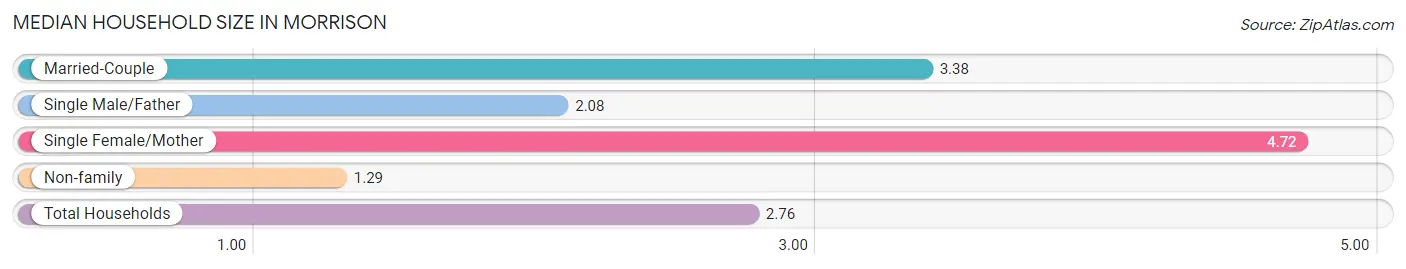
| Household Type | # Households | Household Size |
| Married-Couple | 114 (43.9%) | 3.38 |
| Single Male/Father | 26 (10.0%) | 2.08 |
| Single Female/Mother | 36 (13.9%) | 4.72 |
| Non-family | 84 (32.3%) | 1.29 |
| Total Households | 260 (100.0%) | 2.76 |
Household Size by Marriage Status in Morrison
Out of a total of 260 households in Morrison, 176 (67.7%) are family households, while 84 (32.3%) are nonfamily households. The most numerous type of family households are 2-person households, comprising 65, and the most common type of nonfamily households are 1-person households, comprising 65.
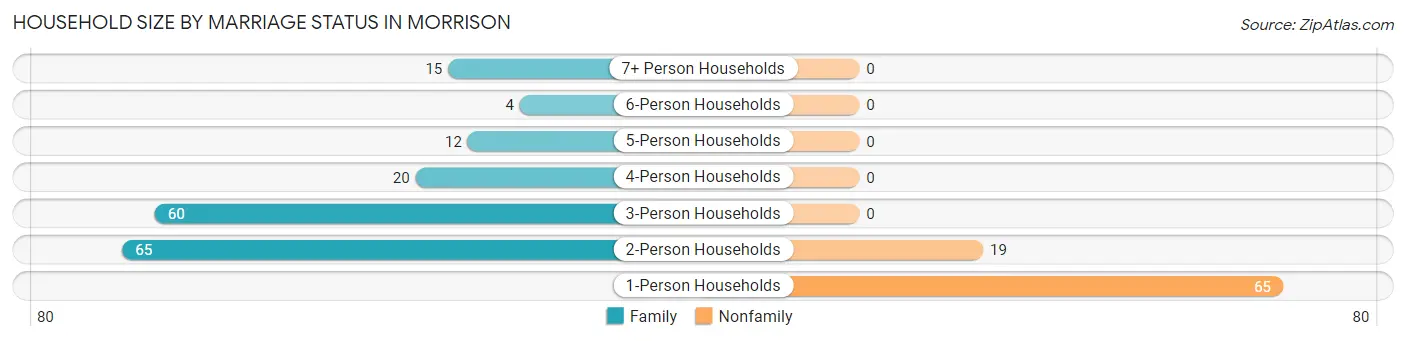
| Household Size | Family Households | Nonfamily Households |
| 1-Person Households | - | 65 (25.0%) |
| 2-Person Households | 65 (25.0%) | 19 (7.3%) |
| 3-Person Households | 60 (23.1%) | 0 (0.0%) |
| 4-Person Households | 20 (7.7%) | 0 (0.0%) |
| 5-Person Households | 12 (4.6%) | 0 (0.0%) |
| 6-Person Households | 4 (1.5%) | 0 (0.0%) |
| 7+ Person Households | 15 (5.8%) | 0 (0.0%) |
| Total | 176 (67.7%) | 84 (32.3%) |
Female Fertility in Morrison
Fertility by Age in Morrison
Average fertility rate in Morrison is 21.0 births per 1,000 women. Women in the age bracket of 20 to 34 years have the highest fertility rate with 52.0 births per 1,000 women. Women in the age bracket of 20 to 34 years acount for 100.0% of all women with births.
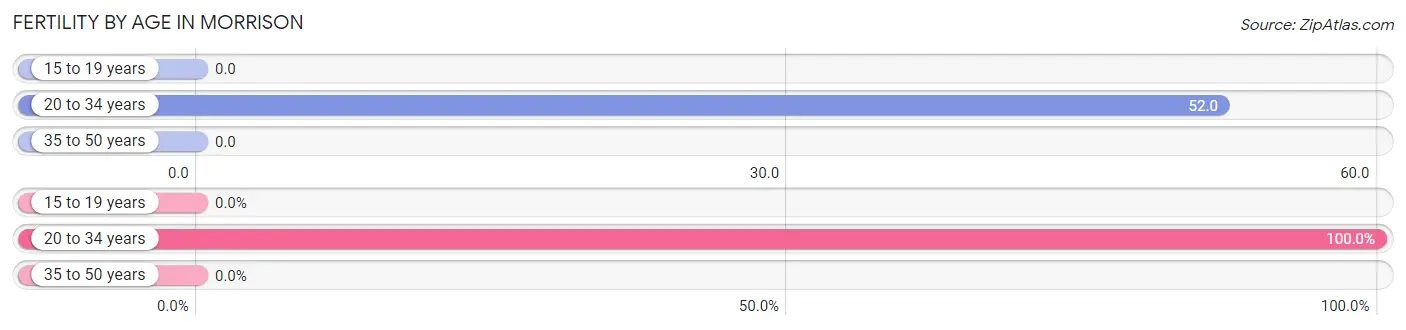
| Age Bracket | Women with Births | Births / 1,000 Women |
| 15 to 19 years | 0 (0.0%) | 0.0 |
| 20 to 34 years | 3 (100.0%) | 52.0 |
| 35 to 50 years | 0 (0.0%) | 0.0 |
| Total | 3 (100.0%) | 21.0 |
Fertility by Age by Marriage Status in Morrison
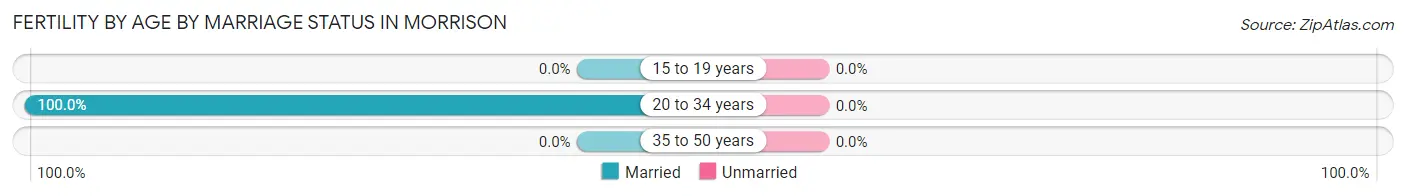
| Age Bracket | Married | Unmarried |
| 15 to 19 years | 0 (0.0%) | 0 (0.0%) |
| 20 to 34 years | 3 (100.0%) | 0 (0.0%) |
| 35 to 50 years | 0 (0.0%) | 0 (0.0%) |
| Total | 3 (100.0%) | 0 (0.0%) |
Fertility by Education in Morrison
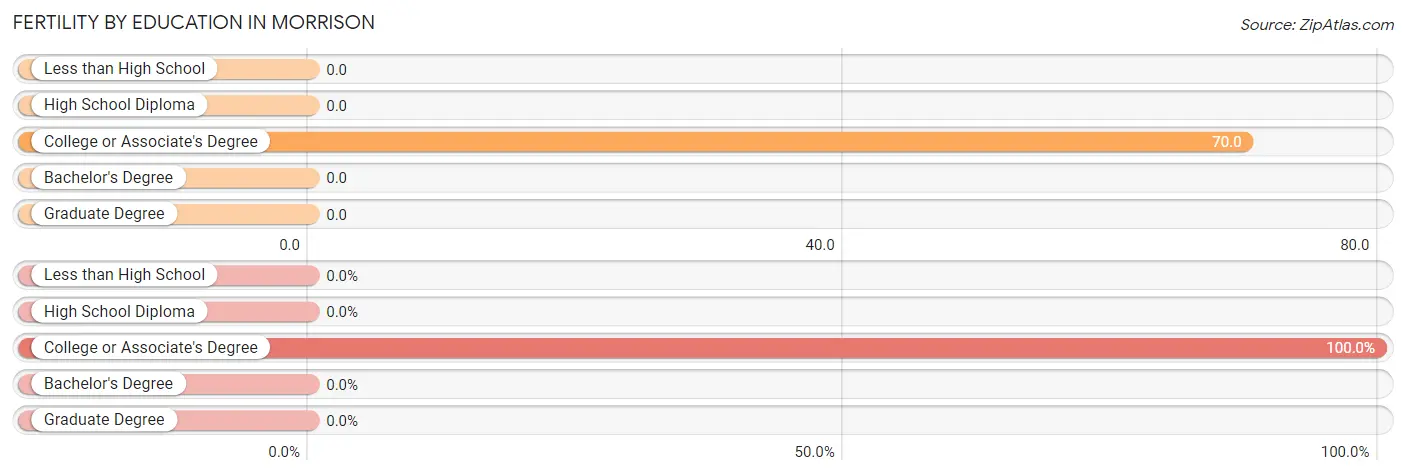
| Educational Attainment | Women with Births | Births / 1,000 Women |
| Less than High School | 0 (0.0%) | 0.0 |
| High School Diploma | 0 (0.0%) | 0.0 |
| College or Associate's Degree | 3 (100.0%) | 70.0 |
| Bachelor's Degree | 0 (0.0%) | 0.0 |
| Graduate Degree | 0 (0.0%) | 0.0 |
| Total | 3 (100.0%) | 21.0 |
Fertility by Education by Marriage Status in Morrison
| Educational Attainment | Married | Unmarried |
| Less than High School | 0 (0.0%) | 0 (0.0%) |
| High School Diploma | 0 (0.0%) | 0 (0.0%) |
| College or Associate's Degree | 3 (100.0%) | 0 (0.0%) |
| Bachelor's Degree | 0 (0.0%) | 0 (0.0%) |
| Graduate Degree | 0 (0.0%) | 0 (0.0%) |
| Total | 3 (100.0%) | 0 (0.0%) |
Employment Characteristics in Morrison
Employment by Class of Employer in Morrison
Among the 281 employed individuals in Morrison, private company employees (240 | 85.4%), local government employees (16 | 5.7%), and self-employed (not incorporated) (10 | 3.6%) make up the most common classes of employment.
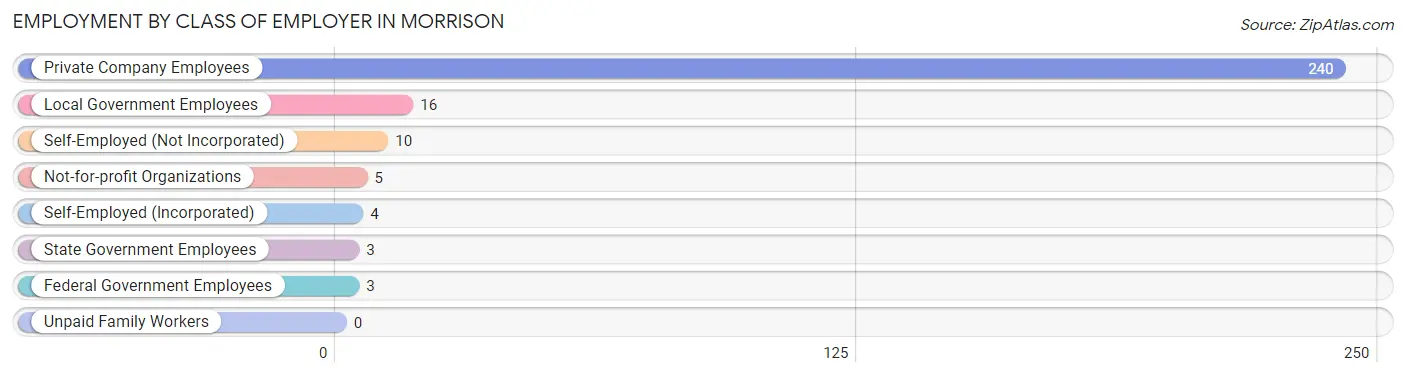
| Employer Class | # Employees | % Employees |
| Private Company Employees | 240 | 85.4% |
| Self-Employed (Incorporated) | 4 | 1.4% |
| Self-Employed (Not Incorporated) | 10 | 3.6% |
| Not-for-profit Organizations | 5 | 1.8% |
| Local Government Employees | 16 | 5.7% |
| State Government Employees | 3 | 1.1% |
| Federal Government Employees | 3 | 1.1% |
| Unpaid Family Workers | 0 | 0.0% |
| Total | 281 | 100.0% |
Employment Status by Age in Morrison
According to the labor force statistics for Morrison, out of the total population over 16 years of age (534), 56.2% or 300 individuals are in the labor force, with 5.7% or 17 of them unemployed. The age group with the highest labor force participation rate is 16 to 19 years, with 100.0% or 22 individuals in the labor force. Within the labor force, the 55 to 59 years age range has the highest percentage of unemployed individuals, with 75.0% or 6 of them being unemployed.
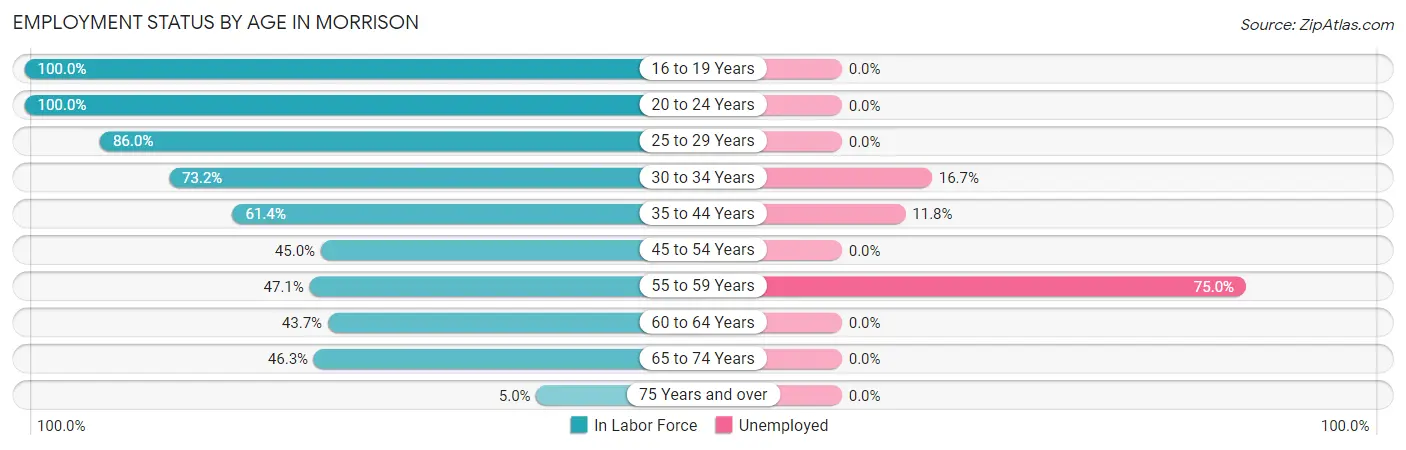
| Age Bracket | In Labor Force | Unemployed |
| 16 to 19 Years | 22 (100.0%) | 0 (0.0%) |
| 20 to 24 Years | 38 (100.0%) | 0 (0.0%) |
| 25 to 29 Years | 37 (86.0%) | 0 (0.0%) |
| 30 to 34 Years | 30 (73.2%) | 5 (16.7%) |
| 35 to 44 Years | 51 (61.4%) | 6 (11.8%) |
| 45 to 54 Years | 49 (45.0%) | 0 (0.0%) |
| 55 to 59 Years | 8 (47.1%) | 6 (75.0%) |
| 60 to 64 Years | 38 (43.7%) | 0 (0.0%) |
| 65 to 74 Years | 25 (46.3%) | 0 (0.0%) |
| 75 Years and over | 2 (5.0%) | 0 (0.0%) |
| Total | 300 (56.2%) | 17 (5.7%) |
Employment Status by Educational Attainment in Morrison
According to labor force statistics for Morrison, 56.1% of individuals (213) out of the total population between 25 and 64 years of age (380) are in the labor force, with 8.0% or 17 of them being unemployed. The group with the highest labor force participation rate are those with the educational attainment of bachelor's degree or higher, with 100.0% or 22 individuals in the labor force. Within the labor force, individuals with college / associate degree education have the highest percentage of unemployment, with 14.0% or 6 of them being unemployed.
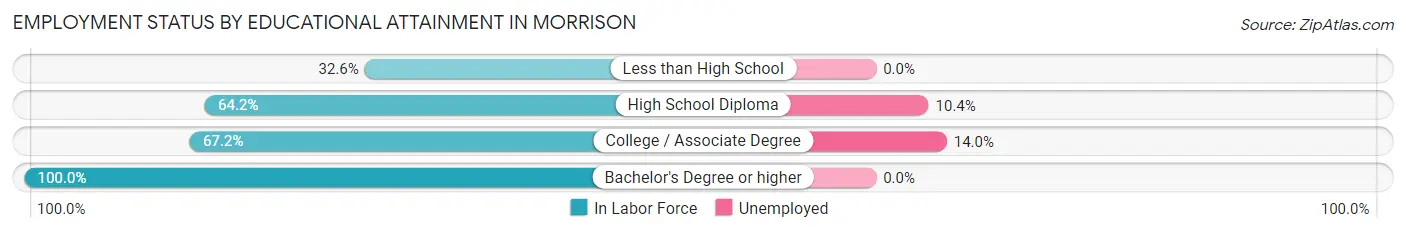
| Educational Attainment | In Labor Force | Unemployed |
| Less than High School | 42 (32.6%) | 0 (0.0%) |
| High School Diploma | 106 (64.2%) | 17 (10.4%) |
| College / Associate Degree | 43 (67.2%) | 9 (14.0%) |
| Bachelor's Degree or higher | 22 (100.0%) | 0 (0.0%) |
| Total | 213 (56.1%) | 30 (8.0%) |
Employment Occupations by Sex in Morrison
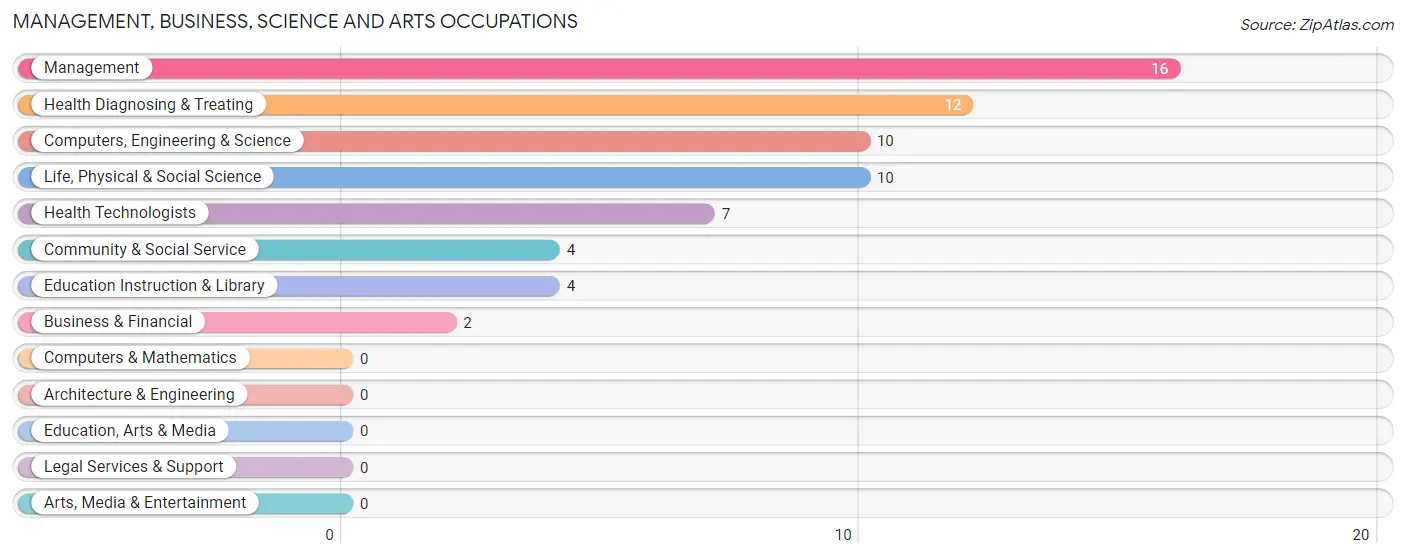
Management, Business, Science and Arts Occupations
The most common Management, Business, Science and Arts occupations in Morrison are Management (16 | 5.7%), Health Diagnosing & Treating (12 | 4.2%), Computers, Engineering & Science (10 | 3.5%), Life, Physical & Social Science (10 | 3.5%), and Health Technologists (7 | 2.5%).
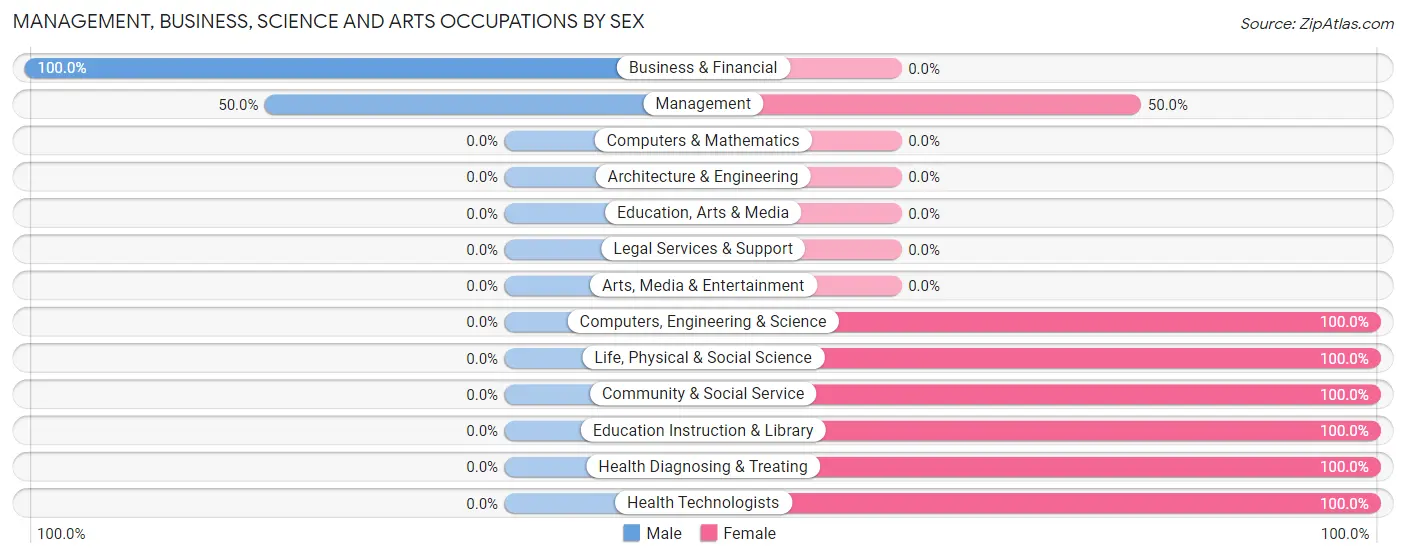
Management, Business, Science and Arts Occupations by Sex
Within the Management, Business, Science and Arts occupations in Morrison, the most male-oriented occupations are Business & Financial (100.0%), and Management (50.0%), while the most female-oriented occupations are Computers, Engineering & Science (100.0%), Life, Physical & Social Science (100.0%), and Community & Social Service (100.0%).
| Occupation | Male | Female |
| Management | 8 (50.0%) | 8 (50.0%) |
| Business & Financial | 2 (100.0%) | 0 (0.0%) |
| Computers, Engineering & Science | 0 (0.0%) | 10 (100.0%) |
| Computers & Mathematics | 0 (0.0%) | 0 (0.0%) |
| Architecture & Engineering | 0 (0.0%) | 0 (0.0%) |
| Life, Physical & Social Science | 0 (0.0%) | 10 (100.0%) |
| Community & Social Service | 0 (0.0%) | 4 (100.0%) |
| Education, Arts & Media | 0 (0.0%) | 0 (0.0%) |
| Legal Services & Support | 0 (0.0%) | 0 (0.0%) |
| Education Instruction & Library | 0 (0.0%) | 4 (100.0%) |
| Arts, Media & Entertainment | 0 (0.0%) | 0 (0.0%) |
| Health Diagnosing & Treating | 0 (0.0%) | 12 (100.0%) |
| Health Technologists | 0 (0.0%) | 7 (100.0%) |
| Total (Category) | 10 (22.7%) | 34 (77.3%) |
| Total (Overall) | 165 (58.3%) | 118 (41.7%) |
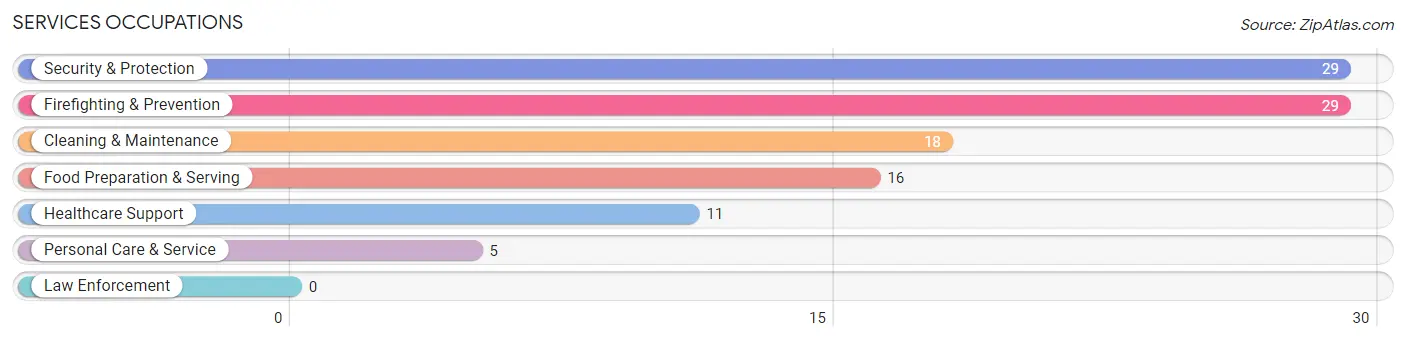
Services Occupations
The most common Services occupations in Morrison are Security & Protection (29 | 10.2%), Firefighting & Prevention (29 | 10.2%), Cleaning & Maintenance (18 | 6.4%), Food Preparation & Serving (16 | 5.7%), and Healthcare Support (11 | 3.9%).
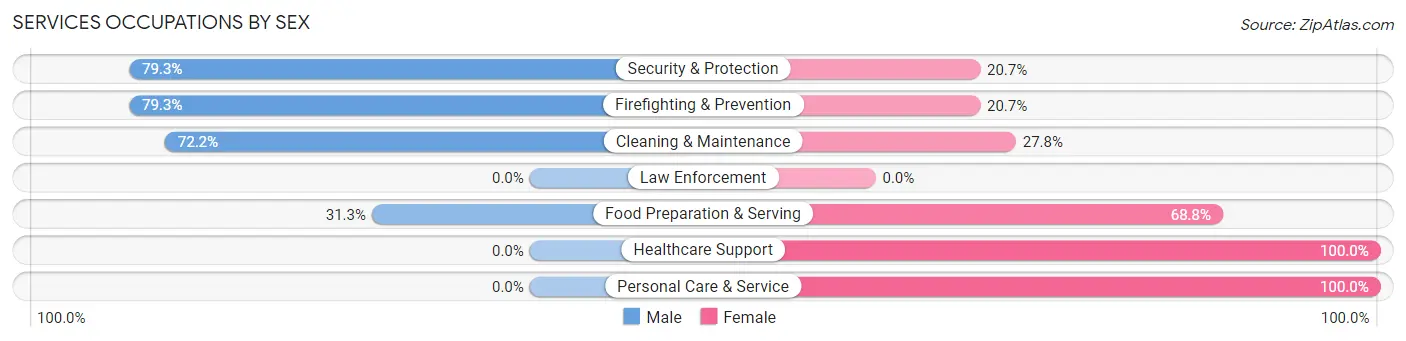
Services Occupations by Sex
Within the Services occupations in Morrison, the most male-oriented occupations are Security & Protection (79.3%), Firefighting & Prevention (79.3%), and Cleaning & Maintenance (72.2%), while the most female-oriented occupations are Healthcare Support (100.0%), Personal Care & Service (100.0%), and Food Preparation & Serving (68.8%).
| Occupation | Male | Female |
| Healthcare Support | 0 (0.0%) | 11 (100.0%) |
| Security & Protection | 23 (79.3%) | 6 (20.7%) |
| Firefighting & Prevention | 23 (79.3%) | 6 (20.7%) |
| Law Enforcement | 0 (0.0%) | 0 (0.0%) |
| Food Preparation & Serving | 5 (31.2%) | 11 (68.8%) |
| Cleaning & Maintenance | 13 (72.2%) | 5 (27.8%) |
| Personal Care & Service | 0 (0.0%) | 5 (100.0%) |
| Total (Category) | 41 (51.9%) | 38 (48.1%) |
| Total (Overall) | 165 (58.3%) | 118 (41.7%) |
Sales and Office Occupations
The most common Sales and Office occupations in Morrison are Office & Administration (19 | 6.7%), and Sales & Related (10 | 3.5%).
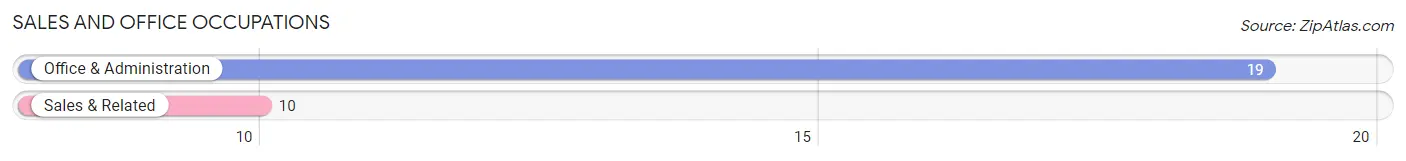
Sales and Office Occupations by Sex
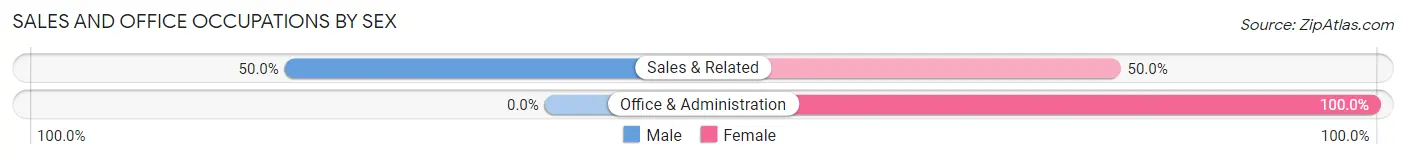
| Occupation | Male | Female |
| Sales & Related | 5 (50.0%) | 5 (50.0%) |
| Office & Administration | 0 (0.0%) | 19 (100.0%) |
| Total (Category) | 5 (17.2%) | 24 (82.8%) |
| Total (Overall) | 165 (58.3%) | 118 (41.7%) |
Natural Resources, Construction and Maintenance Occupations
The most common Natural Resources, Construction and Maintenance occupations in Morrison are Construction & Extraction (8 | 2.8%), Installation, Maintenance & Repair (8 | 2.8%), and Farming, Fishing & Forestry (6 | 2.1%).
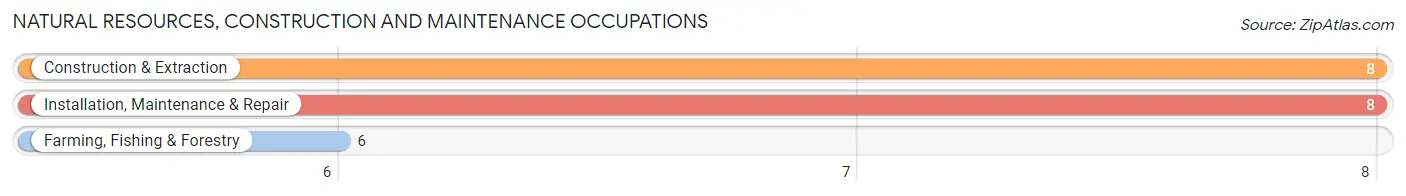
Natural Resources, Construction and Maintenance Occupations by Sex
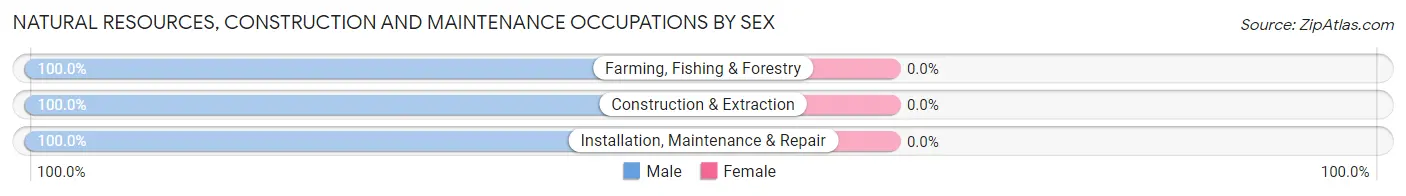
| Occupation | Male | Female |
| Farming, Fishing & Forestry | 6 (100.0%) | 0 (0.0%) |
| Construction & Extraction | 8 (100.0%) | 0 (0.0%) |
| Installation, Maintenance & Repair | 8 (100.0%) | 0 (0.0%) |
| Total (Category) | 22 (100.0%) | 0 (0.0%) |
| Total (Overall) | 165 (58.3%) | 118 (41.7%) |
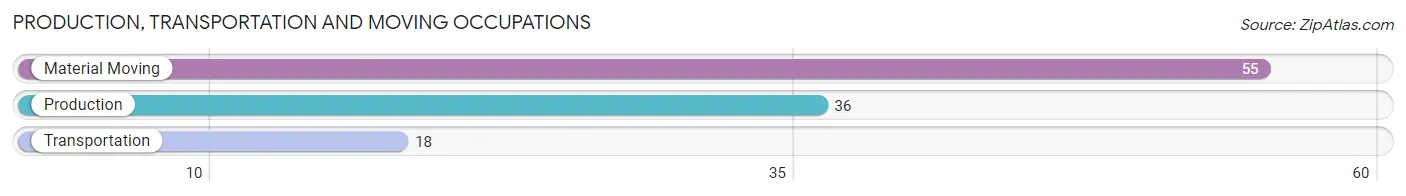
Production, Transportation and Moving Occupations
The most common Production, Transportation and Moving occupations in Morrison are Material Moving (55 | 19.4%), Production (36 | 12.7%), and Transportation (18 | 6.4%).
Production, Transportation and Moving Occupations by Sex
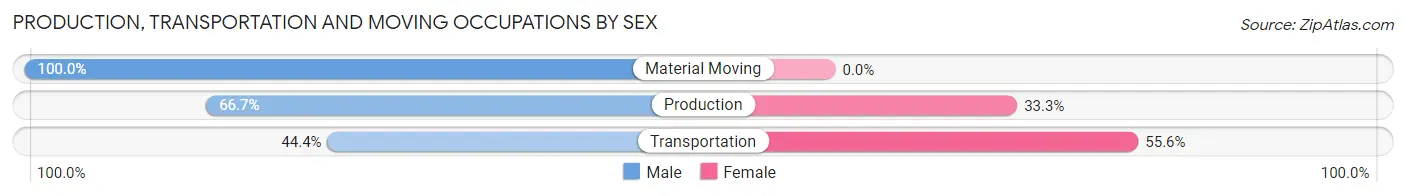
| Occupation | Male | Female |
| Production | 24 (66.7%) | 12 (33.3%) |
| Transportation | 8 (44.4%) | 10 (55.6%) |
| Material Moving | 55 (100.0%) | 0 (0.0%) |
| Total (Category) | 87 (79.8%) | 22 (20.2%) |
| Total (Overall) | 165 (58.3%) | 118 (41.7%) |
Employment Industries by Sex in Morrison
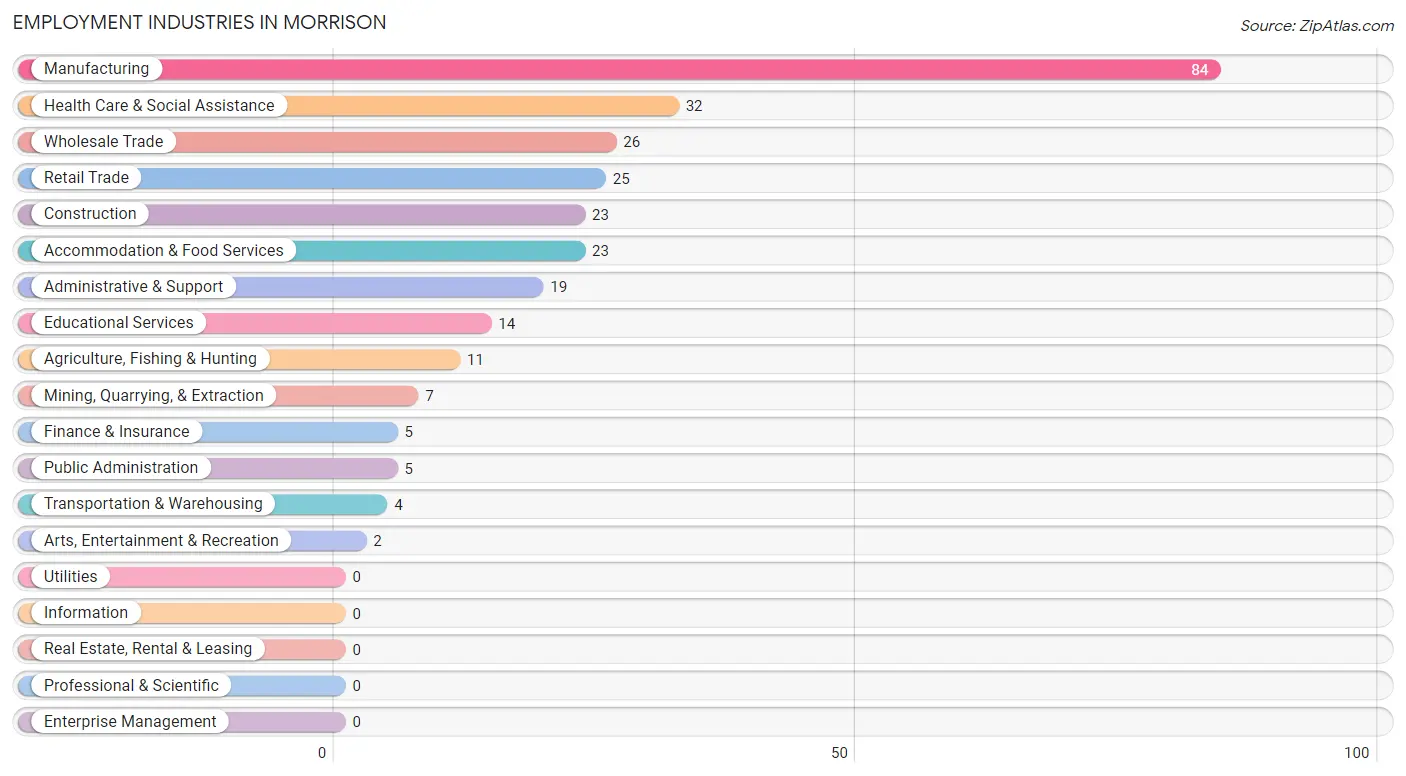
Employment Industries in Morrison
The major employment industries in Morrison include Manufacturing (84 | 29.7%), Health Care & Social Assistance (32 | 11.3%), Wholesale Trade (26 | 9.2%), Retail Trade (25 | 8.8%), and Construction (23 | 8.1%).
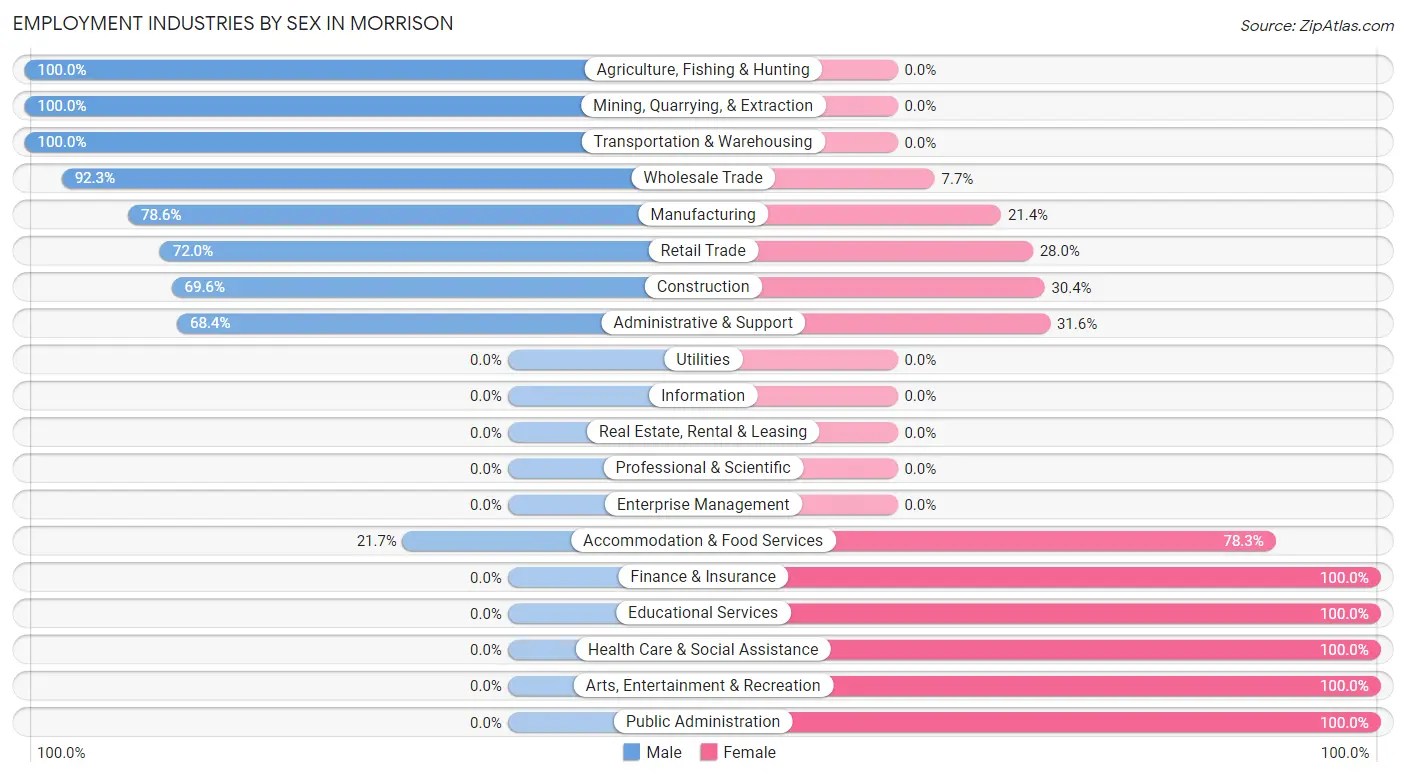
Employment Industries by Sex in Morrison
The Morrison industries that see more men than women are Agriculture, Fishing & Hunting (100.0%), Mining, Quarrying, & Extraction (100.0%), and Transportation & Warehousing (100.0%), whereas the industries that tend to have a higher number of women are Finance & Insurance (100.0%), Educational Services (100.0%), and Health Care & Social Assistance (100.0%).
| Industry | Male | Female |
| Agriculture, Fishing & Hunting | 11 (100.0%) | 0 (0.0%) |
| Mining, Quarrying, & Extraction | 7 (100.0%) | 0 (0.0%) |
| Construction | 16 (69.6%) | 7 (30.4%) |
| Manufacturing | 66 (78.6%) | 18 (21.4%) |
| Wholesale Trade | 24 (92.3%) | 2 (7.7%) |
| Retail Trade | 18 (72.0%) | 7 (28.0%) |
| Transportation & Warehousing | 4 (100.0%) | 0 (0.0%) |
| Utilities | 0 (0.0%) | 0 (0.0%) |
| Information | 0 (0.0%) | 0 (0.0%) |
| Finance & Insurance | 0 (0.0%) | 5 (100.0%) |
| Real Estate, Rental & Leasing | 0 (0.0%) | 0 (0.0%) |
| Professional & Scientific | 0 (0.0%) | 0 (0.0%) |
| Enterprise Management | 0 (0.0%) | 0 (0.0%) |
| Administrative & Support | 13 (68.4%) | 6 (31.6%) |
| Educational Services | 0 (0.0%) | 14 (100.0%) |
| Health Care & Social Assistance | 0 (0.0%) | 32 (100.0%) |
| Arts, Entertainment & Recreation | 0 (0.0%) | 2 (100.0%) |
| Accommodation & Food Services | 5 (21.7%) | 18 (78.3%) |
| Public Administration | 0 (0.0%) | 5 (100.0%) |
| Total | 165 (58.3%) | 118 (41.7%) |
Education in Morrison
School Enrollment in Morrison
The most common levels of schooling among the 179 students in Morrison are elementary school (62 | 34.6%), middle school (36 | 20.1%), and kindergarten (29 | 16.2%).
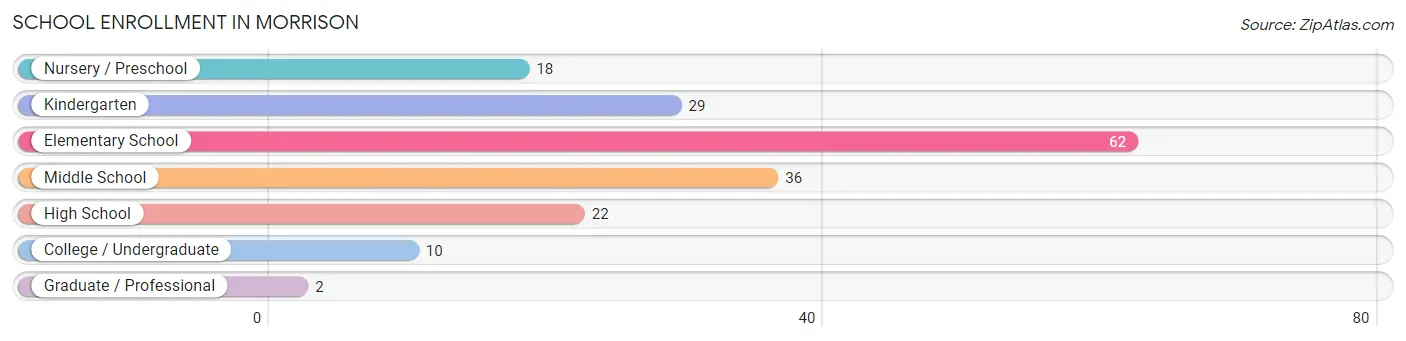
| School Level | # Students | % Students |
| Nursery / Preschool | 18 | 10.1% |
| Kindergarten | 29 | 16.2% |
| Elementary School | 62 | 34.6% |
| Middle School | 36 | 20.1% |
| High School | 22 | 12.3% |
| College / Undergraduate | 10 | 5.6% |
| Graduate / Professional | 2 | 1.1% |
| Total | 179 | 100.0% |
School Enrollment by Age by Funding Source in Morrison
Out of a total of 179 students who are enrolled in schools in Morrison, 2 (1.1%) attend a private institution, while the remaining 177 (98.9%) are enrolled in public schools. The age group of 35 years and over has the highest likelihood of being enrolled in private schools, with 2 (50.0% in the age bracket) enrolled. Conversely, the age group of 3 to 4 year olds has the lowest likelihood of being enrolled in a private school, with 26 (100.0% in the age bracket) attending a public institution.
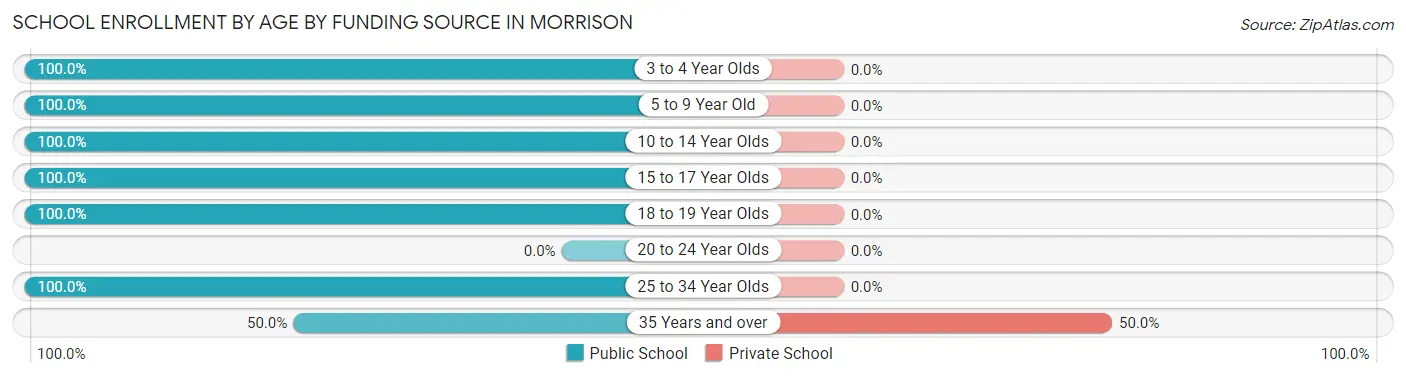
| Age Bracket | Public School | Private School |
| 3 to 4 Year Olds | 26 (100.0%) | 0 (0.0%) |
| 5 to 9 Year Old | 80 (100.0%) | 0 (0.0%) |
| 10 to 14 Year Olds | 46 (100.0%) | 0 (0.0%) |
| 15 to 17 Year Olds | 4 (100.0%) | 0 (0.0%) |
| 18 to 19 Year Olds | 16 (100.0%) | 0 (0.0%) |
| 20 to 24 Year Olds | 0 (0.0%) | 0 (0.0%) |
| 25 to 34 Year Olds | 3 (100.0%) | 0 (0.0%) |
| 35 Years and over | 2 (50.0%) | 2 (50.0%) |
| Total | 177 (98.9%) | 2 (1.1%) |
Educational Attainment by Field of Study in Morrison
Business (9 | 33.3%), bio, nature & agricultural (8 | 29.6%), education (4 | 14.8%), science & technology (2 | 7.4%), and liberal arts & history (2 | 7.4%) are the most common fields of study among 27 individuals in Morrison who have obtained a bachelor's degree or higher.
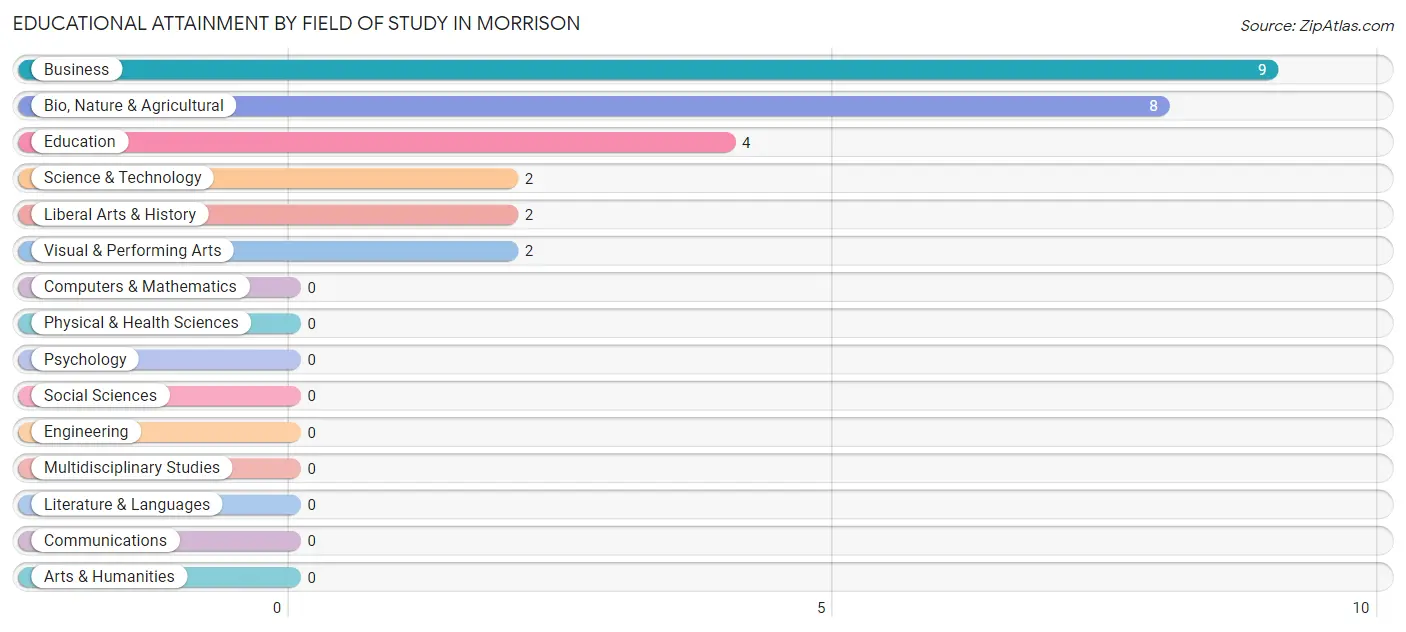
| Field of Study | # Graduates | % Graduates |
| Computers & Mathematics | 0 | 0.0% |
| Bio, Nature & Agricultural | 8 | 29.6% |
| Physical & Health Sciences | 0 | 0.0% |
| Psychology | 0 | 0.0% |
| Social Sciences | 0 | 0.0% |
| Engineering | 0 | 0.0% |
| Multidisciplinary Studies | 0 | 0.0% |
| Science & Technology | 2 | 7.4% |
| Business | 9 | 33.3% |
| Education | 4 | 14.8% |
| Literature & Languages | 0 | 0.0% |
| Liberal Arts & History | 2 | 7.4% |
| Visual & Performing Arts | 2 | 7.4% |
| Communications | 0 | 0.0% |
| Arts & Humanities | 0 | 0.0% |
| Total | 27 | 100.0% |
Transportation & Commute in Morrison
Vehicle Availability by Sex in Morrison
The most prevalent vehicle ownership categories in Morrison are males with 2 vehicles (85, accounting for 51.5%) and females with 2 vehicles (30, making up 73.3%).
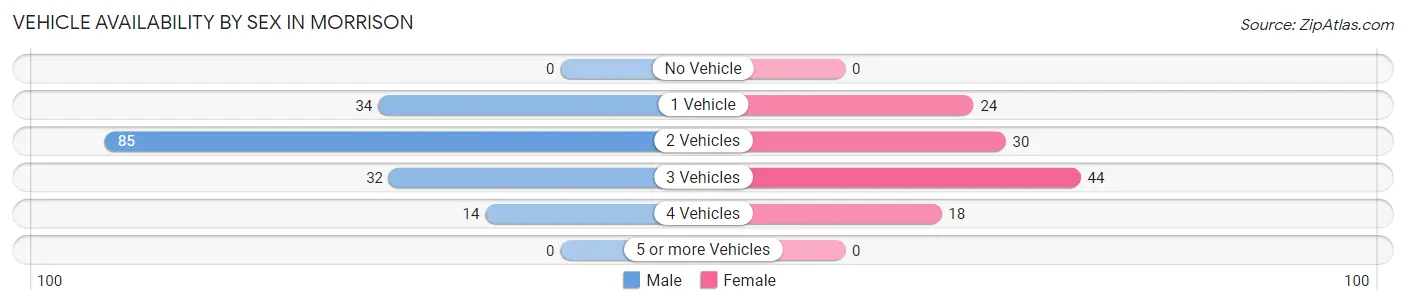
| Vehicles Available | Male | Female |
| No Vehicle | 0 (0.0%) | 0 (0.0%) |
| 1 Vehicle | 34 (20.6%) | 24 (20.7%) |
| 2 Vehicles | 85 (51.5%) | 30 (25.9%) |
| 3 Vehicles | 32 (19.4%) | 44 (37.9%) |
| 4 Vehicles | 14 (8.5%) | 18 (15.5%) |
| 5 or more Vehicles | 0 (0.0%) | 0 (0.0%) |
| Total | 165 (100.0%) | 116 (100.0%) |
Commute Time in Morrison
The most frequently occuring commute durations in Morrison are 30 to 34 minutes (75 commuters, 27.0%), 15 to 19 minutes (48 commuters, 17.3%), and 20 to 24 minutes (40 commuters, 14.4%).
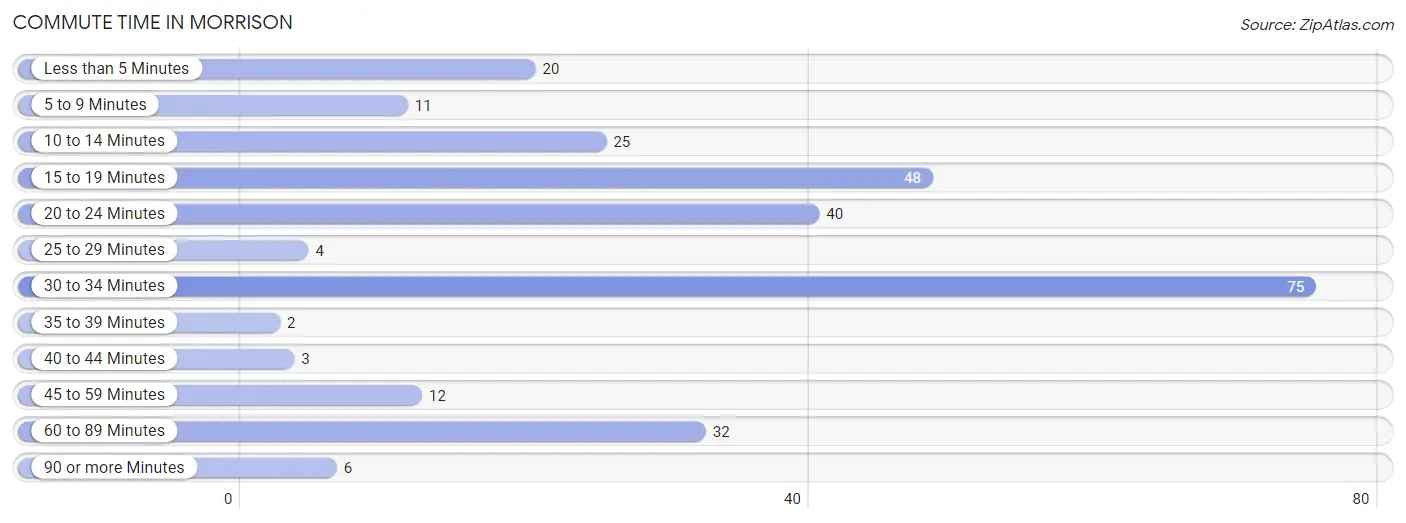
| Commute Time | # Commuters | % Commuters |
| Less than 5 Minutes | 20 | 7.2% |
| 5 to 9 Minutes | 11 | 4.0% |
| 10 to 14 Minutes | 25 | 9.0% |
| 15 to 19 Minutes | 48 | 17.3% |
| 20 to 24 Minutes | 40 | 14.4% |
| 25 to 29 Minutes | 4 | 1.4% |
| 30 to 34 Minutes | 75 | 27.0% |
| 35 to 39 Minutes | 2 | 0.7% |
| 40 to 44 Minutes | 3 | 1.1% |
| 45 to 59 Minutes | 12 | 4.3% |
| 60 to 89 Minutes | 32 | 11.5% |
| 90 or more Minutes | 6 | 2.2% |
Commute Time by Sex in Morrison
The most common commute times in Morrison are 30 to 34 minutes (57 commuters, 34.5%) for males and 20 to 24 minutes (33 commuters, 29.2%) for females.
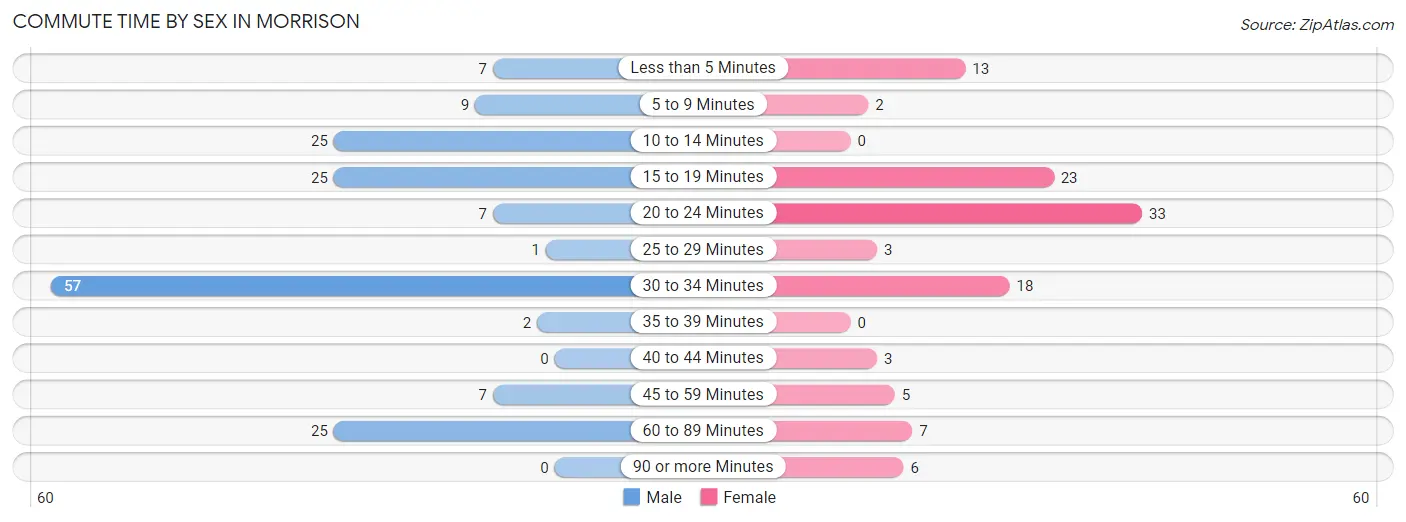
| Commute Time | Male | Female |
| Less than 5 Minutes | 7 (4.2%) | 13 (11.5%) |
| 5 to 9 Minutes | 9 (5.4%) | 2 (1.8%) |
| 10 to 14 Minutes | 25 (15.1%) | 0 (0.0%) |
| 15 to 19 Minutes | 25 (15.1%) | 23 (20.3%) |
| 20 to 24 Minutes | 7 (4.2%) | 33 (29.2%) |
| 25 to 29 Minutes | 1 (0.6%) | 3 (2.6%) |
| 30 to 34 Minutes | 57 (34.5%) | 18 (15.9%) |
| 35 to 39 Minutes | 2 (1.2%) | 0 (0.0%) |
| 40 to 44 Minutes | 0 (0.0%) | 3 (2.6%) |
| 45 to 59 Minutes | 7 (4.2%) | 5 (4.4%) |
| 60 to 89 Minutes | 25 (15.1%) | 7 (6.2%) |
| 90 or more Minutes | 0 (0.0%) | 6 (5.3%) |
Time of Departure to Work by Sex in Morrison
The most frequent times of departure to work in Morrison are 6:30 AM to 6:59 AM (61, 37.0%) for males and 5:30 AM to 5:59 AM (31, 27.4%) for females.
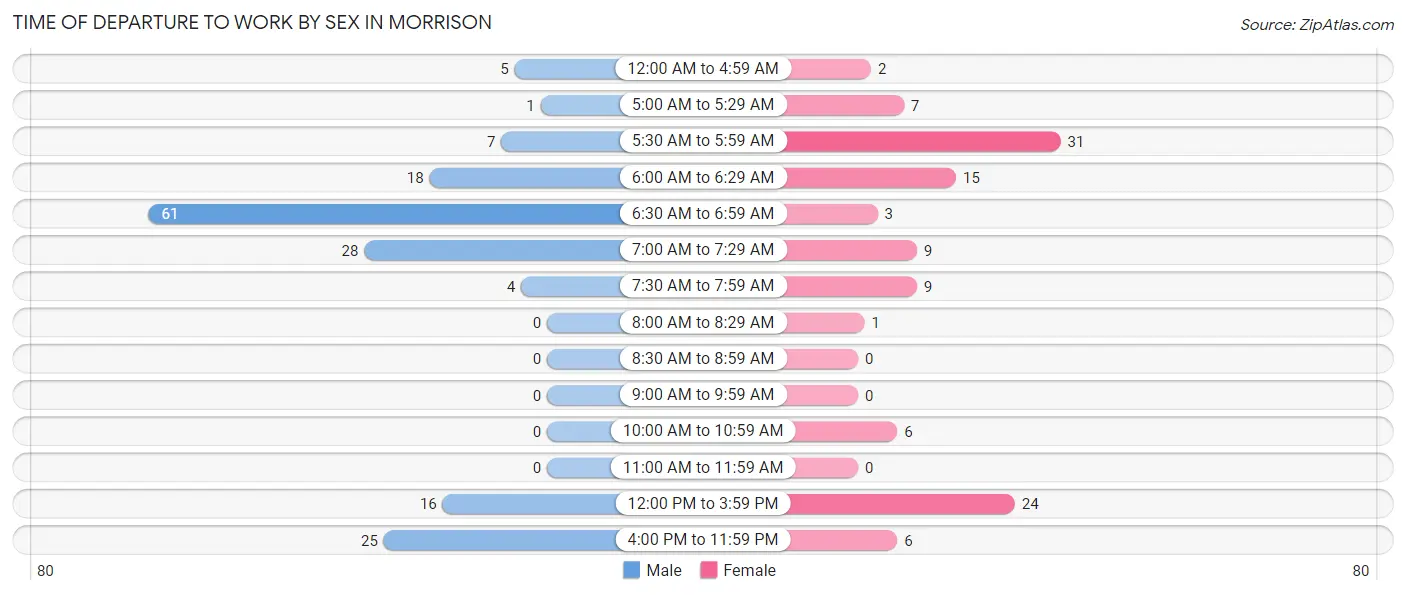
| Time of Departure | Male | Female |
| 12:00 AM to 4:59 AM | 5 (3.0%) | 2 (1.8%) |
| 5:00 AM to 5:29 AM | 1 (0.6%) | 7 (6.2%) |
| 5:30 AM to 5:59 AM | 7 (4.2%) | 31 (27.4%) |
| 6:00 AM to 6:29 AM | 18 (10.9%) | 15 (13.3%) |
| 6:30 AM to 6:59 AM | 61 (37.0%) | 3 (2.6%) |
| 7:00 AM to 7:29 AM | 28 (17.0%) | 9 (8.0%) |
| 7:30 AM to 7:59 AM | 4 (2.4%) | 9 (8.0%) |
| 8:00 AM to 8:29 AM | 0 (0.0%) | 1 (0.9%) |
| 8:30 AM to 8:59 AM | 0 (0.0%) | 0 (0.0%) |
| 9:00 AM to 9:59 AM | 0 (0.0%) | 0 (0.0%) |
| 10:00 AM to 10:59 AM | 0 (0.0%) | 6 (5.3%) |
| 11:00 AM to 11:59 AM | 0 (0.0%) | 0 (0.0%) |
| 12:00 PM to 3:59 PM | 16 (9.7%) | 24 (21.2%) |
| 4:00 PM to 11:59 PM | 25 (15.1%) | 6 (5.3%) |
| Total | 165 (100.0%) | 113 (100.0%) |
Housing Occupancy in Morrison
Occupancy by Ownership in Morrison
Of the total 260 dwellings in Morrison, owner-occupied units account for 104 (40.0%), while renter-occupied units make up 156 (60.0%).
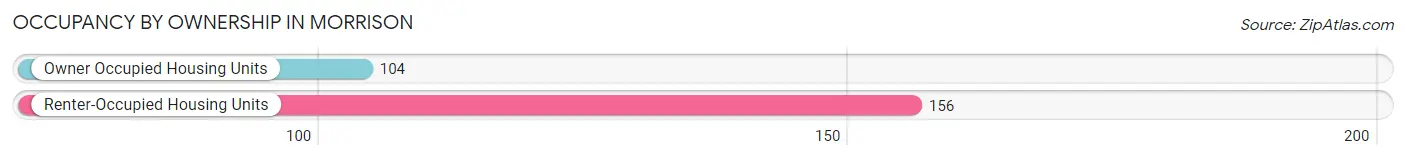
| Occupancy | # Housing Units | % Housing Units |
| Owner Occupied Housing Units | 104 | 40.0% |
| Renter-Occupied Housing Units | 156 | 60.0% |
| Total Occupied Housing Units | 260 | 100.0% |
Occupancy by Household Size in Morrison
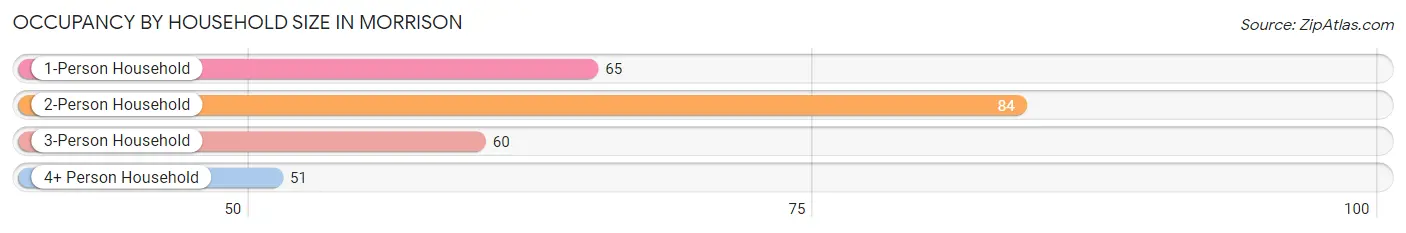
| Household Size | # Housing Units | % Housing Units |
| 1-Person Household | 65 | 25.0% |
| 2-Person Household | 84 | 32.3% |
| 3-Person Household | 60 | 23.1% |
| 4+ Person Household | 51 | 19.6% |
| Total Housing Units | 260 | 100.0% |
Occupancy by Ownership by Household Size in Morrison
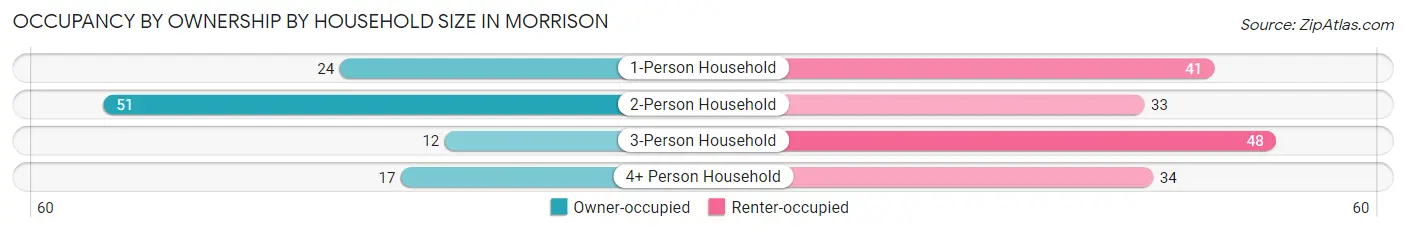
| Household Size | Owner-occupied | Renter-occupied |
| 1-Person Household | 24 (36.9%) | 41 (63.1%) |
| 2-Person Household | 51 (60.7%) | 33 (39.3%) |
| 3-Person Household | 12 (20.0%) | 48 (80.0%) |
| 4+ Person Household | 17 (33.3%) | 34 (66.7%) |
| Total Housing Units | 104 (40.0%) | 156 (60.0%) |
Occupancy by Educational Attainment in Morrison
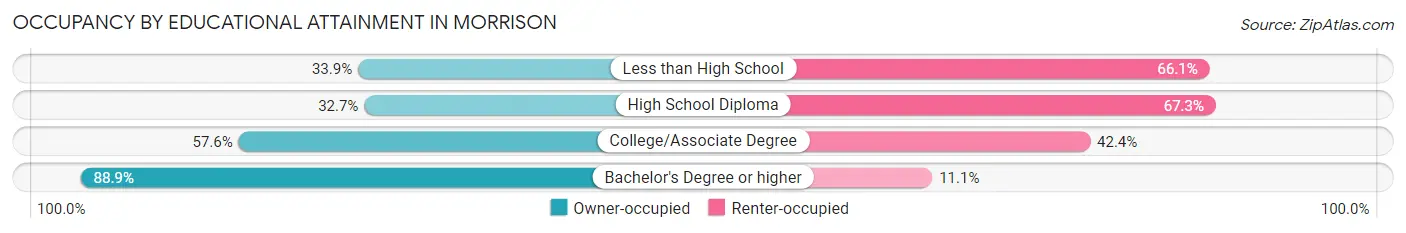
| Household Size | Owner-occupied | Renter-occupied |
| Less than High School | 20 (33.9%) | 39 (66.1%) |
| High School Diploma | 49 (32.7%) | 101 (67.3%) |
| College/Associate Degree | 19 (57.6%) | 14 (42.4%) |
| Bachelor's Degree or higher | 16 (88.9%) | 2 (11.1%) |
Occupancy by Age of Householder in Morrison
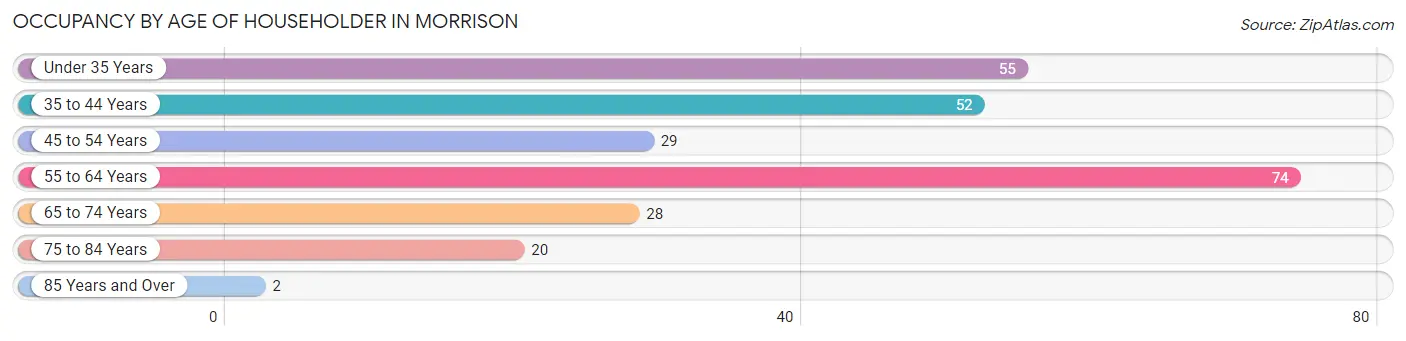
| Age Bracket | # Households | % Households |
| Under 35 Years | 55 | 21.1% |
| 35 to 44 Years | 52 | 20.0% |
| 45 to 54 Years | 29 | 11.2% |
| 55 to 64 Years | 74 | 28.5% |
| 65 to 74 Years | 28 | 10.8% |
| 75 to 84 Years | 20 | 7.7% |
| 85 Years and Over | 2 | 0.8% |
| Total | 260 | 100.0% |
Housing Finances in Morrison
Median Income by Occupancy in Morrison
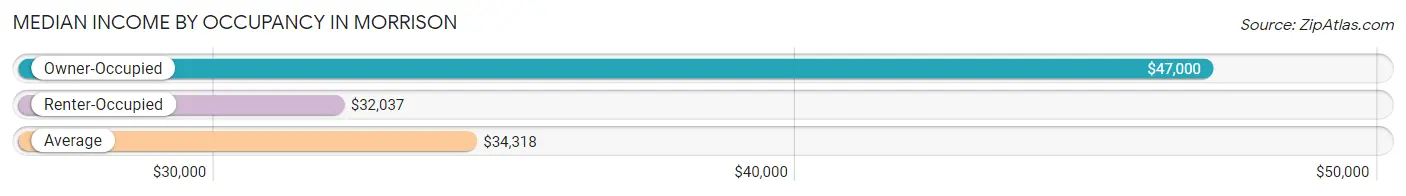
| Occupancy Type | # Households | Median Income |
| Owner-Occupied | 104 (40.0%) | $47,000 |
| Renter-Occupied | 156 (60.0%) | $32,037 |
| Average | 260 (100.0%) | $34,318 |
Occupancy by Householder Income Bracket in Morrison
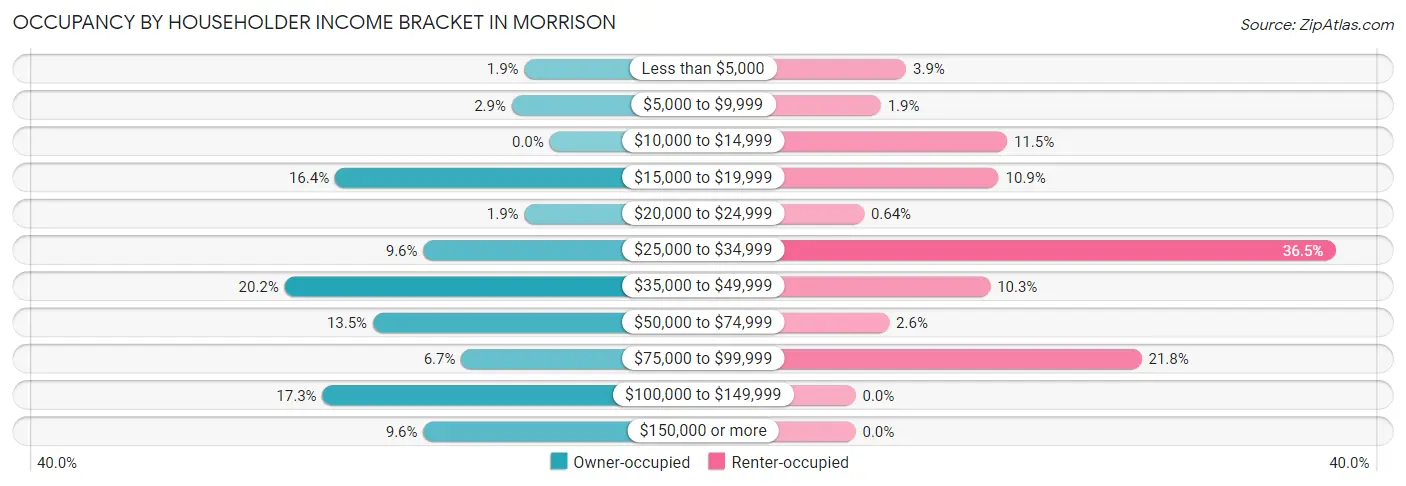
| Income Bracket | Owner-occupied | Renter-occupied |
| Less than $5,000 | 2 (1.9%) | 6 (3.8%) |
| $5,000 to $9,999 | 3 (2.9%) | 3 (1.9%) |
| $10,000 to $14,999 | 0 (0.0%) | 18 (11.5%) |
| $15,000 to $19,999 | 17 (16.4%) | 17 (10.9%) |
| $20,000 to $24,999 | 2 (1.9%) | 1 (0.6%) |
| $25,000 to $34,999 | 10 (9.6%) | 57 (36.5%) |
| $35,000 to $49,999 | 21 (20.2%) | 16 (10.3%) |
| $50,000 to $74,999 | 14 (13.5%) | 4 (2.6%) |
| $75,000 to $99,999 | 7 (6.7%) | 34 (21.8%) |
| $100,000 to $149,999 | 18 (17.3%) | 0 (0.0%) |
| $150,000 or more | 10 (9.6%) | 0 (0.0%) |
| Total | 104 (100.0%) | 156 (100.0%) |
Monthly Housing Cost Tiers in Morrison
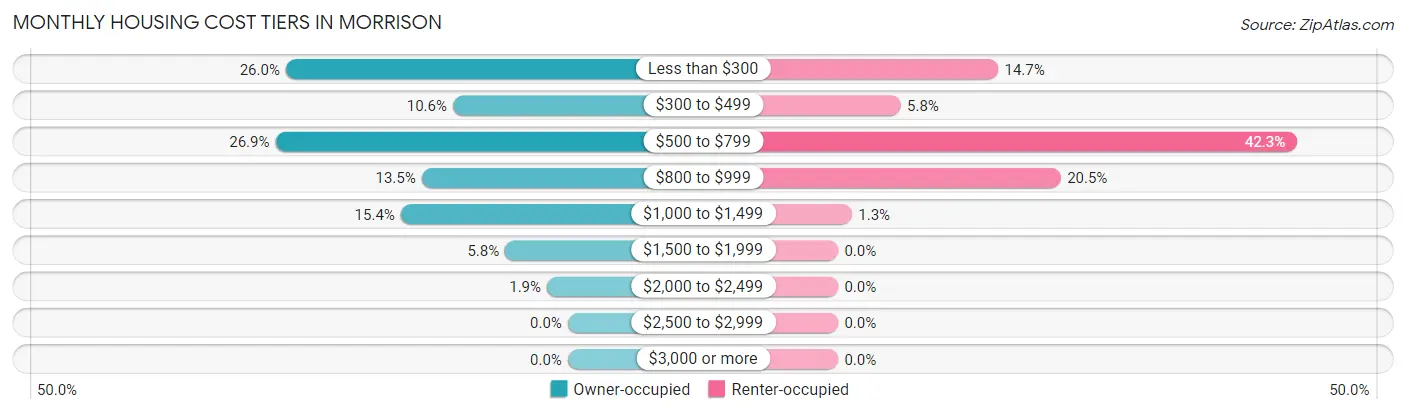
| Monthly Cost | Owner-occupied | Renter-occupied |
| Less than $300 | 27 (26.0%) | 23 (14.7%) |
| $300 to $499 | 11 (10.6%) | 9 (5.8%) |
| $500 to $799 | 28 (26.9%) | 66 (42.3%) |
| $800 to $999 | 14 (13.5%) | 32 (20.5%) |
| $1,000 to $1,499 | 16 (15.4%) | 2 (1.3%) |
| $1,500 to $1,999 | 6 (5.8%) | 0 (0.0%) |
| $2,000 to $2,499 | 2 (1.9%) | 0 (0.0%) |
| $2,500 to $2,999 | 0 (0.0%) | 0 (0.0%) |
| $3,000 or more | 0 (0.0%) | 0 (0.0%) |
| Total | 104 (100.0%) | 156 (100.0%) |
Physical Housing Characteristics in Morrison
Housing Structures in Morrison
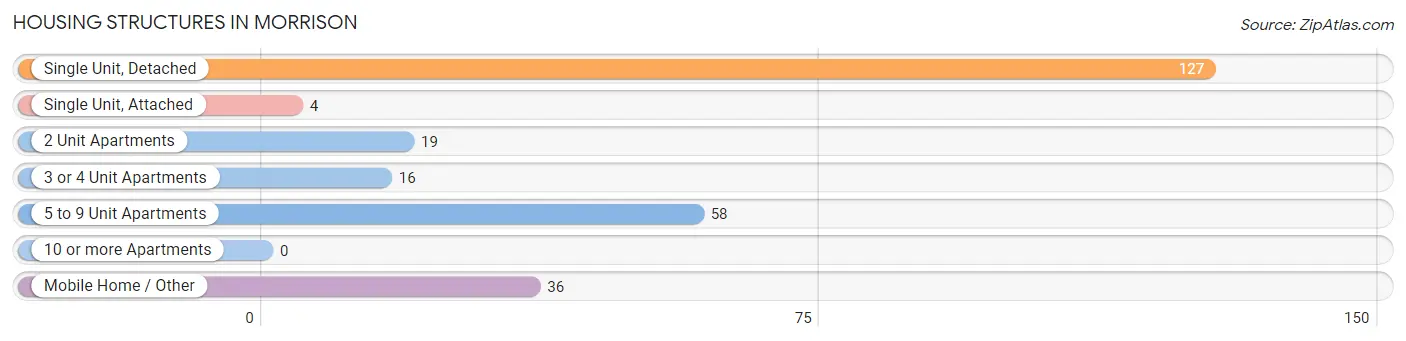
| Structure Type | # Housing Units | % Housing Units |
| Single Unit, Detached | 127 | 48.8% |
| Single Unit, Attached | 4 | 1.5% |
| 2 Unit Apartments | 19 | 7.3% |
| 3 or 4 Unit Apartments | 16 | 6.1% |
| 5 to 9 Unit Apartments | 58 | 22.3% |
| 10 or more Apartments | 0 | 0.0% |
| Mobile Home / Other | 36 | 13.9% |
| Total | 260 | 100.0% |
Housing Structures by Occupancy in Morrison
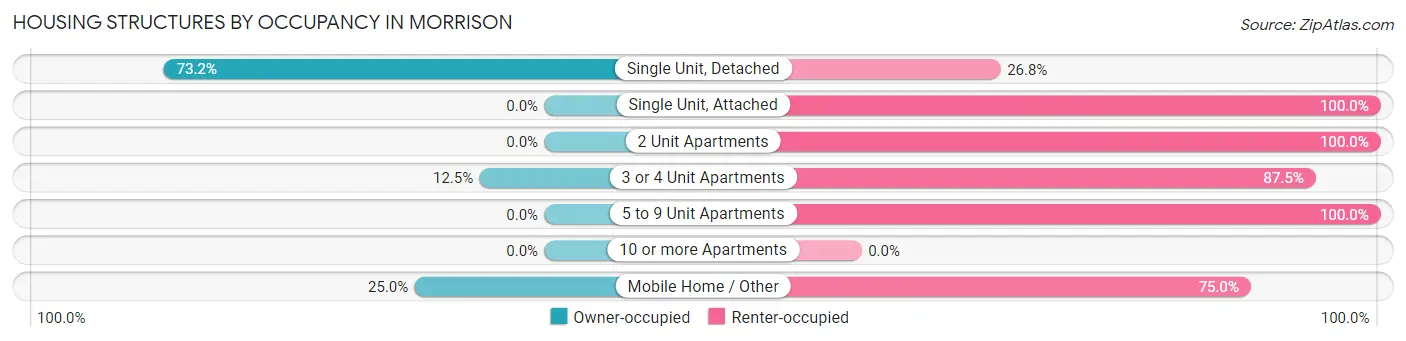
| Structure Type | Owner-occupied | Renter-occupied |
| Single Unit, Detached | 93 (73.2%) | 34 (26.8%) |
| Single Unit, Attached | 0 (0.0%) | 4 (100.0%) |
| 2 Unit Apartments | 0 (0.0%) | 19 (100.0%) |
| 3 or 4 Unit Apartments | 2 (12.5%) | 14 (87.5%) |
| 5 to 9 Unit Apartments | 0 (0.0%) | 58 (100.0%) |
| 10 or more Apartments | 0 (0.0%) | 0 (0.0%) |
| Mobile Home / Other | 9 (25.0%) | 27 (75.0%) |
| Total | 104 (40.0%) | 156 (60.0%) |
Housing Structures by Number of Rooms in Morrison
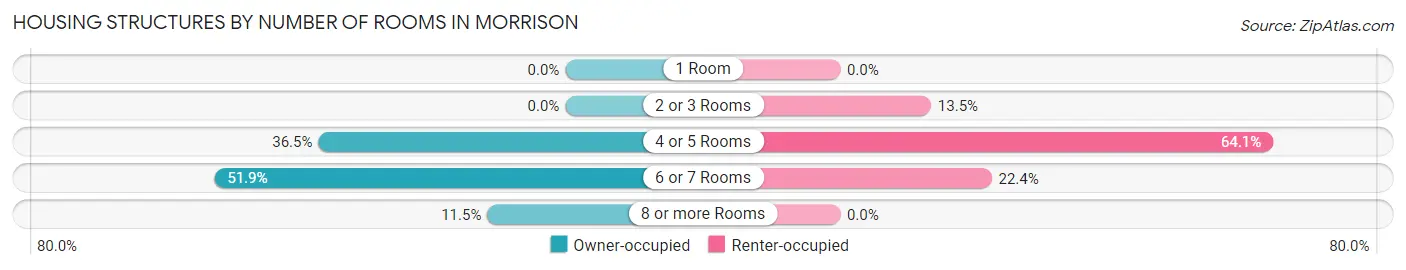
| Number of Rooms | Owner-occupied | Renter-occupied |
| 1 Room | 0 (0.0%) | 0 (0.0%) |
| 2 or 3 Rooms | 0 (0.0%) | 21 (13.5%) |
| 4 or 5 Rooms | 38 (36.5%) | 100 (64.1%) |
| 6 or 7 Rooms | 54 (51.9%) | 35 (22.4%) |
| 8 or more Rooms | 12 (11.5%) | 0 (0.0%) |
| Total | 104 (100.0%) | 156 (100.0%) |
Housing Structure by Heating Type in Morrison
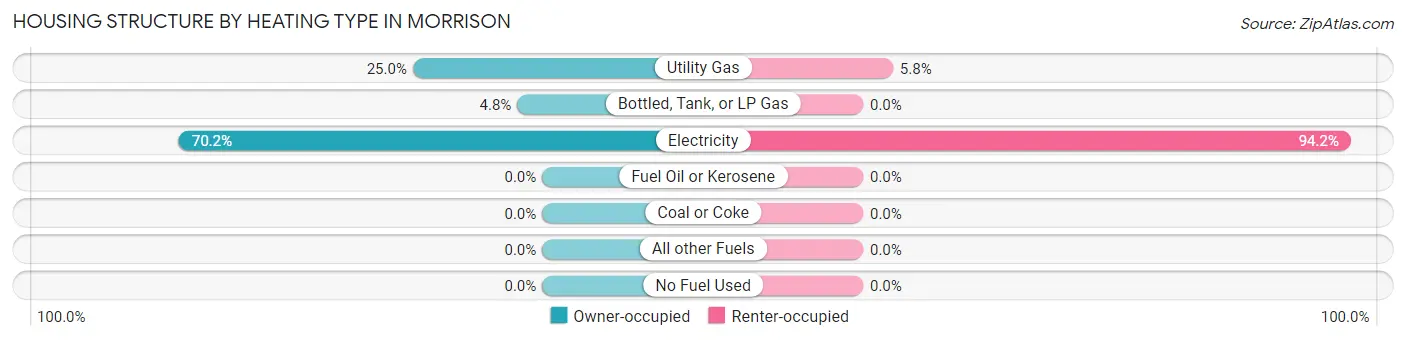
| Heating Type | Owner-occupied | Renter-occupied |
| Utility Gas | 26 (25.0%) | 9 (5.8%) |
| Bottled, Tank, or LP Gas | 5 (4.8%) | 0 (0.0%) |
| Electricity | 73 (70.2%) | 147 (94.2%) |
| Fuel Oil or Kerosene | 0 (0.0%) | 0 (0.0%) |
| Coal or Coke | 0 (0.0%) | 0 (0.0%) |
| All other Fuels | 0 (0.0%) | 0 (0.0%) |
| No Fuel Used | 0 (0.0%) | 0 (0.0%) |
| Total | 104 (100.0%) | 156 (100.0%) |
Household Vehicle Usage in Morrison
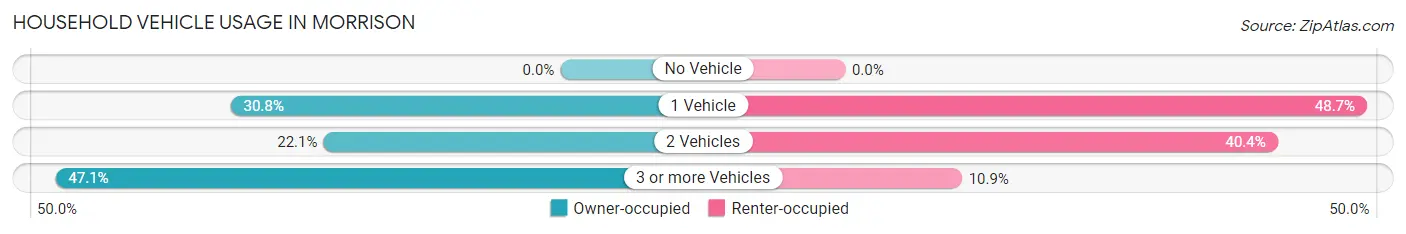
| Vehicles per Household | Owner-occupied | Renter-occupied |
| No Vehicle | 0 (0.0%) | 0 (0.0%) |
| 1 Vehicle | 32 (30.8%) | 76 (48.7%) |
| 2 Vehicles | 23 (22.1%) | 63 (40.4%) |
| 3 or more Vehicles | 49 (47.1%) | 17 (10.9%) |
| Total | 104 (100.0%) | 156 (100.0%) |
Real Estate & Mortgages in Morrison
Real Estate and Mortgage Overview in Morrison
| Characteristic | Without Mortgage | With Mortgage |
| Housing Units | 61 | 43 |
| Median Property Value | $120,500 | $114,800 |
| Median Household Income | $45,417 | $7 |
| Monthly Housing Costs | $388 | $0 |
| Real Estate Taxes | $571 | $0 |
Property Value by Mortgage Status in Morrison
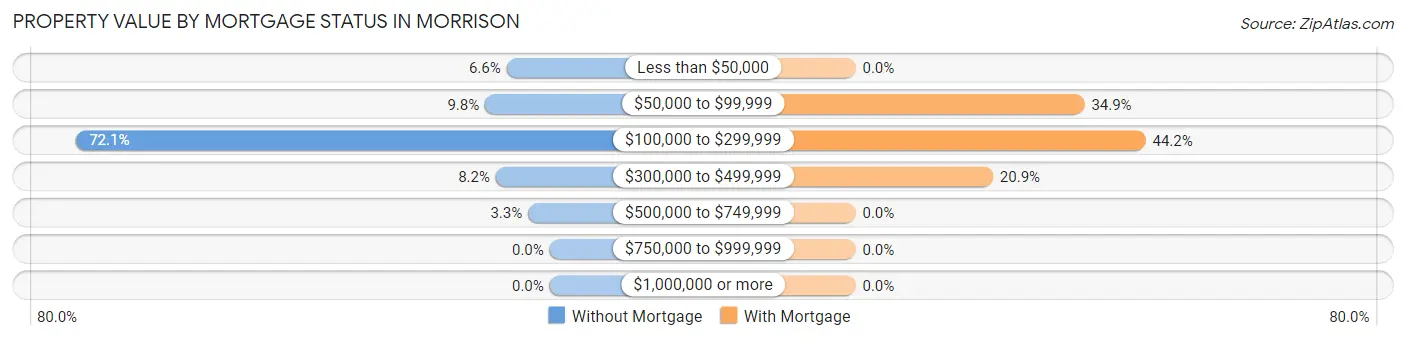
| Property Value | Without Mortgage | With Mortgage |
| Less than $50,000 | 4 (6.6%) | 0 (0.0%) |
| $50,000 to $99,999 | 6 (9.8%) | 15 (34.9%) |
| $100,000 to $299,999 | 44 (72.1%) | 19 (44.2%) |
| $300,000 to $499,999 | 5 (8.2%) | 9 (20.9%) |
| $500,000 to $749,999 | 2 (3.3%) | 0 (0.0%) |
| $750,000 to $999,999 | 0 (0.0%) | 0 (0.0%) |
| $1,000,000 or more | 0 (0.0%) | 0 (0.0%) |
| Total | 61 (100.0%) | 43 (100.0%) |
Household Income by Mortgage Status in Morrison
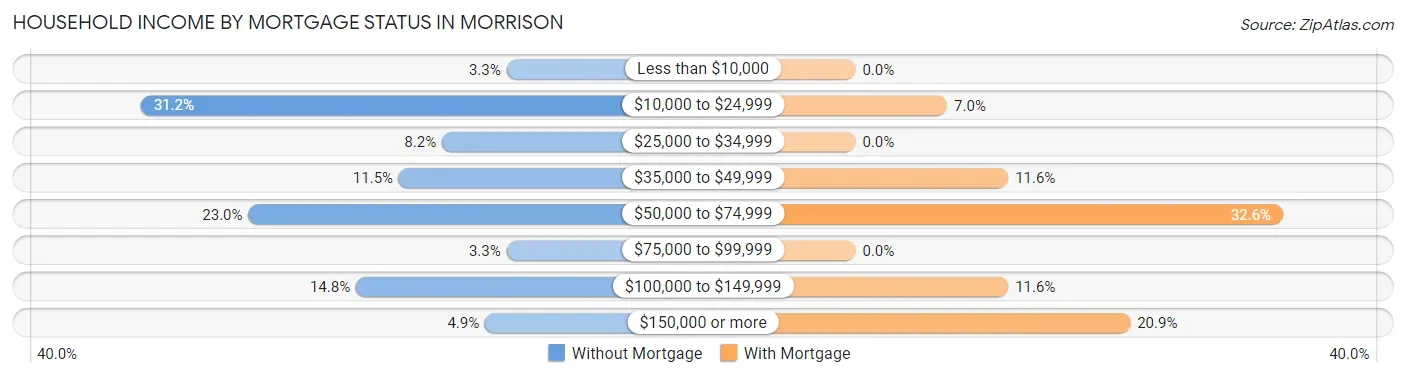
| Household Income | Without Mortgage | With Mortgage |
| Less than $10,000 | 2 (3.3%) | 0 (0.0%) |
| $10,000 to $24,999 | 19 (31.1%) | 3 (7.0%) |
| $25,000 to $34,999 | 5 (8.2%) | 0 (0.0%) |
| $35,000 to $49,999 | 7 (11.5%) | 5 (11.6%) |
| $50,000 to $74,999 | 14 (23.0%) | 14 (32.6%) |
| $75,000 to $99,999 | 2 (3.3%) | 0 (0.0%) |
| $100,000 to $149,999 | 9 (14.7%) | 5 (11.6%) |
| $150,000 or more | 3 (4.9%) | 9 (20.9%) |
| Total | 61 (100.0%) | 43 (100.0%) |
Property Value to Household Income Ratio in Morrison
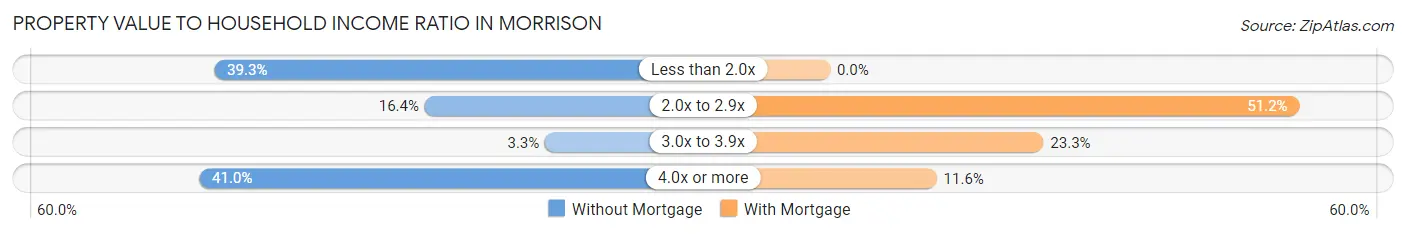
| Value-to-Income Ratio | Without Mortgage | With Mortgage |
| Less than 2.0x | 24 (39.3%) | 0 (0.0%) |
| 2.0x to 2.9x | 10 (16.4%) | 22 (51.2%) |
| 3.0x to 3.9x | 2 (3.3%) | 10 (23.3%) |
| 4.0x or more | 25 (41.0%) | 5 (11.6%) |
| Total | 61 (100.0%) | 43 (100.0%) |
Real Estate Taxes by Mortgage Status in Morrison
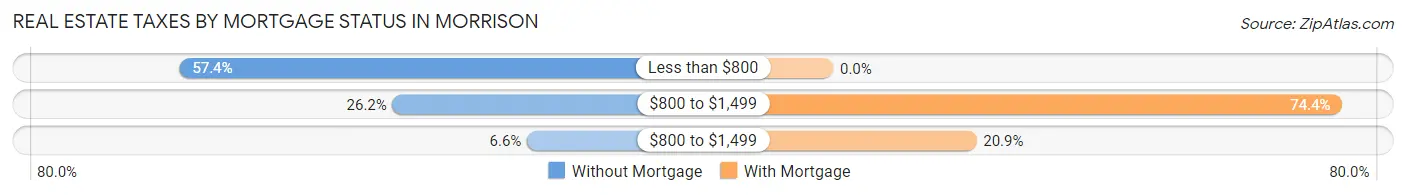
| Property Taxes | Without Mortgage | With Mortgage |
| Less than $800 | 35 (57.4%) | 0 (0.0%) |
| $800 to $1,499 | 16 (26.2%) | 32 (74.4%) |
| $800 to $1,499 | 4 (6.6%) | 9 (20.9%) |
| Total | 61 (100.0%) | 43 (100.0%) |
Health & Disability in Morrison
Health Insurance Coverage by Age in Morrison
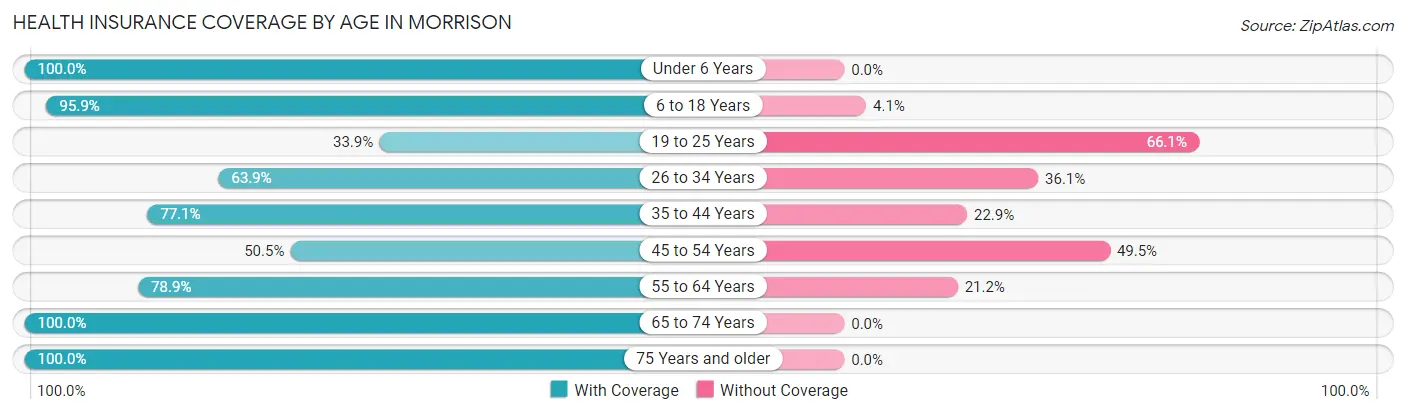
| Age Bracket | With Coverage | Without Coverage |
| Under 6 Years | 62 (100.0%) | 0 (0.0%) |
| 6 to 18 Years | 118 (95.9%) | 5 (4.1%) |
| 19 to 25 Years | 20 (33.9%) | 39 (66.1%) |
| 26 to 34 Years | 53 (63.9%) | 30 (36.1%) |
| 35 to 44 Years | 64 (77.1%) | 19 (22.9%) |
| 45 to 54 Years | 55 (50.5%) | 54 (49.5%) |
| 55 to 64 Years | 82 (78.8%) | 22 (21.1%) |
| 65 to 74 Years | 54 (100.0%) | 0 (0.0%) |
| 75 Years and older | 40 (100.0%) | 0 (0.0%) |
| Total | 548 (76.4%) | 169 (23.6%) |
Health Insurance Coverage by Citizenship Status in Morrison
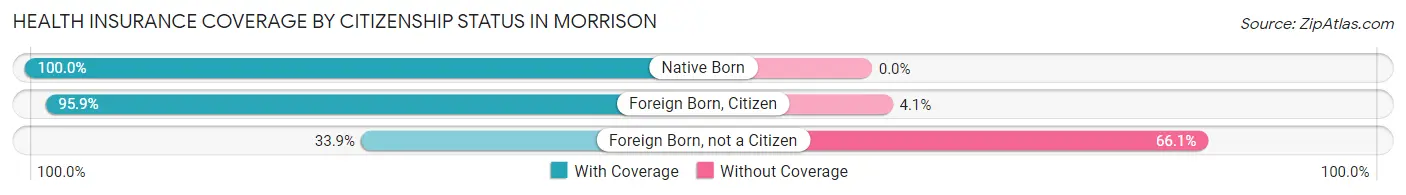
| Citizenship Status | With Coverage | Without Coverage |
| Native Born | 62 (100.0%) | 0 (0.0%) |
| Foreign Born, Citizen | 118 (95.9%) | 5 (4.1%) |
| Foreign Born, not a Citizen | 20 (33.9%) | 39 (66.1%) |
Health Insurance Coverage by Household Income in Morrison
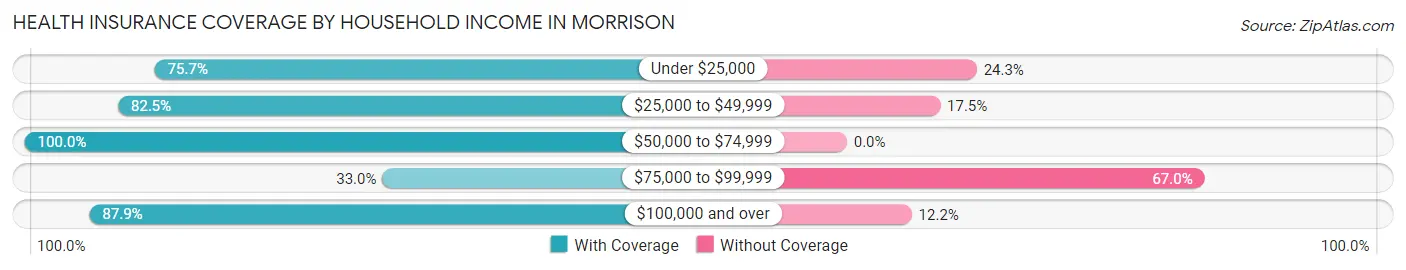
| Household Income | With Coverage | Without Coverage |
| Under $25,000 | 115 (75.7%) | 37 (24.3%) |
| $25,000 to $49,999 | 255 (82.5%) | 54 (17.5%) |
| $50,000 to $74,999 | 52 (100.0%) | 0 (0.0%) |
| $75,000 to $99,999 | 32 (33.0%) | 65 (67.0%) |
| $100,000 and over | 94 (87.8%) | 13 (12.1%) |
Public vs Private Health Insurance Coverage by Age in Morrison
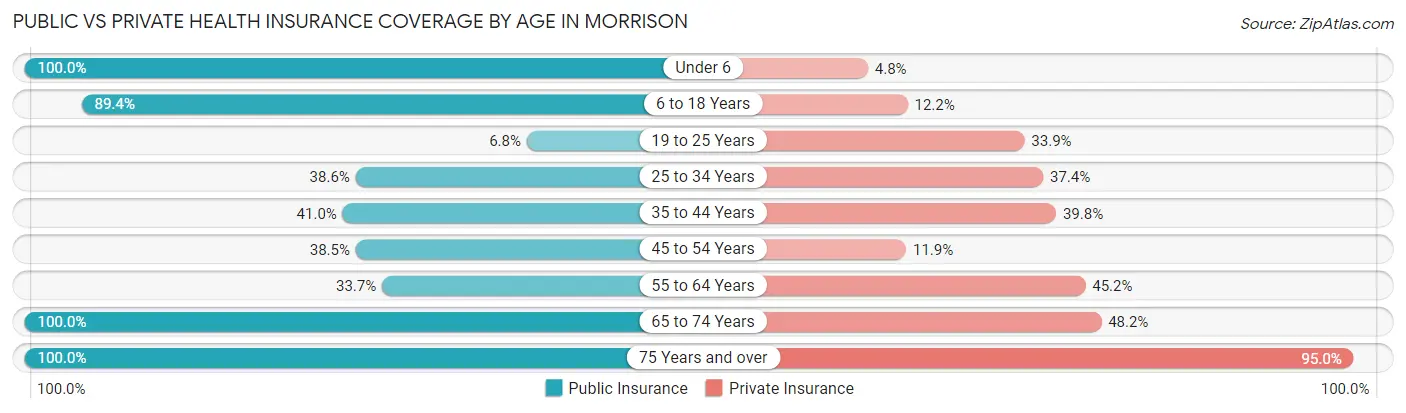
| Age Bracket | Public Insurance | Private Insurance |
| Under 6 | 62 (100.0%) | 3 (4.8%) |
| 6 to 18 Years | 110 (89.4%) | 15 (12.2%) |
| 19 to 25 Years | 4 (6.8%) | 20 (33.9%) |
| 25 to 34 Years | 32 (38.6%) | 31 (37.3%) |
| 35 to 44 Years | 34 (41.0%) | 33 (39.8%) |
| 45 to 54 Years | 42 (38.5%) | 13 (11.9%) |
| 55 to 64 Years | 35 (33.7%) | 47 (45.2%) |
| 65 to 74 Years | 54 (100.0%) | 26 (48.1%) |
| 75 Years and over | 40 (100.0%) | 38 (95.0%) |
| Total | 413 (57.6%) | 226 (31.5%) |
Disability Status by Sex by Age in Morrison
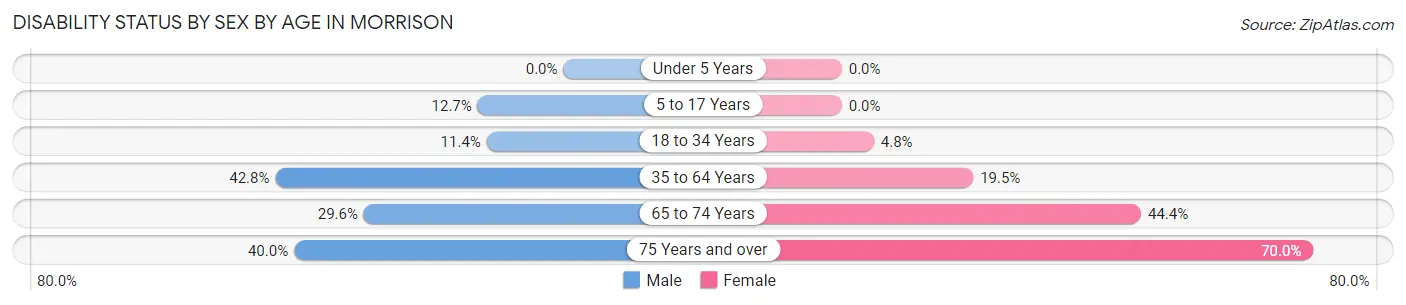
| Age Bracket | Male | Female |
| Under 5 Years | 0 (0.0%) | 0 (0.0%) |
| 5 to 17 Years | 7 (12.7%) | 0 (0.0%) |
| 18 to 34 Years | 9 (11.4%) | 3 (4.8%) |
| 35 to 64 Years | 74 (42.8%) | 24 (19.5%) |
| 65 to 74 Years | 8 (29.6%) | 12 (44.4%) |
| 75 Years and over | 4 (40.0%) | 21 (70.0%) |
Disability Class by Sex by Age in Morrison
Disability Class: Hearing Difficulty
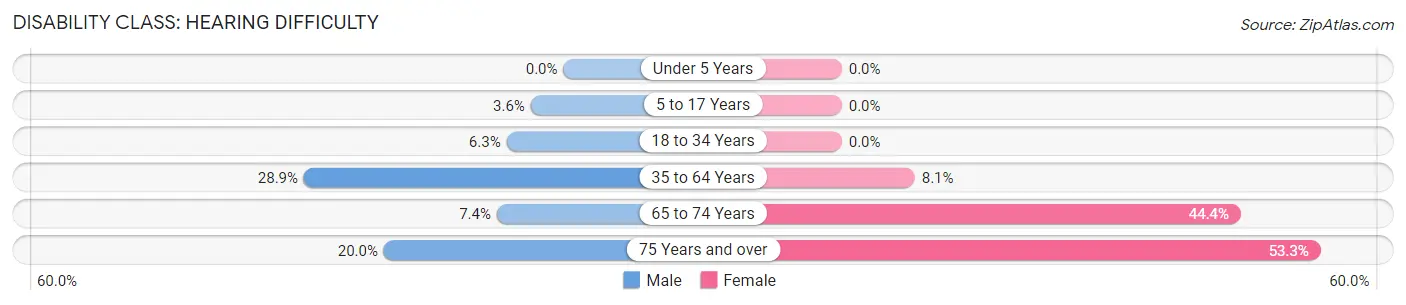
| Age Bracket | Male | Female |
| Under 5 Years | 0 (0.0%) | 0 (0.0%) |
| 5 to 17 Years | 2 (3.6%) | 0 (0.0%) |
| 18 to 34 Years | 5 (6.3%) | 0 (0.0%) |
| 35 to 64 Years | 50 (28.9%) | 10 (8.1%) |
| 65 to 74 Years | 2 (7.4%) | 12 (44.4%) |
| 75 Years and over | 2 (20.0%) | 16 (53.3%) |
Disability Class: Vision Difficulty
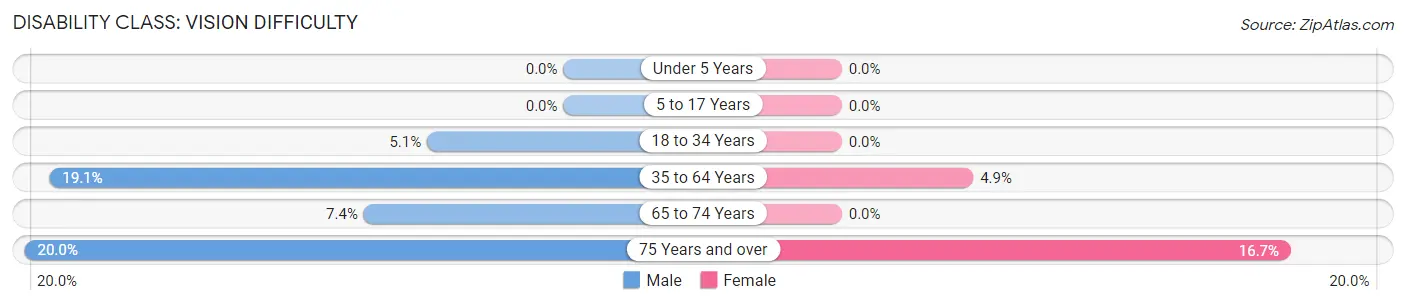
| Age Bracket | Male | Female |
| Under 5 Years | 0 (0.0%) | 0 (0.0%) |
| 5 to 17 Years | 0 (0.0%) | 0 (0.0%) |
| 18 to 34 Years | 4 (5.1%) | 0 (0.0%) |
| 35 to 64 Years | 33 (19.1%) | 6 (4.9%) |
| 65 to 74 Years | 2 (7.4%) | 0 (0.0%) |
| 75 Years and over | 2 (20.0%) | 5 (16.7%) |
Disability Class: Cognitive Difficulty
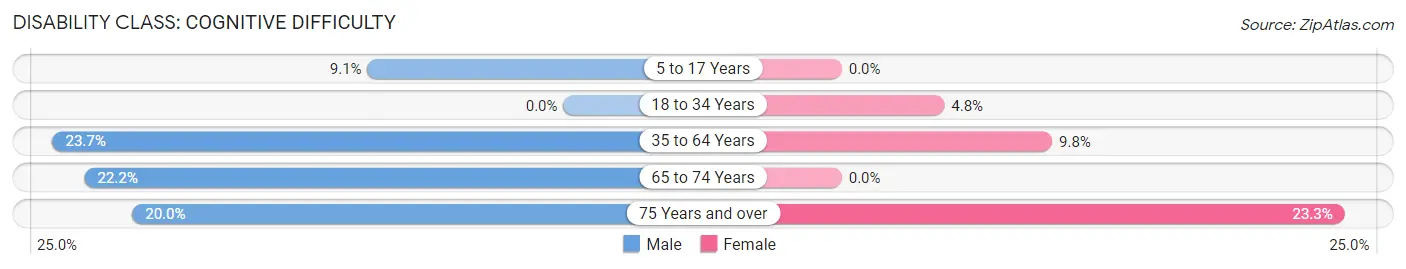
| Age Bracket | Male | Female |
| 5 to 17 Years | 5 (9.1%) | 0 (0.0%) |
| 18 to 34 Years | 0 (0.0%) | 3 (4.8%) |
| 35 to 64 Years | 41 (23.7%) | 12 (9.8%) |
| 65 to 74 Years | 6 (22.2%) | 0 (0.0%) |
| 75 Years and over | 2 (20.0%) | 7 (23.3%) |
Disability Class: Ambulatory Difficulty
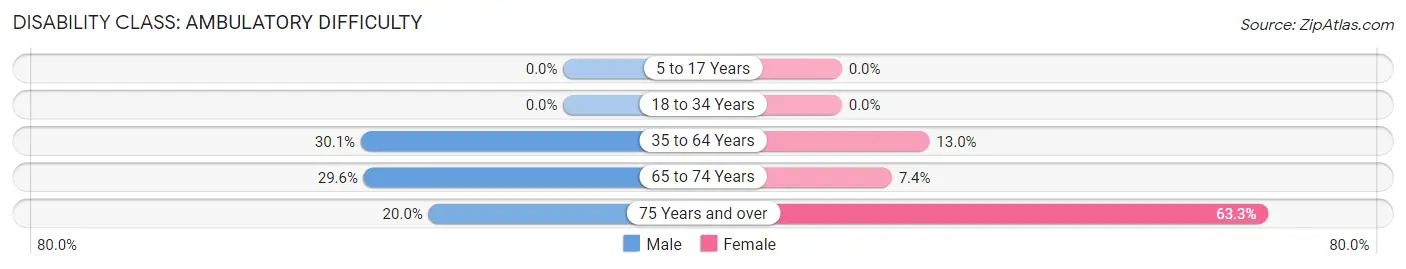
| Age Bracket | Male | Female |
| 5 to 17 Years | 0 (0.0%) | 0 (0.0%) |
| 18 to 34 Years | 0 (0.0%) | 0 (0.0%) |
| 35 to 64 Years | 52 (30.1%) | 16 (13.0%) |
| 65 to 74 Years | 8 (29.6%) | 2 (7.4%) |
| 75 Years and over | 2 (20.0%) | 19 (63.3%) |
Disability Class: Self-Care Difficulty
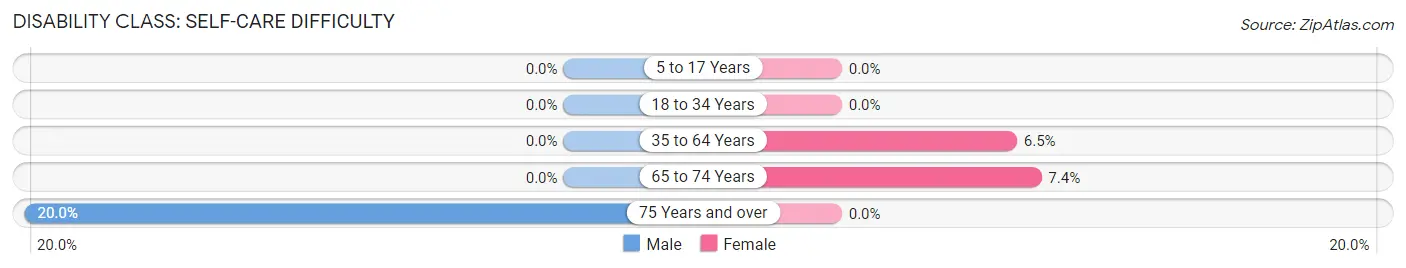
| Age Bracket | Male | Female |
| 5 to 17 Years | 0 (0.0%) | 0 (0.0%) |
| 18 to 34 Years | 0 (0.0%) | 0 (0.0%) |
| 35 to 64 Years | 0 (0.0%) | 8 (6.5%) |
| 65 to 74 Years | 0 (0.0%) | 2 (7.4%) |
| 75 Years and over | 2 (20.0%) | 0 (0.0%) |
Technology Access in Morrison
Computing Device Access in Morrison
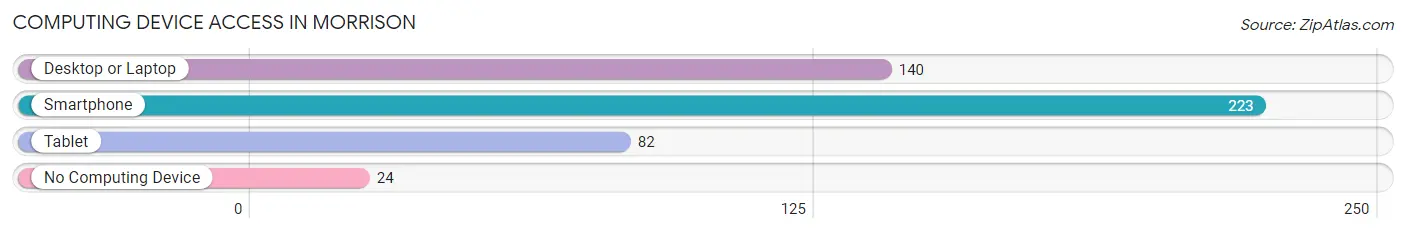
| Device Type | # Households | % Households |
| Desktop or Laptop | 140 | 53.8% |
| Smartphone | 223 | 85.8% |
| Tablet | 82 | 31.5% |
| No Computing Device | 24 | 9.2% |
| Total | 260 | 100.0% |
Internet Access in Morrison
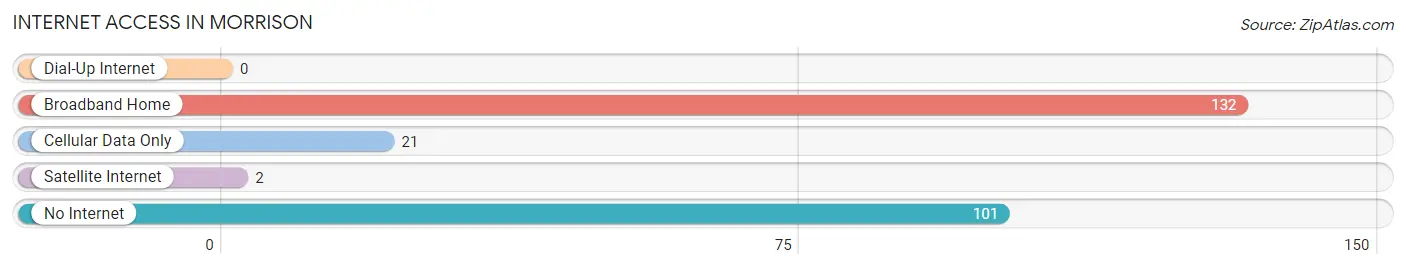
| Internet Type | # Households | % Households |
| Dial-Up Internet | 0 | 0.0% |
| Broadband Home | 132 | 50.8% |
| Cellular Data Only | 21 | 8.1% |
| Satellite Internet | 2 | 0.8% |
| No Internet | 101 | 38.9% |
| Total | 260 | 100.0% |
Morrison Summary
Morrison is a small town located in Warren County, Tennessee. It is situated in the foothills of the Cumberland Plateau, approximately 25 miles east of Nashville. The town was founded in 1820 and has a population of approximately 1,500 people.
History
Morrison was founded in 1820 by William Morrison, a Revolutionary War veteran. He purchased the land from the Cherokee Indians and named the town after himself. The town was originally known as “Morrison’s Crossroads” due to its location at the intersection of two major roads.
In the early days, Morrison was a small farming community. The town was home to several gristmills, sawmills, and a cotton gin. The town also had a blacksmith, a general store, and a post office.
In the late 1800s, Morrison began to grow and develop. The town was incorporated in 1891 and the first mayor was elected in 1892. The town was connected to the railroad in 1895, which allowed for the transportation of goods and people.
In the early 1900s, Morrison began to experience a period of growth and prosperity. The town was home to several businesses, including a bank, a hotel, a movie theater, and a variety of stores. The town also had a school, a library, and a hospital.
Geography
Morrison is located in Warren County, Tennessee. It is situated in the foothills of the Cumberland Plateau, approximately 25 miles east of Nashville. The town is located at the intersection of two major roads, Highway 70 and Highway 99.
The town is surrounded by rolling hills and forests. The nearby Collins River is a popular spot for fishing and canoeing. The town is also home to several parks, including Morrison City Park and Morrison Nature Park.
Economy
Morrison’s economy is largely based on agriculture and tourism. The town is home to several farms, which produce a variety of crops, including corn, soybeans, and wheat. The town is also home to several wineries and distilleries, which produce a variety of wines and spirits.
The town is also home to several businesses, including restaurants, shops, and a variety of services. The town is also home to a variety of manufacturing companies, which produce a variety of products, including furniture, clothing, and automotive parts.
Demographics
As of the 2010 census, Morrison had a population of 1,500 people. The town is predominantly white, with approximately 95% of the population being Caucasian. The town is also home to a small African American population, with approximately 4% of the population being African American.
The median household income in Morrison is approximately $45,000. The town has a poverty rate of approximately 15%, which is slightly higher than the national average. The town also has a high rate of unemployment, with approximately 10% of the population being unemployed.
Conclusion
Morrison is a small town located in Warren County, Tennessee. It is situated in the foothills of the Cumberland Plateau, approximately 25 miles east of Nashville. The town was founded in 1820 and has a population of approximately 1,500 people. The town’s economy is largely based on agriculture and tourism. The town is predominantly white, with approximately 95% of the population being Caucasian. The median household income in Morrison is approximately $45,000 and the town has a poverty rate of approximately 15%.
Common Questions
What is Per Capita Income in Morrison?
Per Capita income in Morrison is $19,739.
What is the Median Family Income in Morrison?
Median Family Income in Morrison is $47,143.
What is the Median Household income in Morrison?
Median Household Income in Morrison is $34,318.
What is Income or Wage Gap in Morrison?
Income or Wage Gap in Morrison is 13.9%.
Women in Morrison earn 86.1 cents for every dollar earned by a man.
What is Inequality or Gini Index in Morrison?
Inequality or Gini Index in Morrison is 0.42.
What is the Total Population of Morrison?
Total Population of Morrison is 717.
What is the Total Male Population of Morrison?
Total Male Population of Morrison is 384.
What is the Total Female Population of Morrison?
Total Female Population of Morrison is 333.
What is the Ratio of Males per 100 Females in Morrison?
There are 115.32 Males per 100 Females in Morrison.
What is the Ratio of Females per 100 Males in Morrison?
There are 86.72 Females per 100 Males in Morrison.
What is the Median Population Age in Morrison?
Median Population Age in Morrison is 40.5 Years.
What is the Average Family Size in Morrison
Average Family Size in Morrison is 3.3 People.
What is the Average Household Size in Morrison
Average Household Size in Morrison is 2.8 People.
How Large is the Labor Force in Morrison?
There are 300 People in the Labor Forcein in Morrison.
What is the Percentage of People in the Labor Force in Morrison?
56.2% of People are in the Labor Force in Morrison.
What is the Unemployment Rate in Morrison?
Unemployment Rate in Morrison is 5.7%.