Monterey, TN Map & Demographics
Monterey Map
Monterey Overview
$17,189
PER CAPITA INCOME
$40,417
AVG FAMILY INCOME
$38,869
AVG HOUSEHOLD INCOME
3.5%
WAGE / INCOME GAP [ % ]
96.5¢/ $1
WAGE / INCOME GAP [ $ ]
$11,542
FAMILY INCOME DEFICIT
0.43
INEQUALITY / GINI INDEX
2,751
TOTAL POPULATION
1,436
MALE POPULATION
1,315
FEMALE POPULATION
109.20
MALES / 100 FEMALES
91.57
FEMALES / 100 MALES
27.7
MEDIAN AGE
3.7
AVG FAMILY SIZE
3.0
AVG HOUSEHOLD SIZE
1,112
LABOR FORCE [ PEOPLE ]
56.5%
PERCENT IN LABOR FORCE
2.7%
UNEMPLOYMENT RATE
Monterey Zip Codes
Monterey Area Codes
Income in Monterey
Income Overview in Monterey
Per Capita Income in Monterey is $17,189, while median incomes of families and households are $40,417 and $38,869 respectively.
| Characteristic | Number | Measure |
| Per Capita Income | 2,751 | $17,189 |
| Median Family Income | 627 | $40,417 |
| Mean Family Income | 627 | $55,151 |
| Median Household Income | 877 | $38,869 |
| Mean Household Income | 877 | $51,846 |
| Income Deficit | 627 | $11,542 |
| Wage / Income Gap (%) | 2,751 | 3.45% |
| Wage / Income Gap ($) | 2,751 | 96.55¢ per $1 |
| Gini / Inequality Index | 2,751 | 0.43 |
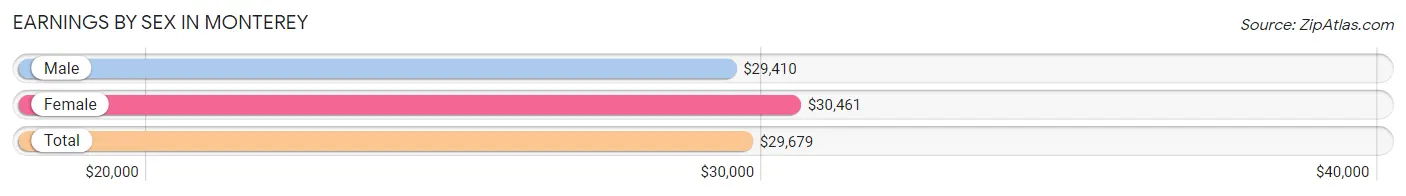
Earnings by Sex in Monterey
Average Earnings in Monterey are $29,679, $29,410 for men and $30,461 for women, a difference of 3.5%.
| Sex | Number | Average Earnings |
| Male | 715 (62.7%) | $29,410 |
| Female | 425 (37.3%) | $30,461 |
| Total | 1,140 (100.0%) | $29,679 |
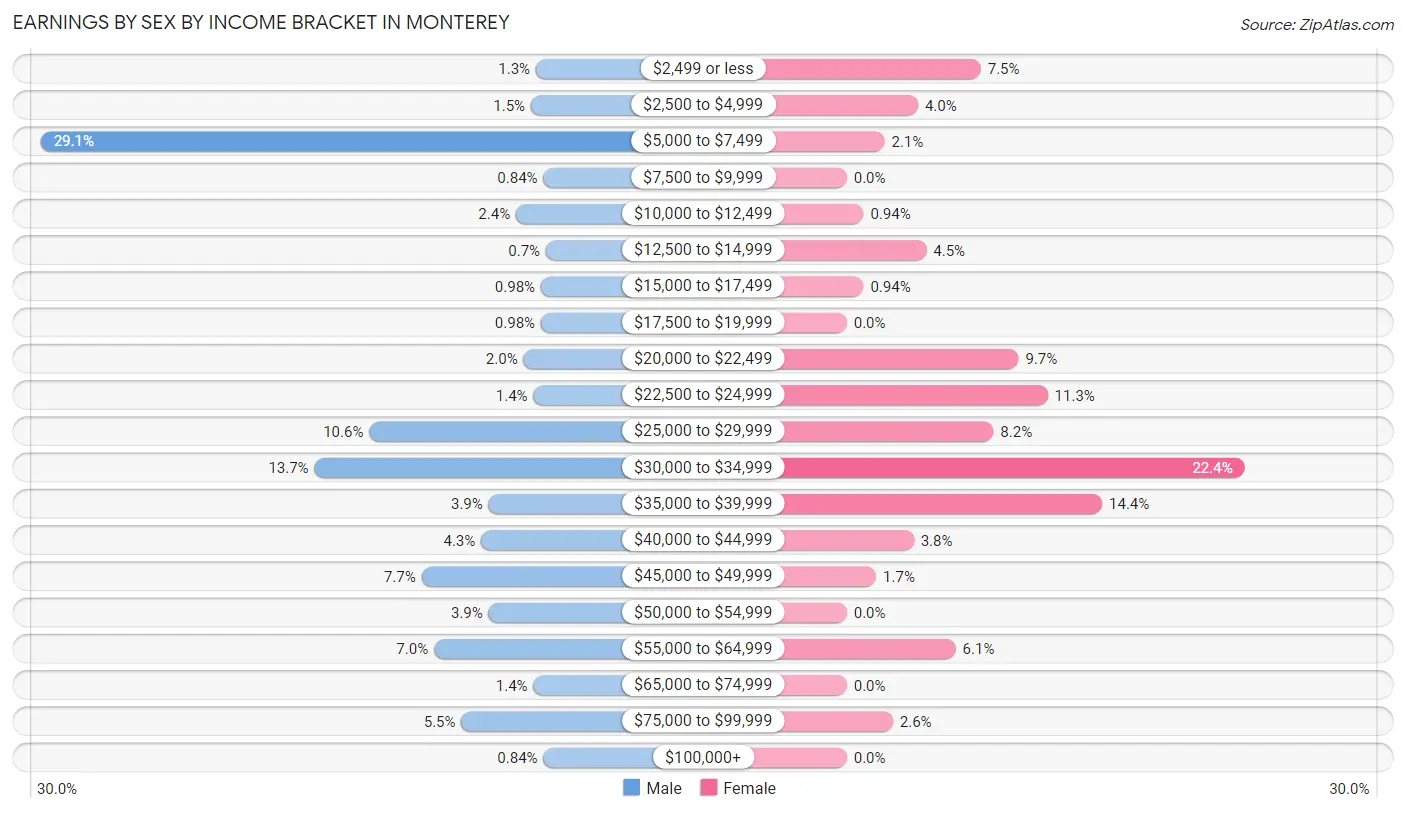
Earnings by Sex by Income Bracket in Monterey
The most common earnings brackets in Monterey are $5,000 to $7,499 for men (208 | 29.1%) and $30,000 to $34,999 for women (95 | 22.4%).
| Income | Male | Female |
| $2,499 or less | 9 (1.3%) | 32 (7.5%) |
| $2,500 to $4,999 | 11 (1.5%) | 17 (4.0%) |
| $5,000 to $7,499 | 208 (29.1%) | 9 (2.1%) |
| $7,500 to $9,999 | 6 (0.8%) | 0 (0.0%) |
| $10,000 to $12,499 | 17 (2.4%) | 4 (0.9%) |
| $12,500 to $14,999 | 5 (0.7%) | 19 (4.5%) |
| $15,000 to $17,499 | 7 (1.0%) | 4 (0.9%) |
| $17,500 to $19,999 | 7 (1.0%) | 0 (0.0%) |
| $20,000 to $22,499 | 14 (2.0%) | 41 (9.7%) |
| $22,500 to $24,999 | 10 (1.4%) | 48 (11.3%) |
| $25,000 to $29,999 | 76 (10.6%) | 35 (8.2%) |
| $30,000 to $34,999 | 98 (13.7%) | 95 (22.4%) |
| $35,000 to $39,999 | 28 (3.9%) | 61 (14.3%) |
| $40,000 to $44,999 | 31 (4.3%) | 16 (3.8%) |
| $45,000 to $49,999 | 55 (7.7%) | 7 (1.7%) |
| $50,000 to $54,999 | 28 (3.9%) | 0 (0.0%) |
| $55,000 to $64,999 | 50 (7.0%) | 26 (6.1%) |
| $65,000 to $74,999 | 10 (1.4%) | 0 (0.0%) |
| $75,000 to $99,999 | 39 (5.4%) | 11 (2.6%) |
| $100,000+ | 6 (0.8%) | 0 (0.0%) |
| Total | 715 (100.0%) | 425 (100.0%) |
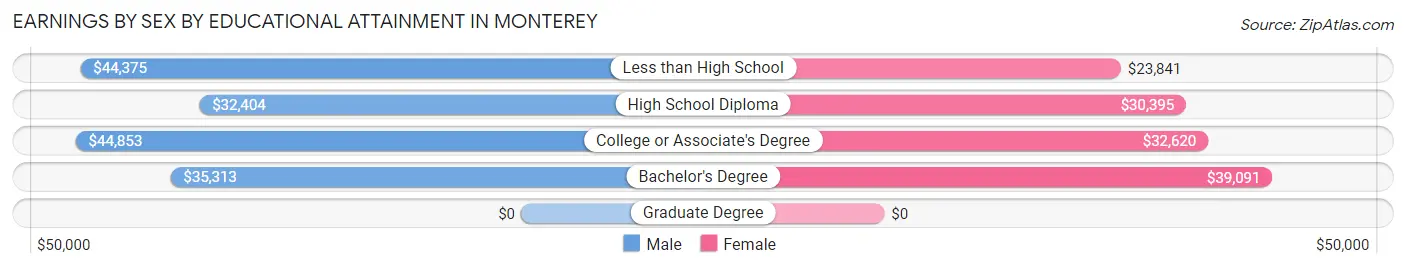
Earnings by Sex by Educational Attainment in Monterey
Average earnings in Monterey are $35,313 for men and $30,461 for women, a difference of 13.7%. Men with an educational attainment of college or associate's degree enjoy the highest average annual earnings of $44,853, while those with high school diploma education earn the least with $32,404. Women with an educational attainment of bachelor's degree earn the most with the average annual earnings of $39,091, while those with less than high school education have the smallest earnings of $23,841.
| Educational Attainment | Male Income | Female Income |
| Less than High School | $44,375 | $23,841 |
| High School Diploma | $32,404 | $30,395 |
| College or Associate's Degree | $44,853 | $32,620 |
| Bachelor's Degree | $35,313 | $39,091 |
| Graduate Degree | - | - |
| Total | $35,313 | $30,461 |
Family Income in Monterey
Family Income Brackets in Monterey
According to the Monterey family income data, there are 163 families falling into the $35,000 to $49,999 income range, which is the most common income bracket and makes up 26.0% of all families. Conversely, the $200,000+ income bracket is the least frequent group with only 6 families (1.0%) belonging to this category.
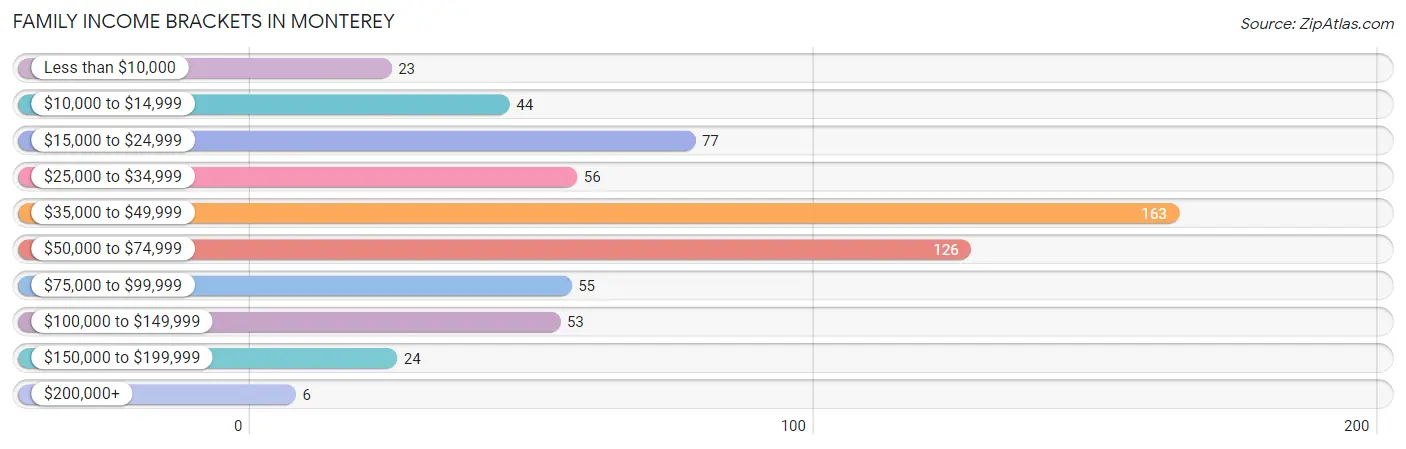
| Income Bracket | # Families | % Families |
| Less than $10,000 | 23 | 3.7% |
| $10,000 to $14,999 | 44 | 7.0% |
| $15,000 to $24,999 | 77 | 12.3% |
| $25,000 to $34,999 | 56 | 8.9% |
| $35,000 to $49,999 | 163 | 26.0% |
| $50,000 to $74,999 | 126 | 20.1% |
| $75,000 to $99,999 | 55 | 8.8% |
| $100,000 to $149,999 | 53 | 8.5% |
| $150,000 to $199,999 | 24 | 3.8% |
| $200,000+ | 6 | 1.0% |
Family Income by Famaliy Size in Monterey
3-person families (161 | 25.7%) account for the highest median family income in Monterey with $67,188 per family, while 3-person families (161 | 25.7%) have the highest median income of $22,396 per family member.
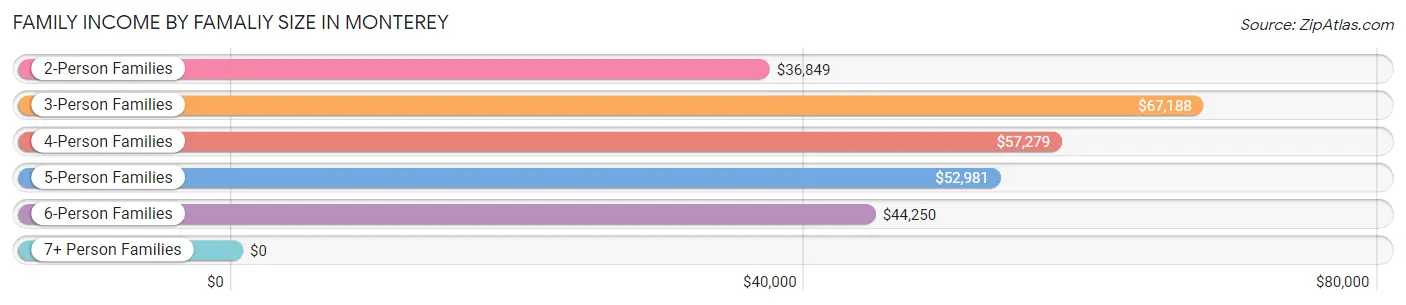
| Income Bracket | # Families | Median Income |
| 2-Person Families | 249 (39.7%) | $36,849 |
| 3-Person Families | 161 (25.7%) | $67,188 |
| 4-Person Families | 75 (12.0%) | $57,279 |
| 5-Person Families | 73 (11.6%) | $52,981 |
| 6-Person Families | 56 (8.9%) | $44,250 |
| 7+ Person Families | 13 (2.1%) | $0 |
| Total | 627 (100.0%) | $40,417 |
Family Income by Number of Earners in Monterey
The median family income in Monterey is $40,417, with families comprising 3+ earners (85) having the highest median family income of $125,795, while families with no earners (129) have the lowest median family income of $24,792, accounting for 13.6% and 20.6% of families, respectively.
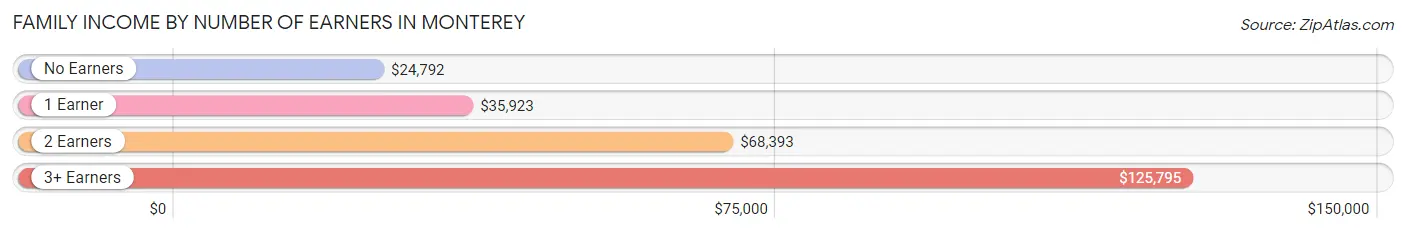
| Number of Earners | # Families | Median Income |
| No Earners | 129 (20.6%) | $24,792 |
| 1 Earner | 259 (41.3%) | $35,923 |
| 2 Earners | 154 (24.6%) | $68,393 |
| 3+ Earners | 85 (13.6%) | $125,795 |
| Total | 627 (100.0%) | $40,417 |
Household Income in Monterey
Household Income Brackets in Monterey
With 180 households falling in the category, the $35,000 to $49,999 income range is the most frequent in Monterey, accounting for 20.5% of all households. In contrast, only 12 households (1.4%) fall into the $200,000+ income bracket, making it the least populous group.
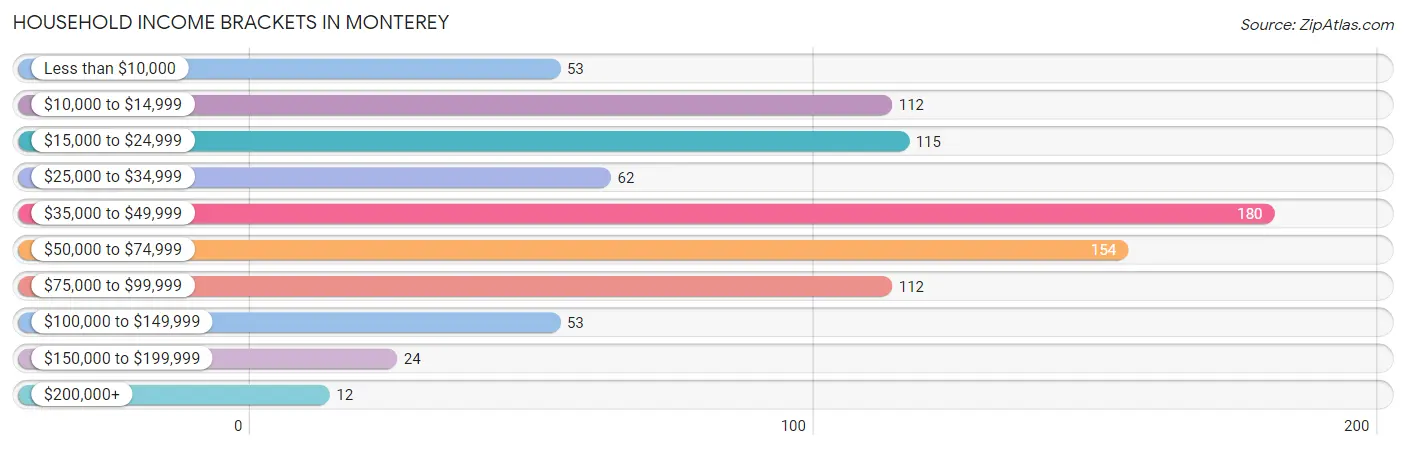
| Income Bracket | # Households | % Households |
| Less than $10,000 | 53 | 6.0% |
| $10,000 to $14,999 | 112 | 12.8% |
| $15,000 to $24,999 | 115 | 13.1% |
| $25,000 to $34,999 | 62 | 7.1% |
| $35,000 to $49,999 | 180 | 20.5% |
| $50,000 to $74,999 | 154 | 17.6% |
| $75,000 to $99,999 | 112 | 12.8% |
| $100,000 to $149,999 | 53 | 6.0% |
| $150,000 to $199,999 | 24 | 2.7% |
| $200,000+ | 12 | 1.4% |
Household Income by Householder Age in Monterey
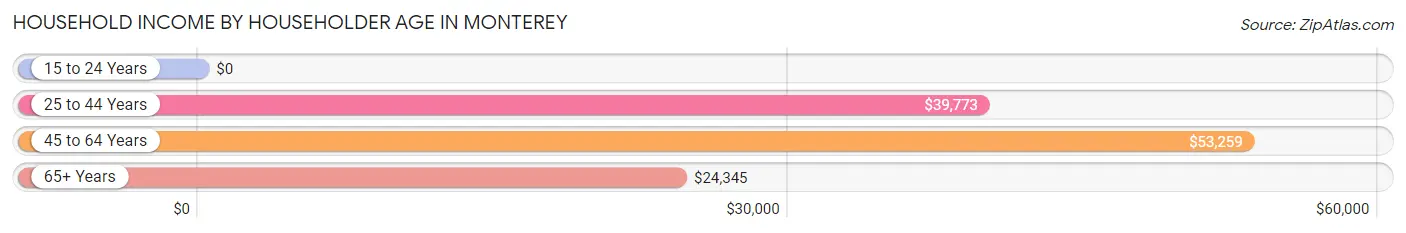
The median household income in Monterey is $38,869, with the highest median household income of $53,259 found in the 45 to 64 years age bracket for the primary householder. A total of 253 households (28.8%) fall into this category. Meanwhile, the 15 to 24 years age bracket for the primary householder has the lowest median household income of $0, with 69 households (7.9%) in this group.
| Income Bracket | # Households | Median Income |
| 15 to 24 Years | 69 (7.9%) | $0 |
| 25 to 44 Years | 318 (36.3%) | $39,773 |
| 45 to 64 Years | 253 (28.8%) | $53,259 |
| 65+ Years | 237 (27.0%) | $24,345 |
| Total | 877 (100.0%) | $38,869 |
Poverty in Monterey
Income Below Poverty by Sex and Age in Monterey
With 28.6% poverty level for males and 34.1% for females among the residents of Monterey, 16 and 17 year old males and 12 to 14 year old females are the most vulnerable to poverty, with 215 males (82.1%) and 16 females (100.0%) in their respective age groups living below the poverty level.
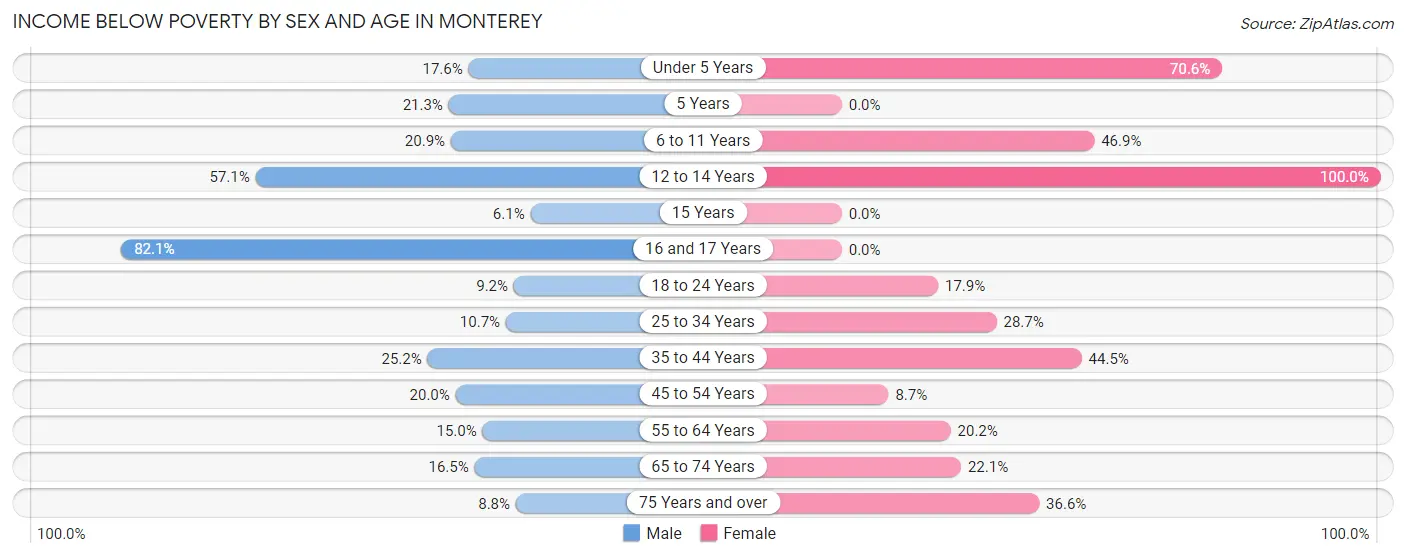
| Age Bracket | Male | Female |
| Under 5 Years | 22 (17.6%) | 108 (70.6%) |
| 5 Years | 10 (21.3%) | 0 (0.0%) |
| 6 to 11 Years | 24 (20.9%) | 82 (46.9%) |
| 12 to 14 Years | 12 (57.1%) | 16 (100.0%) |
| 15 Years | 5 (6.1%) | 0 (0.0%) |
| 16 and 17 Years | 215 (82.1%) | 0 (0.0%) |
| 18 to 24 Years | 9 (9.2%) | 10 (17.9%) |
| 25 to 34 Years | 21 (10.7%) | 52 (28.7%) |
| 35 to 44 Years | 30 (25.2%) | 65 (44.5%) |
| 45 to 54 Years | 15 (20.0%) | 13 (8.7%) |
| 55 to 64 Years | 21 (15.0%) | 20 (20.2%) |
| 65 to 74 Years | 15 (16.5%) | 25 (22.1%) |
| 75 Years and over | 3 (8.8%) | 37 (36.6%) |
| Total | 402 (28.6%) | 428 (34.1%) |
Income Above Poverty by Sex and Age in Monterey
According to the poverty statistics in Monterey, males aged 15 years and females aged 5 years are the age groups that are most secure financially, with 93.9% of males and 100.0% of females in these age groups living above the poverty line.
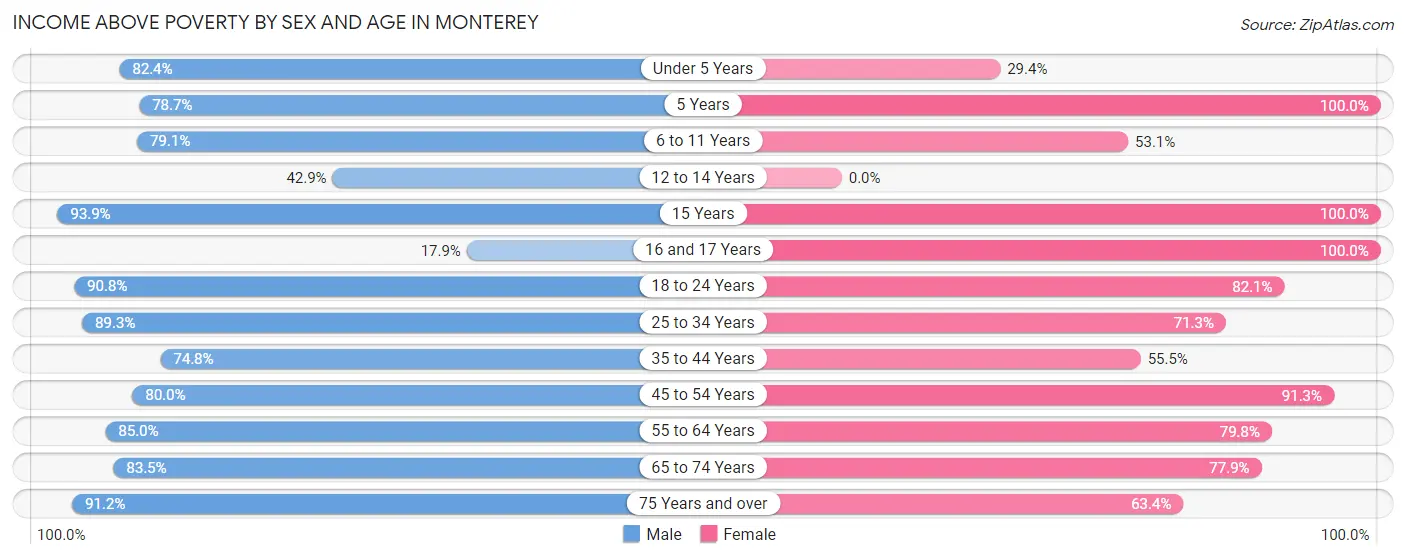
| Age Bracket | Male | Female |
| Under 5 Years | 103 (82.4%) | 45 (29.4%) |
| 5 Years | 37 (78.7%) | 26 (100.0%) |
| 6 to 11 Years | 91 (79.1%) | 93 (53.1%) |
| 12 to 14 Years | 9 (42.9%) | 0 (0.0%) |
| 15 Years | 77 (93.9%) | 20 (100.0%) |
| 16 and 17 Years | 47 (17.9%) | 18 (100.0%) |
| 18 to 24 Years | 89 (90.8%) | 46 (82.1%) |
| 25 to 34 Years | 176 (89.3%) | 129 (71.3%) |
| 35 to 44 Years | 89 (74.8%) | 81 (55.5%) |
| 45 to 54 Years | 60 (80.0%) | 137 (91.3%) |
| 55 to 64 Years | 119 (85.0%) | 79 (79.8%) |
| 65 to 74 Years | 76 (83.5%) | 88 (77.9%) |
| 75 Years and over | 31 (91.2%) | 64 (63.4%) |
| Total | 1,004 (71.4%) | 826 (65.9%) |
Income Below Poverty Among Married-Couple Families in Monterey
The poverty statistics for married-couple families in Monterey show that 21.2% or 80 of the total 378 families live below the poverty line. Families with 5 or more children have the highest poverty rate of 100.0%, comprising of 12 families. On the other hand, families with 1 or 2 children have the lowest poverty rate of 8.4%, which includes 12 families.
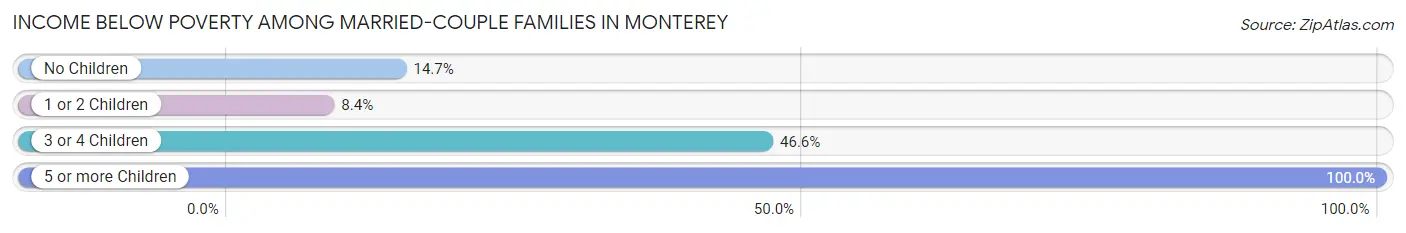
| Children | Above Poverty | Below Poverty |
| No Children | 128 (85.3%) | 22 (14.7%) |
| 1 or 2 Children | 131 (91.6%) | 12 (8.4%) |
| 3 or 4 Children | 39 (53.4%) | 34 (46.6%) |
| 5 or more Children | 0 (0.0%) | 12 (100.0%) |
| Total | 298 (78.8%) | 80 (21.2%) |
Income Below Poverty Among Single-Parent Households in Monterey
According to the poverty data in Monterey, 13.4% or 11 single-father households and 23.4% or 39 single-mother households are living below the poverty line. Among single-father households, those with 1 or 2 children have the highest poverty rate, with 8 households (19.5%) experiencing poverty. Likewise, among single-mother households, those with 1 or 2 children have the highest poverty rate, with 30 households (28.0%) falling below the poverty line.
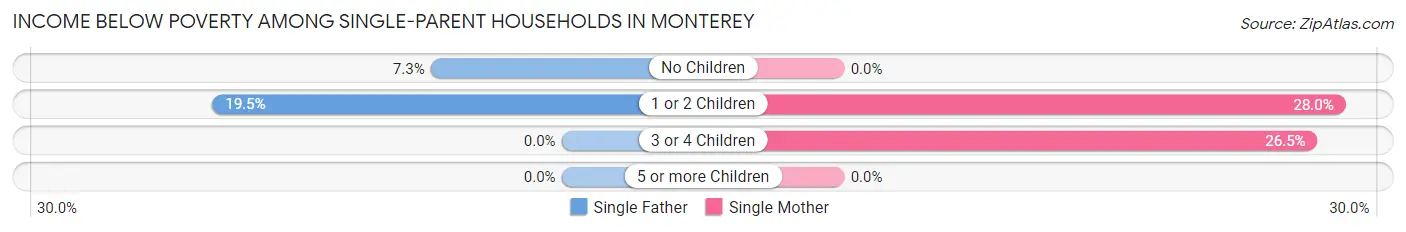
| Children | Single Father | Single Mother |
| No Children | 3 (7.3%) | 0 (0.0%) |
| 1 or 2 Children | 8 (19.5%) | 30 (28.0%) |
| 3 or 4 Children | 0 (0.0%) | 9 (26.5%) |
| 5 or more Children | 0 (0.0%) | 0 (0.0%) |
| Total | 11 (13.4%) | 39 (23.4%) |
Income Below Poverty Among Married-Couple vs Single-Parent Households in Monterey
The poverty data for Monterey shows that 80 of the married-couple family households (21.2%) and 50 of the single-parent households (20.1%) are living below the poverty level. Within the married-couple family households, those with 5 or more children have the highest poverty rate, with 12 households (100.0%) falling below the poverty line. Among the single-parent households, those with 3 or 4 children have the highest poverty rate, with 9 household (26.5%) living below poverty.
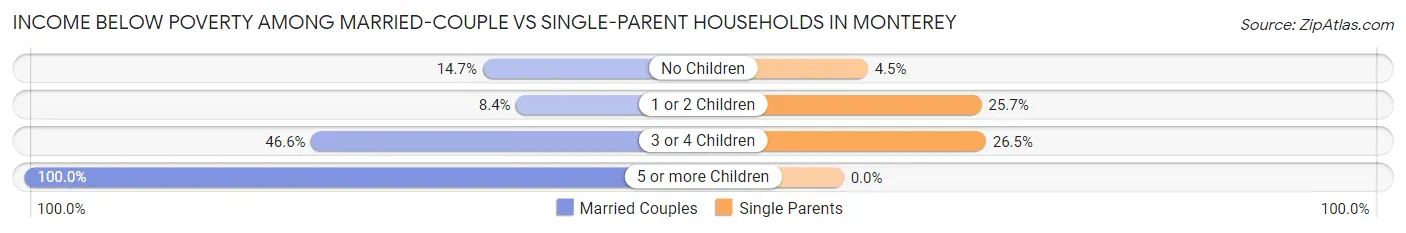
| Children | Married-Couple Families | Single-Parent Households |
| No Children | 22 (14.7%) | 3 (4.5%) |
| 1 or 2 Children | 12 (8.4%) | 38 (25.7%) |
| 3 or 4 Children | 34 (46.6%) | 9 (26.5%) |
| 5 or more Children | 12 (100.0%) | 0 (0.0%) |
| Total | 80 (21.2%) | 50 (20.1%) |
Race in Monterey
The most populous races in Monterey are White / Caucasian (2,429 | 88.3%), Hispanic or Latino (525 | 19.1%), and Some other Race (119 | 4.3%).
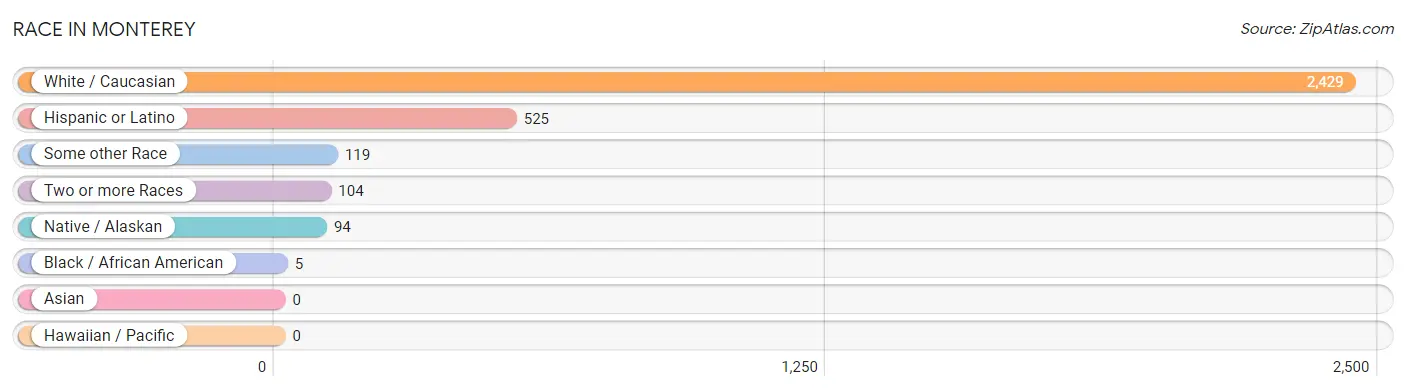
| Race | # Population | % Population |
| Asian | 0 | 0.0% |
| Black / African American | 5 | 0.2% |
| Hawaiian / Pacific | 0 | 0.0% |
| Hispanic or Latino | 525 | 19.1% |
| Native / Alaskan | 94 | 3.4% |
| White / Caucasian | 2,429 | 88.3% |
| Two or more Races | 104 | 3.8% |
| Some other Race | 119 | 4.3% |
| Total | 2,751 | 100.0% |
Ancestry in Monterey
The most populous ancestries reported in Monterey are American (706 | 25.7%), English (486 | 17.7%), Central American (257 | 9.3%), Guatemalan (257 | 9.3%), and Irish (175 | 6.4%), together accounting for 68.4% of all Monterey residents.
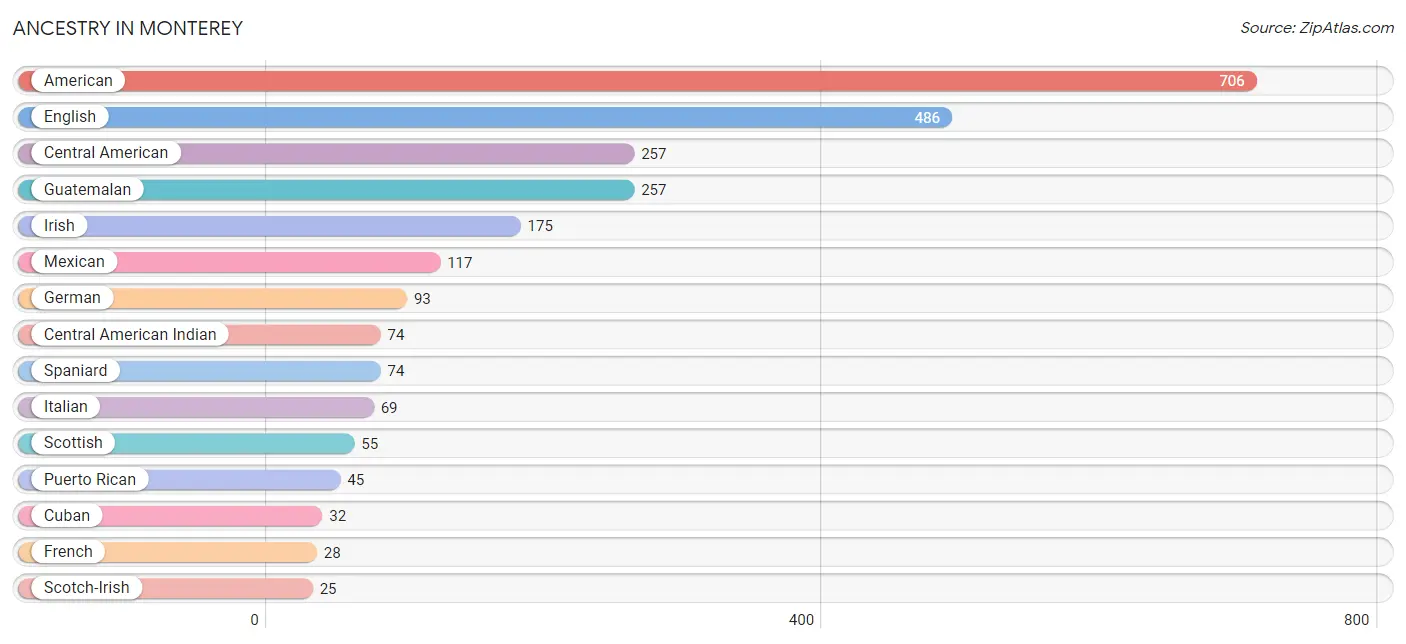
| Ancestry | # Population | % Population |
| American | 706 | 25.7% |
| Canadian | 5 | 0.2% |
| Central American | 257 | 9.3% |
| Central American Indian | 74 | 2.7% |
| Cherokee | 13 | 0.5% |
| Choctaw | 3 | 0.1% |
| Cuban | 32 | 1.2% |
| Dutch | 3 | 0.1% |
| Eastern European | 4 | 0.2% |
| English | 486 | 17.7% |
| European | 20 | 0.7% |
| French | 28 | 1.0% |
| French Canadian | 10 | 0.4% |
| German | 93 | 3.4% |
| Greek | 4 | 0.2% |
| Guatemalan | 257 | 9.3% |
| Irish | 175 | 6.4% |
| Italian | 69 | 2.5% |
| Mexican | 117 | 4.3% |
| Puerto Rican | 45 | 1.6% |
| Scotch-Irish | 25 | 0.9% |
| Scottish | 55 | 2.0% |
| Sioux | 4 | 0.2% |
| Spaniard | 74 | 2.7% |
| Welsh | 6 | 0.2% | View All 25 Rows |
Immigrants in Monterey
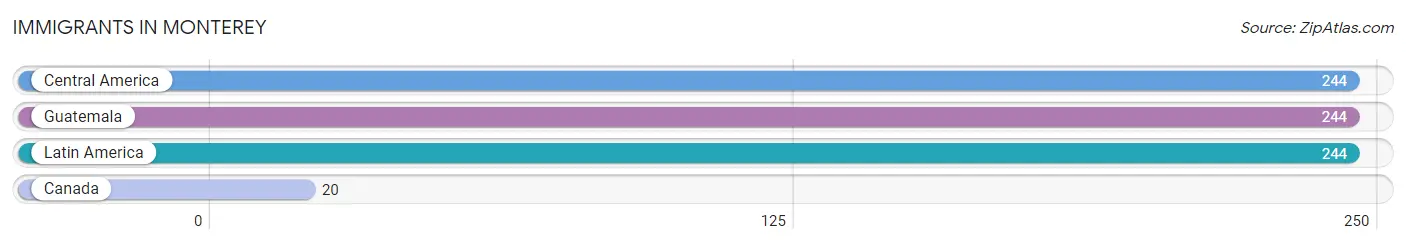
The most numerous immigrant groups reported in Monterey came from Central America (244 | 8.9%), Guatemala (244 | 8.9%), Latin America (244 | 8.9%), and Canada (20 | 0.7%), together accounting for 27.3% of all Monterey residents.
| Immigration Origin | # Population | % Population |
| Canada | 20 | 0.7% |
| Central America | 244 | 8.9% |
| Guatemala | 244 | 8.9% |
| Latin America | 244 | 8.9% | View All 4 Rows |
Sex and Age in Monterey
Sex and Age in Monterey
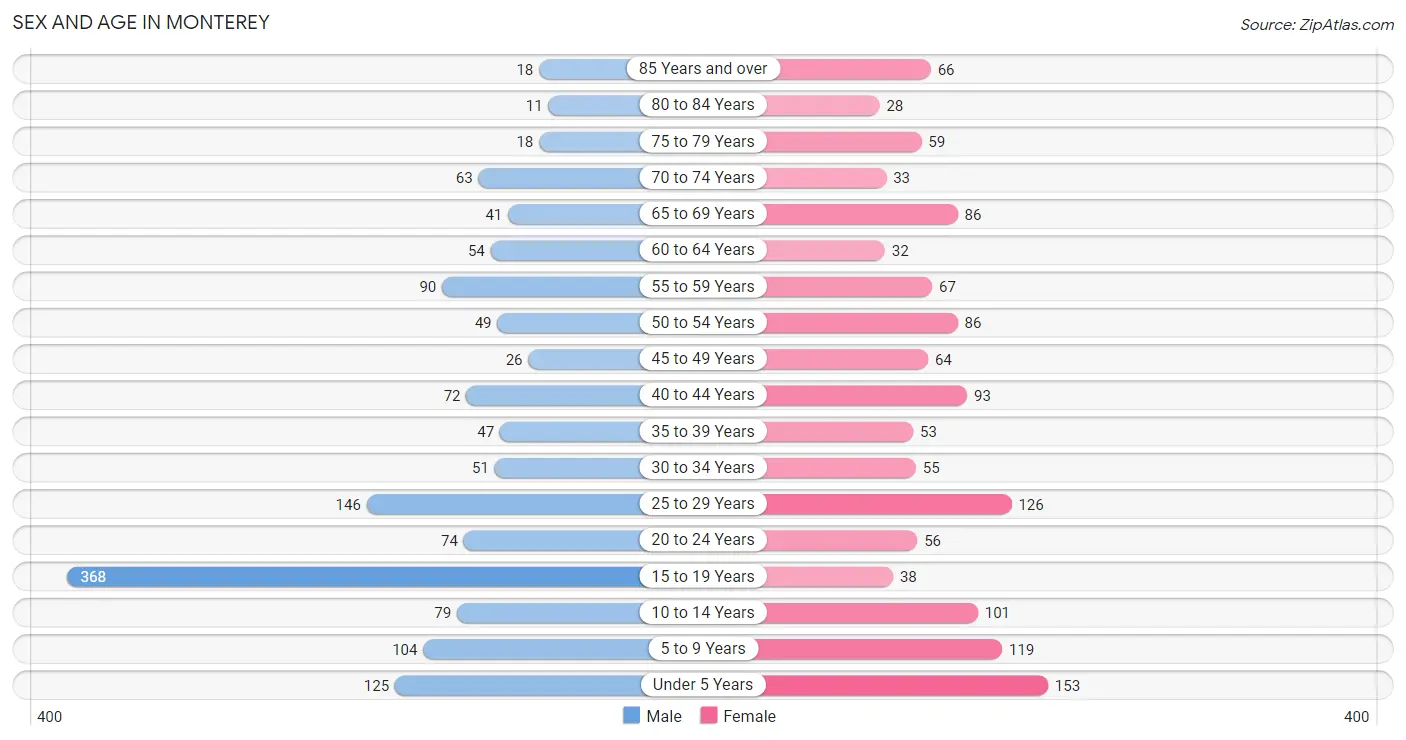
The most populous age groups in Monterey are 15 to 19 Years (368 | 25.6%) for men and Under 5 Years (153 | 11.6%) for women.
| Age Bracket | Male | Female |
| Under 5 Years | 125 (8.7%) | 153 (11.6%) |
| 5 to 9 Years | 104 (7.2%) | 119 (9.0%) |
| 10 to 14 Years | 79 (5.5%) | 101 (7.7%) |
| 15 to 19 Years | 368 (25.6%) | 38 (2.9%) |
| 20 to 24 Years | 74 (5.1%) | 56 (4.3%) |
| 25 to 29 Years | 146 (10.2%) | 126 (9.6%) |
| 30 to 34 Years | 51 (3.5%) | 55 (4.2%) |
| 35 to 39 Years | 47 (3.3%) | 53 (4.0%) |
| 40 to 44 Years | 72 (5.0%) | 93 (7.1%) |
| 45 to 49 Years | 26 (1.8%) | 64 (4.9%) |
| 50 to 54 Years | 49 (3.4%) | 86 (6.5%) |
| 55 to 59 Years | 90 (6.3%) | 67 (5.1%) |
| 60 to 64 Years | 54 (3.8%) | 32 (2.4%) |
| 65 to 69 Years | 41 (2.9%) | 86 (6.5%) |
| 70 to 74 Years | 63 (4.4%) | 33 (2.5%) |
| 75 to 79 Years | 18 (1.3%) | 59 (4.5%) |
| 80 to 84 Years | 11 (0.8%) | 28 (2.1%) |
| 85 Years and over | 18 (1.3%) | 66 (5.0%) |
| Total | 1,436 (100.0%) | 1,315 (100.0%) |
Families and Households in Monterey
Median Family Size in Monterey
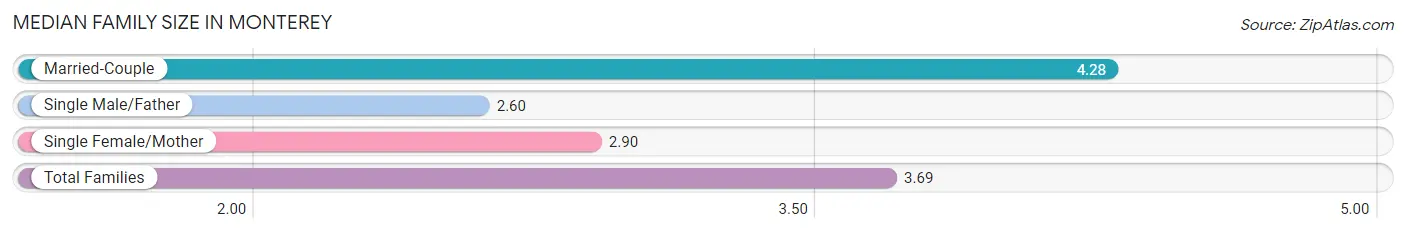
The median family size in Monterey is 3.69 persons per family, with married-couple families (378 | 60.3%) accounting for the largest median family size of 4.28 persons per family. On the other hand, single male/father families (82 | 13.1%) represent the smallest median family size with 2.60 persons per family.
| Family Type | # Families | Family Size |
| Married-Couple | 378 (60.3%) | 4.28 |
| Single Male/Father | 82 (13.1%) | 2.60 |
| Single Female/Mother | 167 (26.6%) | 2.90 |
| Total Families | 627 (100.0%) | 3.69 |
Median Household Size in Monterey
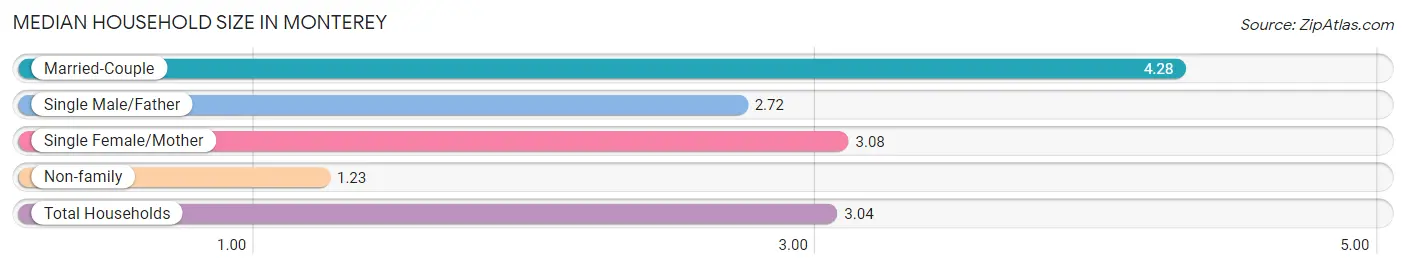
The median household size in Monterey is 3.04 persons per household, with married-couple households (378 | 43.1%) accounting for the largest median household size of 4.28 persons per household. non-family households (250 | 28.5%) represent the smallest median household size with 1.23 persons per household.
| Household Type | # Households | Household Size |
| Married-Couple | 378 (43.1%) | 4.28 |
| Single Male/Father | 82 (9.3%) | 2.72 |
| Single Female/Mother | 167 (19.0%) | 3.08 |
| Non-family | 250 (28.5%) | 1.23 |
| Total Households | 877 (100.0%) | 3.04 |
Household Size by Marriage Status in Monterey
Out of a total of 877 households in Monterey, 627 (71.5%) are family households, while 250 (28.5%) are nonfamily households. The most numerous type of family households are 2-person households, comprising 242, and the most common type of nonfamily households are 1-person households, comprising 191.
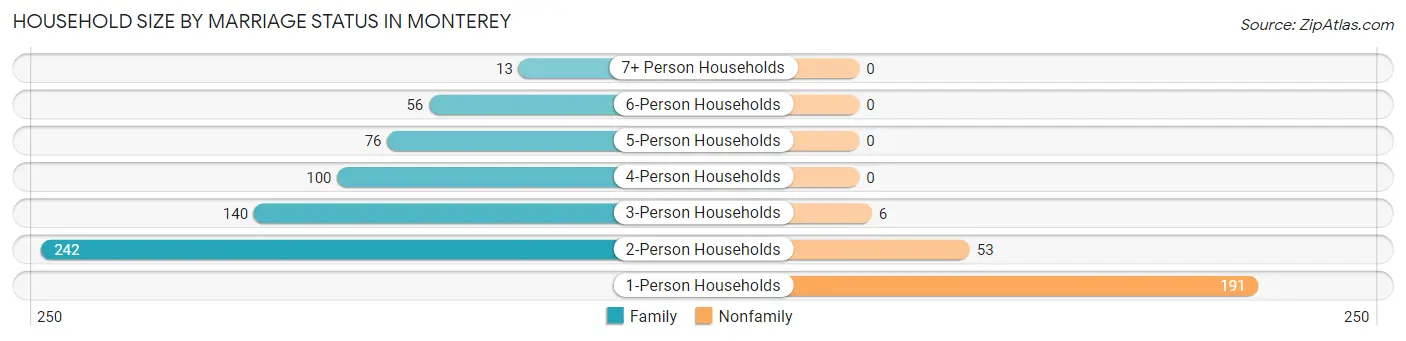
| Household Size | Family Households | Nonfamily Households |
| 1-Person Households | - | 191 (21.8%) |
| 2-Person Households | 242 (27.6%) | 53 (6.0%) |
| 3-Person Households | 140 (16.0%) | 6 (0.7%) |
| 4-Person Households | 100 (11.4%) | 0 (0.0%) |
| 5-Person Households | 76 (8.7%) | 0 (0.0%) |
| 6-Person Households | 56 (6.4%) | 0 (0.0%) |
| 7+ Person Households | 13 (1.5%) | 0 (0.0%) |
| Total | 627 (71.5%) | 250 (28.5%) |
Female Fertility in Monterey
Fertility by Age in Monterey
Average fertility rate in Monterey is 63.0 births per 1,000 women. Women in the age bracket of 20 to 34 years have the highest fertility rate with 139.0 births per 1,000 women. Women in the age bracket of 20 to 34 years acount for 100.0% of all women with births.
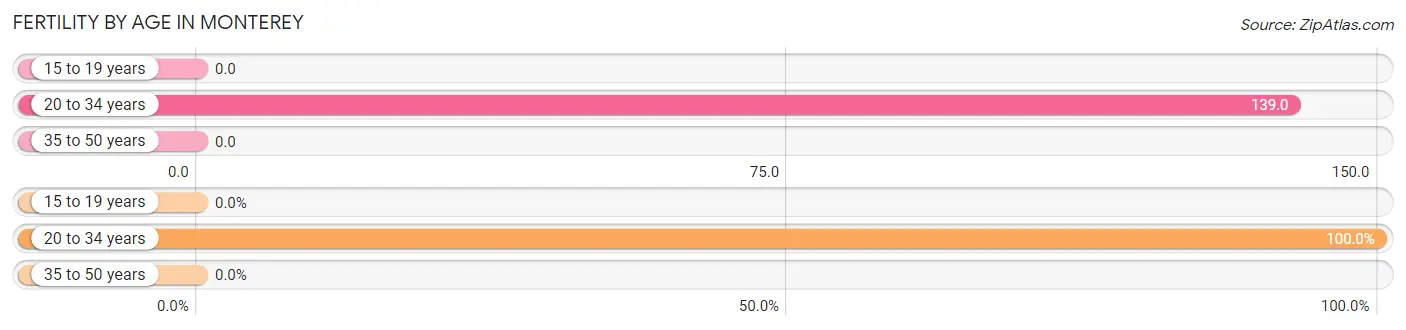
| Age Bracket | Women with Births | Births / 1,000 Women |
| 15 to 19 years | 0 (0.0%) | 0.0 |
| 20 to 34 years | 33 (100.0%) | 139.0 |
| 35 to 50 years | 0 (0.0%) | 0.0 |
| Total | 33 (100.0%) | 63.0 |
Fertility by Age by Marriage Status in Monterey
78.8% of women with births (33) in Monterey are married. The highest percentage of unmarried women with births falls into 20 to 34 years age bracket with 21.2% of them unmarried at the time of birth, while the lowest percentage of unmarried women with births belong to 20 to 34 years age bracket with 21.2% of them unmarried.
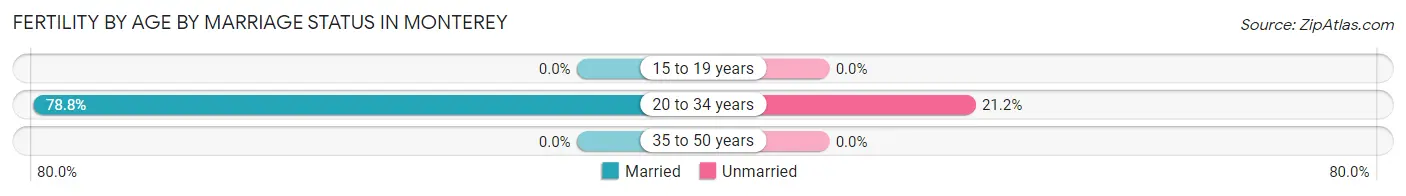
| Age Bracket | Married | Unmarried |
| 15 to 19 years | 0 (0.0%) | 0 (0.0%) |
| 20 to 34 years | 26 (78.8%) | 7 (21.2%) |
| 35 to 50 years | 0 (0.0%) | 0 (0.0%) |
| Total | 26 (78.8%) | 7 (21.2%) |
Fertility by Education in Monterey
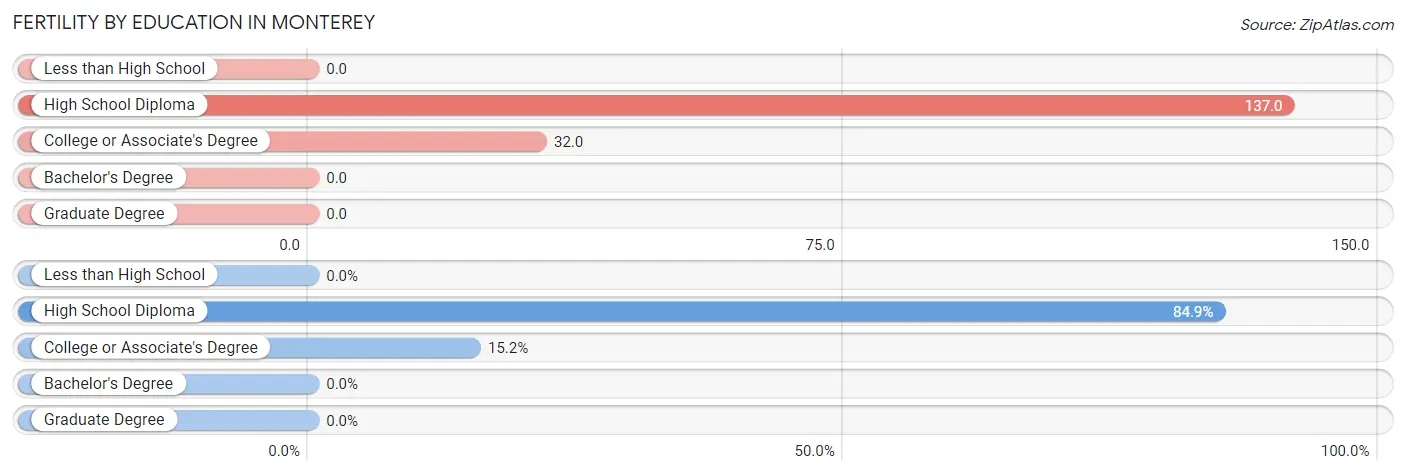
| Educational Attainment | Women with Births | Births / 1,000 Women |
| Less than High School | 0 (0.0%) | 0.0 |
| High School Diploma | 28 (84.9%) | 137.0 |
| College or Associate's Degree | 5 (15.1%) | 32.0 |
| Bachelor's Degree | 0 (0.0%) | 0.0 |
| Graduate Degree | 0 (0.0%) | 0.0 |
| Total | 33 (100.0%) | 63.0 |
Fertility by Education by Marriage Status in Monterey
21.2% of women with births in Monterey are unmarried. Women with the educational attainment of high school diploma are most likely to be married with 92.9% of them married at childbirth, while women with the educational attainment of college or associate's degree are least likely to be married with 100.0% of them unmarried at childbirth.
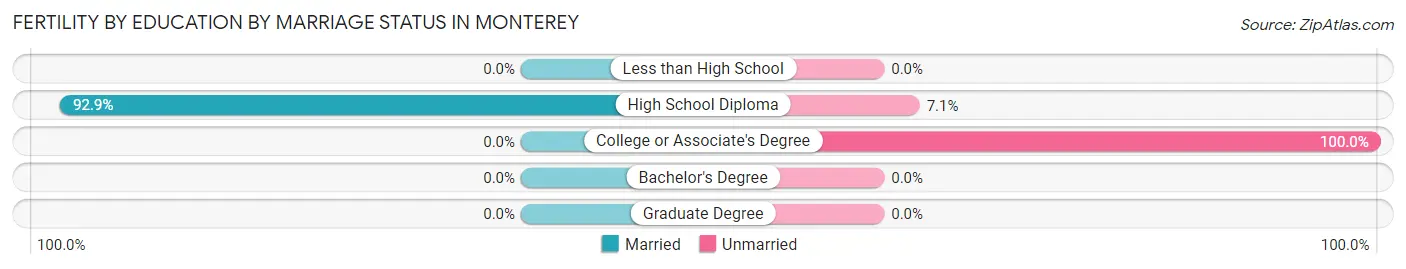
| Educational Attainment | Married | Unmarried |
| Less than High School | 0 (0.0%) | 0 (0.0%) |
| High School Diploma | 26 (92.9%) | 2 (7.1%) |
| College or Associate's Degree | 0 (0.0%) | 5 (100.0%) |
| Bachelor's Degree | 0 (0.0%) | 0 (0.0%) |
| Graduate Degree | 0 (0.0%) | 0 (0.0%) |
| Total | 26 (78.8%) | 7 (21.2%) |
Employment Characteristics in Monterey
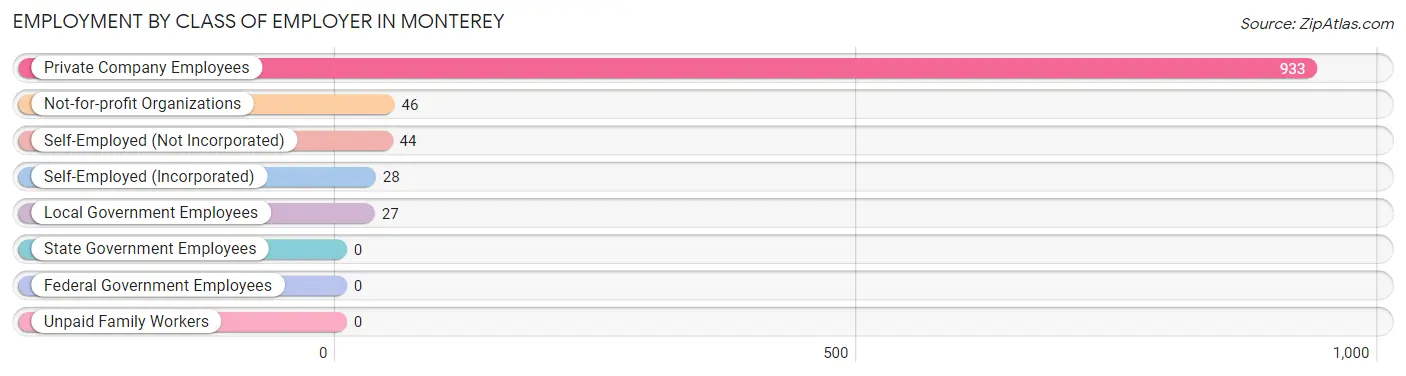
Employment by Class of Employer in Monterey
Among the 1,078 employed individuals in Monterey, private company employees (933 | 86.6%), not-for-profit organizations (46 | 4.3%), and self-employed (not incorporated) (44 | 4.1%) make up the most common classes of employment.
| Employer Class | # Employees | % Employees |
| Private Company Employees | 933 | 86.6% |
| Self-Employed (Incorporated) | 28 | 2.6% |
| Self-Employed (Not Incorporated) | 44 | 4.1% |
| Not-for-profit Organizations | 46 | 4.3% |
| Local Government Employees | 27 | 2.5% |
| State Government Employees | 0 | 0.0% |
| Federal Government Employees | 0 | 0.0% |
| Unpaid Family Workers | 0 | 0.0% |
| Total | 1,078 | 100.0% |
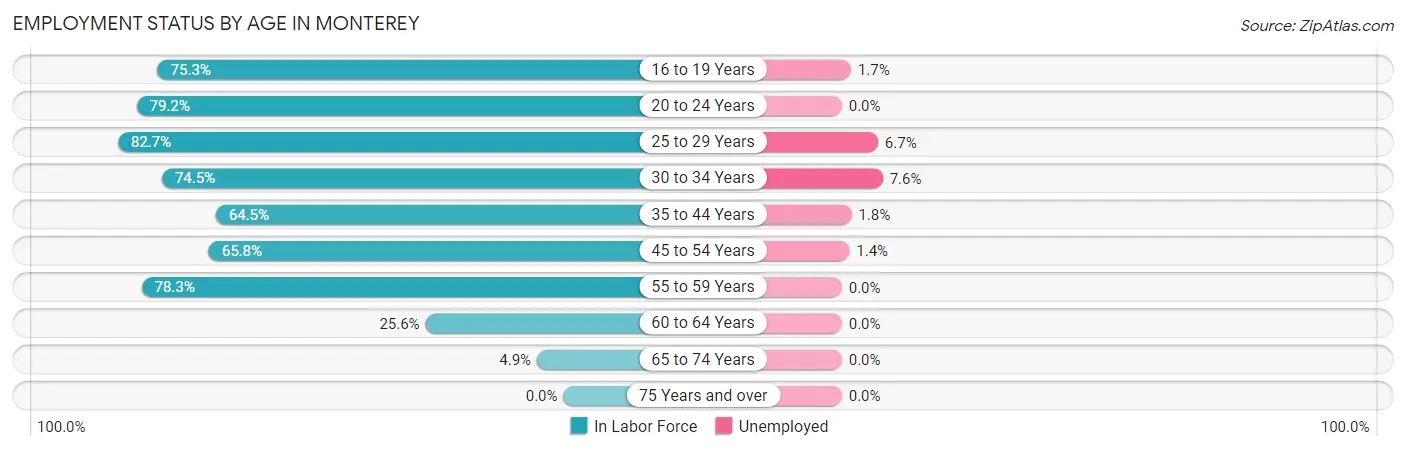
Employment Status by Age in Monterey
According to the labor force statistics for Monterey, out of the total population over 16 years of age (1,968), 56.5% or 1,112 individuals are in the labor force, with 2.7% or 30 of them unemployed. The age group with the highest labor force participation rate is 25 to 29 years, with 82.7% or 225 individuals in the labor force. Within the labor force, the 30 to 34 years age range has the highest percentage of unemployed individuals, with 7.6% or 6 of them being unemployed.
| Age Bracket | In Labor Force | Unemployed |
| 16 to 19 Years | 229 (75.3%) | 4 (1.7%) |
| 20 to 24 Years | 103 (79.2%) | 0 (0.0%) |
| 25 to 29 Years | 225 (82.7%) | 15 (6.7%) |
| 30 to 34 Years | 79 (74.5%) | 6 (7.6%) |
| 35 to 44 Years | 171 (64.5%) | 3 (1.8%) |
| 45 to 54 Years | 148 (65.8%) | 2 (1.4%) |
| 55 to 59 Years | 123 (78.3%) | 0 (0.0%) |
| 60 to 64 Years | 22 (25.6%) | 0 (0.0%) |
| 65 to 74 Years | 11 (4.9%) | 0 (0.0%) |
| 75 Years and over | 0 (0.0%) | 0 (0.0%) |
| Total | 1,112 (56.5%) | 30 (2.7%) |
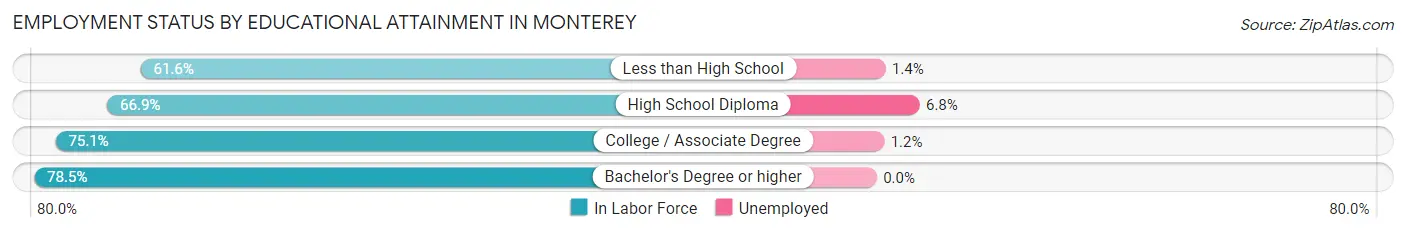
Employment Status by Educational Attainment in Monterey
According to labor force statistics for Monterey, 69.1% of individuals (768) out of the total population between 25 and 64 years of age (1,111) are in the labor force, with 3.4% or 26 of them being unemployed. The group with the highest labor force participation rate are those with the educational attainment of bachelor's degree or higher, with 78.5% or 62 individuals in the labor force. Within the labor force, individuals with high school diploma education have the highest percentage of unemployment, with 6.8% or 21 of them being unemployed.
| Educational Attainment | In Labor Force | Unemployed |
| Less than High School | 143 (61.6%) | 3 (1.4%) |
| High School Diploma | 309 (66.9%) | 31 (6.8%) |
| College / Associate Degree | 254 (75.1%) | 4 (1.2%) |
| Bachelor's Degree or higher | 62 (78.5%) | 0 (0.0%) |
| Total | 768 (69.1%) | 38 (3.4%) |
Employment Occupations by Sex in Monterey
Management, Business, Science and Arts Occupations
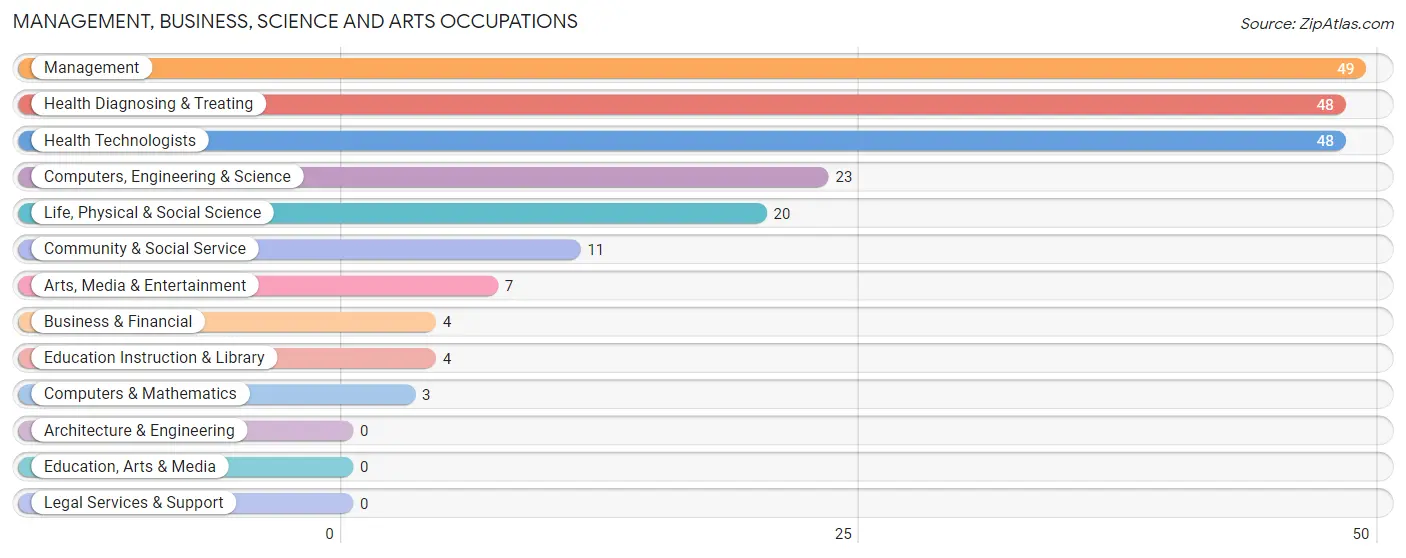
The most common Management, Business, Science and Arts occupations in Monterey are Management (49 | 4.5%), Health Diagnosing & Treating (48 | 4.4%), Health Technologists (48 | 4.4%), Computers, Engineering & Science (23 | 2.1%), and Life, Physical & Social Science (20 | 1.8%).
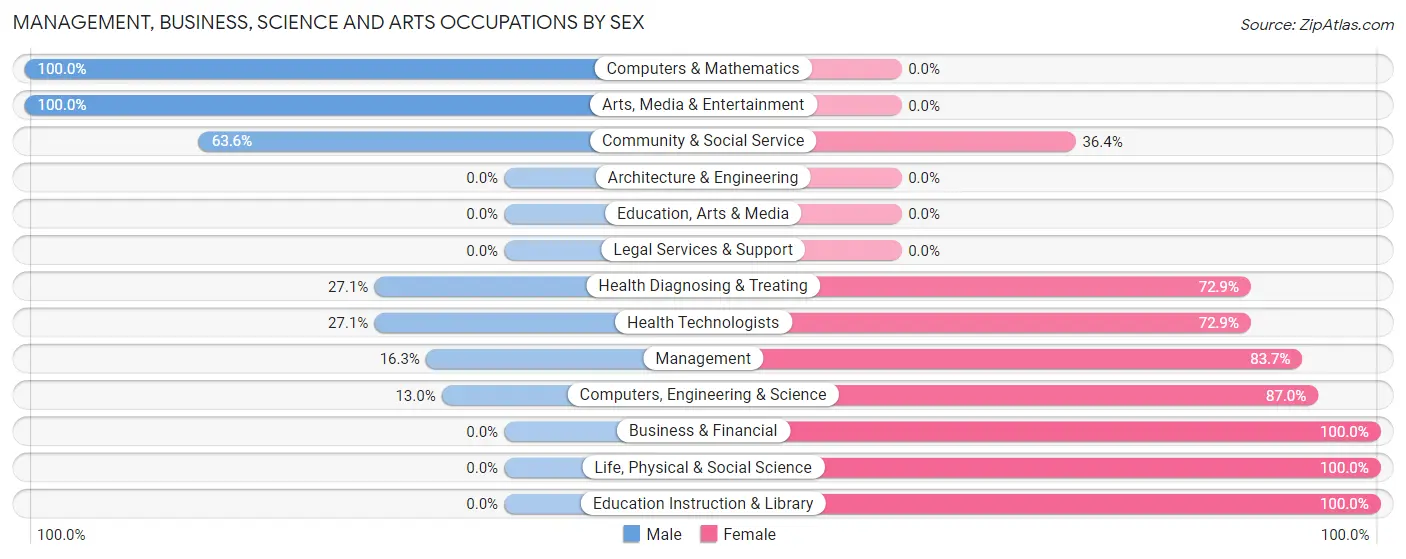
Management, Business, Science and Arts Occupations by Sex
Within the Management, Business, Science and Arts occupations in Monterey, the most male-oriented occupations are Computers & Mathematics (100.0%), Arts, Media & Entertainment (100.0%), and Community & Social Service (63.6%), while the most female-oriented occupations are Business & Financial (100.0%), Life, Physical & Social Science (100.0%), and Education Instruction & Library (100.0%).
| Occupation | Male | Female |
| Management | 8 (16.3%) | 41 (83.7%) |
| Business & Financial | 0 (0.0%) | 4 (100.0%) |
| Computers, Engineering & Science | 3 (13.0%) | 20 (87.0%) |
| Computers & Mathematics | 3 (100.0%) | 0 (0.0%) |
| Architecture & Engineering | 0 (0.0%) | 0 (0.0%) |
| Life, Physical & Social Science | 0 (0.0%) | 20 (100.0%) |
| Community & Social Service | 7 (63.6%) | 4 (36.4%) |
| Education, Arts & Media | 0 (0.0%) | 0 (0.0%) |
| Legal Services & Support | 0 (0.0%) | 0 (0.0%) |
| Education Instruction & Library | 0 (0.0%) | 4 (100.0%) |
| Arts, Media & Entertainment | 7 (100.0%) | 0 (0.0%) |
| Health Diagnosing & Treating | 13 (27.1%) | 35 (72.9%) |
| Health Technologists | 13 (27.1%) | 35 (72.9%) |
| Total (Category) | 31 (23.0%) | 104 (77.0%) |
| Total (Overall) | 704 (65.1%) | 377 (34.9%) |
Services Occupations
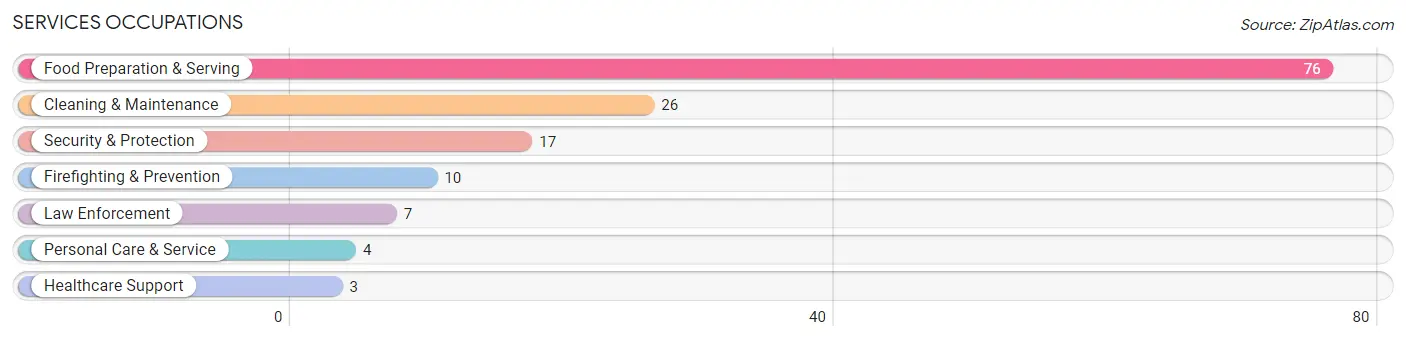
The most common Services occupations in Monterey are Food Preparation & Serving (76 | 7.0%), Cleaning & Maintenance (26 | 2.4%), Security & Protection (17 | 1.6%), Firefighting & Prevention (10 | 0.9%), and Law Enforcement (7 | 0.6%).
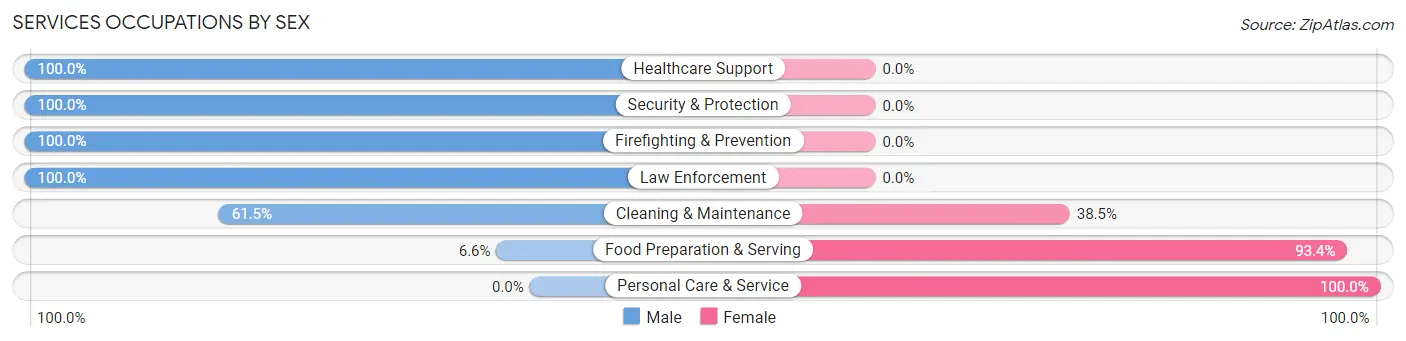
Services Occupations by Sex
Within the Services occupations in Monterey, the most male-oriented occupations are Healthcare Support (100.0%), Security & Protection (100.0%), and Firefighting & Prevention (100.0%), while the most female-oriented occupations are Personal Care & Service (100.0%), Food Preparation & Serving (93.4%), and Cleaning & Maintenance (38.5%).
| Occupation | Male | Female |
| Healthcare Support | 3 (100.0%) | 0 (0.0%) |
| Security & Protection | 17 (100.0%) | 0 (0.0%) |
| Firefighting & Prevention | 10 (100.0%) | 0 (0.0%) |
| Law Enforcement | 7 (100.0%) | 0 (0.0%) |
| Food Preparation & Serving | 5 (6.6%) | 71 (93.4%) |
| Cleaning & Maintenance | 16 (61.5%) | 10 (38.5%) |
| Personal Care & Service | 0 (0.0%) | 4 (100.0%) |
| Total (Category) | 41 (32.5%) | 85 (67.5%) |
| Total (Overall) | 704 (65.1%) | 377 (34.9%) |
Sales and Office Occupations
The most common Sales and Office occupations in Monterey are Office & Administration (126 | 11.7%), and Sales & Related (41 | 3.8%).
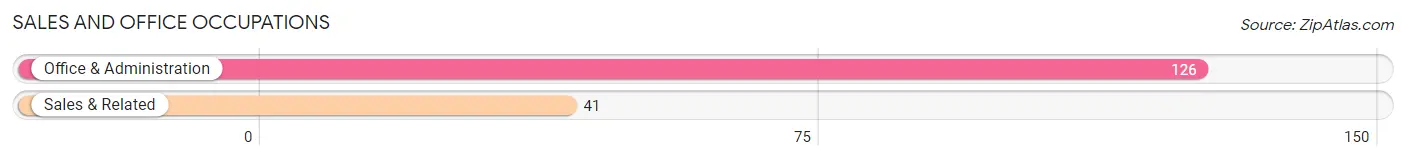
Sales and Office Occupations by Sex
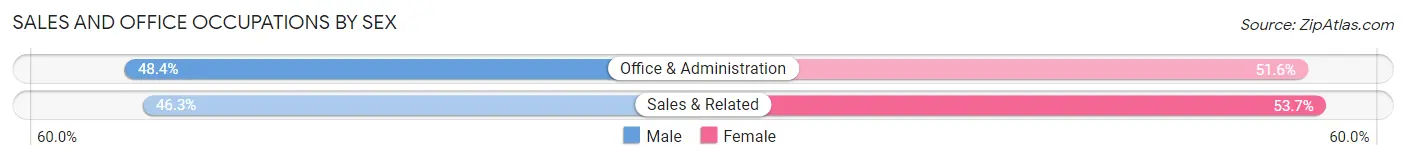
| Occupation | Male | Female |
| Sales & Related | 19 (46.3%) | 22 (53.7%) |
| Office & Administration | 61 (48.4%) | 65 (51.6%) |
| Total (Category) | 80 (47.9%) | 87 (52.1%) |
| Total (Overall) | 704 (65.1%) | 377 (34.9%) |
Natural Resources, Construction and Maintenance Occupations
The most common Natural Resources, Construction and Maintenance occupations in Monterey are Construction & Extraction (83 | 7.7%), Installation, Maintenance & Repair (56 | 5.2%), and Farming, Fishing & Forestry (5 | 0.5%).
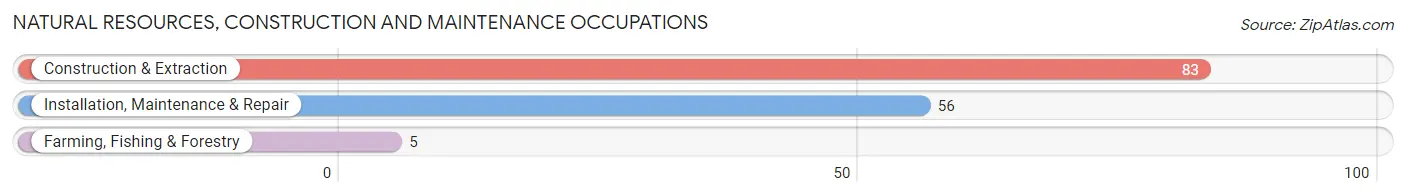
Natural Resources, Construction and Maintenance Occupations by Sex
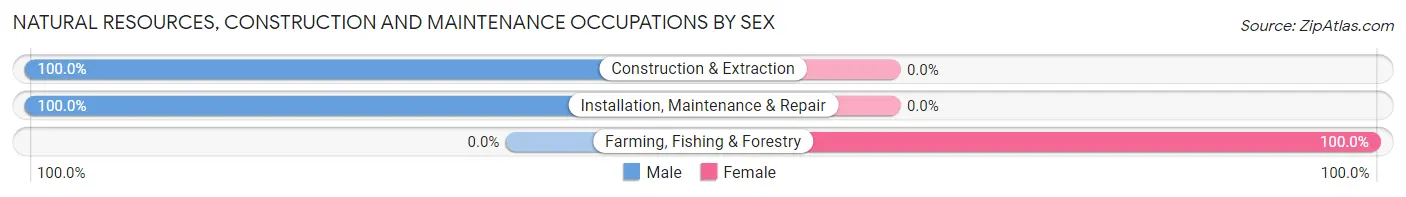
| Occupation | Male | Female |
| Farming, Fishing & Forestry | 0 (0.0%) | 5 (100.0%) |
| Construction & Extraction | 83 (100.0%) | 0 (0.0%) |
| Installation, Maintenance & Repair | 56 (100.0%) | 0 (0.0%) |
| Total (Category) | 139 (96.5%) | 5 (3.5%) |
| Total (Overall) | 704 (65.1%) | 377 (34.9%) |
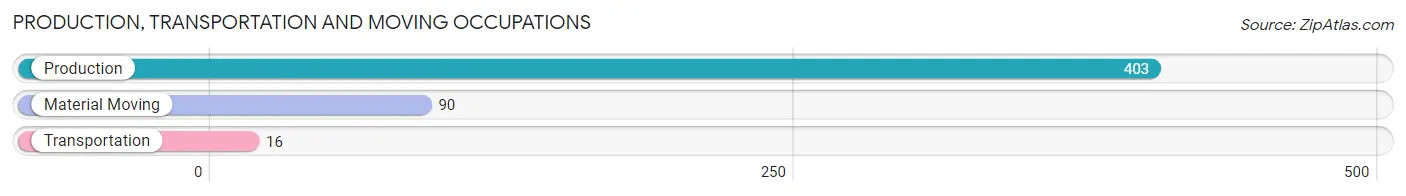
Production, Transportation and Moving Occupations
The most common Production, Transportation and Moving occupations in Monterey are Production (403 | 37.3%), Material Moving (90 | 8.3%), and Transportation (16 | 1.5%).
Production, Transportation and Moving Occupations by Sex
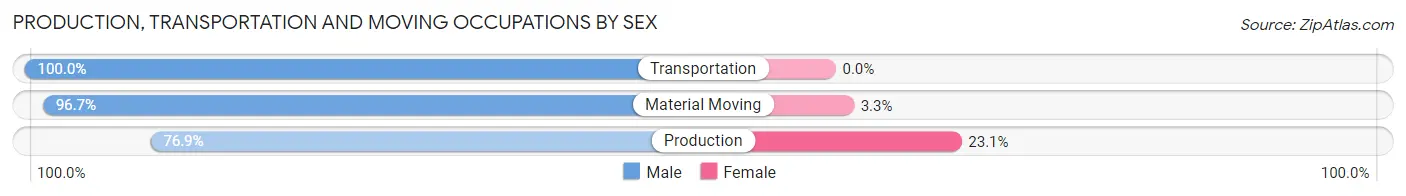
| Occupation | Male | Female |
| Production | 310 (76.9%) | 93 (23.1%) |
| Transportation | 16 (100.0%) | 0 (0.0%) |
| Material Moving | 87 (96.7%) | 3 (3.3%) |
| Total (Category) | 413 (81.1%) | 96 (18.9%) |
| Total (Overall) | 704 (65.1%) | 377 (34.9%) |
Employment Industries by Sex in Monterey
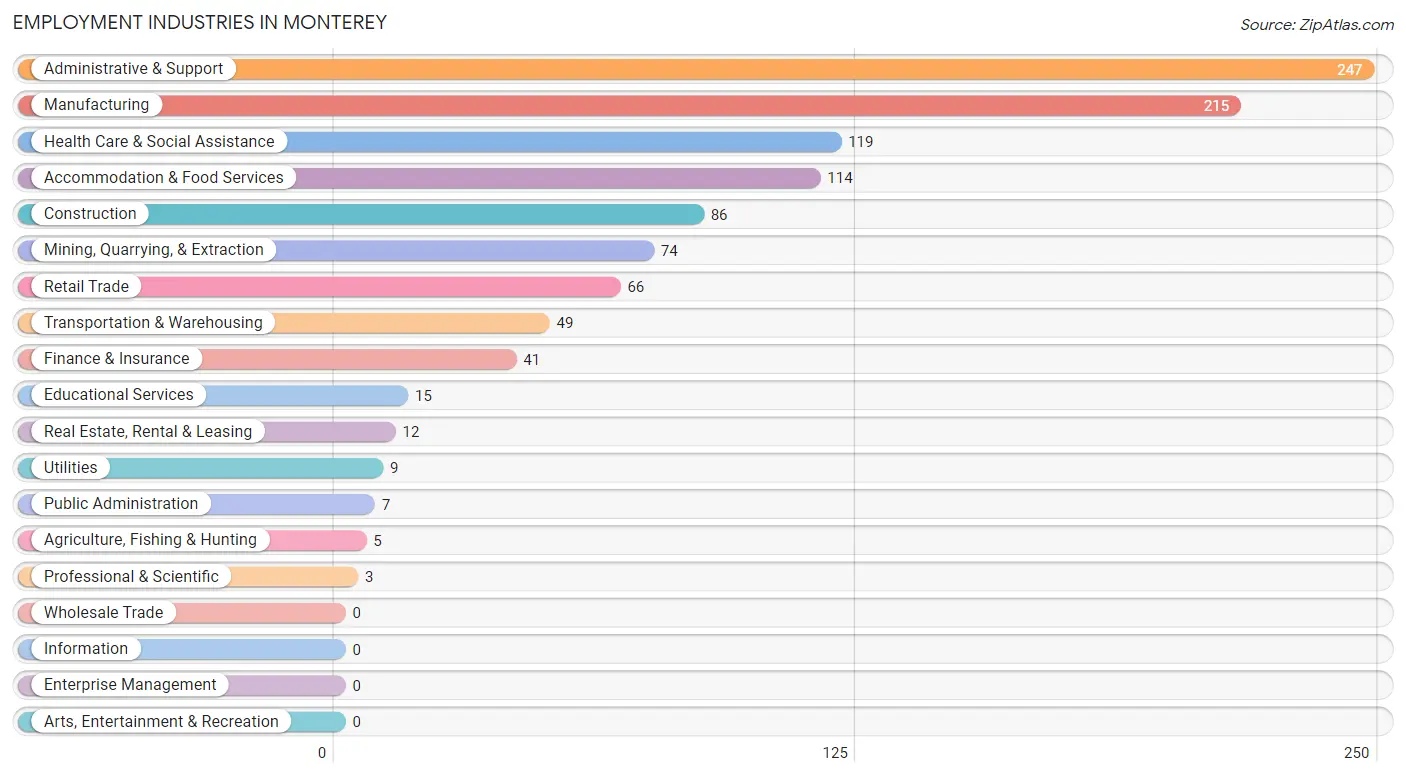
Employment Industries in Monterey
The major employment industries in Monterey include Administrative & Support (247 | 22.9%), Manufacturing (215 | 19.9%), Health Care & Social Assistance (119 | 11.0%), Accommodation & Food Services (114 | 10.5%), and Construction (86 | 8.0%).
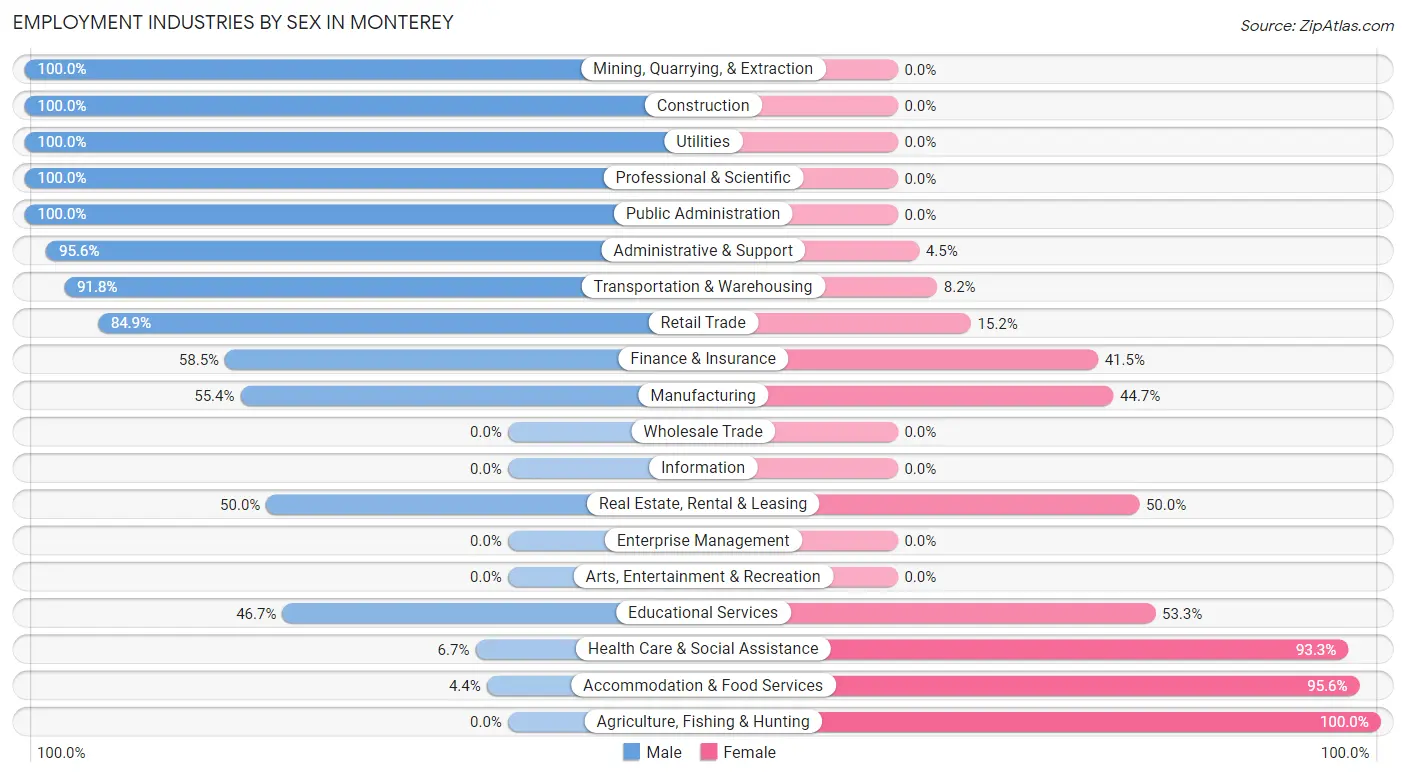
Employment Industries by Sex in Monterey
The Monterey industries that see more men than women are Mining, Quarrying, & Extraction (100.0%), Construction (100.0%), and Utilities (100.0%), whereas the industries that tend to have a higher number of women are Agriculture, Fishing & Hunting (100.0%), Accommodation & Food Services (95.6%), and Health Care & Social Assistance (93.3%).
| Industry | Male | Female |
| Agriculture, Fishing & Hunting | 0 (0.0%) | 5 (100.0%) |
| Mining, Quarrying, & Extraction | 74 (100.0%) | 0 (0.0%) |
| Construction | 86 (100.0%) | 0 (0.0%) |
| Manufacturing | 119 (55.3%) | 96 (44.7%) |
| Wholesale Trade | 0 (0.0%) | 0 (0.0%) |
| Retail Trade | 56 (84.9%) | 10 (15.1%) |
| Transportation & Warehousing | 45 (91.8%) | 4 (8.2%) |
| Utilities | 9 (100.0%) | 0 (0.0%) |
| Information | 0 (0.0%) | 0 (0.0%) |
| Finance & Insurance | 24 (58.5%) | 17 (41.5%) |
| Real Estate, Rental & Leasing | 6 (50.0%) | 6 (50.0%) |
| Professional & Scientific | 3 (100.0%) | 0 (0.0%) |
| Enterprise Management | 0 (0.0%) | 0 (0.0%) |
| Administrative & Support | 236 (95.6%) | 11 (4.4%) |
| Educational Services | 7 (46.7%) | 8 (53.3%) |
| Health Care & Social Assistance | 8 (6.7%) | 111 (93.3%) |
| Arts, Entertainment & Recreation | 0 (0.0%) | 0 (0.0%) |
| Accommodation & Food Services | 5 (4.4%) | 109 (95.6%) |
| Public Administration | 7 (100.0%) | 0 (0.0%) |
| Total | 704 (65.1%) | 377 (34.9%) |
Education in Monterey
School Enrollment in Monterey
The most common levels of schooling among the 825 students in Monterey are high school (360 | 43.6%), elementary school (152 | 18.4%), and middle school (150 | 18.2%).
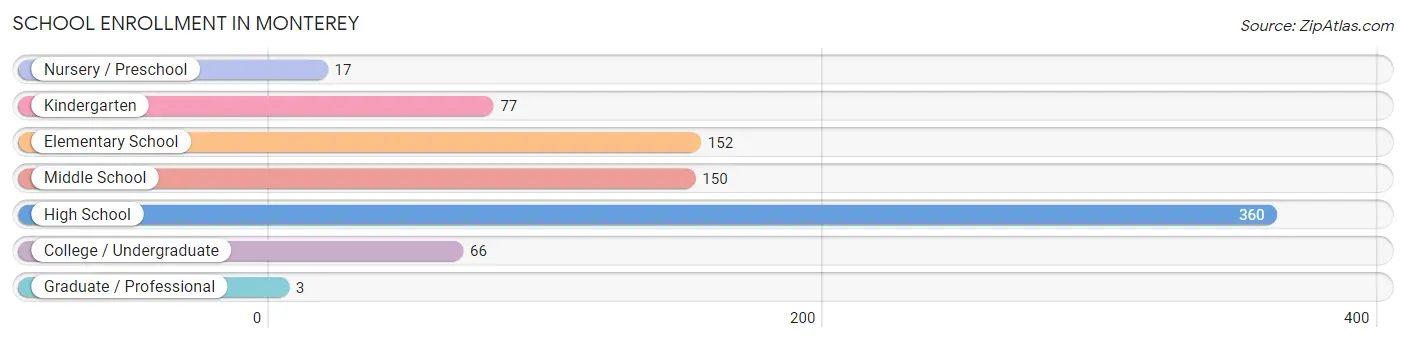
| School Level | # Students | % Students |
| Nursery / Preschool | 17 | 2.1% |
| Kindergarten | 77 | 9.3% |
| Elementary School | 152 | 18.4% |
| Middle School | 150 | 18.2% |
| High School | 360 | 43.6% |
| College / Undergraduate | 66 | 8.0% |
| Graduate / Professional | 3 | 0.4% |
| Total | 825 | 100.0% |
School Enrollment by Age by Funding Source in Monterey
Out of a total of 825 students who are enrolled in schools in Monterey, 108 (13.1%) attend a private institution, while the remaining 717 (86.9%) are enrolled in public schools. The age group of 35 years and over has the highest likelihood of being enrolled in private schools, with 42 (100.0% in the age bracket) enrolled. Conversely, the age group of 3 to 4 year olds has the lowest likelihood of being enrolled in a private school, with 7 (100.0% in the age bracket) attending a public institution.
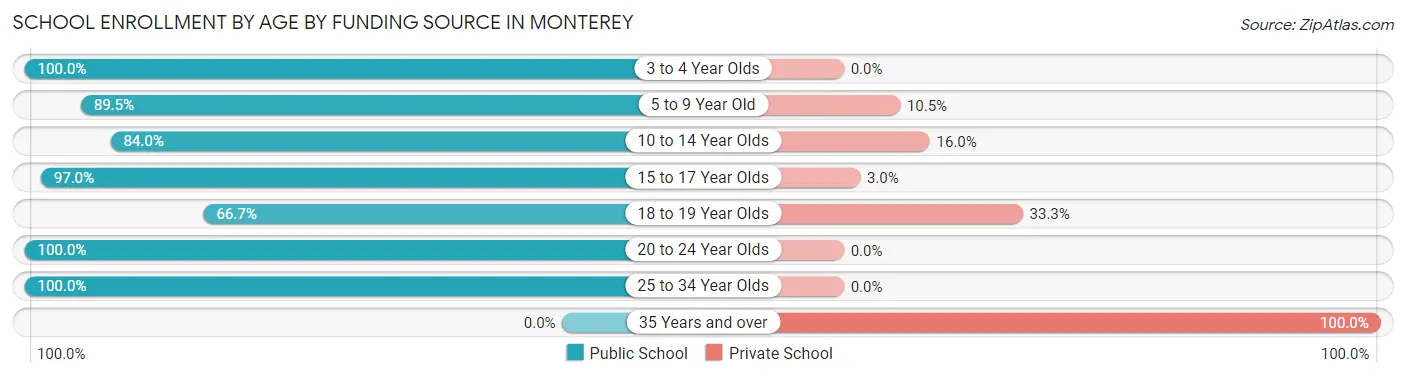
| Age Bracket | Public School | Private School |
| 3 to 4 Year Olds | 7 (100.0%) | 0 (0.0%) |
| 5 to 9 Year Old | 188 (89.5%) | 22 (10.5%) |
| 10 to 14 Year Olds | 147 (84.0%) | 28 (16.0%) |
| 15 to 17 Year Olds | 351 (97.0%) | 11 (3.0%) |
| 18 to 19 Year Olds | 10 (66.7%) | 5 (33.3%) |
| 20 to 24 Year Olds | 7 (100.0%) | 0 (0.0%) |
| 25 to 34 Year Olds | 7 (100.0%) | 0 (0.0%) |
| 35 Years and over | 0 (0.0%) | 42 (100.0%) |
| Total | 717 (86.9%) | 108 (13.1%) |
Educational Attainment by Field of Study in Monterey
Business (42 | 29.0%), science & technology (21 | 14.5%), engineering (20 | 13.8%), arts & humanities (20 | 13.8%), and education (11 | 7.6%) are the most common fields of study among 145 individuals in Monterey who have obtained a bachelor's degree or higher.
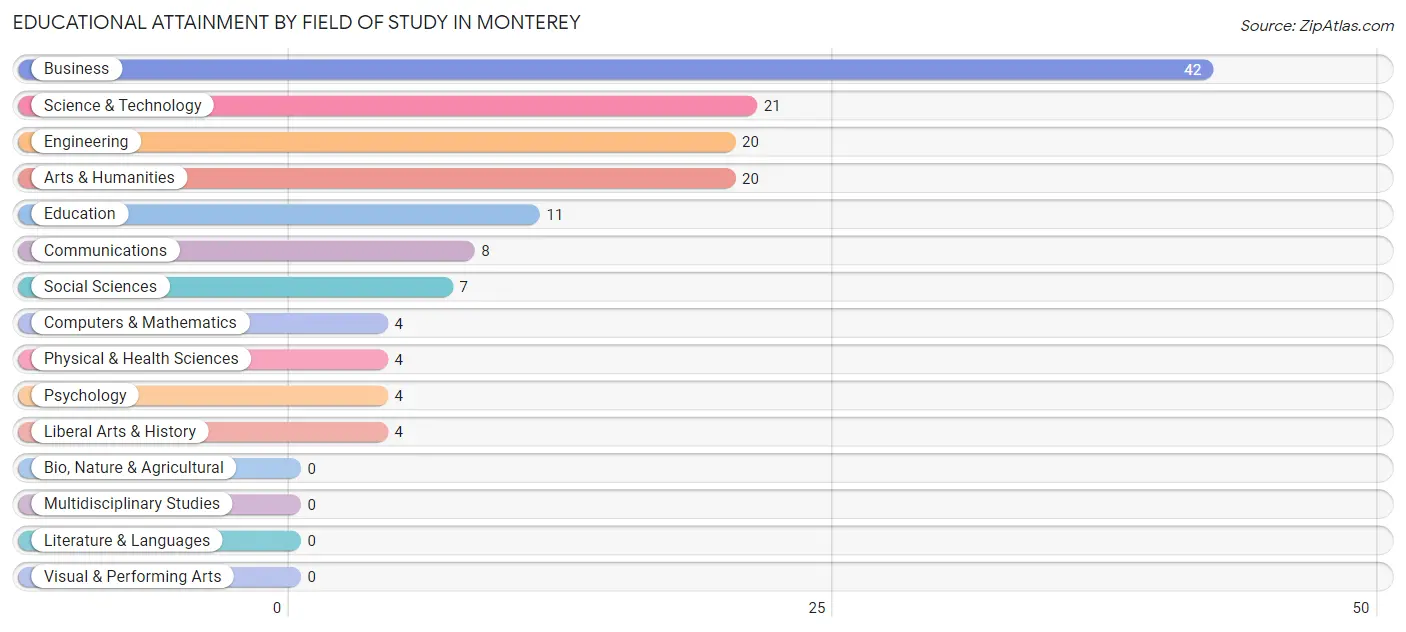
| Field of Study | # Graduates | % Graduates |
| Computers & Mathematics | 4 | 2.8% |
| Bio, Nature & Agricultural | 0 | 0.0% |
| Physical & Health Sciences | 4 | 2.8% |
| Psychology | 4 | 2.8% |
| Social Sciences | 7 | 4.8% |
| Engineering | 20 | 13.8% |
| Multidisciplinary Studies | 0 | 0.0% |
| Science & Technology | 21 | 14.5% |
| Business | 42 | 29.0% |
| Education | 11 | 7.6% |
| Literature & Languages | 0 | 0.0% |
| Liberal Arts & History | 4 | 2.8% |
| Visual & Performing Arts | 0 | 0.0% |
| Communications | 8 | 5.5% |
| Arts & Humanities | 20 | 13.8% |
| Total | 145 | 100.0% |
Transportation & Commute in Monterey
Vehicle Availability by Sex in Monterey
The most prevalent vehicle ownership categories in Monterey are males with 3 vehicles (369, accounting for 52.6%) and females with 3 vehicles (29, making up 97.9%).
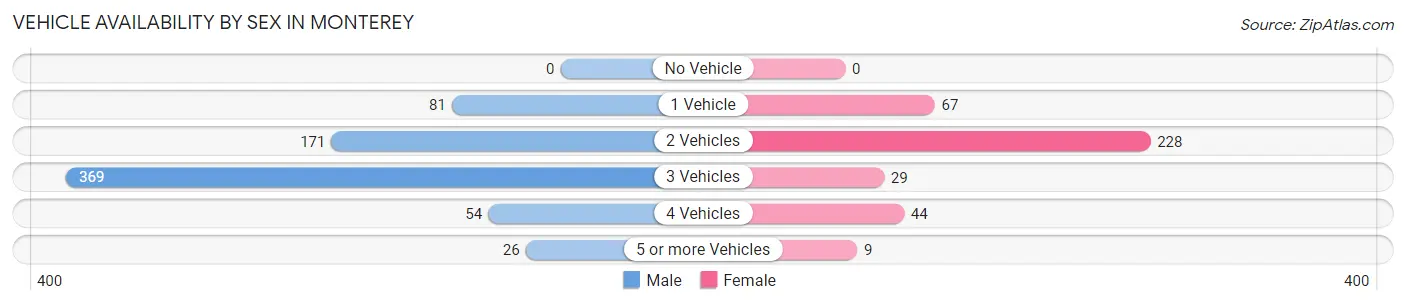
| Vehicles Available | Male | Female |
| No Vehicle | 0 (0.0%) | 0 (0.0%) |
| 1 Vehicle | 81 (11.6%) | 67 (17.8%) |
| 2 Vehicles | 171 (24.4%) | 228 (60.5%) |
| 3 Vehicles | 369 (52.6%) | 29 (7.7%) |
| 4 Vehicles | 54 (7.7%) | 44 (11.7%) |
| 5 or more Vehicles | 26 (3.7%) | 9 (2.4%) |
| Total | 701 (100.0%) | 377 (100.0%) |
Commute Time in Monterey
The most frequently occuring commute durations in Monterey are 30 to 34 minutes (353 commuters, 33.2%), 15 to 19 minutes (264 commuters, 24.8%), and 20 to 24 minutes (169 commuters, 15.9%).
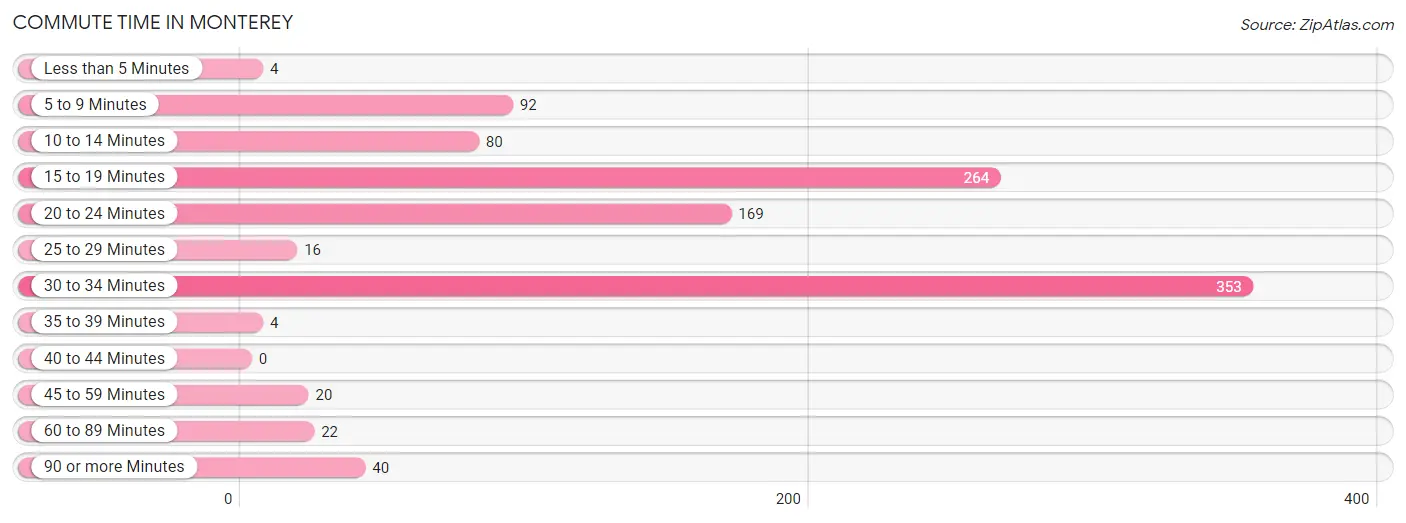
| Commute Time | # Commuters | % Commuters |
| Less than 5 Minutes | 4 | 0.4% |
| 5 to 9 Minutes | 92 | 8.6% |
| 10 to 14 Minutes | 80 | 7.5% |
| 15 to 19 Minutes | 264 | 24.8% |
| 20 to 24 Minutes | 169 | 15.9% |
| 25 to 29 Minutes | 16 | 1.5% |
| 30 to 34 Minutes | 353 | 33.2% |
| 35 to 39 Minutes | 4 | 0.4% |
| 40 to 44 Minutes | 0 | 0.0% |
| 45 to 59 Minutes | 20 | 1.9% |
| 60 to 89 Minutes | 22 | 2.1% |
| 90 or more Minutes | 40 | 3.8% |
Commute Time by Sex in Monterey
The most common commute times in Monterey are 15 to 19 minutes (260 commuters, 37.2%) for males and 30 to 34 minutes (125 commuters, 34.2%) for females.
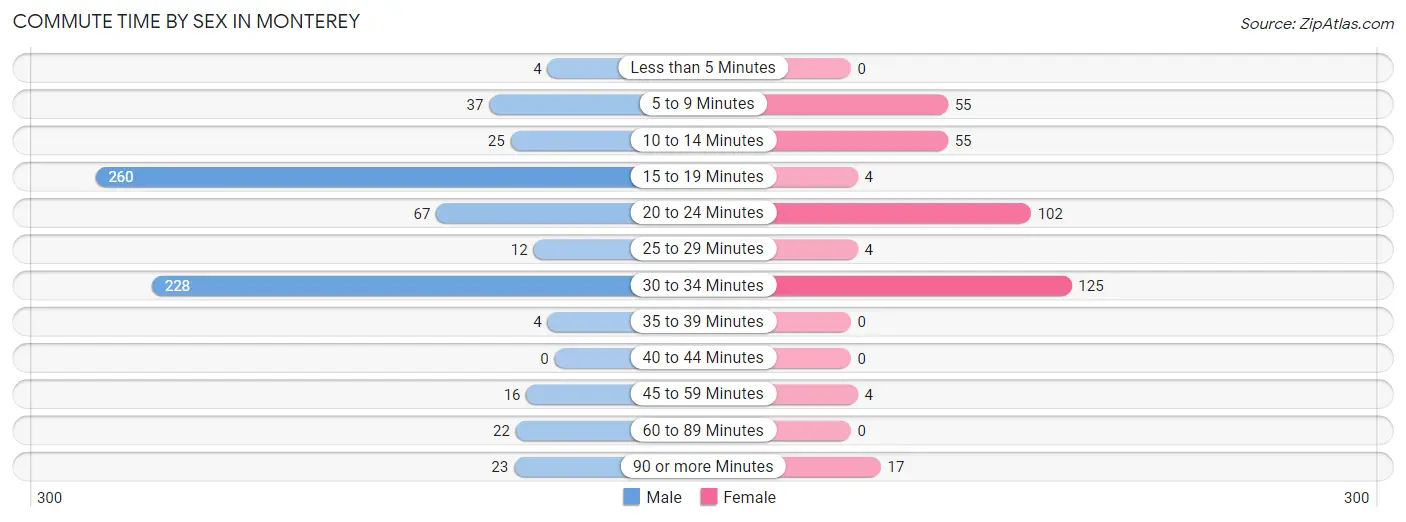
| Commute Time | Male | Female |
| Less than 5 Minutes | 4 (0.6%) | 0 (0.0%) |
| 5 to 9 Minutes | 37 (5.3%) | 55 (15.0%) |
| 10 to 14 Minutes | 25 (3.6%) | 55 (15.0%) |
| 15 to 19 Minutes | 260 (37.2%) | 4 (1.1%) |
| 20 to 24 Minutes | 67 (9.6%) | 102 (27.9%) |
| 25 to 29 Minutes | 12 (1.7%) | 4 (1.1%) |
| 30 to 34 Minutes | 228 (32.7%) | 125 (34.2%) |
| 35 to 39 Minutes | 4 (0.6%) | 0 (0.0%) |
| 40 to 44 Minutes | 0 (0.0%) | 0 (0.0%) |
| 45 to 59 Minutes | 16 (2.3%) | 4 (1.1%) |
| 60 to 89 Minutes | 22 (3.2%) | 0 (0.0%) |
| 90 or more Minutes | 23 (3.3%) | 17 (4.6%) |
Time of Departure to Work by Sex in Monterey
The most frequent times of departure to work in Monterey are 12:00 PM to 3:59 PM (261, 37.4%) for males and 6:30 AM to 6:59 AM (92, 25.1%) for females.
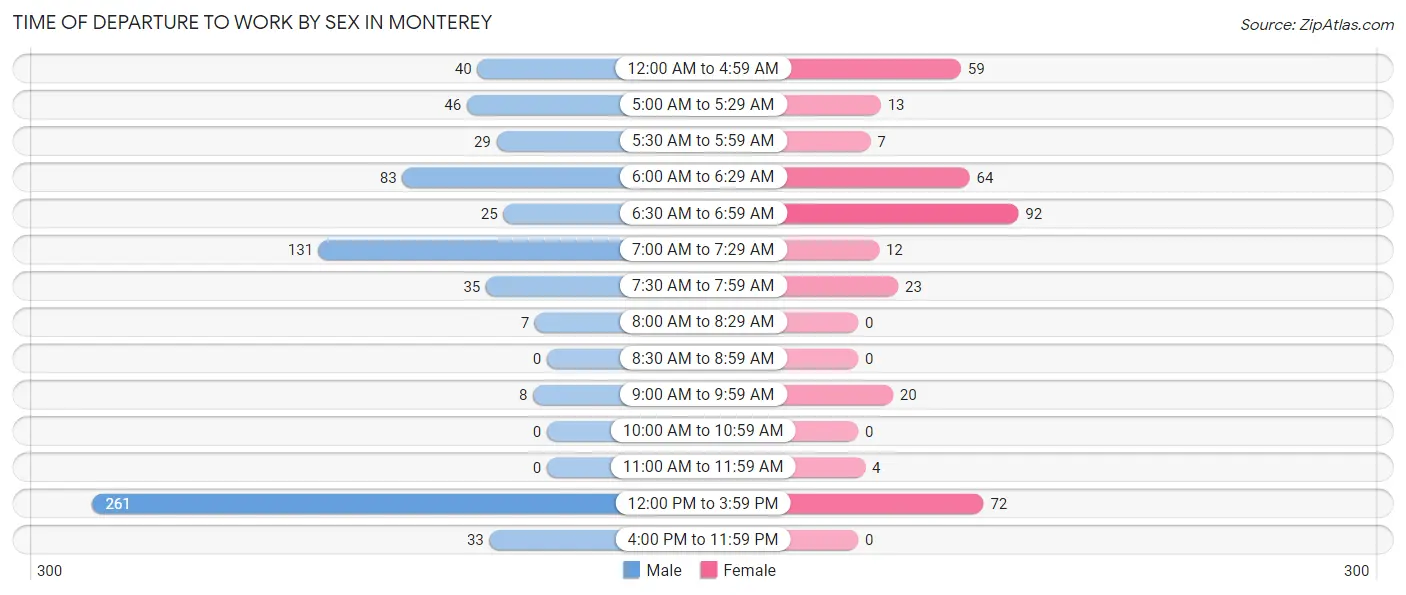
| Time of Departure | Male | Female |
| 12:00 AM to 4:59 AM | 40 (5.7%) | 59 (16.1%) |
| 5:00 AM to 5:29 AM | 46 (6.6%) | 13 (3.5%) |
| 5:30 AM to 5:59 AM | 29 (4.2%) | 7 (1.9%) |
| 6:00 AM to 6:29 AM | 83 (11.9%) | 64 (17.5%) |
| 6:30 AM to 6:59 AM | 25 (3.6%) | 92 (25.1%) |
| 7:00 AM to 7:29 AM | 131 (18.8%) | 12 (3.3%) |
| 7:30 AM to 7:59 AM | 35 (5.0%) | 23 (6.3%) |
| 8:00 AM to 8:29 AM | 7 (1.0%) | 0 (0.0%) |
| 8:30 AM to 8:59 AM | 0 (0.0%) | 0 (0.0%) |
| 9:00 AM to 9:59 AM | 8 (1.1%) | 20 (5.5%) |
| 10:00 AM to 10:59 AM | 0 (0.0%) | 0 (0.0%) |
| 11:00 AM to 11:59 AM | 0 (0.0%) | 4 (1.1%) |
| 12:00 PM to 3:59 PM | 261 (37.4%) | 72 (19.7%) |
| 4:00 PM to 11:59 PM | 33 (4.7%) | 0 (0.0%) |
| Total | 698 (100.0%) | 366 (100.0%) |
Housing Occupancy in Monterey
Occupancy by Ownership in Monterey
Of the total 877 dwellings in Monterey, owner-occupied units account for 409 (46.6%), while renter-occupied units make up 468 (53.4%).
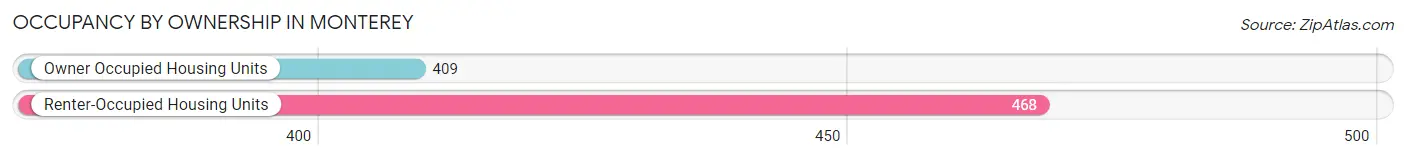
| Occupancy | # Housing Units | % Housing Units |
| Owner Occupied Housing Units | 409 | 46.6% |
| Renter-Occupied Housing Units | 468 | 53.4% |
| Total Occupied Housing Units | 877 | 100.0% |
Occupancy by Household Size in Monterey
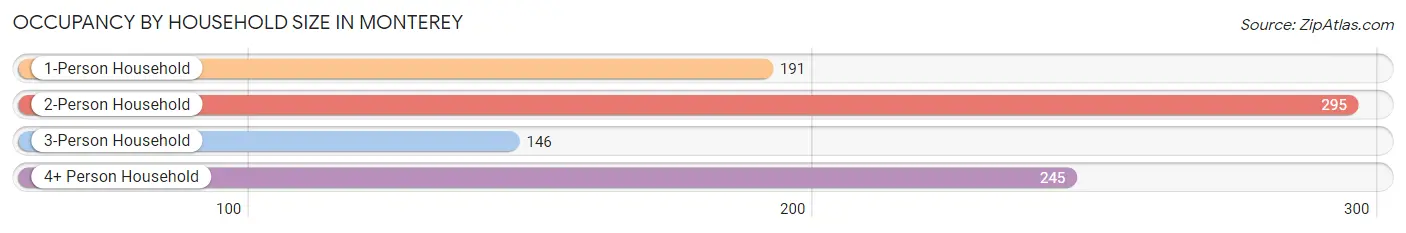
| Household Size | # Housing Units | % Housing Units |
| 1-Person Household | 191 | 21.8% |
| 2-Person Household | 295 | 33.6% |
| 3-Person Household | 146 | 16.7% |
| 4+ Person Household | 245 | 27.9% |
| Total Housing Units | 877 | 100.0% |
Occupancy by Ownership by Household Size in Monterey
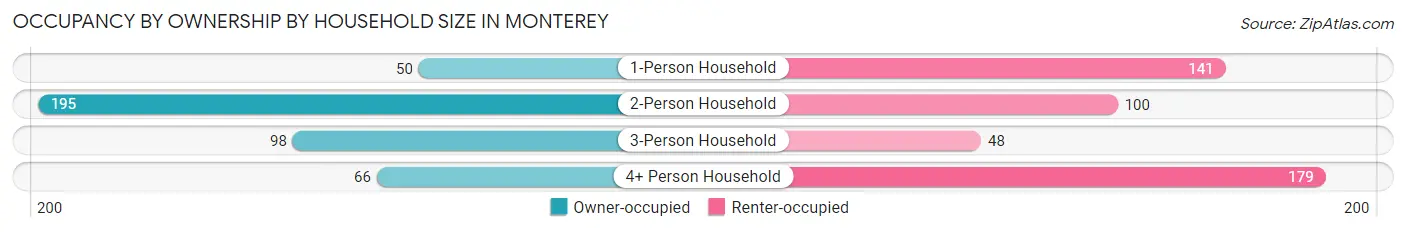
| Household Size | Owner-occupied | Renter-occupied |
| 1-Person Household | 50 (26.2%) | 141 (73.8%) |
| 2-Person Household | 195 (66.1%) | 100 (33.9%) |
| 3-Person Household | 98 (67.1%) | 48 (32.9%) |
| 4+ Person Household | 66 (26.9%) | 179 (73.1%) |
| Total Housing Units | 409 (46.6%) | 468 (53.4%) |
Occupancy by Educational Attainment in Monterey
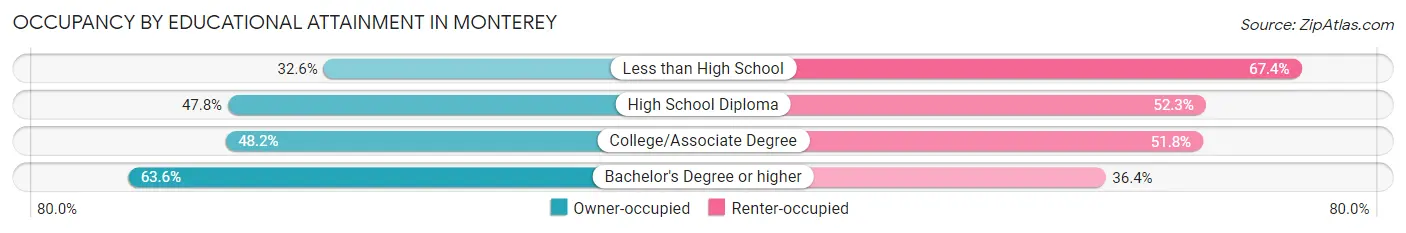
| Household Size | Owner-occupied | Renter-occupied |
| Less than High School | 57 (32.6%) | 118 (67.4%) |
| High School Diploma | 170 (47.7%) | 186 (52.2%) |
| College/Associate Degree | 119 (48.2%) | 128 (51.8%) |
| Bachelor's Degree or higher | 63 (63.6%) | 36 (36.4%) |
Occupancy by Age of Householder in Monterey
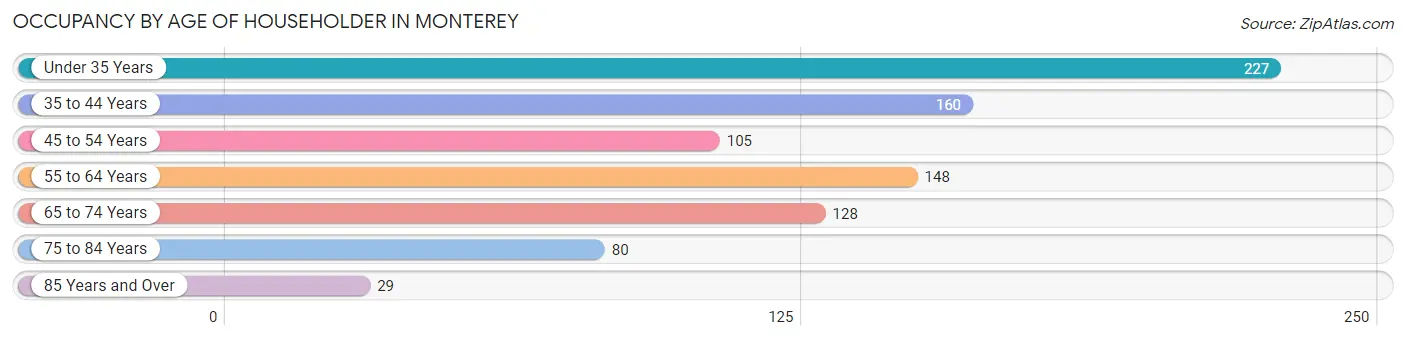
| Age Bracket | # Households | % Households |
| Under 35 Years | 227 | 25.9% |
| 35 to 44 Years | 160 | 18.2% |
| 45 to 54 Years | 105 | 12.0% |
| 55 to 64 Years | 148 | 16.9% |
| 65 to 74 Years | 128 | 14.6% |
| 75 to 84 Years | 80 | 9.1% |
| 85 Years and Over | 29 | 3.3% |
| Total | 877 | 100.0% |
Housing Finances in Monterey
Median Income by Occupancy in Monterey
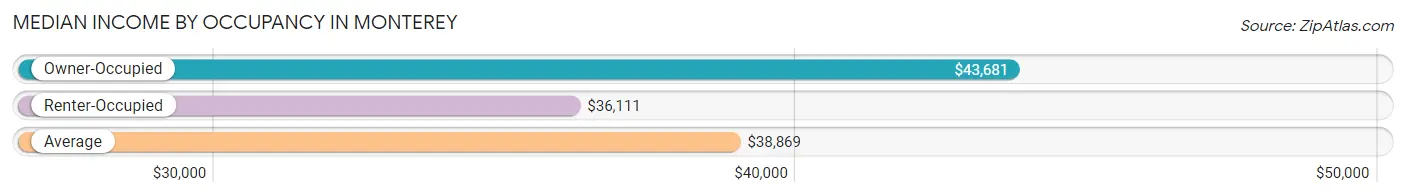
| Occupancy Type | # Households | Median Income |
| Owner-Occupied | 409 (46.6%) | $43,681 |
| Renter-Occupied | 468 (53.4%) | $36,111 |
| Average | 877 (100.0%) | $38,869 |
Occupancy by Householder Income Bracket in Monterey
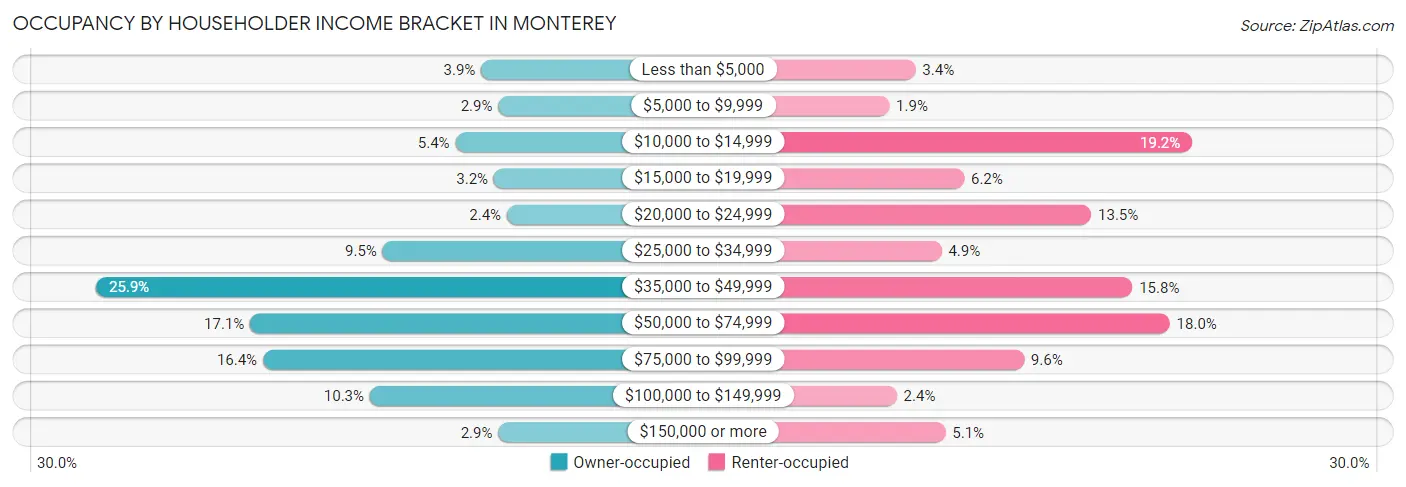
| Income Bracket | Owner-occupied | Renter-occupied |
| Less than $5,000 | 16 (3.9%) | 16 (3.4%) |
| $5,000 to $9,999 | 12 (2.9%) | 9 (1.9%) |
| $10,000 to $14,999 | 22 (5.4%) | 90 (19.2%) |
| $15,000 to $19,999 | 13 (3.2%) | 29 (6.2%) |
| $20,000 to $24,999 | 10 (2.4%) | 63 (13.5%) |
| $25,000 to $34,999 | 39 (9.5%) | 23 (4.9%) |
| $35,000 to $49,999 | 106 (25.9%) | 74 (15.8%) |
| $50,000 to $74,999 | 70 (17.1%) | 84 (17.9%) |
| $75,000 to $99,999 | 67 (16.4%) | 45 (9.6%) |
| $100,000 to $149,999 | 42 (10.3%) | 11 (2.4%) |
| $150,000 or more | 12 (2.9%) | 24 (5.1%) |
| Total | 409 (100.0%) | 468 (100.0%) |
Monthly Housing Cost Tiers in Monterey
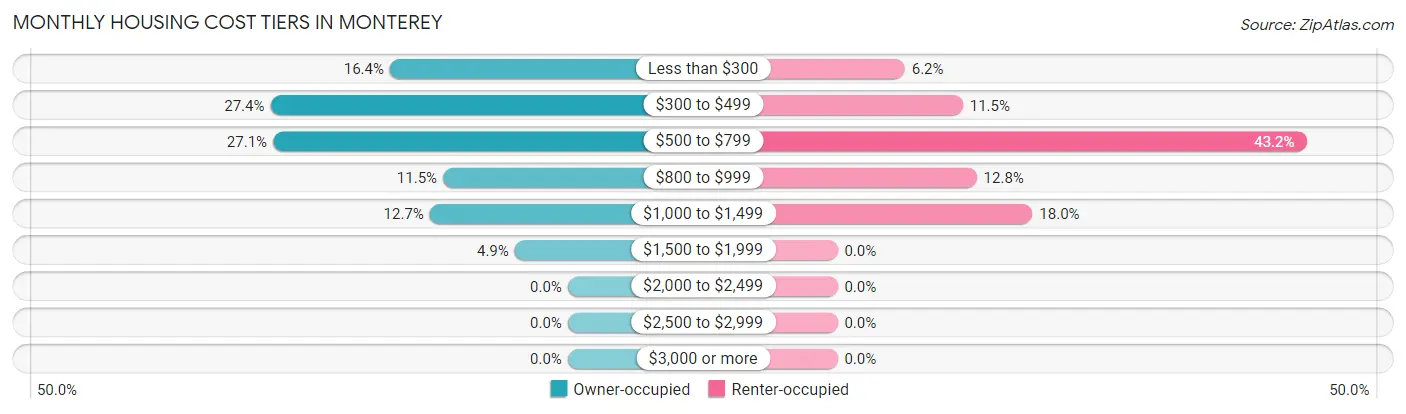
| Monthly Cost | Owner-occupied | Renter-occupied |
| Less than $300 | 67 (16.4%) | 29 (6.2%) |
| $300 to $499 | 112 (27.4%) | 54 (11.5%) |
| $500 to $799 | 111 (27.1%) | 202 (43.2%) |
| $800 to $999 | 47 (11.5%) | 60 (12.8%) |
| $1,000 to $1,499 | 52 (12.7%) | 84 (17.9%) |
| $1,500 to $1,999 | 20 (4.9%) | 0 (0.0%) |
| $2,000 to $2,499 | 0 (0.0%) | 0 (0.0%) |
| $2,500 to $2,999 | 0 (0.0%) | 0 (0.0%) |
| $3,000 or more | 0 (0.0%) | 0 (0.0%) |
| Total | 409 (100.0%) | 468 (100.0%) |
Physical Housing Characteristics in Monterey
Housing Structures in Monterey
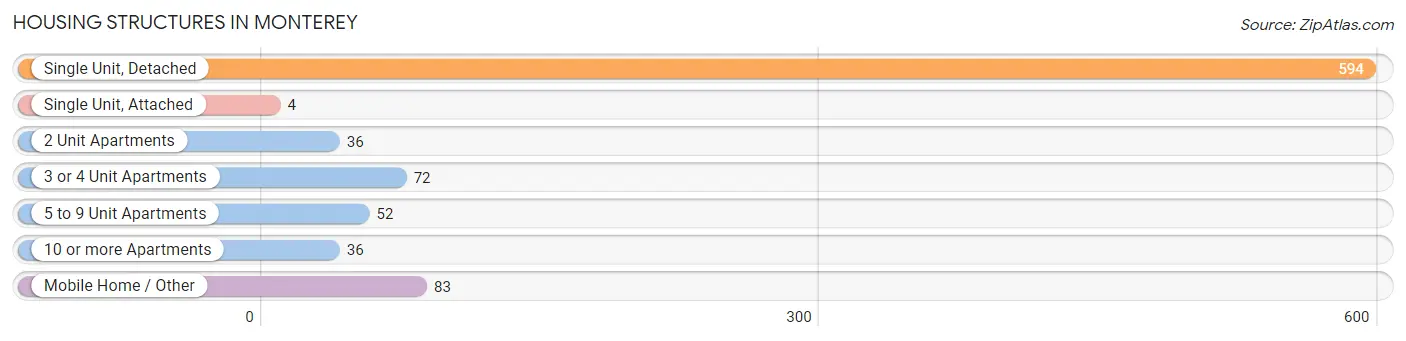
| Structure Type | # Housing Units | % Housing Units |
| Single Unit, Detached | 594 | 67.7% |
| Single Unit, Attached | 4 | 0.5% |
| 2 Unit Apartments | 36 | 4.1% |
| 3 or 4 Unit Apartments | 72 | 8.2% |
| 5 to 9 Unit Apartments | 52 | 5.9% |
| 10 or more Apartments | 36 | 4.1% |
| Mobile Home / Other | 83 | 9.5% |
| Total | 877 | 100.0% |
Housing Structures by Occupancy in Monterey
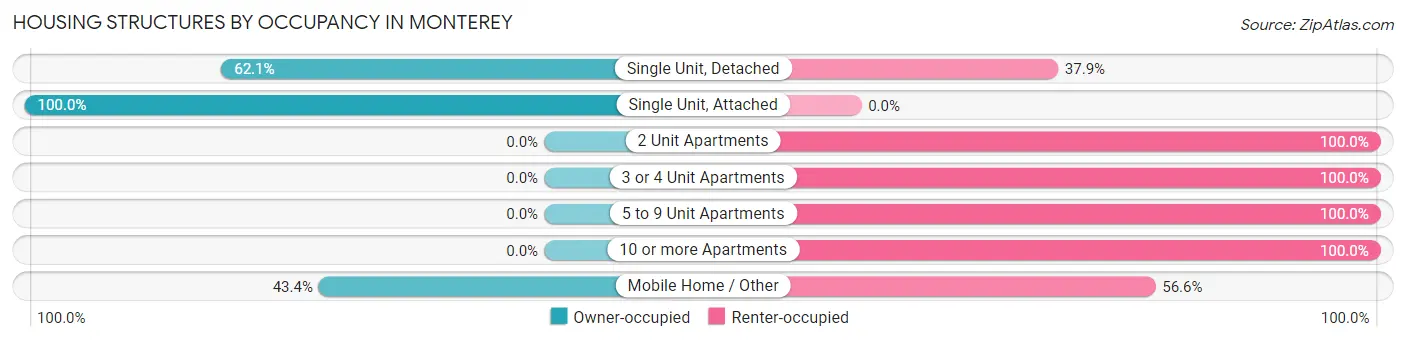
| Structure Type | Owner-occupied | Renter-occupied |
| Single Unit, Detached | 369 (62.1%) | 225 (37.9%) |
| Single Unit, Attached | 4 (100.0%) | 0 (0.0%) |
| 2 Unit Apartments | 0 (0.0%) | 36 (100.0%) |
| 3 or 4 Unit Apartments | 0 (0.0%) | 72 (100.0%) |
| 5 to 9 Unit Apartments | 0 (0.0%) | 52 (100.0%) |
| 10 or more Apartments | 0 (0.0%) | 36 (100.0%) |
| Mobile Home / Other | 36 (43.4%) | 47 (56.6%) |
| Total | 409 (46.6%) | 468 (53.4%) |
Housing Structures by Number of Rooms in Monterey
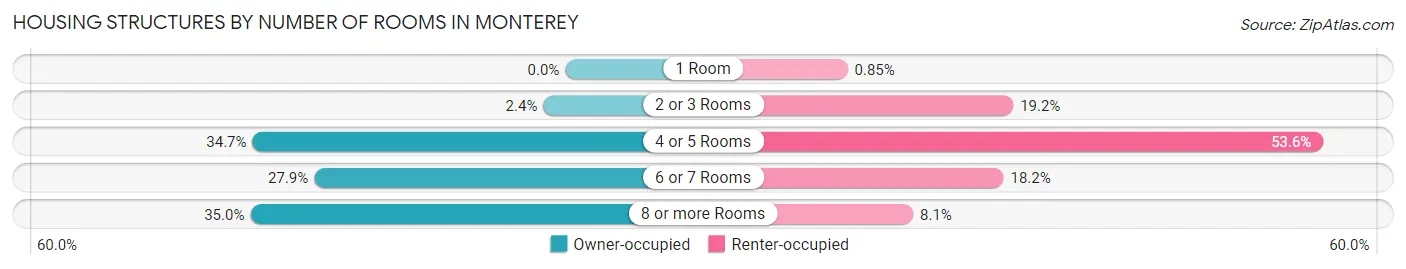
| Number of Rooms | Owner-occupied | Renter-occupied |
| 1 Room | 0 (0.0%) | 4 (0.9%) |
| 2 or 3 Rooms | 10 (2.4%) | 90 (19.2%) |
| 4 or 5 Rooms | 142 (34.7%) | 251 (53.6%) |
| 6 or 7 Rooms | 114 (27.9%) | 85 (18.2%) |
| 8 or more Rooms | 143 (35.0%) | 38 (8.1%) |
| Total | 409 (100.0%) | 468 (100.0%) |
Housing Structure by Heating Type in Monterey
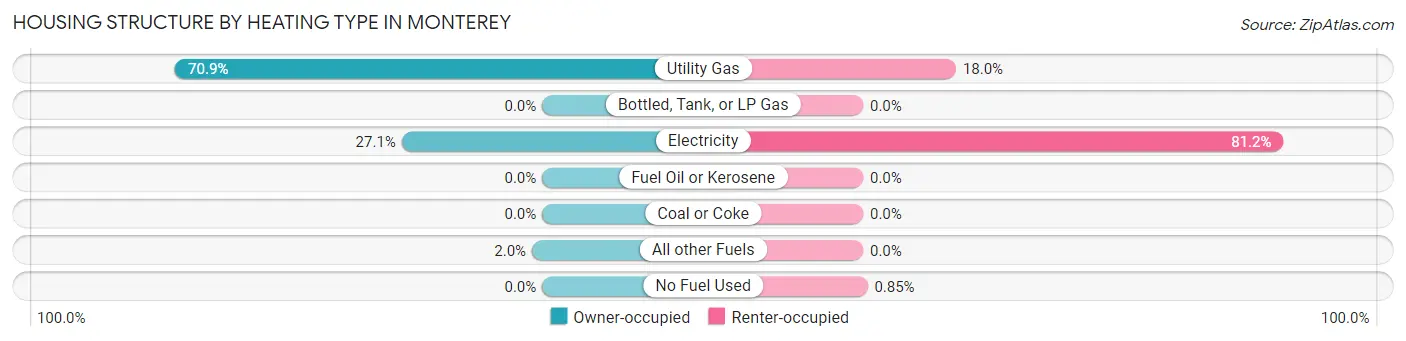
| Heating Type | Owner-occupied | Renter-occupied |
| Utility Gas | 290 (70.9%) | 84 (17.9%) |
| Bottled, Tank, or LP Gas | 0 (0.0%) | 0 (0.0%) |
| Electricity | 111 (27.1%) | 380 (81.2%) |
| Fuel Oil or Kerosene | 0 (0.0%) | 0 (0.0%) |
| Coal or Coke | 0 (0.0%) | 0 (0.0%) |
| All other Fuels | 8 (2.0%) | 0 (0.0%) |
| No Fuel Used | 0 (0.0%) | 4 (0.9%) |
| Total | 409 (100.0%) | 468 (100.0%) |
Household Vehicle Usage in Monterey
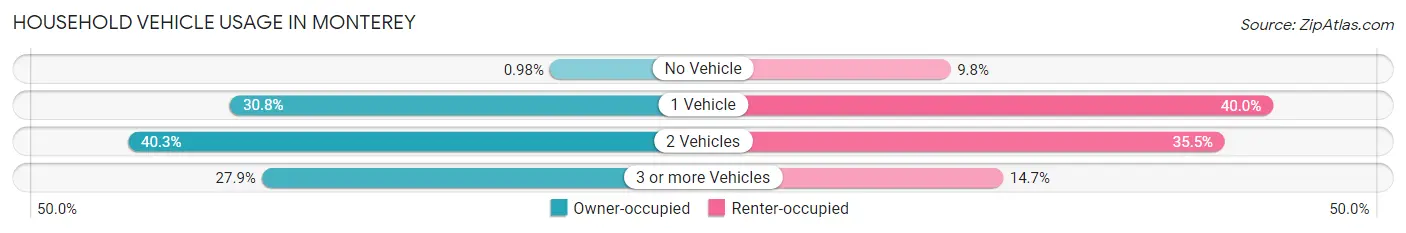
| Vehicles per Household | Owner-occupied | Renter-occupied |
| No Vehicle | 4 (1.0%) | 46 (9.8%) |
| 1 Vehicle | 126 (30.8%) | 187 (40.0%) |
| 2 Vehicles | 165 (40.3%) | 166 (35.5%) |
| 3 or more Vehicles | 114 (27.9%) | 69 (14.7%) |
| Total | 409 (100.0%) | 468 (100.0%) |
Real Estate & Mortgages in Monterey
Real Estate and Mortgage Overview in Monterey
| Characteristic | Without Mortgage | With Mortgage |
| Housing Units | 216 | 193 |
| Median Property Value | $125,000 | $141,300 |
| Median Household Income | $39,375 | $6 |
| Monthly Housing Costs | $350 | $0 |
| Real Estate Taxes | $819 | $0 |
Property Value by Mortgage Status in Monterey
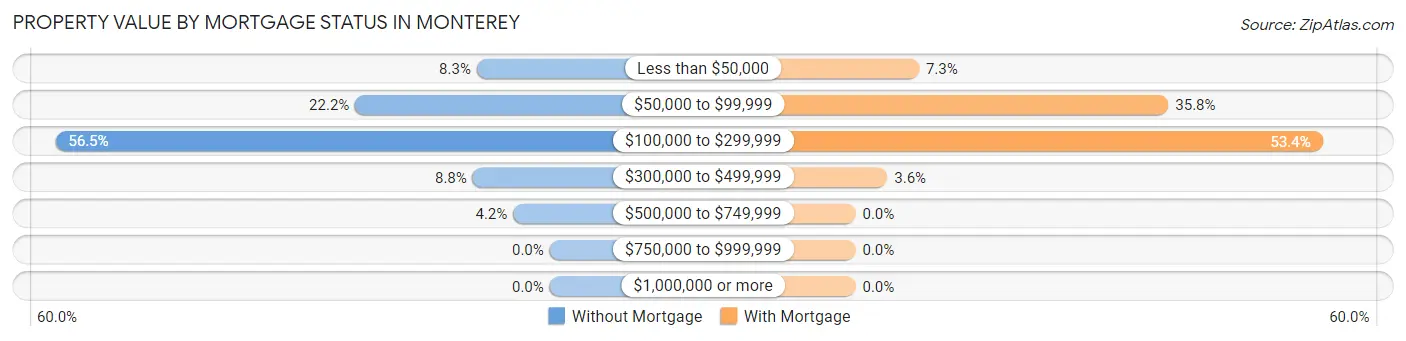
| Property Value | Without Mortgage | With Mortgage |
| Less than $50,000 | 18 (8.3%) | 14 (7.2%) |
| $50,000 to $99,999 | 48 (22.2%) | 69 (35.7%) |
| $100,000 to $299,999 | 122 (56.5%) | 103 (53.4%) |
| $300,000 to $499,999 | 19 (8.8%) | 7 (3.6%) |
| $500,000 to $749,999 | 9 (4.2%) | 0 (0.0%) |
| $750,000 to $999,999 | 0 (0.0%) | 0 (0.0%) |
| $1,000,000 or more | 0 (0.0%) | 0 (0.0%) |
| Total | 216 (100.0%) | 193 (100.0%) |
Household Income by Mortgage Status in Monterey
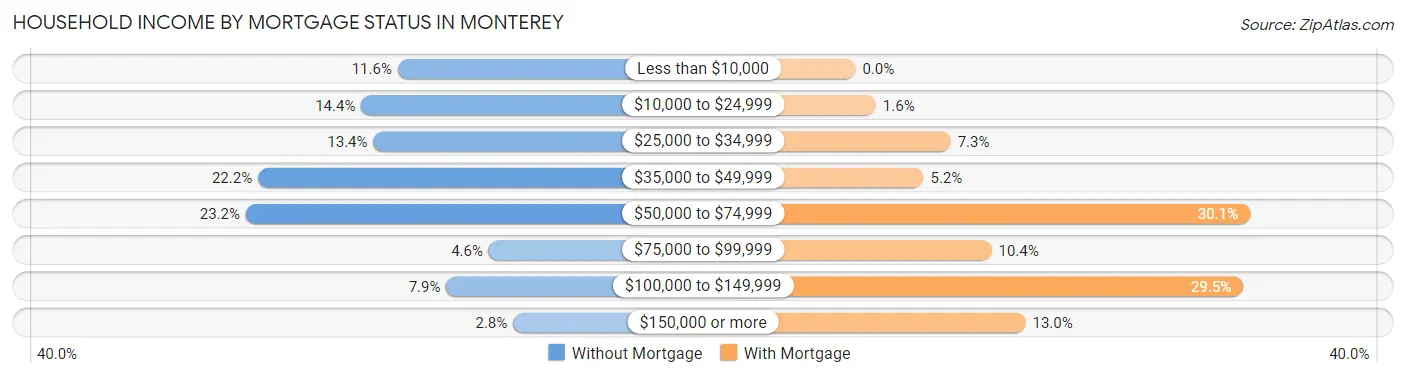
| Household Income | Without Mortgage | With Mortgage |
| Less than $10,000 | 25 (11.6%) | 0 (0.0%) |
| $10,000 to $24,999 | 31 (14.3%) | 3 (1.5%) |
| $25,000 to $34,999 | 29 (13.4%) | 14 (7.2%) |
| $35,000 to $49,999 | 48 (22.2%) | 10 (5.2%) |
| $50,000 to $74,999 | 50 (23.2%) | 58 (30.0%) |
| $75,000 to $99,999 | 10 (4.6%) | 20 (10.4%) |
| $100,000 to $149,999 | 17 (7.9%) | 57 (29.5%) |
| $150,000 or more | 6 (2.8%) | 25 (13.0%) |
| Total | 216 (100.0%) | 193 (100.0%) |
Property Value to Household Income Ratio in Monterey
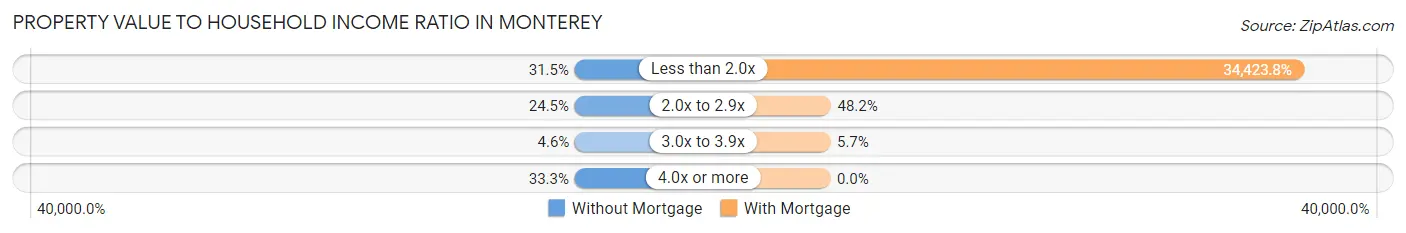
| Value-to-Income Ratio | Without Mortgage | With Mortgage |
| Less than 2.0x | 68 (31.5%) | 66,438 (34,423.8%) |
| 2.0x to 2.9x | 53 (24.5%) | 93 (48.2%) |
| 3.0x to 3.9x | 10 (4.6%) | 11 (5.7%) |
| 4.0x or more | 72 (33.3%) | 0 (0.0%) |
| Total | 216 (100.0%) | 193 (100.0%) |
Real Estate Taxes by Mortgage Status in Monterey
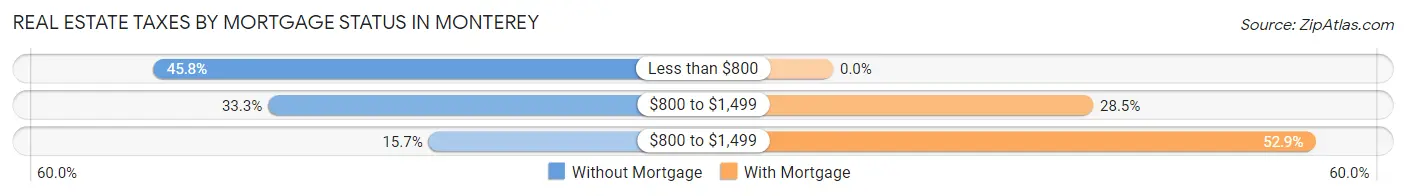
| Property Taxes | Without Mortgage | With Mortgage |
| Less than $800 | 99 (45.8%) | 0 (0.0%) |
| $800 to $1,499 | 72 (33.3%) | 55 (28.5%) |
| $800 to $1,499 | 34 (15.7%) | 102 (52.8%) |
| Total | 216 (100.0%) | 193 (100.0%) |
Health & Disability in Monterey
Health Insurance Coverage by Age in Monterey
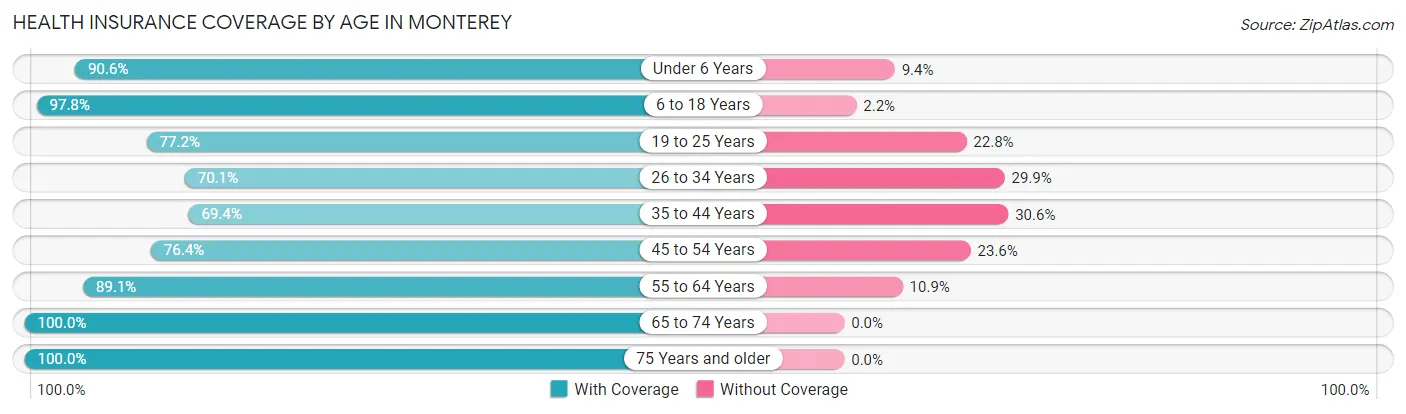
| Age Bracket | With Coverage | Without Coverage |
| Under 6 Years | 318 (90.6%) | 33 (9.4%) |
| 6 to 18 Years | 698 (97.8%) | 16 (2.2%) |
| 19 to 25 Years | 156 (77.2%) | 46 (22.8%) |
| 26 to 34 Years | 230 (70.1%) | 98 (29.9%) |
| 35 to 44 Years | 184 (69.4%) | 81 (30.6%) |
| 45 to 54 Years | 172 (76.4%) | 53 (23.6%) |
| 55 to 64 Years | 213 (89.1%) | 26 (10.9%) |
| 65 to 74 Years | 204 (100.0%) | 0 (0.0%) |
| 75 Years and older | 135 (100.0%) | 0 (0.0%) |
| Total | 2,310 (86.7%) | 353 (13.3%) |
Health Insurance Coverage by Citizenship Status in Monterey
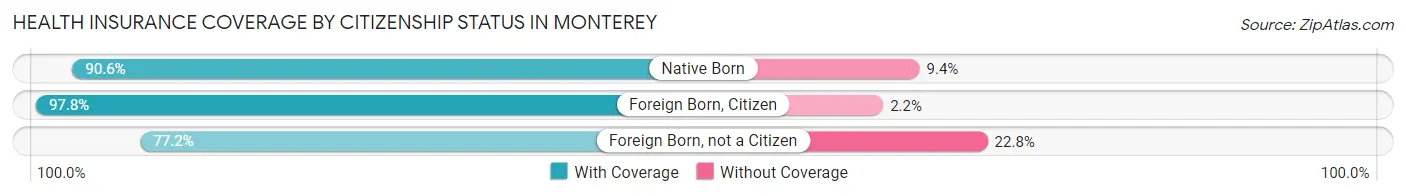
| Citizenship Status | With Coverage | Without Coverage |
| Native Born | 318 (90.6%) | 33 (9.4%) |
| Foreign Born, Citizen | 698 (97.8%) | 16 (2.2%) |
| Foreign Born, not a Citizen | 156 (77.2%) | 46 (22.8%) |
Health Insurance Coverage by Household Income in Monterey
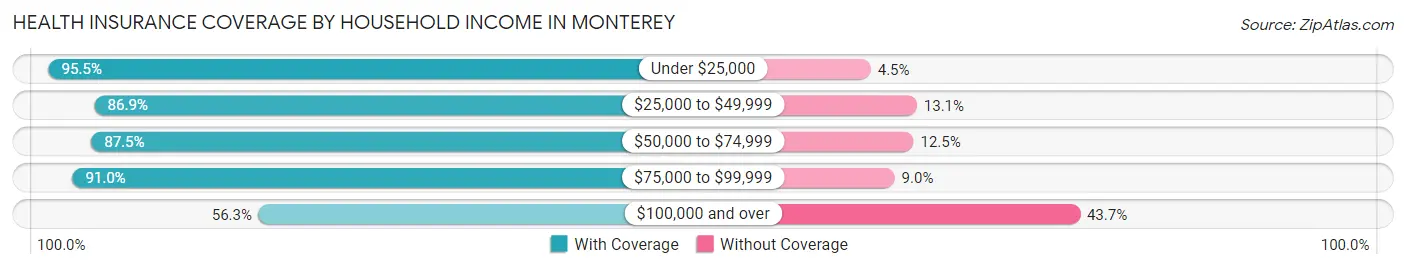
| Household Income | With Coverage | Without Coverage |
| Under $25,000 | 806 (95.5%) | 38 (4.5%) |
| $25,000 to $49,999 | 582 (86.9%) | 88 (13.1%) |
| $50,000 to $74,999 | 413 (87.5%) | 59 (12.5%) |
| $75,000 to $99,999 | 335 (91.0%) | 33 (9.0%) |
| $100,000 and over | 174 (56.3%) | 135 (43.7%) |
Public vs Private Health Insurance Coverage by Age in Monterey
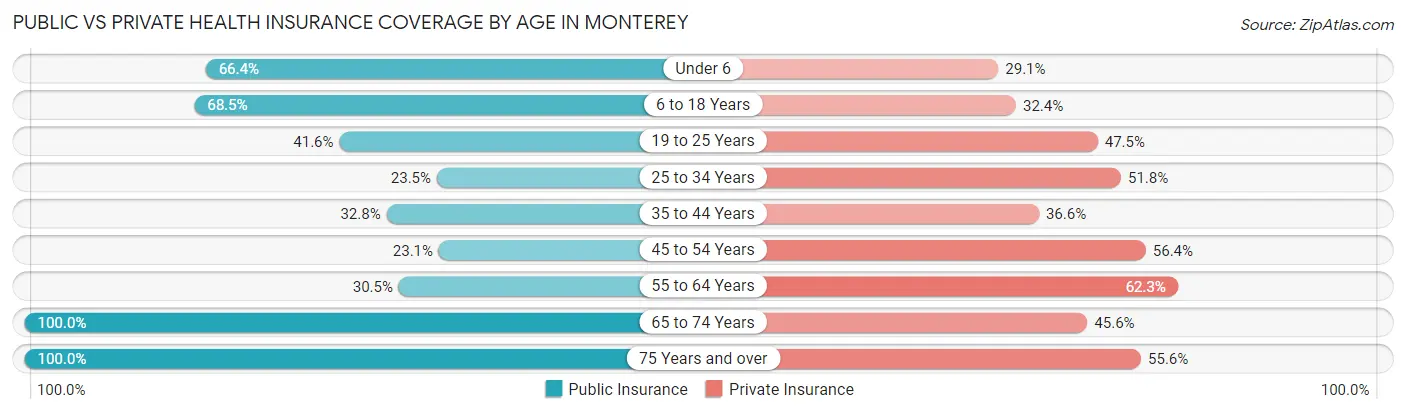
| Age Bracket | Public Insurance | Private Insurance |
| Under 6 | 233 (66.4%) | 102 (29.1%) |
| 6 to 18 Years | 489 (68.5%) | 231 (32.4%) |
| 19 to 25 Years | 84 (41.6%) | 96 (47.5%) |
| 25 to 34 Years | 77 (23.5%) | 170 (51.8%) |
| 35 to 44 Years | 87 (32.8%) | 97 (36.6%) |
| 45 to 54 Years | 52 (23.1%) | 127 (56.4%) |
| 55 to 64 Years | 73 (30.5%) | 149 (62.3%) |
| 65 to 74 Years | 204 (100.0%) | 93 (45.6%) |
| 75 Years and over | 135 (100.0%) | 75 (55.6%) |
| Total | 1,434 (53.8%) | 1,140 (42.8%) |
Disability Status by Sex by Age in Monterey
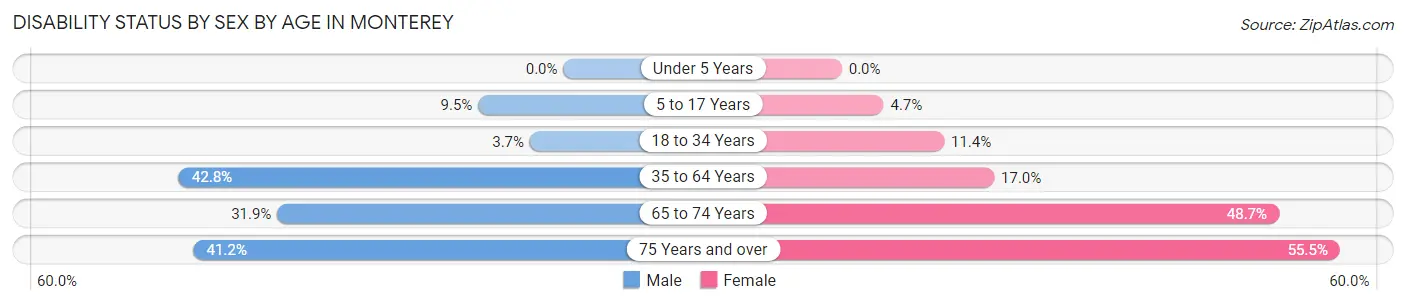
| Age Bracket | Male | Female |
| Under 5 Years | 0 (0.0%) | 0 (0.0%) |
| 5 to 17 Years | 50 (9.5%) | 12 (4.6%) |
| 18 to 34 Years | 11 (3.7%) | 27 (11.4%) |
| 35 to 64 Years | 143 (42.8%) | 67 (17.0%) |
| 65 to 74 Years | 29 (31.9%) | 55 (48.7%) |
| 75 Years and over | 14 (41.2%) | 56 (55.4%) |
Disability Class by Sex by Age in Monterey
Disability Class: Hearing Difficulty
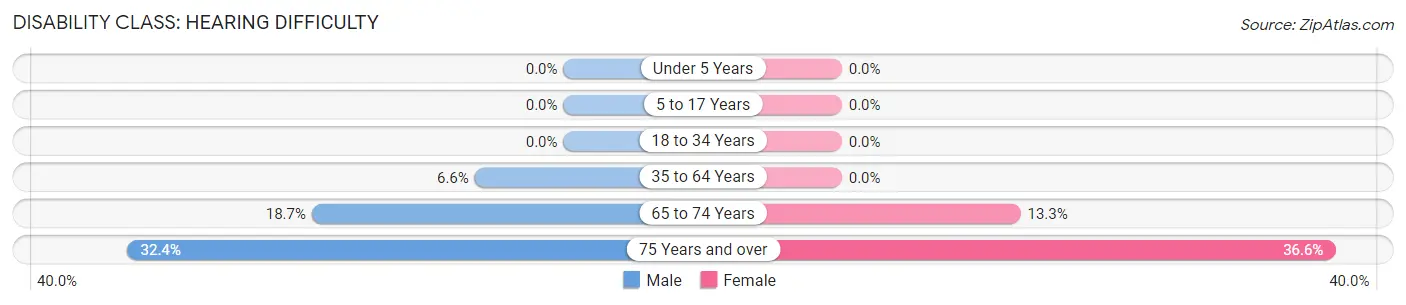
| Age Bracket | Male | Female |
| Under 5 Years | 0 (0.0%) | 0 (0.0%) |
| 5 to 17 Years | 0 (0.0%) | 0 (0.0%) |
| 18 to 34 Years | 0 (0.0%) | 0 (0.0%) |
| 35 to 64 Years | 22 (6.6%) | 0 (0.0%) |
| 65 to 74 Years | 17 (18.7%) | 15 (13.3%) |
| 75 Years and over | 11 (32.4%) | 37 (36.6%) |
Disability Class: Vision Difficulty
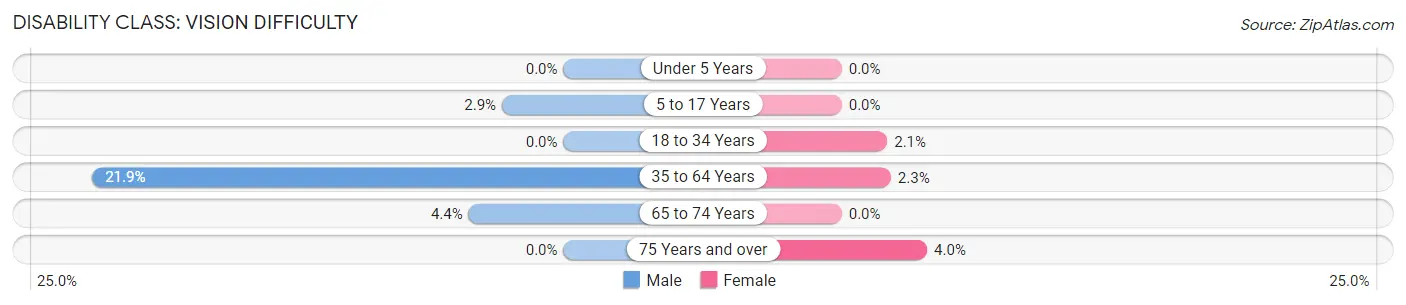
| Age Bracket | Male | Female |
| Under 5 Years | 0 (0.0%) | 0 (0.0%) |
| 5 to 17 Years | 15 (2.9%) | 0 (0.0%) |
| 18 to 34 Years | 0 (0.0%) | 5 (2.1%) |
| 35 to 64 Years | 73 (21.9%) | 9 (2.3%) |
| 65 to 74 Years | 4 (4.4%) | 0 (0.0%) |
| 75 Years and over | 0 (0.0%) | 4 (4.0%) |
Disability Class: Cognitive Difficulty
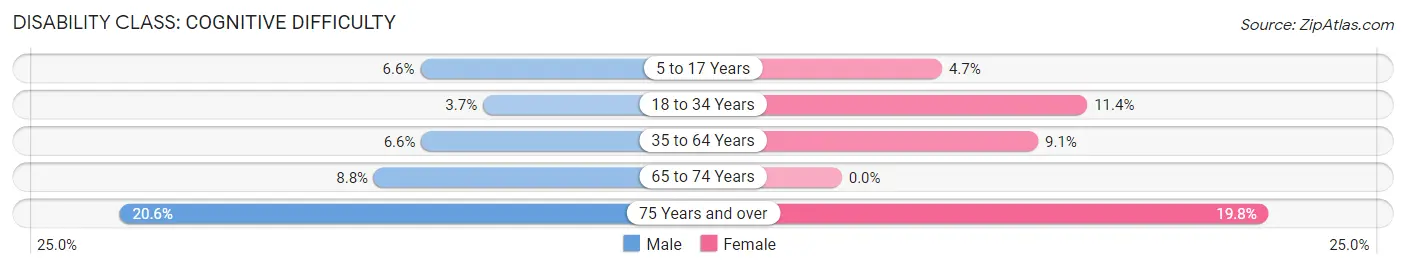
| Age Bracket | Male | Female |
| 5 to 17 Years | 35 (6.6%) | 12 (4.6%) |
| 18 to 34 Years | 11 (3.7%) | 27 (11.4%) |
| 35 to 64 Years | 22 (6.6%) | 36 (9.1%) |
| 65 to 74 Years | 8 (8.8%) | 0 (0.0%) |
| 75 Years and over | 7 (20.6%) | 20 (19.8%) |
Disability Class: Ambulatory Difficulty
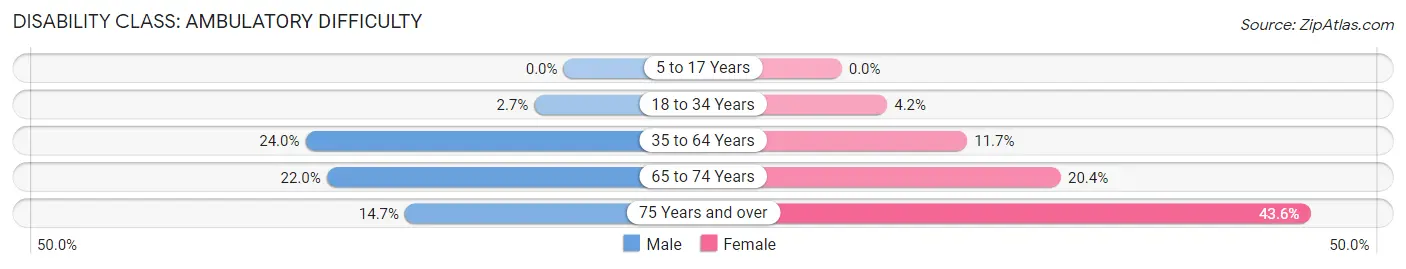
| Age Bracket | Male | Female |
| 5 to 17 Years | 0 (0.0%) | 0 (0.0%) |
| 18 to 34 Years | 8 (2.7%) | 10 (4.2%) |
| 35 to 64 Years | 80 (23.9%) | 46 (11.7%) |
| 65 to 74 Years | 20 (22.0%) | 23 (20.3%) |
| 75 Years and over | 5 (14.7%) | 44 (43.6%) |
Disability Class: Self-Care Difficulty
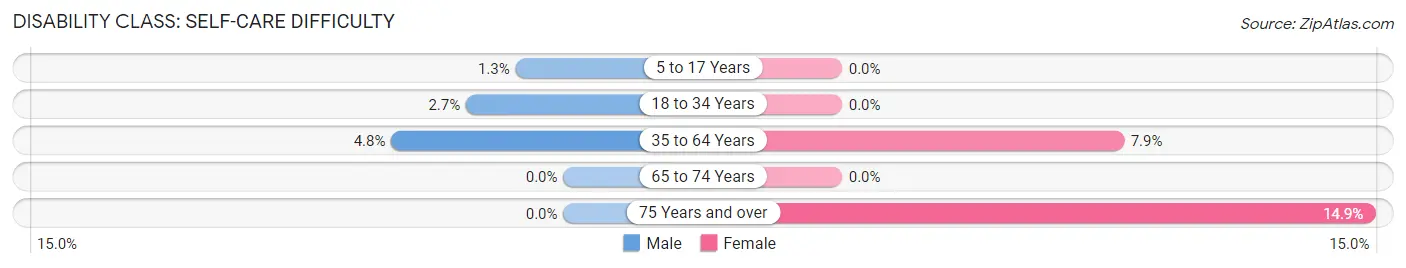
| Age Bracket | Male | Female |
| 5 to 17 Years | 7 (1.3%) | 0 (0.0%) |
| 18 to 34 Years | 8 (2.7%) | 0 (0.0%) |
| 35 to 64 Years | 16 (4.8%) | 31 (7.9%) |
| 65 to 74 Years | 0 (0.0%) | 0 (0.0%) |
| 75 Years and over | 0 (0.0%) | 15 (14.8%) |
Technology Access in Monterey
Computing Device Access in Monterey
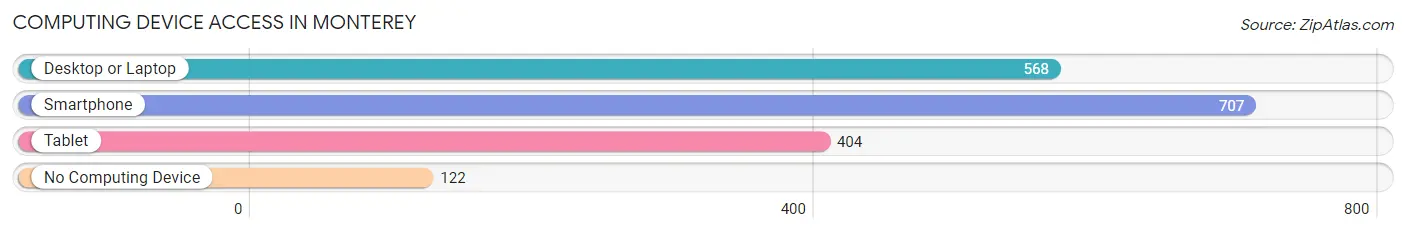
| Device Type | # Households | % Households |
| Desktop or Laptop | 568 | 64.8% |
| Smartphone | 707 | 80.6% |
| Tablet | 404 | 46.1% |
| No Computing Device | 122 | 13.9% |
| Total | 877 | 100.0% |
Internet Access in Monterey
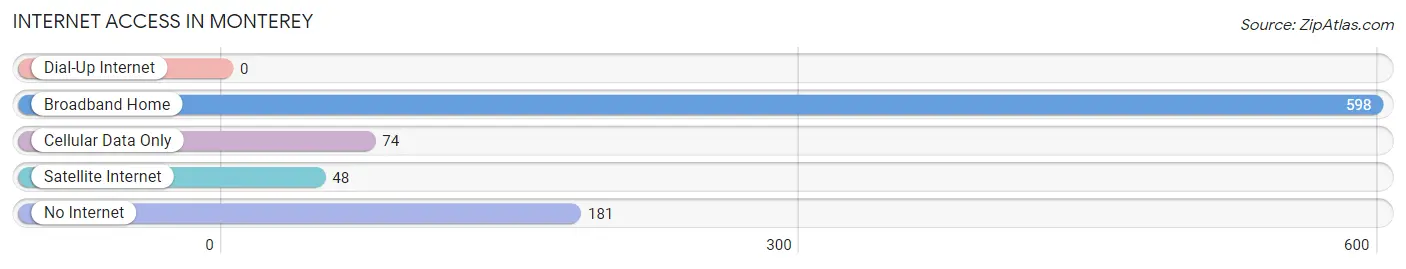
| Internet Type | # Households | % Households |
| Dial-Up Internet | 0 | 0.0% |
| Broadband Home | 598 | 68.2% |
| Cellular Data Only | 74 | 8.4% |
| Satellite Internet | 48 | 5.5% |
| No Internet | 181 | 20.6% |
| Total | 877 | 100.0% |
Monterey Summary
Monterey, Tennessee is a small town located in Putnam County, Tennessee. It is situated in the foothills of the Cumberland Mountains and is part of the Cookeville, Tennessee Metropolitan Statistical Area. The town has a population of approximately 2,000 people and is known for its rural charm and friendly atmosphere.
History
Monterey was founded in 1820 by a group of settlers from North Carolina. The town was named after the Battle of Monterrey, which was fought during the Mexican-American War. The town was originally a farming community, but it soon developed into a small industrial center. The town was home to several factories, including a cotton mill, a furniture factory, and a shoe factory.
In the late 19th century, Monterey was a popular tourist destination. The town was home to several resorts, including the Monterey Hotel, which was built in 1887. The hotel was a popular destination for wealthy visitors from Nashville and other nearby cities.
Geography
Monterey is located in the foothills of the Cumberland Mountains. The town is situated at an elevation of 1,000 feet above sea level. The town is located approximately 30 miles from Cookeville, Tennessee and is accessible via State Route 111.
The town is surrounded by several small towns and villages, including Baxter, Cookeville, and Sparta. The town is also located near several state parks, including Cummins Falls State Park and Burgess Falls State Park.
Economy
Monterey’s economy is largely based on agriculture and tourism. The town is home to several farms, which produce a variety of crops, including corn, soybeans, and wheat. The town is also home to several tourist attractions, including the Monterey Hotel and the Monterey Country Club.
The town is also home to several small businesses, including restaurants, retail stores, and service providers. The town is also home to several manufacturing companies, including a furniture factory and a shoe factory.
Demographics
As of the 2010 census, the population of Monterey was 2,000. The town is predominantly white, with approximately 95% of the population identifying as white. The town is also home to a small African American population, with approximately 4% of the population identifying as African American.
The median household income in Monterey is approximately $35,000. The town has a poverty rate of approximately 15%, which is slightly higher than the national average. The town also has a high rate of unemployment, with approximately 10% of the population unemployed.
Conclusion
Monterey, Tennessee is a small town located in Putnam County, Tennessee. The town has a population of approximately 2,000 people and is known for its rural charm and friendly atmosphere. The town’s economy is largely based on agriculture and tourism, and the town is home to several small businesses, manufacturing companies, and tourist attractions. The town is predominantly white, with a small African American population. The median household income in Monterey is approximately $35,000, and the town has a poverty rate of approximately 15%.
Common Questions
What is Per Capita Income in Monterey?
Per Capita income in Monterey is $17,189.
What is the Median Family Income in Monterey?
Median Family Income in Monterey is $40,417.
What is the Median Household income in Monterey?
Median Household Income in Monterey is $38,869.
What is Income or Wage Gap in Monterey?
Income or Wage Gap in Monterey is 3.5%.
Women in Monterey earn 96.5 cents for every dollar earned by a man.
What is Family Income Deficit in Monterey?
Family Income Deficit in Monterey is $11,542.
Families that are below poverty line in Monterey earn $11,542 less on average than the poverty threshold level.
What is Inequality or Gini Index in Monterey?
Inequality or Gini Index in Monterey is 0.43.
What is the Total Population of Monterey?
Total Population of Monterey is 2,751.
What is the Total Male Population of Monterey?
Total Male Population of Monterey is 1,436.
What is the Total Female Population of Monterey?
Total Female Population of Monterey is 1,315.
What is the Ratio of Males per 100 Females in Monterey?
There are 109.20 Males per 100 Females in Monterey.
What is the Ratio of Females per 100 Males in Monterey?
There are 91.57 Females per 100 Males in Monterey.
What is the Median Population Age in Monterey?
Median Population Age in Monterey is 27.7 Years.
What is the Average Family Size in Monterey
Average Family Size in Monterey is 3.7 People.
What is the Average Household Size in Monterey
Average Household Size in Monterey is 3.0 People.
How Large is the Labor Force in Monterey?
There are 1,112 People in the Labor Forcein in Monterey.
What is the Percentage of People in the Labor Force in Monterey?
56.5% of People are in the Labor Force in Monterey.
What is the Unemployment Rate in Monterey?
Unemployment Rate in Monterey is 2.7%.