Monteagle, TN Map & Demographics
Monteagle Map
Monteagle Overview
$24,434
PER CAPITA INCOME
$54,459
AVG FAMILY INCOME
$49,917
AVG HOUSEHOLD INCOME
55.5%
WAGE / INCOME GAP [ % ]
44.5¢/ $1
WAGE / INCOME GAP [ $ ]
0.43
INEQUALITY / GINI INDEX
1,915
TOTAL POPULATION
931
MALE POPULATION
984
FEMALE POPULATION
94.61
MALES / 100 FEMALES
105.69
FEMALES / 100 MALES
42.5
MEDIAN AGE
3.0
AVG FAMILY SIZE
2.5
AVG HOUSEHOLD SIZE
647
LABOR FORCE [ PEOPLE ]
42.1%
PERCENT IN LABOR FORCE
13.3%
UNEMPLOYMENT RATE
Monteagle Zip Codes
Monteagle Area Codes
Income in Monteagle
Income Overview in Monteagle
Per Capita Income in Monteagle is $24,434, while median incomes of families and households are $54,459 and $49,917 respectively.
| Characteristic | Number | Measure |
| Per Capita Income | 1,915 | $24,434 |
| Median Family Income | 476 | $54,459 |
| Mean Family Income | 476 | $73,287 |
| Median Household Income | 690 | $49,917 |
| Mean Household Income | 690 | $64,470 |
| Income Deficit | 476 | $0 |
| Wage / Income Gap (%) | 1,915 | 55.49% |
| Wage / Income Gap ($) | 1,915 | 44.51¢ per $1 |
| Gini / Inequality Index | 1,915 | 0.43 |
Earnings by Sex in Monteagle
Average Earnings in Monteagle are $24,864, $40,321 for men and $17,946 for women, a difference of 55.5%.
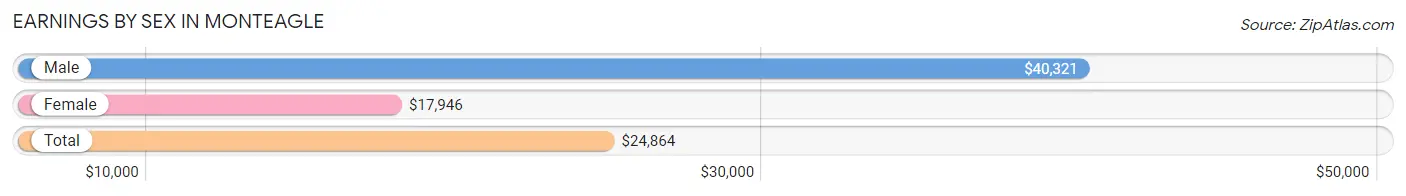
| Sex | Number | Average Earnings |
| Male | 368 (57.4%) | $40,321 |
| Female | 273 (42.6%) | $17,946 |
| Total | 641 (100.0%) | $24,864 |
Earnings by Sex by Income Bracket in Monteagle
The most common earnings brackets in Monteagle are $40,000 to $44,999 for men (47 | 12.8%) and $2,499 or less for women (42 | 15.4%).
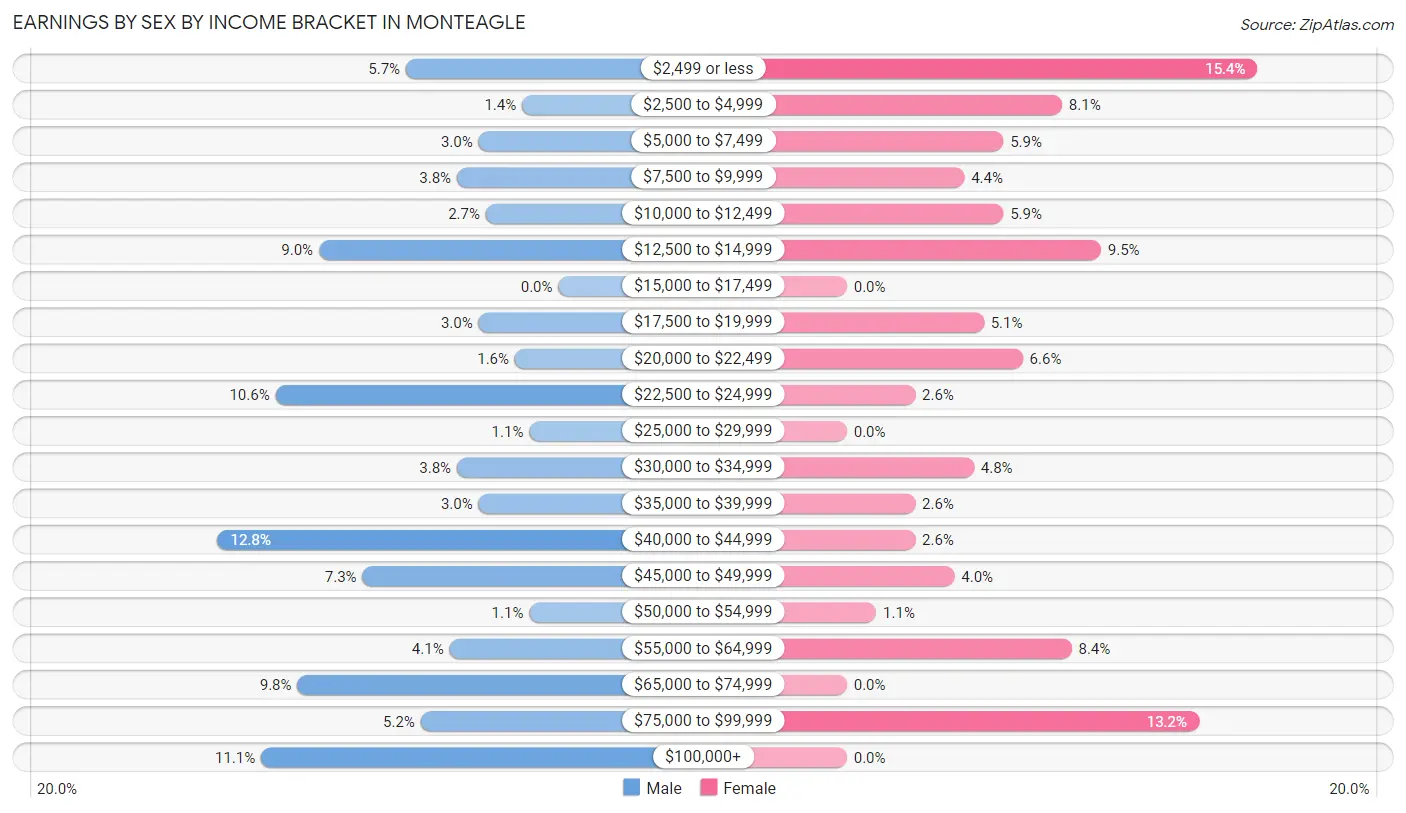
| Income | Male | Female |
| $2,499 or less | 21 (5.7%) | 42 (15.4%) |
| $2,500 to $4,999 | 5 (1.4%) | 22 (8.1%) |
| $5,000 to $7,499 | 11 (3.0%) | 16 (5.9%) |
| $7,500 to $9,999 | 14 (3.8%) | 12 (4.4%) |
| $10,000 to $12,499 | 10 (2.7%) | 16 (5.9%) |
| $12,500 to $14,999 | 33 (9.0%) | 26 (9.5%) |
| $15,000 to $17,499 | 0 (0.0%) | 0 (0.0%) |
| $17,500 to $19,999 | 11 (3.0%) | 14 (5.1%) |
| $20,000 to $22,499 | 6 (1.6%) | 18 (6.6%) |
| $22,500 to $24,999 | 39 (10.6%) | 7 (2.6%) |
| $25,000 to $29,999 | 4 (1.1%) | 0 (0.0%) |
| $30,000 to $34,999 | 14 (3.8%) | 13 (4.8%) |
| $35,000 to $39,999 | 11 (3.0%) | 7 (2.6%) |
| $40,000 to $44,999 | 47 (12.8%) | 7 (2.6%) |
| $45,000 to $49,999 | 27 (7.3%) | 11 (4.0%) |
| $50,000 to $54,999 | 4 (1.1%) | 3 (1.1%) |
| $55,000 to $64,999 | 15 (4.1%) | 23 (8.4%) |
| $65,000 to $74,999 | 36 (9.8%) | 0 (0.0%) |
| $75,000 to $99,999 | 19 (5.2%) | 36 (13.2%) |
| $100,000+ | 41 (11.1%) | 0 (0.0%) |
| Total | 368 (100.0%) | 273 (100.0%) |
Earnings by Sex by Educational Attainment in Monteagle
Average earnings in Monteagle are $40,737 for men and $17,768 for women, a difference of 56.4%. Men with an educational attainment of college or associate's degree enjoy the highest average annual earnings of $45,865, while those with less than high school education earn the least with $19,375. Women with an educational attainment of graduate degree earn the most with the average annual earnings of $56,346, while those with less than high school education have the smallest earnings of $2,499.
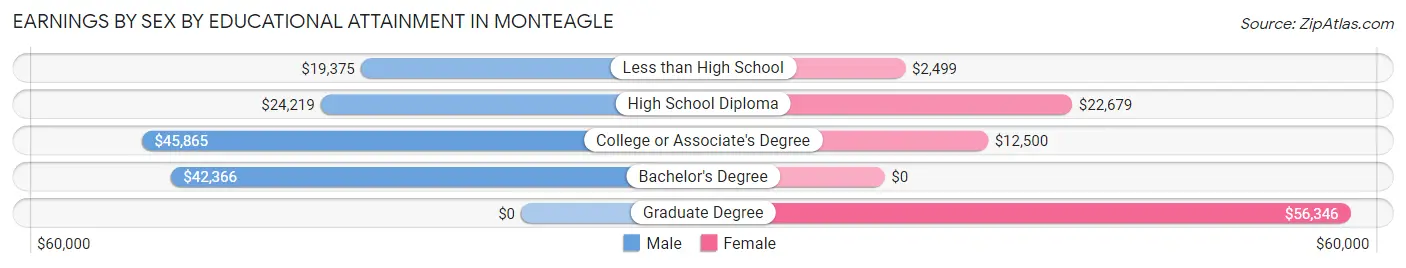
| Educational Attainment | Male Income | Female Income |
| Less than High School | $19,375 | $2,499 |
| High School Diploma | $24,219 | $22,679 |
| College or Associate's Degree | $45,865 | $12,500 |
| Bachelor's Degree | $42,366 | $0 |
| Graduate Degree | - | - |
| Total | $40,737 | $17,768 |
Family Income in Monteagle
Family Income Brackets in Monteagle
According to the Monteagle family income data, there are 121 families falling into the $50,000 to $74,999 income range, which is the most common income bracket and makes up 25.4% of all families. Conversely, the $10,000 to $14,999 income bracket is the least frequent group with only 9 families (1.9%) belonging to this category.
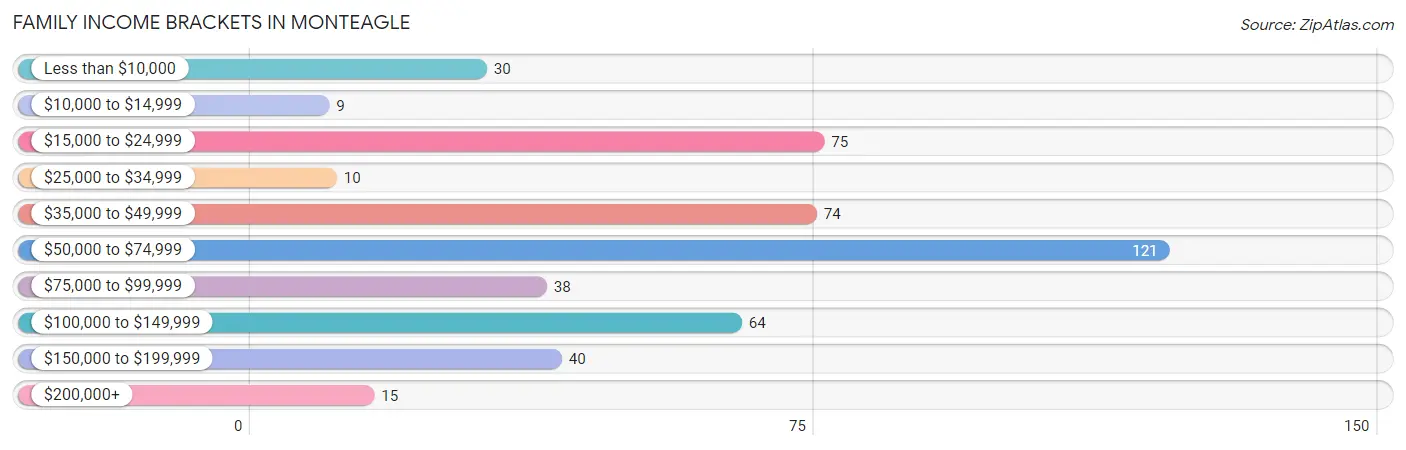
| Income Bracket | # Families | % Families |
| Less than $10,000 | 30 | 6.3% |
| $10,000 to $14,999 | 9 | 1.9% |
| $15,000 to $24,999 | 75 | 15.8% |
| $25,000 to $34,999 | 10 | 2.1% |
| $35,000 to $49,999 | 74 | 15.5% |
| $50,000 to $74,999 | 121 | 25.4% |
| $75,000 to $99,999 | 38 | 8.0% |
| $100,000 to $149,999 | 64 | 13.4% |
| $150,000 to $199,999 | 40 | 8.4% |
| $200,000+ | 15 | 3.2% |
Family Income by Famaliy Size in Monteagle
4-person families (121 | 25.4%) account for the highest median family income in Monteagle with $72,697 per family, while 2-person families (279 | 58.6%) have the highest median income of $26,841 per family member.
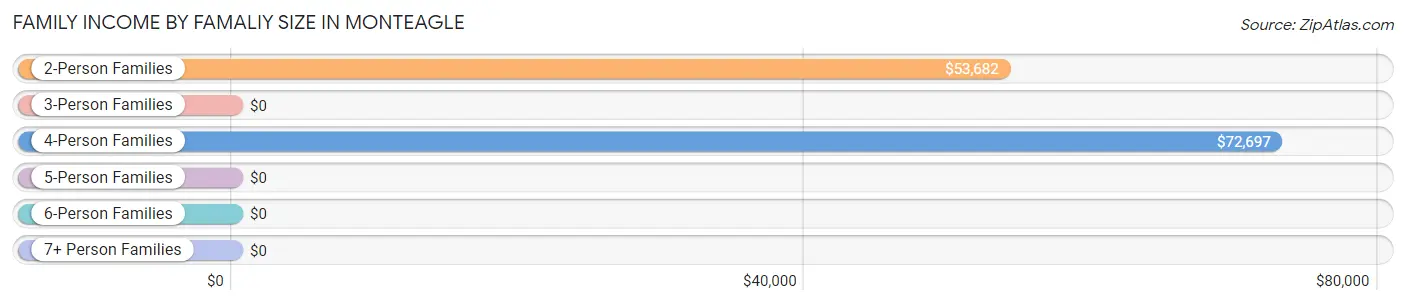
| Income Bracket | # Families | Median Income |
| 2-Person Families | 279 (58.6%) | $53,682 |
| 3-Person Families | 75 (15.8%) | $0 |
| 4-Person Families | 121 (25.4%) | $72,697 |
| 5-Person Families | 1 (0.2%) | $0 |
| 6-Person Families | 0 (0.0%) | $0 |
| 7+ Person Families | 0 (0.0%) | $0 |
| Total | 476 (100.0%) | $54,459 |
Family Income by Number of Earners in Monteagle
The median family income in Monteagle is $54,459, with families comprising 3+ earners (18) having the highest median family income of $183,833, while families with 1 earner (158) have the lowest median family income of $24,063, accounting for 3.8% and 33.2% of families, respectively.
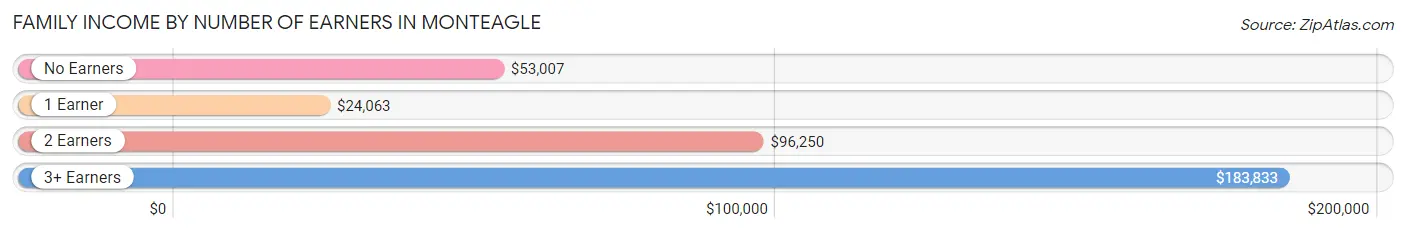
| Number of Earners | # Families | Median Income |
| No Earners | 185 (38.9%) | $53,007 |
| 1 Earner | 158 (33.2%) | $24,063 |
| 2 Earners | 115 (24.2%) | $96,250 |
| 3+ Earners | 18 (3.8%) | $183,833 |
| Total | 476 (100.0%) | $54,459 |
Household Income in Monteagle
Household Income Brackets in Monteagle
With 156 households falling in the category, the $50,000 to $74,999 income range is the most frequent in Monteagle, accounting for 22.6% of all households. In contrast, only 15 households (2.2%) fall into the $200,000+ income bracket, making it the least populous group.
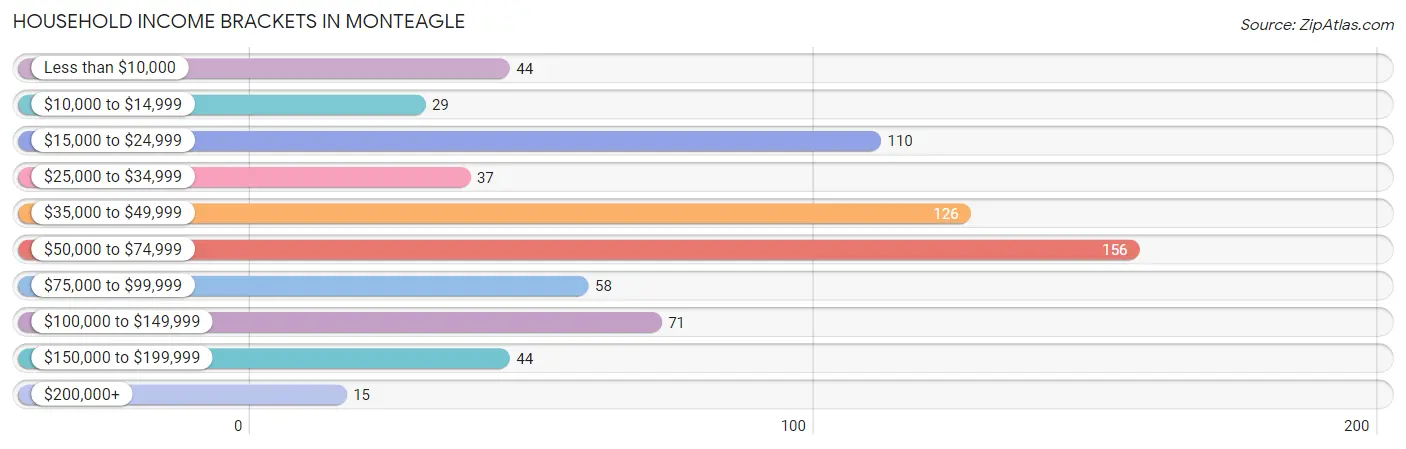
| Income Bracket | # Households | % Households |
| Less than $10,000 | 44 | 6.4% |
| $10,000 to $14,999 | 29 | 4.2% |
| $15,000 to $24,999 | 110 | 15.9% |
| $25,000 to $34,999 | 37 | 5.4% |
| $35,000 to $49,999 | 126 | 18.3% |
| $50,000 to $74,999 | 156 | 22.6% |
| $75,000 to $99,999 | 58 | 8.4% |
| $100,000 to $149,999 | 71 | 10.3% |
| $150,000 to $199,999 | 44 | 6.4% |
| $200,000+ | 15 | 2.2% |
Household Income by Householder Age in Monteagle
The median household income in Monteagle is $49,917, with the highest median household income of $66,618 found in the 45 to 64 years age bracket for the primary householder. A total of 196 households (28.4%) fall into this category. Meanwhile, the 15 to 24 years age bracket for the primary householder has the lowest median household income of $9,318, with 16 households (2.3%) in this group.
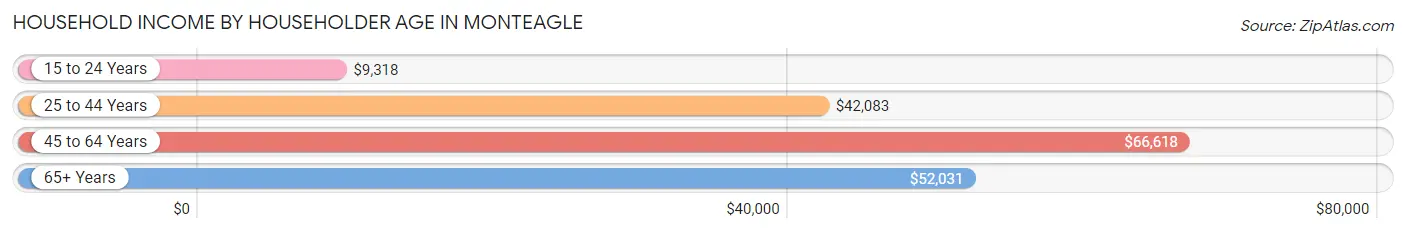
| Income Bracket | # Households | Median Income |
| 15 to 24 Years | 16 (2.3%) | $9,318 |
| 25 to 44 Years | 207 (30.0%) | $42,083 |
| 45 to 64 Years | 196 (28.4%) | $66,618 |
| 65+ Years | 271 (39.3%) | $52,031 |
| Total | 690 (100.0%) | $49,917 |
Poverty in Monteagle
Income Below Poverty by Sex and Age in Monteagle
With 23.3% poverty level for males and 17.4% for females among the residents of Monteagle, 16 and 17 year old males and 12 to 14 year old females are the most vulnerable to poverty, with 66 males (86.8%) and 6 females (54.5%) in their respective age groups living below the poverty level.
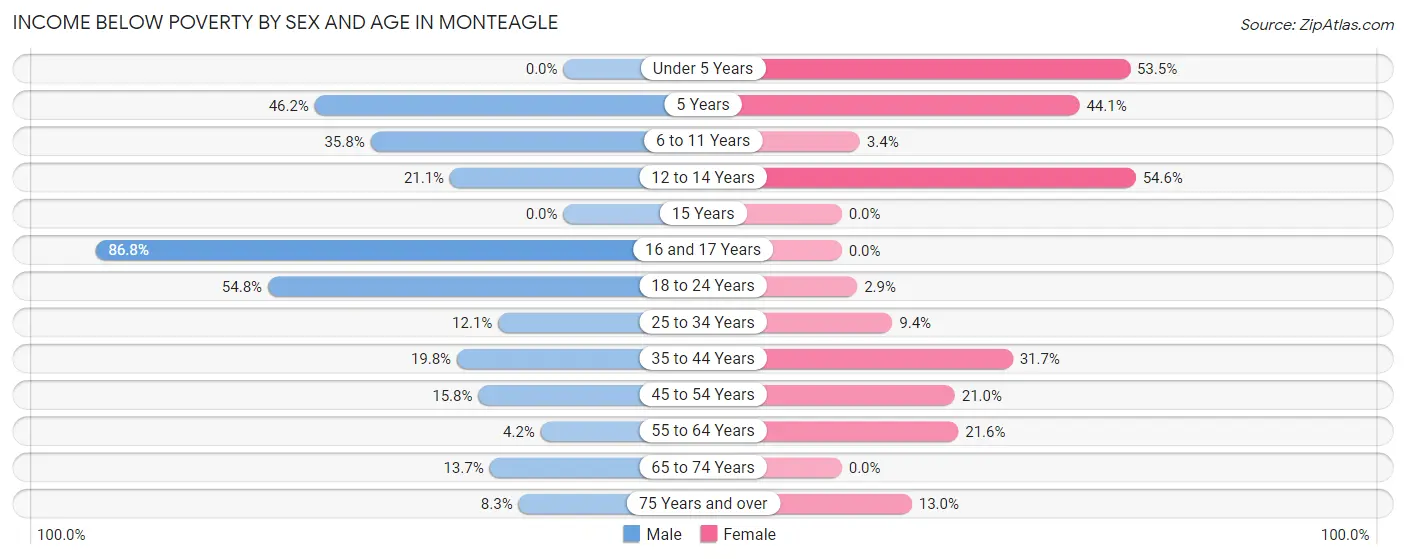
| Age Bracket | Male | Female |
| Under 5 Years | 0 (0.0%) | 23 (53.5%) |
| 5 Years | 6 (46.2%) | 15 (44.1%) |
| 6 to 11 Years | 29 (35.8%) | 5 (3.4%) |
| 12 to 14 Years | 4 (21.0%) | 6 (54.5%) |
| 15 Years | 0 (0.0%) | 0 (0.0%) |
| 16 and 17 Years | 66 (86.8%) | 0 (0.0%) |
| 18 to 24 Years | 17 (54.8%) | 1 (2.9%) |
| 25 to 34 Years | 15 (12.1%) | 3 (9.4%) |
| 35 to 44 Years | 32 (19.8%) | 59 (31.7%) |
| 45 to 54 Years | 9 (15.8%) | 13 (21.0%) |
| 55 to 64 Years | 4 (4.2%) | 24 (21.6%) |
| 65 to 74 Years | 17 (13.7%) | 0 (0.0%) |
| 75 Years and over | 7 (8.3%) | 10 (13.0%) |
| Total | 206 (23.3%) | 159 (17.4%) |
Income Above Poverty by Sex and Age in Monteagle
According to the poverty statistics in Monteagle, males aged 15 years and females aged 15 years are the age groups that are most secure financially, with 100.0% of males and 100.0% of females in these age groups living above the poverty line.
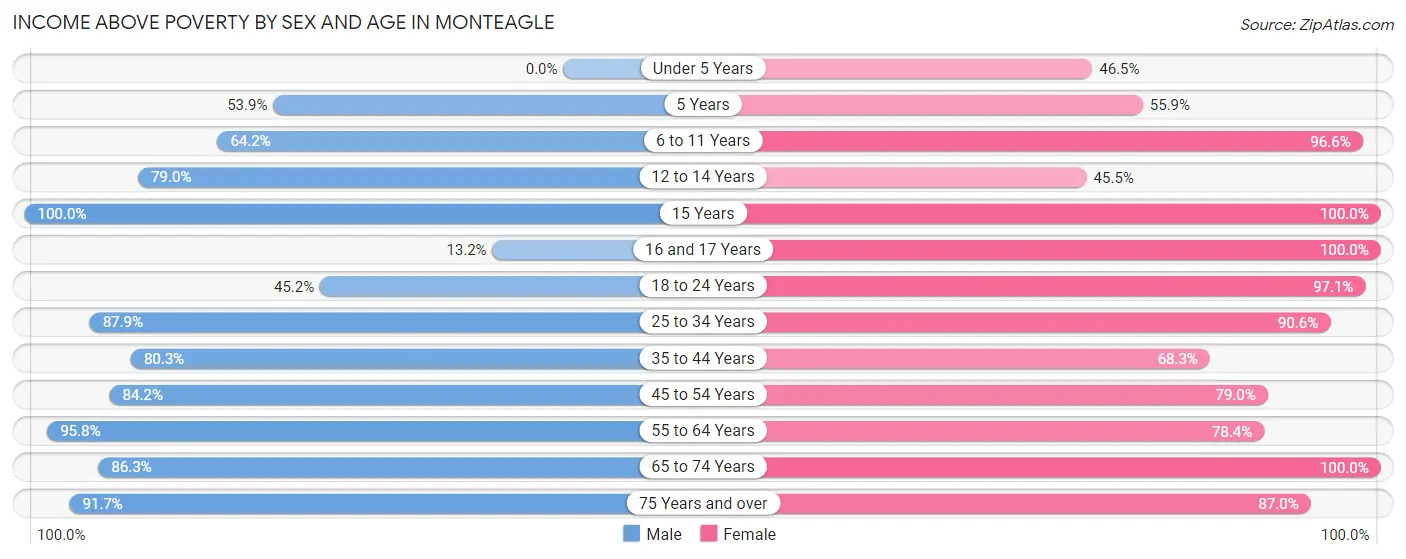
| Age Bracket | Male | Female |
| Under 5 Years | 0 (0.0%) | 20 (46.5%) |
| 5 Years | 7 (53.8%) | 19 (55.9%) |
| 6 to 11 Years | 52 (64.2%) | 144 (96.6%) |
| 12 to 14 Years | 15 (78.9%) | 5 (45.5%) |
| 15 Years | 17 (100.0%) | 12 (100.0%) |
| 16 and 17 Years | 10 (13.2%) | 3 (100.0%) |
| 18 to 24 Years | 14 (45.2%) | 34 (97.1%) |
| 25 to 34 Years | 109 (87.9%) | 29 (90.6%) |
| 35 to 44 Years | 130 (80.2%) | 127 (68.3%) |
| 45 to 54 Years | 48 (84.2%) | 49 (79.0%) |
| 55 to 64 Years | 91 (95.8%) | 87 (78.4%) |
| 65 to 74 Years | 107 (86.3%) | 160 (100.0%) |
| 75 Years and over | 77 (91.7%) | 67 (87.0%) |
| Total | 677 (76.7%) | 756 (82.6%) |
Income Below Poverty Among Married-Couple Families in Monteagle
The poverty statistics for married-couple families in Monteagle show that 3.0% or 10 of the total 332 families live below the poverty line. Families with 1 or 2 children have the highest poverty rate of 3.5%, comprising of 4 families. On the other hand, families with no children have the lowest poverty rate of 2.8%, which includes 6 families.
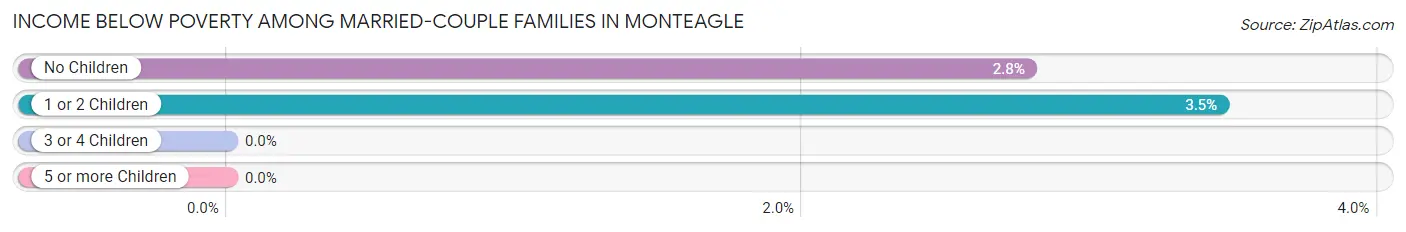
| Children | Above Poverty | Below Poverty |
| No Children | 210 (97.2%) | 6 (2.8%) |
| 1 or 2 Children | 112 (96.6%) | 4 (3.5%) |
| 3 or 4 Children | 0 (0.0%) | 0 (0.0%) |
| 5 or more Children | 0 (0.0%) | 0 (0.0%) |
| Total | 322 (97.0%) | 10 (3.0%) |
Income Below Poverty Among Single-Parent Households in Monteagle
According to the poverty data in Monteagle, 30.8% or 12 single-father households and 48.6% or 51 single-mother households are living below the poverty line. Among single-father households, those with 1 or 2 children have the highest poverty rate, with 12 households (37.5%) experiencing poverty. Likewise, among single-mother households, those with 1 or 2 children have the highest poverty rate, with 46 households (70.8%) falling below the poverty line.
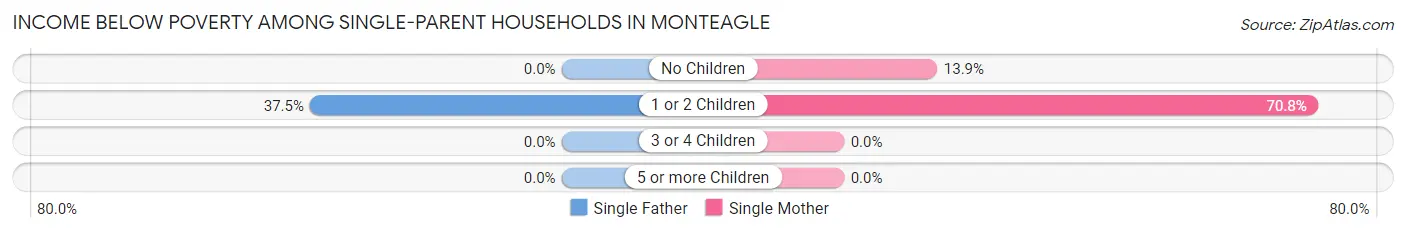
| Children | Single Father | Single Mother |
| No Children | 0 (0.0%) | 5 (13.9%) |
| 1 or 2 Children | 12 (37.5%) | 46 (70.8%) |
| 3 or 4 Children | 0 (0.0%) | 0 (0.0%) |
| 5 or more Children | 0 (0.0%) | 0 (0.0%) |
| Total | 12 (30.8%) | 51 (48.6%) |
Income Below Poverty Among Married-Couple vs Single-Parent Households in Monteagle
The poverty data for Monteagle shows that 10 of the married-couple family households (3.0%) and 63 of the single-parent households (43.8%) are living below the poverty level. Within the married-couple family households, those with 1 or 2 children have the highest poverty rate, with 4 households (3.5%) falling below the poverty line. Among the single-parent households, those with 1 or 2 children have the highest poverty rate, with 58 household (59.8%) living below poverty.
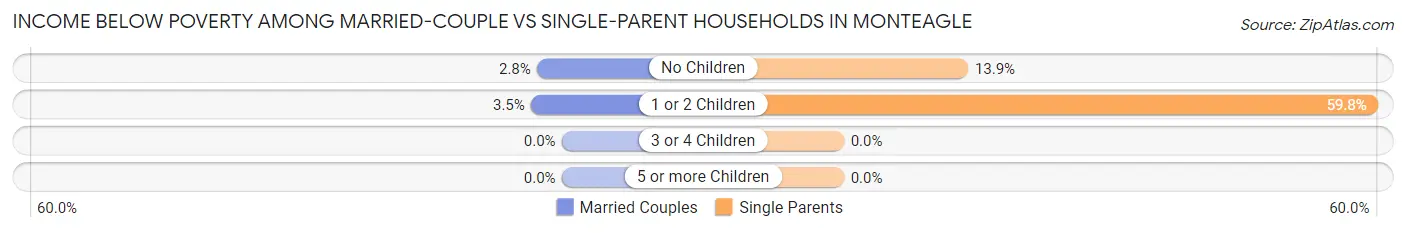
| Children | Married-Couple Families | Single-Parent Households |
| No Children | 6 (2.8%) | 5 (13.9%) |
| 1 or 2 Children | 4 (3.5%) | 58 (59.8%) |
| 3 or 4 Children | 0 (0.0%) | 0 (0.0%) |
| 5 or more Children | 0 (0.0%) | 0 (0.0%) |
| Total | 10 (3.0%) | 63 (43.8%) |
Race in Monteagle
The most populous races in Monteagle are White / Caucasian (1,782 | 93.0%), Hispanic or Latino (56 | 2.9%), and Asian (44 | 2.3%).
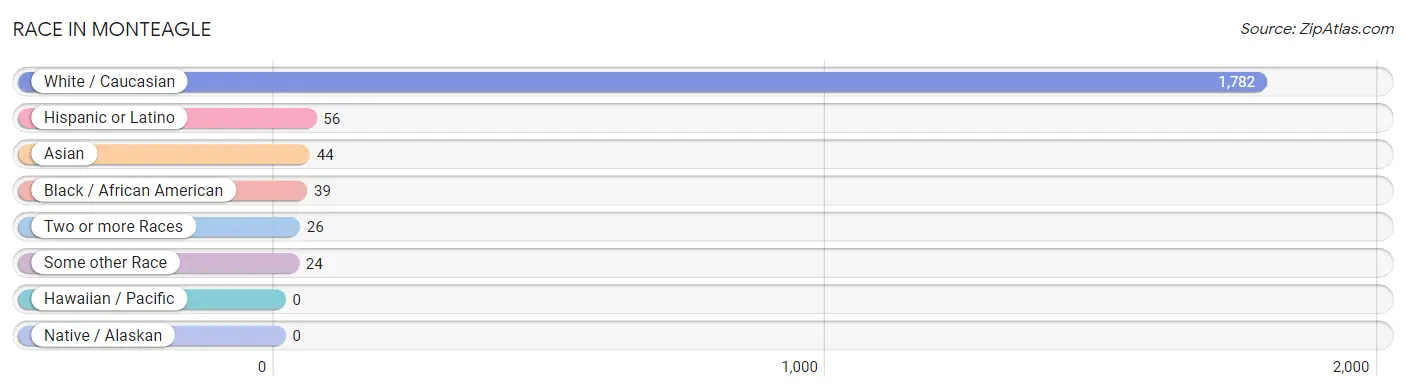
| Race | # Population | % Population |
| Asian | 44 | 2.3% |
| Black / African American | 39 | 2.0% |
| Hawaiian / Pacific | 0 | 0.0% |
| Hispanic or Latino | 56 | 2.9% |
| Native / Alaskan | 0 | 0.0% |
| White / Caucasian | 1,782 | 93.0% |
| Two or more Races | 26 | 1.4% |
| Some other Race | 24 | 1.3% |
| Total | 1,915 | 100.0% |
Ancestry in Monteagle
The most populous ancestries reported in Monteagle are English (396 | 20.7%), Irish (297 | 15.5%), American (180 | 9.4%), German (166 | 8.7%), and Italian (95 | 5.0%), together accounting for 59.2% of all Monteagle residents.
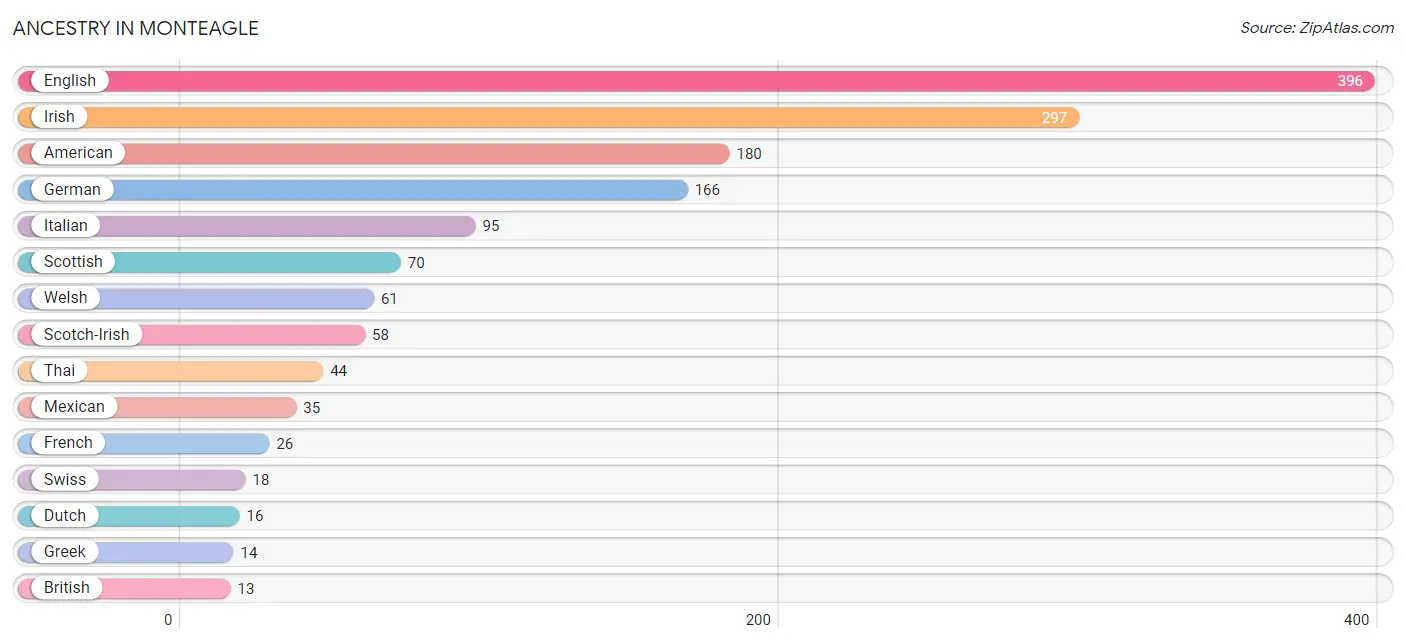
| Ancestry | # Population | % Population |
| American | 180 | 9.4% |
| Austrian | 11 | 0.6% |
| British | 13 | 0.7% |
| Canadian | 1 | 0.1% |
| Cherokee | 6 | 0.3% |
| Dutch | 16 | 0.8% |
| Eastern European | 5 | 0.3% |
| English | 396 | 20.7% |
| European | 10 | 0.5% |
| French | 26 | 1.4% |
| French Canadian | 2 | 0.1% |
| German | 166 | 8.7% |
| Greek | 14 | 0.7% |
| Irish | 297 | 15.5% |
| Italian | 95 | 5.0% |
| Mexican | 35 | 1.8% |
| Northern European | 10 | 0.5% |
| Norwegian | 8 | 0.4% |
| Polish | 11 | 0.6% |
| Puerto Rican | 12 | 0.6% |
| Scotch-Irish | 58 | 3.0% |
| Scottish | 70 | 3.7% |
| Spanish | 4 | 0.2% |
| Swedish | 4 | 0.2% |
| Swiss | 18 | 0.9% |
| Thai | 44 | 2.3% |
| Ukrainian | 6 | 0.3% |
| Welsh | 61 | 3.2% | View All 28 Rows |
Immigrants in Monteagle
The most numerous immigrant groups reported in Monteagle came from Asia (33 | 1.7%), India (33 | 1.7%), South Central Asia (33 | 1.7%), Central America (29 | 1.5%), and Latin America (29 | 1.5%), together accounting for 8.2% of all Monteagle residents.
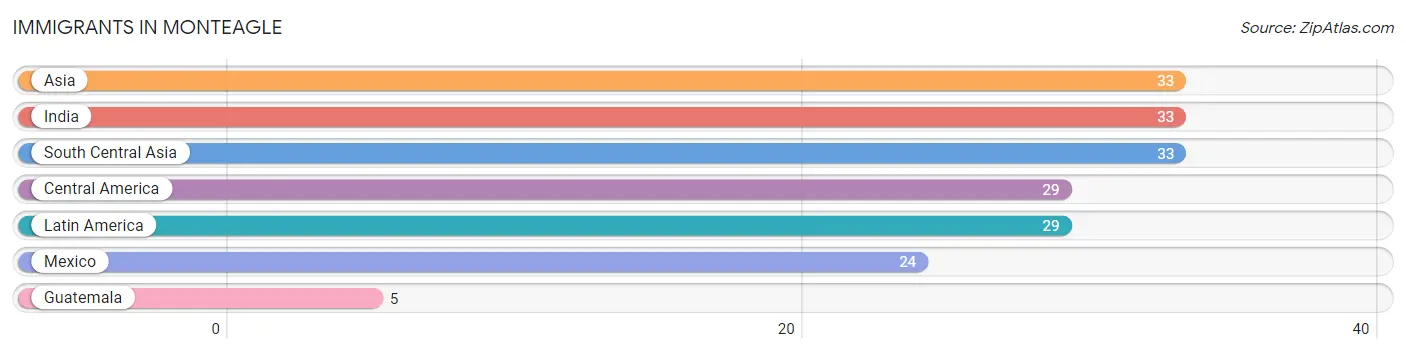
| Immigration Origin | # Population | % Population |
| Asia | 33 | 1.7% |
| Central America | 29 | 1.5% |
| Guatemala | 5 | 0.3% |
| India | 33 | 1.7% |
| Latin America | 29 | 1.5% |
| Mexico | 24 | 1.3% |
| South Central Asia | 33 | 1.7% | View All 7 Rows |
Sex and Age in Monteagle
Sex and Age in Monteagle
The most populous age groups in Monteagle are 35 to 39 Years (117 | 12.6%) for men and 5 to 9 Years (115 | 11.7%) for women.
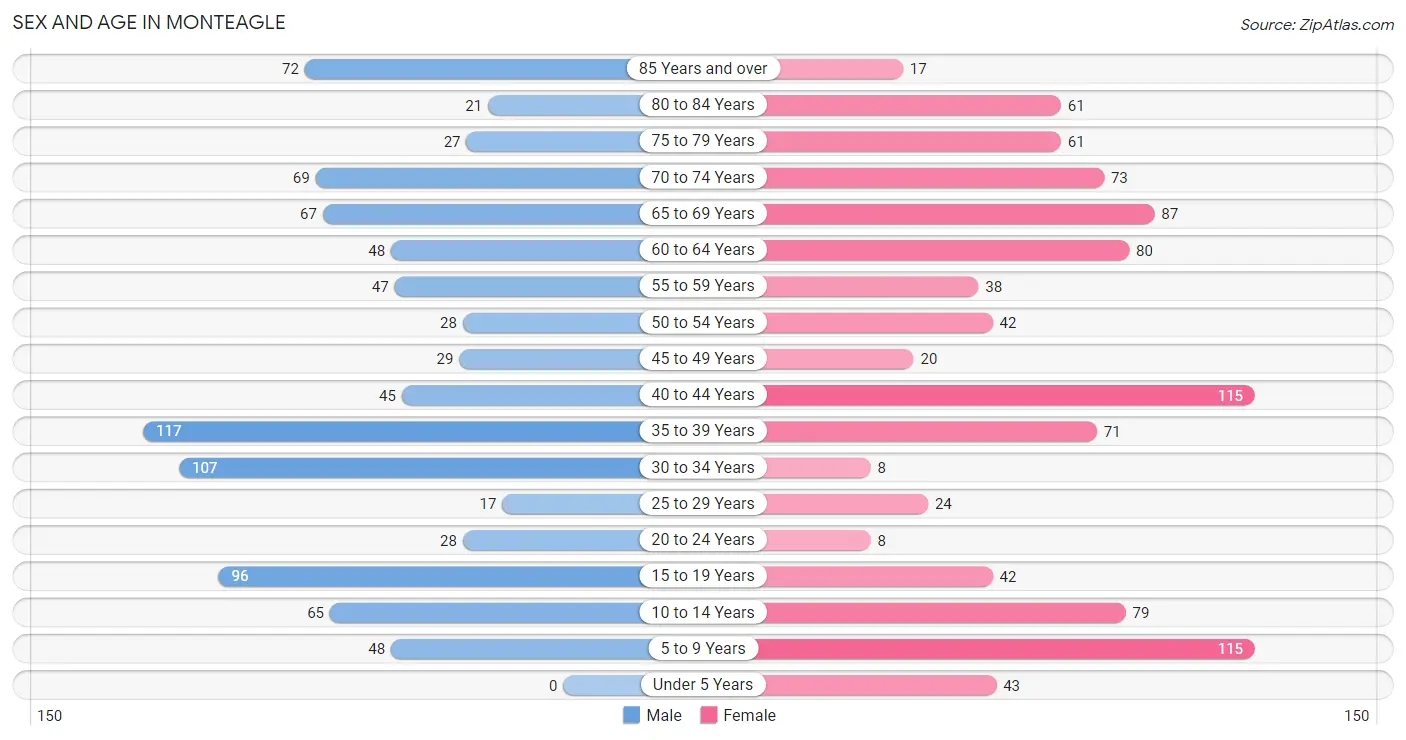
| Age Bracket | Male | Female |
| Under 5 Years | 0 (0.0%) | 43 (4.4%) |
| 5 to 9 Years | 48 (5.2%) | 115 (11.7%) |
| 10 to 14 Years | 65 (7.0%) | 79 (8.0%) |
| 15 to 19 Years | 96 (10.3%) | 42 (4.3%) |
| 20 to 24 Years | 28 (3.0%) | 8 (0.8%) |
| 25 to 29 Years | 17 (1.8%) | 24 (2.4%) |
| 30 to 34 Years | 107 (11.5%) | 8 (0.8%) |
| 35 to 39 Years | 117 (12.6%) | 71 (7.2%) |
| 40 to 44 Years | 45 (4.8%) | 115 (11.7%) |
| 45 to 49 Years | 29 (3.1%) | 20 (2.0%) |
| 50 to 54 Years | 28 (3.0%) | 42 (4.3%) |
| 55 to 59 Years | 47 (5.1%) | 38 (3.9%) |
| 60 to 64 Years | 48 (5.2%) | 80 (8.1%) |
| 65 to 69 Years | 67 (7.2%) | 87 (8.8%) |
| 70 to 74 Years | 69 (7.4%) | 73 (7.4%) |
| 75 to 79 Years | 27 (2.9%) | 61 (6.2%) |
| 80 to 84 Years | 21 (2.3%) | 61 (6.2%) |
| 85 Years and over | 72 (7.7%) | 17 (1.7%) |
| Total | 931 (100.0%) | 984 (100.0%) |
Families and Households in Monteagle
Median Family Size in Monteagle
The median family size in Monteagle is 2.99 persons per family, with single male/father families (39 | 8.2%) accounting for the largest median family size of 4.08 persons per family. On the other hand, married-couple families (332 | 69.8%) represent the smallest median family size with 2.67 persons per family.
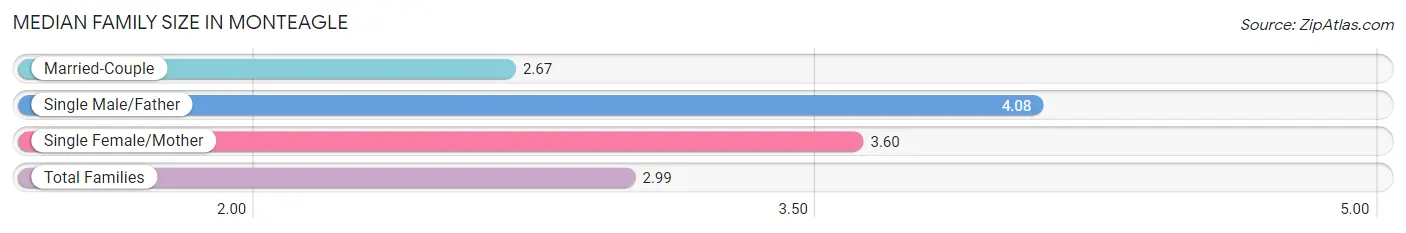
| Family Type | # Families | Family Size |
| Married-Couple | 332 (69.8%) | 2.67 |
| Single Male/Father | 39 (8.2%) | 4.08 |
| Single Female/Mother | 105 (22.1%) | 3.60 |
| Total Families | 476 (100.0%) | 2.99 |
Median Household Size in Monteagle
The median household size in Monteagle is 2.52 persons per household, with single male/father households (39 | 5.7%) accounting for the largest median household size of 4.23 persons per household. non-family households (214 | 31.0%) represent the smallest median household size with 1.29 persons per household.
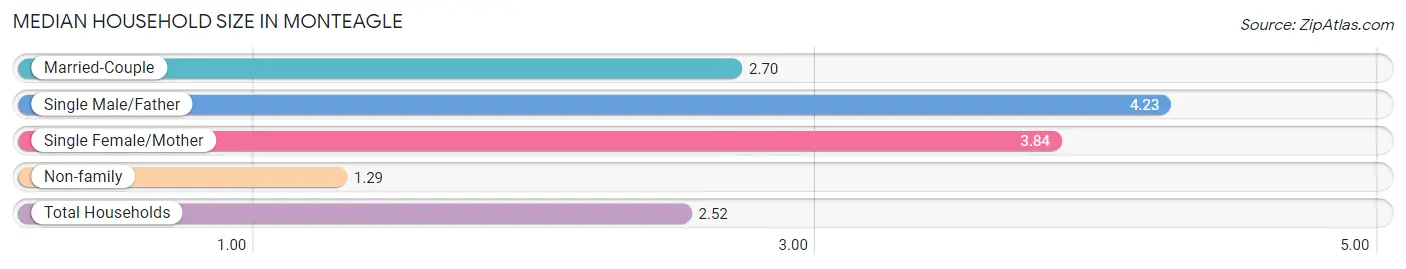
| Household Type | # Households | Household Size |
| Married-Couple | 332 (48.1%) | 2.70 |
| Single Male/Father | 39 (5.7%) | 4.23 |
| Single Female/Mother | 105 (15.2%) | 3.84 |
| Non-family | 214 (31.0%) | 1.29 |
| Total Households | 690 (100.0%) | 2.52 |
Household Size by Marriage Status in Monteagle
Out of a total of 690 households in Monteagle, 476 (69.0%) are family households, while 214 (31.0%) are nonfamily households. The most numerous type of family households are 2-person households, comprising 254, and the most common type of nonfamily households are 1-person households, comprising 178.
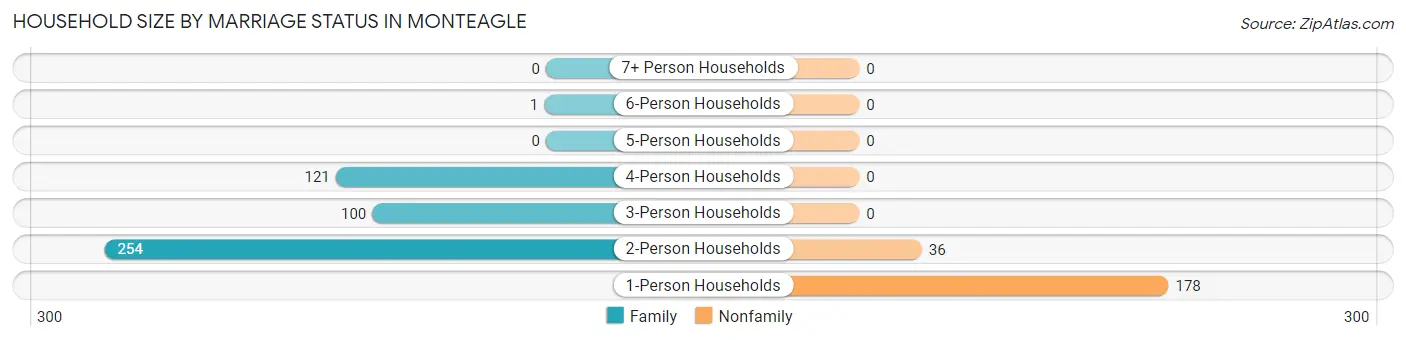
| Household Size | Family Households | Nonfamily Households |
| 1-Person Households | - | 178 (25.8%) |
| 2-Person Households | 254 (36.8%) | 36 (5.2%) |
| 3-Person Households | 100 (14.5%) | 0 (0.0%) |
| 4-Person Households | 121 (17.5%) | 0 (0.0%) |
| 5-Person Households | 0 (0.0%) | 0 (0.0%) |
| 6-Person Households | 1 (0.1%) | 0 (0.0%) |
| 7+ Person Households | 0 (0.0%) | 0 (0.0%) |
| Total | 476 (69.0%) | 214 (31.0%) |
Female Fertility in Monteagle
Fertility by Age in Monteagle
Average fertility rate in Monteagle is 44.0 births per 1,000 women. Women in the age bracket of 20 to 34 years have the highest fertility rate with 325.0 births per 1,000 women. Women in the age bracket of 20 to 34 years acount for 100.0% of all women with births.
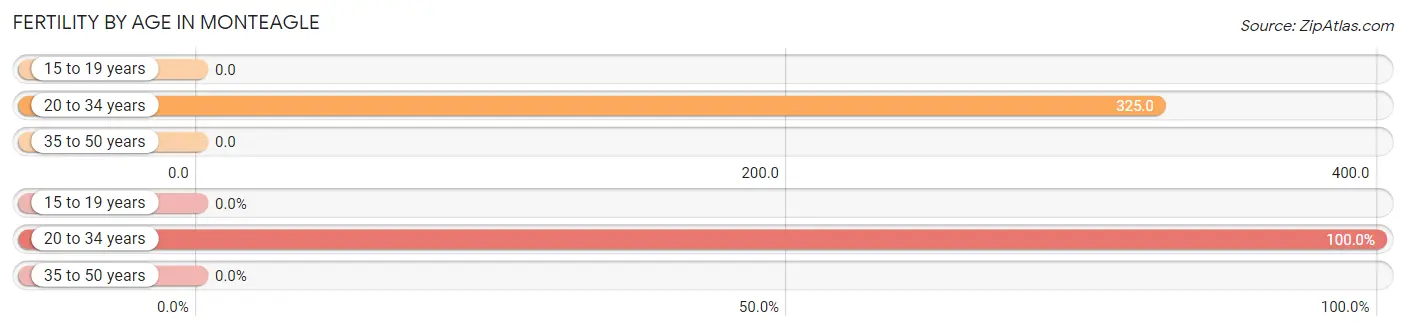
| Age Bracket | Women with Births | Births / 1,000 Women |
| 15 to 19 years | 0 (0.0%) | 0.0 |
| 20 to 34 years | 13 (100.0%) | 325.0 |
| 35 to 50 years | 0 (0.0%) | 0.0 |
| Total | 13 (100.0%) | 44.0 |
Fertility by Age by Marriage Status in Monteagle
92.3% of women with births (13) in Monteagle are married. The highest percentage of unmarried women with births falls into 20 to 34 years age bracket with 7.7% of them unmarried at the time of birth, while the lowest percentage of unmarried women with births belong to 20 to 34 years age bracket with 7.7% of them unmarried.
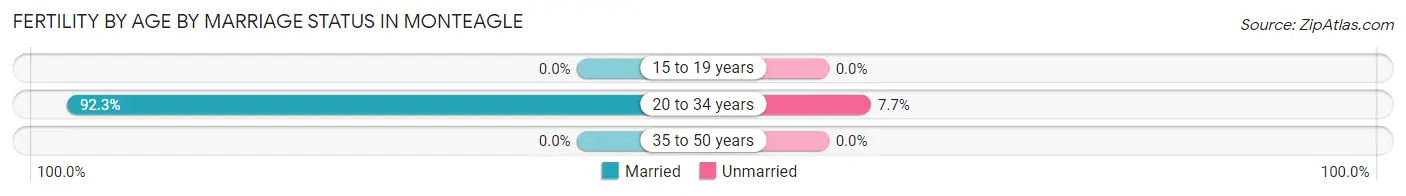
| Age Bracket | Married | Unmarried |
| 15 to 19 years | 0 (0.0%) | 0 (0.0%) |
| 20 to 34 years | 12 (92.3%) | 1 (7.7%) |
| 35 to 50 years | 0 (0.0%) | 0 (0.0%) |
| Total | 12 (92.3%) | 1 (7.7%) |
Fertility by Education in Monteagle
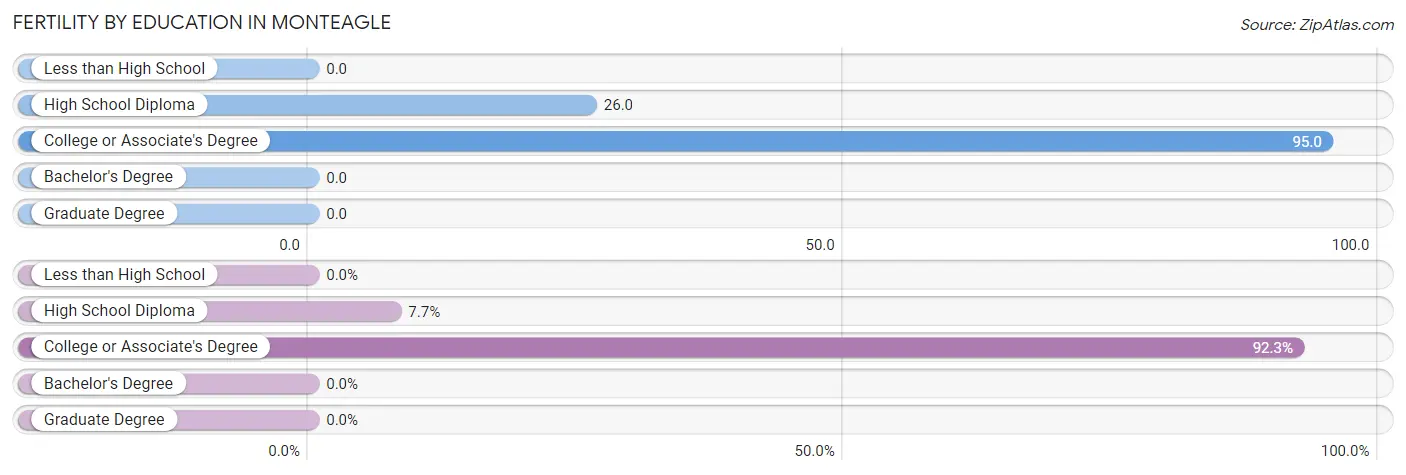
| Educational Attainment | Women with Births | Births / 1,000 Women |
| Less than High School | 0 (0.0%) | 0.0 |
| High School Diploma | 1 (7.7%) | 26.0 |
| College or Associate's Degree | 12 (92.3%) | 95.0 |
| Bachelor's Degree | 0 (0.0%) | 0.0 |
| Graduate Degree | 0 (0.0%) | 0.0 |
| Total | 13 (100.0%) | 44.0 |
Fertility by Education by Marriage Status in Monteagle
7.7% of women with births in Monteagle are unmarried. Women with the educational attainment of college or associate's degree are most likely to be married with 100.0% of them married at childbirth, while women with the educational attainment of high school diploma are least likely to be married with 100.0% of them unmarried at childbirth.
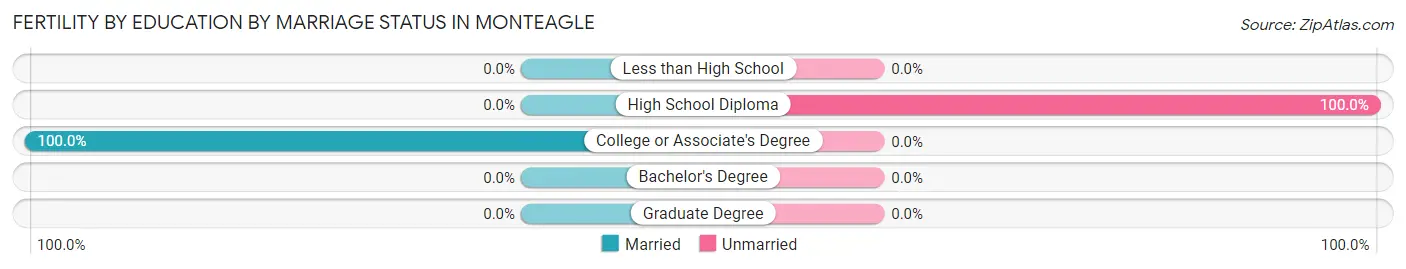
| Educational Attainment | Married | Unmarried |
| Less than High School | 0 (0.0%) | 0 (0.0%) |
| High School Diploma | 0 (0.0%) | 1 (100.0%) |
| College or Associate's Degree | 12 (100.0%) | 0 (0.0%) |
| Bachelor's Degree | 0 (0.0%) | 0 (0.0%) |
| Graduate Degree | 0 (0.0%) | 0 (0.0%) |
| Total | 12 (92.3%) | 1 (7.7%) |
Employment Characteristics in Monteagle
Employment by Class of Employer in Monteagle
Among the 547 employed individuals in Monteagle, private company employees (314 | 57.4%), state government employees (73 | 13.4%), and self-employed (incorporated) (46 | 8.4%) make up the most common classes of employment.
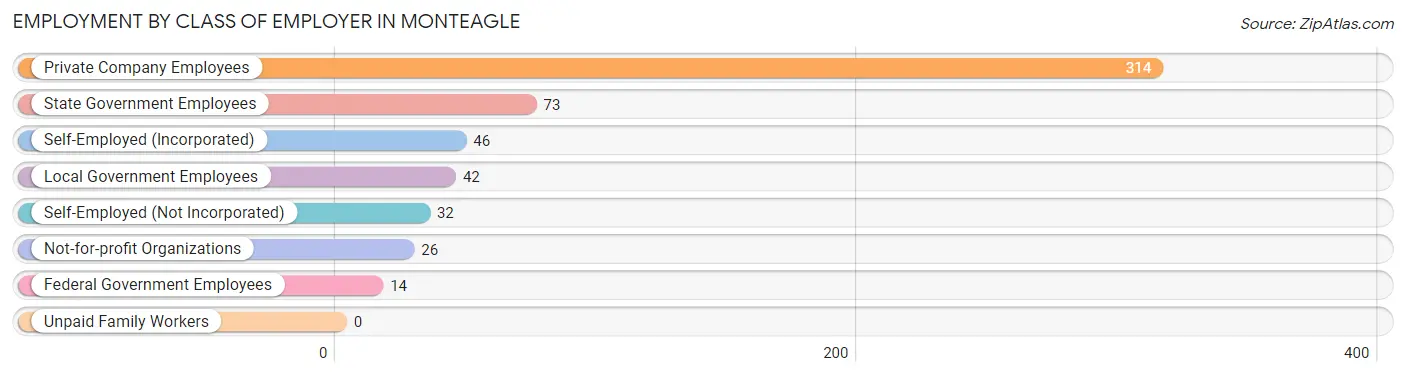
| Employer Class | # Employees | % Employees |
| Private Company Employees | 314 | 57.4% |
| Self-Employed (Incorporated) | 46 | 8.4% |
| Self-Employed (Not Incorporated) | 32 | 5.9% |
| Not-for-profit Organizations | 26 | 4.8% |
| Local Government Employees | 42 | 7.7% |
| State Government Employees | 73 | 13.4% |
| Federal Government Employees | 14 | 2.6% |
| Unpaid Family Workers | 0 | 0.0% |
| Total | 547 | 100.0% |
Employment Status by Age in Monteagle
According to the labor force statistics for Monteagle, out of the total population over 16 years of age (1,536), 42.1% or 647 individuals are in the labor force, with 13.3% or 86 of them unemployed. The age group with the highest labor force participation rate is 45 to 54 years, with 96.6% or 115 individuals in the labor force. Within the labor force, the 16 to 19 years age range has the highest percentage of unemployed individuals, with 100.0% or 54 of them being unemployed.
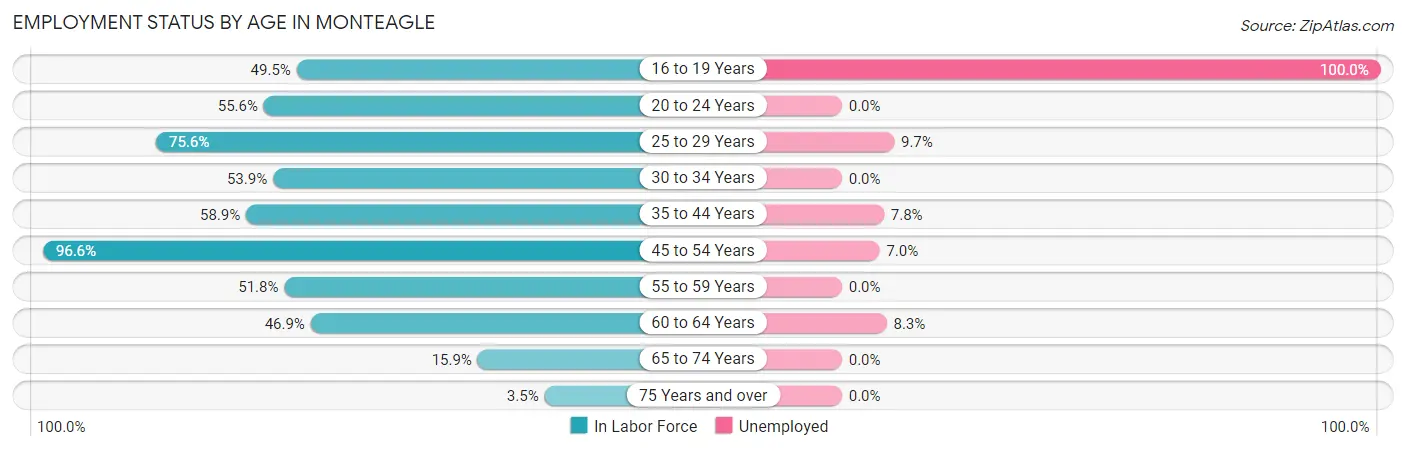
| Age Bracket | In Labor Force | Unemployed |
| 16 to 19 Years | 54 (49.5%) | 54 (100.0%) |
| 20 to 24 Years | 20 (55.6%) | 0 (0.0%) |
| 25 to 29 Years | 31 (75.6%) | 3 (9.7%) |
| 30 to 34 Years | 62 (53.9%) | 0 (0.0%) |
| 35 to 44 Years | 205 (58.9%) | 16 (7.8%) |
| 45 to 54 Years | 115 (96.6%) | 8 (7.0%) |
| 55 to 59 Years | 44 (51.8%) | 0 (0.0%) |
| 60 to 64 Years | 60 (46.9%) | 5 (8.3%) |
| 65 to 74 Years | 47 (15.9%) | 0 (0.0%) |
| 75 Years and over | 9 (3.5%) | 0 (0.0%) |
| Total | 647 (42.1%) | 86 (13.3%) |
Employment Status by Educational Attainment in Monteagle
According to labor force statistics for Monteagle, 61.8% of individuals (517) out of the total population between 25 and 64 years of age (836) are in the labor force, with 6.2% or 32 of them being unemployed. The group with the highest labor force participation rate are those with the educational attainment of college / associate degree, with 78.5% or 226 individuals in the labor force. Within the labor force, individuals with less than high school education have the highest percentage of unemployment, with 41.3% or 19 of them being unemployed.
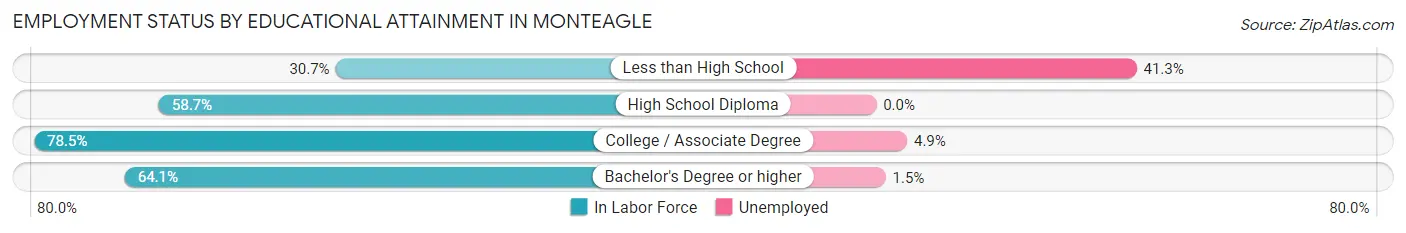
| Educational Attainment | In Labor Force | Unemployed |
| Less than High School | 46 (30.7%) | 62 (41.3%) |
| High School Diploma | 111 (58.7%) | 0 (0.0%) |
| College / Associate Degree | 226 (78.5%) | 14 (4.9%) |
| Bachelor's Degree or higher | 134 (64.1%) | 3 (1.5%) |
| Total | 517 (61.8%) | 52 (6.2%) |
Employment Occupations by Sex in Monteagle
Management, Business, Science and Arts Occupations
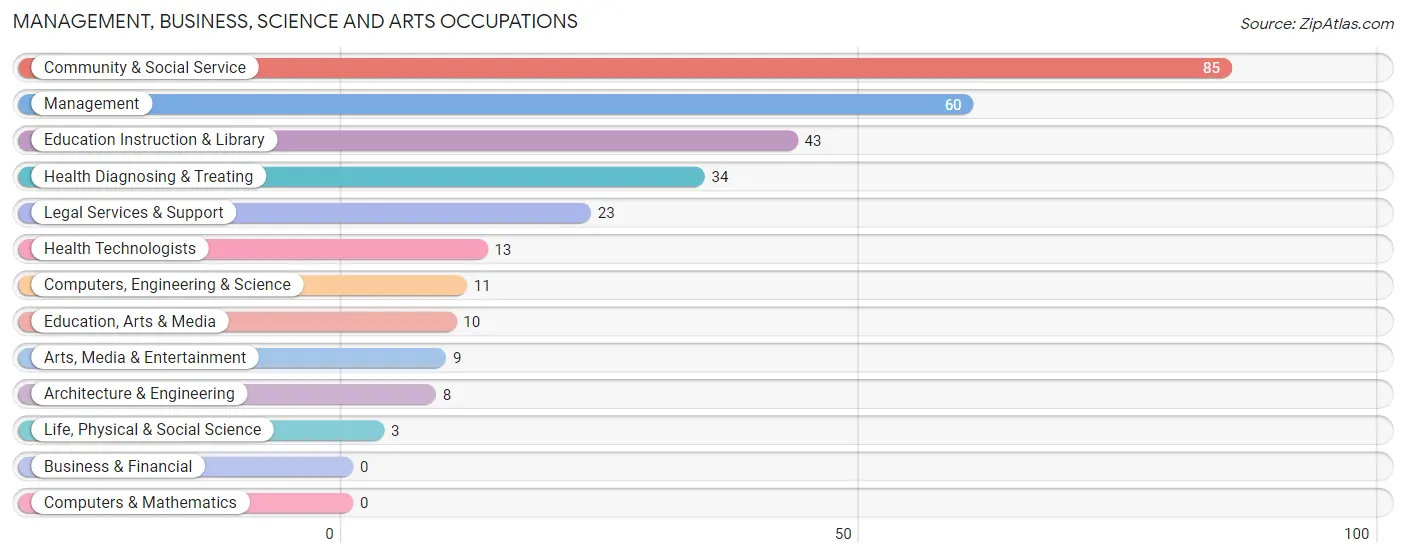
The most common Management, Business, Science and Arts occupations in Monteagle are Community & Social Service (85 | 15.1%), Management (60 | 10.7%), Education Instruction & Library (43 | 7.7%), Health Diagnosing & Treating (34 | 6.1%), and Legal Services & Support (23 | 4.1%).
Management, Business, Science and Arts Occupations by Sex
Within the Management, Business, Science and Arts occupations in Monteagle, the most male-oriented occupations are Computers, Engineering & Science (100.0%), Architecture & Engineering (100.0%), and Life, Physical & Social Science (100.0%), while the most female-oriented occupations are Education, Arts & Media (100.0%), Health Technologists (84.6%), and Health Diagnosing & Treating (76.5%).
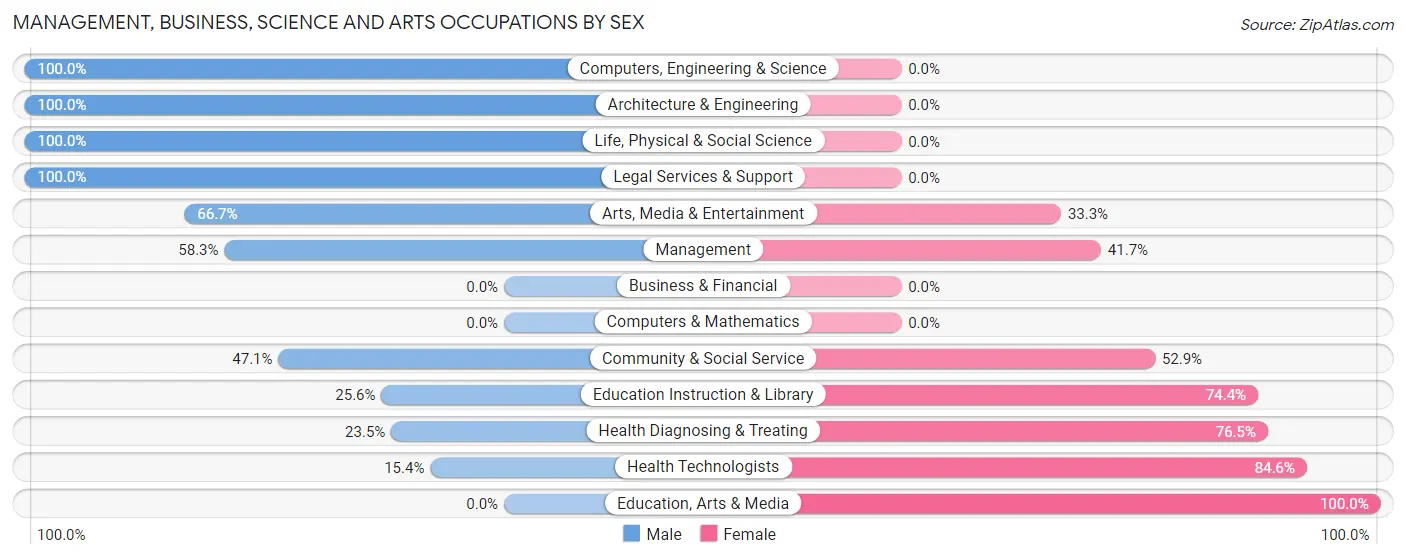
| Occupation | Male | Female |
| Management | 35 (58.3%) | 25 (41.7%) |
| Business & Financial | 0 (0.0%) | 0 (0.0%) |
| Computers, Engineering & Science | 11 (100.0%) | 0 (0.0%) |
| Computers & Mathematics | 0 (0.0%) | 0 (0.0%) |
| Architecture & Engineering | 8 (100.0%) | 0 (0.0%) |
| Life, Physical & Social Science | 3 (100.0%) | 0 (0.0%) |
| Community & Social Service | 40 (47.1%) | 45 (52.9%) |
| Education, Arts & Media | 0 (0.0%) | 10 (100.0%) |
| Legal Services & Support | 23 (100.0%) | 0 (0.0%) |
| Education Instruction & Library | 11 (25.6%) | 32 (74.4%) |
| Arts, Media & Entertainment | 6 (66.7%) | 3 (33.3%) |
| Health Diagnosing & Treating | 8 (23.5%) | 26 (76.5%) |
| Health Technologists | 2 (15.4%) | 11 (84.6%) |
| Total (Category) | 94 (49.5%) | 96 (50.5%) |
| Total (Overall) | 349 (62.2%) | 212 (37.8%) |
Services Occupations
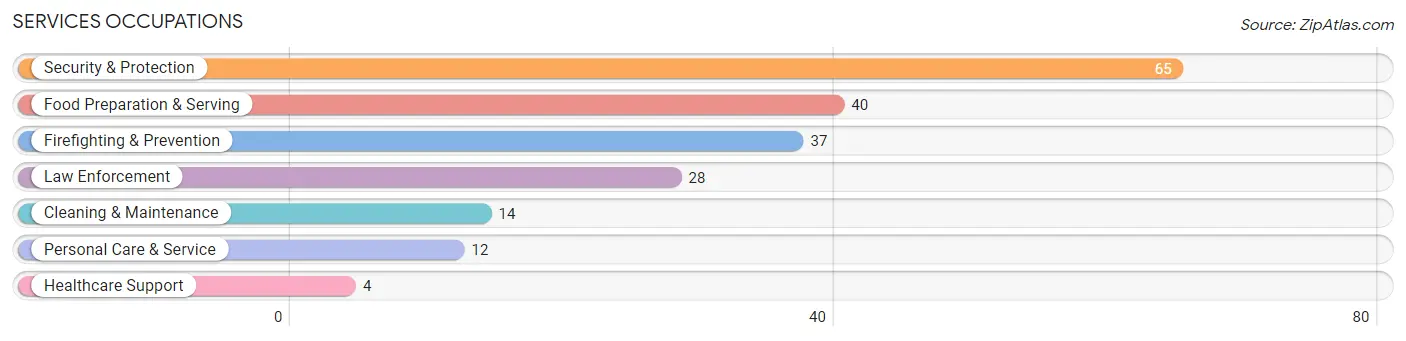
The most common Services occupations in Monteagle are Security & Protection (65 | 11.6%), Food Preparation & Serving (40 | 7.1%), Firefighting & Prevention (37 | 6.6%), Law Enforcement (28 | 5.0%), and Cleaning & Maintenance (14 | 2.5%).
Services Occupations by Sex
Within the Services occupations in Monteagle, the most male-oriented occupations are Security & Protection (100.0%), Firefighting & Prevention (100.0%), and Law Enforcement (100.0%), while the most female-oriented occupations are Healthcare Support (100.0%), Personal Care & Service (100.0%), and Food Preparation & Serving (50.0%).
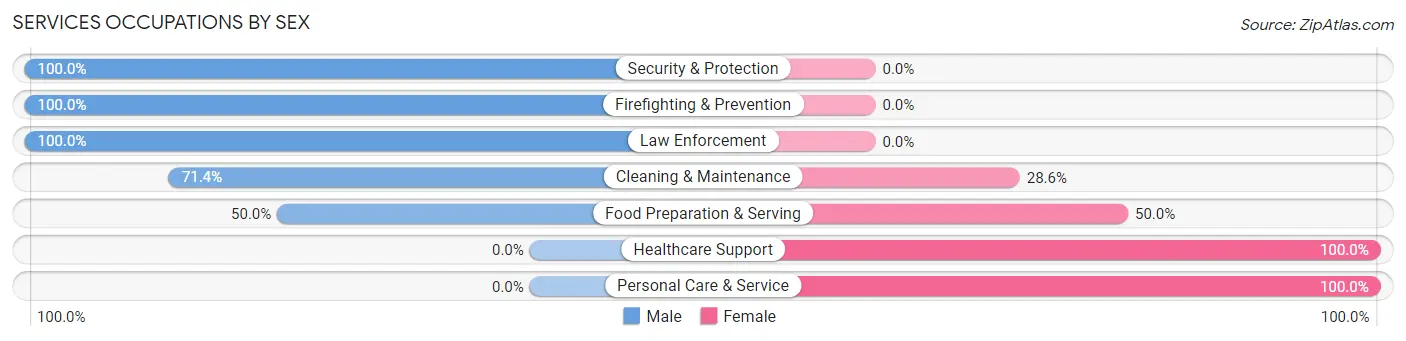
| Occupation | Male | Female |
| Healthcare Support | 0 (0.0%) | 4 (100.0%) |
| Security & Protection | 65 (100.0%) | 0 (0.0%) |
| Firefighting & Prevention | 37 (100.0%) | 0 (0.0%) |
| Law Enforcement | 28 (100.0%) | 0 (0.0%) |
| Food Preparation & Serving | 20 (50.0%) | 20 (50.0%) |
| Cleaning & Maintenance | 10 (71.4%) | 4 (28.6%) |
| Personal Care & Service | 0 (0.0%) | 12 (100.0%) |
| Total (Category) | 95 (70.4%) | 40 (29.6%) |
| Total (Overall) | 349 (62.2%) | 212 (37.8%) |
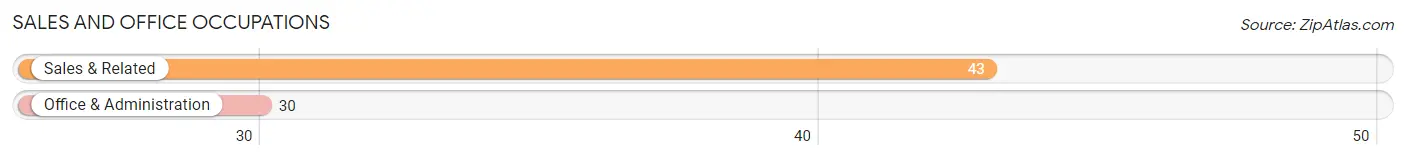
Sales and Office Occupations
The most common Sales and Office occupations in Monteagle are Sales & Related (43 | 7.7%), and Office & Administration (30 | 5.3%).
Sales and Office Occupations by Sex
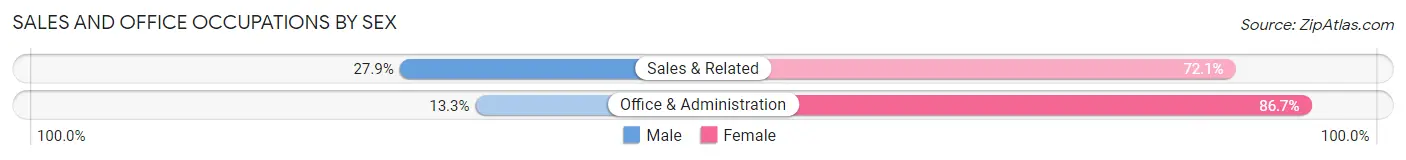
| Occupation | Male | Female |
| Sales & Related | 12 (27.9%) | 31 (72.1%) |
| Office & Administration | 4 (13.3%) | 26 (86.7%) |
| Total (Category) | 16 (21.9%) | 57 (78.1%) |
| Total (Overall) | 349 (62.2%) | 212 (37.8%) |
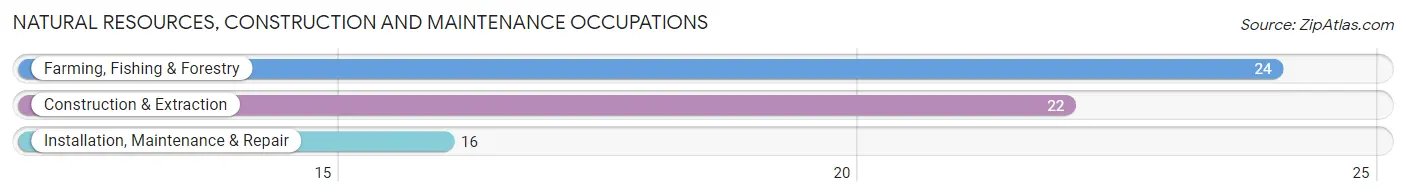
Natural Resources, Construction and Maintenance Occupations
The most common Natural Resources, Construction and Maintenance occupations in Monteagle are Farming, Fishing & Forestry (24 | 4.3%), Construction & Extraction (22 | 3.9%), and Installation, Maintenance & Repair (16 | 2.9%).
Natural Resources, Construction and Maintenance Occupations by Sex
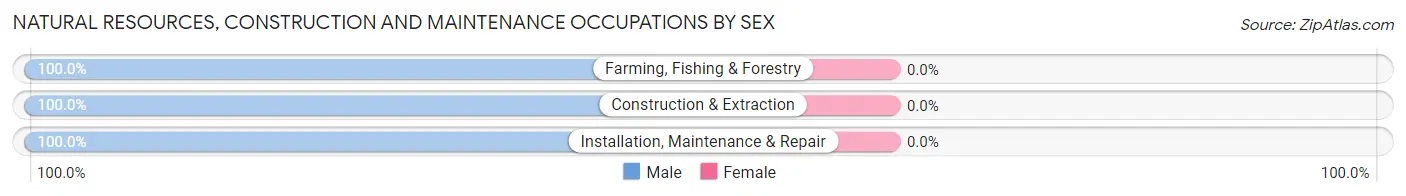
| Occupation | Male | Female |
| Farming, Fishing & Forestry | 24 (100.0%) | 0 (0.0%) |
| Construction & Extraction | 22 (100.0%) | 0 (0.0%) |
| Installation, Maintenance & Repair | 16 (100.0%) | 0 (0.0%) |
| Total (Category) | 62 (100.0%) | 0 (0.0%) |
| Total (Overall) | 349 (62.2%) | 212 (37.8%) |
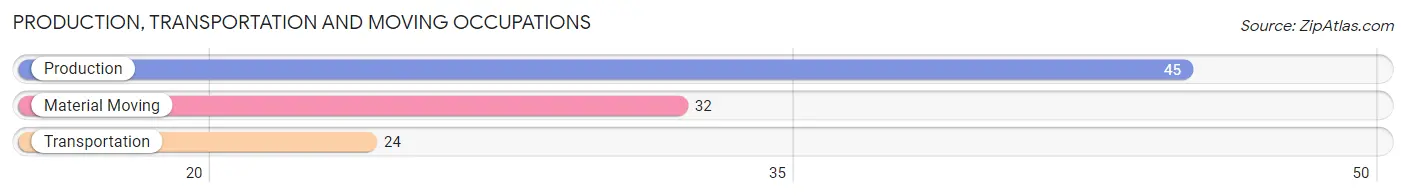
Production, Transportation and Moving Occupations
The most common Production, Transportation and Moving occupations in Monteagle are Production (45 | 8.0%), Material Moving (32 | 5.7%), and Transportation (24 | 4.3%).
Production, Transportation and Moving Occupations by Sex
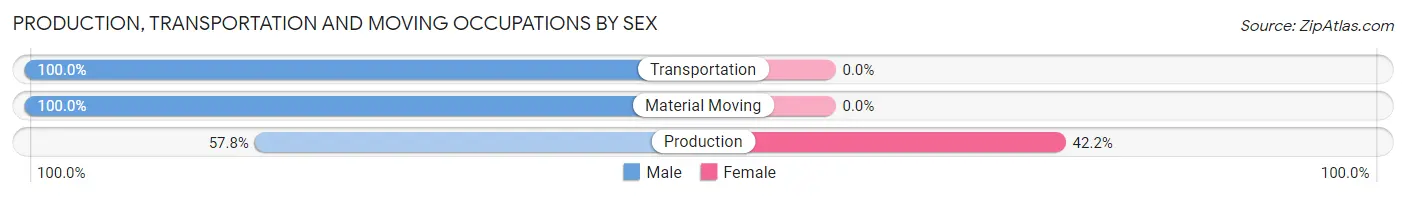
| Occupation | Male | Female |
| Production | 26 (57.8%) | 19 (42.2%) |
| Transportation | 24 (100.0%) | 0 (0.0%) |
| Material Moving | 32 (100.0%) | 0 (0.0%) |
| Total (Category) | 82 (81.2%) | 19 (18.8%) |
| Total (Overall) | 349 (62.2%) | 212 (37.8%) |
Employment Industries by Sex in Monteagle
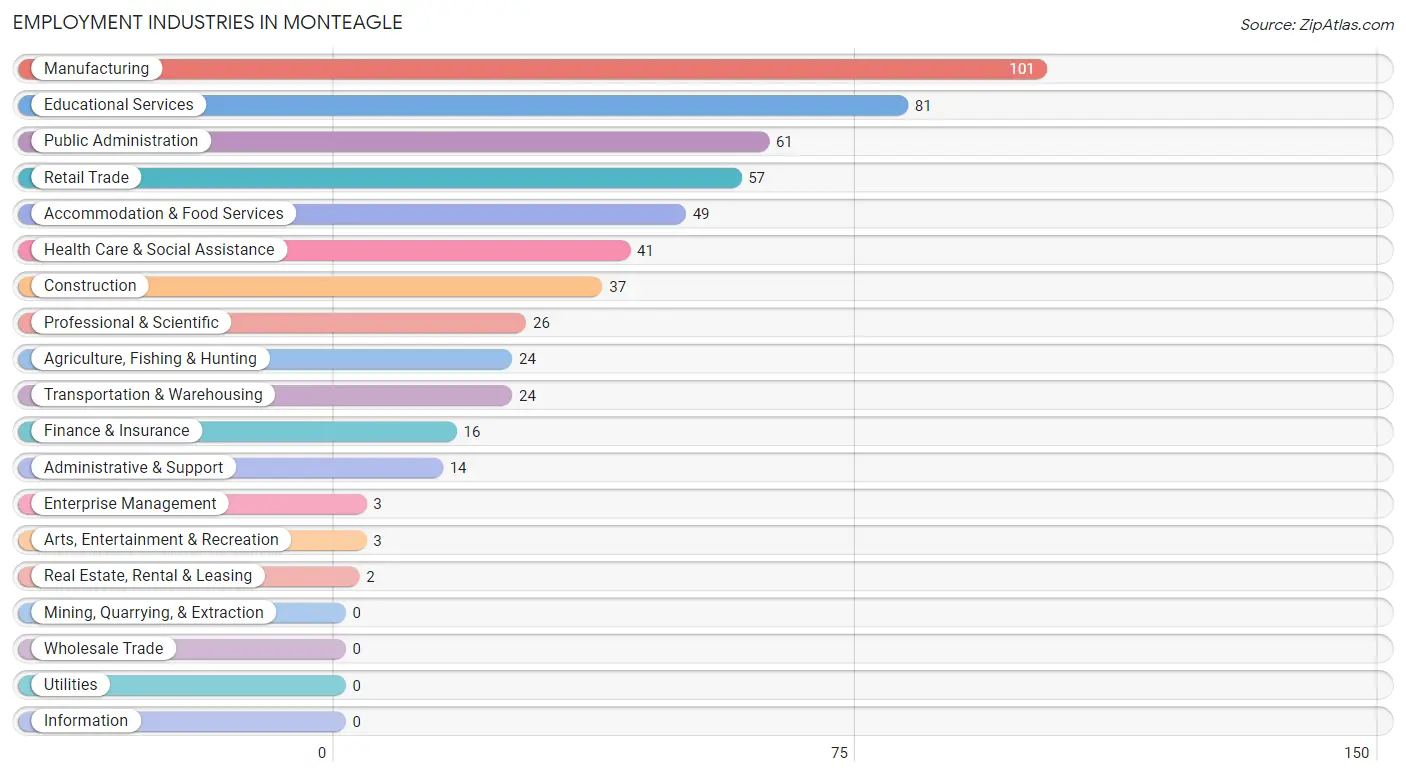
Employment Industries in Monteagle
The major employment industries in Monteagle include Manufacturing (101 | 18.0%), Educational Services (81 | 14.4%), Public Administration (61 | 10.9%), Retail Trade (57 | 10.2%), and Accommodation & Food Services (49 | 8.7%).
Employment Industries by Sex in Monteagle
The Monteagle industries that see more men than women are Agriculture, Fishing & Hunting (100.0%), Transportation & Warehousing (100.0%), and Enterprise Management (100.0%), whereas the industries that tend to have a higher number of women are Real Estate, Rental & Leasing (100.0%), Arts, Entertainment & Recreation (100.0%), and Educational Services (79.0%).
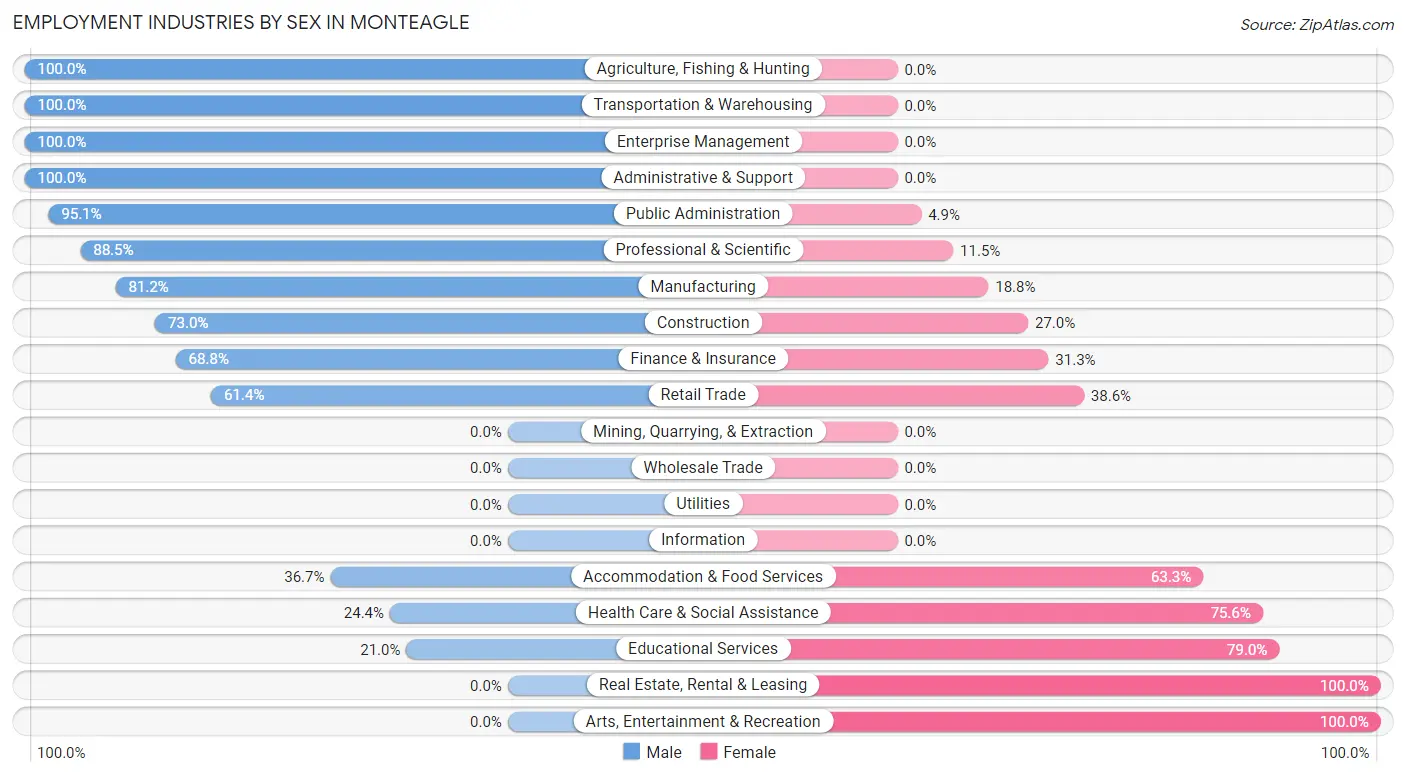
| Industry | Male | Female |
| Agriculture, Fishing & Hunting | 24 (100.0%) | 0 (0.0%) |
| Mining, Quarrying, & Extraction | 0 (0.0%) | 0 (0.0%) |
| Construction | 27 (73.0%) | 10 (27.0%) |
| Manufacturing | 82 (81.2%) | 19 (18.8%) |
| Wholesale Trade | 0 (0.0%) | 0 (0.0%) |
| Retail Trade | 35 (61.4%) | 22 (38.6%) |
| Transportation & Warehousing | 24 (100.0%) | 0 (0.0%) |
| Utilities | 0 (0.0%) | 0 (0.0%) |
| Information | 0 (0.0%) | 0 (0.0%) |
| Finance & Insurance | 11 (68.8%) | 5 (31.2%) |
| Real Estate, Rental & Leasing | 0 (0.0%) | 2 (100.0%) |
| Professional & Scientific | 23 (88.5%) | 3 (11.5%) |
| Enterprise Management | 3 (100.0%) | 0 (0.0%) |
| Administrative & Support | 14 (100.0%) | 0 (0.0%) |
| Educational Services | 17 (21.0%) | 64 (79.0%) |
| Health Care & Social Assistance | 10 (24.4%) | 31 (75.6%) |
| Arts, Entertainment & Recreation | 0 (0.0%) | 3 (100.0%) |
| Accommodation & Food Services | 18 (36.7%) | 31 (63.3%) |
| Public Administration | 58 (95.1%) | 3 (4.9%) |
| Total | 349 (62.2%) | 212 (37.8%) |
Education in Monteagle
School Enrollment in Monteagle
The most common levels of schooling among the 398 students in Monteagle are middle school (146 | 36.7%), elementary school (111 | 27.9%), and high school (54 | 13.6%).
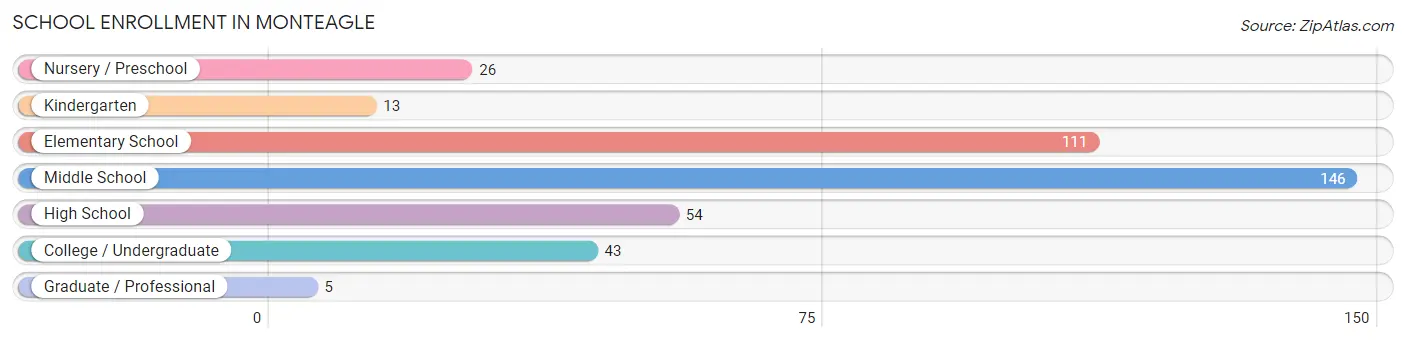
| School Level | # Students | % Students |
| Nursery / Preschool | 26 | 6.5% |
| Kindergarten | 13 | 3.3% |
| Elementary School | 111 | 27.9% |
| Middle School | 146 | 36.7% |
| High School | 54 | 13.6% |
| College / Undergraduate | 43 | 10.8% |
| Graduate / Professional | 5 | 1.3% |
| Total | 398 | 100.0% |
School Enrollment by Age by Funding Source in Monteagle
Out of a total of 398 students who are enrolled in schools in Monteagle, 39 (9.8%) attend a private institution, while the remaining 359 (90.2%) are enrolled in public schools. The age group of 35 years and over has the highest likelihood of being enrolled in private schools, with 11 (45.8% in the age bracket) enrolled. Conversely, the age group of 3 to 4 year olds has the lowest likelihood of being enrolled in a private school, with 7 (100.0% in the age bracket) attending a public institution.
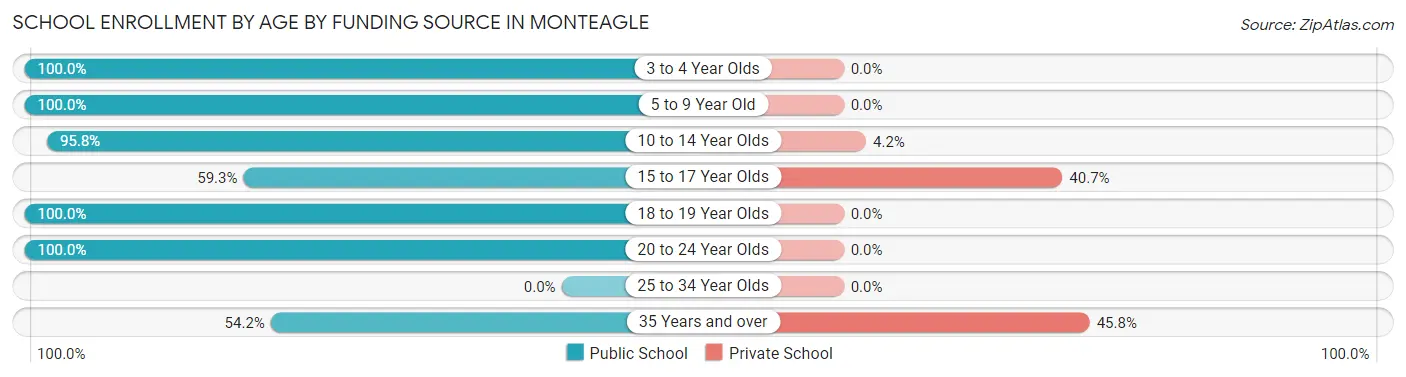
| Age Bracket | Public School | Private School |
| 3 to 4 Year Olds | 7 (100.0%) | 0 (0.0%) |
| 5 to 9 Year Old | 145 (100.0%) | 0 (0.0%) |
| 10 to 14 Year Olds | 138 (95.8%) | 6 (4.2%) |
| 15 to 17 Year Olds | 32 (59.3%) | 22 (40.7%) |
| 18 to 19 Year Olds | 21 (100.0%) | 0 (0.0%) |
| 20 to 24 Year Olds | 3 (100.0%) | 0 (0.0%) |
| 25 to 34 Year Olds | 0 (0.0%) | 0 (0.0%) |
| 35 Years and over | 13 (54.2%) | 11 (45.8%) |
| Total | 359 (90.2%) | 39 (9.8%) |
Educational Attainment by Field of Study in Monteagle
Education (86 | 19.0%), arts & humanities (85 | 18.8%), liberal arts & history (54 | 11.9%), literature & languages (46 | 10.2%), and bio, nature & agricultural (40 | 8.8%) are the most common fields of study among 453 individuals in Monteagle who have obtained a bachelor's degree or higher.
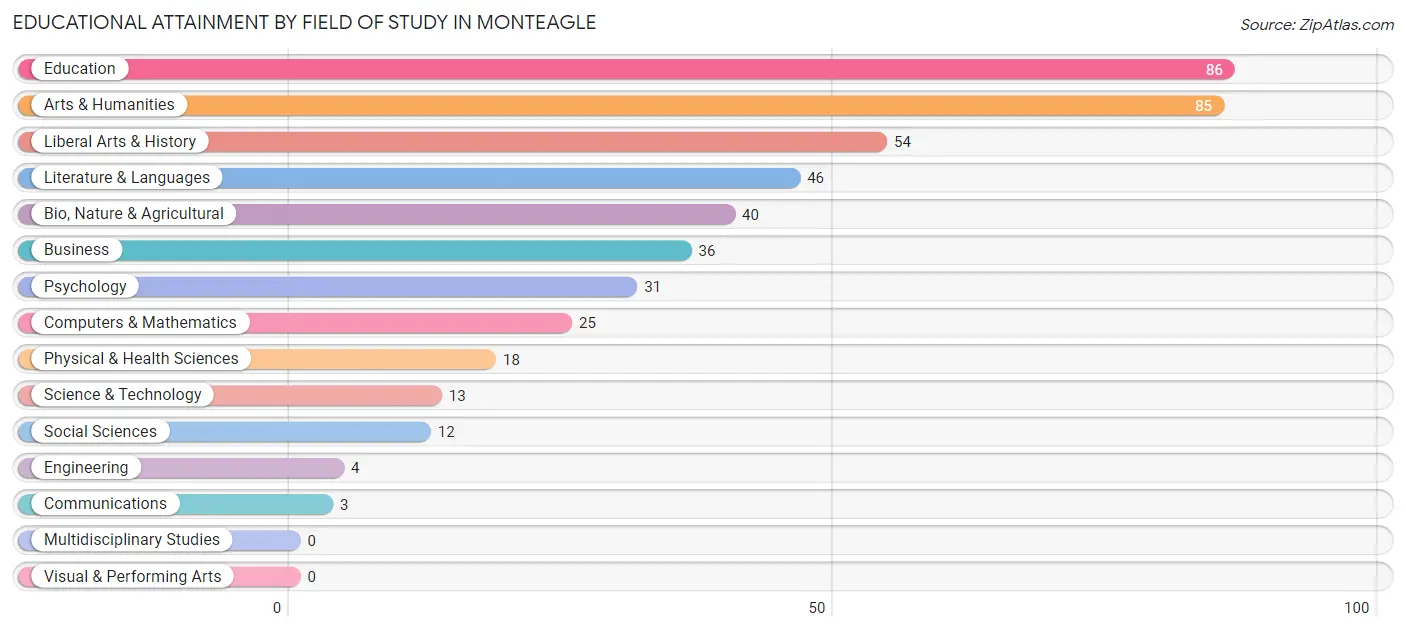
| Field of Study | # Graduates | % Graduates |
| Computers & Mathematics | 25 | 5.5% |
| Bio, Nature & Agricultural | 40 | 8.8% |
| Physical & Health Sciences | 18 | 4.0% |
| Psychology | 31 | 6.8% |
| Social Sciences | 12 | 2.6% |
| Engineering | 4 | 0.9% |
| Multidisciplinary Studies | 0 | 0.0% |
| Science & Technology | 13 | 2.9% |
| Business | 36 | 8.0% |
| Education | 86 | 19.0% |
| Literature & Languages | 46 | 10.2% |
| Liberal Arts & History | 54 | 11.9% |
| Visual & Performing Arts | 0 | 0.0% |
| Communications | 3 | 0.7% |
| Arts & Humanities | 85 | 18.8% |
| Total | 453 | 100.0% |
Transportation & Commute in Monteagle
Vehicle Availability by Sex in Monteagle
The most prevalent vehicle ownership categories in Monteagle are males with 2 vehicles (127, accounting for 39.7%) and females with 2 vehicles (71, making up 63.2%).
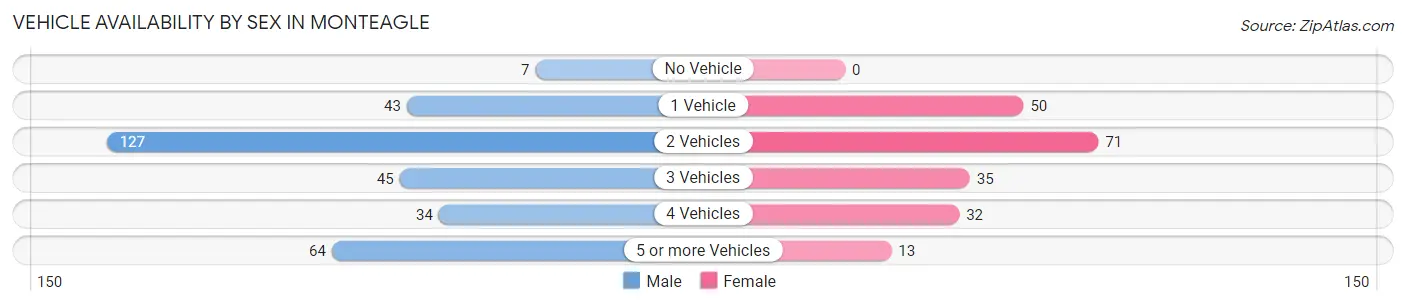
| Vehicles Available | Male | Female |
| No Vehicle | 7 (2.2%) | 0 (0.0%) |
| 1 Vehicle | 43 (13.4%) | 50 (24.9%) |
| 2 Vehicles | 127 (39.7%) | 71 (35.3%) |
| 3 Vehicles | 45 (14.1%) | 35 (17.4%) |
| 4 Vehicles | 34 (10.6%) | 32 (15.9%) |
| 5 or more Vehicles | 64 (20.0%) | 13 (6.5%) |
| Total | 320 (100.0%) | 201 (100.0%) |
Commute Time in Monteagle
The most frequently occuring commute durations in Monteagle are 5 to 9 minutes (161 commuters, 31.7%), 10 to 14 minutes (67 commuters, 13.2%), and 25 to 29 minutes (58 commuters, 11.4%).
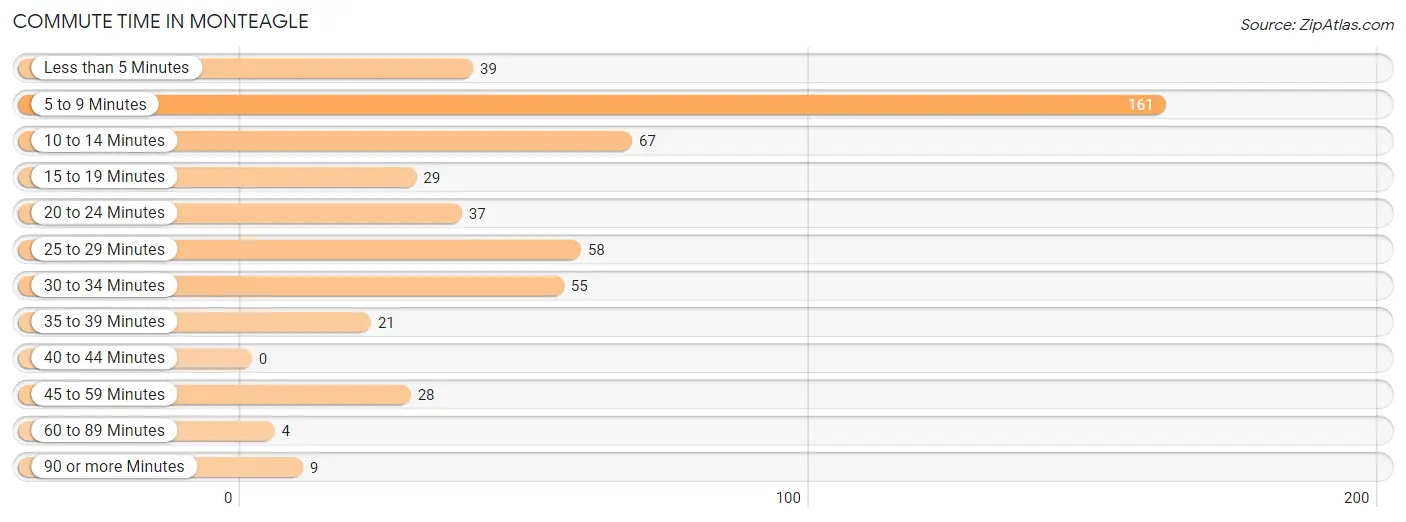
| Commute Time | # Commuters | % Commuters |
| Less than 5 Minutes | 39 | 7.7% |
| 5 to 9 Minutes | 161 | 31.7% |
| 10 to 14 Minutes | 67 | 13.2% |
| 15 to 19 Minutes | 29 | 5.7% |
| 20 to 24 Minutes | 37 | 7.3% |
| 25 to 29 Minutes | 58 | 11.4% |
| 30 to 34 Minutes | 55 | 10.8% |
| 35 to 39 Minutes | 21 | 4.1% |
| 40 to 44 Minutes | 0 | 0.0% |
| 45 to 59 Minutes | 28 | 5.5% |
| 60 to 89 Minutes | 4 | 0.8% |
| 90 or more Minutes | 9 | 1.8% |
Commute Time by Sex in Monteagle
The most common commute times in Monteagle are 5 to 9 minutes (118 commuters, 36.5%) for males and 5 to 9 minutes (43 commuters, 23.2%) for females.
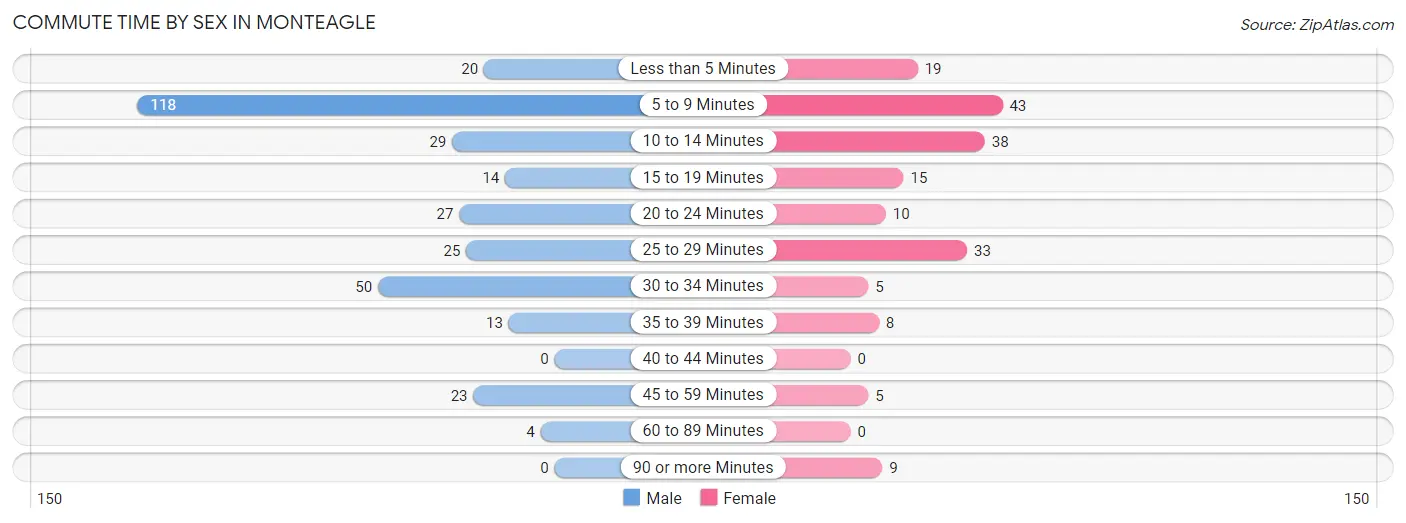
| Commute Time | Male | Female |
| Less than 5 Minutes | 20 (6.2%) | 19 (10.3%) |
| 5 to 9 Minutes | 118 (36.5%) | 43 (23.2%) |
| 10 to 14 Minutes | 29 (9.0%) | 38 (20.5%) |
| 15 to 19 Minutes | 14 (4.3%) | 15 (8.1%) |
| 20 to 24 Minutes | 27 (8.4%) | 10 (5.4%) |
| 25 to 29 Minutes | 25 (7.7%) | 33 (17.8%) |
| 30 to 34 Minutes | 50 (15.5%) | 5 (2.7%) |
| 35 to 39 Minutes | 13 (4.0%) | 8 (4.3%) |
| 40 to 44 Minutes | 0 (0.0%) | 0 (0.0%) |
| 45 to 59 Minutes | 23 (7.1%) | 5 (2.7%) |
| 60 to 89 Minutes | 4 (1.2%) | 0 (0.0%) |
| 90 or more Minutes | 0 (0.0%) | 9 (4.9%) |
Time of Departure to Work by Sex in Monteagle
The most frequent times of departure to work in Monteagle are 4:00 PM to 11:59 PM (53, 16.4%) for males and 7:30 AM to 7:59 AM (50, 27.0%) for females.
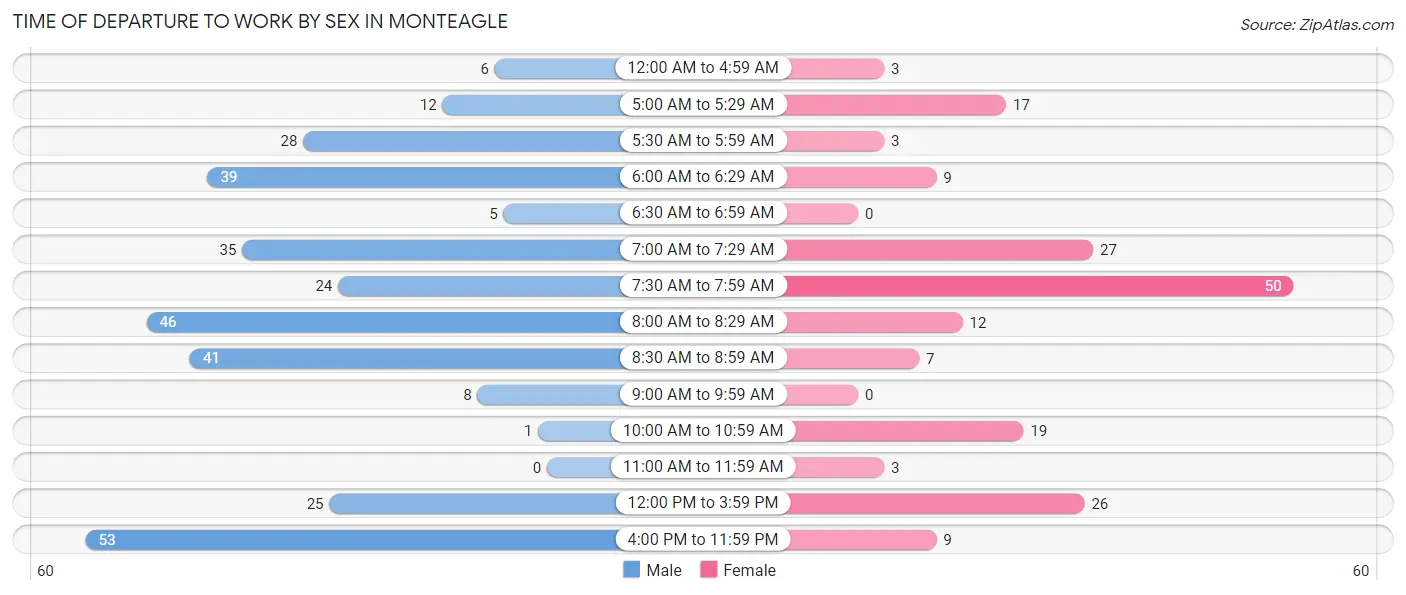
| Time of Departure | Male | Female |
| 12:00 AM to 4:59 AM | 6 (1.9%) | 3 (1.6%) |
| 5:00 AM to 5:29 AM | 12 (3.7%) | 17 (9.2%) |
| 5:30 AM to 5:59 AM | 28 (8.7%) | 3 (1.6%) |
| 6:00 AM to 6:29 AM | 39 (12.1%) | 9 (4.9%) |
| 6:30 AM to 6:59 AM | 5 (1.5%) | 0 (0.0%) |
| 7:00 AM to 7:29 AM | 35 (10.8%) | 27 (14.6%) |
| 7:30 AM to 7:59 AM | 24 (7.4%) | 50 (27.0%) |
| 8:00 AM to 8:29 AM | 46 (14.2%) | 12 (6.5%) |
| 8:30 AM to 8:59 AM | 41 (12.7%) | 7 (3.8%) |
| 9:00 AM to 9:59 AM | 8 (2.5%) | 0 (0.0%) |
| 10:00 AM to 10:59 AM | 1 (0.3%) | 19 (10.3%) |
| 11:00 AM to 11:59 AM | 0 (0.0%) | 3 (1.6%) |
| 12:00 PM to 3:59 PM | 25 (7.7%) | 26 (14.1%) |
| 4:00 PM to 11:59 PM | 53 (16.4%) | 9 (4.9%) |
| Total | 323 (100.0%) | 185 (100.0%) |
Housing Occupancy in Monteagle
Occupancy by Ownership in Monteagle
Of the total 690 dwellings in Monteagle, owner-occupied units account for 429 (62.2%), while renter-occupied units make up 261 (37.8%).
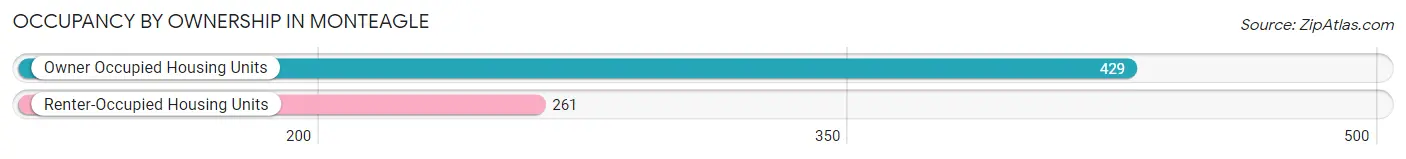
| Occupancy | # Housing Units | % Housing Units |
| Owner Occupied Housing Units | 429 | 62.2% |
| Renter-Occupied Housing Units | 261 | 37.8% |
| Total Occupied Housing Units | 690 | 100.0% |
Occupancy by Household Size in Monteagle
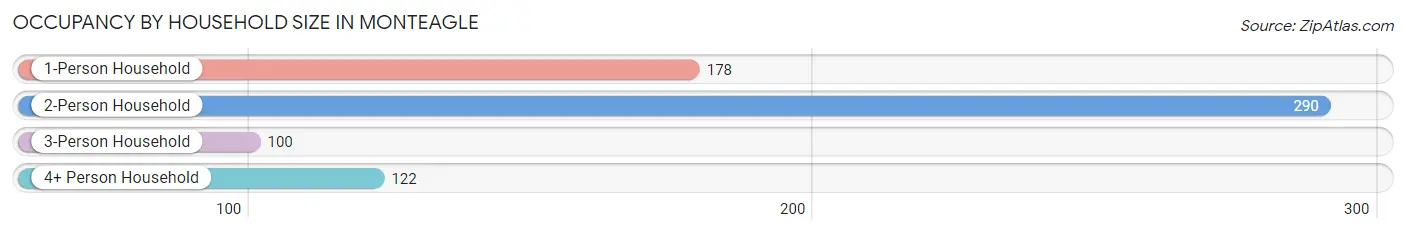
| Household Size | # Housing Units | % Housing Units |
| 1-Person Household | 178 | 25.8% |
| 2-Person Household | 290 | 42.0% |
| 3-Person Household | 100 | 14.5% |
| 4+ Person Household | 122 | 17.7% |
| Total Housing Units | 690 | 100.0% |
Occupancy by Ownership by Household Size in Monteagle
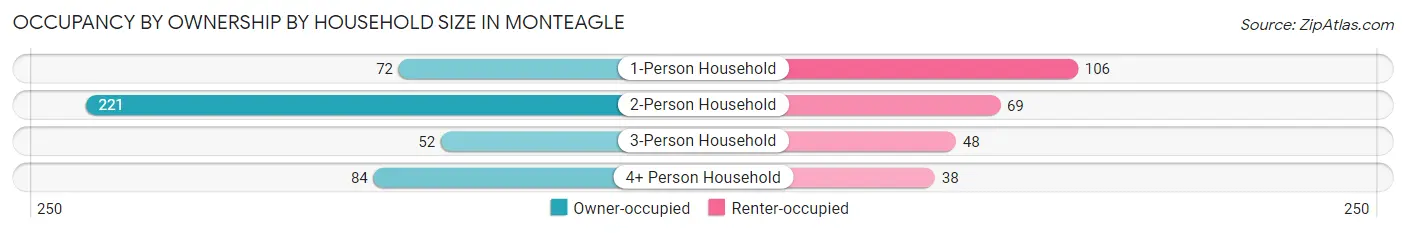
| Household Size | Owner-occupied | Renter-occupied |
| 1-Person Household | 72 (40.5%) | 106 (59.6%) |
| 2-Person Household | 221 (76.2%) | 69 (23.8%) |
| 3-Person Household | 52 (52.0%) | 48 (48.0%) |
| 4+ Person Household | 84 (68.9%) | 38 (31.1%) |
| Total Housing Units | 429 (62.2%) | 261 (37.8%) |
Occupancy by Educational Attainment in Monteagle
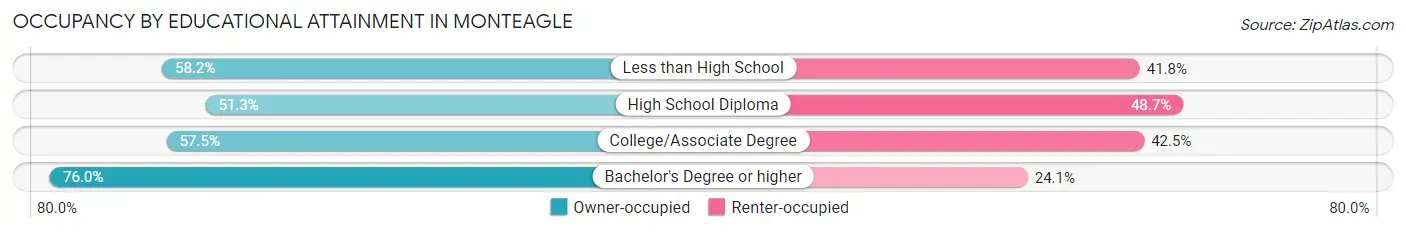
| Household Size | Owner-occupied | Renter-occupied |
| Less than High School | 32 (58.2%) | 23 (41.8%) |
| High School Diploma | 98 (51.3%) | 93 (48.7%) |
| College/Associate Degree | 119 (57.5%) | 88 (42.5%) |
| Bachelor's Degree or higher | 180 (75.9%) | 57 (24.0%) |
Occupancy by Age of Householder in Monteagle
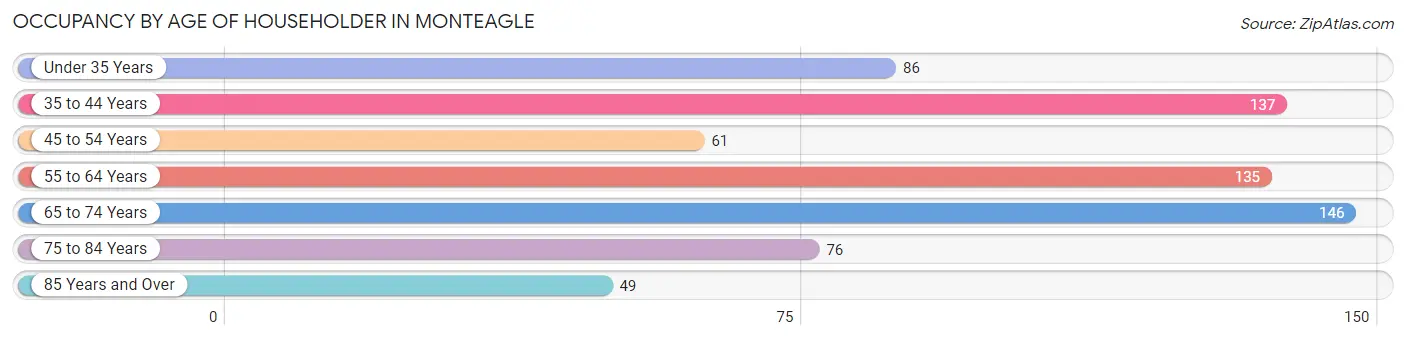
| Age Bracket | # Households | % Households |
| Under 35 Years | 86 | 12.5% |
| 35 to 44 Years | 137 | 19.9% |
| 45 to 54 Years | 61 | 8.8% |
| 55 to 64 Years | 135 | 19.6% |
| 65 to 74 Years | 146 | 21.2% |
| 75 to 84 Years | 76 | 11.0% |
| 85 Years and Over | 49 | 7.1% |
| Total | 690 | 100.0% |
Housing Finances in Monteagle
Median Income by Occupancy in Monteagle
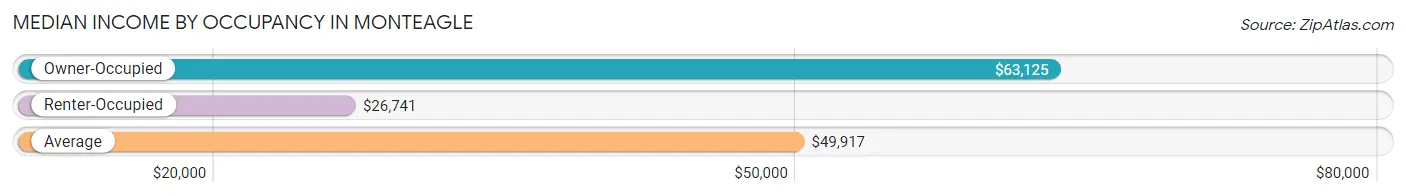
| Occupancy Type | # Households | Median Income |
| Owner-Occupied | 429 (62.2%) | $63,125 |
| Renter-Occupied | 261 (37.8%) | $26,741 |
| Average | 690 (100.0%) | $49,917 |
Occupancy by Householder Income Bracket in Monteagle
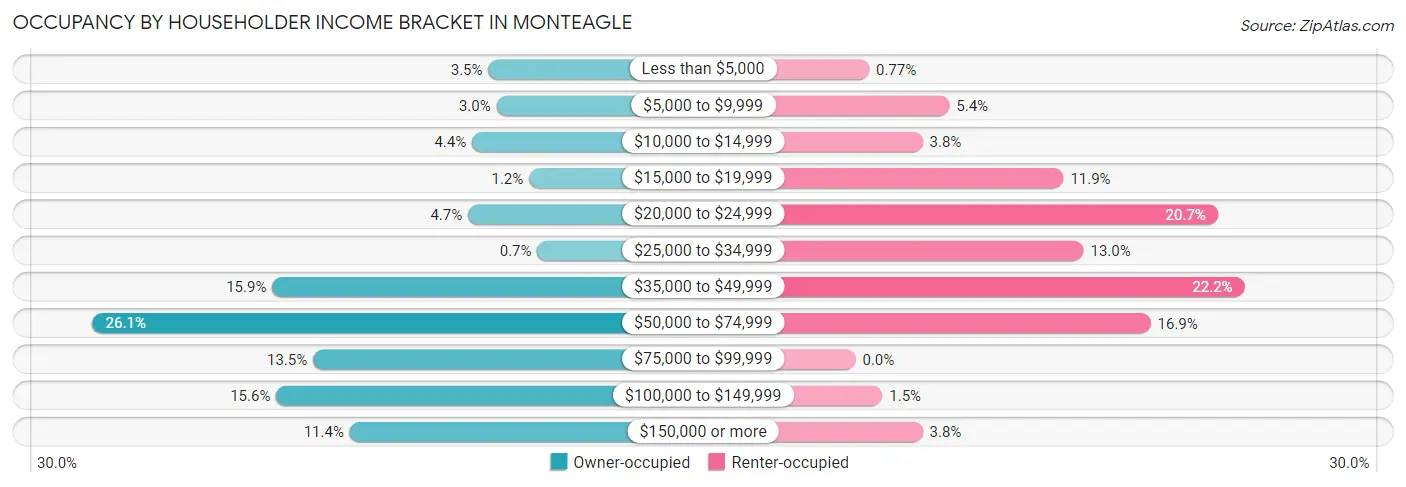
| Income Bracket | Owner-occupied | Renter-occupied |
| Less than $5,000 | 15 (3.5%) | 2 (0.8%) |
| $5,000 to $9,999 | 13 (3.0%) | 14 (5.4%) |
| $10,000 to $14,999 | 19 (4.4%) | 10 (3.8%) |
| $15,000 to $19,999 | 5 (1.2%) | 31 (11.9%) |
| $20,000 to $24,999 | 20 (4.7%) | 54 (20.7%) |
| $25,000 to $34,999 | 3 (0.7%) | 34 (13.0%) |
| $35,000 to $49,999 | 68 (15.9%) | 58 (22.2%) |
| $50,000 to $74,999 | 112 (26.1%) | 44 (16.9%) |
| $75,000 to $99,999 | 58 (13.5%) | 0 (0.0%) |
| $100,000 to $149,999 | 67 (15.6%) | 4 (1.5%) |
| $150,000 or more | 49 (11.4%) | 10 (3.8%) |
| Total | 429 (100.0%) | 261 (100.0%) |
Monthly Housing Cost Tiers in Monteagle
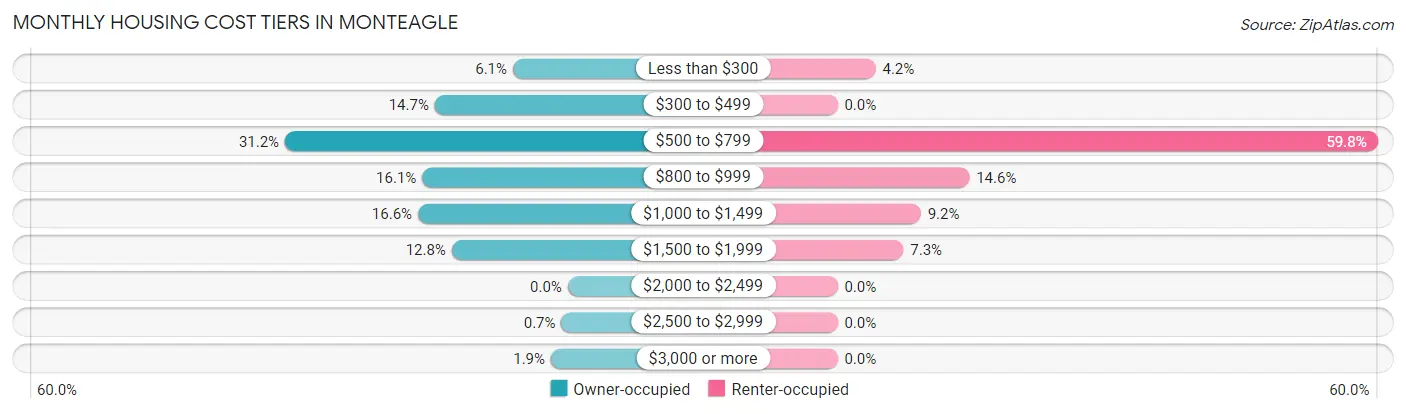
| Monthly Cost | Owner-occupied | Renter-occupied |
| Less than $300 | 26 (6.1%) | 11 (4.2%) |
| $300 to $499 | 63 (14.7%) | 0 (0.0%) |
| $500 to $799 | 134 (31.2%) | 156 (59.8%) |
| $800 to $999 | 69 (16.1%) | 38 (14.6%) |
| $1,000 to $1,499 | 71 (16.6%) | 24 (9.2%) |
| $1,500 to $1,999 | 55 (12.8%) | 19 (7.3%) |
| $2,000 to $2,499 | 0 (0.0%) | 0 (0.0%) |
| $2,500 to $2,999 | 3 (0.7%) | 0 (0.0%) |
| $3,000 or more | 8 (1.9%) | 0 (0.0%) |
| Total | 429 (100.0%) | 261 (100.0%) |
Physical Housing Characteristics in Monteagle
Housing Structures in Monteagle
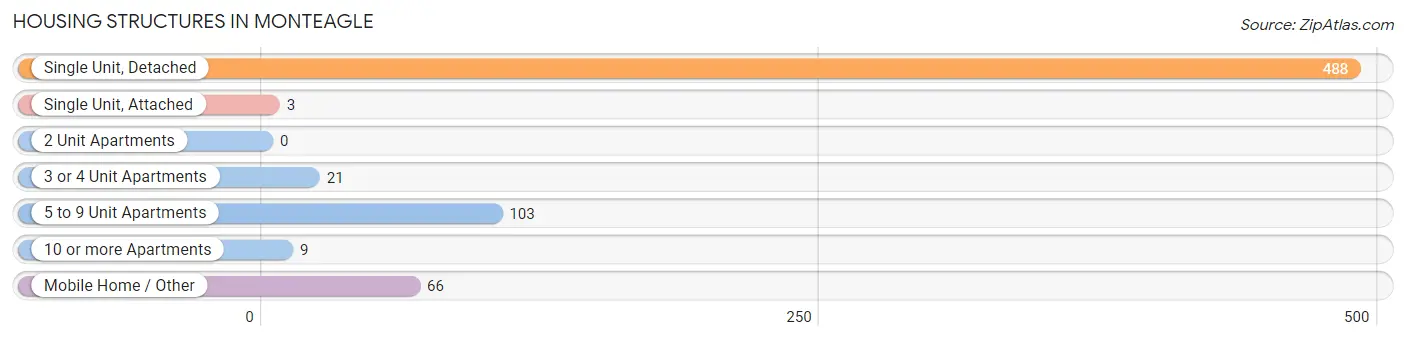
| Structure Type | # Housing Units | % Housing Units |
| Single Unit, Detached | 488 | 70.7% |
| Single Unit, Attached | 3 | 0.4% |
| 2 Unit Apartments | 0 | 0.0% |
| 3 or 4 Unit Apartments | 21 | 3.0% |
| 5 to 9 Unit Apartments | 103 | 14.9% |
| 10 or more Apartments | 9 | 1.3% |
| Mobile Home / Other | 66 | 9.6% |
| Total | 690 | 100.0% |
Housing Structures by Occupancy in Monteagle
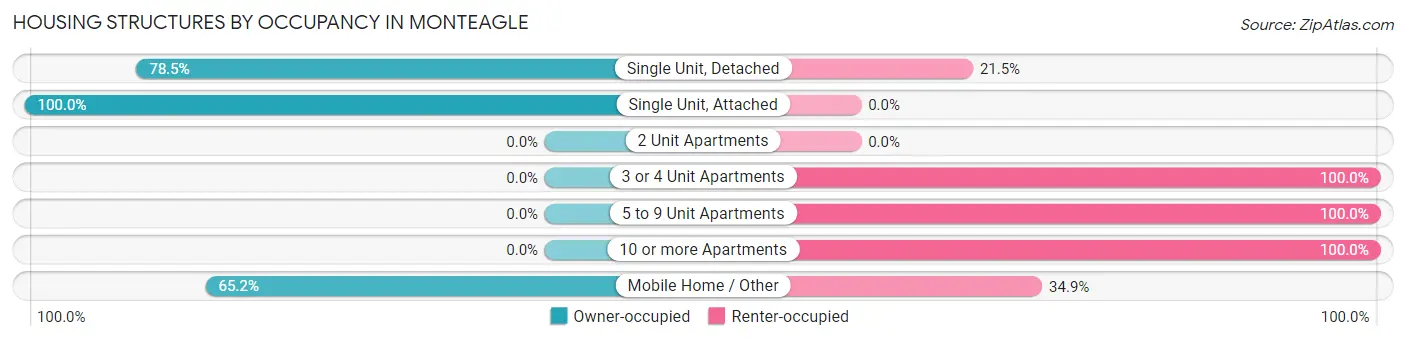
| Structure Type | Owner-occupied | Renter-occupied |
| Single Unit, Detached | 383 (78.5%) | 105 (21.5%) |
| Single Unit, Attached | 3 (100.0%) | 0 (0.0%) |
| 2 Unit Apartments | 0 (0.0%) | 0 (0.0%) |
| 3 or 4 Unit Apartments | 0 (0.0%) | 21 (100.0%) |
| 5 to 9 Unit Apartments | 0 (0.0%) | 103 (100.0%) |
| 10 or more Apartments | 0 (0.0%) | 9 (100.0%) |
| Mobile Home / Other | 43 (65.1%) | 23 (34.8%) |
| Total | 429 (62.2%) | 261 (37.8%) |
Housing Structures by Number of Rooms in Monteagle
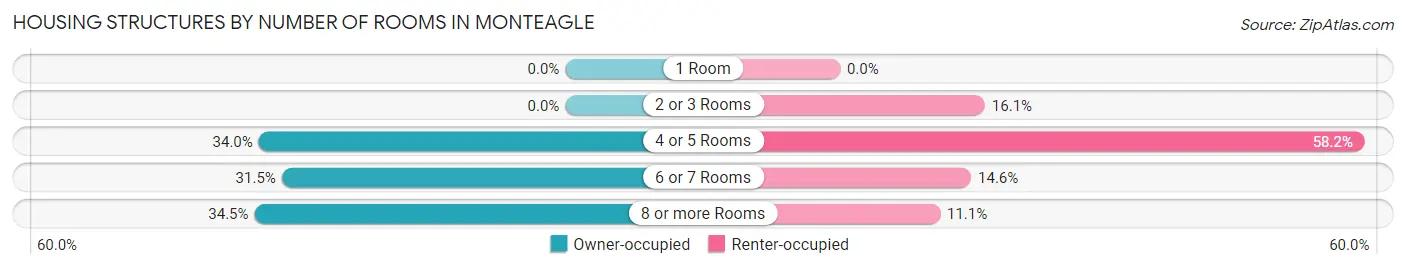
| Number of Rooms | Owner-occupied | Renter-occupied |
| 1 Room | 0 (0.0%) | 0 (0.0%) |
| 2 or 3 Rooms | 0 (0.0%) | 42 (16.1%) |
| 4 or 5 Rooms | 146 (34.0%) | 152 (58.2%) |
| 6 or 7 Rooms | 135 (31.5%) | 38 (14.6%) |
| 8 or more Rooms | 148 (34.5%) | 29 (11.1%) |
| Total | 429 (100.0%) | 261 (100.0%) |
Housing Structure by Heating Type in Monteagle
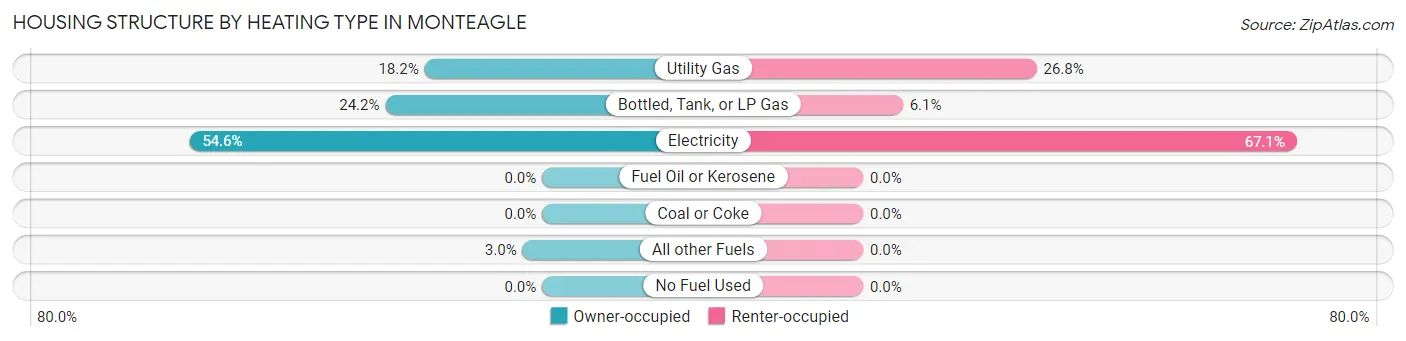
| Heating Type | Owner-occupied | Renter-occupied |
| Utility Gas | 78 (18.2%) | 70 (26.8%) |
| Bottled, Tank, or LP Gas | 104 (24.2%) | 16 (6.1%) |
| Electricity | 234 (54.5%) | 175 (67.0%) |
| Fuel Oil or Kerosene | 0 (0.0%) | 0 (0.0%) |
| Coal or Coke | 0 (0.0%) | 0 (0.0%) |
| All other Fuels | 13 (3.0%) | 0 (0.0%) |
| No Fuel Used | 0 (0.0%) | 0 (0.0%) |
| Total | 429 (100.0%) | 261 (100.0%) |
Household Vehicle Usage in Monteagle
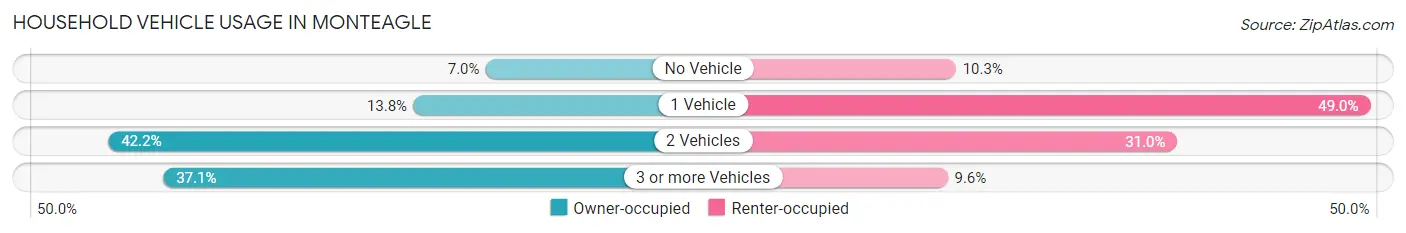
| Vehicles per Household | Owner-occupied | Renter-occupied |
| No Vehicle | 30 (7.0%) | 27 (10.3%) |
| 1 Vehicle | 59 (13.8%) | 128 (49.0%) |
| 2 Vehicles | 181 (42.2%) | 81 (31.0%) |
| 3 or more Vehicles | 159 (37.1%) | 25 (9.6%) |
| Total | 429 (100.0%) | 261 (100.0%) |
Real Estate & Mortgages in Monteagle
Real Estate and Mortgage Overview in Monteagle
| Characteristic | Without Mortgage | With Mortgage |
| Housing Units | 221 | 208 |
| Median Property Value | $320,100 | $235,500 |
| Median Household Income | $53,558 | $28 |
| Monthly Housing Costs | $560 | $8 |
| Real Estate Taxes | $914 | $5 |
Property Value by Mortgage Status in Monteagle
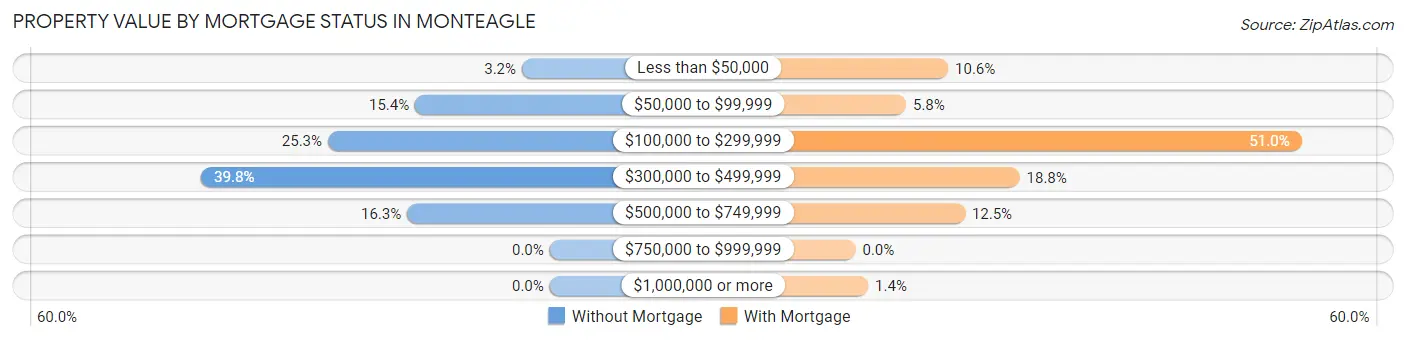
| Property Value | Without Mortgage | With Mortgage |
| Less than $50,000 | 7 (3.2%) | 22 (10.6%) |
| $50,000 to $99,999 | 34 (15.4%) | 12 (5.8%) |
| $100,000 to $299,999 | 56 (25.3%) | 106 (51.0%) |
| $300,000 to $499,999 | 88 (39.8%) | 39 (18.8%) |
| $500,000 to $749,999 | 36 (16.3%) | 26 (12.5%) |
| $750,000 to $999,999 | 0 (0.0%) | 0 (0.0%) |
| $1,000,000 or more | 0 (0.0%) | 3 (1.4%) |
| Total | 221 (100.0%) | 208 (100.0%) |
Household Income by Mortgage Status in Monteagle
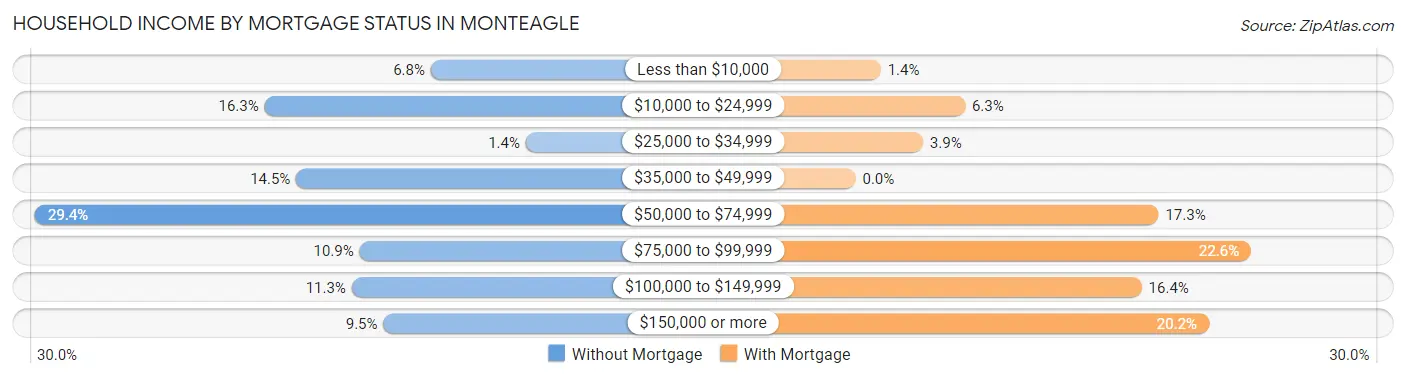
| Household Income | Without Mortgage | With Mortgage |
| Less than $10,000 | 15 (6.8%) | 3 (1.4%) |
| $10,000 to $24,999 | 36 (16.3%) | 13 (6.2%) |
| $25,000 to $34,999 | 3 (1.4%) | 8 (3.8%) |
| $35,000 to $49,999 | 32 (14.5%) | 0 (0.0%) |
| $50,000 to $74,999 | 65 (29.4%) | 36 (17.3%) |
| $75,000 to $99,999 | 24 (10.9%) | 47 (22.6%) |
| $100,000 to $149,999 | 25 (11.3%) | 34 (16.4%) |
| $150,000 or more | 21 (9.5%) | 42 (20.2%) |
| Total | 221 (100.0%) | 208 (100.0%) |
Property Value to Household Income Ratio in Monteagle
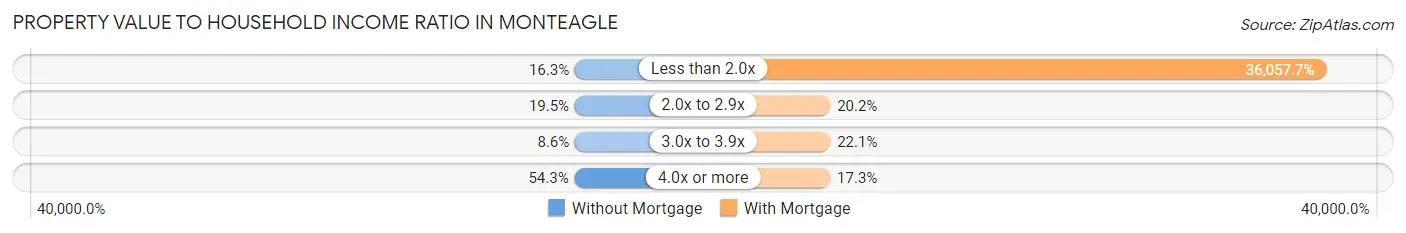
| Value-to-Income Ratio | Without Mortgage | With Mortgage |
| Less than 2.0x | 36 (16.3%) | 75,000 (36,057.7%) |
| 2.0x to 2.9x | 43 (19.5%) | 42 (20.2%) |
| 3.0x to 3.9x | 19 (8.6%) | 46 (22.1%) |
| 4.0x or more | 120 (54.3%) | 36 (17.3%) |
| Total | 221 (100.0%) | 208 (100.0%) |
Real Estate Taxes by Mortgage Status in Monteagle
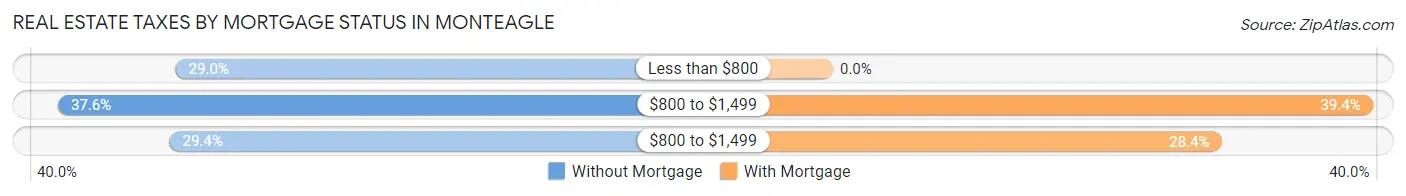
| Property Taxes | Without Mortgage | With Mortgage |
| Less than $800 | 64 (29.0%) | 0 (0.0%) |
| $800 to $1,499 | 83 (37.6%) | 82 (39.4%) |
| $800 to $1,499 | 65 (29.4%) | 59 (28.4%) |
| Total | 221 (100.0%) | 208 (100.0%) |
Health & Disability in Monteagle
Health Insurance Coverage by Age in Monteagle
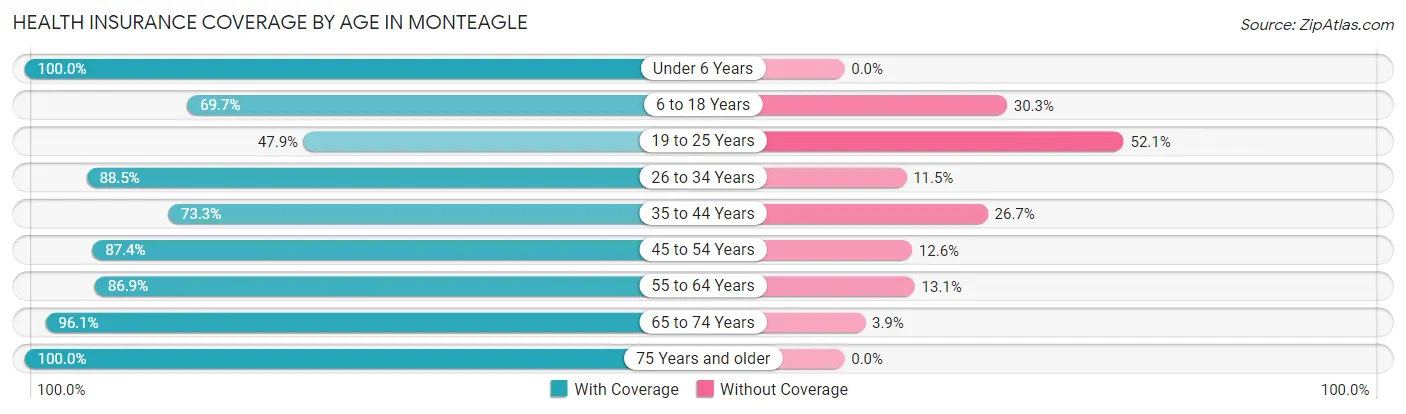
| Age Bracket | With Coverage | Without Coverage |
| Under 6 Years | 90 (100.0%) | 0 (0.0%) |
| 6 to 18 Years | 269 (69.7%) | 117 (30.3%) |
| 19 to 25 Years | 23 (47.9%) | 25 (52.1%) |
| 26 to 34 Years | 138 (88.5%) | 18 (11.5%) |
| 35 to 44 Years | 255 (73.3%) | 93 (26.7%) |
| 45 to 54 Years | 104 (87.4%) | 15 (12.6%) |
| 55 to 64 Years | 179 (86.9%) | 27 (13.1%) |
| 65 to 74 Years | 273 (96.1%) | 11 (3.9%) |
| 75 Years and older | 161 (100.0%) | 0 (0.0%) |
| Total | 1,492 (83.0%) | 306 (17.0%) |
Health Insurance Coverage by Citizenship Status in Monteagle
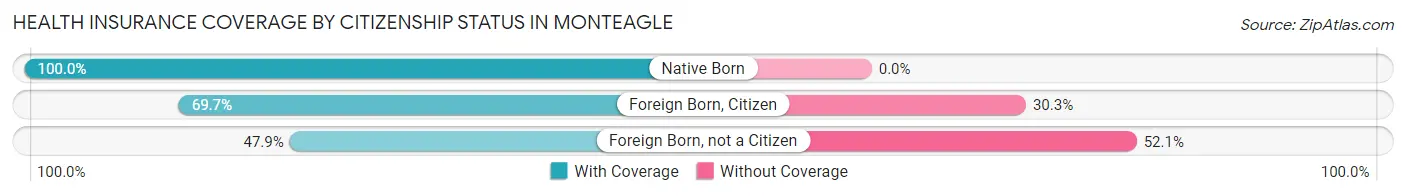
| Citizenship Status | With Coverage | Without Coverage |
| Native Born | 90 (100.0%) | 0 (0.0%) |
| Foreign Born, Citizen | 269 (69.7%) | 117 (30.3%) |
| Foreign Born, not a Citizen | 23 (47.9%) | 25 (52.1%) |
Health Insurance Coverage by Household Income in Monteagle
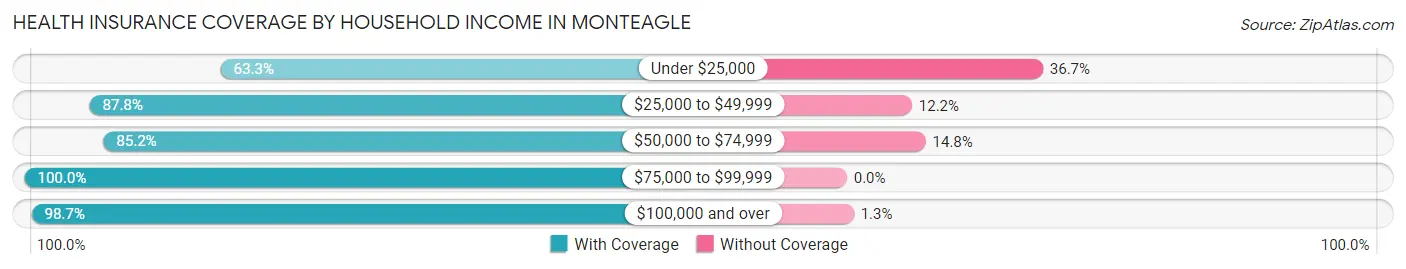
| Household Income | With Coverage | Without Coverage |
| Under $25,000 | 267 (63.3%) | 155 (36.7%) |
| $25,000 to $49,999 | 389 (87.8%) | 54 (12.2%) |
| $50,000 to $74,999 | 352 (85.2%) | 61 (14.8%) |
| $75,000 to $99,999 | 154 (100.0%) | 0 (0.0%) |
| $100,000 and over | 304 (98.7%) | 4 (1.3%) |
Public vs Private Health Insurance Coverage by Age in Monteagle
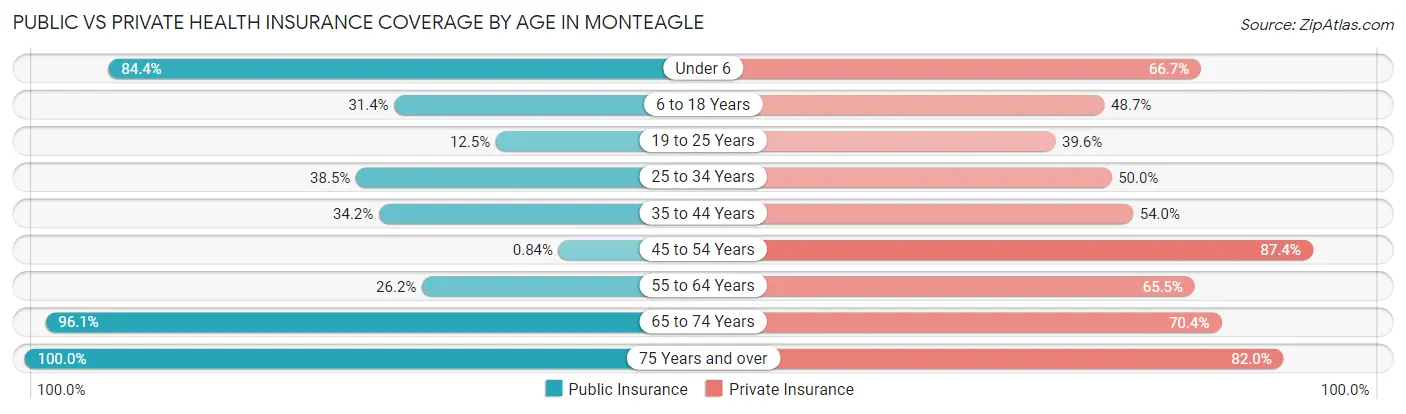
| Age Bracket | Public Insurance | Private Insurance |
| Under 6 | 76 (84.4%) | 60 (66.7%) |
| 6 to 18 Years | 121 (31.4%) | 188 (48.7%) |
| 19 to 25 Years | 6 (12.5%) | 19 (39.6%) |
| 25 to 34 Years | 60 (38.5%) | 78 (50.0%) |
| 35 to 44 Years | 119 (34.2%) | 188 (54.0%) |
| 45 to 54 Years | 1 (0.8%) | 104 (87.4%) |
| 55 to 64 Years | 54 (26.2%) | 135 (65.5%) |
| 65 to 74 Years | 273 (96.1%) | 200 (70.4%) |
| 75 Years and over | 161 (100.0%) | 132 (82.0%) |
| Total | 871 (48.4%) | 1,104 (61.4%) |
Disability Status by Sex by Age in Monteagle
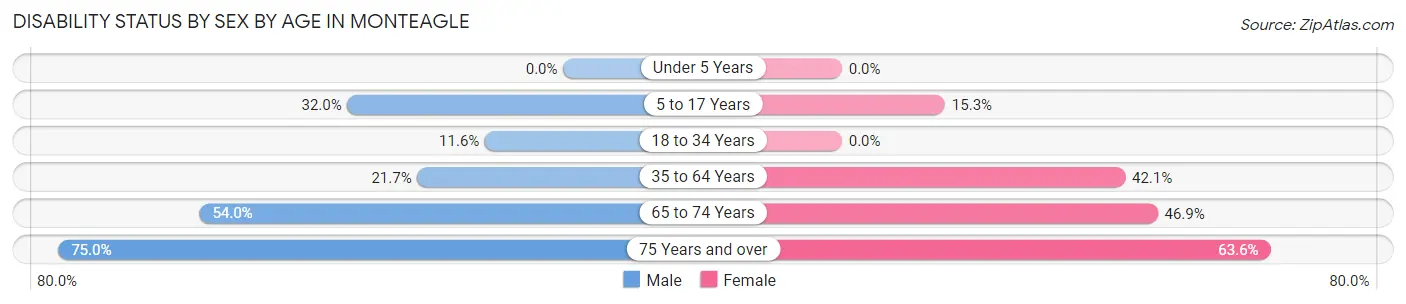
| Age Bracket | Male | Female |
| Under 5 Years | 0 (0.0%) | 0 (0.0%) |
| 5 to 17 Years | 66 (32.0%) | 32 (15.3%) |
| 18 to 34 Years | 18 (11.6%) | 0 (0.0%) |
| 35 to 64 Years | 68 (21.7%) | 151 (42.1%) |
| 65 to 74 Years | 67 (54.0%) | 75 (46.9%) |
| 75 Years and over | 63 (75.0%) | 49 (63.6%) |
Disability Class by Sex by Age in Monteagle
Disability Class: Hearing Difficulty
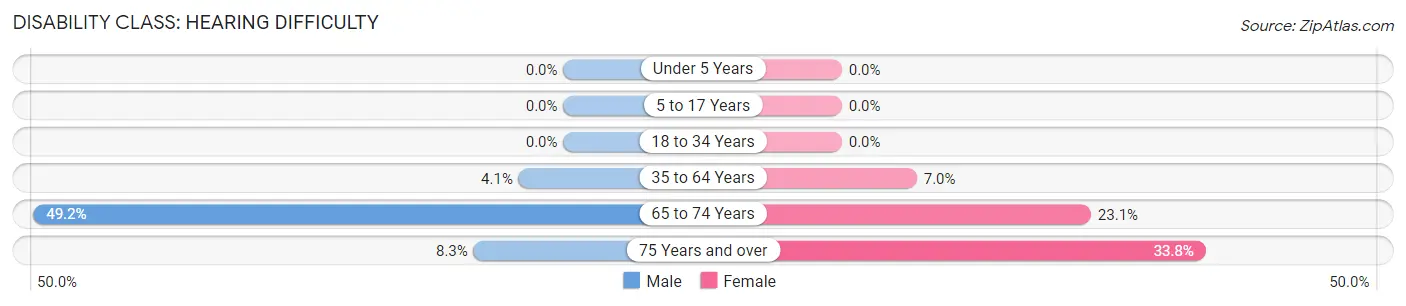
| Age Bracket | Male | Female |
| Under 5 Years | 0 (0.0%) | 0 (0.0%) |
| 5 to 17 Years | 0 (0.0%) | 0 (0.0%) |
| 18 to 34 Years | 0 (0.0%) | 0 (0.0%) |
| 35 to 64 Years | 13 (4.1%) | 25 (7.0%) |
| 65 to 74 Years | 61 (49.2%) | 37 (23.1%) |
| 75 Years and over | 7 (8.3%) | 26 (33.8%) |
Disability Class: Vision Difficulty
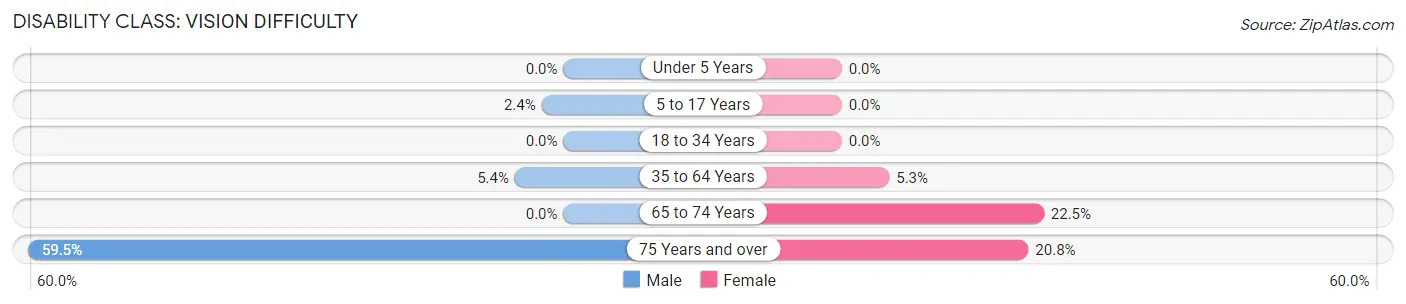
| Age Bracket | Male | Female |
| Under 5 Years | 0 (0.0%) | 0 (0.0%) |
| 5 to 17 Years | 5 (2.4%) | 0 (0.0%) |
| 18 to 34 Years | 0 (0.0%) | 0 (0.0%) |
| 35 to 64 Years | 17 (5.4%) | 19 (5.3%) |
| 65 to 74 Years | 0 (0.0%) | 36 (22.5%) |
| 75 Years and over | 50 (59.5%) | 16 (20.8%) |
Disability Class: Cognitive Difficulty
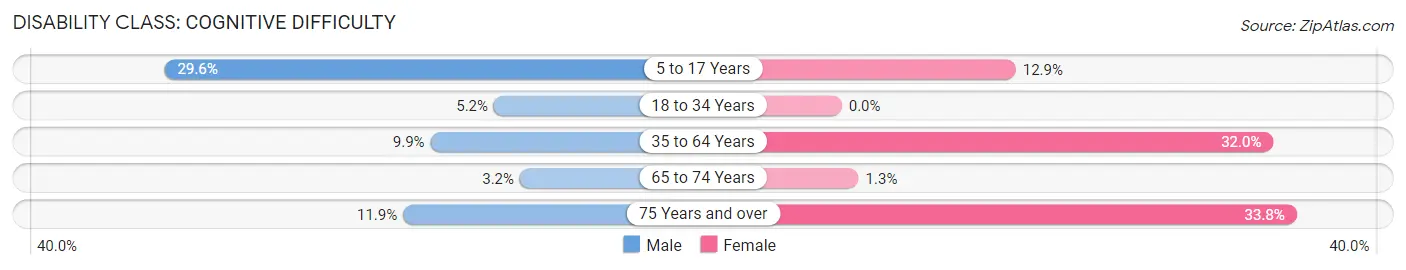
| Age Bracket | Male | Female |
| 5 to 17 Years | 61 (29.6%) | 27 (12.9%) |
| 18 to 34 Years | 8 (5.2%) | 0 (0.0%) |
| 35 to 64 Years | 31 (9.9%) | 115 (32.0%) |
| 65 to 74 Years | 4 (3.2%) | 2 (1.3%) |
| 75 Years and over | 10 (11.9%) | 26 (33.8%) |
Disability Class: Ambulatory Difficulty
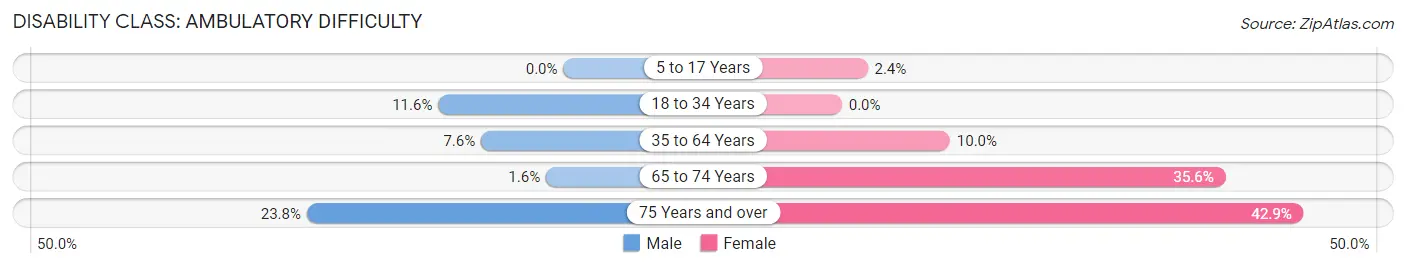
| Age Bracket | Male | Female |
| 5 to 17 Years | 0 (0.0%) | 5 (2.4%) |
| 18 to 34 Years | 18 (11.6%) | 0 (0.0%) |
| 35 to 64 Years | 24 (7.6%) | 36 (10.0%) |
| 65 to 74 Years | 2 (1.6%) | 57 (35.6%) |
| 75 Years and over | 20 (23.8%) | 33 (42.9%) |
Disability Class: Self-Care Difficulty
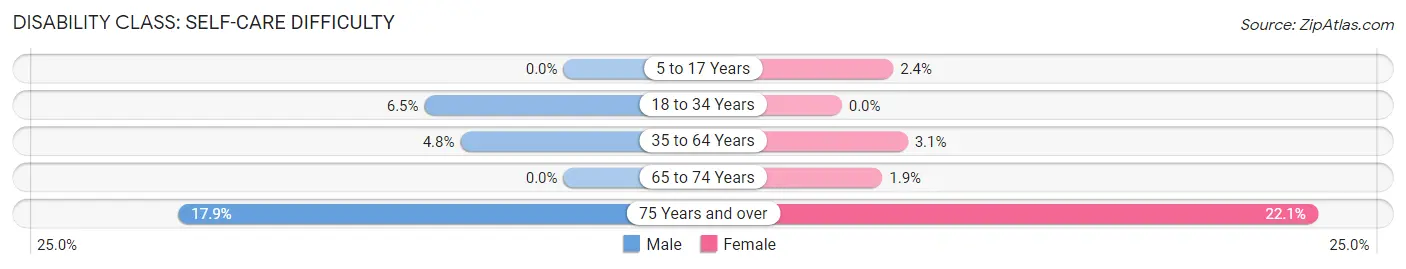
| Age Bracket | Male | Female |
| 5 to 17 Years | 0 (0.0%) | 5 (2.4%) |
| 18 to 34 Years | 10 (6.5%) | 0 (0.0%) |
| 35 to 64 Years | 15 (4.8%) | 11 (3.1%) |
| 65 to 74 Years | 0 (0.0%) | 3 (1.9%) |
| 75 Years and over | 15 (17.9%) | 17 (22.1%) |
Technology Access in Monteagle
Computing Device Access in Monteagle
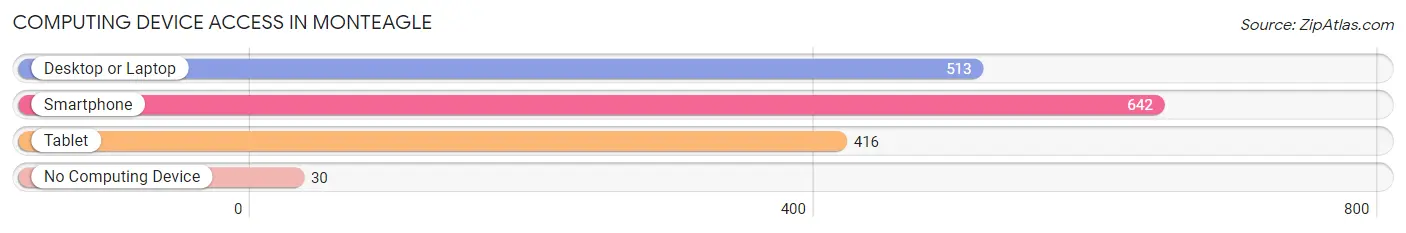
| Device Type | # Households | % Households |
| Desktop or Laptop | 513 | 74.4% |
| Smartphone | 642 | 93.0% |
| Tablet | 416 | 60.3% |
| No Computing Device | 30 | 4.3% |
| Total | 690 | 100.0% |
Internet Access in Monteagle
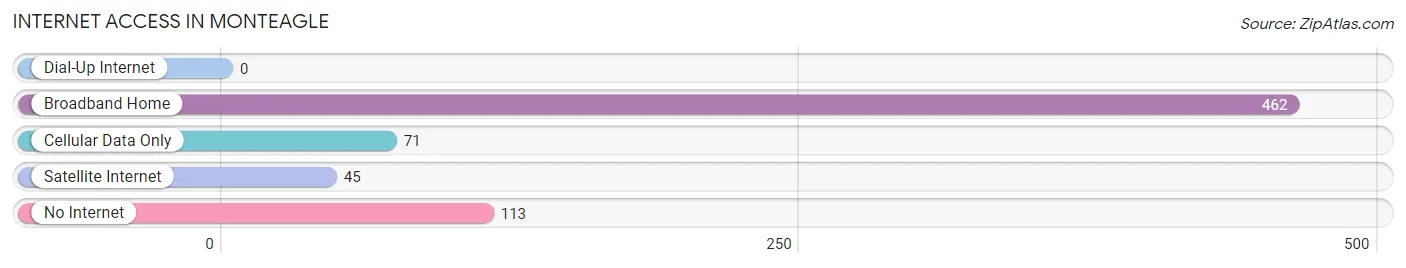
| Internet Type | # Households | % Households |
| Dial-Up Internet | 0 | 0.0% |
| Broadband Home | 462 | 67.0% |
| Cellular Data Only | 71 | 10.3% |
| Satellite Internet | 45 | 6.5% |
| No Internet | 113 | 16.4% |
| Total | 690 | 100.0% |
Monteagle Summary
Monteagle is a small town located in the Cumberland Plateau region of Tennessee. It is situated in Marion County, and is part of the Chattanooga metropolitan area. The town has a population of approximately 1,500 people, and is known for its scenic beauty and outdoor recreation opportunities.
History
Monteagle was founded in 1848 by a group of settlers from North Carolina. The town was named after a mountain in Scotland, and was originally known as Monteagle Mountain. The town was incorporated in 1851, and was the first town in Marion County to be incorporated.
The town was an important stop on the Nashville and Chattanooga Railroad, which was completed in 1854. This railroad was a major factor in the growth of Monteagle, as it allowed for the transportation of goods and people to and from the town.
The town was also home to a number of educational institutions, including the Monteagle Institute, which was founded in 1856. The institute was a private school for girls, and was one of the first schools of its kind in the state.
Geography
Monteagle is located in the Cumberland Plateau region of Tennessee. The town is situated in Marion County, and is part of the Chattanooga metropolitan area. The town is located at the base of Monteagle Mountain, which is part of the Cumberland Plateau. The town is surrounded by the Cherokee National Forest, and is home to a number of outdoor recreation opportunities.
The town is located at an elevation of 1,400 feet, and has a humid subtropical climate. The average annual temperature is around 60 degrees Fahrenheit, and the average annual precipitation is around 45 inches.
Economy
Monteagle is a small town, and the economy is largely based on tourism. The town is home to a number of outdoor recreation opportunities, including hiking, camping, fishing, and hunting. The town is also home to a number of bed and breakfasts, as well as a number of restaurants and shops.
The town is also home to a number of manufacturing companies, including a furniture factory and a textile mill. The town is also home to a number of small businesses, including a number of antique stores and art galleries.
Demographics
As of the 2010 census, the population of Monteagle was 1,500 people. The racial makeup of the town was 95.3% White, 1.7% African American, 0.3% Native American, 0.7% Asian, 0.3% from other races, and 1.7% from two or more races. The median household income was $35,000, and the median family income was $41,000.
Conclusion
Monteagle is a small town located in the Cumberland Plateau region of Tennessee. The town has a population of approximately 1,500 people, and is known for its scenic beauty and outdoor recreation opportunities. The town is home to a number of manufacturing companies, as well as a number of small businesses. The town is also home to a number of bed and breakfasts, as well as a number of restaurants and shops. The town has a humid subtropical climate, and the average annual temperature is around 60 degrees Fahrenheit.
Common Questions
What is Per Capita Income in Monteagle?
Per Capita income in Monteagle is $24,434.
What is the Median Family Income in Monteagle?
Median Family Income in Monteagle is $54,459.
What is the Median Household income in Monteagle?
Median Household Income in Monteagle is $49,917.
What is Income or Wage Gap in Monteagle?
Income or Wage Gap in Monteagle is 55.5%.
Women in Monteagle earn 44.5 cents for every dollar earned by a man.
What is Inequality or Gini Index in Monteagle?
Inequality or Gini Index in Monteagle is 0.43.
What is the Total Population of Monteagle?
Total Population of Monteagle is 1,915.
What is the Total Male Population of Monteagle?
Total Male Population of Monteagle is 931.
What is the Total Female Population of Monteagle?
Total Female Population of Monteagle is 984.
What is the Ratio of Males per 100 Females in Monteagle?
There are 94.61 Males per 100 Females in Monteagle.
What is the Ratio of Females per 100 Males in Monteagle?
There are 105.69 Females per 100 Males in Monteagle.
What is the Median Population Age in Monteagle?
Median Population Age in Monteagle is 42.5 Years.
What is the Average Family Size in Monteagle
Average Family Size in Monteagle is 3.0 People.
What is the Average Household Size in Monteagle
Average Household Size in Monteagle is 2.5 People.
How Large is the Labor Force in Monteagle?
There are 647 People in the Labor Forcein in Monteagle.
What is the Percentage of People in the Labor Force in Monteagle?
42.1% of People are in the Labor Force in Monteagle.
What is the Unemployment Rate in Monteagle?
Unemployment Rate in Monteagle is 13.3%.