Minor Hill, TN Map & Demographics
Minor Hill Map
Minor Hill Overview
$24,219
PER CAPITA INCOME
$44,500
AVG FAMILY INCOME
$42,371
AVG HOUSEHOLD INCOME
0.49
INEQUALITY / GINI INDEX
707
TOTAL POPULATION
333
MALE POPULATION
374
FEMALE POPULATION
89.04
MALES / 100 FEMALES
112.31
FEMALES / 100 MALES
27.4
MEDIAN AGE
4.0
AVG FAMILY SIZE
3.1
AVG HOUSEHOLD SIZE
309
LABOR FORCE [ PEOPLE ]
67.9%
PERCENT IN LABOR FORCE
3.6%
UNEMPLOYMENT RATE
Minor Hill Zip Codes
Minor Hill Area Codes
Income in Minor Hill
Income Overview in Minor Hill
Per Capita Income in Minor Hill is $24,219, while median incomes of families and households are $44,500 and $42,371 respectively.
| Characteristic | Number | Measure |
| Per Capita Income | 707 | $24,219 |
| Median Family Income | 150 | $44,500 |
| Mean Family Income | 150 | $81,391 |
| Median Household Income | 225 | $42,371 |
| Mean Household Income | 225 | $68,832 |
| Income Deficit | 150 | $0 |
| Wage / Income Gap (%) | 707 | 0.00% |
| Wage / Income Gap ($) | 707 | 100.00¢ per $1 |
| Gini / Inequality Index | 707 | 0.49 |
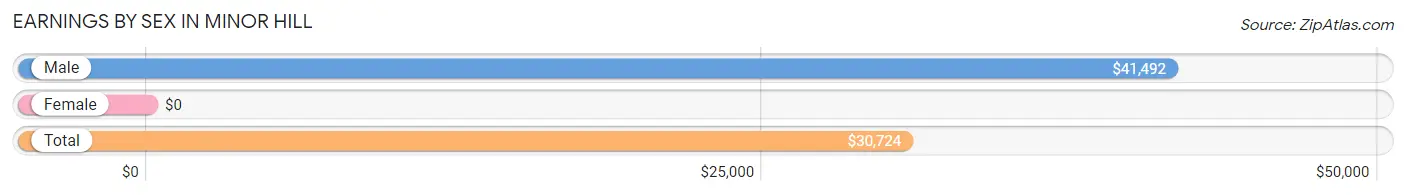
Earnings by Sex in Minor Hill
| Sex | Number | Average Earnings |
| Male | 173 (48.7%) | $41,492 |
| Female | 182 (51.3%) | $0 |
| Total | 355 (100.0%) | $30,724 |
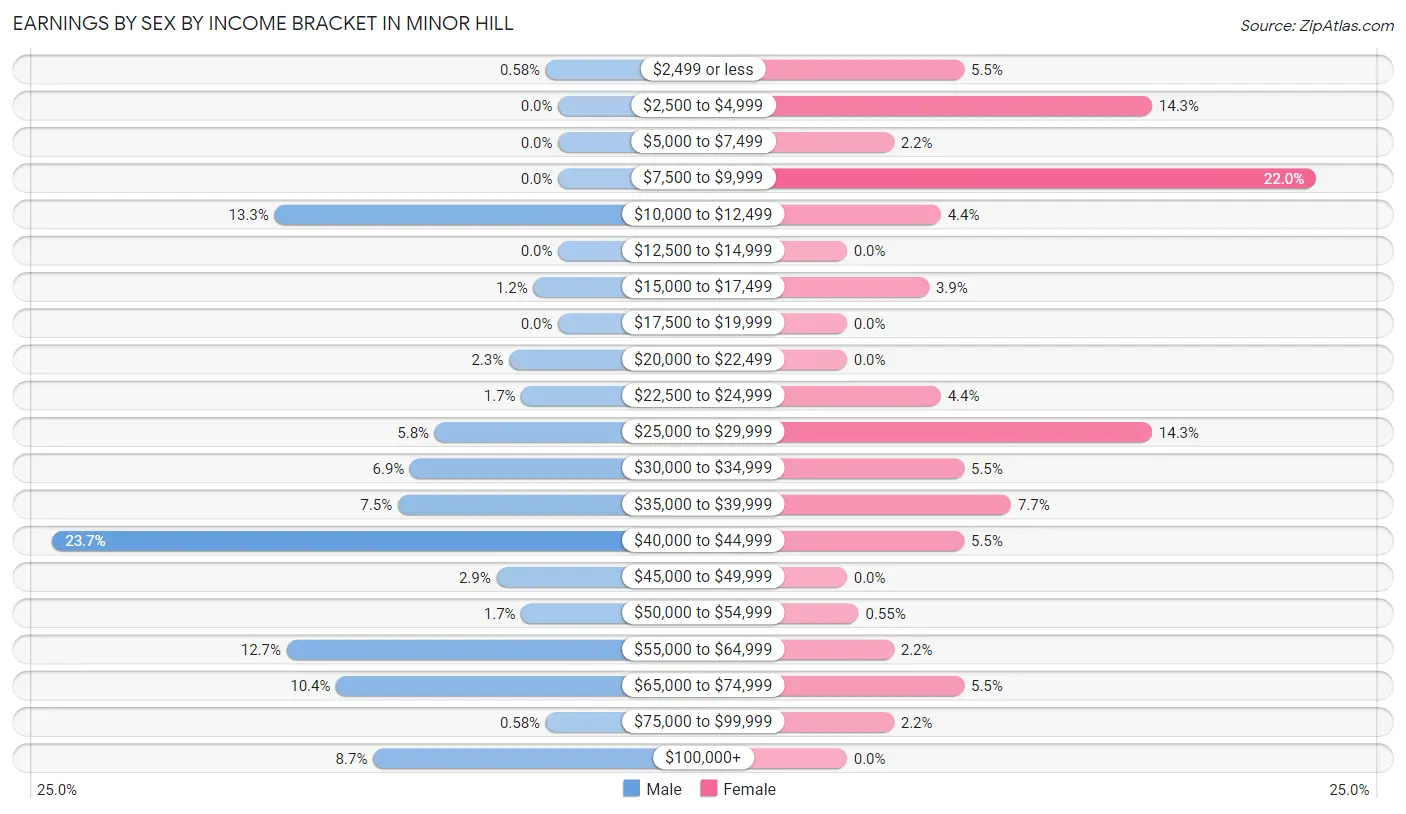
Earnings by Sex by Income Bracket in Minor Hill
The most common earnings brackets in Minor Hill are $40,000 to $44,999 for men (41 | 23.7%) and $7,500 to $9,999 for women (40 | 22.0%).
| Income | Male | Female |
| $2,499 or less | 1 (0.6%) | 10 (5.5%) |
| $2,500 to $4,999 | 0 (0.0%) | 26 (14.3%) |
| $5,000 to $7,499 | 0 (0.0%) | 4 (2.2%) |
| $7,500 to $9,999 | 0 (0.0%) | 40 (22.0%) |
| $10,000 to $12,499 | 23 (13.3%) | 8 (4.4%) |
| $12,500 to $14,999 | 0 (0.0%) | 0 (0.0%) |
| $15,000 to $17,499 | 2 (1.2%) | 7 (3.8%) |
| $17,500 to $19,999 | 0 (0.0%) | 0 (0.0%) |
| $20,000 to $22,499 | 4 (2.3%) | 0 (0.0%) |
| $22,500 to $24,999 | 3 (1.7%) | 8 (4.4%) |
| $25,000 to $29,999 | 10 (5.8%) | 26 (14.3%) |
| $30,000 to $34,999 | 12 (6.9%) | 10 (5.5%) |
| $35,000 to $39,999 | 13 (7.5%) | 14 (7.7%) |
| $40,000 to $44,999 | 41 (23.7%) | 10 (5.5%) |
| $45,000 to $49,999 | 5 (2.9%) | 0 (0.0%) |
| $50,000 to $54,999 | 3 (1.7%) | 1 (0.5%) |
| $55,000 to $64,999 | 22 (12.7%) | 4 (2.2%) |
| $65,000 to $74,999 | 18 (10.4%) | 10 (5.5%) |
| $75,000 to $99,999 | 1 (0.6%) | 4 (2.2%) |
| $100,000+ | 15 (8.7%) | 0 (0.0%) |
| Total | 173 (100.0%) | 182 (100.0%) |
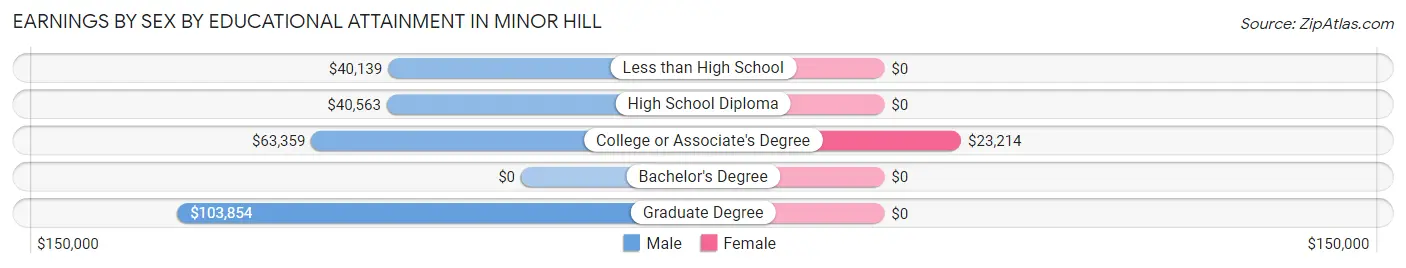
Earnings by Sex by Educational Attainment in Minor Hill
Average earnings in Minor Hill are $42,218 for men and $23,594 for women, a difference of 44.1%. Men with an educational attainment of graduate degree enjoy the highest average annual earnings of $103,854, while those with less than high school education earn the least with $40,139. Women with an educational attainment of college or associate's degree earn the most with the average annual earnings of $23,214, while those with college or associate's degree education have the smallest earnings of $23,214.
| Educational Attainment | Male Income | Female Income |
| Less than High School | $40,139 | $0 |
| High School Diploma | $40,563 | $0 |
| College or Associate's Degree | $63,359 | $23,214 |
| Bachelor's Degree | - | - |
| Graduate Degree | $103,854 | $0 |
| Total | $42,218 | $23,594 |
Family Income in Minor Hill
Family Income Brackets in Minor Hill
According to the Minor Hill family income data, there are 52 families falling into the $35,000 to $49,999 income range, which is the most common income bracket and makes up 34.7% of all families. Conversely, the $100,000 to $149,999 income bracket is the least frequent group with only 4 families (2.7%) belonging to this category.
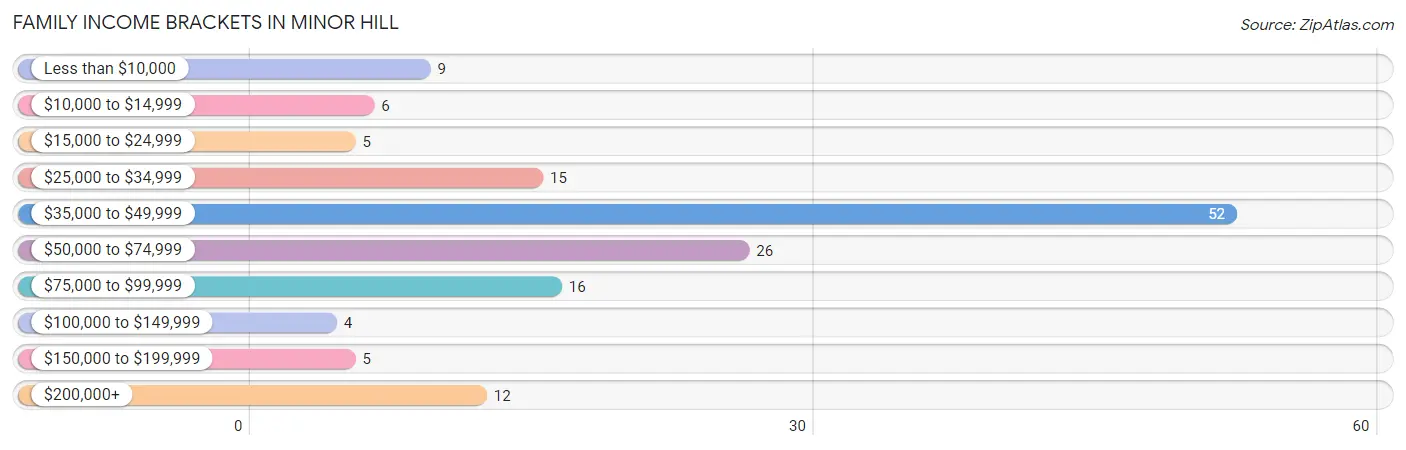
| Income Bracket | # Families | % Families |
| Less than $10,000 | 9 | 6.0% |
| $10,000 to $14,999 | 6 | 4.0% |
| $15,000 to $24,999 | 5 | 3.3% |
| $25,000 to $34,999 | 15 | 10.0% |
| $35,000 to $49,999 | 52 | 34.7% |
| $50,000 to $74,999 | 26 | 17.3% |
| $75,000 to $99,999 | 16 | 10.7% |
| $100,000 to $149,999 | 4 | 2.7% |
| $150,000 to $199,999 | 5 | 3.3% |
| $200,000+ | 12 | 8.0% |
Family Income by Famaliy Size in Minor Hill
4-person families (56 | 37.3%) account for the highest median family income in Minor Hill with $44,250 per family, while 4-person families (56 | 37.3%) have the highest median income of $11,062 per family member.
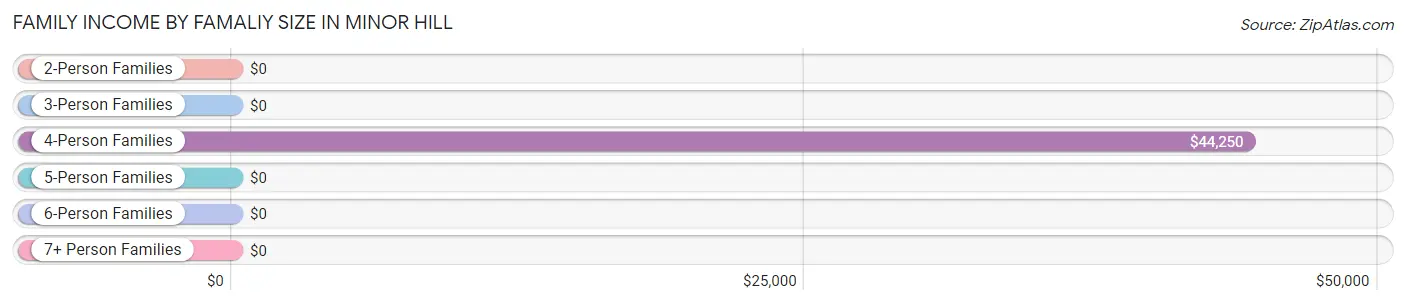
| Income Bracket | # Families | Median Income |
| 2-Person Families | 26 (17.3%) | $0 |
| 3-Person Families | 33 (22.0%) | $0 |
| 4-Person Families | 56 (37.3%) | $44,250 |
| 5-Person Families | 35 (23.3%) | $0 |
| 6-Person Families | 0 (0.0%) | $0 |
| 7+ Person Families | 0 (0.0%) | $0 |
| Total | 150 (100.0%) | $44,500 |
Family Income by Number of Earners in Minor Hill
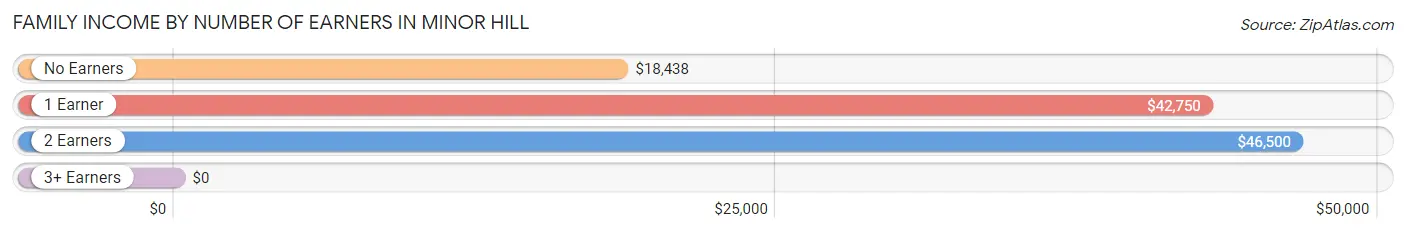
| Number of Earners | # Families | Median Income |
| No Earners | 9 (6.0%) | $18,438 |
| 1 Earner | 66 (44.0%) | $42,750 |
| 2 Earners | 64 (42.7%) | $46,500 |
| 3+ Earners | 11 (7.3%) | $0 |
| Total | 150 (100.0%) | $44,500 |
Household Income in Minor Hill
Household Income Brackets in Minor Hill
With 77 households falling in the category, the $35,000 to $49,999 income range is the most frequent in Minor Hill, accounting for 34.2% of all households. In contrast, only 4 households (1.8%) fall into the $100,000 to $149,999 income bracket, making it the least populous group.
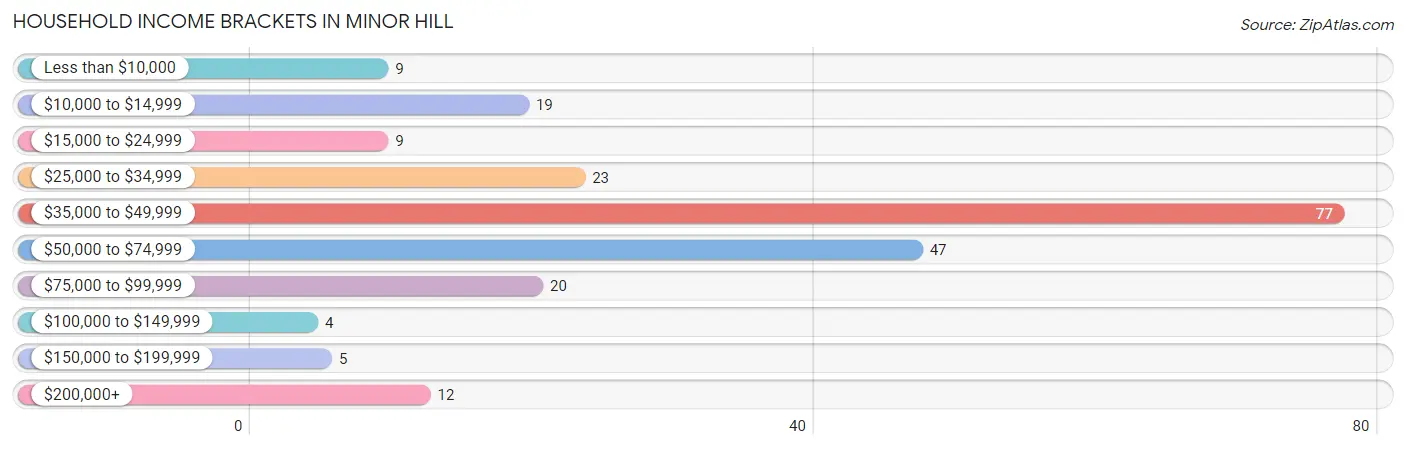
| Income Bracket | # Households | % Households |
| Less than $10,000 | 9 | 4.0% |
| $10,000 to $14,999 | 19 | 8.4% |
| $15,000 to $24,999 | 9 | 4.0% |
| $25,000 to $34,999 | 23 | 10.2% |
| $35,000 to $49,999 | 77 | 34.2% |
| $50,000 to $74,999 | 47 | 20.9% |
| $75,000 to $99,999 | 20 | 8.9% |
| $100,000 to $149,999 | 4 | 1.8% |
| $150,000 to $199,999 | 5 | 2.2% |
| $200,000+ | 12 | 5.3% |
Household Income by Householder Age in Minor Hill
The median household income in Minor Hill is $42,371, with the highest median household income of $62,656 found in the 45 to 64 years age bracket for the primary householder. A total of 114 households (50.7%) fall into this category. Meanwhile, the 15 to 24 years age bracket for the primary householder has the lowest median household income of $0, with 4 households (1.8%) in this group.
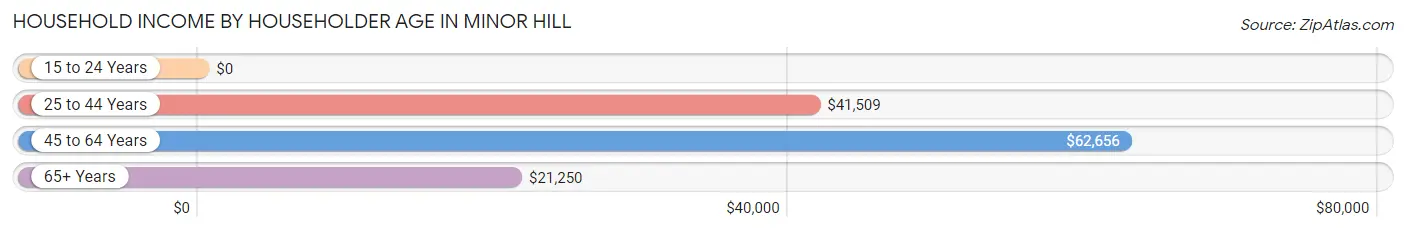
| Income Bracket | # Households | Median Income |
| 15 to 24 Years | 4 (1.8%) | $0 |
| 25 to 44 Years | 83 (36.9%) | $41,509 |
| 45 to 64 Years | 114 (50.7%) | $62,656 |
| 65+ Years | 24 (10.7%) | $21,250 |
| Total | 225 (100.0%) | $42,371 |
Poverty in Minor Hill
Income Below Poverty by Sex and Age in Minor Hill
With 20.1% poverty level for males and 18.7% for females among the residents of Minor Hill, 16 and 17 year old males and 35 to 44 year old females are the most vulnerable to poverty, with 3 males (100.0%) and 6 females (100.0%) in their respective age groups living below the poverty level.
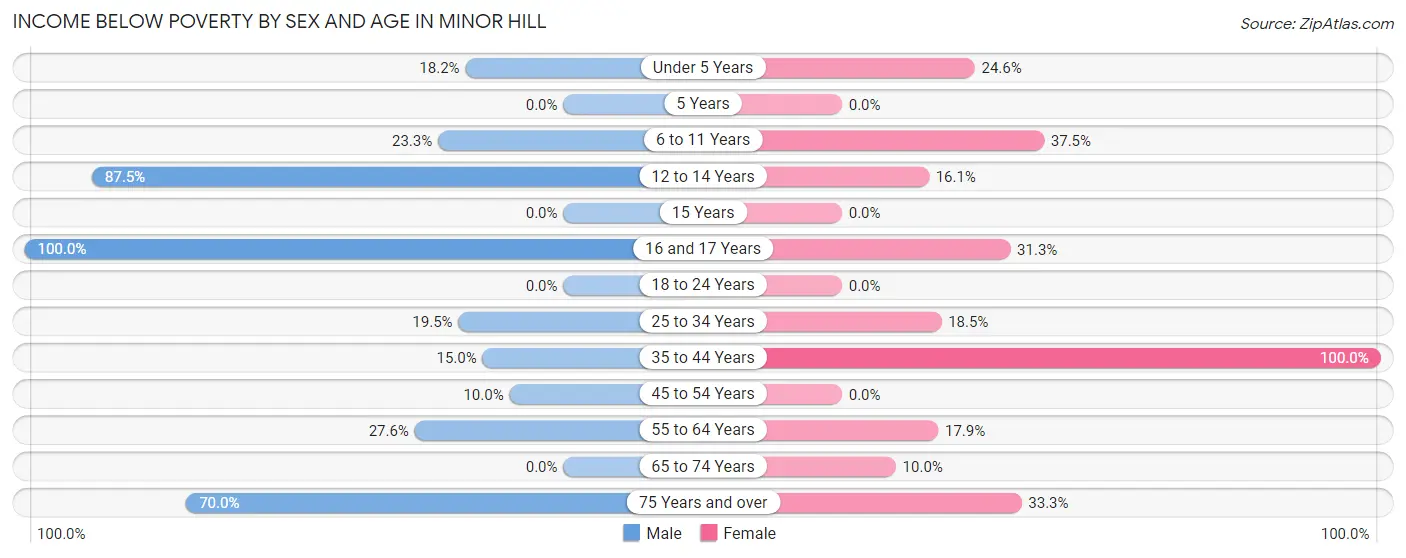
| Age Bracket | Male | Female |
| Under 5 Years | 10 (18.2%) | 17 (24.6%) |
| 5 Years | 0 (0.0%) | 0 (0.0%) |
| 6 to 11 Years | 10 (23.3%) | 9 (37.5%) |
| 12 to 14 Years | 7 (87.5%) | 5 (16.1%) |
| 15 Years | 0 (0.0%) | 0 (0.0%) |
| 16 and 17 Years | 3 (100.0%) | 5 (31.2%) |
| 18 to 24 Years | 0 (0.0%) | 0 (0.0%) |
| 25 to 34 Years | 15 (19.5%) | 19 (18.4%) |
| 35 to 44 Years | 3 (15.0%) | 6 (100.0%) |
| 45 to 54 Years | 4 (10.0%) | 0 (0.0%) |
| 55 to 64 Years | 8 (27.6%) | 5 (17.9%) |
| 65 to 74 Years | 0 (0.0%) | 1 (10.0%) |
| 75 Years and over | 7 (70.0%) | 3 (33.3%) |
| Total | 67 (20.1%) | 70 (18.7%) |
Income Above Poverty by Sex and Age in Minor Hill
According to the poverty statistics in Minor Hill, males aged 5 years and females aged 5 years are the age groups that are most secure financially, with 100.0% of males and 100.0% of females in these age groups living above the poverty line.
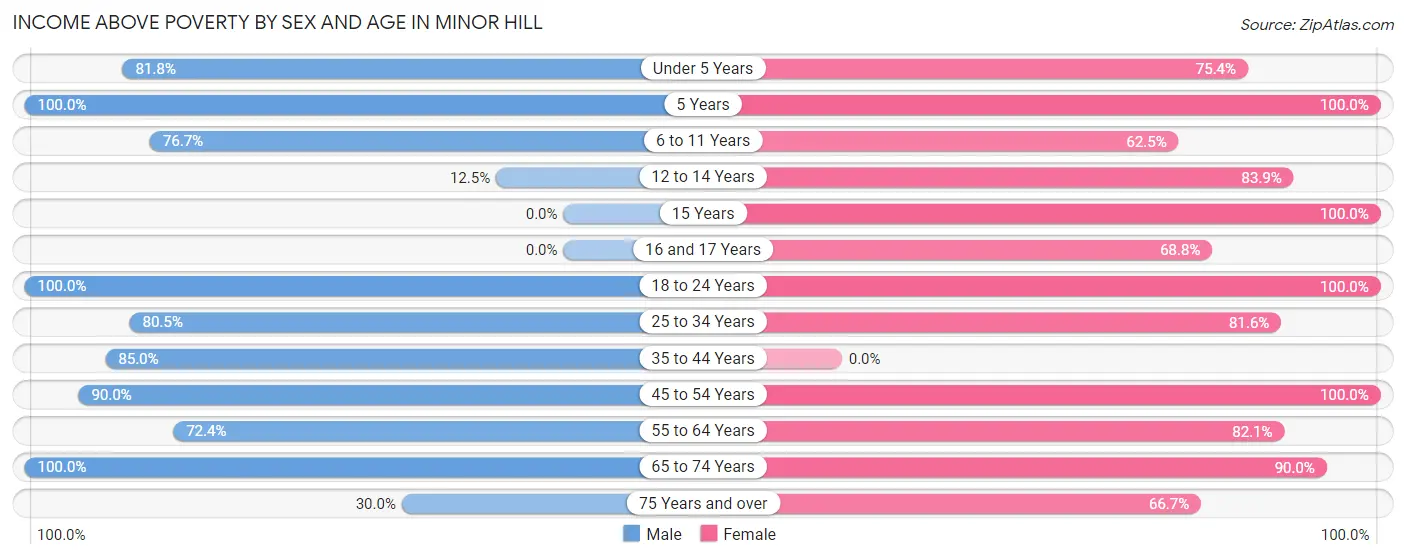
| Age Bracket | Male | Female |
| Under 5 Years | 45 (81.8%) | 52 (75.4%) |
| 5 Years | 8 (100.0%) | 6 (100.0%) |
| 6 to 11 Years | 33 (76.7%) | 15 (62.5%) |
| 12 to 14 Years | 1 (12.5%) | 26 (83.9%) |
| 15 Years | 0 (0.0%) | 8 (100.0%) |
| 16 and 17 Years | 0 (0.0%) | 11 (68.8%) |
| 18 to 24 Years | 23 (100.0%) | 6 (100.0%) |
| 25 to 34 Years | 62 (80.5%) | 84 (81.6%) |
| 35 to 44 Years | 17 (85.0%) | 0 (0.0%) |
| 45 to 54 Years | 36 (90.0%) | 58 (100.0%) |
| 55 to 64 Years | 21 (72.4%) | 23 (82.1%) |
| 65 to 74 Years | 17 (100.0%) | 9 (90.0%) |
| 75 Years and over | 3 (30.0%) | 6 (66.7%) |
| Total | 266 (79.9%) | 304 (81.3%) |
Income Below Poverty Among Married-Couple Families in Minor Hill
The poverty statistics for married-couple families in Minor Hill show that 11.4% or 9 of the total 79 families live below the poverty line. Families with 1 or 2 children have the highest poverty rate of 19.4%, comprising of 7 families. On the other hand, families with no children have the lowest poverty rate of 0.0%, which includes 0 families.
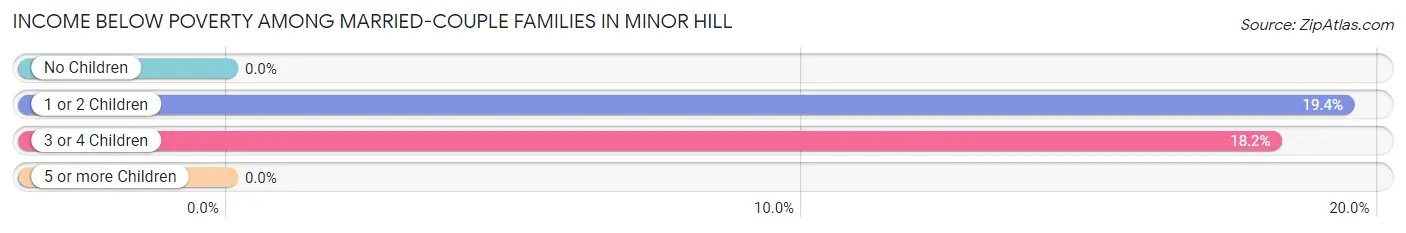
| Children | Above Poverty | Below Poverty |
| No Children | 32 (100.0%) | 0 (0.0%) |
| 1 or 2 Children | 29 (80.6%) | 7 (19.4%) |
| 3 or 4 Children | 9 (81.8%) | 2 (18.2%) |
| 5 or more Children | 0 (0.0%) | 0 (0.0%) |
| Total | 70 (88.6%) | 9 (11.4%) |
Income Below Poverty Among Single-Parent Households in Minor Hill
According to the poverty data in Minor Hill, 20.0% or 4 single-father households and 21.6% or 11 single-mother households are living below the poverty line. Among single-father households, those with 1 or 2 children have the highest poverty rate, with 4 households (100.0%) experiencing poverty. Likewise, among single-mother households, those with 1 or 2 children have the highest poverty rate, with 11 households (40.7%) falling below the poverty line.
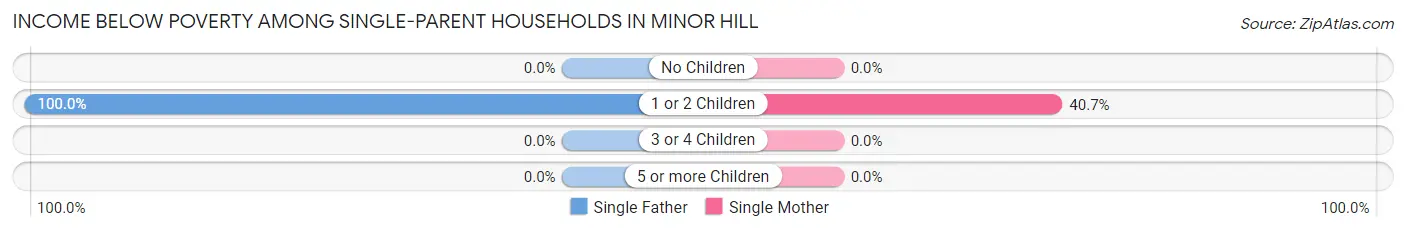
| Children | Single Father | Single Mother |
| No Children | 0 (0.0%) | 0 (0.0%) |
| 1 or 2 Children | 4 (100.0%) | 11 (40.7%) |
| 3 or 4 Children | 0 (0.0%) | 0 (0.0%) |
| 5 or more Children | 0 (0.0%) | 0 (0.0%) |
| Total | 4 (20.0%) | 11 (21.6%) |
Income Below Poverty Among Married-Couple vs Single-Parent Households in Minor Hill
The poverty data for Minor Hill shows that 9 of the married-couple family households (11.4%) and 15 of the single-parent households (21.1%) are living below the poverty level. Within the married-couple family households, those with 1 or 2 children have the highest poverty rate, with 7 households (19.4%) falling below the poverty line. Among the single-parent households, those with 1 or 2 children have the highest poverty rate, with 15 household (48.4%) living below poverty.
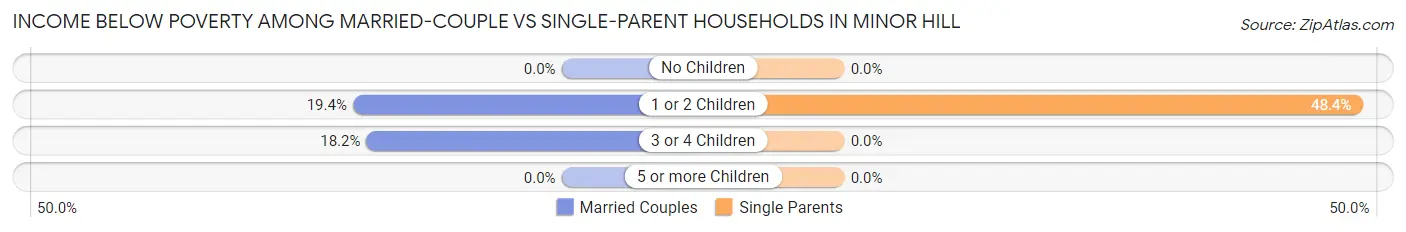
| Children | Married-Couple Families | Single-Parent Households |
| No Children | 0 (0.0%) | 0 (0.0%) |
| 1 or 2 Children | 7 (19.4%) | 15 (48.4%) |
| 3 or 4 Children | 2 (18.2%) | 0 (0.0%) |
| 5 or more Children | 0 (0.0%) | 0 (0.0%) |
| Total | 9 (11.4%) | 15 (21.1%) |
Race in Minor Hill
The most populous races in Minor Hill are White / Caucasian (659 | 93.2%), Two or more Races (40 | 5.7%), and Hispanic or Latino (11 | 1.6%).
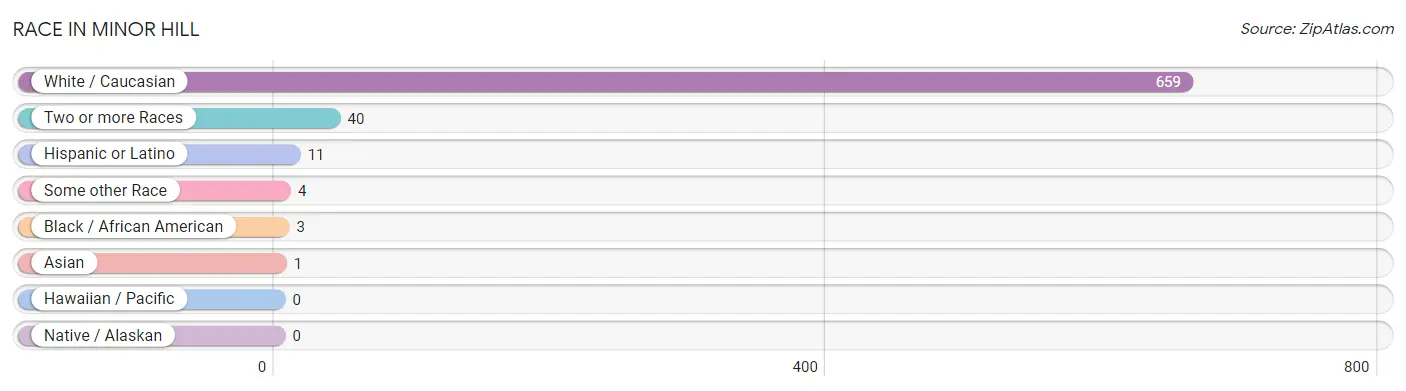
| Race | # Population | % Population |
| Asian | 1 | 0.1% |
| Black / African American | 3 | 0.4% |
| Hawaiian / Pacific | 0 | 0.0% |
| Hispanic or Latino | 11 | 1.6% |
| Native / Alaskan | 0 | 0.0% |
| White / Caucasian | 659 | 93.2% |
| Two or more Races | 40 | 5.7% |
| Some other Race | 4 | 0.6% |
| Total | 707 | 100.0% |
Ancestry in Minor Hill
The most populous ancestries reported in Minor Hill are American (104 | 14.7%), European (102 | 14.4%), English (93 | 13.2%), Irish (57 | 8.1%), and Scotch-Irish (41 | 5.8%), together accounting for 56.2% of all Minor Hill residents.
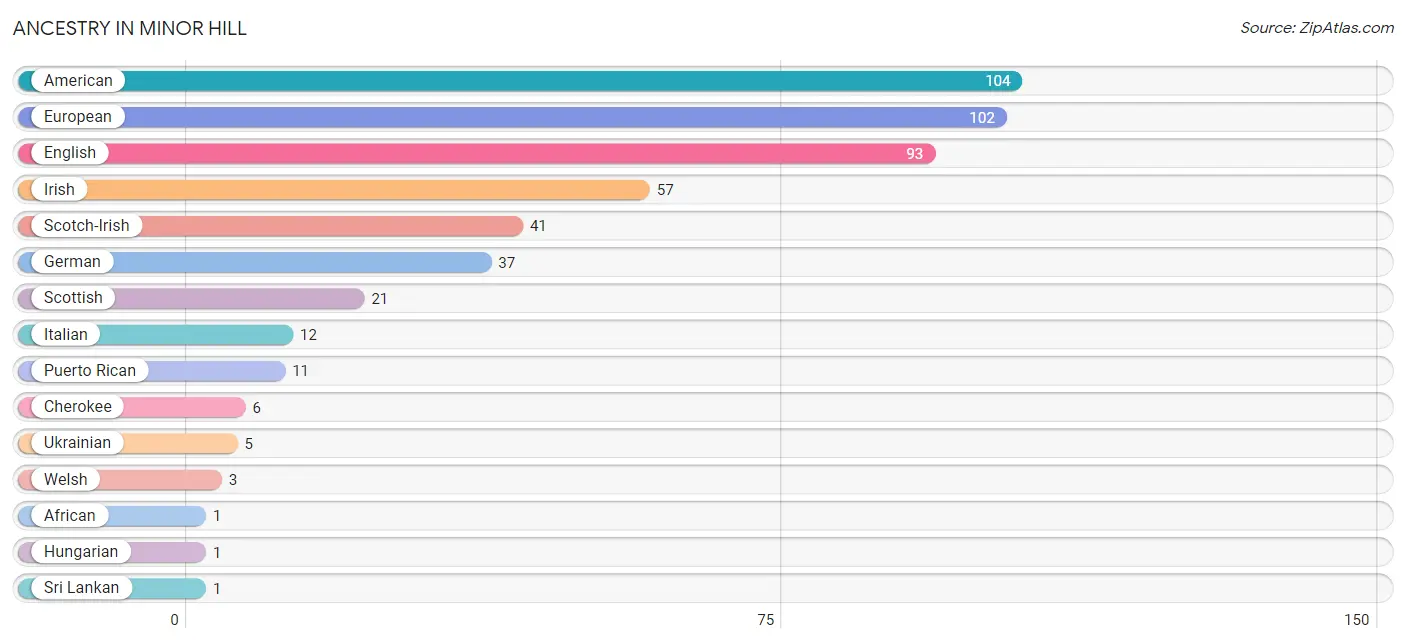
| Ancestry | # Population | % Population |
| African | 1 | 0.1% |
| American | 104 | 14.7% |
| Cherokee | 6 | 0.9% |
| English | 93 | 13.2% |
| European | 102 | 14.4% |
| German | 37 | 5.2% |
| Hungarian | 1 | 0.1% |
| Irish | 57 | 8.1% |
| Italian | 12 | 1.7% |
| Puerto Rican | 11 | 1.6% |
| Scotch-Irish | 41 | 5.8% |
| Scottish | 21 | 3.0% |
| Sri Lankan | 1 | 0.1% |
| Subsaharan African | 1 | 0.1% |
| Ukrainian | 5 | 0.7% |
| Welsh | 3 | 0.4% | View All 16 Rows |
Immigrants in Minor Hill
The most numerous immigrant groups reported in Minor Hill came from Asia (3 | 0.4%), Eastern Asia (3 | 0.4%), and Japan (3 | 0.4%), together accounting for 1.3% of all Minor Hill residents.
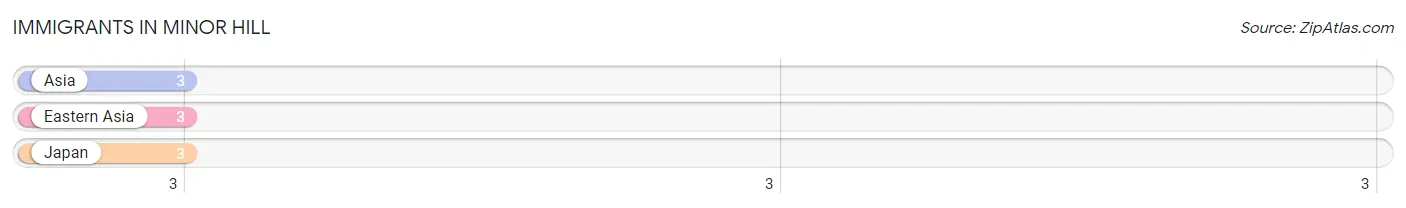
| Immigration Origin | # Population | % Population |
| Asia | 3 | 0.4% |
| Eastern Asia | 3 | 0.4% |
| Japan | 3 | 0.4% | View All 3 Rows |
Sex and Age in Minor Hill
Sex and Age in Minor Hill
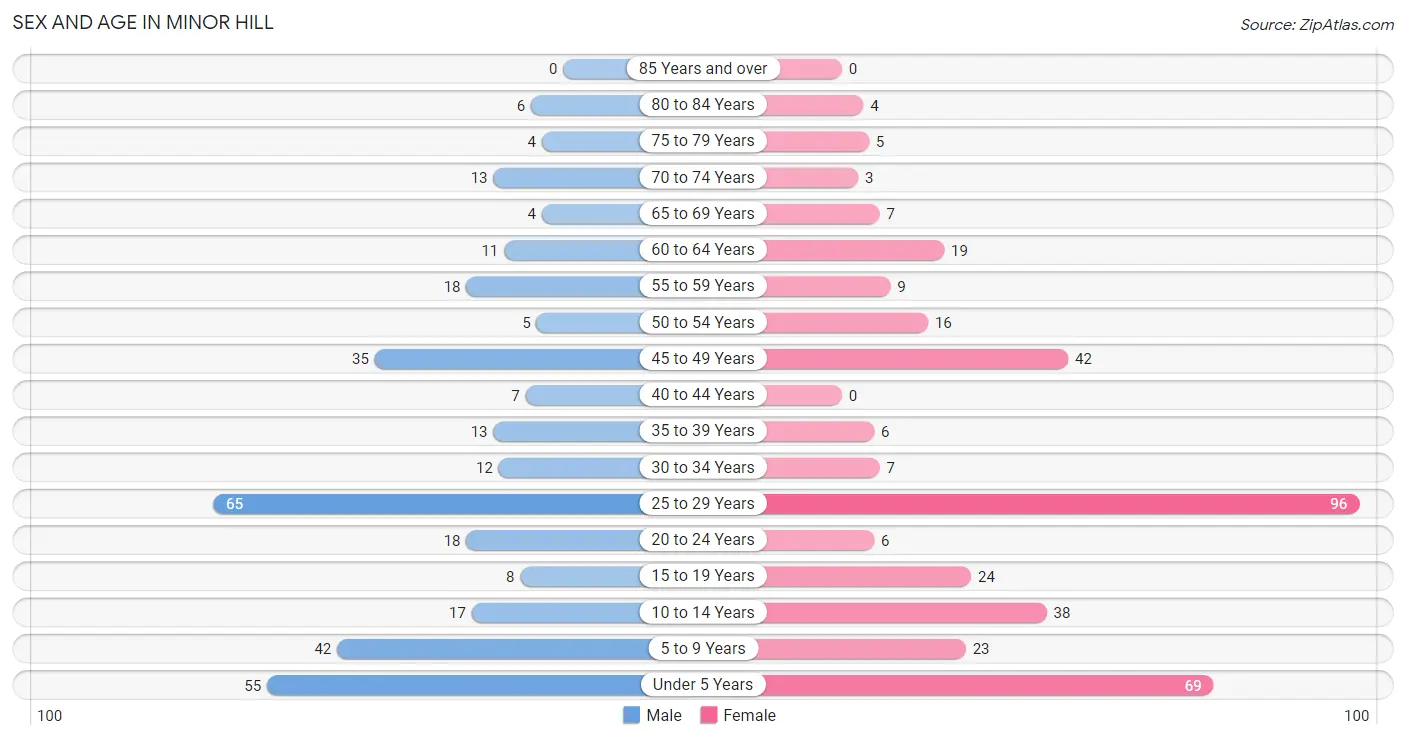
The most populous age groups in Minor Hill are 25 to 29 Years (65 | 19.5%) for men and 25 to 29 Years (96 | 25.7%) for women.
| Age Bracket | Male | Female |
| Under 5 Years | 55 (16.5%) | 69 (18.4%) |
| 5 to 9 Years | 42 (12.6%) | 23 (6.1%) |
| 10 to 14 Years | 17 (5.1%) | 38 (10.2%) |
| 15 to 19 Years | 8 (2.4%) | 24 (6.4%) |
| 20 to 24 Years | 18 (5.4%) | 6 (1.6%) |
| 25 to 29 Years | 65 (19.5%) | 96 (25.7%) |
| 30 to 34 Years | 12 (3.6%) | 7 (1.9%) |
| 35 to 39 Years | 13 (3.9%) | 6 (1.6%) |
| 40 to 44 Years | 7 (2.1%) | 0 (0.0%) |
| 45 to 49 Years | 35 (10.5%) | 42 (11.2%) |
| 50 to 54 Years | 5 (1.5%) | 16 (4.3%) |
| 55 to 59 Years | 18 (5.4%) | 9 (2.4%) |
| 60 to 64 Years | 11 (3.3%) | 19 (5.1%) |
| 65 to 69 Years | 4 (1.2%) | 7 (1.9%) |
| 70 to 74 Years | 13 (3.9%) | 3 (0.8%) |
| 75 to 79 Years | 4 (1.2%) | 5 (1.3%) |
| 80 to 84 Years | 6 (1.8%) | 4 (1.1%) |
| 85 Years and over | 0 (0.0%) | 0 (0.0%) |
| Total | 333 (100.0%) | 374 (100.0%) |
Families and Households in Minor Hill
Median Family Size in Minor Hill
The median family size in Minor Hill is 3.99 persons per family, with single male/father families (20 | 13.3%) accounting for the largest median family size of 4.6 persons per family. On the other hand, single female/mother families (51 | 34.0%) represent the smallest median family size with 3.78 persons per family.
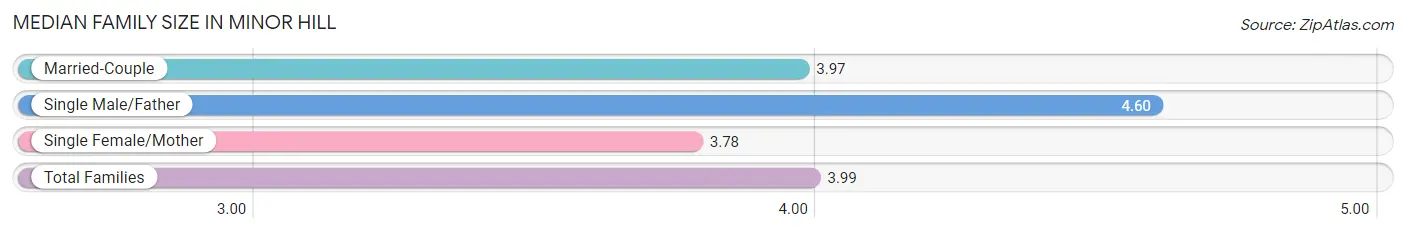
| Family Type | # Families | Family Size |
| Married-Couple | 79 (52.7%) | 3.97 |
| Single Male/Father | 20 (13.3%) | 4.60 |
| Single Female/Mother | 51 (34.0%) | 3.78 |
| Total Families | 150 (100.0%) | 3.99 |
Median Household Size in Minor Hill
The median household size in Minor Hill is 3.14 persons per household, with single male/father households (20 | 8.9%) accounting for the largest median household size of 5.05 persons per household. non-family households (75 | 33.3%) represent the smallest median household size with 1.04 persons per household.
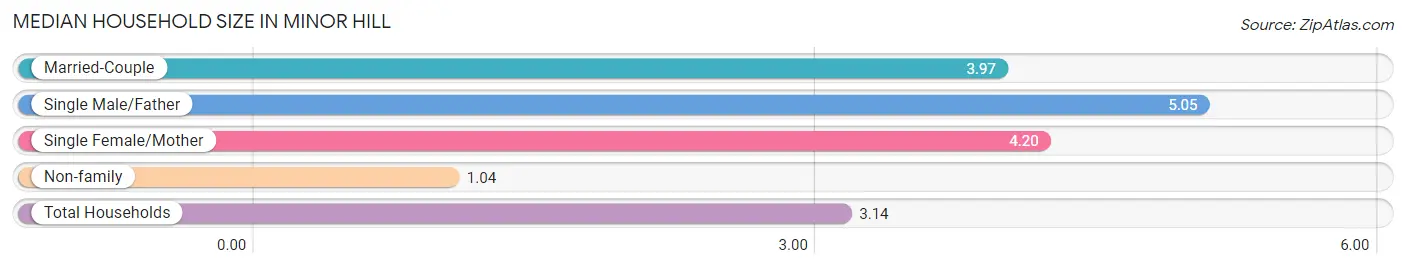
| Household Type | # Households | Household Size |
| Married-Couple | 79 (35.1%) | 3.97 |
| Single Male/Father | 20 (8.9%) | 5.05 |
| Single Female/Mother | 51 (22.7%) | 4.20 |
| Non-family | 75 (33.3%) | 1.04 |
| Total Households | 225 (100.0%) | 3.14 |
Household Size by Marriage Status in Minor Hill
Out of a total of 225 households in Minor Hill, 150 (66.7%) are family households, while 75 (33.3%) are nonfamily households. The most numerous type of family households are 4-person households, comprising 53, and the most common type of nonfamily households are 1-person households, comprising 72.
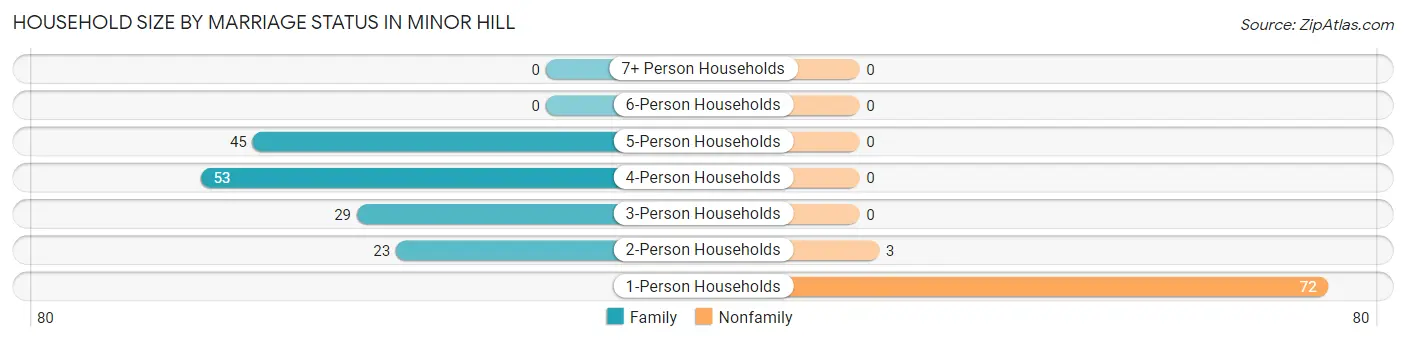
| Household Size | Family Households | Nonfamily Households |
| 1-Person Households | - | 72 (32.0%) |
| 2-Person Households | 23 (10.2%) | 3 (1.3%) |
| 3-Person Households | 29 (12.9%) | 0 (0.0%) |
| 4-Person Households | 53 (23.6%) | 0 (0.0%) |
| 5-Person Households | 45 (20.0%) | 0 (0.0%) |
| 6-Person Households | 0 (0.0%) | 0 (0.0%) |
| 7+ Person Households | 0 (0.0%) | 0 (0.0%) |
| Total | 150 (66.7%) | 75 (33.3%) |
Female Fertility in Minor Hill
Fertility by Age in Minor Hill
Average fertility rate in Minor Hill is 60.0 births per 1,000 women. Women in the age bracket of 20 to 34 years have the highest fertility rate with 92.0 births per 1,000 women. Women in the age bracket of 20 to 34 years acount for 90.9% of all women with births.
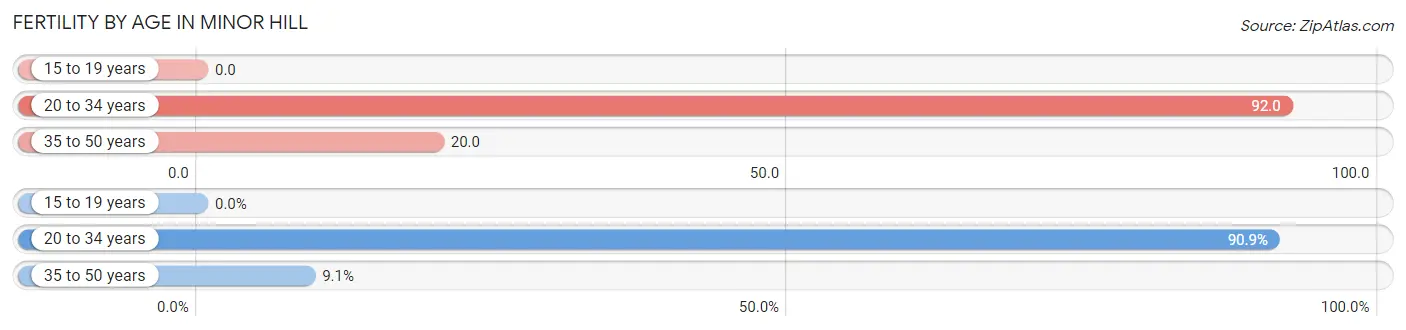
| Age Bracket | Women with Births | Births / 1,000 Women |
| 15 to 19 years | 0 (0.0%) | 0.0 |
| 20 to 34 years | 10 (90.9%) | 92.0 |
| 35 to 50 years | 1 (9.1%) | 20.0 |
| Total | 11 (100.0%) | 60.0 |
Fertility by Age by Marriage Status in Minor Hill
18.2% of women with births (11) in Minor Hill are married. The highest percentage of unmarried women with births falls into 20 to 34 years age bracket with 90.0% of them unmarried at the time of birth, while the lowest percentage of unmarried women with births belong to 35 to 50 years age bracket with 0.0% of them unmarried.
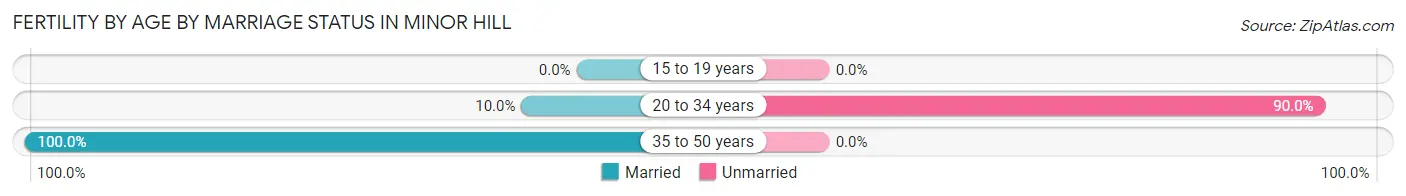
| Age Bracket | Married | Unmarried |
| 15 to 19 years | 0 (0.0%) | 0 (0.0%) |
| 20 to 34 years | 1 (10.0%) | 9 (90.0%) |
| 35 to 50 years | 1 (100.0%) | 0 (0.0%) |
| Total | 2 (18.2%) | 9 (81.8%) |
Fertility by Education in Minor Hill
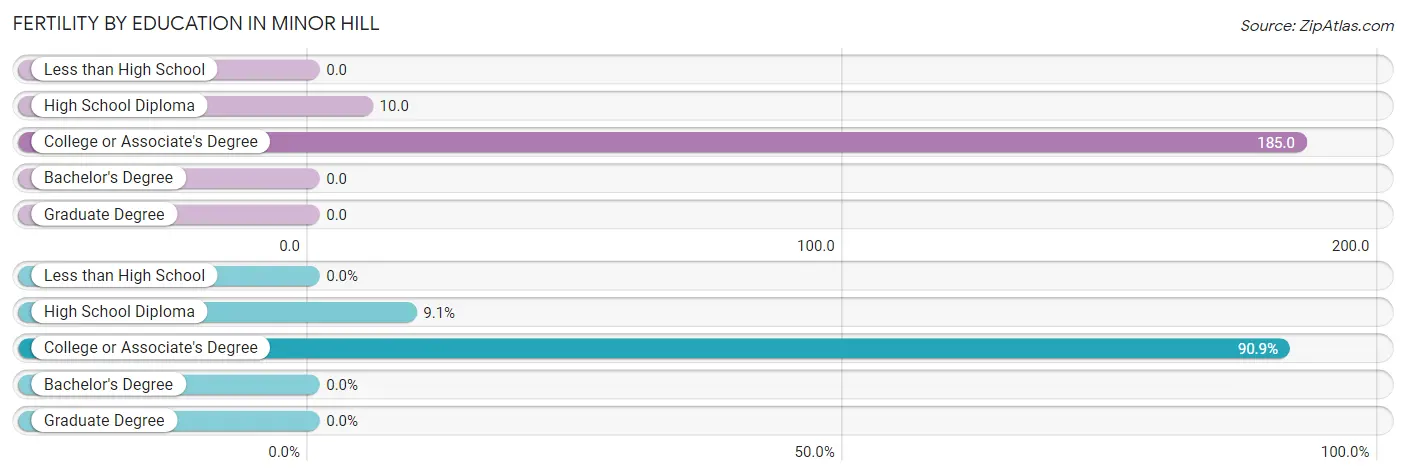
| Educational Attainment | Women with Births | Births / 1,000 Women |
| Less than High School | 0 (0.0%) | 0.0 |
| High School Diploma | 1 (9.1%) | 10.0 |
| College or Associate's Degree | 10 (90.9%) | 185.0 |
| Bachelor's Degree | 0 (0.0%) | 0.0 |
| Graduate Degree | 0 (0.0%) | 0.0 |
| Total | 11 (100.0%) | 60.0 |
Fertility by Education by Marriage Status in Minor Hill
81.8% of women with births in Minor Hill are unmarried. Women with the educational attainment of high school diploma are most likely to be married with 100.0% of them married at childbirth, while women with the educational attainment of college or associate's degree are least likely to be married with 90.0% of them unmarried at childbirth.
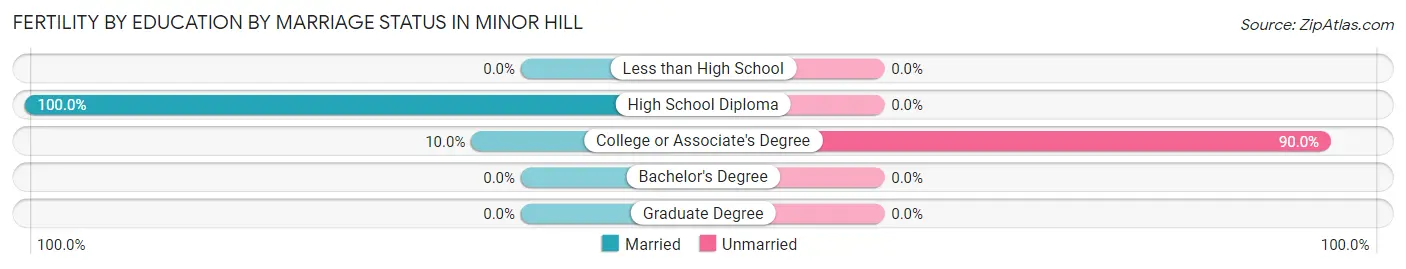
| Educational Attainment | Married | Unmarried |
| Less than High School | 0 (0.0%) | 0 (0.0%) |
| High School Diploma | 1 (100.0%) | 0 (0.0%) |
| College or Associate's Degree | 1 (10.0%) | 9 (90.0%) |
| Bachelor's Degree | 0 (0.0%) | 0 (0.0%) |
| Graduate Degree | 0 (0.0%) | 0 (0.0%) |
| Total | 2 (18.2%) | 9 (81.8%) |
Employment Characteristics in Minor Hill
Employment by Class of Employer in Minor Hill
Among the 285 employed individuals in Minor Hill, private company employees (269 | 94.4%), self-employed (not incorporated) (7 | 2.5%), and local government employees (5 | 1.8%) make up the most common classes of employment.
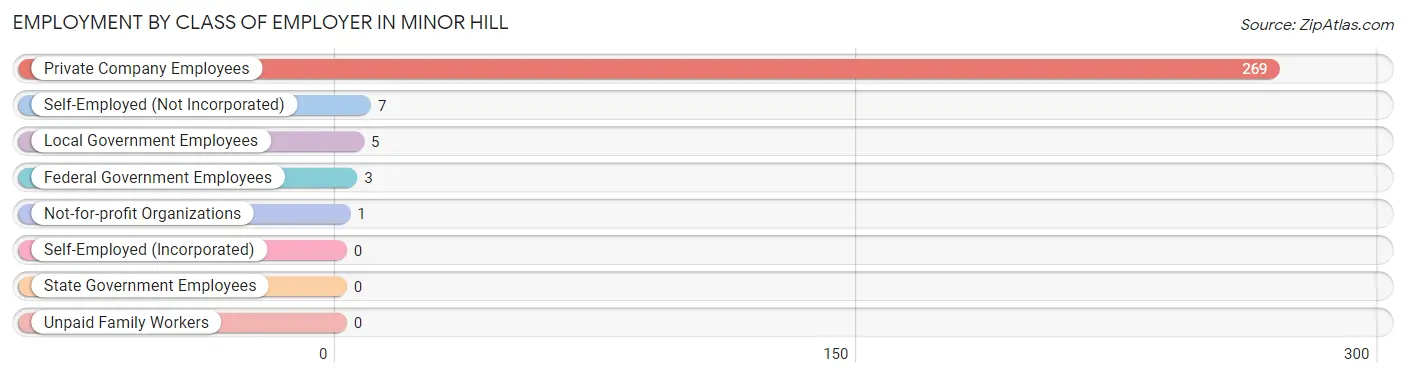
| Employer Class | # Employees | % Employees |
| Private Company Employees | 269 | 94.4% |
| Self-Employed (Incorporated) | 0 | 0.0% |
| Self-Employed (Not Incorporated) | 7 | 2.5% |
| Not-for-profit Organizations | 1 | 0.4% |
| Local Government Employees | 5 | 1.8% |
| State Government Employees | 0 | 0.0% |
| Federal Government Employees | 3 | 1.1% |
| Unpaid Family Workers | 0 | 0.0% |
| Total | 285 | 100.0% |
Employment Status by Age in Minor Hill
According to the labor force statistics for Minor Hill, out of the total population over 16 years of age (455), 67.9% or 309 individuals are in the labor force, with 3.6% or 11 of them unemployed. The age group with the highest labor force participation rate is 20 to 24 years, with 79.2% or 19 individuals in the labor force. Within the labor force, the 55 to 59 years age range has the highest percentage of unemployed individuals, with 11.1% or 2 of them being unemployed.
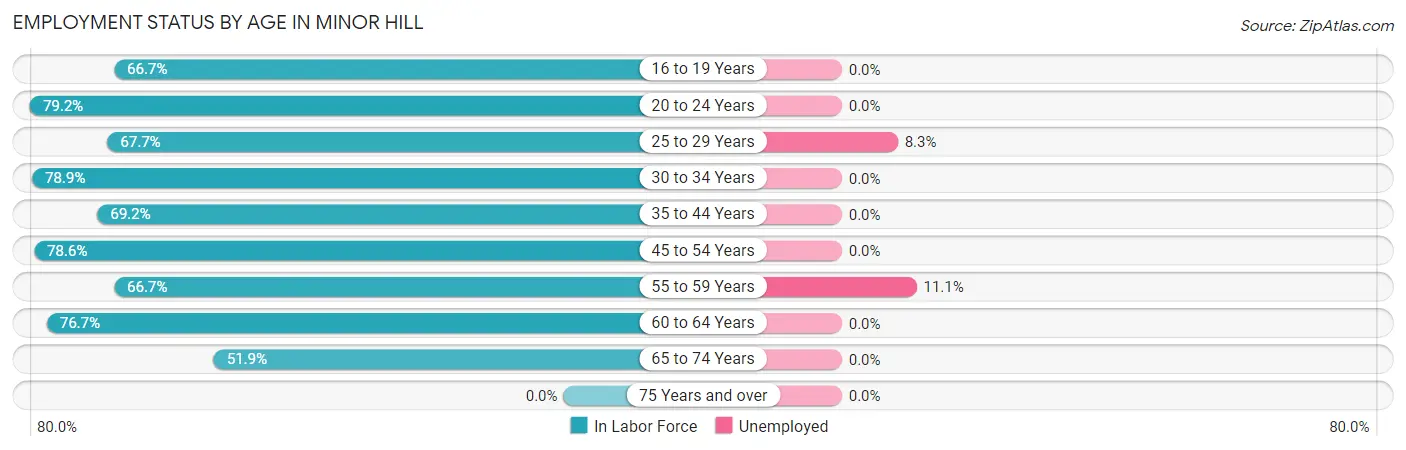
| Age Bracket | In Labor Force | Unemployed |
| 16 to 19 Years | 16 (66.7%) | 0 (0.0%) |
| 20 to 24 Years | 19 (79.2%) | 0 (0.0%) |
| 25 to 29 Years | 109 (67.7%) | 9 (8.3%) |
| 30 to 34 Years | 15 (78.9%) | 0 (0.0%) |
| 35 to 44 Years | 18 (69.2%) | 0 (0.0%) |
| 45 to 54 Years | 77 (78.6%) | 0 (0.0%) |
| 55 to 59 Years | 18 (66.7%) | 2 (11.1%) |
| 60 to 64 Years | 23 (76.7%) | 0 (0.0%) |
| 65 to 74 Years | 14 (51.9%) | 0 (0.0%) |
| 75 Years and over | 0 (0.0%) | 0 (0.0%) |
| Total | 309 (67.9%) | 11 (3.6%) |
Employment Status by Educational Attainment in Minor Hill
According to labor force statistics for Minor Hill, 72.0% of individuals (260) out of the total population between 25 and 64 years of age (361) are in the labor force, with 4.2% or 11 of them being unemployed. The group with the highest labor force participation rate are those with the educational attainment of bachelor's degree or higher, with 100.0% or 22 individuals in the labor force. Within the labor force, individuals with college / associate degree education have the highest percentage of unemployment, with 9.3% or 9 of them being unemployed.
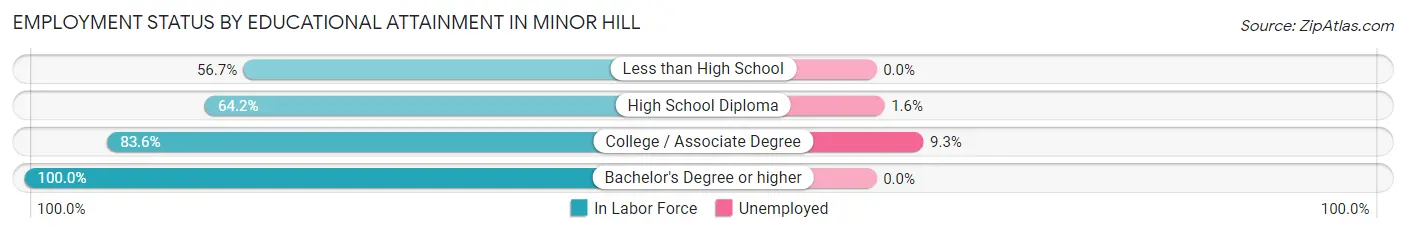
| Educational Attainment | In Labor Force | Unemployed |
| Less than High School | 17 (56.7%) | 0 (0.0%) |
| High School Diploma | 124 (64.2%) | 3 (1.6%) |
| College / Associate Degree | 97 (83.6%) | 11 (9.3%) |
| Bachelor's Degree or higher | 22 (100.0%) | 0 (0.0%) |
| Total | 260 (72.0%) | 15 (4.2%) |
Employment Occupations by Sex in Minor Hill
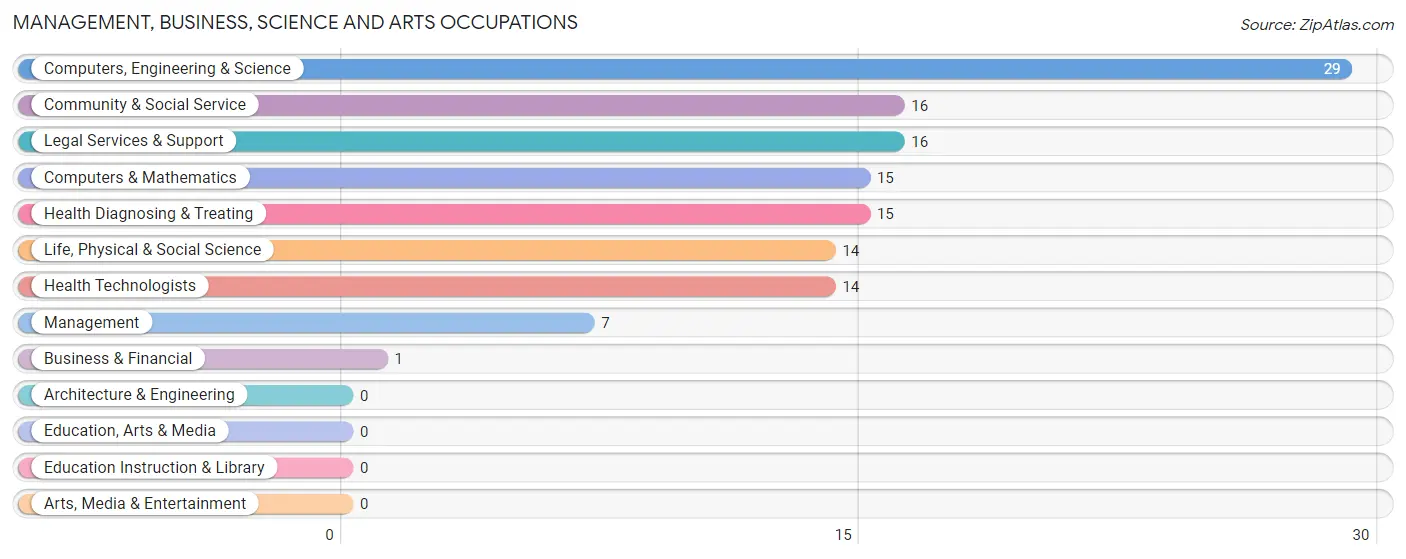
Management, Business, Science and Arts Occupations
The most common Management, Business, Science and Arts occupations in Minor Hill are Computers, Engineering & Science (29 | 9.7%), Community & Social Service (16 | 5.4%), Legal Services & Support (16 | 5.4%), Computers & Mathematics (15 | 5.0%), and Health Diagnosing & Treating (15 | 5.0%).
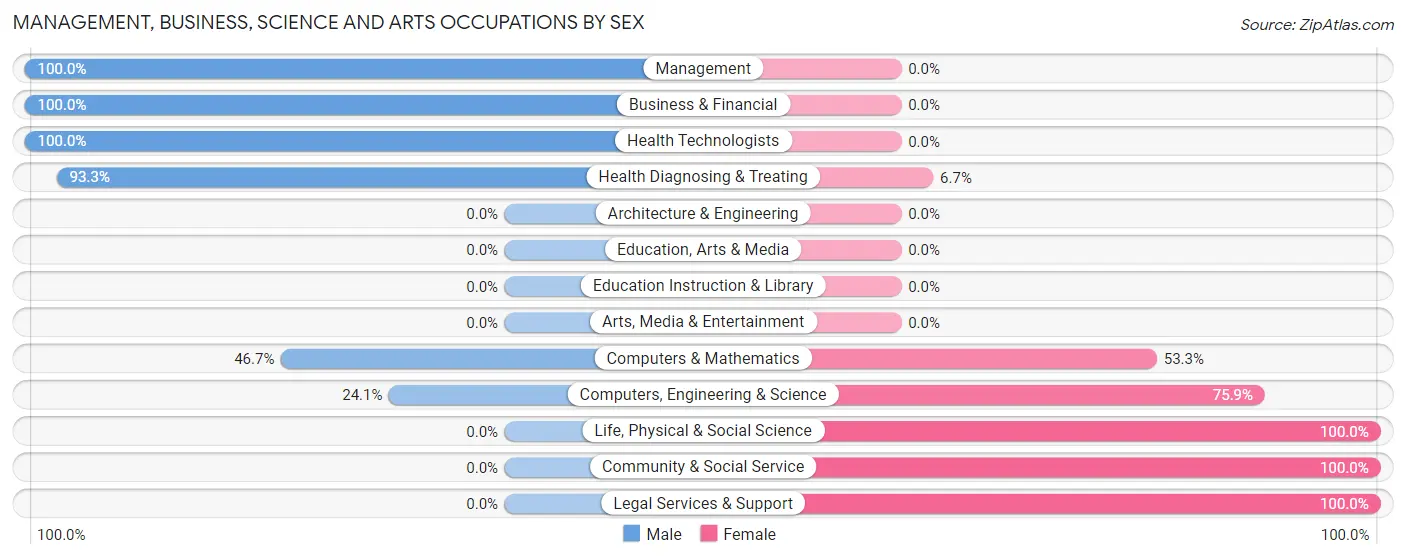
Management, Business, Science and Arts Occupations by Sex
Within the Management, Business, Science and Arts occupations in Minor Hill, the most male-oriented occupations are Management (100.0%), Business & Financial (100.0%), and Health Technologists (100.0%), while the most female-oriented occupations are Life, Physical & Social Science (100.0%), Community & Social Service (100.0%), and Legal Services & Support (100.0%).
| Occupation | Male | Female |
| Management | 7 (100.0%) | 0 (0.0%) |
| Business & Financial | 1 (100.0%) | 0 (0.0%) |
| Computers, Engineering & Science | 7 (24.1%) | 22 (75.9%) |
| Computers & Mathematics | 7 (46.7%) | 8 (53.3%) |
| Architecture & Engineering | 0 (0.0%) | 0 (0.0%) |
| Life, Physical & Social Science | 0 (0.0%) | 14 (100.0%) |
| Community & Social Service | 0 (0.0%) | 16 (100.0%) |
| Education, Arts & Media | 0 (0.0%) | 0 (0.0%) |
| Legal Services & Support | 0 (0.0%) | 16 (100.0%) |
| Education Instruction & Library | 0 (0.0%) | 0 (0.0%) |
| Arts, Media & Entertainment | 0 (0.0%) | 0 (0.0%) |
| Health Diagnosing & Treating | 14 (93.3%) | 1 (6.7%) |
| Health Technologists | 14 (100.0%) | 0 (0.0%) |
| Total (Category) | 29 (42.6%) | 39 (57.4%) |
| Total (Overall) | 170 (57.1%) | 128 (42.9%) |
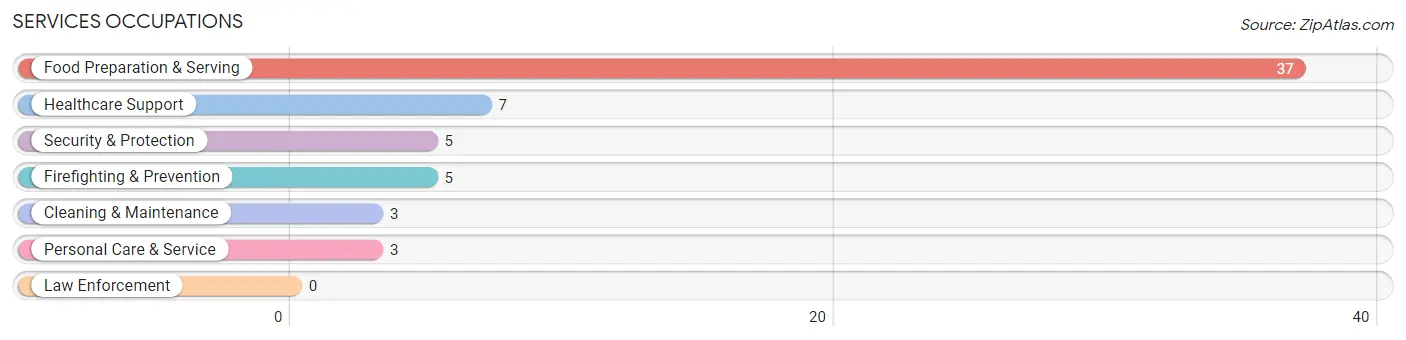
Services Occupations
The most common Services occupations in Minor Hill are Food Preparation & Serving (37 | 12.4%), Healthcare Support (7 | 2.4%), Security & Protection (5 | 1.7%), Firefighting & Prevention (5 | 1.7%), and Cleaning & Maintenance (3 | 1.0%).
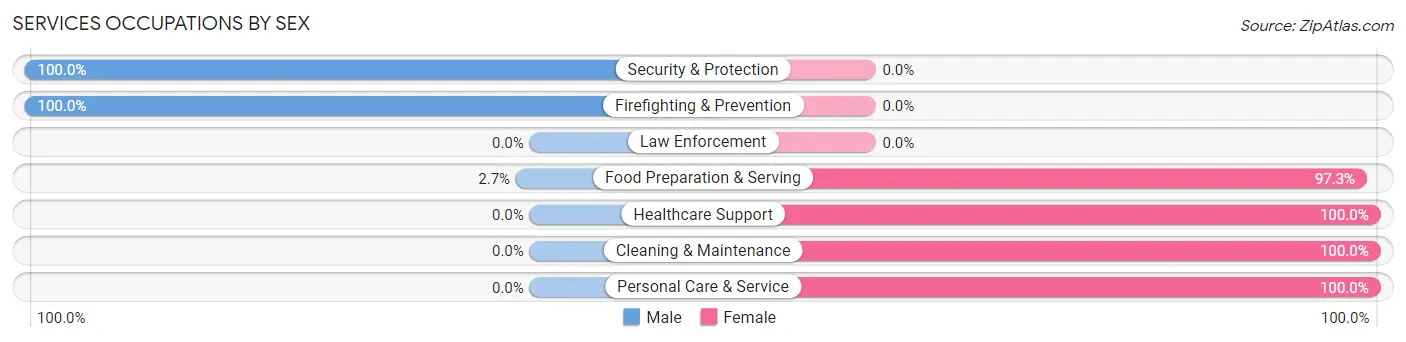
Services Occupations by Sex
Within the Services occupations in Minor Hill, the most male-oriented occupations are Security & Protection (100.0%), Firefighting & Prevention (100.0%), and Food Preparation & Serving (2.7%), while the most female-oriented occupations are Healthcare Support (100.0%), Cleaning & Maintenance (100.0%), and Personal Care & Service (100.0%).
| Occupation | Male | Female |
| Healthcare Support | 0 (0.0%) | 7 (100.0%) |
| Security & Protection | 5 (100.0%) | 0 (0.0%) |
| Firefighting & Prevention | 5 (100.0%) | 0 (0.0%) |
| Law Enforcement | 0 (0.0%) | 0 (0.0%) |
| Food Preparation & Serving | 1 (2.7%) | 36 (97.3%) |
| Cleaning & Maintenance | 0 (0.0%) | 3 (100.0%) |
| Personal Care & Service | 0 (0.0%) | 3 (100.0%) |
| Total (Category) | 6 (10.9%) | 49 (89.1%) |
| Total (Overall) | 170 (57.1%) | 128 (42.9%) |
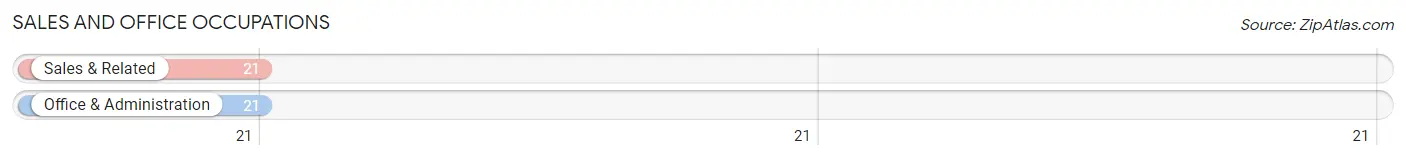
Sales and Office Occupations
The most common Sales and Office occupations in Minor Hill are Sales & Related (21 | 7.0%), and Office & Administration (21 | 7.0%).
Sales and Office Occupations by Sex
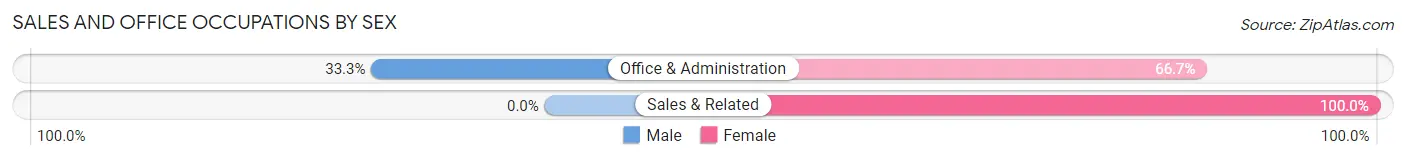
| Occupation | Male | Female |
| Sales & Related | 0 (0.0%) | 21 (100.0%) |
| Office & Administration | 7 (33.3%) | 14 (66.7%) |
| Total (Category) | 7 (16.7%) | 35 (83.3%) |
| Total (Overall) | 170 (57.1%) | 128 (42.9%) |
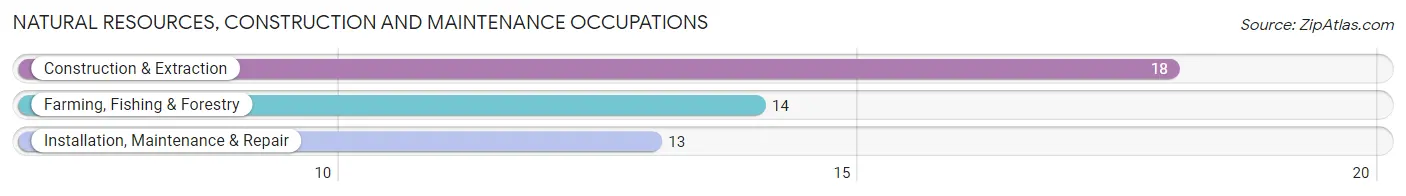
Natural Resources, Construction and Maintenance Occupations
The most common Natural Resources, Construction and Maintenance occupations in Minor Hill are Construction & Extraction (18 | 6.0%), Farming, Fishing & Forestry (14 | 4.7%), and Installation, Maintenance & Repair (13 | 4.4%).
Natural Resources, Construction and Maintenance Occupations by Sex
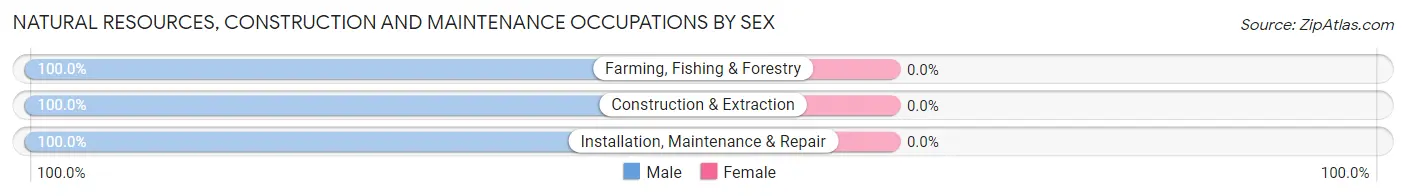
| Occupation | Male | Female |
| Farming, Fishing & Forestry | 14 (100.0%) | 0 (0.0%) |
| Construction & Extraction | 18 (100.0%) | 0 (0.0%) |
| Installation, Maintenance & Repair | 13 (100.0%) | 0 (0.0%) |
| Total (Category) | 45 (100.0%) | 0 (0.0%) |
| Total (Overall) | 170 (57.1%) | 128 (42.9%) |
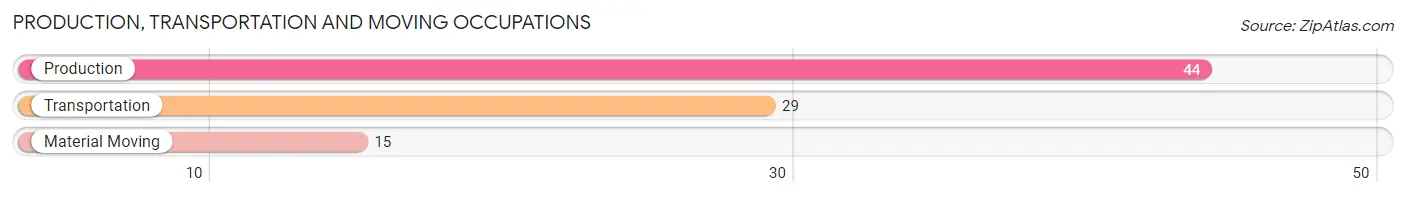
Production, Transportation and Moving Occupations
The most common Production, Transportation and Moving occupations in Minor Hill are Production (44 | 14.8%), Transportation (29 | 9.7%), and Material Moving (15 | 5.0%).
Production, Transportation and Moving Occupations by Sex
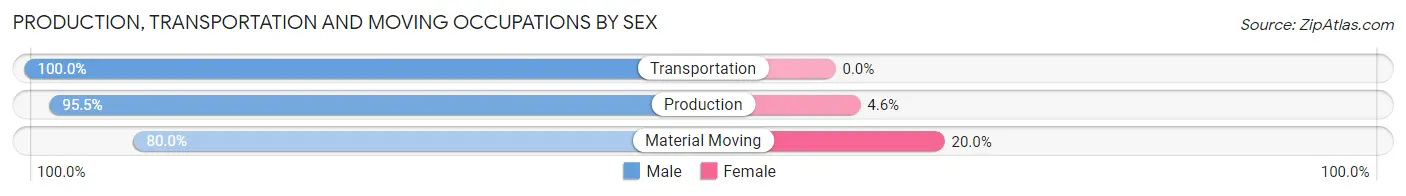
| Occupation | Male | Female |
| Production | 42 (95.5%) | 2 (4.5%) |
| Transportation | 29 (100.0%) | 0 (0.0%) |
| Material Moving | 12 (80.0%) | 3 (20.0%) |
| Total (Category) | 83 (94.3%) | 5 (5.7%) |
| Total (Overall) | 170 (57.1%) | 128 (42.9%) |
Employment Industries by Sex in Minor Hill
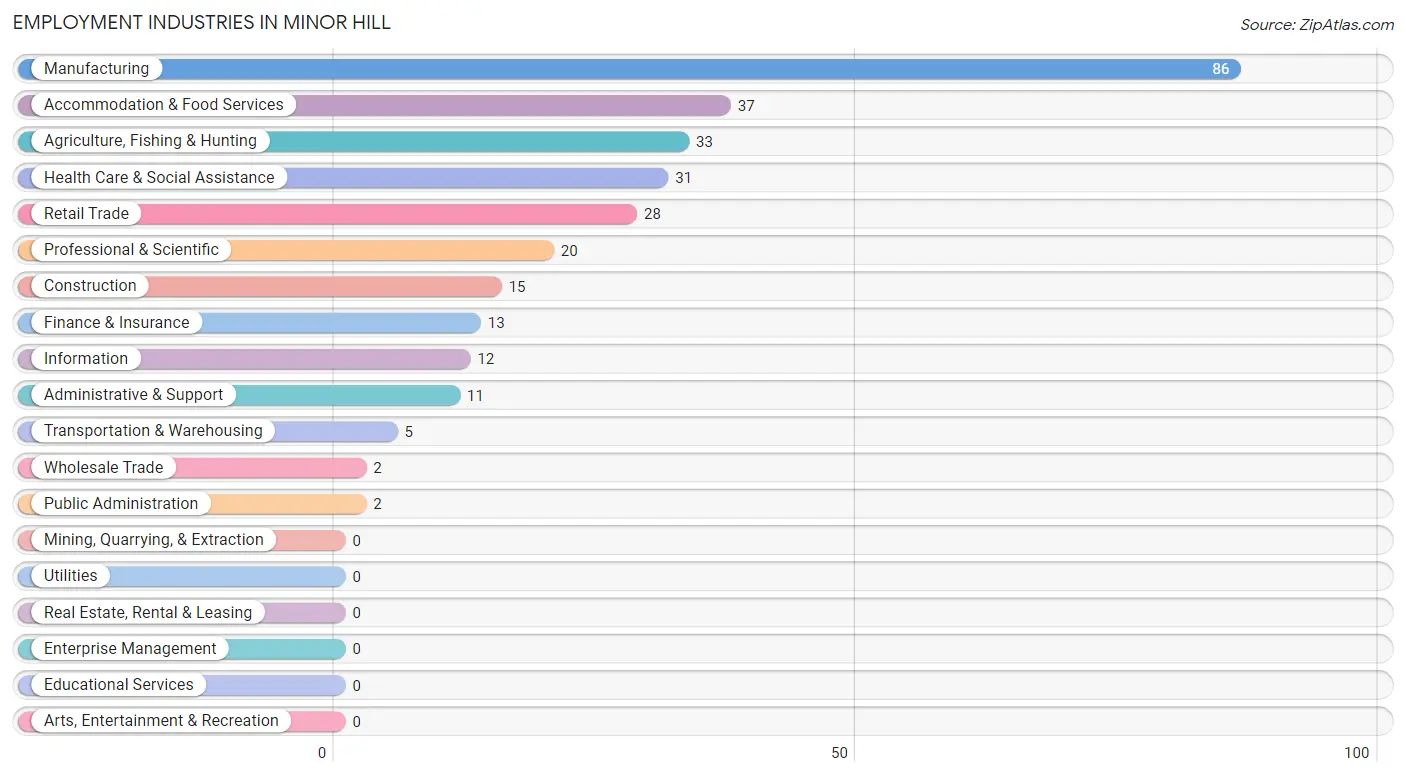
Employment Industries in Minor Hill
The major employment industries in Minor Hill include Manufacturing (86 | 28.9%), Accommodation & Food Services (37 | 12.4%), Agriculture, Fishing & Hunting (33 | 11.1%), Health Care & Social Assistance (31 | 10.4%), and Retail Trade (28 | 9.4%).
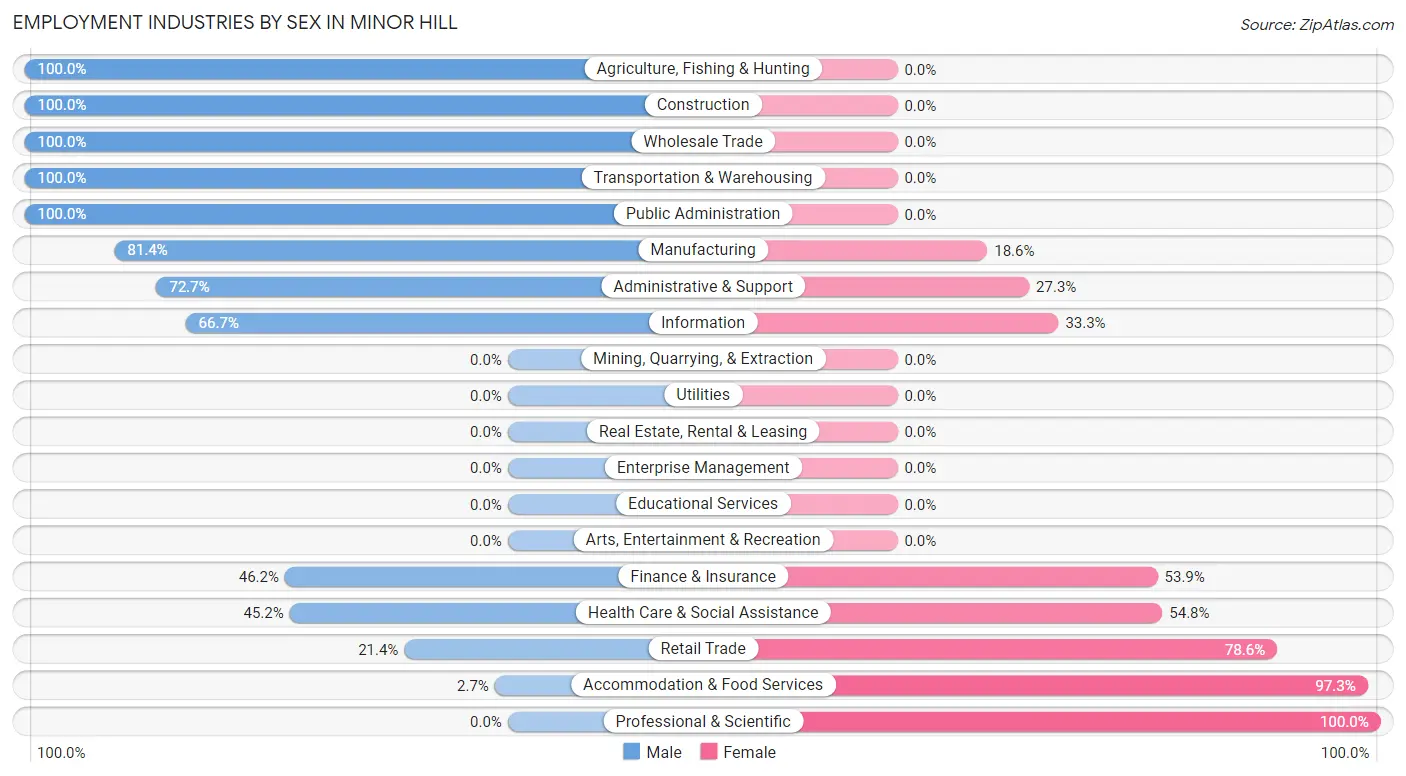
Employment Industries by Sex in Minor Hill
The Minor Hill industries that see more men than women are Agriculture, Fishing & Hunting (100.0%), Construction (100.0%), and Wholesale Trade (100.0%), whereas the industries that tend to have a higher number of women are Professional & Scientific (100.0%), Accommodation & Food Services (97.3%), and Retail Trade (78.6%).
| Industry | Male | Female |
| Agriculture, Fishing & Hunting | 33 (100.0%) | 0 (0.0%) |
| Mining, Quarrying, & Extraction | 0 (0.0%) | 0 (0.0%) |
| Construction | 15 (100.0%) | 0 (0.0%) |
| Manufacturing | 70 (81.4%) | 16 (18.6%) |
| Wholesale Trade | 2 (100.0%) | 0 (0.0%) |
| Retail Trade | 6 (21.4%) | 22 (78.6%) |
| Transportation & Warehousing | 5 (100.0%) | 0 (0.0%) |
| Utilities | 0 (0.0%) | 0 (0.0%) |
| Information | 8 (66.7%) | 4 (33.3%) |
| Finance & Insurance | 6 (46.2%) | 7 (53.8%) |
| Real Estate, Rental & Leasing | 0 (0.0%) | 0 (0.0%) |
| Professional & Scientific | 0 (0.0%) | 20 (100.0%) |
| Enterprise Management | 0 (0.0%) | 0 (0.0%) |
| Administrative & Support | 8 (72.7%) | 3 (27.3%) |
| Educational Services | 0 (0.0%) | 0 (0.0%) |
| Health Care & Social Assistance | 14 (45.2%) | 17 (54.8%) |
| Arts, Entertainment & Recreation | 0 (0.0%) | 0 (0.0%) |
| Accommodation & Food Services | 1 (2.7%) | 36 (97.3%) |
| Public Administration | 2 (100.0%) | 0 (0.0%) |
| Total | 170 (57.1%) | 128 (42.9%) |
Education in Minor Hill
School Enrollment in Minor Hill
The most common levels of schooling among the 173 students in Minor Hill are elementary school (52 | 30.1%), middle school (51 | 29.5%), and high school (27 | 15.6%).
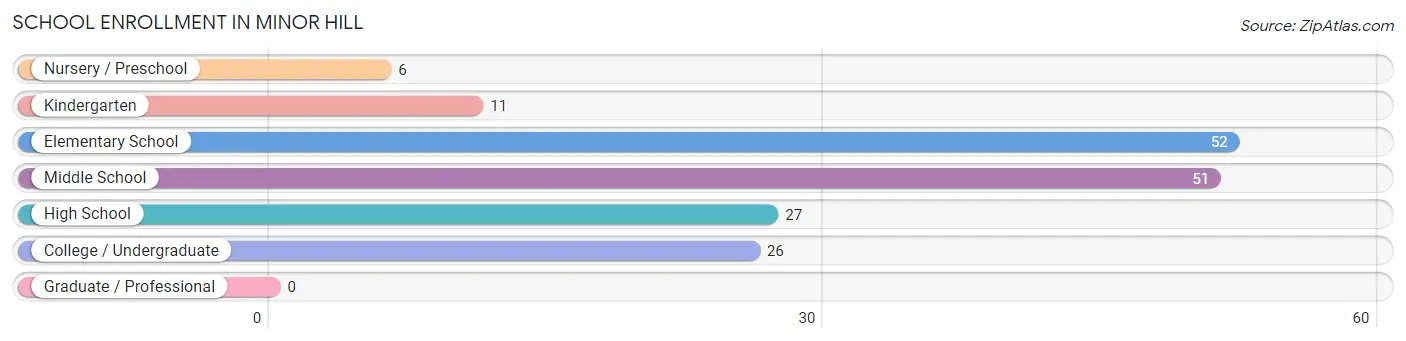
| School Level | # Students | % Students |
| Nursery / Preschool | 6 | 3.5% |
| Kindergarten | 11 | 6.4% |
| Elementary School | 52 | 30.1% |
| Middle School | 51 | 29.5% |
| High School | 27 | 15.6% |
| College / Undergraduate | 26 | 15.0% |
| Graduate / Professional | 0 | 0.0% |
| Total | 173 | 100.0% |
School Enrollment by Age by Funding Source in Minor Hill
Out of a total of 173 students who are enrolled in schools in Minor Hill, 8 (4.6%) attend a private institution, while the remaining 165 (95.4%) are enrolled in public schools. The age group of 5 to 9 year old has the highest likelihood of being enrolled in private schools, with 8 (12.3% in the age bracket) enrolled. Conversely, the age group of 10 to 14 year olds has the lowest likelihood of being enrolled in a private school, with 55 (100.0% in the age bracket) attending a public institution.
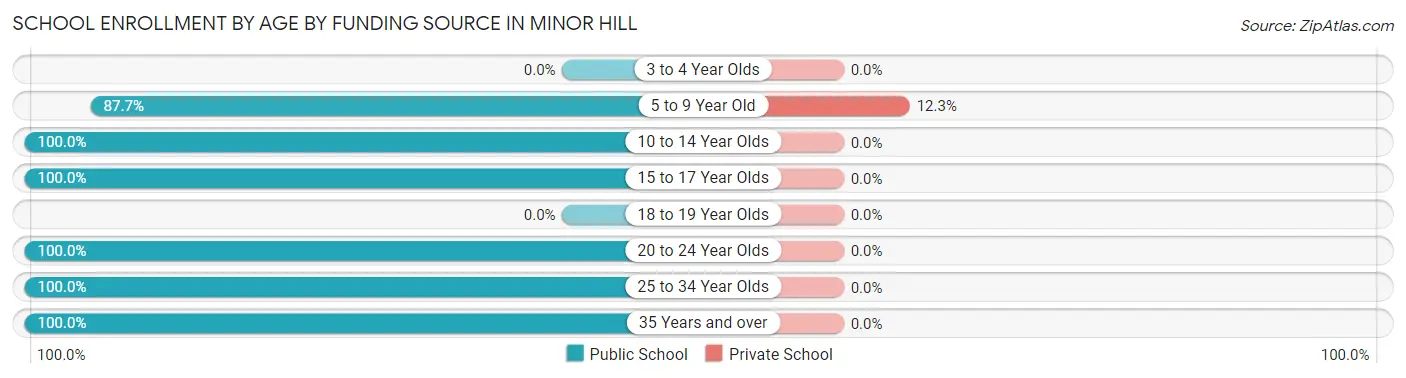
| Age Bracket | Public School | Private School |
| 3 to 4 Year Olds | 0 (0.0%) | 0 (0.0%) |
| 5 to 9 Year Old | 57 (87.7%) | 8 (12.3%) |
| 10 to 14 Year Olds | 55 (100.0%) | 0 (0.0%) |
| 15 to 17 Year Olds | 27 (100.0%) | 0 (0.0%) |
| 18 to 19 Year Olds | 0 (0.0%) | 0 (0.0%) |
| 20 to 24 Year Olds | 8 (100.0%) | 0 (0.0%) |
| 25 to 34 Year Olds | 15 (100.0%) | 0 (0.0%) |
| 35 Years and over | 3 (100.0%) | 0 (0.0%) |
| Total | 165 (95.4%) | 8 (4.6%) |
Educational Attainment by Field of Study in Minor Hill
Bio, nature & agricultural (15 | 37.5%), business (11 | 27.5%), education (11 | 27.5%), science & technology (2 | 5.0%), and liberal arts & history (1 | 2.5%) are the most common fields of study among 40 individuals in Minor Hill who have obtained a bachelor's degree or higher.
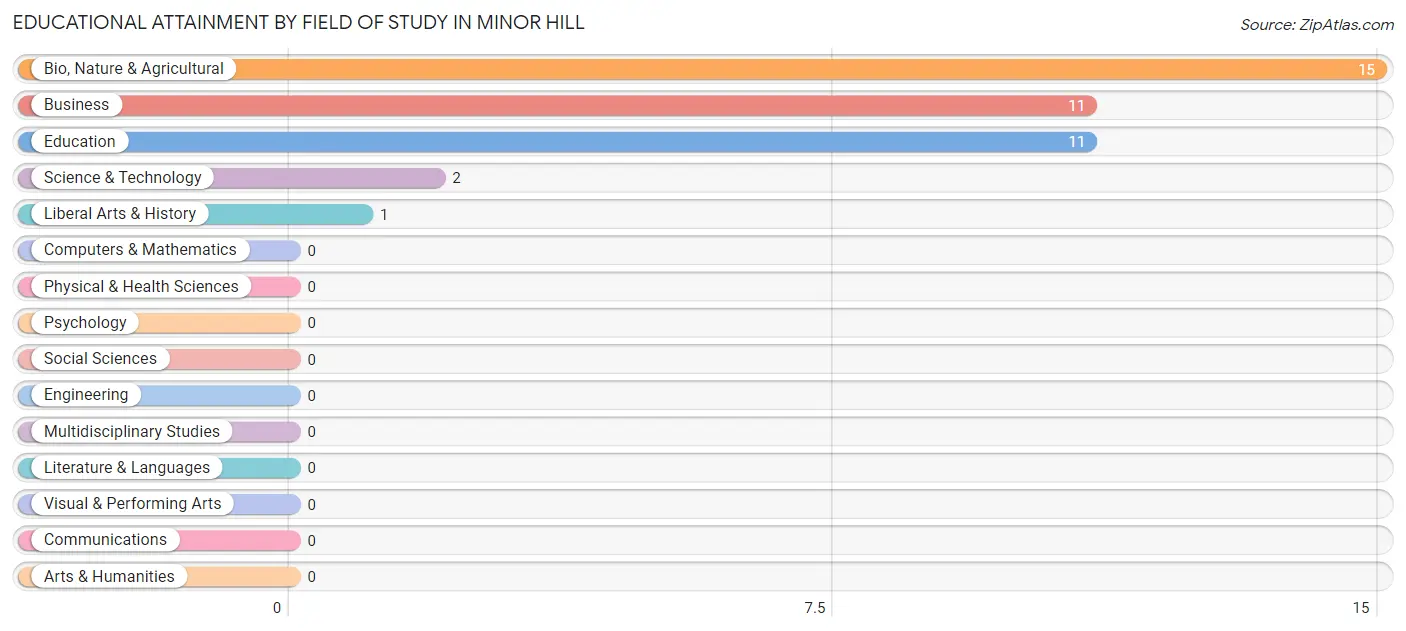
| Field of Study | # Graduates | % Graduates |
| Computers & Mathematics | 0 | 0.0% |
| Bio, Nature & Agricultural | 15 | 37.5% |
| Physical & Health Sciences | 0 | 0.0% |
| Psychology | 0 | 0.0% |
| Social Sciences | 0 | 0.0% |
| Engineering | 0 | 0.0% |
| Multidisciplinary Studies | 0 | 0.0% |
| Science & Technology | 2 | 5.0% |
| Business | 11 | 27.5% |
| Education | 11 | 27.5% |
| Literature & Languages | 0 | 0.0% |
| Liberal Arts & History | 1 | 2.5% |
| Visual & Performing Arts | 0 | 0.0% |
| Communications | 0 | 0.0% |
| Arts & Humanities | 0 | 0.0% |
| Total | 40 | 100.0% |
Transportation & Commute in Minor Hill
Vehicle Availability by Sex in Minor Hill
The most prevalent vehicle ownership categories in Minor Hill are males with 2 vehicles (49, accounting for 28.8%) and females with 2 vehicles (19, making up 42.6%).
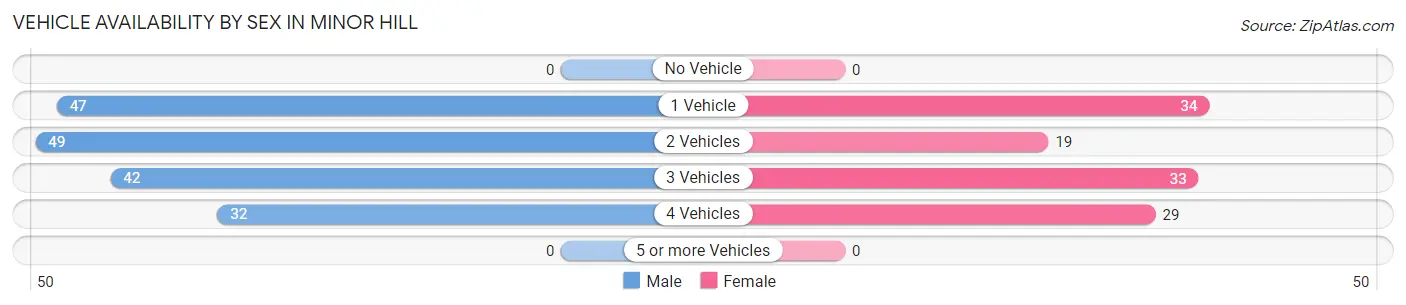
| Vehicles Available | Male | Female |
| No Vehicle | 0 (0.0%) | 0 (0.0%) |
| 1 Vehicle | 47 (27.7%) | 34 (29.6%) |
| 2 Vehicles | 49 (28.8%) | 19 (16.5%) |
| 3 Vehicles | 42 (24.7%) | 33 (28.7%) |
| 4 Vehicles | 32 (18.8%) | 29 (25.2%) |
| 5 or more Vehicles | 0 (0.0%) | 0 (0.0%) |
| Total | 170 (100.0%) | 115 (100.0%) |
Commute Time in Minor Hill
The most frequently occuring commute durations in Minor Hill are 45 to 59 minutes (63 commuters, 23.0%), 20 to 24 minutes (45 commuters, 16.4%), and 10 to 14 minutes (36 commuters, 13.1%).
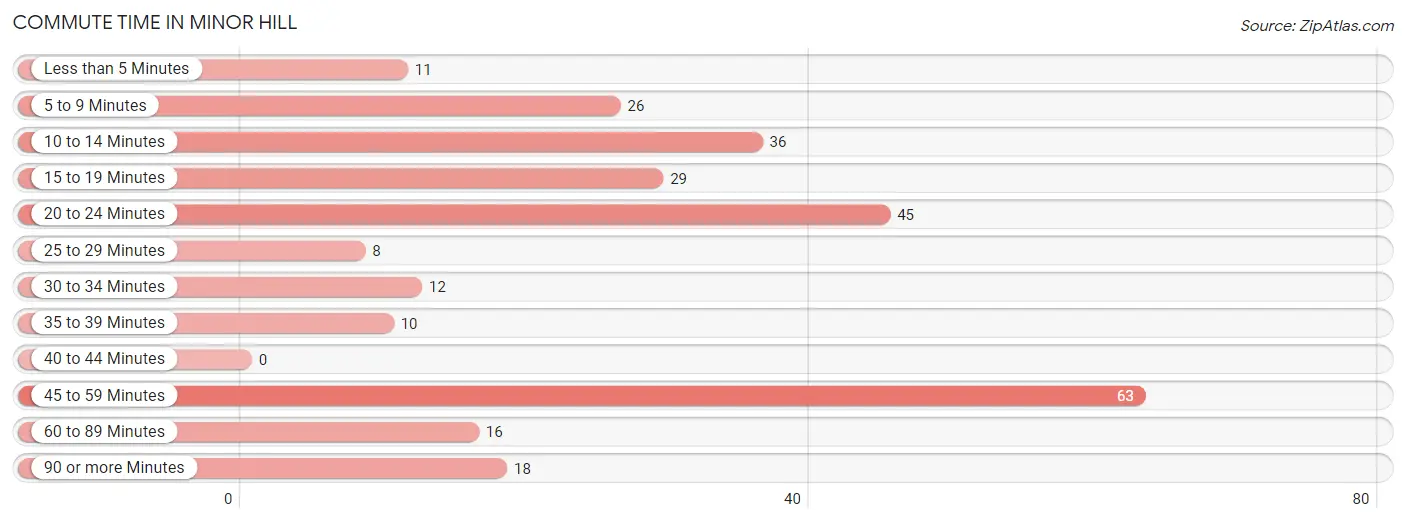
| Commute Time | # Commuters | % Commuters |
| Less than 5 Minutes | 11 | 4.0% |
| 5 to 9 Minutes | 26 | 9.5% |
| 10 to 14 Minutes | 36 | 13.1% |
| 15 to 19 Minutes | 29 | 10.6% |
| 20 to 24 Minutes | 45 | 16.4% |
| 25 to 29 Minutes | 8 | 2.9% |
| 30 to 34 Minutes | 12 | 4.4% |
| 35 to 39 Minutes | 10 | 3.6% |
| 40 to 44 Minutes | 0 | 0.0% |
| 45 to 59 Minutes | 63 | 23.0% |
| 60 to 89 Minutes | 16 | 5.8% |
| 90 or more Minutes | 18 | 6.6% |
Commute Time by Sex in Minor Hill
The most common commute times in Minor Hill are 10 to 14 minutes (36 commuters, 21.2%) for males and 45 to 59 minutes (31 commuters, 29.8%) for females.
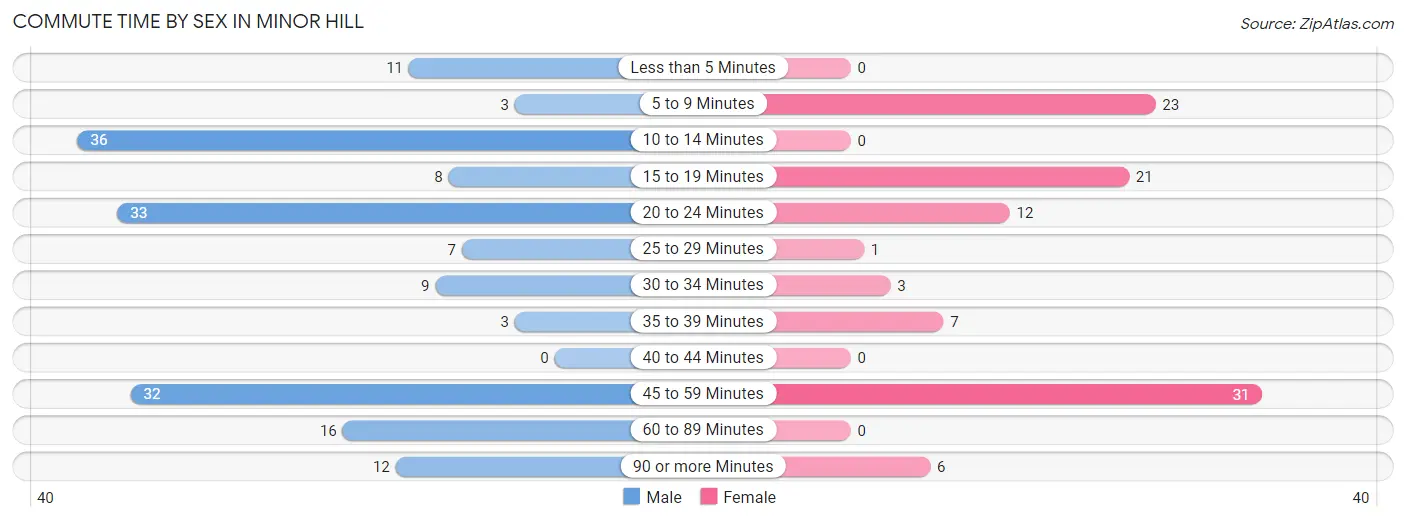
| Commute Time | Male | Female |
| Less than 5 Minutes | 11 (6.5%) | 0 (0.0%) |
| 5 to 9 Minutes | 3 (1.8%) | 23 (22.1%) |
| 10 to 14 Minutes | 36 (21.2%) | 0 (0.0%) |
| 15 to 19 Minutes | 8 (4.7%) | 21 (20.2%) |
| 20 to 24 Minutes | 33 (19.4%) | 12 (11.5%) |
| 25 to 29 Minutes | 7 (4.1%) | 1 (1.0%) |
| 30 to 34 Minutes | 9 (5.3%) | 3 (2.9%) |
| 35 to 39 Minutes | 3 (1.8%) | 7 (6.7%) |
| 40 to 44 Minutes | 0 (0.0%) | 0 (0.0%) |
| 45 to 59 Minutes | 32 (18.8%) | 31 (29.8%) |
| 60 to 89 Minutes | 16 (9.4%) | 0 (0.0%) |
| 90 or more Minutes | 12 (7.1%) | 6 (5.8%) |
Time of Departure to Work by Sex in Minor Hill
The most frequent times of departure to work in Minor Hill are 6:00 AM to 6:29 AM (35, 20.6%) for males and 8:00 AM to 8:29 AM (26, 25.0%) for females.
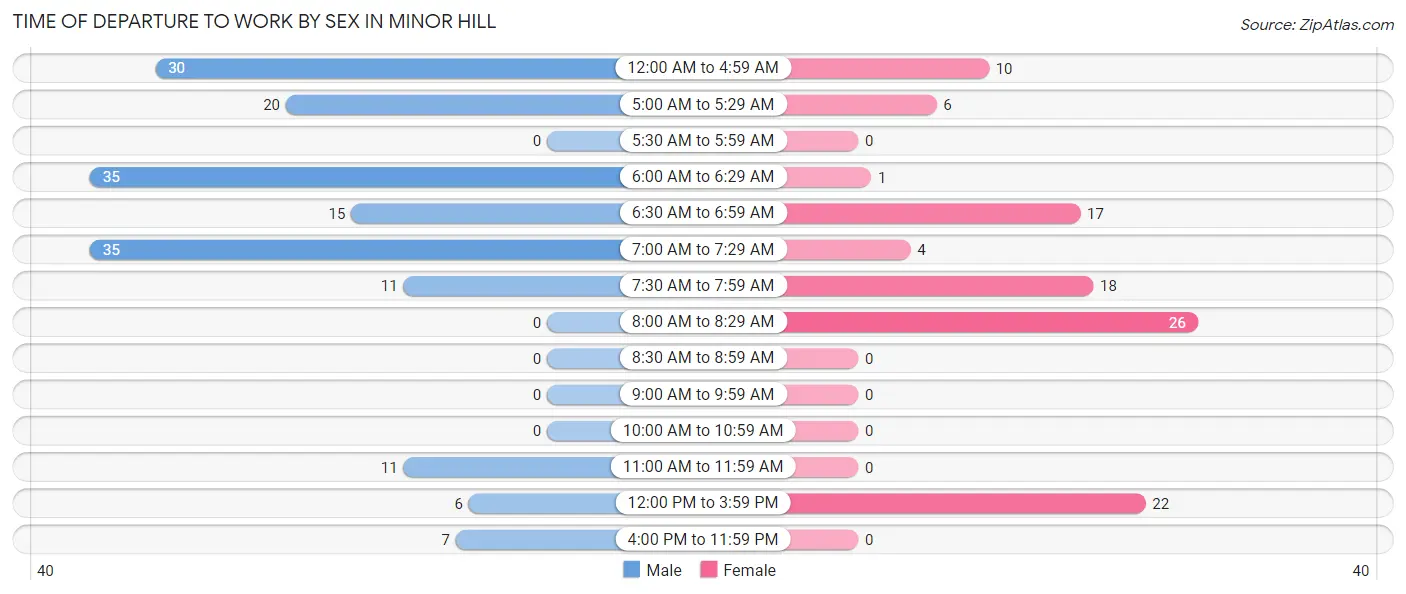
| Time of Departure | Male | Female |
| 12:00 AM to 4:59 AM | 30 (17.6%) | 10 (9.6%) |
| 5:00 AM to 5:29 AM | 20 (11.8%) | 6 (5.8%) |
| 5:30 AM to 5:59 AM | 0 (0.0%) | 0 (0.0%) |
| 6:00 AM to 6:29 AM | 35 (20.6%) | 1 (1.0%) |
| 6:30 AM to 6:59 AM | 15 (8.8%) | 17 (16.4%) |
| 7:00 AM to 7:29 AM | 35 (20.6%) | 4 (3.8%) |
| 7:30 AM to 7:59 AM | 11 (6.5%) | 18 (17.3%) |
| 8:00 AM to 8:29 AM | 0 (0.0%) | 26 (25.0%) |
| 8:30 AM to 8:59 AM | 0 (0.0%) | 0 (0.0%) |
| 9:00 AM to 9:59 AM | 0 (0.0%) | 0 (0.0%) |
| 10:00 AM to 10:59 AM | 0 (0.0%) | 0 (0.0%) |
| 11:00 AM to 11:59 AM | 11 (6.5%) | 0 (0.0%) |
| 12:00 PM to 3:59 PM | 6 (3.5%) | 22 (21.1%) |
| 4:00 PM to 11:59 PM | 7 (4.1%) | 0 (0.0%) |
| Total | 170 (100.0%) | 104 (100.0%) |
Housing Occupancy in Minor Hill
Occupancy by Ownership in Minor Hill
Of the total 225 dwellings in Minor Hill, owner-occupied units account for 109 (48.4%), while renter-occupied units make up 116 (51.6%).
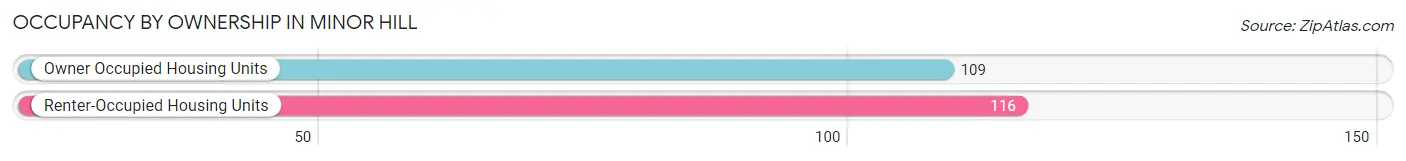
| Occupancy | # Housing Units | % Housing Units |
| Owner Occupied Housing Units | 109 | 48.4% |
| Renter-Occupied Housing Units | 116 | 51.6% |
| Total Occupied Housing Units | 225 | 100.0% |
Occupancy by Household Size in Minor Hill
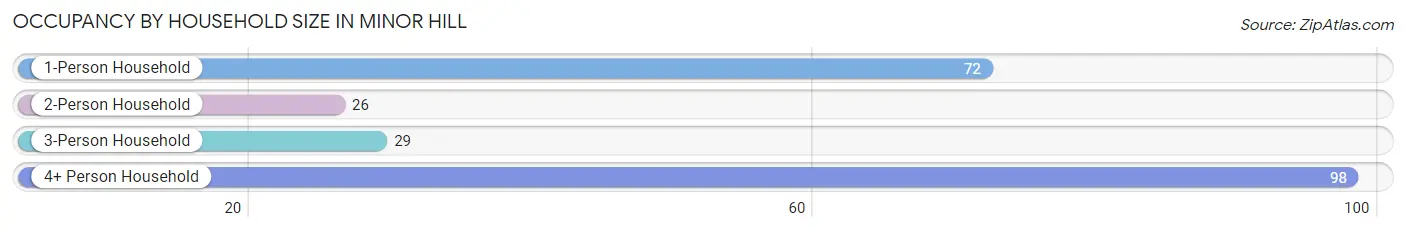
| Household Size | # Housing Units | % Housing Units |
| 1-Person Household | 72 | 32.0% |
| 2-Person Household | 26 | 11.6% |
| 3-Person Household | 29 | 12.9% |
| 4+ Person Household | 98 | 43.6% |
| Total Housing Units | 225 | 100.0% |
Occupancy by Ownership by Household Size in Minor Hill
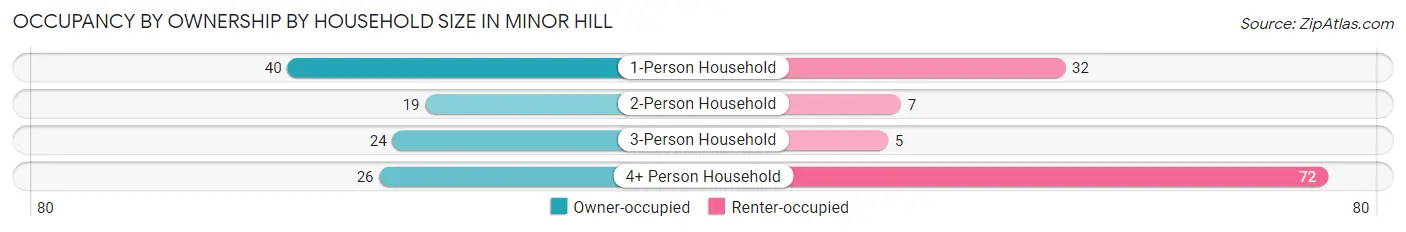
| Household Size | Owner-occupied | Renter-occupied |
| 1-Person Household | 40 (55.6%) | 32 (44.4%) |
| 2-Person Household | 19 (73.1%) | 7 (26.9%) |
| 3-Person Household | 24 (82.8%) | 5 (17.2%) |
| 4+ Person Household | 26 (26.5%) | 72 (73.5%) |
| Total Housing Units | 109 (48.4%) | 116 (51.6%) |
Occupancy by Educational Attainment in Minor Hill
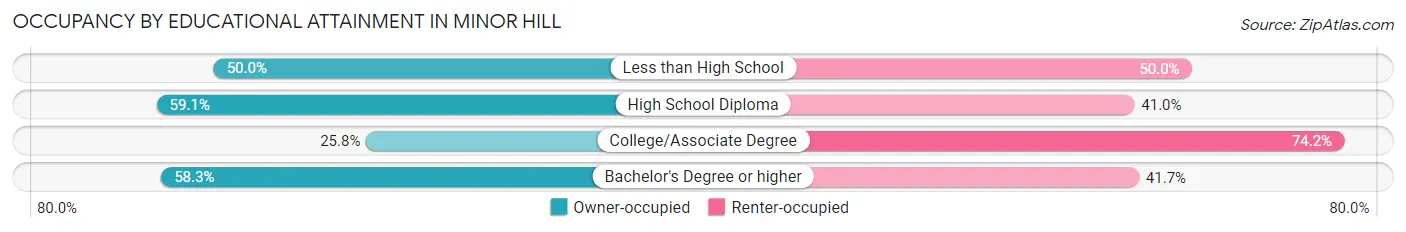
| Household Size | Owner-occupied | Renter-occupied |
| Less than High School | 17 (50.0%) | 17 (50.0%) |
| High School Diploma | 62 (59.1%) | 43 (40.9%) |
| College/Associate Degree | 16 (25.8%) | 46 (74.2%) |
| Bachelor's Degree or higher | 14 (58.3%) | 10 (41.7%) |
Occupancy by Age of Householder in Minor Hill
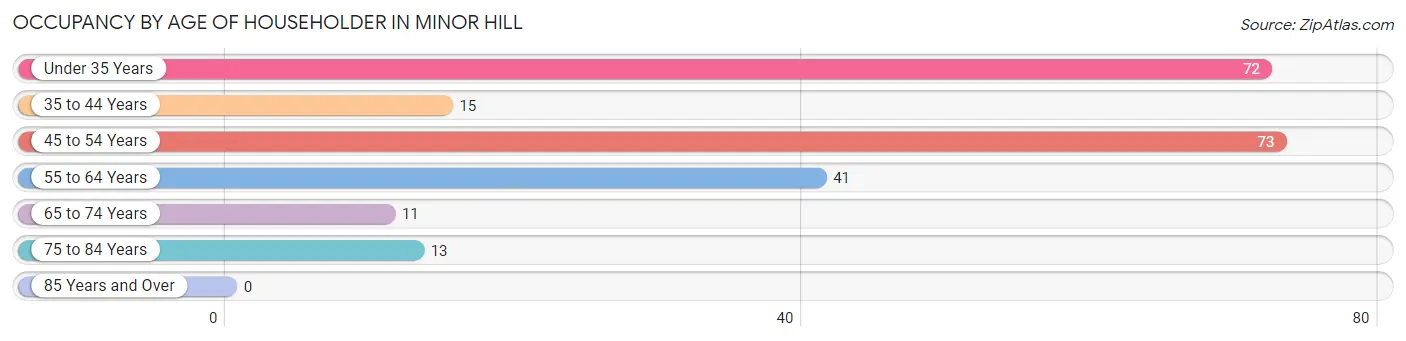
| Age Bracket | # Households | % Households |
| Under 35 Years | 72 | 32.0% |
| 35 to 44 Years | 15 | 6.7% |
| 45 to 54 Years | 73 | 32.4% |
| 55 to 64 Years | 41 | 18.2% |
| 65 to 74 Years | 11 | 4.9% |
| 75 to 84 Years | 13 | 5.8% |
| 85 Years and Over | 0 | 0.0% |
| Total | 225 | 100.0% |
Housing Finances in Minor Hill
Median Income by Occupancy in Minor Hill
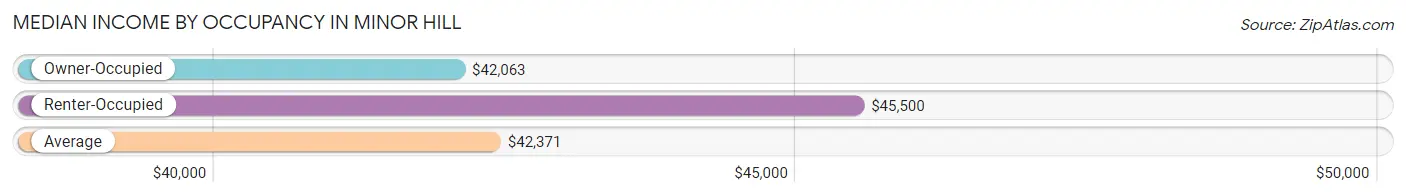
| Occupancy Type | # Households | Median Income |
| Owner-Occupied | 109 (48.4%) | $42,063 |
| Renter-Occupied | 116 (51.6%) | $45,500 |
| Average | 225 (100.0%) | $42,371 |
Occupancy by Householder Income Bracket in Minor Hill
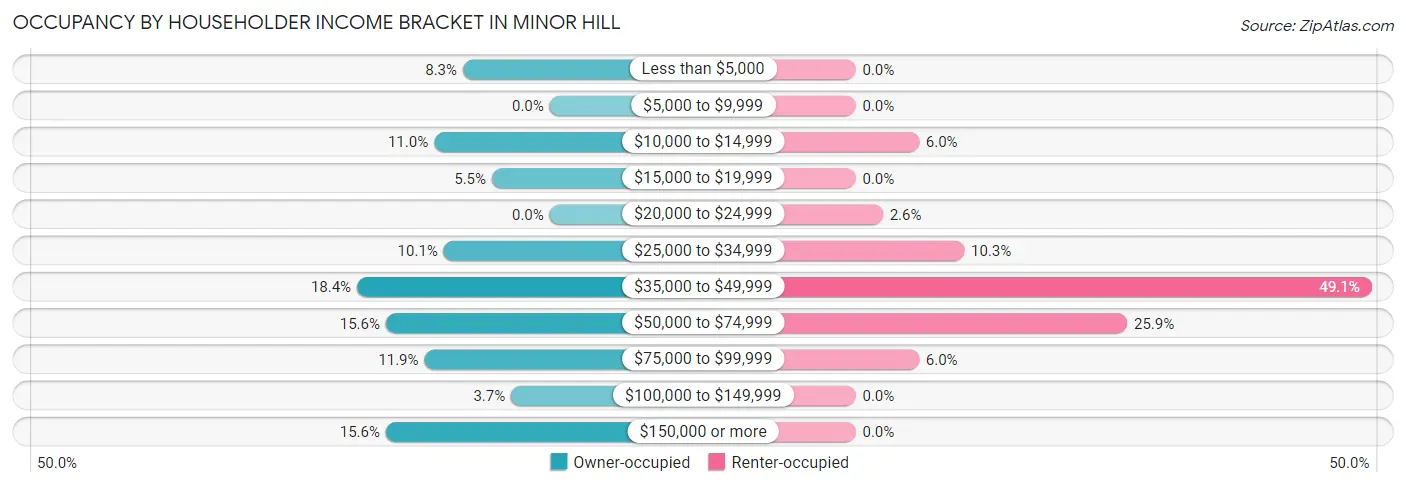
| Income Bracket | Owner-occupied | Renter-occupied |
| Less than $5,000 | 9 (8.3%) | 0 (0.0%) |
| $5,000 to $9,999 | 0 (0.0%) | 0 (0.0%) |
| $10,000 to $14,999 | 12 (11.0%) | 7 (6.0%) |
| $15,000 to $19,999 | 6 (5.5%) | 0 (0.0%) |
| $20,000 to $24,999 | 0 (0.0%) | 3 (2.6%) |
| $25,000 to $34,999 | 11 (10.1%) | 12 (10.3%) |
| $35,000 to $49,999 | 20 (18.3%) | 57 (49.1%) |
| $50,000 to $74,999 | 17 (15.6%) | 30 (25.9%) |
| $75,000 to $99,999 | 13 (11.9%) | 7 (6.0%) |
| $100,000 to $149,999 | 4 (3.7%) | 0 (0.0%) |
| $150,000 or more | 17 (15.6%) | 0 (0.0%) |
| Total | 109 (100.0%) | 116 (100.0%) |
Monthly Housing Cost Tiers in Minor Hill
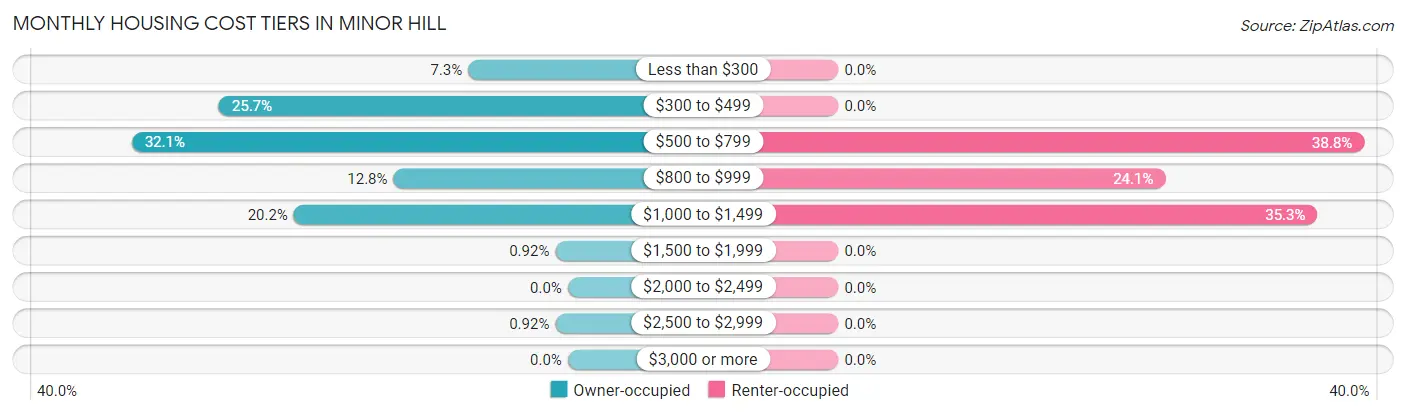
| Monthly Cost | Owner-occupied | Renter-occupied |
| Less than $300 | 8 (7.3%) | 0 (0.0%) |
| $300 to $499 | 28 (25.7%) | 0 (0.0%) |
| $500 to $799 | 35 (32.1%) | 45 (38.8%) |
| $800 to $999 | 14 (12.8%) | 28 (24.1%) |
| $1,000 to $1,499 | 22 (20.2%) | 41 (35.3%) |
| $1,500 to $1,999 | 1 (0.9%) | 0 (0.0%) |
| $2,000 to $2,499 | 0 (0.0%) | 0 (0.0%) |
| $2,500 to $2,999 | 1 (0.9%) | 0 (0.0%) |
| $3,000 or more | 0 (0.0%) | 0 (0.0%) |
| Total | 109 (100.0%) | 116 (100.0%) |
Physical Housing Characteristics in Minor Hill
Housing Structures in Minor Hill
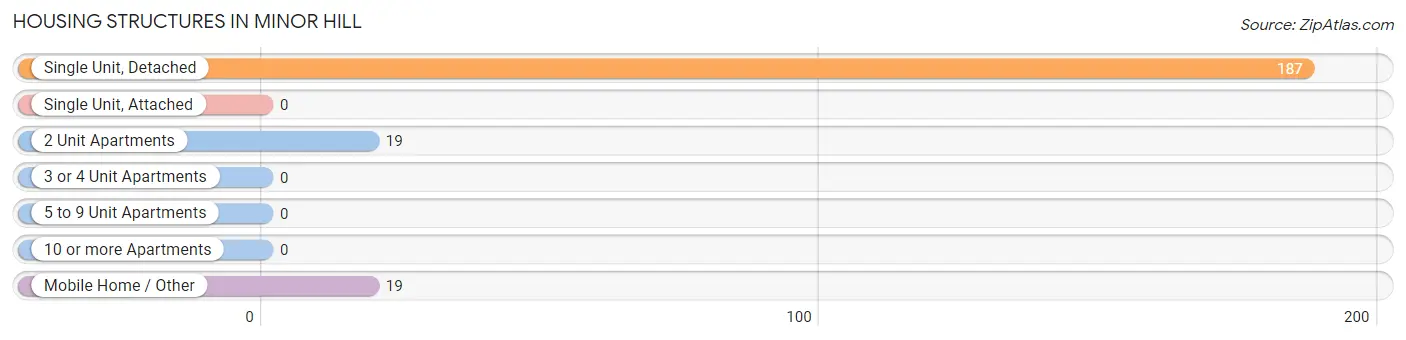
| Structure Type | # Housing Units | % Housing Units |
| Single Unit, Detached | 187 | 83.1% |
| Single Unit, Attached | 0 | 0.0% |
| 2 Unit Apartments | 19 | 8.4% |
| 3 or 4 Unit Apartments | 0 | 0.0% |
| 5 to 9 Unit Apartments | 0 | 0.0% |
| 10 or more Apartments | 0 | 0.0% |
| Mobile Home / Other | 19 | 8.4% |
| Total | 225 | 100.0% |
Housing Structures by Occupancy in Minor Hill
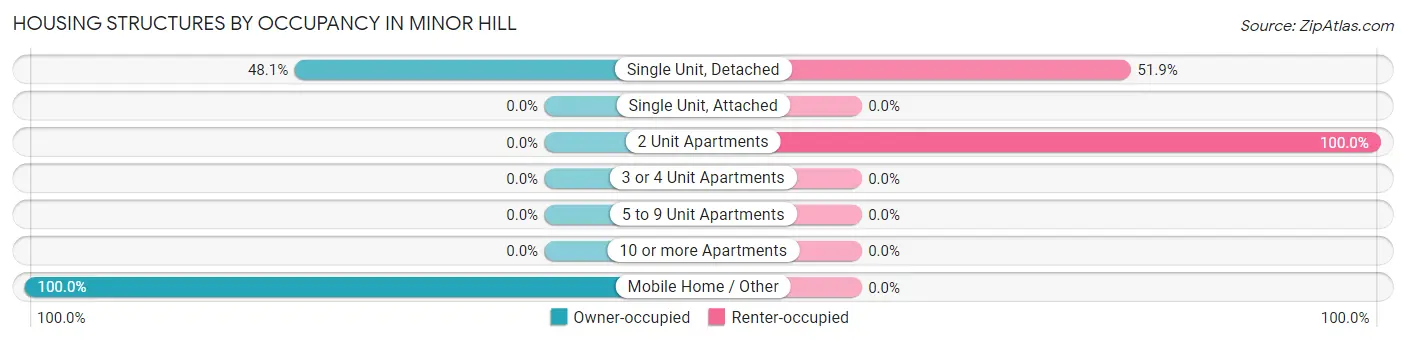
| Structure Type | Owner-occupied | Renter-occupied |
| Single Unit, Detached | 90 (48.1%) | 97 (51.9%) |
| Single Unit, Attached | 0 (0.0%) | 0 (0.0%) |
| 2 Unit Apartments | 0 (0.0%) | 19 (100.0%) |
| 3 or 4 Unit Apartments | 0 (0.0%) | 0 (0.0%) |
| 5 to 9 Unit Apartments | 0 (0.0%) | 0 (0.0%) |
| 10 or more Apartments | 0 (0.0%) | 0 (0.0%) |
| Mobile Home / Other | 19 (100.0%) | 0 (0.0%) |
| Total | 109 (48.4%) | 116 (51.6%) |
Housing Structures by Number of Rooms in Minor Hill
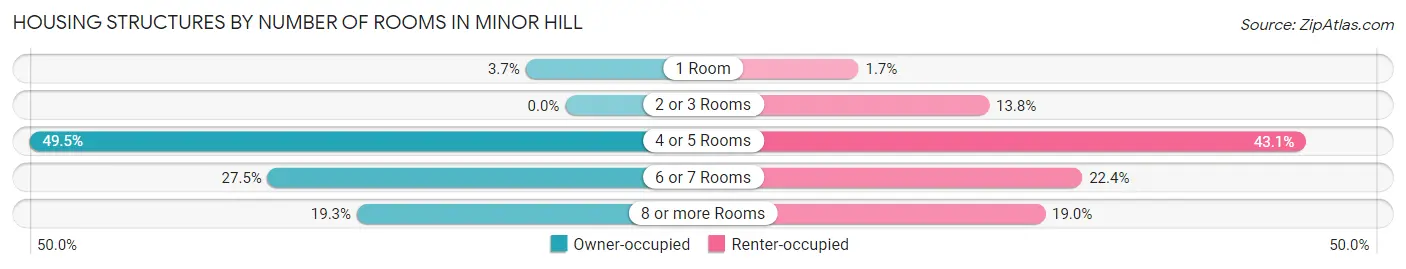
| Number of Rooms | Owner-occupied | Renter-occupied |
| 1 Room | 4 (3.7%) | 2 (1.7%) |
| 2 or 3 Rooms | 0 (0.0%) | 16 (13.8%) |
| 4 or 5 Rooms | 54 (49.5%) | 50 (43.1%) |
| 6 or 7 Rooms | 30 (27.5%) | 26 (22.4%) |
| 8 or more Rooms | 21 (19.3%) | 22 (19.0%) |
| Total | 109 (100.0%) | 116 (100.0%) |
Housing Structure by Heating Type in Minor Hill
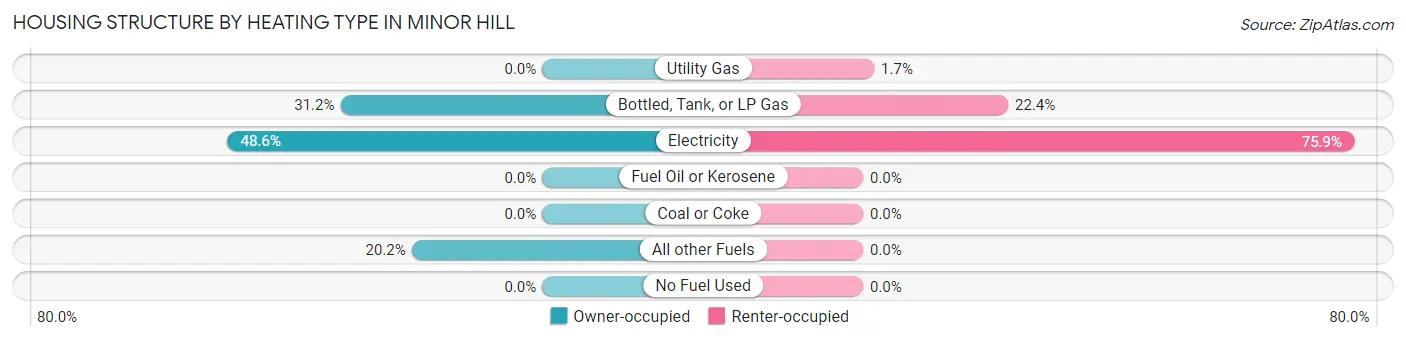
| Heating Type | Owner-occupied | Renter-occupied |
| Utility Gas | 0 (0.0%) | 2 (1.7%) |
| Bottled, Tank, or LP Gas | 34 (31.2%) | 26 (22.4%) |
| Electricity | 53 (48.6%) | 88 (75.9%) |
| Fuel Oil or Kerosene | 0 (0.0%) | 0 (0.0%) |
| Coal or Coke | 0 (0.0%) | 0 (0.0%) |
| All other Fuels | 22 (20.2%) | 0 (0.0%) |
| No Fuel Used | 0 (0.0%) | 0 (0.0%) |
| Total | 109 (100.0%) | 116 (100.0%) |
Household Vehicle Usage in Minor Hill
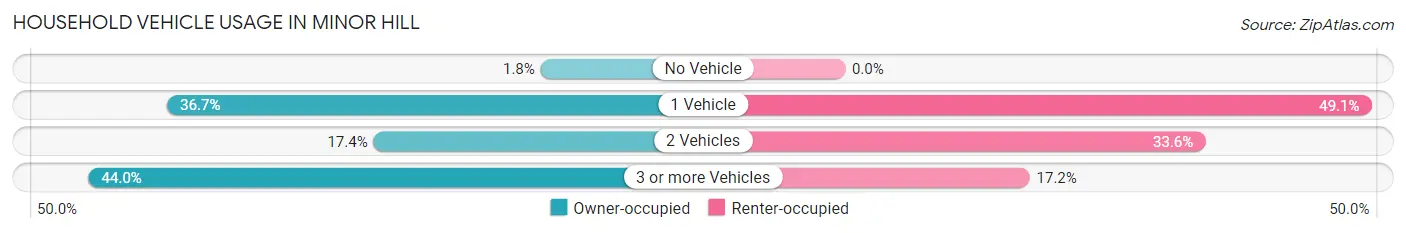
| Vehicles per Household | Owner-occupied | Renter-occupied |
| No Vehicle | 2 (1.8%) | 0 (0.0%) |
| 1 Vehicle | 40 (36.7%) | 57 (49.1%) |
| 2 Vehicles | 19 (17.4%) | 39 (33.6%) |
| 3 or more Vehicles | 48 (44.0%) | 20 (17.2%) |
| Total | 109 (100.0%) | 116 (100.0%) |
Real Estate & Mortgages in Minor Hill
Real Estate and Mortgage Overview in Minor Hill
| Characteristic | Without Mortgage | With Mortgage |
| Housing Units | 65 | 44 |
| Median Property Value | $112,100 | $99,300 |
| Median Household Income | $40,813 | $5 |
| Monthly Housing Costs | $496 | $0 |
| Real Estate Taxes | $761 | $1 |
Property Value by Mortgage Status in Minor Hill
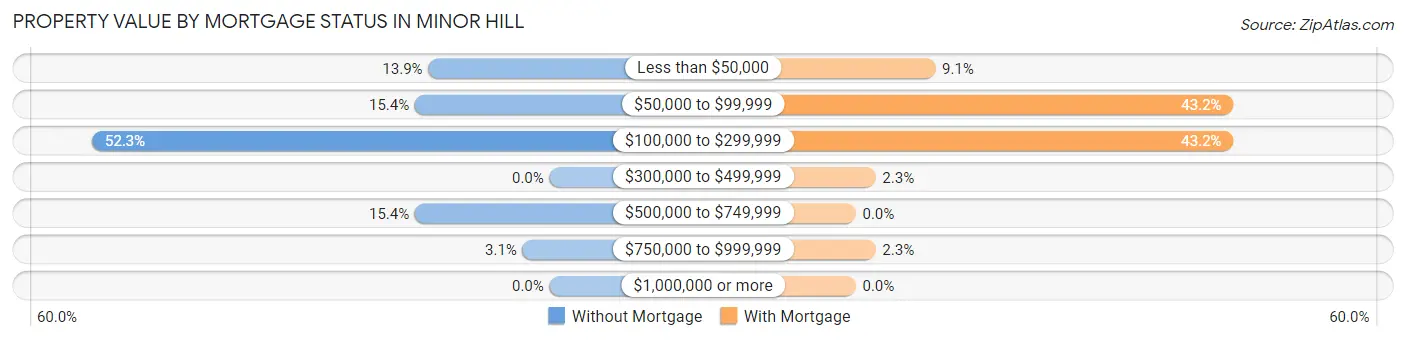
| Property Value | Without Mortgage | With Mortgage |
| Less than $50,000 | 9 (13.9%) | 4 (9.1%) |
| $50,000 to $99,999 | 10 (15.4%) | 19 (43.2%) |
| $100,000 to $299,999 | 34 (52.3%) | 19 (43.2%) |
| $300,000 to $499,999 | 0 (0.0%) | 1 (2.3%) |
| $500,000 to $749,999 | 10 (15.4%) | 0 (0.0%) |
| $750,000 to $999,999 | 2 (3.1%) | 1 (2.3%) |
| $1,000,000 or more | 0 (0.0%) | 0 (0.0%) |
| Total | 65 (100.0%) | 44 (100.0%) |
Household Income by Mortgage Status in Minor Hill
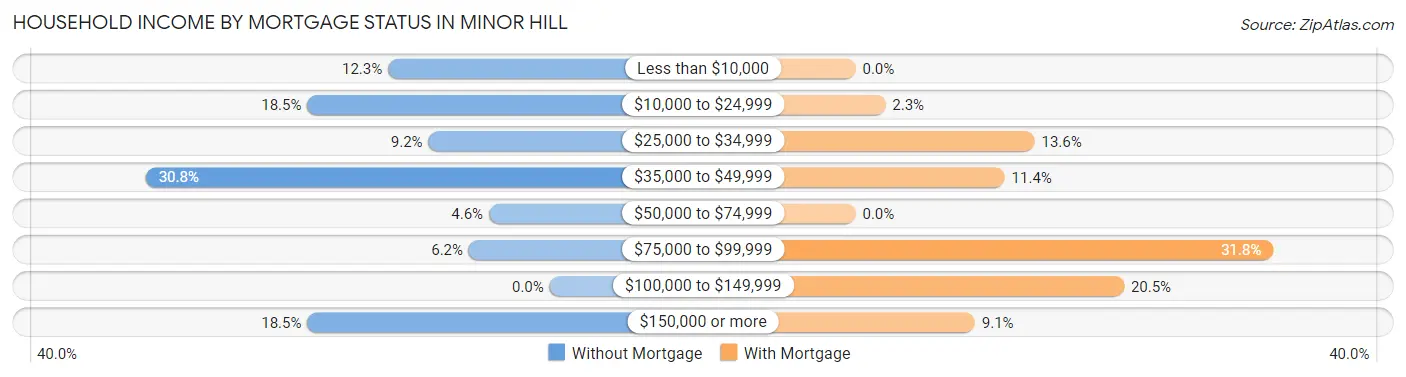
| Household Income | Without Mortgage | With Mortgage |
| Less than $10,000 | 8 (12.3%) | 0 (0.0%) |
| $10,000 to $24,999 | 12 (18.5%) | 1 (2.3%) |
| $25,000 to $34,999 | 6 (9.2%) | 6 (13.6%) |
| $35,000 to $49,999 | 20 (30.8%) | 5 (11.4%) |
| $50,000 to $74,999 | 3 (4.6%) | 0 (0.0%) |
| $75,000 to $99,999 | 4 (6.1%) | 14 (31.8%) |
| $100,000 to $149,999 | 0 (0.0%) | 9 (20.4%) |
| $150,000 or more | 12 (18.5%) | 4 (9.1%) |
| Total | 65 (100.0%) | 44 (100.0%) |
Property Value to Household Income Ratio in Minor Hill
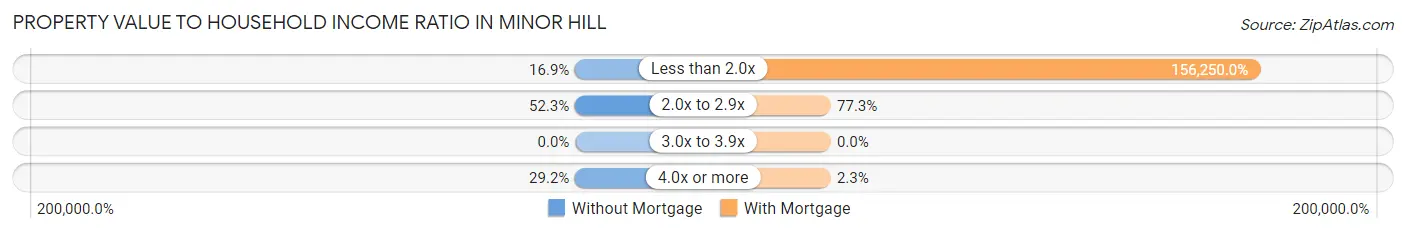
| Value-to-Income Ratio | Without Mortgage | With Mortgage |
| Less than 2.0x | 11 (16.9%) | 68,750 (156,250.0%) |
| 2.0x to 2.9x | 34 (52.3%) | 34 (77.3%) |
| 3.0x to 3.9x | 0 (0.0%) | 0 (0.0%) |
| 4.0x or more | 19 (29.2%) | 1 (2.3%) |
| Total | 65 (100.0%) | 44 (100.0%) |
Real Estate Taxes by Mortgage Status in Minor Hill
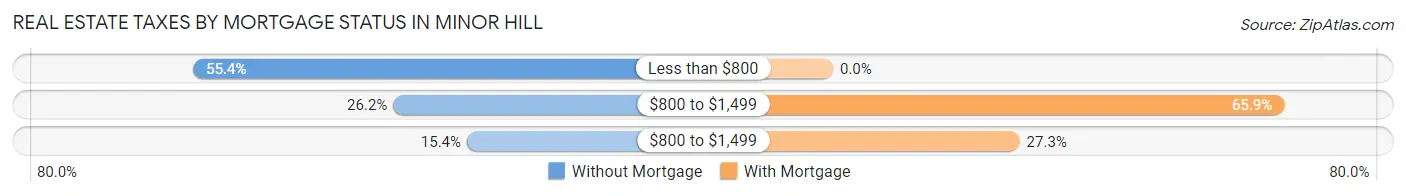
| Property Taxes | Without Mortgage | With Mortgage |
| Less than $800 | 36 (55.4%) | 0 (0.0%) |
| $800 to $1,499 | 17 (26.2%) | 29 (65.9%) |
| $800 to $1,499 | 10 (15.4%) | 12 (27.3%) |
| Total | 65 (100.0%) | 44 (100.0%) |
Health & Disability in Minor Hill
Health Insurance Coverage by Age in Minor Hill
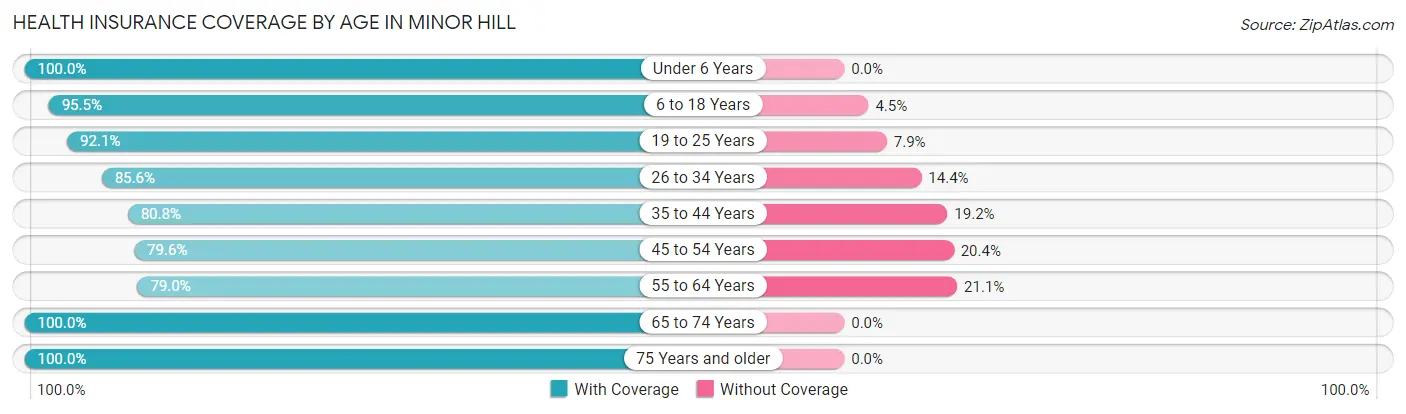
| Age Bracket | With Coverage | Without Coverage |
| Under 6 Years | 138 (100.0%) | 0 (0.0%) |
| 6 to 18 Years | 127 (95.5%) | 6 (4.5%) |
| 19 to 25 Years | 58 (92.1%) | 5 (7.9%) |
| 26 to 34 Years | 125 (85.6%) | 21 (14.4%) |
| 35 to 44 Years | 21 (80.8%) | 5 (19.2%) |
| 45 to 54 Years | 78 (79.6%) | 20 (20.4%) |
| 55 to 64 Years | 45 (78.9%) | 12 (21.0%) |
| 65 to 74 Years | 27 (100.0%) | 0 (0.0%) |
| 75 Years and older | 19 (100.0%) | 0 (0.0%) |
| Total | 638 (90.2%) | 69 (9.8%) |
Health Insurance Coverage by Citizenship Status in Minor Hill
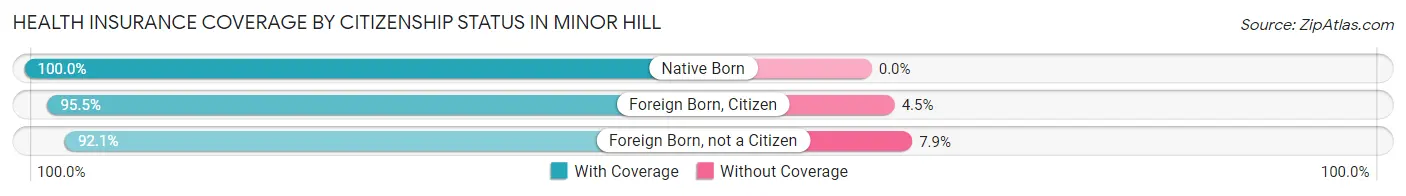
| Citizenship Status | With Coverage | Without Coverage |
| Native Born | 138 (100.0%) | 0 (0.0%) |
| Foreign Born, Citizen | 127 (95.5%) | 6 (4.5%) |
| Foreign Born, not a Citizen | 58 (92.1%) | 5 (7.9%) |
Health Insurance Coverage by Household Income in Minor Hill
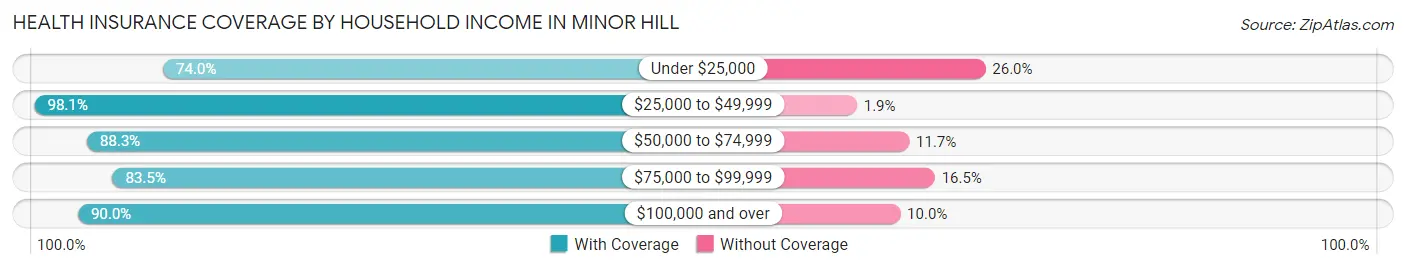
| Household Income | With Coverage | Without Coverage |
| Under $25,000 | 77 (74.0%) | 27 (26.0%) |
| $25,000 to $49,999 | 315 (98.1%) | 6 (1.9%) |
| $50,000 to $74,999 | 121 (88.3%) | 16 (11.7%) |
| $75,000 to $99,999 | 71 (83.5%) | 14 (16.5%) |
| $100,000 and over | 54 (90.0%) | 6 (10.0%) |
Public vs Private Health Insurance Coverage by Age in Minor Hill
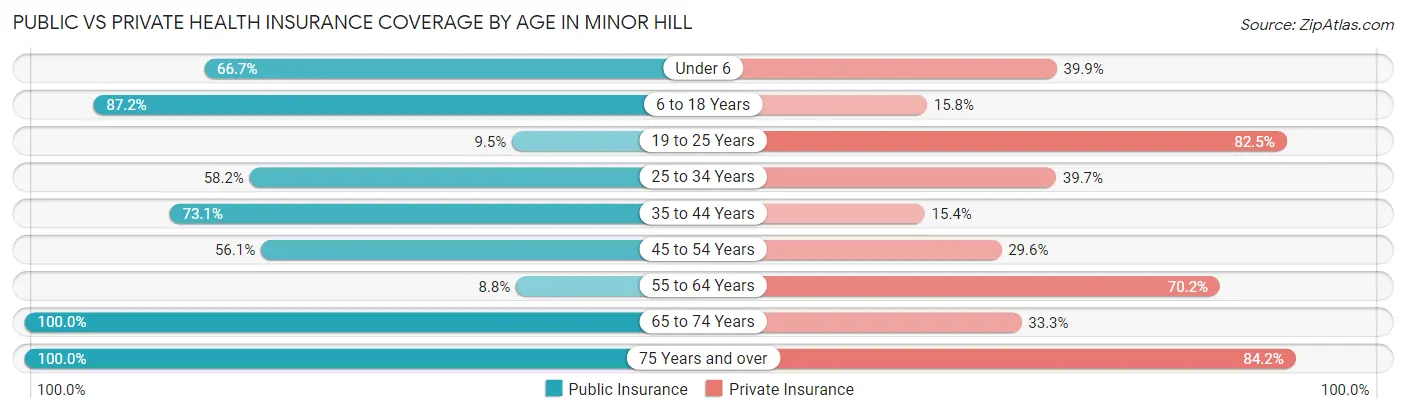
| Age Bracket | Public Insurance | Private Insurance |
| Under 6 | 92 (66.7%) | 55 (39.9%) |
| 6 to 18 Years | 116 (87.2%) | 21 (15.8%) |
| 19 to 25 Years | 6 (9.5%) | 52 (82.5%) |
| 25 to 34 Years | 85 (58.2%) | 58 (39.7%) |
| 35 to 44 Years | 19 (73.1%) | 4 (15.4%) |
| 45 to 54 Years | 55 (56.1%) | 29 (29.6%) |
| 55 to 64 Years | 5 (8.8%) | 40 (70.2%) |
| 65 to 74 Years | 27 (100.0%) | 9 (33.3%) |
| 75 Years and over | 19 (100.0%) | 16 (84.2%) |
| Total | 424 (60.0%) | 284 (40.2%) |
Disability Status by Sex by Age in Minor Hill
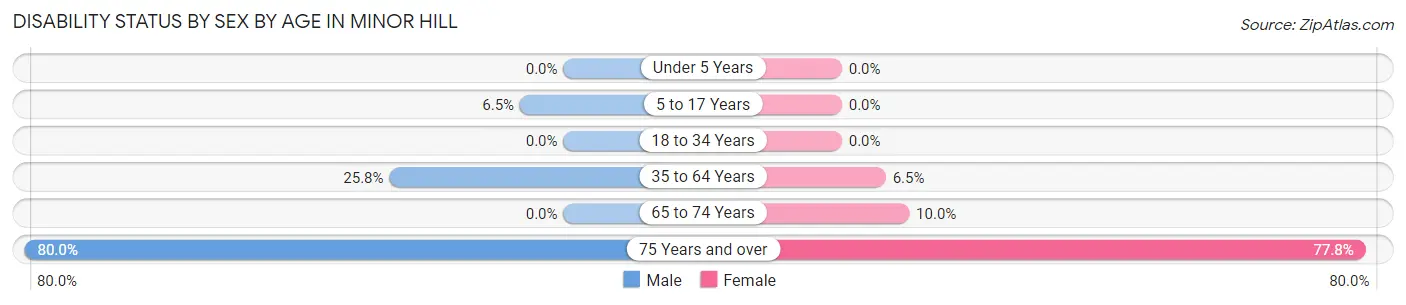
| Age Bracket | Male | Female |
| Under 5 Years | 0 (0.0%) | 0 (0.0%) |
| 5 to 17 Years | 4 (6.5%) | 0 (0.0%) |
| 18 to 34 Years | 0 (0.0%) | 0 (0.0%) |
| 35 to 64 Years | 23 (25.8%) | 6 (6.5%) |
| 65 to 74 Years | 0 (0.0%) | 1 (10.0%) |
| 75 Years and over | 8 (80.0%) | 7 (77.8%) |
Disability Class by Sex by Age in Minor Hill
Disability Class: Hearing Difficulty
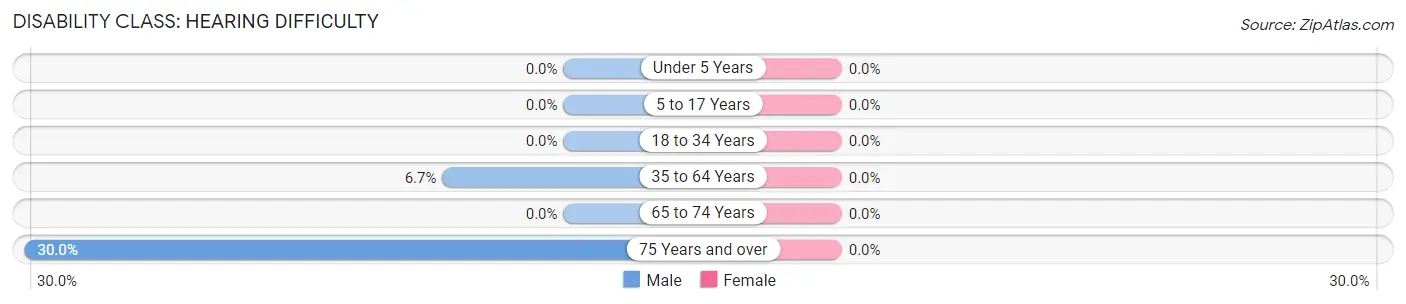
| Age Bracket | Male | Female |
| Under 5 Years | 0 (0.0%) | 0 (0.0%) |
| 5 to 17 Years | 0 (0.0%) | 0 (0.0%) |
| 18 to 34 Years | 0 (0.0%) | 0 (0.0%) |
| 35 to 64 Years | 6 (6.7%) | 0 (0.0%) |
| 65 to 74 Years | 0 (0.0%) | 0 (0.0%) |
| 75 Years and over | 3 (30.0%) | 0 (0.0%) |
Disability Class: Vision Difficulty
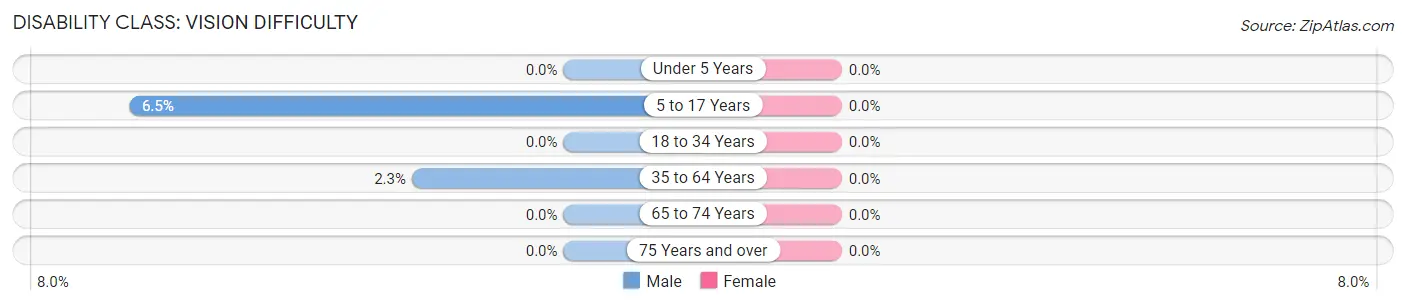
| Age Bracket | Male | Female |
| Under 5 Years | 0 (0.0%) | 0 (0.0%) |
| 5 to 17 Years | 4 (6.5%) | 0 (0.0%) |
| 18 to 34 Years | 0 (0.0%) | 0 (0.0%) |
| 35 to 64 Years | 2 (2.2%) | 0 (0.0%) |
| 65 to 74 Years | 0 (0.0%) | 0 (0.0%) |
| 75 Years and over | 0 (0.0%) | 0 (0.0%) |
Disability Class: Cognitive Difficulty

| Age Bracket | Male | Female |
| 5 to 17 Years | 0 (0.0%) | 0 (0.0%) |
| 18 to 34 Years | 0 (0.0%) | 0 (0.0%) |
| 35 to 64 Years | 8 (9.0%) | 3 (3.3%) |
| 65 to 74 Years | 0 (0.0%) | 0 (0.0%) |
| 75 Years and over | 0 (0.0%) | 2 (22.2%) |
Disability Class: Ambulatory Difficulty
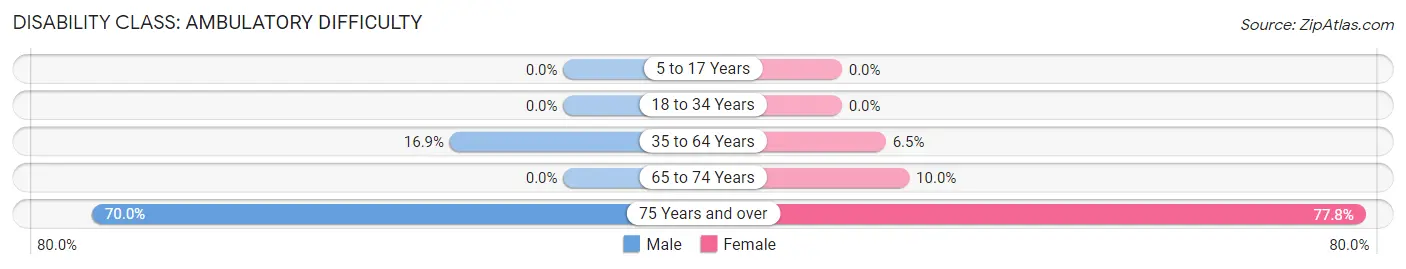
| Age Bracket | Male | Female |
| 5 to 17 Years | 0 (0.0%) | 0 (0.0%) |
| 18 to 34 Years | 0 (0.0%) | 0 (0.0%) |
| 35 to 64 Years | 15 (16.9%) | 6 (6.5%) |
| 65 to 74 Years | 0 (0.0%) | 1 (10.0%) |
| 75 Years and over | 7 (70.0%) | 7 (77.8%) |
Disability Class: Self-Care Difficulty
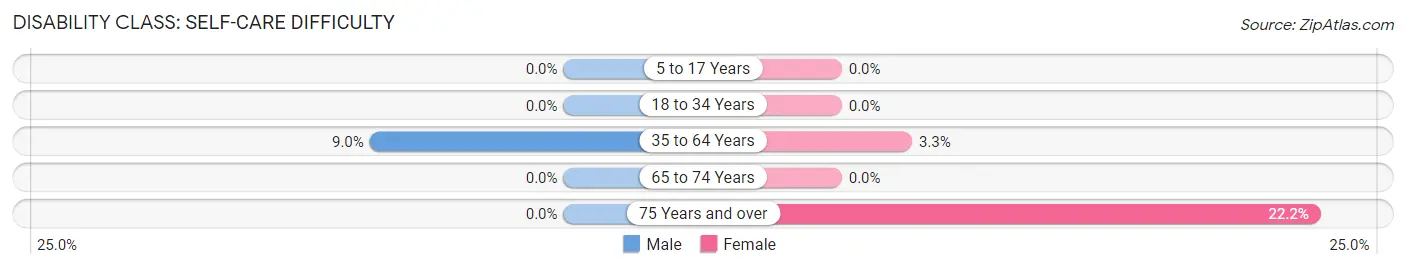
| Age Bracket | Male | Female |
| 5 to 17 Years | 0 (0.0%) | 0 (0.0%) |
| 18 to 34 Years | 0 (0.0%) | 0 (0.0%) |
| 35 to 64 Years | 8 (9.0%) | 3 (3.3%) |
| 65 to 74 Years | 0 (0.0%) | 0 (0.0%) |
| 75 Years and over | 0 (0.0%) | 2 (22.2%) |
Technology Access in Minor Hill
Computing Device Access in Minor Hill
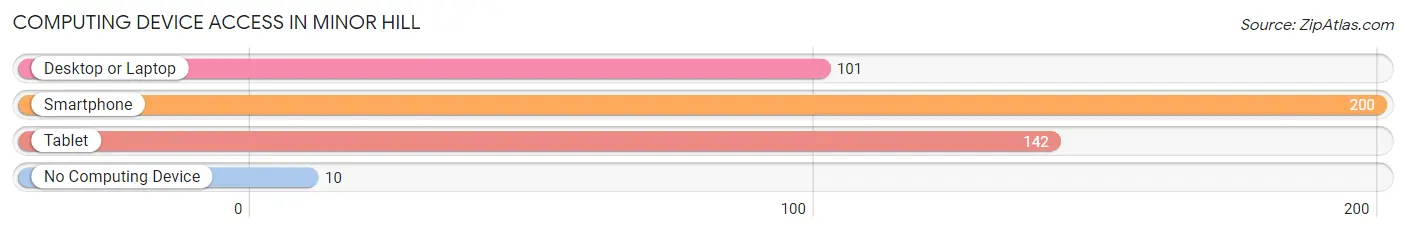
| Device Type | # Households | % Households |
| Desktop or Laptop | 101 | 44.9% |
| Smartphone | 200 | 88.9% |
| Tablet | 142 | 63.1% |
| No Computing Device | 10 | 4.4% |
| Total | 225 | 100.0% |
Internet Access in Minor Hill
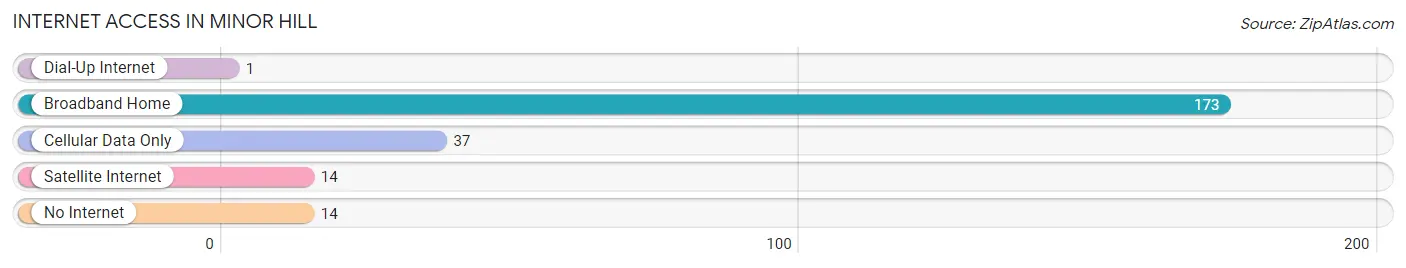
| Internet Type | # Households | % Households |
| Dial-Up Internet | 1 | 0.4% |
| Broadband Home | 173 | 76.9% |
| Cellular Data Only | 37 | 16.4% |
| Satellite Internet | 14 | 6.2% |
| No Internet | 14 | 6.2% |
| Total | 225 | 100.0% |
Minor Hill Summary
Introduction
Minor Hill is a small town located in Giles County, Tennessee. It is situated in the foothills of the Appalachian Mountains and is home to a population of just over 1,000 people. The town is known for its rural charm and its close proximity to the Tennessee River. The town has a rich history, a diverse geography, a thriving economy, and a unique demographic makeup.
History
Minor Hill was founded in 1820 by a group of settlers from North Carolina. The town was named after a local landowner, William Minor, who owned a large tract of land in the area. The town quickly grew and became a center of commerce and industry in the region. In the late 19th century, the town was home to several mills, a cotton gin, and a railroad line.
The town was also home to a number of churches, including the Minor Hill Methodist Church, which was founded in 1845. The church is still active today and is a popular tourist attraction.
In the early 20th century, Minor Hill was a popular destination for tourists, who came to enjoy the town’s rural charm and its proximity to the Tennessee River. The town was also home to a number of resorts, including the Minor Hill Hotel, which was built in the 1920s.
Geography
Minor Hill is located in the foothills of the Appalachian Mountains in Giles County, Tennessee. The town is situated on the banks of the Tennessee River and is surrounded by rolling hills and lush forests. The town is located approximately 30 miles south of Nashville and is easily accessible by car or train.
The town is home to a number of parks and recreational areas, including Minor Hill Park, which is located on the banks of the Tennessee River. The park features a playground, picnic areas, and a walking trail.
Economy
Minor Hill is home to a thriving economy. The town is home to a number of businesses, including a grocery store, a hardware store, and a number of restaurants. The town is also home to a number of manufacturing companies, including a furniture factory and a textile mill.
The town is also home to a number of tourist attractions, including the Minor Hill Hotel and the Minor Hill Methodist Church. The town is also home to a number of festivals and events, including the Minor Hill Music Festival, which is held every summer.
Demographics
Minor Hill is home to a population of just over 1,000 people. The town is predominantly white, with a small African American population. The town is also home to a number of immigrants, including a large Hispanic population. The town has a median household income of $35,000 and a poverty rate of 17%.
Conclusion
Minor Hill is a small town located in Giles County, Tennessee. The town is known for its rural charm and its close proximity to the Tennessee River. The town has a rich history, a diverse geography, a thriving economy, and a unique demographic makeup. The town is home to a number of businesses, tourist attractions, and festivals, making it a great place to live and visit.
Common Questions
What is Per Capita Income in Minor Hill?
Per Capita income in Minor Hill is $24,219.
What is the Median Family Income in Minor Hill?
Median Family Income in Minor Hill is $44,500.
What is the Median Household income in Minor Hill?
Median Household Income in Minor Hill is $42,371.
What is Inequality or Gini Index in Minor Hill?
Inequality or Gini Index in Minor Hill is 0.49.
What is the Total Population of Minor Hill?
Total Population of Minor Hill is 707.
What is the Total Male Population of Minor Hill?
Total Male Population of Minor Hill is 333.
What is the Total Female Population of Minor Hill?
Total Female Population of Minor Hill is 374.
What is the Ratio of Males per 100 Females in Minor Hill?
There are 89.04 Males per 100 Females in Minor Hill.
What is the Ratio of Females per 100 Males in Minor Hill?
There are 112.31 Females per 100 Males in Minor Hill.
What is the Median Population Age in Minor Hill?
Median Population Age in Minor Hill is 27.4 Years.
What is the Average Family Size in Minor Hill
Average Family Size in Minor Hill is 4.0 People.
What is the Average Household Size in Minor Hill
Average Household Size in Minor Hill is 3.1 People.
How Large is the Labor Force in Minor Hill?
There are 309 People in the Labor Forcein in Minor Hill.
What is the Percentage of People in the Labor Force in Minor Hill?
67.9% of People are in the Labor Force in Minor Hill.
What is the Unemployment Rate in Minor Hill?
Unemployment Rate in Minor Hill is 3.6%.