Mascot, TN Map & Demographics
Mascot Map
Mascot Overview
$27,314
PER CAPITA INCOME
$70,313
AVG FAMILY INCOME
$44,955
AVG HOUSEHOLD INCOME
16.5%
WAGE / INCOME GAP [ % ]
83.5¢/ $1
WAGE / INCOME GAP [ $ ]
0.38
INEQUALITY / GINI INDEX
2,715
TOTAL POPULATION
1,394
MALE POPULATION
1,321
FEMALE POPULATION
105.53
MALES / 100 FEMALES
94.76
FEMALES / 100 MALES
44.8
MEDIAN AGE
2.9
AVG FAMILY SIZE
2.4
AVG HOUSEHOLD SIZE
1,357
LABOR FORCE [ PEOPLE ]
59.5%
PERCENT IN LABOR FORCE
4.2%
UNEMPLOYMENT RATE
Mascot Zip Codes
Mascot Area Codes
Income in Mascot
Income Overview in Mascot
Per Capita Income in Mascot is $27,314, while median incomes of families and households are $70,313 and $44,955 respectively.
| Characteristic | Number | Measure |
| Per Capita Income | 2,715 | $27,314 |
| Median Family Income | 756 | $70,313 |
| Mean Family Income | 756 | $74,767 |
| Median Household Income | 1,132 | $44,955 |
| Mean Household Income | 1,132 | $63,628 |
| Income Deficit | 756 | $0 |
| Wage / Income Gap (%) | 2,715 | 16.54% |
| Wage / Income Gap ($) | 2,715 | 83.46¢ per $1 |
| Gini / Inequality Index | 2,715 | 0.38 |
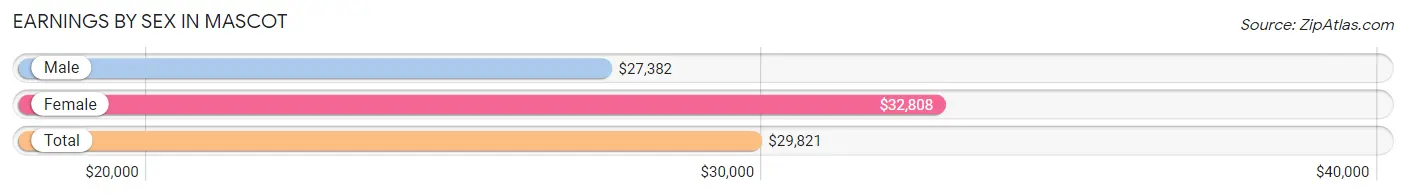
Earnings by Sex in Mascot
Average Earnings in Mascot are $29,821, $27,382 for men and $32,808 for women, a difference of 16.5%.
| Sex | Number | Average Earnings |
| Male | 755 (54.6%) | $27,382 |
| Female | 627 (45.4%) | $32,808 |
| Total | 1,382 (100.0%) | $29,821 |
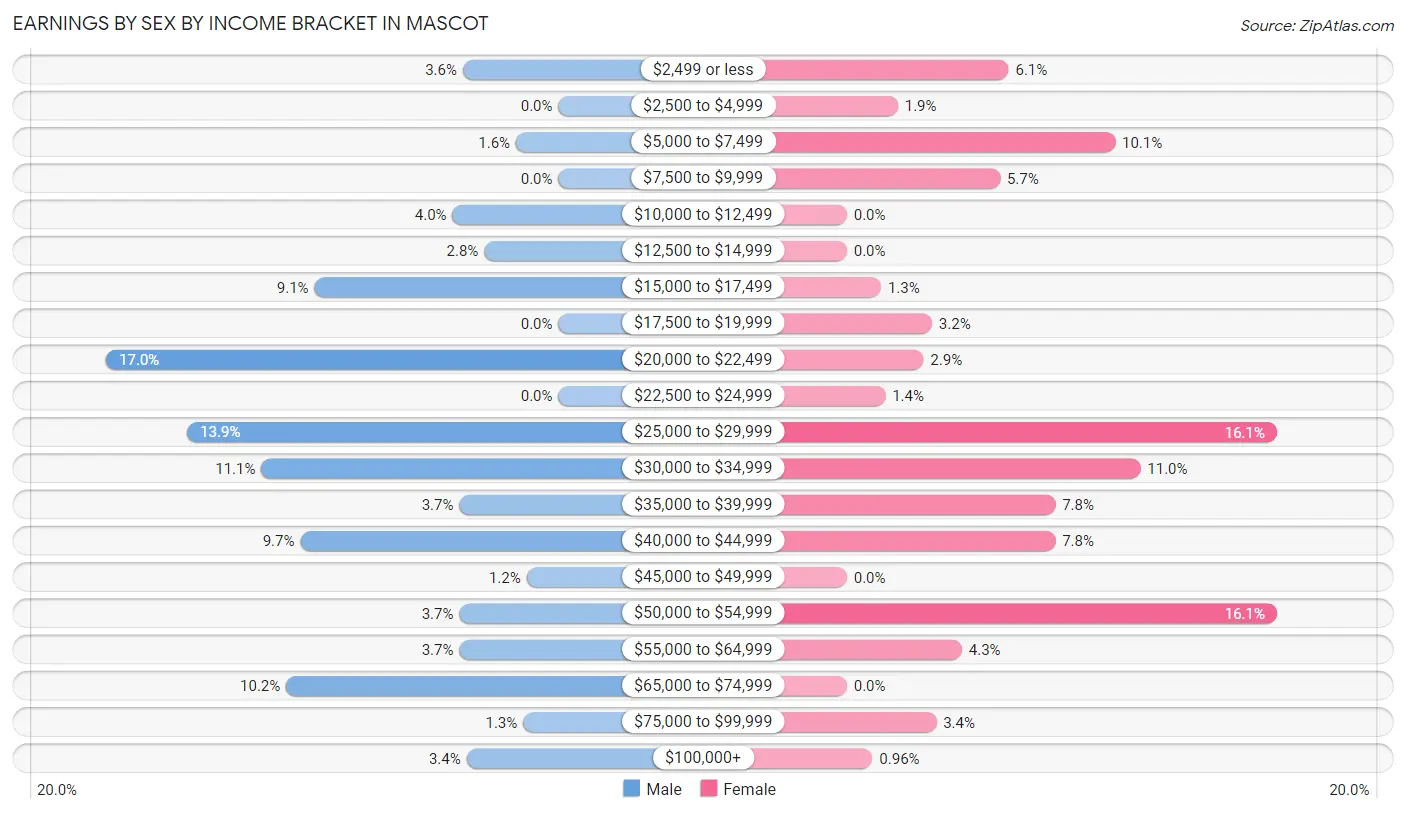
Earnings by Sex by Income Bracket in Mascot
The most common earnings brackets in Mascot are $20,000 to $22,499 for men (128 | 17.0%) and $25,000 to $29,999 for women (101 | 16.1%).
| Income | Male | Female |
| $2,499 or less | 27 (3.6%) | 38 (6.1%) |
| $2,500 to $4,999 | 0 (0.0%) | 12 (1.9%) |
| $5,000 to $7,499 | 12 (1.6%) | 63 (10.1%) |
| $7,500 to $9,999 | 0 (0.0%) | 36 (5.7%) |
| $10,000 to $12,499 | 30 (4.0%) | 0 (0.0%) |
| $12,500 to $14,999 | 21 (2.8%) | 0 (0.0%) |
| $15,000 to $17,499 | 69 (9.1%) | 8 (1.3%) |
| $17,500 to $19,999 | 0 (0.0%) | 20 (3.2%) |
| $20,000 to $22,499 | 128 (17.0%) | 18 (2.9%) |
| $22,500 to $24,999 | 0 (0.0%) | 9 (1.4%) |
| $25,000 to $29,999 | 105 (13.9%) | 101 (16.1%) |
| $30,000 to $34,999 | 84 (11.1%) | 69 (11.0%) |
| $35,000 to $39,999 | 28 (3.7%) | 49 (7.8%) |
| $40,000 to $44,999 | 73 (9.7%) | 49 (7.8%) |
| $45,000 to $49,999 | 9 (1.2%) | 0 (0.0%) |
| $50,000 to $54,999 | 28 (3.7%) | 101 (16.1%) |
| $55,000 to $64,999 | 28 (3.7%) | 27 (4.3%) |
| $65,000 to $74,999 | 77 (10.2%) | 0 (0.0%) |
| $75,000 to $99,999 | 10 (1.3%) | 21 (3.4%) |
| $100,000+ | 26 (3.4%) | 6 (1.0%) |
| Total | 755 (100.0%) | 627 (100.0%) |
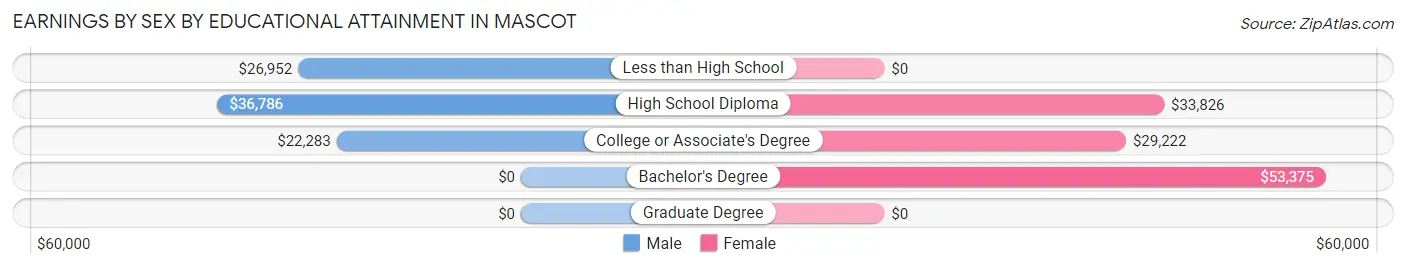
Earnings by Sex by Educational Attainment in Mascot
Average earnings in Mascot are $30,357 for men and $34,565 for women, a difference of 12.2%. Men with an educational attainment of high school diploma enjoy the highest average annual earnings of $36,786, while those with college or associate's degree education earn the least with $22,283. Women with an educational attainment of bachelor's degree earn the most with the average annual earnings of $53,375, while those with college or associate's degree education have the smallest earnings of $29,222.
| Educational Attainment | Male Income | Female Income |
| Less than High School | $26,952 | $0 |
| High School Diploma | $36,786 | $33,826 |
| College or Associate's Degree | $22,283 | $29,222 |
| Bachelor's Degree | - | - |
| Graduate Degree | - | - |
| Total | $30,357 | $34,565 |
Family Income in Mascot
Family Income Brackets in Mascot
According to the Mascot family income data, there are 172 families falling into the $75,000 to $99,999 income range, which is the most common income bracket and makes up 22.8% of all families. Conversely, the less than $10,000 income bracket is the least frequent group with only 12 families (1.6%) belonging to this category.
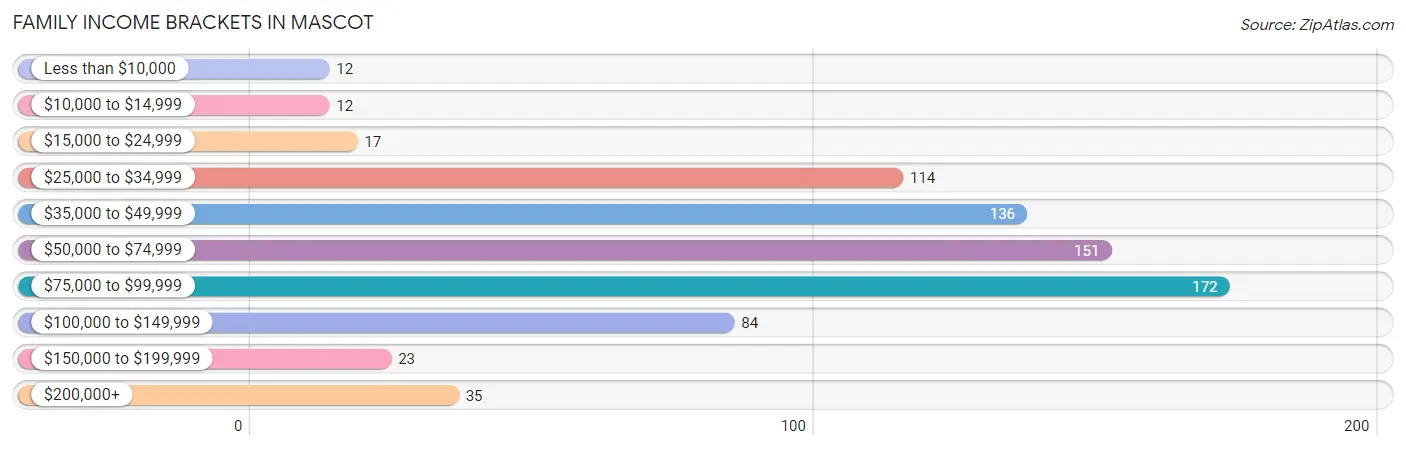
| Income Bracket | # Families | % Families |
| Less than $10,000 | 12 | 1.6% |
| $10,000 to $14,999 | 12 | 1.6% |
| $15,000 to $24,999 | 17 | 2.2% |
| $25,000 to $34,999 | 114 | 15.1% |
| $35,000 to $49,999 | 136 | 18.0% |
| $50,000 to $74,999 | 151 | 20.0% |
| $75,000 to $99,999 | 172 | 22.8% |
| $100,000 to $149,999 | 84 | 11.1% |
| $150,000 to $199,999 | 23 | 3.0% |
| $200,000+ | 35 | 4.6% |
Family Income by Famaliy Size in Mascot
4-person families (32 | 4.2%) account for the highest median family income in Mascot with $124,063 per family, while 4-person families (32 | 4.2%) have the highest median income of $31,016 per family member.
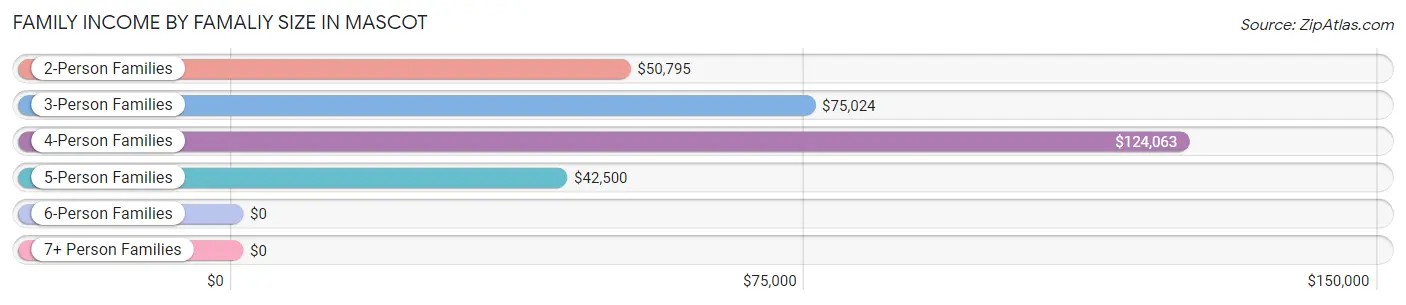
| Income Bracket | # Families | Median Income |
| 2-Person Families | 373 (49.3%) | $50,795 |
| 3-Person Families | 260 (34.4%) | $75,024 |
| 4-Person Families | 32 (4.2%) | $124,063 |
| 5-Person Families | 60 (7.9%) | $42,500 |
| 6-Person Families | 0 (0.0%) | $0 |
| 7+ Person Families | 31 (4.1%) | $0 |
| Total | 756 (100.0%) | $70,313 |
Family Income by Number of Earners in Mascot
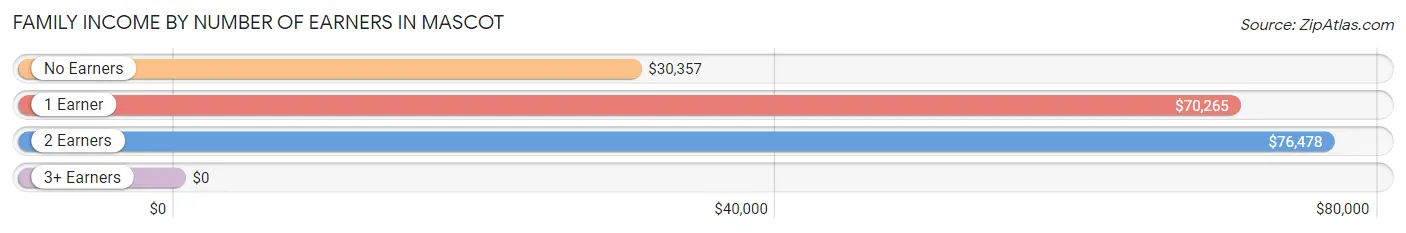
| Number of Earners | # Families | Median Income |
| No Earners | 188 (24.9%) | $30,357 |
| 1 Earner | 169 (22.4%) | $70,265 |
| 2 Earners | 307 (40.6%) | $76,478 |
| 3+ Earners | 92 (12.2%) | $0 |
| Total | 756 (100.0%) | $70,313 |
Household Income in Mascot
Household Income Brackets in Mascot
With 288 households falling in the category, the $35,000 to $49,999 income range is the most frequent in Mascot, accounting for 25.4% of all households. In contrast, only 22 households (1.9%) fall into the less than $10,000 income bracket, making it the least populous group.
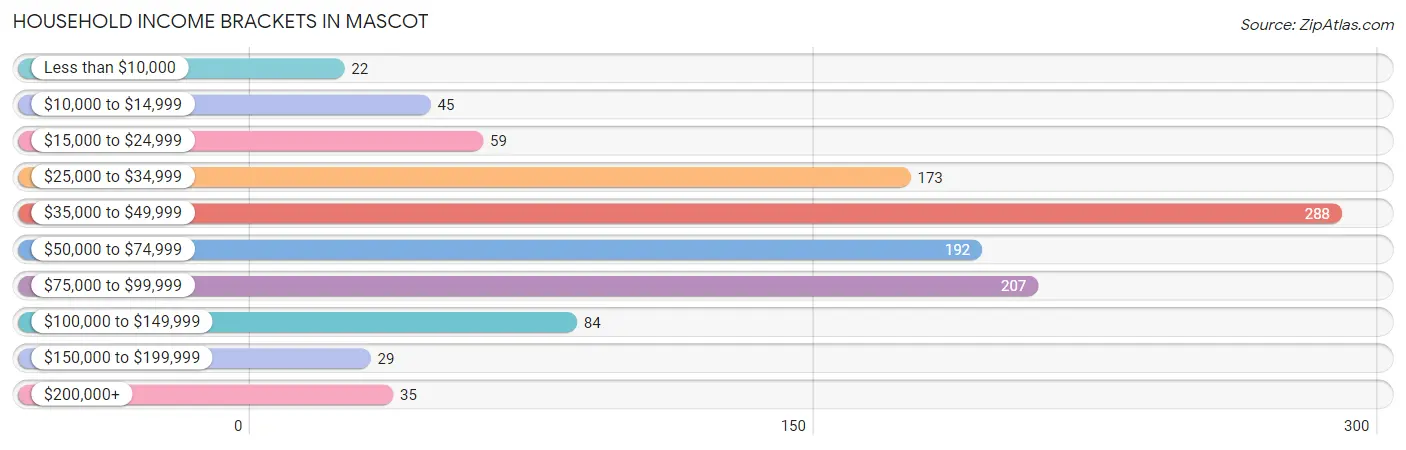
| Income Bracket | # Households | % Households |
| Less than $10,000 | 22 | 1.9% |
| $10,000 to $14,999 | 45 | 4.0% |
| $15,000 to $24,999 | 59 | 5.2% |
| $25,000 to $34,999 | 173 | 15.3% |
| $35,000 to $49,999 | 288 | 25.4% |
| $50,000 to $74,999 | 192 | 17.0% |
| $75,000 to $99,999 | 207 | 18.3% |
| $100,000 to $149,999 | 84 | 7.4% |
| $150,000 to $199,999 | 29 | 2.6% |
| $200,000+ | 35 | 3.1% |
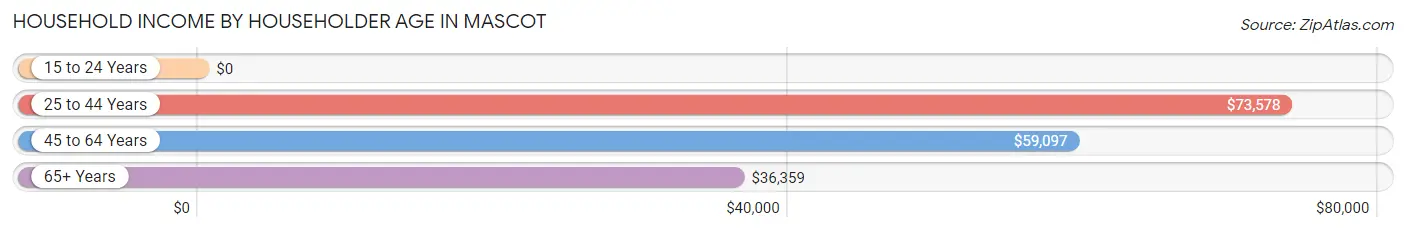
Household Income by Householder Age in Mascot
The median household income in Mascot is $44,955, with the highest median household income of $73,578 found in the 25 to 44 years age bracket for the primary householder. A total of 335 households (29.6%) fall into this category. Meanwhile, the 15 to 24 years age bracket for the primary householder has the lowest median household income of $0, with 19 households (1.7%) in this group.
| Income Bracket | # Households | Median Income |
| 15 to 24 Years | 19 (1.7%) | $0 |
| 25 to 44 Years | 335 (29.6%) | $73,578 |
| 45 to 64 Years | 365 (32.2%) | $59,097 |
| 65+ Years | 413 (36.5%) | $36,359 |
| Total | 1,132 (100.0%) | $44,955 |
Poverty in Mascot
Income Below Poverty by Sex and Age in Mascot
With 6.5% poverty level for males and 11.1% for females among the residents of Mascot, under 5 year old males and 75 year old and over females are the most vulnerable to poverty, with 25 males (44.6%) and 27 females (27.3%) in their respective age groups living below the poverty level.
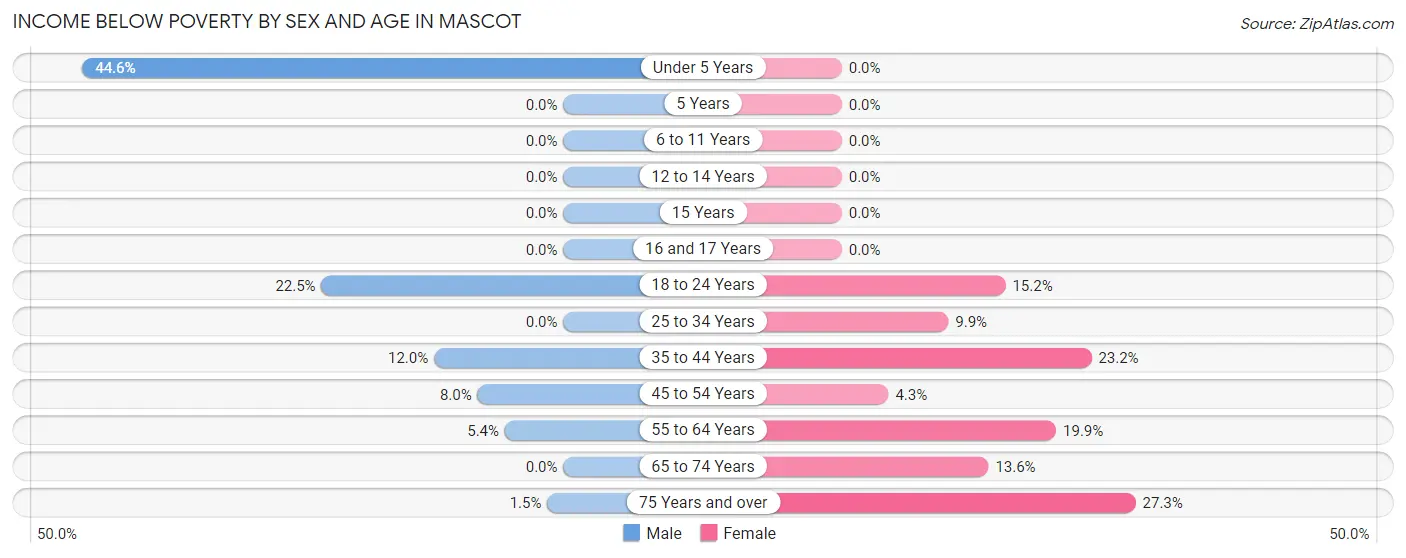
| Age Bracket | Male | Female |
| Under 5 Years | 25 (44.6%) | 0 (0.0%) |
| 5 Years | 0 (0.0%) | 0 (0.0%) |
| 6 to 11 Years | 0 (0.0%) | 0 (0.0%) |
| 12 to 14 Years | 0 (0.0%) | 0 (0.0%) |
| 15 Years | 0 (0.0%) | 0 (0.0%) |
| 16 and 17 Years | 0 (0.0%) | 0 (0.0%) |
| 18 to 24 Years | 22 (22.5%) | 12 (15.2%) |
| 25 to 34 Years | 0 (0.0%) | 18 (9.9%) |
| 35 to 44 Years | 21 (12.0%) | 19 (23.2%) |
| 45 to 54 Years | 9 (8.0%) | 9 (4.3%) |
| 55 to 64 Years | 12 (5.4%) | 35 (19.9%) |
| 65 to 74 Years | 0 (0.0%) | 26 (13.6%) |
| 75 Years and over | 2 (1.5%) | 27 (27.3%) |
| Total | 91 (6.5%) | 146 (11.1%) |
Income Above Poverty by Sex and Age in Mascot
According to the poverty statistics in Mascot, males aged 5 years and females aged under 5 years are the age groups that are most secure financially, with 100.0% of males and 100.0% of females in these age groups living above the poverty line.
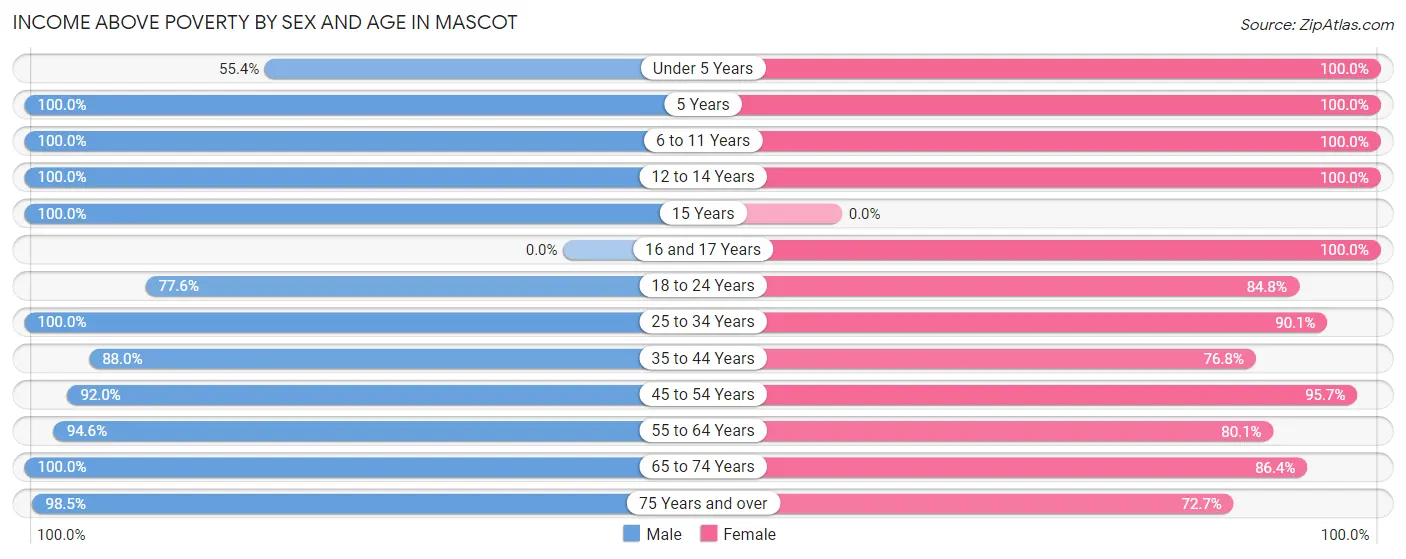
| Age Bracket | Male | Female |
| Under 5 Years | 31 (55.4%) | 14 (100.0%) |
| 5 Years | 28 (100.0%) | 28 (100.0%) |
| 6 to 11 Years | 67 (100.0%) | 150 (100.0%) |
| 12 to 14 Years | 31 (100.0%) | 27 (100.0%) |
| 15 Years | 33 (100.0%) | 0 (0.0%) |
| 16 and 17 Years | 0 (0.0%) | 85 (100.0%) |
| 18 to 24 Years | 76 (77.5%) | 67 (84.8%) |
| 25 to 34 Years | 231 (100.0%) | 164 (90.1%) |
| 35 to 44 Years | 154 (88.0%) | 63 (76.8%) |
| 45 to 54 Years | 104 (92.0%) | 199 (95.7%) |
| 55 to 64 Years | 209 (94.6%) | 141 (80.1%) |
| 65 to 74 Years | 207 (100.0%) | 165 (86.4%) |
| 75 Years and over | 132 (98.5%) | 72 (72.7%) |
| Total | 1,303 (93.5%) | 1,175 (88.9%) |
Income Below Poverty Among Married-Couple Families in Mascot
The poverty statistics for married-couple families in Mascot show that 4.0% or 24 of the total 605 families live below the poverty line. Families with 1 or 2 children have the highest poverty rate of 11.8%, comprising of 24 families. On the other hand, families with no children have the lowest poverty rate of 0.0%, which includes 0 families.
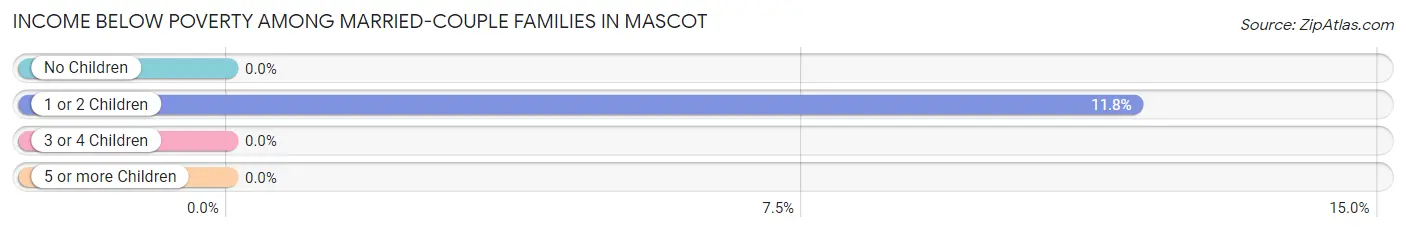
| Children | Above Poverty | Below Poverty |
| No Children | 323 (100.0%) | 0 (0.0%) |
| 1 or 2 Children | 179 (88.2%) | 24 (11.8%) |
| 3 or 4 Children | 68 (100.0%) | 0 (0.0%) |
| 5 or more Children | 11 (100.0%) | 0 (0.0%) |
| Total | 581 (96.0%) | 24 (4.0%) |
Income Below Poverty Among Single-Parent Households in Mascot
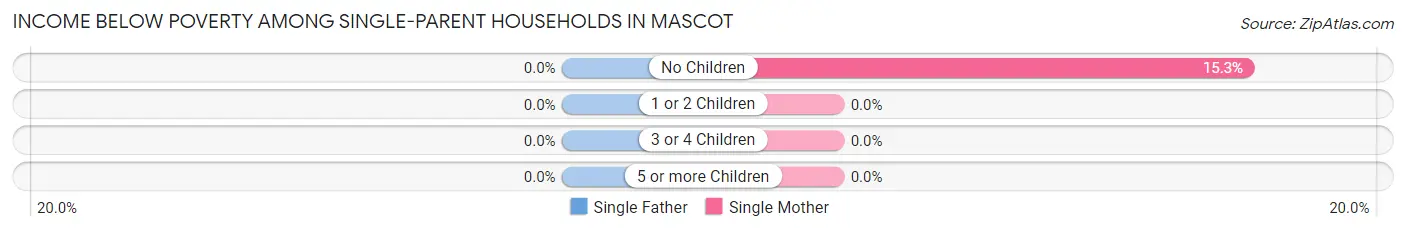
| Children | Single Father | Single Mother |
| No Children | 0 (0.0%) | 17 (15.3%) |
| 1 or 2 Children | 0 (0.0%) | 0 (0.0%) |
| 3 or 4 Children | 0 (0.0%) | 0 (0.0%) |
| 5 or more Children | 0 (0.0%) | 0 (0.0%) |
| Total | 0 (0.0%) | 17 (13.9%) |
Income Below Poverty Among Married-Couple vs Single-Parent Households in Mascot
The poverty data for Mascot shows that 24 of the married-couple family households (4.0%) and 17 of the single-parent households (11.3%) are living below the poverty level. Within the married-couple family households, those with 1 or 2 children have the highest poverty rate, with 24 households (11.8%) falling below the poverty line. Among the single-parent households, those with no children have the highest poverty rate, with 17 household (15.3%) living below poverty.
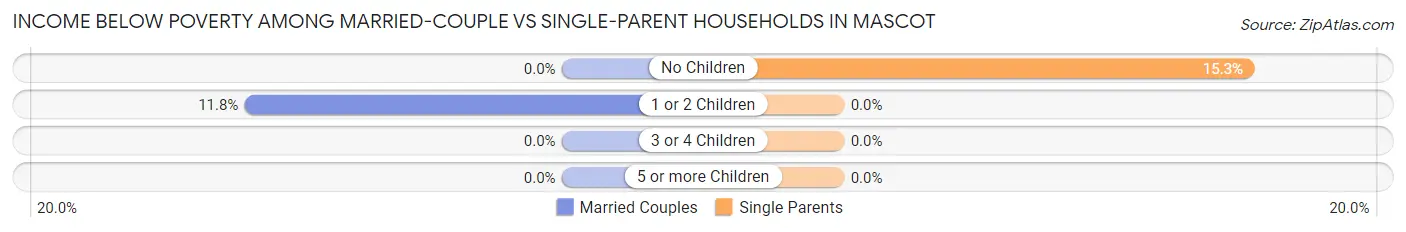
| Children | Married-Couple Families | Single-Parent Households |
| No Children | 0 (0.0%) | 17 (15.3%) |
| 1 or 2 Children | 24 (11.8%) | 0 (0.0%) |
| 3 or 4 Children | 0 (0.0%) | 0 (0.0%) |
| 5 or more Children | 0 (0.0%) | 0 (0.0%) |
| Total | 24 (4.0%) | 17 (11.3%) |
Race in Mascot
The most populous races in Mascot are White / Caucasian (2,502 | 92.1%), Hispanic or Latino (253 | 9.3%), and Black / African American (204 | 7.5%).
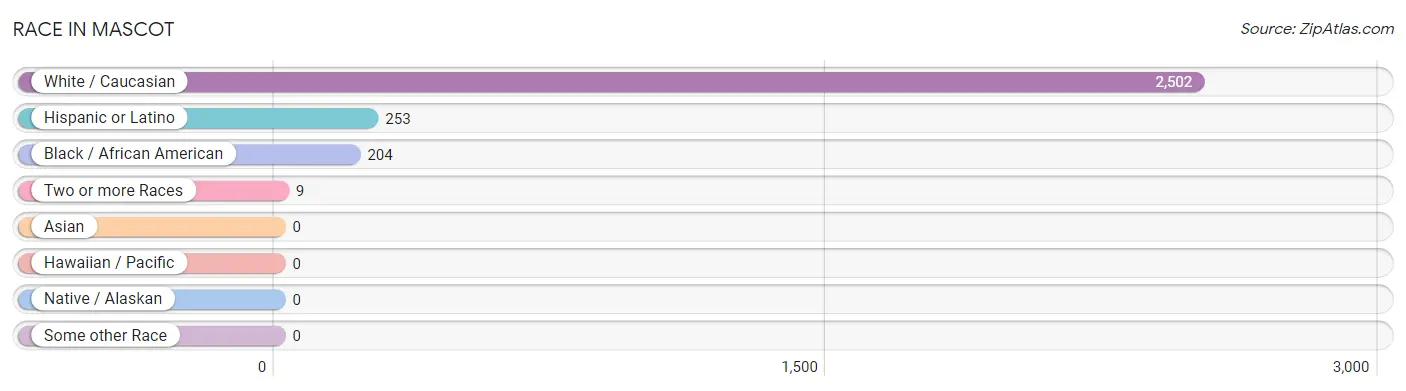
| Race | # Population | % Population |
| Asian | 0 | 0.0% |
| Black / African American | 204 | 7.5% |
| Hawaiian / Pacific | 0 | 0.0% |
| Hispanic or Latino | 253 | 9.3% |
| Native / Alaskan | 0 | 0.0% |
| White / Caucasian | 2,502 | 92.1% |
| Two or more Races | 9 | 0.3% |
| Some other Race | 0 | 0.0% |
| Total | 2,715 | 100.0% |
Ancestry in Mascot
The most populous ancestries reported in Mascot are Irish (522 | 19.2%), German (257 | 9.5%), Mexican (253 | 9.3%), American (227 | 8.4%), and Dutch (168 | 6.2%), together accounting for 52.6% of all Mascot residents.
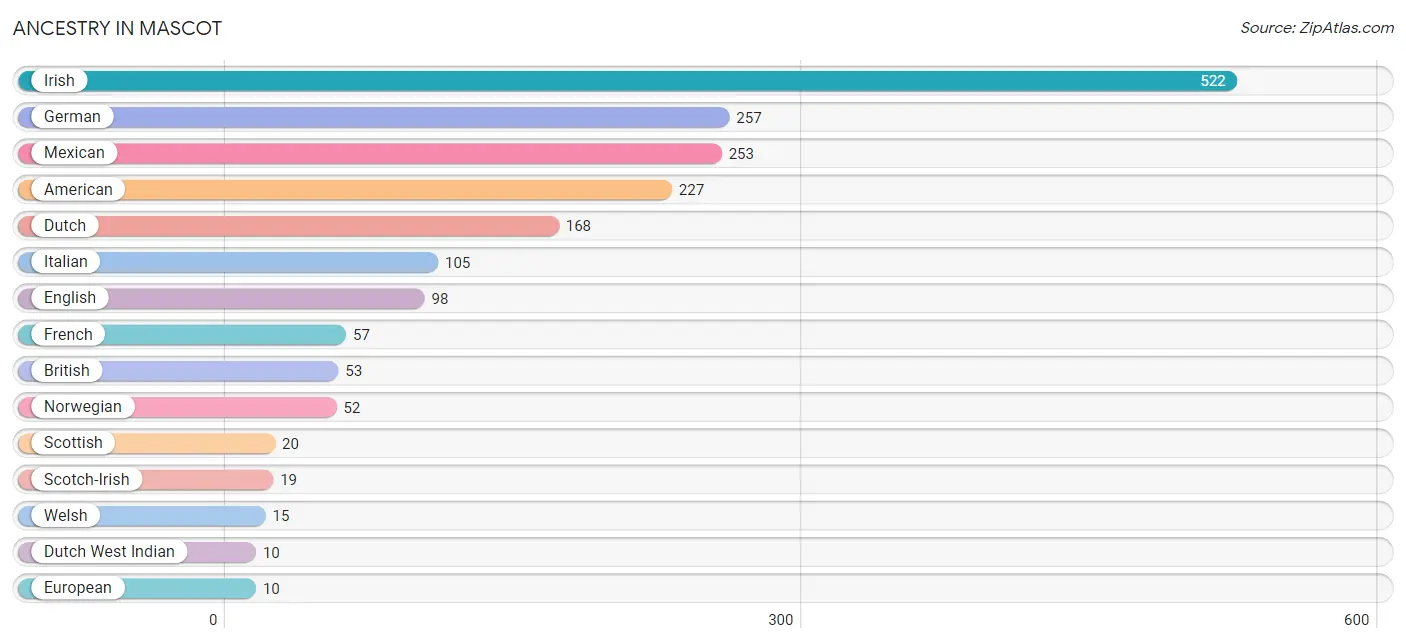
| Ancestry | # Population | % Population |
| American | 227 | 8.4% |
| British | 53 | 1.9% |
| Cherokee | 2 | 0.1% |
| Dutch | 168 | 6.2% |
| Dutch West Indian | 10 | 0.4% |
| English | 98 | 3.6% |
| European | 10 | 0.4% |
| French | 57 | 2.1% |
| French Canadian | 9 | 0.3% |
| German | 257 | 9.5% |
| Irish | 522 | 19.2% |
| Italian | 105 | 3.9% |
| Mexican | 253 | 9.3% |
| Norwegian | 52 | 1.9% |
| Polish | 5 | 0.2% |
| Potawatomi | 7 | 0.3% |
| Scotch-Irish | 19 | 0.7% |
| Scottish | 20 | 0.7% |
| Swiss | 8 | 0.3% |
| Welsh | 15 | 0.5% | View All 20 Rows |
Immigrants in Mascot
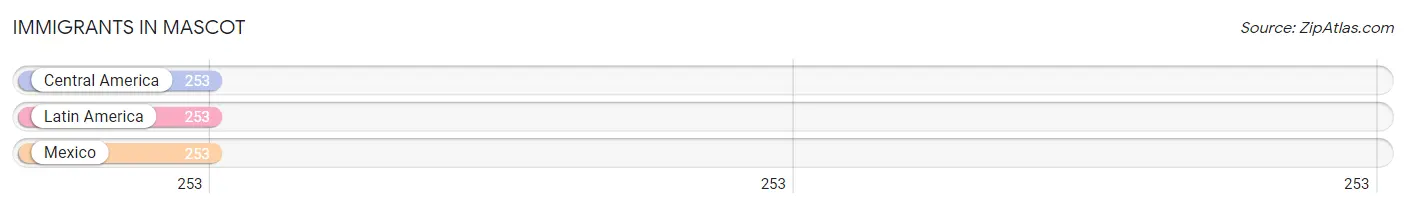
The most numerous immigrant groups reported in Mascot came from Central America (253 | 9.3%), Latin America (253 | 9.3%), and Mexico (253 | 9.3%), together accounting for 28.0% of all Mascot residents.
| Immigration Origin | # Population | % Population |
| Central America | 253 | 9.3% |
| Latin America | 253 | 9.3% |
| Mexico | 253 | 9.3% | View All 3 Rows |
Sex and Age in Mascot
Sex and Age in Mascot
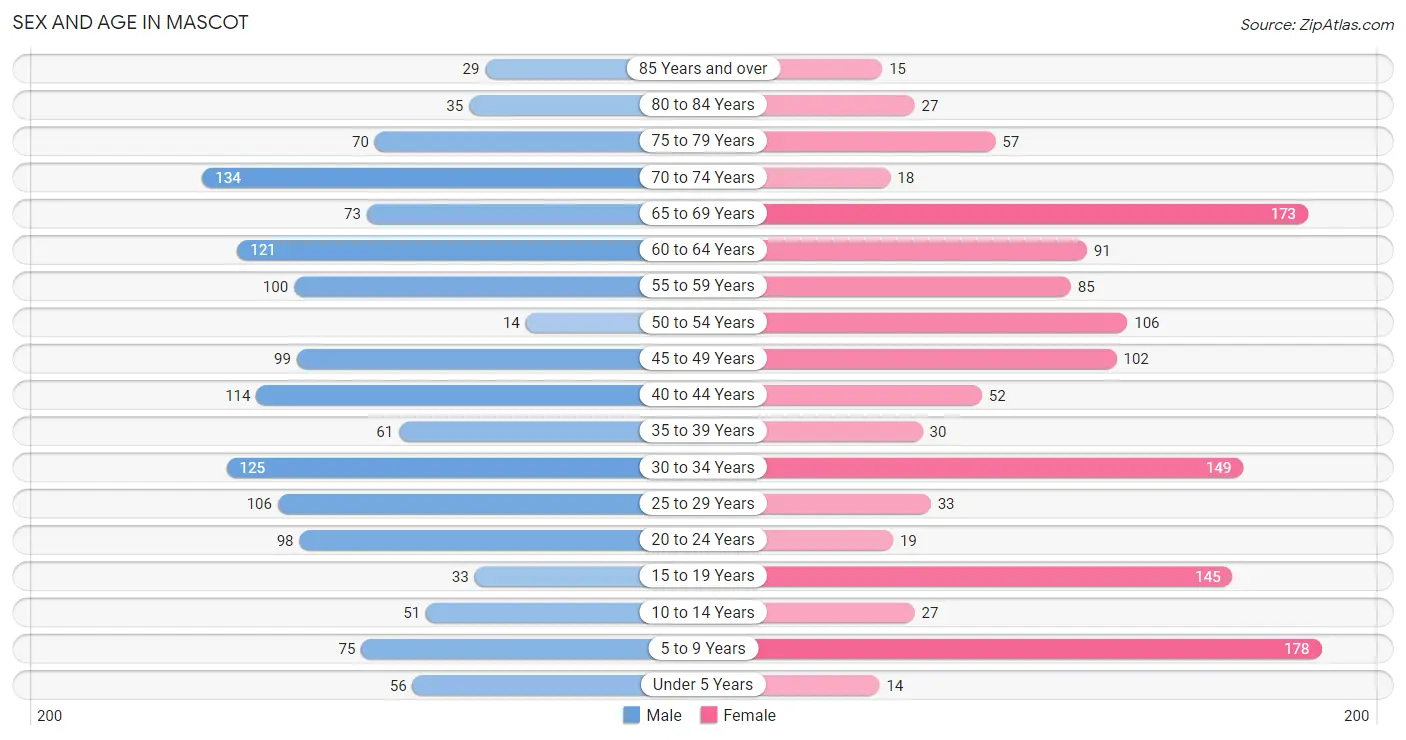
The most populous age groups in Mascot are 70 to 74 Years (134 | 9.6%) for men and 5 to 9 Years (178 | 13.5%) for women.
| Age Bracket | Male | Female |
| Under 5 Years | 56 (4.0%) | 14 (1.1%) |
| 5 to 9 Years | 75 (5.4%) | 178 (13.5%) |
| 10 to 14 Years | 51 (3.7%) | 27 (2.0%) |
| 15 to 19 Years | 33 (2.4%) | 145 (11.0%) |
| 20 to 24 Years | 98 (7.0%) | 19 (1.4%) |
| 25 to 29 Years | 106 (7.6%) | 33 (2.5%) |
| 30 to 34 Years | 125 (9.0%) | 149 (11.3%) |
| 35 to 39 Years | 61 (4.4%) | 30 (2.3%) |
| 40 to 44 Years | 114 (8.2%) | 52 (3.9%) |
| 45 to 49 Years | 99 (7.1%) | 102 (7.7%) |
| 50 to 54 Years | 14 (1.0%) | 106 (8.0%) |
| 55 to 59 Years | 100 (7.2%) | 85 (6.4%) |
| 60 to 64 Years | 121 (8.7%) | 91 (6.9%) |
| 65 to 69 Years | 73 (5.2%) | 173 (13.1%) |
| 70 to 74 Years | 134 (9.6%) | 18 (1.4%) |
| 75 to 79 Years | 70 (5.0%) | 57 (4.3%) |
| 80 to 84 Years | 35 (2.5%) | 27 (2.0%) |
| 85 Years and over | 29 (2.1%) | 15 (1.1%) |
| Total | 1,394 (100.0%) | 1,321 (100.0%) |
Families and Households in Mascot
Median Family Size in Mascot
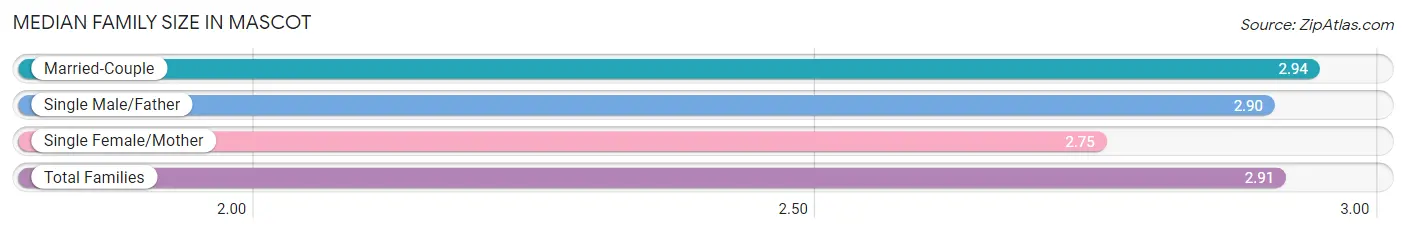
The median family size in Mascot is 2.91 persons per family, with married-couple families (605 | 80.0%) accounting for the largest median family size of 2.94 persons per family. On the other hand, single female/mother families (122 | 16.1%) represent the smallest median family size with 2.75 persons per family.
| Family Type | # Families | Family Size |
| Married-Couple | 605 (80.0%) | 2.94 |
| Single Male/Father | 29 (3.8%) | 2.90 |
| Single Female/Mother | 122 (16.1%) | 2.75 |
| Total Families | 756 (100.0%) | 2.91 |
Median Household Size in Mascot
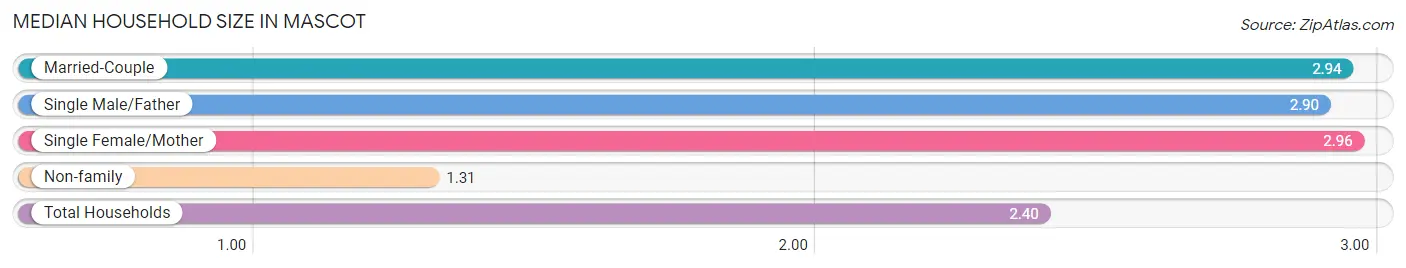
The median household size in Mascot is 2.40 persons per household, with single female/mother households (122 | 10.8%) accounting for the largest median household size of 2.96 persons per household. non-family households (376 | 33.2%) represent the smallest median household size with 1.31 persons per household.
| Household Type | # Households | Household Size |
| Married-Couple | 605 (53.4%) | 2.94 |
| Single Male/Father | 29 (2.6%) | 2.90 |
| Single Female/Mother | 122 (10.8%) | 2.96 |
| Non-family | 376 (33.2%) | 1.31 |
| Total Households | 1,132 (100.0%) | 2.40 |
Household Size by Marriage Status in Mascot
Out of a total of 1,132 households in Mascot, 756 (66.8%) are family households, while 376 (33.2%) are nonfamily households. The most numerous type of family households are 2-person households, comprising 365, and the most common type of nonfamily households are 1-person households, comprising 260.
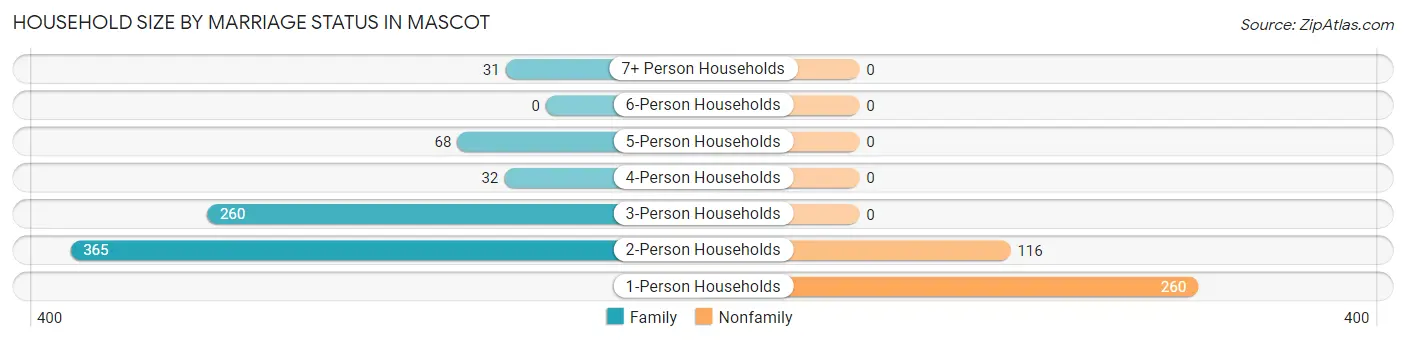
| Household Size | Family Households | Nonfamily Households |
| 1-Person Households | - | 260 (23.0%) |
| 2-Person Households | 365 (32.2%) | 116 (10.2%) |
| 3-Person Households | 260 (23.0%) | 0 (0.0%) |
| 4-Person Households | 32 (2.8%) | 0 (0.0%) |
| 5-Person Households | 68 (6.0%) | 0 (0.0%) |
| 6-Person Households | 0 (0.0%) | 0 (0.0%) |
| 7+ Person Households | 31 (2.7%) | 0 (0.0%) |
| Total | 756 (66.8%) | 376 (33.2%) |
Female Fertility in Mascot
Fertility by Age in Mascot
Average fertility rate in Mascot is 20.0 births per 1,000 women. Women in the age bracket of 20 to 34 years have the highest fertility rate with 60.0 births per 1,000 women. Women in the age bracket of 20 to 34 years acount for 100.0% of all women with births.
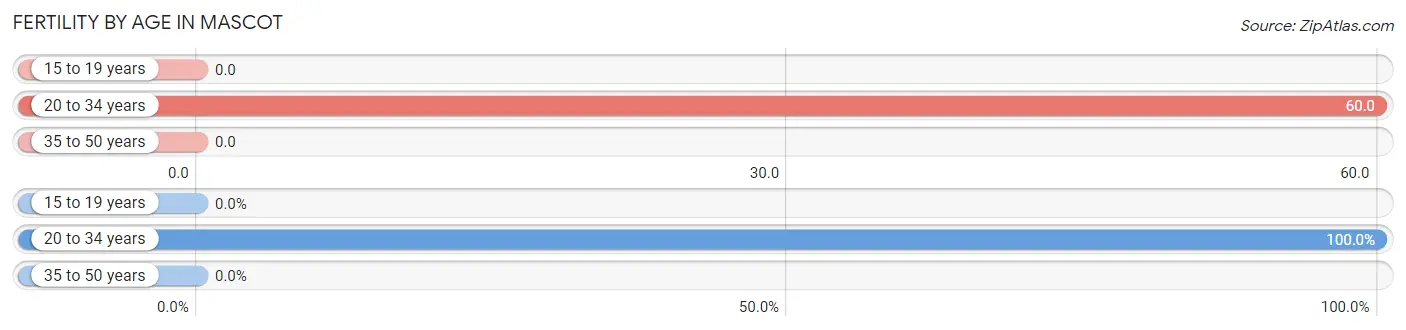
| Age Bracket | Women with Births | Births / 1,000 Women |
| 15 to 19 years | 0 (0.0%) | 0.0 |
| 20 to 34 years | 12 (100.0%) | 60.0 |
| 35 to 50 years | 0 (0.0%) | 0.0 |
| Total | 12 (100.0%) | 20.0 |
Fertility by Age by Marriage Status in Mascot
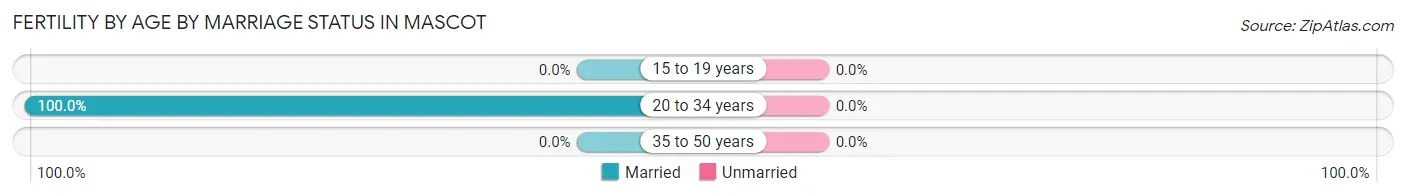
| Age Bracket | Married | Unmarried |
| 15 to 19 years | 0 (0.0%) | 0 (0.0%) |
| 20 to 34 years | 12 (100.0%) | 0 (0.0%) |
| 35 to 50 years | 0 (0.0%) | 0 (0.0%) |
| Total | 12 (100.0%) | 0 (0.0%) |
Fertility by Education in Mascot
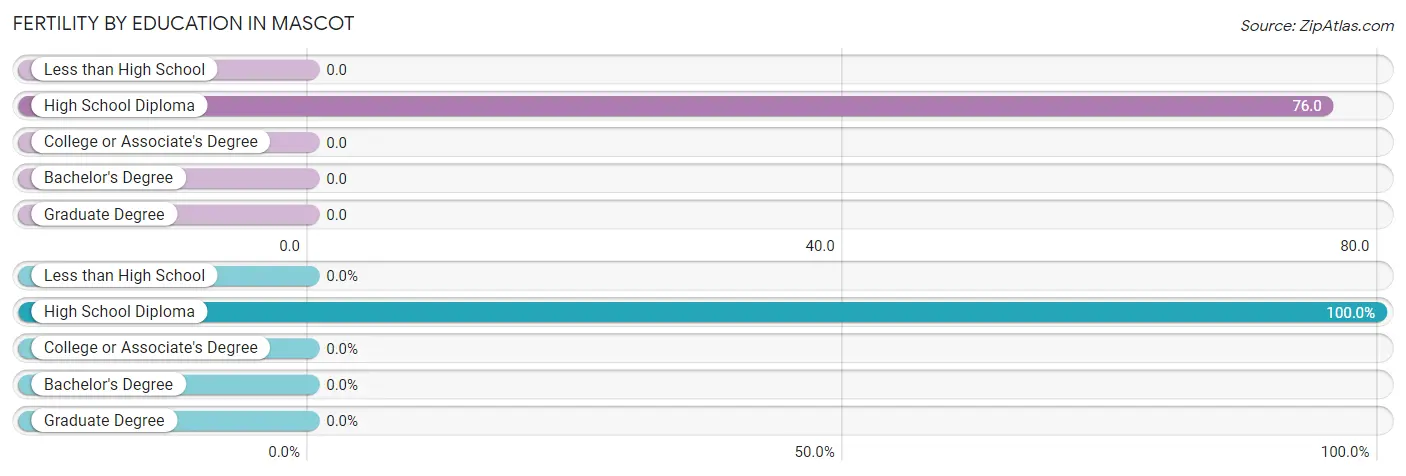
| Educational Attainment | Women with Births | Births / 1,000 Women |
| Less than High School | 0 (0.0%) | 0.0 |
| High School Diploma | 12 (100.0%) | 76.0 |
| College or Associate's Degree | 0 (0.0%) | 0.0 |
| Bachelor's Degree | 0 (0.0%) | 0.0 |
| Graduate Degree | 0 (0.0%) | 0.0 |
| Total | 12 (100.0%) | 20.0 |
Fertility by Education by Marriage Status in Mascot
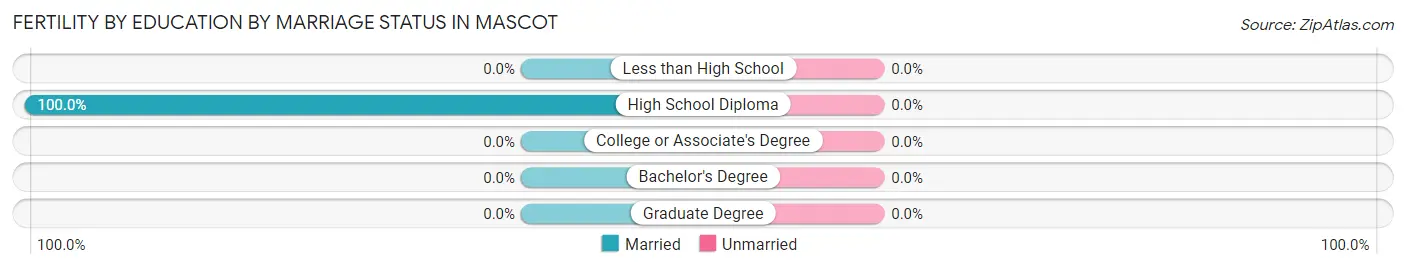
| Educational Attainment | Married | Unmarried |
| Less than High School | 0 (0.0%) | 0 (0.0%) |
| High School Diploma | 12 (100.0%) | 0 (0.0%) |
| College or Associate's Degree | 0 (0.0%) | 0 (0.0%) |
| Bachelor's Degree | 0 (0.0%) | 0 (0.0%) |
| Graduate Degree | 0 (0.0%) | 0 (0.0%) |
| Total | 12 (100.0%) | 0 (0.0%) |
Employment Characteristics in Mascot
Employment by Class of Employer in Mascot
Among the 1,261 employed individuals in Mascot, private company employees (1,036 | 82.2%), self-employed (not incorporated) (126 | 10.0%), and not-for-profit organizations (35 | 2.8%) make up the most common classes of employment.
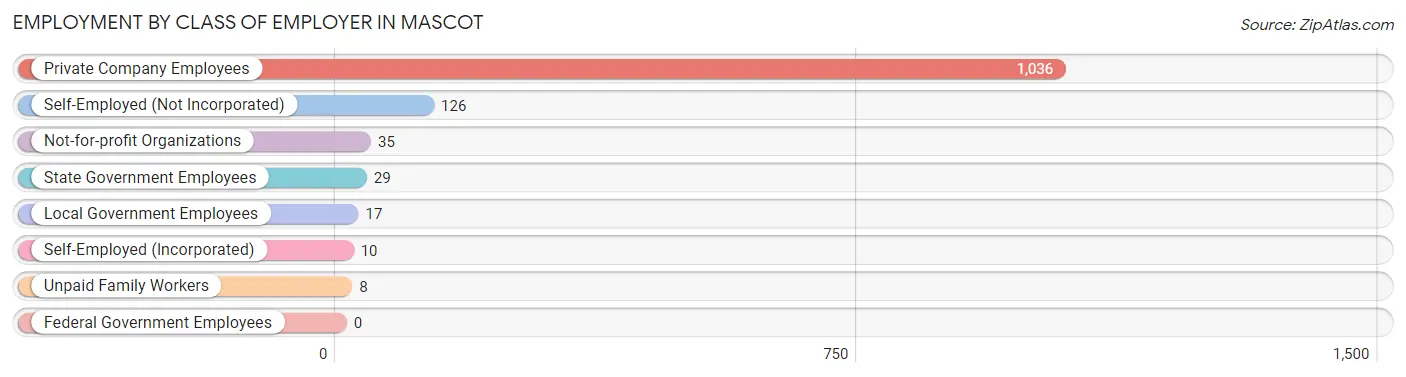
| Employer Class | # Employees | % Employees |
| Private Company Employees | 1,036 | 82.2% |
| Self-Employed (Incorporated) | 10 | 0.8% |
| Self-Employed (Not Incorporated) | 126 | 10.0% |
| Not-for-profit Organizations | 35 | 2.8% |
| Local Government Employees | 17 | 1.3% |
| State Government Employees | 29 | 2.3% |
| Federal Government Employees | 0 | 0.0% |
| Unpaid Family Workers | 8 | 0.6% |
| Total | 1,261 | 100.0% |
Employment Status by Age in Mascot
According to the labor force statistics for Mascot, out of the total population over 16 years of age (2,281), 59.5% or 1,357 individuals are in the labor force, with 4.2% or 57 of them unemployed. The age group with the highest labor force participation rate is 25 to 29 years, with 90.6% or 126 individuals in the labor force. Within the labor force, the 65 to 74 years age range has the highest percentage of unemployed individuals, with 17.5% or 18 of them being unemployed.
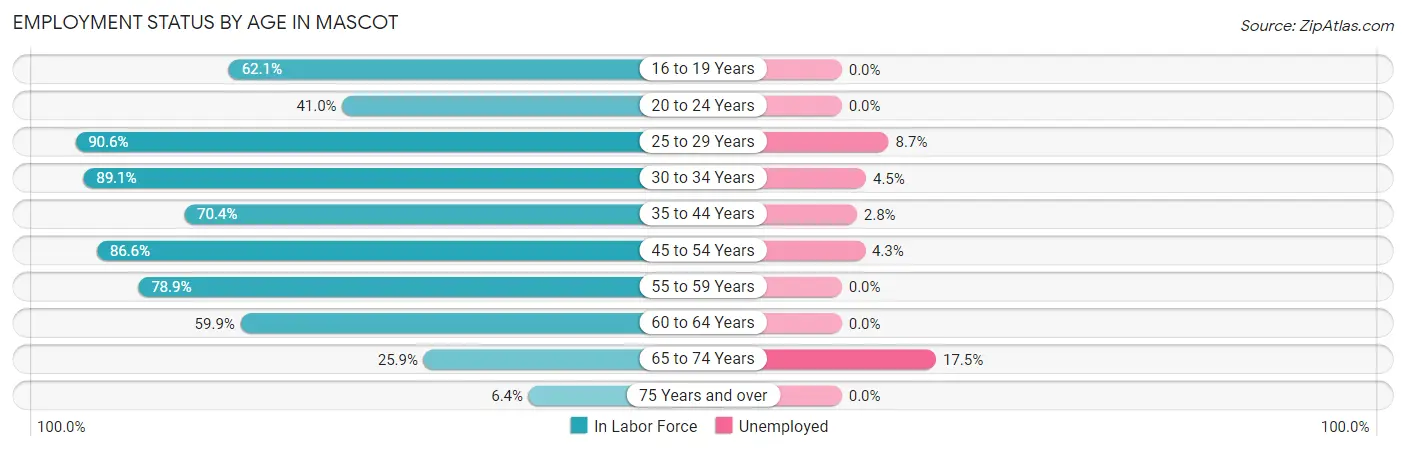
| Age Bracket | In Labor Force | Unemployed |
| 16 to 19 Years | 90 (62.1%) | 0 (0.0%) |
| 20 to 24 Years | 48 (41.0%) | 0 (0.0%) |
| 25 to 29 Years | 126 (90.6%) | 11 (8.7%) |
| 30 to 34 Years | 244 (89.1%) | 11 (4.5%) |
| 35 to 44 Years | 181 (70.4%) | 5 (2.8%) |
| 45 to 54 Years | 278 (86.6%) | 12 (4.3%) |
| 55 to 59 Years | 146 (78.9%) | 0 (0.0%) |
| 60 to 64 Years | 127 (59.9%) | 0 (0.0%) |
| 65 to 74 Years | 103 (25.9%) | 18 (17.5%) |
| 75 Years and over | 15 (6.4%) | 0 (0.0%) |
| Total | 1,357 (59.5%) | 57 (4.2%) |
Employment Status by Educational Attainment in Mascot
According to labor force statistics for Mascot, 79.4% of individuals (1,102) out of the total population between 25 and 64 years of age (1,388) are in the labor force, with 3.5% or 39 of them being unemployed. The group with the highest labor force participation rate are those with the educational attainment of bachelor's degree or higher, with 88.9% or 201 individuals in the labor force. Within the labor force, individuals with college / associate degree education have the highest percentage of unemployment, with 5.5% or 23 of them being unemployed.
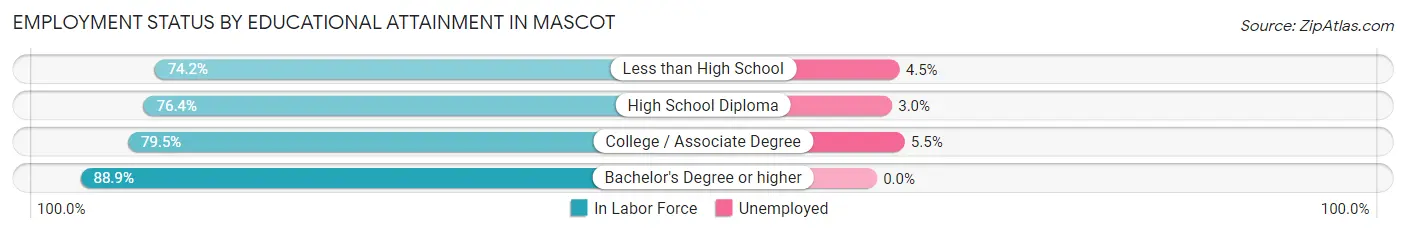
| Educational Attainment | In Labor Force | Unemployed |
| Less than High School | 112 (74.2%) | 7 (4.5%) |
| High School Diploma | 370 (76.4%) | 15 (3.0%) |
| College / Associate Degree | 419 (79.5%) | 29 (5.5%) |
| Bachelor's Degree or higher | 201 (88.9%) | 0 (0.0%) |
| Total | 1,102 (79.4%) | 49 (3.5%) |
Employment Occupations by Sex in Mascot
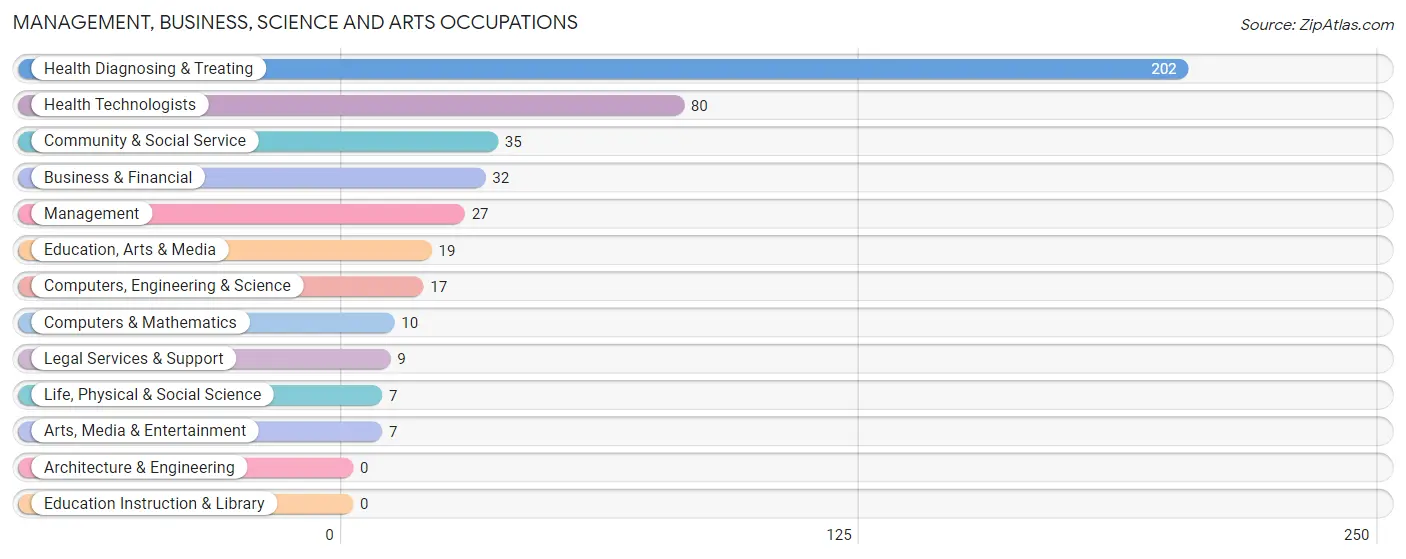
Management, Business, Science and Arts Occupations
The most common Management, Business, Science and Arts occupations in Mascot are Health Diagnosing & Treating (202 | 15.5%), Health Technologists (80 | 6.1%), Community & Social Service (35 | 2.7%), Business & Financial (32 | 2.5%), and Management (27 | 2.1%).
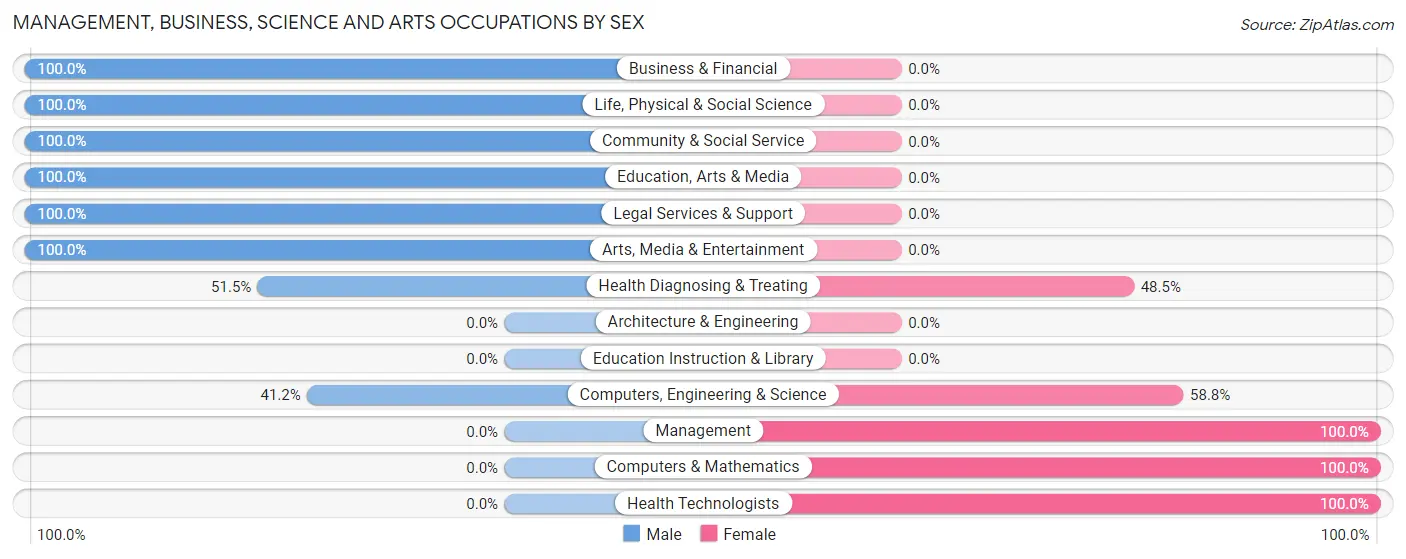
Management, Business, Science and Arts Occupations by Sex
Within the Management, Business, Science and Arts occupations in Mascot, the most male-oriented occupations are Business & Financial (100.0%), Life, Physical & Social Science (100.0%), and Community & Social Service (100.0%), while the most female-oriented occupations are Management (100.0%), Computers & Mathematics (100.0%), and Health Technologists (100.0%).
| Occupation | Male | Female |
| Management | 0 (0.0%) | 27 (100.0%) |
| Business & Financial | 32 (100.0%) | 0 (0.0%) |
| Computers, Engineering & Science | 7 (41.2%) | 10 (58.8%) |
| Computers & Mathematics | 0 (0.0%) | 10 (100.0%) |
| Architecture & Engineering | 0 (0.0%) | 0 (0.0%) |
| Life, Physical & Social Science | 7 (100.0%) | 0 (0.0%) |
| Community & Social Service | 35 (100.0%) | 0 (0.0%) |
| Education, Arts & Media | 19 (100.0%) | 0 (0.0%) |
| Legal Services & Support | 9 (100.0%) | 0 (0.0%) |
| Education Instruction & Library | 0 (0.0%) | 0 (0.0%) |
| Arts, Media & Entertainment | 7 (100.0%) | 0 (0.0%) |
| Health Diagnosing & Treating | 104 (51.5%) | 98 (48.5%) |
| Health Technologists | 0 (0.0%) | 80 (100.0%) |
| Total (Category) | 178 (56.9%) | 135 (43.1%) |
| Total (Overall) | 706 (54.3%) | 595 (45.7%) |
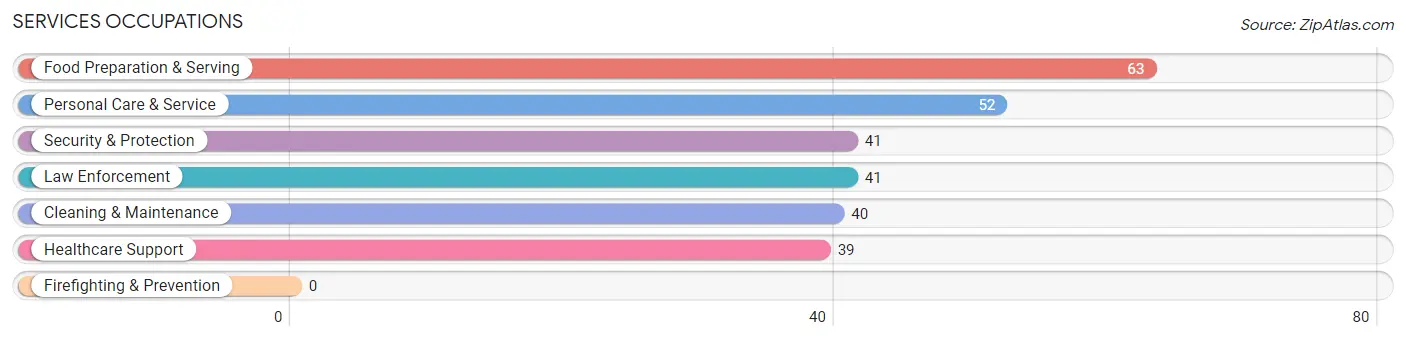
Services Occupations
The most common Services occupations in Mascot are Food Preparation & Serving (63 | 4.8%), Personal Care & Service (52 | 4.0%), Security & Protection (41 | 3.2%), Law Enforcement (41 | 3.2%), and Cleaning & Maintenance (40 | 3.1%).
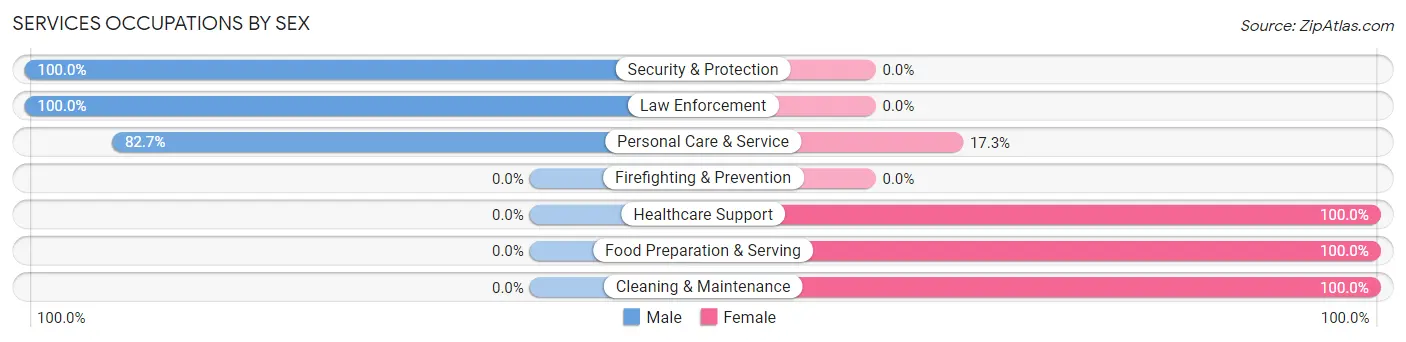
Services Occupations by Sex
Within the Services occupations in Mascot, the most male-oriented occupations are Security & Protection (100.0%), Law Enforcement (100.0%), and Personal Care & Service (82.7%), while the most female-oriented occupations are Healthcare Support (100.0%), Food Preparation & Serving (100.0%), and Cleaning & Maintenance (100.0%).
| Occupation | Male | Female |
| Healthcare Support | 0 (0.0%) | 39 (100.0%) |
| Security & Protection | 41 (100.0%) | 0 (0.0%) |
| Firefighting & Prevention | 0 (0.0%) | 0 (0.0%) |
| Law Enforcement | 41 (100.0%) | 0 (0.0%) |
| Food Preparation & Serving | 0 (0.0%) | 63 (100.0%) |
| Cleaning & Maintenance | 0 (0.0%) | 40 (100.0%) |
| Personal Care & Service | 43 (82.7%) | 9 (17.3%) |
| Total (Category) | 84 (35.7%) | 151 (64.3%) |
| Total (Overall) | 706 (54.3%) | 595 (45.7%) |
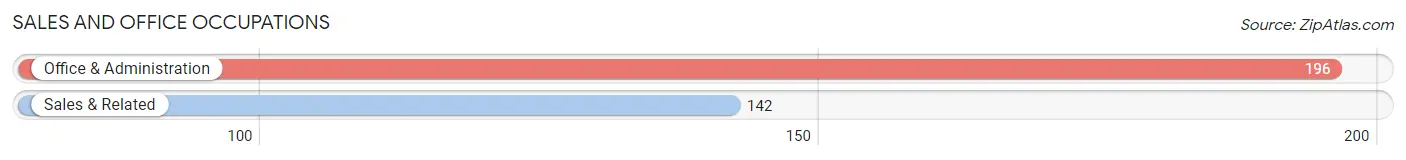
Sales and Office Occupations
The most common Sales and Office occupations in Mascot are Office & Administration (196 | 15.1%), and Sales & Related (142 | 10.9%).
Sales and Office Occupations by Sex
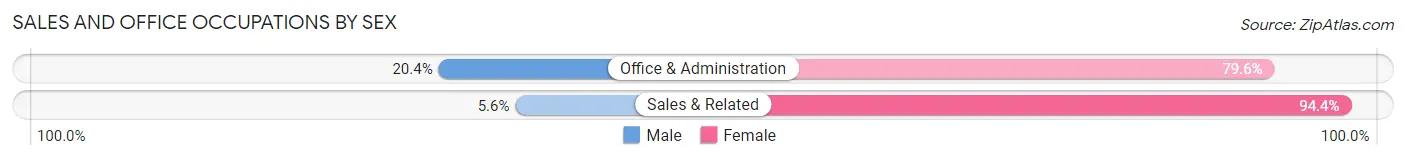
| Occupation | Male | Female |
| Sales & Related | 8 (5.6%) | 134 (94.4%) |
| Office & Administration | 40 (20.4%) | 156 (79.6%) |
| Total (Category) | 48 (14.2%) | 290 (85.8%) |
| Total (Overall) | 706 (54.3%) | 595 (45.7%) |
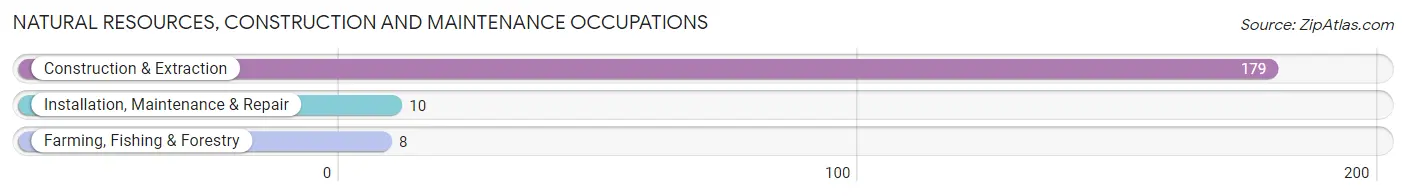
Natural Resources, Construction and Maintenance Occupations
The most common Natural Resources, Construction and Maintenance occupations in Mascot are Construction & Extraction (179 | 13.8%), Installation, Maintenance & Repair (10 | 0.8%), and Farming, Fishing & Forestry (8 | 0.6%).
Natural Resources, Construction and Maintenance Occupations by Sex
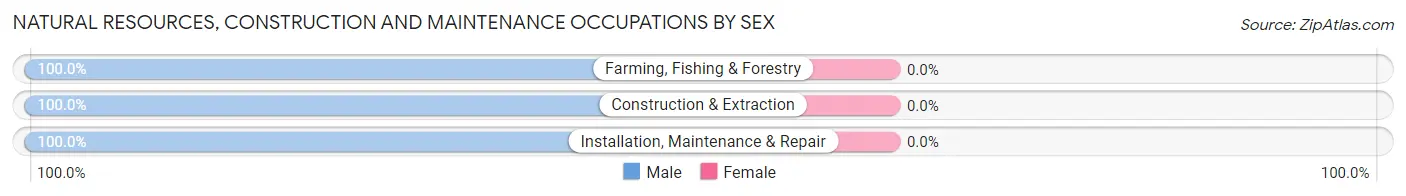
| Occupation | Male | Female |
| Farming, Fishing & Forestry | 8 (100.0%) | 0 (0.0%) |
| Construction & Extraction | 179 (100.0%) | 0 (0.0%) |
| Installation, Maintenance & Repair | 10 (100.0%) | 0 (0.0%) |
| Total (Category) | 197 (100.0%) | 0 (0.0%) |
| Total (Overall) | 706 (54.3%) | 595 (45.7%) |
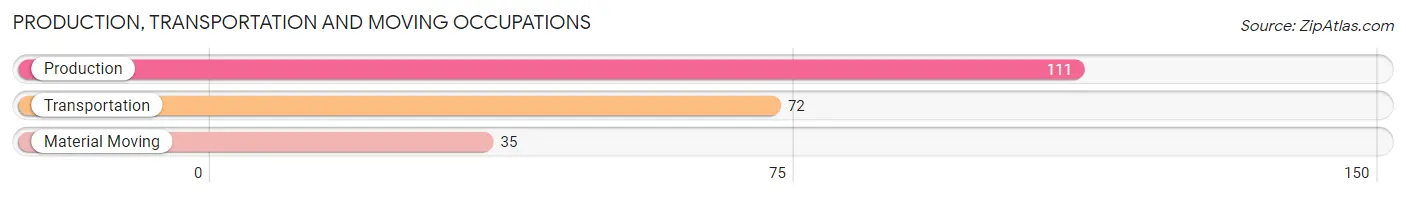
Production, Transportation and Moving Occupations
The most common Production, Transportation and Moving occupations in Mascot are Production (111 | 8.5%), Transportation (72 | 5.5%), and Material Moving (35 | 2.7%).
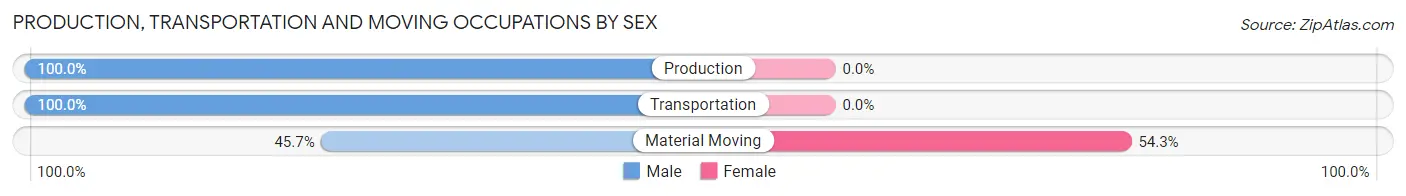
Production, Transportation and Moving Occupations by Sex
| Occupation | Male | Female |
| Production | 111 (100.0%) | 0 (0.0%) |
| Transportation | 72 (100.0%) | 0 (0.0%) |
| Material Moving | 16 (45.7%) | 19 (54.3%) |
| Total (Category) | 199 (91.3%) | 19 (8.7%) |
| Total (Overall) | 706 (54.3%) | 595 (45.7%) |
Employment Industries by Sex in Mascot
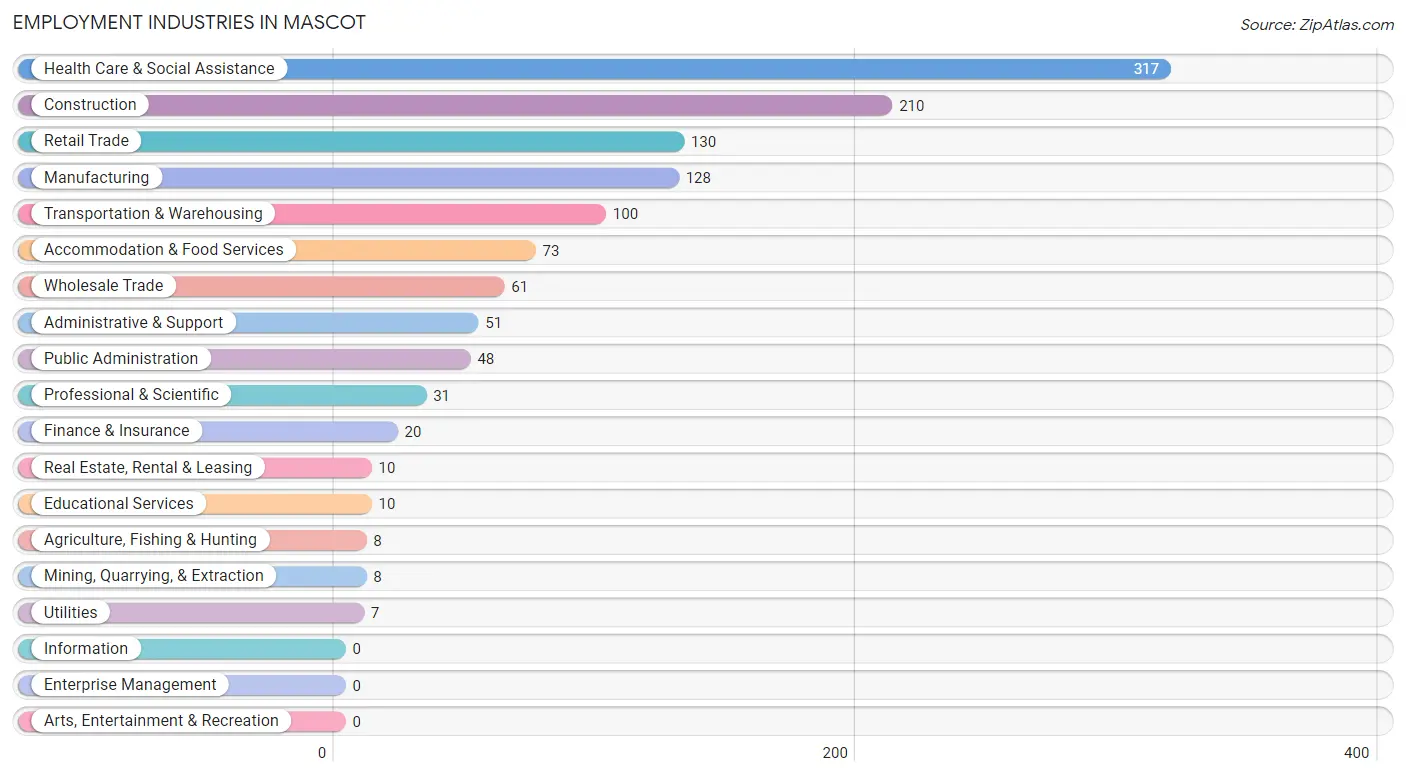
Employment Industries in Mascot
The major employment industries in Mascot include Health Care & Social Assistance (317 | 24.4%), Construction (210 | 16.1%), Retail Trade (130 | 10.0%), Manufacturing (128 | 9.8%), and Transportation & Warehousing (100 | 7.7%).
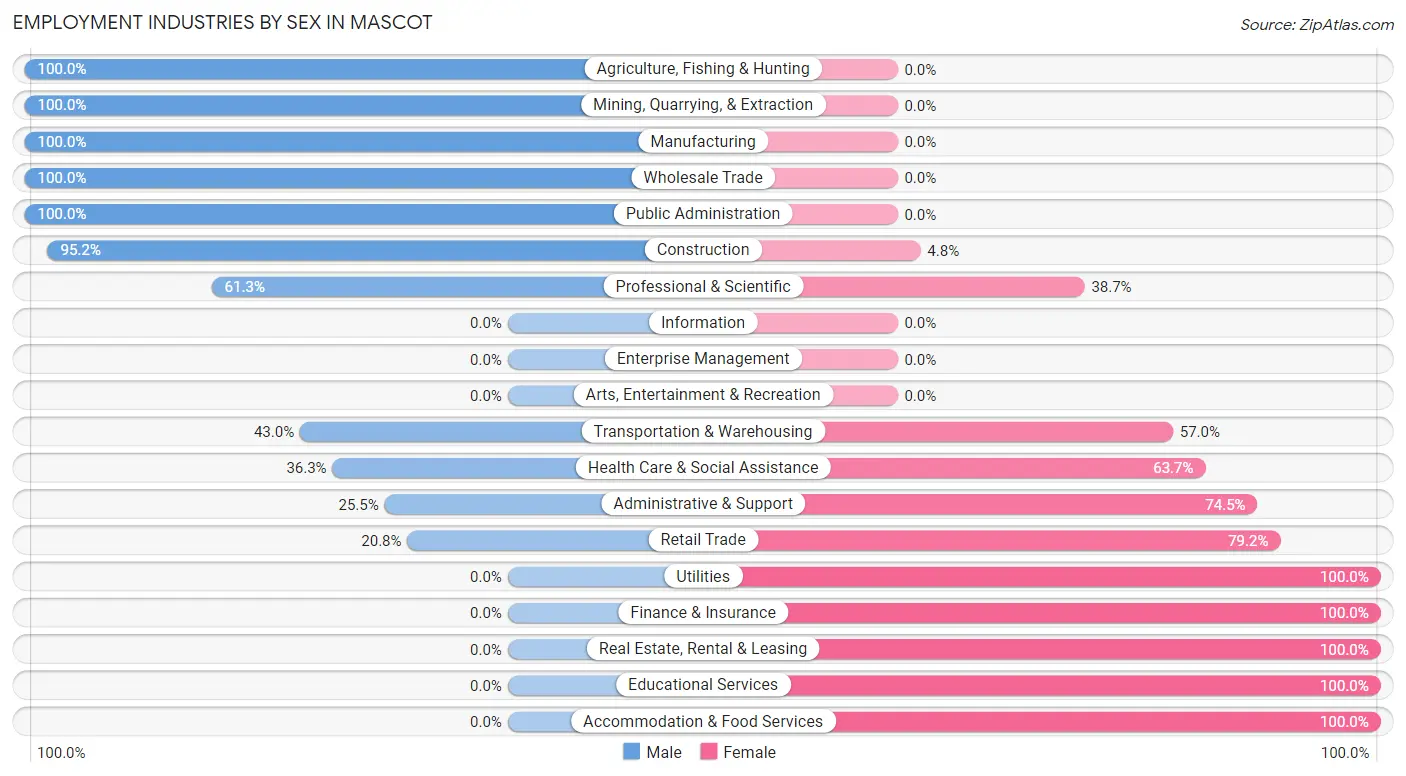
Employment Industries by Sex in Mascot
The Mascot industries that see more men than women are Agriculture, Fishing & Hunting (100.0%), Mining, Quarrying, & Extraction (100.0%), and Manufacturing (100.0%), whereas the industries that tend to have a higher number of women are Utilities (100.0%), Finance & Insurance (100.0%), and Real Estate, Rental & Leasing (100.0%).
| Industry | Male | Female |
| Agriculture, Fishing & Hunting | 8 (100.0%) | 0 (0.0%) |
| Mining, Quarrying, & Extraction | 8 (100.0%) | 0 (0.0%) |
| Construction | 200 (95.2%) | 10 (4.8%) |
| Manufacturing | 128 (100.0%) | 0 (0.0%) |
| Wholesale Trade | 61 (100.0%) | 0 (0.0%) |
| Retail Trade | 27 (20.8%) | 103 (79.2%) |
| Transportation & Warehousing | 43 (43.0%) | 57 (57.0%) |
| Utilities | 0 (0.0%) | 7 (100.0%) |
| Information | 0 (0.0%) | 0 (0.0%) |
| Finance & Insurance | 0 (0.0%) | 20 (100.0%) |
| Real Estate, Rental & Leasing | 0 (0.0%) | 10 (100.0%) |
| Professional & Scientific | 19 (61.3%) | 12 (38.7%) |
| Enterprise Management | 0 (0.0%) | 0 (0.0%) |
| Administrative & Support | 13 (25.5%) | 38 (74.5%) |
| Educational Services | 0 (0.0%) | 10 (100.0%) |
| Health Care & Social Assistance | 115 (36.3%) | 202 (63.7%) |
| Arts, Entertainment & Recreation | 0 (0.0%) | 0 (0.0%) |
| Accommodation & Food Services | 0 (0.0%) | 73 (100.0%) |
| Public Administration | 48 (100.0%) | 0 (0.0%) |
| Total | 706 (54.3%) | 595 (45.7%) |
Education in Mascot
School Enrollment in Mascot
The most common levels of schooling among the 558 students in Mascot are high school (164 | 29.4%), elementary school (153 | 27.4%), and college / undergraduate (80 | 14.3%).
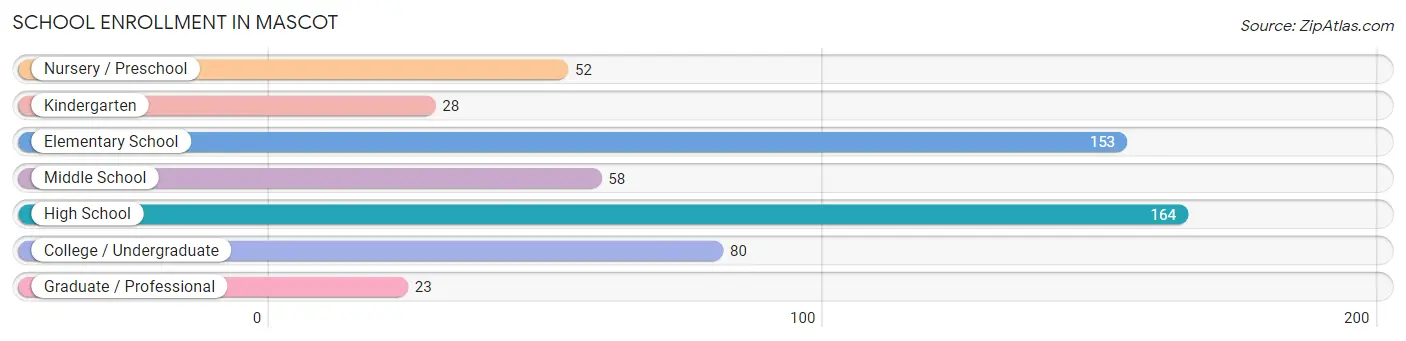
| School Level | # Students | % Students |
| Nursery / Preschool | 52 | 9.3% |
| Kindergarten | 28 | 5.0% |
| Elementary School | 153 | 27.4% |
| Middle School | 58 | 10.4% |
| High School | 164 | 29.4% |
| College / Undergraduate | 80 | 14.3% |
| Graduate / Professional | 23 | 4.1% |
| Total | 558 | 100.0% |
School Enrollment by Age by Funding Source in Mascot
Out of a total of 558 students who are enrolled in schools in Mascot, 164 (29.4%) attend a private institution, while the remaining 394 (70.6%) are enrolled in public schools. The age group of 25 to 34 year olds has the highest likelihood of being enrolled in private schools, with 35 (100.0% in the age bracket) enrolled. Conversely, the age group of 20 to 24 year olds has the lowest likelihood of being enrolled in a private school, with 54 (100.0% in the age bracket) attending a public institution.
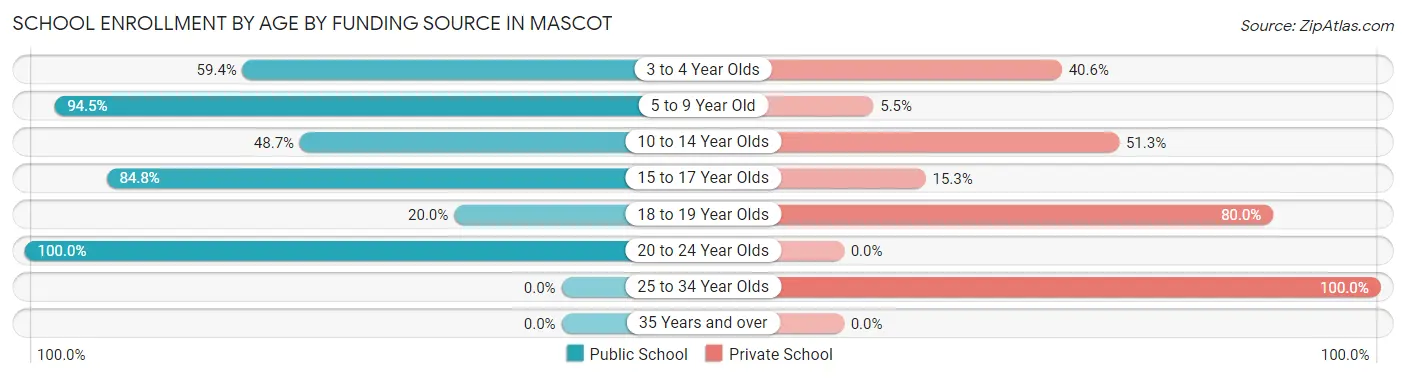
| Age Bracket | Public School | Private School |
| 3 to 4 Year Olds | 19 (59.4%) | 13 (40.6%) |
| 5 to 9 Year Old | 171 (94.5%) | 10 (5.5%) |
| 10 to 14 Year Olds | 38 (48.7%) | 40 (51.3%) |
| 15 to 17 Year Olds | 100 (84.8%) | 18 (15.2%) |
| 18 to 19 Year Olds | 12 (20.0%) | 48 (80.0%) |
| 20 to 24 Year Olds | 54 (100.0%) | 0 (0.0%) |
| 25 to 34 Year Olds | 0 (0.0%) | 35 (100.0%) |
| 35 Years and over | 0 (0.0%) | 0 (0.0%) |
| Total | 394 (70.6%) | 164 (29.4%) |
Educational Attainment by Field of Study in Mascot
Science & technology (131 | 44.6%), business (97 | 33.0%), education (22 | 7.5%), visual & performing arts (19 | 6.5%), and social sciences (13 | 4.4%) are the most common fields of study among 294 individuals in Mascot who have obtained a bachelor's degree or higher.
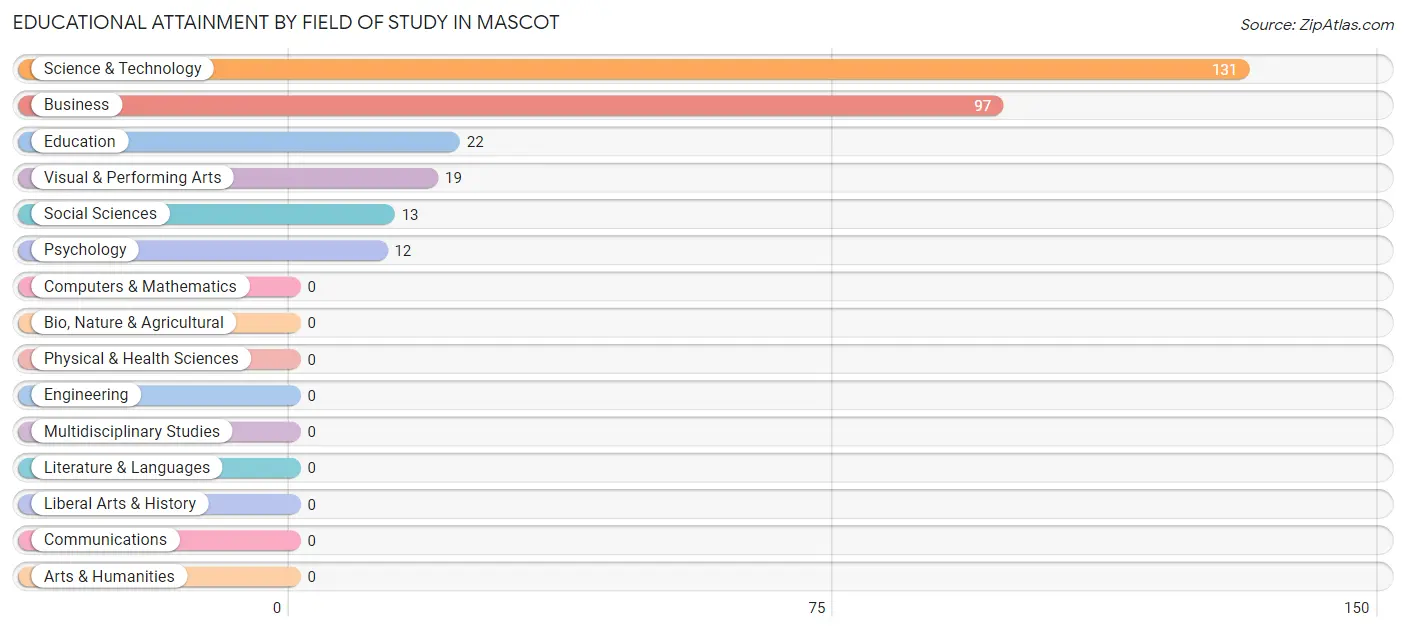
| Field of Study | # Graduates | % Graduates |
| Computers & Mathematics | 0 | 0.0% |
| Bio, Nature & Agricultural | 0 | 0.0% |
| Physical & Health Sciences | 0 | 0.0% |
| Psychology | 12 | 4.1% |
| Social Sciences | 13 | 4.4% |
| Engineering | 0 | 0.0% |
| Multidisciplinary Studies | 0 | 0.0% |
| Science & Technology | 131 | 44.6% |
| Business | 97 | 33.0% |
| Education | 22 | 7.5% |
| Literature & Languages | 0 | 0.0% |
| Liberal Arts & History | 0 | 0.0% |
| Visual & Performing Arts | 19 | 6.5% |
| Communications | 0 | 0.0% |
| Arts & Humanities | 0 | 0.0% |
| Total | 294 | 100.0% |
Transportation & Commute in Mascot
Vehicle Availability by Sex in Mascot
The most prevalent vehicle ownership categories in Mascot are males with 2 vehicles (326, accounting for 47.0%) and females with 2 vehicles (280, making up 57.5%).
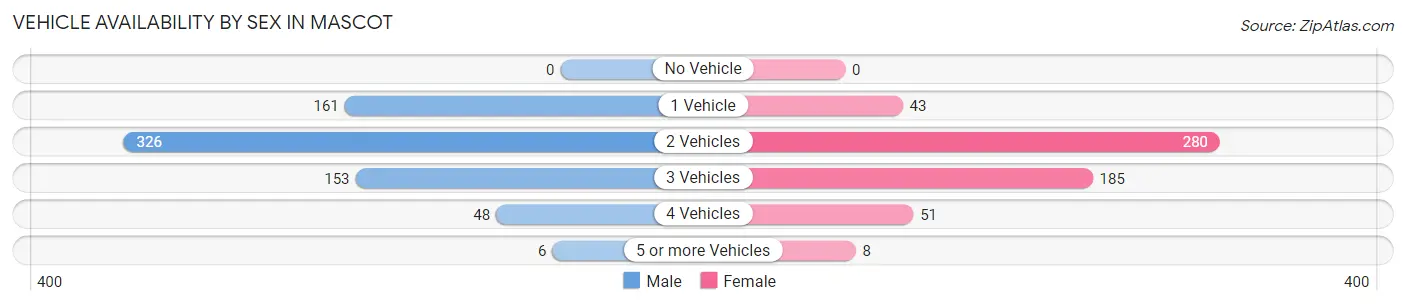
| Vehicles Available | Male | Female |
| No Vehicle | 0 (0.0%) | 0 (0.0%) |
| 1 Vehicle | 161 (23.2%) | 43 (7.6%) |
| 2 Vehicles | 326 (47.0%) | 280 (49.4%) |
| 3 Vehicles | 153 (22.1%) | 185 (32.6%) |
| 4 Vehicles | 48 (6.9%) | 51 (9.0%) |
| 5 or more Vehicles | 6 (0.9%) | 8 (1.4%) |
| Total | 694 (100.0%) | 567 (100.0%) |
Commute Time in Mascot
The most frequently occuring commute durations in Mascot are 30 to 34 minutes (344 commuters, 27.7%), 10 to 14 minutes (189 commuters, 15.2%), and 20 to 24 minutes (177 commuters, 14.2%).
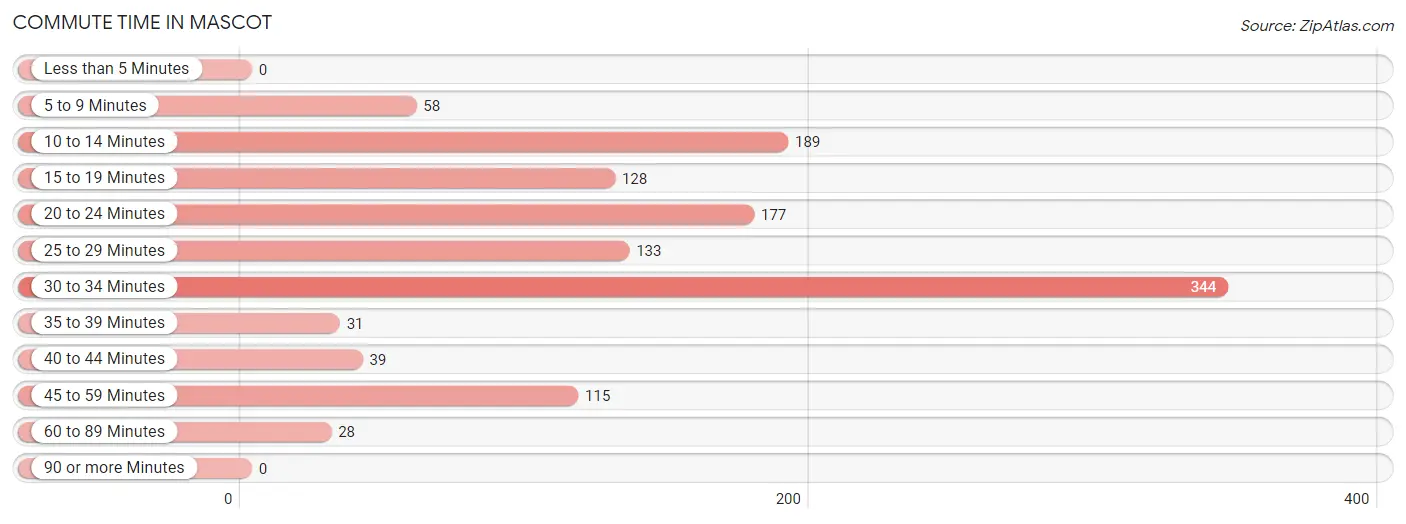
| Commute Time | # Commuters | % Commuters |
| Less than 5 Minutes | 0 | 0.0% |
| 5 to 9 Minutes | 58 | 4.7% |
| 10 to 14 Minutes | 189 | 15.2% |
| 15 to 19 Minutes | 128 | 10.3% |
| 20 to 24 Minutes | 177 | 14.2% |
| 25 to 29 Minutes | 133 | 10.7% |
| 30 to 34 Minutes | 344 | 27.7% |
| 35 to 39 Minutes | 31 | 2.5% |
| 40 to 44 Minutes | 39 | 3.1% |
| 45 to 59 Minutes | 115 | 9.3% |
| 60 to 89 Minutes | 28 | 2.2% |
| 90 or more Minutes | 0 | 0.0% |
Commute Time by Sex in Mascot
The most common commute times in Mascot are 10 to 14 minutes (159 commuters, 23.2%) for males and 30 to 34 minutes (203 commuters, 36.4%) for females.
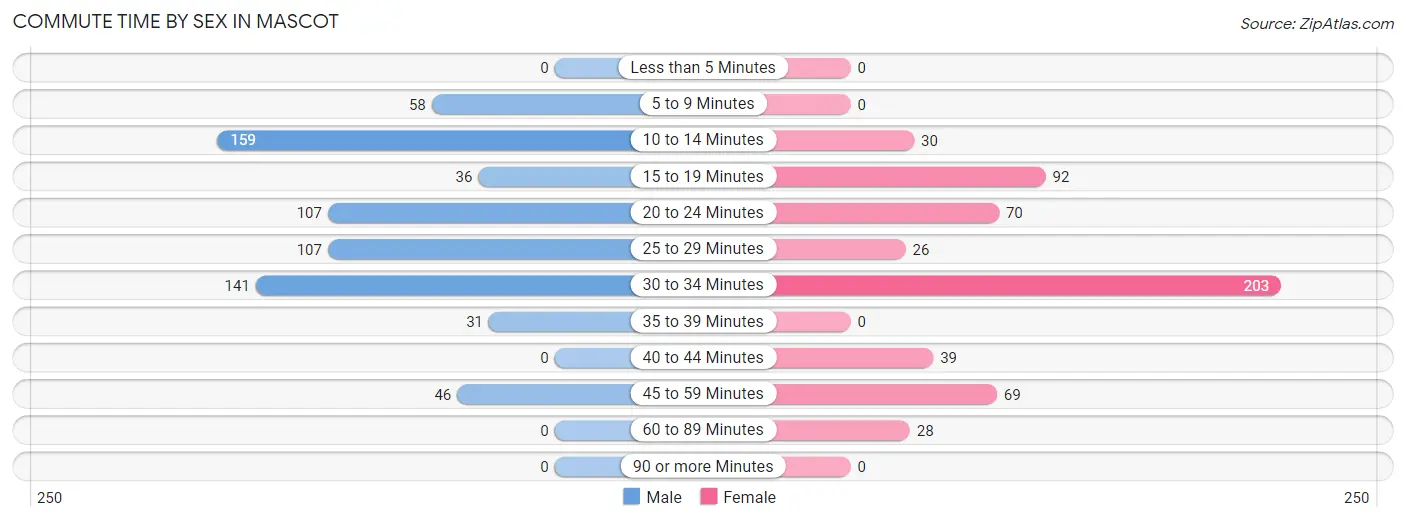
| Commute Time | Male | Female |
| Less than 5 Minutes | 0 (0.0%) | 0 (0.0%) |
| 5 to 9 Minutes | 58 (8.5%) | 0 (0.0%) |
| 10 to 14 Minutes | 159 (23.2%) | 30 (5.4%) |
| 15 to 19 Minutes | 36 (5.3%) | 92 (16.5%) |
| 20 to 24 Minutes | 107 (15.6%) | 70 (12.6%) |
| 25 to 29 Minutes | 107 (15.6%) | 26 (4.7%) |
| 30 to 34 Minutes | 141 (20.6%) | 203 (36.4%) |
| 35 to 39 Minutes | 31 (4.5%) | 0 (0.0%) |
| 40 to 44 Minutes | 0 (0.0%) | 39 (7.0%) |
| 45 to 59 Minutes | 46 (6.7%) | 69 (12.4%) |
| 60 to 89 Minutes | 0 (0.0%) | 28 (5.0%) |
| 90 or more Minutes | 0 (0.0%) | 0 (0.0%) |
Time of Departure to Work by Sex in Mascot
The most frequent times of departure to work in Mascot are 12:00 AM to 4:59 AM (173, 25.3%) for males and 6:00 AM to 6:29 AM (139, 25.0%) for females.
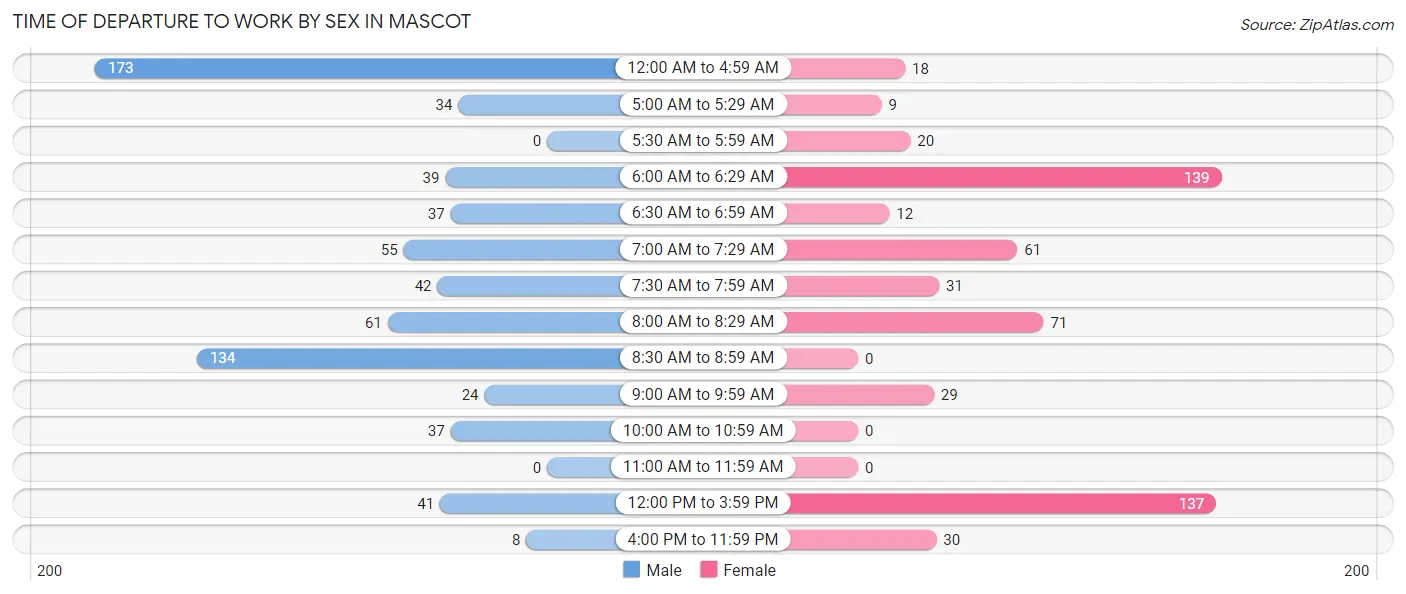
| Time of Departure | Male | Female |
| 12:00 AM to 4:59 AM | 173 (25.3%) | 18 (3.2%) |
| 5:00 AM to 5:29 AM | 34 (5.0%) | 9 (1.6%) |
| 5:30 AM to 5:59 AM | 0 (0.0%) | 20 (3.6%) |
| 6:00 AM to 6:29 AM | 39 (5.7%) | 139 (25.0%) |
| 6:30 AM to 6:59 AM | 37 (5.4%) | 12 (2.1%) |
| 7:00 AM to 7:29 AM | 55 (8.0%) | 61 (11.0%) |
| 7:30 AM to 7:59 AM | 42 (6.1%) | 31 (5.6%) |
| 8:00 AM to 8:29 AM | 61 (8.9%) | 71 (12.8%) |
| 8:30 AM to 8:59 AM | 134 (19.6%) | 0 (0.0%) |
| 9:00 AM to 9:59 AM | 24 (3.5%) | 29 (5.2%) |
| 10:00 AM to 10:59 AM | 37 (5.4%) | 0 (0.0%) |
| 11:00 AM to 11:59 AM | 0 (0.0%) | 0 (0.0%) |
| 12:00 PM to 3:59 PM | 41 (6.0%) | 137 (24.6%) |
| 4:00 PM to 11:59 PM | 8 (1.2%) | 30 (5.4%) |
| Total | 685 (100.0%) | 557 (100.0%) |
Housing Occupancy in Mascot
Occupancy by Ownership in Mascot
Of the total 1,132 dwellings in Mascot, owner-occupied units account for 723 (63.9%), while renter-occupied units make up 409 (36.1%).
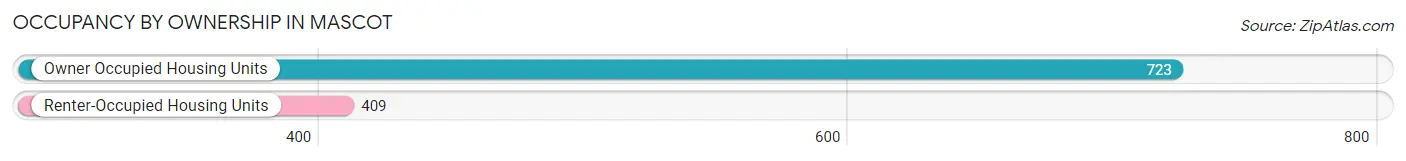
| Occupancy | # Housing Units | % Housing Units |
| Owner Occupied Housing Units | 723 | 63.9% |
| Renter-Occupied Housing Units | 409 | 36.1% |
| Total Occupied Housing Units | 1,132 | 100.0% |
Occupancy by Household Size in Mascot
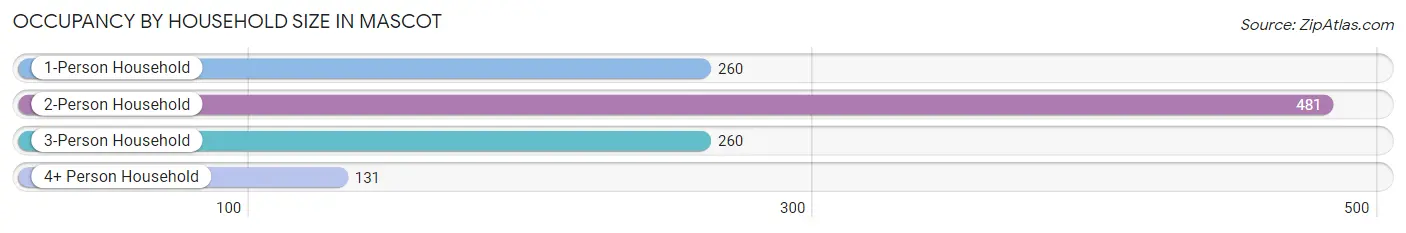
| Household Size | # Housing Units | % Housing Units |
| 1-Person Household | 260 | 23.0% |
| 2-Person Household | 481 | 42.5% |
| 3-Person Household | 260 | 23.0% |
| 4+ Person Household | 131 | 11.6% |
| Total Housing Units | 1,132 | 100.0% |
Occupancy by Ownership by Household Size in Mascot
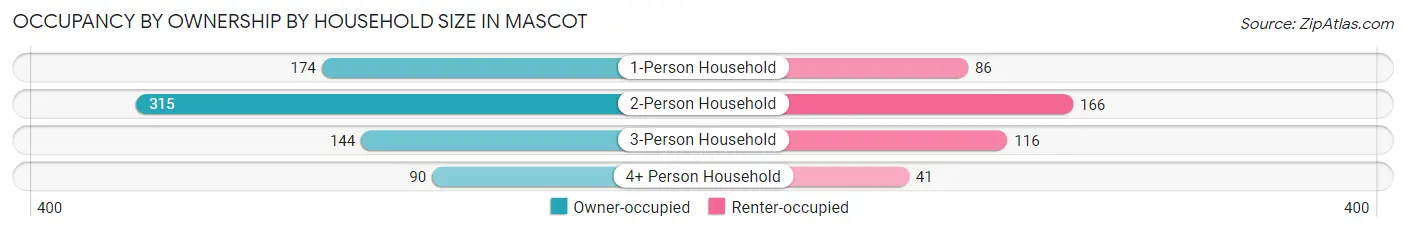
| Household Size | Owner-occupied | Renter-occupied |
| 1-Person Household | 174 (66.9%) | 86 (33.1%) |
| 2-Person Household | 315 (65.5%) | 166 (34.5%) |
| 3-Person Household | 144 (55.4%) | 116 (44.6%) |
| 4+ Person Household | 90 (68.7%) | 41 (31.3%) |
| Total Housing Units | 723 (63.9%) | 409 (36.1%) |
Occupancy by Educational Attainment in Mascot
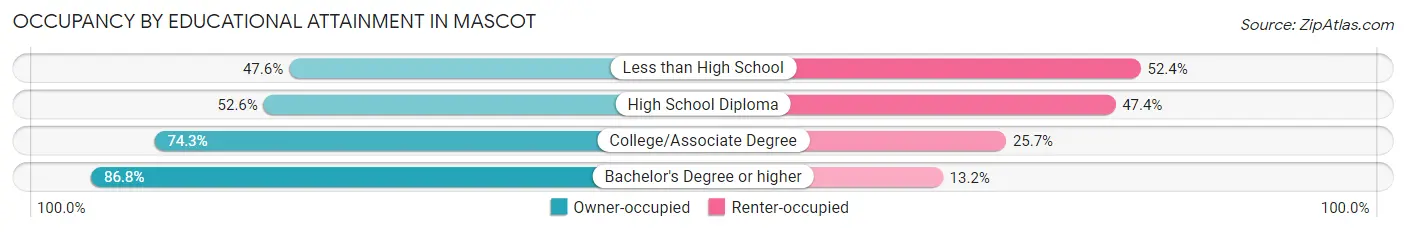
| Household Size | Owner-occupied | Renter-occupied |
| Less than High School | 128 (47.6%) | 141 (52.4%) |
| High School Diploma | 151 (52.6%) | 136 (47.4%) |
| College/Associate Degree | 332 (74.3%) | 115 (25.7%) |
| Bachelor's Degree or higher | 112 (86.8%) | 17 (13.2%) |
Occupancy by Age of Householder in Mascot
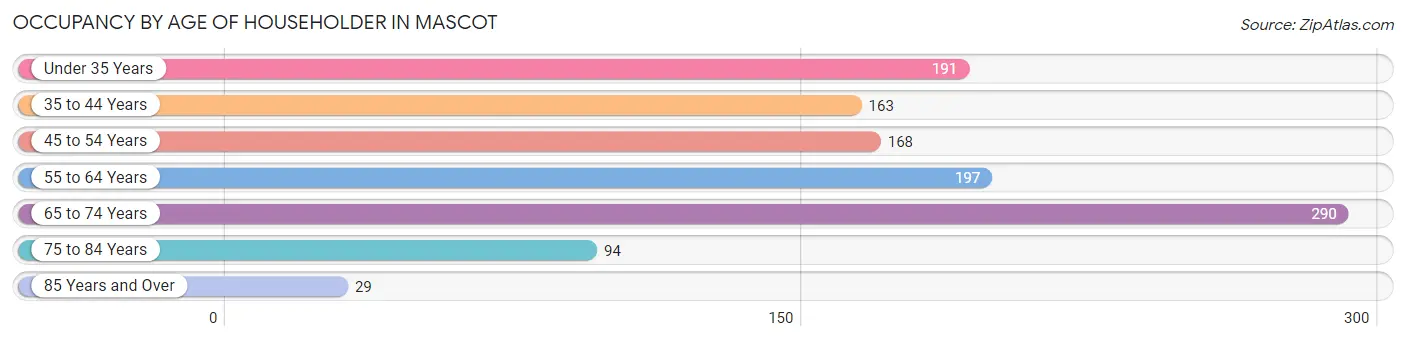
| Age Bracket | # Households | % Households |
| Under 35 Years | 191 | 16.9% |
| 35 to 44 Years | 163 | 14.4% |
| 45 to 54 Years | 168 | 14.8% |
| 55 to 64 Years | 197 | 17.4% |
| 65 to 74 Years | 290 | 25.6% |
| 75 to 84 Years | 94 | 8.3% |
| 85 Years and Over | 29 | 2.6% |
| Total | 1,132 | 100.0% |
Housing Finances in Mascot
Median Income by Occupancy in Mascot
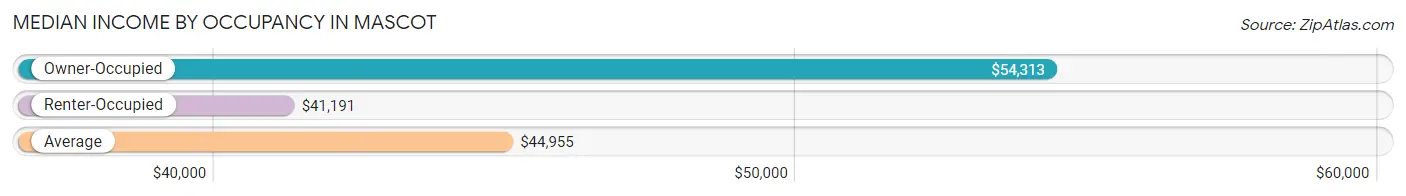
| Occupancy Type | # Households | Median Income |
| Owner-Occupied | 723 (63.9%) | $54,313 |
| Renter-Occupied | 409 (36.1%) | $41,191 |
| Average | 1,132 (100.0%) | $44,955 |
Occupancy by Householder Income Bracket in Mascot
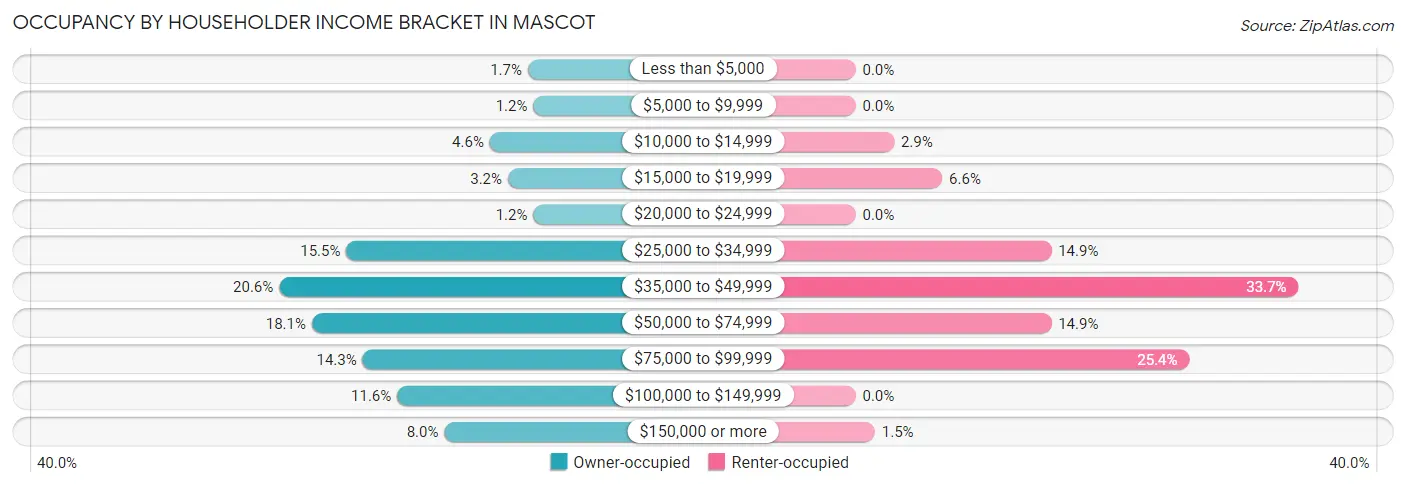
| Income Bracket | Owner-occupied | Renter-occupied |
| Less than $5,000 | 12 (1.7%) | 0 (0.0%) |
| $5,000 to $9,999 | 9 (1.2%) | 0 (0.0%) |
| $10,000 to $14,999 | 33 (4.6%) | 12 (2.9%) |
| $15,000 to $19,999 | 23 (3.2%) | 27 (6.6%) |
| $20,000 to $24,999 | 9 (1.2%) | 0 (0.0%) |
| $25,000 to $34,999 | 112 (15.5%) | 61 (14.9%) |
| $35,000 to $49,999 | 149 (20.6%) | 138 (33.7%) |
| $50,000 to $74,999 | 131 (18.1%) | 61 (14.9%) |
| $75,000 to $99,999 | 103 (14.2%) | 104 (25.4%) |
| $100,000 to $149,999 | 84 (11.6%) | 0 (0.0%) |
| $150,000 or more | 58 (8.0%) | 6 (1.5%) |
| Total | 723 (100.0%) | 409 (100.0%) |
Monthly Housing Cost Tiers in Mascot
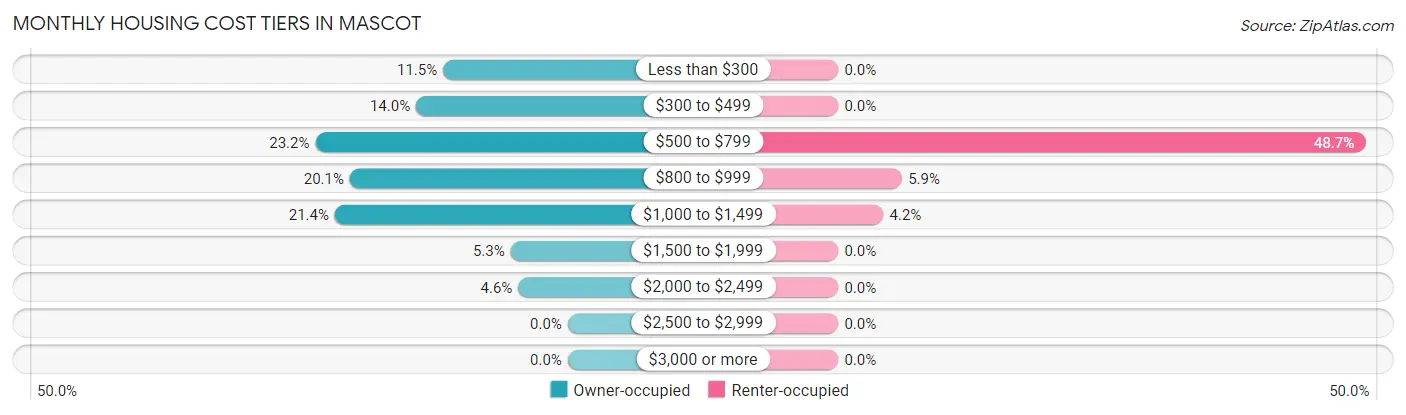
| Monthly Cost | Owner-occupied | Renter-occupied |
| Less than $300 | 83 (11.5%) | 0 (0.0%) |
| $300 to $499 | 101 (14.0%) | 0 (0.0%) |
| $500 to $799 | 168 (23.2%) | 199 (48.7%) |
| $800 to $999 | 145 (20.1%) | 24 (5.9%) |
| $1,000 to $1,499 | 155 (21.4%) | 17 (4.2%) |
| $1,500 to $1,999 | 38 (5.3%) | 0 (0.0%) |
| $2,000 to $2,499 | 33 (4.6%) | 0 (0.0%) |
| $2,500 to $2,999 | 0 (0.0%) | 0 (0.0%) |
| $3,000 or more | 0 (0.0%) | 0 (0.0%) |
| Total | 723 (100.0%) | 409 (100.0%) |
Physical Housing Characteristics in Mascot
Housing Structures in Mascot
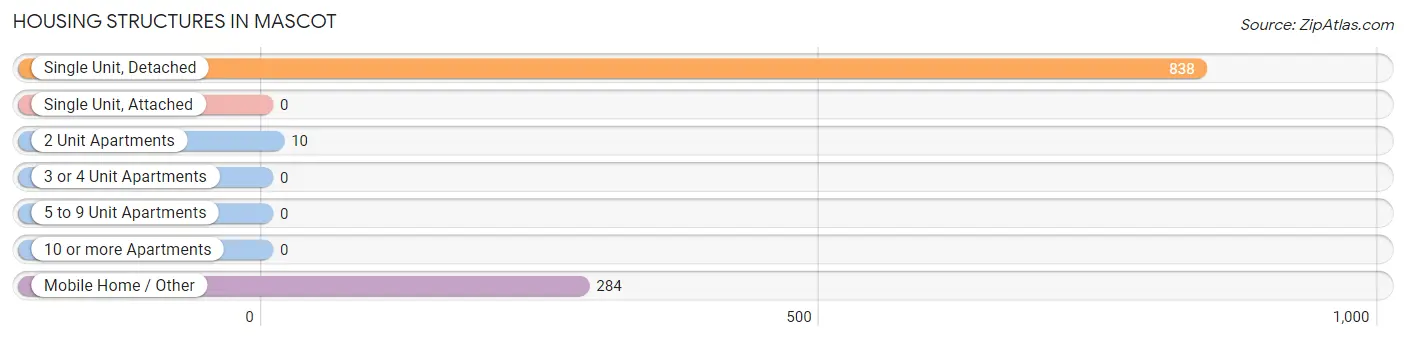
| Structure Type | # Housing Units | % Housing Units |
| Single Unit, Detached | 838 | 74.0% |
| Single Unit, Attached | 0 | 0.0% |
| 2 Unit Apartments | 10 | 0.9% |
| 3 or 4 Unit Apartments | 0 | 0.0% |
| 5 to 9 Unit Apartments | 0 | 0.0% |
| 10 or more Apartments | 0 | 0.0% |
| Mobile Home / Other | 284 | 25.1% |
| Total | 1,132 | 100.0% |
Housing Structures by Occupancy in Mascot
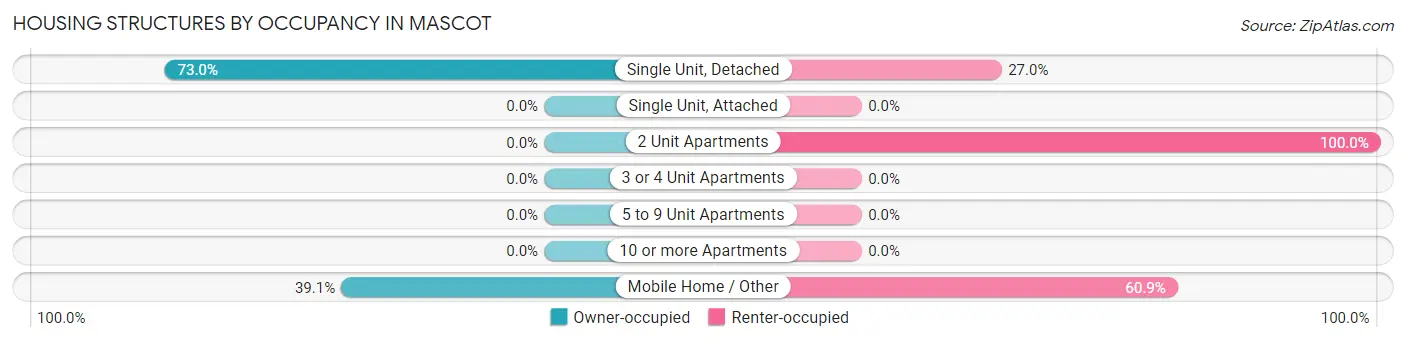
| Structure Type | Owner-occupied | Renter-occupied |
| Single Unit, Detached | 612 (73.0%) | 226 (27.0%) |
| Single Unit, Attached | 0 (0.0%) | 0 (0.0%) |
| 2 Unit Apartments | 0 (0.0%) | 10 (100.0%) |
| 3 or 4 Unit Apartments | 0 (0.0%) | 0 (0.0%) |
| 5 to 9 Unit Apartments | 0 (0.0%) | 0 (0.0%) |
| 10 or more Apartments | 0 (0.0%) | 0 (0.0%) |
| Mobile Home / Other | 111 (39.1%) | 173 (60.9%) |
| Total | 723 (63.9%) | 409 (36.1%) |
Housing Structures by Number of Rooms in Mascot
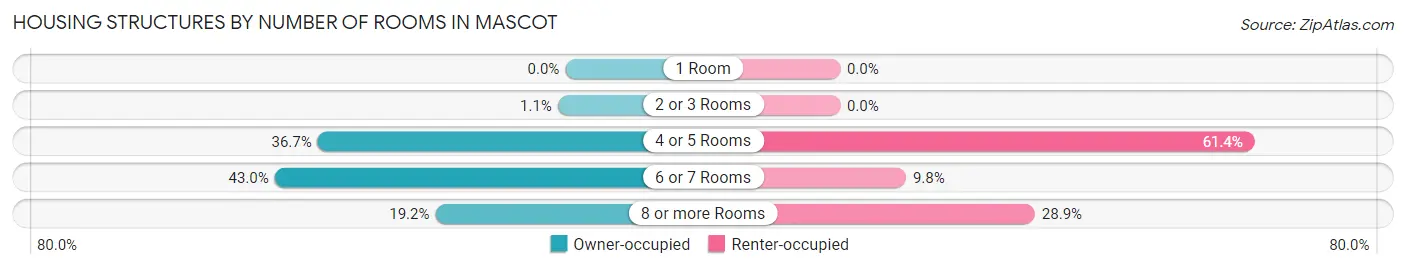
| Number of Rooms | Owner-occupied | Renter-occupied |
| 1 Room | 0 (0.0%) | 0 (0.0%) |
| 2 or 3 Rooms | 8 (1.1%) | 0 (0.0%) |
| 4 or 5 Rooms | 265 (36.6%) | 251 (61.4%) |
| 6 or 7 Rooms | 311 (43.0%) | 40 (9.8%) |
| 8 or more Rooms | 139 (19.2%) | 118 (28.8%) |
| Total | 723 (100.0%) | 409 (100.0%) |
Housing Structure by Heating Type in Mascot
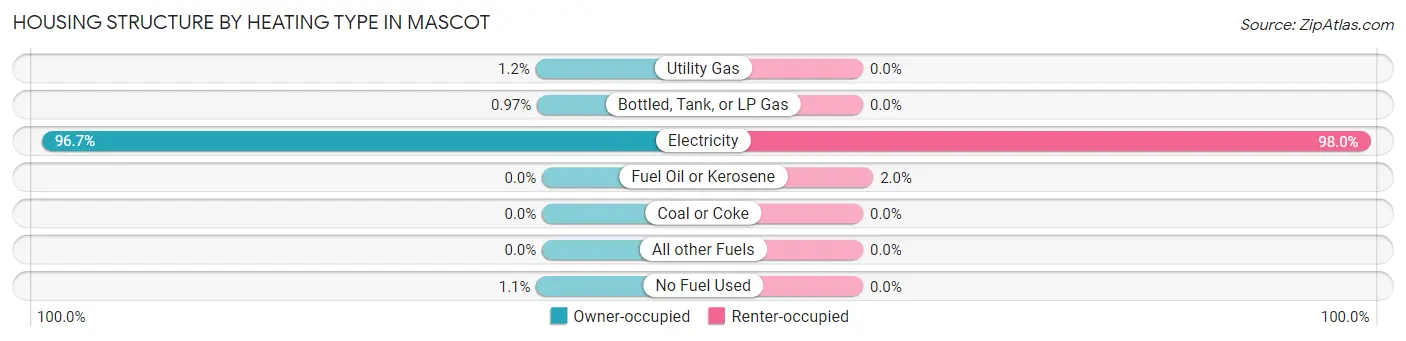
| Heating Type | Owner-occupied | Renter-occupied |
| Utility Gas | 9 (1.2%) | 0 (0.0%) |
| Bottled, Tank, or LP Gas | 7 (1.0%) | 0 (0.0%) |
| Electricity | 699 (96.7%) | 401 (98.0%) |
| Fuel Oil or Kerosene | 0 (0.0%) | 8 (2.0%) |
| Coal or Coke | 0 (0.0%) | 0 (0.0%) |
| All other Fuels | 0 (0.0%) | 0 (0.0%) |
| No Fuel Used | 8 (1.1%) | 0 (0.0%) |
| Total | 723 (100.0%) | 409 (100.0%) |
Household Vehicle Usage in Mascot
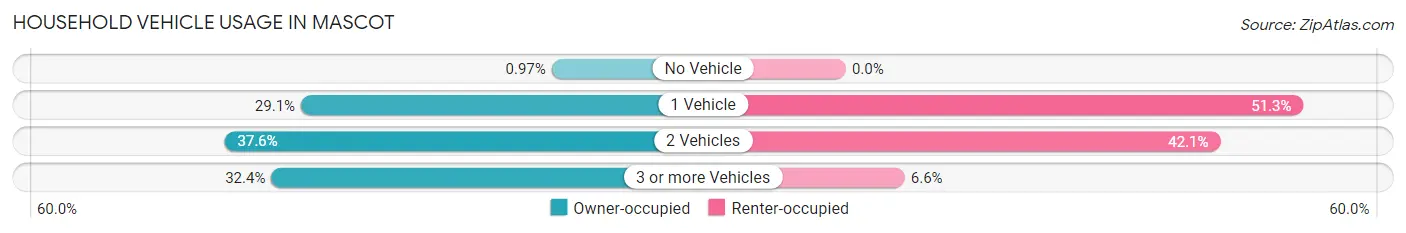
| Vehicles per Household | Owner-occupied | Renter-occupied |
| No Vehicle | 7 (1.0%) | 0 (0.0%) |
| 1 Vehicle | 210 (29.0%) | 210 (51.3%) |
| 2 Vehicles | 272 (37.6%) | 172 (42.0%) |
| 3 or more Vehicles | 234 (32.4%) | 27 (6.6%) |
| Total | 723 (100.0%) | 409 (100.0%) |
Real Estate & Mortgages in Mascot
Real Estate and Mortgage Overview in Mascot
| Characteristic | Without Mortgage | With Mortgage |
| Housing Units | 292 | 431 |
| Median Property Value | $157,900 | $167,500 |
| Median Household Income | $48,056 | $58 |
| Monthly Housing Costs | $422 | $0 |
| Real Estate Taxes | $593 | $10 |
Property Value by Mortgage Status in Mascot
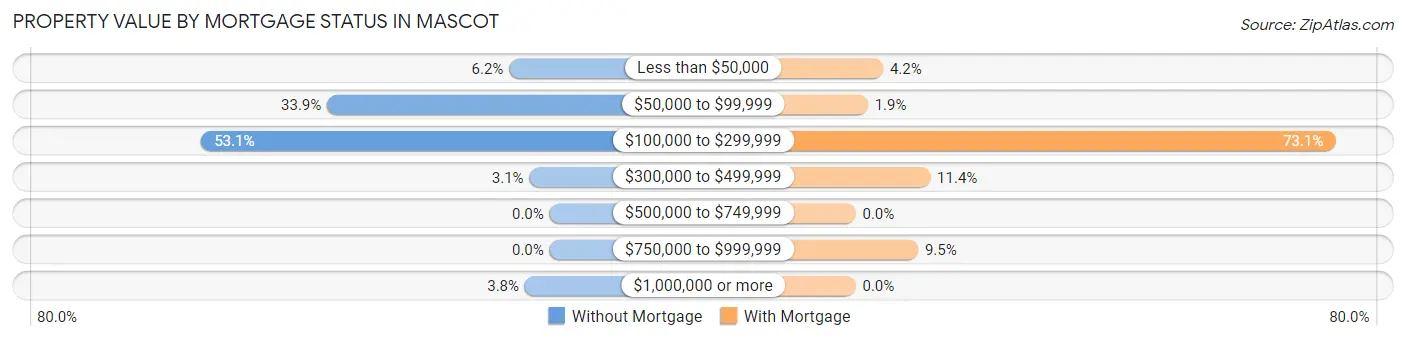
| Property Value | Without Mortgage | With Mortgage |
| Less than $50,000 | 18 (6.2%) | 18 (4.2%) |
| $50,000 to $99,999 | 99 (33.9%) | 8 (1.9%) |
| $100,000 to $299,999 | 155 (53.1%) | 315 (73.1%) |
| $300,000 to $499,999 | 9 (3.1%) | 49 (11.4%) |
| $500,000 to $749,999 | 0 (0.0%) | 0 (0.0%) |
| $750,000 to $999,999 | 0 (0.0%) | 41 (9.5%) |
| $1,000,000 or more | 11 (3.8%) | 0 (0.0%) |
| Total | 292 (100.0%) | 431 (100.0%) |
Household Income by Mortgage Status in Mascot
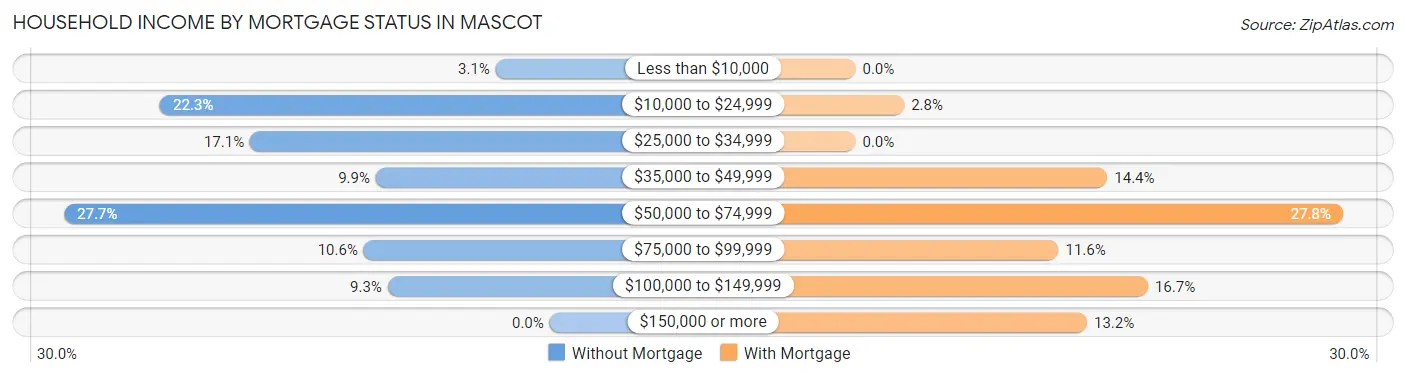
| Household Income | Without Mortgage | With Mortgage |
| Less than $10,000 | 9 (3.1%) | 0 (0.0%) |
| $10,000 to $24,999 | 65 (22.3%) | 12 (2.8%) |
| $25,000 to $34,999 | 50 (17.1%) | 0 (0.0%) |
| $35,000 to $49,999 | 29 (9.9%) | 62 (14.4%) |
| $50,000 to $74,999 | 81 (27.7%) | 120 (27.8%) |
| $75,000 to $99,999 | 31 (10.6%) | 50 (11.6%) |
| $100,000 to $149,999 | 27 (9.2%) | 72 (16.7%) |
| $150,000 or more | 0 (0.0%) | 57 (13.2%) |
| Total | 292 (100.0%) | 431 (100.0%) |
Property Value to Household Income Ratio in Mascot
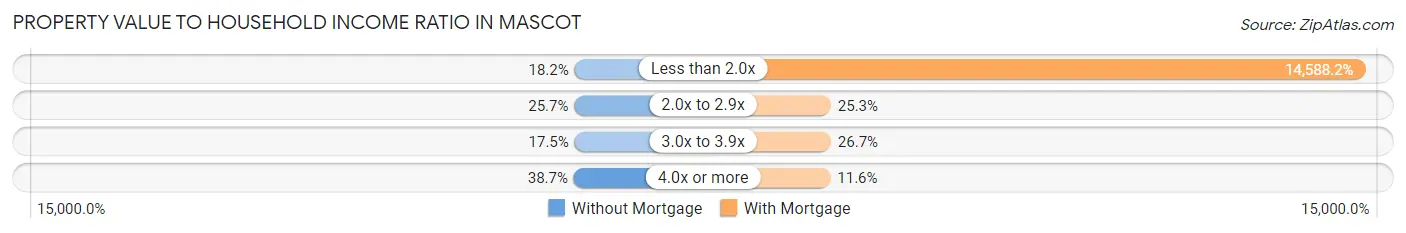
| Value-to-Income Ratio | Without Mortgage | With Mortgage |
| Less than 2.0x | 53 (18.1%) | 62,875 (14,588.2%) |
| 2.0x to 2.9x | 75 (25.7%) | 109 (25.3%) |
| 3.0x to 3.9x | 51 (17.5%) | 115 (26.7%) |
| 4.0x or more | 113 (38.7%) | 50 (11.6%) |
| Total | 292 (100.0%) | 431 (100.0%) |
Real Estate Taxes by Mortgage Status in Mascot
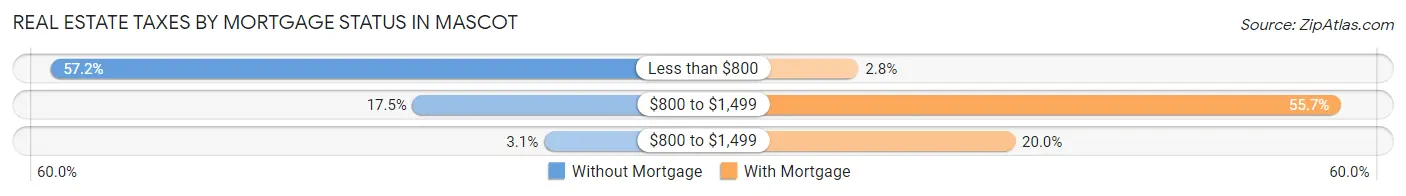
| Property Taxes | Without Mortgage | With Mortgage |
| Less than $800 | 167 (57.2%) | 12 (2.8%) |
| $800 to $1,499 | 51 (17.5%) | 240 (55.7%) |
| $800 to $1,499 | 9 (3.1%) | 86 (20.0%) |
| Total | 292 (100.0%) | 431 (100.0%) |
Health & Disability in Mascot
Health Insurance Coverage by Age in Mascot
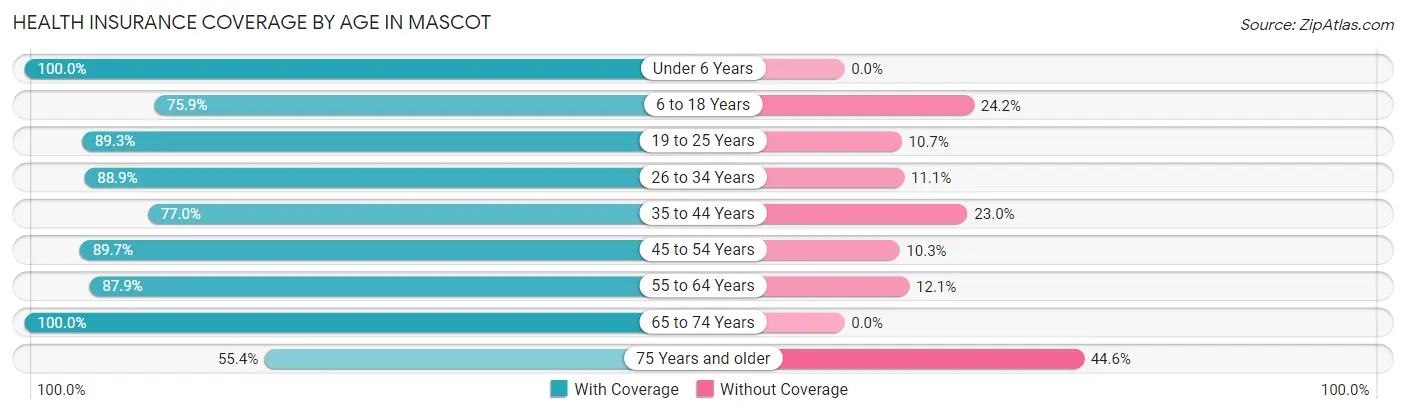
| Age Bracket | With Coverage | Without Coverage |
| Under 6 Years | 126 (100.0%) | 0 (0.0%) |
| 6 to 18 Years | 333 (75.8%) | 106 (24.1%) |
| 19 to 25 Years | 117 (89.3%) | 14 (10.7%) |
| 26 to 34 Years | 367 (88.9%) | 46 (11.1%) |
| 35 to 44 Years | 198 (77.0%) | 59 (23.0%) |
| 45 to 54 Years | 288 (89.7%) | 33 (10.3%) |
| 55 to 64 Years | 349 (87.9%) | 48 (12.1%) |
| 65 to 74 Years | 398 (100.0%) | 0 (0.0%) |
| 75 Years and older | 129 (55.4%) | 104 (44.6%) |
| Total | 2,305 (84.9%) | 410 (15.1%) |
Health Insurance Coverage by Citizenship Status in Mascot
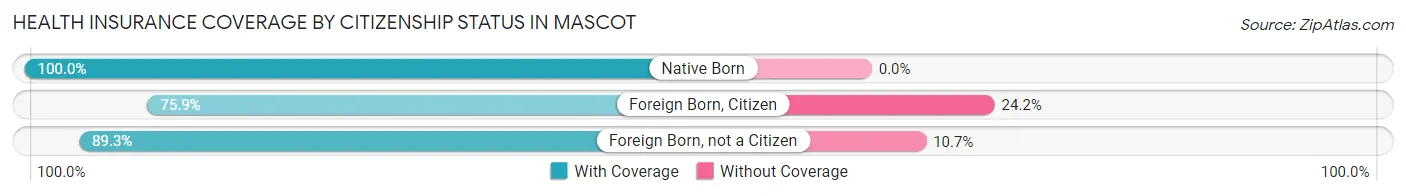
| Citizenship Status | With Coverage | Without Coverage |
| Native Born | 126 (100.0%) | 0 (0.0%) |
| Foreign Born, Citizen | 333 (75.8%) | 106 (24.1%) |
| Foreign Born, not a Citizen | 117 (89.3%) | 14 (10.7%) |
Health Insurance Coverage by Household Income in Mascot
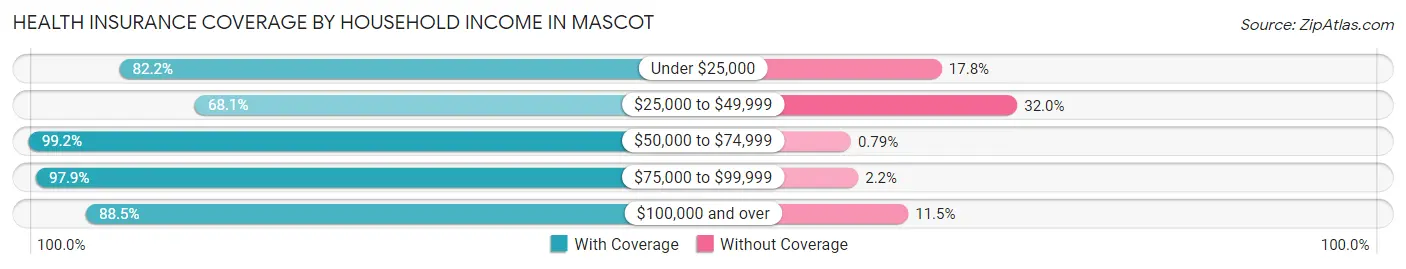
| Household Income | With Coverage | Without Coverage |
| Under $25,000 | 166 (82.2%) | 36 (17.8%) |
| $25,000 to $49,999 | 654 (68.0%) | 307 (32.0%) |
| $50,000 to $74,999 | 631 (99.2%) | 5 (0.8%) |
| $75,000 to $99,999 | 455 (97.9%) | 10 (2.1%) |
| $100,000 and over | 399 (88.5%) | 52 (11.5%) |
Public vs Private Health Insurance Coverage by Age in Mascot
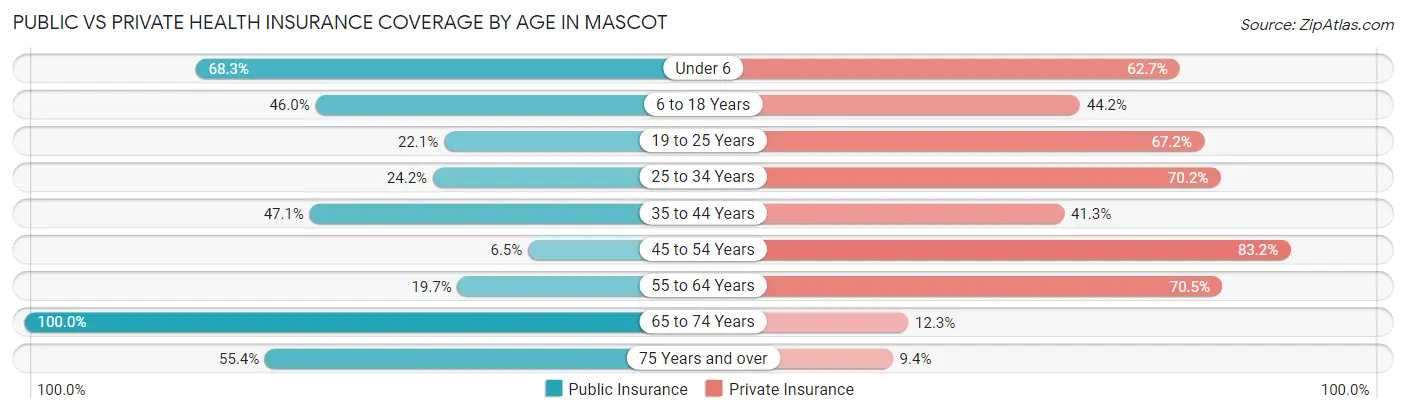
| Age Bracket | Public Insurance | Private Insurance |
| Under 6 | 86 (68.2%) | 79 (62.7%) |
| 6 to 18 Years | 202 (46.0%) | 194 (44.2%) |
| 19 to 25 Years | 29 (22.1%) | 88 (67.2%) |
| 25 to 34 Years | 100 (24.2%) | 290 (70.2%) |
| 35 to 44 Years | 121 (47.1%) | 106 (41.2%) |
| 45 to 54 Years | 21 (6.5%) | 267 (83.2%) |
| 55 to 64 Years | 78 (19.7%) | 280 (70.5%) |
| 65 to 74 Years | 398 (100.0%) | 49 (12.3%) |
| 75 Years and over | 129 (55.4%) | 22 (9.4%) |
| Total | 1,164 (42.9%) | 1,375 (50.6%) |
Disability Status by Sex by Age in Mascot
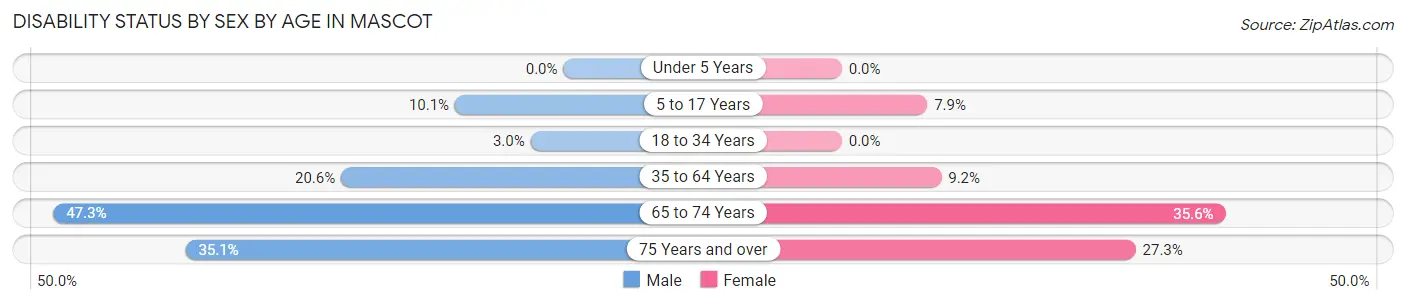
| Age Bracket | Male | Female |
| Under 5 Years | 0 (0.0%) | 0 (0.0%) |
| 5 to 17 Years | 16 (10.1%) | 23 (7.9%) |
| 18 to 34 Years | 10 (3.0%) | 0 (0.0%) |
| 35 to 64 Years | 105 (20.6%) | 43 (9.2%) |
| 65 to 74 Years | 98 (47.3%) | 68 (35.6%) |
| 75 Years and over | 47 (35.1%) | 27 (27.3%) |
Disability Class by Sex by Age in Mascot
Disability Class: Hearing Difficulty
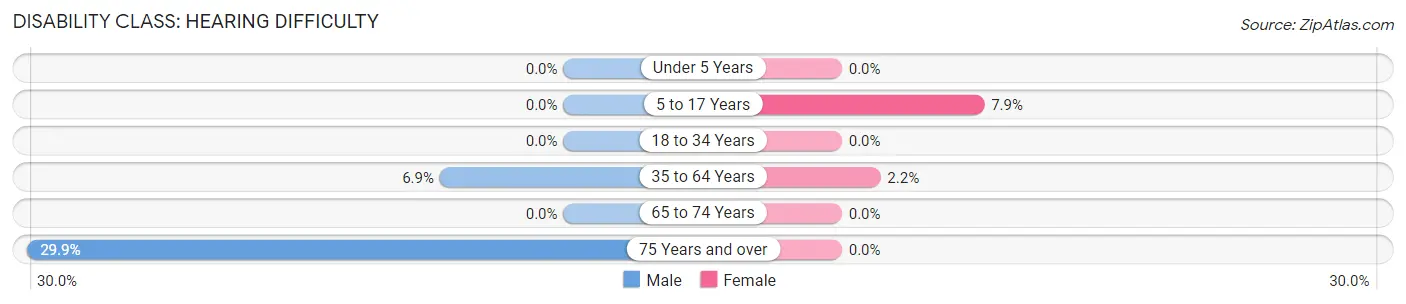
| Age Bracket | Male | Female |
| Under 5 Years | 0 (0.0%) | 0 (0.0%) |
| 5 to 17 Years | 0 (0.0%) | 23 (7.9%) |
| 18 to 34 Years | 0 (0.0%) | 0 (0.0%) |
| 35 to 64 Years | 35 (6.9%) | 10 (2.1%) |
| 65 to 74 Years | 0 (0.0%) | 0 (0.0%) |
| 75 Years and over | 40 (29.8%) | 0 (0.0%) |
Disability Class: Vision Difficulty
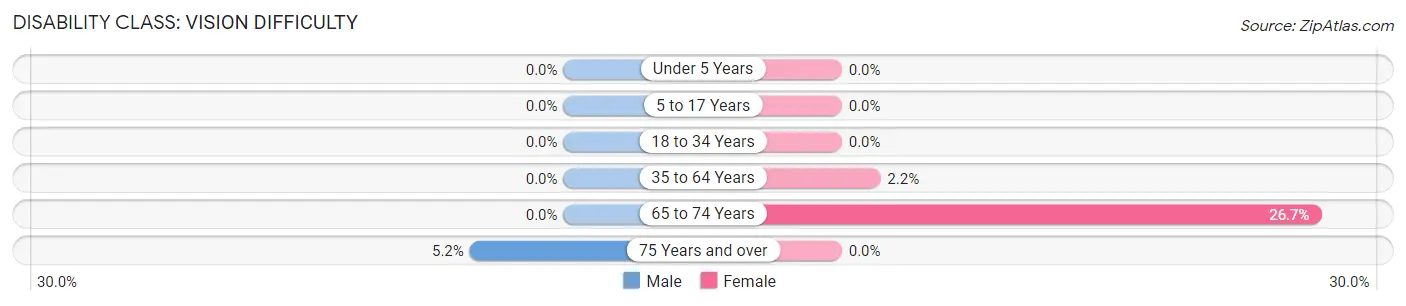
| Age Bracket | Male | Female |
| Under 5 Years | 0 (0.0%) | 0 (0.0%) |
| 5 to 17 Years | 0 (0.0%) | 0 (0.0%) |
| 18 to 34 Years | 0 (0.0%) | 0 (0.0%) |
| 35 to 64 Years | 0 (0.0%) | 10 (2.1%) |
| 65 to 74 Years | 0 (0.0%) | 51 (26.7%) |
| 75 Years and over | 7 (5.2%) | 0 (0.0%) |
Disability Class: Cognitive Difficulty
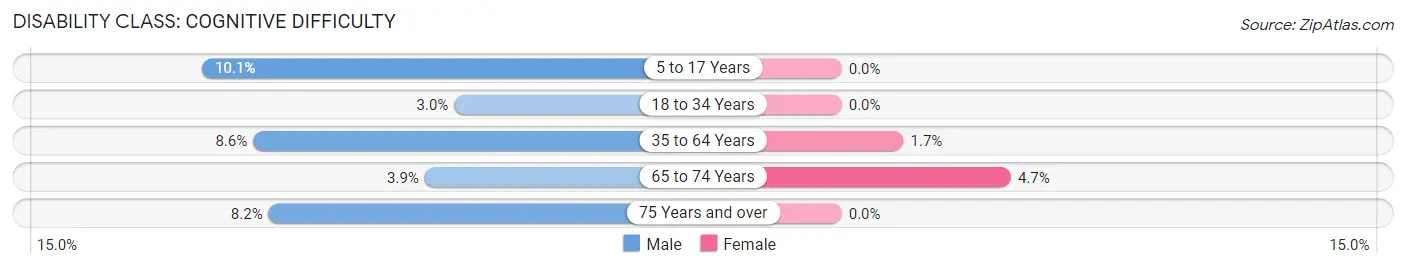
| Age Bracket | Male | Female |
| 5 to 17 Years | 16 (10.1%) | 0 (0.0%) |
| 18 to 34 Years | 10 (3.0%) | 0 (0.0%) |
| 35 to 64 Years | 44 (8.6%) | 8 (1.7%) |
| 65 to 74 Years | 8 (3.9%) | 9 (4.7%) |
| 75 Years and over | 11 (8.2%) | 0 (0.0%) |
Disability Class: Ambulatory Difficulty
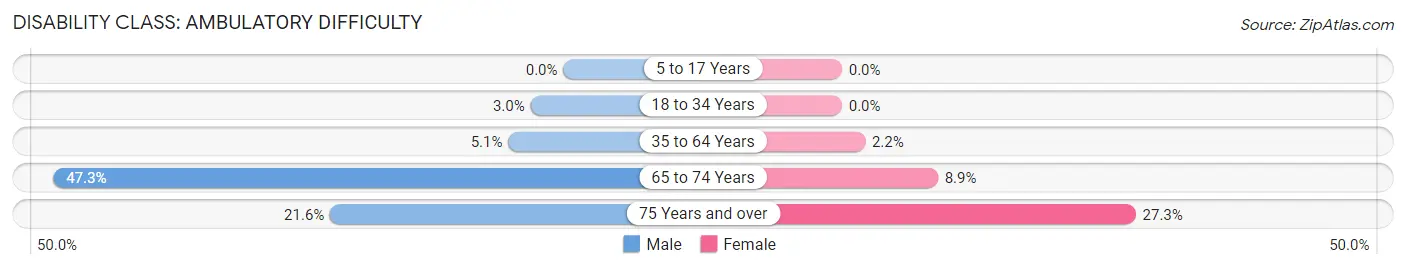
| Age Bracket | Male | Female |
| 5 to 17 Years | 0 (0.0%) | 0 (0.0%) |
| 18 to 34 Years | 10 (3.0%) | 0 (0.0%) |
| 35 to 64 Years | 26 (5.1%) | 10 (2.1%) |
| 65 to 74 Years | 98 (47.3%) | 17 (8.9%) |
| 75 Years and over | 29 (21.6%) | 27 (27.3%) |
Disability Class: Self-Care Difficulty
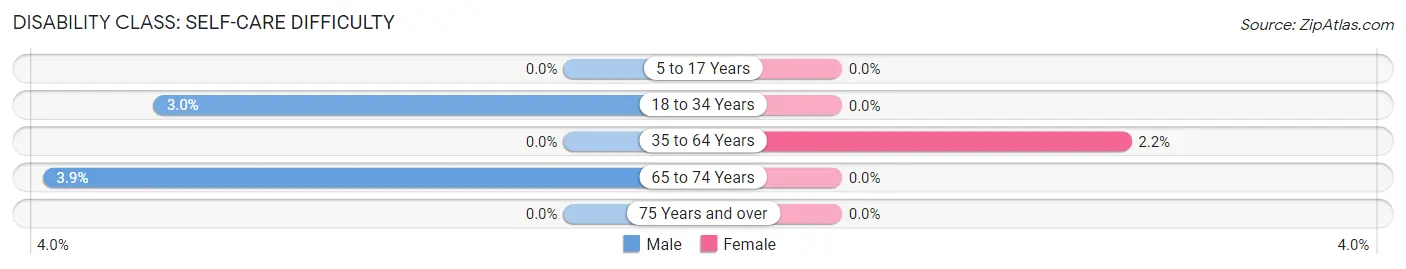
| Age Bracket | Male | Female |
| 5 to 17 Years | 0 (0.0%) | 0 (0.0%) |
| 18 to 34 Years | 10 (3.0%) | 0 (0.0%) |
| 35 to 64 Years | 0 (0.0%) | 10 (2.1%) |
| 65 to 74 Years | 8 (3.9%) | 0 (0.0%) |
| 75 Years and over | 0 (0.0%) | 0 (0.0%) |
Technology Access in Mascot
Computing Device Access in Mascot
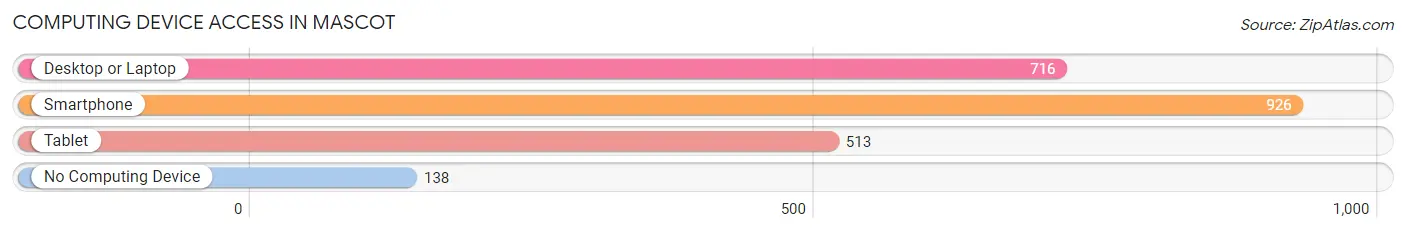
| Device Type | # Households | % Households |
| Desktop or Laptop | 716 | 63.2% |
| Smartphone | 926 | 81.8% |
| Tablet | 513 | 45.3% |
| No Computing Device | 138 | 12.2% |
| Total | 1,132 | 100.0% |
Internet Access in Mascot
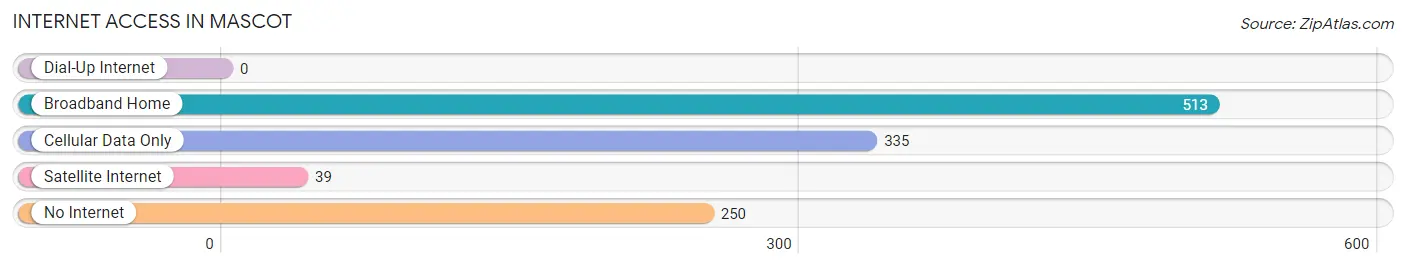
| Internet Type | # Households | % Households |
| Dial-Up Internet | 0 | 0.0% |
| Broadband Home | 513 | 45.3% |
| Cellular Data Only | 335 | 29.6% |
| Satellite Internet | 39 | 3.5% |
| No Internet | 250 | 22.1% |
| Total | 1,132 | 100.0% |
Mascot Summary
Mascot is a small unincorporated community located in Knox County, Tennessee. It is situated in the foothills of the Great Smoky Mountains, approximately 15 miles south of Knoxville. The community is home to a population of approximately 1,000 people, and is known for its rural charm and friendly atmosphere.
History
Mascot was first settled in the early 1800s by a group of settlers from North Carolina. The community was originally known as “Mascot Station”, and was named after a local Native American chief. The town was officially incorporated in 1883, and was home to a variety of businesses, including a general store, a blacksmith shop, and a post office.
In the early 1900s, Mascot began to experience a period of growth and prosperity. The town was home to several churches, a school, and a variety of businesses. The town also had a thriving agricultural industry, with many of the local farmers growing corn, wheat, and other crops.
In the mid-1900s, Mascot began to experience a period of decline. The town’s population began to decline, and many of the businesses and churches closed. In the late 1970s, the town was revitalized by the opening of a new shopping center, which brought new life to the community.
Geography
Mascot is located in the foothills of the Great Smoky Mountains, approximately 15 miles south of Knoxville. The town is situated in a valley, surrounded by rolling hills and lush forests. The town is located near the junction of Interstate 40 and US Highway 411, making it easily accessible from nearby cities.
The climate in Mascot is mild and temperate, with warm summers and cool winters. The average annual temperature is around 60 degrees Fahrenheit, and the average annual precipitation is around 45 inches.
Economy
Mascot’s economy is largely based on agriculture and tourism. The town is home to several farms, which produce a variety of crops, including corn, wheat, and soybeans. The town is also home to several tourist attractions, including a historic museum, a winery, and a variety of outdoor activities.
The town is also home to several small businesses, including restaurants, shops, and other services. The town is also home to a variety of manufacturing companies, which produce a variety of products, including furniture, clothing, and electronics.
Demographics
As of the 2010 census, Mascot had a population of 1,000 people. The racial makeup of the town was 97.2% White, 0.7% African American, 0.3% Native American, 0.2% Asian, and 1.6% from other races. The median household income was $37,500, and the median age was 41.
Mascot is a small, rural community with a friendly atmosphere and a strong sense of community. The town is home to a variety of businesses, churches, and other amenities, making it a great place to live and work.
Common Questions
What is Per Capita Income in Mascot?
Per Capita income in Mascot is $27,314.
What is the Median Family Income in Mascot?
Median Family Income in Mascot is $70,313.
What is the Median Household income in Mascot?
Median Household Income in Mascot is $44,955.
What is Income or Wage Gap in Mascot?
Income or Wage Gap in Mascot is 16.5%.
Women in Mascot earn 83.5 cents for every dollar earned by a man.
What is Inequality or Gini Index in Mascot?
Inequality or Gini Index in Mascot is 0.38.
What is the Total Population of Mascot?
Total Population of Mascot is 2,715.
What is the Total Male Population of Mascot?
Total Male Population of Mascot is 1,394.
What is the Total Female Population of Mascot?
Total Female Population of Mascot is 1,321.
What is the Ratio of Males per 100 Females in Mascot?
There are 105.53 Males per 100 Females in Mascot.
What is the Ratio of Females per 100 Males in Mascot?
There are 94.76 Females per 100 Males in Mascot.
What is the Median Population Age in Mascot?
Median Population Age in Mascot is 44.8 Years.
What is the Average Family Size in Mascot
Average Family Size in Mascot is 2.9 People.
What is the Average Household Size in Mascot
Average Household Size in Mascot is 2.4 People.
How Large is the Labor Force in Mascot?
There are 1,357 People in the Labor Forcein in Mascot.
What is the Percentage of People in the Labor Force in Mascot?
59.5% of People are in the Labor Force in Mascot.
What is the Unemployment Rate in Mascot?
Unemployment Rate in Mascot is 4.2%.