Luttrell, TN Map & Demographics
Luttrell Map
Luttrell Overview
$17,728
PER CAPITA INCOME
$39,391
AVG FAMILY INCOME
$37,292
AVG HOUSEHOLD INCOME
4.9%
WAGE / INCOME GAP [ % ]
95.1¢/ $1
WAGE / INCOME GAP [ $ ]
0.38
INEQUALITY / GINI INDEX
917
TOTAL POPULATION
471
MALE POPULATION
446
FEMALE POPULATION
105.61
MALES / 100 FEMALES
94.69
FEMALES / 100 MALES
46.7
MEDIAN AGE
2.9
AVG FAMILY SIZE
2.5
AVG HOUSEHOLD SIZE
282
LABOR FORCE [ PEOPLE ]
39.7%
PERCENT IN LABOR FORCE
4.3%
UNEMPLOYMENT RATE
Luttrell Zip Codes
Luttrell Area Codes
Income in Luttrell
Income Overview in Luttrell
Per Capita Income in Luttrell is $17,728, while median incomes of families and households are $39,391 and $37,292 respectively.
| Characteristic | Number | Measure |
| Per Capita Income | 917 | $17,728 |
| Median Family Income | 283 | $39,391 |
| Mean Family Income | 283 | $49,157 |
| Median Household Income | 362 | $37,292 |
| Mean Household Income | 362 | $43,668 |
| Income Deficit | 283 | $0 |
| Wage / Income Gap (%) | 917 | 4.87% |
| Wage / Income Gap ($) | 917 | 95.13¢ per $1 |
| Gini / Inequality Index | 917 | 0.38 |
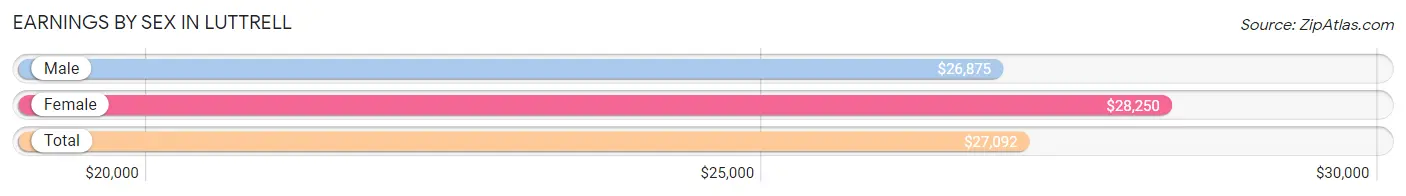
Earnings by Sex in Luttrell
Average Earnings in Luttrell are $27,092, $26,875 for men and $28,250 for women, a difference of 4.9%.
| Sex | Number | Average Earnings |
| Male | 201 (70.8%) | $26,875 |
| Female | 83 (29.2%) | $28,250 |
| Total | 284 (100.0%) | $27,092 |
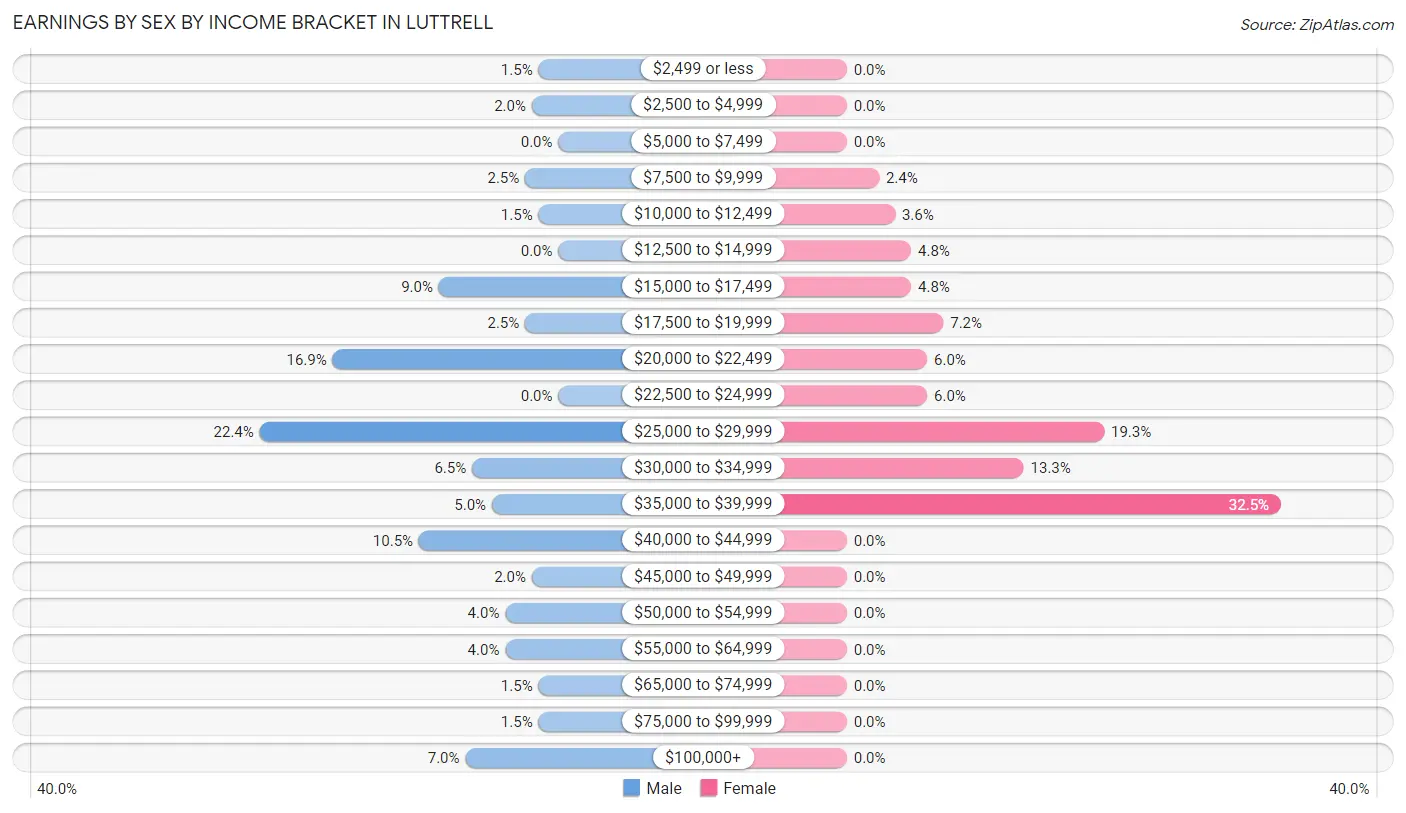
Earnings by Sex by Income Bracket in Luttrell
The most common earnings brackets in Luttrell are $25,000 to $29,999 for men (45 | 22.4%) and $35,000 to $39,999 for women (27 | 32.5%).
| Income | Male | Female |
| $2,499 or less | 3 (1.5%) | 0 (0.0%) |
| $2,500 to $4,999 | 4 (2.0%) | 0 (0.0%) |
| $5,000 to $7,499 | 0 (0.0%) | 0 (0.0%) |
| $7,500 to $9,999 | 5 (2.5%) | 2 (2.4%) |
| $10,000 to $12,499 | 3 (1.5%) | 3 (3.6%) |
| $12,500 to $14,999 | 0 (0.0%) | 4 (4.8%) |
| $15,000 to $17,499 | 18 (9.0%) | 4 (4.8%) |
| $17,500 to $19,999 | 5 (2.5%) | 6 (7.2%) |
| $20,000 to $22,499 | 34 (16.9%) | 5 (6.0%) |
| $22,500 to $24,999 | 0 (0.0%) | 5 (6.0%) |
| $25,000 to $29,999 | 45 (22.4%) | 16 (19.3%) |
| $30,000 to $34,999 | 13 (6.5%) | 11 (13.3%) |
| $35,000 to $39,999 | 10 (5.0%) | 27 (32.5%) |
| $40,000 to $44,999 | 21 (10.4%) | 0 (0.0%) |
| $45,000 to $49,999 | 4 (2.0%) | 0 (0.0%) |
| $50,000 to $54,999 | 8 (4.0%) | 0 (0.0%) |
| $55,000 to $64,999 | 8 (4.0%) | 0 (0.0%) |
| $65,000 to $74,999 | 3 (1.5%) | 0 (0.0%) |
| $75,000 to $99,999 | 3 (1.5%) | 0 (0.0%) |
| $100,000+ | 14 (7.0%) | 0 (0.0%) |
| Total | 201 (100.0%) | 83 (100.0%) |
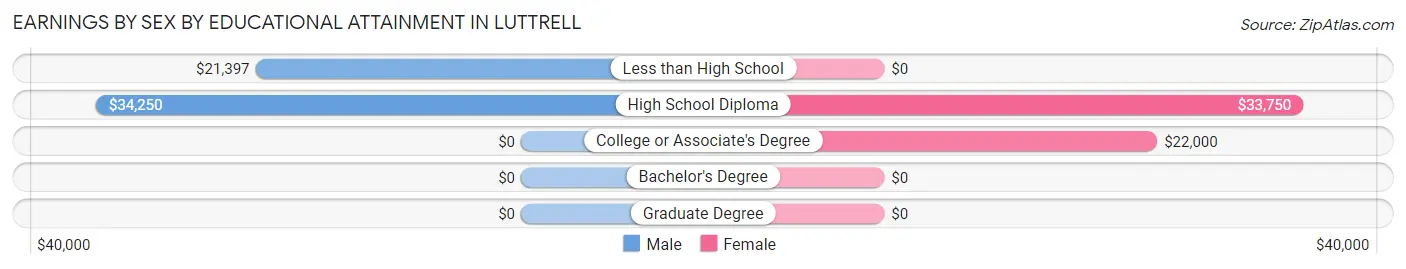
Earnings by Sex by Educational Attainment in Luttrell
Average earnings in Luttrell are $26,546 for men and $27,273 for women, a difference of 2.7%. Men with an educational attainment of high school diploma enjoy the highest average annual earnings of $34,250, while those with less than high school education earn the least with $21,397. Women with an educational attainment of high school diploma earn the most with the average annual earnings of $33,750, while those with college or associate's degree education have the smallest earnings of $22,000.
| Educational Attainment | Male Income | Female Income |
| Less than High School | $21,397 | $0 |
| High School Diploma | $34,250 | $33,750 |
| College or Associate's Degree | - | - |
| Bachelor's Degree | - | - |
| Graduate Degree | - | - |
| Total | $26,546 | $27,273 |
Family Income in Luttrell
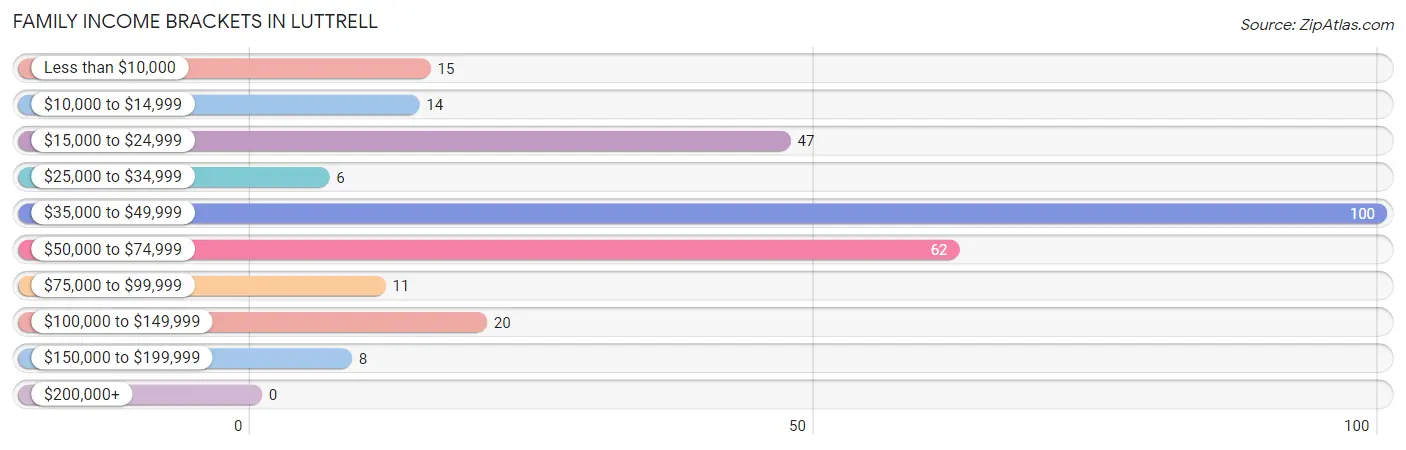
Family Income Brackets in Luttrell
According to the Luttrell family income data, there are 100 families falling into the $35,000 to $49,999 income range, which is the most common income bracket and makes up 35.3% of all families.
| Income Bracket | # Families | % Families |
| Less than $10,000 | 15 | 5.3% |
| $10,000 to $14,999 | 14 | 4.9% |
| $15,000 to $24,999 | 47 | 16.6% |
| $25,000 to $34,999 | 6 | 2.1% |
| $35,000 to $49,999 | 100 | 35.3% |
| $50,000 to $74,999 | 62 | 21.9% |
| $75,000 to $99,999 | 11 | 3.9% |
| $100,000 to $149,999 | 20 | 7.1% |
| $150,000 to $199,999 | 8 | 2.8% |
| $200,000+ | 0 | 0.0% |
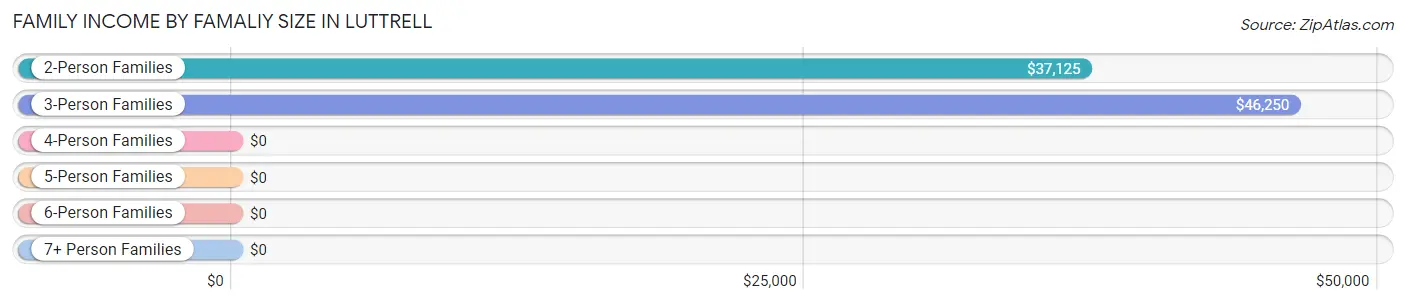
Family Income by Famaliy Size in Luttrell
3-person families (61 | 21.5%) account for the highest median family income in Luttrell with $46,250 per family, while 2-person families (161 | 56.9%) have the highest median income of $18,562 per family member.
| Income Bracket | # Families | Median Income |
| 2-Person Families | 161 (56.9%) | $37,125 |
| 3-Person Families | 61 (21.5%) | $46,250 |
| 4-Person Families | 11 (3.9%) | $0 |
| 5-Person Families | 46 (16.3%) | $0 |
| 6-Person Families | 4 (1.4%) | $0 |
| 7+ Person Families | 0 (0.0%) | $0 |
| Total | 283 (100.0%) | $39,391 |
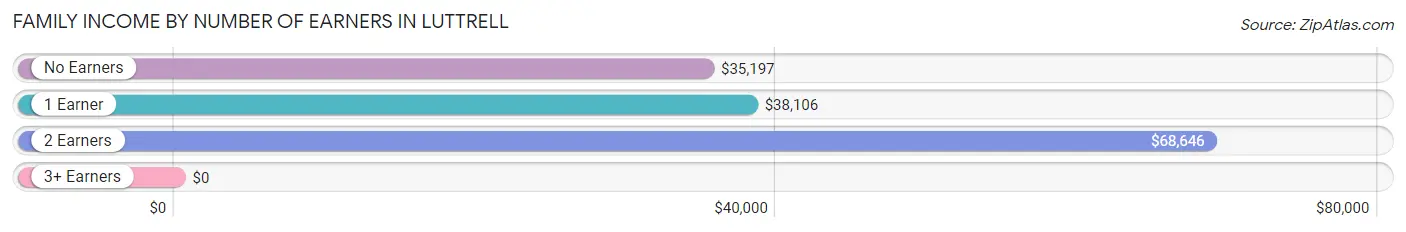
Family Income by Number of Earners in Luttrell
| Number of Earners | # Families | Median Income |
| No Earners | 113 (39.9%) | $35,197 |
| 1 Earner | 92 (32.5%) | $38,106 |
| 2 Earners | 73 (25.8%) | $68,646 |
| 3+ Earners | 5 (1.8%) | $0 |
| Total | 283 (100.0%) | $39,391 |
Household Income in Luttrell
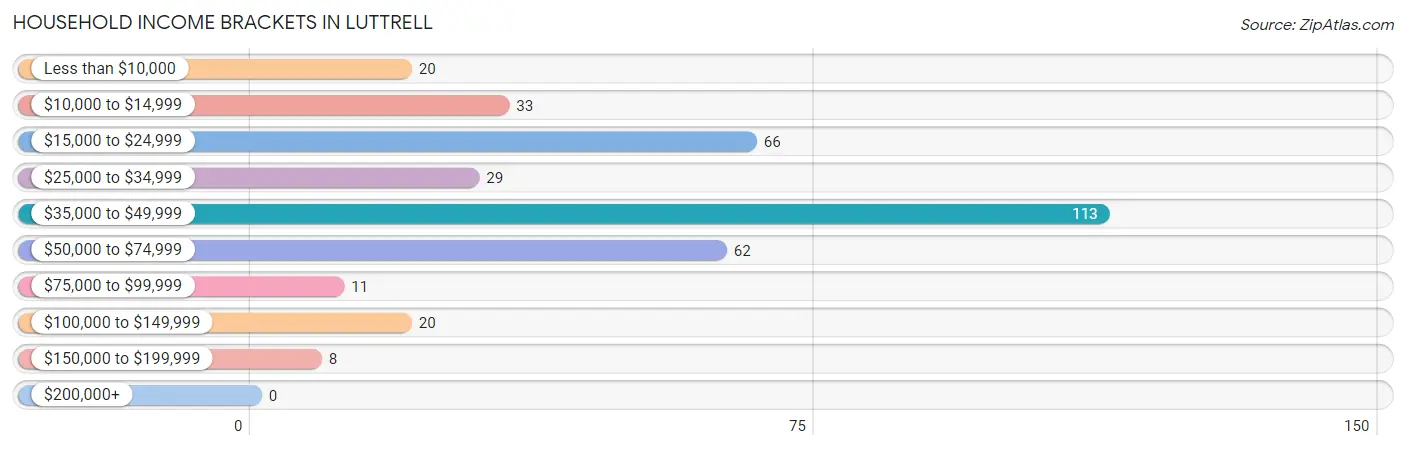
Household Income Brackets in Luttrell
With 113 households falling in the category, the $35,000 to $49,999 income range is the most frequent in Luttrell, accounting for 31.2% of all households.
| Income Bracket | # Households | % Households |
| Less than $10,000 | 20 | 5.5% |
| $10,000 to $14,999 | 33 | 9.1% |
| $15,000 to $24,999 | 66 | 18.2% |
| $25,000 to $34,999 | 29 | 8.0% |
| $35,000 to $49,999 | 113 | 31.2% |
| $50,000 to $74,999 | 62 | 17.1% |
| $75,000 to $99,999 | 11 | 3.0% |
| $100,000 to $149,999 | 20 | 5.5% |
| $150,000 to $199,999 | 8 | 2.2% |
| $200,000+ | 0 | 0.0% |
Household Income by Householder Age in Luttrell
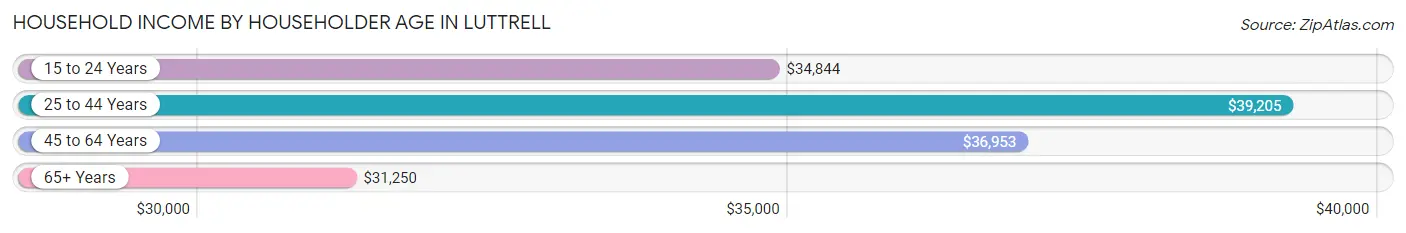
The median household income in Luttrell is $37,292, with the highest median household income of $39,205 found in the 25 to 44 years age bracket for the primary householder. A total of 69 households (19.1%) fall into this category. Meanwhile, the 65+ years age bracket for the primary householder has the lowest median household income of $31,250, with 137 households (37.9%) in this group.
| Income Bracket | # Households | Median Income |
| 15 to 24 Years | 15 (4.1%) | $34,844 |
| 25 to 44 Years | 69 (19.1%) | $39,205 |
| 45 to 64 Years | 141 (39.0%) | $36,953 |
| 65+ Years | 137 (37.9%) | $31,250 |
| Total | 362 (100.0%) | $37,292 |
Poverty in Luttrell
Income Below Poverty by Sex and Age in Luttrell
With 22.9% poverty level for males and 23.5% for females among the residents of Luttrell, 15 year old males and 5 year old females are the most vulnerable to poverty, with 12 males (100.0%) and 11 females (100.0%) in their respective age groups living below the poverty level.
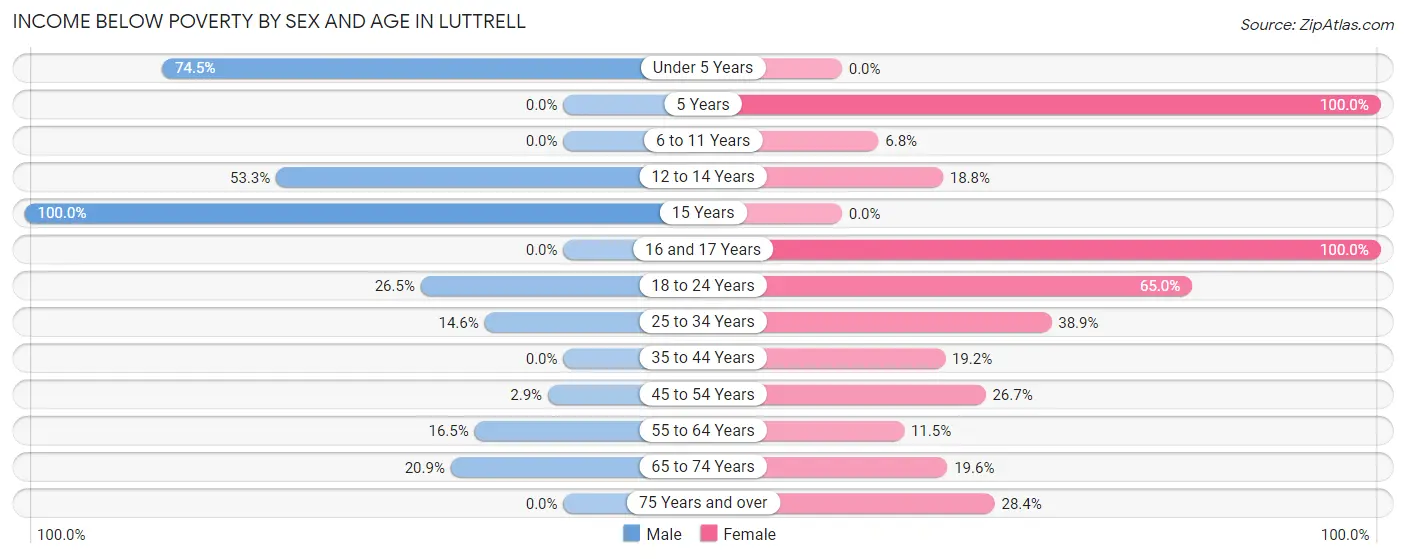
| Age Bracket | Male | Female |
| Under 5 Years | 35 (74.5%) | 0 (0.0%) |
| 5 Years | 0 (0.0%) | 11 (100.0%) |
| 6 to 11 Years | 0 (0.0%) | 4 (6.8%) |
| 12 to 14 Years | 8 (53.3%) | 6 (18.8%) |
| 15 Years | 12 (100.0%) | 0 (0.0%) |
| 16 and 17 Years | 0 (0.0%) | 5 (100.0%) |
| 18 to 24 Years | 9 (26.5%) | 13 (65.0%) |
| 25 to 34 Years | 12 (14.6%) | 7 (38.9%) |
| 35 to 44 Years | 0 (0.0%) | 9 (19.2%) |
| 45 to 54 Years | 2 (2.9%) | 16 (26.7%) |
| 55 to 64 Years | 16 (16.5%) | 6 (11.5%) |
| 65 to 74 Years | 14 (20.9%) | 9 (19.6%) |
| 75 Years and over | 0 (0.0%) | 19 (28.4%) |
| Total | 108 (22.9%) | 105 (23.5%) |
Income Above Poverty by Sex and Age in Luttrell
According to the poverty statistics in Luttrell, males aged 6 to 11 years and females aged under 5 years are the age groups that are most secure financially, with 100.0% of males and 100.0% of females in these age groups living above the poverty line.
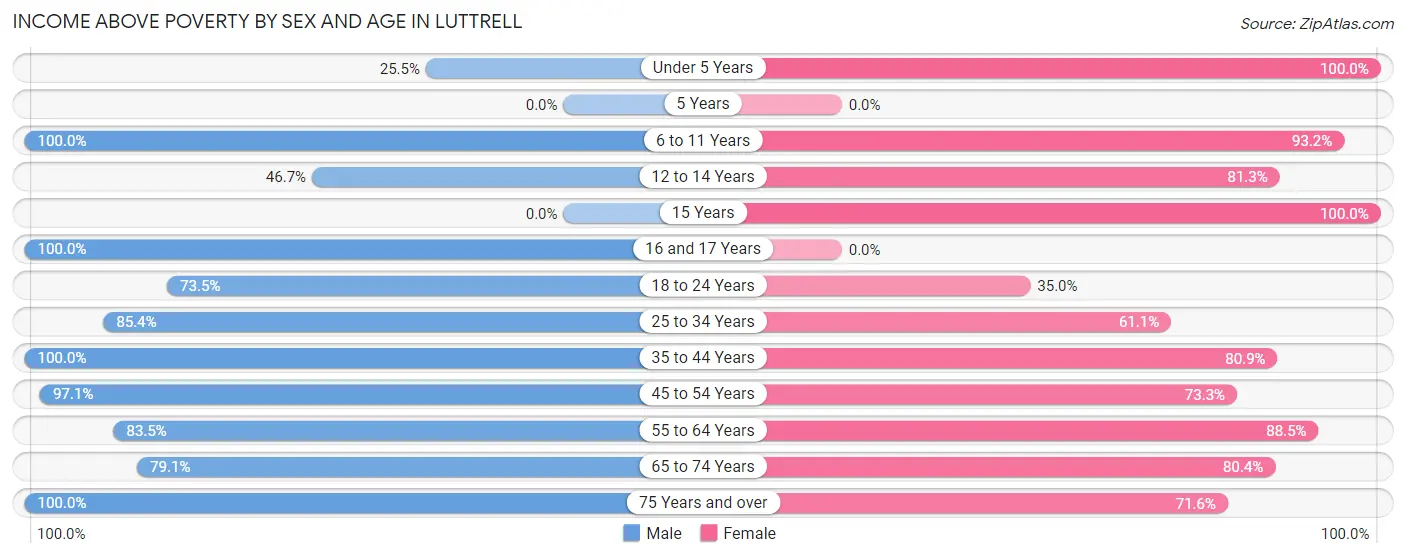
| Age Bracket | Male | Female |
| Under 5 Years | 12 (25.5%) | 27 (100.0%) |
| 5 Years | 0 (0.0%) | 0 (0.0%) |
| 6 to 11 Years | 2 (100.0%) | 55 (93.2%) |
| 12 to 14 Years | 7 (46.7%) | 26 (81.2%) |
| 15 Years | 0 (0.0%) | 2 (100.0%) |
| 16 and 17 Years | 7 (100.0%) | 0 (0.0%) |
| 18 to 24 Years | 25 (73.5%) | 7 (35.0%) |
| 25 to 34 Years | 70 (85.4%) | 11 (61.1%) |
| 35 to 44 Years | 24 (100.0%) | 38 (80.8%) |
| 45 to 54 Years | 68 (97.1%) | 44 (73.3%) |
| 55 to 64 Years | 81 (83.5%) | 46 (88.5%) |
| 65 to 74 Years | 53 (79.1%) | 37 (80.4%) |
| 75 Years and over | 14 (100.0%) | 48 (71.6%) |
| Total | 363 (77.1%) | 341 (76.5%) |
Income Below Poverty Among Married-Couple Families in Luttrell
The poverty statistics for married-couple families in Luttrell show that 7.9% or 14 of the total 178 families live below the poverty line. Families with no children have the highest poverty rate of 8.6%, comprising of 8 families. On the other hand, families with 3 or 4 children have the lowest poverty rate of 0.0%, which includes 0 families.
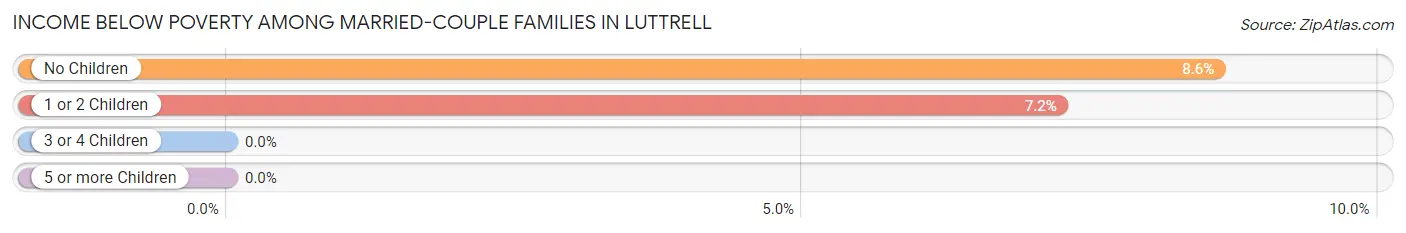
| Children | Above Poverty | Below Poverty |
| No Children | 85 (91.4%) | 8 (8.6%) |
| 1 or 2 Children | 77 (92.8%) | 6 (7.2%) |
| 3 or 4 Children | 2 (100.0%) | 0 (0.0%) |
| 5 or more Children | 0 (0.0%) | 0 (0.0%) |
| Total | 164 (92.1%) | 14 (7.9%) |
Income Below Poverty Among Single-Parent Households in Luttrell
According to the poverty data in Luttrell, 22.2% or 6 single-father households and 48.7% or 38 single-mother households are living below the poverty line. Among single-father households, those with 1 or 2 children have the highest poverty rate, with 2 households (100.0%) experiencing poverty. Likewise, among single-mother households, those with 3 or 4 children have the highest poverty rate, with 4 households (100.0%) falling below the poverty line.
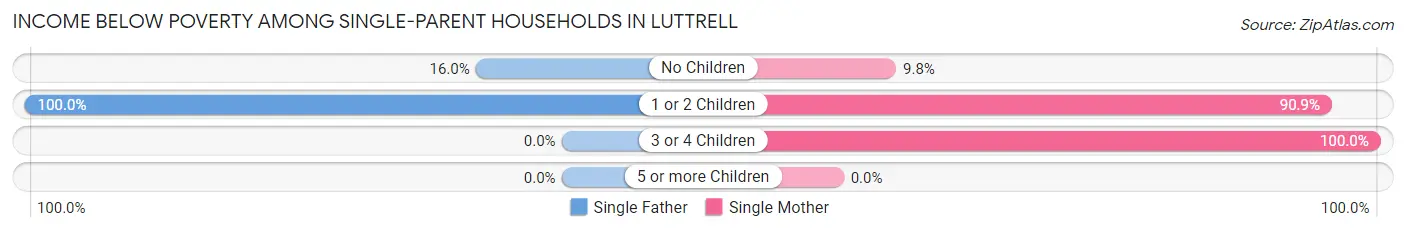
| Children | Single Father | Single Mother |
| No Children | 4 (16.0%) | 4 (9.8%) |
| 1 or 2 Children | 2 (100.0%) | 30 (90.9%) |
| 3 or 4 Children | 0 (0.0%) | 4 (100.0%) |
| 5 or more Children | 0 (0.0%) | 0 (0.0%) |
| Total | 6 (22.2%) | 38 (48.7%) |
Income Below Poverty Among Married-Couple vs Single-Parent Households in Luttrell
The poverty data for Luttrell shows that 14 of the married-couple family households (7.9%) and 44 of the single-parent households (41.9%) are living below the poverty level. Within the married-couple family households, those with no children have the highest poverty rate, with 8 households (8.6%) falling below the poverty line. Among the single-parent households, those with 3 or 4 children have the highest poverty rate, with 4 household (100.0%) living below poverty.
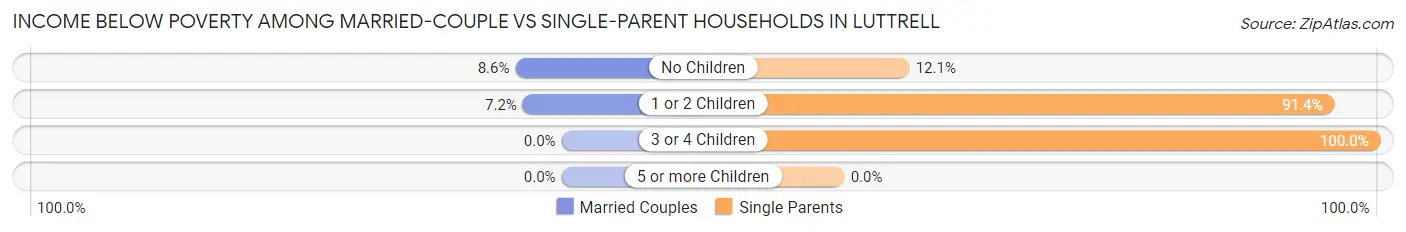
| Children | Married-Couple Families | Single-Parent Households |
| No Children | 8 (8.6%) | 8 (12.1%) |
| 1 or 2 Children | 6 (7.2%) | 32 (91.4%) |
| 3 or 4 Children | 0 (0.0%) | 4 (100.0%) |
| 5 or more Children | 0 (0.0%) | 0 (0.0%) |
| Total | 14 (7.9%) | 44 (41.9%) |
Race in Luttrell
The most populous races in Luttrell are White / Caucasian (907 | 98.9%), Hispanic or Latino (20 | 2.2%), and Two or more Races (8 | 0.9%).
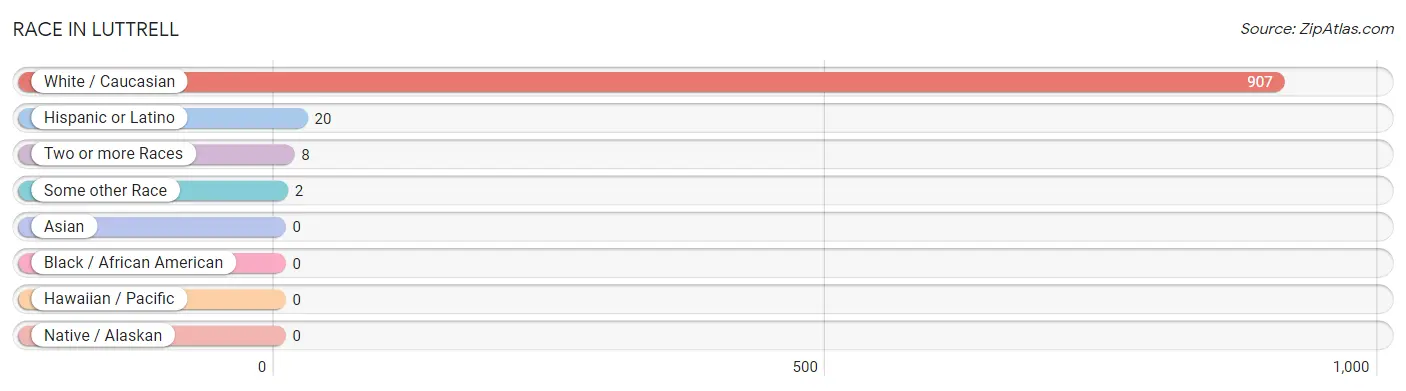
| Race | # Population | % Population |
| Asian | 0 | 0.0% |
| Black / African American | 0 | 0.0% |
| Hawaiian / Pacific | 0 | 0.0% |
| Hispanic or Latino | 20 | 2.2% |
| Native / Alaskan | 0 | 0.0% |
| White / Caucasian | 907 | 98.9% |
| Two or more Races | 8 | 0.9% |
| Some other Race | 2 | 0.2% |
| Total | 917 | 100.0% |
Ancestry in Luttrell
The most populous ancestries reported in Luttrell are American (148 | 16.1%), Norwegian (125 | 13.6%), German (76 | 8.3%), English (64 | 7.0%), and Irish (60 | 6.5%), together accounting for 51.6% of all Luttrell residents.
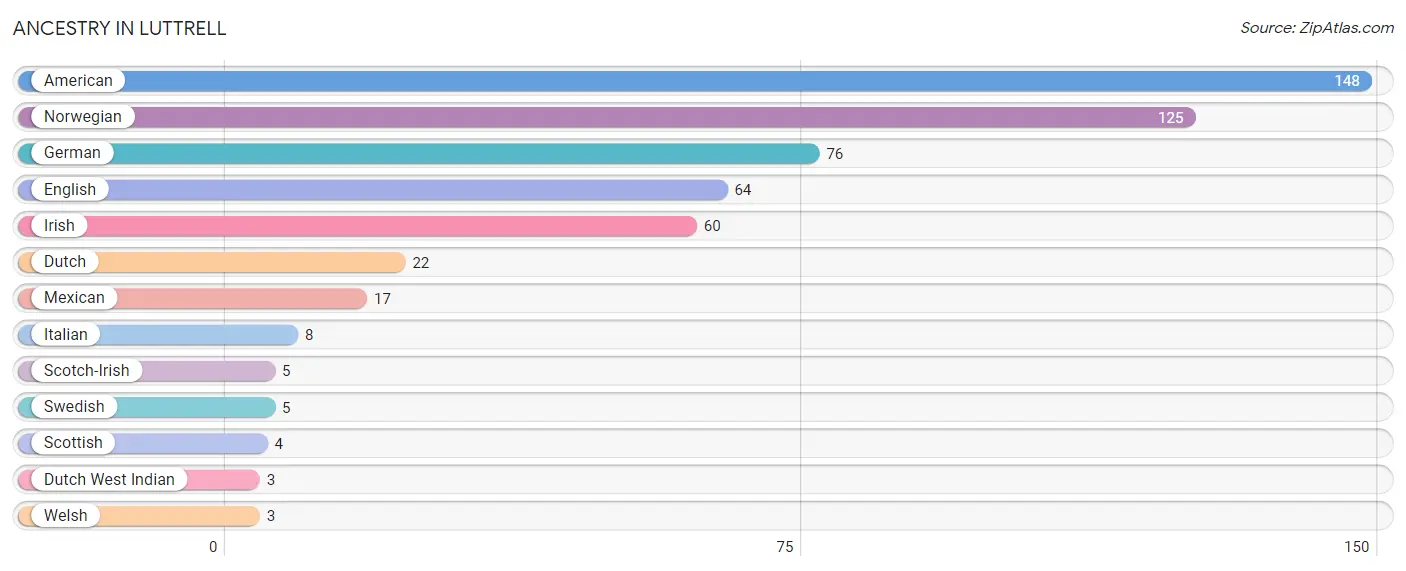
| Ancestry | # Population | % Population |
| American | 148 | 16.1% |
| Dutch | 22 | 2.4% |
| Dutch West Indian | 3 | 0.3% |
| English | 64 | 7.0% |
| German | 76 | 8.3% |
| Irish | 60 | 6.5% |
| Italian | 8 | 0.9% |
| Mexican | 17 | 1.8% |
| Norwegian | 125 | 13.6% |
| Scotch-Irish | 5 | 0.5% |
| Scottish | 4 | 0.4% |
| Swedish | 5 | 0.5% |
| Welsh | 3 | 0.3% | View All 13 Rows |
Immigrants in Luttrell
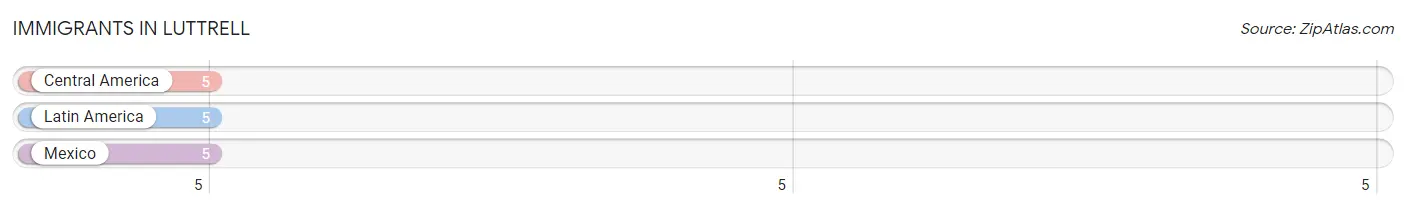
The most numerous immigrant groups reported in Luttrell came from Central America (5 | 0.5%), Latin America (5 | 0.5%), and Mexico (5 | 0.5%), together accounting for 1.7% of all Luttrell residents.
| Immigration Origin | # Population | % Population |
| Central America | 5 | 0.5% |
| Latin America | 5 | 0.5% |
| Mexico | 5 | 0.5% | View All 3 Rows |
Sex and Age in Luttrell
Sex and Age in Luttrell
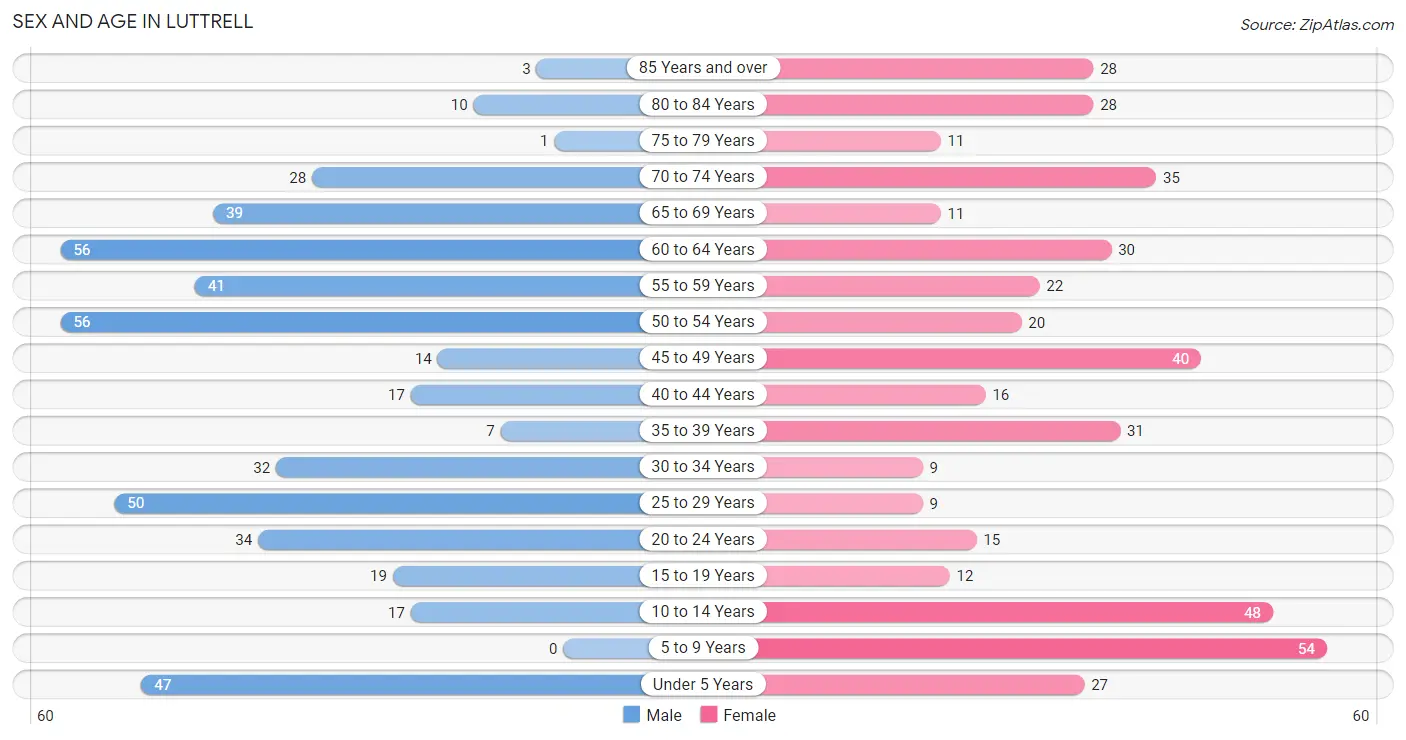
The most populous age groups in Luttrell are 50 to 54 Years (56 | 11.9%) for men and 5 to 9 Years (54 | 12.1%) for women.
| Age Bracket | Male | Female |
| Under 5 Years | 47 (10.0%) | 27 (6.0%) |
| 5 to 9 Years | 0 (0.0%) | 54 (12.1%) |
| 10 to 14 Years | 17 (3.6%) | 48 (10.8%) |
| 15 to 19 Years | 19 (4.0%) | 12 (2.7%) |
| 20 to 24 Years | 34 (7.2%) | 15 (3.4%) |
| 25 to 29 Years | 50 (10.6%) | 9 (2.0%) |
| 30 to 34 Years | 32 (6.8%) | 9 (2.0%) |
| 35 to 39 Years | 7 (1.5%) | 31 (7.0%) |
| 40 to 44 Years | 17 (3.6%) | 16 (3.6%) |
| 45 to 49 Years | 14 (3.0%) | 40 (9.0%) |
| 50 to 54 Years | 56 (11.9%) | 20 (4.5%) |
| 55 to 59 Years | 41 (8.7%) | 22 (4.9%) |
| 60 to 64 Years | 56 (11.9%) | 30 (6.7%) |
| 65 to 69 Years | 39 (8.3%) | 11 (2.5%) |
| 70 to 74 Years | 28 (5.9%) | 35 (7.9%) |
| 75 to 79 Years | 1 (0.2%) | 11 (2.5%) |
| 80 to 84 Years | 10 (2.1%) | 28 (6.3%) |
| 85 Years and over | 3 (0.6%) | 28 (6.3%) |
| Total | 471 (100.0%) | 446 (100.0%) |
Families and Households in Luttrell
Median Family Size in Luttrell
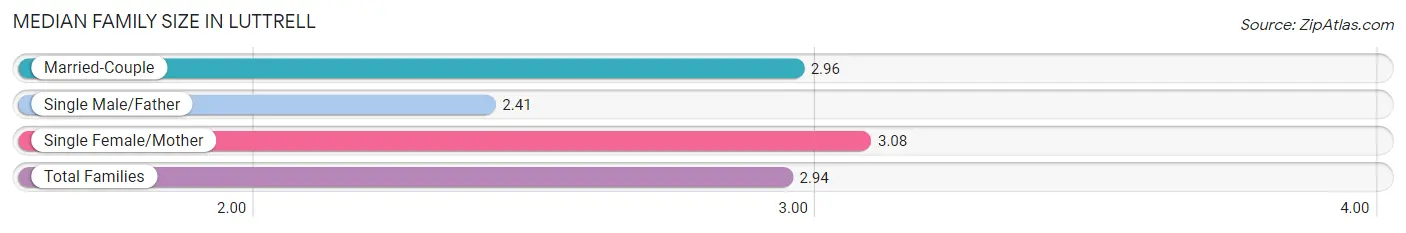
The median family size in Luttrell is 2.94 persons per family, with single female/mother families (78 | 27.6%) accounting for the largest median family size of 3.08 persons per family. On the other hand, single male/father families (27 | 9.5%) represent the smallest median family size with 2.41 persons per family.
| Family Type | # Families | Family Size |
| Married-Couple | 178 (62.9%) | 2.96 |
| Single Male/Father | 27 (9.5%) | 2.41 |
| Single Female/Mother | 78 (27.6%) | 3.08 |
| Total Families | 283 (100.0%) | 2.94 |
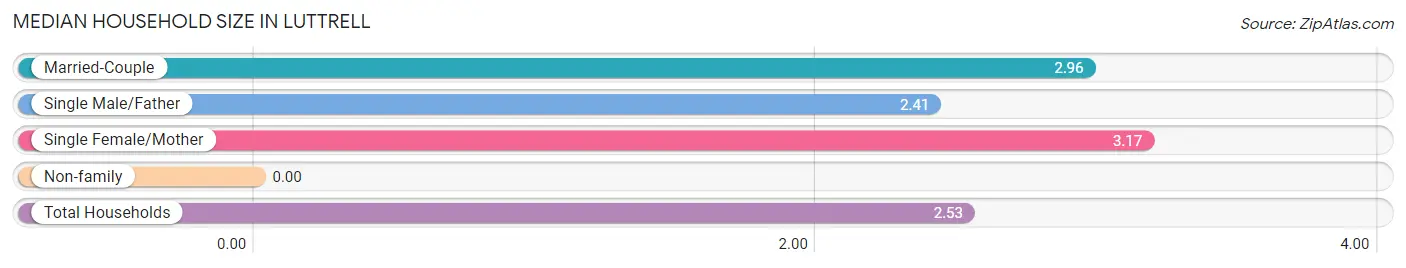
Median Household Size in Luttrell
| Household Type | # Households | Household Size |
| Married-Couple | 178 (49.2%) | 2.96 |
| Single Male/Father | 27 (7.5%) | 2.41 |
| Single Female/Mother | 78 (21.5%) | 3.17 |
| Non-family | 79 (21.8%) | - |
| Total Households | 362 (100.0%) | 2.53 |
Household Size by Marriage Status in Luttrell
Out of a total of 362 households in Luttrell, 283 (78.2%) are family households, while 79 (21.8%) are nonfamily households. The most numerous type of family households are 2-person households, comprising 159, and the most common type of nonfamily households are 1-person households, comprising 79.
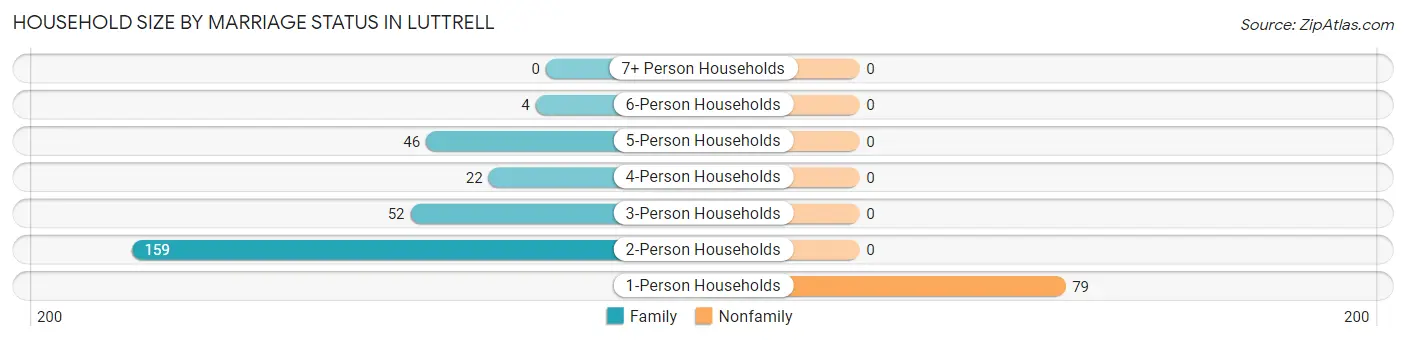
| Household Size | Family Households | Nonfamily Households |
| 1-Person Households | - | 79 (21.8%) |
| 2-Person Households | 159 (43.9%) | 0 (0.0%) |
| 3-Person Households | 52 (14.4%) | 0 (0.0%) |
| 4-Person Households | 22 (6.1%) | 0 (0.0%) |
| 5-Person Households | 46 (12.7%) | 0 (0.0%) |
| 6-Person Households | 4 (1.1%) | 0 (0.0%) |
| 7+ Person Households | 0 (0.0%) | 0 (0.0%) |
| Total | 283 (78.2%) | 79 (21.8%) |
Female Fertility in Luttrell
Fertility by Age in Luttrell
Average fertility rate in Luttrell is 136.0 births per 1,000 women. Women in the age bracket of 20 to 34 years have the highest fertility rate with 333.0 births per 1,000 women. Women in the age bracket of 20 to 34 years acount for 61.1% of all women with births.
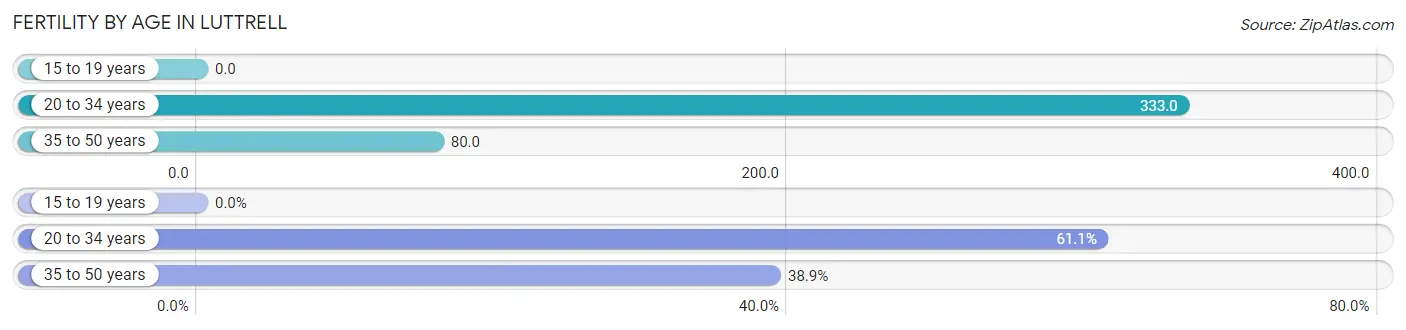
| Age Bracket | Women with Births | Births / 1,000 Women |
| 15 to 19 years | 0 (0.0%) | 0.0 |
| 20 to 34 years | 11 (61.1%) | 333.0 |
| 35 to 50 years | 7 (38.9%) | 80.0 |
| Total | 18 (100.0%) | 136.0 |
Fertility by Age by Marriage Status in Luttrell
55.6% of women with births (18) in Luttrell are married. The highest percentage of unmarried women with births falls into 20 to 34 years age bracket with 72.7% of them unmarried at the time of birth, while the lowest percentage of unmarried women with births belong to 35 to 50 years age bracket with 0.0% of them unmarried.
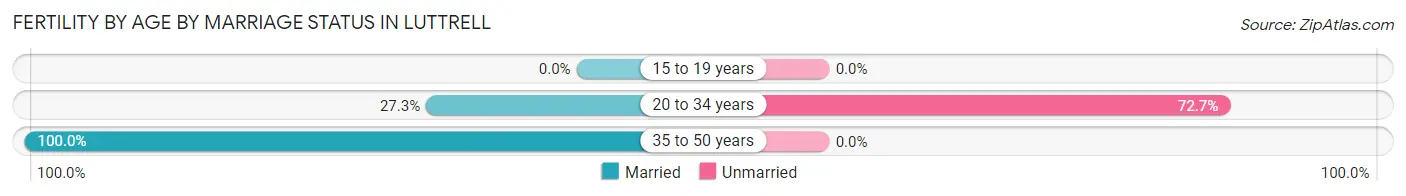
| Age Bracket | Married | Unmarried |
| 15 to 19 years | 0 (0.0%) | 0 (0.0%) |
| 20 to 34 years | 3 (27.3%) | 8 (72.7%) |
| 35 to 50 years | 7 (100.0%) | 0 (0.0%) |
| Total | 10 (55.6%) | 8 (44.4%) |
Fertility by Education in Luttrell
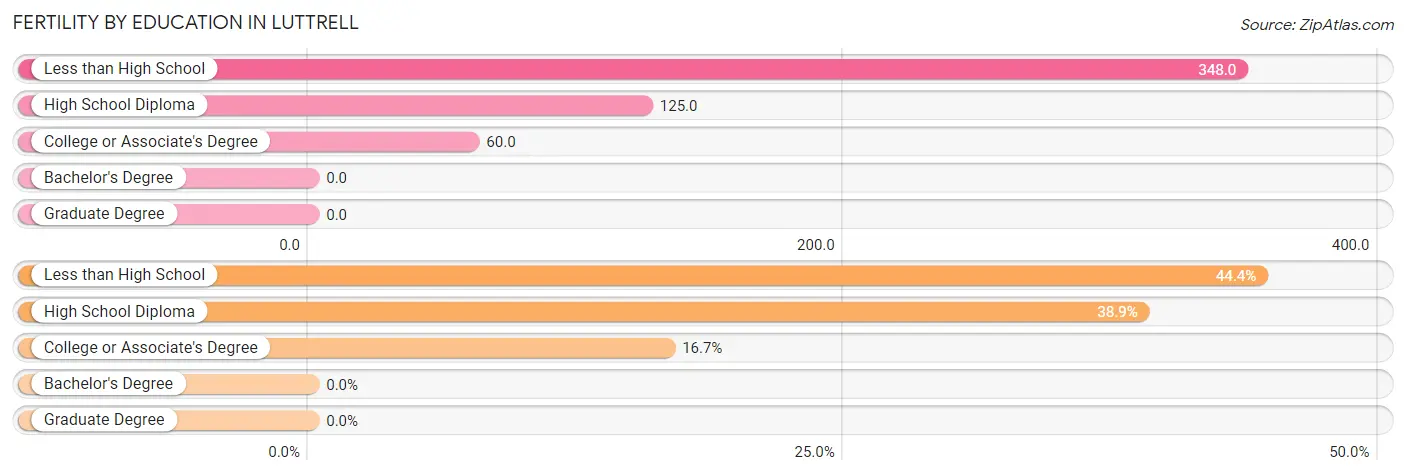
| Educational Attainment | Women with Births | Births / 1,000 Women |
| Less than High School | 8 (44.4%) | 348.0 |
| High School Diploma | 7 (38.9%) | 125.0 |
| College or Associate's Degree | 3 (16.7%) | 60.0 |
| Bachelor's Degree | 0 (0.0%) | 0.0 |
| Graduate Degree | 0 (0.0%) | 0.0 |
| Total | 18 (100.0%) | 136.0 |
Fertility by Education by Marriage Status in Luttrell
44.4% of women with births in Luttrell are unmarried. Women with the educational attainment of high school diploma are most likely to be married with 100.0% of them married at childbirth, while women with the educational attainment of less than high school are least likely to be married with 100.0% of them unmarried at childbirth.
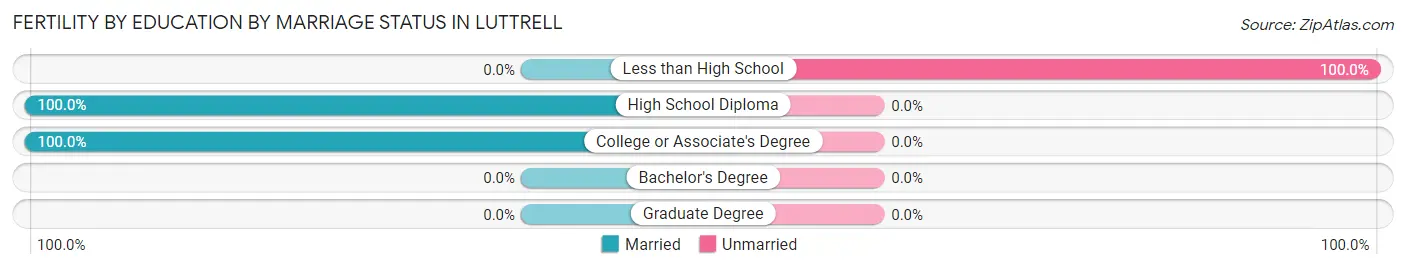
| Educational Attainment | Married | Unmarried |
| Less than High School | 0 (0.0%) | 8 (100.0%) |
| High School Diploma | 7 (100.0%) | 0 (0.0%) |
| College or Associate's Degree | 3 (100.0%) | 0 (0.0%) |
| Bachelor's Degree | 0 (0.0%) | 0 (0.0%) |
| Graduate Degree | 0 (0.0%) | 0 (0.0%) |
| Total | 10 (55.6%) | 8 (44.4%) |
Employment Characteristics in Luttrell
Employment by Class of Employer in Luttrell
Among the 263 employed individuals in Luttrell, private company employees (202 | 76.8%), federal government employees (27 | 10.3%), and state government employees (14 | 5.3%) make up the most common classes of employment.
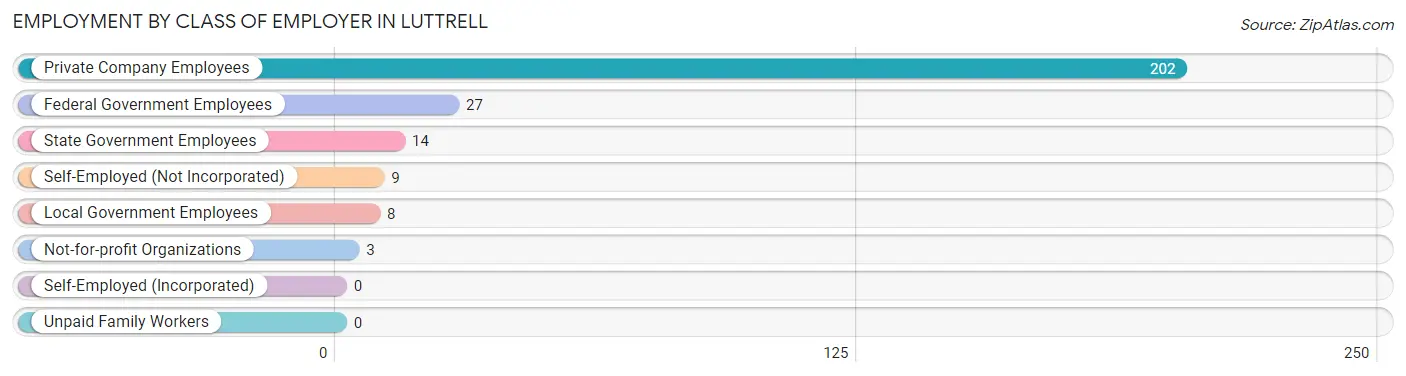
| Employer Class | # Employees | % Employees |
| Private Company Employees | 202 | 76.8% |
| Self-Employed (Incorporated) | 0 | 0.0% |
| Self-Employed (Not Incorporated) | 9 | 3.4% |
| Not-for-profit Organizations | 3 | 1.1% |
| Local Government Employees | 8 | 3.0% |
| State Government Employees | 14 | 5.3% |
| Federal Government Employees | 27 | 10.3% |
| Unpaid Family Workers | 0 | 0.0% |
| Total | 263 | 100.0% |
Employment Status by Age in Luttrell
According to the labor force statistics for Luttrell, out of the total population over 16 years of age (710), 39.7% or 282 individuals are in the labor force, with 4.3% or 12 of them unemployed. The age group with the highest labor force participation rate is 25 to 29 years, with 93.2% or 55 individuals in the labor force. Within the labor force, the 16 to 19 years age range has the highest percentage of unemployed individuals, with 71.4% or 5 of them being unemployed.
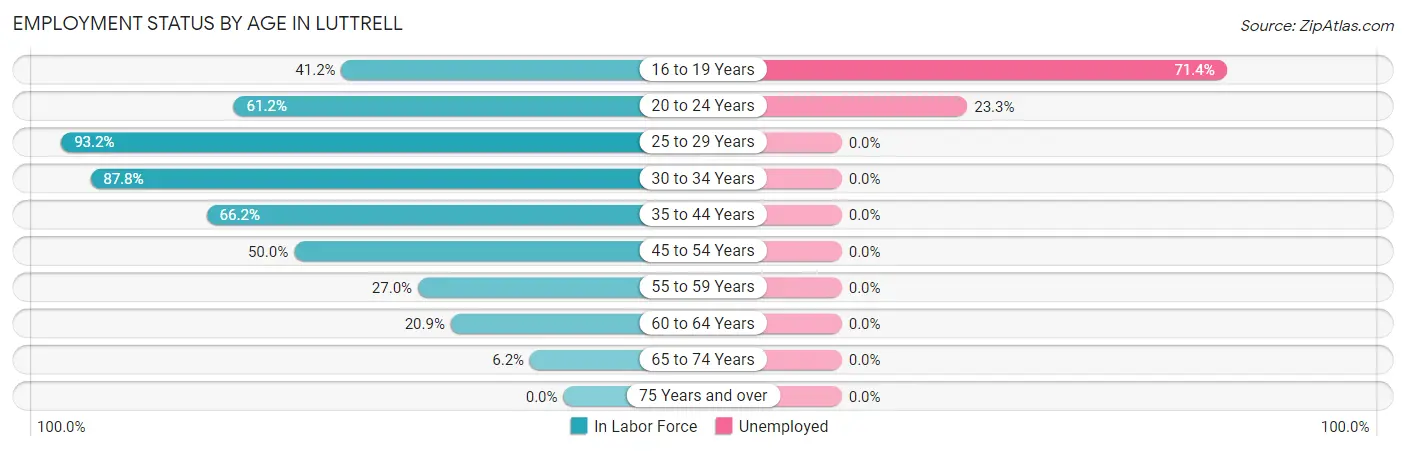
| Age Bracket | In Labor Force | Unemployed |
| 16 to 19 Years | 7 (41.2%) | 5 (71.4%) |
| 20 to 24 Years | 30 (61.2%) | 7 (23.3%) |
| 25 to 29 Years | 55 (93.2%) | 0 (0.0%) |
| 30 to 34 Years | 36 (87.8%) | 0 (0.0%) |
| 35 to 44 Years | 47 (66.2%) | 0 (0.0%) |
| 45 to 54 Years | 65 (50.0%) | 0 (0.0%) |
| 55 to 59 Years | 17 (27.0%) | 0 (0.0%) |
| 60 to 64 Years | 18 (20.9%) | 0 (0.0%) |
| 65 to 74 Years | 7 (6.2%) | 0 (0.0%) |
| 75 Years and over | 0 (0.0%) | 0 (0.0%) |
| Total | 282 (39.7%) | 12 (4.3%) |
Employment Status by Educational Attainment in Luttrell
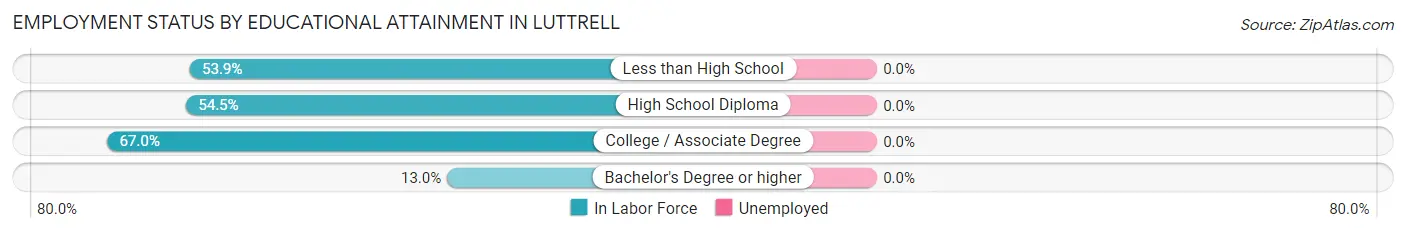
| Educational Attainment | In Labor Force | Unemployed |
| Less than High School | 62 (53.9%) | 0 (0.0%) |
| High School Diploma | 103 (54.5%) | 0 (0.0%) |
| College / Associate Degree | 67 (67.0%) | 0 (0.0%) |
| Bachelor's Degree or higher | 6 (13.0%) | 0 (0.0%) |
| Total | 238 (52.9%) | 0 (0.0%) |
Employment Occupations by Sex in Luttrell
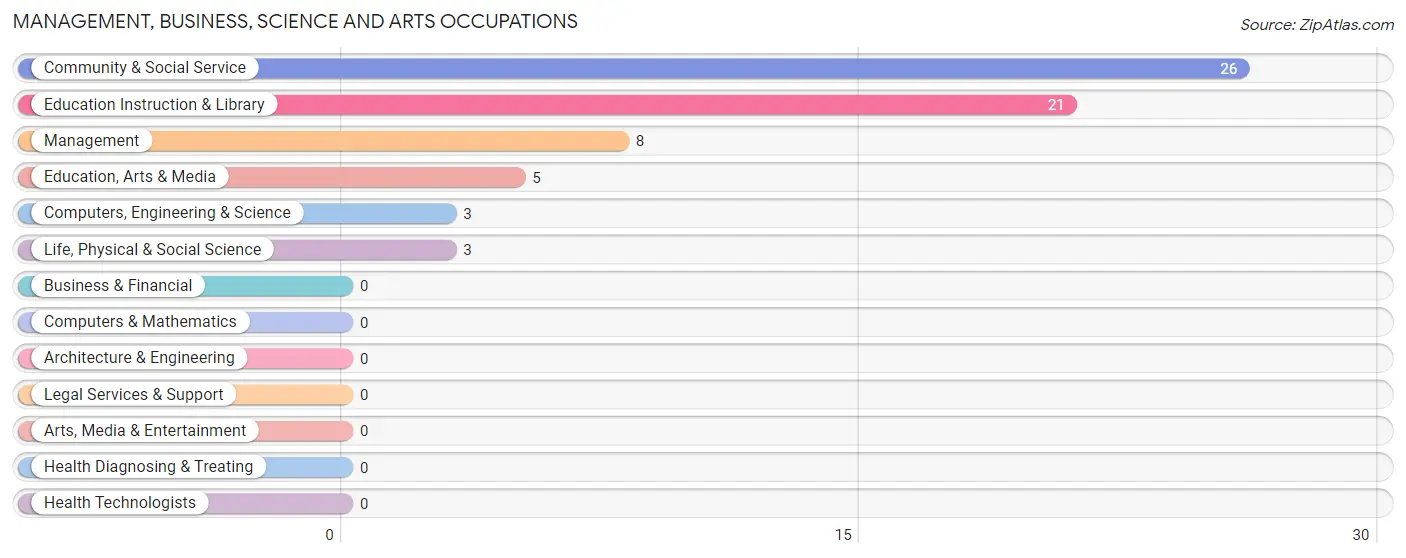
Management, Business, Science and Arts Occupations
The most common Management, Business, Science and Arts occupations in Luttrell are Community & Social Service (26 | 9.6%), Education Instruction & Library (21 | 7.8%), Management (8 | 3.0%), Education, Arts & Media (5 | 1.8%), and Computers, Engineering & Science (3 | 1.1%).
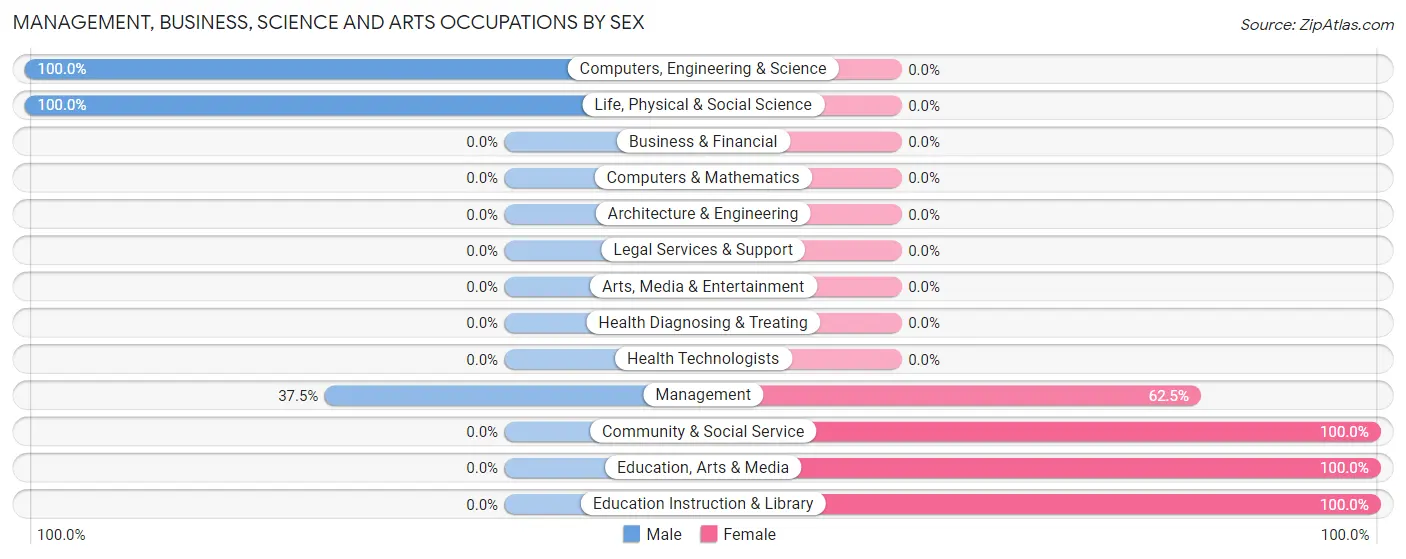
Management, Business, Science and Arts Occupations by Sex
Within the Management, Business, Science and Arts occupations in Luttrell, the most male-oriented occupations are Computers, Engineering & Science (100.0%), Life, Physical & Social Science (100.0%), and Management (37.5%), while the most female-oriented occupations are Community & Social Service (100.0%), Education, Arts & Media (100.0%), and Education Instruction & Library (100.0%).
| Occupation | Male | Female |
| Management | 3 (37.5%) | 5 (62.5%) |
| Business & Financial | 0 (0.0%) | 0 (0.0%) |
| Computers, Engineering & Science | 3 (100.0%) | 0 (0.0%) |
| Computers & Mathematics | 0 (0.0%) | 0 (0.0%) |
| Architecture & Engineering | 0 (0.0%) | 0 (0.0%) |
| Life, Physical & Social Science | 3 (100.0%) | 0 (0.0%) |
| Community & Social Service | 0 (0.0%) | 26 (100.0%) |
| Education, Arts & Media | 0 (0.0%) | 5 (100.0%) |
| Legal Services & Support | 0 (0.0%) | 0 (0.0%) |
| Education Instruction & Library | 0 (0.0%) | 21 (100.0%) |
| Arts, Media & Entertainment | 0 (0.0%) | 0 (0.0%) |
| Health Diagnosing & Treating | 0 (0.0%) | 0 (0.0%) |
| Health Technologists | 0 (0.0%) | 0 (0.0%) |
| Total (Category) | 6 (16.2%) | 31 (83.8%) |
| Total (Overall) | 192 (71.1%) | 78 (28.9%) |
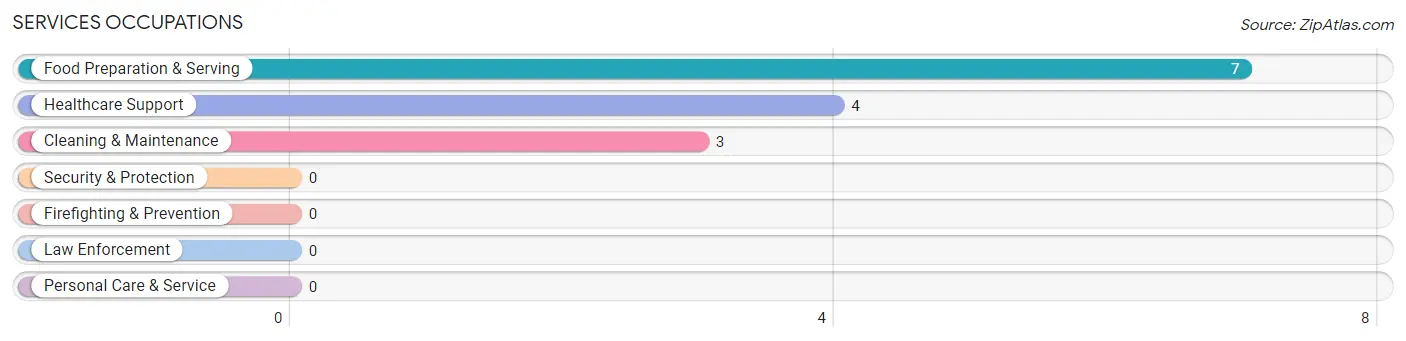
Services Occupations
The most common Services occupations in Luttrell are Food Preparation & Serving (7 | 2.6%), Healthcare Support (4 | 1.5%), and Cleaning & Maintenance (3 | 1.1%).
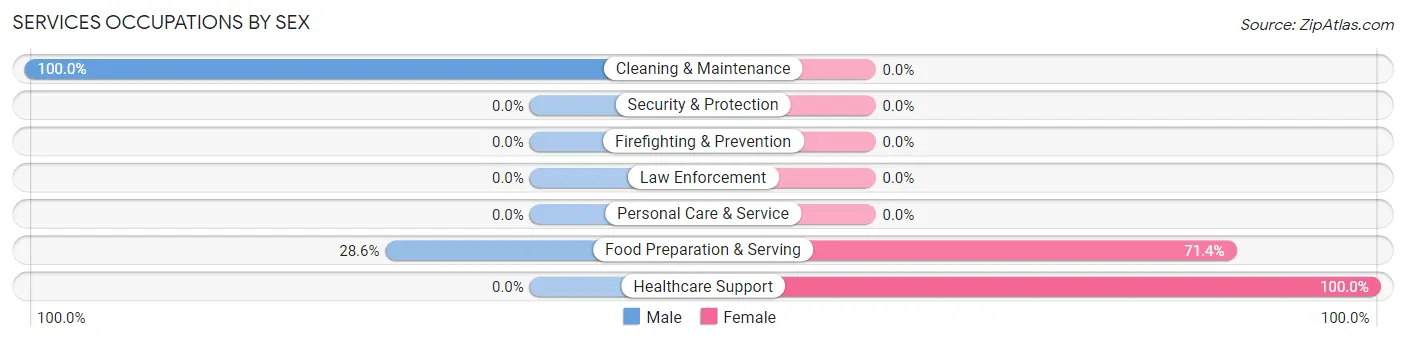
Services Occupations by Sex
Within the Services occupations in Luttrell, the most male-oriented occupations are Cleaning & Maintenance (100.0%), and Food Preparation & Serving (28.6%), while the most female-oriented occupations are Healthcare Support (100.0%), and Food Preparation & Serving (71.4%).
| Occupation | Male | Female |
| Healthcare Support | 0 (0.0%) | 4 (100.0%) |
| Security & Protection | 0 (0.0%) | 0 (0.0%) |
| Firefighting & Prevention | 0 (0.0%) | 0 (0.0%) |
| Law Enforcement | 0 (0.0%) | 0 (0.0%) |
| Food Preparation & Serving | 2 (28.6%) | 5 (71.4%) |
| Cleaning & Maintenance | 3 (100.0%) | 0 (0.0%) |
| Personal Care & Service | 0 (0.0%) | 0 (0.0%) |
| Total (Category) | 5 (35.7%) | 9 (64.3%) |
| Total (Overall) | 192 (71.1%) | 78 (28.9%) |
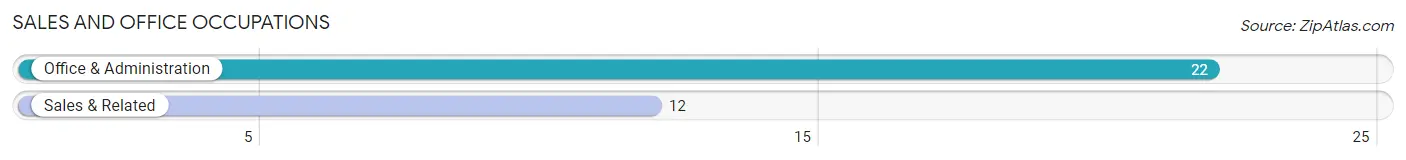
Sales and Office Occupations
The most common Sales and Office occupations in Luttrell are Office & Administration (22 | 8.2%), and Sales & Related (12 | 4.4%).
Sales and Office Occupations by Sex
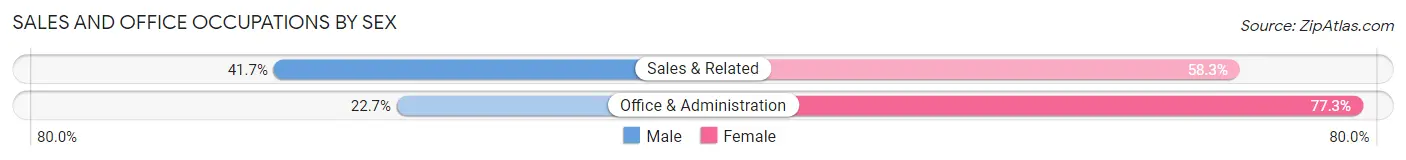
| Occupation | Male | Female |
| Sales & Related | 5 (41.7%) | 7 (58.3%) |
| Office & Administration | 5 (22.7%) | 17 (77.3%) |
| Total (Category) | 10 (29.4%) | 24 (70.6%) |
| Total (Overall) | 192 (71.1%) | 78 (28.9%) |
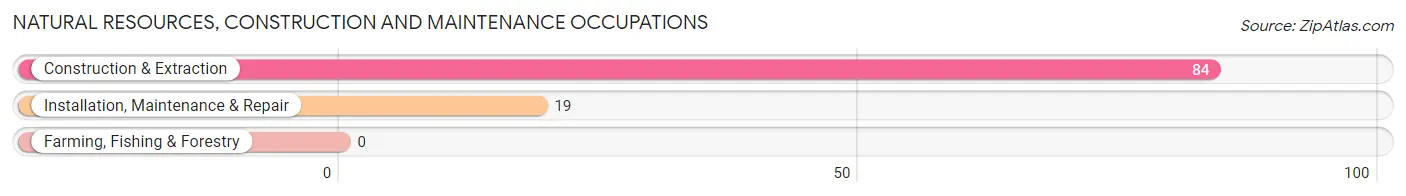
Natural Resources, Construction and Maintenance Occupations
The most common Natural Resources, Construction and Maintenance occupations in Luttrell are Construction & Extraction (84 | 31.1%), and Installation, Maintenance & Repair (19 | 7.0%).
Natural Resources, Construction and Maintenance Occupations by Sex
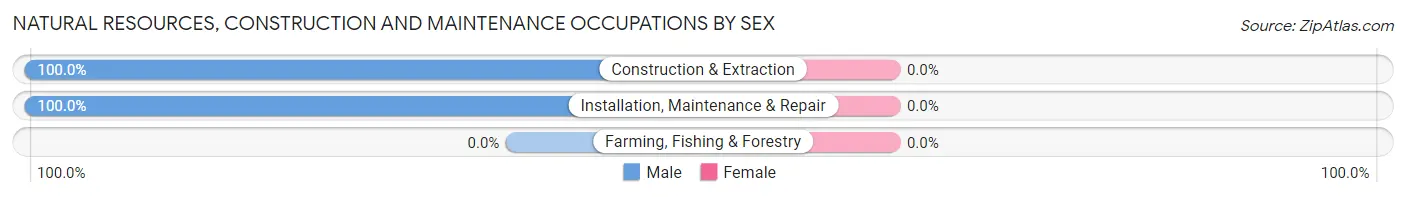
| Occupation | Male | Female |
| Farming, Fishing & Forestry | 0 (0.0%) | 0 (0.0%) |
| Construction & Extraction | 84 (100.0%) | 0 (0.0%) |
| Installation, Maintenance & Repair | 19 (100.0%) | 0 (0.0%) |
| Total (Category) | 103 (100.0%) | 0 (0.0%) |
| Total (Overall) | 192 (71.1%) | 78 (28.9%) |
Production, Transportation and Moving Occupations
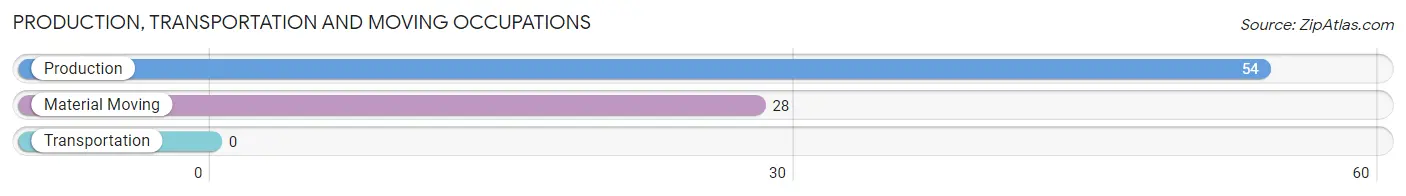
The most common Production, Transportation and Moving occupations in Luttrell are Production (54 | 20.0%), and Material Moving (28 | 10.4%).
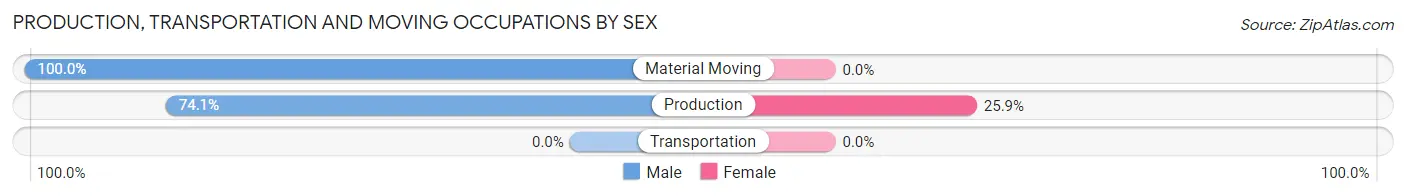
Production, Transportation and Moving Occupations by Sex
| Occupation | Male | Female |
| Production | 40 (74.1%) | 14 (25.9%) |
| Transportation | 0 (0.0%) | 0 (0.0%) |
| Material Moving | 28 (100.0%) | 0 (0.0%) |
| Total (Category) | 68 (82.9%) | 14 (17.1%) |
| Total (Overall) | 192 (71.1%) | 78 (28.9%) |
Employment Industries by Sex in Luttrell
Employment Industries in Luttrell
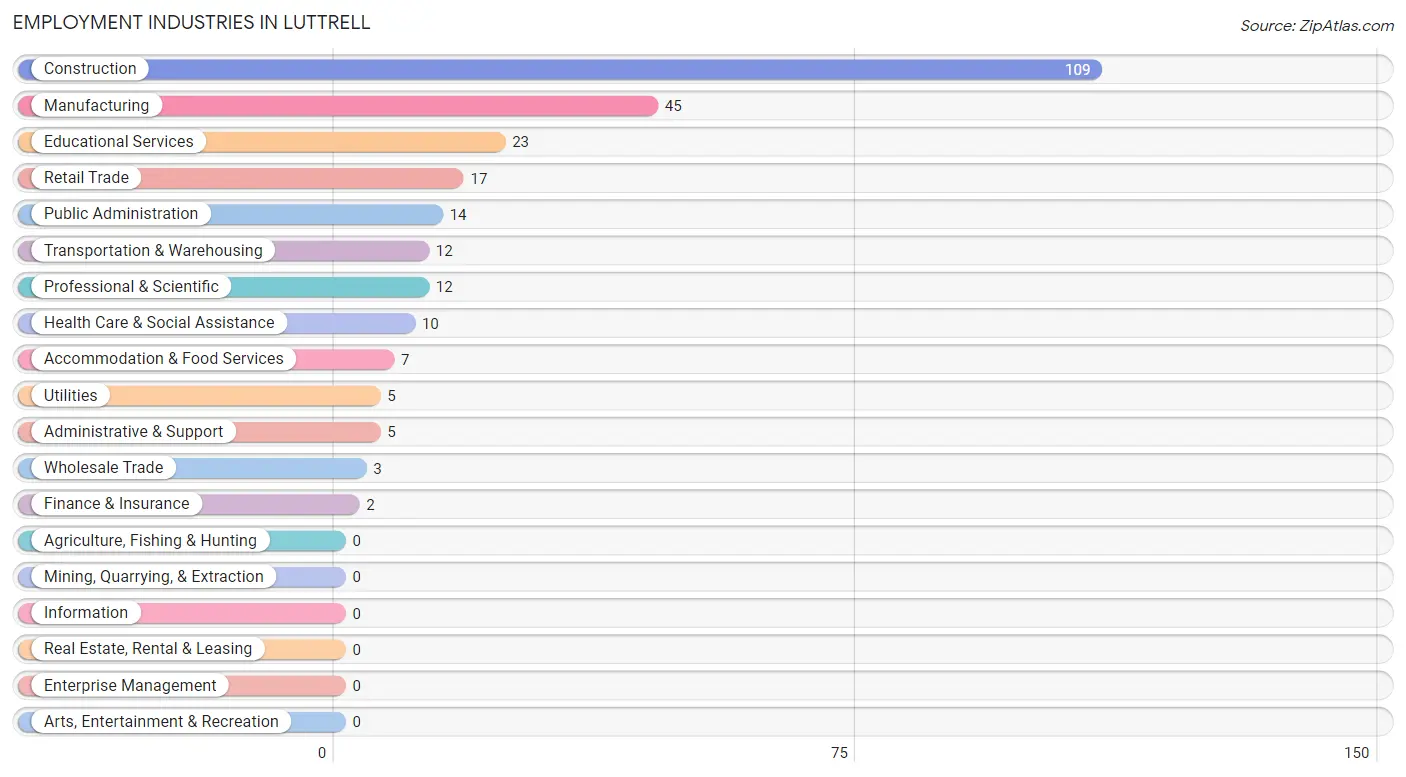
The major employment industries in Luttrell include Construction (109 | 40.4%), Manufacturing (45 | 16.7%), Educational Services (23 | 8.5%), Retail Trade (17 | 6.3%), and Public Administration (14 | 5.2%).
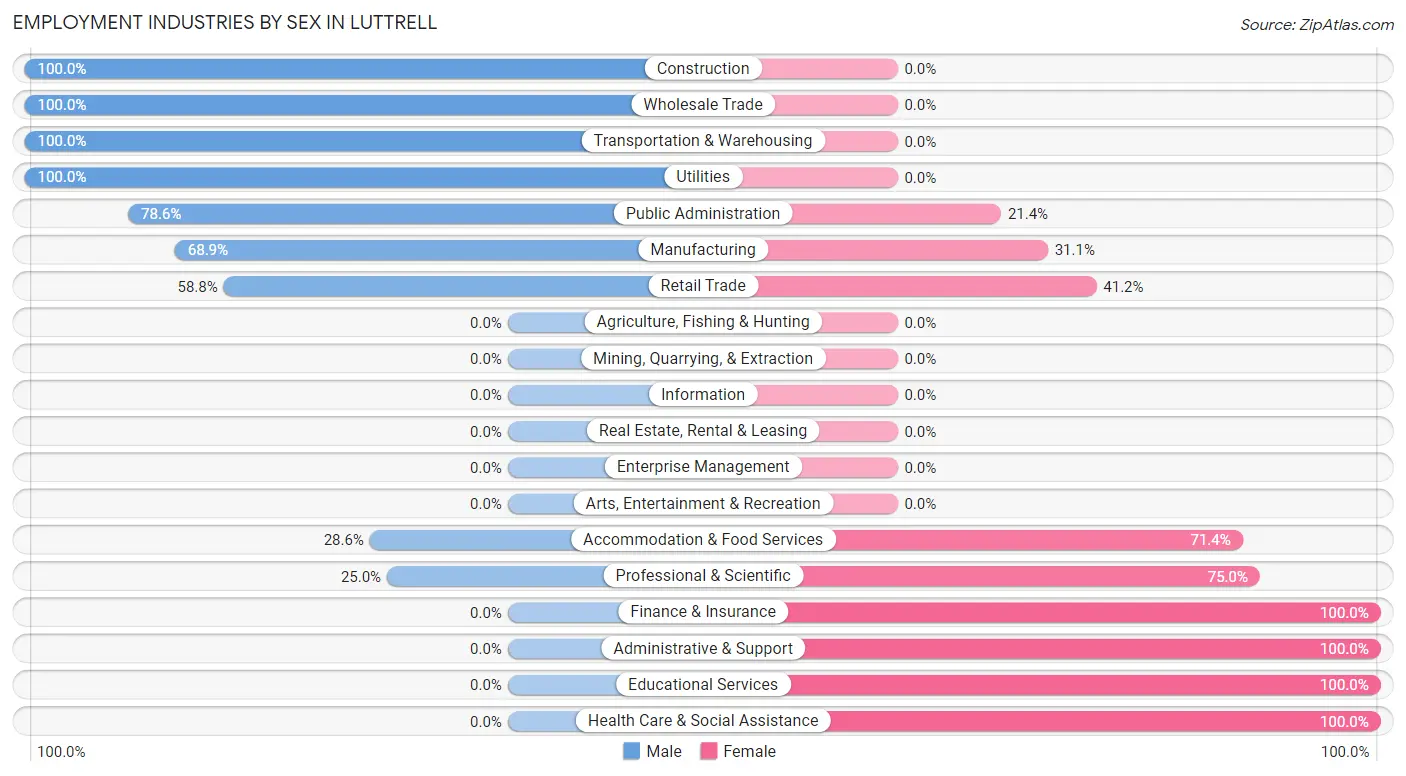
Employment Industries by Sex in Luttrell
The Luttrell industries that see more men than women are Construction (100.0%), Wholesale Trade (100.0%), and Transportation & Warehousing (100.0%), whereas the industries that tend to have a higher number of women are Finance & Insurance (100.0%), Administrative & Support (100.0%), and Educational Services (100.0%).
| Industry | Male | Female |
| Agriculture, Fishing & Hunting | 0 (0.0%) | 0 (0.0%) |
| Mining, Quarrying, & Extraction | 0 (0.0%) | 0 (0.0%) |
| Construction | 109 (100.0%) | 0 (0.0%) |
| Manufacturing | 31 (68.9%) | 14 (31.1%) |
| Wholesale Trade | 3 (100.0%) | 0 (0.0%) |
| Retail Trade | 10 (58.8%) | 7 (41.2%) |
| Transportation & Warehousing | 12 (100.0%) | 0 (0.0%) |
| Utilities | 5 (100.0%) | 0 (0.0%) |
| Information | 0 (0.0%) | 0 (0.0%) |
| Finance & Insurance | 0 (0.0%) | 2 (100.0%) |
| Real Estate, Rental & Leasing | 0 (0.0%) | 0 (0.0%) |
| Professional & Scientific | 3 (25.0%) | 9 (75.0%) |
| Enterprise Management | 0 (0.0%) | 0 (0.0%) |
| Administrative & Support | 0 (0.0%) | 5 (100.0%) |
| Educational Services | 0 (0.0%) | 23 (100.0%) |
| Health Care & Social Assistance | 0 (0.0%) | 10 (100.0%) |
| Arts, Entertainment & Recreation | 0 (0.0%) | 0 (0.0%) |
| Accommodation & Food Services | 2 (28.6%) | 5 (71.4%) |
| Public Administration | 11 (78.6%) | 3 (21.4%) |
| Total | 192 (71.1%) | 78 (28.9%) |
Education in Luttrell
School Enrollment in Luttrell
The most common levels of schooling among the 153 students in Luttrell are elementary school (58 | 37.9%), middle school (45 | 29.4%), and high school (35 | 22.9%).
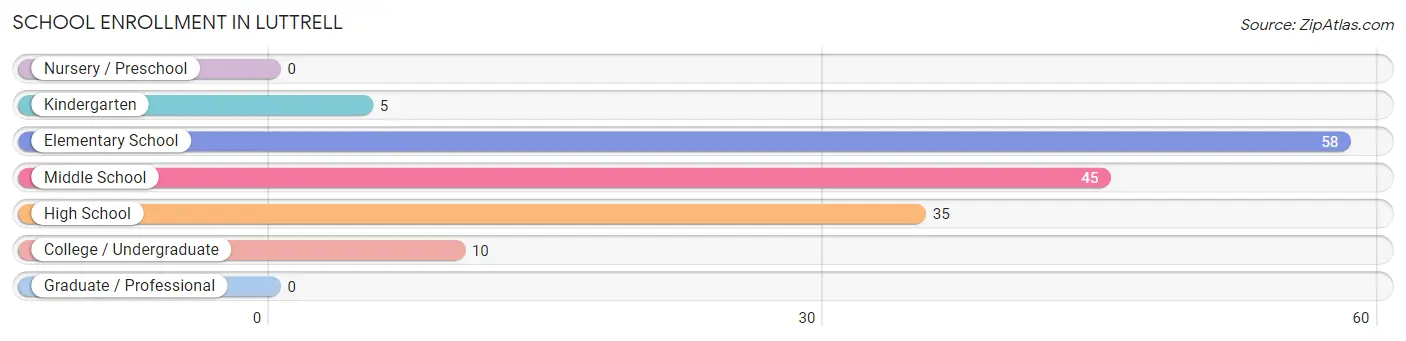
| School Level | # Students | % Students |
| Nursery / Preschool | 0 | 0.0% |
| Kindergarten | 5 | 3.3% |
| Elementary School | 58 | 37.9% |
| Middle School | 45 | 29.4% |
| High School | 35 | 22.9% |
| College / Undergraduate | 10 | 6.5% |
| Graduate / Professional | 0 | 0.0% |
| Total | 153 | 100.0% |
School Enrollment by Age by Funding Source in Luttrell
Out of a total of 153 students who are enrolled in schools in Luttrell, 6 (3.9%) attend a private institution, while the remaining 147 (96.1%) are enrolled in public schools. The age group of 20 to 24 year olds has the highest likelihood of being enrolled in private schools, with 2 (22.2% in the age bracket) enrolled. Conversely, the age group of 5 to 9 year old has the lowest likelihood of being enrolled in a private school, with 48 (100.0% in the age bracket) attending a public institution.
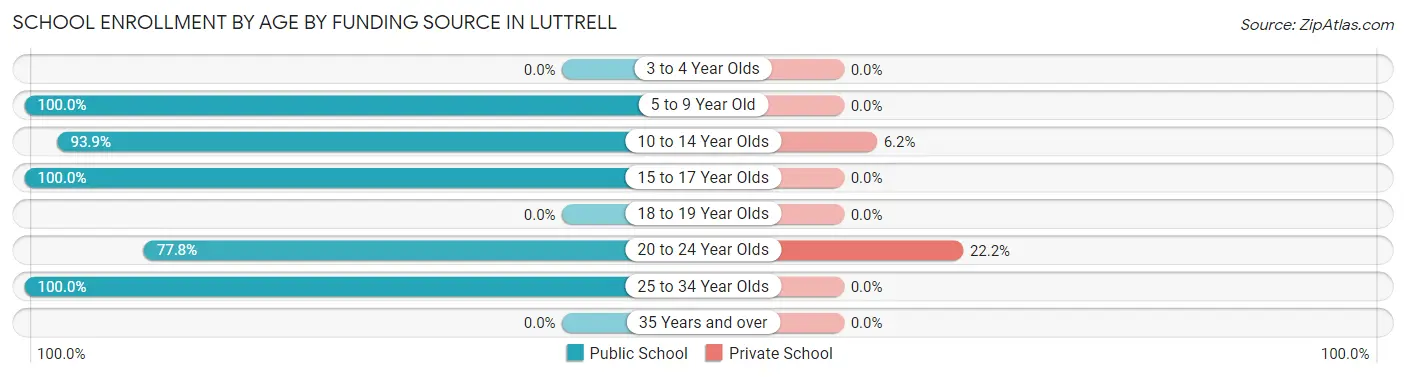
| Age Bracket | Public School | Private School |
| 3 to 4 Year Olds | 0 (0.0%) | 0 (0.0%) |
| 5 to 9 Year Old | 48 (100.0%) | 0 (0.0%) |
| 10 to 14 Year Olds | 61 (93.9%) | 4 (6.1%) |
| 15 to 17 Year Olds | 26 (100.0%) | 0 (0.0%) |
| 18 to 19 Year Olds | 0 (0.0%) | 0 (0.0%) |
| 20 to 24 Year Olds | 7 (77.8%) | 2 (22.2%) |
| 25 to 34 Year Olds | 5 (100.0%) | 0 (0.0%) |
| 35 Years and over | 0 (0.0%) | 0 (0.0%) |
| Total | 147 (96.1%) | 6 (3.9%) |
Educational Attainment by Field of Study in Luttrell
Education (43 | 84.3%), business (5 | 9.8%), and psychology (3 | 5.9%) are the most common fields of study among 51 individuals in Luttrell who have obtained a bachelor's degree or higher.
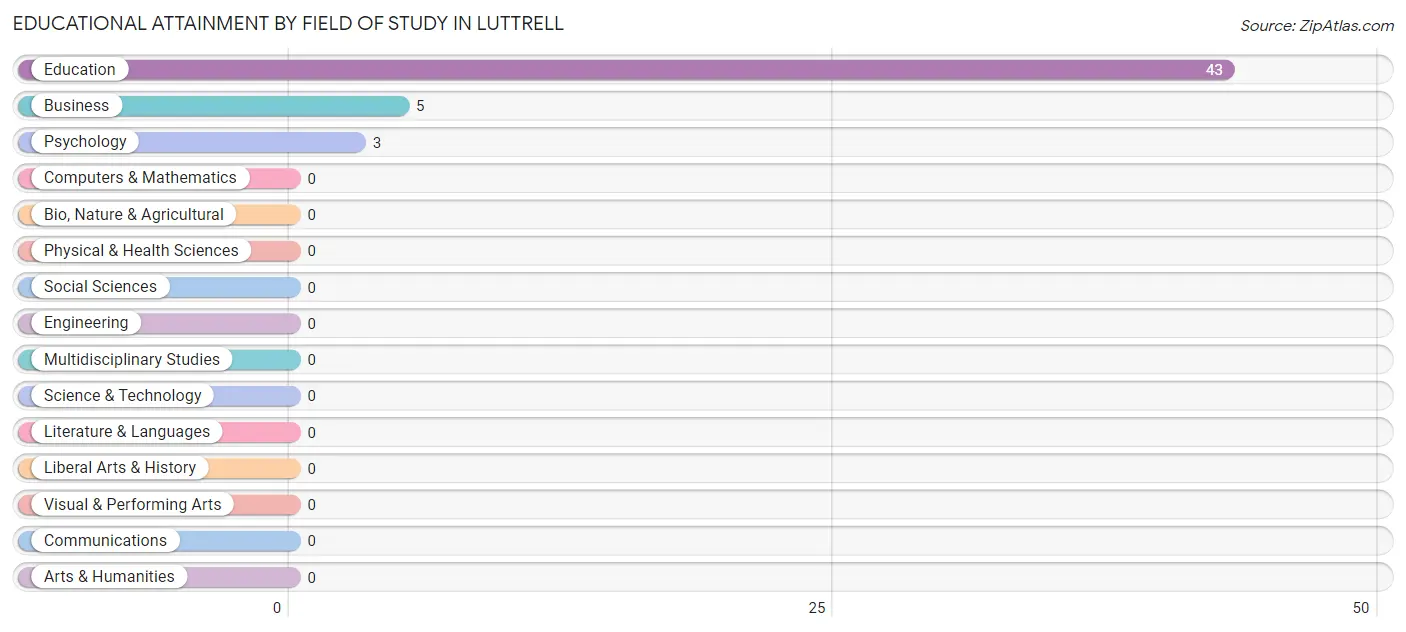
| Field of Study | # Graduates | % Graduates |
| Computers & Mathematics | 0 | 0.0% |
| Bio, Nature & Agricultural | 0 | 0.0% |
| Physical & Health Sciences | 0 | 0.0% |
| Psychology | 3 | 5.9% |
| Social Sciences | 0 | 0.0% |
| Engineering | 0 | 0.0% |
| Multidisciplinary Studies | 0 | 0.0% |
| Science & Technology | 0 | 0.0% |
| Business | 5 | 9.8% |
| Education | 43 | 84.3% |
| Literature & Languages | 0 | 0.0% |
| Liberal Arts & History | 0 | 0.0% |
| Visual & Performing Arts | 0 | 0.0% |
| Communications | 0 | 0.0% |
| Arts & Humanities | 0 | 0.0% |
| Total | 51 | 100.0% |
Transportation & Commute in Luttrell
Vehicle Availability by Sex in Luttrell
The most prevalent vehicle ownership categories in Luttrell are males with 3 vehicles (68, accounting for 36.0%) and females with 3 vehicles (17, making up 91.9%).
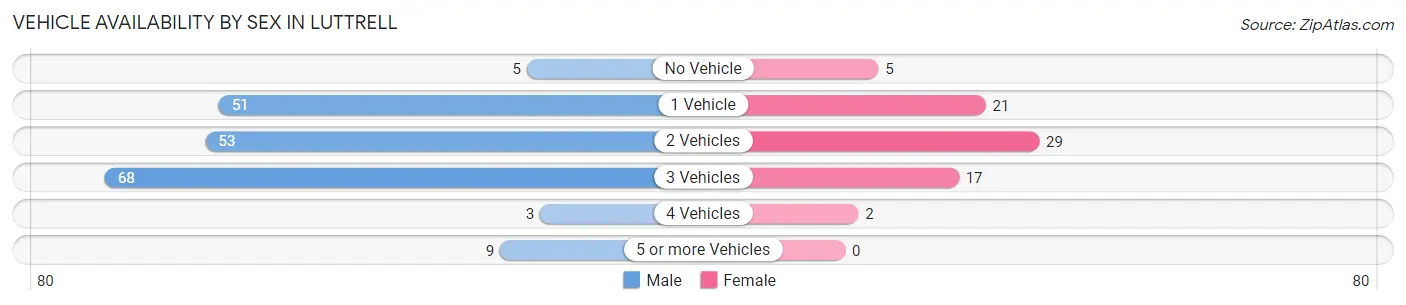
| Vehicles Available | Male | Female |
| No Vehicle | 5 (2.6%) | 5 (6.8%) |
| 1 Vehicle | 51 (27.0%) | 21 (28.4%) |
| 2 Vehicles | 53 (28.0%) | 29 (39.2%) |
| 3 Vehicles | 68 (36.0%) | 17 (23.0%) |
| 4 Vehicles | 3 (1.6%) | 2 (2.7%) |
| 5 or more Vehicles | 9 (4.8%) | 0 (0.0%) |
| Total | 189 (100.0%) | 74 (100.0%) |
Commute Time in Luttrell
The most frequently occuring commute durations in Luttrell are 60 to 89 minutes (62 commuters, 24.1%), 30 to 34 minutes (58 commuters, 22.6%), and 20 to 24 minutes (31 commuters, 12.1%).
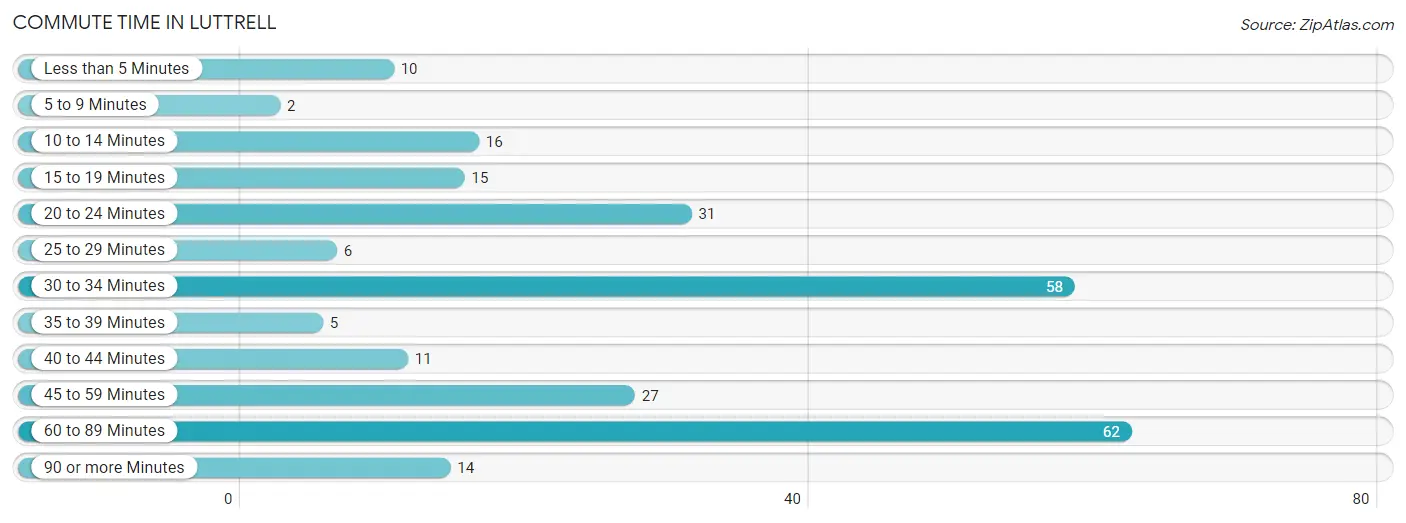
| Commute Time | # Commuters | % Commuters |
| Less than 5 Minutes | 10 | 3.9% |
| 5 to 9 Minutes | 2 | 0.8% |
| 10 to 14 Minutes | 16 | 6.2% |
| 15 to 19 Minutes | 15 | 5.8% |
| 20 to 24 Minutes | 31 | 12.1% |
| 25 to 29 Minutes | 6 | 2.3% |
| 30 to 34 Minutes | 58 | 22.6% |
| 35 to 39 Minutes | 5 | 1.9% |
| 40 to 44 Minutes | 11 | 4.3% |
| 45 to 59 Minutes | 27 | 10.5% |
| 60 to 89 Minutes | 62 | 24.1% |
| 90 or more Minutes | 14 | 5.4% |
Commute Time by Sex in Luttrell
The most common commute times in Luttrell are 60 to 89 minutes (56 commuters, 29.6%) for males and 30 to 34 minutes (17 commuters, 25.0%) for females.
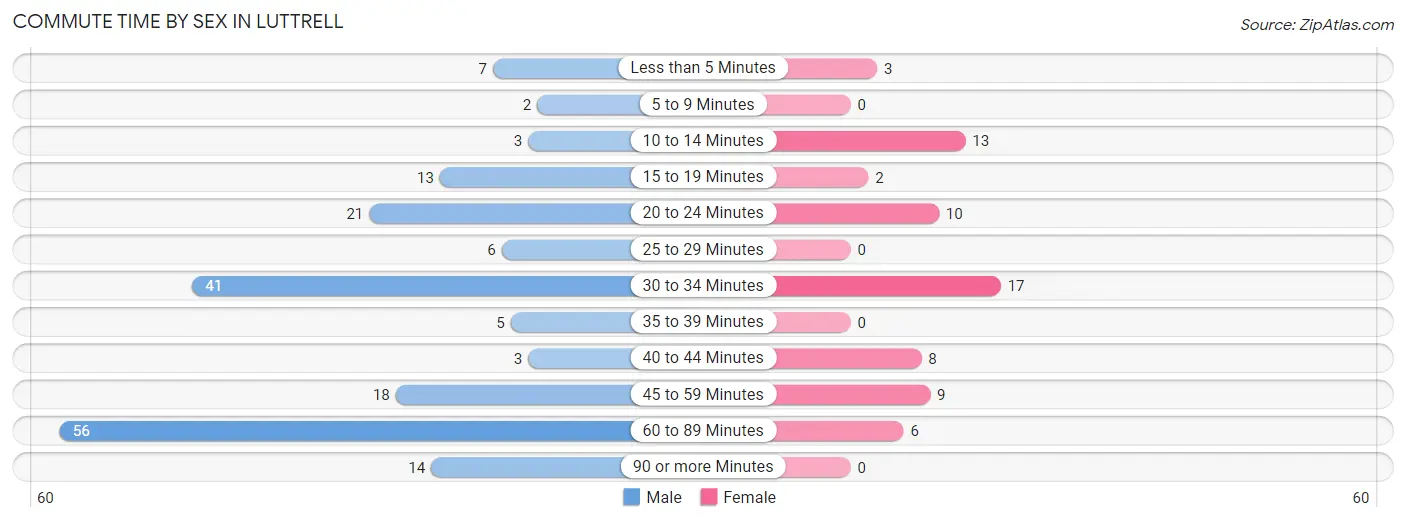
| Commute Time | Male | Female |
| Less than 5 Minutes | 7 (3.7%) | 3 (4.4%) |
| 5 to 9 Minutes | 2 (1.1%) | 0 (0.0%) |
| 10 to 14 Minutes | 3 (1.6%) | 13 (19.1%) |
| 15 to 19 Minutes | 13 (6.9%) | 2 (2.9%) |
| 20 to 24 Minutes | 21 (11.1%) | 10 (14.7%) |
| 25 to 29 Minutes | 6 (3.2%) | 0 (0.0%) |
| 30 to 34 Minutes | 41 (21.7%) | 17 (25.0%) |
| 35 to 39 Minutes | 5 (2.6%) | 0 (0.0%) |
| 40 to 44 Minutes | 3 (1.6%) | 8 (11.8%) |
| 45 to 59 Minutes | 18 (9.5%) | 9 (13.2%) |
| 60 to 89 Minutes | 56 (29.6%) | 6 (8.8%) |
| 90 or more Minutes | 14 (7.4%) | 0 (0.0%) |
Time of Departure to Work by Sex in Luttrell
The most frequent times of departure to work in Luttrell are 6:30 AM to 6:59 AM (68, 36.0%) for males and 7:00 AM to 7:29 AM (22, 32.4%) for females.
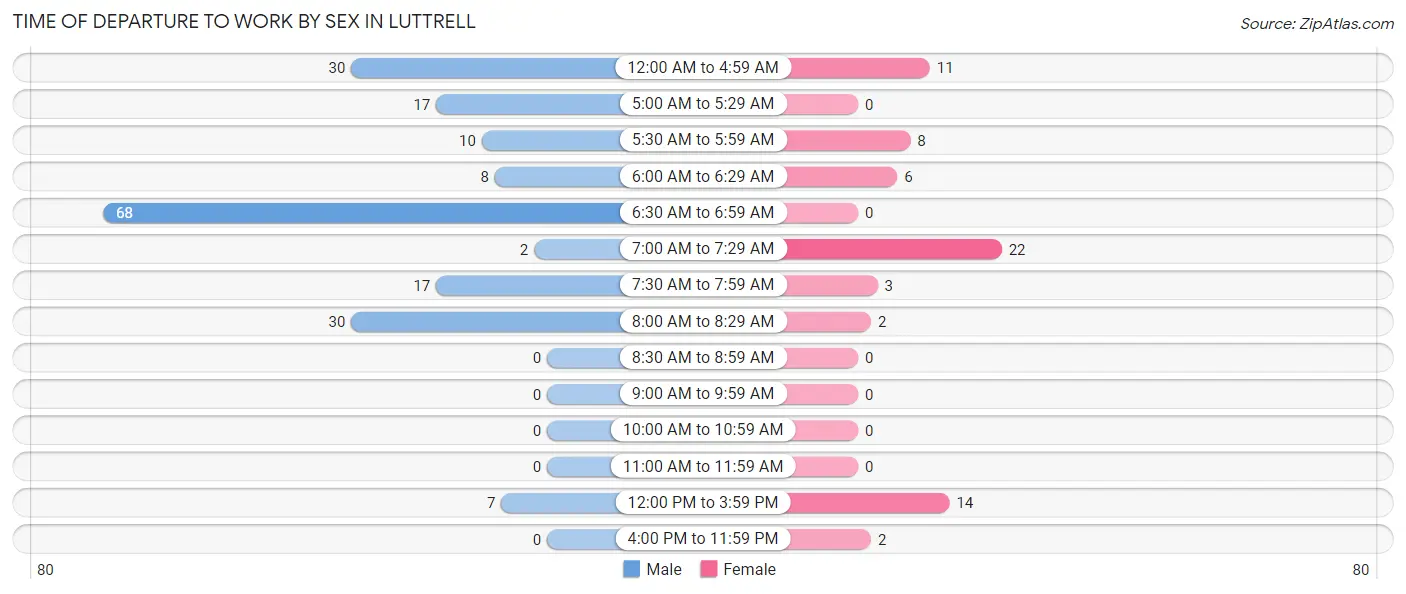
| Time of Departure | Male | Female |
| 12:00 AM to 4:59 AM | 30 (15.9%) | 11 (16.2%) |
| 5:00 AM to 5:29 AM | 17 (9.0%) | 0 (0.0%) |
| 5:30 AM to 5:59 AM | 10 (5.3%) | 8 (11.8%) |
| 6:00 AM to 6:29 AM | 8 (4.2%) | 6 (8.8%) |
| 6:30 AM to 6:59 AM | 68 (36.0%) | 0 (0.0%) |
| 7:00 AM to 7:29 AM | 2 (1.1%) | 22 (32.4%) |
| 7:30 AM to 7:59 AM | 17 (9.0%) | 3 (4.4%) |
| 8:00 AM to 8:29 AM | 30 (15.9%) | 2 (2.9%) |
| 8:30 AM to 8:59 AM | 0 (0.0%) | 0 (0.0%) |
| 9:00 AM to 9:59 AM | 0 (0.0%) | 0 (0.0%) |
| 10:00 AM to 10:59 AM | 0 (0.0%) | 0 (0.0%) |
| 11:00 AM to 11:59 AM | 0 (0.0%) | 0 (0.0%) |
| 12:00 PM to 3:59 PM | 7 (3.7%) | 14 (20.6%) |
| 4:00 PM to 11:59 PM | 0 (0.0%) | 2 (2.9%) |
| Total | 189 (100.0%) | 68 (100.0%) |
Housing Occupancy in Luttrell
Occupancy by Ownership in Luttrell
Of the total 362 dwellings in Luttrell, owner-occupied units account for 300 (82.9%), while renter-occupied units make up 62 (17.1%).
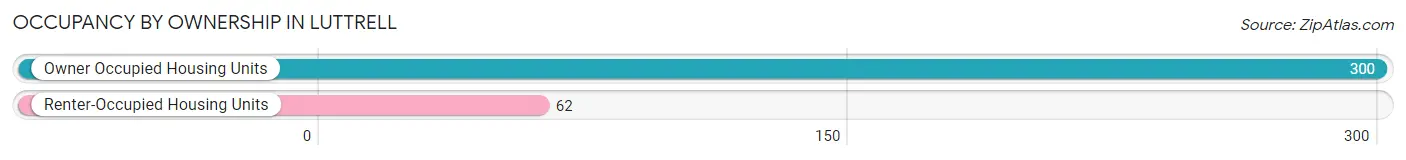
| Occupancy | # Housing Units | % Housing Units |
| Owner Occupied Housing Units | 300 | 82.9% |
| Renter-Occupied Housing Units | 62 | 17.1% |
| Total Occupied Housing Units | 362 | 100.0% |
Occupancy by Household Size in Luttrell
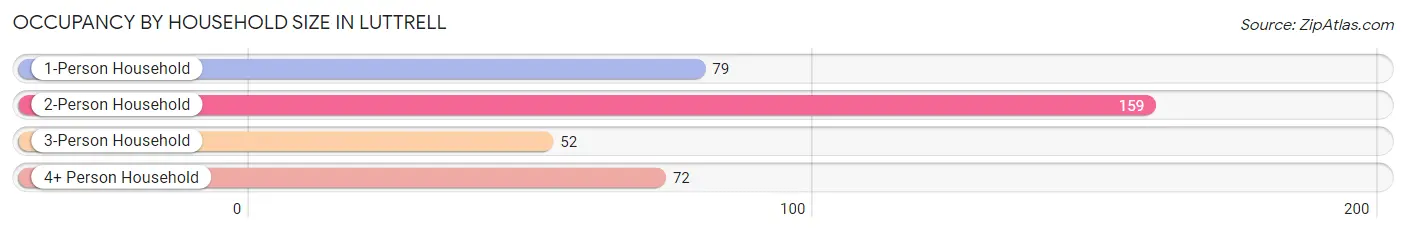
| Household Size | # Housing Units | % Housing Units |
| 1-Person Household | 79 | 21.8% |
| 2-Person Household | 159 | 43.9% |
| 3-Person Household | 52 | 14.4% |
| 4+ Person Household | 72 | 19.9% |
| Total Housing Units | 362 | 100.0% |
Occupancy by Ownership by Household Size in Luttrell
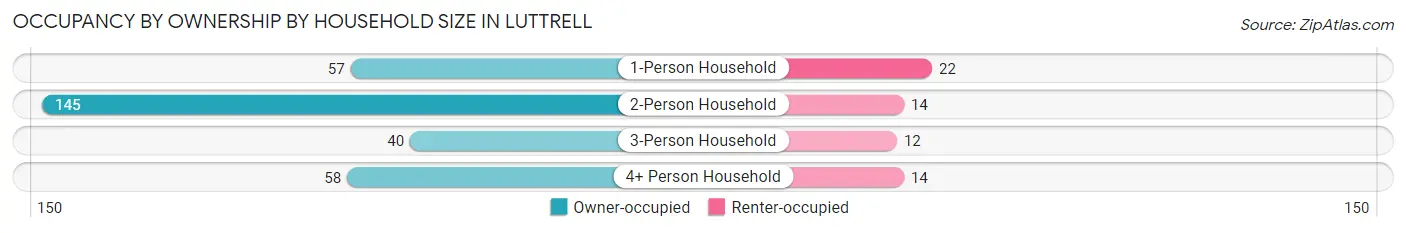
| Household Size | Owner-occupied | Renter-occupied |
| 1-Person Household | 57 (72.2%) | 22 (27.9%) |
| 2-Person Household | 145 (91.2%) | 14 (8.8%) |
| 3-Person Household | 40 (76.9%) | 12 (23.1%) |
| 4+ Person Household | 58 (80.6%) | 14 (19.4%) |
| Total Housing Units | 300 (82.9%) | 62 (17.1%) |
Occupancy by Educational Attainment in Luttrell
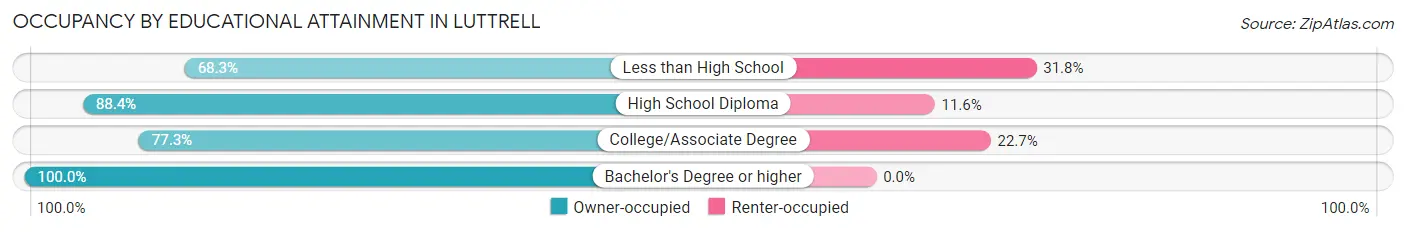
| Household Size | Owner-occupied | Renter-occupied |
| Less than High School | 43 (68.2%) | 20 (31.8%) |
| High School Diploma | 191 (88.4%) | 25 (11.6%) |
| College/Associate Degree | 58 (77.3%) | 17 (22.7%) |
| Bachelor's Degree or higher | 8 (100.0%) | 0 (0.0%) |
Occupancy by Age of Householder in Luttrell
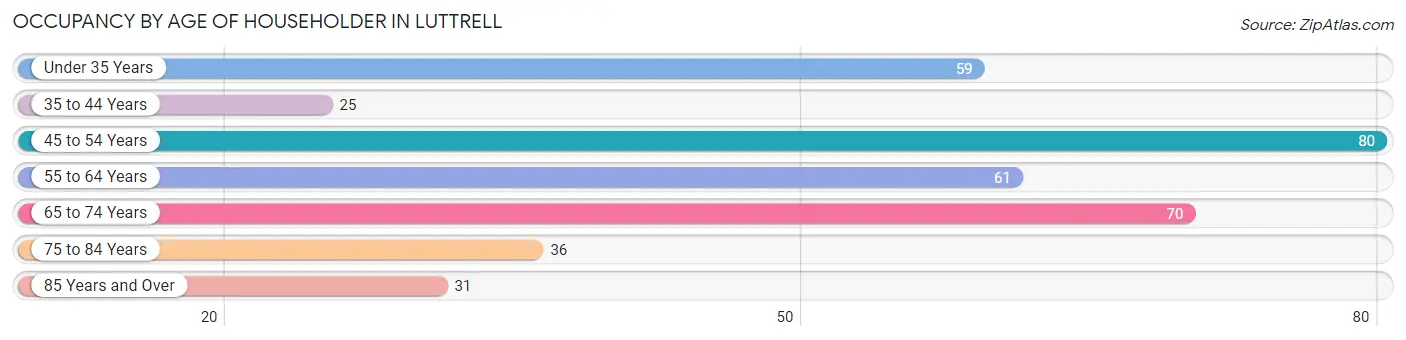
| Age Bracket | # Households | % Households |
| Under 35 Years | 59 | 16.3% |
| 35 to 44 Years | 25 | 6.9% |
| 45 to 54 Years | 80 | 22.1% |
| 55 to 64 Years | 61 | 16.9% |
| 65 to 74 Years | 70 | 19.3% |
| 75 to 84 Years | 36 | 9.9% |
| 85 Years and Over | 31 | 8.6% |
| Total | 362 | 100.0% |
Housing Finances in Luttrell
Median Income by Occupancy in Luttrell
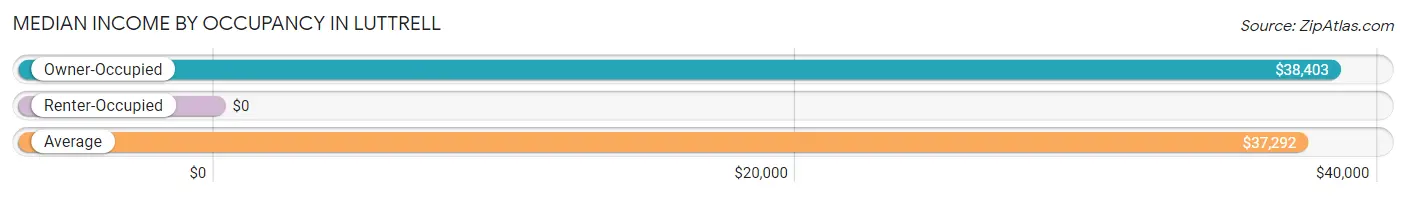
| Occupancy Type | # Households | Median Income |
| Owner-Occupied | 300 (82.9%) | $38,403 |
| Renter-Occupied | 62 (17.1%) | $0 |
| Average | 362 (100.0%) | $37,292 |
Occupancy by Householder Income Bracket in Luttrell
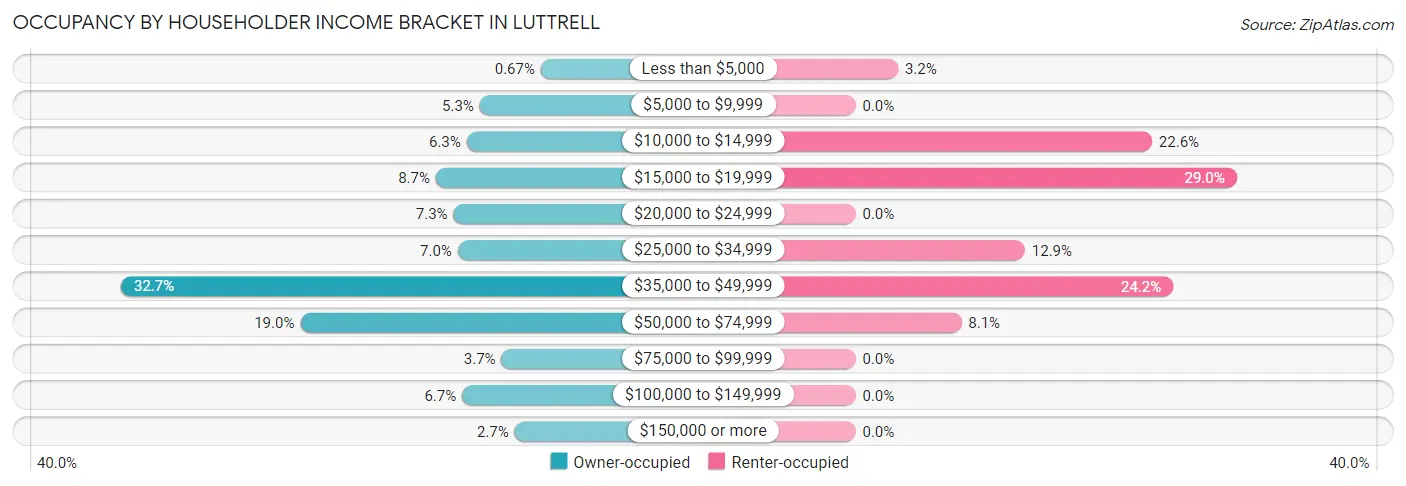
| Income Bracket | Owner-occupied | Renter-occupied |
| Less than $5,000 | 2 (0.7%) | 2 (3.2%) |
| $5,000 to $9,999 | 16 (5.3%) | 0 (0.0%) |
| $10,000 to $14,999 | 19 (6.3%) | 14 (22.6%) |
| $15,000 to $19,999 | 26 (8.7%) | 18 (29.0%) |
| $20,000 to $24,999 | 22 (7.3%) | 0 (0.0%) |
| $25,000 to $34,999 | 21 (7.0%) | 8 (12.9%) |
| $35,000 to $49,999 | 98 (32.7%) | 15 (24.2%) |
| $50,000 to $74,999 | 57 (19.0%) | 5 (8.1%) |
| $75,000 to $99,999 | 11 (3.7%) | 0 (0.0%) |
| $100,000 to $149,999 | 20 (6.7%) | 0 (0.0%) |
| $150,000 or more | 8 (2.7%) | 0 (0.0%) |
| Total | 300 (100.0%) | 62 (100.0%) |
Monthly Housing Cost Tiers in Luttrell
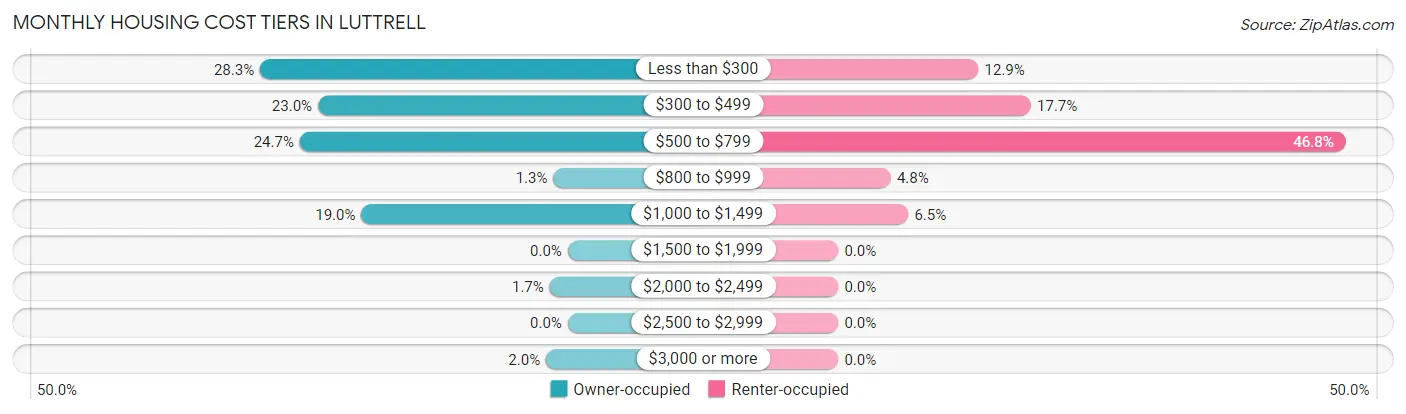
| Monthly Cost | Owner-occupied | Renter-occupied |
| Less than $300 | 85 (28.3%) | 8 (12.9%) |
| $300 to $499 | 69 (23.0%) | 11 (17.7%) |
| $500 to $799 | 74 (24.7%) | 29 (46.8%) |
| $800 to $999 | 4 (1.3%) | 3 (4.8%) |
| $1,000 to $1,499 | 57 (19.0%) | 4 (6.5%) |
| $1,500 to $1,999 | 0 (0.0%) | 0 (0.0%) |
| $2,000 to $2,499 | 5 (1.7%) | 0 (0.0%) |
| $2,500 to $2,999 | 0 (0.0%) | 0 (0.0%) |
| $3,000 or more | 6 (2.0%) | 0 (0.0%) |
| Total | 300 (100.0%) | 62 (100.0%) |
Physical Housing Characteristics in Luttrell
Housing Structures in Luttrell
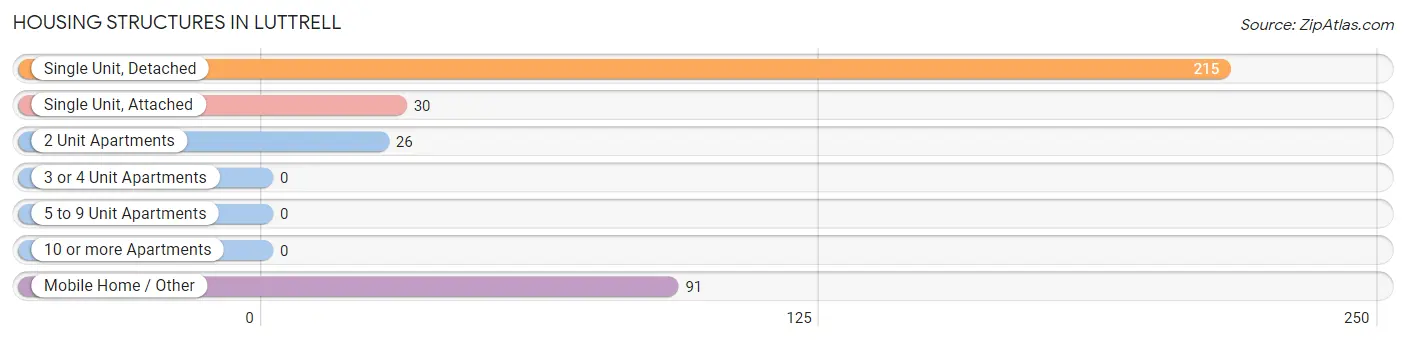
| Structure Type | # Housing Units | % Housing Units |
| Single Unit, Detached | 215 | 59.4% |
| Single Unit, Attached | 30 | 8.3% |
| 2 Unit Apartments | 26 | 7.2% |
| 3 or 4 Unit Apartments | 0 | 0.0% |
| 5 to 9 Unit Apartments | 0 | 0.0% |
| 10 or more Apartments | 0 | 0.0% |
| Mobile Home / Other | 91 | 25.1% |
| Total | 362 | 100.0% |
Housing Structures by Occupancy in Luttrell
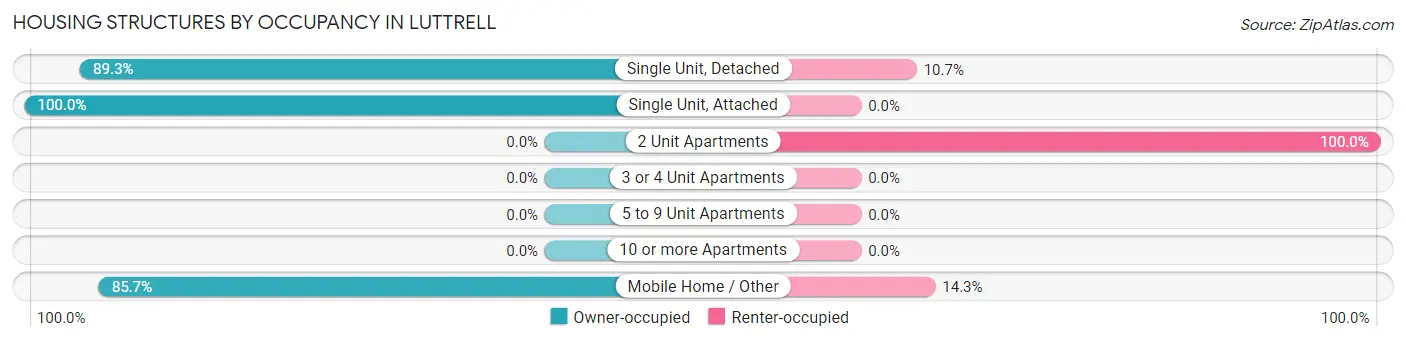
| Structure Type | Owner-occupied | Renter-occupied |
| Single Unit, Detached | 192 (89.3%) | 23 (10.7%) |
| Single Unit, Attached | 30 (100.0%) | 0 (0.0%) |
| 2 Unit Apartments | 0 (0.0%) | 26 (100.0%) |
| 3 or 4 Unit Apartments | 0 (0.0%) | 0 (0.0%) |
| 5 to 9 Unit Apartments | 0 (0.0%) | 0 (0.0%) |
| 10 or more Apartments | 0 (0.0%) | 0 (0.0%) |
| Mobile Home / Other | 78 (85.7%) | 13 (14.3%) |
| Total | 300 (82.9%) | 62 (17.1%) |
Housing Structures by Number of Rooms in Luttrell
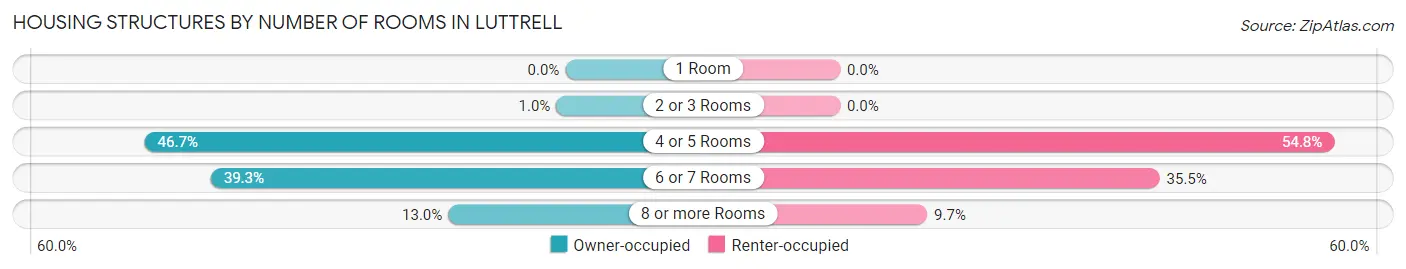
| Number of Rooms | Owner-occupied | Renter-occupied |
| 1 Room | 0 (0.0%) | 0 (0.0%) |
| 2 or 3 Rooms | 3 (1.0%) | 0 (0.0%) |
| 4 or 5 Rooms | 140 (46.7%) | 34 (54.8%) |
| 6 or 7 Rooms | 118 (39.3%) | 22 (35.5%) |
| 8 or more Rooms | 39 (13.0%) | 6 (9.7%) |
| Total | 300 (100.0%) | 62 (100.0%) |
Housing Structure by Heating Type in Luttrell
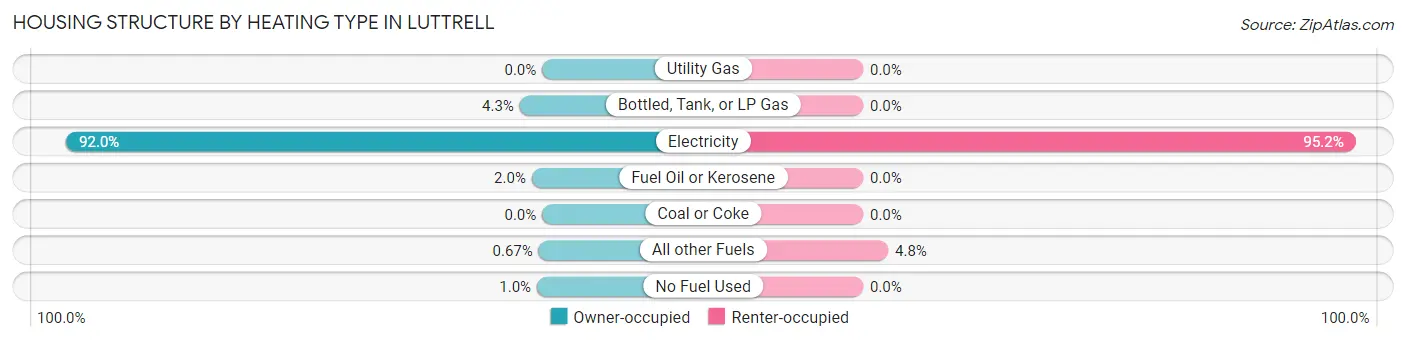
| Heating Type | Owner-occupied | Renter-occupied |
| Utility Gas | 0 (0.0%) | 0 (0.0%) |
| Bottled, Tank, or LP Gas | 13 (4.3%) | 0 (0.0%) |
| Electricity | 276 (92.0%) | 59 (95.2%) |
| Fuel Oil or Kerosene | 6 (2.0%) | 0 (0.0%) |
| Coal or Coke | 0 (0.0%) | 0 (0.0%) |
| All other Fuels | 2 (0.7%) | 3 (4.8%) |
| No Fuel Used | 3 (1.0%) | 0 (0.0%) |
| Total | 300 (100.0%) | 62 (100.0%) |
Household Vehicle Usage in Luttrell
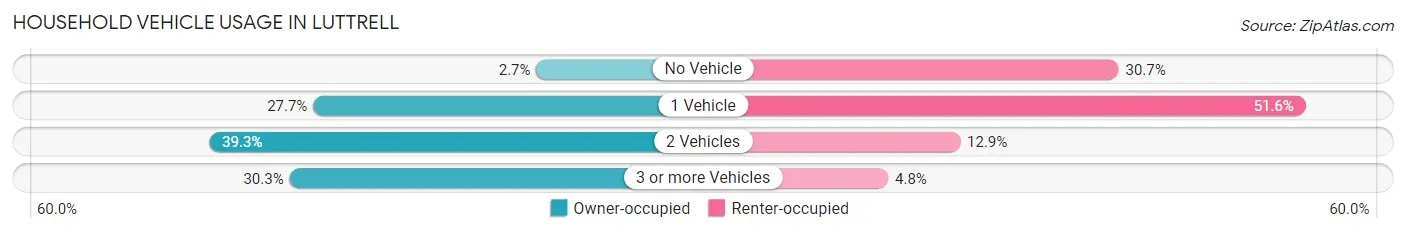
| Vehicles per Household | Owner-occupied | Renter-occupied |
| No Vehicle | 8 (2.7%) | 19 (30.6%) |
| 1 Vehicle | 83 (27.7%) | 32 (51.6%) |
| 2 Vehicles | 118 (39.3%) | 8 (12.9%) |
| 3 or more Vehicles | 91 (30.3%) | 3 (4.8%) |
| Total | 300 (100.0%) | 62 (100.0%) |
Real Estate & Mortgages in Luttrell
Real Estate and Mortgage Overview in Luttrell
| Characteristic | Without Mortgage | With Mortgage |
| Housing Units | 197 | 103 |
| Median Property Value | $127,200 | $126,000 |
| Median Household Income | $36,653 | $5 |
| Monthly Housing Costs | $319 | $6 |
| Real Estate Taxes | $517 | $3 |
Property Value by Mortgage Status in Luttrell
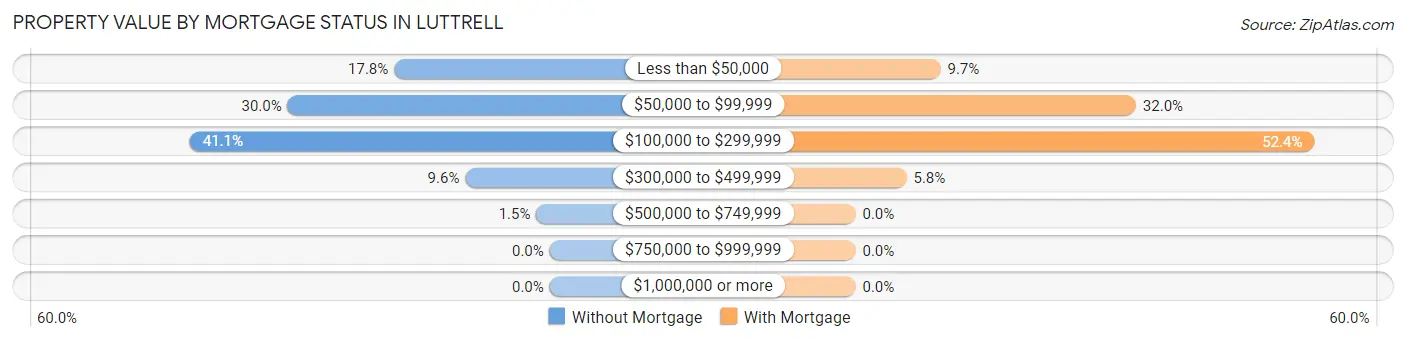
| Property Value | Without Mortgage | With Mortgage |
| Less than $50,000 | 35 (17.8%) | 10 (9.7%) |
| $50,000 to $99,999 | 59 (29.9%) | 33 (32.0%) |
| $100,000 to $299,999 | 81 (41.1%) | 54 (52.4%) |
| $300,000 to $499,999 | 19 (9.6%) | 6 (5.8%) |
| $500,000 to $749,999 | 3 (1.5%) | 0 (0.0%) |
| $750,000 to $999,999 | 0 (0.0%) | 0 (0.0%) |
| $1,000,000 or more | 0 (0.0%) | 0 (0.0%) |
| Total | 197 (100.0%) | 103 (100.0%) |
Household Income by Mortgage Status in Luttrell
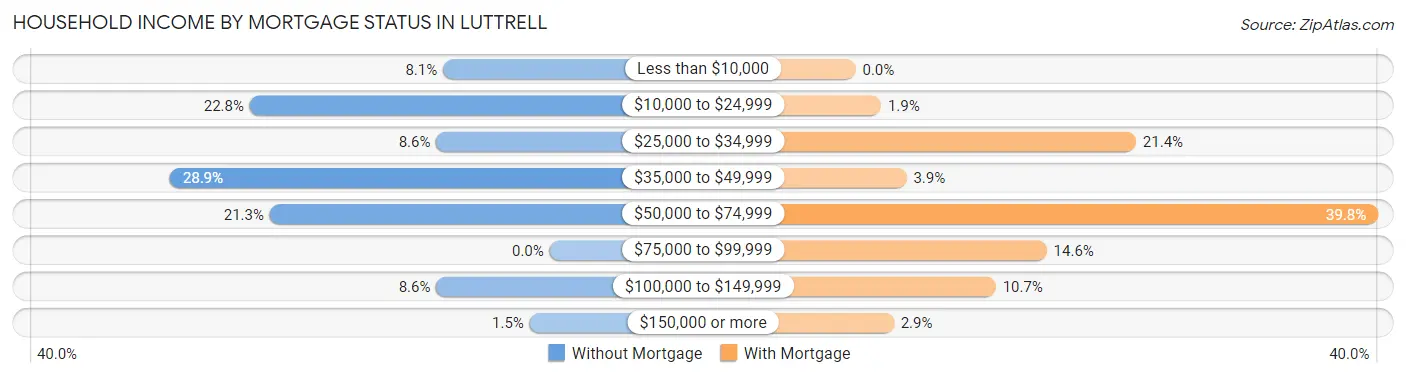
| Household Income | Without Mortgage | With Mortgage |
| Less than $10,000 | 16 (8.1%) | 0 (0.0%) |
| $10,000 to $24,999 | 45 (22.8%) | 2 (1.9%) |
| $25,000 to $34,999 | 17 (8.6%) | 22 (21.4%) |
| $35,000 to $49,999 | 57 (28.9%) | 4 (3.9%) |
| $50,000 to $74,999 | 42 (21.3%) | 41 (39.8%) |
| $75,000 to $99,999 | 0 (0.0%) | 15 (14.6%) |
| $100,000 to $149,999 | 17 (8.6%) | 11 (10.7%) |
| $150,000 or more | 3 (1.5%) | 3 (2.9%) |
| Total | 197 (100.0%) | 103 (100.0%) |
Property Value to Household Income Ratio in Luttrell
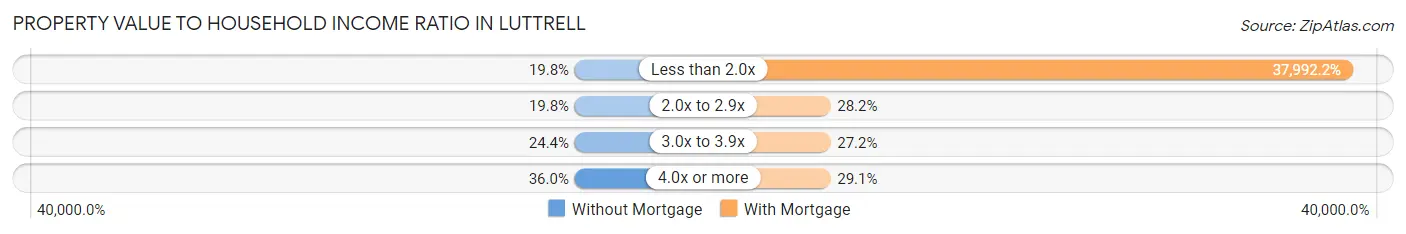
| Value-to-Income Ratio | Without Mortgage | With Mortgage |
| Less than 2.0x | 39 (19.8%) | 39,132 (37,992.2%) |
| 2.0x to 2.9x | 39 (19.8%) | 29 (28.2%) |
| 3.0x to 3.9x | 48 (24.4%) | 28 (27.2%) |
| 4.0x or more | 71 (36.0%) | 30 (29.1%) |
| Total | 197 (100.0%) | 103 (100.0%) |
Real Estate Taxes by Mortgage Status in Luttrell
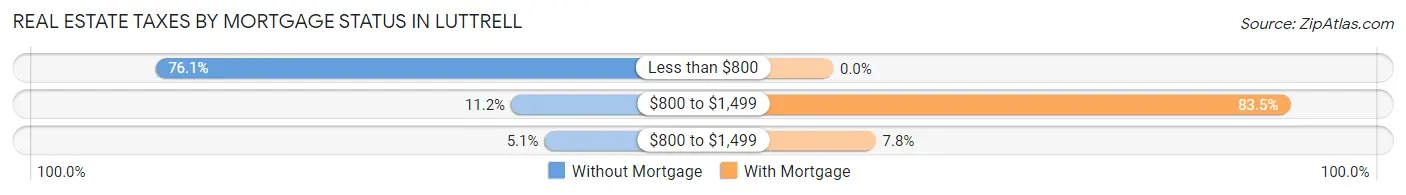
| Property Taxes | Without Mortgage | With Mortgage |
| Less than $800 | 150 (76.1%) | 0 (0.0%) |
| $800 to $1,499 | 22 (11.2%) | 86 (83.5%) |
| $800 to $1,499 | 10 (5.1%) | 8 (7.8%) |
| Total | 197 (100.0%) | 103 (100.0%) |
Health & Disability in Luttrell
Health Insurance Coverage by Age in Luttrell
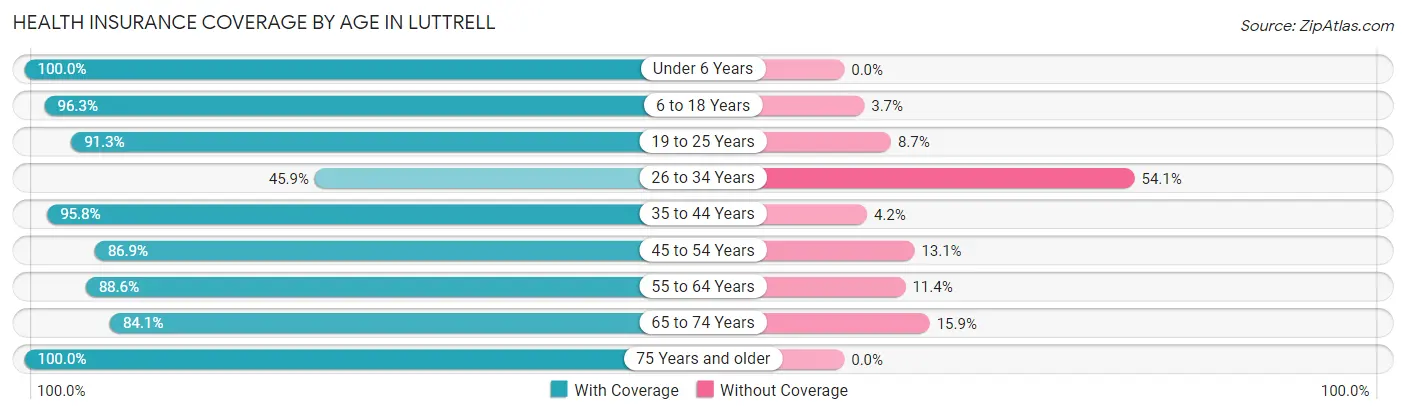
| Age Bracket | With Coverage | Without Coverage |
| Under 6 Years | 85 (100.0%) | 0 (0.0%) |
| 6 to 18 Years | 129 (96.3%) | 5 (3.7%) |
| 19 to 25 Years | 63 (91.3%) | 6 (8.7%) |
| 26 to 34 Years | 39 (45.9%) | 46 (54.1%) |
| 35 to 44 Years | 68 (95.8%) | 3 (4.2%) |
| 45 to 54 Years | 113 (86.9%) | 17 (13.1%) |
| 55 to 64 Years | 132 (88.6%) | 17 (11.4%) |
| 65 to 74 Years | 95 (84.1%) | 18 (15.9%) |
| 75 Years and older | 81 (100.0%) | 0 (0.0%) |
| Total | 805 (87.8%) | 112 (12.2%) |
Health Insurance Coverage by Citizenship Status in Luttrell
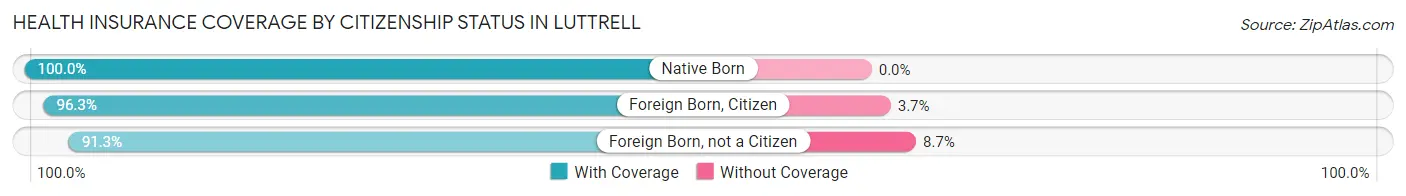
| Citizenship Status | With Coverage | Without Coverage |
| Native Born | 85 (100.0%) | 0 (0.0%) |
| Foreign Born, Citizen | 129 (96.3%) | 5 (3.7%) |
| Foreign Born, not a Citizen | 63 (91.3%) | 6 (8.7%) |
Health Insurance Coverage by Household Income in Luttrell
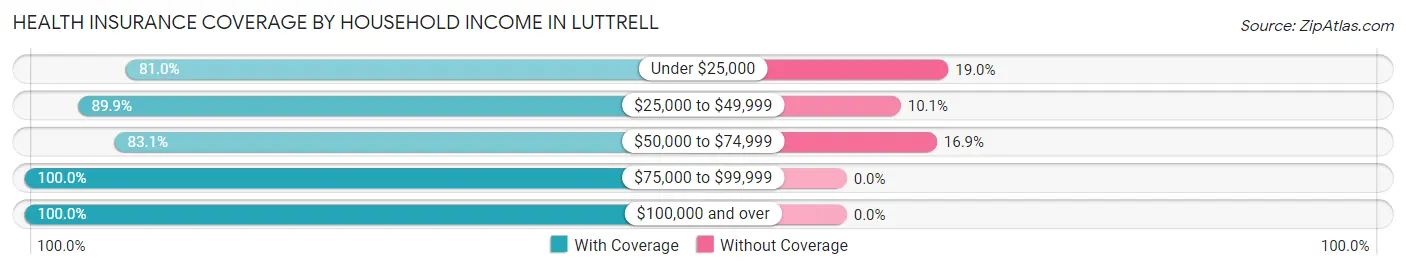
| Household Income | With Coverage | Without Coverage |
| Under $25,000 | 183 (81.0%) | 43 (19.0%) |
| $25,000 to $49,999 | 373 (89.9%) | 42 (10.1%) |
| $50,000 to $74,999 | 133 (83.1%) | 27 (16.9%) |
| $75,000 to $99,999 | 42 (100.0%) | 0 (0.0%) |
| $100,000 and over | 74 (100.0%) | 0 (0.0%) |
Public vs Private Health Insurance Coverage by Age in Luttrell
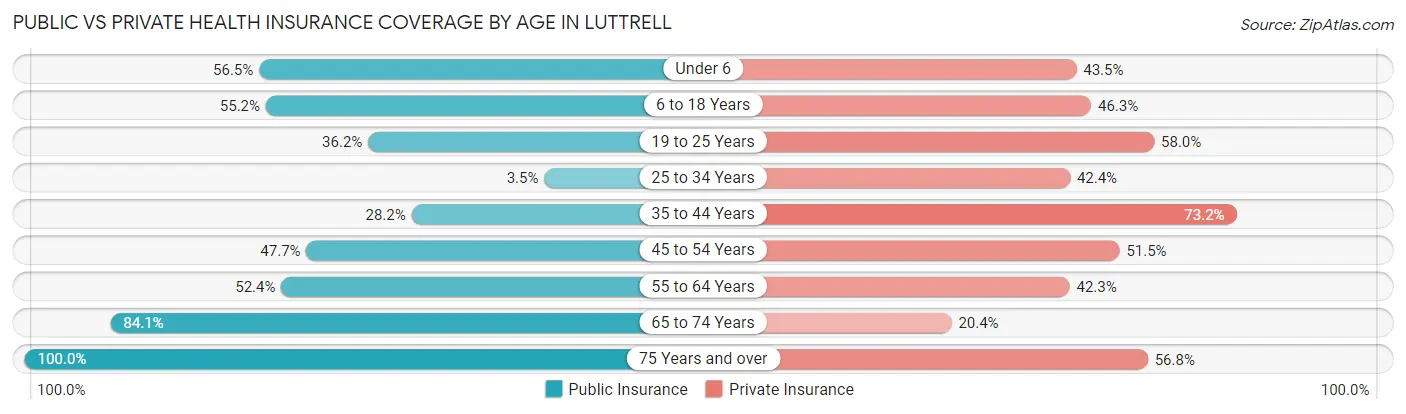
| Age Bracket | Public Insurance | Private Insurance |
| Under 6 | 48 (56.5%) | 37 (43.5%) |
| 6 to 18 Years | 74 (55.2%) | 62 (46.3%) |
| 19 to 25 Years | 25 (36.2%) | 40 (58.0%) |
| 25 to 34 Years | 3 (3.5%) | 36 (42.3%) |
| 35 to 44 Years | 20 (28.2%) | 52 (73.2%) |
| 45 to 54 Years | 62 (47.7%) | 67 (51.5%) |
| 55 to 64 Years | 78 (52.3%) | 63 (42.3%) |
| 65 to 74 Years | 95 (84.1%) | 23 (20.3%) |
| 75 Years and over | 81 (100.0%) | 46 (56.8%) |
| Total | 486 (53.0%) | 426 (46.5%) |
Disability Status by Sex by Age in Luttrell
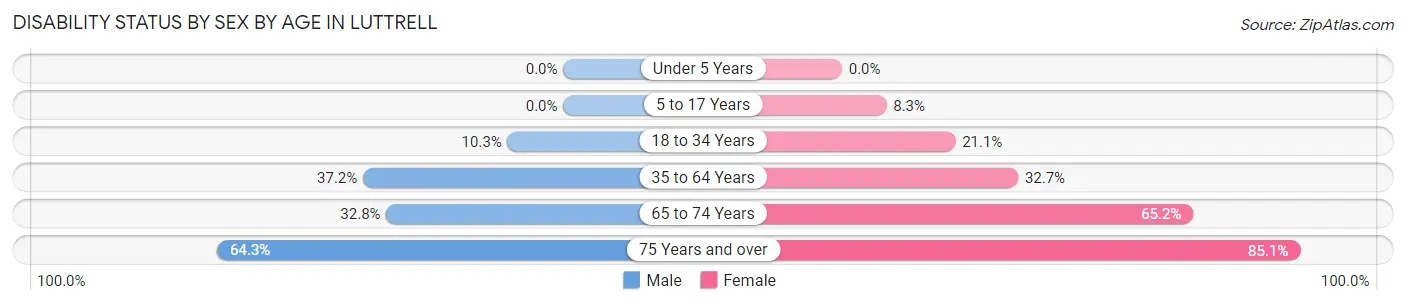
| Age Bracket | Male | Female |
| Under 5 Years | 0 (0.0%) | 0 (0.0%) |
| 5 to 17 Years | 0 (0.0%) | 9 (8.3%) |
| 18 to 34 Years | 12 (10.3%) | 8 (21.0%) |
| 35 to 64 Years | 71 (37.2%) | 52 (32.7%) |
| 65 to 74 Years | 22 (32.8%) | 30 (65.2%) |
| 75 Years and over | 9 (64.3%) | 57 (85.1%) |
Disability Class by Sex by Age in Luttrell
Disability Class: Hearing Difficulty
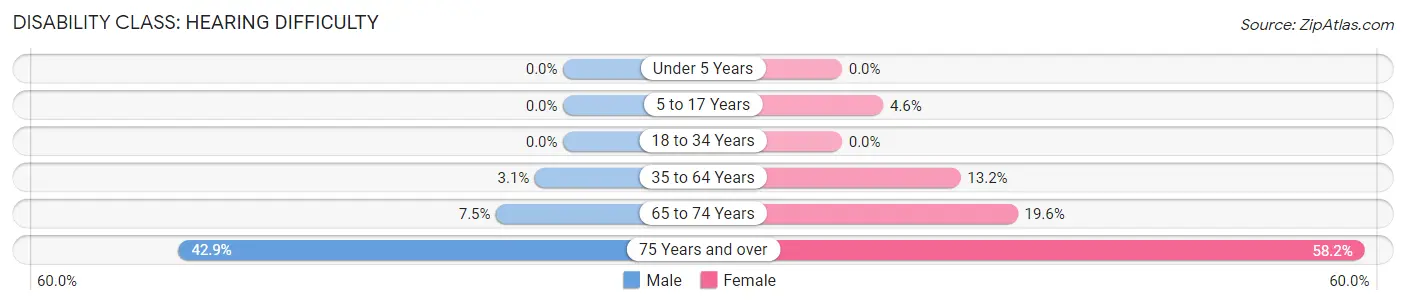
| Age Bracket | Male | Female |
| Under 5 Years | 0 (0.0%) | 0 (0.0%) |
| 5 to 17 Years | 0 (0.0%) | 5 (4.6%) |
| 18 to 34 Years | 0 (0.0%) | 0 (0.0%) |
| 35 to 64 Years | 6 (3.1%) | 21 (13.2%) |
| 65 to 74 Years | 5 (7.5%) | 9 (19.6%) |
| 75 Years and over | 6 (42.9%) | 39 (58.2%) |
Disability Class: Vision Difficulty
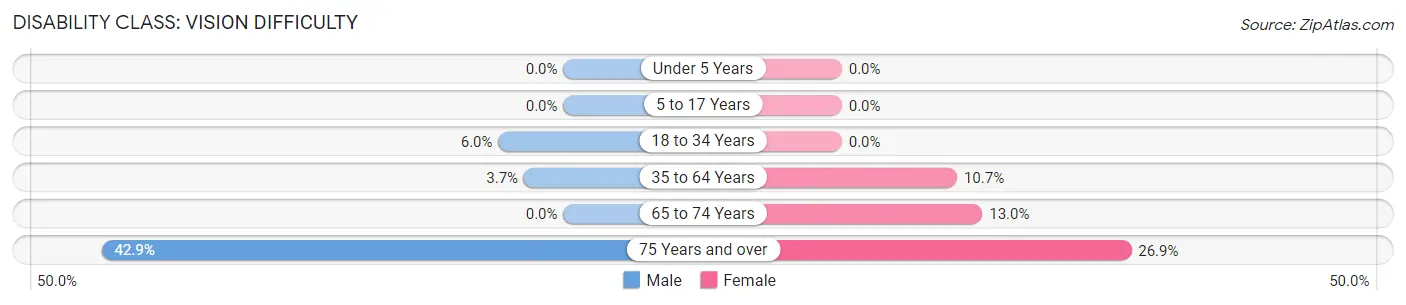
| Age Bracket | Male | Female |
| Under 5 Years | 0 (0.0%) | 0 (0.0%) |
| 5 to 17 Years | 0 (0.0%) | 0 (0.0%) |
| 18 to 34 Years | 7 (6.0%) | 0 (0.0%) |
| 35 to 64 Years | 7 (3.7%) | 17 (10.7%) |
| 65 to 74 Years | 0 (0.0%) | 6 (13.0%) |
| 75 Years and over | 6 (42.9%) | 18 (26.9%) |
Disability Class: Cognitive Difficulty
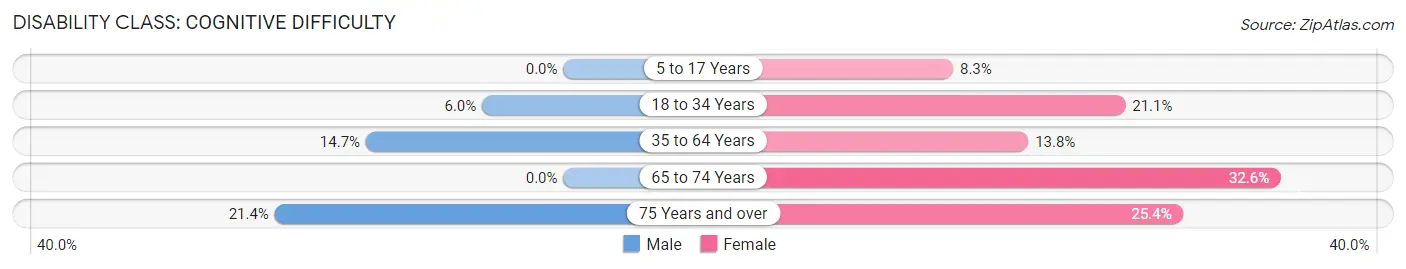
| Age Bracket | Male | Female |
| 5 to 17 Years | 0 (0.0%) | 9 (8.3%) |
| 18 to 34 Years | 7 (6.0%) | 8 (21.0%) |
| 35 to 64 Years | 28 (14.7%) | 22 (13.8%) |
| 65 to 74 Years | 0 (0.0%) | 15 (32.6%) |
| 75 Years and over | 3 (21.4%) | 17 (25.4%) |
Disability Class: Ambulatory Difficulty
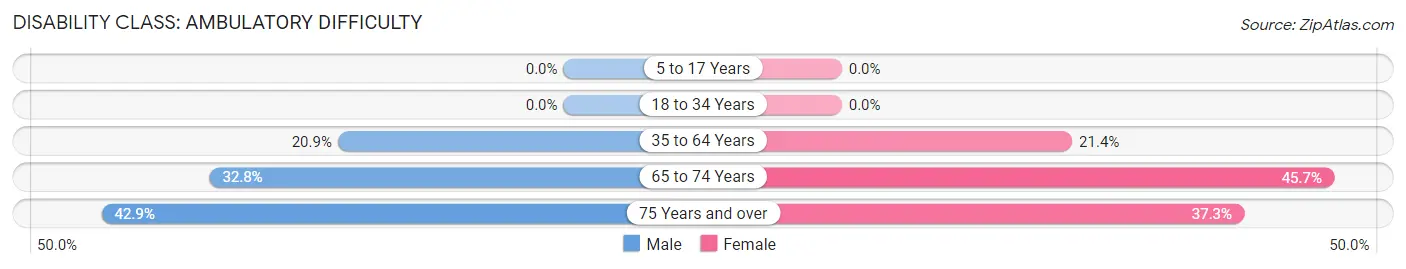
| Age Bracket | Male | Female |
| 5 to 17 Years | 0 (0.0%) | 0 (0.0%) |
| 18 to 34 Years | 0 (0.0%) | 0 (0.0%) |
| 35 to 64 Years | 40 (20.9%) | 34 (21.4%) |
| 65 to 74 Years | 22 (32.8%) | 21 (45.7%) |
| 75 Years and over | 6 (42.9%) | 25 (37.3%) |
Disability Class: Self-Care Difficulty
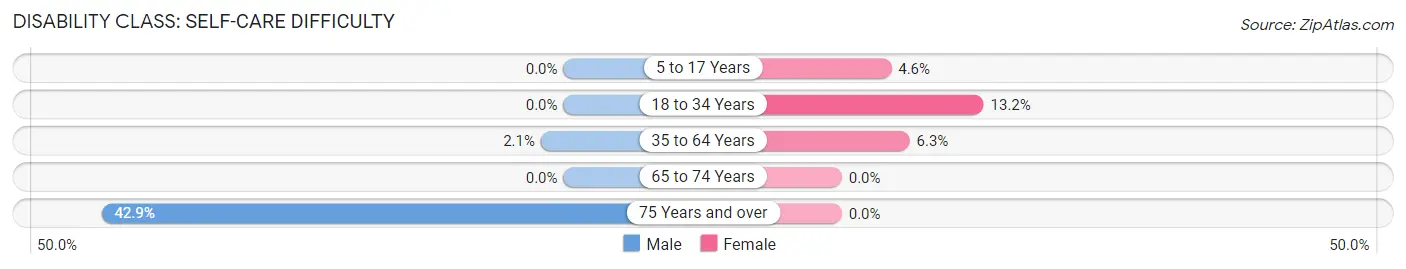
| Age Bracket | Male | Female |
| 5 to 17 Years | 0 (0.0%) | 5 (4.6%) |
| 18 to 34 Years | 0 (0.0%) | 5 (13.2%) |
| 35 to 64 Years | 4 (2.1%) | 10 (6.3%) |
| 65 to 74 Years | 0 (0.0%) | 0 (0.0%) |
| 75 Years and over | 6 (42.9%) | 0 (0.0%) |
Technology Access in Luttrell
Computing Device Access in Luttrell
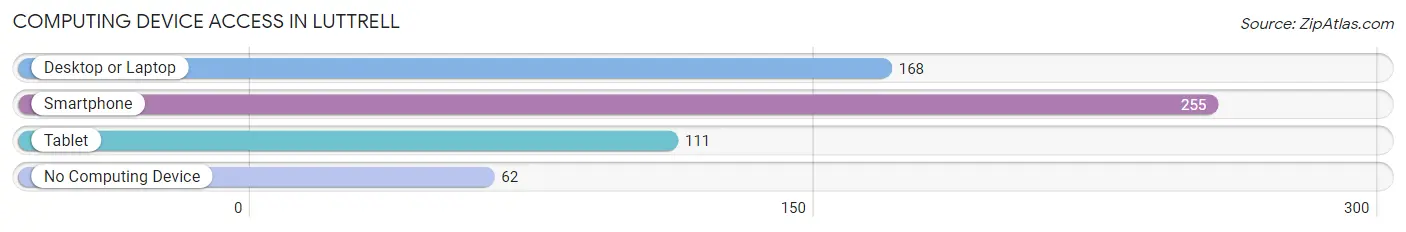
| Device Type | # Households | % Households |
| Desktop or Laptop | 168 | 46.4% |
| Smartphone | 255 | 70.4% |
| Tablet | 111 | 30.7% |
| No Computing Device | 62 | 17.1% |
| Total | 362 | 100.0% |
Internet Access in Luttrell
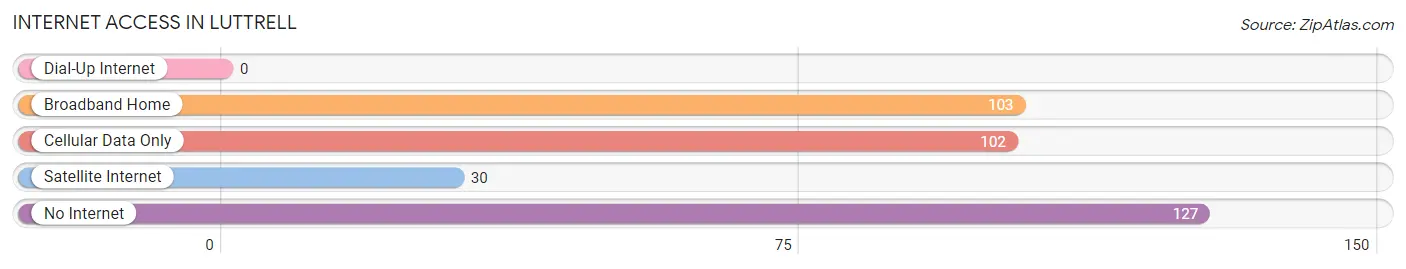
| Internet Type | # Households | % Households |
| Dial-Up Internet | 0 | 0.0% |
| Broadband Home | 103 | 28.4% |
| Cellular Data Only | 102 | 28.2% |
| Satellite Internet | 30 | 8.3% |
| No Internet | 127 | 35.1% |
| Total | 362 | 100.0% |
Luttrell Summary
Luttrell is a small town located in Union County, Tennessee. It is situated in the foothills of the Great Smoky Mountains, and is part of the Knoxville Metropolitan Statistical Area. The town has a population of 1,845 people, according to the 2010 census.
History
Luttrell was founded in 1883 by William Luttrell, a former Confederate soldier. The town was originally known as Luttrell Station, and was a stop on the Knoxville and Bristol Railroad. The town was incorporated in 1887, and the name was changed to Luttrell.
The town was a farming community until the 1950s, when the Tennessee Valley Authority (TVA) began building dams in the area. This brought new jobs and economic growth to the area, and the population of Luttrell began to grow.
Geography
Luttrell is located in Union County, Tennessee, in the foothills of the Great Smoky Mountains. The town is situated at an elevation of 1,068 feet above sea level. The town is located along the Clinch River, and is bordered by the towns of Maynardville and Sharps Chapel.
The climate in Luttrell is humid subtropical, with hot summers and mild winters. The average annual temperature is 61 degrees Fahrenheit, and the average annual precipitation is 48 inches.
Economy
The economy of Luttrell is largely based on agriculture and tourism. The town is home to several farms, which produce a variety of crops, including corn, soybeans, and hay. The town is also home to several tourist attractions, including the Clinch River, Norris Lake, and the Great Smoky Mountains National Park.
The town is also home to several small businesses, including restaurants, retail stores, and service providers. The town is also home to several manufacturing companies, including a furniture factory and a plastics factory.
Demographics
According to the 2010 census, the population of Luttrell was 1,845 people. The racial makeup of the town was 97.3% White, 0.9% African American, 0.2% Native American, 0.2% Asian, 0.1% Pacific Islander, 0.3% from other races, and 0.9% from two or more races. Hispanic or Latino of any race were 1.2% of the population.
The median household income in Luttrell was $37,917, and the median family income was $45,625. The per capita income was $18,945. About 15.3% of the population was below the poverty line.
Conclusion
Luttrell is a small town located in Union County, Tennessee. It is situated in the foothills of the Great Smoky Mountains, and is part of the Knoxville Metropolitan Statistical Area. The town has a population of 1,845 people, according to the 2010 census. The economy of Luttrell is largely based on agriculture and tourism, and the town is home to several small businesses, manufacturing companies, and tourist attractions. The racial makeup of the town is 97.3% White, 0.9% African American, 0.2% Native American, 0.2% Asian, 0.1% Pacific Islander, 0.3% from other races, and 0.9% from two or more races. The median household income in Luttrell was $37,917, and the median family income was $45,625. The per capita income was $18,945. About 15.3% of the population was below the poverty line.
Common Questions
What is Per Capita Income in Luttrell?
Per Capita income in Luttrell is $17,728.
What is the Median Family Income in Luttrell?
Median Family Income in Luttrell is $39,391.
What is the Median Household income in Luttrell?
Median Household Income in Luttrell is $37,292.
What is Income or Wage Gap in Luttrell?
Income or Wage Gap in Luttrell is 4.9%.
Women in Luttrell earn 95.1 cents for every dollar earned by a man.
What is Inequality or Gini Index in Luttrell?
Inequality or Gini Index in Luttrell is 0.38.
What is the Total Population of Luttrell?
Total Population of Luttrell is 917.
What is the Total Male Population of Luttrell?
Total Male Population of Luttrell is 471.
What is the Total Female Population of Luttrell?
Total Female Population of Luttrell is 446.
What is the Ratio of Males per 100 Females in Luttrell?
There are 105.61 Males per 100 Females in Luttrell.
What is the Ratio of Females per 100 Males in Luttrell?
There are 94.69 Females per 100 Males in Luttrell.
What is the Median Population Age in Luttrell?
Median Population Age in Luttrell is 46.7 Years.
What is the Average Family Size in Luttrell
Average Family Size in Luttrell is 2.9 People.
What is the Average Household Size in Luttrell
Average Household Size in Luttrell is 2.5 People.
How Large is the Labor Force in Luttrell?
There are 282 People in the Labor Forcein in Luttrell.
What is the Percentage of People in the Labor Force in Luttrell?
39.7% of People are in the Labor Force in Luttrell.
What is the Unemployment Rate in Luttrell?
Unemployment Rate in Luttrell is 4.3%.