Lakewood Park, TN Map & Demographics
Lakewood Park Map
Lakewood Park Overview
$22,884
PER CAPITA INCOME
$30,703
AVG FAMILY INCOME
$35,612
AVG HOUSEHOLD INCOME
78.1%
WAGE / INCOME GAP [ % ]
21.9¢/ $1
WAGE / INCOME GAP [ $ ]
0.42
INEQUALITY / GINI INDEX
1,070
TOTAL POPULATION
480
MALE POPULATION
590
FEMALE POPULATION
81.36
MALES / 100 FEMALES
122.92
FEMALES / 100 MALES
54.2
MEDIAN AGE
2.8
AVG FAMILY SIZE
2.4
AVG HOUSEHOLD SIZE
419
LABOR FORCE [ PEOPLE ]
43.2%
PERCENT IN LABOR FORCE
6.0%
UNEMPLOYMENT RATE
Income in Lakewood Park
Income Overview in Lakewood Park
Per Capita Income in Lakewood Park is $22,884, while median incomes of families and households are $30,703 and $35,612 respectively.
| Characteristic | Number | Measure |
| Per Capita Income | 1,070 | $22,884 |
| Median Family Income | 296 | $30,703 |
| Mean Family Income | 296 | $46,795 |
| Median Household Income | 440 | $35,612 |
| Mean Household Income | 440 | $53,207 |
| Income Deficit | 296 | $0 |
| Wage / Income Gap (%) | 1,070 | 78.06% |
| Wage / Income Gap ($) | 1,070 | 21.94¢ per $1 |
| Gini / Inequality Index | 1,070 | 0.42 |
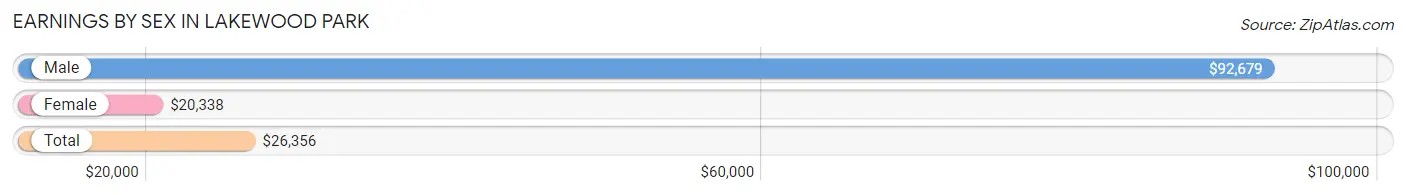
Earnings by Sex in Lakewood Park
Average Earnings in Lakewood Park are $26,356, $92,679 for men and $20,338 for women, a difference of 78.1%.
| Sex | Number | Average Earnings |
| Male | 147 (33.8%) | $92,679 |
| Female | 288 (66.2%) | $20,338 |
| Total | 435 (100.0%) | $26,356 |
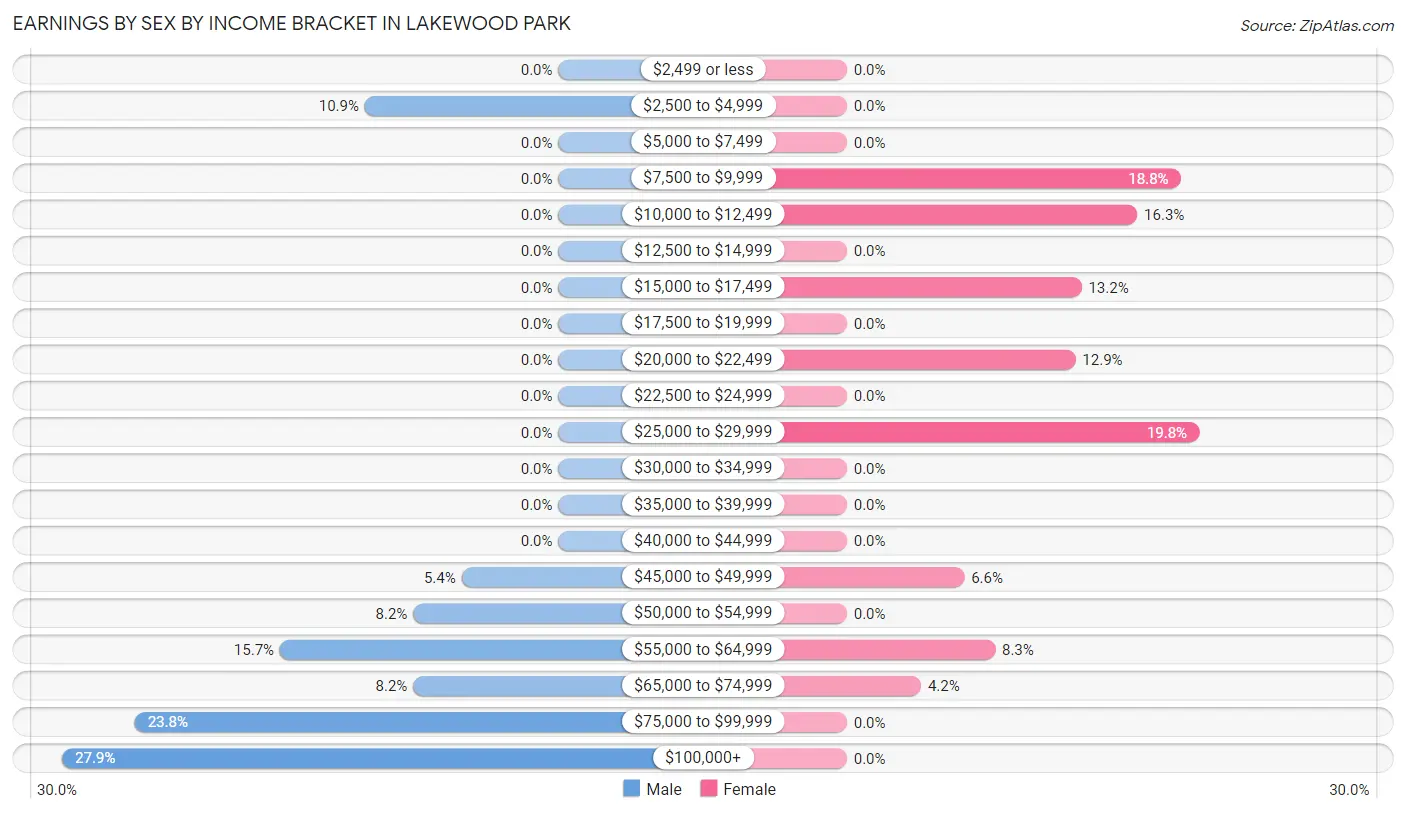
Earnings by Sex by Income Bracket in Lakewood Park
The most common earnings brackets in Lakewood Park are $100,000+ for men (41 | 27.9%) and $25,000 to $29,999 for women (57 | 19.8%).
| Income | Male | Female |
| $2,499 or less | 0 (0.0%) | 0 (0.0%) |
| $2,500 to $4,999 | 16 (10.9%) | 0 (0.0%) |
| $5,000 to $7,499 | 0 (0.0%) | 0 (0.0%) |
| $7,500 to $9,999 | 0 (0.0%) | 54 (18.8%) |
| $10,000 to $12,499 | 0 (0.0%) | 47 (16.3%) |
| $12,500 to $14,999 | 0 (0.0%) | 0 (0.0%) |
| $15,000 to $17,499 | 0 (0.0%) | 38 (13.2%) |
| $17,500 to $19,999 | 0 (0.0%) | 0 (0.0%) |
| $20,000 to $22,499 | 0 (0.0%) | 37 (12.9%) |
| $22,500 to $24,999 | 0 (0.0%) | 0 (0.0%) |
| $25,000 to $29,999 | 0 (0.0%) | 57 (19.8%) |
| $30,000 to $34,999 | 0 (0.0%) | 0 (0.0%) |
| $35,000 to $39,999 | 0 (0.0%) | 0 (0.0%) |
| $40,000 to $44,999 | 0 (0.0%) | 0 (0.0%) |
| $45,000 to $49,999 | 8 (5.4%) | 19 (6.6%) |
| $50,000 to $54,999 | 12 (8.2%) | 0 (0.0%) |
| $55,000 to $64,999 | 23 (15.7%) | 24 (8.3%) |
| $65,000 to $74,999 | 12 (8.2%) | 12 (4.2%) |
| $75,000 to $99,999 | 35 (23.8%) | 0 (0.0%) |
| $100,000+ | 41 (27.9%) | 0 (0.0%) |
| Total | 147 (100.0%) | 288 (100.0%) |
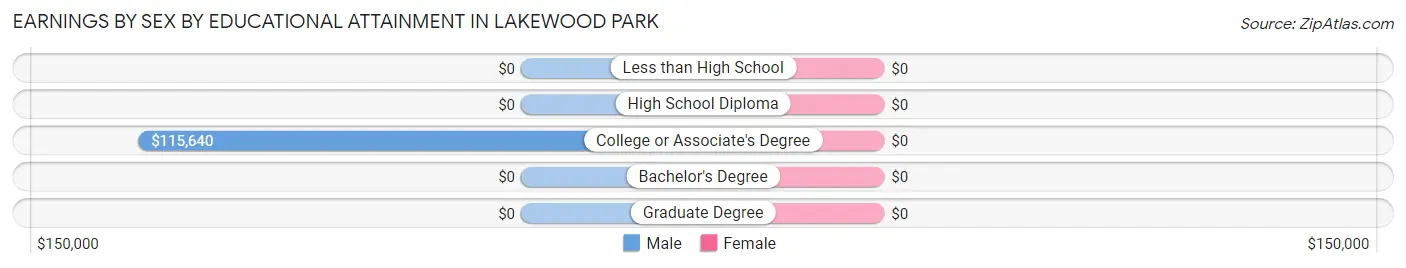
Earnings by Sex by Educational Attainment in Lakewood Park
| Educational Attainment | Male Income | Female Income |
| Less than High School | - | - |
| High School Diploma | - | - |
| College or Associate's Degree | $115,640 | $0 |
| Bachelor's Degree | - | - |
| Graduate Degree | - | - |
| Total | $93,250 | $26,702 |
Family Income in Lakewood Park
Family Income Brackets in Lakewood Park
According to the Lakewood Park family income data, there are 77 families falling into the $15,000 to $24,999 income range, which is the most common income bracket and makes up 26.0% of all families.
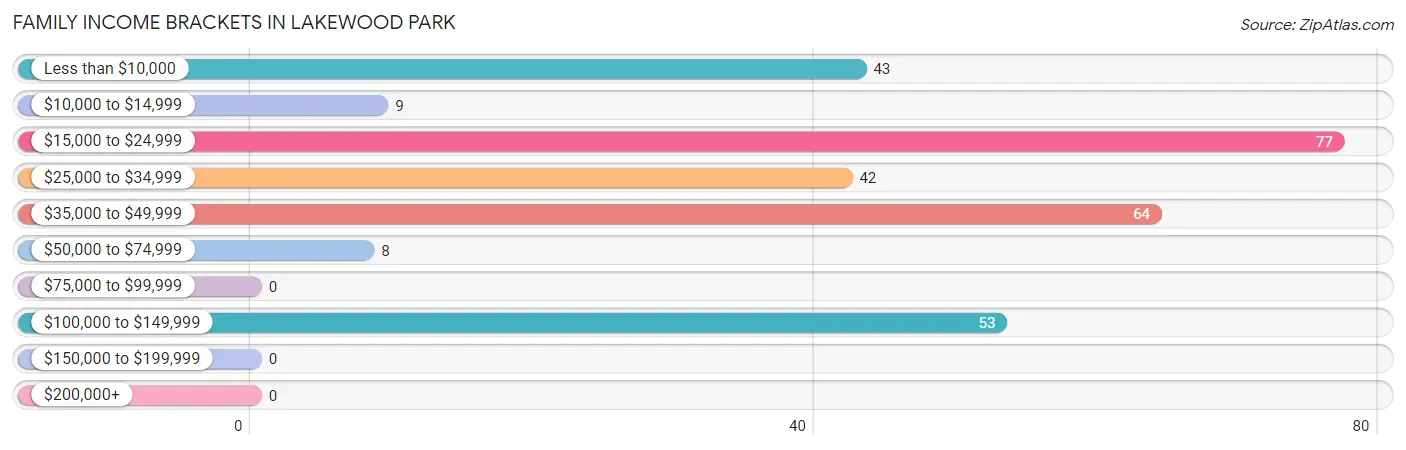
| Income Bracket | # Families | % Families |
| Less than $10,000 | 43 | 14.5% |
| $10,000 to $14,999 | 9 | 3.0% |
| $15,000 to $24,999 | 77 | 26.0% |
| $25,000 to $34,999 | 42 | 14.2% |
| $35,000 to $49,999 | 64 | 21.6% |
| $50,000 to $74,999 | 8 | 2.7% |
| $75,000 to $99,999 | 0 | 0.0% |
| $100,000 to $149,999 | 53 | 17.9% |
| $150,000 to $199,999 | 0 | 0.0% |
| $200,000+ | 0 | 0.0% |
Family Income by Famaliy Size in Lakewood Park
2-person families (180 | 60.8%) account for the highest median family income in Lakewood Park with $27,250 per family, while 2-person families (180 | 60.8%) have the highest median income of $13,625 per family member.
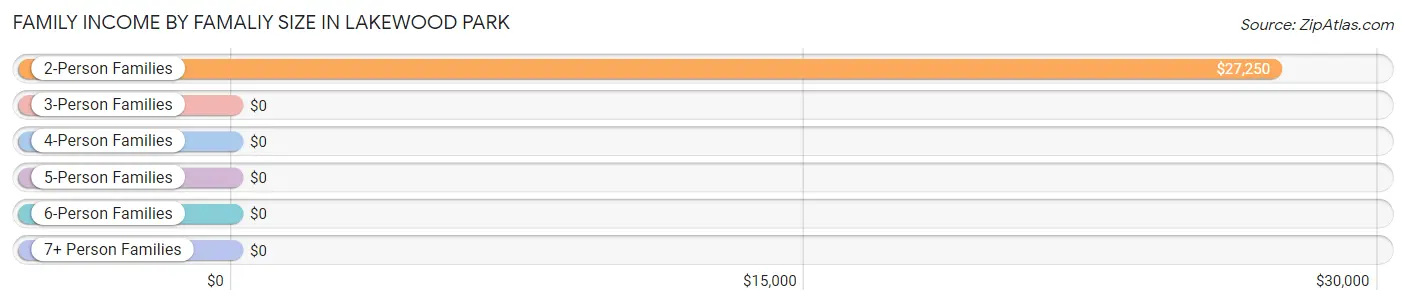
| Income Bracket | # Families | Median Income |
| 2-Person Families | 180 (60.8%) | $27,250 |
| 3-Person Families | 93 (31.4%) | $0 |
| 4-Person Families | 15 (5.1%) | $0 |
| 5-Person Families | 8 (2.7%) | $0 |
| 6-Person Families | 0 (0.0%) | $0 |
| 7+ Person Families | 0 (0.0%) | $0 |
| Total | 296 (100.0%) | $30,703 |
Family Income by Number of Earners in Lakewood Park
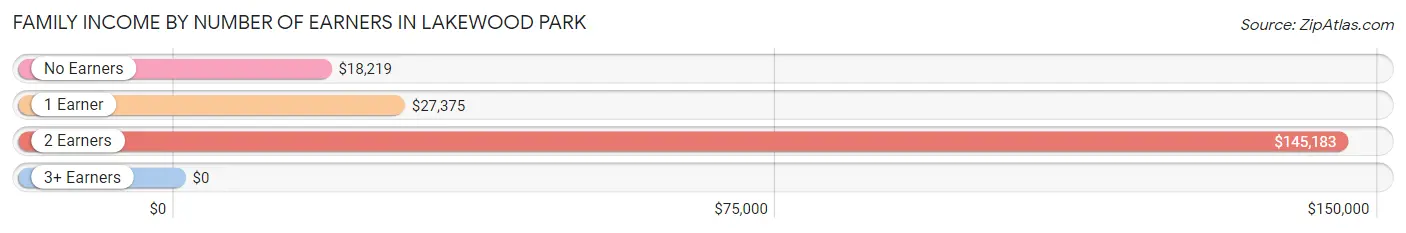
| Number of Earners | # Families | Median Income |
| No Earners | 185 (62.5%) | $18,219 |
| 1 Earner | 35 (11.8%) | $27,375 |
| 2 Earners | 76 (25.7%) | $145,183 |
| 3+ Earners | 0 (0.0%) | $0 |
| Total | 296 (100.0%) | $30,703 |
Household Income in Lakewood Park
Household Income Brackets in Lakewood Park
With 104 households falling in the category, the $25,000 to $34,999 income range is the most frequent in Lakewood Park, accounting for 23.6% of all households.
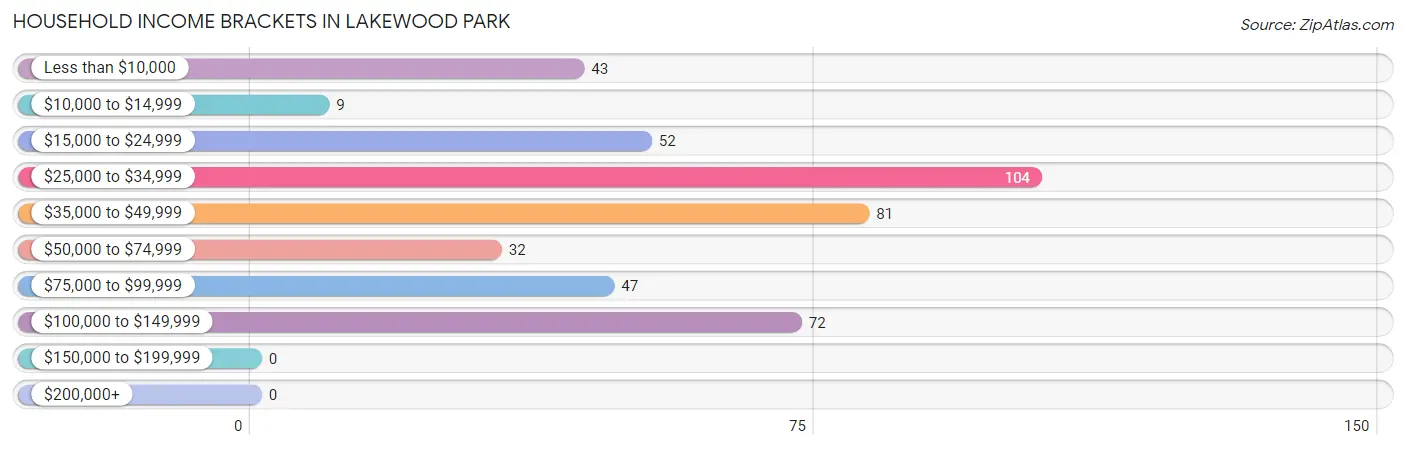
| Income Bracket | # Households | % Households |
| Less than $10,000 | 43 | 9.8% |
| $10,000 to $14,999 | 9 | 2.0% |
| $15,000 to $24,999 | 52 | 11.8% |
| $25,000 to $34,999 | 104 | 23.6% |
| $35,000 to $49,999 | 81 | 18.4% |
| $50,000 to $74,999 | 32 | 7.3% |
| $75,000 to $99,999 | 47 | 10.7% |
| $100,000 to $149,999 | 72 | 16.4% |
| $150,000 to $199,999 | 0 | 0.0% |
| $200,000+ | 0 | 0.0% |
Household Income by Householder Age in Lakewood Park
The median household income in Lakewood Park is $35,612, with the highest median household income of $94,571 found in the 25 to 44 years age bracket for the primary householder. A total of 74 households (16.8%) fall into this category. Meanwhile, the 15 to 24 years age bracket for the primary householder has the lowest median household income of $0, with 22 households (5.0%) in this group.
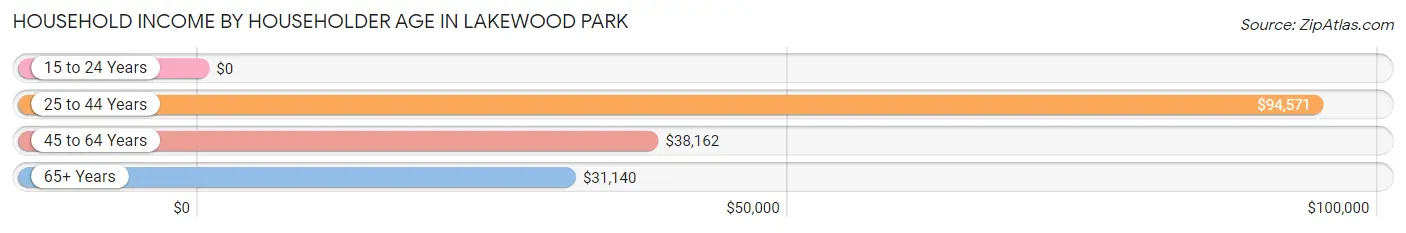
| Income Bracket | # Households | Median Income |
| 15 to 24 Years | 22 (5.0%) | $0 |
| 25 to 44 Years | 74 (16.8%) | $94,571 |
| 45 to 64 Years | 209 (47.5%) | $38,162 |
| 65+ Years | 135 (30.7%) | $31,140 |
| Total | 440 (100.0%) | $35,612 |
Poverty in Lakewood Park
Income Below Poverty by Sex and Age in Lakewood Park
With 44.6% poverty level for males and 34.1% for females among the residents of Lakewood Park, 12 to 14 year old males and under 5 year old females are the most vulnerable to poverty, with 25 males (100.0%) and 18 females (100.0%) in their respective age groups living below the poverty level.
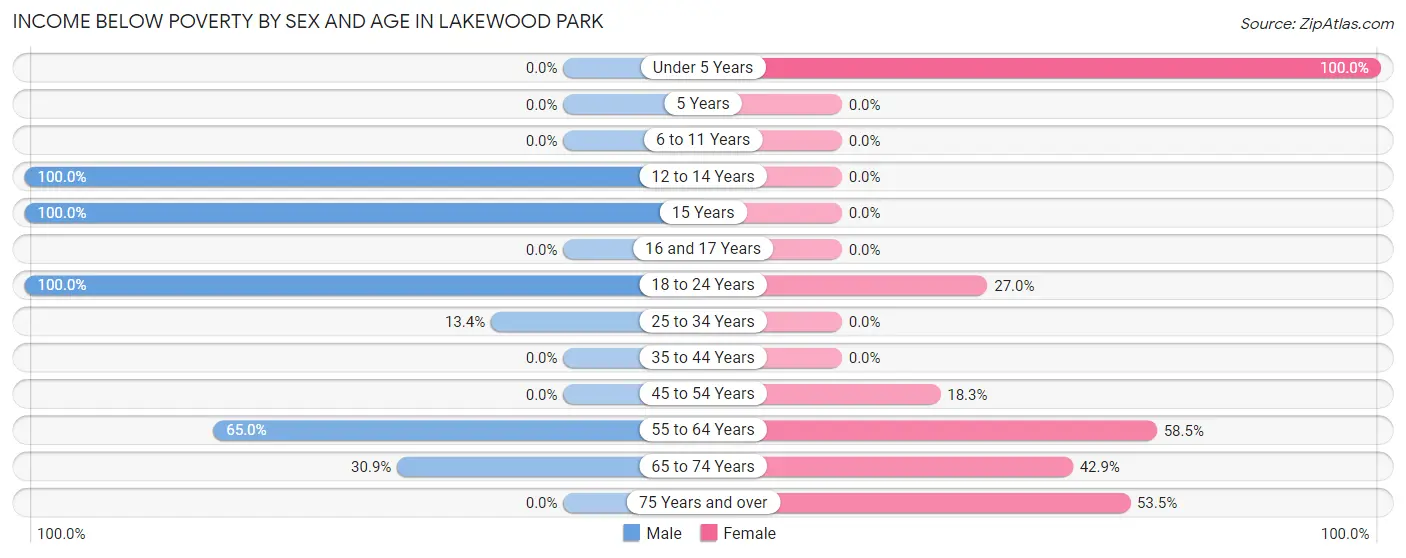
| Age Bracket | Male | Female |
| Under 5 Years | 0 (0.0%) | 18 (100.0%) |
| 5 Years | 0 (0.0%) | 0 (0.0%) |
| 6 to 11 Years | 0 (0.0%) | 0 (0.0%) |
| 12 to 14 Years | 25 (100.0%) | 0 (0.0%) |
| 15 Years | 16 (100.0%) | 0 (0.0%) |
| 16 and 17 Years | 0 (0.0%) | 0 (0.0%) |
| 18 to 24 Years | 59 (100.0%) | 37 (27.0%) |
| 25 to 34 Years | 9 (13.4%) | 0 (0.0%) |
| 35 to 44 Years | 0 (0.0%) | 0 (0.0%) |
| 45 to 54 Years | 0 (0.0%) | 17 (18.3%) |
| 55 to 64 Years | 76 (65.0%) | 76 (58.5%) |
| 65 to 74 Years | 29 (30.8%) | 30 (42.9%) |
| 75 Years and over | 0 (0.0%) | 23 (53.5%) |
| Total | 214 (44.6%) | 201 (34.1%) |
Income Above Poverty by Sex and Age in Lakewood Park
According to the poverty statistics in Lakewood Park, males aged under 5 years and females aged 15 years are the age groups that are most secure financially, with 100.0% of males and 100.0% of females in these age groups living above the poverty line.
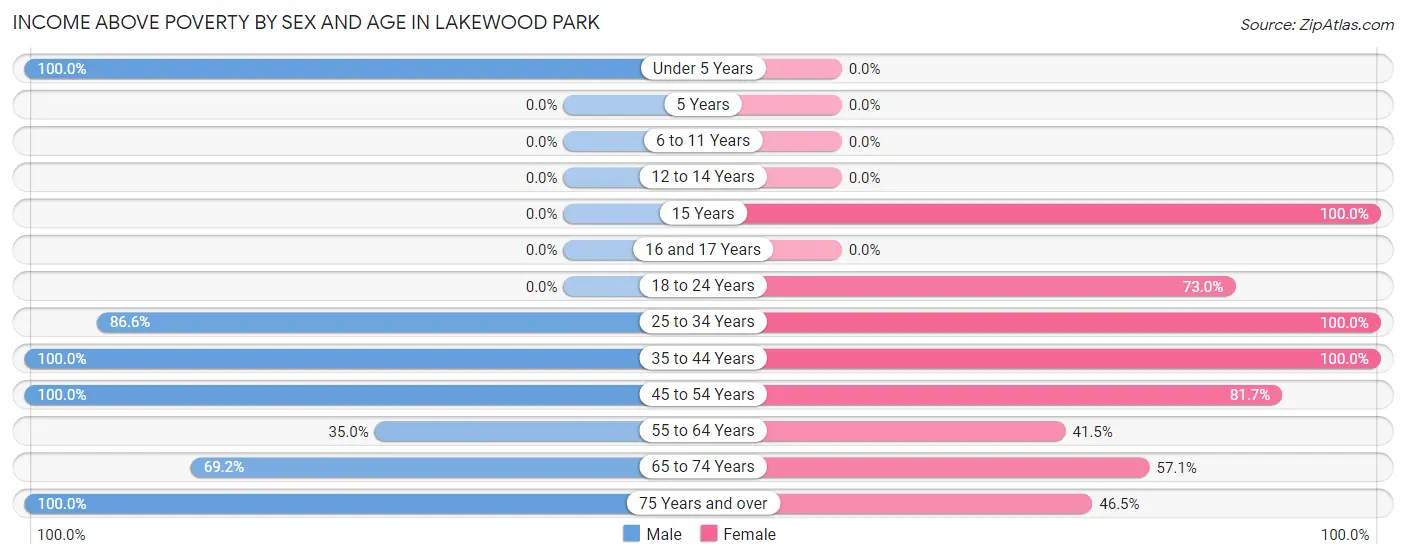
| Age Bracket | Male | Female |
| Under 5 Years | 29 (100.0%) | 0 (0.0%) |
| 5 Years | 0 (0.0%) | 0 (0.0%) |
| 6 to 11 Years | 0 (0.0%) | 0 (0.0%) |
| 12 to 14 Years | 0 (0.0%) | 0 (0.0%) |
| 15 Years | 0 (0.0%) | 11 (100.0%) |
| 16 and 17 Years | 0 (0.0%) | 0 (0.0%) |
| 18 to 24 Years | 0 (0.0%) | 100 (73.0%) |
| 25 to 34 Years | 58 (86.6%) | 42 (100.0%) |
| 35 to 44 Years | 20 (100.0%) | 46 (100.0%) |
| 45 to 54 Years | 30 (100.0%) | 76 (81.7%) |
| 55 to 64 Years | 41 (35.0%) | 54 (41.5%) |
| 65 to 74 Years | 65 (69.2%) | 40 (57.1%) |
| 75 Years and over | 23 (100.0%) | 20 (46.5%) |
| Total | 266 (55.4%) | 389 (65.9%) |
Income Below Poverty Among Married-Couple Families in Lakewood Park
The poverty statistics for married-couple families in Lakewood Park show that 39.1% or 72 of the total 184 families live below the poverty line. Families with no children have the highest poverty rate of 41.9%, comprising of 72 families. On the other hand, families with 1 or 2 children have the lowest poverty rate of 0.0%, which includes 0 families.
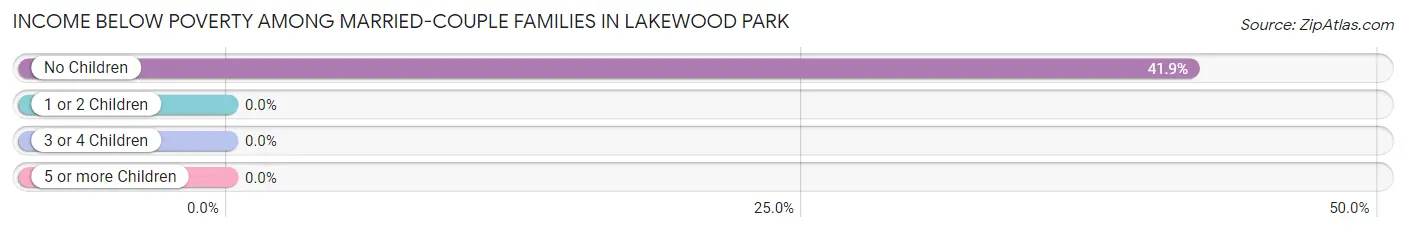
| Children | Above Poverty | Below Poverty |
| No Children | 100 (58.1%) | 72 (41.9%) |
| 1 or 2 Children | 12 (100.0%) | 0 (0.0%) |
| 3 or 4 Children | 0 (0.0%) | 0 (0.0%) |
| 5 or more Children | 0 (0.0%) | 0 (0.0%) |
| Total | 112 (60.9%) | 72 (39.1%) |
Income Below Poverty Among Single-Parent Households in Lakewood Park
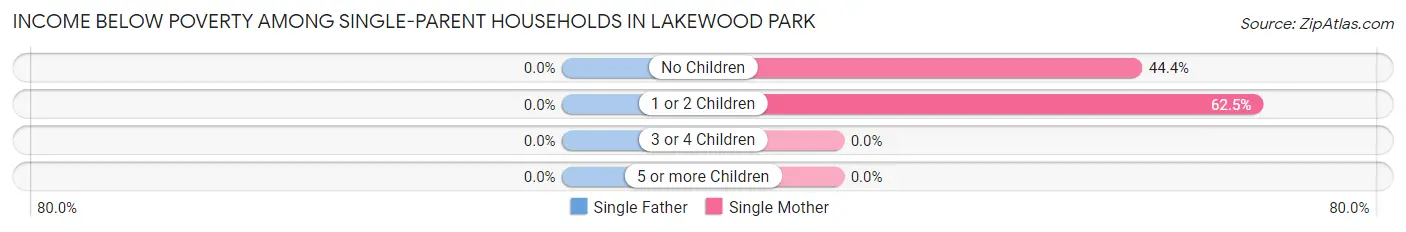
| Children | Single Father | Single Mother |
| No Children | 0 (0.0%) | 32 (44.4%) |
| 1 or 2 Children | 0 (0.0%) | 25 (62.5%) |
| 3 or 4 Children | 0 (0.0%) | 0 (0.0%) |
| 5 or more Children | 0 (0.0%) | 0 (0.0%) |
| Total | 0 (0.0%) | 57 (50.9%) |
Income Below Poverty Among Married-Couple vs Single-Parent Households in Lakewood Park
The poverty data for Lakewood Park shows that 72 of the married-couple family households (39.1%) and 57 of the single-parent households (50.9%) are living below the poverty level. Within the married-couple family households, those with no children have the highest poverty rate, with 72 households (41.9%) falling below the poverty line. Among the single-parent households, those with 1 or 2 children have the highest poverty rate, with 25 household (62.5%) living below poverty.
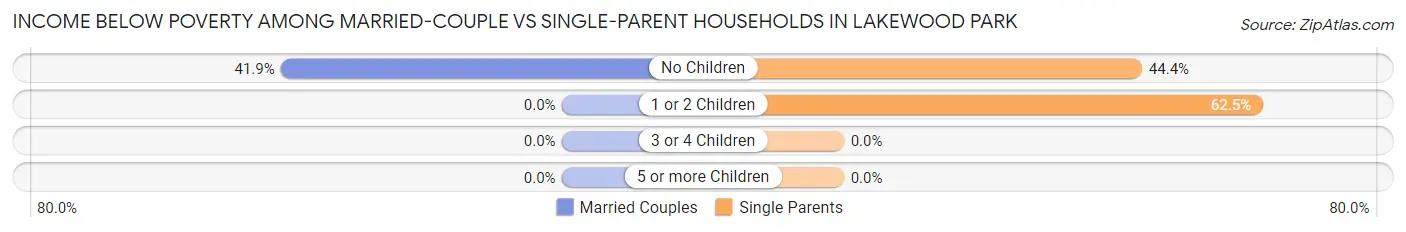
| Children | Married-Couple Families | Single-Parent Households |
| No Children | 72 (41.9%) | 32 (44.4%) |
| 1 or 2 Children | 0 (0.0%) | 25 (62.5%) |
| 3 or 4 Children | 0 (0.0%) | 0 (0.0%) |
| 5 or more Children | 0 (0.0%) | 0 (0.0%) |
| Total | 72 (39.1%) | 57 (50.9%) |
Race in Lakewood Park
The most populous races in Lakewood Park are White / Caucasian (964 | 90.1%), Asian (59 | 5.5%), and Two or more Races (47 | 4.4%).
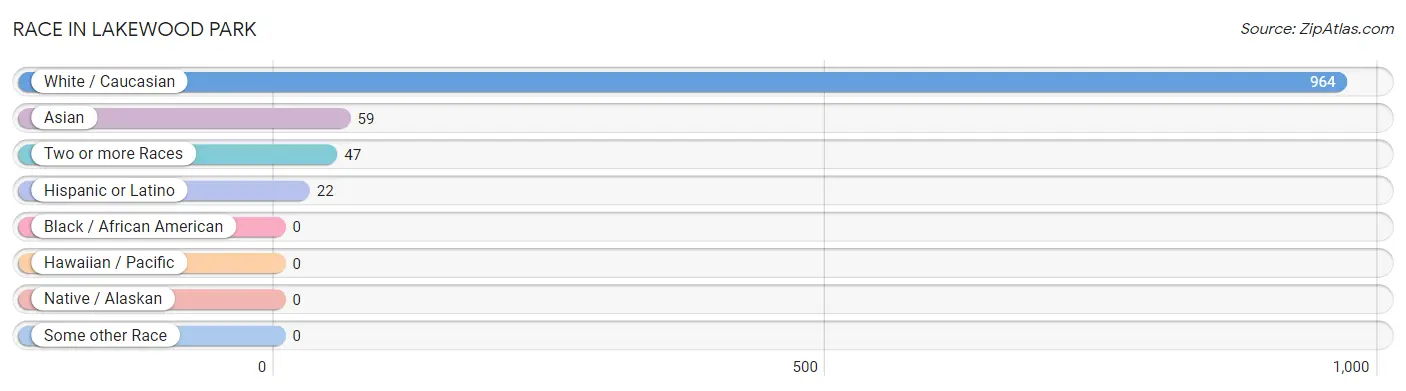
| Race | # Population | % Population |
| Asian | 59 | 5.5% |
| Black / African American | 0 | 0.0% |
| Hawaiian / Pacific | 0 | 0.0% |
| Hispanic or Latino | 22 | 2.1% |
| Native / Alaskan | 0 | 0.0% |
| White / Caucasian | 964 | 90.1% |
| Two or more Races | 47 | 4.4% |
| Some other Race | 0 | 0.0% |
| Total | 1,070 | 100.0% |
Ancestry in Lakewood Park
The most populous ancestries reported in Lakewood Park are Irish (196 | 18.3%), American (90 | 8.4%), German (90 | 8.4%), English (69 | 6.5%), and Bangladeshi (59 | 5.5%), together accounting for 47.1% of all Lakewood Park residents.
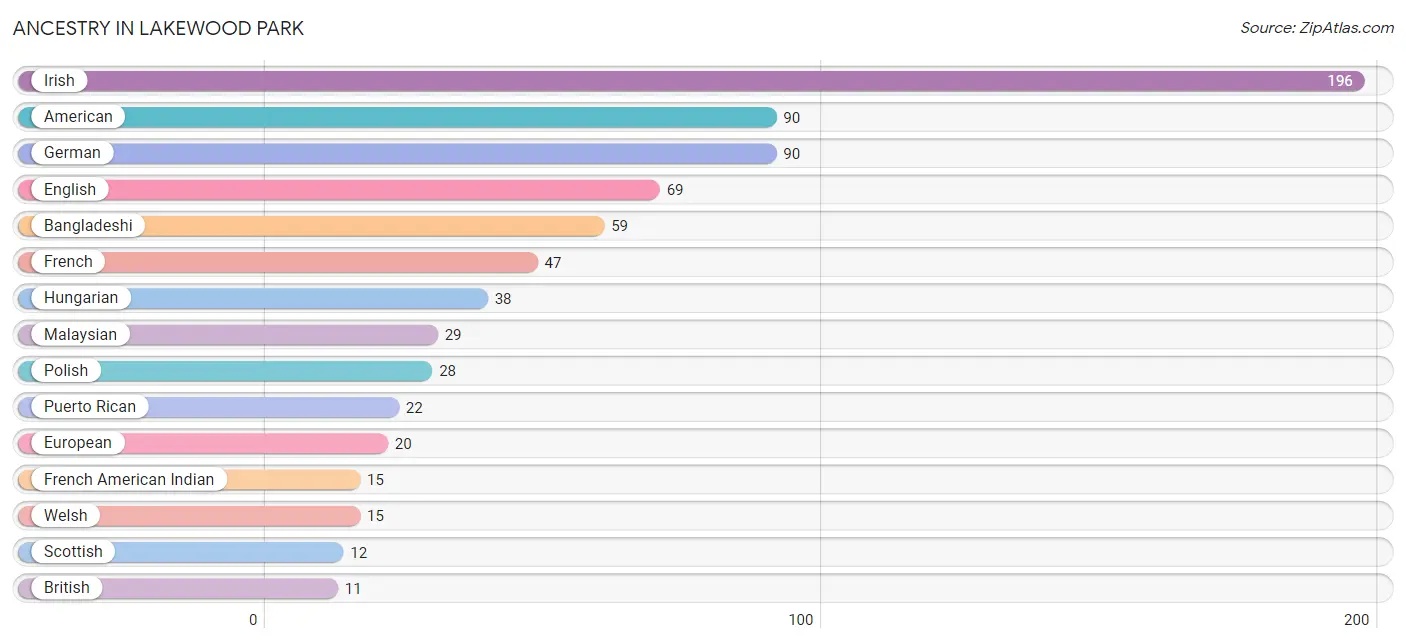
| Ancestry | # Population | % Population |
| American | 90 | 8.4% |
| Bangladeshi | 59 | 5.5% |
| British | 11 | 1.0% |
| English | 69 | 6.5% |
| European | 20 | 1.9% |
| French | 47 | 4.4% |
| French American Indian | 15 | 1.4% |
| German | 90 | 8.4% |
| Hungarian | 38 | 3.5% |
| Irish | 196 | 18.3% |
| Malaysian | 29 | 2.7% |
| Polish | 28 | 2.6% |
| Puerto Rican | 22 | 2.1% |
| Scottish | 12 | 1.1% |
| Welsh | 15 | 1.4% | View All 15 Rows |
Immigrants in Lakewood Park
The most numerous immigrant groups reported in Lakewood Park came from Asia (30 | 2.8%), Eastern Asia (30 | 2.8%), and Korea (30 | 2.8%), together accounting for 8.4% of all Lakewood Park residents.
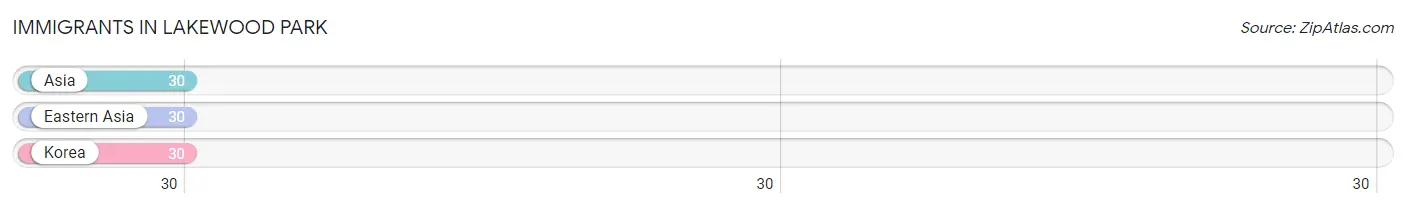
| Immigration Origin | # Population | % Population |
| Asia | 30 | 2.8% |
| Eastern Asia | 30 | 2.8% |
| Korea | 30 | 2.8% | View All 3 Rows |
Sex and Age in Lakewood Park
Sex and Age in Lakewood Park
The most populous age groups in Lakewood Park are 55 to 59 Years (117 | 24.4%) for men and 20 to 24 Years (128 | 21.7%) for women.
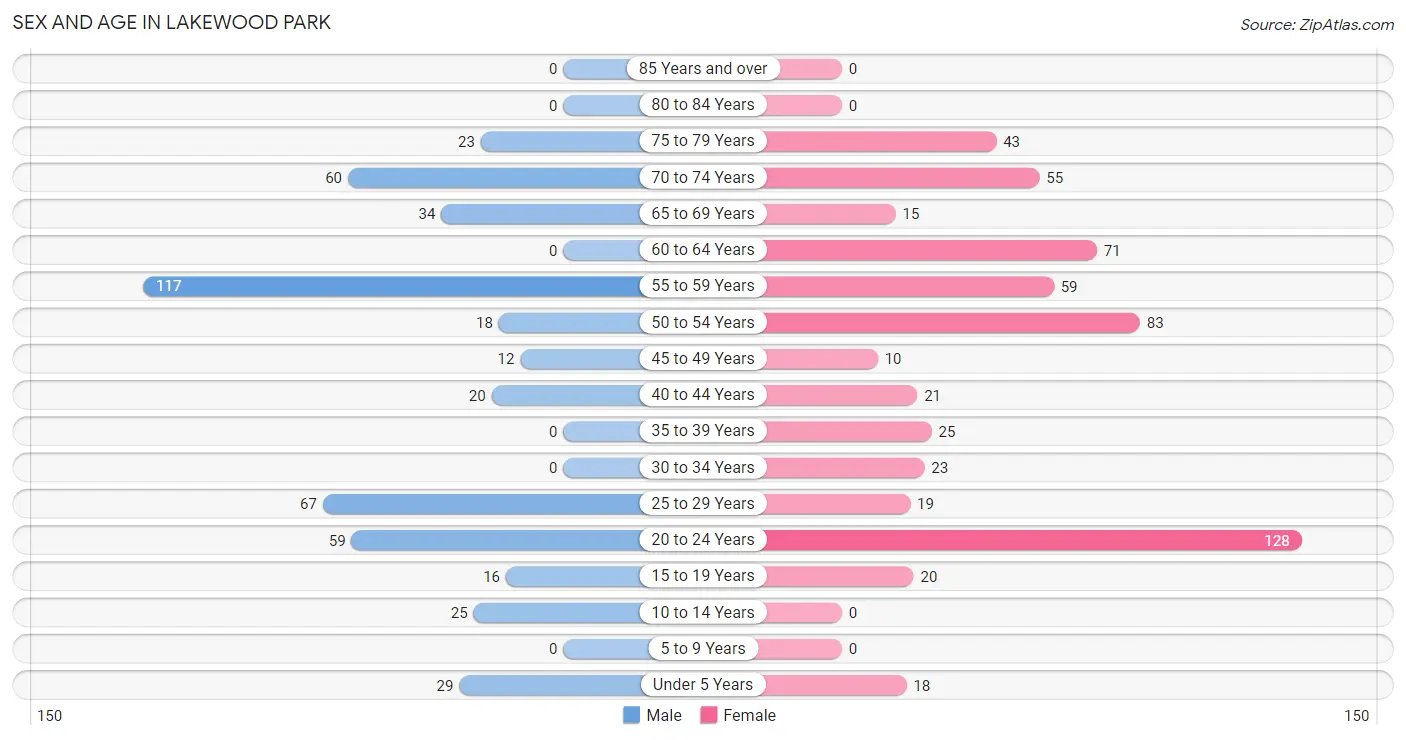
| Age Bracket | Male | Female |
| Under 5 Years | 29 (6.0%) | 18 (3.0%) |
| 5 to 9 Years | 0 (0.0%) | 0 (0.0%) |
| 10 to 14 Years | 25 (5.2%) | 0 (0.0%) |
| 15 to 19 Years | 16 (3.3%) | 20 (3.4%) |
| 20 to 24 Years | 59 (12.3%) | 128 (21.7%) |
| 25 to 29 Years | 67 (14.0%) | 19 (3.2%) |
| 30 to 34 Years | 0 (0.0%) | 23 (3.9%) |
| 35 to 39 Years | 0 (0.0%) | 25 (4.2%) |
| 40 to 44 Years | 20 (4.2%) | 21 (3.6%) |
| 45 to 49 Years | 12 (2.5%) | 10 (1.7%) |
| 50 to 54 Years | 18 (3.7%) | 83 (14.1%) |
| 55 to 59 Years | 117 (24.4%) | 59 (10.0%) |
| 60 to 64 Years | 0 (0.0%) | 71 (12.0%) |
| 65 to 69 Years | 34 (7.1%) | 15 (2.5%) |
| 70 to 74 Years | 60 (12.5%) | 55 (9.3%) |
| 75 to 79 Years | 23 (4.8%) | 43 (7.3%) |
| 80 to 84 Years | 0 (0.0%) | 0 (0.0%) |
| 85 Years and over | 0 (0.0%) | 0 (0.0%) |
| Total | 480 (100.0%) | 590 (100.0%) |
Families and Households in Lakewood Park
Median Family Size in Lakewood Park
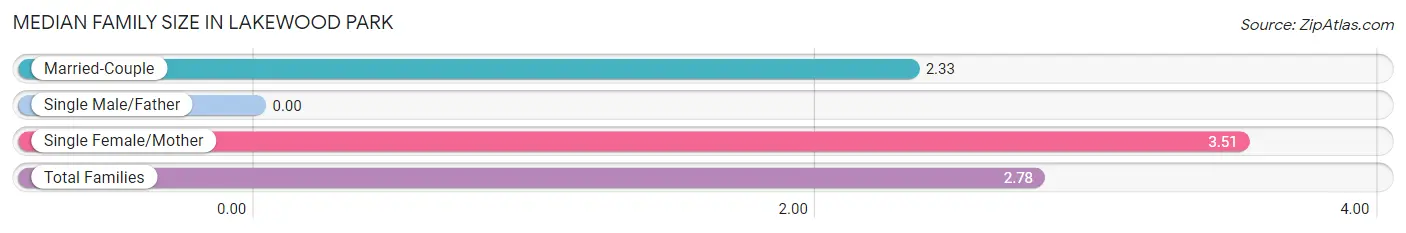
| Family Type | # Families | Family Size |
| Married-Couple | 184 (62.2%) | 2.33 |
| Single Male/Father | 0 (0.0%) | - |
| Single Female/Mother | 112 (37.8%) | 3.51 |
| Total Families | 296 (100.0%) | 2.78 |
Median Household Size in Lakewood Park
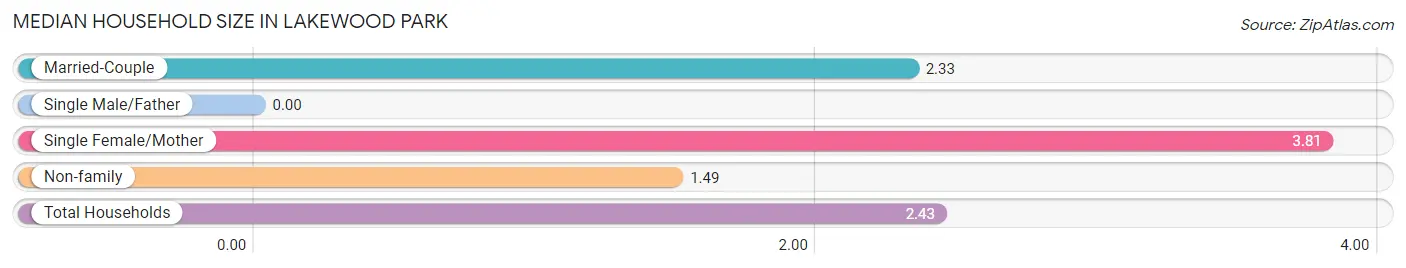
| Household Type | # Households | Household Size |
| Married-Couple | 184 (41.8%) | 2.33 |
| Single Male/Father | 0 (0.0%) | - |
| Single Female/Mother | 112 (25.5%) | 3.81 |
| Non-family | 144 (32.7%) | 1.49 |
| Total Households | 440 (100.0%) | 2.43 |
Household Size by Marriage Status in Lakewood Park
Out of a total of 440 households in Lakewood Park, 296 (67.3%) are family households, while 144 (32.7%) are nonfamily households. The most numerous type of family households are 2-person households, comprising 180, and the most common type of nonfamily households are 1-person households, comprising 91.
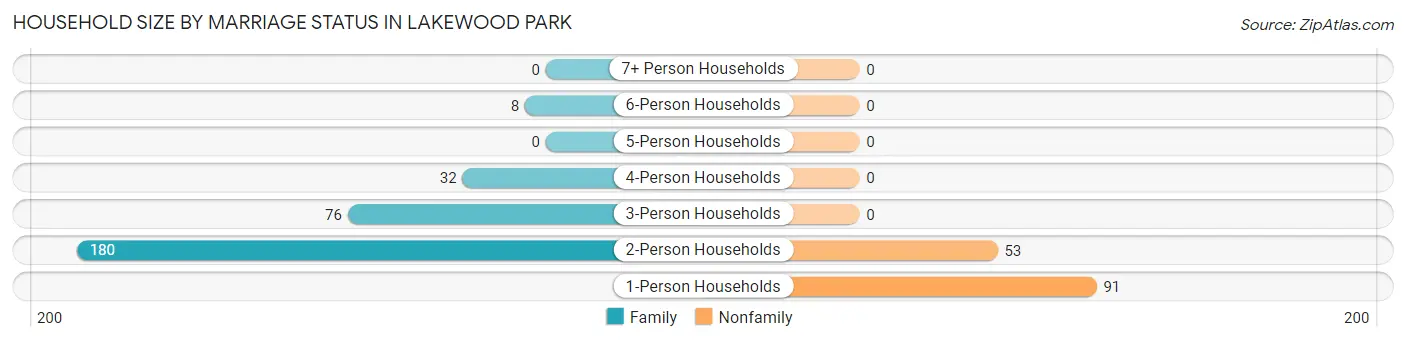
| Household Size | Family Households | Nonfamily Households |
| 1-Person Households | - | 91 (20.7%) |
| 2-Person Households | 180 (40.9%) | 53 (12.0%) |
| 3-Person Households | 76 (17.3%) | 0 (0.0%) |
| 4-Person Households | 32 (7.3%) | 0 (0.0%) |
| 5-Person Households | 0 (0.0%) | 0 (0.0%) |
| 6-Person Households | 8 (1.8%) | 0 (0.0%) |
| 7+ Person Households | 0 (0.0%) | 0 (0.0%) |
| Total | 296 (67.3%) | 144 (32.7%) |
Female Fertility in Lakewood Park
Fertility by Age in Lakewood Park
Average fertility rate in Lakewood Park is 61.0 births per 1,000 women. Women in the age bracket of 20 to 34 years have the highest fertility rate with 88.0 births per 1,000 women. Women in the age bracket of 20 to 34 years acount for 100.0% of all women with births.
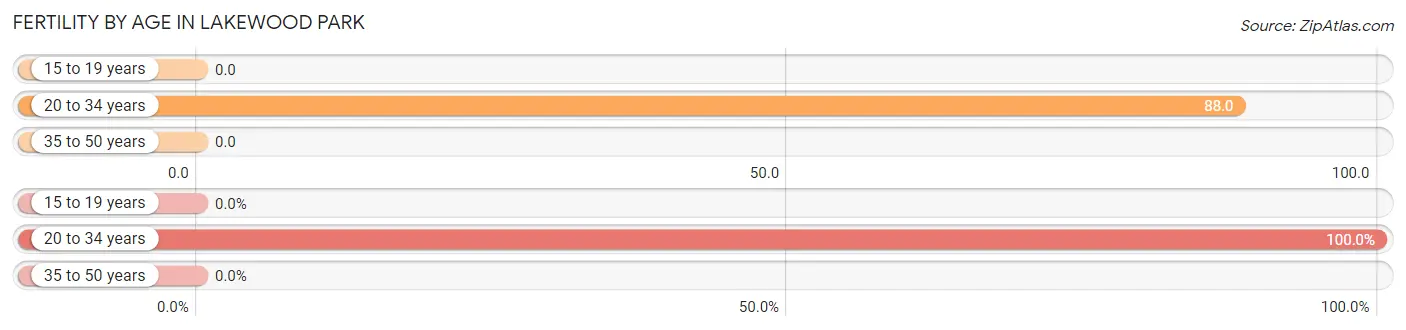
| Age Bracket | Women with Births | Births / 1,000 Women |
| 15 to 19 years | 0 (0.0%) | 0.0 |
| 20 to 34 years | 15 (100.0%) | 88.0 |
| 35 to 50 years | 0 (0.0%) | 0.0 |
| Total | 15 (100.0%) | 61.0 |
Fertility by Age by Marriage Status in Lakewood Park
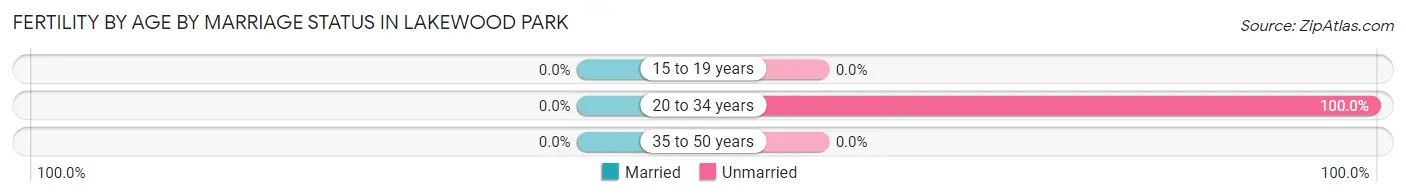
| Age Bracket | Married | Unmarried |
| 15 to 19 years | 0 (0.0%) | 0 (0.0%) |
| 20 to 34 years | 0 (0.0%) | 15 (100.0%) |
| 35 to 50 years | 0 (0.0%) | 0 (0.0%) |
| Total | 0 (0.0%) | 15 (100.0%) |
Fertility by Education in Lakewood Park
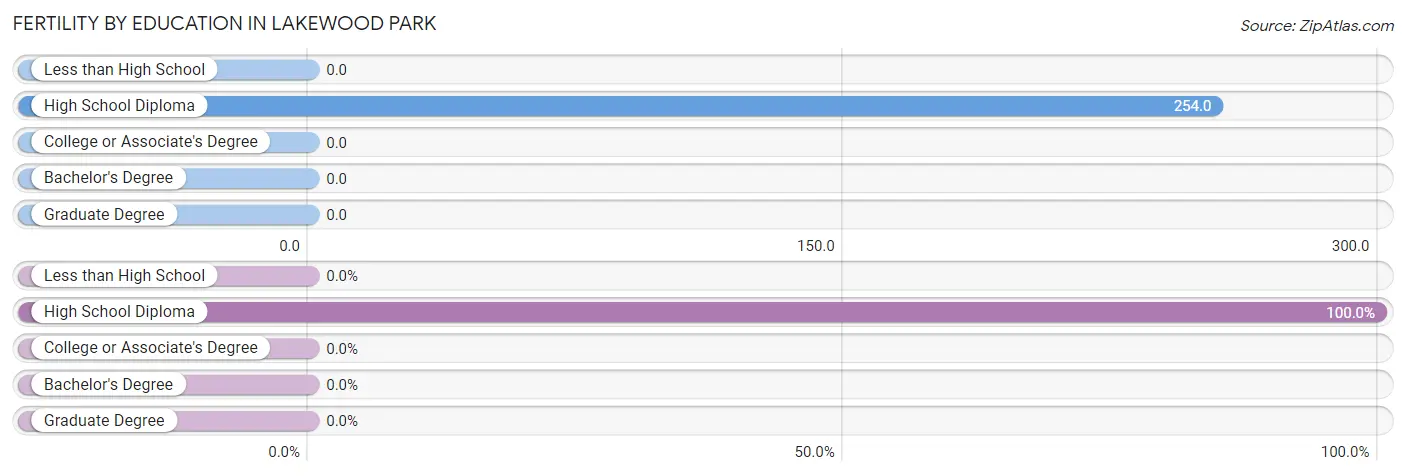
| Educational Attainment | Women with Births | Births / 1,000 Women |
| Less than High School | 0 (0.0%) | 0.0 |
| High School Diploma | 15 (100.0%) | 254.0 |
| College or Associate's Degree | 0 (0.0%) | 0.0 |
| Bachelor's Degree | 0 (0.0%) | 0.0 |
| Graduate Degree | 0 (0.0%) | 0.0 |
| Total | 15 (100.0%) | 61.0 |
Fertility by Education by Marriage Status in Lakewood Park
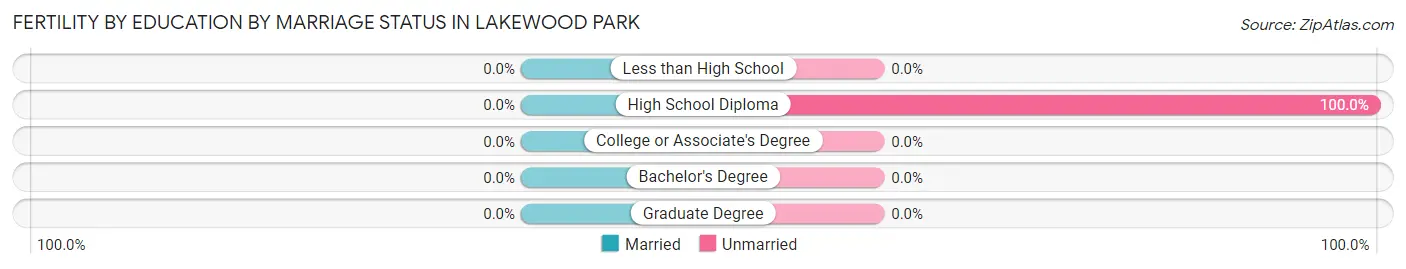
| Educational Attainment | Married | Unmarried |
| Less than High School | 0 (0.0%) | 0 (0.0%) |
| High School Diploma | 0 (0.0%) | 15 (100.0%) |
| College or Associate's Degree | 0 (0.0%) | 0 (0.0%) |
| Bachelor's Degree | 0 (0.0%) | 0 (0.0%) |
| Graduate Degree | 0 (0.0%) | 0 (0.0%) |
| Total | 0 (0.0%) | 15 (100.0%) |
Employment Characteristics in Lakewood Park
Employment by Class of Employer in Lakewood Park
Among the 357 employed individuals in Lakewood Park, private company employees (338 | 94.7%), and state government employees (19 | 5.3%) make up the most common classes of employment.
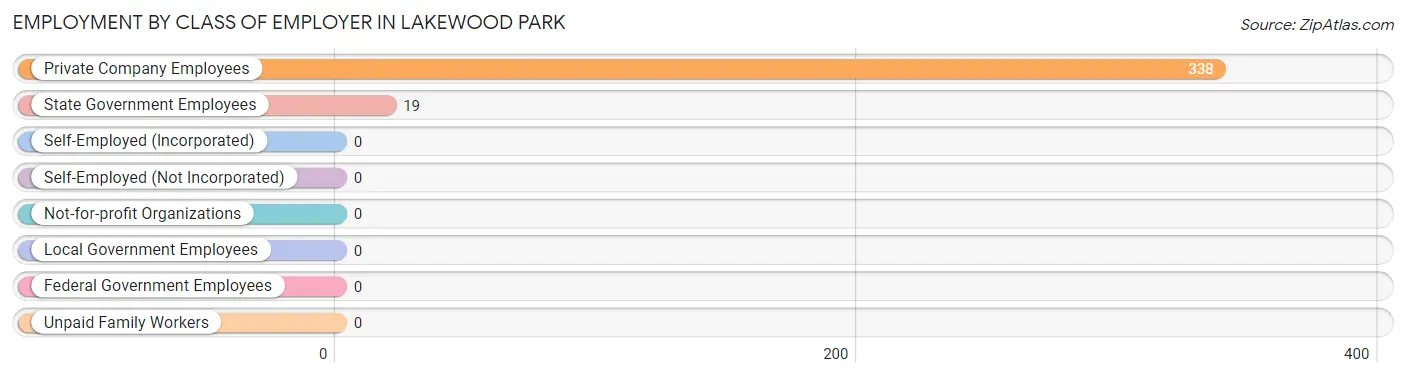
| Employer Class | # Employees | % Employees |
| Private Company Employees | 338 | 94.7% |
| Self-Employed (Incorporated) | 0 | 0.0% |
| Self-Employed (Not Incorporated) | 0 | 0.0% |
| Not-for-profit Organizations | 0 | 0.0% |
| Local Government Employees | 0 | 0.0% |
| State Government Employees | 19 | 5.3% |
| Federal Government Employees | 0 | 0.0% |
| Unpaid Family Workers | 0 | 0.0% |
| Total | 357 | 100.0% |
Employment Status by Age in Lakewood Park
According to the labor force statistics for Lakewood Park, out of the total population over 16 years of age (971), 43.2% or 419 individuals are in the labor force, with 6.0% or 25 of them unemployed. The age group with the highest labor force participation rate is 30 to 34 years, with 100.0% or 23 individuals in the labor force. Within the labor force, the 35 to 44 years age range has the highest percentage of unemployed individuals, with 37.9% or 25 of them being unemployed.
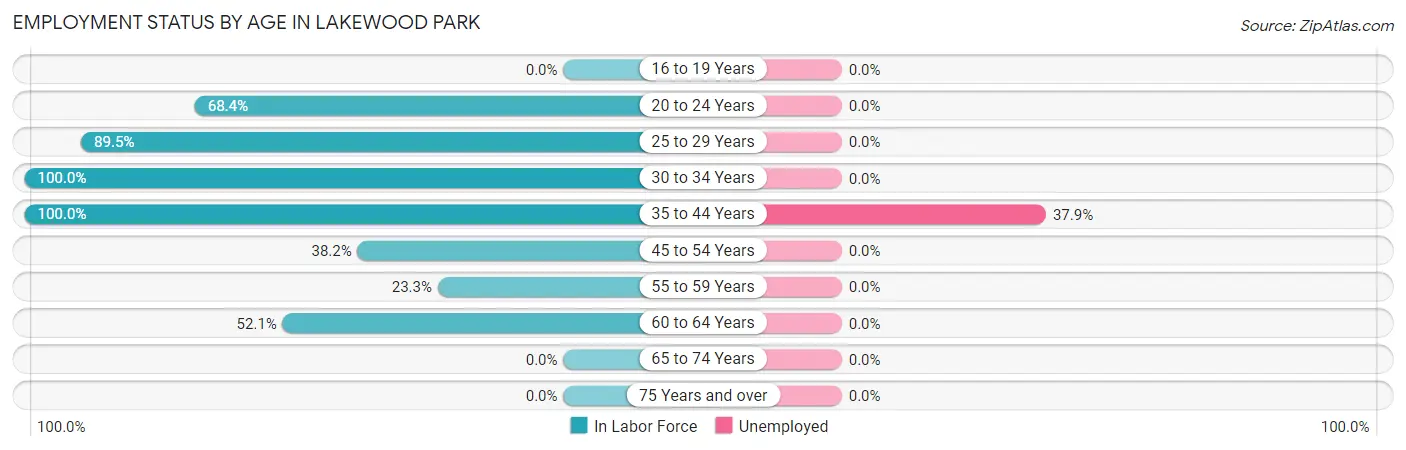
| Age Bracket | In Labor Force | Unemployed |
| 16 to 19 Years | 0 (0.0%) | 0 (0.0%) |
| 20 to 24 Years | 128 (68.4%) | 0 (0.0%) |
| 25 to 29 Years | 77 (89.5%) | 0 (0.0%) |
| 30 to 34 Years | 23 (100.0%) | 0 (0.0%) |
| 35 to 44 Years | 66 (100.0%) | 25 (37.9%) |
| 45 to 54 Years | 47 (38.2%) | 0 (0.0%) |
| 55 to 59 Years | 41 (23.3%) | 0 (0.0%) |
| 60 to 64 Years | 37 (52.1%) | 0 (0.0%) |
| 65 to 74 Years | 0 (0.0%) | 0 (0.0%) |
| 75 Years and over | 0 (0.0%) | 0 (0.0%) |
| Total | 419 (43.2%) | 25 (6.0%) |
Employment Status by Educational Attainment in Lakewood Park
According to labor force statistics for Lakewood Park, 53.4% of individuals (291) out of the total population between 25 and 64 years of age (545) are in the labor force, with 8.6% or 25 of them being unemployed. The group with the highest labor force participation rate are those with the educational attainment of bachelor's degree or higher, with 100.0% or 77 individuals in the labor force. Within the labor force, individuals with high school diploma education have the highest percentage of unemployment, with 37.9% or 25 of them being unemployed.
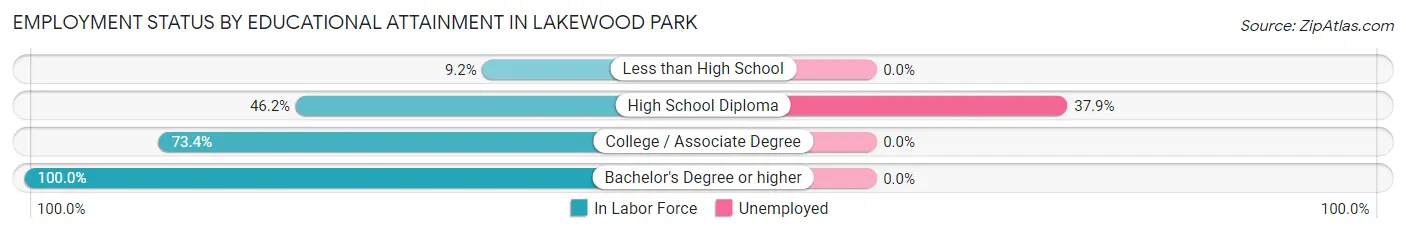
| Educational Attainment | In Labor Force | Unemployed |
| Less than High School | 13 (9.2%) | 0 (0.0%) |
| High School Diploma | 66 (46.2%) | 54 (37.9%) |
| College / Associate Degree | 135 (73.4%) | 0 (0.0%) |
| Bachelor's Degree or higher | 77 (100.0%) | 0 (0.0%) |
| Total | 291 (53.4%) | 47 (8.6%) |
Employment Occupations by Sex in Lakewood Park
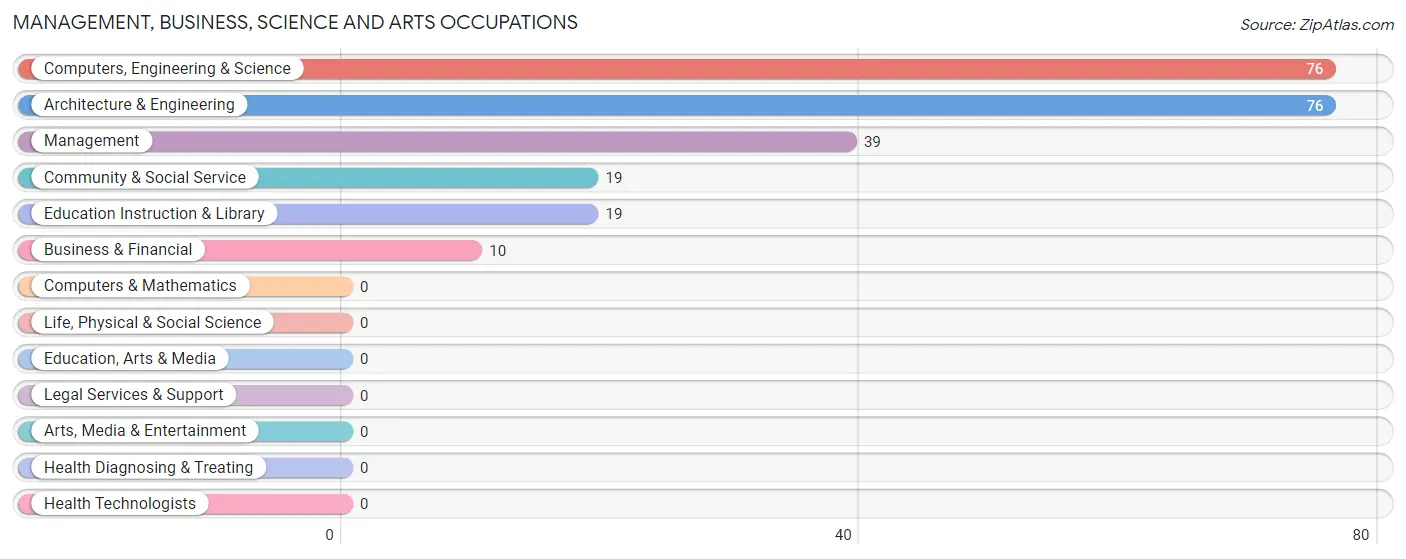
Management, Business, Science and Arts Occupations
The most common Management, Business, Science and Arts occupations in Lakewood Park are Computers, Engineering & Science (76 | 19.3%), Architecture & Engineering (76 | 19.3%), Management (39 | 9.9%), Community & Social Service (19 | 4.8%), and Education Instruction & Library (19 | 4.8%).
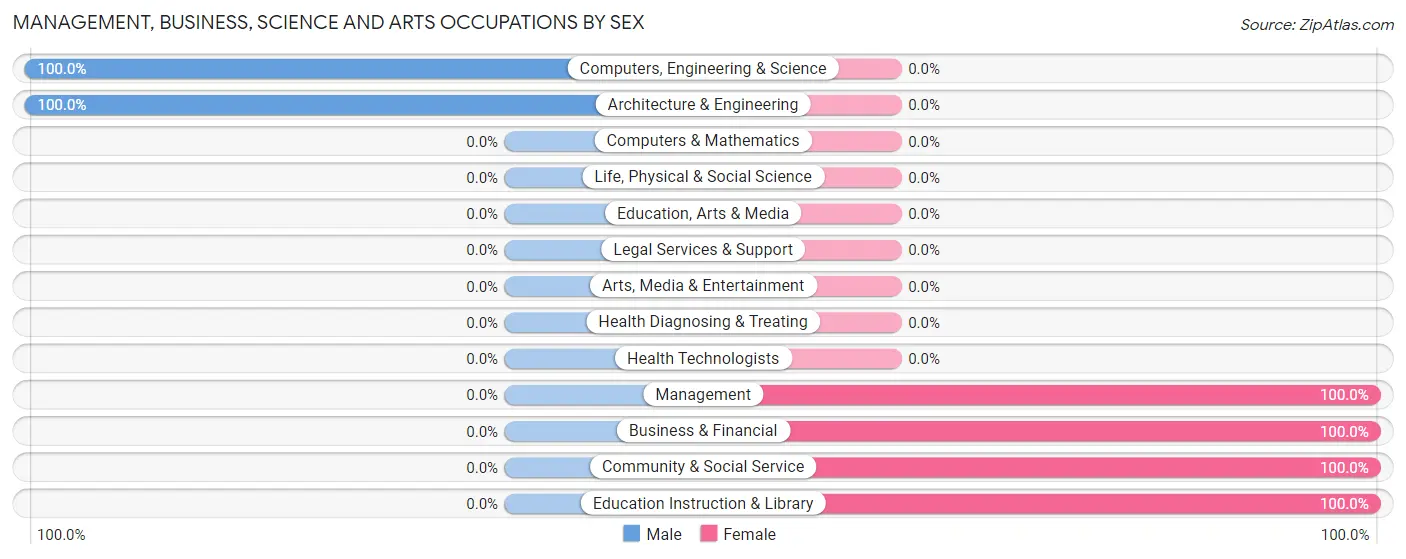
Management, Business, Science and Arts Occupations by Sex
Within the Management, Business, Science and Arts occupations in Lakewood Park, the most male-oriented occupations are Computers, Engineering & Science (100.0%), and Architecture & Engineering (100.0%), while the most female-oriented occupations are Management (100.0%), Business & Financial (100.0%), and Community & Social Service (100.0%).
| Occupation | Male | Female |
| Management | 0 (0.0%) | 39 (100.0%) |
| Business & Financial | 0 (0.0%) | 10 (100.0%) |
| Computers, Engineering & Science | 76 (100.0%) | 0 (0.0%) |
| Computers & Mathematics | 0 (0.0%) | 0 (0.0%) |
| Architecture & Engineering | 76 (100.0%) | 0 (0.0%) |
| Life, Physical & Social Science | 0 (0.0%) | 0 (0.0%) |
| Community & Social Service | 0 (0.0%) | 19 (100.0%) |
| Education, Arts & Media | 0 (0.0%) | 0 (0.0%) |
| Legal Services & Support | 0 (0.0%) | 0 (0.0%) |
| Education Instruction & Library | 0 (0.0%) | 19 (100.0%) |
| Arts, Media & Entertainment | 0 (0.0%) | 0 (0.0%) |
| Health Diagnosing & Treating | 0 (0.0%) | 0 (0.0%) |
| Health Technologists | 0 (0.0%) | 0 (0.0%) |
| Total (Category) | 76 (52.8%) | 68 (47.2%) |
| Total (Overall) | 131 (33.3%) | 263 (66.7%) |
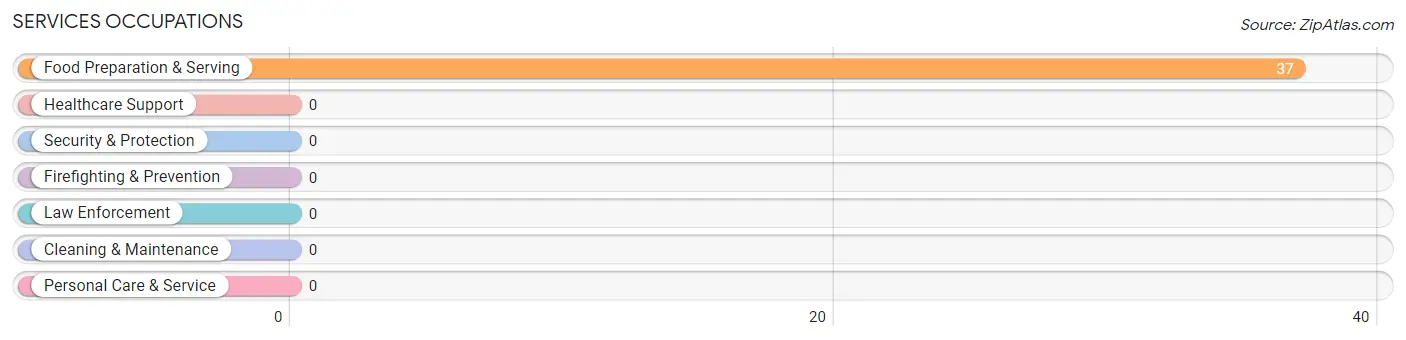
Services Occupations
The most common Services occupations in Lakewood Park are , and Food Preparation & Serving (37 | 9.4%).
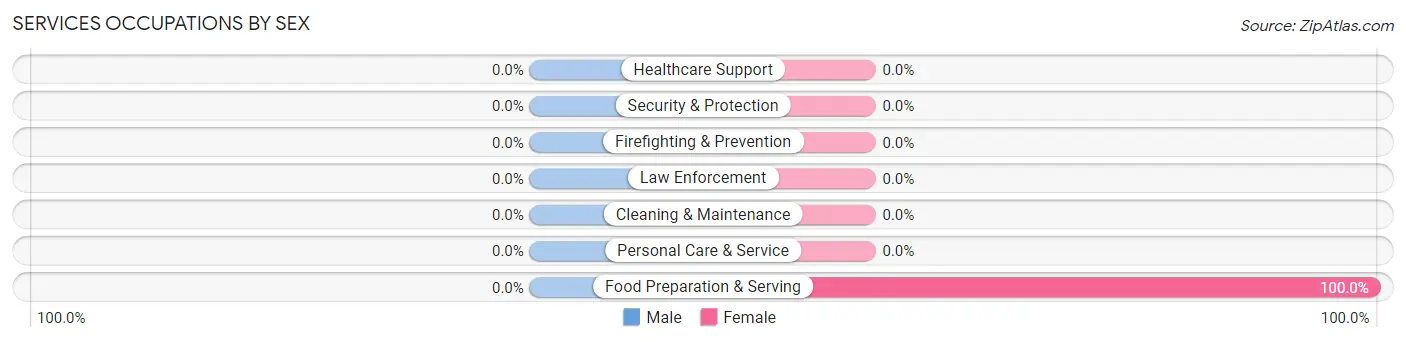
Services Occupations by Sex
| Occupation | Male | Female |
| Healthcare Support | 0 (0.0%) | 0 (0.0%) |
| Security & Protection | 0 (0.0%) | 0 (0.0%) |
| Firefighting & Prevention | 0 (0.0%) | 0 (0.0%) |
| Law Enforcement | 0 (0.0%) | 0 (0.0%) |
| Food Preparation & Serving | 0 (0.0%) | 37 (100.0%) |
| Cleaning & Maintenance | 0 (0.0%) | 0 (0.0%) |
| Personal Care & Service | 0 (0.0%) | 0 (0.0%) |
| Total (Category) | 0 (0.0%) | 37 (100.0%) |
| Total (Overall) | 131 (33.3%) | 263 (66.7%) |
Sales and Office Occupations
The most common Sales and Office occupations in Lakewood Park are Office & Administration (88 | 22.3%), and Sales & Related (9 | 2.3%).
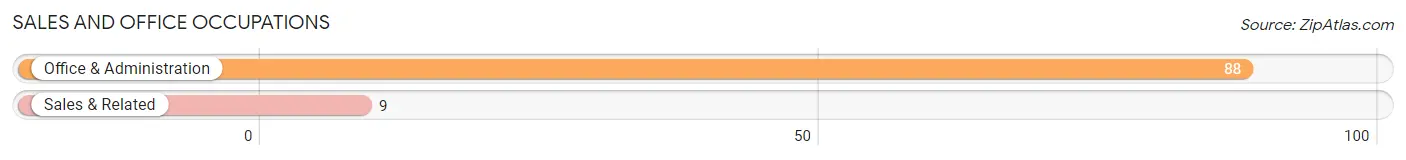
Sales and Office Occupations by Sex
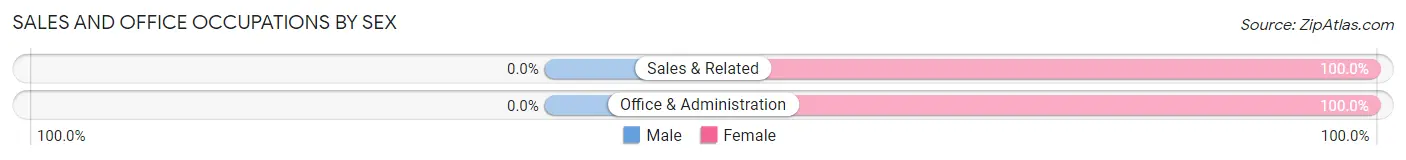
| Occupation | Male | Female |
| Sales & Related | 0 (0.0%) | 9 (100.0%) |
| Office & Administration | 0 (0.0%) | 88 (100.0%) |
| Total (Category) | 0 (0.0%) | 97 (100.0%) |
| Total (Overall) | 131 (33.3%) | 263 (66.7%) |
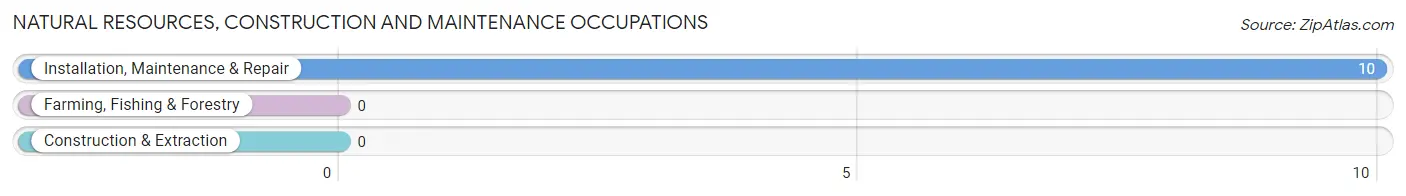
Natural Resources, Construction and Maintenance Occupations
The most common Natural Resources, Construction and Maintenance occupations in Lakewood Park are , and Installation, Maintenance & Repair (10 | 2.5%).
Natural Resources, Construction and Maintenance Occupations by Sex
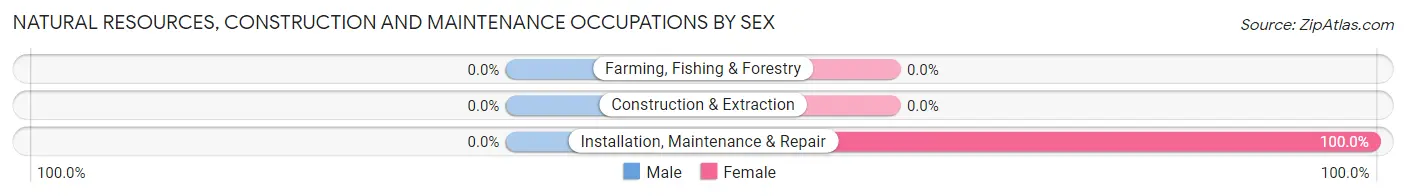
| Occupation | Male | Female |
| Farming, Fishing & Forestry | 0 (0.0%) | 0 (0.0%) |
| Construction & Extraction | 0 (0.0%) | 0 (0.0%) |
| Installation, Maintenance & Repair | 0 (0.0%) | 10 (100.0%) |
| Total (Category) | 0 (0.0%) | 10 (100.0%) |
| Total (Overall) | 131 (33.3%) | 263 (66.7%) |
Production, Transportation and Moving Occupations
The most common Production, Transportation and Moving occupations in Lakewood Park are Production (70 | 17.8%), Material Moving (23 | 5.8%), and Transportation (13 | 3.3%).
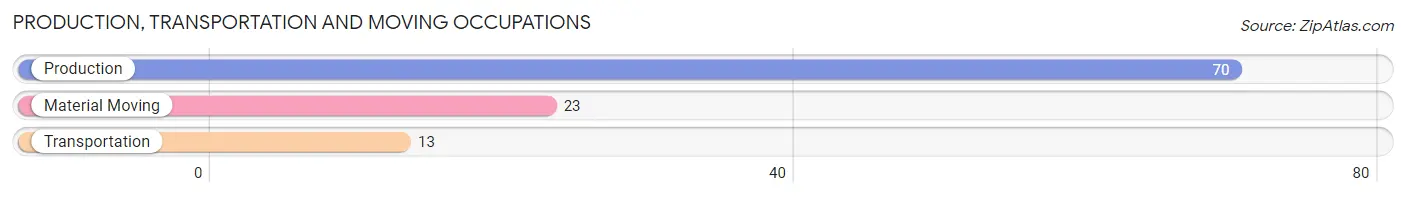
Production, Transportation and Moving Occupations by Sex
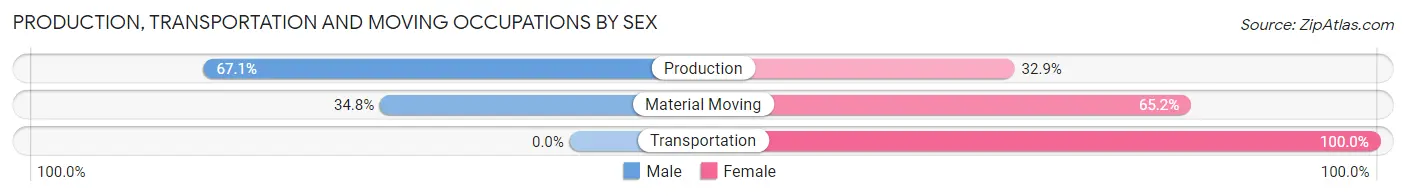
| Occupation | Male | Female |
| Production | 47 (67.1%) | 23 (32.9%) |
| Transportation | 0 (0.0%) | 13 (100.0%) |
| Material Moving | 8 (34.8%) | 15 (65.2%) |
| Total (Category) | 55 (51.9%) | 51 (48.1%) |
| Total (Overall) | 131 (33.3%) | 263 (66.7%) |
Employment Industries by Sex in Lakewood Park
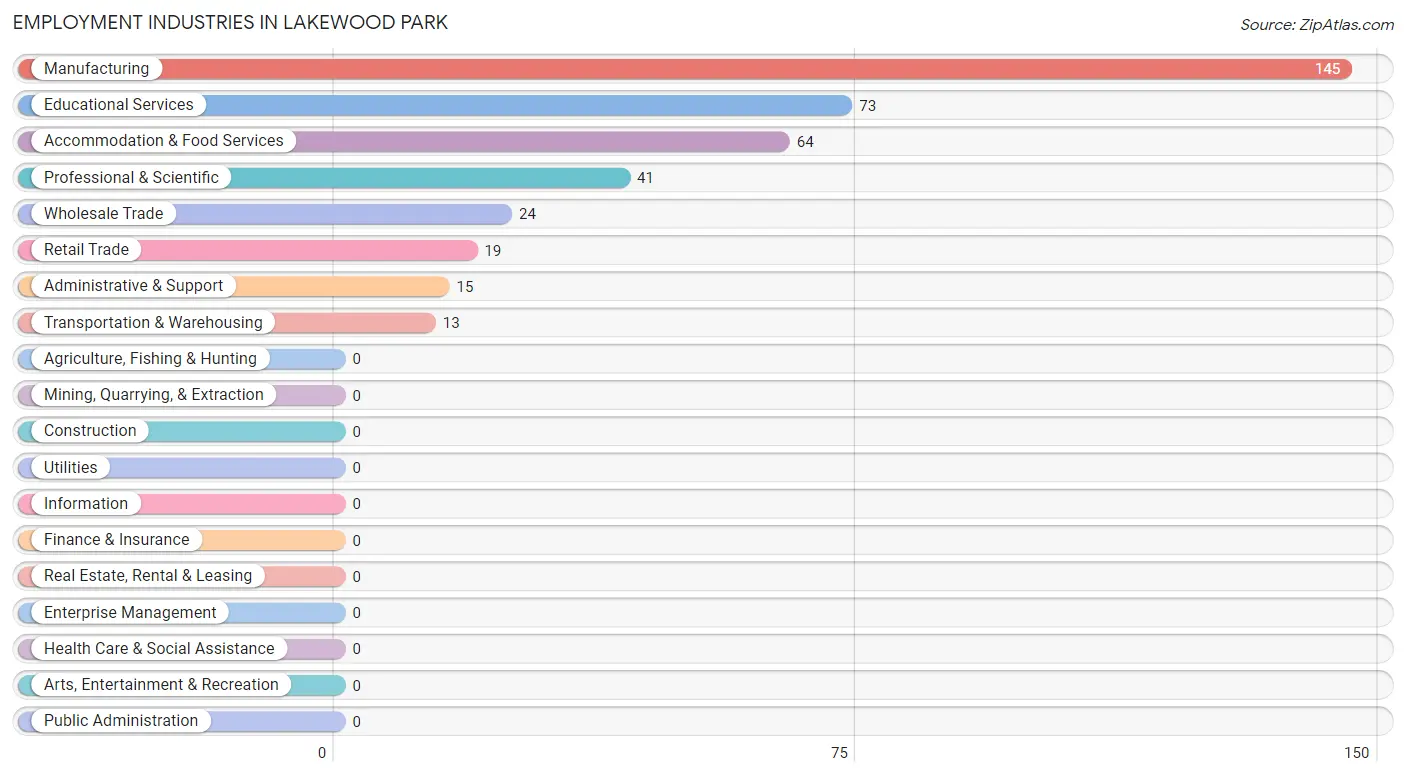
Employment Industries in Lakewood Park
The major employment industries in Lakewood Park include Manufacturing (145 | 36.8%), Educational Services (73 | 18.5%), Accommodation & Food Services (64 | 16.2%), Professional & Scientific (41 | 10.4%), and Wholesale Trade (24 | 6.1%).
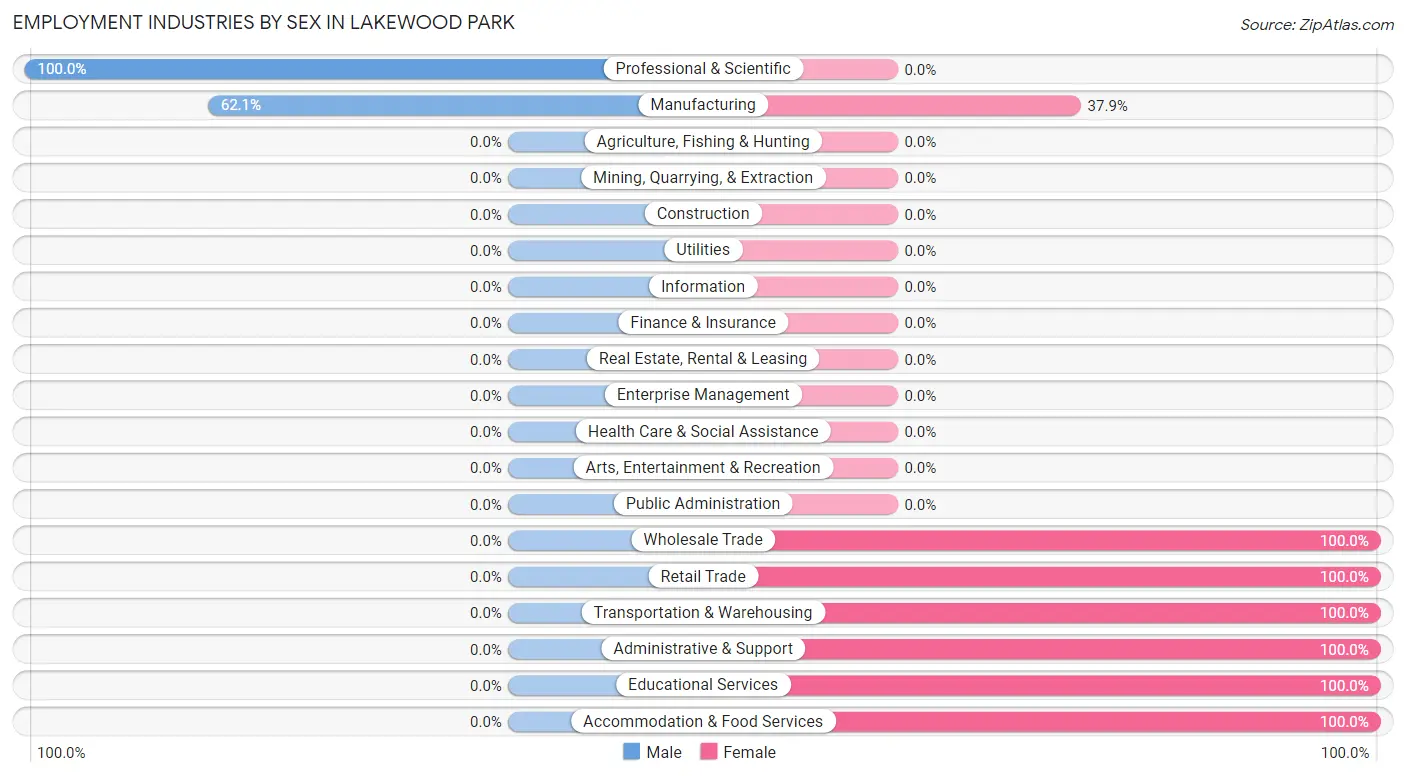
Employment Industries by Sex in Lakewood Park
The Lakewood Park industries that see more men than women are Professional & Scientific (100.0%), and Manufacturing (62.1%), whereas the industries that tend to have a higher number of women are Wholesale Trade (100.0%), Retail Trade (100.0%), and Transportation & Warehousing (100.0%).
| Industry | Male | Female |
| Agriculture, Fishing & Hunting | 0 (0.0%) | 0 (0.0%) |
| Mining, Quarrying, & Extraction | 0 (0.0%) | 0 (0.0%) |
| Construction | 0 (0.0%) | 0 (0.0%) |
| Manufacturing | 90 (62.1%) | 55 (37.9%) |
| Wholesale Trade | 0 (0.0%) | 24 (100.0%) |
| Retail Trade | 0 (0.0%) | 19 (100.0%) |
| Transportation & Warehousing | 0 (0.0%) | 13 (100.0%) |
| Utilities | 0 (0.0%) | 0 (0.0%) |
| Information | 0 (0.0%) | 0 (0.0%) |
| Finance & Insurance | 0 (0.0%) | 0 (0.0%) |
| Real Estate, Rental & Leasing | 0 (0.0%) | 0 (0.0%) |
| Professional & Scientific | 41 (100.0%) | 0 (0.0%) |
| Enterprise Management | 0 (0.0%) | 0 (0.0%) |
| Administrative & Support | 0 (0.0%) | 15 (100.0%) |
| Educational Services | 0 (0.0%) | 73 (100.0%) |
| Health Care & Social Assistance | 0 (0.0%) | 0 (0.0%) |
| Arts, Entertainment & Recreation | 0 (0.0%) | 0 (0.0%) |
| Accommodation & Food Services | 0 (0.0%) | 64 (100.0%) |
| Public Administration | 0 (0.0%) | 0 (0.0%) |
| Total | 131 (33.3%) | 263 (66.7%) |
Education in Lakewood Park
School Enrollment in Lakewood Park
The most common levels of schooling among the 200 students in Lakewood Park are college / undergraduate (121 | 60.5%), middle school (59 | 29.5%), and high school (20 | 10.0%).
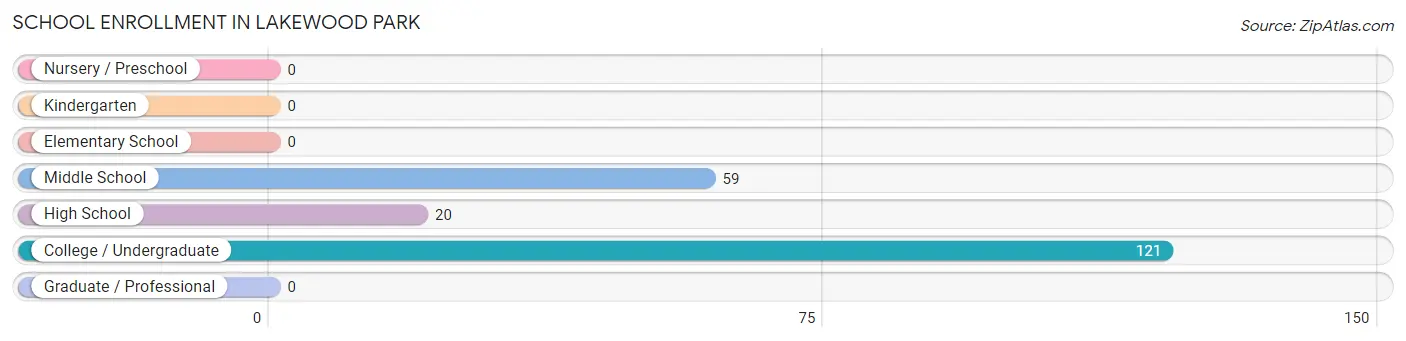
| School Level | # Students | % Students |
| Nursery / Preschool | 0 | 0.0% |
| Kindergarten | 0 | 0.0% |
| Elementary School | 0 | 0.0% |
| Middle School | 59 | 29.5% |
| High School | 20 | 10.0% |
| College / Undergraduate | 121 | 60.5% |
| Graduate / Professional | 0 | 0.0% |
| Total | 200 | 100.0% |
School Enrollment by Age by Funding Source in Lakewood Park
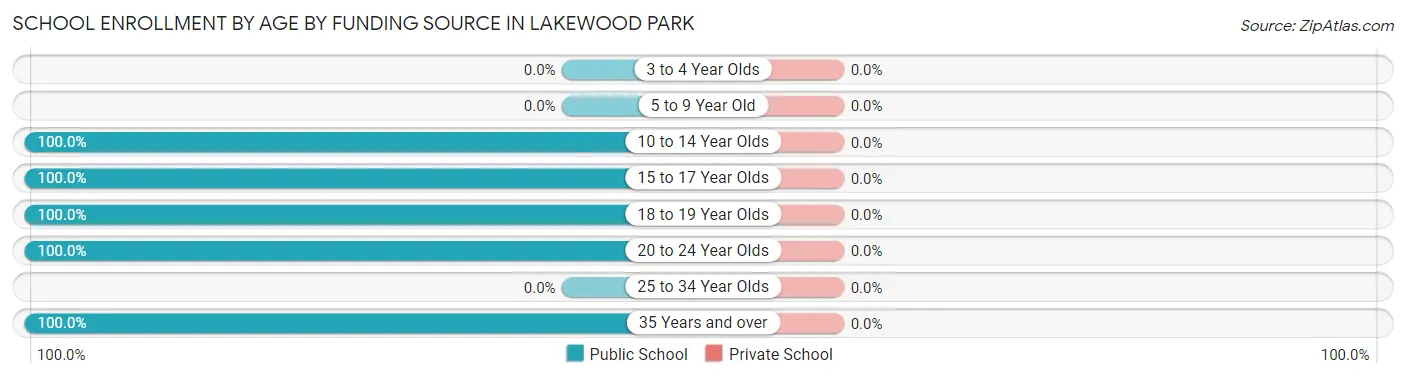
| Age Bracket | Public School | Private School |
| 3 to 4 Year Olds | 0 (0.0%) | 0 (0.0%) |
| 5 to 9 Year Old | 0 (0.0%) | 0 (0.0%) |
| 10 to 14 Year Olds | 25 (100.0%) | 0 (0.0%) |
| 15 to 17 Year Olds | 27 (100.0%) | 0 (0.0%) |
| 18 to 19 Year Olds | 9 (100.0%) | 0 (0.0%) |
| 20 to 24 Year Olds | 113 (100.0%) | 0 (0.0%) |
| 25 to 34 Year Olds | 0 (0.0%) | 0 (0.0%) |
| 35 Years and over | 26 (100.0%) | 0 (0.0%) |
| Total | 200 (100.0%) | 0 (0.0%) |
Educational Attainment by Field of Study in Lakewood Park
Engineering (58 | 51.8%), physical & health sciences (35 | 31.2%), and education (19 | 17.0%) are the most common fields of study among 112 individuals in Lakewood Park who have obtained a bachelor's degree or higher.
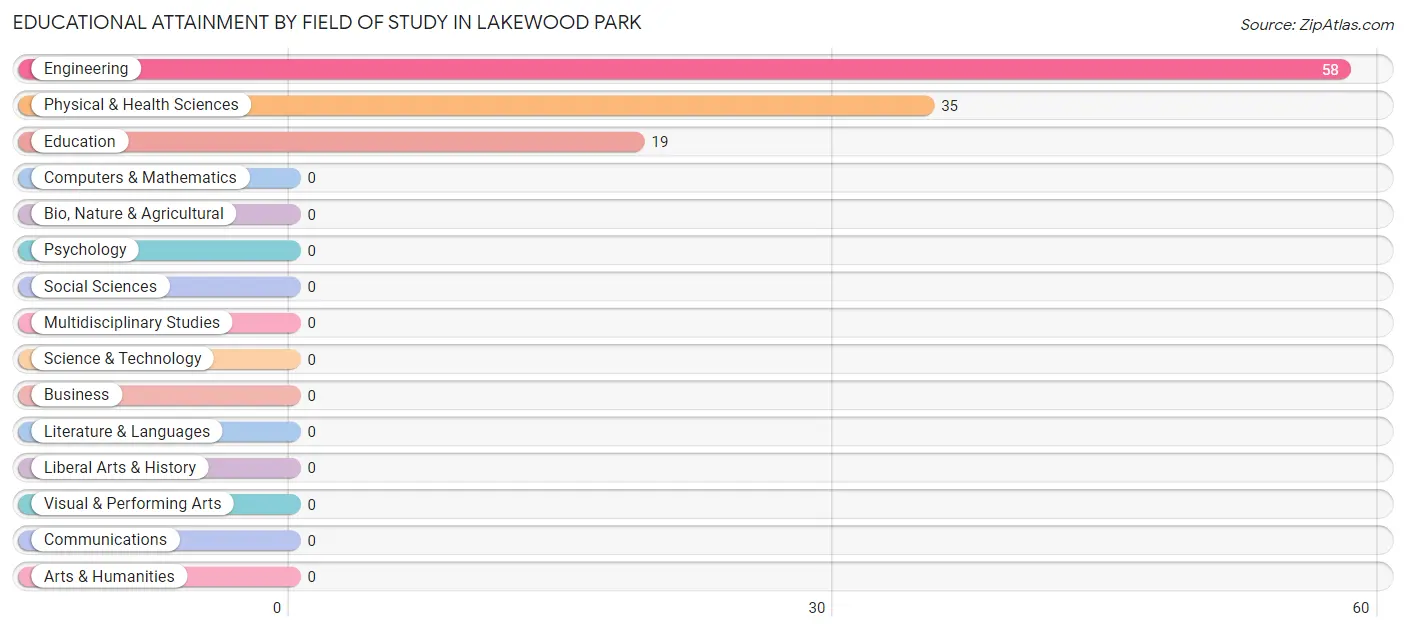
| Field of Study | # Graduates | % Graduates |
| Computers & Mathematics | 0 | 0.0% |
| Bio, Nature & Agricultural | 0 | 0.0% |
| Physical & Health Sciences | 35 | 31.2% |
| Psychology | 0 | 0.0% |
| Social Sciences | 0 | 0.0% |
| Engineering | 58 | 51.8% |
| Multidisciplinary Studies | 0 | 0.0% |
| Science & Technology | 0 | 0.0% |
| Business | 0 | 0.0% |
| Education | 19 | 17.0% |
| Literature & Languages | 0 | 0.0% |
| Liberal Arts & History | 0 | 0.0% |
| Visual & Performing Arts | 0 | 0.0% |
| Communications | 0 | 0.0% |
| Arts & Humanities | 0 | 0.0% |
| Total | 112 | 100.0% |
Transportation & Commute in Lakewood Park
Vehicle Availability by Sex in Lakewood Park
The most prevalent vehicle ownership categories in Lakewood Park are males with 2 vehicles (78, accounting for 59.5%) and females with 2 vehicles (123, making up 34.5%).
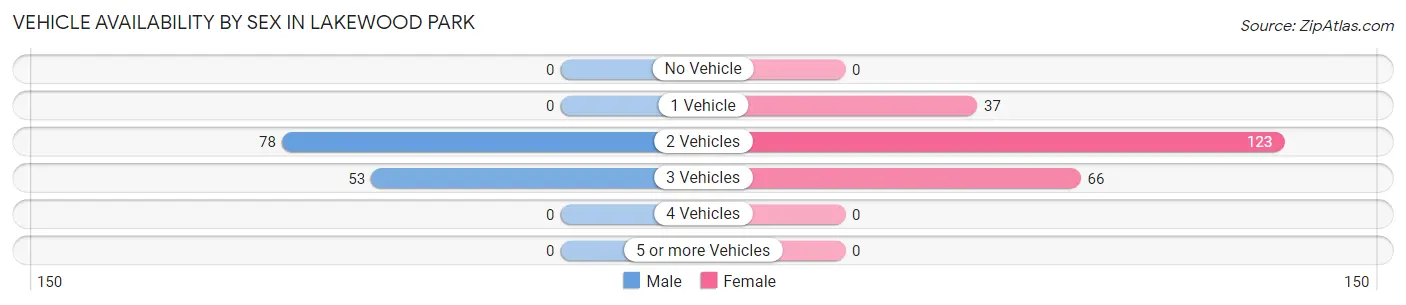
| Vehicles Available | Male | Female |
| No Vehicle | 0 (0.0%) | 0 (0.0%) |
| 1 Vehicle | 0 (0.0%) | 37 (16.4%) |
| 2 Vehicles | 78 (59.5%) | 123 (54.4%) |
| 3 Vehicles | 53 (40.5%) | 66 (29.2%) |
| 4 Vehicles | 0 (0.0%) | 0 (0.0%) |
| 5 or more Vehicles | 0 (0.0%) | 0 (0.0%) |
| Total | 131 (100.0%) | 226 (100.0%) |
Commute Time in Lakewood Park
The most frequently occuring commute durations in Lakewood Park are 30 to 34 minutes (113 commuters, 35.3%), 45 to 59 minutes (87 commuters, 27.2%), and 60 to 89 minutes (47 commuters, 14.7%).
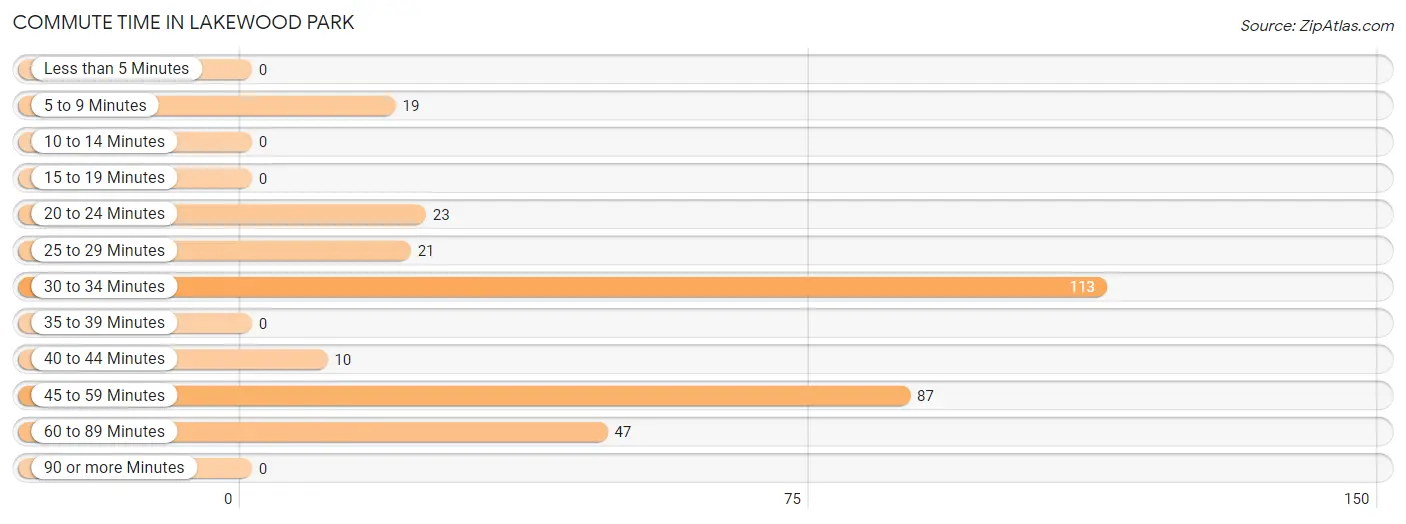
| Commute Time | # Commuters | % Commuters |
| Less than 5 Minutes | 0 | 0.0% |
| 5 to 9 Minutes | 19 | 5.9% |
| 10 to 14 Minutes | 0 | 0.0% |
| 15 to 19 Minutes | 0 | 0.0% |
| 20 to 24 Minutes | 23 | 7.2% |
| 25 to 29 Minutes | 21 | 6.6% |
| 30 to 34 Minutes | 113 | 35.3% |
| 35 to 39 Minutes | 0 | 0.0% |
| 40 to 44 Minutes | 10 | 3.1% |
| 45 to 59 Minutes | 87 | 27.2% |
| 60 to 89 Minutes | 47 | 14.7% |
| 90 or more Minutes | 0 | 0.0% |
Commute Time by Sex in Lakewood Park
The most common commute times in Lakewood Park are 30 to 34 minutes (76 commuters, 58.0%) for males and 45 to 59 minutes (64 commuters, 33.9%) for females.
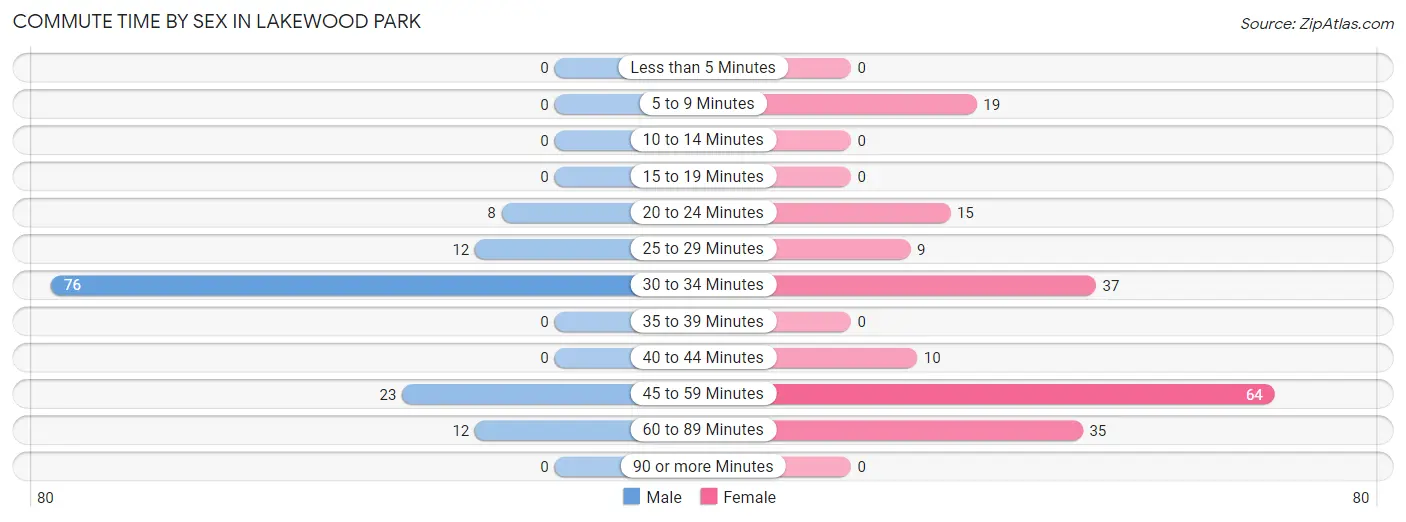
| Commute Time | Male | Female |
| Less than 5 Minutes | 0 (0.0%) | 0 (0.0%) |
| 5 to 9 Minutes | 0 (0.0%) | 19 (10.1%) |
| 10 to 14 Minutes | 0 (0.0%) | 0 (0.0%) |
| 15 to 19 Minutes | 0 (0.0%) | 0 (0.0%) |
| 20 to 24 Minutes | 8 (6.1%) | 15 (7.9%) |
| 25 to 29 Minutes | 12 (9.2%) | 9 (4.8%) |
| 30 to 34 Minutes | 76 (58.0%) | 37 (19.6%) |
| 35 to 39 Minutes | 0 (0.0%) | 0 (0.0%) |
| 40 to 44 Minutes | 0 (0.0%) | 10 (5.3%) |
| 45 to 59 Minutes | 23 (17.6%) | 64 (33.9%) |
| 60 to 89 Minutes | 12 (9.2%) | 35 (18.5%) |
| 90 or more Minutes | 0 (0.0%) | 0 (0.0%) |
Time of Departure to Work by Sex in Lakewood Park
The most frequent times of departure to work in Lakewood Park are 6:30 AM to 6:59 AM (47, 35.9%) for males and 9:00 AM to 9:59 AM (54, 28.6%) for females.
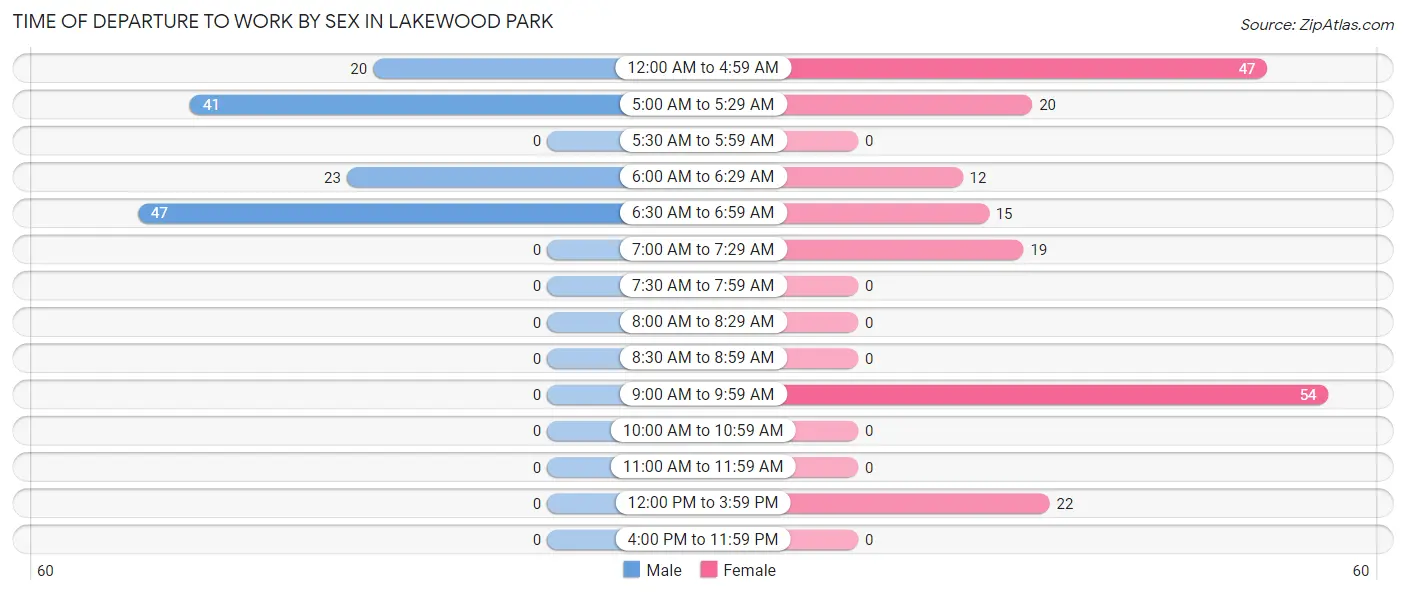
| Time of Departure | Male | Female |
| 12:00 AM to 4:59 AM | 20 (15.3%) | 47 (24.9%) |
| 5:00 AM to 5:29 AM | 41 (31.3%) | 20 (10.6%) |
| 5:30 AM to 5:59 AM | 0 (0.0%) | 0 (0.0%) |
| 6:00 AM to 6:29 AM | 23 (17.6%) | 12 (6.4%) |
| 6:30 AM to 6:59 AM | 47 (35.9%) | 15 (7.9%) |
| 7:00 AM to 7:29 AM | 0 (0.0%) | 19 (10.1%) |
| 7:30 AM to 7:59 AM | 0 (0.0%) | 0 (0.0%) |
| 8:00 AM to 8:29 AM | 0 (0.0%) | 0 (0.0%) |
| 8:30 AM to 8:59 AM | 0 (0.0%) | 0 (0.0%) |
| 9:00 AM to 9:59 AM | 0 (0.0%) | 54 (28.6%) |
| 10:00 AM to 10:59 AM | 0 (0.0%) | 0 (0.0%) |
| 11:00 AM to 11:59 AM | 0 (0.0%) | 0 (0.0%) |
| 12:00 PM to 3:59 PM | 0 (0.0%) | 22 (11.6%) |
| 4:00 PM to 11:59 PM | 0 (0.0%) | 0 (0.0%) |
| Total | 131 (100.0%) | 189 (100.0%) |
Housing Occupancy in Lakewood Park
Occupancy by Ownership in Lakewood Park
Of the total 440 dwellings in Lakewood Park, owner-occupied units account for 343 (77.9%), while renter-occupied units make up 97 (22.1%).
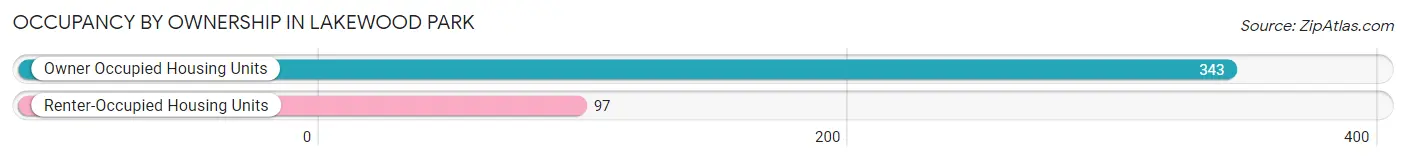
| Occupancy | # Housing Units | % Housing Units |
| Owner Occupied Housing Units | 343 | 77.9% |
| Renter-Occupied Housing Units | 97 | 22.1% |
| Total Occupied Housing Units | 440 | 100.0% |
Occupancy by Household Size in Lakewood Park
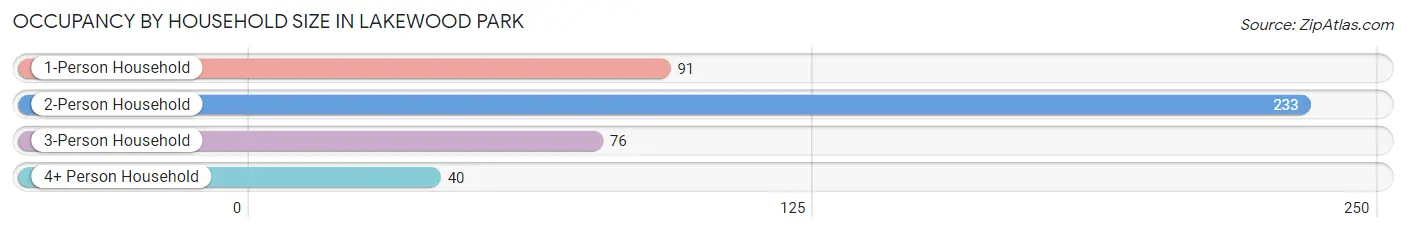
| Household Size | # Housing Units | % Housing Units |
| 1-Person Household | 91 | 20.7% |
| 2-Person Household | 233 | 52.9% |
| 3-Person Household | 76 | 17.3% |
| 4+ Person Household | 40 | 9.1% |
| Total Housing Units | 440 | 100.0% |
Occupancy by Ownership by Household Size in Lakewood Park
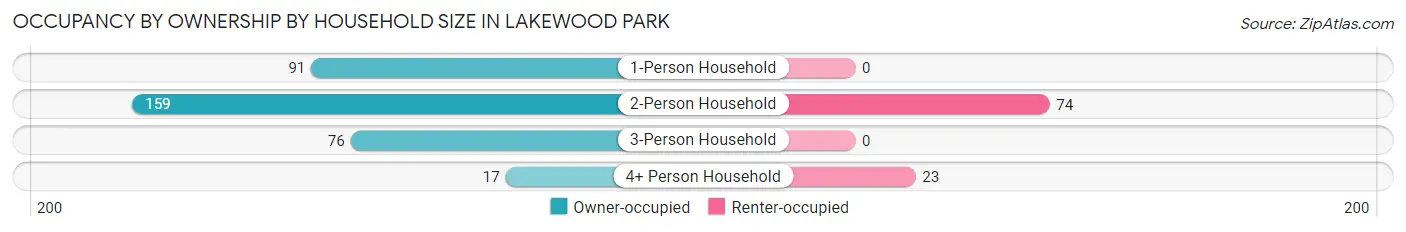
| Household Size | Owner-occupied | Renter-occupied |
| 1-Person Household | 91 (100.0%) | 0 (0.0%) |
| 2-Person Household | 159 (68.2%) | 74 (31.8%) |
| 3-Person Household | 76 (100.0%) | 0 (0.0%) |
| 4+ Person Household | 17 (42.5%) | 23 (57.5%) |
| Total Housing Units | 343 (77.9%) | 97 (22.1%) |
Occupancy by Educational Attainment in Lakewood Park
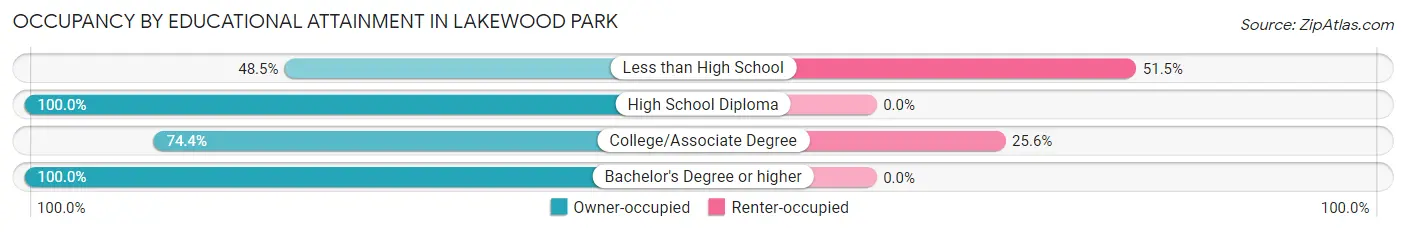
| Household Size | Owner-occupied | Renter-occupied |
| Less than High School | 49 (48.5%) | 52 (51.5%) |
| High School Diploma | 109 (100.0%) | 0 (0.0%) |
| College/Associate Degree | 131 (74.4%) | 45 (25.6%) |
| Bachelor's Degree or higher | 54 (100.0%) | 0 (0.0%) |
Occupancy by Age of Householder in Lakewood Park
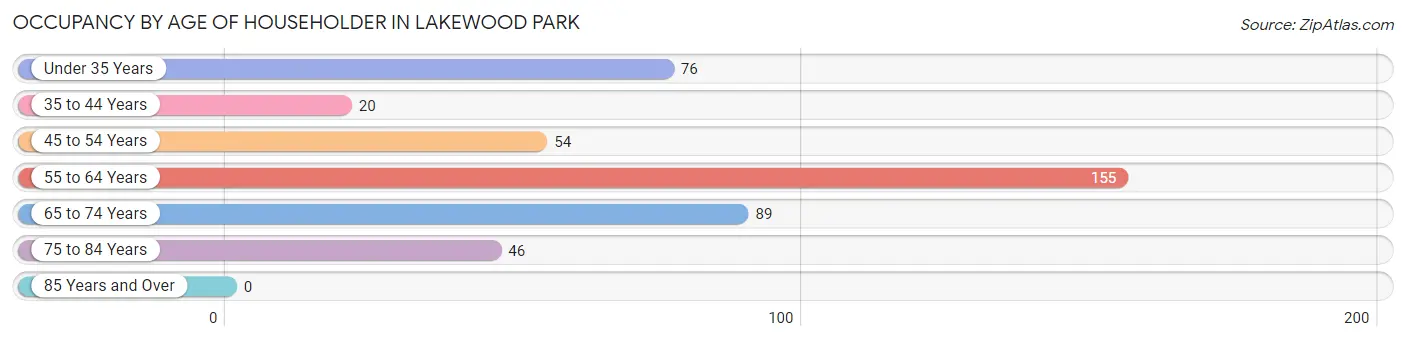
| Age Bracket | # Households | % Households |
| Under 35 Years | 76 | 17.3% |
| 35 to 44 Years | 20 | 4.5% |
| 45 to 54 Years | 54 | 12.3% |
| 55 to 64 Years | 155 | 35.2% |
| 65 to 74 Years | 89 | 20.2% |
| 75 to 84 Years | 46 | 10.4% |
| 85 Years and Over | 0 | 0.0% |
| Total | 440 | 100.0% |
Housing Finances in Lakewood Park
Median Income by Occupancy in Lakewood Park
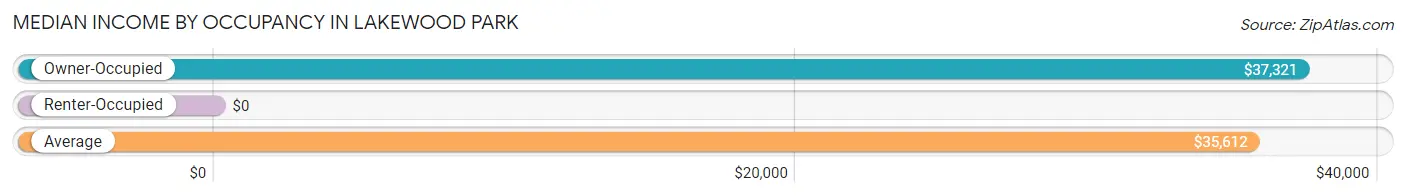
| Occupancy Type | # Households | Median Income |
| Owner-Occupied | 343 (77.9%) | $37,321 |
| Renter-Occupied | 97 (22.1%) | $0 |
| Average | 440 (100.0%) | $35,612 |
Occupancy by Householder Income Bracket in Lakewood Park
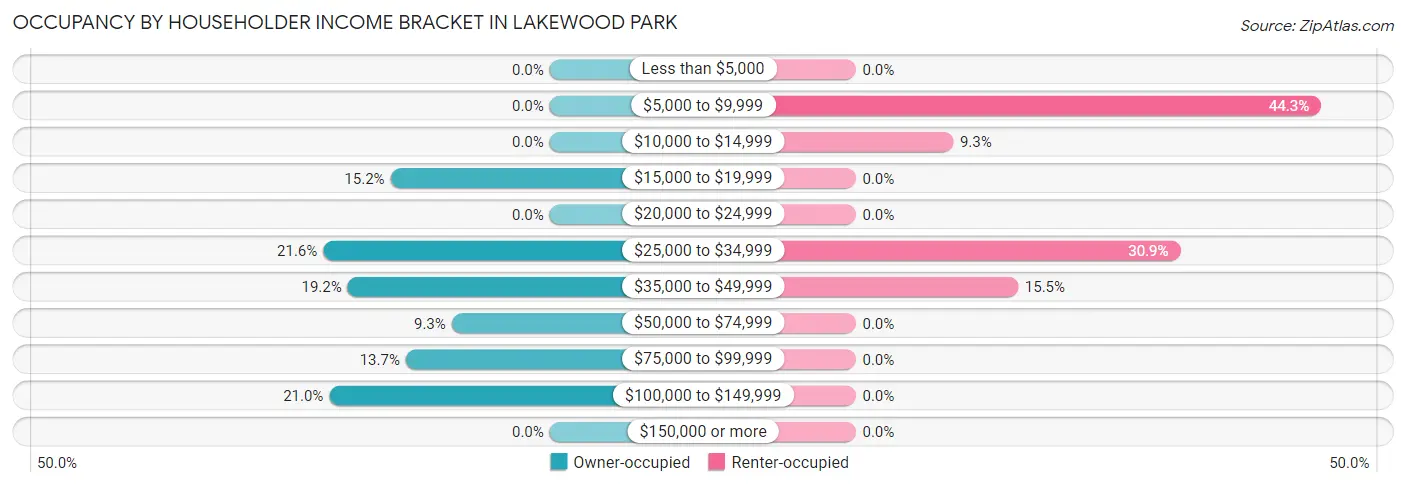
| Income Bracket | Owner-occupied | Renter-occupied |
| Less than $5,000 | 0 (0.0%) | 0 (0.0%) |
| $5,000 to $9,999 | 0 (0.0%) | 43 (44.3%) |
| $10,000 to $14,999 | 0 (0.0%) | 9 (9.3%) |
| $15,000 to $19,999 | 52 (15.2%) | 0 (0.0%) |
| $20,000 to $24,999 | 0 (0.0%) | 0 (0.0%) |
| $25,000 to $34,999 | 74 (21.6%) | 30 (30.9%) |
| $35,000 to $49,999 | 66 (19.2%) | 15 (15.5%) |
| $50,000 to $74,999 | 32 (9.3%) | 0 (0.0%) |
| $75,000 to $99,999 | 47 (13.7%) | 0 (0.0%) |
| $100,000 to $149,999 | 72 (21.0%) | 0 (0.0%) |
| $150,000 or more | 0 (0.0%) | 0 (0.0%) |
| Total | 343 (100.0%) | 97 (100.0%) |
Monthly Housing Cost Tiers in Lakewood Park
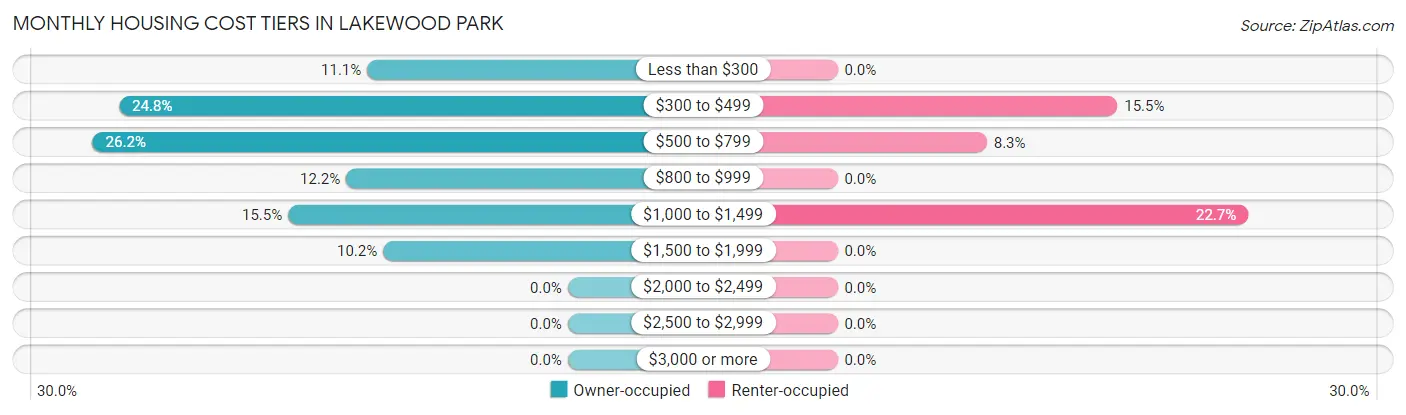
| Monthly Cost | Owner-occupied | Renter-occupied |
| Less than $300 | 38 (11.1%) | 0 (0.0%) |
| $300 to $499 | 85 (24.8%) | 15 (15.5%) |
| $500 to $799 | 90 (26.2%) | 8 (8.3%) |
| $800 to $999 | 42 (12.2%) | 0 (0.0%) |
| $1,000 to $1,499 | 53 (15.4%) | 22 (22.7%) |
| $1,500 to $1,999 | 35 (10.2%) | 0 (0.0%) |
| $2,000 to $2,499 | 0 (0.0%) | 0 (0.0%) |
| $2,500 to $2,999 | 0 (0.0%) | 0 (0.0%) |
| $3,000 or more | 0 (0.0%) | 0 (0.0%) |
| Total | 343 (100.0%) | 97 (100.0%) |
Physical Housing Characteristics in Lakewood Park
Housing Structures in Lakewood Park
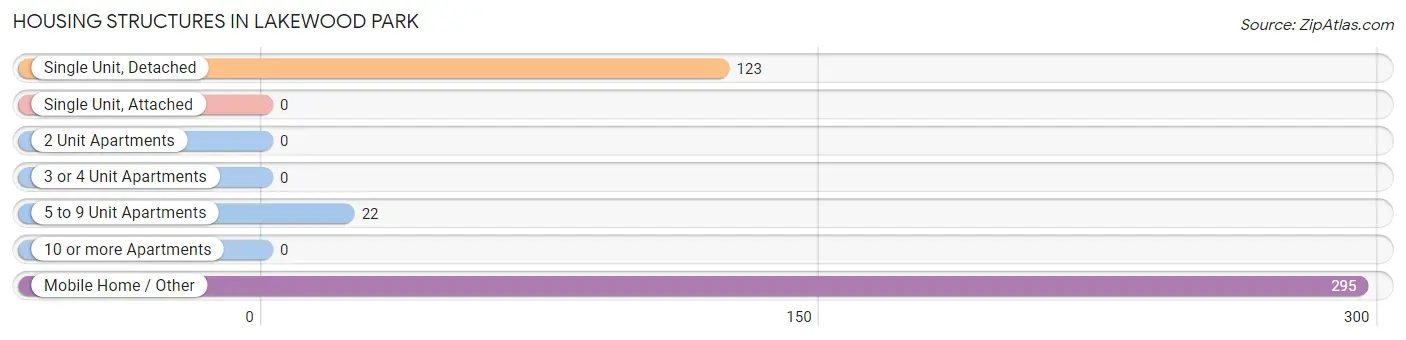
| Structure Type | # Housing Units | % Housing Units |
| Single Unit, Detached | 123 | 28.0% |
| Single Unit, Attached | 0 | 0.0% |
| 2 Unit Apartments | 0 | 0.0% |
| 3 or 4 Unit Apartments | 0 | 0.0% |
| 5 to 9 Unit Apartments | 22 | 5.0% |
| 10 or more Apartments | 0 | 0.0% |
| Mobile Home / Other | 295 | 67.0% |
| Total | 440 | 100.0% |
Housing Structures by Occupancy in Lakewood Park
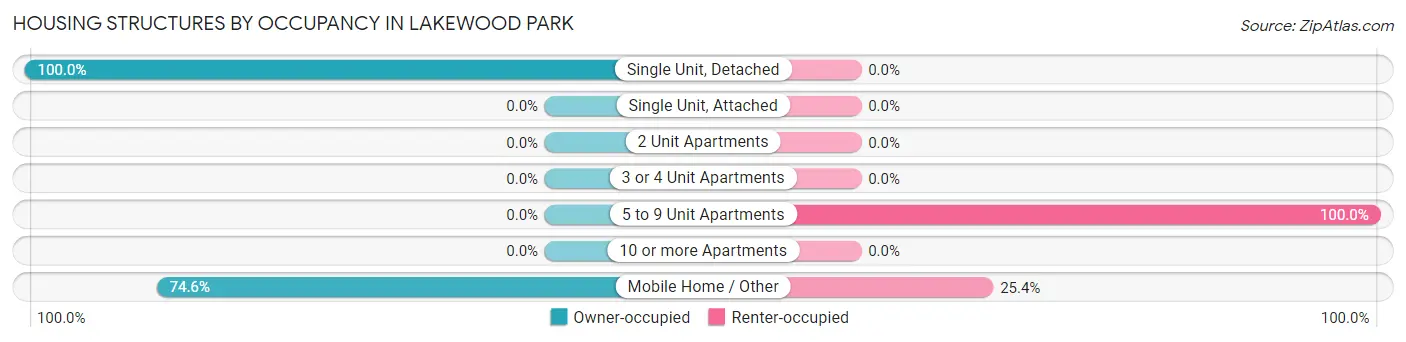
| Structure Type | Owner-occupied | Renter-occupied |
| Single Unit, Detached | 123 (100.0%) | 0 (0.0%) |
| Single Unit, Attached | 0 (0.0%) | 0 (0.0%) |
| 2 Unit Apartments | 0 (0.0%) | 0 (0.0%) |
| 3 or 4 Unit Apartments | 0 (0.0%) | 0 (0.0%) |
| 5 to 9 Unit Apartments | 0 (0.0%) | 22 (100.0%) |
| 10 or more Apartments | 0 (0.0%) | 0 (0.0%) |
| Mobile Home / Other | 220 (74.6%) | 75 (25.4%) |
| Total | 343 (77.9%) | 97 (22.1%) |
Housing Structures by Number of Rooms in Lakewood Park
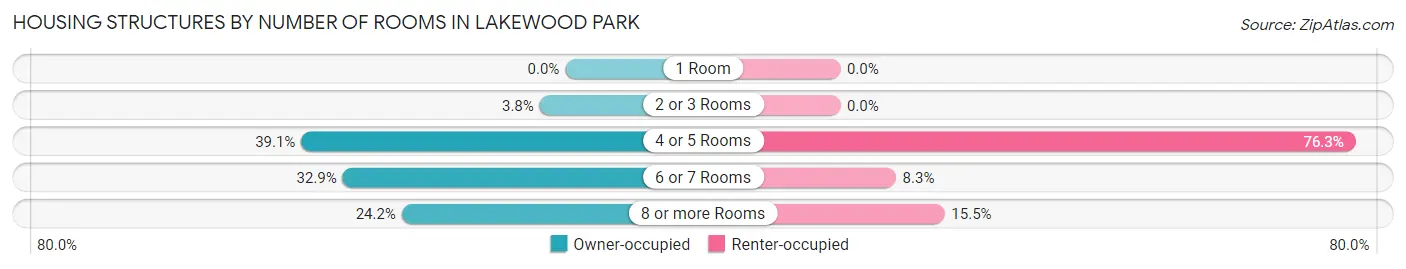
| Number of Rooms | Owner-occupied | Renter-occupied |
| 1 Room | 0 (0.0%) | 0 (0.0%) |
| 2 or 3 Rooms | 13 (3.8%) | 0 (0.0%) |
| 4 or 5 Rooms | 134 (39.1%) | 74 (76.3%) |
| 6 or 7 Rooms | 113 (32.9%) | 8 (8.3%) |
| 8 or more Rooms | 83 (24.2%) | 15 (15.5%) |
| Total | 343 (100.0%) | 97 (100.0%) |
Housing Structure by Heating Type in Lakewood Park
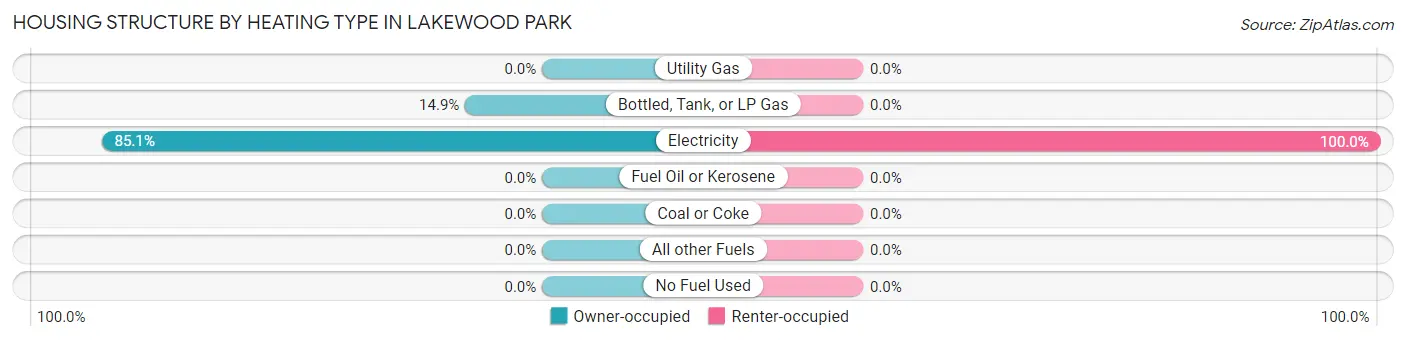
| Heating Type | Owner-occupied | Renter-occupied |
| Utility Gas | 0 (0.0%) | 0 (0.0%) |
| Bottled, Tank, or LP Gas | 51 (14.9%) | 0 (0.0%) |
| Electricity | 292 (85.1%) | 97 (100.0%) |
| Fuel Oil or Kerosene | 0 (0.0%) | 0 (0.0%) |
| Coal or Coke | 0 (0.0%) | 0 (0.0%) |
| All other Fuels | 0 (0.0%) | 0 (0.0%) |
| No Fuel Used | 0 (0.0%) | 0 (0.0%) |
| Total | 343 (100.0%) | 97 (100.0%) |
Household Vehicle Usage in Lakewood Park
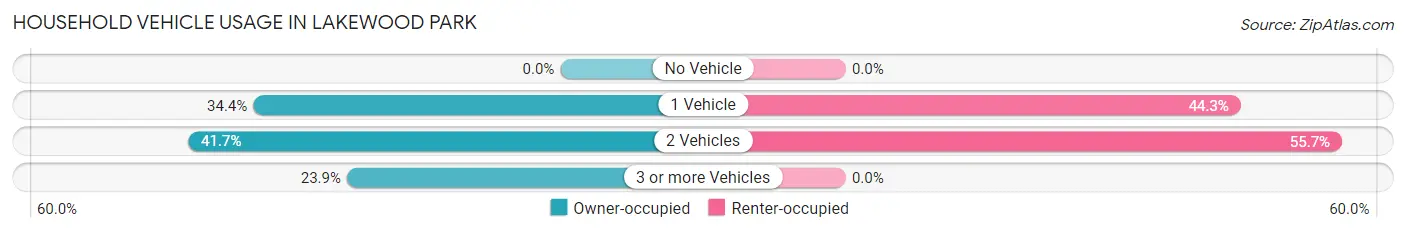
| Vehicles per Household | Owner-occupied | Renter-occupied |
| No Vehicle | 0 (0.0%) | 0 (0.0%) |
| 1 Vehicle | 118 (34.4%) | 43 (44.3%) |
| 2 Vehicles | 143 (41.7%) | 54 (55.7%) |
| 3 or more Vehicles | 82 (23.9%) | 0 (0.0%) |
| Total | 343 (100.0%) | 97 (100.0%) |
Real Estate & Mortgages in Lakewood Park
Real Estate and Mortgage Overview in Lakewood Park
| Characteristic | Without Mortgage | With Mortgage |
| Housing Units | 130 | 213 |
| Median Property Value | - | - |
| Median Household Income | $31,397 | $0 |
| Monthly Housing Costs | $338 | $0 |
| Real Estate Taxes | $519 | $17 |
Property Value by Mortgage Status in Lakewood Park
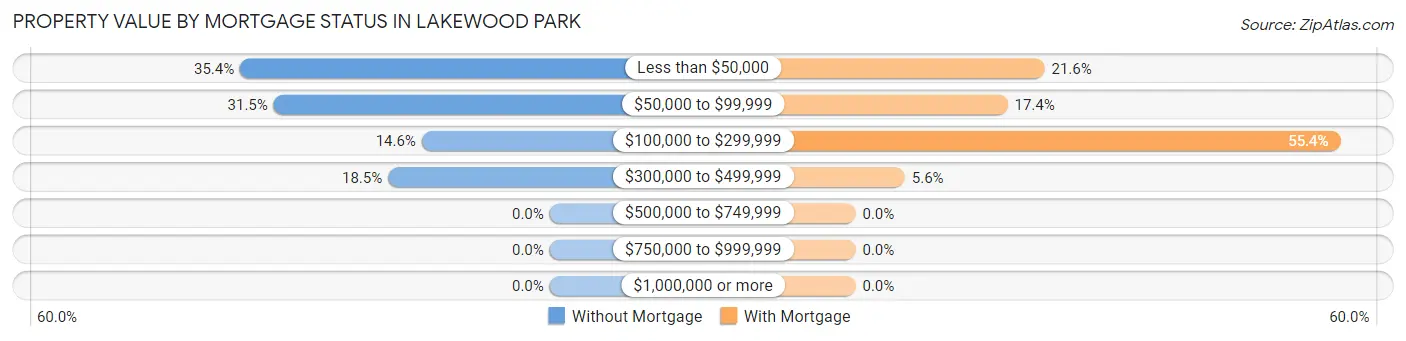
| Property Value | Without Mortgage | With Mortgage |
| Less than $50,000 | 46 (35.4%) | 46 (21.6%) |
| $50,000 to $99,999 | 41 (31.5%) | 37 (17.4%) |
| $100,000 to $299,999 | 19 (14.6%) | 118 (55.4%) |
| $300,000 to $499,999 | 24 (18.5%) | 12 (5.6%) |
| $500,000 to $749,999 | 0 (0.0%) | 0 (0.0%) |
| $750,000 to $999,999 | 0 (0.0%) | 0 (0.0%) |
| $1,000,000 or more | 0 (0.0%) | 0 (0.0%) |
| Total | 130 (100.0%) | 213 (100.0%) |
Household Income by Mortgage Status in Lakewood Park
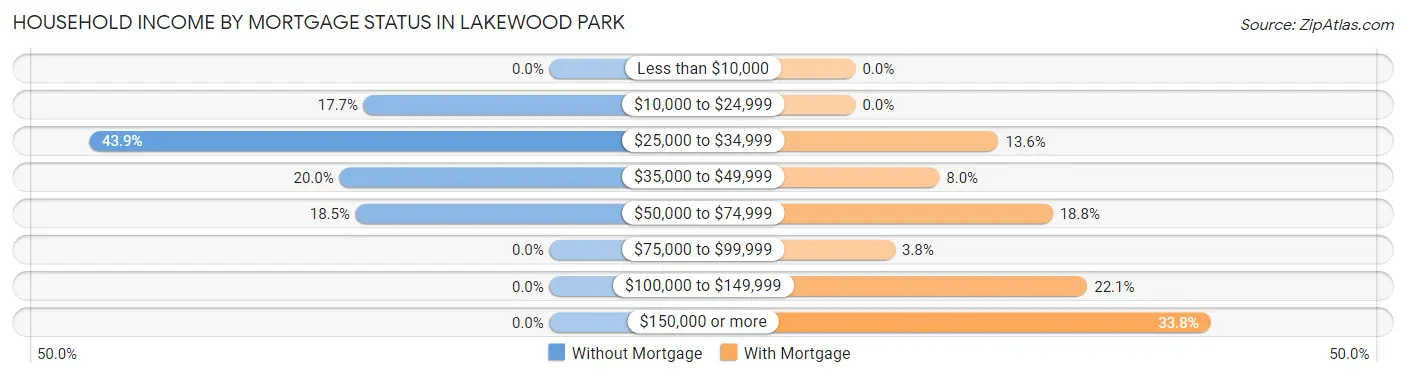
| Household Income | Without Mortgage | With Mortgage |
| Less than $10,000 | 0 (0.0%) | 0 (0.0%) |
| $10,000 to $24,999 | 23 (17.7%) | 0 (0.0%) |
| $25,000 to $34,999 | 57 (43.9%) | 29 (13.6%) |
| $35,000 to $49,999 | 26 (20.0%) | 17 (8.0%) |
| $50,000 to $74,999 | 24 (18.5%) | 40 (18.8%) |
| $75,000 to $99,999 | 0 (0.0%) | 8 (3.8%) |
| $100,000 to $149,999 | 0 (0.0%) | 47 (22.1%) |
| $150,000 or more | 0 (0.0%) | 72 (33.8%) |
| Total | 130 (100.0%) | 213 (100.0%) |
Property Value to Household Income Ratio in Lakewood Park
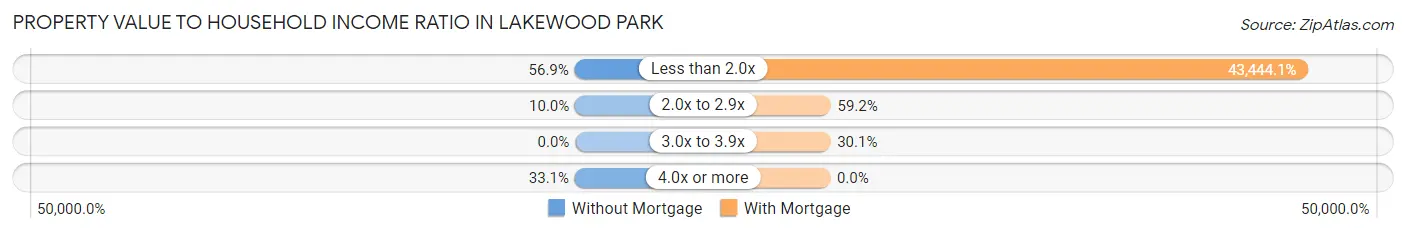
| Value-to-Income Ratio | Without Mortgage | With Mortgage |
| Less than 2.0x | 74 (56.9%) | 92,536 (43,444.1%) |
| 2.0x to 2.9x | 13 (10.0%) | 126 (59.2%) |
| 3.0x to 3.9x | 0 (0.0%) | 64 (30.0%) |
| 4.0x or more | 43 (33.1%) | 0 (0.0%) |
| Total | 130 (100.0%) | 213 (100.0%) |
Real Estate Taxes by Mortgage Status in Lakewood Park
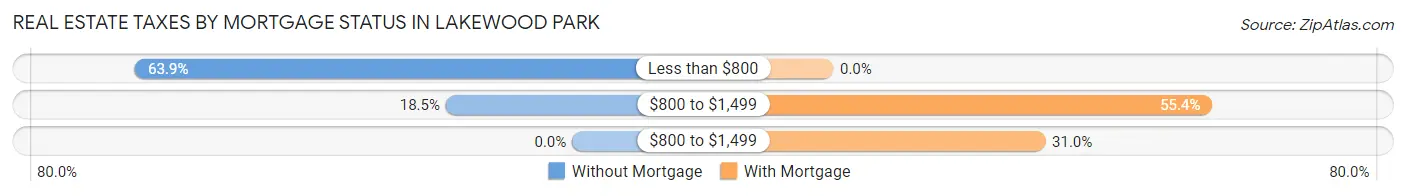
| Property Taxes | Without Mortgage | With Mortgage |
| Less than $800 | 83 (63.8%) | 0 (0.0%) |
| $800 to $1,499 | 24 (18.5%) | 118 (55.4%) |
| $800 to $1,499 | 0 (0.0%) | 66 (31.0%) |
| Total | 130 (100.0%) | 213 (100.0%) |
Health & Disability in Lakewood Park
Health Insurance Coverage by Age in Lakewood Park
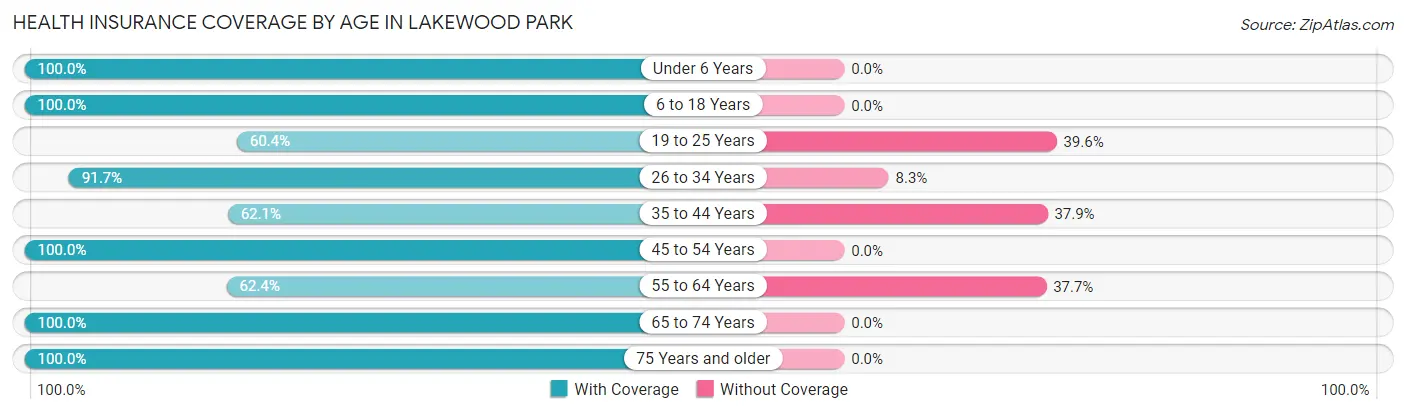
| Age Bracket | With Coverage | Without Coverage |
| Under 6 Years | 47 (100.0%) | 0 (0.0%) |
| 6 to 18 Years | 61 (100.0%) | 0 (0.0%) |
| 19 to 25 Years | 113 (60.4%) | 74 (39.6%) |
| 26 to 34 Years | 100 (91.7%) | 9 (8.3%) |
| 35 to 44 Years | 41 (62.1%) | 25 (37.9%) |
| 45 to 54 Years | 123 (100.0%) | 0 (0.0%) |
| 55 to 64 Years | 154 (62.4%) | 93 (37.7%) |
| 65 to 74 Years | 164 (100.0%) | 0 (0.0%) |
| 75 Years and older | 66 (100.0%) | 0 (0.0%) |
| Total | 869 (81.2%) | 201 (18.8%) |
Health Insurance Coverage by Citizenship Status in Lakewood Park
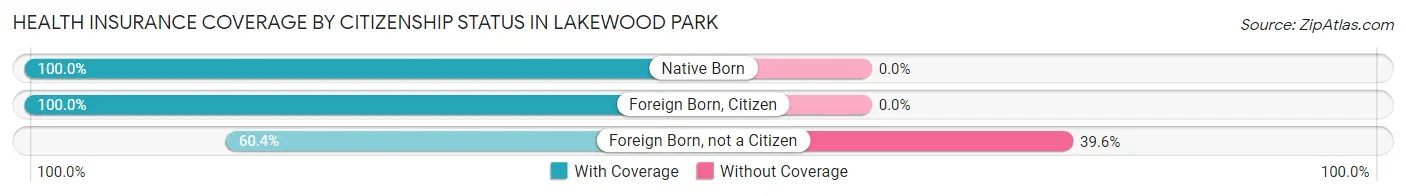
| Citizenship Status | With Coverage | Without Coverage |
| Native Born | 47 (100.0%) | 0 (0.0%) |
| Foreign Born, Citizen | 61 (100.0%) | 0 (0.0%) |
| Foreign Born, not a Citizen | 113 (60.4%) | 74 (39.6%) |
Health Insurance Coverage by Household Income in Lakewood Park
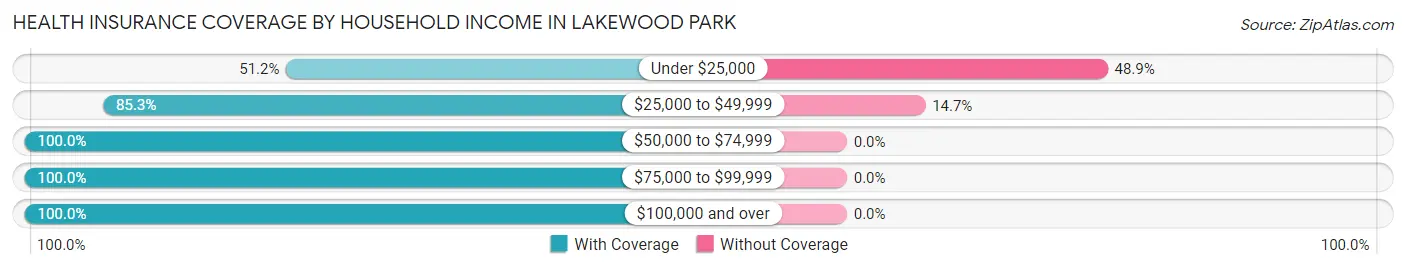
| Household Income | With Coverage | Without Coverage |
| Under $25,000 | 134 (51.1%) | 128 (48.8%) |
| $25,000 to $49,999 | 424 (85.3%) | 73 (14.7%) |
| $50,000 to $74,999 | 41 (100.0%) | 0 (0.0%) |
| $75,000 to $99,999 | 57 (100.0%) | 0 (0.0%) |
| $100,000 and over | 213 (100.0%) | 0 (0.0%) |
Public vs Private Health Insurance Coverage by Age in Lakewood Park
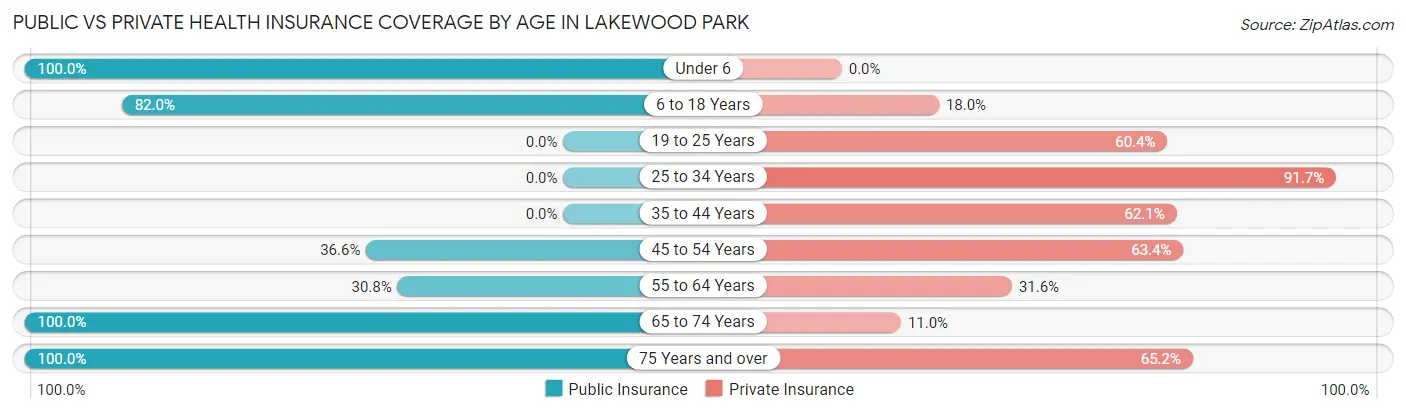
| Age Bracket | Public Insurance | Private Insurance |
| Under 6 | 47 (100.0%) | 0 (0.0%) |
| 6 to 18 Years | 50 (82.0%) | 11 (18.0%) |
| 19 to 25 Years | 0 (0.0%) | 113 (60.4%) |
| 25 to 34 Years | 0 (0.0%) | 100 (91.7%) |
| 35 to 44 Years | 0 (0.0%) | 41 (62.1%) |
| 45 to 54 Years | 45 (36.6%) | 78 (63.4%) |
| 55 to 64 Years | 76 (30.8%) | 78 (31.6%) |
| 65 to 74 Years | 164 (100.0%) | 18 (11.0%) |
| 75 Years and over | 66 (100.0%) | 43 (65.1%) |
| Total | 448 (41.9%) | 482 (45.1%) |
Disability Status by Sex by Age in Lakewood Park
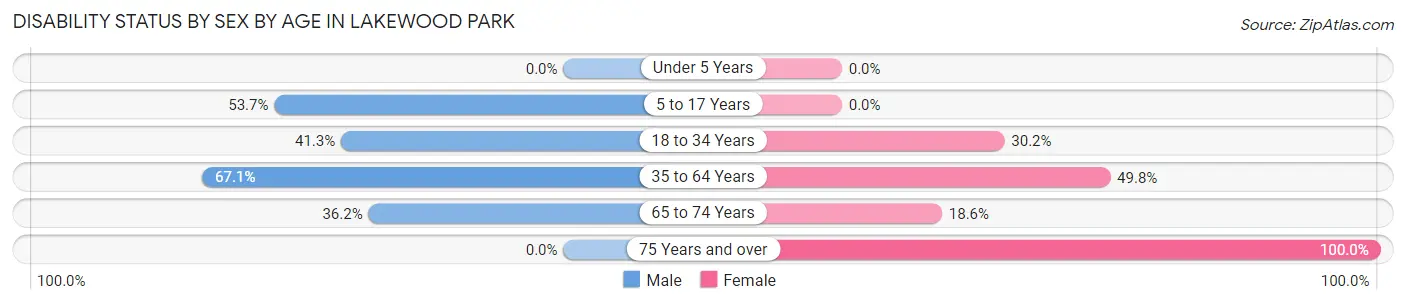
| Age Bracket | Male | Female |
| Under 5 Years | 0 (0.0%) | 0 (0.0%) |
| 5 to 17 Years | 22 (53.7%) | 0 (0.0%) |
| 18 to 34 Years | 52 (41.3%) | 54 (30.2%) |
| 35 to 64 Years | 112 (67.1%) | 134 (49.8%) |
| 65 to 74 Years | 34 (36.2%) | 13 (18.6%) |
| 75 Years and over | 0 (0.0%) | 43 (100.0%) |
Disability Class by Sex by Age in Lakewood Park
Disability Class: Hearing Difficulty
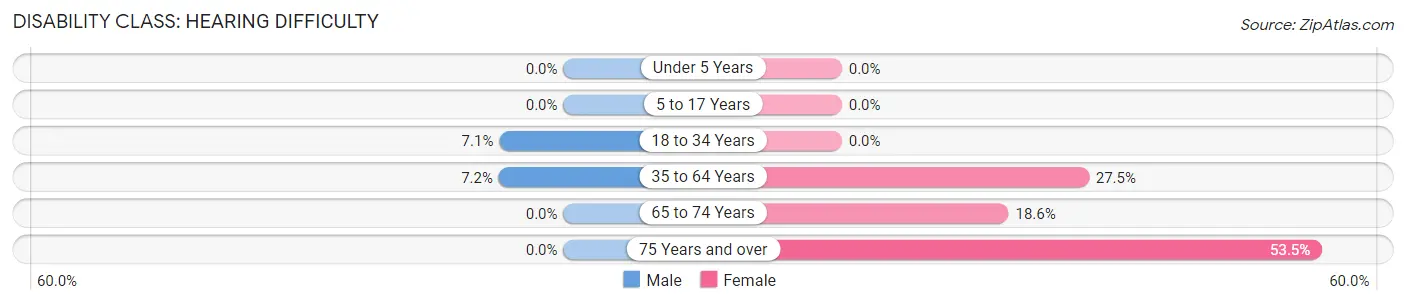
| Age Bracket | Male | Female |
| Under 5 Years | 0 (0.0%) | 0 (0.0%) |
| 5 to 17 Years | 0 (0.0%) | 0 (0.0%) |
| 18 to 34 Years | 9 (7.1%) | 0 (0.0%) |
| 35 to 64 Years | 12 (7.2%) | 74 (27.5%) |
| 65 to 74 Years | 0 (0.0%) | 13 (18.6%) |
| 75 Years and over | 0 (0.0%) | 23 (53.5%) |
Disability Class: Vision Difficulty
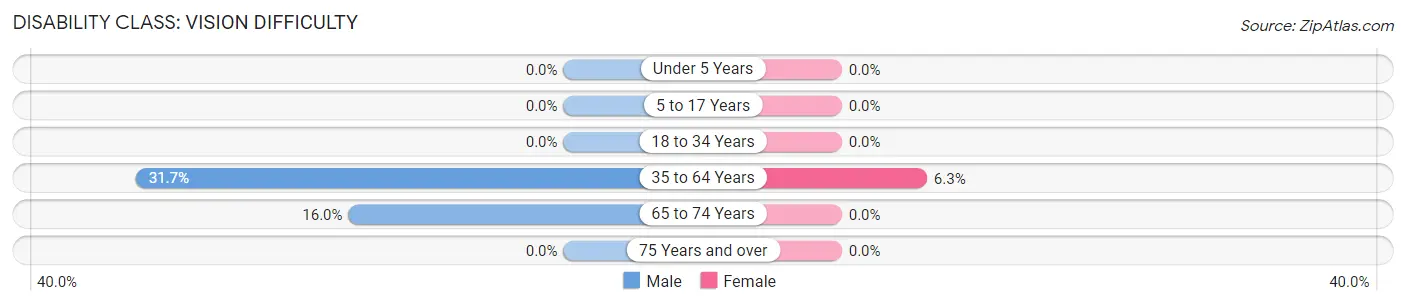
| Age Bracket | Male | Female |
| Under 5 Years | 0 (0.0%) | 0 (0.0%) |
| 5 to 17 Years | 0 (0.0%) | 0 (0.0%) |
| 18 to 34 Years | 0 (0.0%) | 0 (0.0%) |
| 35 to 64 Years | 53 (31.7%) | 17 (6.3%) |
| 65 to 74 Years | 15 (16.0%) | 0 (0.0%) |
| 75 Years and over | 0 (0.0%) | 0 (0.0%) |
Disability Class: Cognitive Difficulty
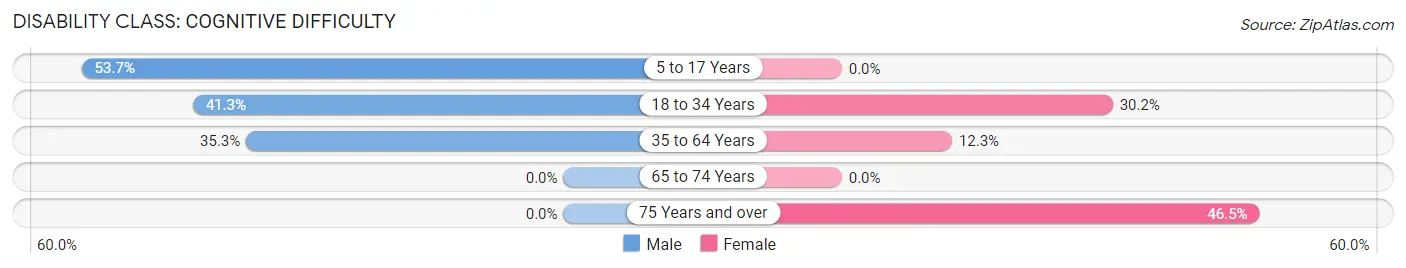
| Age Bracket | Male | Female |
| 5 to 17 Years | 22 (53.7%) | 0 (0.0%) |
| 18 to 34 Years | 52 (41.3%) | 54 (30.2%) |
| 35 to 64 Years | 59 (35.3%) | 33 (12.3%) |
| 65 to 74 Years | 0 (0.0%) | 0 (0.0%) |
| 75 Years and over | 0 (0.0%) | 20 (46.5%) |
Disability Class: Ambulatory Difficulty
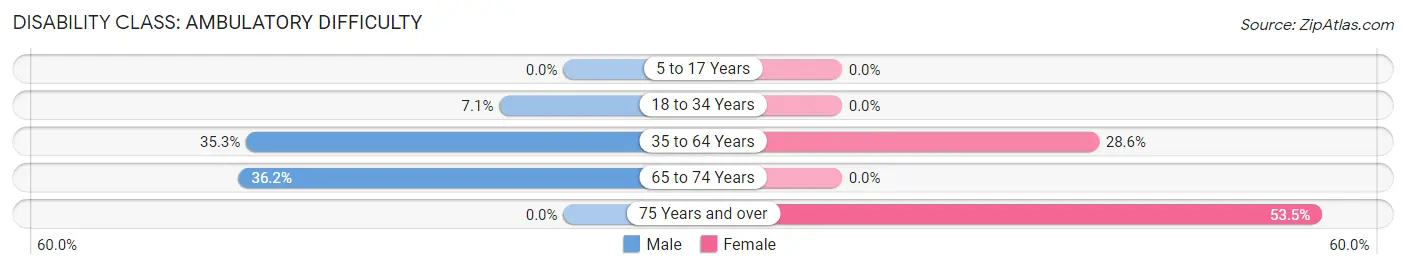
| Age Bracket | Male | Female |
| 5 to 17 Years | 0 (0.0%) | 0 (0.0%) |
| 18 to 34 Years | 9 (7.1%) | 0 (0.0%) |
| 35 to 64 Years | 59 (35.3%) | 77 (28.6%) |
| 65 to 74 Years | 34 (36.2%) | 0 (0.0%) |
| 75 Years and over | 0 (0.0%) | 23 (53.5%) |
Disability Class: Self-Care Difficulty
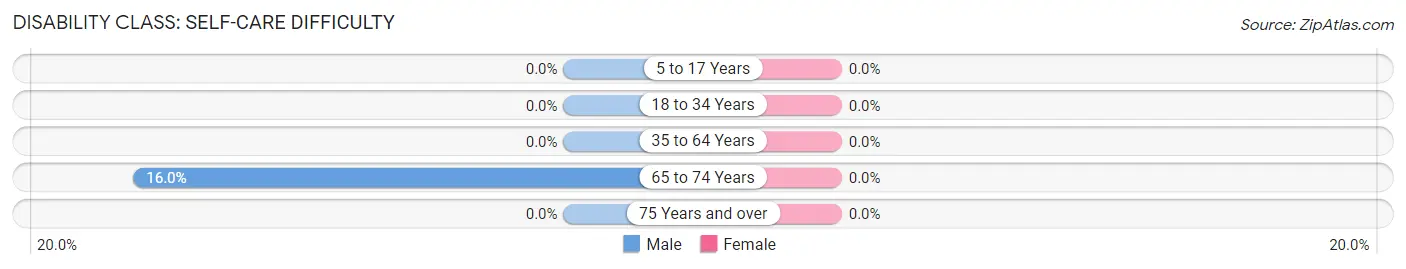
| Age Bracket | Male | Female |
| 5 to 17 Years | 0 (0.0%) | 0 (0.0%) |
| 18 to 34 Years | 0 (0.0%) | 0 (0.0%) |
| 35 to 64 Years | 0 (0.0%) | 0 (0.0%) |
| 65 to 74 Years | 15 (16.0%) | 0 (0.0%) |
| 75 Years and over | 0 (0.0%) | 0 (0.0%) |
Technology Access in Lakewood Park
Computing Device Access in Lakewood Park
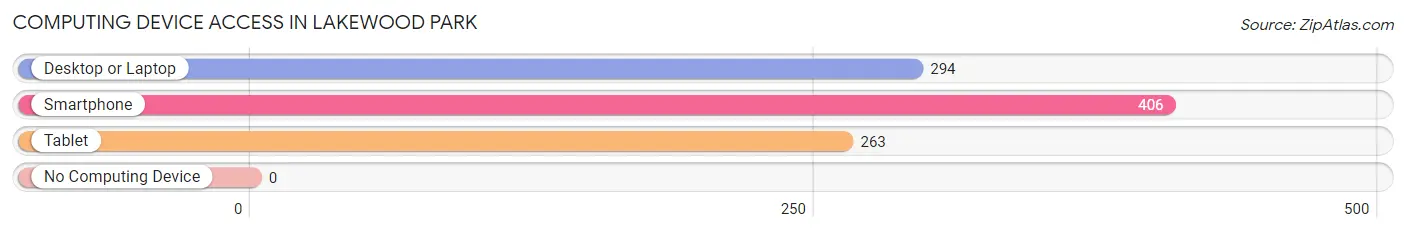
| Device Type | # Households | % Households |
| Desktop or Laptop | 294 | 66.8% |
| Smartphone | 406 | 92.3% |
| Tablet | 263 | 59.8% |
| No Computing Device | 0 | 0.0% |
| Total | 440 | 100.0% |
Internet Access in Lakewood Park
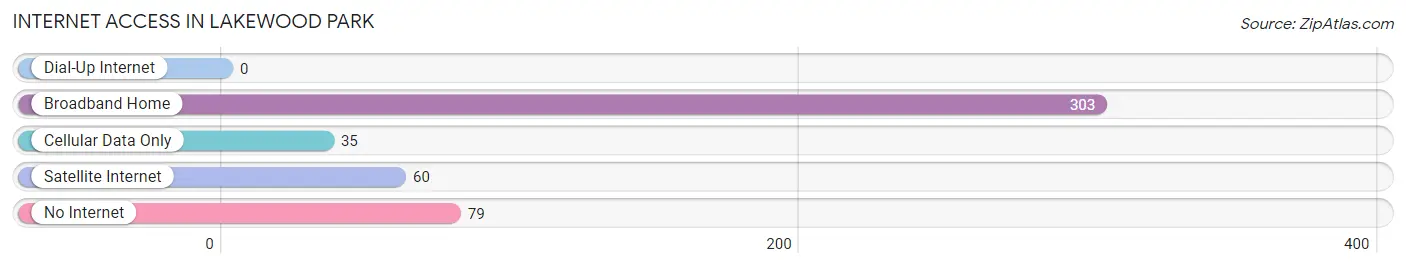
| Internet Type | # Households | % Households |
| Dial-Up Internet | 0 | 0.0% |
| Broadband Home | 303 | 68.9% |
| Cellular Data Only | 35 | 8.0% |
| Satellite Internet | 60 | 13.6% |
| No Internet | 79 | 17.9% |
| Total | 440 | 100.0% |
Lakewood Park Summary
Introduction
Located in the state of Tennessee, Lakewood Park is a small town with a population of just over 1,000 people. It is situated in the foothills of the Appalachian Mountains and is surrounded by lush forests and rolling hills. The town is known for its picturesque views and its close proximity to the Great Smoky Mountains National Park. The town has a rich history, with its roots dating back to the early 1800s. It has a diverse economy, with a variety of industries and businesses, and a diverse population. This paper will explore the history, geography, economy and demographics of Lakewood Park, TN.
History
The history of Lakewood Park dates back to the early 1800s, when the area was first settled by settlers from North Carolina. The town was originally known as “Lakewood” and was a small farming community. In the late 1800s, the town was renamed “Lakewood Park” and began to grow and develop. The town was incorporated in 1891 and was home to a variety of businesses, including a sawmill, a grist mill, a general store, and a post office.
The town experienced a period of growth in the early 1900s, with the construction of a railroad line and the opening of a number of businesses. The town was also home to a number of churches, including the First Baptist Church, which was founded in 1891. The town experienced a period of decline in the mid-1900s, as many of the businesses closed and the population decreased. However, the town has experienced a resurgence in recent years, with the opening of new businesses and the development of new housing.
Geography
Lakewood Park is located in the foothills of the Appalachian Mountains in eastern Tennessee. The town is situated in a valley, surrounded by rolling hills and lush forests. The town is located near the Great Smoky Mountains National Park, which is one of the most visited national parks in the United States. The town is also located near the Cherokee National Forest, which is home to a variety of wildlife and plants.
The town is located in the Eastern Time Zone and has a humid subtropical climate, with hot summers and mild winters. The average annual temperature is around 60 degrees Fahrenheit, with an average high of around 80 degrees in the summer and an average low of around 40 degrees in the winter. The town receives an average of around 50 inches of precipitation per year.
Economy
The economy of Lakewood Park is diverse, with a variety of industries and businesses. The town is home to a number of small businesses, including restaurants, retail stores, and service providers. The town is also home to a number of manufacturing companies, including a furniture manufacturer and a plastics manufacturer. The town is also home to a number of agricultural businesses, including a dairy farm and a vegetable farm.
The town is also home to a number of tourist attractions, including the Great Smoky Mountains National Park and the Cherokee National Forest. The town is also home to a number of outdoor recreation activities, including hiking, fishing, and camping.
Demographics
As of the 2010 census, the population of Lakewood Park was 1,072. The population is predominantly white, with a small percentage of African Americans and Hispanics. The median age of the population is 44.7 years, with a median household income of $41,250. The town has a low unemployment rate, with only 4.2% of the population unemployed.
Conclusion
Lakewood Park, TN is a small town with a rich history and a diverse economy. The town is located in the foothills of the Appalachian Mountains and is surrounded by lush forests and rolling hills. The town has a diverse population, with a variety of industries and businesses. The town is also home to a number of tourist attractions and outdoor recreation activities. The town has a low unemployment rate and a median household income of $41,250.
Common Questions
What is Per Capita Income in Lakewood Park?
Per Capita income in Lakewood Park is $22,884.
What is the Median Family Income in Lakewood Park?
Median Family Income in Lakewood Park is $30,703.
What is the Median Household income in Lakewood Park?
Median Household Income in Lakewood Park is $35,612.
What is Income or Wage Gap in Lakewood Park?
Income or Wage Gap in Lakewood Park is 78.1%.
Women in Lakewood Park earn 21.9 cents for every dollar earned by a man.
What is Inequality or Gini Index in Lakewood Park?
Inequality or Gini Index in Lakewood Park is 0.42.
What is the Total Population of Lakewood Park?
Total Population of Lakewood Park is 1,070.
What is the Total Male Population of Lakewood Park?
Total Male Population of Lakewood Park is 480.
What is the Total Female Population of Lakewood Park?
Total Female Population of Lakewood Park is 590.
What is the Ratio of Males per 100 Females in Lakewood Park?
There are 81.36 Males per 100 Females in Lakewood Park.
What is the Ratio of Females per 100 Males in Lakewood Park?
There are 122.92 Females per 100 Males in Lakewood Park.
What is the Median Population Age in Lakewood Park?
Median Population Age in Lakewood Park is 54.2 Years.
What is the Average Family Size in Lakewood Park
Average Family Size in Lakewood Park is 2.8 People.
What is the Average Household Size in Lakewood Park
Average Household Size in Lakewood Park is 2.4 People.
How Large is the Labor Force in Lakewood Park?
There are 419 People in the Labor Forcein in Lakewood Park.
What is the Percentage of People in the Labor Force in Lakewood Park?
43.2% of People are in the Labor Force in Lakewood Park.
What is the Unemployment Rate in Lakewood Park?
Unemployment Rate in Lakewood Park is 6.0%.