Jasper, TN Map & Demographics
Jasper Map
Jasper Overview
$30,074
PER CAPITA INCOME
$82,118
AVG FAMILY INCOME
$58,971
AVG HOUSEHOLD INCOME
5.3%
WAGE / INCOME GAP [ % ]
94.7¢/ $1
WAGE / INCOME GAP [ $ ]
0.44
INEQUALITY / GINI INDEX
3,592
TOTAL POPULATION
1,610
MALE POPULATION
1,982
FEMALE POPULATION
81.23
MALES / 100 FEMALES
123.11
FEMALES / 100 MALES
36.9
MEDIAN AGE
2.9
AVG FAMILY SIZE
2.5
AVG HOUSEHOLD SIZE
1,610
LABOR FORCE [ PEOPLE ]
56.3%
PERCENT IN LABOR FORCE
2.7%
UNEMPLOYMENT RATE
Jasper Zip Codes
Jasper Area Codes
Income in Jasper
Income Overview in Jasper
Per Capita Income in Jasper is $30,074, while median incomes of families and households are $82,118 and $58,971 respectively.
| Characteristic | Number | Measure |
| Per Capita Income | 3,592 | $30,074 |
| Median Family Income | 968 | $82,118 |
| Mean Family Income | 968 | $91,338 |
| Median Household Income | 1,420 | $58,971 |
| Mean Household Income | 1,420 | $73,969 |
| Income Deficit | 968 | $0 |
| Wage / Income Gap (%) | 3,592 | 5.33% |
| Wage / Income Gap ($) | 3,592 | 94.67¢ per $1 |
| Gini / Inequality Index | 3,592 | 0.44 |
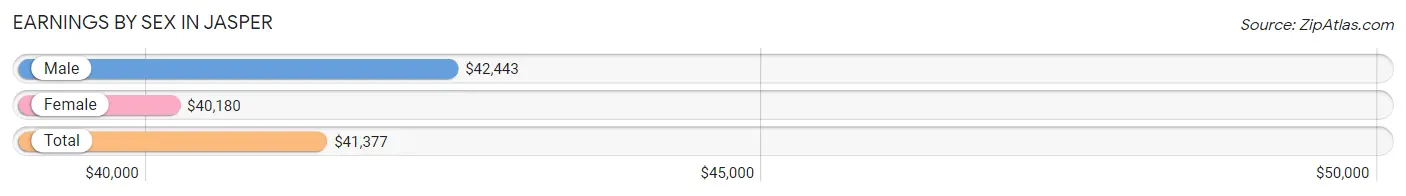
Earnings by Sex in Jasper
Average Earnings in Jasper are $41,377, $42,443 for men and $40,180 for women, a difference of 5.3%.
| Sex | Number | Average Earnings |
| Male | 963 (57.0%) | $42,443 |
| Female | 726 (43.0%) | $40,180 |
| Total | 1,689 (100.0%) | $41,377 |
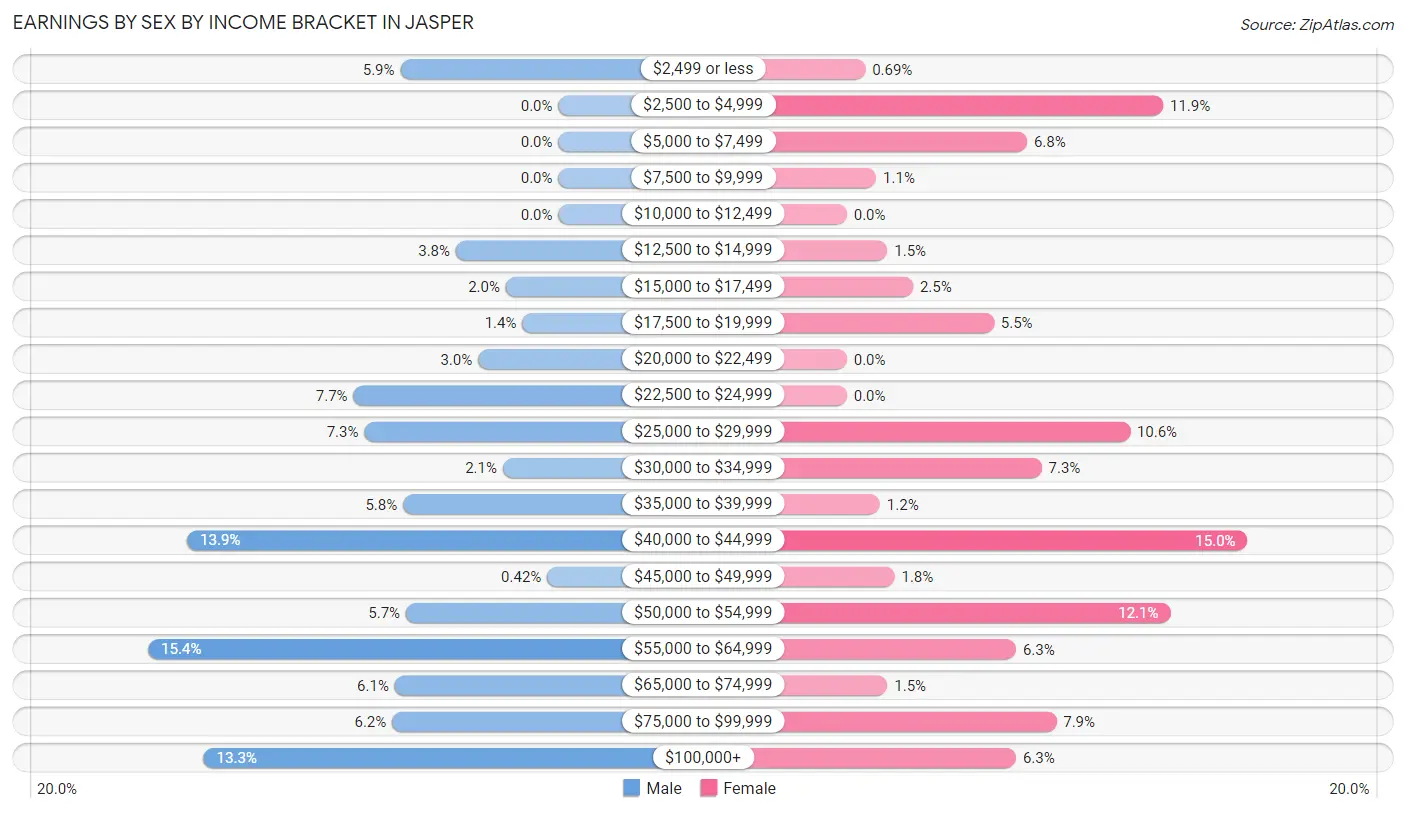
Earnings by Sex by Income Bracket in Jasper
The most common earnings brackets in Jasper are $55,000 to $64,999 for men (148 | 15.4%) and $40,000 to $44,999 for women (109 | 15.0%).
| Income | Male | Female |
| $2,499 or less | 57 (5.9%) | 5 (0.7%) |
| $2,500 to $4,999 | 0 (0.0%) | 86 (11.8%) |
| $5,000 to $7,499 | 0 (0.0%) | 49 (6.8%) |
| $7,500 to $9,999 | 0 (0.0%) | 8 (1.1%) |
| $10,000 to $12,499 | 0 (0.0%) | 0 (0.0%) |
| $12,500 to $14,999 | 37 (3.8%) | 11 (1.5%) |
| $15,000 to $17,499 | 19 (2.0%) | 18 (2.5%) |
| $17,500 to $19,999 | 13 (1.3%) | 40 (5.5%) |
| $20,000 to $22,499 | 29 (3.0%) | 0 (0.0%) |
| $22,500 to $24,999 | 74 (7.7%) | 0 (0.0%) |
| $25,000 to $29,999 | 70 (7.3%) | 77 (10.6%) |
| $30,000 to $34,999 | 20 (2.1%) | 53 (7.3%) |
| $35,000 to $39,999 | 56 (5.8%) | 9 (1.2%) |
| $40,000 to $44,999 | 134 (13.9%) | 109 (15.0%) |
| $45,000 to $49,999 | 4 (0.4%) | 13 (1.8%) |
| $50,000 to $54,999 | 55 (5.7%) | 88 (12.1%) |
| $55,000 to $64,999 | 148 (15.4%) | 46 (6.3%) |
| $65,000 to $74,999 | 59 (6.1%) | 11 (1.5%) |
| $75,000 to $99,999 | 60 (6.2%) | 57 (7.9%) |
| $100,000+ | 128 (13.3%) | 46 (6.3%) |
| Total | 963 (100.0%) | 726 (100.0%) |
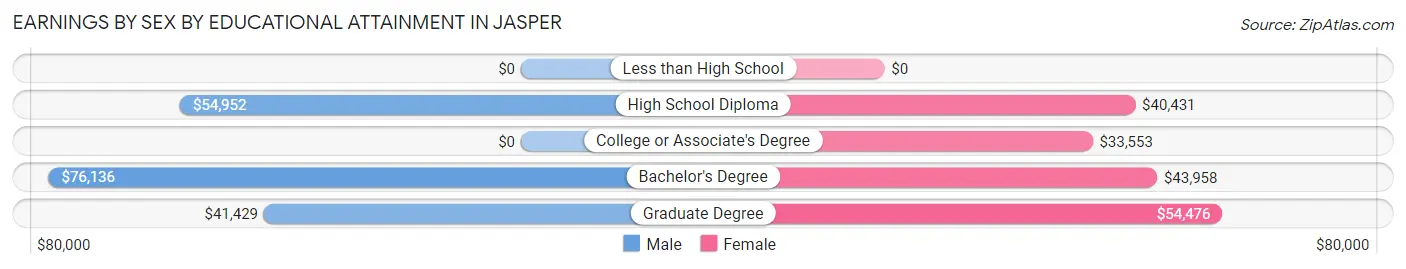
Earnings by Sex by Educational Attainment in Jasper
Average earnings in Jasper are $53,125 for men and $41,469 for women, a difference of 21.9%. Men with an educational attainment of bachelor's degree enjoy the highest average annual earnings of $76,136, while those with graduate degree education earn the least with $41,429. Women with an educational attainment of graduate degree earn the most with the average annual earnings of $54,476, while those with college or associate's degree education have the smallest earnings of $33,553.
| Educational Attainment | Male Income | Female Income |
| Less than High School | - | - |
| High School Diploma | $54,952 | $40,431 |
| College or Associate's Degree | - | - |
| Bachelor's Degree | $76,136 | $43,958 |
| Graduate Degree | $41,429 | $54,476 |
| Total | $53,125 | $41,469 |
Family Income in Jasper
Family Income Brackets in Jasper
According to the Jasper family income data, there are 205 families falling into the $100,000 to $149,999 income range, which is the most common income bracket and makes up 21.2% of all families. Conversely, the $15,000 to $24,999 income bracket is the least frequent group with only 19 families (2.0%) belonging to this category.
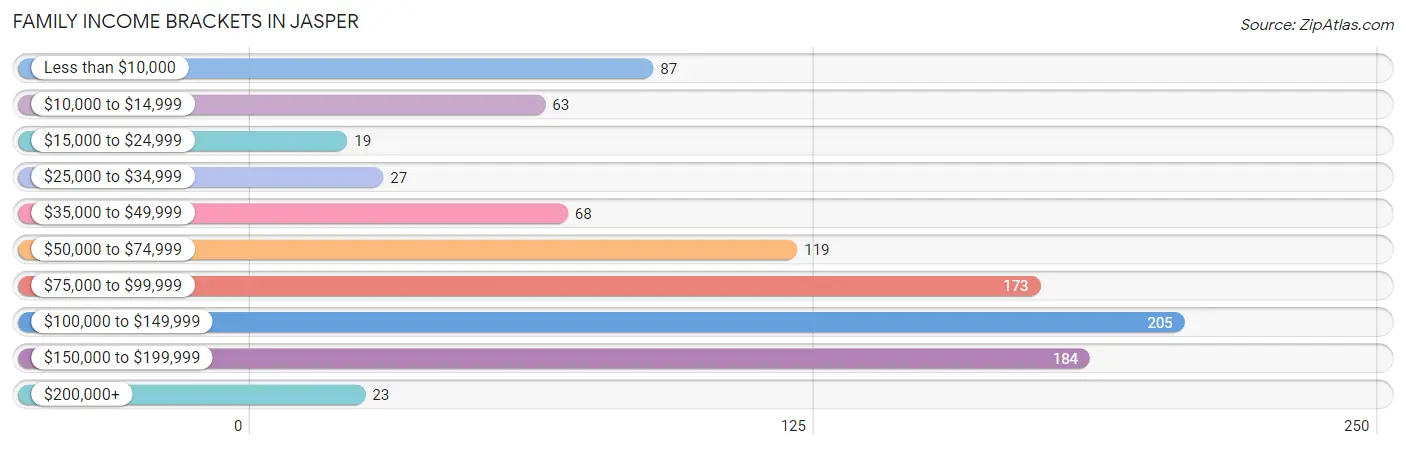
| Income Bracket | # Families | % Families |
| Less than $10,000 | 87 | 9.0% |
| $10,000 to $14,999 | 63 | 6.5% |
| $15,000 to $24,999 | 19 | 2.0% |
| $25,000 to $34,999 | 27 | 2.8% |
| $35,000 to $49,999 | 68 | 7.0% |
| $50,000 to $74,999 | 119 | 12.3% |
| $75,000 to $99,999 | 173 | 17.9% |
| $100,000 to $149,999 | 205 | 21.2% |
| $150,000 to $199,999 | 184 | 19.0% |
| $200,000+ | 23 | 2.4% |
Family Income by Famaliy Size in Jasper
4-person families (95 | 9.8%) account for the highest median family income in Jasper with $133,618 per family, while 3-person families (238 | 24.6%) have the highest median income of $37,955 per family member.
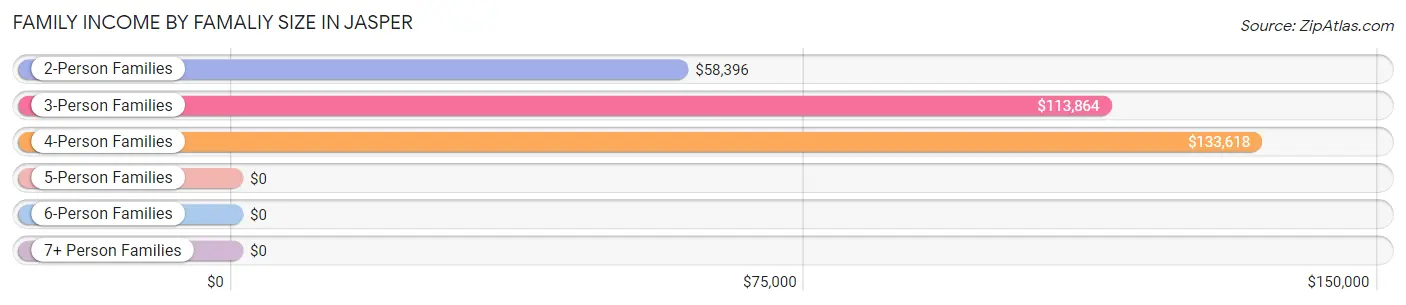
| Income Bracket | # Families | Median Income |
| 2-Person Families | 512 (52.9%) | $58,396 |
| 3-Person Families | 238 (24.6%) | $113,864 |
| 4-Person Families | 95 (9.8%) | $133,618 |
| 5-Person Families | 114 (11.8%) | $0 |
| 6-Person Families | 0 (0.0%) | $0 |
| 7+ Person Families | 9 (0.9%) | $0 |
| Total | 968 (100.0%) | $82,118 |
Family Income by Number of Earners in Jasper
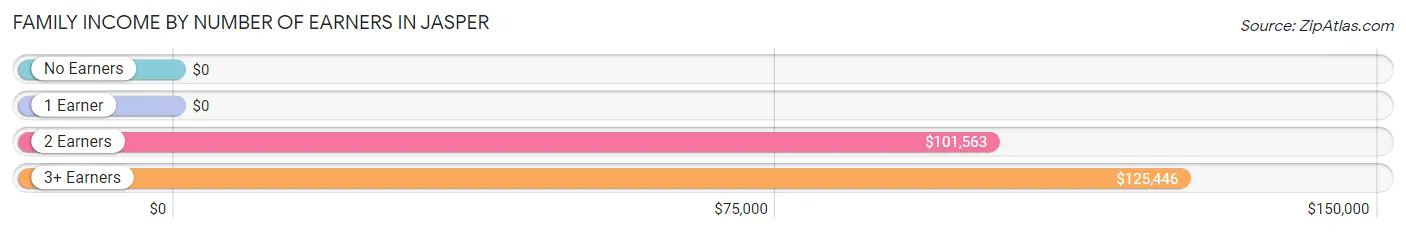
| Number of Earners | # Families | Median Income |
| No Earners | 212 (21.9%) | $0 |
| 1 Earner | 300 (31.0%) | $0 |
| 2 Earners | 369 (38.1%) | $101,563 |
| 3+ Earners | 87 (9.0%) | $125,446 |
| Total | 968 (100.0%) | $82,118 |
Household Income in Jasper
Household Income Brackets in Jasper
With 302 households falling in the category, the $100,000 to $149,999 income range is the most frequent in Jasper, accounting for 21.3% of all households. In contrast, only 23 households (1.6%) fall into the $200,000+ income bracket, making it the least populous group.
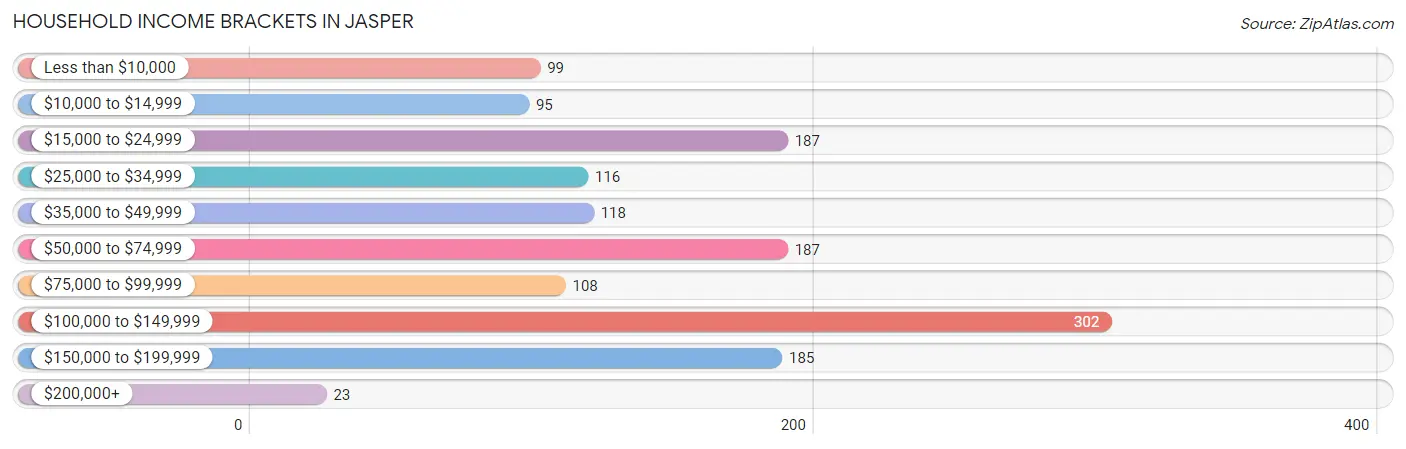
| Income Bracket | # Households | % Households |
| Less than $10,000 | 99 | 7.0% |
| $10,000 to $14,999 | 95 | 6.7% |
| $15,000 to $24,999 | 187 | 13.2% |
| $25,000 to $34,999 | 116 | 8.2% |
| $35,000 to $49,999 | 118 | 8.3% |
| $50,000 to $74,999 | 187 | 13.2% |
| $75,000 to $99,999 | 108 | 7.6% |
| $100,000 to $149,999 | 302 | 21.3% |
| $150,000 to $199,999 | 185 | 13.0% |
| $200,000+ | 23 | 1.6% |
Household Income by Householder Age in Jasper
The median household income in Jasper is $58,971, with the highest median household income of $125,044 found in the 25 to 44 years age bracket for the primary householder. A total of 452 households (31.8%) fall into this category. Meanwhile, the 15 to 24 years age bracket for the primary householder has the lowest median household income of $0, with 122 households (8.6%) in this group.
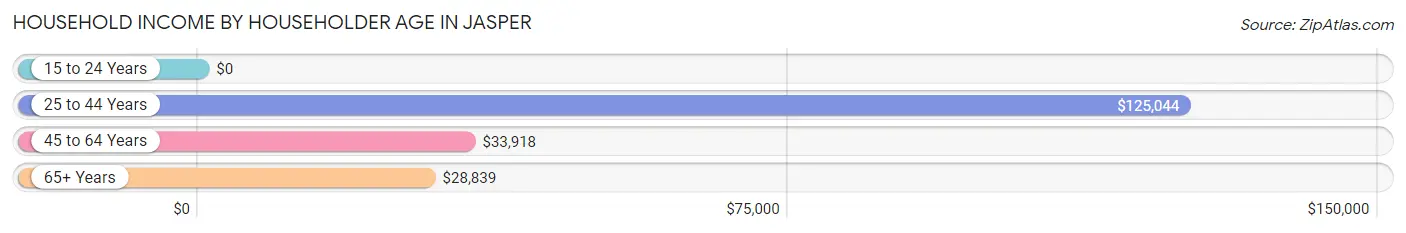
| Income Bracket | # Households | Median Income |
| 15 to 24 Years | 122 (8.6%) | $0 |
| 25 to 44 Years | 452 (31.8%) | $125,044 |
| 45 to 64 Years | 435 (30.6%) | $33,918 |
| 65+ Years | 411 (28.9%) | $28,839 |
| Total | 1,420 (100.0%) | $58,971 |
Poverty in Jasper
Income Below Poverty by Sex and Age in Jasper
With 5.0% poverty level for males and 17.1% for females among the residents of Jasper, 5 year old males and 12 to 14 year old females are the most vulnerable to poverty, with 31 males (100.0%) and 15 females (100.0%) in their respective age groups living below the poverty level.
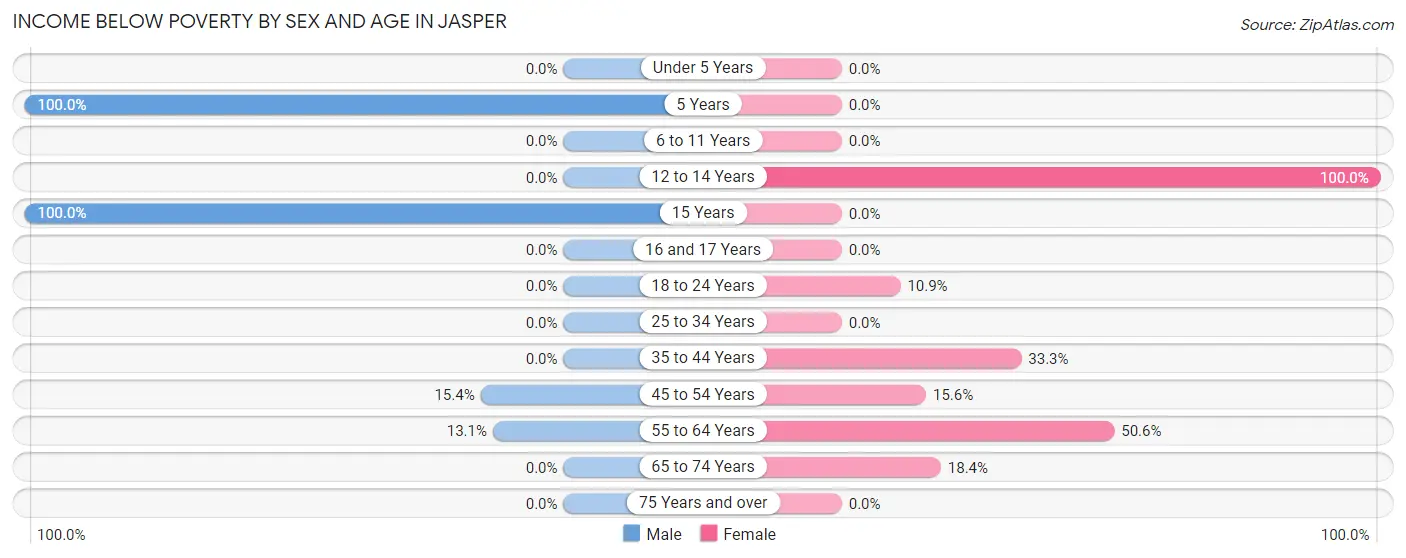
| Age Bracket | Male | Female |
| Under 5 Years | 0 (0.0%) | 0 (0.0%) |
| 5 Years | 31 (100.0%) | 0 (0.0%) |
| 6 to 11 Years | 0 (0.0%) | 0 (0.0%) |
| 12 to 14 Years | 0 (0.0%) | 15 (100.0%) |
| 15 Years | 9 (100.0%) | 0 (0.0%) |
| 16 and 17 Years | 0 (0.0%) | 0 (0.0%) |
| 18 to 24 Years | 0 (0.0%) | 11 (10.9%) |
| 25 to 34 Years | 0 (0.0%) | 0 (0.0%) |
| 35 to 44 Years | 0 (0.0%) | 106 (33.3%) |
| 45 to 54 Years | 18 (15.4%) | 28 (15.6%) |
| 55 to 64 Years | 19 (13.1%) | 130 (50.6%) |
| 65 to 74 Years | 0 (0.0%) | 32 (18.4%) |
| 75 Years and over | 0 (0.0%) | 0 (0.0%) |
| Total | 77 (5.0%) | 322 (17.1%) |
Income Above Poverty by Sex and Age in Jasper
According to the poverty statistics in Jasper, males aged under 5 years and females aged under 5 years are the age groups that are most secure financially, with 100.0% of males and 100.0% of females in these age groups living above the poverty line.
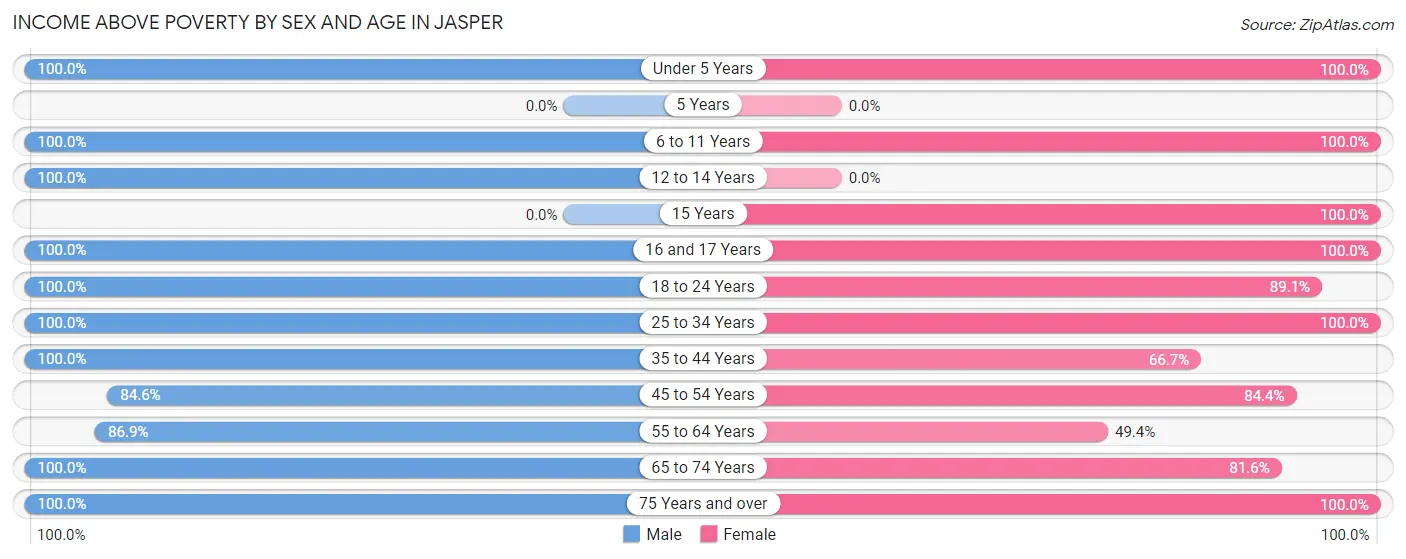
| Age Bracket | Male | Female |
| Under 5 Years | 125 (100.0%) | 226 (100.0%) |
| 5 Years | 0 (0.0%) | 0 (0.0%) |
| 6 to 11 Years | 87 (100.0%) | 107 (100.0%) |
| 12 to 14 Years | 69 (100.0%) | 0 (0.0%) |
| 15 Years | 0 (0.0%) | 8 (100.0%) |
| 16 and 17 Years | 48 (100.0%) | 94 (100.0%) |
| 18 to 24 Years | 122 (100.0%) | 90 (89.1%) |
| 25 to 34 Years | 328 (100.0%) | 206 (100.0%) |
| 35 to 44 Years | 232 (100.0%) | 212 (66.7%) |
| 45 to 54 Years | 99 (84.6%) | 151 (84.4%) |
| 55 to 64 Years | 126 (86.9%) | 127 (49.4%) |
| 65 to 74 Years | 105 (100.0%) | 142 (81.6%) |
| 75 Years and over | 129 (100.0%) | 204 (100.0%) |
| Total | 1,470 (95.0%) | 1,567 (83.0%) |
Income Below Poverty Among Married-Couple Families in Jasper
The poverty statistics for married-couple families in Jasper show that 2.8% or 18 of the total 647 families live below the poverty line. Families with no children have the highest poverty rate of 8.0%, comprising of 18 families. On the other hand, families with 1 or 2 children have the lowest poverty rate of 0.0%, which includes 0 families.
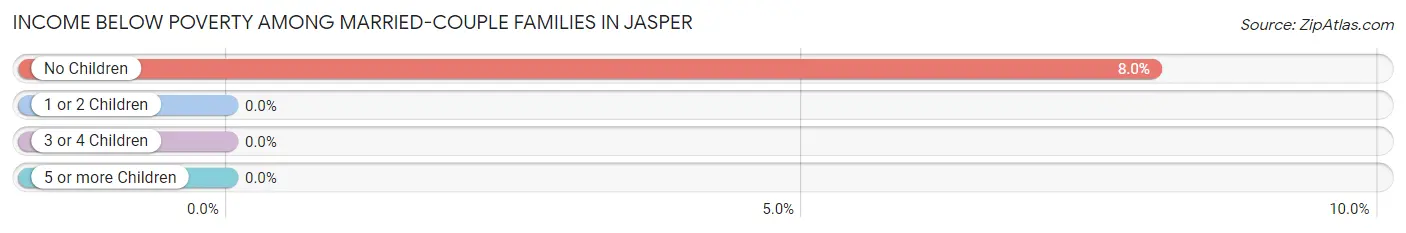
| Children | Above Poverty | Below Poverty |
| No Children | 206 (92.0%) | 18 (8.0%) |
| 1 or 2 Children | 337 (100.0%) | 0 (0.0%) |
| 3 or 4 Children | 86 (100.0%) | 0 (0.0%) |
| 5 or more Children | 0 (0.0%) | 0 (0.0%) |
| Total | 629 (97.2%) | 18 (2.8%) |
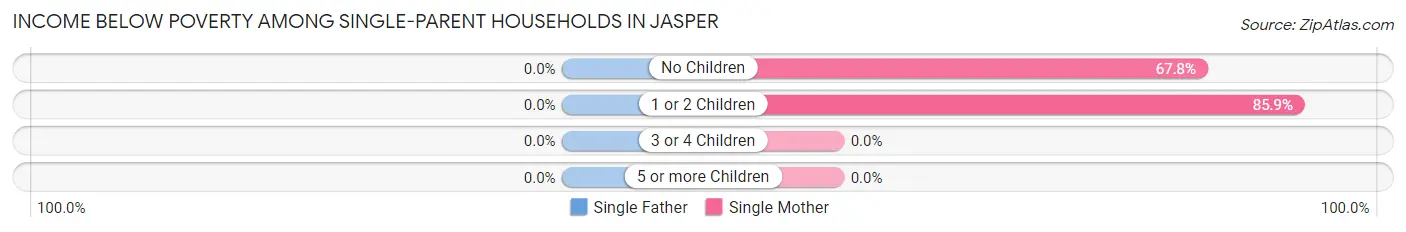
Income Below Poverty Among Single-Parent Households in Jasper
| Children | Single Father | Single Mother |
| No Children | 0 (0.0%) | 78 (67.8%) |
| 1 or 2 Children | 0 (0.0%) | 73 (85.9%) |
| 3 or 4 Children | 0 (0.0%) | 0 (0.0%) |
| 5 or more Children | 0 (0.0%) | 0 (0.0%) |
| Total | 0 (0.0%) | 151 (75.5%) |
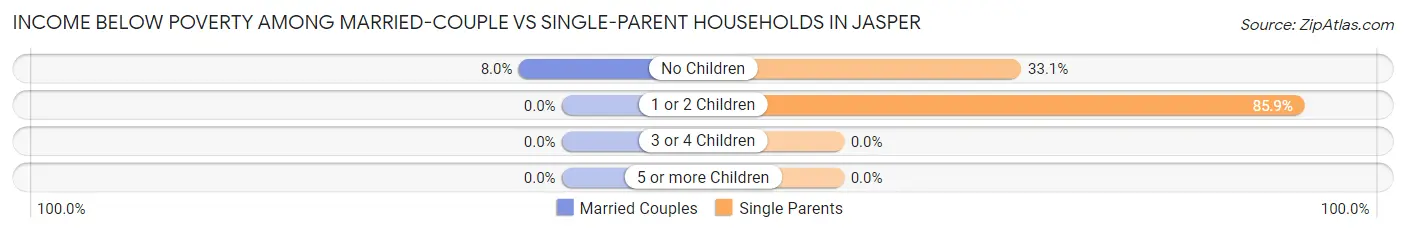
Income Below Poverty Among Married-Couple vs Single-Parent Households in Jasper
The poverty data for Jasper shows that 18 of the married-couple family households (2.8%) and 151 of the single-parent households (47.0%) are living below the poverty level. Within the married-couple family households, those with no children have the highest poverty rate, with 18 households (8.0%) falling below the poverty line. Among the single-parent households, those with 1 or 2 children have the highest poverty rate, with 73 household (85.9%) living below poverty.
| Children | Married-Couple Families | Single-Parent Households |
| No Children | 18 (8.0%) | 78 (33.1%) |
| 1 or 2 Children | 0 (0.0%) | 73 (85.9%) |
| 3 or 4 Children | 0 (0.0%) | 0 (0.0%) |
| 5 or more Children | 0 (0.0%) | 0 (0.0%) |
| Total | 18 (2.8%) | 151 (47.0%) |
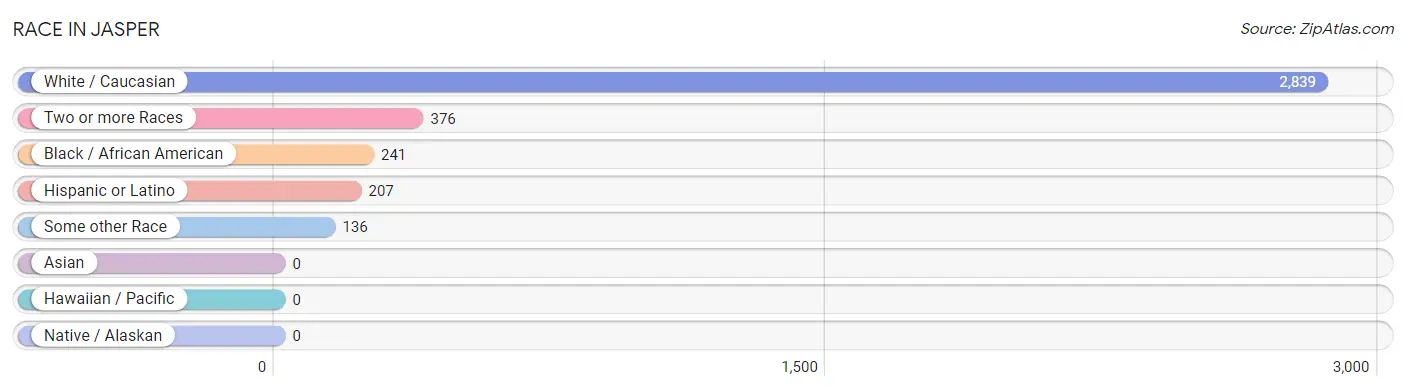
Race in Jasper
The most populous races in Jasper are White / Caucasian (2,839 | 79.0%), Two or more Races (376 | 10.5%), and Black / African American (241 | 6.7%).
| Race | # Population | % Population |
| Asian | 0 | 0.0% |
| Black / African American | 241 | 6.7% |
| Hawaiian / Pacific | 0 | 0.0% |
| Hispanic or Latino | 207 | 5.8% |
| Native / Alaskan | 0 | 0.0% |
| White / Caucasian | 2,839 | 79.0% |
| Two or more Races | 376 | 10.5% |
| Some other Race | 136 | 3.8% |
| Total | 3,592 | 100.0% |
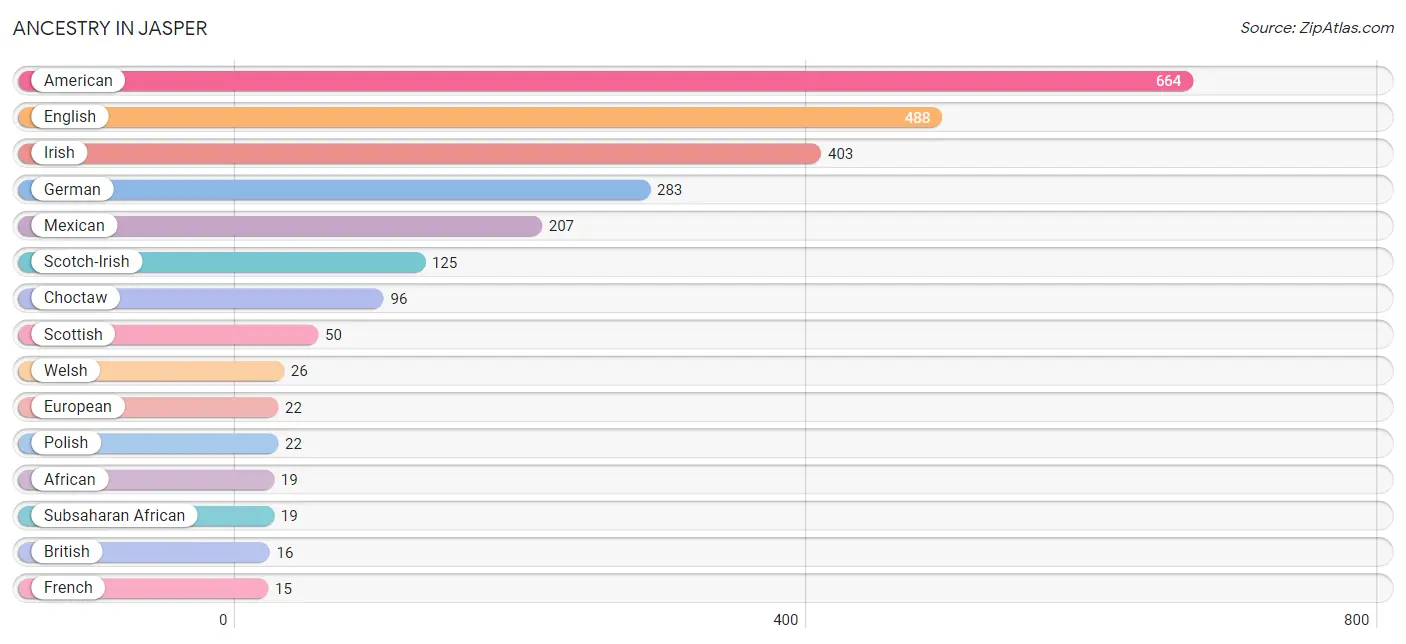
Ancestry in Jasper
The most populous ancestries reported in Jasper are American (664 | 18.5%), English (488 | 13.6%), Irish (403 | 11.2%), German (283 | 7.9%), and Mexican (207 | 5.8%), together accounting for 56.9% of all Jasper residents.
| Ancestry | # Population | % Population |
| African | 19 | 0.5% |
| American | 664 | 18.5% |
| Brazilian | 4 | 0.1% |
| British | 16 | 0.4% |
| Choctaw | 96 | 2.7% |
| English | 488 | 13.6% |
| European | 22 | 0.6% |
| French | 15 | 0.4% |
| German | 283 | 7.9% |
| Irish | 403 | 11.2% |
| Italian | 8 | 0.2% |
| Mexican | 207 | 5.8% |
| Polish | 22 | 0.6% |
| Portuguese | 9 | 0.3% |
| Scotch-Irish | 125 | 3.5% |
| Scottish | 50 | 1.4% |
| Subsaharan African | 19 | 0.5% |
| Welsh | 26 | 0.7% | View All 18 Rows |
Immigrants in Jasper
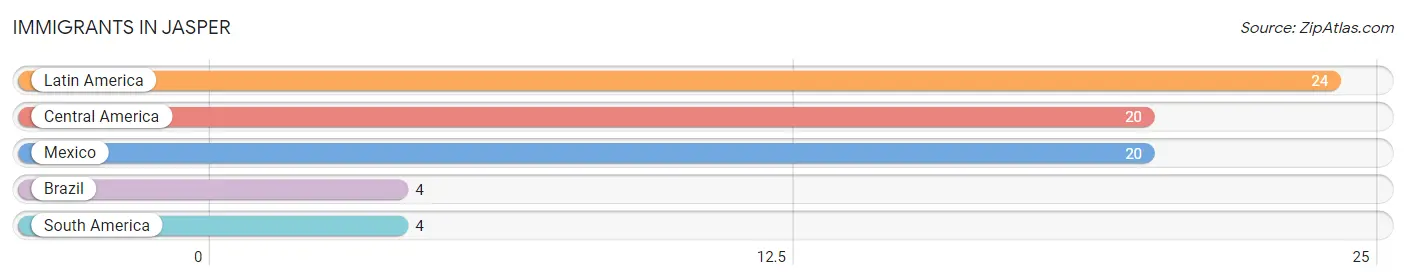
The most numerous immigrant groups reported in Jasper came from Latin America (24 | 0.7%), Central America (20 | 0.6%), Mexico (20 | 0.6%), Brazil (4 | 0.1%), and South America (4 | 0.1%), together accounting for 2.0% of all Jasper residents.
| Immigration Origin | # Population | % Population |
| Brazil | 4 | 0.1% |
| Central America | 20 | 0.6% |
| Latin America | 24 | 0.7% |
| Mexico | 20 | 0.6% |
| South America | 4 | 0.1% | View All 5 Rows |
Sex and Age in Jasper
Sex and Age in Jasper
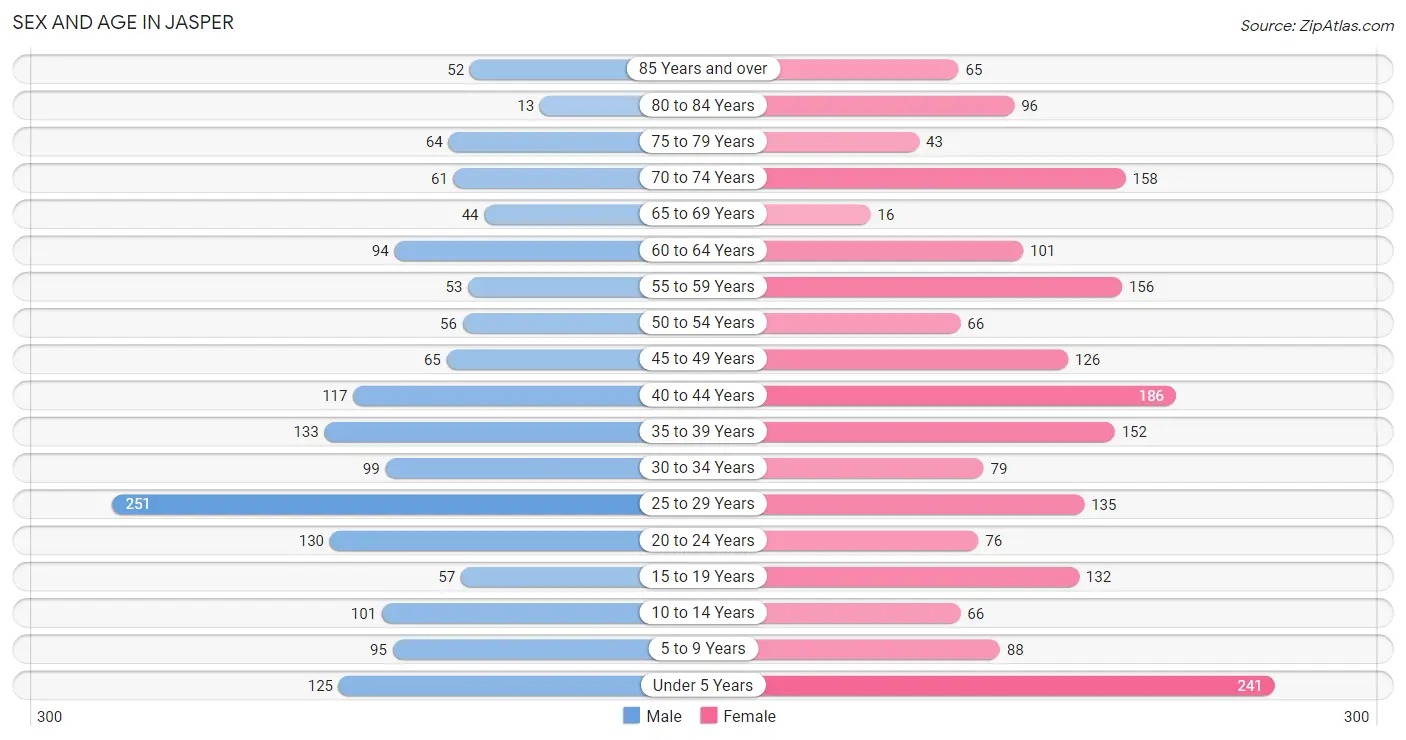
The most populous age groups in Jasper are 25 to 29 Years (251 | 15.6%) for men and Under 5 Years (241 | 12.2%) for women.
| Age Bracket | Male | Female |
| Under 5 Years | 125 (7.8%) | 241 (12.2%) |
| 5 to 9 Years | 95 (5.9%) | 88 (4.4%) |
| 10 to 14 Years | 101 (6.3%) | 66 (3.3%) |
| 15 to 19 Years | 57 (3.5%) | 132 (6.7%) |
| 20 to 24 Years | 130 (8.1%) | 76 (3.8%) |
| 25 to 29 Years | 251 (15.6%) | 135 (6.8%) |
| 30 to 34 Years | 99 (6.1%) | 79 (4.0%) |
| 35 to 39 Years | 133 (8.3%) | 152 (7.7%) |
| 40 to 44 Years | 117 (7.3%) | 186 (9.4%) |
| 45 to 49 Years | 65 (4.0%) | 126 (6.4%) |
| 50 to 54 Years | 56 (3.5%) | 66 (3.3%) |
| 55 to 59 Years | 53 (3.3%) | 156 (7.9%) |
| 60 to 64 Years | 94 (5.8%) | 101 (5.1%) |
| 65 to 69 Years | 44 (2.7%) | 16 (0.8%) |
| 70 to 74 Years | 61 (3.8%) | 158 (8.0%) |
| 75 to 79 Years | 64 (4.0%) | 43 (2.2%) |
| 80 to 84 Years | 13 (0.8%) | 96 (4.8%) |
| 85 Years and over | 52 (3.2%) | 65 (3.3%) |
| Total | 1,610 (100.0%) | 1,982 (100.0%) |
Families and Households in Jasper
Median Family Size in Jasper
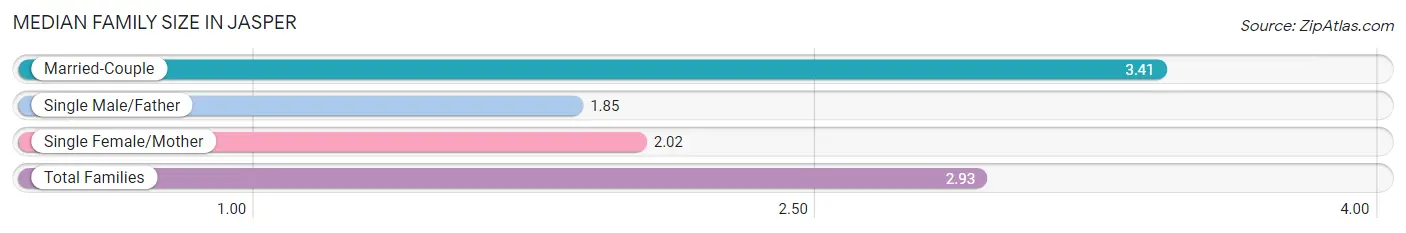
The median family size in Jasper is 2.93 persons per family, with married-couple families (647 | 66.8%) accounting for the largest median family size of 3.41 persons per family. On the other hand, single male/father families (121 | 12.5%) represent the smallest median family size with 1.85 persons per family.
| Family Type | # Families | Family Size |
| Married-Couple | 647 (66.8%) | 3.41 |
| Single Male/Father | 121 (12.5%) | 1.85 |
| Single Female/Mother | 200 (20.7%) | 2.02 |
| Total Families | 968 (100.0%) | 2.93 |
Median Household Size in Jasper
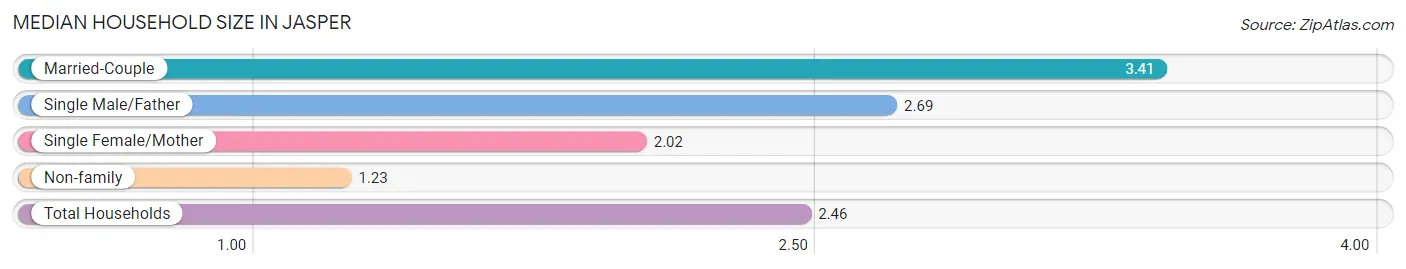
The median household size in Jasper is 2.46 persons per household, with married-couple households (647 | 45.6%) accounting for the largest median household size of 3.41 persons per household. non-family households (452 | 31.8%) represent the smallest median household size with 1.23 persons per household.
| Household Type | # Households | Household Size |
| Married-Couple | 647 (45.6%) | 3.41 |
| Single Male/Father | 121 (8.5%) | 2.69 |
| Single Female/Mother | 200 (14.1%) | 2.02 |
| Non-family | 452 (31.8%) | 1.23 |
| Total Households | 1,420 (100.0%) | 2.46 |
Household Size by Marriage Status in Jasper
Out of a total of 1,420 households in Jasper, 968 (68.2%) are family households, while 452 (31.8%) are nonfamily households. The most numerous type of family households are 2-person households, comprising 416, and the most common type of nonfamily households are 1-person households, comprising 374.
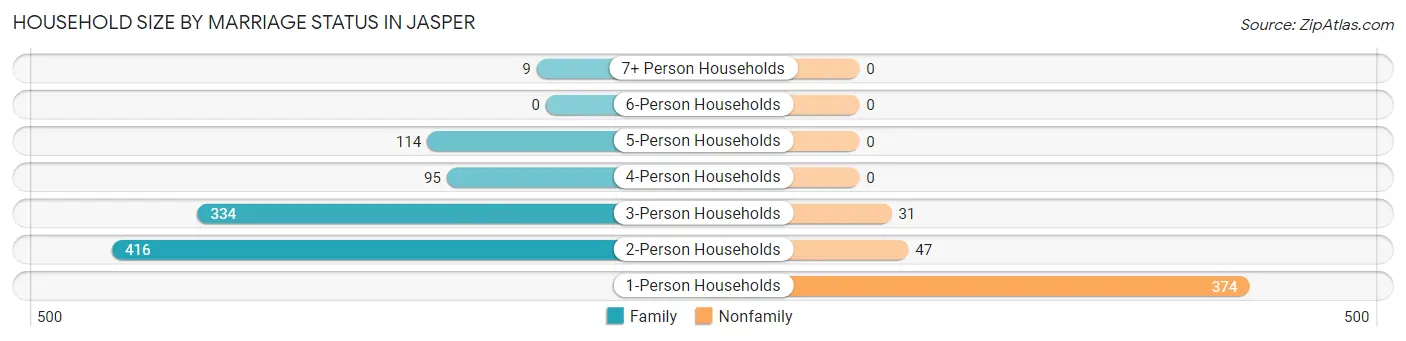
| Household Size | Family Households | Nonfamily Households |
| 1-Person Households | - | 374 (26.3%) |
| 2-Person Households | 416 (29.3%) | 47 (3.3%) |
| 3-Person Households | 334 (23.5%) | 31 (2.2%) |
| 4-Person Households | 95 (6.7%) | 0 (0.0%) |
| 5-Person Households | 114 (8.0%) | 0 (0.0%) |
| 6-Person Households | 0 (0.0%) | 0 (0.0%) |
| 7+ Person Households | 9 (0.6%) | 0 (0.0%) |
| Total | 968 (68.2%) | 452 (31.8%) |
Female Fertility in Jasper
Fertility by Age in Jasper
Average fertility rate in Jasper is 36.0 births per 1,000 women. Women in the age bracket of 35 to 50 years have the highest fertility rate with 60.0 births per 1,000 women. Women in the age bracket of 35 to 50 years acount for 87.9% of all women with births.
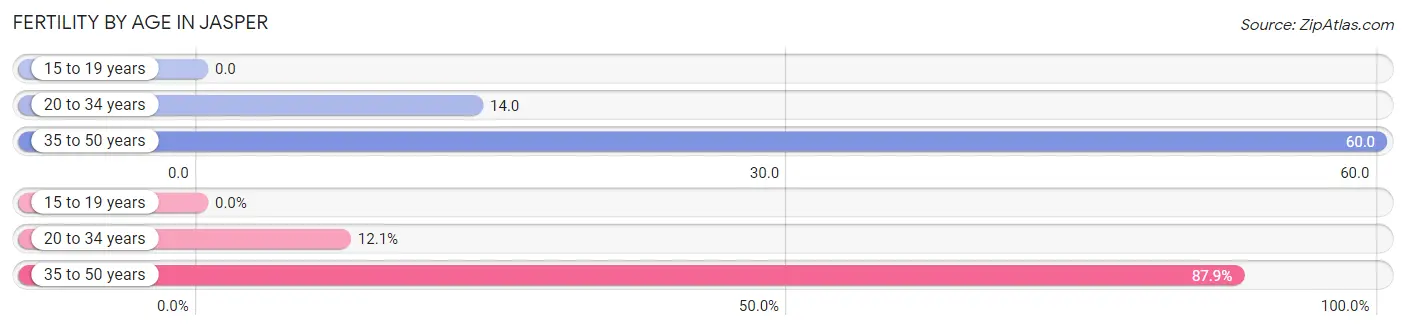
| Age Bracket | Women with Births | Births / 1,000 Women |
| 15 to 19 years | 0 (0.0%) | 0.0 |
| 20 to 34 years | 4 (12.1%) | 14.0 |
| 35 to 50 years | 29 (87.9%) | 60.0 |
| Total | 33 (100.0%) | 36.0 |
Fertility by Age by Marriage Status in Jasper
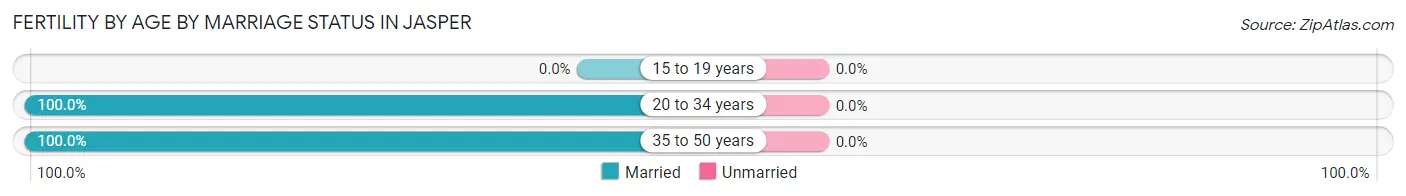
| Age Bracket | Married | Unmarried |
| 15 to 19 years | 0 (0.0%) | 0 (0.0%) |
| 20 to 34 years | 4 (100.0%) | 0 (0.0%) |
| 35 to 50 years | 29 (100.0%) | 0 (0.0%) |
| Total | 33 (100.0%) | 0 (0.0%) |
Fertility by Education in Jasper
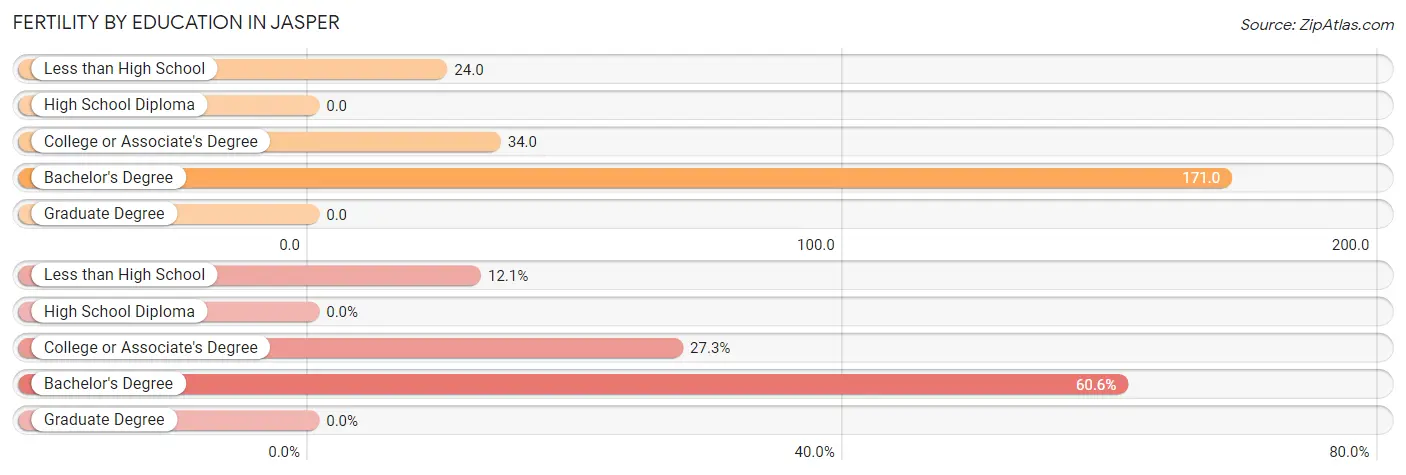
| Educational Attainment | Women with Births | Births / 1,000 Women |
| Less than High School | 4 (12.1%) | 24.0 |
| High School Diploma | 0 (0.0%) | 0.0 |
| College or Associate's Degree | 9 (27.3%) | 34.0 |
| Bachelor's Degree | 20 (60.6%) | 171.0 |
| Graduate Degree | 0 (0.0%) | 0.0 |
| Total | 33 (100.0%) | 36.0 |
Fertility by Education by Marriage Status in Jasper
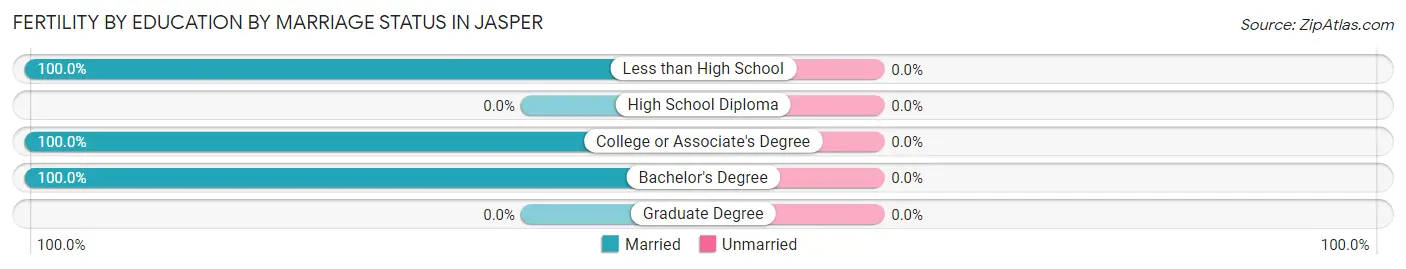
| Educational Attainment | Married | Unmarried |
| Less than High School | 4 (100.0%) | 0 (0.0%) |
| High School Diploma | 0 (0.0%) | 0 (0.0%) |
| College or Associate's Degree | 9 (100.0%) | 0 (0.0%) |
| Bachelor's Degree | 20 (100.0%) | 0 (0.0%) |
| Graduate Degree | 0 (0.0%) | 0 (0.0%) |
| Total | 33 (100.0%) | 0 (0.0%) |
Employment Characteristics in Jasper
Employment by Class of Employer in Jasper
Among the 1,566 employed individuals in Jasper, private company employees (1,114 | 71.1%), federal government employees (105 | 6.7%), and local government employees (99 | 6.3%) make up the most common classes of employment.
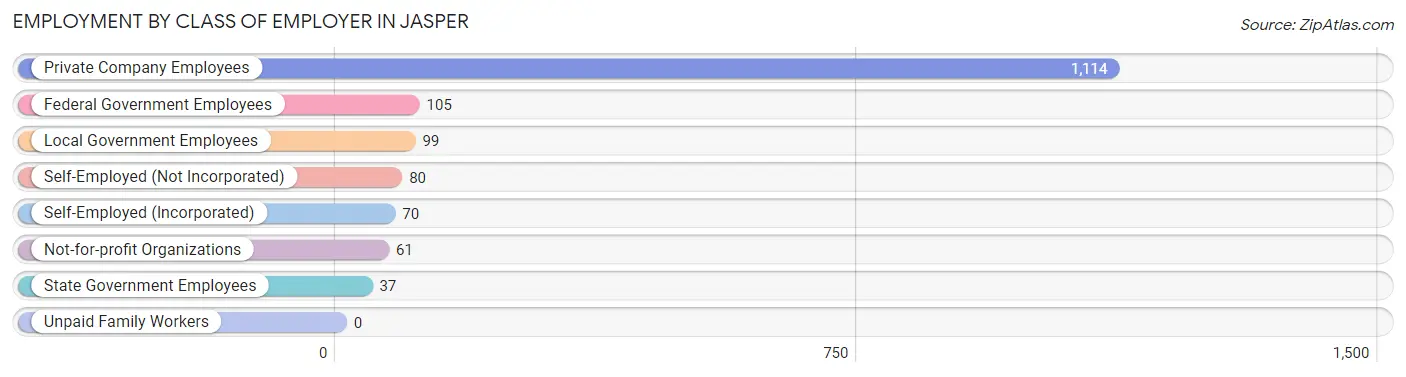
| Employer Class | # Employees | % Employees |
| Private Company Employees | 1,114 | 71.1% |
| Self-Employed (Incorporated) | 70 | 4.5% |
| Self-Employed (Not Incorporated) | 80 | 5.1% |
| Not-for-profit Organizations | 61 | 3.9% |
| Local Government Employees | 99 | 6.3% |
| State Government Employees | 37 | 2.4% |
| Federal Government Employees | 105 | 6.7% |
| Unpaid Family Workers | 0 | 0.0% |
| Total | 1,566 | 100.0% |
Employment Status by Age in Jasper
According to the labor force statistics for Jasper, out of the total population over 16 years of age (2,859), 56.3% or 1,610 individuals are in the labor force, with 2.7% or 43 of them unemployed. The age group with the highest labor force participation rate is 30 to 34 years, with 87.6% or 156 individuals in the labor force. Within the labor force, the 55 to 59 years age range has the highest percentage of unemployed individuals, with 13.0% or 19 of them being unemployed.
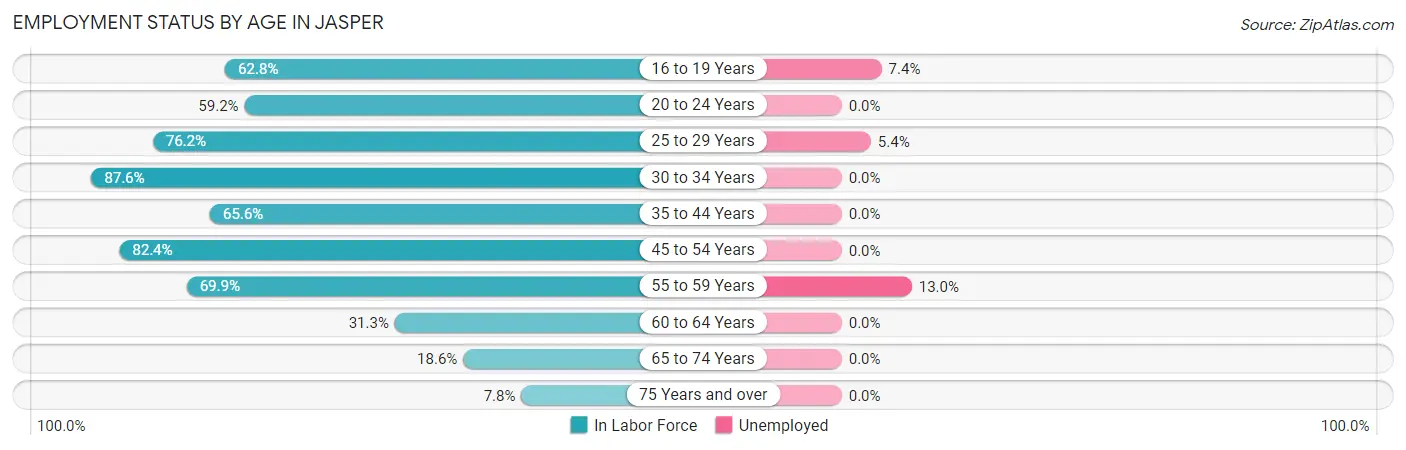
| Age Bracket | In Labor Force | Unemployed |
| 16 to 19 Years | 108 (62.8%) | 8 (7.4%) |
| 20 to 24 Years | 122 (59.2%) | 0 (0.0%) |
| 25 to 29 Years | 294 (76.2%) | 16 (5.4%) |
| 30 to 34 Years | 156 (87.6%) | 0 (0.0%) |
| 35 to 44 Years | 386 (65.6%) | 0 (0.0%) |
| 45 to 54 Years | 258 (82.4%) | 0 (0.0%) |
| 55 to 59 Years | 146 (69.9%) | 19 (13.0%) |
| 60 to 64 Years | 61 (31.3%) | 0 (0.0%) |
| 65 to 74 Years | 52 (18.6%) | 0 (0.0%) |
| 75 Years and over | 26 (7.8%) | 0 (0.0%) |
| Total | 1,610 (56.3%) | 43 (2.7%) |
Employment Status by Educational Attainment in Jasper
According to labor force statistics for Jasper, 69.6% of individuals (1,301) out of the total population between 25 and 64 years of age (1,869) are in the labor force, with 2.7% or 35 of them being unemployed. The group with the highest labor force participation rate are those with the educational attainment of bachelor's degree or higher, with 83.4% or 346 individuals in the labor force. Within the labor force, individuals with high school diploma education have the highest percentage of unemployment, with 4.9% or 19 of them being unemployed.
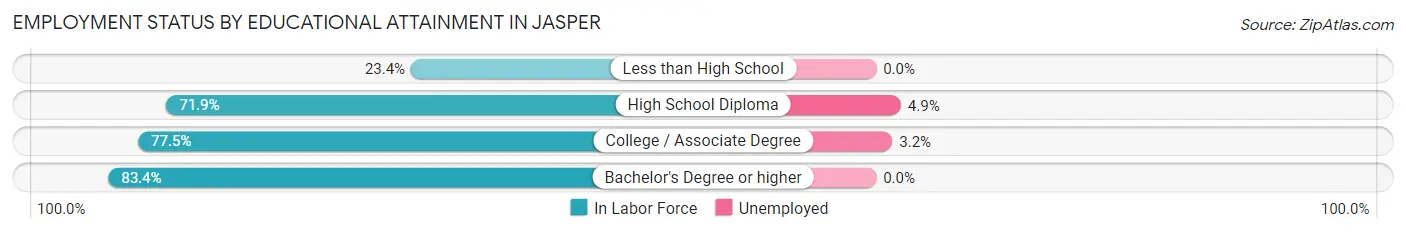
| Educational Attainment | In Labor Force | Unemployed |
| Less than High School | 61 (23.4%) | 0 (0.0%) |
| High School Diploma | 391 (71.9%) | 27 (4.9%) |
| College / Associate Degree | 503 (77.5%) | 21 (3.2%) |
| Bachelor's Degree or higher | 346 (83.4%) | 0 (0.0%) |
| Total | 1,301 (69.6%) | 50 (2.7%) |
Employment Occupations by Sex in Jasper
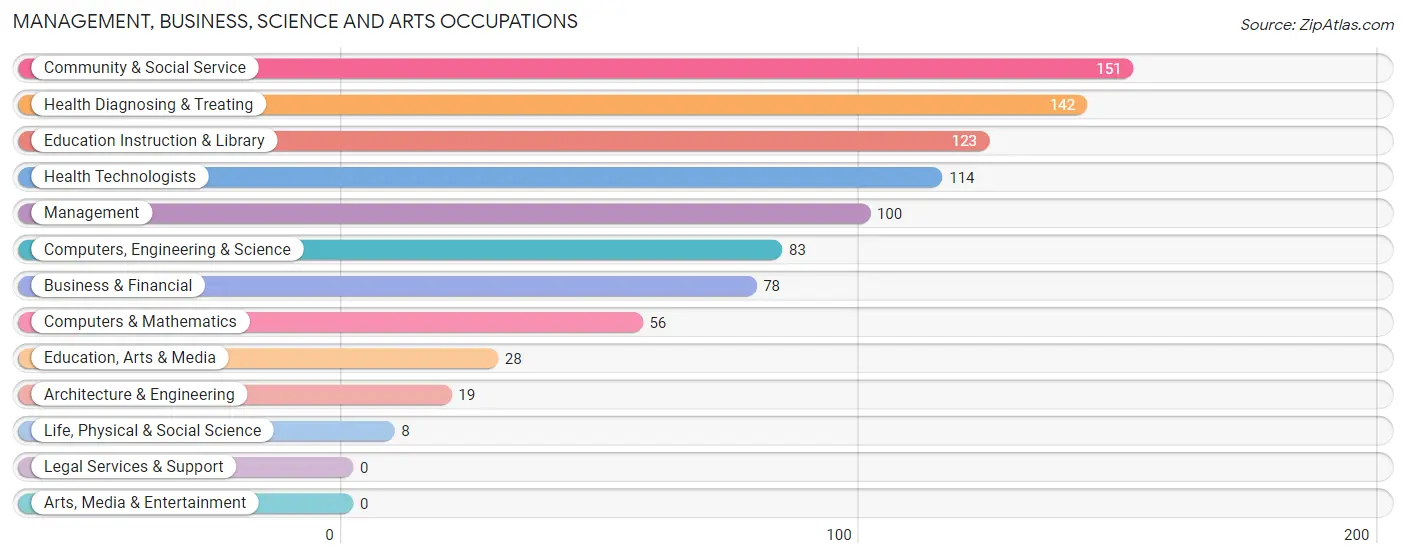
Management, Business, Science and Arts Occupations
The most common Management, Business, Science and Arts occupations in Jasper are Community & Social Service (151 | 9.6%), Health Diagnosing & Treating (142 | 9.1%), Education Instruction & Library (123 | 7.9%), Health Technologists (114 | 7.3%), and Management (100 | 6.4%).
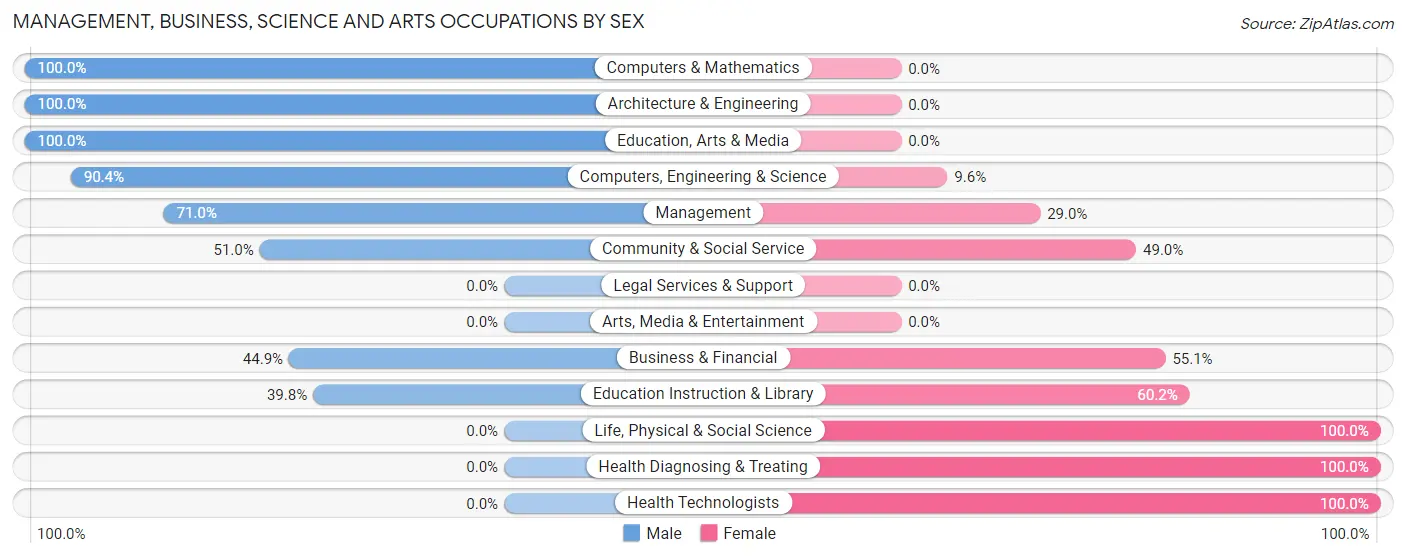
Management, Business, Science and Arts Occupations by Sex
Within the Management, Business, Science and Arts occupations in Jasper, the most male-oriented occupations are Computers & Mathematics (100.0%), Architecture & Engineering (100.0%), and Education, Arts & Media (100.0%), while the most female-oriented occupations are Life, Physical & Social Science (100.0%), Health Diagnosing & Treating (100.0%), and Health Technologists (100.0%).
| Occupation | Male | Female |
| Management | 71 (71.0%) | 29 (29.0%) |
| Business & Financial | 35 (44.9%) | 43 (55.1%) |
| Computers, Engineering & Science | 75 (90.4%) | 8 (9.6%) |
| Computers & Mathematics | 56 (100.0%) | 0 (0.0%) |
| Architecture & Engineering | 19 (100.0%) | 0 (0.0%) |
| Life, Physical & Social Science | 0 (0.0%) | 8 (100.0%) |
| Community & Social Service | 77 (51.0%) | 74 (49.0%) |
| Education, Arts & Media | 28 (100.0%) | 0 (0.0%) |
| Legal Services & Support | 0 (0.0%) | 0 (0.0%) |
| Education Instruction & Library | 49 (39.8%) | 74 (60.2%) |
| Arts, Media & Entertainment | 0 (0.0%) | 0 (0.0%) |
| Health Diagnosing & Treating | 0 (0.0%) | 142 (100.0%) |
| Health Technologists | 0 (0.0%) | 114 (100.0%) |
| Total (Category) | 258 (46.6%) | 296 (53.4%) |
| Total (Overall) | 894 (57.1%) | 672 (42.9%) |
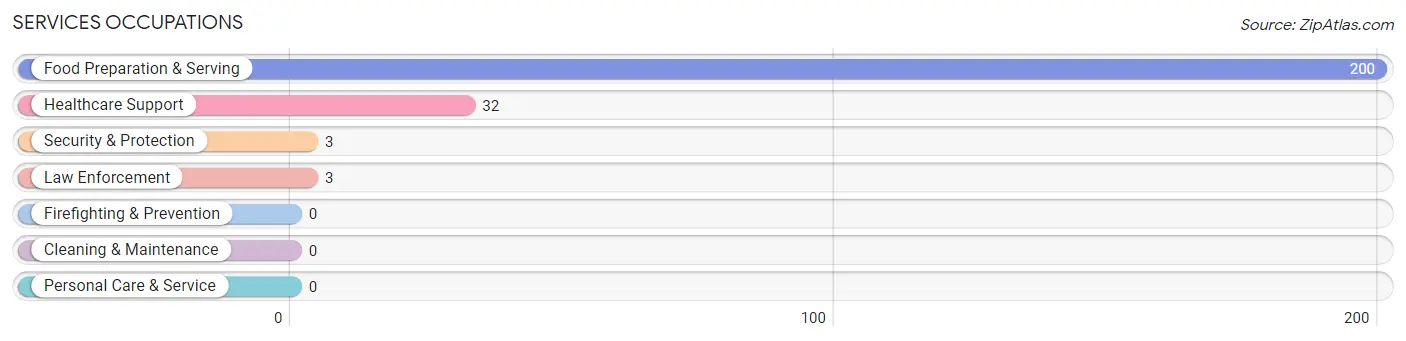
Services Occupations
The most common Services occupations in Jasper are Food Preparation & Serving (200 | 12.8%), Healthcare Support (32 | 2.0%), Security & Protection (3 | 0.2%), and Law Enforcement (3 | 0.2%).
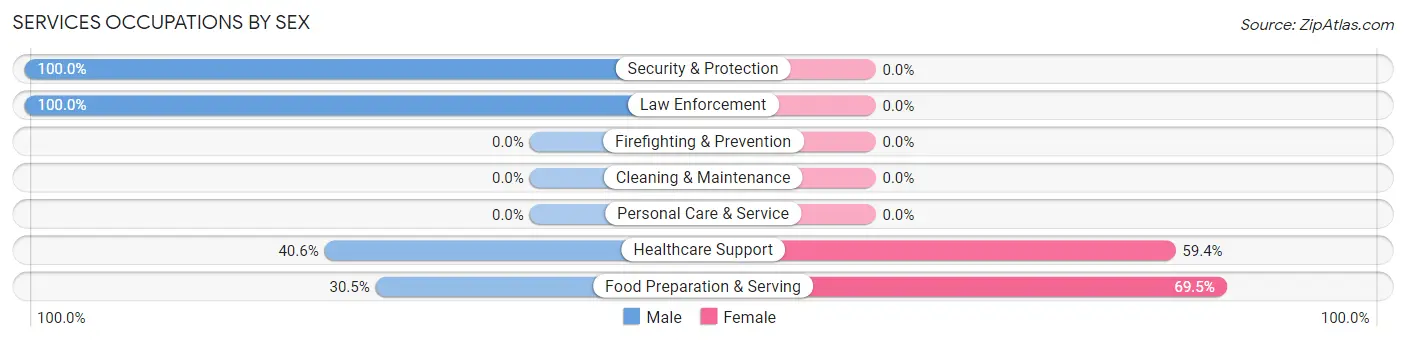
Services Occupations by Sex
Within the Services occupations in Jasper, the most male-oriented occupations are Security & Protection (100.0%), Law Enforcement (100.0%), and Healthcare Support (40.6%), while the most female-oriented occupations are Food Preparation & Serving (69.5%), and Healthcare Support (59.4%).
| Occupation | Male | Female |
| Healthcare Support | 13 (40.6%) | 19 (59.4%) |
| Security & Protection | 3 (100.0%) | 0 (0.0%) |
| Firefighting & Prevention | 0 (0.0%) | 0 (0.0%) |
| Law Enforcement | 3 (100.0%) | 0 (0.0%) |
| Food Preparation & Serving | 61 (30.5%) | 139 (69.5%) |
| Cleaning & Maintenance | 0 (0.0%) | 0 (0.0%) |
| Personal Care & Service | 0 (0.0%) | 0 (0.0%) |
| Total (Category) | 77 (32.8%) | 158 (67.2%) |
| Total (Overall) | 894 (57.1%) | 672 (42.9%) |
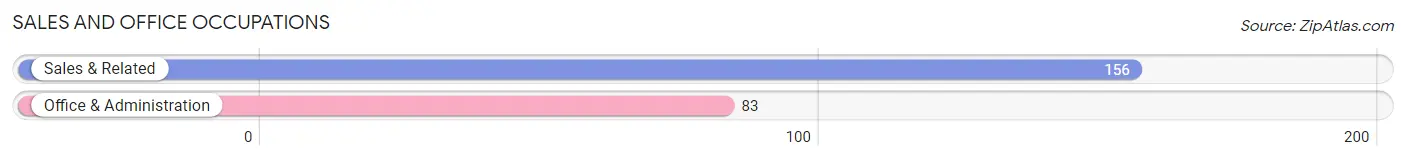
Sales and Office Occupations
The most common Sales and Office occupations in Jasper are Sales & Related (156 | 10.0%), and Office & Administration (83 | 5.3%).
Sales and Office Occupations by Sex
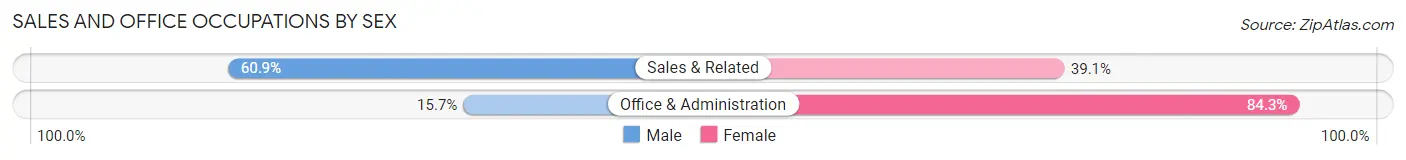
| Occupation | Male | Female |
| Sales & Related | 95 (60.9%) | 61 (39.1%) |
| Office & Administration | 13 (15.7%) | 70 (84.3%) |
| Total (Category) | 108 (45.2%) | 131 (54.8%) |
| Total (Overall) | 894 (57.1%) | 672 (42.9%) |
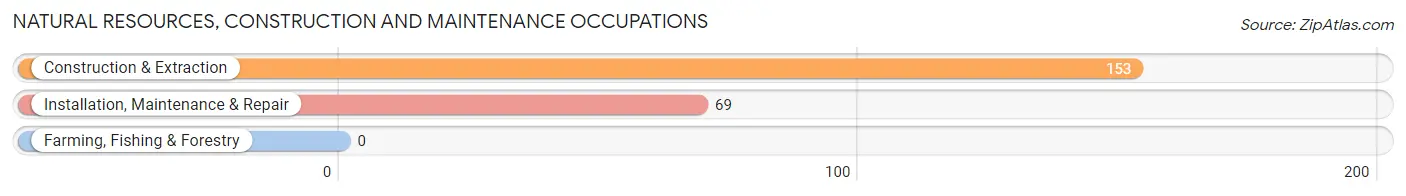
Natural Resources, Construction and Maintenance Occupations
The most common Natural Resources, Construction and Maintenance occupations in Jasper are Construction & Extraction (153 | 9.8%), and Installation, Maintenance & Repair (69 | 4.4%).
Natural Resources, Construction and Maintenance Occupations by Sex
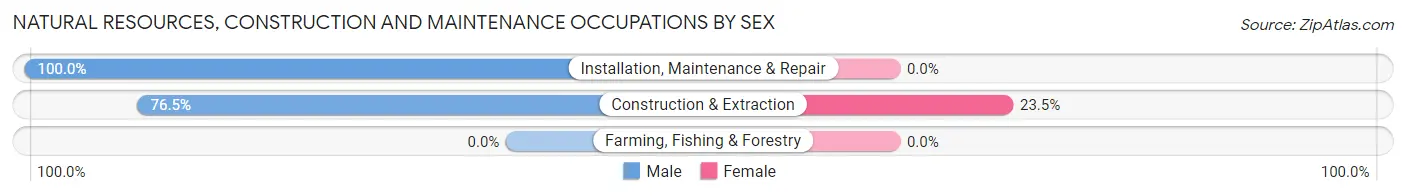
| Occupation | Male | Female |
| Farming, Fishing & Forestry | 0 (0.0%) | 0 (0.0%) |
| Construction & Extraction | 117 (76.5%) | 36 (23.5%) |
| Installation, Maintenance & Repair | 69 (100.0%) | 0 (0.0%) |
| Total (Category) | 186 (83.8%) | 36 (16.2%) |
| Total (Overall) | 894 (57.1%) | 672 (42.9%) |
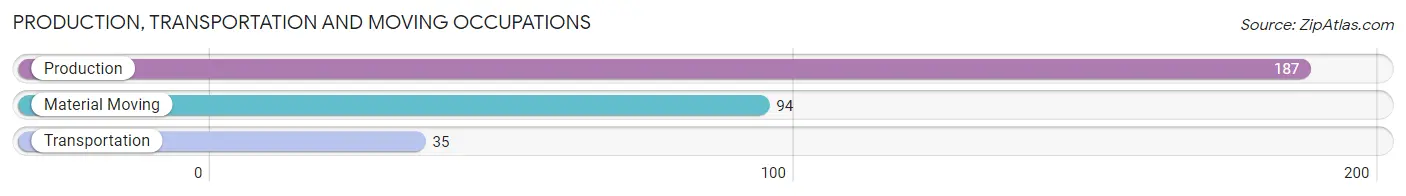
Production, Transportation and Moving Occupations
The most common Production, Transportation and Moving occupations in Jasper are Production (187 | 11.9%), Material Moving (94 | 6.0%), and Transportation (35 | 2.2%).
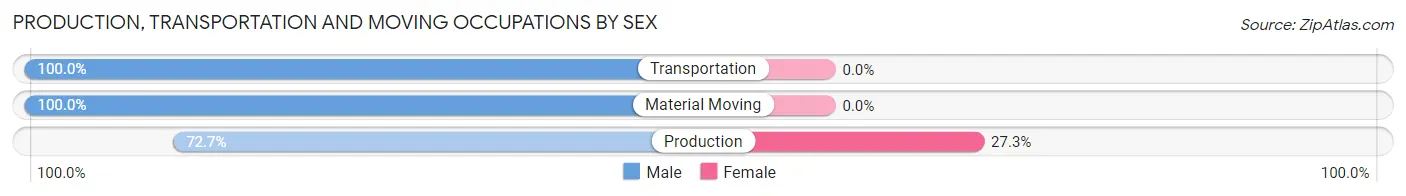
Production, Transportation and Moving Occupations by Sex
| Occupation | Male | Female |
| Production | 136 (72.7%) | 51 (27.3%) |
| Transportation | 35 (100.0%) | 0 (0.0%) |
| Material Moving | 94 (100.0%) | 0 (0.0%) |
| Total (Category) | 265 (83.9%) | 51 (16.1%) |
| Total (Overall) | 894 (57.1%) | 672 (42.9%) |
Employment Industries by Sex in Jasper
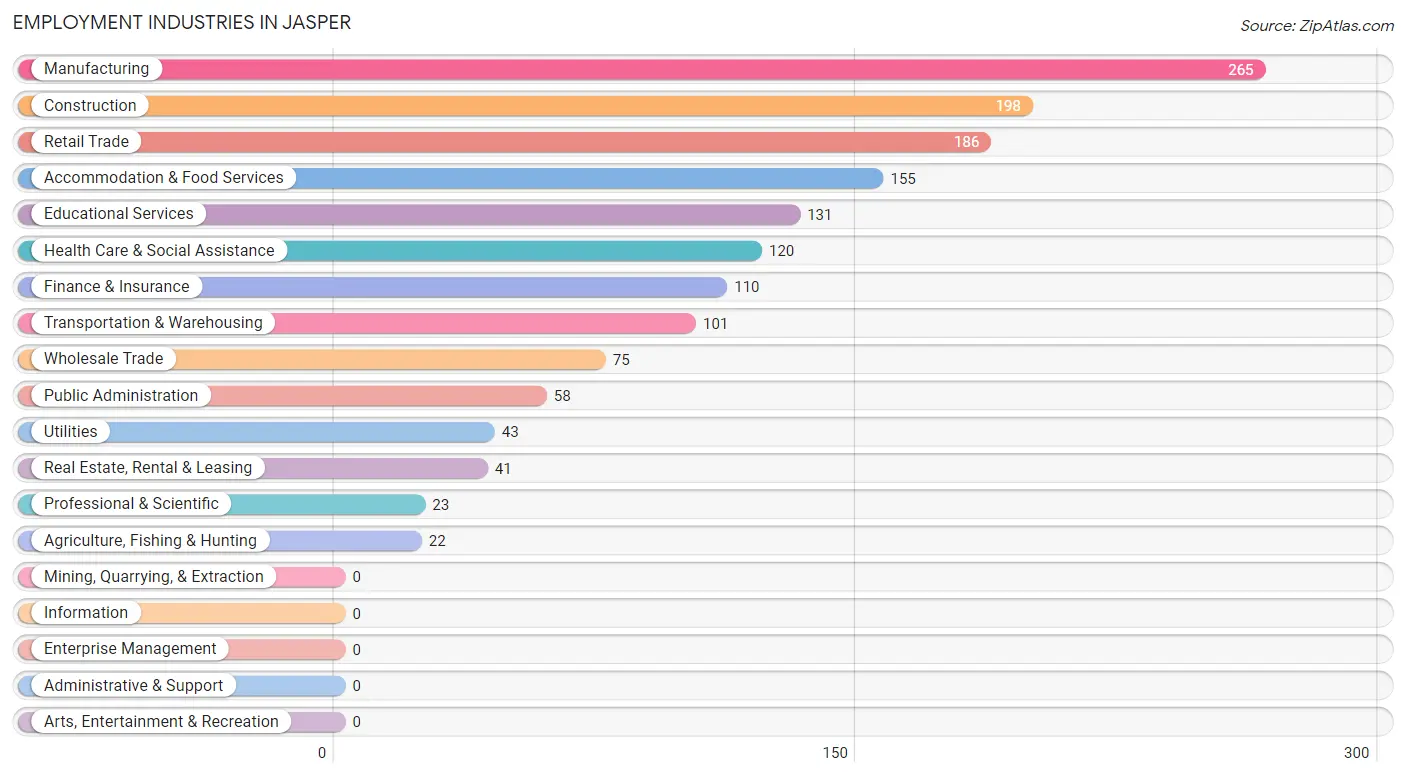
Employment Industries in Jasper
The major employment industries in Jasper include Manufacturing (265 | 16.9%), Construction (198 | 12.6%), Retail Trade (186 | 11.9%), Accommodation & Food Services (155 | 9.9%), and Educational Services (131 | 8.4%).
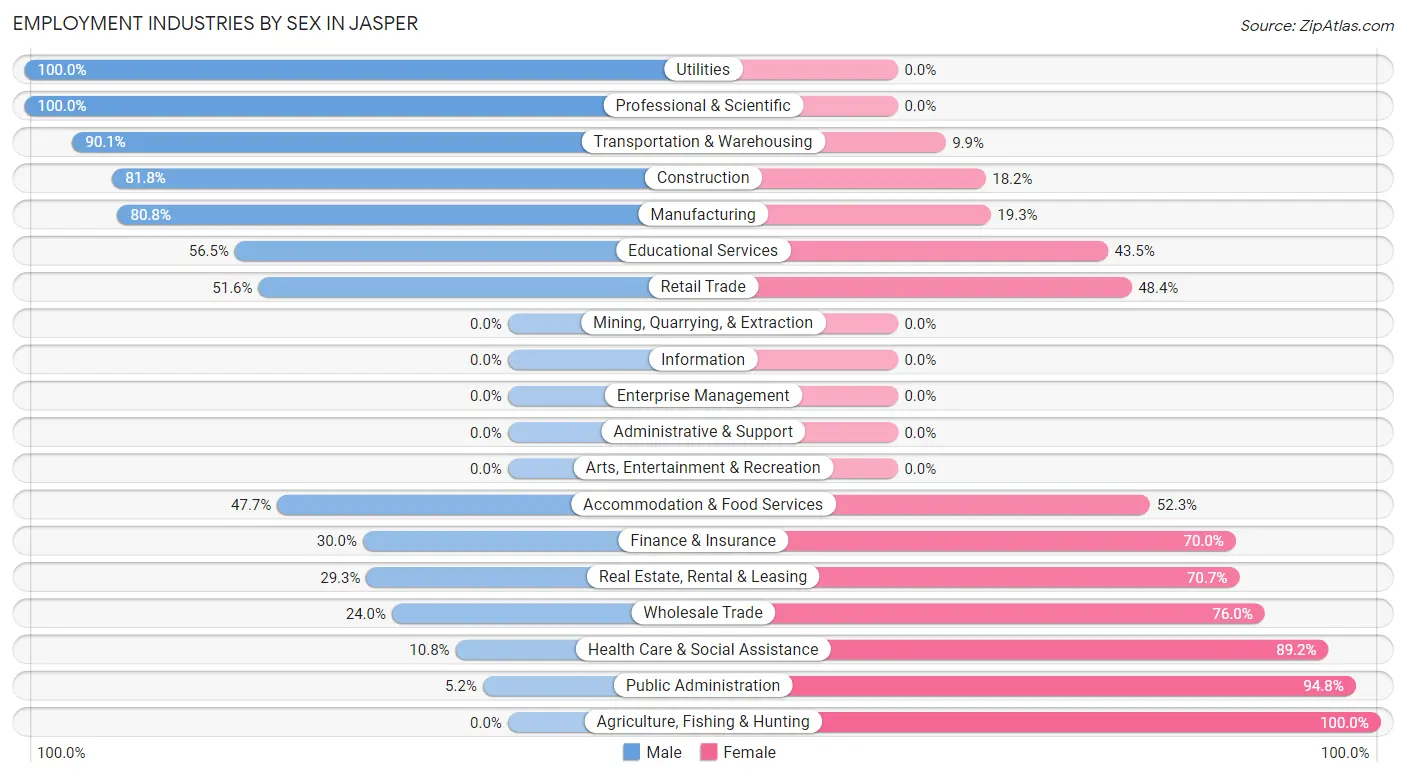
Employment Industries by Sex in Jasper
The Jasper industries that see more men than women are Utilities (100.0%), Professional & Scientific (100.0%), and Transportation & Warehousing (90.1%), whereas the industries that tend to have a higher number of women are Agriculture, Fishing & Hunting (100.0%), Public Administration (94.8%), and Health Care & Social Assistance (89.2%).
| Industry | Male | Female |
| Agriculture, Fishing & Hunting | 0 (0.0%) | 22 (100.0%) |
| Mining, Quarrying, & Extraction | 0 (0.0%) | 0 (0.0%) |
| Construction | 162 (81.8%) | 36 (18.2%) |
| Manufacturing | 214 (80.7%) | 51 (19.3%) |
| Wholesale Trade | 18 (24.0%) | 57 (76.0%) |
| Retail Trade | 96 (51.6%) | 90 (48.4%) |
| Transportation & Warehousing | 91 (90.1%) | 10 (9.9%) |
| Utilities | 43 (100.0%) | 0 (0.0%) |
| Information | 0 (0.0%) | 0 (0.0%) |
| Finance & Insurance | 33 (30.0%) | 77 (70.0%) |
| Real Estate, Rental & Leasing | 12 (29.3%) | 29 (70.7%) |
| Professional & Scientific | 23 (100.0%) | 0 (0.0%) |
| Enterprise Management | 0 (0.0%) | 0 (0.0%) |
| Administrative & Support | 0 (0.0%) | 0 (0.0%) |
| Educational Services | 74 (56.5%) | 57 (43.5%) |
| Health Care & Social Assistance | 13 (10.8%) | 107 (89.2%) |
| Arts, Entertainment & Recreation | 0 (0.0%) | 0 (0.0%) |
| Accommodation & Food Services | 74 (47.7%) | 81 (52.3%) |
| Public Administration | 3 (5.2%) | 55 (94.8%) |
| Total | 894 (57.1%) | 672 (42.9%) |
Education in Jasper
School Enrollment in Jasper
The most common levels of schooling among the 719 students in Jasper are college / undergraduate (200 | 27.8%), high school (168 | 23.4%), and middle school (158 | 22.0%).
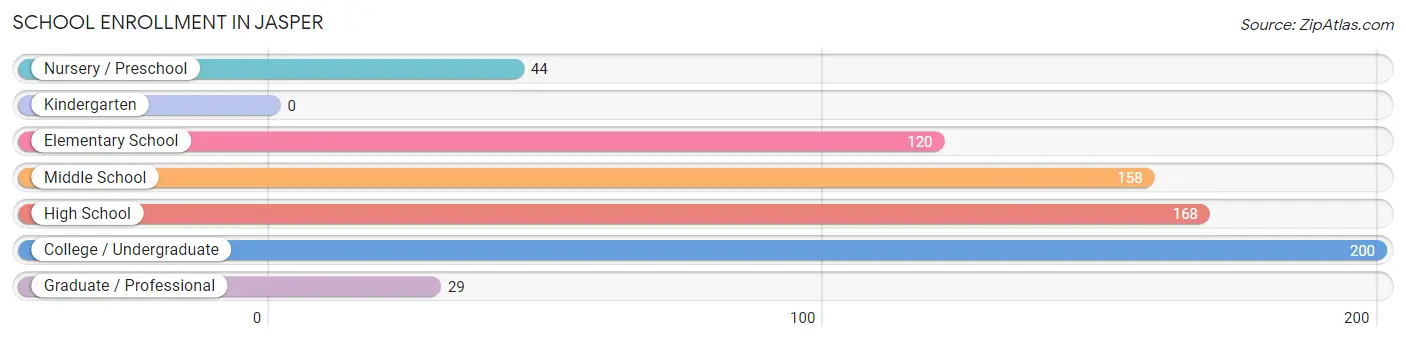
| School Level | # Students | % Students |
| Nursery / Preschool | 44 | 6.1% |
| Kindergarten | 0 | 0.0% |
| Elementary School | 120 | 16.7% |
| Middle School | 158 | 22.0% |
| High School | 168 | 23.4% |
| College / Undergraduate | 200 | 27.8% |
| Graduate / Professional | 29 | 4.0% |
| Total | 719 | 100.0% |
School Enrollment by Age by Funding Source in Jasper
Out of a total of 719 students who are enrolled in schools in Jasper, 21 (2.9%) attend a private institution, while the remaining 698 (97.1%) are enrolled in public schools. The age group of 5 to 9 year old has the highest likelihood of being enrolled in private schools, with 21 (12.8% in the age bracket) enrolled. Conversely, the age group of 10 to 14 year olds has the lowest likelihood of being enrolled in a private school, with 167 (100.0% in the age bracket) attending a public institution.
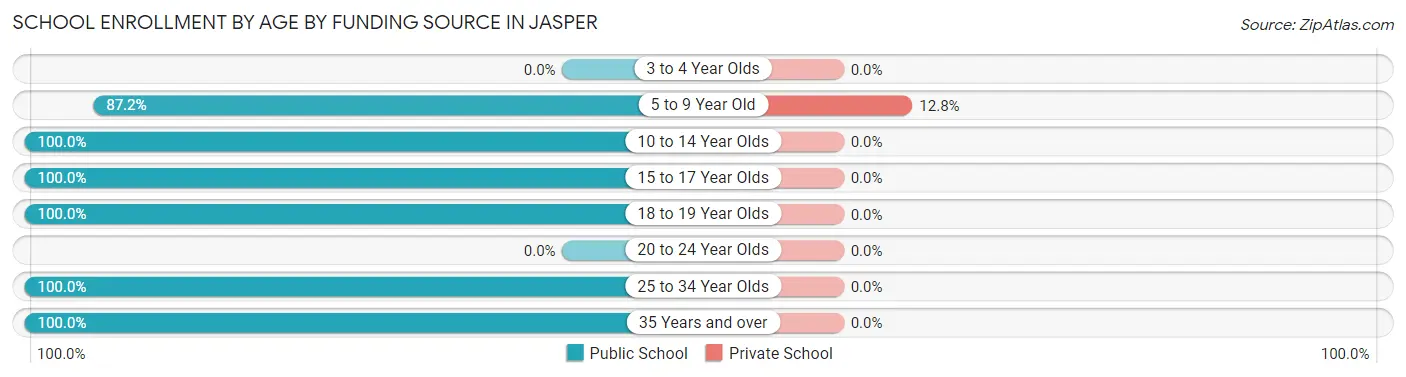
| Age Bracket | Public School | Private School |
| 3 to 4 Year Olds | 0 (0.0%) | 0 (0.0%) |
| 5 to 9 Year Old | 143 (87.2%) | 21 (12.8%) |
| 10 to 14 Year Olds | 167 (100.0%) | 0 (0.0%) |
| 15 to 17 Year Olds | 159 (100.0%) | 0 (0.0%) |
| 18 to 19 Year Olds | 19 (100.0%) | 0 (0.0%) |
| 20 to 24 Year Olds | 0 (0.0%) | 0 (0.0%) |
| 25 to 34 Year Olds | 136 (100.0%) | 0 (0.0%) |
| 35 Years and over | 74 (100.0%) | 0 (0.0%) |
| Total | 698 (97.1%) | 21 (2.9%) |
Educational Attainment by Field of Study in Jasper
Business (192 | 38.3%), education (107 | 21.4%), liberal arts & history (65 | 13.0%), social sciences (44 | 8.8%), and arts & humanities (33 | 6.6%) are the most common fields of study among 501 individuals in Jasper who have obtained a bachelor's degree or higher.
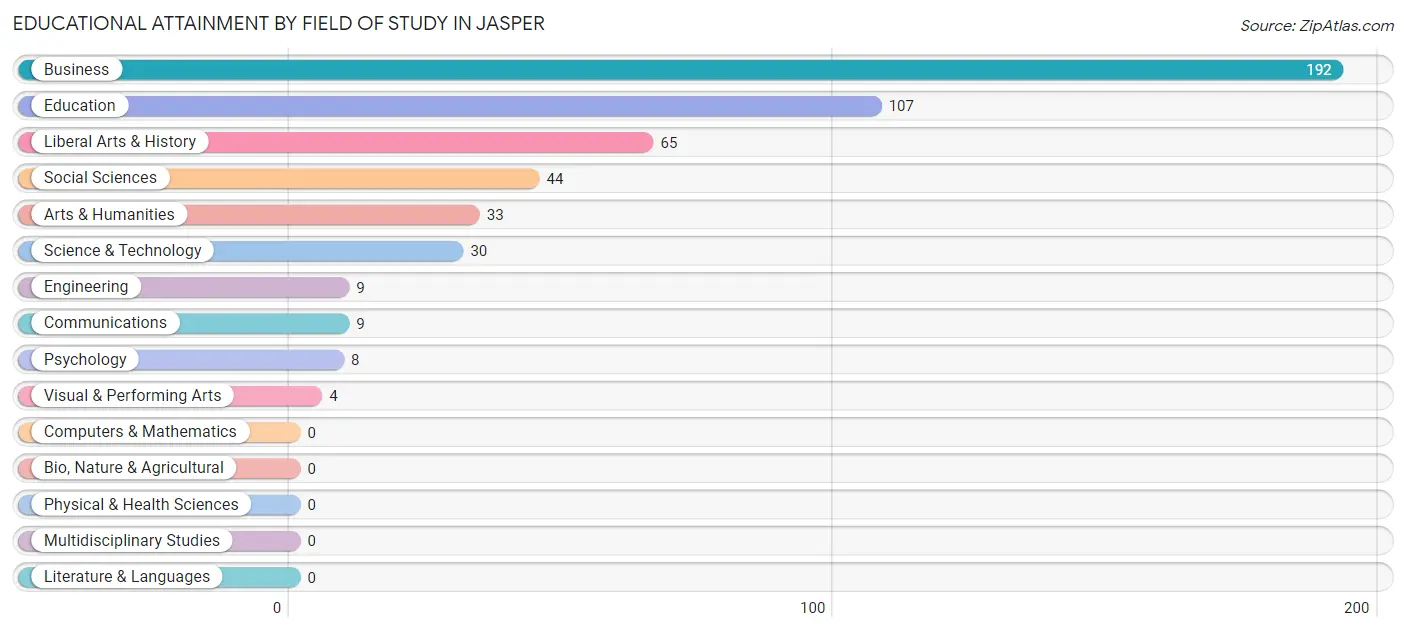
| Field of Study | # Graduates | % Graduates |
| Computers & Mathematics | 0 | 0.0% |
| Bio, Nature & Agricultural | 0 | 0.0% |
| Physical & Health Sciences | 0 | 0.0% |
| Psychology | 8 | 1.6% |
| Social Sciences | 44 | 8.8% |
| Engineering | 9 | 1.8% |
| Multidisciplinary Studies | 0 | 0.0% |
| Science & Technology | 30 | 6.0% |
| Business | 192 | 38.3% |
| Education | 107 | 21.4% |
| Literature & Languages | 0 | 0.0% |
| Liberal Arts & History | 65 | 13.0% |
| Visual & Performing Arts | 4 | 0.8% |
| Communications | 9 | 1.8% |
| Arts & Humanities | 33 | 6.6% |
| Total | 501 | 100.0% |
Transportation & Commute in Jasper
Vehicle Availability by Sex in Jasper
The most prevalent vehicle ownership categories in Jasper are males with 2 vehicles (408, accounting for 45.6%) and females with 2 vehicles (416, making up 60.7%).
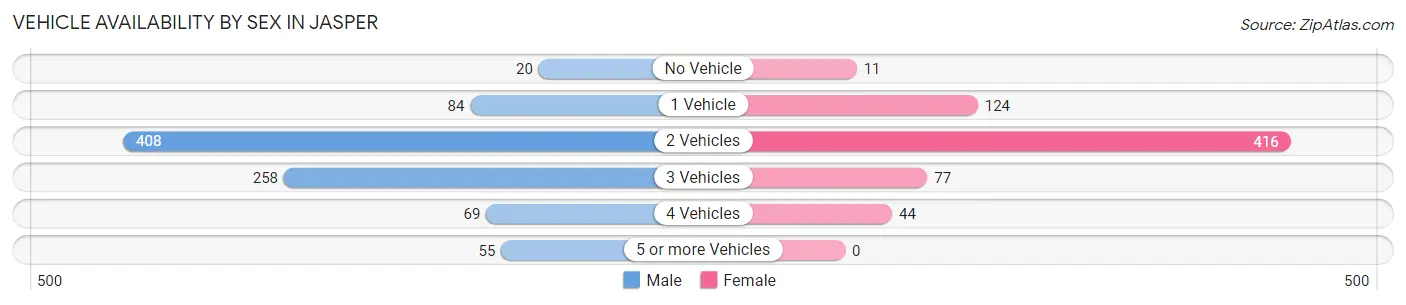
| Vehicles Available | Male | Female |
| No Vehicle | 20 (2.2%) | 11 (1.6%) |
| 1 Vehicle | 84 (9.4%) | 124 (18.4%) |
| 2 Vehicles | 408 (45.6%) | 416 (61.9%) |
| 3 Vehicles | 258 (28.9%) | 77 (11.5%) |
| 4 Vehicles | 69 (7.7%) | 44 (6.6%) |
| 5 or more Vehicles | 55 (6.1%) | 0 (0.0%) |
| Total | 894 (100.0%) | 672 (100.0%) |
Commute Time in Jasper
The most frequently occuring commute durations in Jasper are 10 to 14 minutes (320 commuters, 21.4%), 30 to 34 minutes (184 commuters, 12.3%), and 20 to 24 minutes (161 commuters, 10.8%).
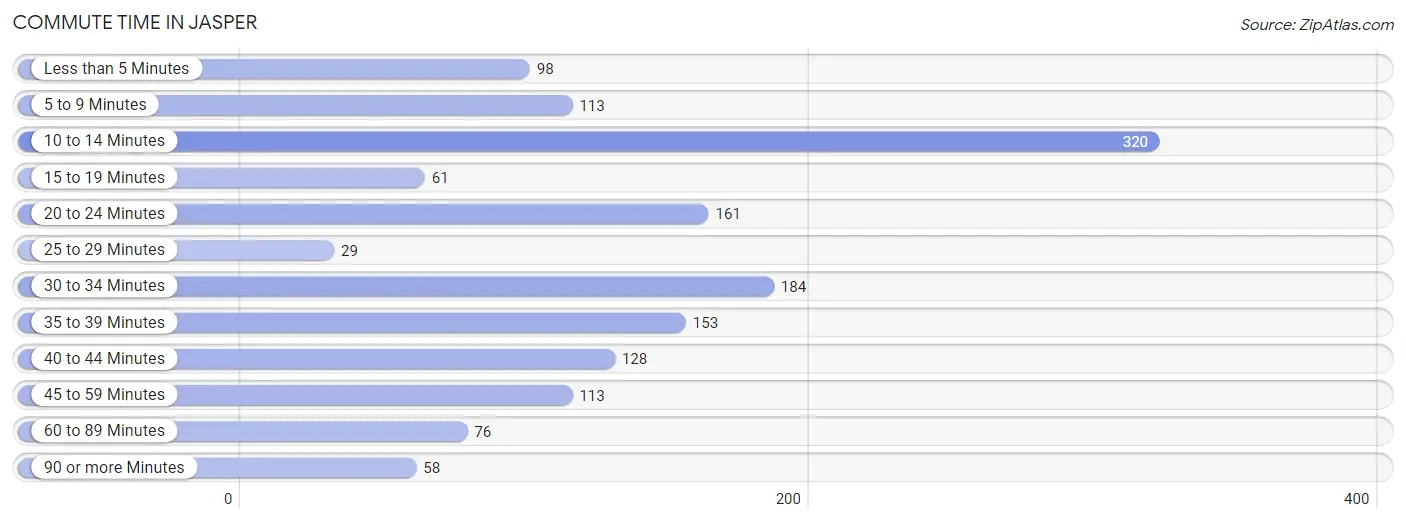
| Commute Time | # Commuters | % Commuters |
| Less than 5 Minutes | 98 | 6.6% |
| 5 to 9 Minutes | 113 | 7.6% |
| 10 to 14 Minutes | 320 | 21.4% |
| 15 to 19 Minutes | 61 | 4.1% |
| 20 to 24 Minutes | 161 | 10.8% |
| 25 to 29 Minutes | 29 | 1.9% |
| 30 to 34 Minutes | 184 | 12.3% |
| 35 to 39 Minutes | 153 | 10.2% |
| 40 to 44 Minutes | 128 | 8.6% |
| 45 to 59 Minutes | 113 | 7.6% |
| 60 to 89 Minutes | 76 | 5.1% |
| 90 or more Minutes | 58 | 3.9% |
Commute Time by Sex in Jasper
The most common commute times in Jasper are 10 to 14 minutes (210 commuters, 24.8%) for males and 30 to 34 minutes (144 commuters, 22.2%) for females.
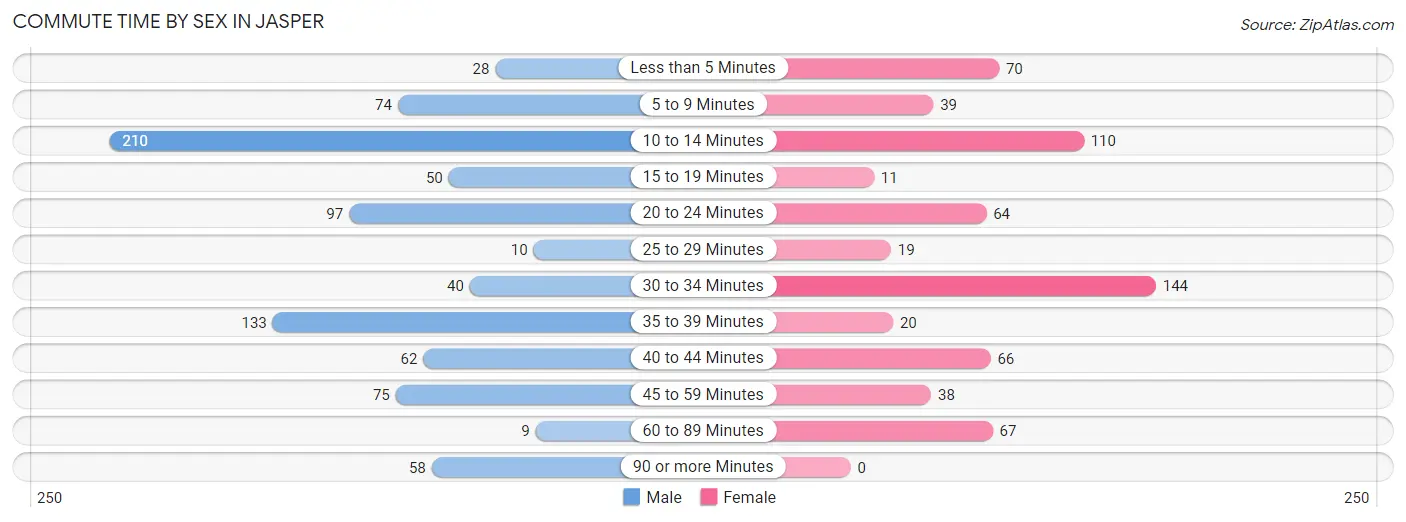
| Commute Time | Male | Female |
| Less than 5 Minutes | 28 (3.3%) | 70 (10.8%) |
| 5 to 9 Minutes | 74 (8.7%) | 39 (6.0%) |
| 10 to 14 Minutes | 210 (24.8%) | 110 (17.0%) |
| 15 to 19 Minutes | 50 (5.9%) | 11 (1.7%) |
| 20 to 24 Minutes | 97 (11.5%) | 64 (9.9%) |
| 25 to 29 Minutes | 10 (1.2%) | 19 (2.9%) |
| 30 to 34 Minutes | 40 (4.7%) | 144 (22.2%) |
| 35 to 39 Minutes | 133 (15.7%) | 20 (3.1%) |
| 40 to 44 Minutes | 62 (7.3%) | 66 (10.2%) |
| 45 to 59 Minutes | 75 (8.9%) | 38 (5.9%) |
| 60 to 89 Minutes | 9 (1.1%) | 67 (10.3%) |
| 90 or more Minutes | 58 (6.9%) | 0 (0.0%) |
Time of Departure to Work by Sex in Jasper
The most frequent times of departure to work in Jasper are 12:00 AM to 4:59 AM (186, 22.0%) for males and 7:30 AM to 7:59 AM (151, 23.3%) for females.
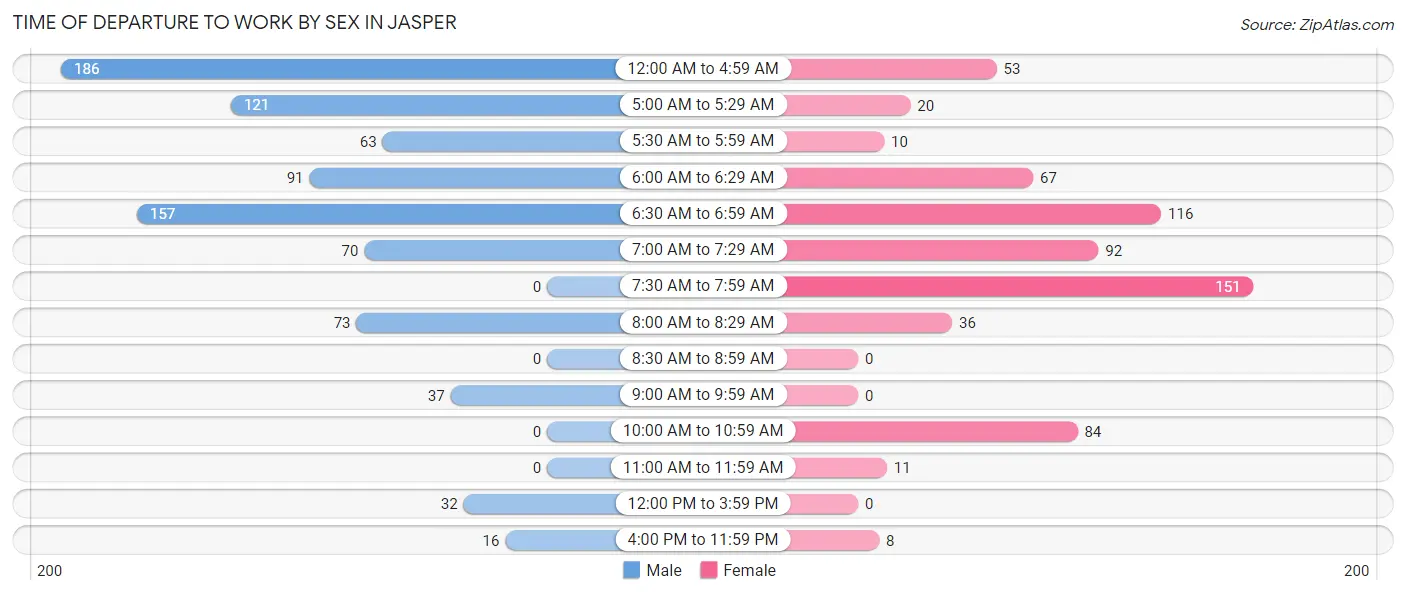
| Time of Departure | Male | Female |
| 12:00 AM to 4:59 AM | 186 (22.0%) | 53 (8.2%) |
| 5:00 AM to 5:29 AM | 121 (14.3%) | 20 (3.1%) |
| 5:30 AM to 5:59 AM | 63 (7.4%) | 10 (1.5%) |
| 6:00 AM to 6:29 AM | 91 (10.8%) | 67 (10.3%) |
| 6:30 AM to 6:59 AM | 157 (18.6%) | 116 (17.9%) |
| 7:00 AM to 7:29 AM | 70 (8.3%) | 92 (14.2%) |
| 7:30 AM to 7:59 AM | 0 (0.0%) | 151 (23.3%) |
| 8:00 AM to 8:29 AM | 73 (8.6%) | 36 (5.6%) |
| 8:30 AM to 8:59 AM | 0 (0.0%) | 0 (0.0%) |
| 9:00 AM to 9:59 AM | 37 (4.4%) | 0 (0.0%) |
| 10:00 AM to 10:59 AM | 0 (0.0%) | 84 (13.0%) |
| 11:00 AM to 11:59 AM | 0 (0.0%) | 11 (1.7%) |
| 12:00 PM to 3:59 PM | 32 (3.8%) | 0 (0.0%) |
| 4:00 PM to 11:59 PM | 16 (1.9%) | 8 (1.2%) |
| Total | 846 (100.0%) | 648 (100.0%) |
Housing Occupancy in Jasper
Occupancy by Ownership in Jasper
Of the total 1,420 dwellings in Jasper, owner-occupied units account for 1,211 (85.3%), while renter-occupied units make up 209 (14.7%).
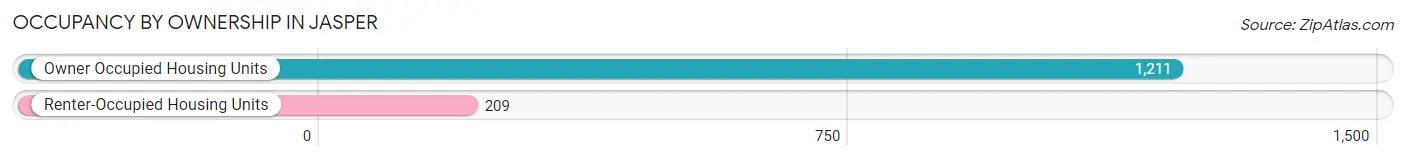
| Occupancy | # Housing Units | % Housing Units |
| Owner Occupied Housing Units | 1,211 | 85.3% |
| Renter-Occupied Housing Units | 209 | 14.7% |
| Total Occupied Housing Units | 1,420 | 100.0% |
Occupancy by Household Size in Jasper
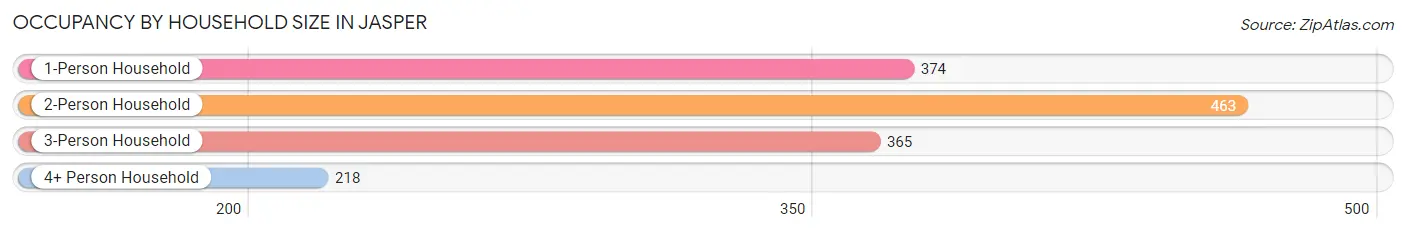
| Household Size | # Housing Units | % Housing Units |
| 1-Person Household | 374 | 26.3% |
| 2-Person Household | 463 | 32.6% |
| 3-Person Household | 365 | 25.7% |
| 4+ Person Household | 218 | 15.3% |
| Total Housing Units | 1,420 | 100.0% |
Occupancy by Ownership by Household Size in Jasper
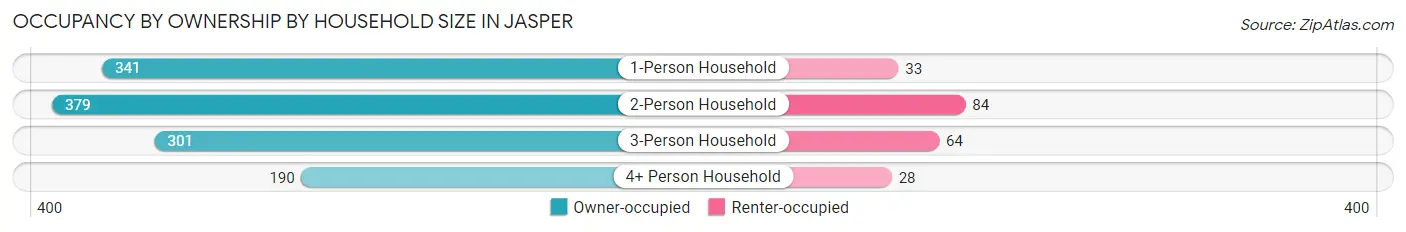
| Household Size | Owner-occupied | Renter-occupied |
| 1-Person Household | 341 (91.2%) | 33 (8.8%) |
| 2-Person Household | 379 (81.9%) | 84 (18.1%) |
| 3-Person Household | 301 (82.5%) | 64 (17.5%) |
| 4+ Person Household | 190 (87.2%) | 28 (12.8%) |
| Total Housing Units | 1,211 (85.3%) | 209 (14.7%) |
Occupancy by Educational Attainment in Jasper
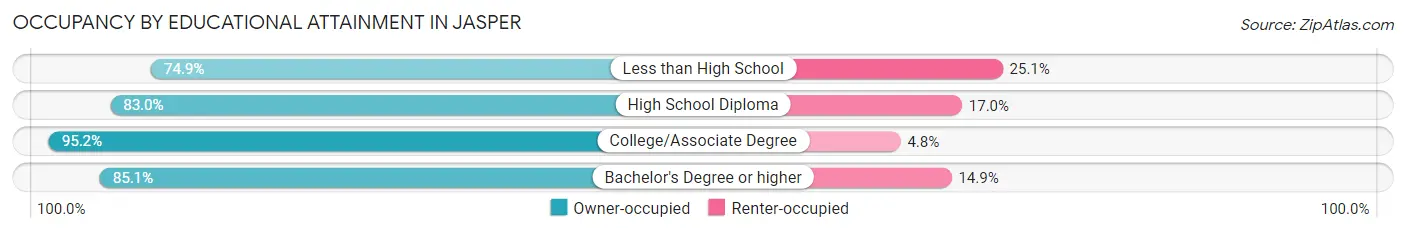
| Household Size | Owner-occupied | Renter-occupied |
| Less than High School | 257 (74.9%) | 86 (25.1%) |
| High School Diploma | 254 (83.0%) | 52 (17.0%) |
| College/Associate Degree | 415 (95.2%) | 21 (4.8%) |
| Bachelor's Degree or higher | 285 (85.1%) | 50 (14.9%) |
Occupancy by Age of Householder in Jasper
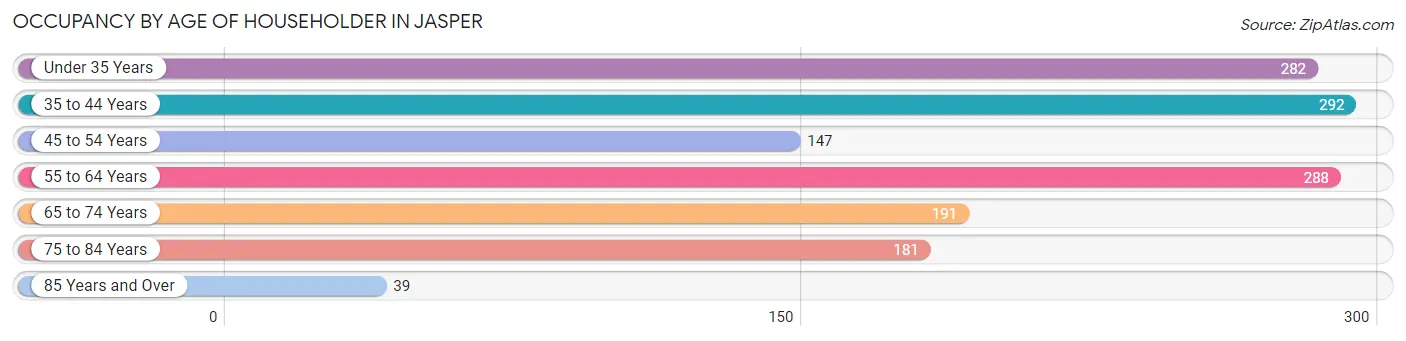
| Age Bracket | # Households | % Households |
| Under 35 Years | 282 | 19.9% |
| 35 to 44 Years | 292 | 20.6% |
| 45 to 54 Years | 147 | 10.3% |
| 55 to 64 Years | 288 | 20.3% |
| 65 to 74 Years | 191 | 13.5% |
| 75 to 84 Years | 181 | 12.8% |
| 85 Years and Over | 39 | 2.8% |
| Total | 1,420 | 100.0% |
Housing Finances in Jasper
Median Income by Occupancy in Jasper
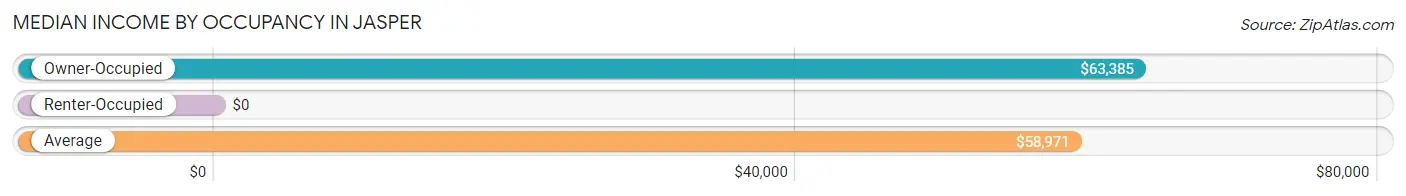
| Occupancy Type | # Households | Median Income |
| Owner-Occupied | 1,211 (85.3%) | $63,385 |
| Renter-Occupied | 209 (14.7%) | $0 |
| Average | 1,420 (100.0%) | $58,971 |
Occupancy by Householder Income Bracket in Jasper
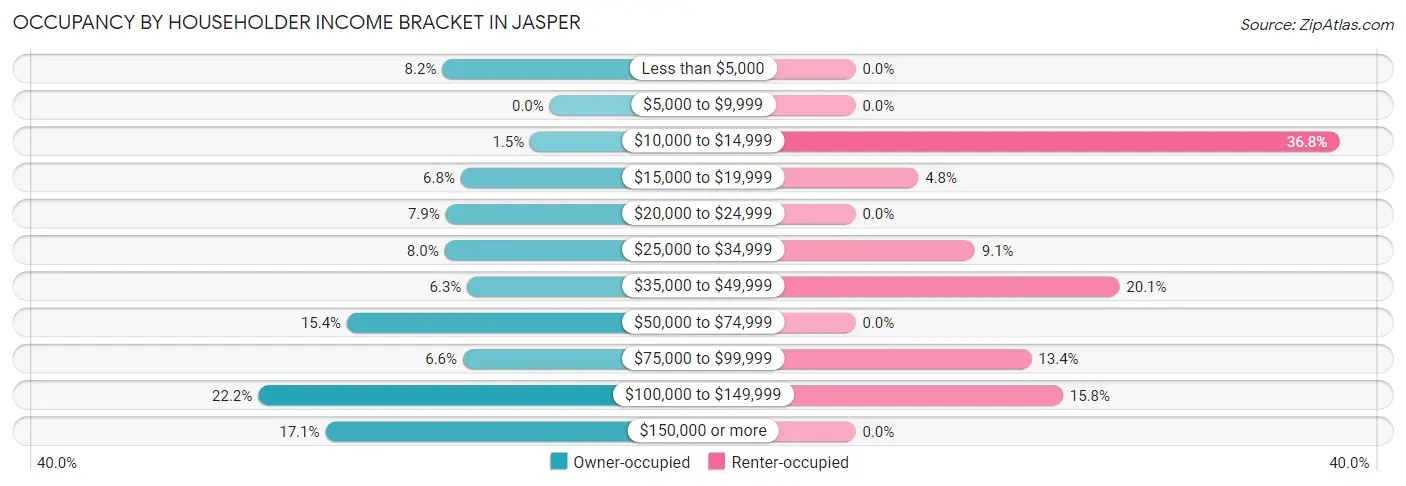
| Income Bracket | Owner-occupied | Renter-occupied |
| Less than $5,000 | 99 (8.2%) | 0 (0.0%) |
| $5,000 to $9,999 | 0 (0.0%) | 0 (0.0%) |
| $10,000 to $14,999 | 18 (1.5%) | 77 (36.8%) |
| $15,000 to $19,999 | 82 (6.8%) | 10 (4.8%) |
| $20,000 to $24,999 | 96 (7.9%) | 0 (0.0%) |
| $25,000 to $34,999 | 97 (8.0%) | 19 (9.1%) |
| $35,000 to $49,999 | 76 (6.3%) | 42 (20.1%) |
| $50,000 to $74,999 | 187 (15.4%) | 0 (0.0%) |
| $75,000 to $99,999 | 80 (6.6%) | 28 (13.4%) |
| $100,000 to $149,999 | 269 (22.2%) | 33 (15.8%) |
| $150,000 or more | 207 (17.1%) | 0 (0.0%) |
| Total | 1,211 (100.0%) | 209 (100.0%) |
Monthly Housing Cost Tiers in Jasper
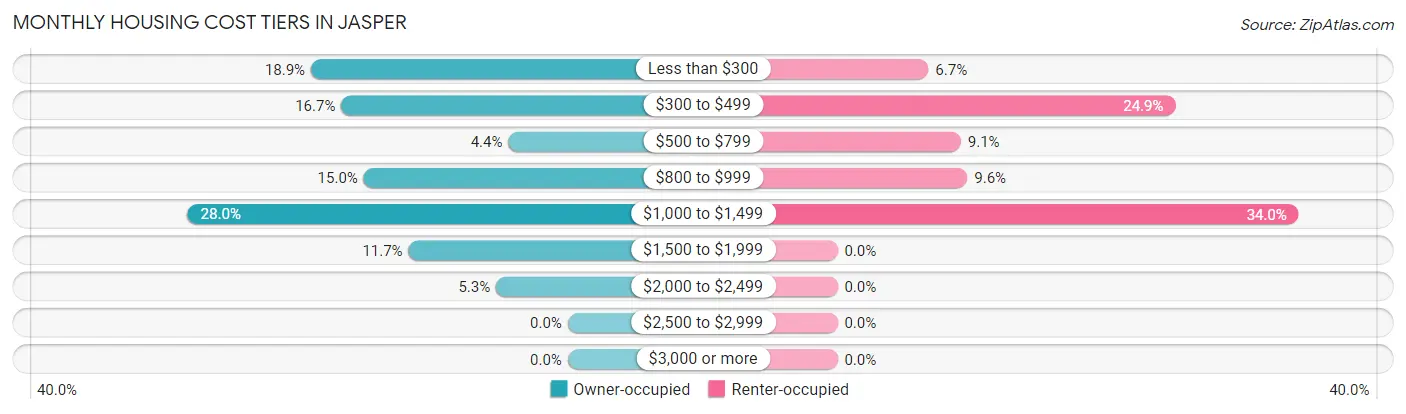
| Monthly Cost | Owner-occupied | Renter-occupied |
| Less than $300 | 229 (18.9%) | 14 (6.7%) |
| $300 to $499 | 202 (16.7%) | 52 (24.9%) |
| $500 to $799 | 53 (4.4%) | 19 (9.1%) |
| $800 to $999 | 182 (15.0%) | 20 (9.6%) |
| $1,000 to $1,499 | 339 (28.0%) | 71 (34.0%) |
| $1,500 to $1,999 | 142 (11.7%) | 0 (0.0%) |
| $2,000 to $2,499 | 64 (5.3%) | 0 (0.0%) |
| $2,500 to $2,999 | 0 (0.0%) | 0 (0.0%) |
| $3,000 or more | 0 (0.0%) | 0 (0.0%) |
| Total | 1,211 (100.0%) | 209 (100.0%) |
Physical Housing Characteristics in Jasper
Housing Structures in Jasper
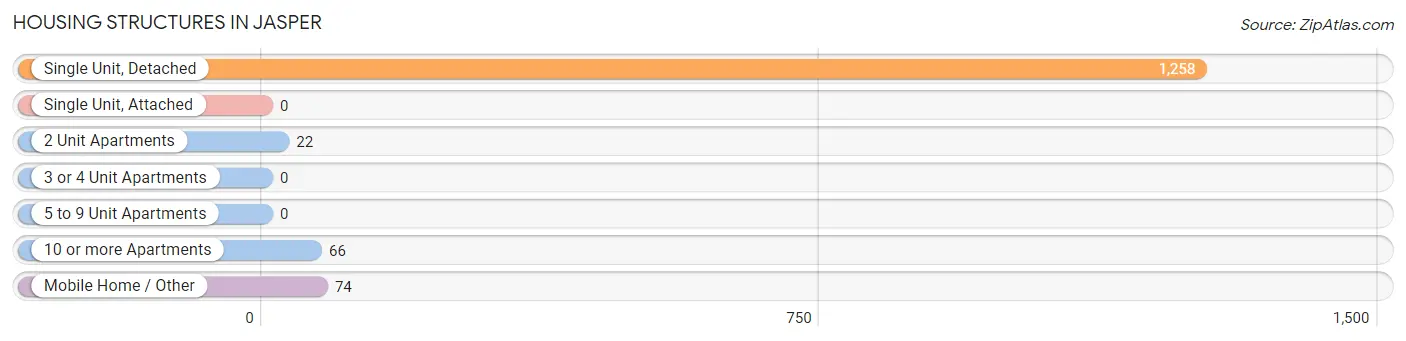
| Structure Type | # Housing Units | % Housing Units |
| Single Unit, Detached | 1,258 | 88.6% |
| Single Unit, Attached | 0 | 0.0% |
| 2 Unit Apartments | 22 | 1.5% |
| 3 or 4 Unit Apartments | 0 | 0.0% |
| 5 to 9 Unit Apartments | 0 | 0.0% |
| 10 or more Apartments | 66 | 4.6% |
| Mobile Home / Other | 74 | 5.2% |
| Total | 1,420 | 100.0% |
Housing Structures by Occupancy in Jasper
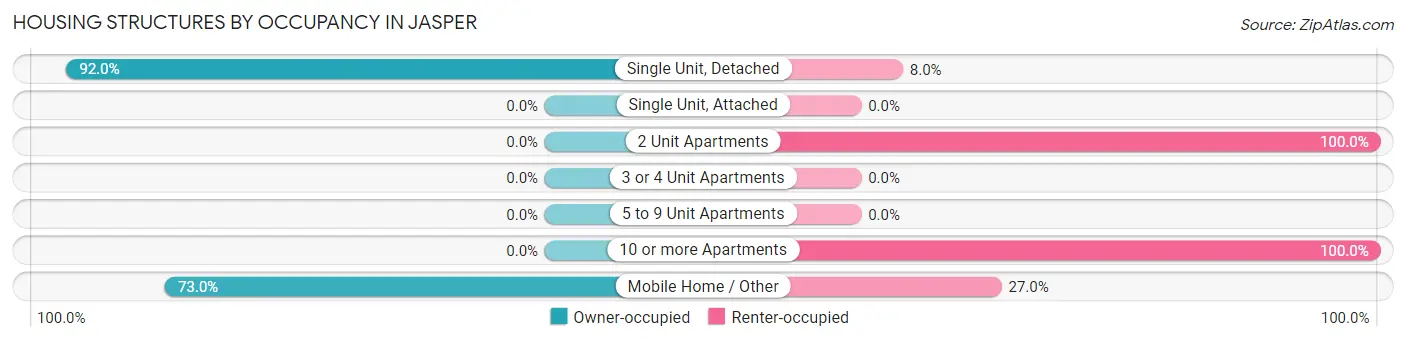
| Structure Type | Owner-occupied | Renter-occupied |
| Single Unit, Detached | 1,157 (92.0%) | 101 (8.0%) |
| Single Unit, Attached | 0 (0.0%) | 0 (0.0%) |
| 2 Unit Apartments | 0 (0.0%) | 22 (100.0%) |
| 3 or 4 Unit Apartments | 0 (0.0%) | 0 (0.0%) |
| 5 to 9 Unit Apartments | 0 (0.0%) | 0 (0.0%) |
| 10 or more Apartments | 0 (0.0%) | 66 (100.0%) |
| Mobile Home / Other | 54 (73.0%) | 20 (27.0%) |
| Total | 1,211 (85.3%) | 209 (14.7%) |
Housing Structures by Number of Rooms in Jasper
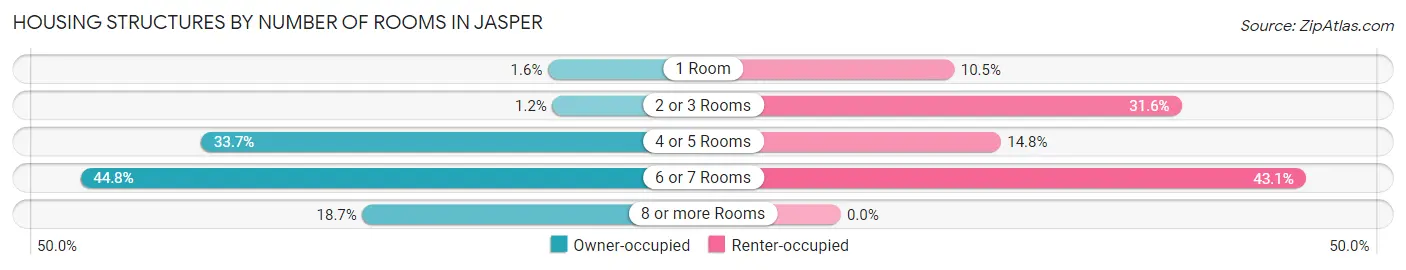
| Number of Rooms | Owner-occupied | Renter-occupied |
| 1 Room | 19 (1.6%) | 22 (10.5%) |
| 2 or 3 Rooms | 14 (1.2%) | 66 (31.6%) |
| 4 or 5 Rooms | 408 (33.7%) | 31 (14.8%) |
| 6 or 7 Rooms | 543 (44.8%) | 90 (43.1%) |
| 8 or more Rooms | 227 (18.7%) | 0 (0.0%) |
| Total | 1,211 (100.0%) | 209 (100.0%) |
Housing Structure by Heating Type in Jasper
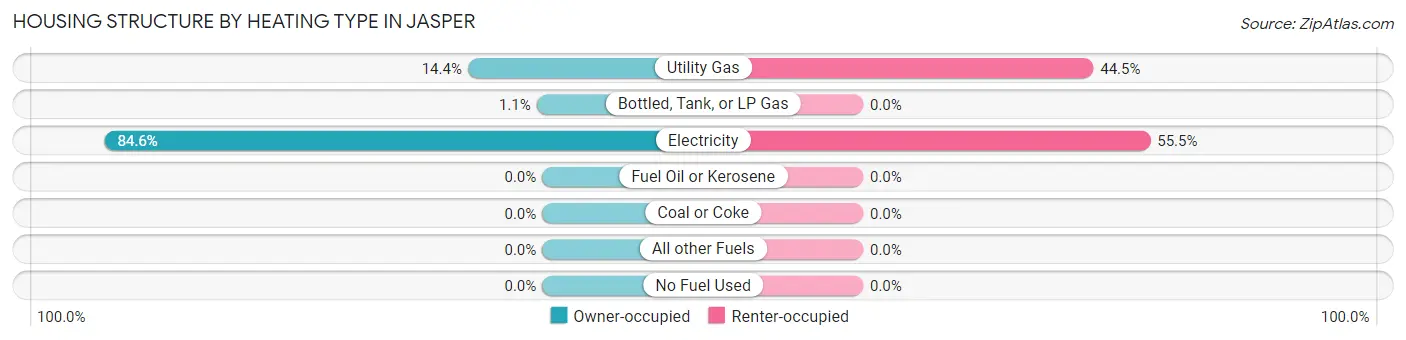
| Heating Type | Owner-occupied | Renter-occupied |
| Utility Gas | 174 (14.4%) | 93 (44.5%) |
| Bottled, Tank, or LP Gas | 13 (1.1%) | 0 (0.0%) |
| Electricity | 1,024 (84.6%) | 116 (55.5%) |
| Fuel Oil or Kerosene | 0 (0.0%) | 0 (0.0%) |
| Coal or Coke | 0 (0.0%) | 0 (0.0%) |
| All other Fuels | 0 (0.0%) | 0 (0.0%) |
| No Fuel Used | 0 (0.0%) | 0 (0.0%) |
| Total | 1,211 (100.0%) | 209 (100.0%) |
Household Vehicle Usage in Jasper
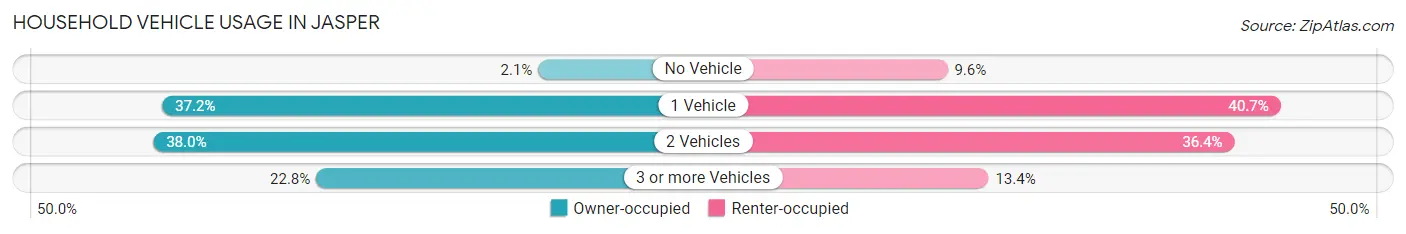
| Vehicles per Household | Owner-occupied | Renter-occupied |
| No Vehicle | 25 (2.1%) | 20 (9.6%) |
| 1 Vehicle | 450 (37.2%) | 85 (40.7%) |
| 2 Vehicles | 460 (38.0%) | 76 (36.4%) |
| 3 or more Vehicles | 276 (22.8%) | 28 (13.4%) |
| Total | 1,211 (100.0%) | 209 (100.0%) |
Real Estate & Mortgages in Jasper
Real Estate and Mortgage Overview in Jasper
| Characteristic | Without Mortgage | With Mortgage |
| Housing Units | 465 | 746 |
| Median Property Value | - | - |
| Median Household Income | $21,888 | $167 |
| Monthly Housing Costs | $302 | $0 |
| Real Estate Taxes | $877 | $101 |
Property Value by Mortgage Status in Jasper
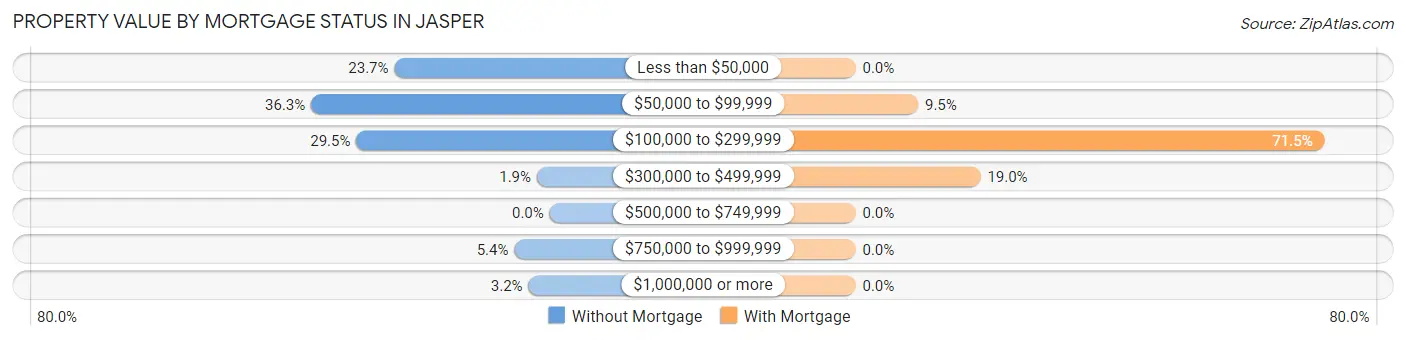
| Property Value | Without Mortgage | With Mortgage |
| Less than $50,000 | 110 (23.7%) | 0 (0.0%) |
| $50,000 to $99,999 | 169 (36.3%) | 71 (9.5%) |
| $100,000 to $299,999 | 137 (29.5%) | 533 (71.5%) |
| $300,000 to $499,999 | 9 (1.9%) | 142 (19.0%) |
| $500,000 to $749,999 | 0 (0.0%) | 0 (0.0%) |
| $750,000 to $999,999 | 25 (5.4%) | 0 (0.0%) |
| $1,000,000 or more | 15 (3.2%) | 0 (0.0%) |
| Total | 465 (100.0%) | 746 (100.0%) |
Household Income by Mortgage Status in Jasper
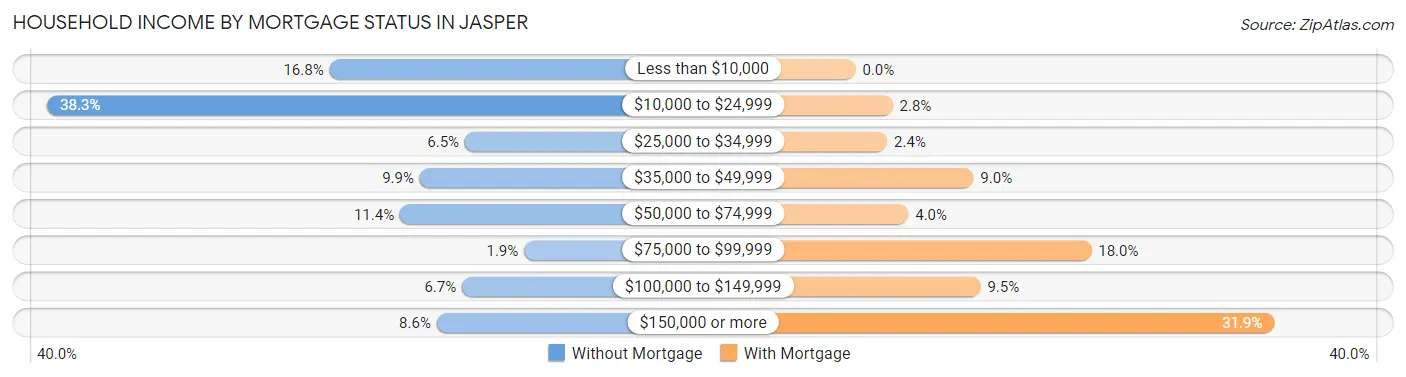
| Household Income | Without Mortgage | With Mortgage |
| Less than $10,000 | 78 (16.8%) | 0 (0.0%) |
| $10,000 to $24,999 | 178 (38.3%) | 21 (2.8%) |
| $25,000 to $34,999 | 30 (6.5%) | 18 (2.4%) |
| $35,000 to $49,999 | 46 (9.9%) | 67 (9.0%) |
| $50,000 to $74,999 | 53 (11.4%) | 30 (4.0%) |
| $75,000 to $99,999 | 9 (1.9%) | 134 (18.0%) |
| $100,000 to $149,999 | 31 (6.7%) | 71 (9.5%) |
| $150,000 or more | 40 (8.6%) | 238 (31.9%) |
| Total | 465 (100.0%) | 746 (100.0%) |
Property Value to Household Income Ratio in Jasper
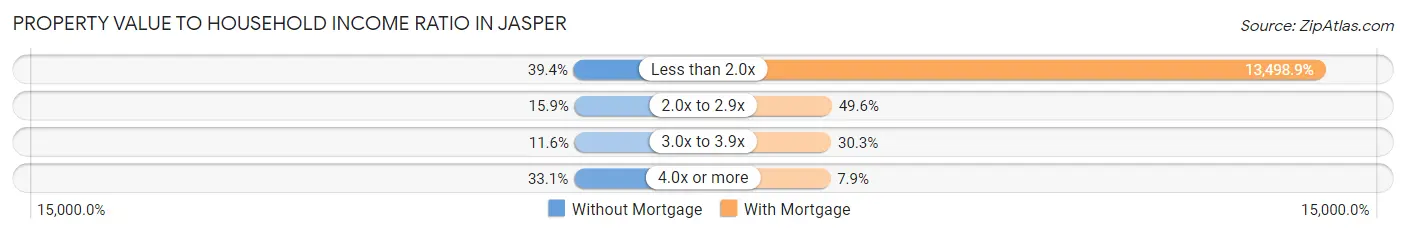
| Value-to-Income Ratio | Without Mortgage | With Mortgage |
| Less than 2.0x | 183 (39.4%) | 100,702 (13,498.9%) |
| 2.0x to 2.9x | 74 (15.9%) | 370 (49.6%) |
| 3.0x to 3.9x | 54 (11.6%) | 226 (30.3%) |
| 4.0x or more | 154 (33.1%) | 59 (7.9%) |
| Total | 465 (100.0%) | 746 (100.0%) |
Real Estate Taxes by Mortgage Status in Jasper
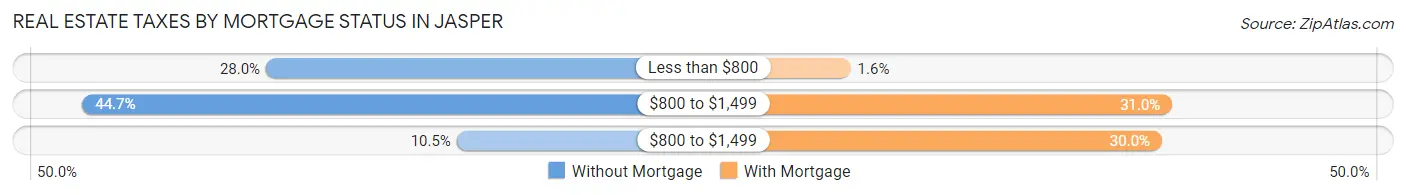
| Property Taxes | Without Mortgage | With Mortgage |
| Less than $800 | 130 (28.0%) | 12 (1.6%) |
| $800 to $1,499 | 208 (44.7%) | 231 (31.0%) |
| $800 to $1,499 | 49 (10.5%) | 224 (30.0%) |
| Total | 465 (100.0%) | 746 (100.0%) |
Health & Disability in Jasper
Health Insurance Coverage by Age in Jasper
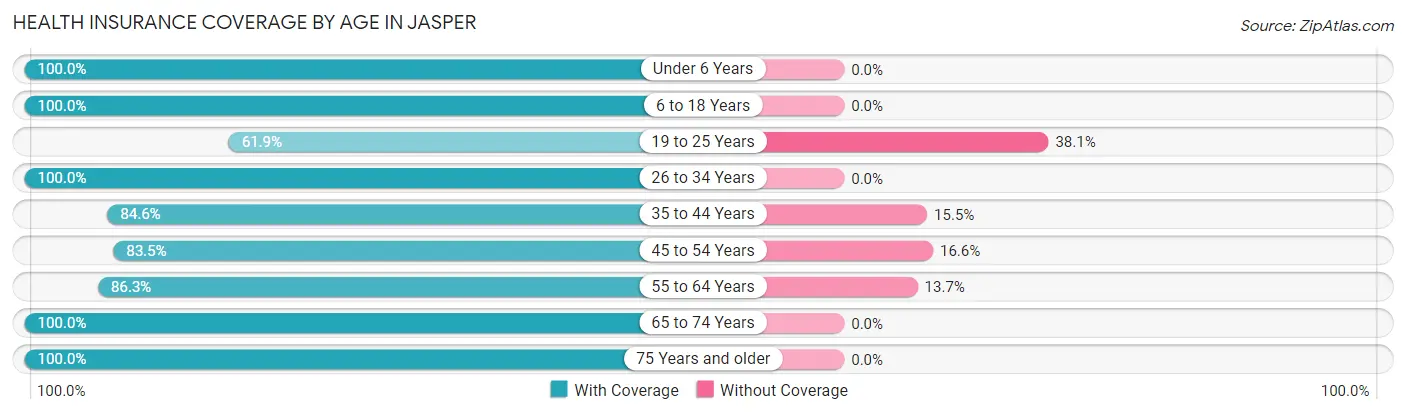
| Age Bracket | With Coverage | Without Coverage |
| Under 6 Years | 429 (100.0%) | 0 (0.0%) |
| 6 to 18 Years | 446 (100.0%) | 0 (0.0%) |
| 19 to 25 Years | 148 (61.9%) | 91 (38.1%) |
| 26 to 34 Years | 518 (100.0%) | 0 (0.0%) |
| 35 to 44 Years | 465 (84.6%) | 85 (15.4%) |
| 45 to 54 Years | 247 (83.5%) | 49 (16.6%) |
| 55 to 64 Years | 347 (86.3%) | 55 (13.7%) |
| 65 to 74 Years | 279 (100.0%) | 0 (0.0%) |
| 75 Years and older | 333 (100.0%) | 0 (0.0%) |
| Total | 3,212 (92.0%) | 280 (8.0%) |
Health Insurance Coverage by Citizenship Status in Jasper
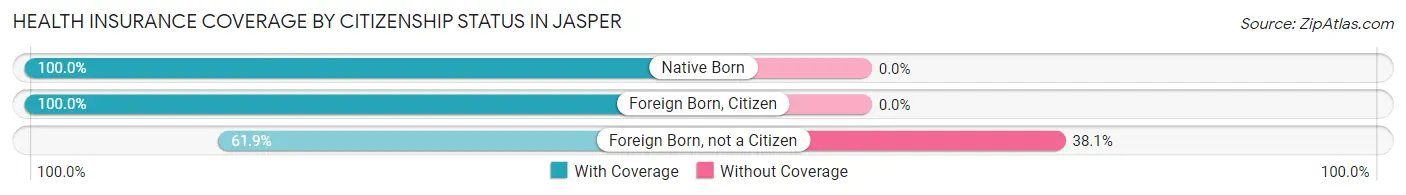
| Citizenship Status | With Coverage | Without Coverage |
| Native Born | 429 (100.0%) | 0 (0.0%) |
| Foreign Born, Citizen | 446 (100.0%) | 0 (0.0%) |
| Foreign Born, not a Citizen | 148 (61.9%) | 91 (38.1%) |
Health Insurance Coverage by Household Income in Jasper
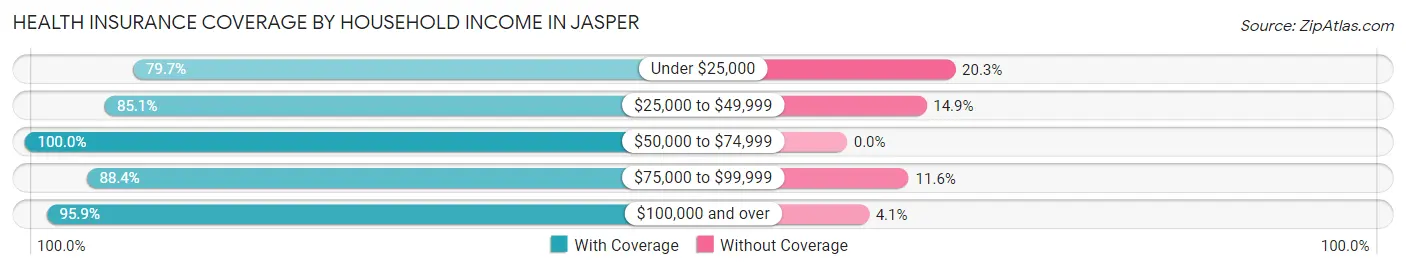
| Household Income | With Coverage | Without Coverage |
| Under $25,000 | 444 (79.7%) | 113 (20.3%) |
| $25,000 to $49,999 | 320 (85.1%) | 56 (14.9%) |
| $50,000 to $74,999 | 486 (100.0%) | 0 (0.0%) |
| $75,000 to $99,999 | 305 (88.4%) | 40 (11.6%) |
| $100,000 and over | 1,657 (95.9%) | 71 (4.1%) |
Public vs Private Health Insurance Coverage by Age in Jasper
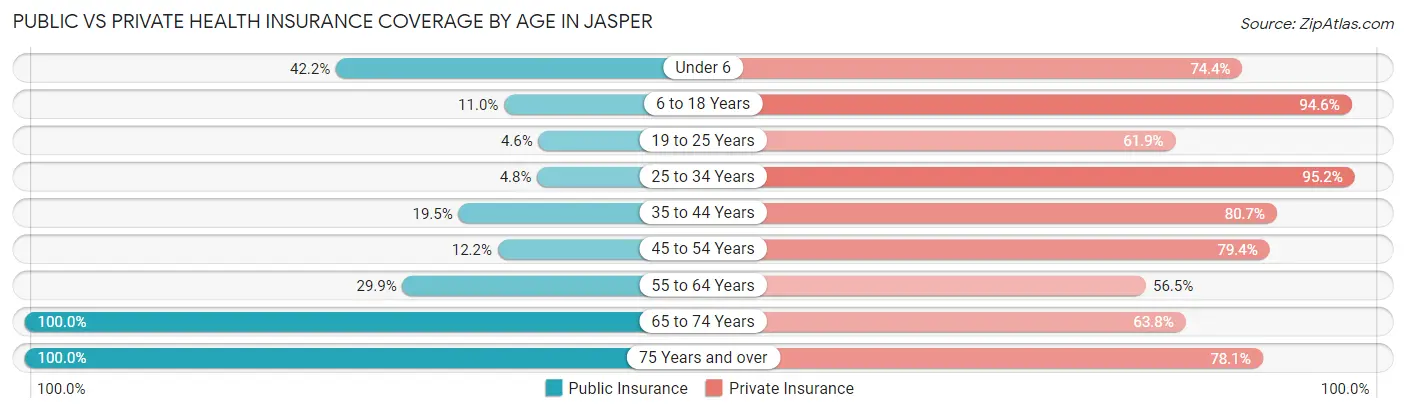
| Age Bracket | Public Insurance | Private Insurance |
| Under 6 | 181 (42.2%) | 319 (74.4%) |
| 6 to 18 Years | 49 (11.0%) | 422 (94.6%) |
| 19 to 25 Years | 11 (4.6%) | 148 (61.9%) |
| 25 to 34 Years | 25 (4.8%) | 493 (95.2%) |
| 35 to 44 Years | 107 (19.5%) | 444 (80.7%) |
| 45 to 54 Years | 36 (12.2%) | 235 (79.4%) |
| 55 to 64 Years | 120 (29.8%) | 227 (56.5%) |
| 65 to 74 Years | 279 (100.0%) | 178 (63.8%) |
| 75 Years and over | 333 (100.0%) | 260 (78.1%) |
| Total | 1,141 (32.7%) | 2,726 (78.1%) |
Disability Status by Sex by Age in Jasper
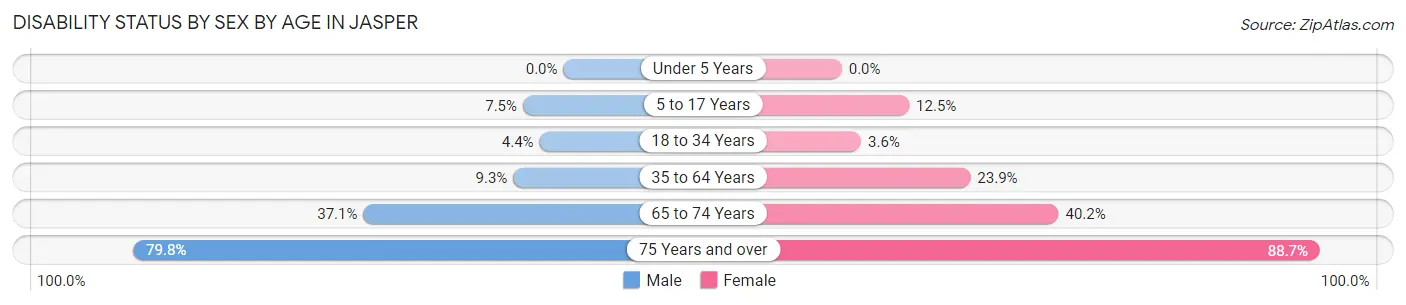
| Age Bracket | Male | Female |
| Under 5 Years | 0 (0.0%) | 0 (0.0%) |
| 5 to 17 Years | 19 (7.5%) | 32 (12.5%) |
| 18 to 34 Years | 20 (4.4%) | 11 (3.6%) |
| 35 to 64 Years | 46 (9.3%) | 180 (23.9%) |
| 65 to 74 Years | 39 (37.1%) | 70 (40.2%) |
| 75 Years and over | 103 (79.8%) | 181 (88.7%) |
Disability Class by Sex by Age in Jasper
Disability Class: Hearing Difficulty
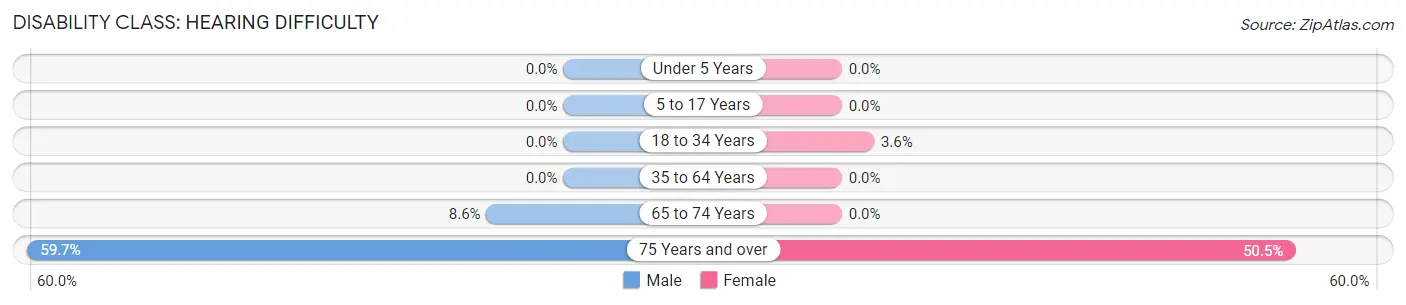
| Age Bracket | Male | Female |
| Under 5 Years | 0 (0.0%) | 0 (0.0%) |
| 5 to 17 Years | 0 (0.0%) | 0 (0.0%) |
| 18 to 34 Years | 0 (0.0%) | 11 (3.6%) |
| 35 to 64 Years | 0 (0.0%) | 0 (0.0%) |
| 65 to 74 Years | 9 (8.6%) | 0 (0.0%) |
| 75 Years and over | 77 (59.7%) | 103 (50.5%) |
Disability Class: Vision Difficulty
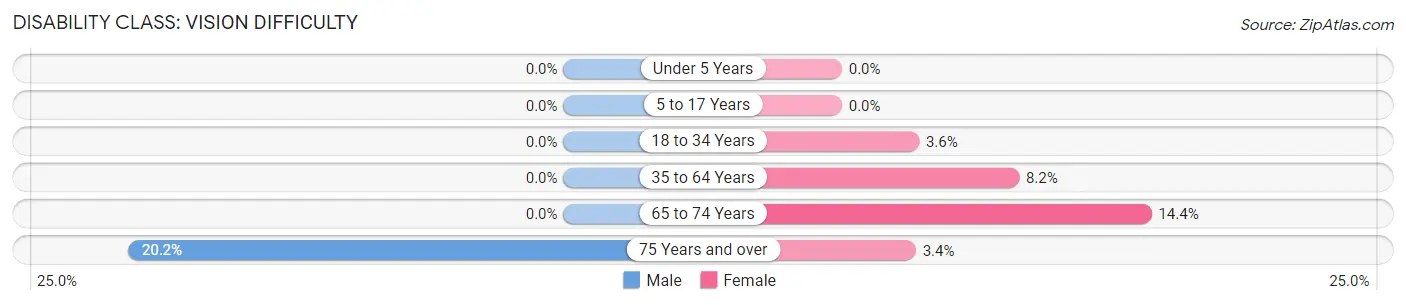
| Age Bracket | Male | Female |
| Under 5 Years | 0 (0.0%) | 0 (0.0%) |
| 5 to 17 Years | 0 (0.0%) | 0 (0.0%) |
| 18 to 34 Years | 0 (0.0%) | 11 (3.6%) |
| 35 to 64 Years | 0 (0.0%) | 62 (8.2%) |
| 65 to 74 Years | 0 (0.0%) | 25 (14.4%) |
| 75 Years and over | 26 (20.2%) | 7 (3.4%) |
Disability Class: Cognitive Difficulty
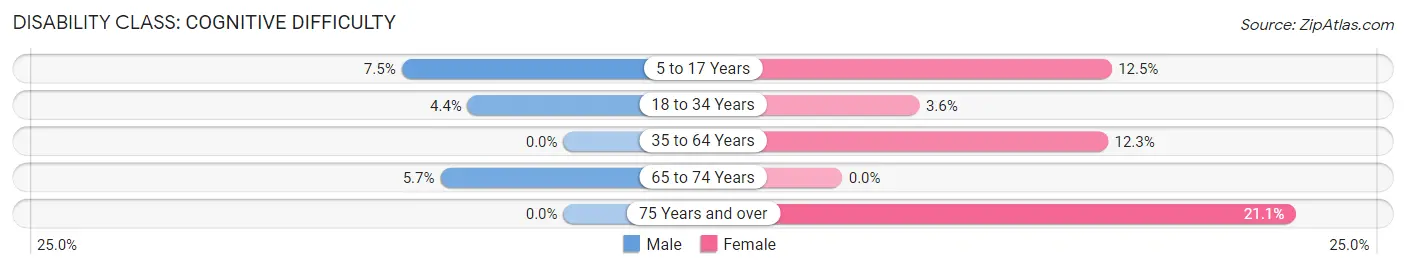
| Age Bracket | Male | Female |
| 5 to 17 Years | 19 (7.5%) | 32 (12.5%) |
| 18 to 34 Years | 20 (4.4%) | 11 (3.6%) |
| 35 to 64 Years | 0 (0.0%) | 93 (12.3%) |
| 65 to 74 Years | 6 (5.7%) | 0 (0.0%) |
| 75 Years and over | 0 (0.0%) | 43 (21.1%) |
Disability Class: Ambulatory Difficulty
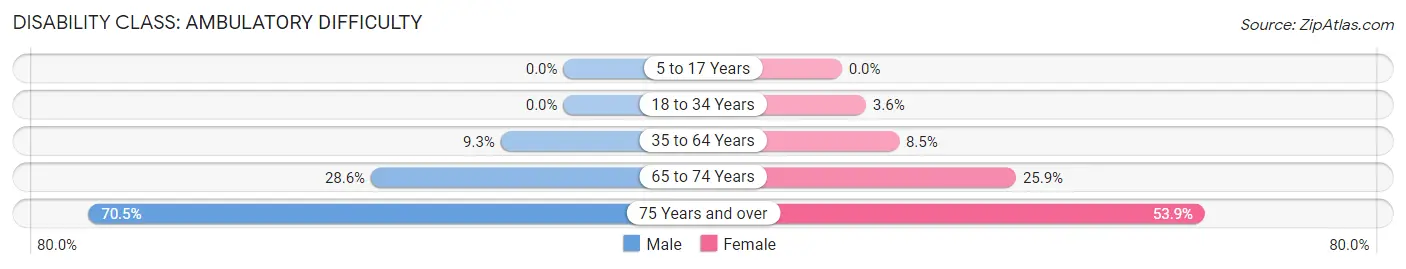
| Age Bracket | Male | Female |
| 5 to 17 Years | 0 (0.0%) | 0 (0.0%) |
| 18 to 34 Years | 0 (0.0%) | 11 (3.6%) |
| 35 to 64 Years | 46 (9.3%) | 64 (8.5%) |
| 65 to 74 Years | 30 (28.6%) | 45 (25.9%) |
| 75 Years and over | 91 (70.5%) | 110 (53.9%) |
Disability Class: Self-Care Difficulty
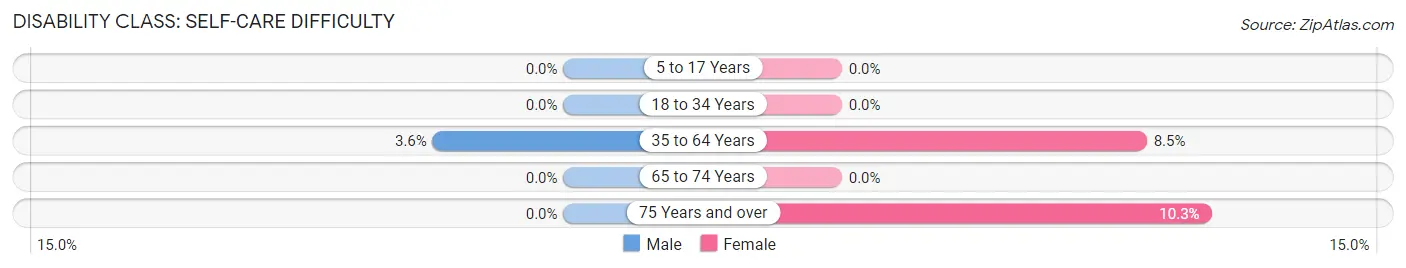
| Age Bracket | Male | Female |
| 5 to 17 Years | 0 (0.0%) | 0 (0.0%) |
| 18 to 34 Years | 0 (0.0%) | 0 (0.0%) |
| 35 to 64 Years | 18 (3.6%) | 64 (8.5%) |
| 65 to 74 Years | 0 (0.0%) | 0 (0.0%) |
| 75 Years and over | 0 (0.0%) | 21 (10.3%) |
Technology Access in Jasper
Computing Device Access in Jasper
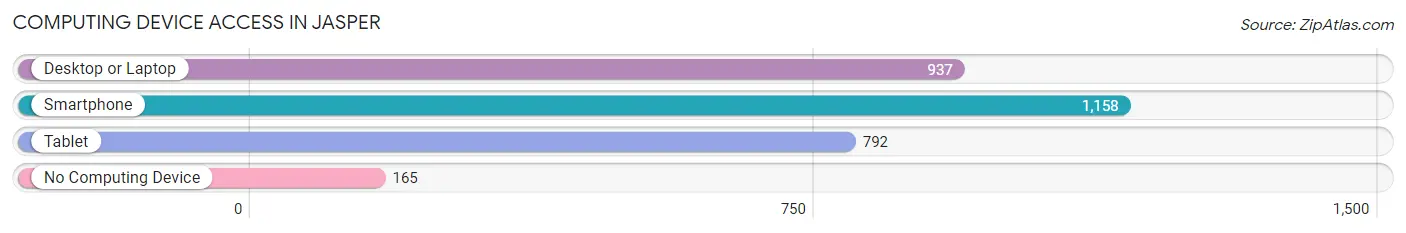
| Device Type | # Households | % Households |
| Desktop or Laptop | 937 | 66.0% |
| Smartphone | 1,158 | 81.6% |
| Tablet | 792 | 55.8% |
| No Computing Device | 165 | 11.6% |
| Total | 1,420 | 100.0% |
Internet Access in Jasper
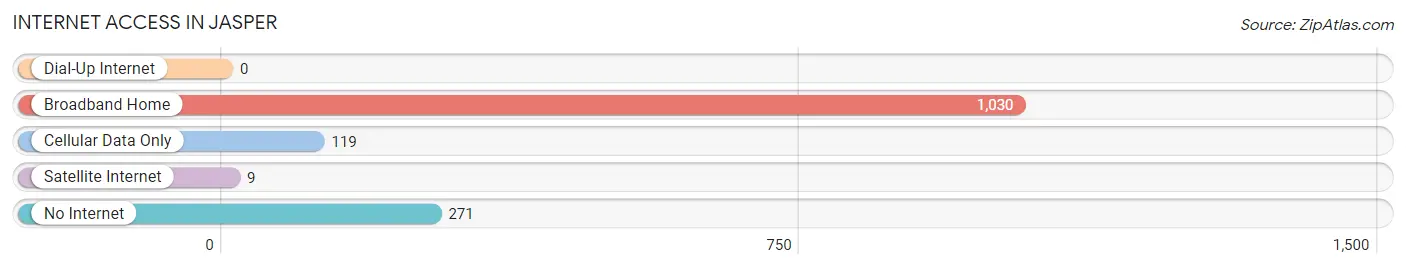
| Internet Type | # Households | % Households |
| Dial-Up Internet | 0 | 0.0% |
| Broadband Home | 1,030 | 72.5% |
| Cellular Data Only | 119 | 8.4% |
| Satellite Internet | 9 | 0.6% |
| No Internet | 271 | 19.1% |
| Total | 1,420 | 100.0% |
Jasper Summary
Jasper, Tennessee is a small town located in Marion County, Tennessee. It is situated in the foothills of the Appalachian Mountains and is part of the Chattanooga metropolitan area. The town has a population of approximately 3,000 people and is known for its rural charm and friendly atmosphere.
History
Jasper was founded in 1820 by a group of settlers from North Carolina. The town was named after William Jasper, a Revolutionary War hero who died in the Battle of Fort Moultrie. The town was originally a farming community, but it soon developed into a small industrial center. In the late 19th century, Jasper was home to several factories, including a cotton mill, a sawmill, and a gristmill.
In the early 20th century, Jasper experienced a period of growth and prosperity. The town was home to several businesses, including a bank, a hotel, and a movie theater. The town also had a thriving music scene, with several local bands playing in the area.
Geography
Jasper is located in the foothills of the Appalachian Mountains in Marion County, Tennessee. The town is situated on the banks of the Sequatchie River, which flows through the town. The town is surrounded by rolling hills and lush forests. The climate in Jasper is mild, with temperatures ranging from the mid-50s in the winter to the mid-80s in the summer.
Economy
Jasper’s economy is largely based on agriculture and tourism. The town is home to several farms, which produce a variety of crops, including corn, soybeans, and hay. The town is also home to several tourist attractions, including the Sequatchie Valley Railroad Museum and the Sequatchie Valley Winery.
Demographics
As of the 2010 census, Jasper had a population of 3,000 people. The racial makeup of the town was 95.2% White, 1.7% African American, 0.3% Native American, 0.3% Asian, 0.1% Pacific Islander, and 2.5% from other races. The median household income in Jasper was $35,000, and the median age was 40.
Jasper is a small town with a rich history and a friendly atmosphere. The town is home to several farms and tourist attractions, and it is a popular destination for outdoor enthusiasts. The town is also home to a diverse population, with a variety of racial and ethnic backgrounds.
Common Questions
What is Per Capita Income in Jasper?
Per Capita income in Jasper is $30,074.
What is the Median Family Income in Jasper?
Median Family Income in Jasper is $82,118.
What is the Median Household income in Jasper?
Median Household Income in Jasper is $58,971.
What is Income or Wage Gap in Jasper?
Income or Wage Gap in Jasper is 5.3%.
Women in Jasper earn 94.7 cents for every dollar earned by a man.
What is Inequality or Gini Index in Jasper?
Inequality or Gini Index in Jasper is 0.44.
What is the Total Population of Jasper?
Total Population of Jasper is 3,592.
What is the Total Male Population of Jasper?
Total Male Population of Jasper is 1,610.
What is the Total Female Population of Jasper?
Total Female Population of Jasper is 1,982.
What is the Ratio of Males per 100 Females in Jasper?
There are 81.23 Males per 100 Females in Jasper.
What is the Ratio of Females per 100 Males in Jasper?
There are 123.11 Females per 100 Males in Jasper.
What is the Median Population Age in Jasper?
Median Population Age in Jasper is 36.9 Years.
What is the Average Family Size in Jasper
Average Family Size in Jasper is 2.9 People.
What is the Average Household Size in Jasper
Average Household Size in Jasper is 2.5 People.
How Large is the Labor Force in Jasper?
There are 1,610 People in the Labor Forcein in Jasper.
What is the Percentage of People in the Labor Force in Jasper?
56.3% of People are in the Labor Force in Jasper.
What is the Unemployment Rate in Jasper?
Unemployment Rate in Jasper is 2.7%.