Jacksboro, TN Map & Demographics
Jacksboro Map
Jacksboro Overview
$26,802
PER CAPITA INCOME
$74,792
AVG FAMILY INCOME
$54,191
AVG HOUSEHOLD INCOME
31.7%
WAGE / INCOME GAP [ % ]
68.3¢/ $1
WAGE / INCOME GAP [ $ ]
$9,230
FAMILY INCOME DEFICIT
0.41
INEQUALITY / GINI INDEX
2,775
TOTAL POPULATION
1,350
MALE POPULATION
1,425
FEMALE POPULATION
94.74
MALES / 100 FEMALES
105.56
FEMALES / 100 MALES
38.5
MEDIAN AGE
3.0
AVG FAMILY SIZE
2.4
AVG HOUSEHOLD SIZE
1,200
LABOR FORCE [ PEOPLE ]
51.2%
PERCENT IN LABOR FORCE
6.5%
UNEMPLOYMENT RATE
Jacksboro Zip Codes
Jacksboro Area Codes
Income in Jacksboro
Income Overview in Jacksboro
Per Capita Income in Jacksboro is $26,802, while median incomes of families and households are $74,792 and $54,191 respectively.
| Characteristic | Number | Measure |
| Per Capita Income | 2,775 | $26,802 |
| Median Family Income | 679 | $74,792 |
| Mean Family Income | 679 | $78,905 |
| Median Household Income | 1,072 | $54,191 |
| Mean Household Income | 1,072 | $65,251 |
| Income Deficit | 679 | $9,230 |
| Wage / Income Gap (%) | 2,775 | 31.74% |
| Wage / Income Gap ($) | 2,775 | 68.26¢ per $1 |
| Gini / Inequality Index | 2,775 | 0.41 |
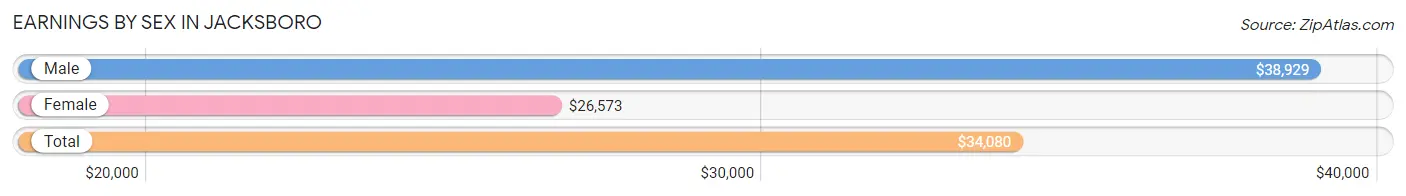
Earnings by Sex in Jacksboro
Average Earnings in Jacksboro are $34,080, $38,929 for men and $26,573 for women, a difference of 31.7%.
| Sex | Number | Average Earnings |
| Male | 730 (53.9%) | $38,929 |
| Female | 623 (46.1%) | $26,573 |
| Total | 1,353 (100.0%) | $34,080 |
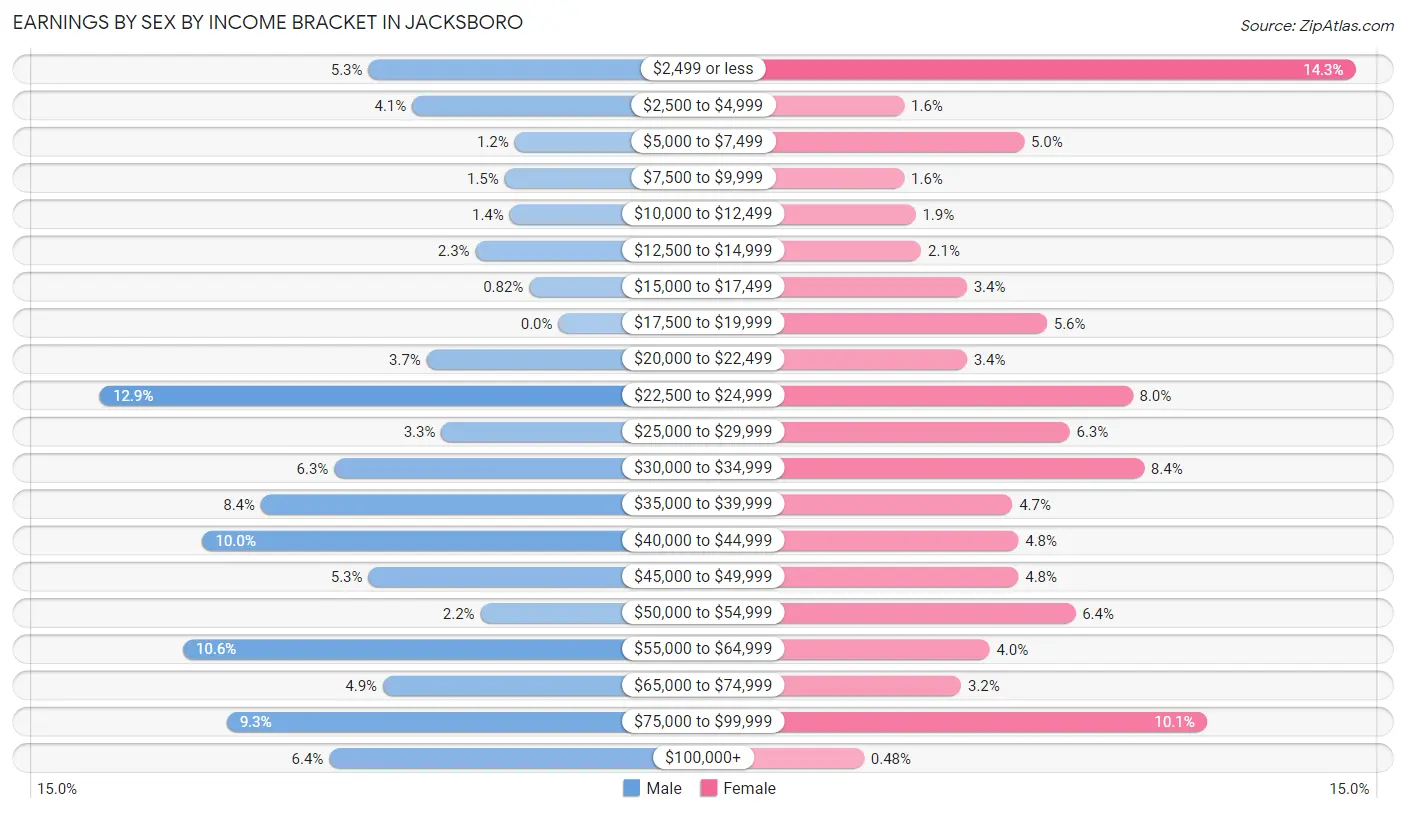
Earnings by Sex by Income Bracket in Jacksboro
The most common earnings brackets in Jacksboro are $22,500 to $24,999 for men (94 | 12.9%) and $2,499 or less for women (89 | 14.3%).
| Income | Male | Female |
| $2,499 or less | 39 (5.3%) | 89 (14.3%) |
| $2,500 to $4,999 | 30 (4.1%) | 10 (1.6%) |
| $5,000 to $7,499 | 9 (1.2%) | 31 (5.0%) |
| $7,500 to $9,999 | 11 (1.5%) | 10 (1.6%) |
| $10,000 to $12,499 | 10 (1.4%) | 12 (1.9%) |
| $12,500 to $14,999 | 17 (2.3%) | 13 (2.1%) |
| $15,000 to $17,499 | 6 (0.8%) | 21 (3.4%) |
| $17,500 to $19,999 | 0 (0.0%) | 35 (5.6%) |
| $20,000 to $22,499 | 27 (3.7%) | 21 (3.4%) |
| $22,500 to $24,999 | 94 (12.9%) | 50 (8.0%) |
| $25,000 to $29,999 | 24 (3.3%) | 39 (6.3%) |
| $30,000 to $34,999 | 46 (6.3%) | 52 (8.4%) |
| $35,000 to $39,999 | 61 (8.4%) | 29 (4.6%) |
| $40,000 to $44,999 | 73 (10.0%) | 30 (4.8%) |
| $45,000 to $49,999 | 39 (5.3%) | 30 (4.8%) |
| $50,000 to $54,999 | 16 (2.2%) | 40 (6.4%) |
| $55,000 to $64,999 | 77 (10.5%) | 25 (4.0%) |
| $65,000 to $74,999 | 36 (4.9%) | 20 (3.2%) |
| $75,000 to $99,999 | 68 (9.3%) | 63 (10.1%) |
| $100,000+ | 47 (6.4%) | 3 (0.5%) |
| Total | 730 (100.0%) | 623 (100.0%) |
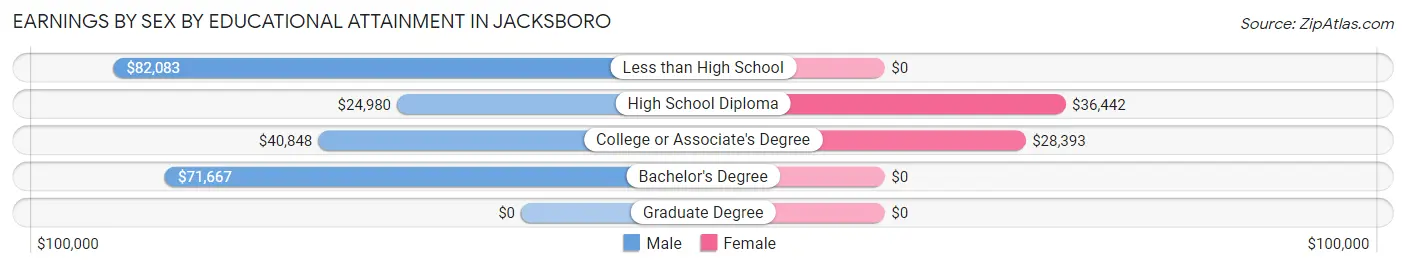
Earnings by Sex by Educational Attainment in Jacksboro
Average earnings in Jacksboro are $41,453 for men and $32,702 for women, a difference of 21.1%. Men with an educational attainment of less than high school enjoy the highest average annual earnings of $82,083, while those with high school diploma education earn the least with $24,980. Women with an educational attainment of high school diploma earn the most with the average annual earnings of $36,442, while those with college or associate's degree education have the smallest earnings of $28,393.
| Educational Attainment | Male Income | Female Income |
| Less than High School | $82,083 | $0 |
| High School Diploma | $24,980 | $36,442 |
| College or Associate's Degree | $40,848 | $28,393 |
| Bachelor's Degree | $71,667 | $0 |
| Graduate Degree | - | - |
| Total | $41,453 | $32,702 |
Family Income in Jacksboro
Family Income Brackets in Jacksboro
According to the Jacksboro family income data, there are 181 families falling into the $75,000 to $99,999 income range, which is the most common income bracket and makes up 26.7% of all families. Conversely, the $10,000 to $14,999 income bracket is the least frequent group with only 4 families (0.6%) belonging to this category.
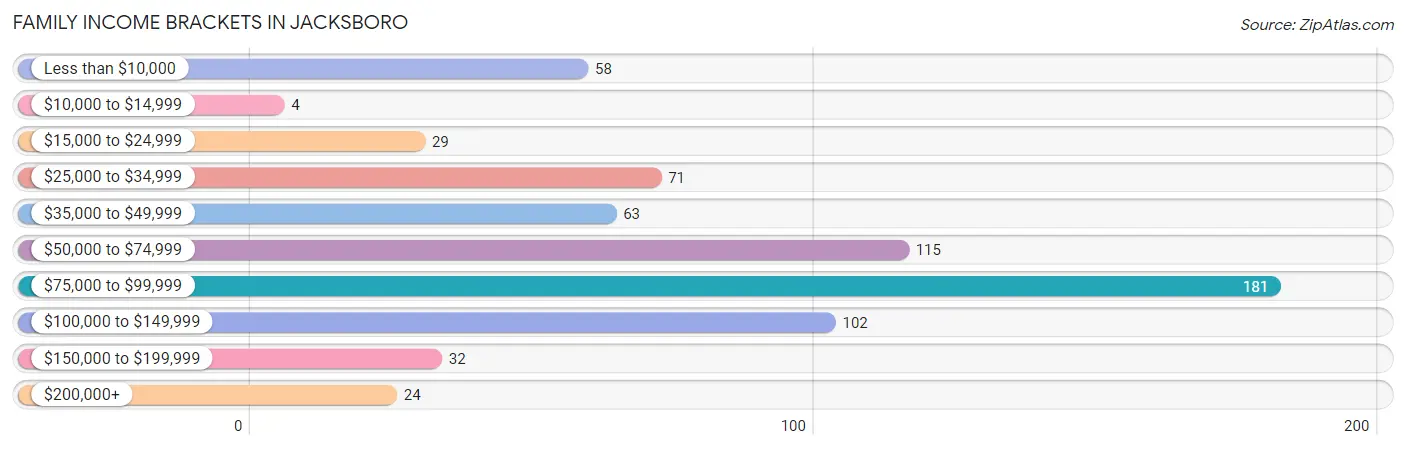
| Income Bracket | # Families | % Families |
| Less than $10,000 | 58 | 8.5% |
| $10,000 to $14,999 | 4 | 0.6% |
| $15,000 to $24,999 | 29 | 4.3% |
| $25,000 to $34,999 | 71 | 10.5% |
| $35,000 to $49,999 | 63 | 9.3% |
| $50,000 to $74,999 | 115 | 16.9% |
| $75,000 to $99,999 | 181 | 26.7% |
| $100,000 to $149,999 | 102 | 15.0% |
| $150,000 to $199,999 | 32 | 4.7% |
| $200,000+ | 24 | 3.5% |
Family Income by Famaliy Size in Jacksboro
5-person families (39 | 5.7%) account for the highest median family income in Jacksboro with $90,759 per family, while 2-person families (345 | 50.8%) have the highest median income of $24,716 per family member.
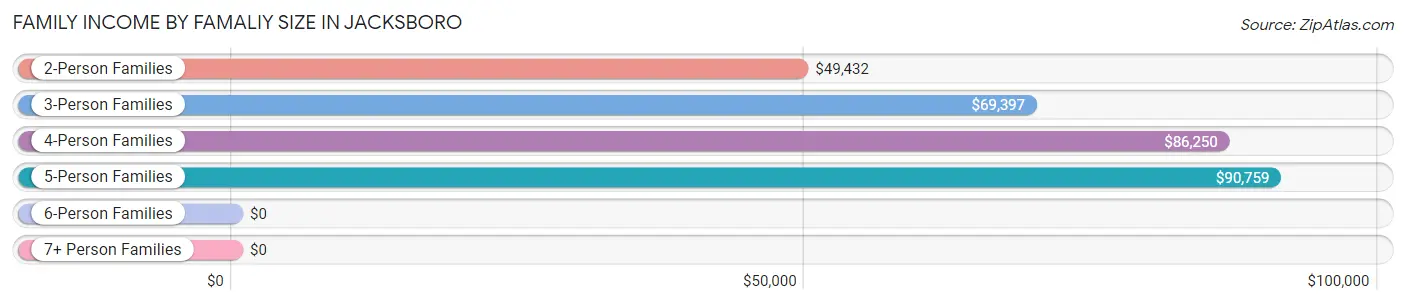
| Income Bracket | # Families | Median Income |
| 2-Person Families | 345 (50.8%) | $49,432 |
| 3-Person Families | 150 (22.1%) | $69,397 |
| 4-Person Families | 106 (15.6%) | $86,250 |
| 5-Person Families | 39 (5.7%) | $90,759 |
| 6-Person Families | 20 (2.9%) | $0 |
| 7+ Person Families | 19 (2.8%) | $0 |
| Total | 679 (100.0%) | $74,792 |
Family Income by Number of Earners in Jacksboro
The median family income in Jacksboro is $74,792, with families comprising 3+ earners (76) having the highest median family income of $154,688, while families with no earners (142) have the lowest median family income of $34,519, accounting for 11.2% and 20.9% of families, respectively.
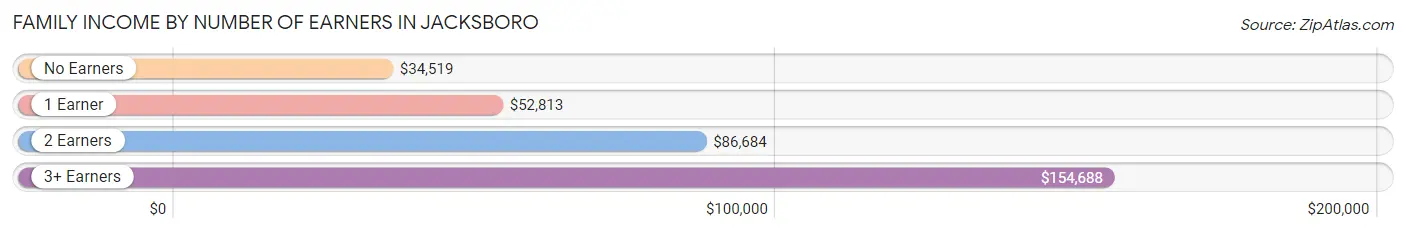
| Number of Earners | # Families | Median Income |
| No Earners | 142 (20.9%) | $34,519 |
| 1 Earner | 213 (31.4%) | $52,813 |
| 2 Earners | 248 (36.5%) | $86,684 |
| 3+ Earners | 76 (11.2%) | $154,688 |
| Total | 679 (100.0%) | $74,792 |
Household Income in Jacksboro
Household Income Brackets in Jacksboro
With 228 households falling in the category, the $75,000 to $99,999 income range is the most frequent in Jacksboro, accounting for 21.3% of all households. In contrast, only 24 households (2.2%) fall into the $200,000+ income bracket, making it the least populous group.
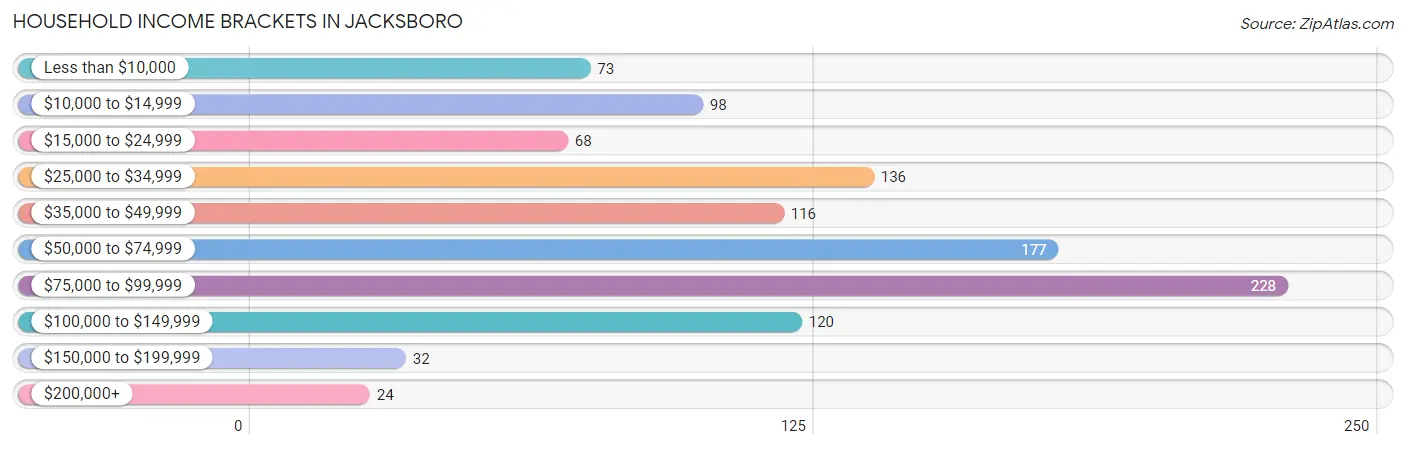
| Income Bracket | # Households | % Households |
| Less than $10,000 | 73 | 6.8% |
| $10,000 to $14,999 | 98 | 9.1% |
| $15,000 to $24,999 | 68 | 6.3% |
| $25,000 to $34,999 | 136 | 12.7% |
| $35,000 to $49,999 | 116 | 10.8% |
| $50,000 to $74,999 | 177 | 16.5% |
| $75,000 to $99,999 | 228 | 21.3% |
| $100,000 to $149,999 | 120 | 11.2% |
| $150,000 to $199,999 | 32 | 3.0% |
| $200,000+ | 24 | 2.2% |
Household Income by Householder Age in Jacksboro
The median household income in Jacksboro is $54,191, with the highest median household income of $69,423 found in the 45 to 64 years age bracket for the primary householder. A total of 492 households (45.9%) fall into this category. Meanwhile, the 65+ years age bracket for the primary householder has the lowest median household income of $33,750, with 300 households (28.0%) in this group.
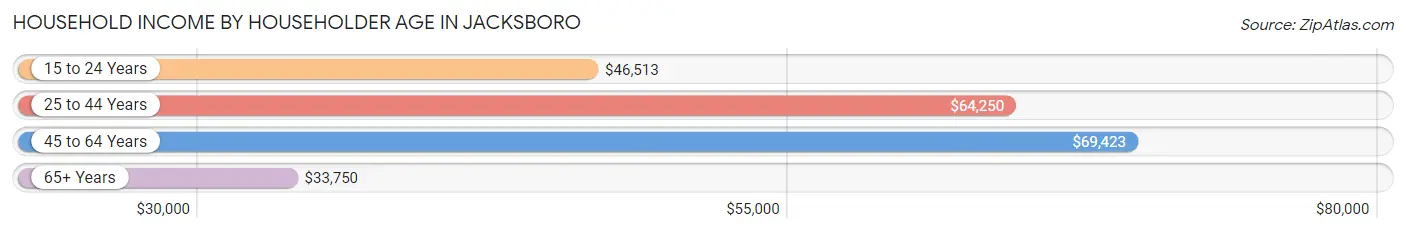
| Income Bracket | # Households | Median Income |
| 15 to 24 Years | 57 (5.3%) | $46,513 |
| 25 to 44 Years | 223 (20.8%) | $64,250 |
| 45 to 64 Years | 492 (45.9%) | $69,423 |
| 65+ Years | 300 (28.0%) | $33,750 |
| Total | 1,072 (100.0%) | $54,191 |
Poverty in Jacksboro
Income Below Poverty by Sex and Age in Jacksboro
With 8.6% poverty level for males and 19.2% for females among the residents of Jacksboro, 5 year old males and 65 to 74 year old females are the most vulnerable to poverty, with 9 males (100.0%) and 75 females (45.2%) in their respective age groups living below the poverty level.
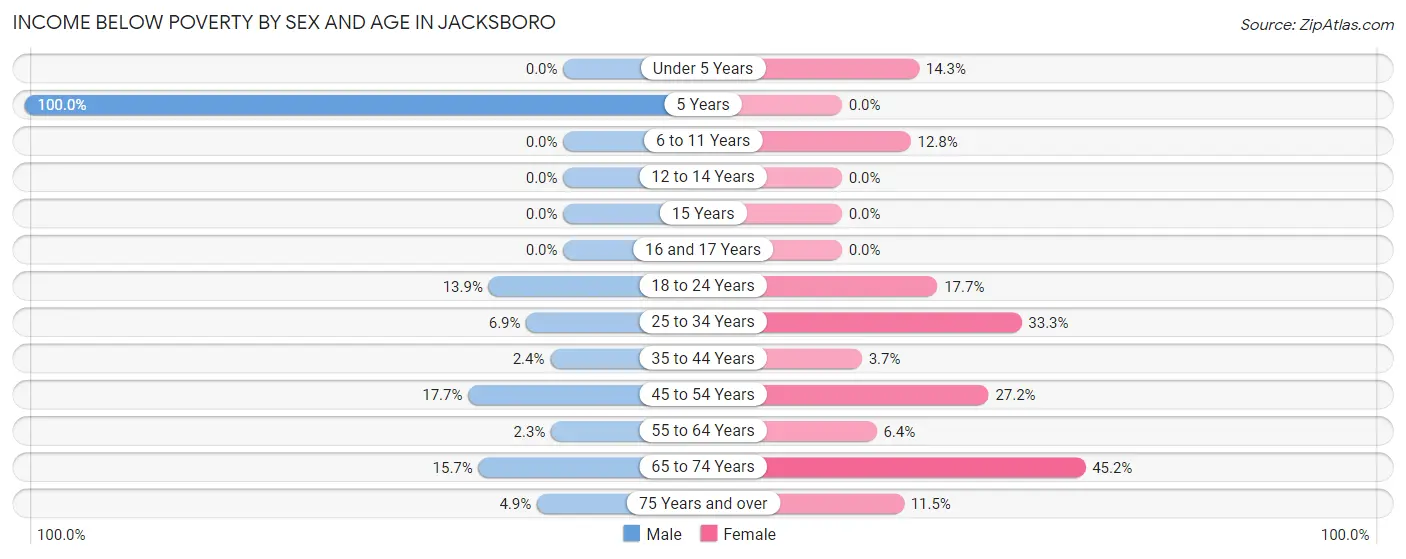
| Age Bracket | Male | Female |
| Under 5 Years | 0 (0.0%) | 9 (14.3%) |
| 5 Years | 9 (100.0%) | 0 (0.0%) |
| 6 to 11 Years | 0 (0.0%) | 18 (12.8%) |
| 12 to 14 Years | 0 (0.0%) | 0 (0.0%) |
| 15 Years | 0 (0.0%) | 0 (0.0%) |
| 16 and 17 Years | 0 (0.0%) | 0 (0.0%) |
| 18 to 24 Years | 27 (13.9%) | 17 (17.7%) |
| 25 to 34 Years | 14 (6.9%) | 56 (33.3%) |
| 35 to 44 Years | 3 (2.4%) | 3 (3.7%) |
| 45 to 54 Years | 27 (17.6%) | 49 (27.2%) |
| 55 to 64 Years | 4 (2.2%) | 17 (6.4%) |
| 65 to 74 Years | 14 (15.7%) | 75 (45.2%) |
| 75 Years and over | 4 (4.9%) | 10 (11.5%) |
| Total | 102 (8.6%) | 254 (19.2%) |
Income Above Poverty by Sex and Age in Jacksboro
According to the poverty statistics in Jacksboro, males aged under 5 years and females aged 5 years are the age groups that are most secure financially, with 100.0% of males and 100.0% of females in these age groups living above the poverty line.
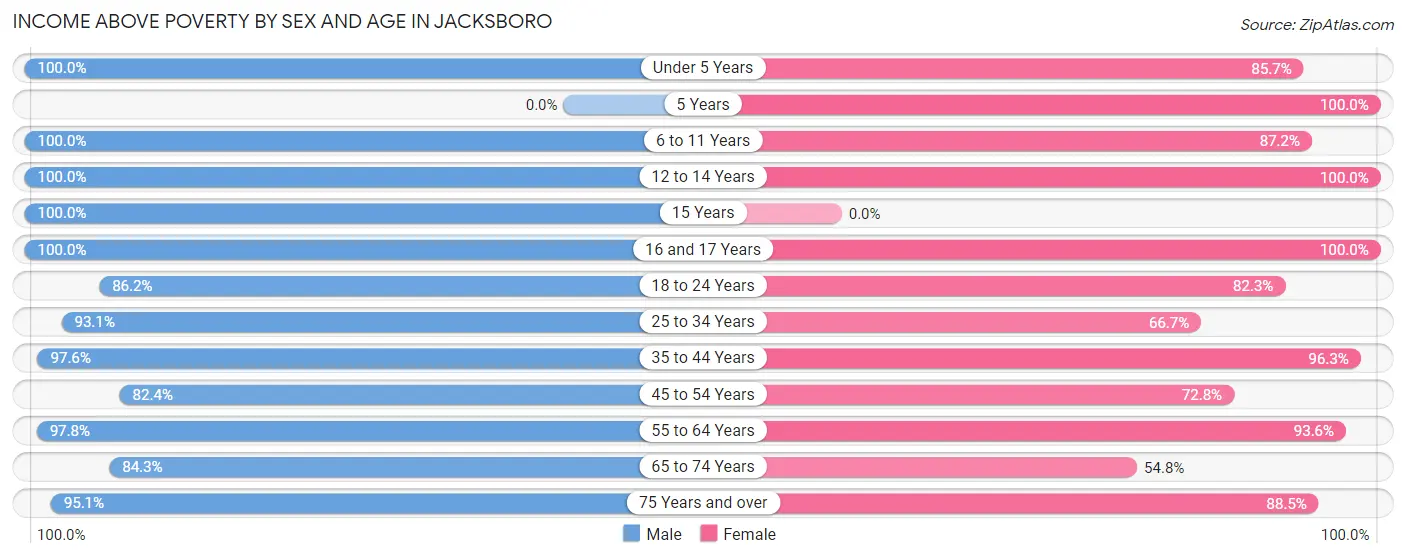
| Age Bracket | Male | Female |
| Under 5 Years | 29 (100.0%) | 54 (85.7%) |
| 5 Years | 0 (0.0%) | 26 (100.0%) |
| 6 to 11 Years | 13 (100.0%) | 123 (87.2%) |
| 12 to 14 Years | 25 (100.0%) | 10 (100.0%) |
| 15 Years | 55 (100.0%) | 0 (0.0%) |
| 16 and 17 Years | 24 (100.0%) | 43 (100.0%) |
| 18 to 24 Years | 168 (86.2%) | 79 (82.3%) |
| 25 to 34 Years | 190 (93.1%) | 112 (66.7%) |
| 35 to 44 Years | 121 (97.6%) | 78 (96.3%) |
| 45 to 54 Years | 126 (82.4%) | 131 (72.8%) |
| 55 to 64 Years | 174 (97.8%) | 247 (93.6%) |
| 65 to 74 Years | 75 (84.3%) | 91 (54.8%) |
| 75 Years and over | 78 (95.1%) | 77 (88.5%) |
| Total | 1,078 (91.4%) | 1,071 (80.8%) |
Income Below Poverty Among Married-Couple Families in Jacksboro
The poverty statistics for married-couple families in Jacksboro show that 5.3% or 26 of the total 487 families live below the poverty line. Families with no children have the highest poverty rate of 8.6%, comprising of 26 families. On the other hand, families with 1 or 2 children have the lowest poverty rate of 0.0%, which includes 0 families.
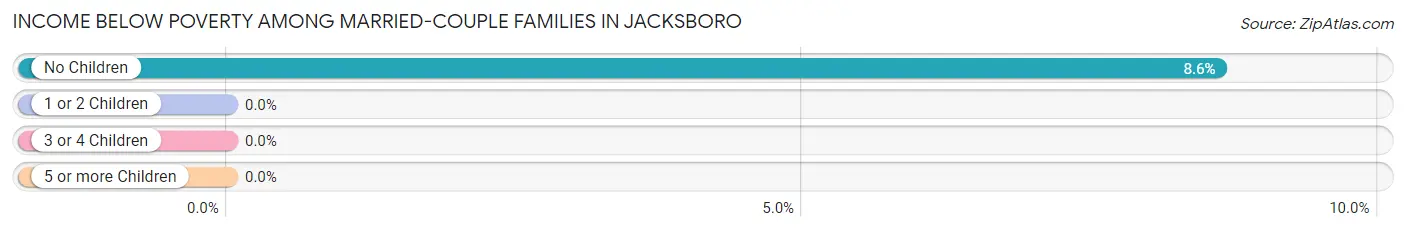
| Children | Above Poverty | Below Poverty |
| No Children | 276 (91.4%) | 26 (8.6%) |
| 1 or 2 Children | 134 (100.0%) | 0 (0.0%) |
| 3 or 4 Children | 44 (100.0%) | 0 (0.0%) |
| 5 or more Children | 7 (100.0%) | 0 (0.0%) |
| Total | 461 (94.7%) | 26 (5.3%) |
Income Below Poverty Among Single-Parent Households in Jacksboro
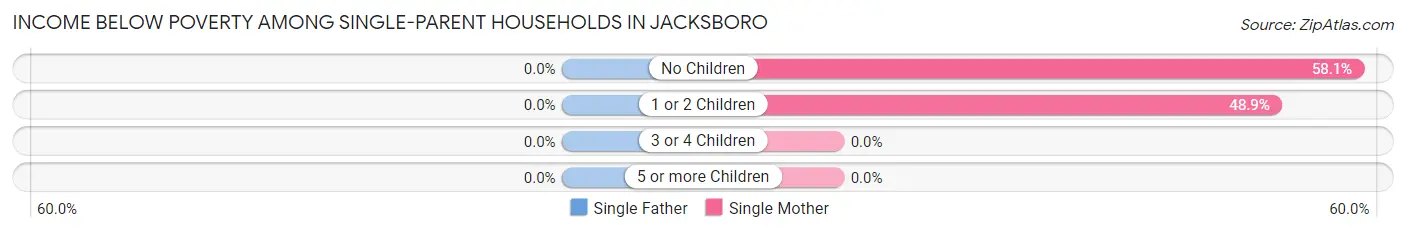
| Children | Single Father | Single Mother |
| No Children | 0 (0.0%) | 25 (58.1%) |
| 1 or 2 Children | 0 (0.0%) | 46 (48.9%) |
| 3 or 4 Children | 0 (0.0%) | 0 (0.0%) |
| 5 or more Children | 0 (0.0%) | 0 (0.0%) |
| Total | 0 (0.0%) | 71 (51.8%) |
Income Below Poverty Among Married-Couple vs Single-Parent Households in Jacksboro
The poverty data for Jacksboro shows that 26 of the married-couple family households (5.3%) and 71 of the single-parent households (37.0%) are living below the poverty level. Within the married-couple family households, those with no children have the highest poverty rate, with 26 households (8.6%) falling below the poverty line. Among the single-parent households, those with no children have the highest poverty rate, with 25 household (38.5%) living below poverty.
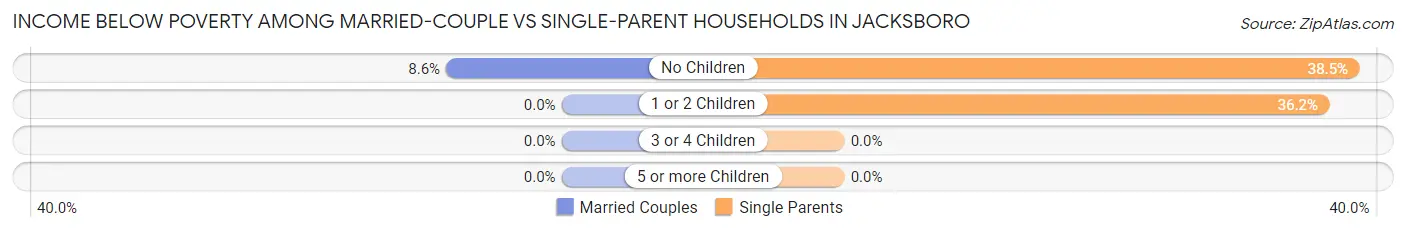
| Children | Married-Couple Families | Single-Parent Households |
| No Children | 26 (8.6%) | 25 (38.5%) |
| 1 or 2 Children | 0 (0.0%) | 46 (36.2%) |
| 3 or 4 Children | 0 (0.0%) | 0 (0.0%) |
| 5 or more Children | 0 (0.0%) | 0 (0.0%) |
| Total | 26 (5.3%) | 71 (37.0%) |
Race in Jacksboro
The most populous races in Jacksboro are White / Caucasian (2,660 | 95.9%), Asian (71 | 2.6%), and Two or more Races (38 | 1.4%).
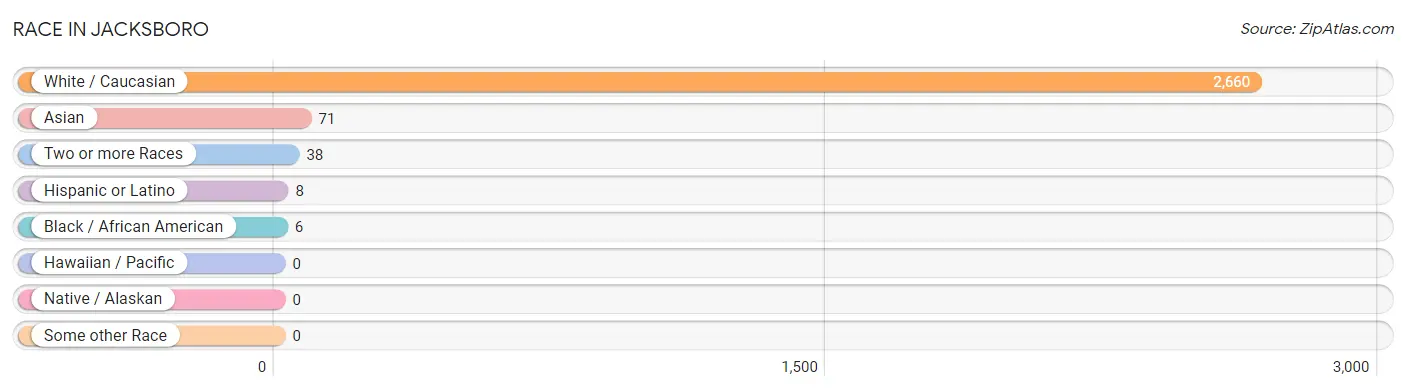
| Race | # Population | % Population |
| Asian | 71 | 2.6% |
| Black / African American | 6 | 0.2% |
| Hawaiian / Pacific | 0 | 0.0% |
| Hispanic or Latino | 8 | 0.3% |
| Native / Alaskan | 0 | 0.0% |
| White / Caucasian | 2,660 | 95.9% |
| Two or more Races | 38 | 1.4% |
| Some other Race | 0 | 0.0% |
| Total | 2,775 | 100.0% |
Ancestry in Jacksboro
The most populous ancestries reported in Jacksboro are Irish (312 | 11.2%), German (298 | 10.7%), English (284 | 10.2%), American (250 | 9.0%), and Scottish (145 | 5.2%), together accounting for 46.5% of all Jacksboro residents.
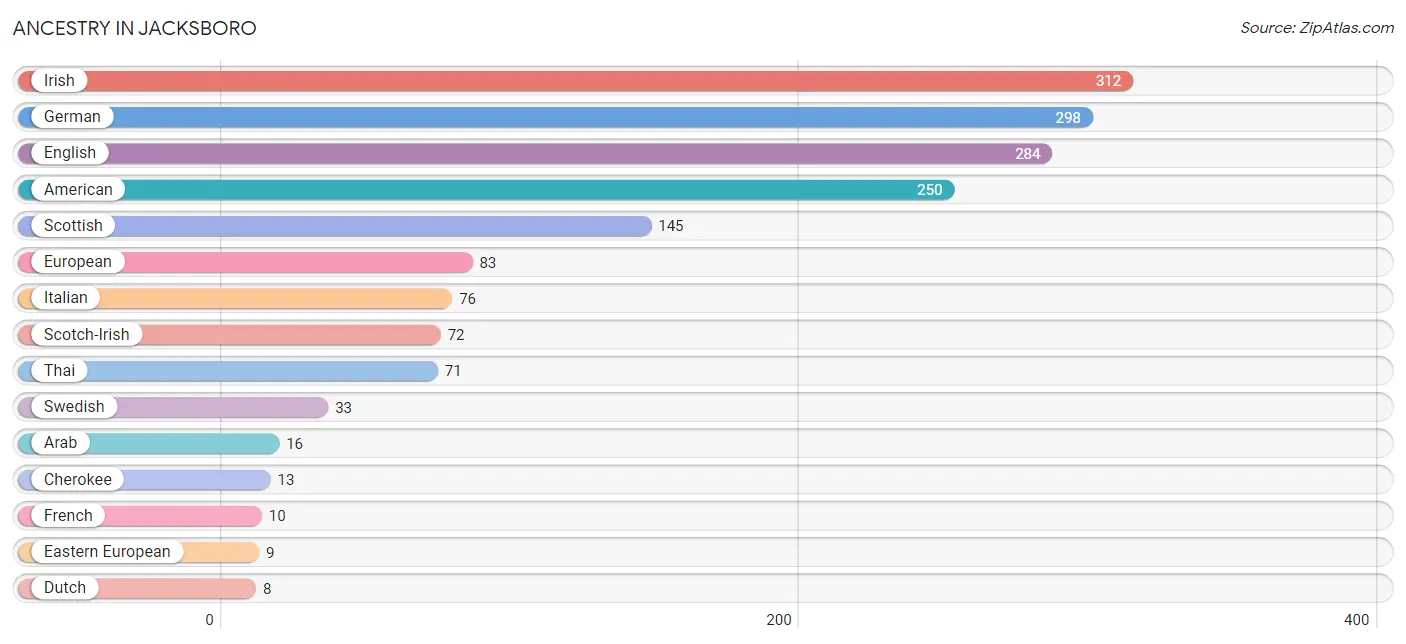
| Ancestry | # Population | % Population |
| American | 250 | 9.0% |
| Arab | 16 | 0.6% |
| Cherokee | 13 | 0.5% |
| Czech | 4 | 0.1% |
| Dutch | 8 | 0.3% |
| Dutch West Indian | 5 | 0.2% |
| Eastern European | 9 | 0.3% |
| Egyptian | 4 | 0.1% |
| English | 284 | 10.2% |
| European | 83 | 3.0% |
| French | 10 | 0.4% |
| French Canadian | 5 | 0.2% |
| German | 298 | 10.7% |
| Iraqi | 4 | 0.1% |
| Irish | 312 | 11.2% |
| Italian | 76 | 2.7% |
| Mexican | 8 | 0.3% |
| Scotch-Irish | 72 | 2.6% |
| Scottish | 145 | 5.2% |
| Swedish | 33 | 1.2% |
| Syrian | 8 | 0.3% |
| Thai | 71 | 2.6% | View All 22 Rows |
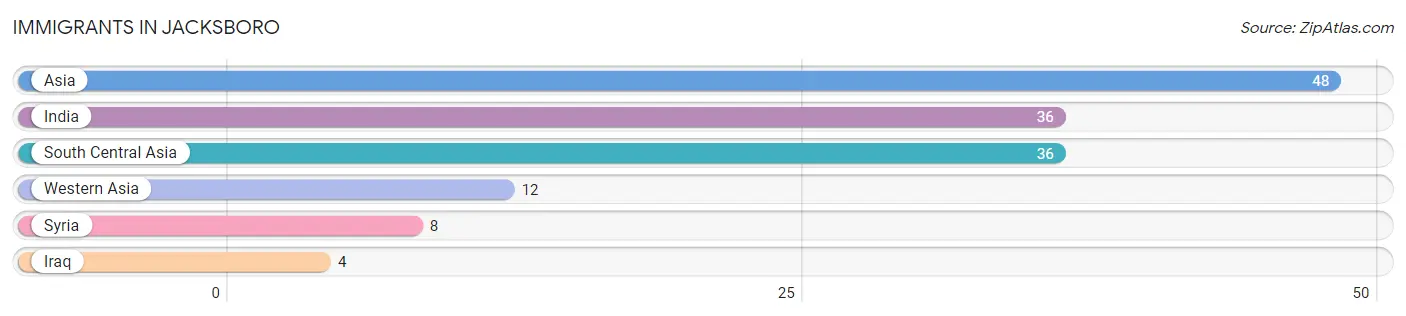
Immigrants in Jacksboro
The most numerous immigrant groups reported in Jacksboro came from Asia (48 | 1.7%), India (36 | 1.3%), South Central Asia (36 | 1.3%), Western Asia (12 | 0.4%), and Syria (8 | 0.3%), together accounting for 5.0% of all Jacksboro residents.
| Immigration Origin | # Population | % Population |
| Asia | 48 | 1.7% |
| India | 36 | 1.3% |
| Iraq | 4 | 0.1% |
| South Central Asia | 36 | 1.3% |
| Syria | 8 | 0.3% |
| Western Asia | 12 | 0.4% | View All 6 Rows |
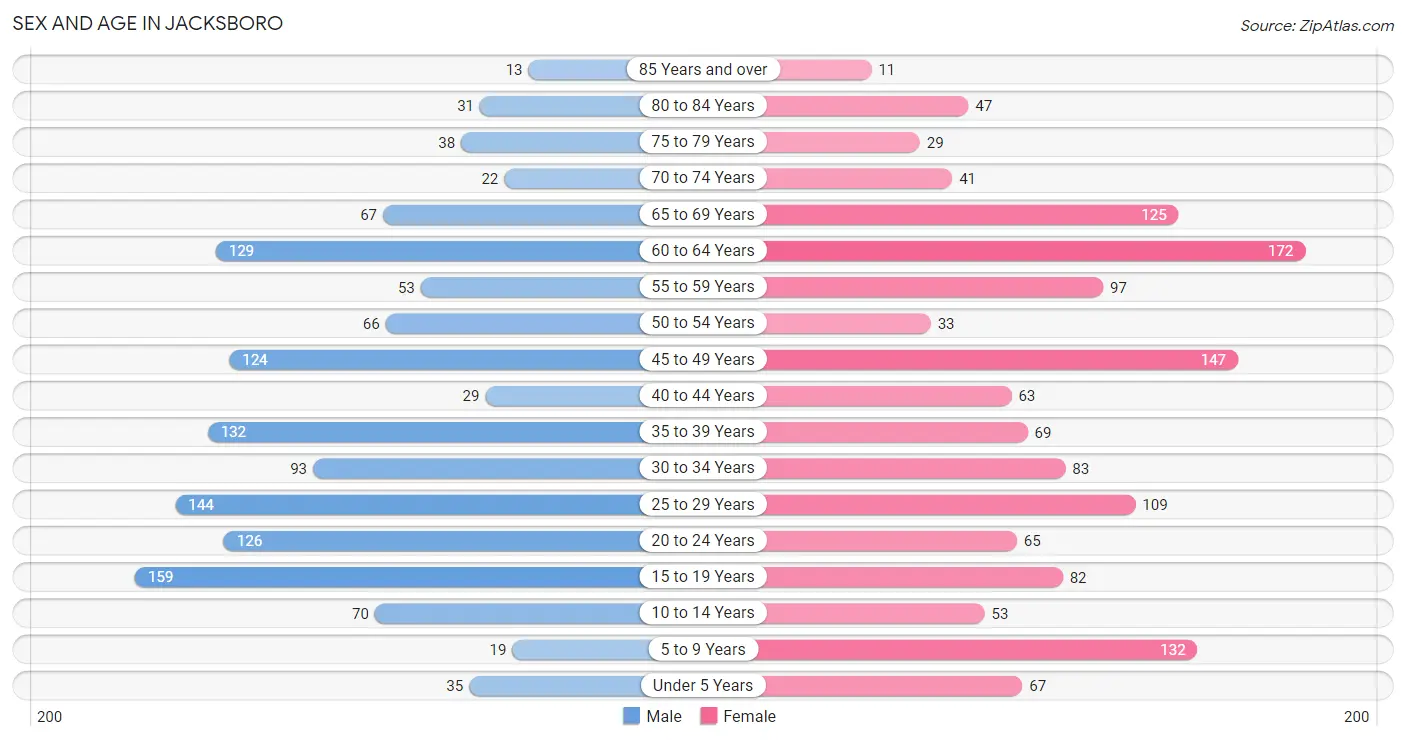
Sex and Age in Jacksboro
Sex and Age in Jacksboro
The most populous age groups in Jacksboro are 15 to 19 Years (159 | 11.8%) for men and 60 to 64 Years (172 | 12.1%) for women.
| Age Bracket | Male | Female |
| Under 5 Years | 35 (2.6%) | 67 (4.7%) |
| 5 to 9 Years | 19 (1.4%) | 132 (9.3%) |
| 10 to 14 Years | 70 (5.2%) | 53 (3.7%) |
| 15 to 19 Years | 159 (11.8%) | 82 (5.8%) |
| 20 to 24 Years | 126 (9.3%) | 65 (4.6%) |
| 25 to 29 Years | 144 (10.7%) | 109 (7.6%) |
| 30 to 34 Years | 93 (6.9%) | 83 (5.8%) |
| 35 to 39 Years | 132 (9.8%) | 69 (4.8%) |
| 40 to 44 Years | 29 (2.1%) | 63 (4.4%) |
| 45 to 49 Years | 124 (9.2%) | 147 (10.3%) |
| 50 to 54 Years | 66 (4.9%) | 33 (2.3%) |
| 55 to 59 Years | 53 (3.9%) | 97 (6.8%) |
| 60 to 64 Years | 129 (9.6%) | 172 (12.1%) |
| 65 to 69 Years | 67 (5.0%) | 125 (8.8%) |
| 70 to 74 Years | 22 (1.6%) | 41 (2.9%) |
| 75 to 79 Years | 38 (2.8%) | 29 (2.0%) |
| 80 to 84 Years | 31 (2.3%) | 47 (3.3%) |
| 85 Years and over | 13 (1.0%) | 11 (0.8%) |
| Total | 1,350 (100.0%) | 1,425 (100.0%) |
Families and Households in Jacksboro
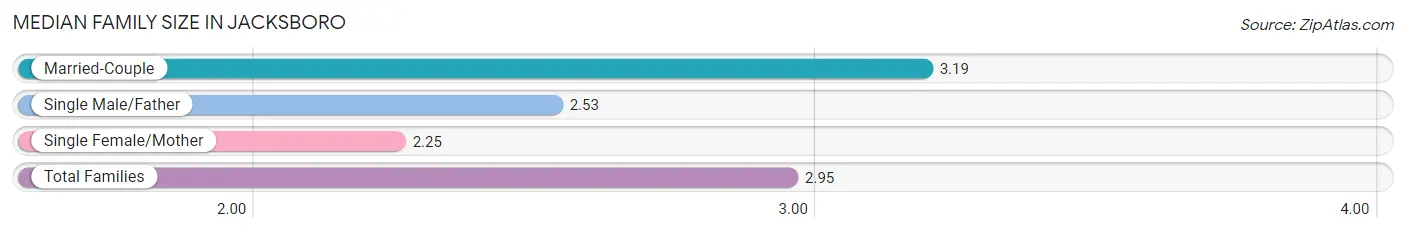
Median Family Size in Jacksboro
The median family size in Jacksboro is 2.95 persons per family, with married-couple families (487 | 71.7%) accounting for the largest median family size of 3.19 persons per family. On the other hand, single female/mother families (137 | 20.2%) represent the smallest median family size with 2.25 persons per family.
| Family Type | # Families | Family Size |
| Married-Couple | 487 (71.7%) | 3.19 |
| Single Male/Father | 55 (8.1%) | 2.53 |
| Single Female/Mother | 137 (20.2%) | 2.25 |
| Total Families | 679 (100.0%) | 2.95 |
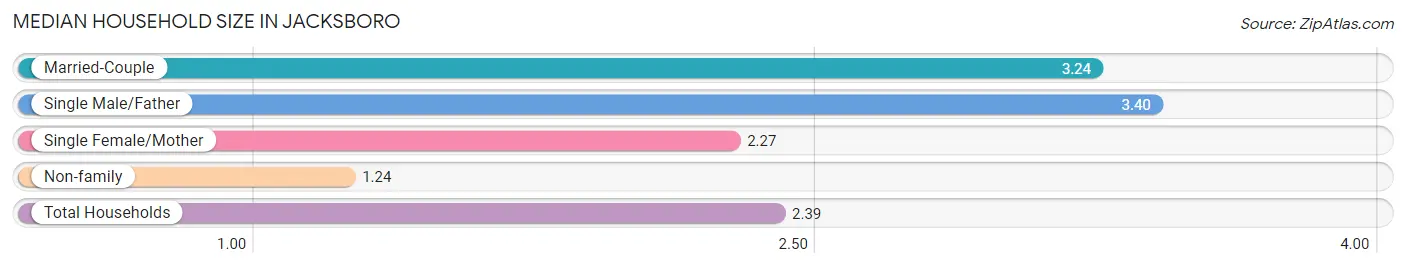
Median Household Size in Jacksboro
The median household size in Jacksboro is 2.39 persons per household, with single male/father households (55 | 5.1%) accounting for the largest median household size of 3.4 persons per household. non-family households (393 | 36.7%) represent the smallest median household size with 1.24 persons per household.
| Household Type | # Households | Household Size |
| Married-Couple | 487 (45.4%) | 3.24 |
| Single Male/Father | 55 (5.1%) | 3.40 |
| Single Female/Mother | 137 (12.8%) | 2.27 |
| Non-family | 393 (36.7%) | 1.24 |
| Total Households | 1,072 (100.0%) | 2.39 |
Household Size by Marriage Status in Jacksboro
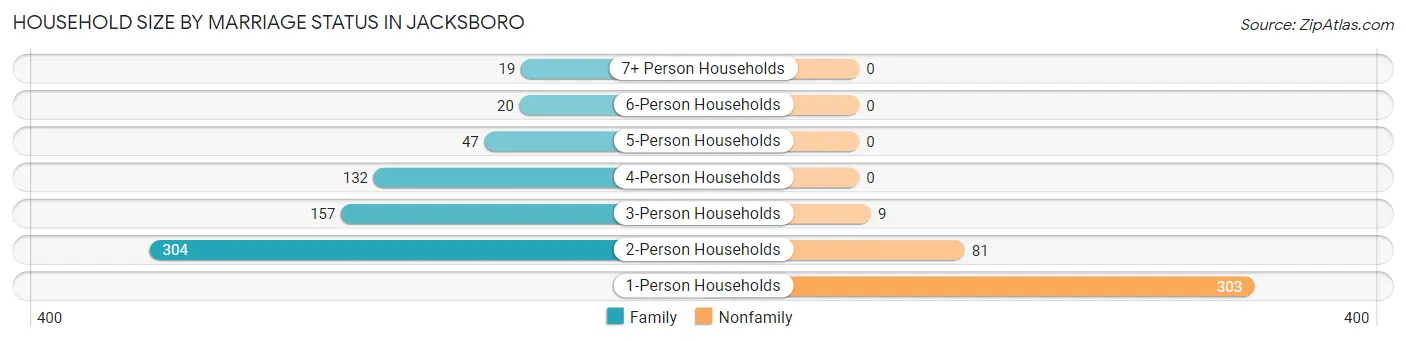
Out of a total of 1,072 households in Jacksboro, 679 (63.3%) are family households, while 393 (36.7%) are nonfamily households. The most numerous type of family households are 2-person households, comprising 304, and the most common type of nonfamily households are 1-person households, comprising 303.
| Household Size | Family Households | Nonfamily Households |
| 1-Person Households | - | 303 (28.3%) |
| 2-Person Households | 304 (28.4%) | 81 (7.6%) |
| 3-Person Households | 157 (14.6%) | 9 (0.8%) |
| 4-Person Households | 132 (12.3%) | 0 (0.0%) |
| 5-Person Households | 47 (4.4%) | 0 (0.0%) |
| 6-Person Households | 20 (1.9%) | 0 (0.0%) |
| 7+ Person Households | 19 (1.8%) | 0 (0.0%) |
| Total | 679 (63.3%) | 393 (36.7%) |
Female Fertility in Jacksboro
Fertility by Age in Jacksboro
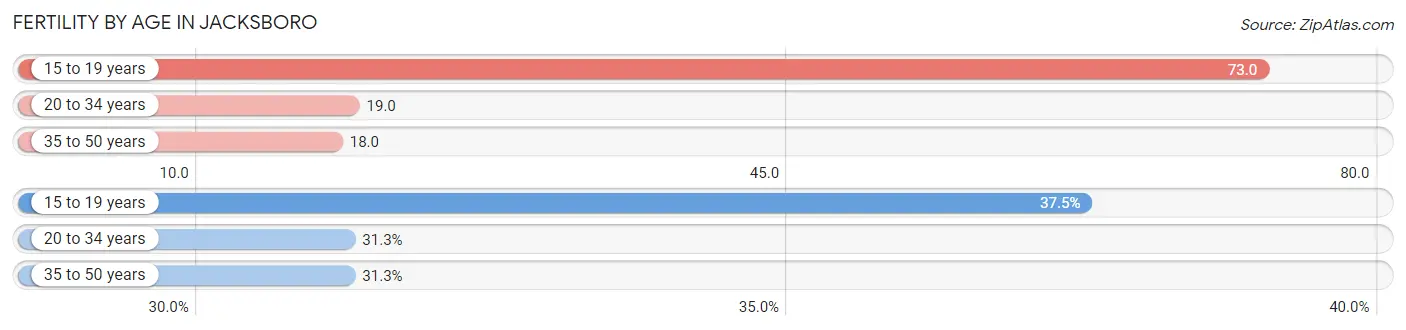
Average fertility rate in Jacksboro is 26.0 births per 1,000 women. Women in the age bracket of 15 to 19 years have the highest fertility rate with 73.0 births per 1,000 women. Women in the age bracket of 15 to 19 years acount for 37.5% of all women with births.
| Age Bracket | Women with Births | Births / 1,000 Women |
| 15 to 19 years | 6 (37.5%) | 73.0 |
| 20 to 34 years | 5 (31.2%) | 19.0 |
| 35 to 50 years | 5 (31.2%) | 18.0 |
| Total | 16 (100.0%) | 26.0 |
Fertility by Age by Marriage Status in Jacksboro
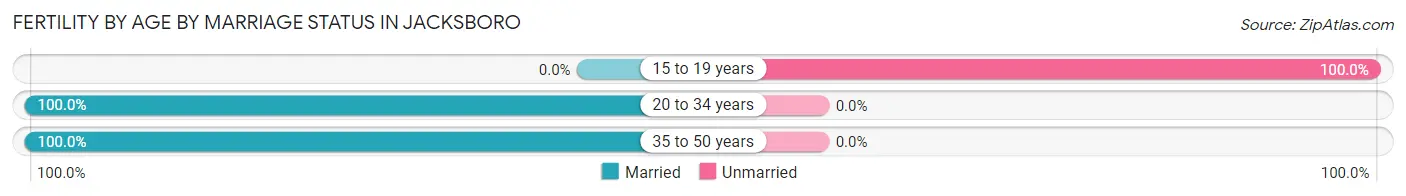
62.5% of women with births (16) in Jacksboro are married. The highest percentage of unmarried women with births falls into 15 to 19 years age bracket with 100.0% of them unmarried at the time of birth, while the lowest percentage of unmarried women with births belong to 20 to 34 years age bracket with 0.0% of them unmarried.
| Age Bracket | Married | Unmarried |
| 15 to 19 years | 0 (0.0%) | 6 (100.0%) |
| 20 to 34 years | 5 (100.0%) | 0 (0.0%) |
| 35 to 50 years | 5 (100.0%) | 0 (0.0%) |
| Total | 10 (62.5%) | 6 (37.5%) |
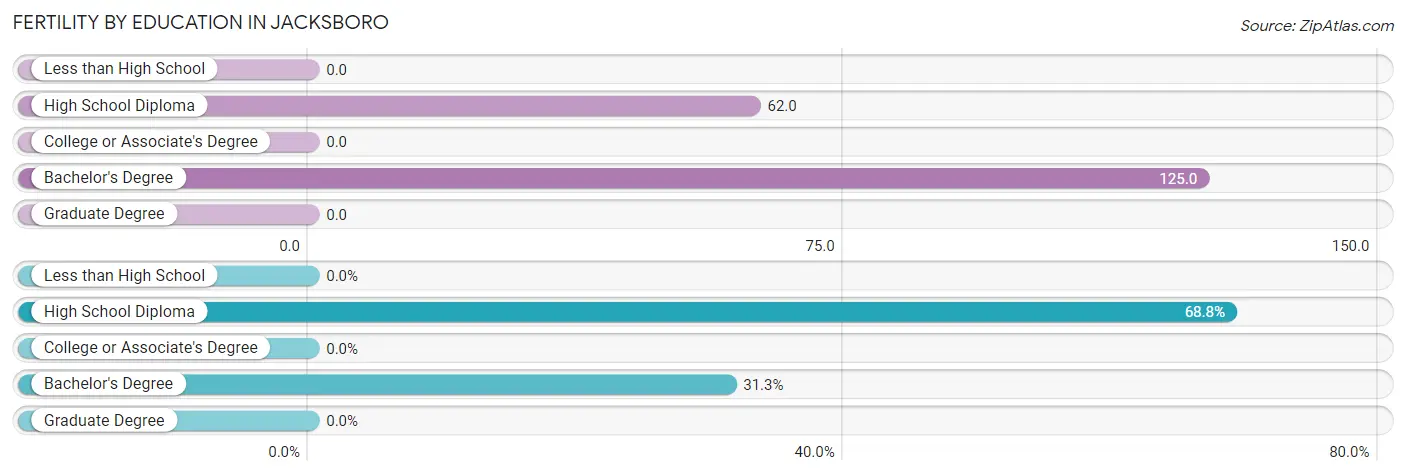
Fertility by Education in Jacksboro
| Educational Attainment | Women with Births | Births / 1,000 Women |
| Less than High School | 0 (0.0%) | 0.0 |
| High School Diploma | 11 (68.8%) | 62.0 |
| College or Associate's Degree | 0 (0.0%) | 0.0 |
| Bachelor's Degree | 5 (31.2%) | 125.0 |
| Graduate Degree | 0 (0.0%) | 0.0 |
| Total | 16 (100.0%) | 26.0 |
Fertility by Education by Marriage Status in Jacksboro
37.5% of women with births in Jacksboro are unmarried. Women with the educational attainment of bachelor's degree are most likely to be married with 100.0% of them married at childbirth, while women with the educational attainment of high school diploma are least likely to be married with 54.5% of them unmarried at childbirth.
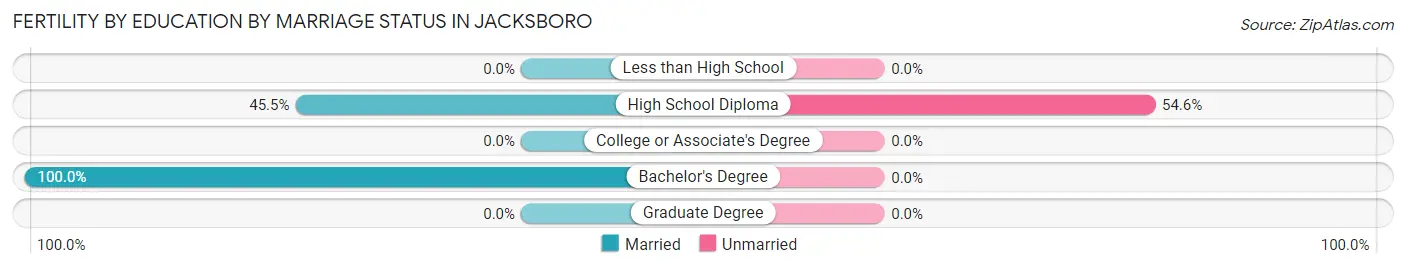
| Educational Attainment | Married | Unmarried |
| Less than High School | 0 (0.0%) | 0 (0.0%) |
| High School Diploma | 5 (45.5%) | 6 (54.5%) |
| College or Associate's Degree | 0 (0.0%) | 0 (0.0%) |
| Bachelor's Degree | 5 (100.0%) | 0 (0.0%) |
| Graduate Degree | 0 (0.0%) | 0 (0.0%) |
| Total | 10 (62.5%) | 6 (37.5%) |
Employment Characteristics in Jacksboro
Employment by Class of Employer in Jacksboro
Among the 1,105 employed individuals in Jacksboro, private company employees (781 | 70.7%), self-employed (not incorporated) (79 | 7.1%), and self-employed (incorporated) (68 | 6.1%) make up the most common classes of employment.
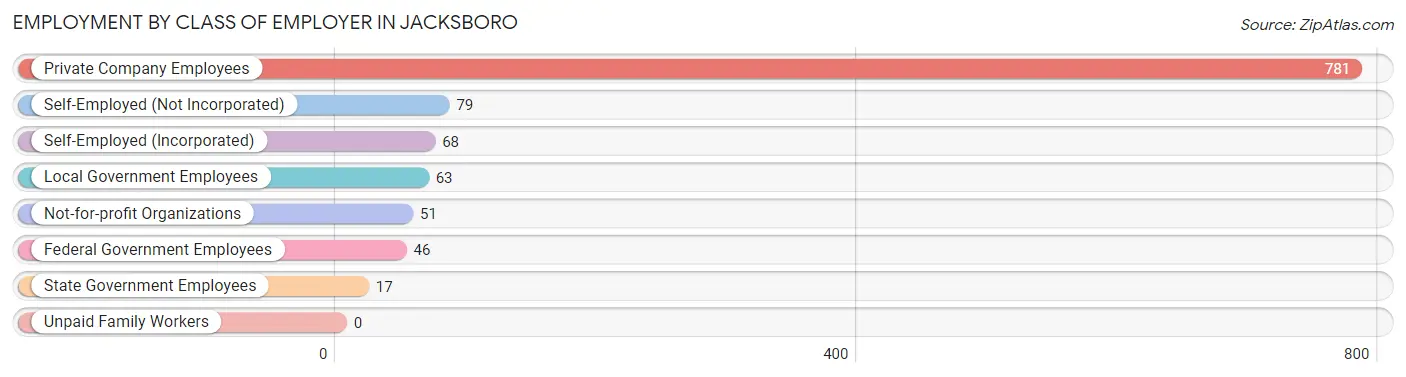
| Employer Class | # Employees | % Employees |
| Private Company Employees | 781 | 70.7% |
| Self-Employed (Incorporated) | 68 | 6.1% |
| Self-Employed (Not Incorporated) | 79 | 7.1% |
| Not-for-profit Organizations | 51 | 4.6% |
| Local Government Employees | 63 | 5.7% |
| State Government Employees | 17 | 1.5% |
| Federal Government Employees | 46 | 4.2% |
| Unpaid Family Workers | 0 | 0.0% |
| Total | 1,105 | 100.0% |
Employment Status by Age in Jacksboro
According to the labor force statistics for Jacksboro, out of the total population over 16 years of age (2,344), 51.2% or 1,200 individuals are in the labor force, with 6.5% or 78 of them unemployed. The age group with the highest labor force participation rate is 25 to 29 years, with 82.6% or 209 individuals in the labor force. Within the labor force, the 25 to 29 years age range has the highest percentage of unemployed individuals, with 24.4% or 51 of them being unemployed.
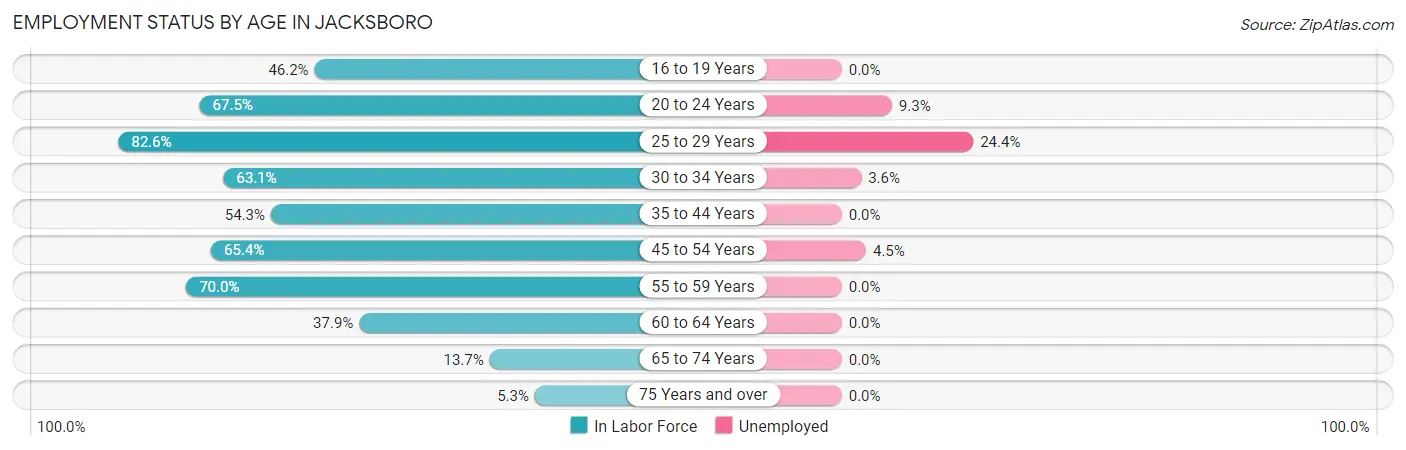
| Age Bracket | In Labor Force | Unemployed |
| 16 to 19 Years | 86 (46.2%) | 0 (0.0%) |
| 20 to 24 Years | 129 (67.5%) | 12 (9.3%) |
| 25 to 29 Years | 209 (82.6%) | 51 (24.4%) |
| 30 to 34 Years | 111 (63.1%) | 4 (3.6%) |
| 35 to 44 Years | 159 (54.3%) | 0 (0.0%) |
| 45 to 54 Years | 242 (65.4%) | 11 (4.5%) |
| 55 to 59 Years | 105 (70.0%) | 0 (0.0%) |
| 60 to 64 Years | 114 (37.9%) | 0 (0.0%) |
| 65 to 74 Years | 35 (13.7%) | 0 (0.0%) |
| 75 Years and over | 9 (5.3%) | 0 (0.0%) |
| Total | 1,200 (51.2%) | 78 (6.5%) |
Employment Status by Educational Attainment in Jacksboro
According to labor force statistics for Jacksboro, 60.9% of individuals (940) out of the total population between 25 and 64 years of age (1,543) are in the labor force, with 7.0% or 66 of them being unemployed. The group with the highest labor force participation rate are those with the educational attainment of college / associate degree, with 71.4% or 461 individuals in the labor force. Within the labor force, individuals with high school diploma education have the highest percentage of unemployment, with 14.1% or 37 of them being unemployed.
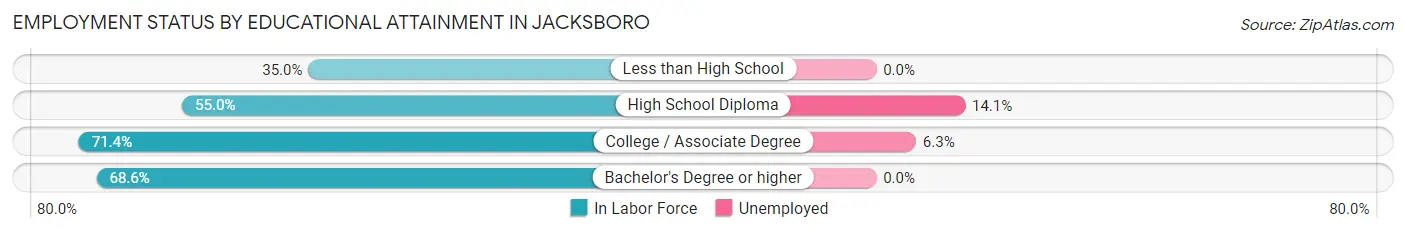
| Educational Attainment | In Labor Force | Unemployed |
| Less than High School | 75 (35.0%) | 0 (0.0%) |
| High School Diploma | 262 (55.0%) | 67 (14.1%) |
| College / Associate Degree | 461 (71.4%) | 41 (6.3%) |
| Bachelor's Degree or higher | 142 (68.6%) | 0 (0.0%) |
| Total | 940 (60.9%) | 108 (7.0%) |
Employment Occupations by Sex in Jacksboro
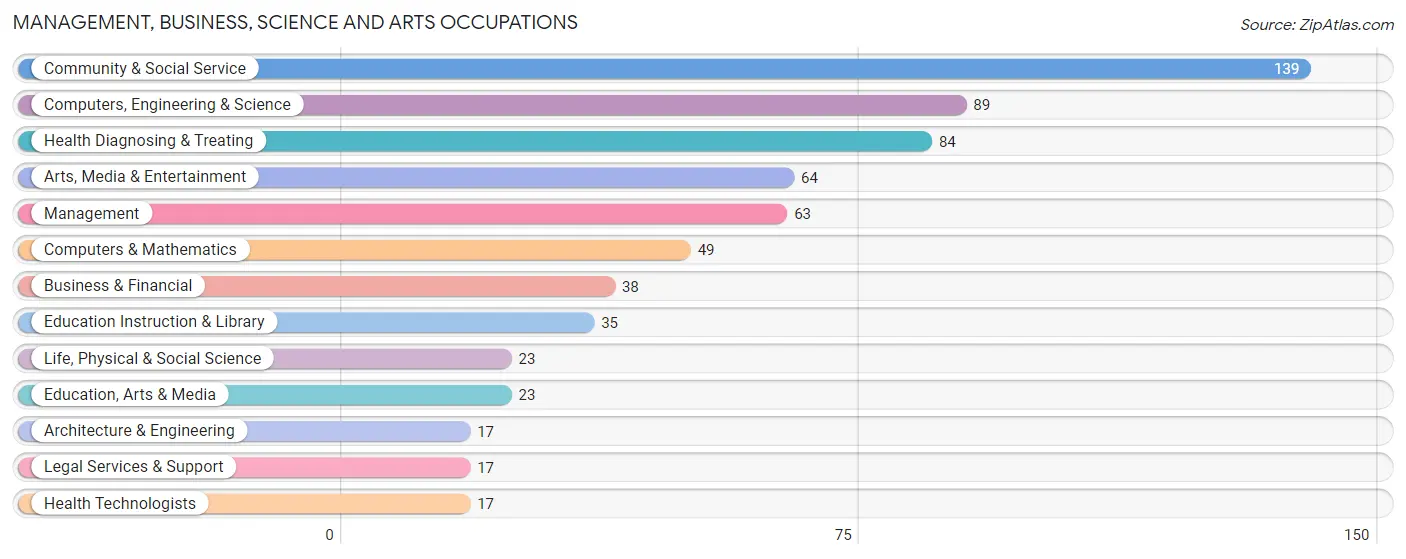
Management, Business, Science and Arts Occupations
The most common Management, Business, Science and Arts occupations in Jacksboro are Community & Social Service (139 | 12.4%), Computers, Engineering & Science (89 | 7.9%), Health Diagnosing & Treating (84 | 7.5%), Arts, Media & Entertainment (64 | 5.7%), and Management (63 | 5.6%).
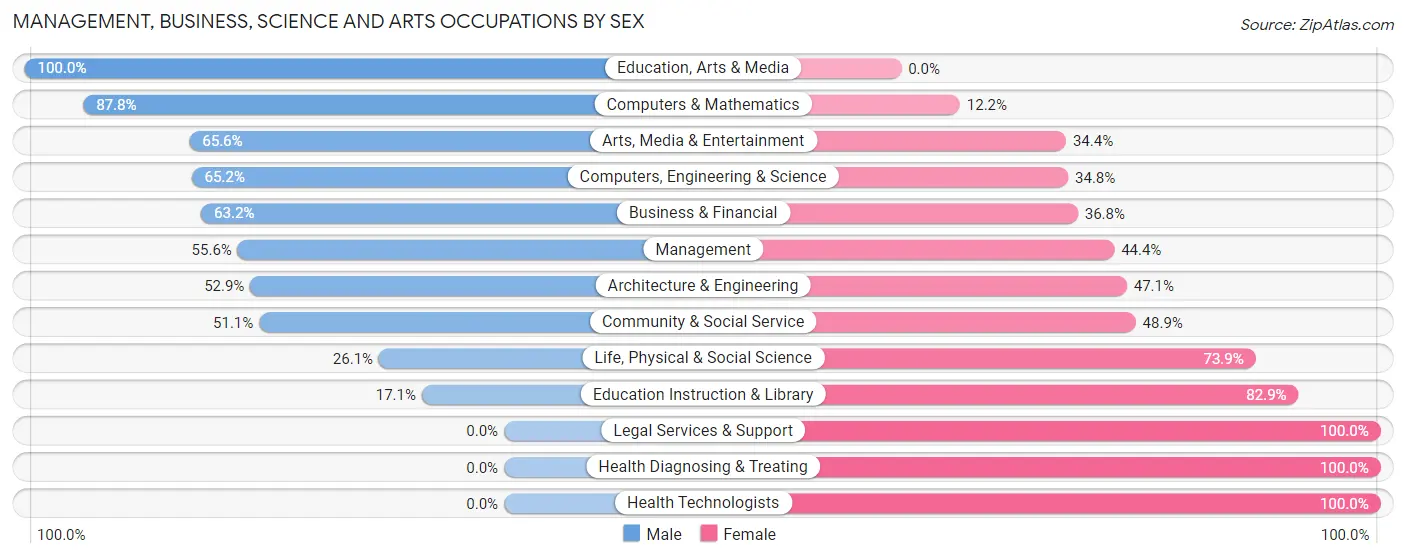
Management, Business, Science and Arts Occupations by Sex
Within the Management, Business, Science and Arts occupations in Jacksboro, the most male-oriented occupations are Education, Arts & Media (100.0%), Computers & Mathematics (87.8%), and Arts, Media & Entertainment (65.6%), while the most female-oriented occupations are Legal Services & Support (100.0%), Health Diagnosing & Treating (100.0%), and Health Technologists (100.0%).
| Occupation | Male | Female |
| Management | 35 (55.6%) | 28 (44.4%) |
| Business & Financial | 24 (63.2%) | 14 (36.8%) |
| Computers, Engineering & Science | 58 (65.2%) | 31 (34.8%) |
| Computers & Mathematics | 43 (87.8%) | 6 (12.2%) |
| Architecture & Engineering | 9 (52.9%) | 8 (47.1%) |
| Life, Physical & Social Science | 6 (26.1%) | 17 (73.9%) |
| Community & Social Service | 71 (51.1%) | 68 (48.9%) |
| Education, Arts & Media | 23 (100.0%) | 0 (0.0%) |
| Legal Services & Support | 0 (0.0%) | 17 (100.0%) |
| Education Instruction & Library | 6 (17.1%) | 29 (82.9%) |
| Arts, Media & Entertainment | 42 (65.6%) | 22 (34.4%) |
| Health Diagnosing & Treating | 0 (0.0%) | 84 (100.0%) |
| Health Technologists | 0 (0.0%) | 17 (100.0%) |
| Total (Category) | 188 (45.5%) | 225 (54.5%) |
| Total (Overall) | 602 (53.7%) | 519 (46.3%) |
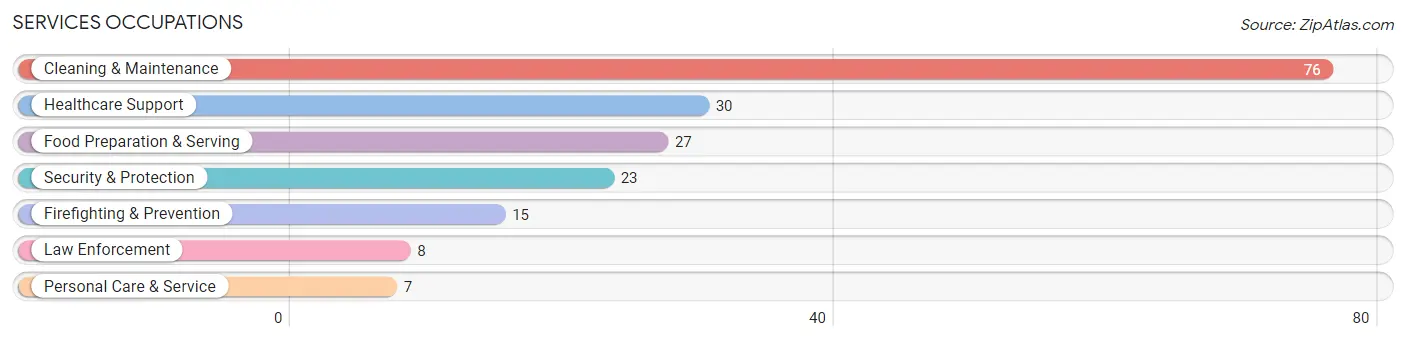
Services Occupations
The most common Services occupations in Jacksboro are Cleaning & Maintenance (76 | 6.8%), Healthcare Support (30 | 2.7%), Food Preparation & Serving (27 | 2.4%), Security & Protection (23 | 2.1%), and Firefighting & Prevention (15 | 1.3%).
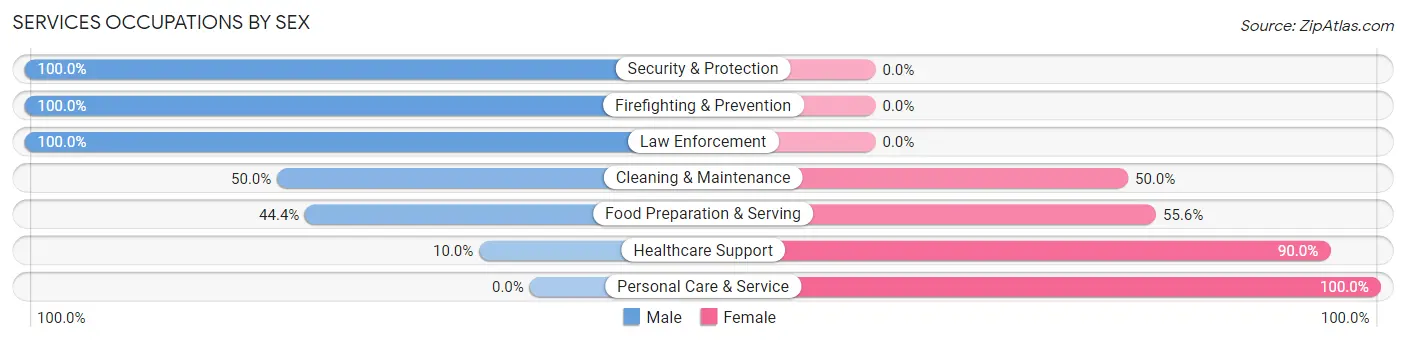
Services Occupations by Sex
Within the Services occupations in Jacksboro, the most male-oriented occupations are Security & Protection (100.0%), Firefighting & Prevention (100.0%), and Law Enforcement (100.0%), while the most female-oriented occupations are Personal Care & Service (100.0%), Healthcare Support (90.0%), and Food Preparation & Serving (55.6%).
| Occupation | Male | Female |
| Healthcare Support | 3 (10.0%) | 27 (90.0%) |
| Security & Protection | 23 (100.0%) | 0 (0.0%) |
| Firefighting & Prevention | 15 (100.0%) | 0 (0.0%) |
| Law Enforcement | 8 (100.0%) | 0 (0.0%) |
| Food Preparation & Serving | 12 (44.4%) | 15 (55.6%) |
| Cleaning & Maintenance | 38 (50.0%) | 38 (50.0%) |
| Personal Care & Service | 0 (0.0%) | 7 (100.0%) |
| Total (Category) | 76 (46.6%) | 87 (53.4%) |
| Total (Overall) | 602 (53.7%) | 519 (46.3%) |
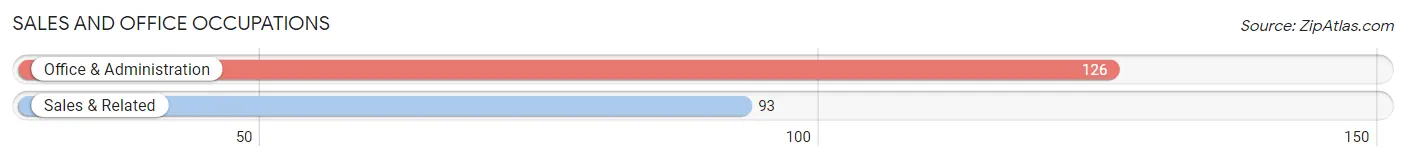
Sales and Office Occupations
The most common Sales and Office occupations in Jacksboro are Office & Administration (126 | 11.2%), and Sales & Related (93 | 8.3%).
Sales and Office Occupations by Sex
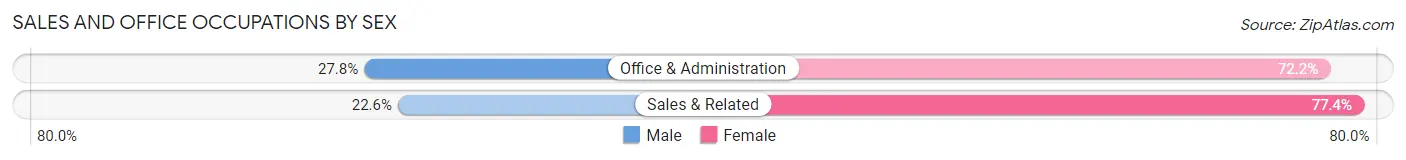
| Occupation | Male | Female |
| Sales & Related | 21 (22.6%) | 72 (77.4%) |
| Office & Administration | 35 (27.8%) | 91 (72.2%) |
| Total (Category) | 56 (25.6%) | 163 (74.4%) |
| Total (Overall) | 602 (53.7%) | 519 (46.3%) |
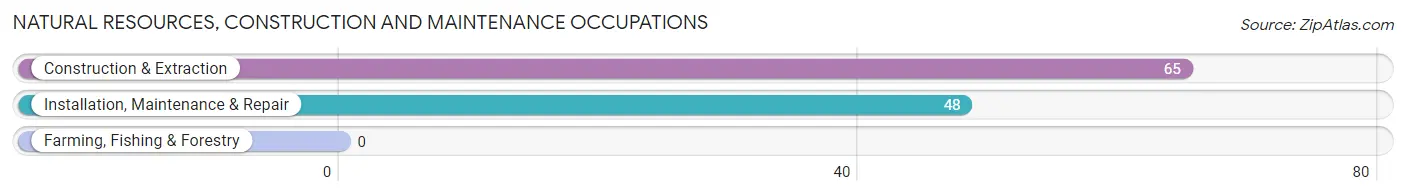
Natural Resources, Construction and Maintenance Occupations
The most common Natural Resources, Construction and Maintenance occupations in Jacksboro are Construction & Extraction (65 | 5.8%), and Installation, Maintenance & Repair (48 | 4.3%).
Natural Resources, Construction and Maintenance Occupations by Sex
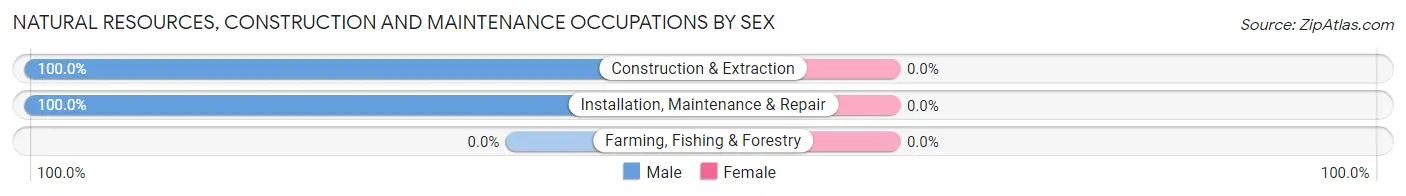
| Occupation | Male | Female |
| Farming, Fishing & Forestry | 0 (0.0%) | 0 (0.0%) |
| Construction & Extraction | 65 (100.0%) | 0 (0.0%) |
| Installation, Maintenance & Repair | 48 (100.0%) | 0 (0.0%) |
| Total (Category) | 113 (100.0%) | 0 (0.0%) |
| Total (Overall) | 602 (53.7%) | 519 (46.3%) |
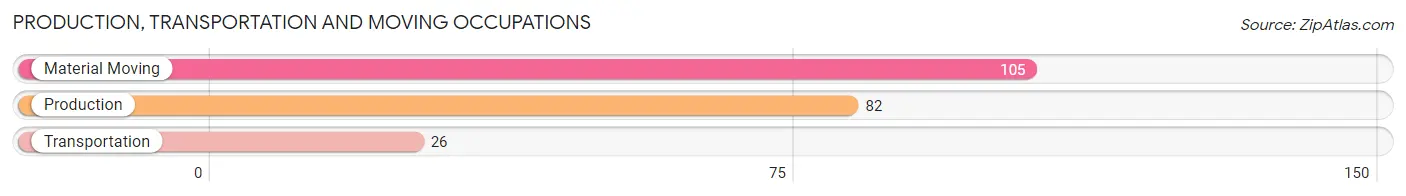
Production, Transportation and Moving Occupations
The most common Production, Transportation and Moving occupations in Jacksboro are Material Moving (105 | 9.4%), Production (82 | 7.3%), and Transportation (26 | 2.3%).
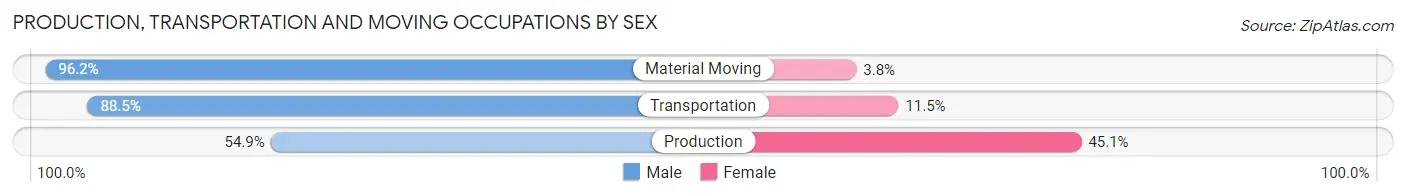
Production, Transportation and Moving Occupations by Sex
| Occupation | Male | Female |
| Production | 45 (54.9%) | 37 (45.1%) |
| Transportation | 23 (88.5%) | 3 (11.5%) |
| Material Moving | 101 (96.2%) | 4 (3.8%) |
| Total (Category) | 169 (79.3%) | 44 (20.7%) |
| Total (Overall) | 602 (53.7%) | 519 (46.3%) |
Employment Industries by Sex in Jacksboro
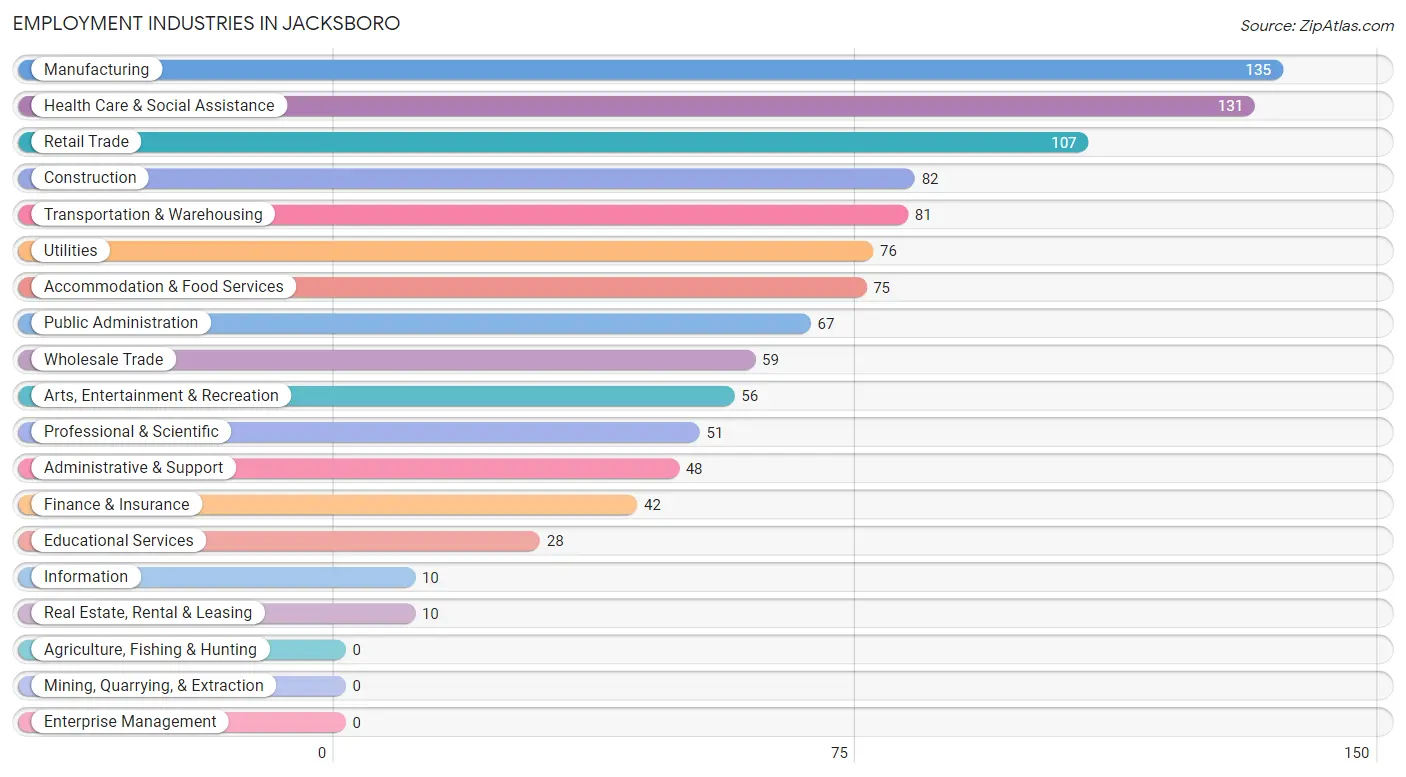
Employment Industries in Jacksboro
The major employment industries in Jacksboro include Manufacturing (135 | 12.0%), Health Care & Social Assistance (131 | 11.7%), Retail Trade (107 | 9.6%), Construction (82 | 7.3%), and Transportation & Warehousing (81 | 7.2%).
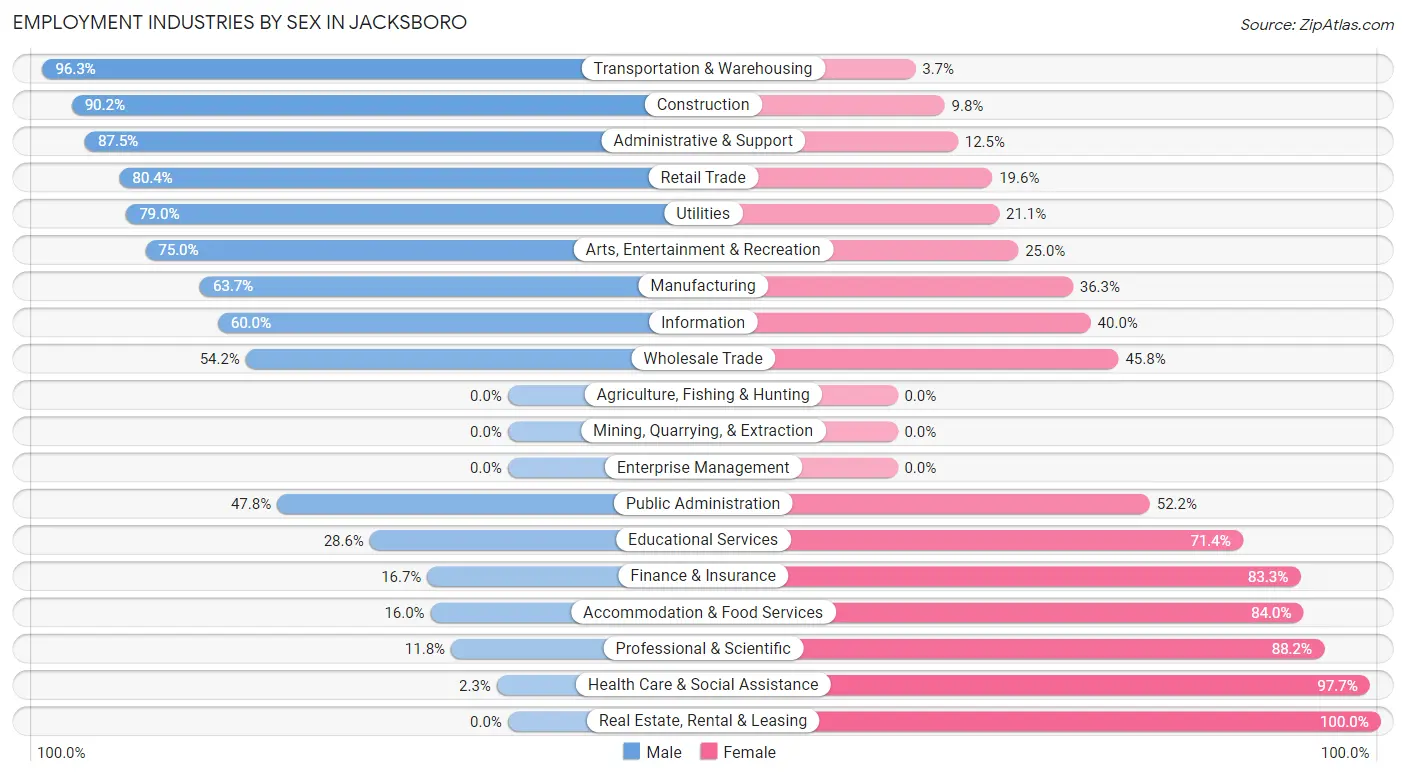
Employment Industries by Sex in Jacksboro
The Jacksboro industries that see more men than women are Transportation & Warehousing (96.3%), Construction (90.2%), and Administrative & Support (87.5%), whereas the industries that tend to have a higher number of women are Real Estate, Rental & Leasing (100.0%), Health Care & Social Assistance (97.7%), and Professional & Scientific (88.2%).
| Industry | Male | Female |
| Agriculture, Fishing & Hunting | 0 (0.0%) | 0 (0.0%) |
| Mining, Quarrying, & Extraction | 0 (0.0%) | 0 (0.0%) |
| Construction | 74 (90.2%) | 8 (9.8%) |
| Manufacturing | 86 (63.7%) | 49 (36.3%) |
| Wholesale Trade | 32 (54.2%) | 27 (45.8%) |
| Retail Trade | 86 (80.4%) | 21 (19.6%) |
| Transportation & Warehousing | 78 (96.3%) | 3 (3.7%) |
| Utilities | 60 (78.9%) | 16 (21.0%) |
| Information | 6 (60.0%) | 4 (40.0%) |
| Finance & Insurance | 7 (16.7%) | 35 (83.3%) |
| Real Estate, Rental & Leasing | 0 (0.0%) | 10 (100.0%) |
| Professional & Scientific | 6 (11.8%) | 45 (88.2%) |
| Enterprise Management | 0 (0.0%) | 0 (0.0%) |
| Administrative & Support | 42 (87.5%) | 6 (12.5%) |
| Educational Services | 8 (28.6%) | 20 (71.4%) |
| Health Care & Social Assistance | 3 (2.3%) | 128 (97.7%) |
| Arts, Entertainment & Recreation | 42 (75.0%) | 14 (25.0%) |
| Accommodation & Food Services | 12 (16.0%) | 63 (84.0%) |
| Public Administration | 32 (47.8%) | 35 (52.2%) |
| Total | 602 (53.7%) | 519 (46.3%) |
Education in Jacksboro
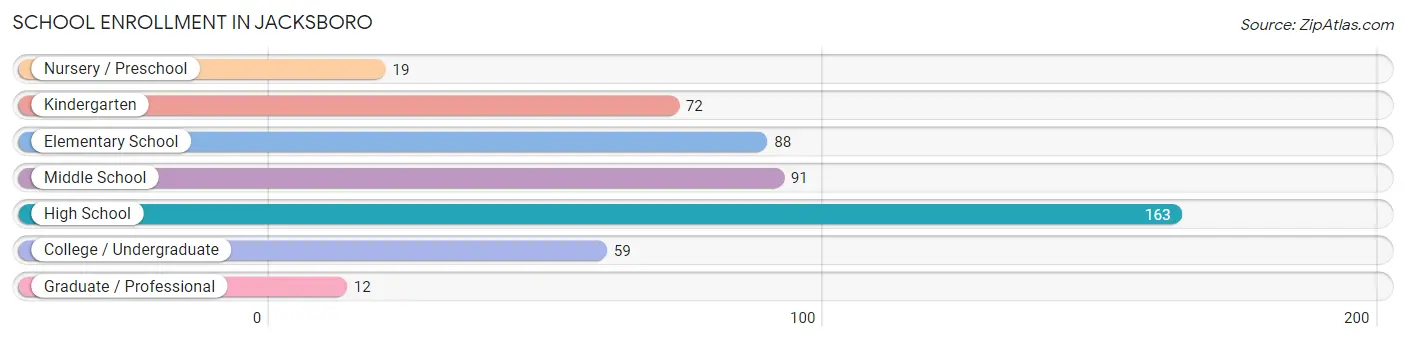
School Enrollment in Jacksboro
The most common levels of schooling among the 504 students in Jacksboro are high school (163 | 32.3%), middle school (91 | 18.1%), and elementary school (88 | 17.5%).
| School Level | # Students | % Students |
| Nursery / Preschool | 19 | 3.8% |
| Kindergarten | 72 | 14.3% |
| Elementary School | 88 | 17.5% |
| Middle School | 91 | 18.1% |
| High School | 163 | 32.3% |
| College / Undergraduate | 59 | 11.7% |
| Graduate / Professional | 12 | 2.4% |
| Total | 504 | 100.0% |
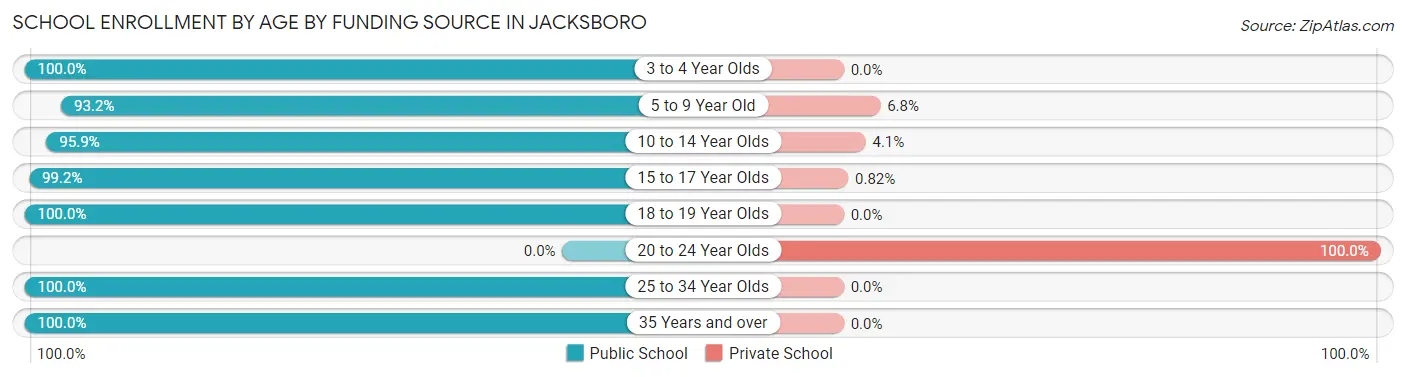
School Enrollment by Age by Funding Source in Jacksboro
Out of a total of 504 students who are enrolled in schools in Jacksboro, 55 (10.9%) attend a private institution, while the remaining 449 (89.1%) are enrolled in public schools. The age group of 20 to 24 year olds has the highest likelihood of being enrolled in private schools, with 39 (100.0% in the age bracket) enrolled. Conversely, the age group of 3 to 4 year olds has the lowest likelihood of being enrolled in a private school, with 10 (100.0% in the age bracket) attending a public institution.
| Age Bracket | Public School | Private School |
| 3 to 4 Year Olds | 10 (100.0%) | 0 (0.0%) |
| 5 to 9 Year Old | 137 (93.2%) | 10 (6.8%) |
| 10 to 14 Year Olds | 118 (95.9%) | 5 (4.1%) |
| 15 to 17 Year Olds | 121 (99.2%) | 1 (0.8%) |
| 18 to 19 Year Olds | 40 (100.0%) | 0 (0.0%) |
| 20 to 24 Year Olds | 0 (0.0%) | 39 (100.0%) |
| 25 to 34 Year Olds | 3 (100.0%) | 0 (0.0%) |
| 35 Years and over | 20 (100.0%) | 0 (0.0%) |
| Total | 449 (89.1%) | 55 (10.9%) |
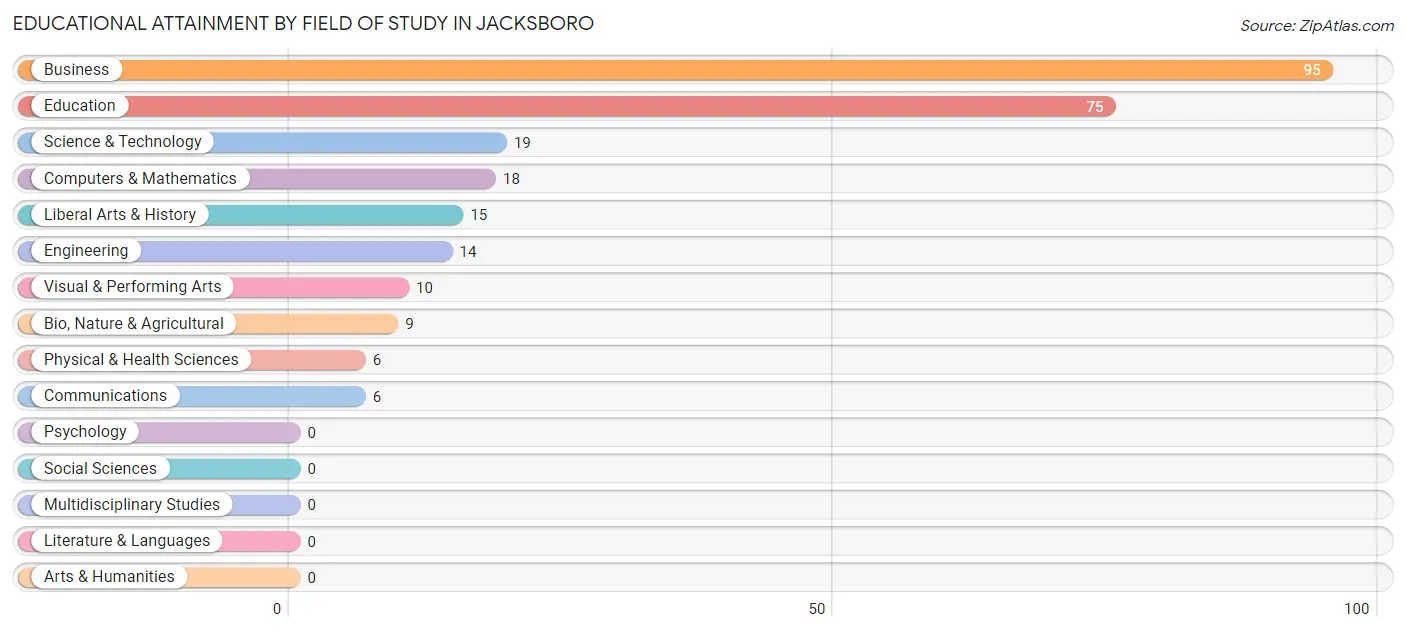
Educational Attainment by Field of Study in Jacksboro
Business (95 | 35.6%), education (75 | 28.1%), science & technology (19 | 7.1%), computers & mathematics (18 | 6.7%), and liberal arts & history (15 | 5.6%) are the most common fields of study among 267 individuals in Jacksboro who have obtained a bachelor's degree or higher.
| Field of Study | # Graduates | % Graduates |
| Computers & Mathematics | 18 | 6.7% |
| Bio, Nature & Agricultural | 9 | 3.4% |
| Physical & Health Sciences | 6 | 2.2% |
| Psychology | 0 | 0.0% |
| Social Sciences | 0 | 0.0% |
| Engineering | 14 | 5.2% |
| Multidisciplinary Studies | 0 | 0.0% |
| Science & Technology | 19 | 7.1% |
| Business | 95 | 35.6% |
| Education | 75 | 28.1% |
| Literature & Languages | 0 | 0.0% |
| Liberal Arts & History | 15 | 5.6% |
| Visual & Performing Arts | 10 | 3.7% |
| Communications | 6 | 2.2% |
| Arts & Humanities | 0 | 0.0% |
| Total | 267 | 100.0% |
Transportation & Commute in Jacksboro
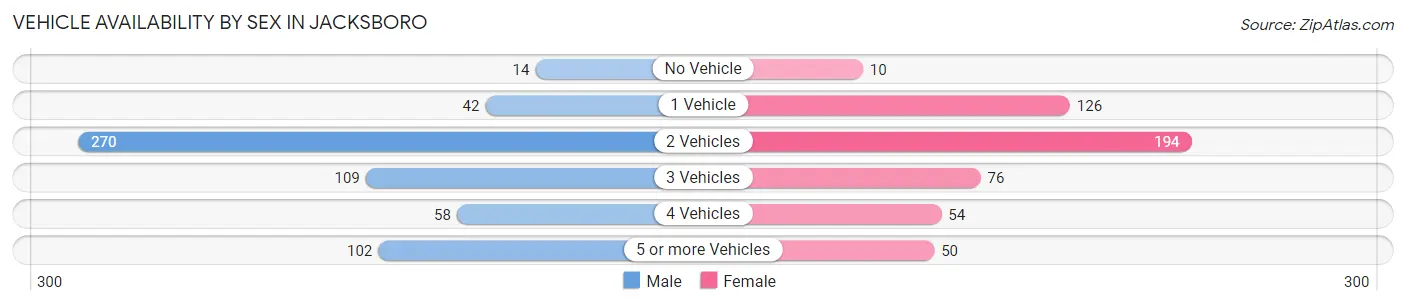
Vehicle Availability by Sex in Jacksboro
The most prevalent vehicle ownership categories in Jacksboro are males with 2 vehicles (270, accounting for 45.4%) and females with 2 vehicles (194, making up 52.9%).
| Vehicles Available | Male | Female |
| No Vehicle | 14 (2.4%) | 10 (2.0%) |
| 1 Vehicle | 42 (7.1%) | 126 (24.7%) |
| 2 Vehicles | 270 (45.4%) | 194 (38.0%) |
| 3 Vehicles | 109 (18.3%) | 76 (14.9%) |
| 4 Vehicles | 58 (9.8%) | 54 (10.6%) |
| 5 or more Vehicles | 102 (17.1%) | 50 (9.8%) |
| Total | 595 (100.0%) | 510 (100.0%) |
Commute Time in Jacksboro
The most frequently occuring commute durations in Jacksboro are 10 to 14 minutes (150 commuters, 15.3%), 25 to 29 minutes (142 commuters, 14.5%), and 5 to 9 minutes (134 commuters, 13.7%).
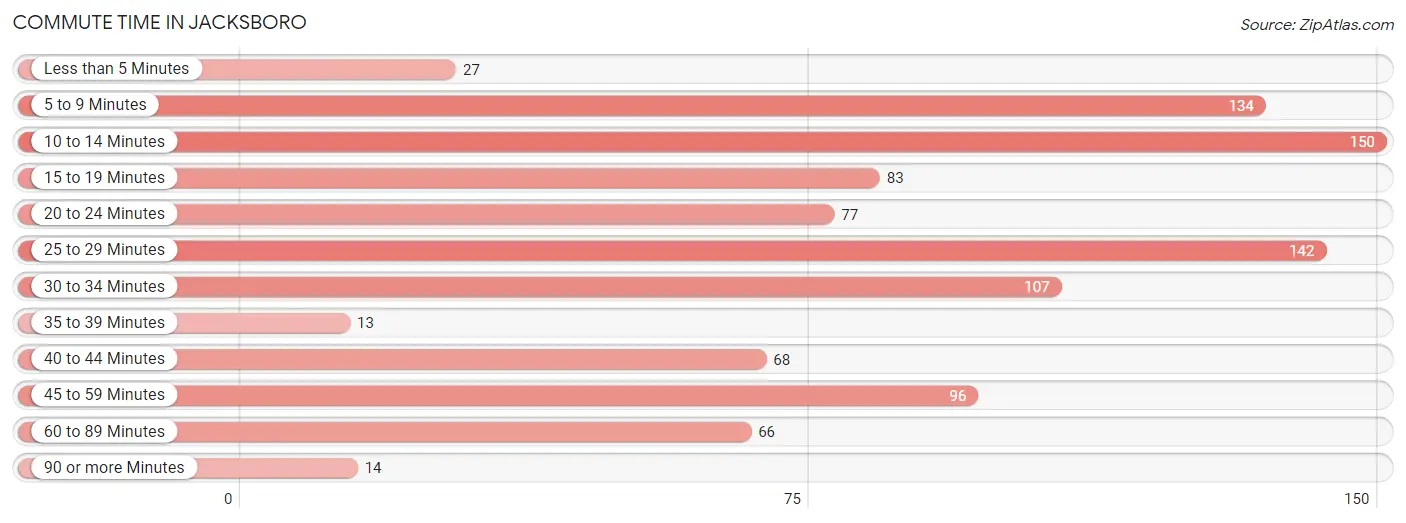
| Commute Time | # Commuters | % Commuters |
| Less than 5 Minutes | 27 | 2.8% |
| 5 to 9 Minutes | 134 | 13.7% |
| 10 to 14 Minutes | 150 | 15.3% |
| 15 to 19 Minutes | 83 | 8.5% |
| 20 to 24 Minutes | 77 | 7.9% |
| 25 to 29 Minutes | 142 | 14.5% |
| 30 to 34 Minutes | 107 | 11.0% |
| 35 to 39 Minutes | 13 | 1.3% |
| 40 to 44 Minutes | 68 | 7.0% |
| 45 to 59 Minutes | 96 | 9.8% |
| 60 to 89 Minutes | 66 | 6.8% |
| 90 or more Minutes | 14 | 1.4% |
Commute Time by Sex in Jacksboro
The most common commute times in Jacksboro are 25 to 29 minutes (116 commuters, 20.7%) for males and 10 to 14 minutes (105 commuters, 25.2%) for females.
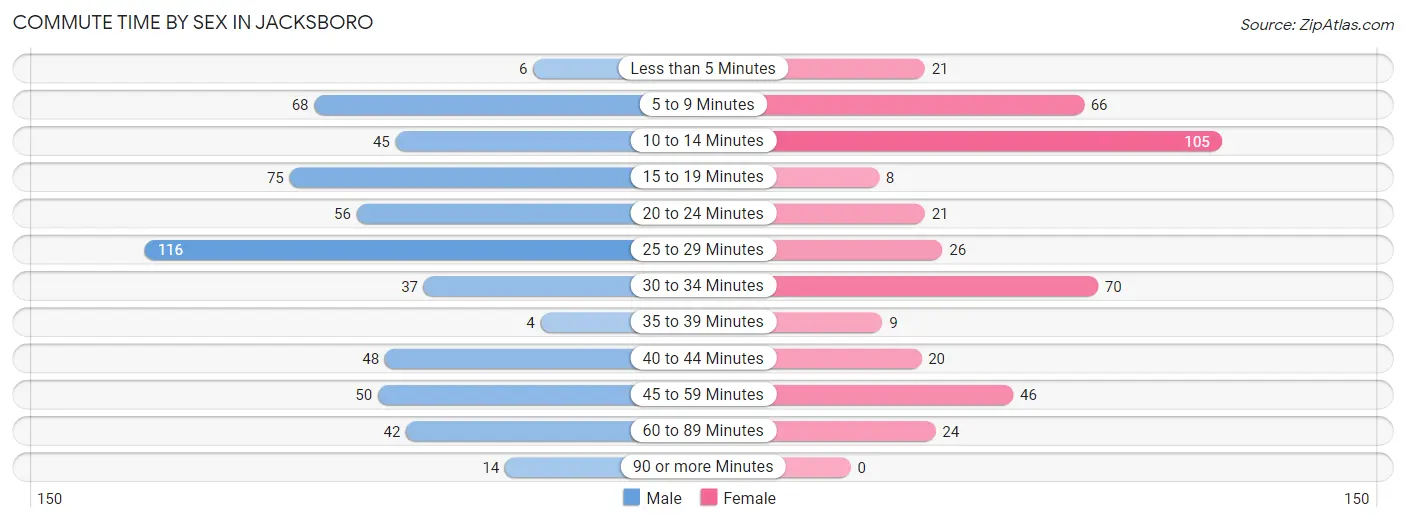
| Commute Time | Male | Female |
| Less than 5 Minutes | 6 (1.1%) | 21 (5.1%) |
| 5 to 9 Minutes | 68 (12.1%) | 66 (15.9%) |
| 10 to 14 Minutes | 45 (8.0%) | 105 (25.2%) |
| 15 to 19 Minutes | 75 (13.4%) | 8 (1.9%) |
| 20 to 24 Minutes | 56 (10.0%) | 21 (5.1%) |
| 25 to 29 Minutes | 116 (20.7%) | 26 (6.2%) |
| 30 to 34 Minutes | 37 (6.6%) | 70 (16.8%) |
| 35 to 39 Minutes | 4 (0.7%) | 9 (2.2%) |
| 40 to 44 Minutes | 48 (8.6%) | 20 (4.8%) |
| 45 to 59 Minutes | 50 (8.9%) | 46 (11.1%) |
| 60 to 89 Minutes | 42 (7.5%) | 24 (5.8%) |
| 90 or more Minutes | 14 (2.5%) | 0 (0.0%) |
Time of Departure to Work by Sex in Jacksboro
The most frequent times of departure to work in Jacksboro are 12:00 PM to 3:59 PM (131, 23.4%) for males and 7:30 AM to 7:59 AM (79, 19.0%) for females.
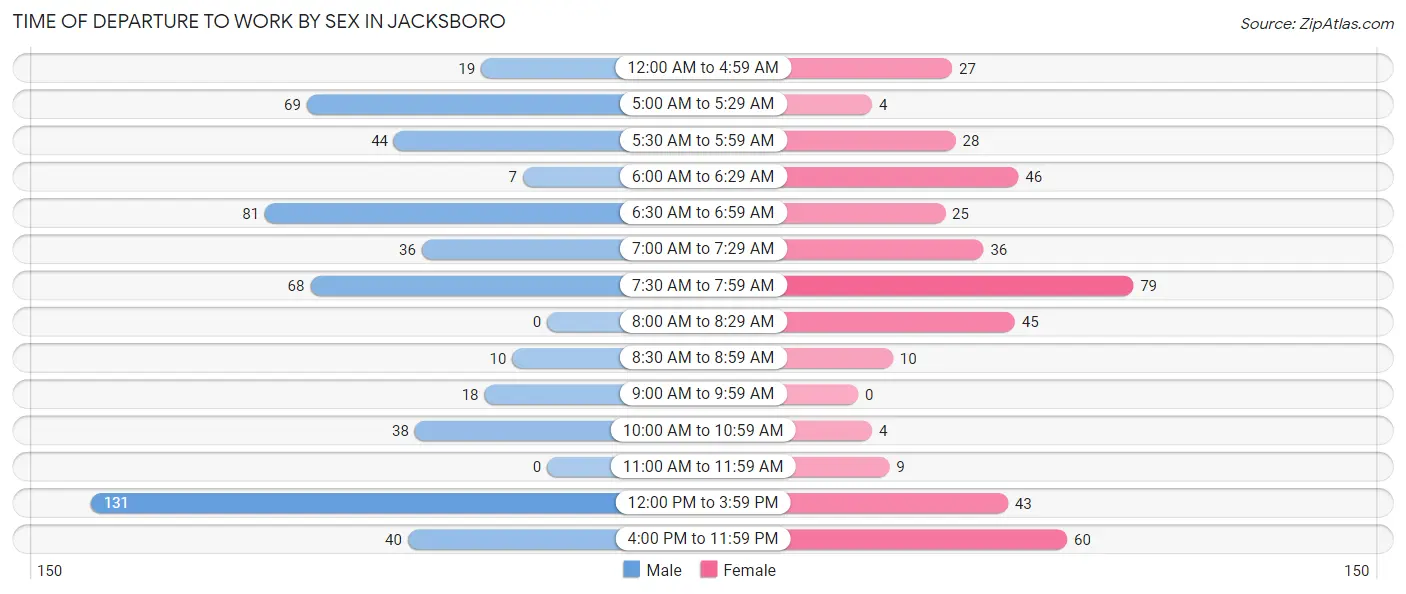
| Time of Departure | Male | Female |
| 12:00 AM to 4:59 AM | 19 (3.4%) | 27 (6.5%) |
| 5:00 AM to 5:29 AM | 69 (12.3%) | 4 (1.0%) |
| 5:30 AM to 5:59 AM | 44 (7.8%) | 28 (6.7%) |
| 6:00 AM to 6:29 AM | 7 (1.3%) | 46 (11.1%) |
| 6:30 AM to 6:59 AM | 81 (14.4%) | 25 (6.0%) |
| 7:00 AM to 7:29 AM | 36 (6.4%) | 36 (8.6%) |
| 7:30 AM to 7:59 AM | 68 (12.1%) | 79 (19.0%) |
| 8:00 AM to 8:29 AM | 0 (0.0%) | 45 (10.8%) |
| 8:30 AM to 8:59 AM | 10 (1.8%) | 10 (2.4%) |
| 9:00 AM to 9:59 AM | 18 (3.2%) | 0 (0.0%) |
| 10:00 AM to 10:59 AM | 38 (6.8%) | 4 (1.0%) |
| 11:00 AM to 11:59 AM | 0 (0.0%) | 9 (2.2%) |
| 12:00 PM to 3:59 PM | 131 (23.4%) | 43 (10.3%) |
| 4:00 PM to 11:59 PM | 40 (7.1%) | 60 (14.4%) |
| Total | 561 (100.0%) | 416 (100.0%) |
Housing Occupancy in Jacksboro
Occupancy by Ownership in Jacksboro
Of the total 1,072 dwellings in Jacksboro, owner-occupied units account for 689 (64.3%), while renter-occupied units make up 383 (35.7%).
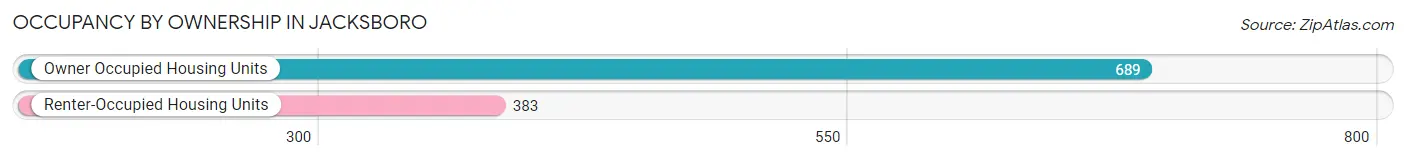
| Occupancy | # Housing Units | % Housing Units |
| Owner Occupied Housing Units | 689 | 64.3% |
| Renter-Occupied Housing Units | 383 | 35.7% |
| Total Occupied Housing Units | 1,072 | 100.0% |
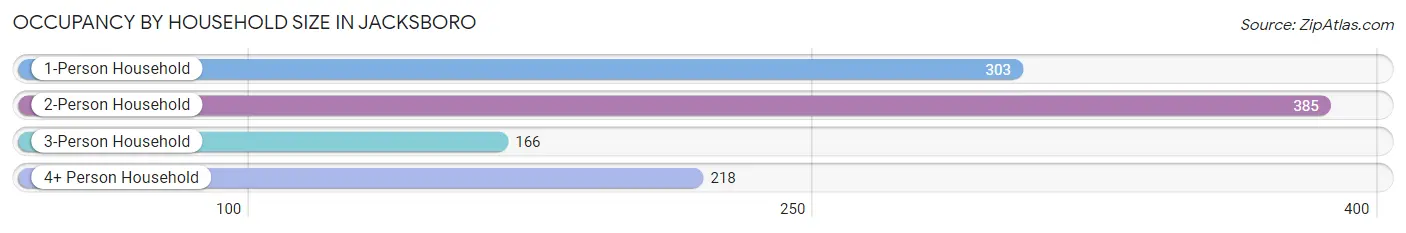
Occupancy by Household Size in Jacksboro
| Household Size | # Housing Units | % Housing Units |
| 1-Person Household | 303 | 28.3% |
| 2-Person Household | 385 | 35.9% |
| 3-Person Household | 166 | 15.5% |
| 4+ Person Household | 218 | 20.3% |
| Total Housing Units | 1,072 | 100.0% |
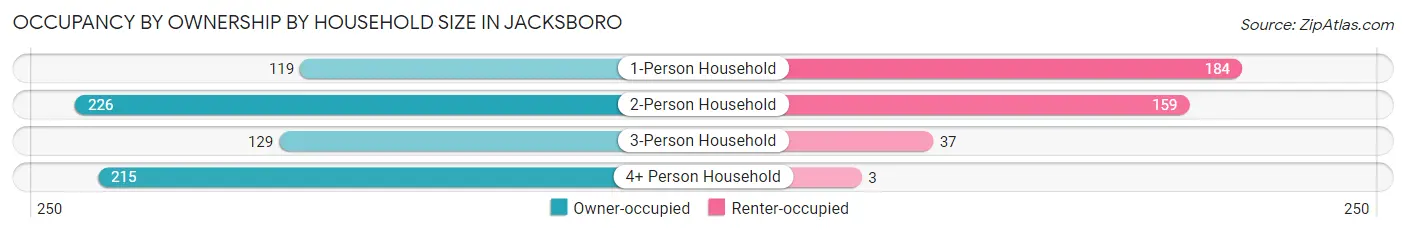
Occupancy by Ownership by Household Size in Jacksboro
| Household Size | Owner-occupied | Renter-occupied |
| 1-Person Household | 119 (39.3%) | 184 (60.7%) |
| 2-Person Household | 226 (58.7%) | 159 (41.3%) |
| 3-Person Household | 129 (77.7%) | 37 (22.3%) |
| 4+ Person Household | 215 (98.6%) | 3 (1.4%) |
| Total Housing Units | 689 (64.3%) | 383 (35.7%) |
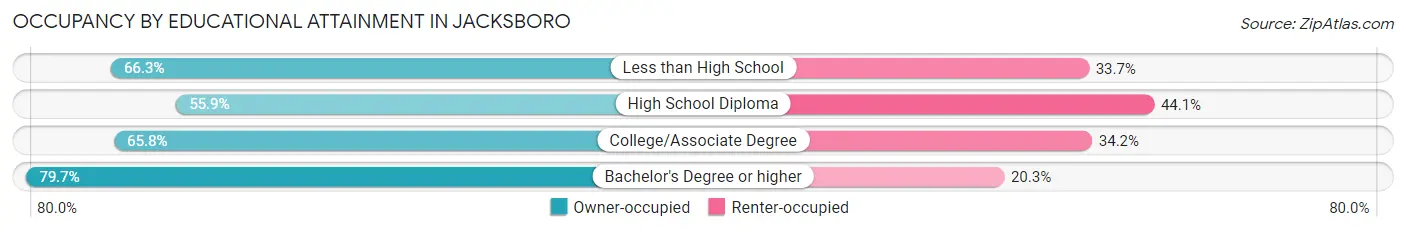
Occupancy by Educational Attainment in Jacksboro
| Household Size | Owner-occupied | Renter-occupied |
| Less than High School | 59 (66.3%) | 30 (33.7%) |
| High School Diploma | 212 (55.9%) | 167 (44.1%) |
| College/Associate Degree | 300 (65.8%) | 156 (34.2%) |
| Bachelor's Degree or higher | 118 (79.7%) | 30 (20.3%) |
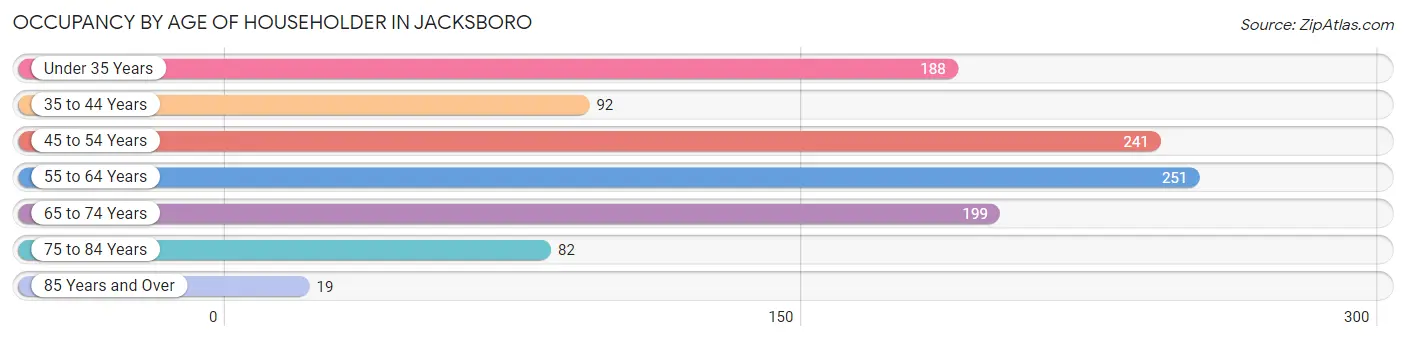
Occupancy by Age of Householder in Jacksboro
| Age Bracket | # Households | % Households |
| Under 35 Years | 188 | 17.5% |
| 35 to 44 Years | 92 | 8.6% |
| 45 to 54 Years | 241 | 22.5% |
| 55 to 64 Years | 251 | 23.4% |
| 65 to 74 Years | 199 | 18.6% |
| 75 to 84 Years | 82 | 7.6% |
| 85 Years and Over | 19 | 1.8% |
| Total | 1,072 | 100.0% |
Housing Finances in Jacksboro
Median Income by Occupancy in Jacksboro
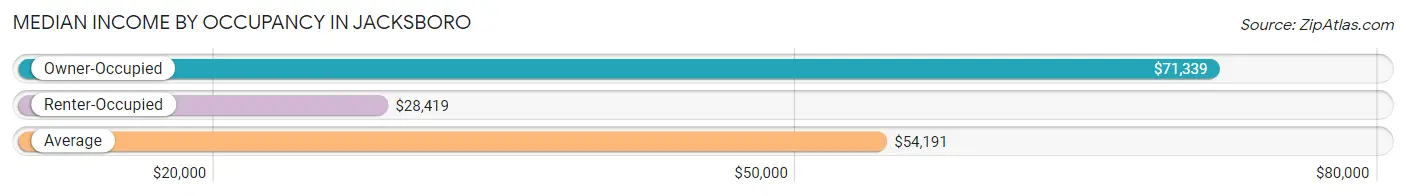
| Occupancy Type | # Households | Median Income |
| Owner-Occupied | 689 (64.3%) | $71,339 |
| Renter-Occupied | 383 (35.7%) | $28,419 |
| Average | 1,072 (100.0%) | $54,191 |
Occupancy by Householder Income Bracket in Jacksboro
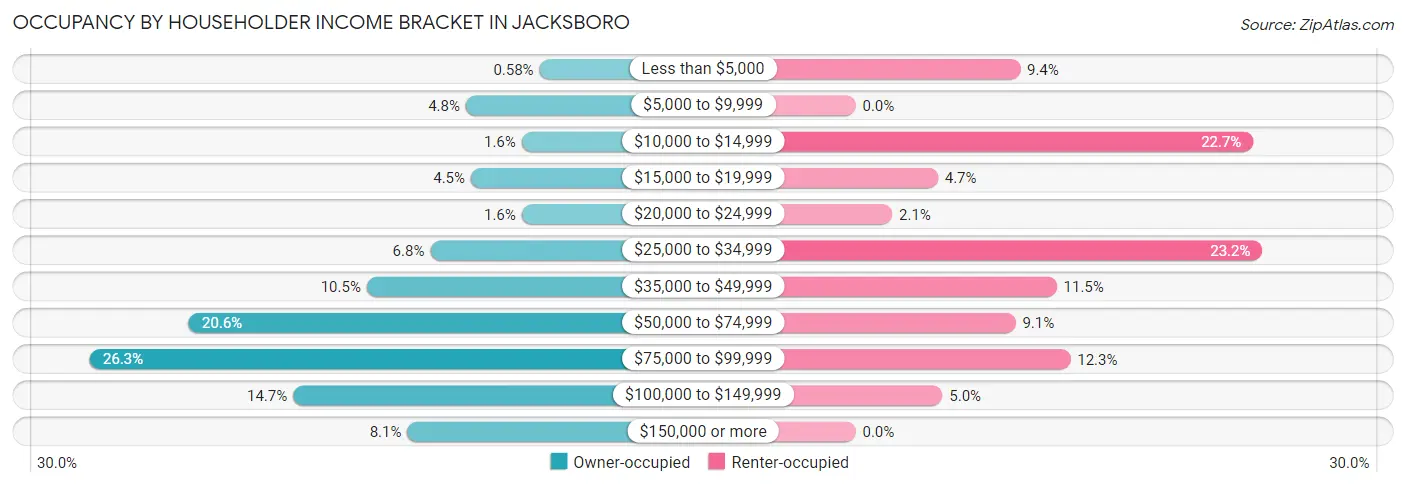
| Income Bracket | Owner-occupied | Renter-occupied |
| Less than $5,000 | 4 (0.6%) | 36 (9.4%) |
| $5,000 to $9,999 | 33 (4.8%) | 0 (0.0%) |
| $10,000 to $14,999 | 11 (1.6%) | 87 (22.7%) |
| $15,000 to $19,999 | 31 (4.5%) | 18 (4.7%) |
| $20,000 to $24,999 | 11 (1.6%) | 8 (2.1%) |
| $25,000 to $34,999 | 47 (6.8%) | 89 (23.2%) |
| $35,000 to $49,999 | 72 (10.4%) | 44 (11.5%) |
| $50,000 to $74,999 | 142 (20.6%) | 35 (9.1%) |
| $75,000 to $99,999 | 181 (26.3%) | 47 (12.3%) |
| $100,000 to $149,999 | 101 (14.7%) | 19 (5.0%) |
| $150,000 or more | 56 (8.1%) | 0 (0.0%) |
| Total | 689 (100.0%) | 383 (100.0%) |
Monthly Housing Cost Tiers in Jacksboro
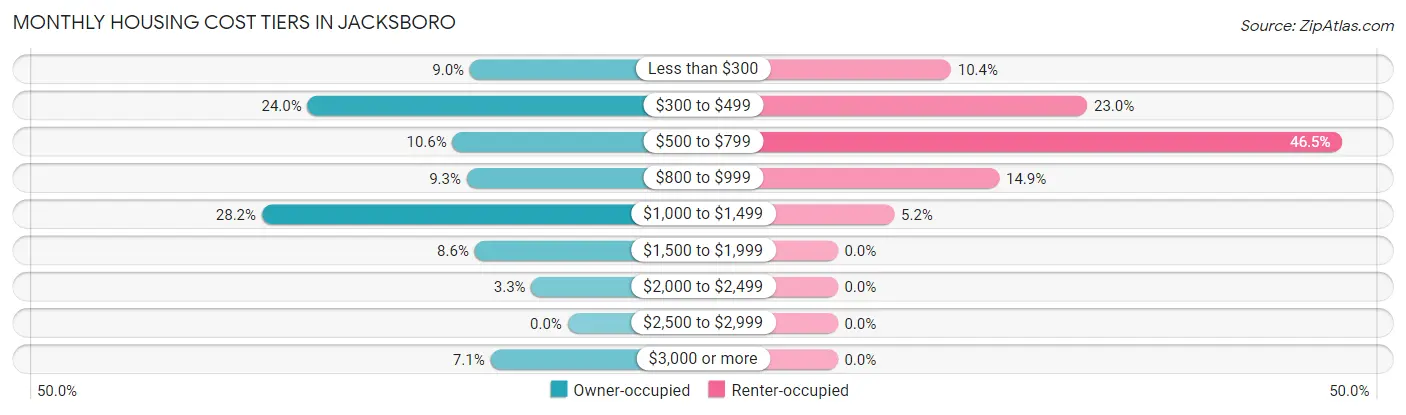
| Monthly Cost | Owner-occupied | Renter-occupied |
| Less than $300 | 62 (9.0%) | 40 (10.4%) |
| $300 to $499 | 165 (23.9%) | 88 (23.0%) |
| $500 to $799 | 73 (10.6%) | 178 (46.5%) |
| $800 to $999 | 64 (9.3%) | 57 (14.9%) |
| $1,000 to $1,499 | 194 (28.2%) | 20 (5.2%) |
| $1,500 to $1,999 | 59 (8.6%) | 0 (0.0%) |
| $2,000 to $2,499 | 23 (3.3%) | 0 (0.0%) |
| $2,500 to $2,999 | 0 (0.0%) | 0 (0.0%) |
| $3,000 or more | 49 (7.1%) | 0 (0.0%) |
| Total | 689 (100.0%) | 383 (100.0%) |
Physical Housing Characteristics in Jacksboro
Housing Structures in Jacksboro
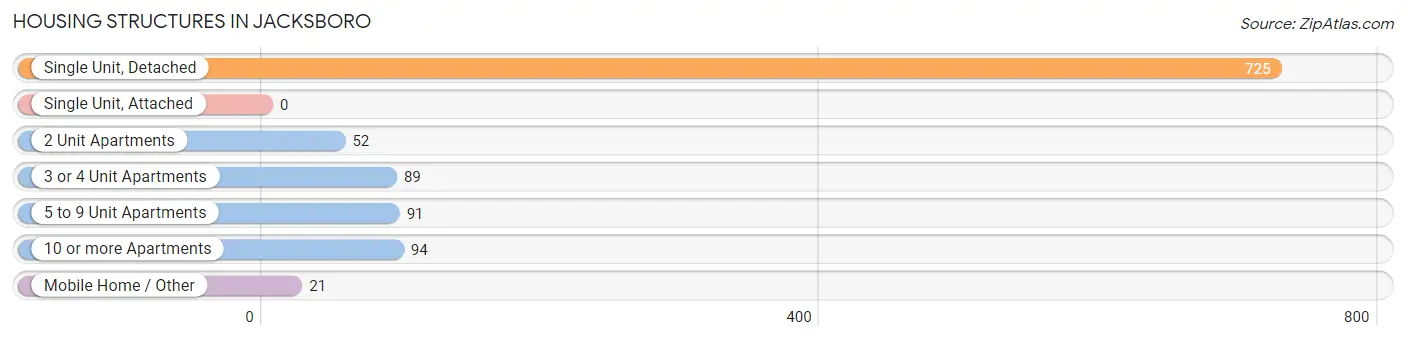
| Structure Type | # Housing Units | % Housing Units |
| Single Unit, Detached | 725 | 67.6% |
| Single Unit, Attached | 0 | 0.0% |
| 2 Unit Apartments | 52 | 4.9% |
| 3 or 4 Unit Apartments | 89 | 8.3% |
| 5 to 9 Unit Apartments | 91 | 8.5% |
| 10 or more Apartments | 94 | 8.8% |
| Mobile Home / Other | 21 | 2.0% |
| Total | 1,072 | 100.0% |
Housing Structures by Occupancy in Jacksboro
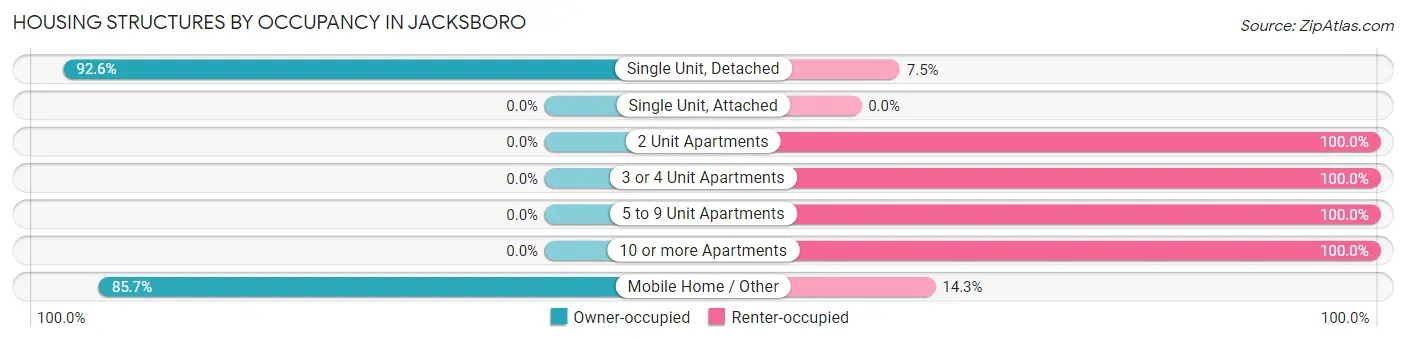
| Structure Type | Owner-occupied | Renter-occupied |
| Single Unit, Detached | 671 (92.5%) | 54 (7.4%) |
| Single Unit, Attached | 0 (0.0%) | 0 (0.0%) |
| 2 Unit Apartments | 0 (0.0%) | 52 (100.0%) |
| 3 or 4 Unit Apartments | 0 (0.0%) | 89 (100.0%) |
| 5 to 9 Unit Apartments | 0 (0.0%) | 91 (100.0%) |
| 10 or more Apartments | 0 (0.0%) | 94 (100.0%) |
| Mobile Home / Other | 18 (85.7%) | 3 (14.3%) |
| Total | 689 (64.3%) | 383 (35.7%) |
Housing Structures by Number of Rooms in Jacksboro
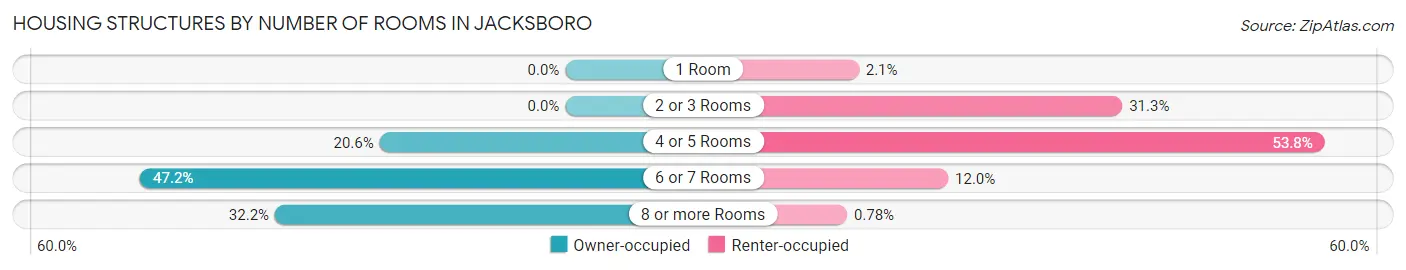
| Number of Rooms | Owner-occupied | Renter-occupied |
| 1 Room | 0 (0.0%) | 8 (2.1%) |
| 2 or 3 Rooms | 0 (0.0%) | 120 (31.3%) |
| 4 or 5 Rooms | 142 (20.6%) | 206 (53.8%) |
| 6 or 7 Rooms | 325 (47.2%) | 46 (12.0%) |
| 8 or more Rooms | 222 (32.2%) | 3 (0.8%) |
| Total | 689 (100.0%) | 383 (100.0%) |
Housing Structure by Heating Type in Jacksboro
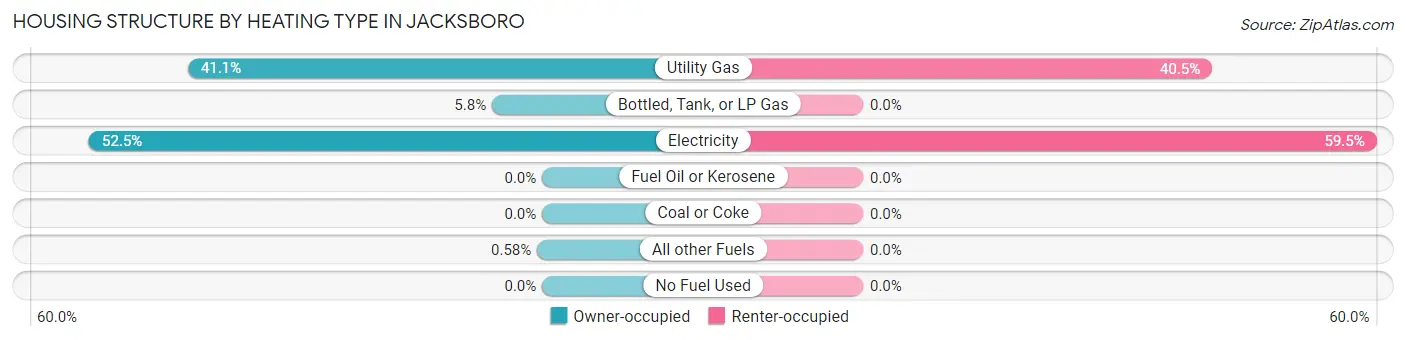
| Heating Type | Owner-occupied | Renter-occupied |
| Utility Gas | 283 (41.1%) | 155 (40.5%) |
| Bottled, Tank, or LP Gas | 40 (5.8%) | 0 (0.0%) |
| Electricity | 362 (52.5%) | 228 (59.5%) |
| Fuel Oil or Kerosene | 0 (0.0%) | 0 (0.0%) |
| Coal or Coke | 0 (0.0%) | 0 (0.0%) |
| All other Fuels | 4 (0.6%) | 0 (0.0%) |
| No Fuel Used | 0 (0.0%) | 0 (0.0%) |
| Total | 689 (100.0%) | 383 (100.0%) |
Household Vehicle Usage in Jacksboro
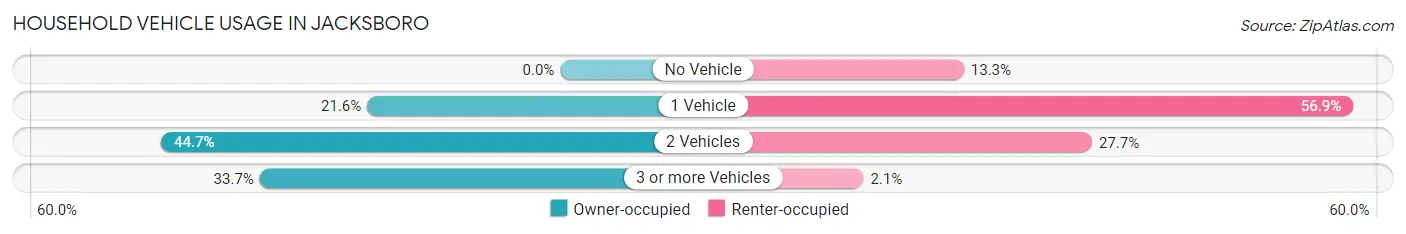
| Vehicles per Household | Owner-occupied | Renter-occupied |
| No Vehicle | 0 (0.0%) | 51 (13.3%) |
| 1 Vehicle | 149 (21.6%) | 218 (56.9%) |
| 2 Vehicles | 308 (44.7%) | 106 (27.7%) |
| 3 or more Vehicles | 232 (33.7%) | 8 (2.1%) |
| Total | 689 (100.0%) | 383 (100.0%) |
Real Estate & Mortgages in Jacksboro
Real Estate and Mortgage Overview in Jacksboro
| Characteristic | Without Mortgage | With Mortgage |
| Housing Units | 285 | 404 |
| Median Property Value | $156,700 | $201,000 |
| Median Household Income | $50,170 | $45 |
| Monthly Housing Costs | $378 | $49 |
| Real Estate Taxes | $598 | $29 |
Property Value by Mortgage Status in Jacksboro
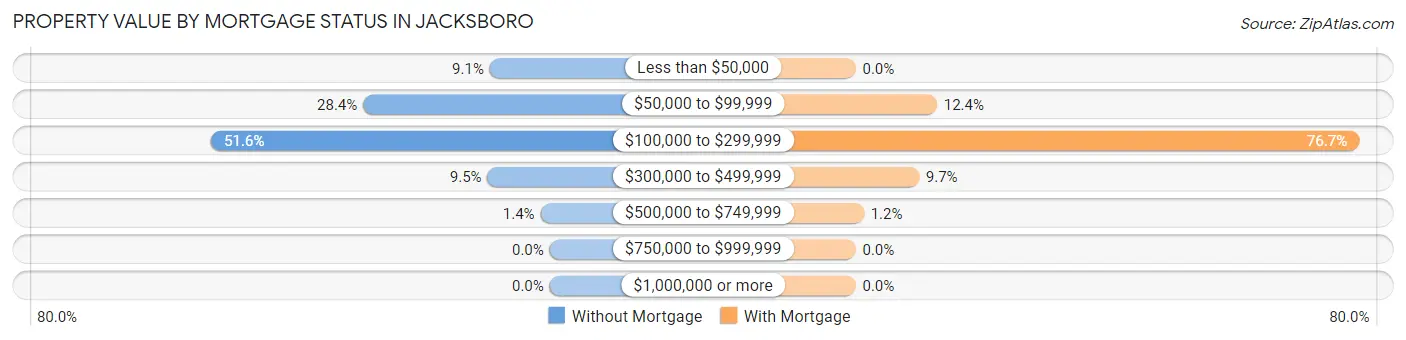
| Property Value | Without Mortgage | With Mortgage |
| Less than $50,000 | 26 (9.1%) | 0 (0.0%) |
| $50,000 to $99,999 | 81 (28.4%) | 50 (12.4%) |
| $100,000 to $299,999 | 147 (51.6%) | 310 (76.7%) |
| $300,000 to $499,999 | 27 (9.5%) | 39 (9.7%) |
| $500,000 to $749,999 | 4 (1.4%) | 5 (1.2%) |
| $750,000 to $999,999 | 0 (0.0%) | 0 (0.0%) |
| $1,000,000 or more | 0 (0.0%) | 0 (0.0%) |
| Total | 285 (100.0%) | 404 (100.0%) |
Household Income by Mortgage Status in Jacksboro
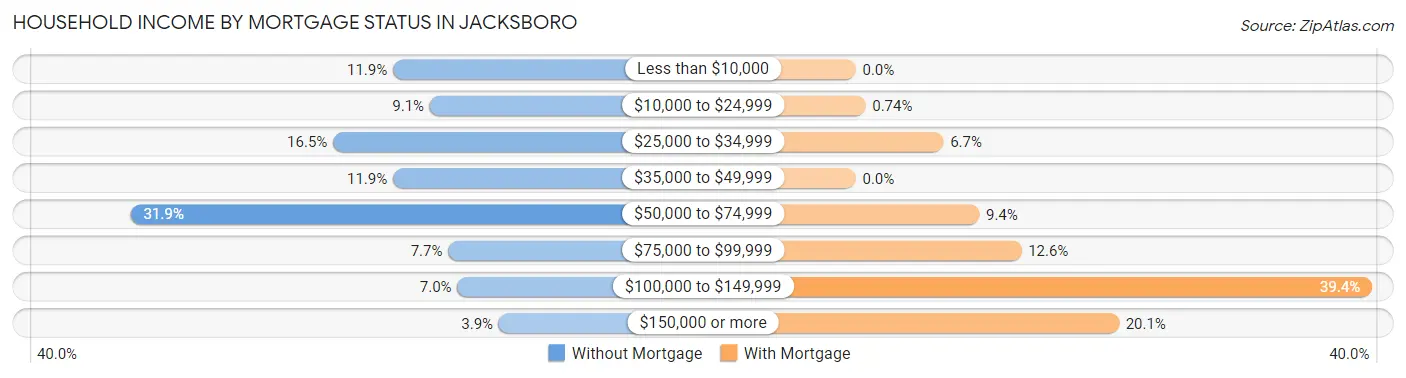
| Household Income | Without Mortgage | With Mortgage |
| Less than $10,000 | 34 (11.9%) | 0 (0.0%) |
| $10,000 to $24,999 | 26 (9.1%) | 3 (0.7%) |
| $25,000 to $34,999 | 47 (16.5%) | 27 (6.7%) |
| $35,000 to $49,999 | 34 (11.9%) | 0 (0.0%) |
| $50,000 to $74,999 | 91 (31.9%) | 38 (9.4%) |
| $75,000 to $99,999 | 22 (7.7%) | 51 (12.6%) |
| $100,000 to $149,999 | 20 (7.0%) | 159 (39.4%) |
| $150,000 or more | 11 (3.9%) | 81 (20.1%) |
| Total | 285 (100.0%) | 404 (100.0%) |
Property Value to Household Income Ratio in Jacksboro
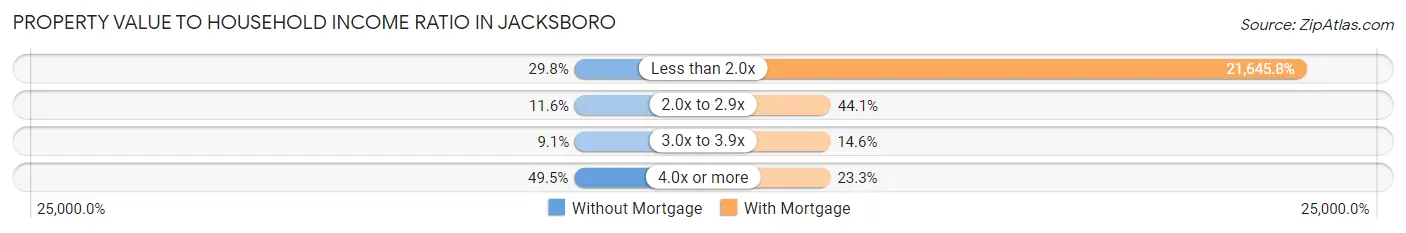
| Value-to-Income Ratio | Without Mortgage | With Mortgage |
| Less than 2.0x | 85 (29.8%) | 87,449 (21,645.8%) |
| 2.0x to 2.9x | 33 (11.6%) | 178 (44.1%) |
| 3.0x to 3.9x | 26 (9.1%) | 59 (14.6%) |
| 4.0x or more | 141 (49.5%) | 94 (23.3%) |
| Total | 285 (100.0%) | 404 (100.0%) |
Real Estate Taxes by Mortgage Status in Jacksboro
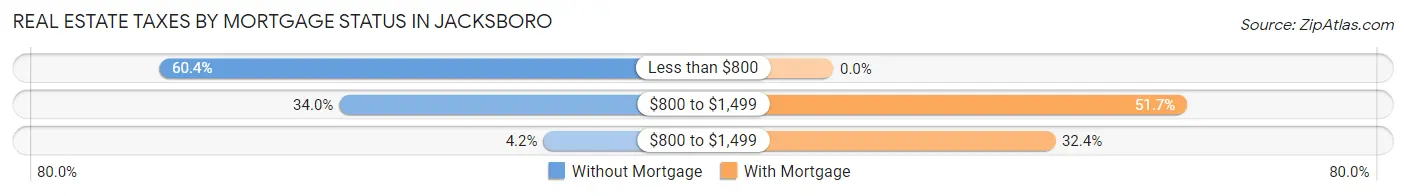
| Property Taxes | Without Mortgage | With Mortgage |
| Less than $800 | 172 (60.4%) | 0 (0.0%) |
| $800 to $1,499 | 97 (34.0%) | 209 (51.7%) |
| $800 to $1,499 | 12 (4.2%) | 131 (32.4%) |
| Total | 285 (100.0%) | 404 (100.0%) |
Health & Disability in Jacksboro
Health Insurance Coverage by Age in Jacksboro
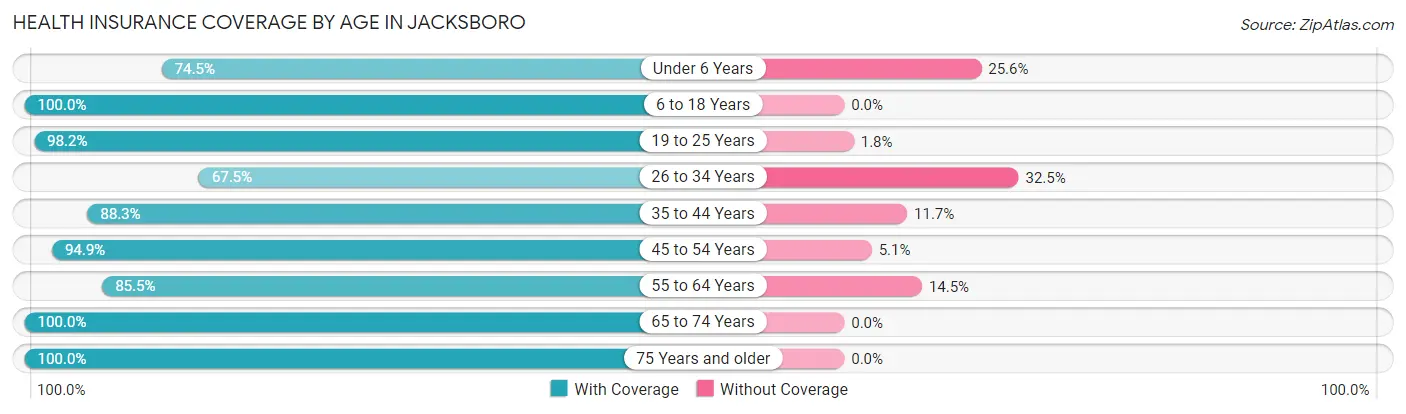
| Age Bracket | With Coverage | Without Coverage |
| Under 6 Years | 102 (74.5%) | 35 (25.6%) |
| 6 to 18 Years | 422 (100.0%) | 0 (0.0%) |
| 19 to 25 Years | 277 (98.2%) | 5 (1.8%) |
| 26 to 34 Years | 216 (67.5%) | 104 (32.5%) |
| 35 to 44 Years | 181 (88.3%) | 24 (11.7%) |
| 45 to 54 Years | 316 (94.9%) | 17 (5.1%) |
| 55 to 64 Years | 378 (85.5%) | 64 (14.5%) |
| 65 to 74 Years | 255 (100.0%) | 0 (0.0%) |
| 75 Years and older | 169 (100.0%) | 0 (0.0%) |
| Total | 2,316 (90.3%) | 249 (9.7%) |
Health Insurance Coverage by Citizenship Status in Jacksboro
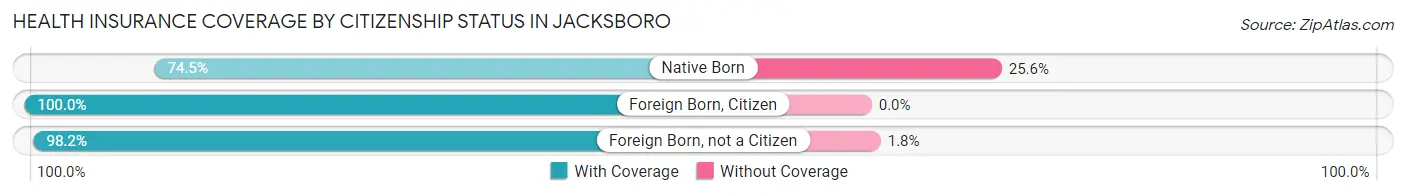
| Citizenship Status | With Coverage | Without Coverage |
| Native Born | 102 (74.5%) | 35 (25.6%) |
| Foreign Born, Citizen | 422 (100.0%) | 0 (0.0%) |
| Foreign Born, not a Citizen | 277 (98.2%) | 5 (1.8%) |
Health Insurance Coverage by Household Income in Jacksboro
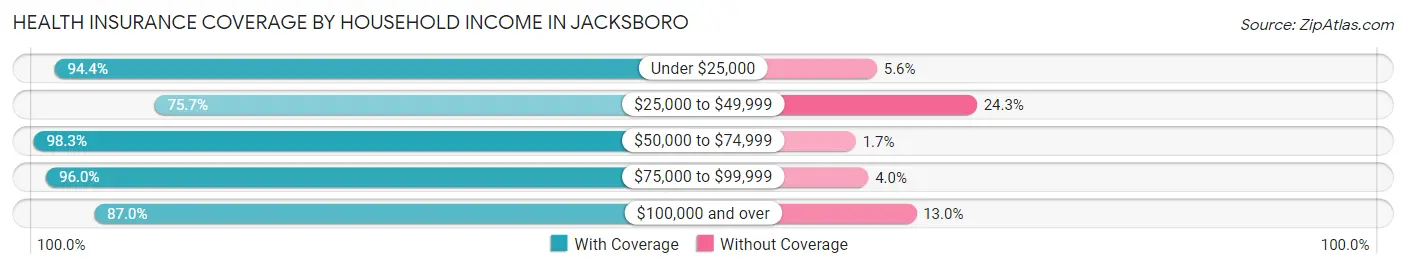
| Household Income | With Coverage | Without Coverage |
| Under $25,000 | 336 (94.4%) | 20 (5.6%) |
| $25,000 to $49,999 | 345 (75.7%) | 111 (24.3%) |
| $50,000 to $74,999 | 411 (98.3%) | 7 (1.7%) |
| $75,000 to $99,999 | 669 (96.0%) | 28 (4.0%) |
| $100,000 and over | 555 (87.0%) | 83 (13.0%) |
Public vs Private Health Insurance Coverage by Age in Jacksboro
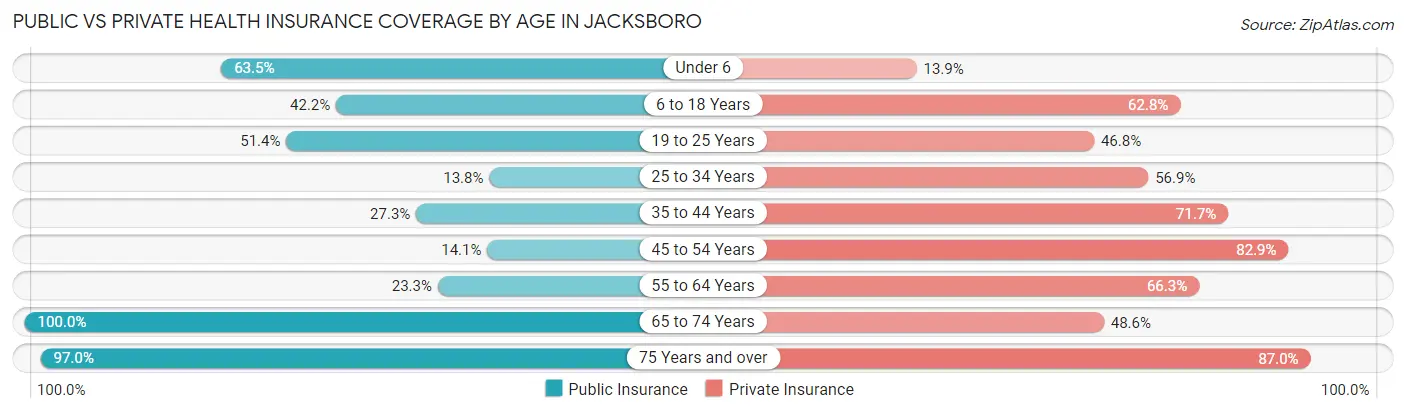
| Age Bracket | Public Insurance | Private Insurance |
| Under 6 | 87 (63.5%) | 19 (13.9%) |
| 6 to 18 Years | 178 (42.2%) | 265 (62.8%) |
| 19 to 25 Years | 145 (51.4%) | 132 (46.8%) |
| 25 to 34 Years | 44 (13.8%) | 182 (56.9%) |
| 35 to 44 Years | 56 (27.3%) | 147 (71.7%) |
| 45 to 54 Years | 47 (14.1%) | 276 (82.9%) |
| 55 to 64 Years | 103 (23.3%) | 293 (66.3%) |
| 65 to 74 Years | 255 (100.0%) | 124 (48.6%) |
| 75 Years and over | 164 (97.0%) | 147 (87.0%) |
| Total | 1,079 (42.1%) | 1,585 (61.8%) |
Disability Status by Sex by Age in Jacksboro
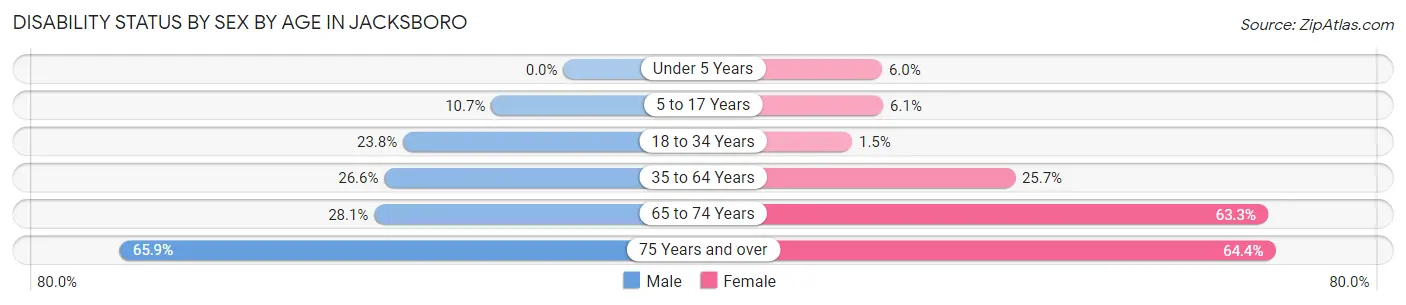
| Age Bracket | Male | Female |
| Under 5 Years | 0 (0.0%) | 4 (6.0%) |
| 5 to 17 Years | 18 (10.7%) | 14 (6.1%) |
| 18 to 34 Years | 95 (23.8%) | 4 (1.5%) |
| 35 to 64 Years | 121 (26.6%) | 135 (25.7%) |
| 65 to 74 Years | 25 (28.1%) | 105 (63.2%) |
| 75 Years and over | 54 (65.8%) | 56 (64.4%) |
Disability Class by Sex by Age in Jacksboro
Disability Class: Hearing Difficulty
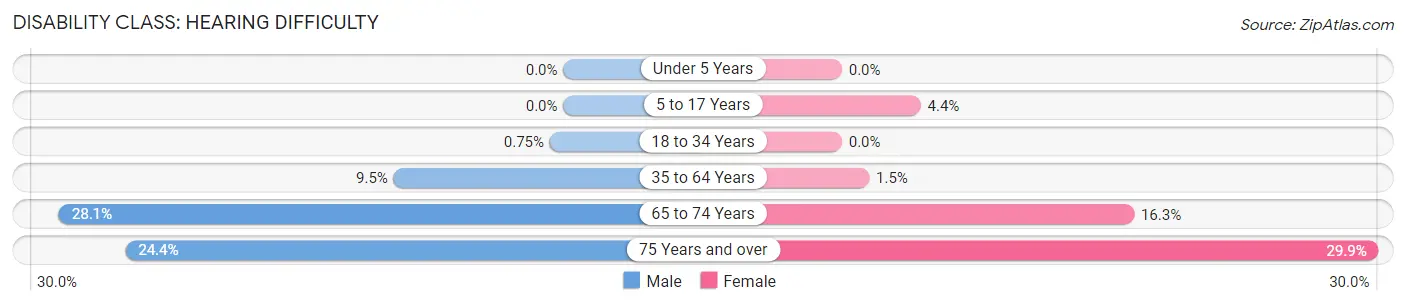
| Age Bracket | Male | Female |
| Under 5 Years | 0 (0.0%) | 0 (0.0%) |
| 5 to 17 Years | 0 (0.0%) | 10 (4.4%) |
| 18 to 34 Years | 3 (0.7%) | 0 (0.0%) |
| 35 to 64 Years | 43 (9.5%) | 8 (1.5%) |
| 65 to 74 Years | 25 (28.1%) | 27 (16.3%) |
| 75 Years and over | 20 (24.4%) | 26 (29.9%) |
Disability Class: Vision Difficulty
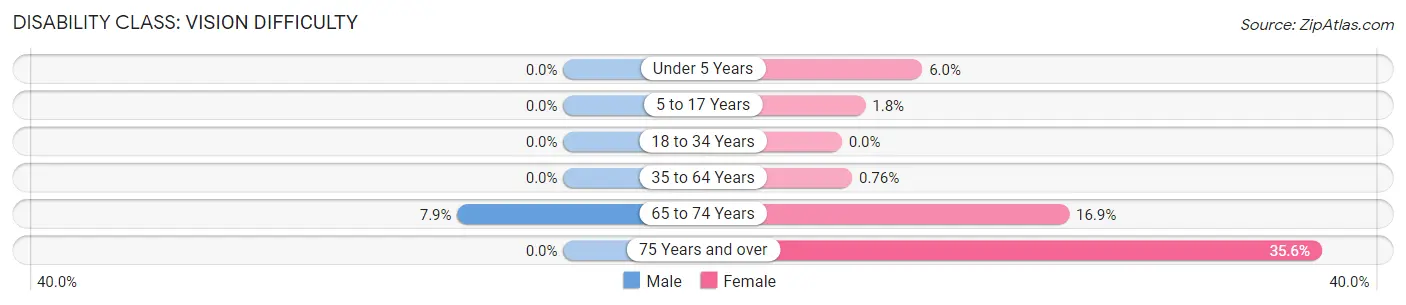
| Age Bracket | Male | Female |
| Under 5 Years | 0 (0.0%) | 4 (6.0%) |
| 5 to 17 Years | 0 (0.0%) | 4 (1.8%) |
| 18 to 34 Years | 0 (0.0%) | 0 (0.0%) |
| 35 to 64 Years | 0 (0.0%) | 4 (0.8%) |
| 65 to 74 Years | 7 (7.9%) | 28 (16.9%) |
| 75 Years and over | 0 (0.0%) | 31 (35.6%) |
Disability Class: Cognitive Difficulty
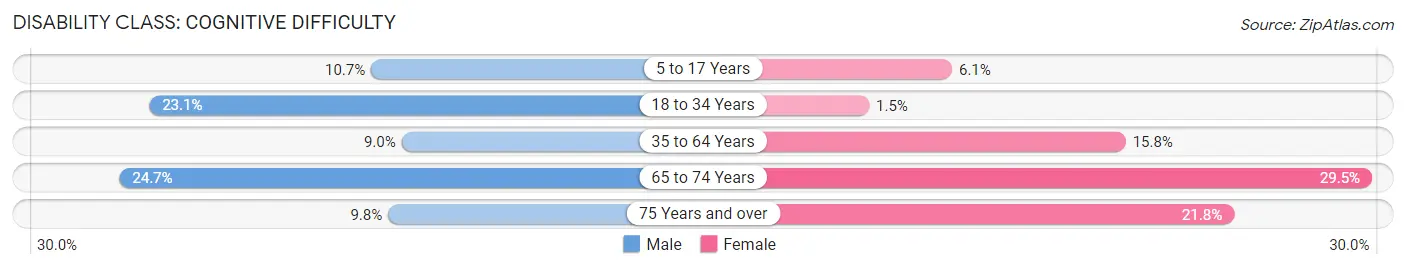
| Age Bracket | Male | Female |
| 5 to 17 Years | 18 (10.7%) | 14 (6.1%) |
| 18 to 34 Years | 92 (23.1%) | 4 (1.5%) |
| 35 to 64 Years | 41 (9.0%) | 83 (15.8%) |
| 65 to 74 Years | 22 (24.7%) | 49 (29.5%) |
| 75 Years and over | 8 (9.8%) | 19 (21.8%) |
Disability Class: Ambulatory Difficulty
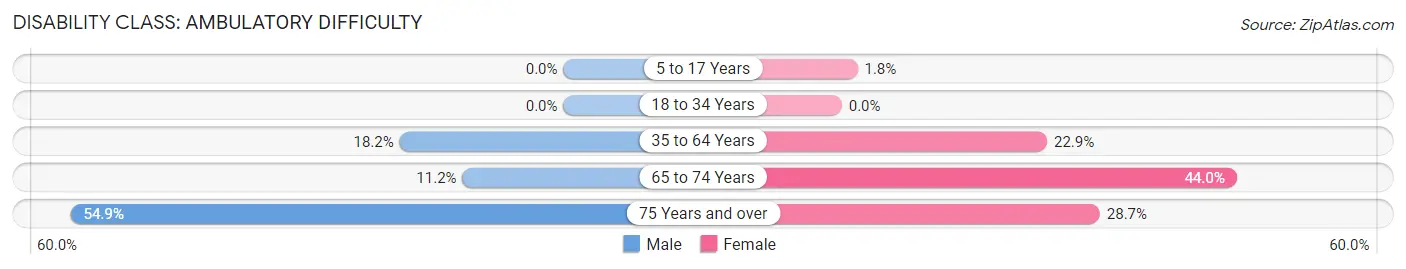
| Age Bracket | Male | Female |
| 5 to 17 Years | 0 (0.0%) | 4 (1.8%) |
| 18 to 34 Years | 0 (0.0%) | 0 (0.0%) |
| 35 to 64 Years | 83 (18.2%) | 120 (22.9%) |
| 65 to 74 Years | 10 (11.2%) | 73 (44.0%) |
| 75 Years and over | 45 (54.9%) | 25 (28.7%) |
Disability Class: Self-Care Difficulty
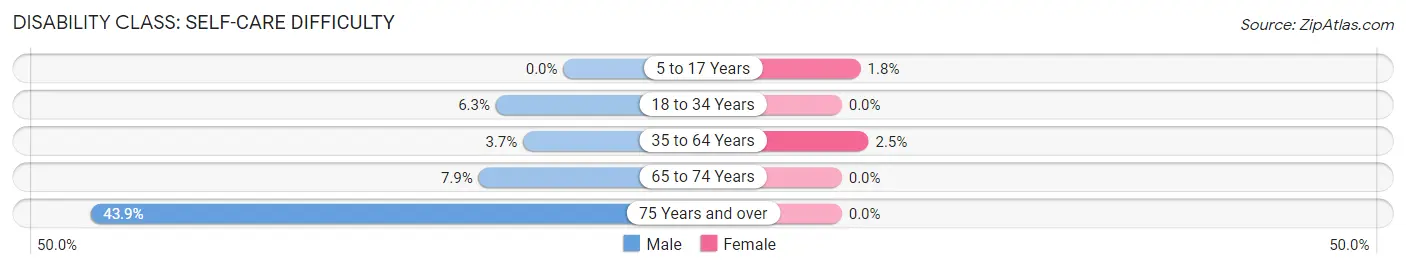
| Age Bracket | Male | Female |
| 5 to 17 Years | 0 (0.0%) | 4 (1.8%) |
| 18 to 34 Years | 25 (6.3%) | 0 (0.0%) |
| 35 to 64 Years | 17 (3.7%) | 13 (2.5%) |
| 65 to 74 Years | 7 (7.9%) | 0 (0.0%) |
| 75 Years and over | 36 (43.9%) | 0 (0.0%) |
Technology Access in Jacksboro
Computing Device Access in Jacksboro
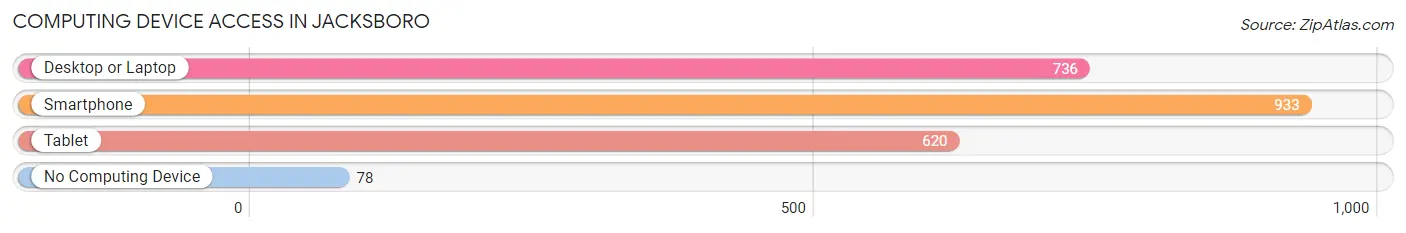
| Device Type | # Households | % Households |
| Desktop or Laptop | 736 | 68.7% |
| Smartphone | 933 | 87.0% |
| Tablet | 620 | 57.8% |
| No Computing Device | 78 | 7.3% |
| Total | 1,072 | 100.0% |
Internet Access in Jacksboro
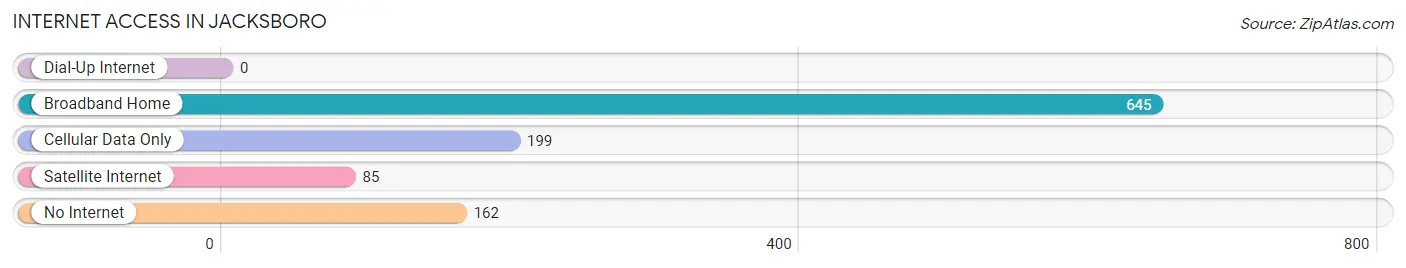
| Internet Type | # Households | % Households |
| Dial-Up Internet | 0 | 0.0% |
| Broadband Home | 645 | 60.2% |
| Cellular Data Only | 199 | 18.6% |
| Satellite Internet | 85 | 7.9% |
| No Internet | 162 | 15.1% |
| Total | 1,072 | 100.0% |
Jacksboro Summary
Jacksboro is a small town located in Campbell County, Tennessee. It is situated in the foothills of the Cumberland Mountains, approximately 40 miles north of Knoxville. The town was founded in 1817 and named after William Jack, a Revolutionary War veteran who settled in the area. The population of Jacksboro was 2,817 at the 2010 census.
Geography
Jacksboro is located at 35°45'25"N 84°14'17"W (35.7569, -84.2379). It is situated in the foothills of the Cumberland Mountains, approximately 40 miles north of Knoxville. The town is located on the banks of the Clinch River, which is a major tributary of the Tennessee River. The town is surrounded by the Cherokee National Forest, which provides a variety of recreational activities.
The town has a total area of 4.2 square miles, all of which is land. The elevation of Jacksboro is 1,068 feet above sea level.
History
Jacksboro was founded in 1817 and named after William Jack, a Revolutionary War veteran who settled in the area. The town was originally known as Jacksborough, but the name was changed to Jacksboro in 1820.
The town was an important stop on the stagecoach route between Knoxville and Nashville. In 1845, the East Tennessee and Virginia Railroad was built through Jacksboro, connecting the town to the rest of the state.
The town was also an important center for the Union Army during the Civil War. In 1863, the Battle of Jacksboro was fought in the area. The Union forces were victorious and the town remained in Union control for the remainder of the war.
Economy
The economy of Jacksboro is largely based on agriculture and tourism. The town is home to several farms, which produce a variety of crops, including corn, soybeans, wheat, and hay. The town is also home to several tourist attractions, including the Jacksboro National Historic Site, which is a Civil War battlefield.
The town is also home to several manufacturing companies, including a furniture factory, a plastics factory, and a metal fabrication plant.
Demographics
As of the 2010 census, the population of Jacksboro was 2,817. The racial makeup of the town was 95.3% White, 1.2% African American, 0.3% Native American, 0.3% Asian, 0.1% Pacific Islander, 1.2% from other races, and 1.6% from two or more races. Hispanic or Latino of any race were 2.2% of the population.
The median income for a household in Jacksboro was $30,938, and the median income for a family was $37,813. The per capita income for the town was $17,845. About 17.2% of families and 20.2% of the population were below the poverty line, including 28.2% of those under age 18 and 14.2% of those age 65 or over.
Common Questions
What is Per Capita Income in Jacksboro?
Per Capita income in Jacksboro is $26,802.
What is the Median Family Income in Jacksboro?
Median Family Income in Jacksboro is $74,792.
What is the Median Household income in Jacksboro?
Median Household Income in Jacksboro is $54,191.
What is Income or Wage Gap in Jacksboro?
Income or Wage Gap in Jacksboro is 31.7%.
Women in Jacksboro earn 68.3 cents for every dollar earned by a man.
What is Family Income Deficit in Jacksboro?
Family Income Deficit in Jacksboro is $9,230.
Families that are below poverty line in Jacksboro earn $9,230 less on average than the poverty threshold level.
What is Inequality or Gini Index in Jacksboro?
Inequality or Gini Index in Jacksboro is 0.41.
What is the Total Population of Jacksboro?
Total Population of Jacksboro is 2,775.
What is the Total Male Population of Jacksboro?
Total Male Population of Jacksboro is 1,350.
What is the Total Female Population of Jacksboro?
Total Female Population of Jacksboro is 1,425.
What is the Ratio of Males per 100 Females in Jacksboro?
There are 94.74 Males per 100 Females in Jacksboro.
What is the Ratio of Females per 100 Males in Jacksboro?
There are 105.56 Females per 100 Males in Jacksboro.
What is the Median Population Age in Jacksboro?
Median Population Age in Jacksboro is 38.5 Years.
What is the Average Family Size in Jacksboro
Average Family Size in Jacksboro is 3.0 People.
What is the Average Household Size in Jacksboro
Average Household Size in Jacksboro is 2.4 People.
How Large is the Labor Force in Jacksboro?
There are 1,200 People in the Labor Forcein in Jacksboro.
What is the Percentage of People in the Labor Force in Jacksboro?
51.2% of People are in the Labor Force in Jacksboro.
What is the Unemployment Rate in Jacksboro?
Unemployment Rate in Jacksboro is 6.5%.