Huntsville, TN Map & Demographics
Huntsville Map
Huntsville Overview
$16,595
PER CAPITA INCOME
$31,685
AVG FAMILY INCOME
$28,750
AVG HOUSEHOLD INCOME
0.3%
WAGE / INCOME GAP [ % ]
99.7¢/ $1
WAGE / INCOME GAP [ $ ]
$7,660
FAMILY INCOME DEFICIT
0.44
INEQUALITY / GINI INDEX
1,889
TOTAL POPULATION
899
MALE POPULATION
990
FEMALE POPULATION
90.81
MALES / 100 FEMALES
110.12
FEMALES / 100 MALES
41.1
MEDIAN AGE
3.1
AVG FAMILY SIZE
2.2
AVG HOUSEHOLD SIZE
687
LABOR FORCE [ PEOPLE ]
42.7%
PERCENT IN LABOR FORCE
12.4%
UNEMPLOYMENT RATE
Huntsville Zip Codes
Huntsville Area Codes
Income in Huntsville
Income Overview in Huntsville
Per Capita Income in Huntsville is $16,595, while median incomes of families and households are $31,685 and $28,750 respectively.
| Characteristic | Number | Measure |
| Per Capita Income | 1,889 | $16,595 |
| Median Family Income | 370 | $31,685 |
| Mean Family Income | 370 | $48,062 |
| Median Household Income | 756 | $28,750 |
| Mean Household Income | 756 | $37,313 |
| Income Deficit | 370 | $7,660 |
| Wage / Income Gap (%) | 1,889 | 0.29% |
| Wage / Income Gap ($) | 1,889 | 99.71¢ per $1 |
| Gini / Inequality Index | 1,889 | 0.44 |
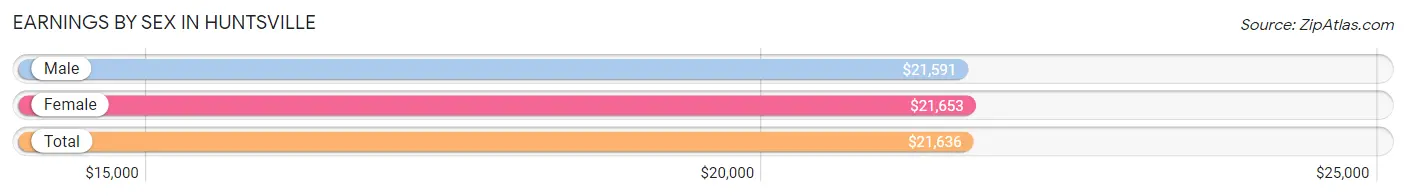
Earnings by Sex in Huntsville
Average Earnings in Huntsville are $21,636, $21,591 for men and $21,653 for women, a difference of 0.3%.
| Sex | Number | Average Earnings |
| Male | 402 (52.3%) | $21,591 |
| Female | 366 (47.7%) | $21,653 |
| Total | 768 (100.0%) | $21,636 |
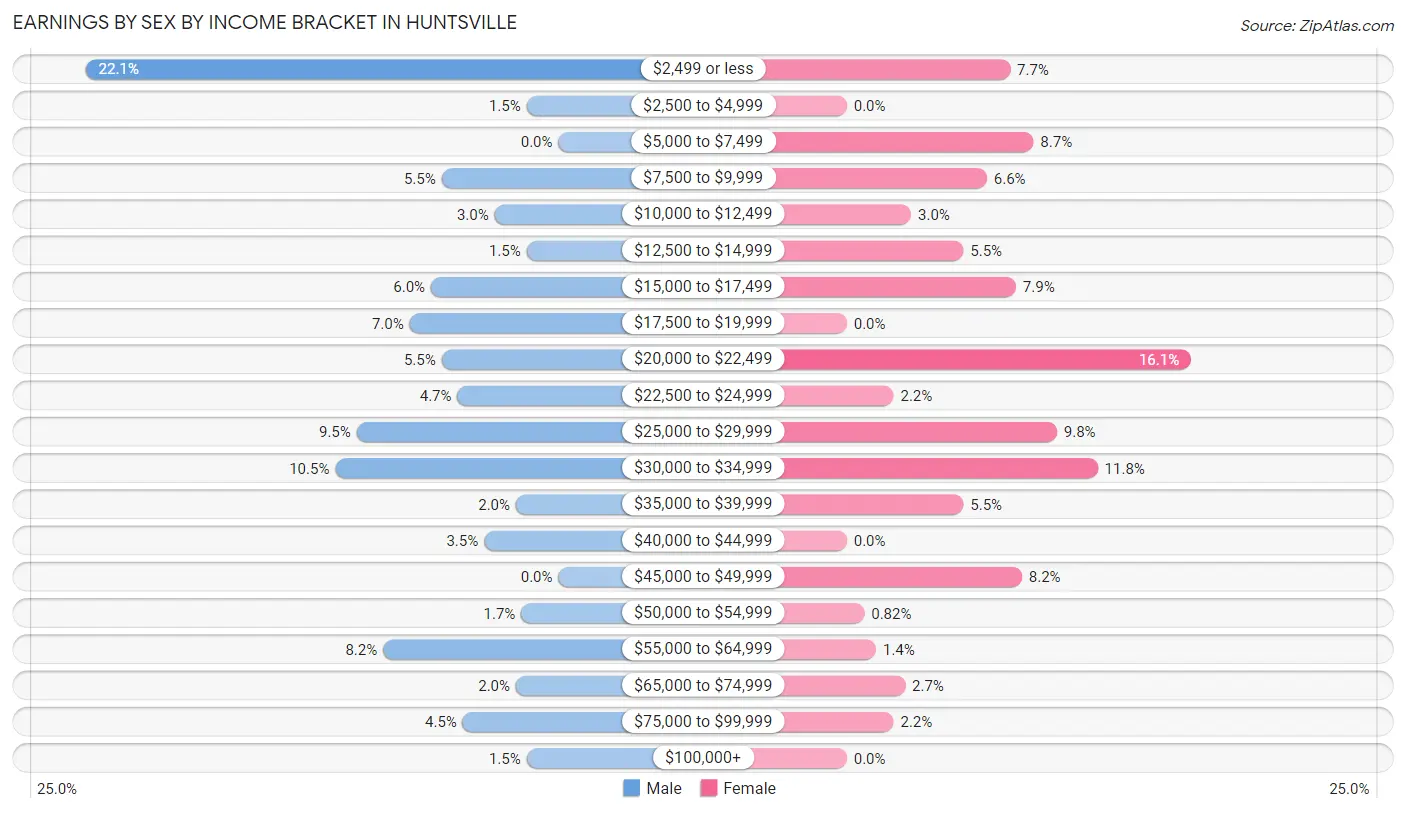
Earnings by Sex by Income Bracket in Huntsville
The most common earnings brackets in Huntsville are $2,499 or less for men (89 | 22.1%) and $20,000 to $22,499 for women (59 | 16.1%).
| Income | Male | Female |
| $2,499 or less | 89 (22.1%) | 28 (7.6%) |
| $2,500 to $4,999 | 6 (1.5%) | 0 (0.0%) |
| $5,000 to $7,499 | 0 (0.0%) | 32 (8.7%) |
| $7,500 to $9,999 | 22 (5.5%) | 24 (6.6%) |
| $10,000 to $12,499 | 12 (3.0%) | 11 (3.0%) |
| $12,500 to $14,999 | 6 (1.5%) | 20 (5.5%) |
| $15,000 to $17,499 | 24 (6.0%) | 29 (7.9%) |
| $17,500 to $19,999 | 28 (7.0%) | 0 (0.0%) |
| $20,000 to $22,499 | 22 (5.5%) | 59 (16.1%) |
| $22,500 to $24,999 | 19 (4.7%) | 8 (2.2%) |
| $25,000 to $29,999 | 38 (9.5%) | 36 (9.8%) |
| $30,000 to $34,999 | 42 (10.4%) | 43 (11.7%) |
| $35,000 to $39,999 | 8 (2.0%) | 20 (5.5%) |
| $40,000 to $44,999 | 14 (3.5%) | 0 (0.0%) |
| $45,000 to $49,999 | 0 (0.0%) | 30 (8.2%) |
| $50,000 to $54,999 | 7 (1.7%) | 3 (0.8%) |
| $55,000 to $64,999 | 33 (8.2%) | 5 (1.4%) |
| $65,000 to $74,999 | 8 (2.0%) | 10 (2.7%) |
| $75,000 to $99,999 | 18 (4.5%) | 8 (2.2%) |
| $100,000+ | 6 (1.5%) | 0 (0.0%) |
| Total | 402 (100.0%) | 366 (100.0%) |
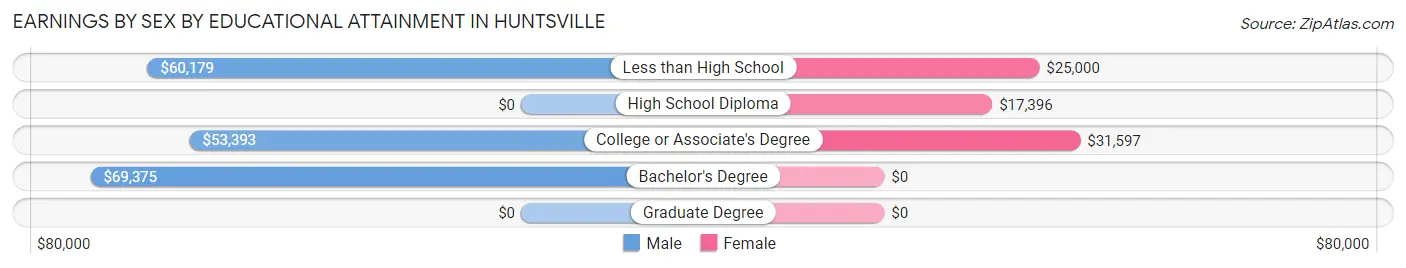
Earnings by Sex by Educational Attainment in Huntsville
Average earnings in Huntsville are $27,019 for men and $22,500 for women, a difference of 16.7%. Men with an educational attainment of bachelor's degree enjoy the highest average annual earnings of $69,375, while those with college or associate's degree education earn the least with $53,393. Women with an educational attainment of college or associate's degree earn the most with the average annual earnings of $31,597, while those with high school diploma education have the smallest earnings of $17,396.
| Educational Attainment | Male Income | Female Income |
| Less than High School | $60,179 | $25,000 |
| High School Diploma | - | - |
| College or Associate's Degree | $53,393 | $31,597 |
| Bachelor's Degree | $69,375 | $0 |
| Graduate Degree | - | - |
| Total | $27,019 | $22,500 |
Family Income in Huntsville
Family Income Brackets in Huntsville
According to the Huntsville family income data, there are 175 families falling into the $25,000 to $34,999 income range, which is the most common income bracket and makes up 47.3% of all families. Conversely, the $150,000 to $199,999 income bracket is the least frequent group with only 3 families (0.8%) belonging to this category.
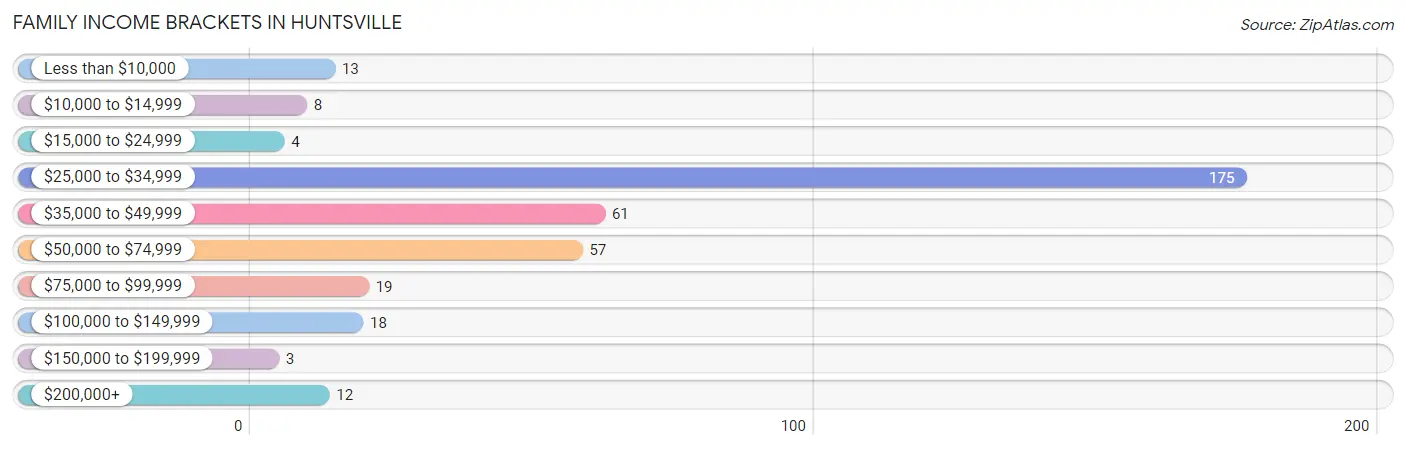
| Income Bracket | # Families | % Families |
| Less than $10,000 | 13 | 3.5% |
| $10,000 to $14,999 | 8 | 2.2% |
| $15,000 to $24,999 | 4 | 1.1% |
| $25,000 to $34,999 | 175 | 47.3% |
| $35,000 to $49,999 | 61 | 16.5% |
| $50,000 to $74,999 | 57 | 15.4% |
| $75,000 to $99,999 | 19 | 5.1% |
| $100,000 to $149,999 | 18 | 4.9% |
| $150,000 to $199,999 | 3 | 0.8% |
| $200,000+ | 12 | 3.2% |
Family Income by Famaliy Size in Huntsville
2-person families (160 | 43.2%) account for the highest median family income in Huntsville with $41,071 per family, while 2-person families (160 | 43.2%) have the highest median income of $20,536 per family member.
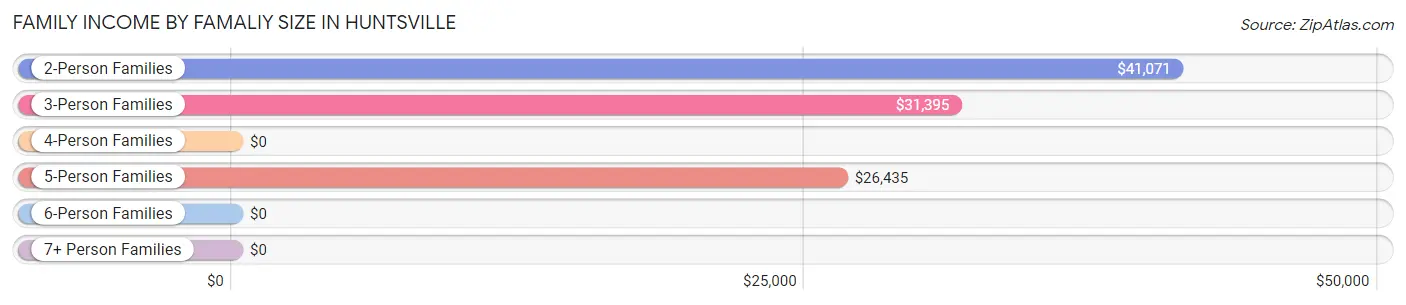
| Income Bracket | # Families | Median Income |
| 2-Person Families | 160 (43.2%) | $41,071 |
| 3-Person Families | 104 (28.1%) | $31,395 |
| 4-Person Families | 41 (11.1%) | $0 |
| 5-Person Families | 62 (16.8%) | $26,435 |
| 6-Person Families | 0 (0.0%) | $0 |
| 7+ Person Families | 3 (0.8%) | $0 |
| Total | 370 (100.0%) | $31,685 |
Family Income by Number of Earners in Huntsville
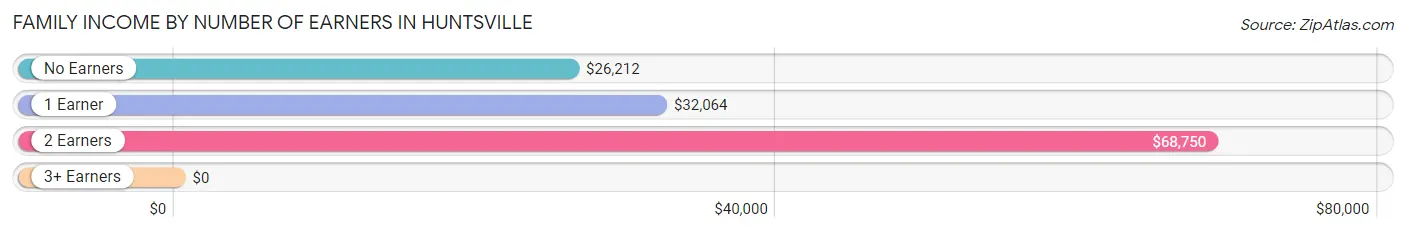
| Number of Earners | # Families | Median Income |
| No Earners | 92 (24.9%) | $26,212 |
| 1 Earner | 153 (41.3%) | $32,064 |
| 2 Earners | 122 (33.0%) | $68,750 |
| 3+ Earners | 3 (0.8%) | $0 |
| Total | 370 (100.0%) | $31,685 |
Household Income in Huntsville
Household Income Brackets in Huntsville
With 219 households falling in the category, the $25,000 to $34,999 income range is the most frequent in Huntsville, accounting for 29.0% of all households. In contrast, only 6 households (0.8%) fall into the $150,000 to $199,999 income bracket, making it the least populous group.
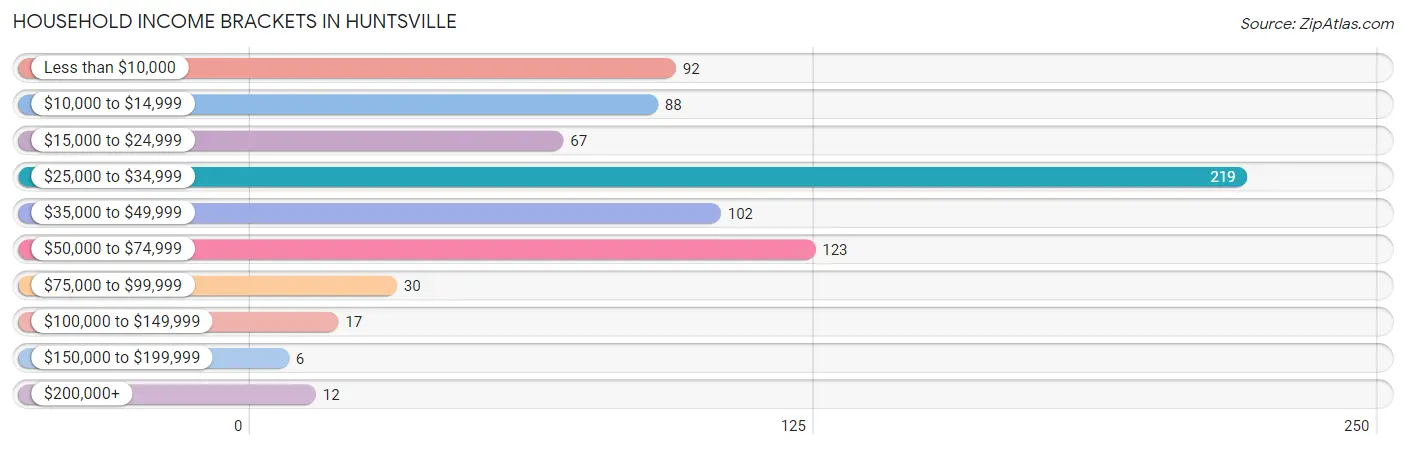
| Income Bracket | # Households | % Households |
| Less than $10,000 | 92 | 12.2% |
| $10,000 to $14,999 | 88 | 11.6% |
| $15,000 to $24,999 | 67 | 8.9% |
| $25,000 to $34,999 | 219 | 29.0% |
| $35,000 to $49,999 | 102 | 13.5% |
| $50,000 to $74,999 | 123 | 16.3% |
| $75,000 to $99,999 | 30 | 4.0% |
| $100,000 to $149,999 | 17 | 2.2% |
| $150,000 to $199,999 | 6 | 0.8% |
| $200,000+ | 12 | 1.6% |
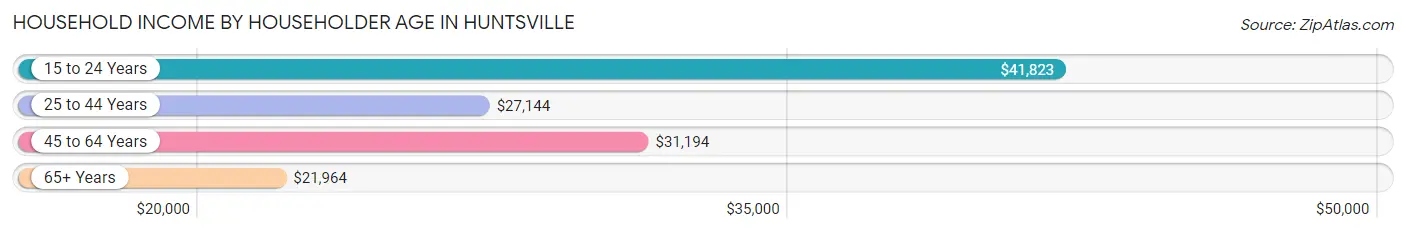
Household Income by Householder Age in Huntsville
The median household income in Huntsville is $28,750, with the highest median household income of $41,823 found in the 15 to 24 years age bracket for the primary householder. A total of 95 households (12.6%) fall into this category. Meanwhile, the 65+ years age bracket for the primary householder has the lowest median household income of $21,964, with 121 households (16.0%) in this group.
| Income Bracket | # Households | Median Income |
| 15 to 24 Years | 95 (12.6%) | $41,823 |
| 25 to 44 Years | 201 (26.6%) | $27,144 |
| 45 to 64 Years | 339 (44.8%) | $31,194 |
| 65+ Years | 121 (16.0%) | $21,964 |
| Total | 756 (100.0%) | $28,750 |
Poverty in Huntsville
Income Below Poverty by Sex and Age in Huntsville
With 27.7% poverty level for males and 49.1% for females among the residents of Huntsville, 35 to 44 year old males and 15 year old females are the most vulnerable to poverty, with 63 males (70.0%) and 33 females (100.0%) in their respective age groups living below the poverty level.
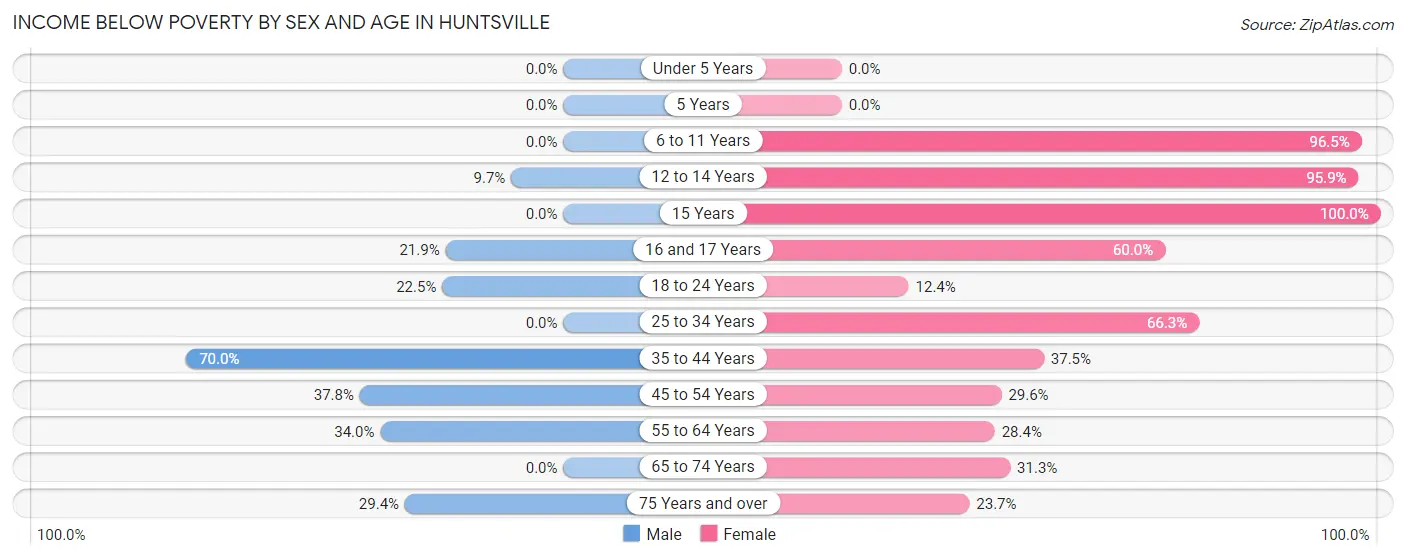
| Age Bracket | Male | Female |
| Under 5 Years | 0 (0.0%) | 0 (0.0%) |
| 5 Years | 0 (0.0%) | 0 (0.0%) |
| 6 to 11 Years | 0 (0.0%) | 109 (96.5%) |
| 12 to 14 Years | 3 (9.7%) | 70 (95.9%) |
| 15 Years | 0 (0.0%) | 33 (100.0%) |
| 16 and 17 Years | 7 (21.9%) | 18 (60.0%) |
| 18 to 24 Years | 29 (22.5%) | 15 (12.4%) |
| 25 to 34 Years | 0 (0.0%) | 63 (66.3%) |
| 35 to 44 Years | 63 (70.0%) | 39 (37.5%) |
| 45 to 54 Years | 34 (37.8%) | 16 (29.6%) |
| 55 to 64 Years | 71 (34.0%) | 44 (28.4%) |
| 65 to 74 Years | 0 (0.0%) | 20 (31.2%) |
| 75 Years and over | 5 (29.4%) | 9 (23.7%) |
| Total | 212 (27.7%) | 436 (49.1%) |
Income Above Poverty by Sex and Age in Huntsville
According to the poverty statistics in Huntsville, males aged under 5 years and females aged under 5 years are the age groups that are most secure financially, with 100.0% of males and 100.0% of females in these age groups living above the poverty line.
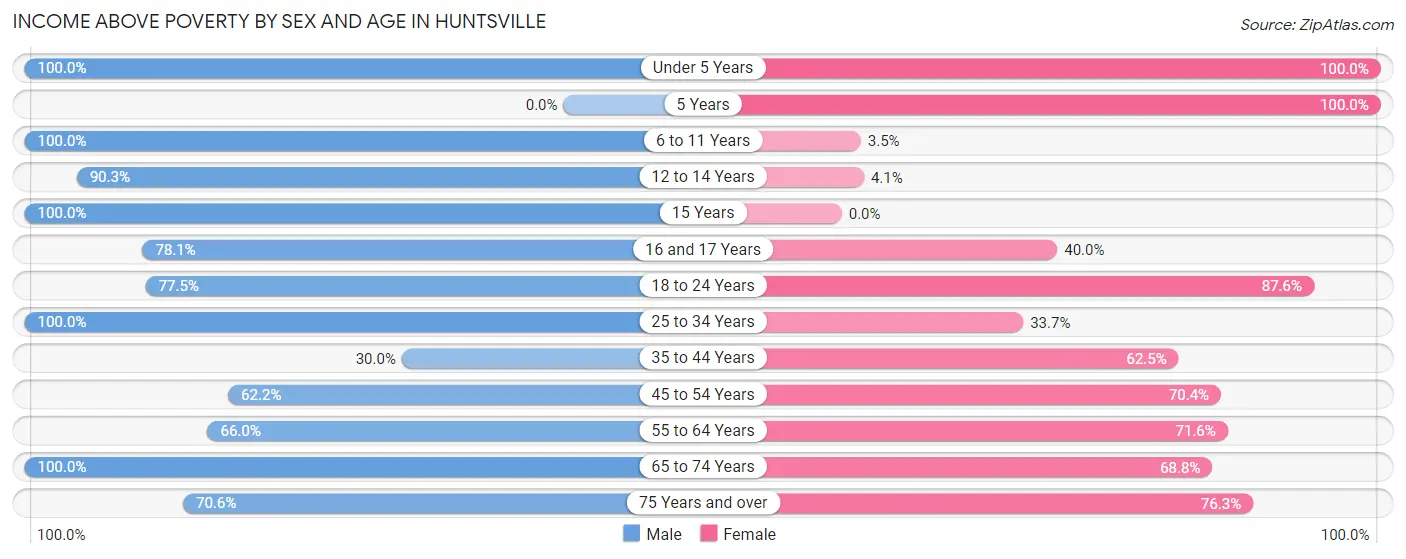
| Age Bracket | Male | Female |
| Under 5 Years | 10 (100.0%) | 4 (100.0%) |
| 5 Years | 0 (0.0%) | 3 (100.0%) |
| 6 to 11 Years | 8 (100.0%) | 4 (3.5%) |
| 12 to 14 Years | 28 (90.3%) | 3 (4.1%) |
| 15 Years | 4 (100.0%) | 0 (0.0%) |
| 16 and 17 Years | 25 (78.1%) | 12 (40.0%) |
| 18 to 24 Years | 100 (77.5%) | 106 (87.6%) |
| 25 to 34 Years | 111 (100.0%) | 32 (33.7%) |
| 35 to 44 Years | 27 (30.0%) | 65 (62.5%) |
| 45 to 54 Years | 56 (62.2%) | 38 (70.4%) |
| 55 to 64 Years | 138 (66.0%) | 111 (71.6%) |
| 65 to 74 Years | 35 (100.0%) | 44 (68.8%) |
| 75 Years and over | 12 (70.6%) | 29 (76.3%) |
| Total | 554 (72.3%) | 451 (50.8%) |
Income Below Poverty Among Married-Couple Families in Huntsville
The poverty statistics for married-couple families in Huntsville show that 26.5% or 64 of the total 242 families live below the poverty line. Families with 3 or 4 children have the highest poverty rate of 100.0%, comprising of 54 families. On the other hand, families with 5 or more children have the lowest poverty rate of 0.0%, which includes 0 families.
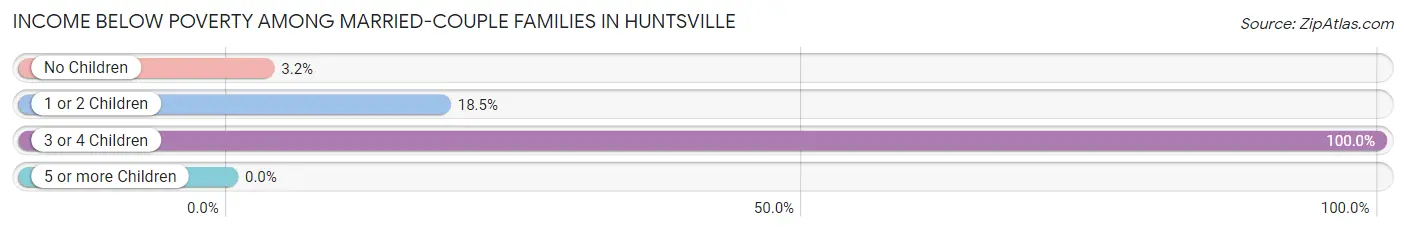
| Children | Above Poverty | Below Poverty |
| No Children | 153 (96.8%) | 5 (3.2%) |
| 1 or 2 Children | 22 (81.5%) | 5 (18.5%) |
| 3 or 4 Children | 0 (0.0%) | 54 (100.0%) |
| 5 or more Children | 3 (100.0%) | 0 (0.0%) |
| Total | 178 (73.6%) | 64 (26.5%) |
Income Below Poverty Among Single-Parent Households in Huntsville
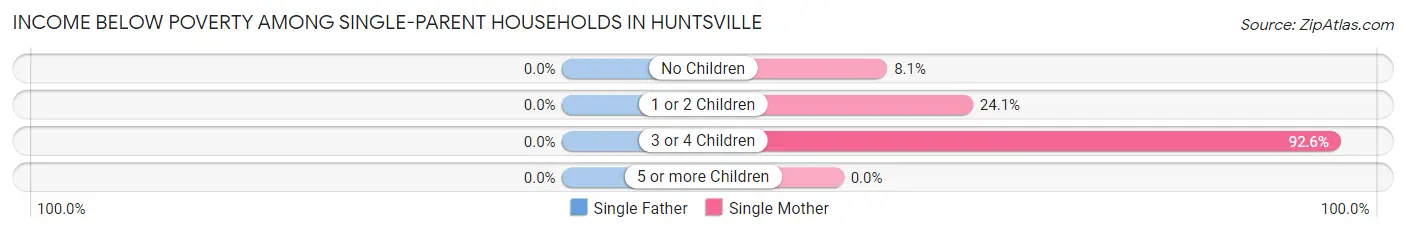
| Children | Single Father | Single Mother |
| No Children | 0 (0.0%) | 3 (8.1%) |
| 1 or 2 Children | 0 (0.0%) | 13 (24.1%) |
| 3 or 4 Children | 0 (0.0%) | 25 (92.6%) |
| 5 or more Children | 0 (0.0%) | 0 (0.0%) |
| Total | 0 (0.0%) | 41 (34.7%) |
Income Below Poverty Among Married-Couple vs Single-Parent Households in Huntsville
The poverty data for Huntsville shows that 64 of the married-couple family households (26.5%) and 41 of the single-parent households (32.0%) are living below the poverty level. Within the married-couple family households, those with 3 or 4 children have the highest poverty rate, with 54 households (100.0%) falling below the poverty line. Among the single-parent households, those with 3 or 4 children have the highest poverty rate, with 25 household (92.6%) living below poverty.
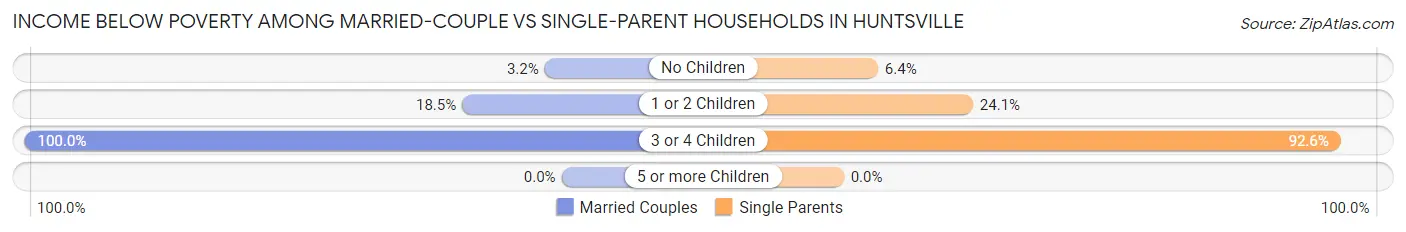
| Children | Married-Couple Families | Single-Parent Households |
| No Children | 5 (3.2%) | 3 (6.4%) |
| 1 or 2 Children | 5 (18.5%) | 13 (24.1%) |
| 3 or 4 Children | 54 (100.0%) | 25 (92.6%) |
| 5 or more Children | 0 (0.0%) | 0 (0.0%) |
| Total | 64 (26.5%) | 41 (32.0%) |
Race in Huntsville
The most populous races in Huntsville are White / Caucasian (1,776 | 94.0%), Black / African American (49 | 2.6%), and Two or more Races (27 | 1.4%).
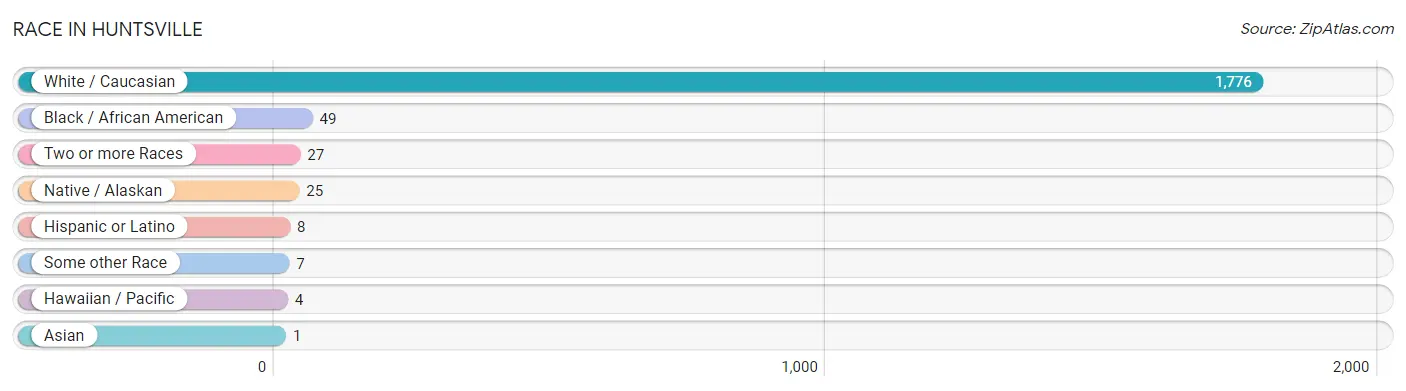
| Race | # Population | % Population |
| Asian | 1 | 0.1% |
| Black / African American | 49 | 2.6% |
| Hawaiian / Pacific | 4 | 0.2% |
| Hispanic or Latino | 8 | 0.4% |
| Native / Alaskan | 25 | 1.3% |
| White / Caucasian | 1,776 | 94.0% |
| Two or more Races | 27 | 1.4% |
| Some other Race | 7 | 0.4% |
| Total | 1,889 | 100.0% |
Ancestry in Huntsville
The most populous ancestries reported in Huntsville are English (254 | 13.5%), Irish (214 | 11.3%), Scotch-Irish (125 | 6.6%), Italian (94 | 5.0%), and American (91 | 4.8%), together accounting for 41.2% of all Huntsville residents.
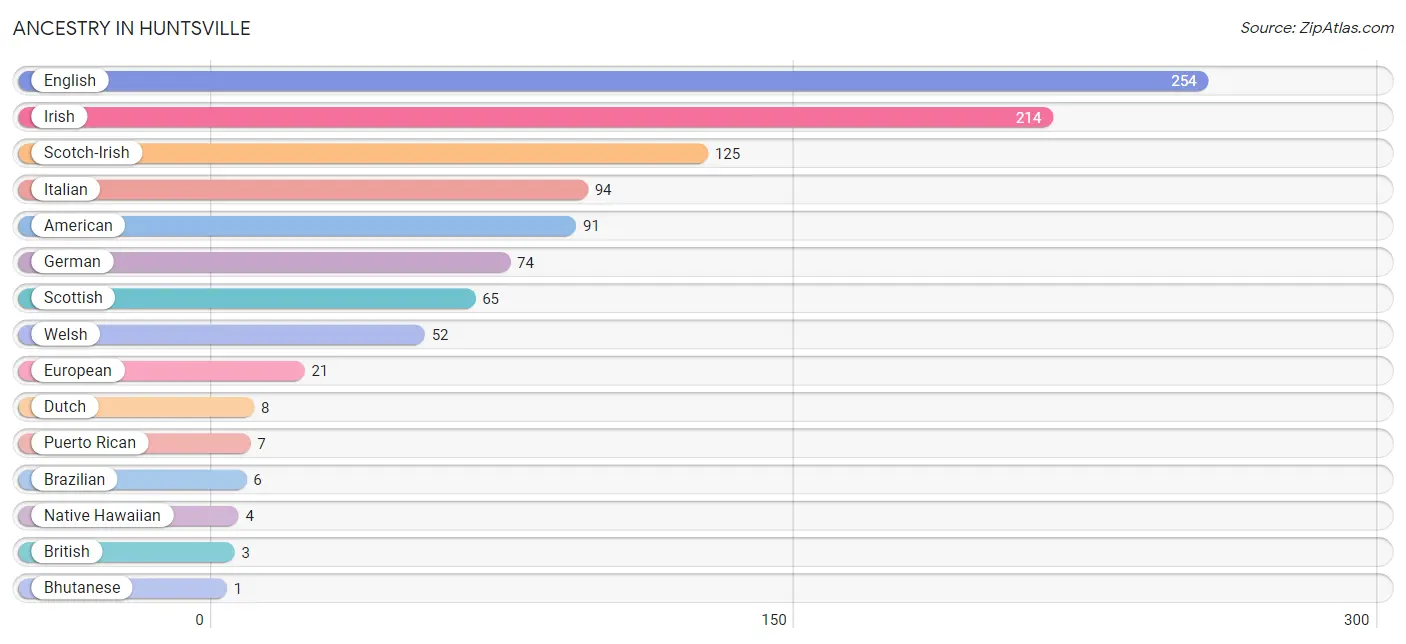
| Ancestry | # Population | % Population |
| American | 91 | 4.8% |
| Bhutanese | 1 | 0.1% |
| Brazilian | 6 | 0.3% |
| British | 3 | 0.2% |
| Cherokee | 1 | 0.1% |
| Dutch | 8 | 0.4% |
| English | 254 | 13.5% |
| European | 21 | 1.1% |
| French | 1 | 0.1% |
| German | 74 | 3.9% |
| Irish | 214 | 11.3% |
| Italian | 94 | 5.0% |
| Mexican | 1 | 0.1% |
| Native Hawaiian | 4 | 0.2% |
| Puerto Rican | 7 | 0.4% |
| Scotch-Irish | 125 | 6.6% |
| Scottish | 65 | 3.4% |
| Welsh | 52 | 2.8% | View All 18 Rows |
Immigrants in Huntsville
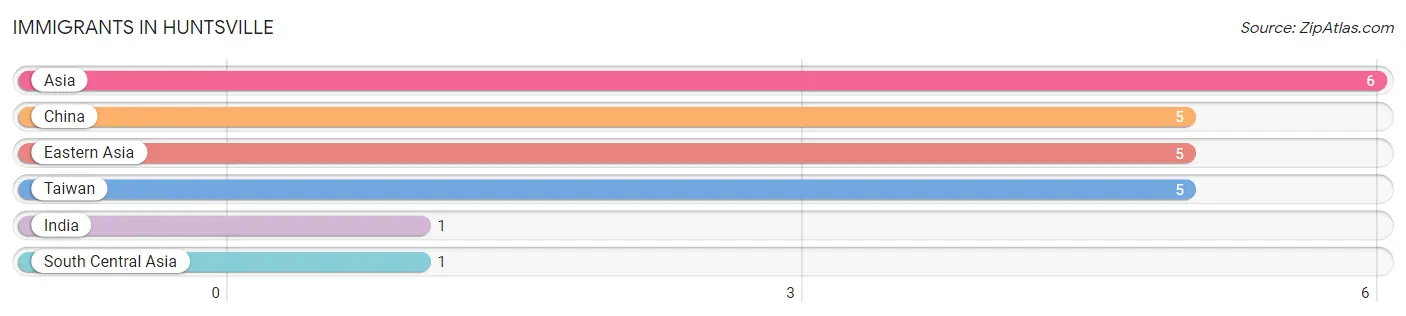
The most numerous immigrant groups reported in Huntsville came from Asia (6 | 0.3%), China (5 | 0.3%), Eastern Asia (5 | 0.3%), Taiwan (5 | 0.3%), and India (1 | 0.1%), together accounting for 1.1% of all Huntsville residents.
| Immigration Origin | # Population | % Population |
| Asia | 6 | 0.3% |
| China | 5 | 0.3% |
| Eastern Asia | 5 | 0.3% |
| India | 1 | 0.1% |
| South Central Asia | 1 | 0.1% |
| Taiwan | 5 | 0.3% | View All 6 Rows |
Sex and Age in Huntsville
Sex and Age in Huntsville
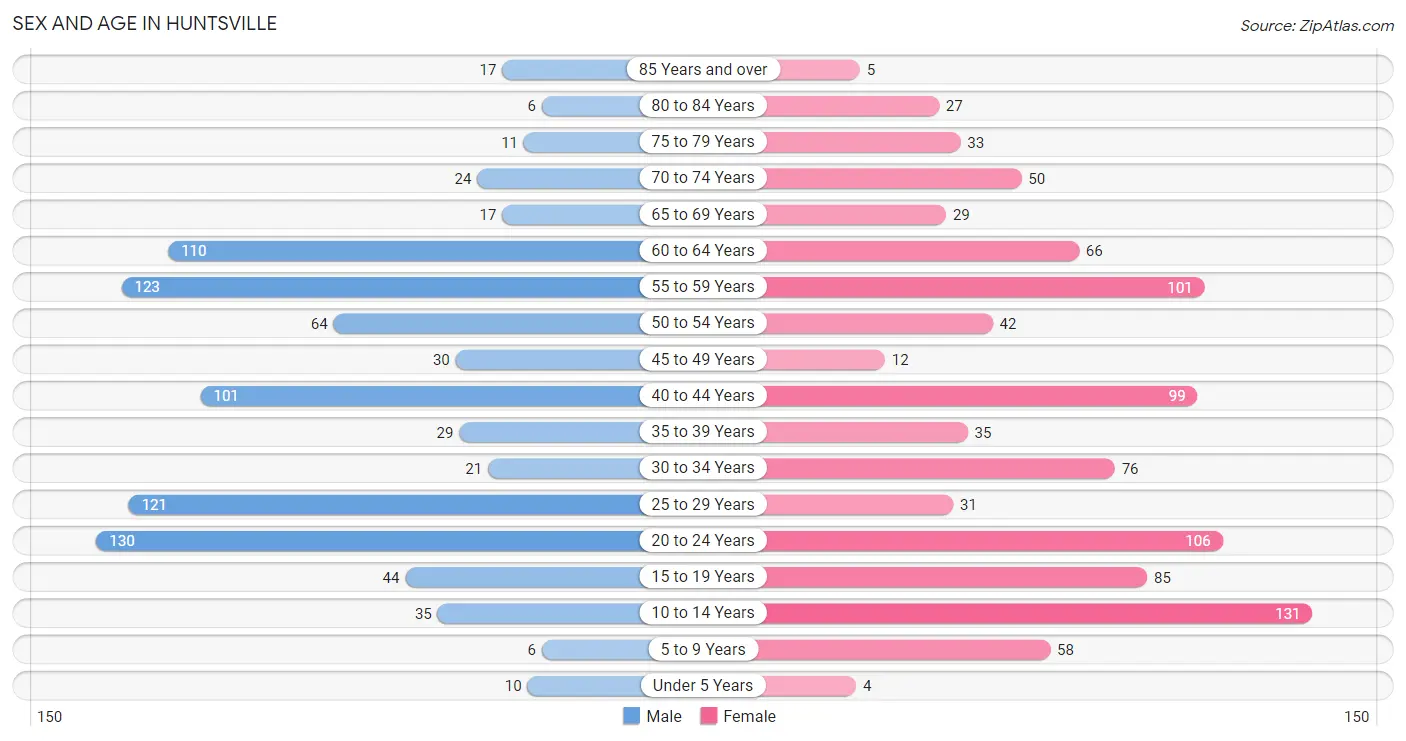
The most populous age groups in Huntsville are 20 to 24 Years (130 | 14.5%) for men and 10 to 14 Years (131 | 13.2%) for women.
| Age Bracket | Male | Female |
| Under 5 Years | 10 (1.1%) | 4 (0.4%) |
| 5 to 9 Years | 6 (0.7%) | 58 (5.9%) |
| 10 to 14 Years | 35 (3.9%) | 131 (13.2%) |
| 15 to 19 Years | 44 (4.9%) | 85 (8.6%) |
| 20 to 24 Years | 130 (14.5%) | 106 (10.7%) |
| 25 to 29 Years | 121 (13.5%) | 31 (3.1%) |
| 30 to 34 Years | 21 (2.3%) | 76 (7.7%) |
| 35 to 39 Years | 29 (3.2%) | 35 (3.5%) |
| 40 to 44 Years | 101 (11.2%) | 99 (10.0%) |
| 45 to 49 Years | 30 (3.3%) | 12 (1.2%) |
| 50 to 54 Years | 64 (7.1%) | 42 (4.2%) |
| 55 to 59 Years | 123 (13.7%) | 101 (10.2%) |
| 60 to 64 Years | 110 (12.2%) | 66 (6.7%) |
| 65 to 69 Years | 17 (1.9%) | 29 (2.9%) |
| 70 to 74 Years | 24 (2.7%) | 50 (5.1%) |
| 75 to 79 Years | 11 (1.2%) | 33 (3.3%) |
| 80 to 84 Years | 6 (0.7%) | 27 (2.7%) |
| 85 Years and over | 17 (1.9%) | 5 (0.5%) |
| Total | 899 (100.0%) | 990 (100.0%) |
Families and Households in Huntsville
Median Family Size in Huntsville
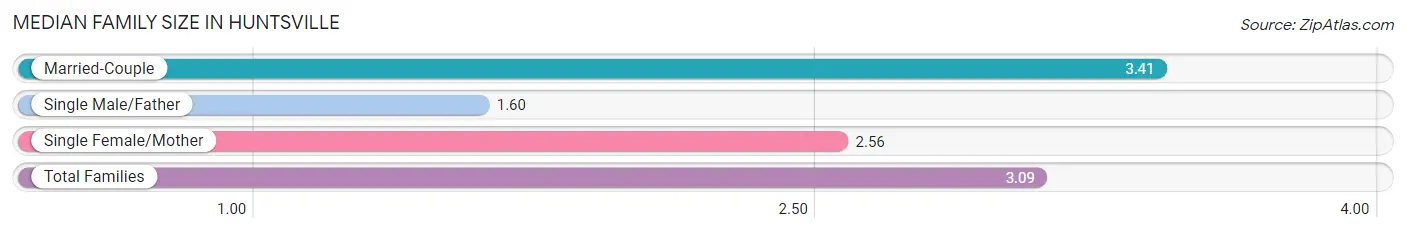
The median family size in Huntsville is 3.09 persons per family, with married-couple families (242 | 65.4%) accounting for the largest median family size of 3.41 persons per family. On the other hand, single male/father families (10 | 2.7%) represent the smallest median family size with 1.60 persons per family.
| Family Type | # Families | Family Size |
| Married-Couple | 242 (65.4%) | 3.41 |
| Single Male/Father | 10 (2.7%) | 1.60 |
| Single Female/Mother | 118 (31.9%) | 2.56 |
| Total Families | 370 (100.0%) | 3.09 |
Median Household Size in Huntsville
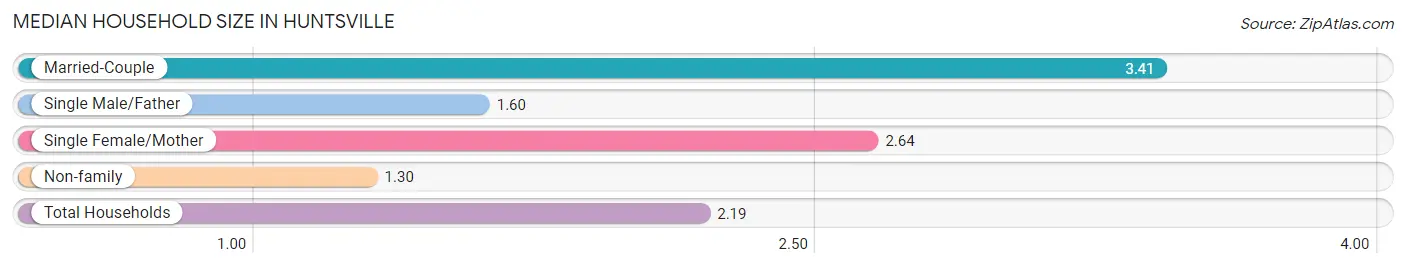
The median household size in Huntsville is 2.19 persons per household, with married-couple households (242 | 32.0%) accounting for the largest median household size of 3.41 persons per household. non-family households (386 | 51.1%) represent the smallest median household size with 1.30 persons per household.
| Household Type | # Households | Household Size |
| Married-Couple | 242 (32.0%) | 3.41 |
| Single Male/Father | 10 (1.3%) | 1.60 |
| Single Female/Mother | 118 (15.6%) | 2.64 |
| Non-family | 386 (51.1%) | 1.30 |
| Total Households | 756 (100.0%) | 2.19 |
Household Size by Marriage Status in Huntsville
Out of a total of 756 households in Huntsville, 370 (48.9%) are family households, while 386 (51.1%) are nonfamily households. The most numerous type of family households are 2-person households, comprising 160, and the most common type of nonfamily households are 1-person households, comprising 265.
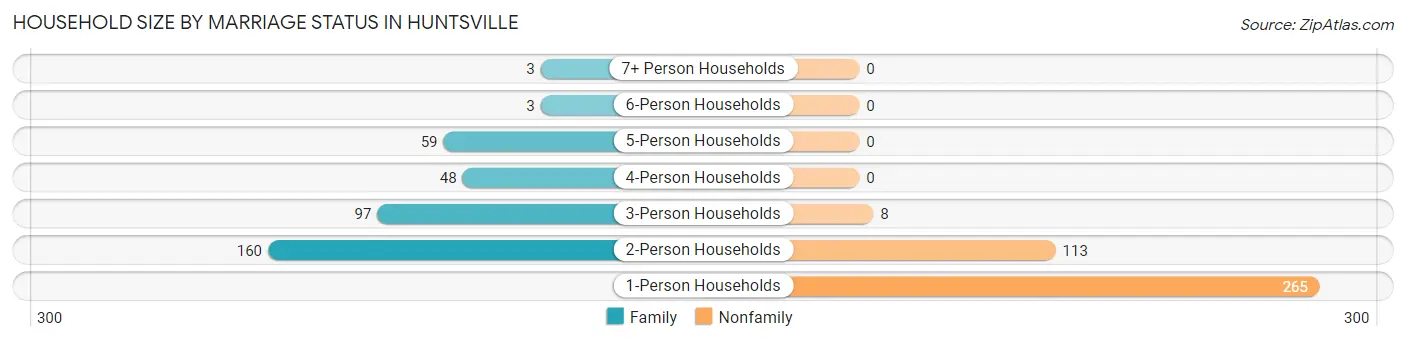
| Household Size | Family Households | Nonfamily Households |
| 1-Person Households | - | 265 (35.0%) |
| 2-Person Households | 160 (21.2%) | 113 (14.9%) |
| 3-Person Households | 97 (12.8%) | 8 (1.1%) |
| 4-Person Households | 48 (6.4%) | 0 (0.0%) |
| 5-Person Households | 59 (7.8%) | 0 (0.0%) |
| 6-Person Households | 3 (0.4%) | 0 (0.0%) |
| 7+ Person Households | 3 (0.4%) | 0 (0.0%) |
| Total | 370 (48.9%) | 386 (51.1%) |
Female Fertility in Huntsville
Fertility by Age in Huntsville
Average fertility rate in Huntsville is 20.0 births per 1,000 women. Women in the age bracket of 20 to 34 years have the highest fertility rate with 42.0 births per 1,000 women. Women in the age bracket of 20 to 34 years acount for 100.0% of all women with births.
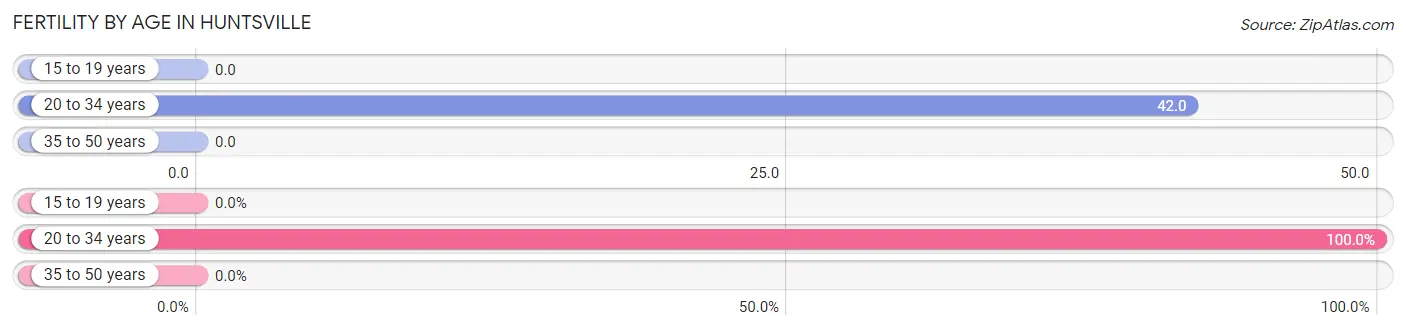
| Age Bracket | Women with Births | Births / 1,000 Women |
| 15 to 19 years | 0 (0.0%) | 0.0 |
| 20 to 34 years | 9 (100.0%) | 42.0 |
| 35 to 50 years | 0 (0.0%) | 0.0 |
| Total | 9 (100.0%) | 20.0 |
Fertility by Age by Marriage Status in Huntsville
33.3% of women with births (9) in Huntsville are married. The highest percentage of unmarried women with births falls into 20 to 34 years age bracket with 66.7% of them unmarried at the time of birth, while the lowest percentage of unmarried women with births belong to 20 to 34 years age bracket with 66.7% of them unmarried.
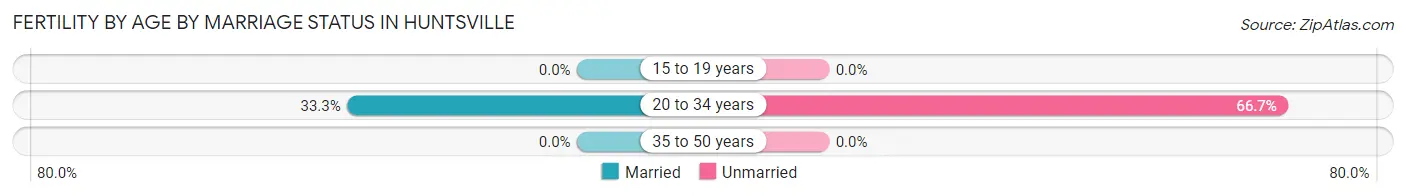
| Age Bracket | Married | Unmarried |
| 15 to 19 years | 0 (0.0%) | 0 (0.0%) |
| 20 to 34 years | 3 (33.3%) | 6 (66.7%) |
| 35 to 50 years | 0 (0.0%) | 0 (0.0%) |
| Total | 3 (33.3%) | 6 (66.7%) |
Fertility by Education in Huntsville
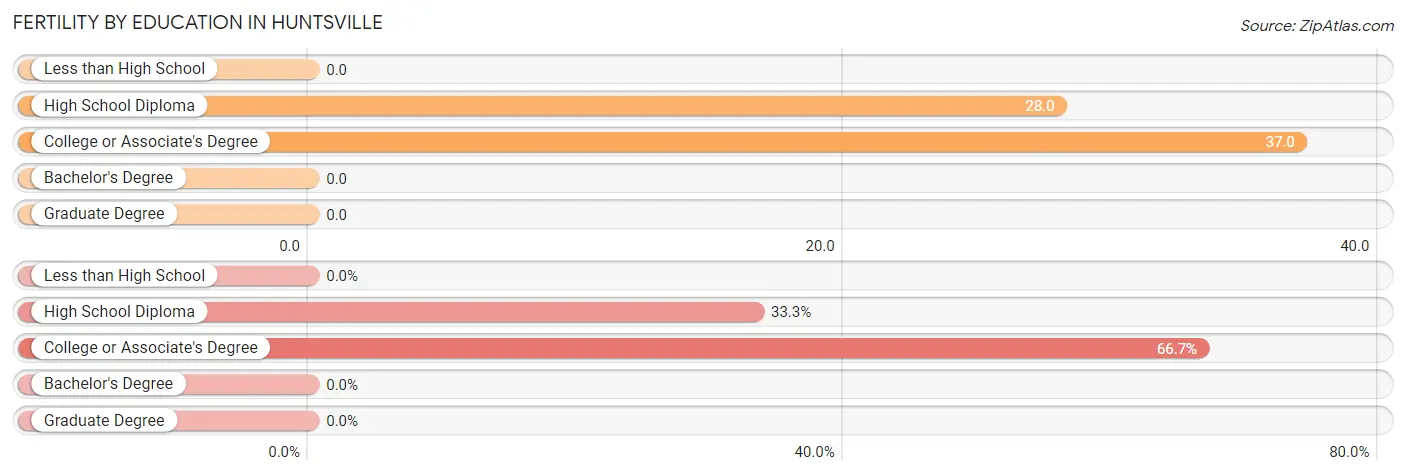
| Educational Attainment | Women with Births | Births / 1,000 Women |
| Less than High School | 0 (0.0%) | 0.0 |
| High School Diploma | 3 (33.3%) | 28.0 |
| College or Associate's Degree | 6 (66.7%) | 37.0 |
| Bachelor's Degree | 0 (0.0%) | 0.0 |
| Graduate Degree | 0 (0.0%) | 0.0 |
| Total | 9 (100.0%) | 20.0 |
Fertility by Education by Marriage Status in Huntsville
66.7% of women with births in Huntsville are unmarried. Women with the educational attainment of high school diploma are most likely to be married with 100.0% of them married at childbirth, while women with the educational attainment of college or associate's degree are least likely to be married with 100.0% of them unmarried at childbirth.
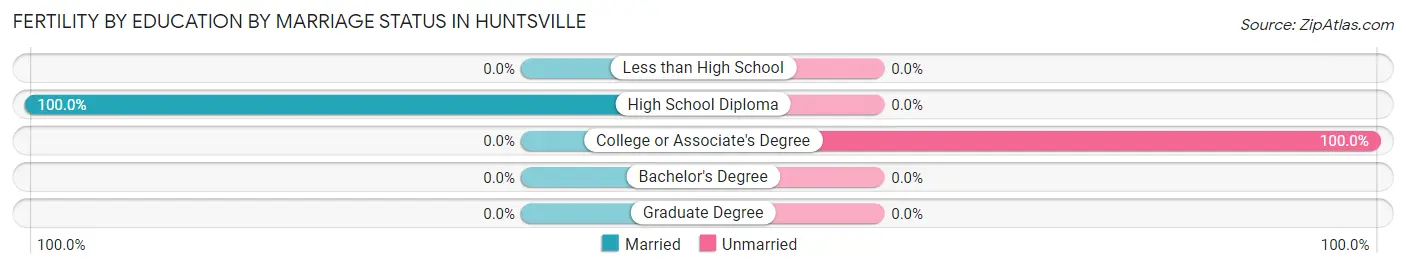
| Educational Attainment | Married | Unmarried |
| Less than High School | 0 (0.0%) | 0 (0.0%) |
| High School Diploma | 3 (100.0%) | 0 (0.0%) |
| College or Associate's Degree | 0 (0.0%) | 6 (100.0%) |
| Bachelor's Degree | 0 (0.0%) | 0 (0.0%) |
| Graduate Degree | 0 (0.0%) | 0 (0.0%) |
| Total | 3 (33.3%) | 6 (66.7%) |
Employment Characteristics in Huntsville
Employment by Class of Employer in Huntsville
Among the 594 employed individuals in Huntsville, private company employees (374 | 63.0%), local government employees (102 | 17.2%), and self-employed (not incorporated) (49 | 8.3%) make up the most common classes of employment.
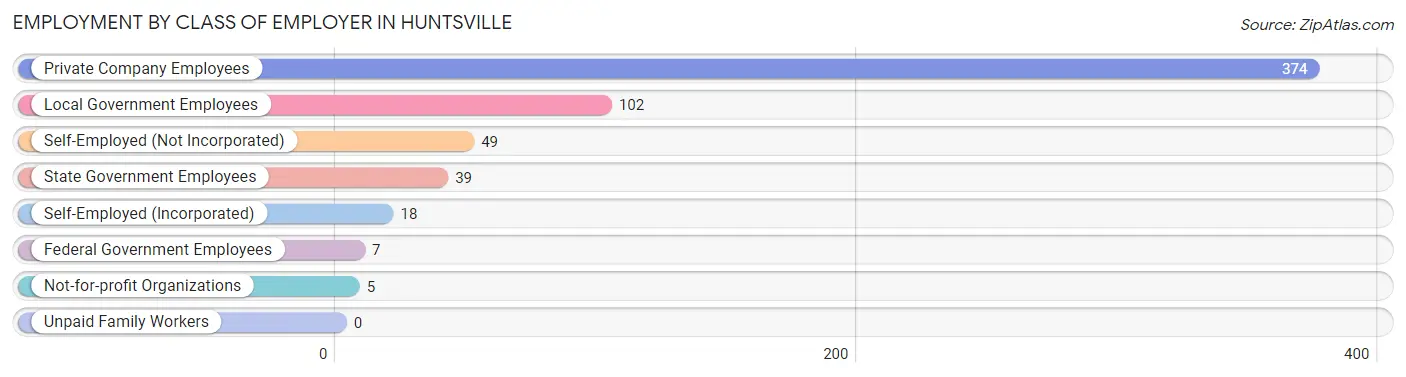
| Employer Class | # Employees | % Employees |
| Private Company Employees | 374 | 63.0% |
| Self-Employed (Incorporated) | 18 | 3.0% |
| Self-Employed (Not Incorporated) | 49 | 8.3% |
| Not-for-profit Organizations | 5 | 0.8% |
| Local Government Employees | 102 | 17.2% |
| State Government Employees | 39 | 6.6% |
| Federal Government Employees | 7 | 1.2% |
| Unpaid Family Workers | 0 | 0.0% |
| Total | 594 | 100.0% |
Employment Status by Age in Huntsville
According to the labor force statistics for Huntsville, out of the total population over 16 years of age (1,608), 42.7% or 687 individuals are in the labor force, with 12.4% or 85 of them unemployed. The age group with the highest labor force participation rate is 20 to 24 years, with 87.7% or 207 individuals in the labor force. Within the labor force, the 25 to 29 years age range has the highest percentage of unemployed individuals, with 64.8% or 79 of them being unemployed.
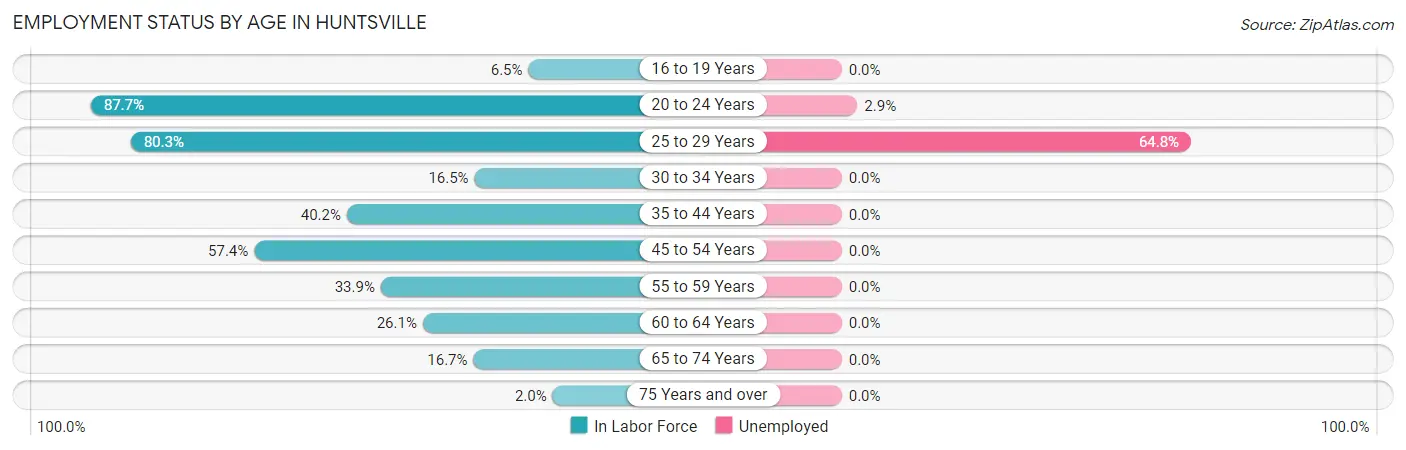
| Age Bracket | In Labor Force | Unemployed |
| 16 to 19 Years | 6 (6.5%) | 0 (0.0%) |
| 20 to 24 Years | 207 (87.7%) | 6 (2.9%) |
| 25 to 29 Years | 122 (80.3%) | 79 (64.8%) |
| 30 to 34 Years | 16 (16.5%) | 0 (0.0%) |
| 35 to 44 Years | 106 (40.2%) | 0 (0.0%) |
| 45 to 54 Years | 85 (57.4%) | 0 (0.0%) |
| 55 to 59 Years | 76 (33.9%) | 0 (0.0%) |
| 60 to 64 Years | 46 (26.1%) | 0 (0.0%) |
| 65 to 74 Years | 20 (16.7%) | 0 (0.0%) |
| 75 Years and over | 2 (2.0%) | 0 (0.0%) |
| Total | 687 (42.7%) | 85 (12.4%) |
Employment Status by Educational Attainment in Huntsville
According to labor force statistics for Huntsville, 42.5% of individuals (451) out of the total population between 25 and 64 years of age (1,061) are in the labor force, with 17.5% or 79 of them being unemployed. The group with the highest labor force participation rate are those with the educational attainment of bachelor's degree or higher, with 95.3% or 82 individuals in the labor force. Within the labor force, individuals with high school diploma education have the highest percentage of unemployment, with 33.8% or 79 of them being unemployed.
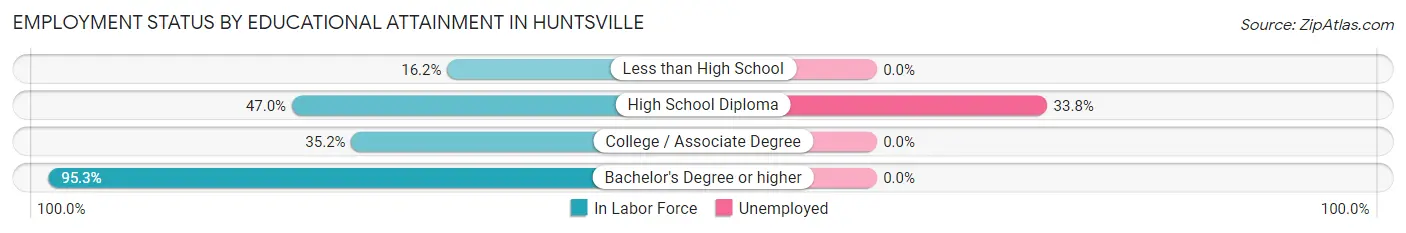
| Educational Attainment | In Labor Force | Unemployed |
| Less than High School | 28 (16.2%) | 0 (0.0%) |
| High School Diploma | 234 (47.0%) | 168 (33.8%) |
| College / Associate Degree | 107 (35.2%) | 0 (0.0%) |
| Bachelor's Degree or higher | 82 (95.3%) | 0 (0.0%) |
| Total | 451 (42.5%) | 186 (17.5%) |
Employment Occupations by Sex in Huntsville
Management, Business, Science and Arts Occupations
The most common Management, Business, Science and Arts occupations in Huntsville are Community & Social Service (61 | 10.2%), Management (58 | 9.7%), Education Instruction & Library (51 | 8.5%), Health Diagnosing & Treating (12 | 2.0%), and Education, Arts & Media (10 | 1.7%).
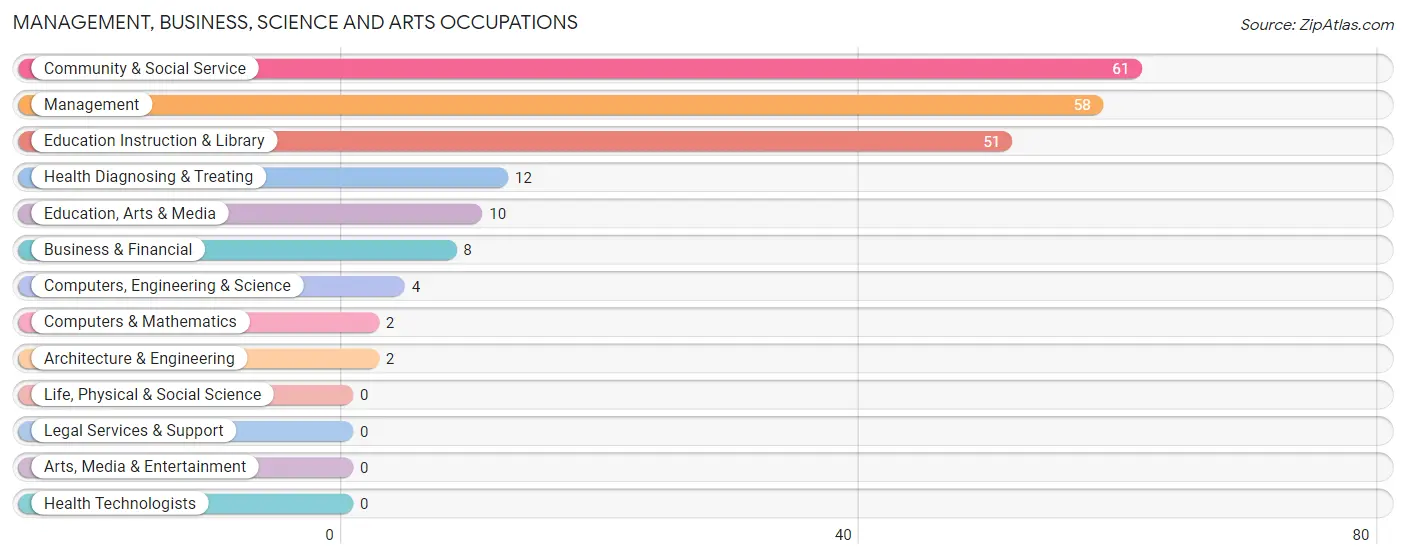
Management, Business, Science and Arts Occupations by Sex
Within the Management, Business, Science and Arts occupations in Huntsville, the most male-oriented occupations are Computers & Mathematics (100.0%), Computers, Engineering & Science (50.0%), and Education, Arts & Media (30.0%), while the most female-oriented occupations are Business & Financial (100.0%), Architecture & Engineering (100.0%), and Health Diagnosing & Treating (100.0%).

| Occupation | Male | Female |
| Management | 7 (12.1%) | 51 (87.9%) |
| Business & Financial | 0 (0.0%) | 8 (100.0%) |
| Computers, Engineering & Science | 2 (50.0%) | 2 (50.0%) |
| Computers & Mathematics | 2 (100.0%) | 0 (0.0%) |
| Architecture & Engineering | 0 (0.0%) | 2 (100.0%) |
| Life, Physical & Social Science | 0 (0.0%) | 0 (0.0%) |
| Community & Social Service | 7 (11.5%) | 54 (88.5%) |
| Education, Arts & Media | 3 (30.0%) | 7 (70.0%) |
| Legal Services & Support | 0 (0.0%) | 0 (0.0%) |
| Education Instruction & Library | 4 (7.8%) | 47 (92.2%) |
| Arts, Media & Entertainment | 0 (0.0%) | 0 (0.0%) |
| Health Diagnosing & Treating | 0 (0.0%) | 12 (100.0%) |
| Health Technologists | 0 (0.0%) | 0 (0.0%) |
| Total (Category) | 16 (11.2%) | 127 (88.8%) |
| Total (Overall) | 273 (45.4%) | 328 (54.6%) |
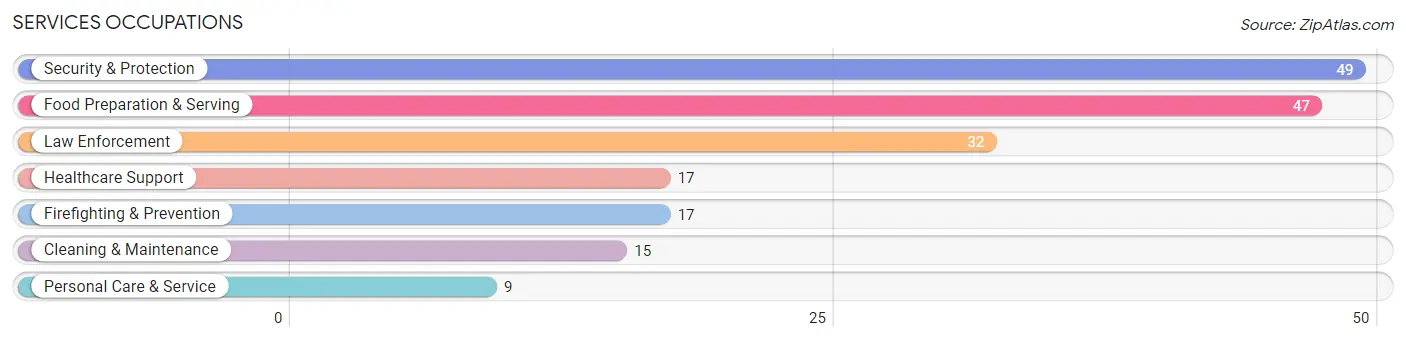
Services Occupations
The most common Services occupations in Huntsville are Security & Protection (49 | 8.2%), Food Preparation & Serving (47 | 7.8%), Law Enforcement (32 | 5.3%), Healthcare Support (17 | 2.8%), and Firefighting & Prevention (17 | 2.8%).
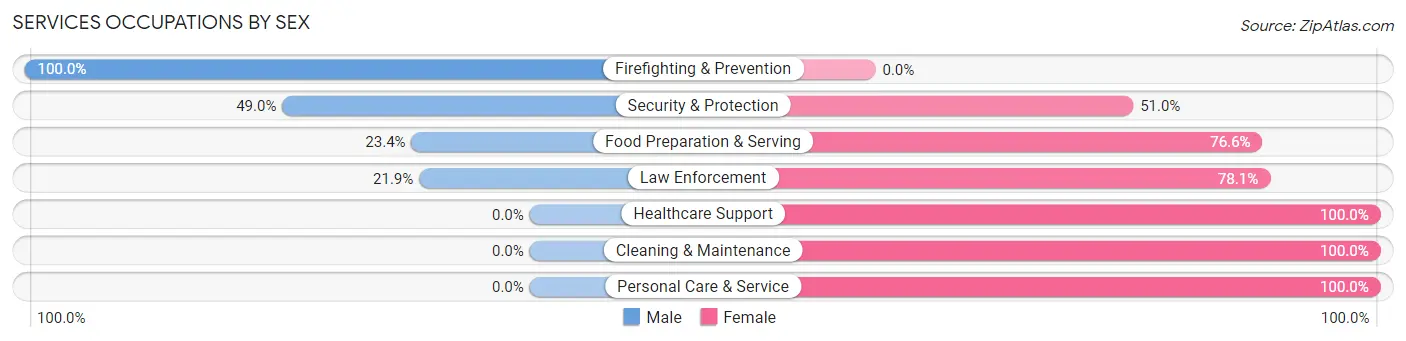
Services Occupations by Sex
Within the Services occupations in Huntsville, the most male-oriented occupations are Firefighting & Prevention (100.0%), Security & Protection (49.0%), and Food Preparation & Serving (23.4%), while the most female-oriented occupations are Healthcare Support (100.0%), Cleaning & Maintenance (100.0%), and Personal Care & Service (100.0%).
| Occupation | Male | Female |
| Healthcare Support | 0 (0.0%) | 17 (100.0%) |
| Security & Protection | 24 (49.0%) | 25 (51.0%) |
| Firefighting & Prevention | 17 (100.0%) | 0 (0.0%) |
| Law Enforcement | 7 (21.9%) | 25 (78.1%) |
| Food Preparation & Serving | 11 (23.4%) | 36 (76.6%) |
| Cleaning & Maintenance | 0 (0.0%) | 15 (100.0%) |
| Personal Care & Service | 0 (0.0%) | 9 (100.0%) |
| Total (Category) | 35 (25.6%) | 102 (74.5%) |
| Total (Overall) | 273 (45.4%) | 328 (54.6%) |
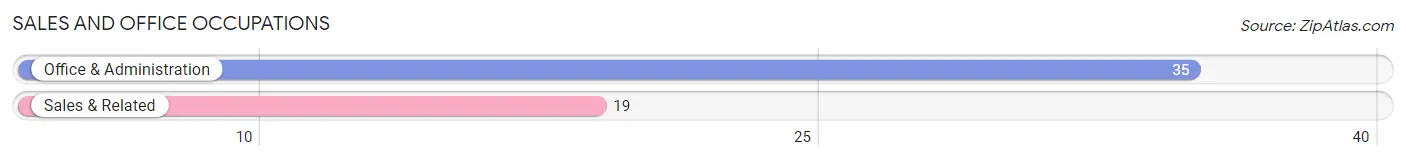
Sales and Office Occupations
The most common Sales and Office occupations in Huntsville are Office & Administration (35 | 5.8%), and Sales & Related (19 | 3.2%).
Sales and Office Occupations by Sex
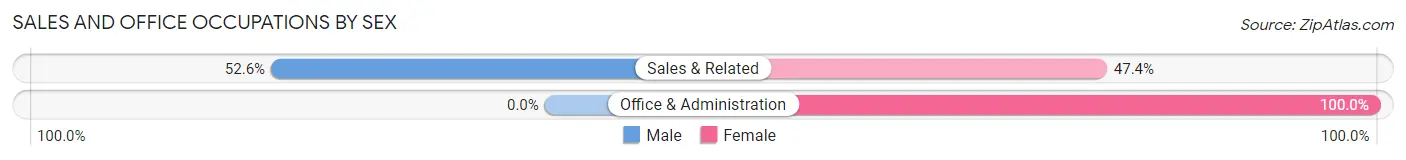
| Occupation | Male | Female |
| Sales & Related | 10 (52.6%) | 9 (47.4%) |
| Office & Administration | 0 (0.0%) | 35 (100.0%) |
| Total (Category) | 10 (18.5%) | 44 (81.5%) |
| Total (Overall) | 273 (45.4%) | 328 (54.6%) |
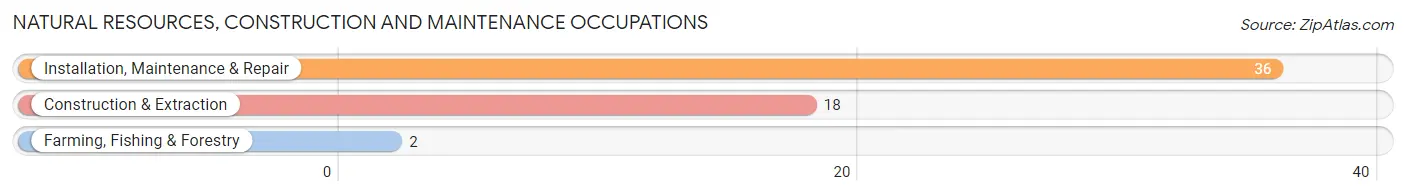
Natural Resources, Construction and Maintenance Occupations
The most common Natural Resources, Construction and Maintenance occupations in Huntsville are Installation, Maintenance & Repair (36 | 6.0%), Construction & Extraction (18 | 3.0%), and Farming, Fishing & Forestry (2 | 0.3%).
Natural Resources, Construction and Maintenance Occupations by Sex
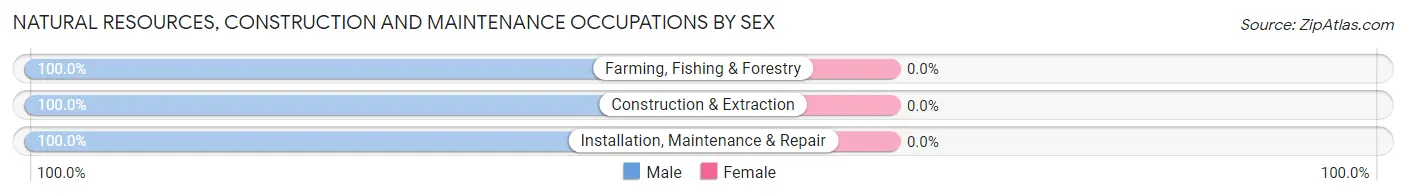
| Occupation | Male | Female |
| Farming, Fishing & Forestry | 2 (100.0%) | 0 (0.0%) |
| Construction & Extraction | 18 (100.0%) | 0 (0.0%) |
| Installation, Maintenance & Repair | 36 (100.0%) | 0 (0.0%) |
| Total (Category) | 56 (100.0%) | 0 (0.0%) |
| Total (Overall) | 273 (45.4%) | 328 (54.6%) |
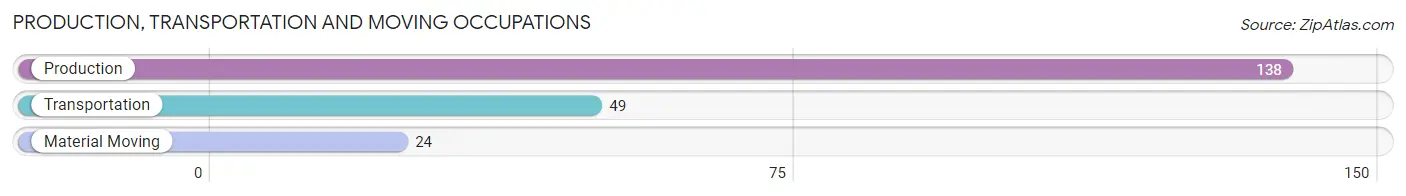
Production, Transportation and Moving Occupations
The most common Production, Transportation and Moving occupations in Huntsville are Production (138 | 23.0%), Transportation (49 | 8.2%), and Material Moving (24 | 4.0%).
Production, Transportation and Moving Occupations by Sex
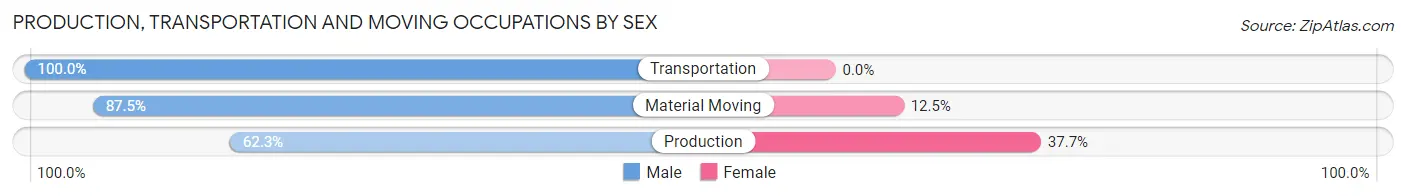
| Occupation | Male | Female |
| Production | 86 (62.3%) | 52 (37.7%) |
| Transportation | 49 (100.0%) | 0 (0.0%) |
| Material Moving | 21 (87.5%) | 3 (12.5%) |
| Total (Category) | 156 (73.9%) | 55 (26.1%) |
| Total (Overall) | 273 (45.4%) | 328 (54.6%) |
Employment Industries by Sex in Huntsville
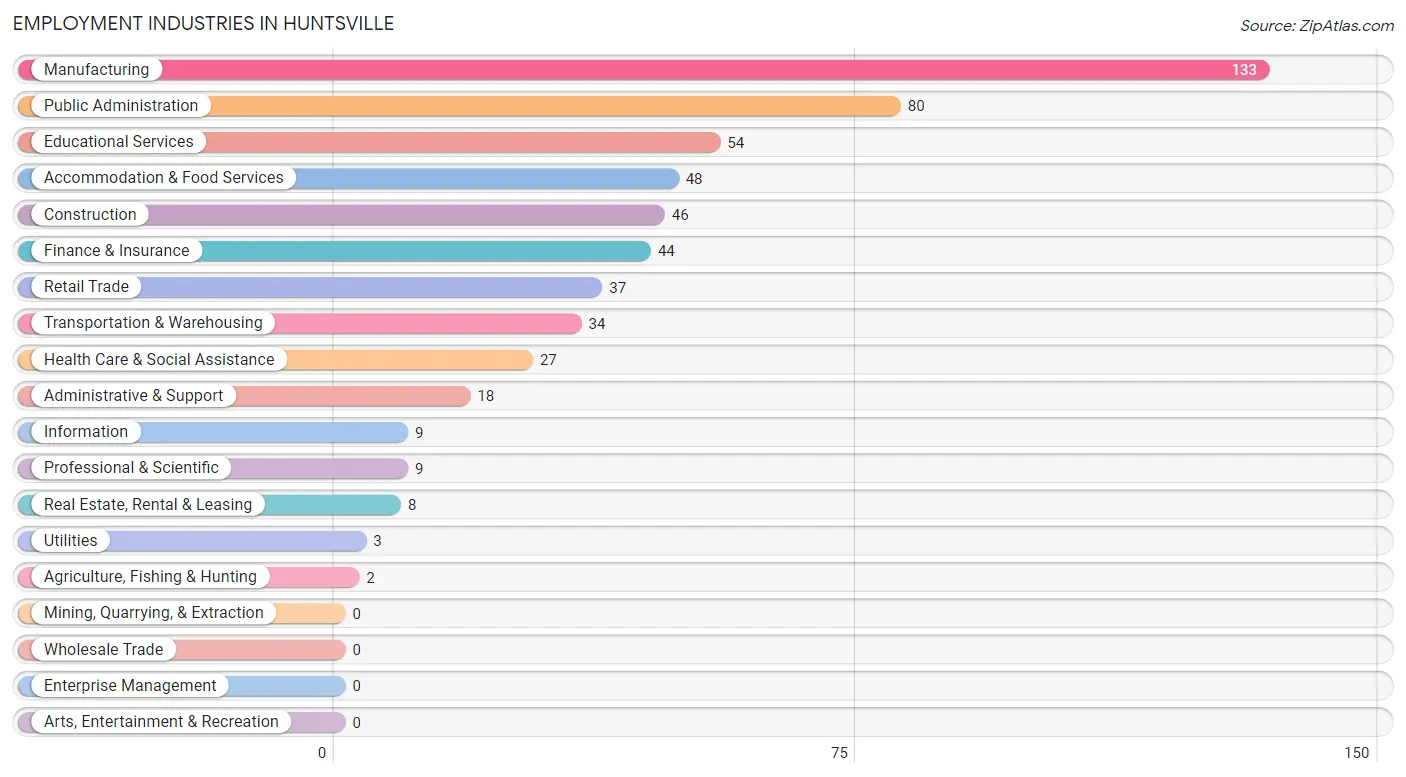
Employment Industries in Huntsville
The major employment industries in Huntsville include Manufacturing (133 | 22.1%), Public Administration (80 | 13.3%), Educational Services (54 | 9.0%), Accommodation & Food Services (48 | 8.0%), and Construction (46 | 7.6%).
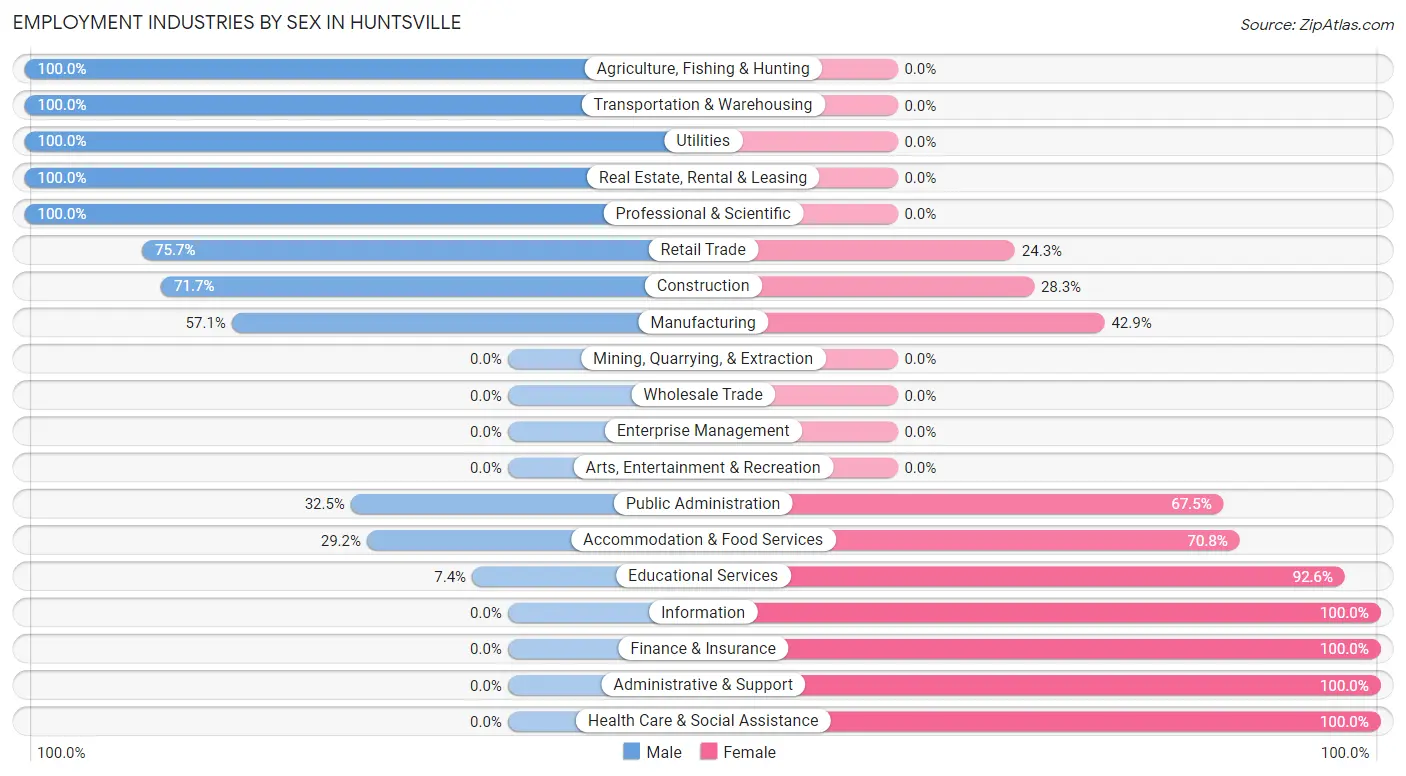
Employment Industries by Sex in Huntsville
The Huntsville industries that see more men than women are Agriculture, Fishing & Hunting (100.0%), Transportation & Warehousing (100.0%), and Utilities (100.0%), whereas the industries that tend to have a higher number of women are Information (100.0%), Finance & Insurance (100.0%), and Administrative & Support (100.0%).
| Industry | Male | Female |
| Agriculture, Fishing & Hunting | 2 (100.0%) | 0 (0.0%) |
| Mining, Quarrying, & Extraction | 0 (0.0%) | 0 (0.0%) |
| Construction | 33 (71.7%) | 13 (28.3%) |
| Manufacturing | 76 (57.1%) | 57 (42.9%) |
| Wholesale Trade | 0 (0.0%) | 0 (0.0%) |
| Retail Trade | 28 (75.7%) | 9 (24.3%) |
| Transportation & Warehousing | 34 (100.0%) | 0 (0.0%) |
| Utilities | 3 (100.0%) | 0 (0.0%) |
| Information | 0 (0.0%) | 9 (100.0%) |
| Finance & Insurance | 0 (0.0%) | 44 (100.0%) |
| Real Estate, Rental & Leasing | 8 (100.0%) | 0 (0.0%) |
| Professional & Scientific | 9 (100.0%) | 0 (0.0%) |
| Enterprise Management | 0 (0.0%) | 0 (0.0%) |
| Administrative & Support | 0 (0.0%) | 18 (100.0%) |
| Educational Services | 4 (7.4%) | 50 (92.6%) |
| Health Care & Social Assistance | 0 (0.0%) | 27 (100.0%) |
| Arts, Entertainment & Recreation | 0 (0.0%) | 0 (0.0%) |
| Accommodation & Food Services | 14 (29.2%) | 34 (70.8%) |
| Public Administration | 26 (32.5%) | 54 (67.5%) |
| Total | 273 (45.4%) | 328 (54.6%) |
Education in Huntsville
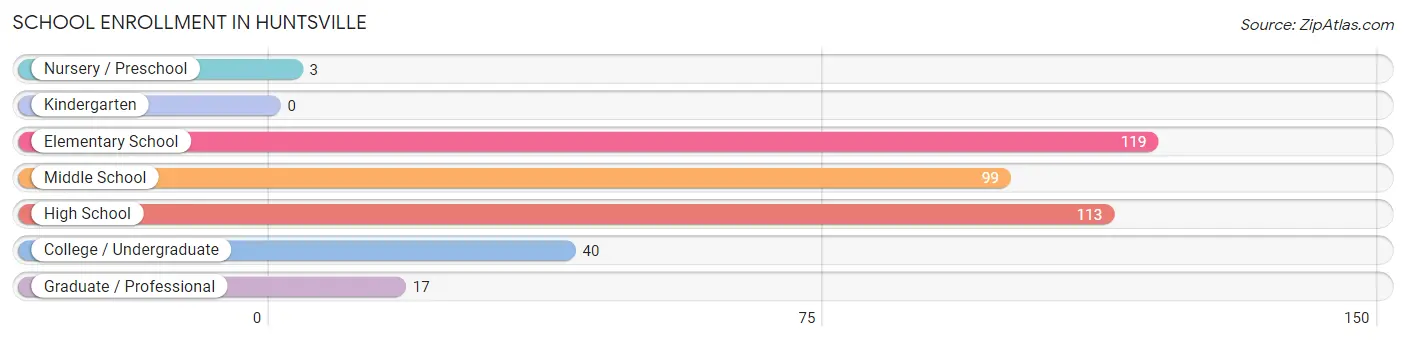
School Enrollment in Huntsville
The most common levels of schooling among the 391 students in Huntsville are elementary school (119 | 30.4%), high school (113 | 28.9%), and middle school (99 | 25.3%).
| School Level | # Students | % Students |
| Nursery / Preschool | 3 | 0.8% |
| Kindergarten | 0 | 0.0% |
| Elementary School | 119 | 30.4% |
| Middle School | 99 | 25.3% |
| High School | 113 | 28.9% |
| College / Undergraduate | 40 | 10.2% |
| Graduate / Professional | 17 | 4.3% |
| Total | 391 | 100.0% |
School Enrollment by Age by Funding Source in Huntsville
Out of a total of 391 students who are enrolled in schools in Huntsville, 16 (4.1%) attend a private institution, while the remaining 375 (95.9%) are enrolled in public schools. The age group of 20 to 24 year olds has the highest likelihood of being enrolled in private schools, with 14 (35.9% in the age bracket) enrolled. Conversely, the age group of 10 to 14 year olds has the lowest likelihood of being enrolled in a private school, with 166 (100.0% in the age bracket) attending a public institution.
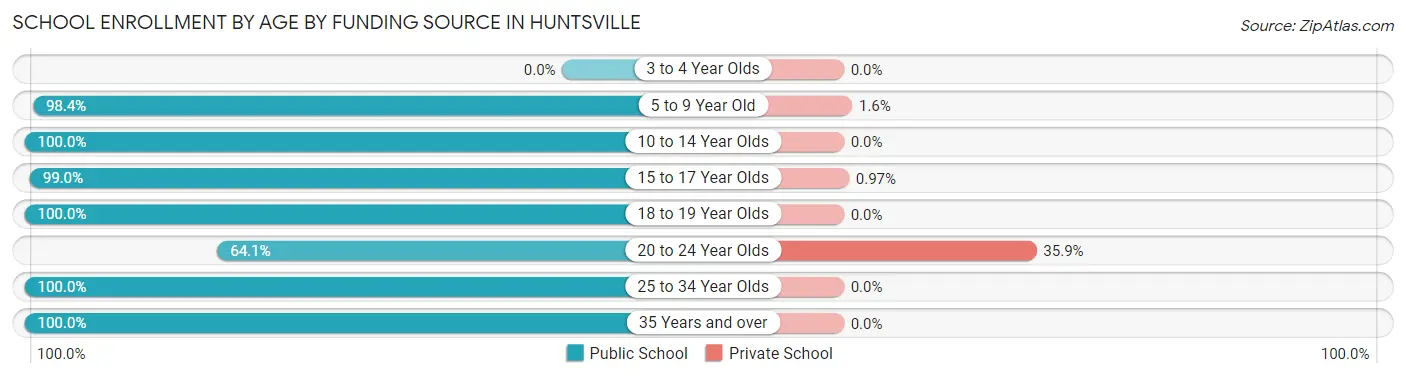
| Age Bracket | Public School | Private School |
| 3 to 4 Year Olds | 0 (0.0%) | 0 (0.0%) |
| 5 to 9 Year Old | 63 (98.4%) | 1 (1.6%) |
| 10 to 14 Year Olds | 166 (100.0%) | 0 (0.0%) |
| 15 to 17 Year Olds | 102 (99.0%) | 1 (1.0%) |
| 18 to 19 Year Olds | 12 (100.0%) | 0 (0.0%) |
| 20 to 24 Year Olds | 25 (64.1%) | 14 (35.9%) |
| 25 to 34 Year Olds | 2 (100.0%) | 0 (0.0%) |
| 35 Years and over | 5 (100.0%) | 0 (0.0%) |
| Total | 375 (95.9%) | 16 (4.1%) |
Educational Attainment by Field of Study in Huntsville
Arts & humanities (32 | 27.1%), education (27 | 22.9%), business (19 | 16.1%), literature & languages (19 | 16.1%), and liberal arts & history (8 | 6.8%) are the most common fields of study among 118 individuals in Huntsville who have obtained a bachelor's degree or higher.
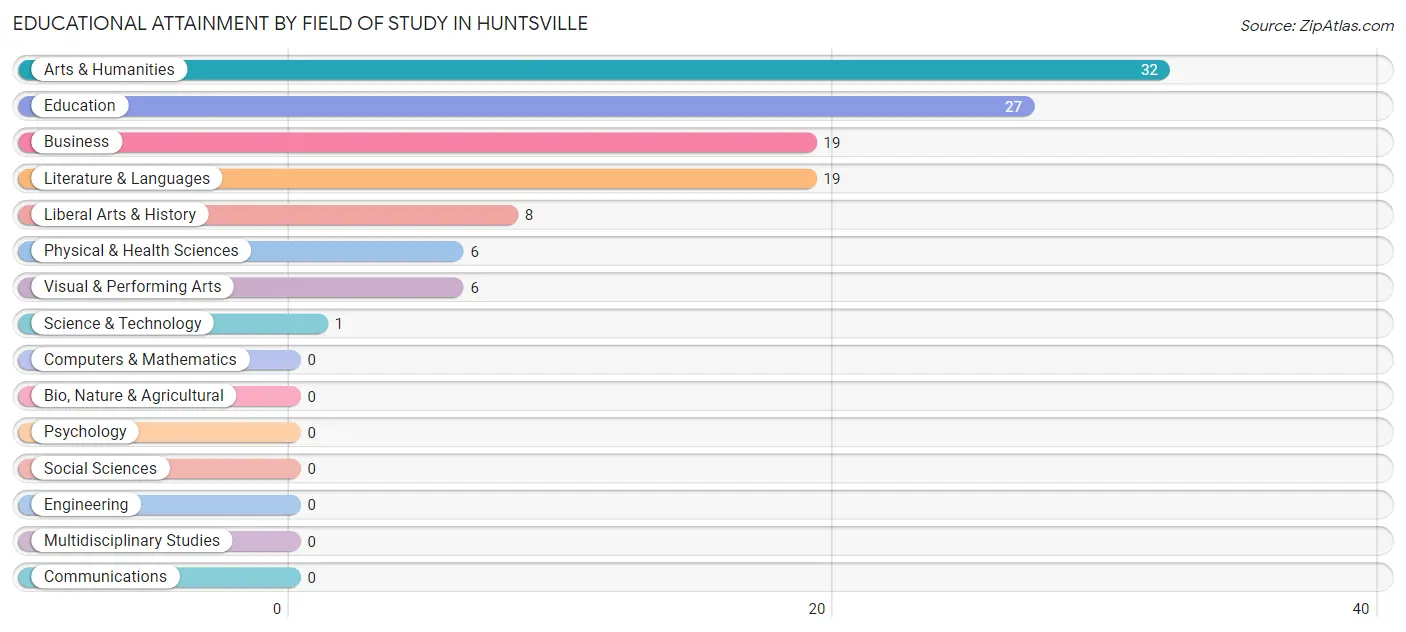
| Field of Study | # Graduates | % Graduates |
| Computers & Mathematics | 0 | 0.0% |
| Bio, Nature & Agricultural | 0 | 0.0% |
| Physical & Health Sciences | 6 | 5.1% |
| Psychology | 0 | 0.0% |
| Social Sciences | 0 | 0.0% |
| Engineering | 0 | 0.0% |
| Multidisciplinary Studies | 0 | 0.0% |
| Science & Technology | 1 | 0.9% |
| Business | 19 | 16.1% |
| Education | 27 | 22.9% |
| Literature & Languages | 19 | 16.1% |
| Liberal Arts & History | 8 | 6.8% |
| Visual & Performing Arts | 6 | 5.1% |
| Communications | 0 | 0.0% |
| Arts & Humanities | 32 | 27.1% |
| Total | 118 | 100.0% |
Transportation & Commute in Huntsville
Vehicle Availability by Sex in Huntsville
The most prevalent vehicle ownership categories in Huntsville are males with 2 vehicles (136, accounting for 49.8%) and females with 2 vehicles (156, making up 42.4%).
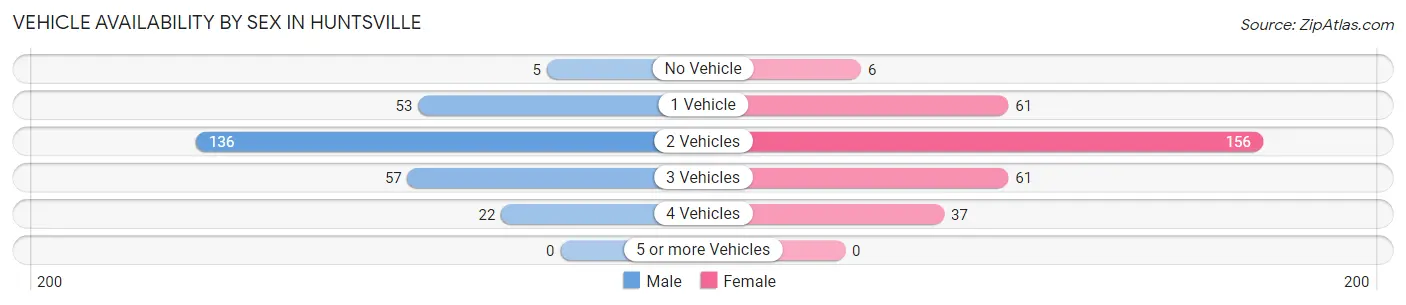
| Vehicles Available | Male | Female |
| No Vehicle | 5 (1.8%) | 6 (1.9%) |
| 1 Vehicle | 53 (19.4%) | 61 (19.0%) |
| 2 Vehicles | 136 (49.8%) | 156 (48.6%) |
| 3 Vehicles | 57 (20.9%) | 61 (19.0%) |
| 4 Vehicles | 22 (8.1%) | 37 (11.5%) |
| 5 or more Vehicles | 0 (0.0%) | 0 (0.0%) |
| Total | 273 (100.0%) | 321 (100.0%) |
Commute Time in Huntsville
The most frequently occuring commute durations in Huntsville are 5 to 9 minutes (154 commuters, 27.1%), 15 to 19 minutes (123 commuters, 21.6%), and 10 to 14 minutes (105 commuters, 18.5%).
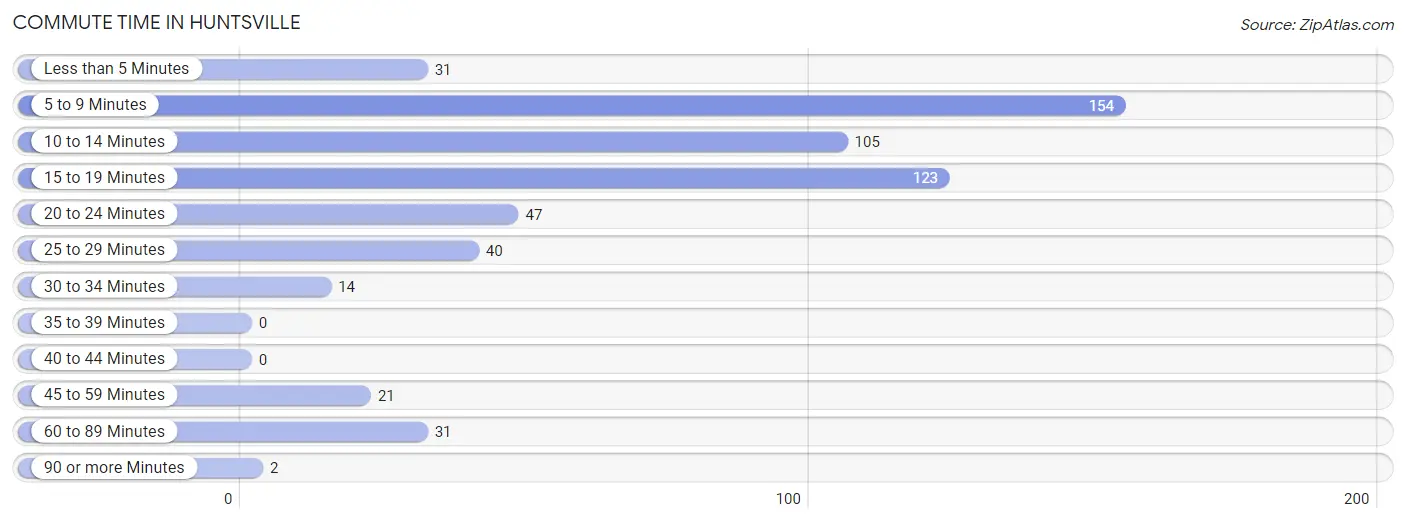
| Commute Time | # Commuters | % Commuters |
| Less than 5 Minutes | 31 | 5.5% |
| 5 to 9 Minutes | 154 | 27.1% |
| 10 to 14 Minutes | 105 | 18.5% |
| 15 to 19 Minutes | 123 | 21.6% |
| 20 to 24 Minutes | 47 | 8.3% |
| 25 to 29 Minutes | 40 | 7.0% |
| 30 to 34 Minutes | 14 | 2.5% |
| 35 to 39 Minutes | 0 | 0.0% |
| 40 to 44 Minutes | 0 | 0.0% |
| 45 to 59 Minutes | 21 | 3.7% |
| 60 to 89 Minutes | 31 | 5.5% |
| 90 or more Minutes | 2 | 0.4% |
Commute Time by Sex in Huntsville
The most common commute times in Huntsville are 15 to 19 minutes (83 commuters, 31.2%) for males and 5 to 9 minutes (116 commuters, 38.4%) for females.
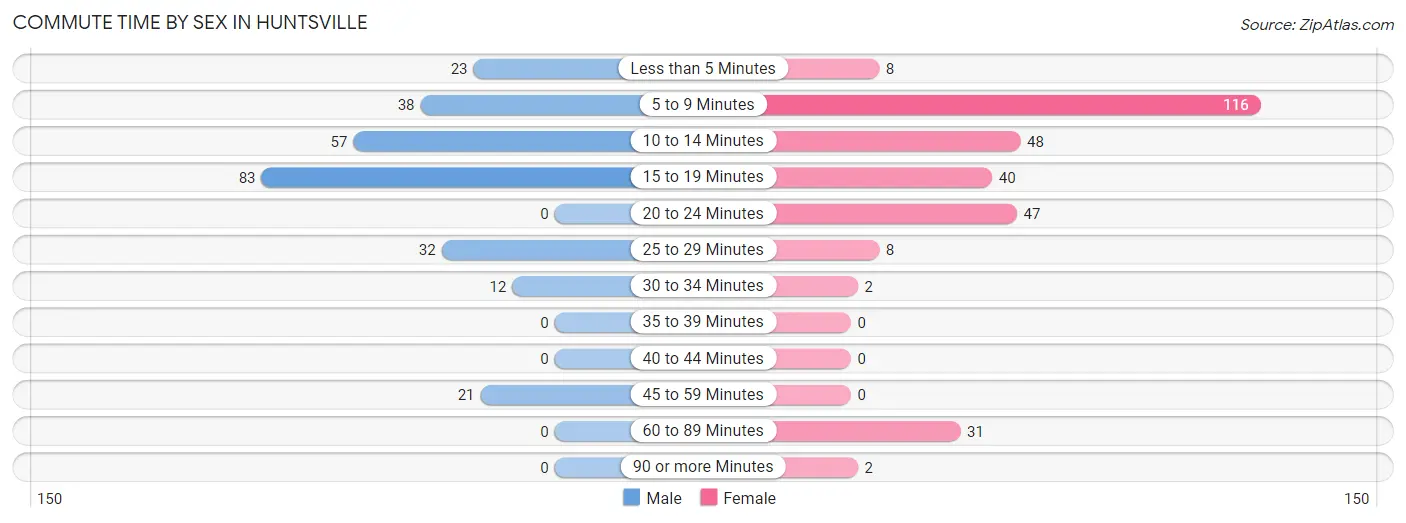
| Commute Time | Male | Female |
| Less than 5 Minutes | 23 (8.6%) | 8 (2.6%) |
| 5 to 9 Minutes | 38 (14.3%) | 116 (38.4%) |
| 10 to 14 Minutes | 57 (21.4%) | 48 (15.9%) |
| 15 to 19 Minutes | 83 (31.2%) | 40 (13.3%) |
| 20 to 24 Minutes | 0 (0.0%) | 47 (15.6%) |
| 25 to 29 Minutes | 32 (12.0%) | 8 (2.6%) |
| 30 to 34 Minutes | 12 (4.5%) | 2 (0.7%) |
| 35 to 39 Minutes | 0 (0.0%) | 0 (0.0%) |
| 40 to 44 Minutes | 0 (0.0%) | 0 (0.0%) |
| 45 to 59 Minutes | 21 (7.9%) | 0 (0.0%) |
| 60 to 89 Minutes | 0 (0.0%) | 31 (10.3%) |
| 90 or more Minutes | 0 (0.0%) | 2 (0.7%) |
Time of Departure to Work by Sex in Huntsville
The most frequent times of departure to work in Huntsville are 12:00 AM to 4:59 AM (53, 19.9%) for males and 7:30 AM to 7:59 AM (80, 26.5%) for females.
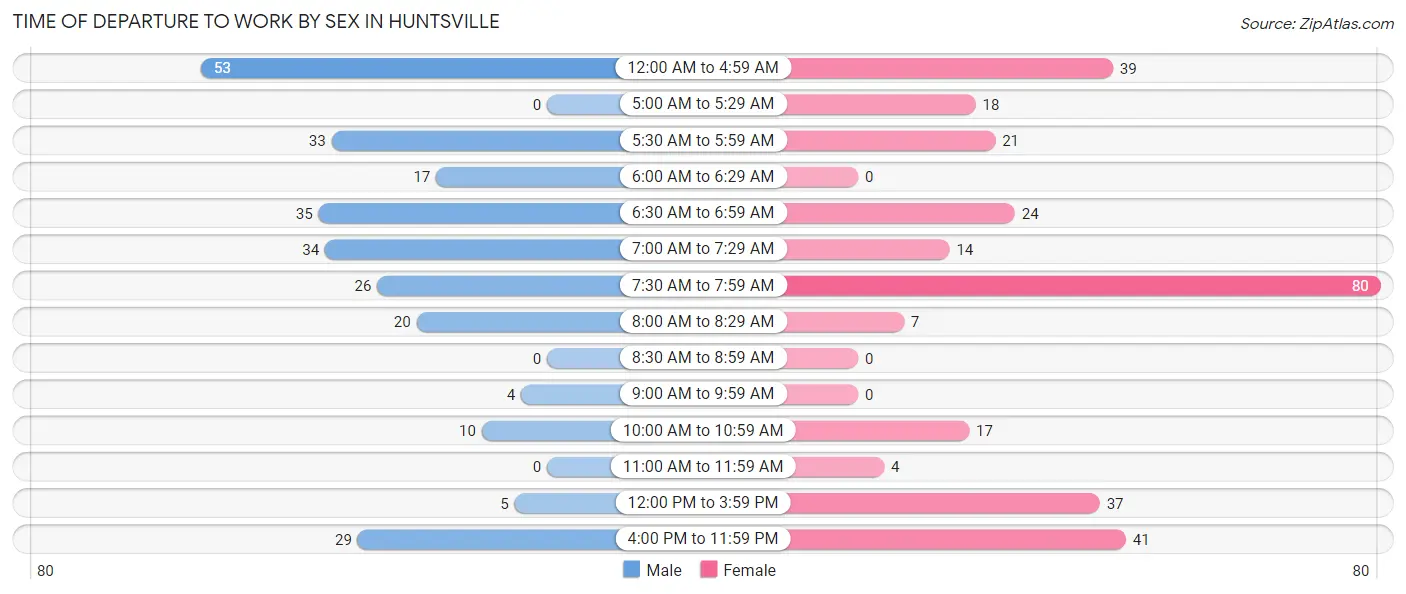
| Time of Departure | Male | Female |
| 12:00 AM to 4:59 AM | 53 (19.9%) | 39 (12.9%) |
| 5:00 AM to 5:29 AM | 0 (0.0%) | 18 (6.0%) |
| 5:30 AM to 5:59 AM | 33 (12.4%) | 21 (7.0%) |
| 6:00 AM to 6:29 AM | 17 (6.4%) | 0 (0.0%) |
| 6:30 AM to 6:59 AM | 35 (13.2%) | 24 (8.0%) |
| 7:00 AM to 7:29 AM | 34 (12.8%) | 14 (4.6%) |
| 7:30 AM to 7:59 AM | 26 (9.8%) | 80 (26.5%) |
| 8:00 AM to 8:29 AM | 20 (7.5%) | 7 (2.3%) |
| 8:30 AM to 8:59 AM | 0 (0.0%) | 0 (0.0%) |
| 9:00 AM to 9:59 AM | 4 (1.5%) | 0 (0.0%) |
| 10:00 AM to 10:59 AM | 10 (3.8%) | 17 (5.6%) |
| 11:00 AM to 11:59 AM | 0 (0.0%) | 4 (1.3%) |
| 12:00 PM to 3:59 PM | 5 (1.9%) | 37 (12.2%) |
| 4:00 PM to 11:59 PM | 29 (10.9%) | 41 (13.6%) |
| Total | 266 (100.0%) | 302 (100.0%) |
Housing Occupancy in Huntsville
Occupancy by Ownership in Huntsville
Of the total 756 dwellings in Huntsville, owner-occupied units account for 299 (39.6%), while renter-occupied units make up 457 (60.5%).
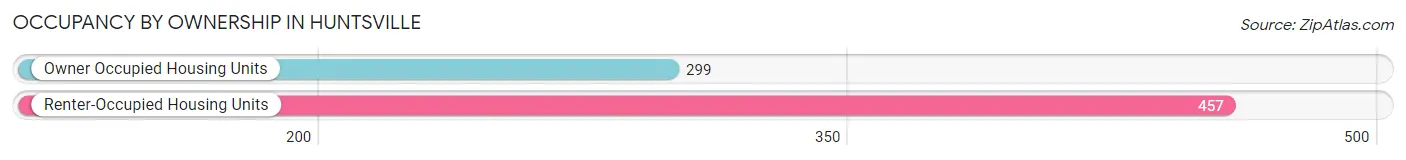
| Occupancy | # Housing Units | % Housing Units |
| Owner Occupied Housing Units | 299 | 39.6% |
| Renter-Occupied Housing Units | 457 | 60.5% |
| Total Occupied Housing Units | 756 | 100.0% |
Occupancy by Household Size in Huntsville
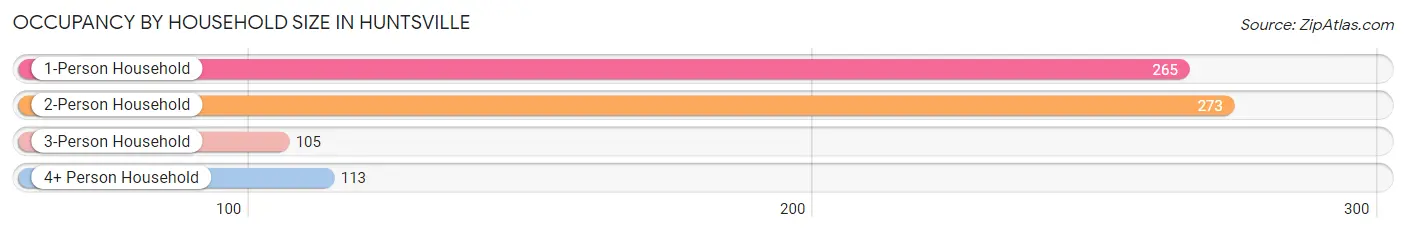
| Household Size | # Housing Units | % Housing Units |
| 1-Person Household | 265 | 35.0% |
| 2-Person Household | 273 | 36.1% |
| 3-Person Household | 105 | 13.9% |
| 4+ Person Household | 113 | 14.9% |
| Total Housing Units | 756 | 100.0% |
Occupancy by Ownership by Household Size in Huntsville
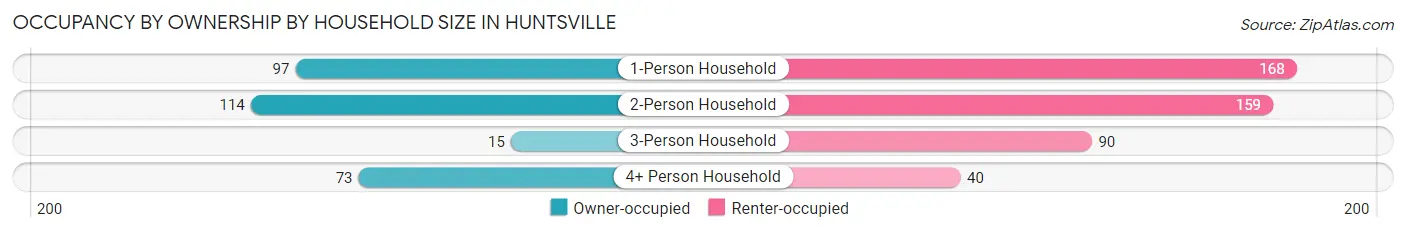
| Household Size | Owner-occupied | Renter-occupied |
| 1-Person Household | 97 (36.6%) | 168 (63.4%) |
| 2-Person Household | 114 (41.8%) | 159 (58.2%) |
| 3-Person Household | 15 (14.3%) | 90 (85.7%) |
| 4+ Person Household | 73 (64.6%) | 40 (35.4%) |
| Total Housing Units | 299 (39.6%) | 457 (60.5%) |
Occupancy by Educational Attainment in Huntsville
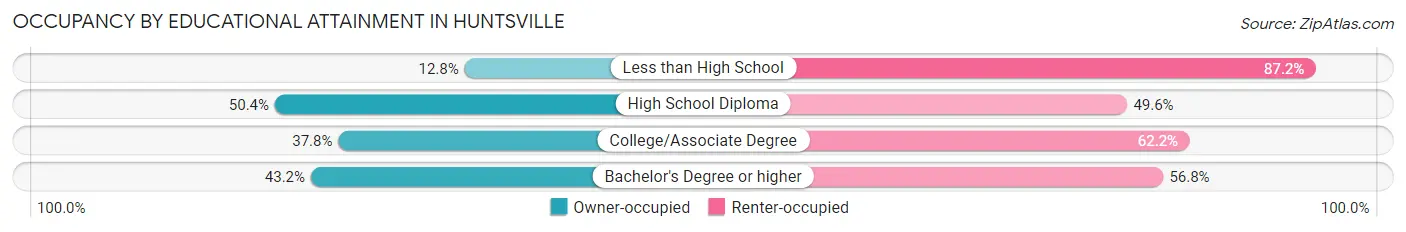
| Household Size | Owner-occupied | Renter-occupied |
| Less than High School | 12 (12.8%) | 82 (87.2%) |
| High School Diploma | 131 (50.4%) | 129 (49.6%) |
| College/Associate Degree | 124 (37.8%) | 204 (62.2%) |
| Bachelor's Degree or higher | 32 (43.2%) | 42 (56.8%) |
Occupancy by Age of Householder in Huntsville
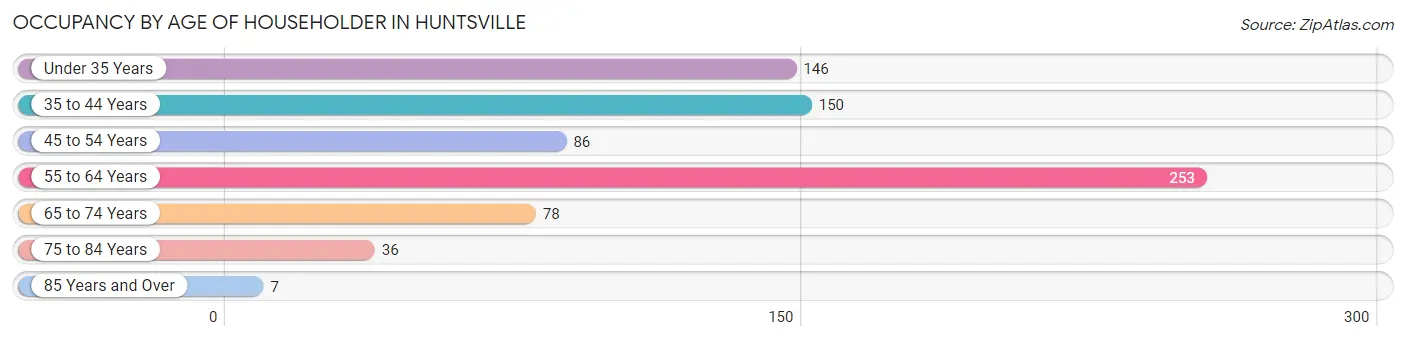
| Age Bracket | # Households | % Households |
| Under 35 Years | 146 | 19.3% |
| 35 to 44 Years | 150 | 19.8% |
| 45 to 54 Years | 86 | 11.4% |
| 55 to 64 Years | 253 | 33.5% |
| 65 to 74 Years | 78 | 10.3% |
| 75 to 84 Years | 36 | 4.8% |
| 85 Years and Over | 7 | 0.9% |
| Total | 756 | 100.0% |
Housing Finances in Huntsville
Median Income by Occupancy in Huntsville
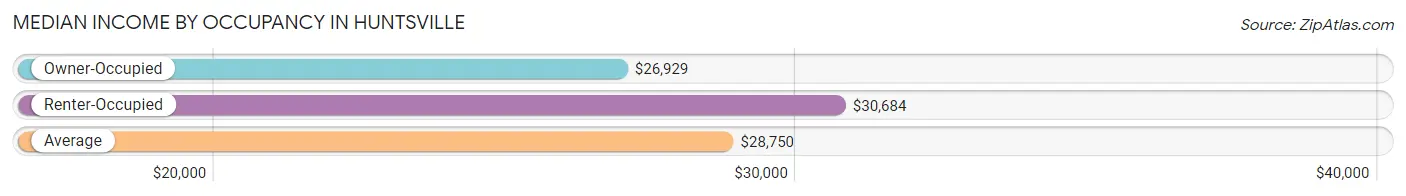
| Occupancy Type | # Households | Median Income |
| Owner-Occupied | 299 (39.6%) | $26,929 |
| Renter-Occupied | 457 (60.5%) | $30,684 |
| Average | 756 (100.0%) | $28,750 |
Occupancy by Householder Income Bracket in Huntsville
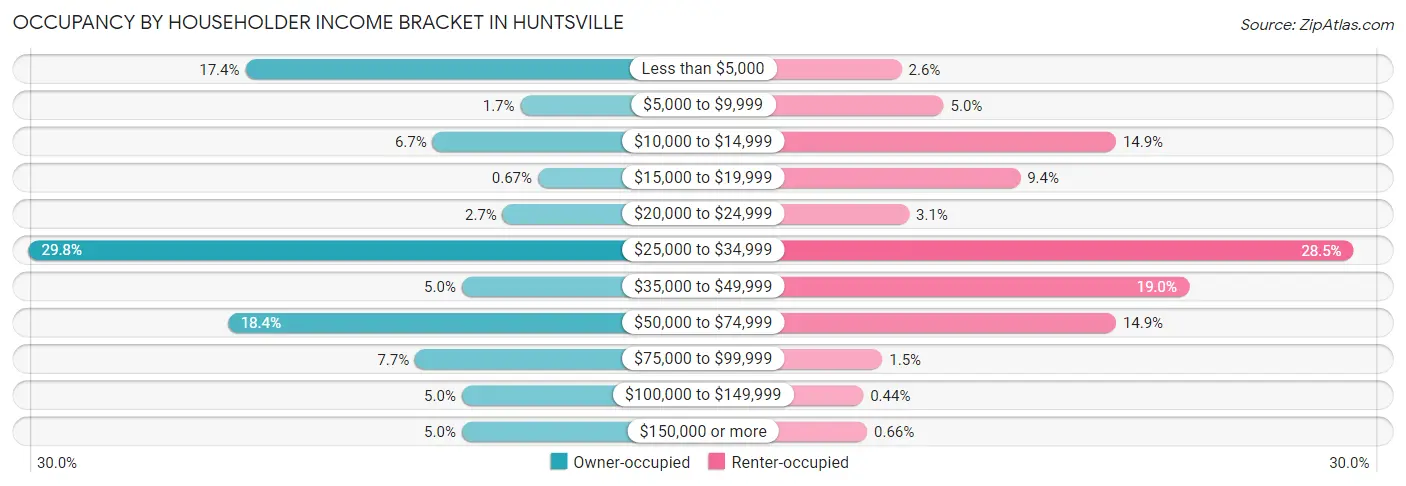
| Income Bracket | Owner-occupied | Renter-occupied |
| Less than $5,000 | 52 (17.4%) | 12 (2.6%) |
| $5,000 to $9,999 | 5 (1.7%) | 23 (5.0%) |
| $10,000 to $14,999 | 20 (6.7%) | 68 (14.9%) |
| $15,000 to $19,999 | 2 (0.7%) | 43 (9.4%) |
| $20,000 to $24,999 | 8 (2.7%) | 14 (3.1%) |
| $25,000 to $34,999 | 89 (29.8%) | 130 (28.4%) |
| $35,000 to $49,999 | 15 (5.0%) | 87 (19.0%) |
| $50,000 to $74,999 | 55 (18.4%) | 68 (14.9%) |
| $75,000 to $99,999 | 23 (7.7%) | 7 (1.5%) |
| $100,000 to $149,999 | 15 (5.0%) | 2 (0.4%) |
| $150,000 or more | 15 (5.0%) | 3 (0.7%) |
| Total | 299 (100.0%) | 457 (100.0%) |
Monthly Housing Cost Tiers in Huntsville
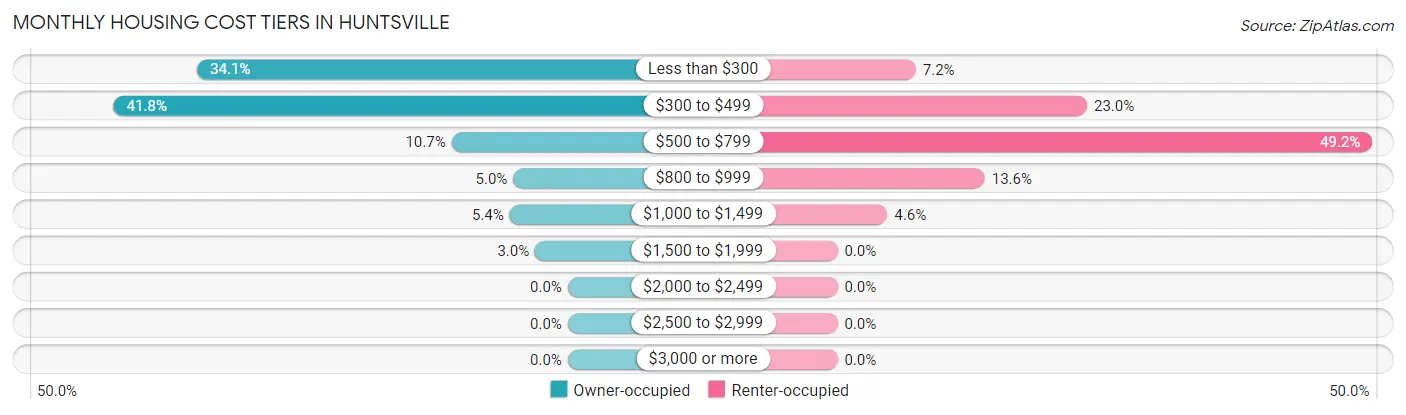
| Monthly Cost | Owner-occupied | Renter-occupied |
| Less than $300 | 102 (34.1%) | 33 (7.2%) |
| $300 to $499 | 125 (41.8%) | 105 (23.0%) |
| $500 to $799 | 32 (10.7%) | 225 (49.2%) |
| $800 to $999 | 15 (5.0%) | 62 (13.6%) |
| $1,000 to $1,499 | 16 (5.3%) | 21 (4.6%) |
| $1,500 to $1,999 | 9 (3.0%) | 0 (0.0%) |
| $2,000 to $2,499 | 0 (0.0%) | 0 (0.0%) |
| $2,500 to $2,999 | 0 (0.0%) | 0 (0.0%) |
| $3,000 or more | 0 (0.0%) | 0 (0.0%) |
| Total | 299 (100.0%) | 457 (100.0%) |
Physical Housing Characteristics in Huntsville
Housing Structures in Huntsville
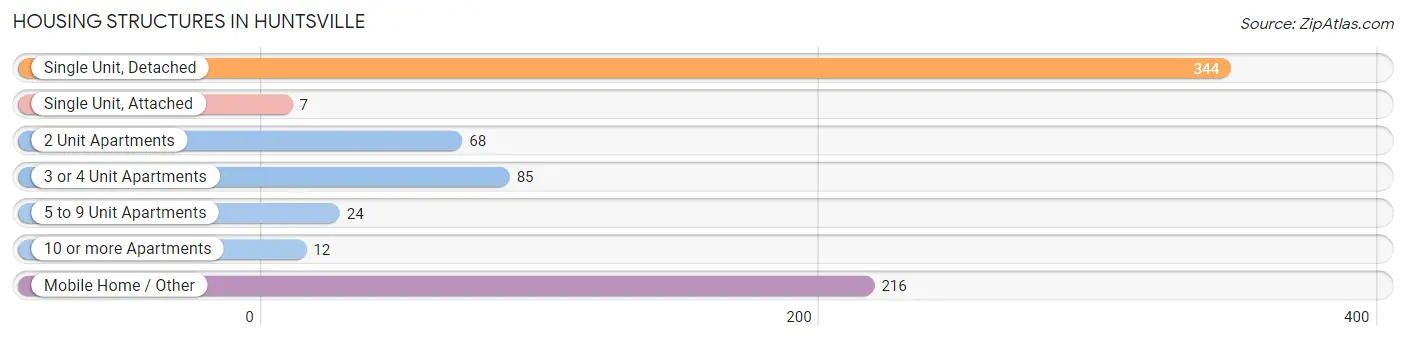
| Structure Type | # Housing Units | % Housing Units |
| Single Unit, Detached | 344 | 45.5% |
| Single Unit, Attached | 7 | 0.9% |
| 2 Unit Apartments | 68 | 9.0% |
| 3 or 4 Unit Apartments | 85 | 11.2% |
| 5 to 9 Unit Apartments | 24 | 3.2% |
| 10 or more Apartments | 12 | 1.6% |
| Mobile Home / Other | 216 | 28.6% |
| Total | 756 | 100.0% |
Housing Structures by Occupancy in Huntsville
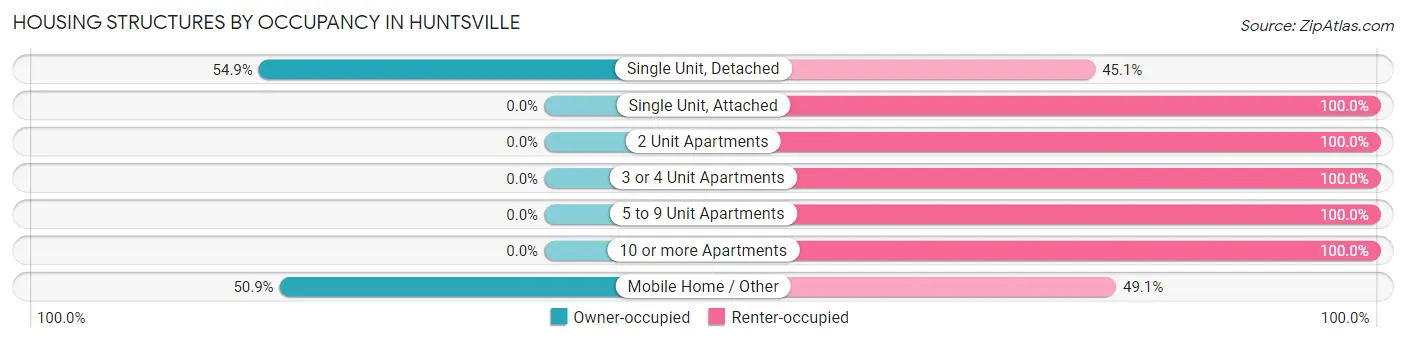
| Structure Type | Owner-occupied | Renter-occupied |
| Single Unit, Detached | 189 (54.9%) | 155 (45.1%) |
| Single Unit, Attached | 0 (0.0%) | 7 (100.0%) |
| 2 Unit Apartments | 0 (0.0%) | 68 (100.0%) |
| 3 or 4 Unit Apartments | 0 (0.0%) | 85 (100.0%) |
| 5 to 9 Unit Apartments | 0 (0.0%) | 24 (100.0%) |
| 10 or more Apartments | 0 (0.0%) | 12 (100.0%) |
| Mobile Home / Other | 110 (50.9%) | 106 (49.1%) |
| Total | 299 (39.6%) | 457 (60.5%) |
Housing Structures by Number of Rooms in Huntsville
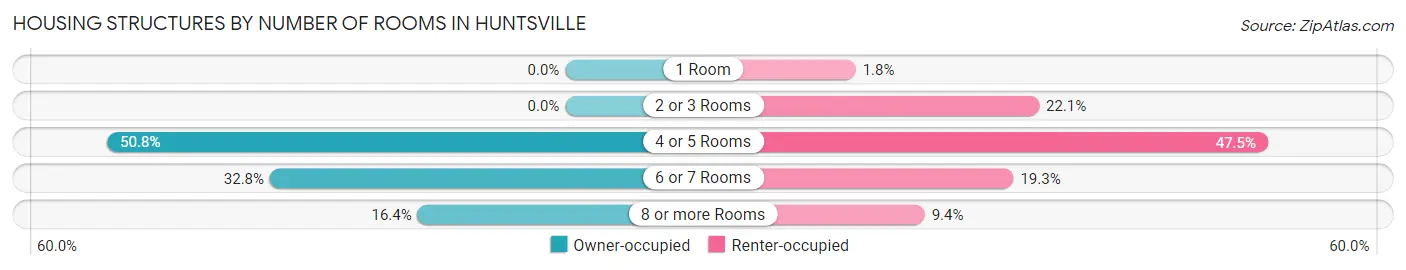
| Number of Rooms | Owner-occupied | Renter-occupied |
| 1 Room | 0 (0.0%) | 8 (1.8%) |
| 2 or 3 Rooms | 0 (0.0%) | 101 (22.1%) |
| 4 or 5 Rooms | 152 (50.8%) | 217 (47.5%) |
| 6 or 7 Rooms | 98 (32.8%) | 88 (19.3%) |
| 8 or more Rooms | 49 (16.4%) | 43 (9.4%) |
| Total | 299 (100.0%) | 457 (100.0%) |
Housing Structure by Heating Type in Huntsville
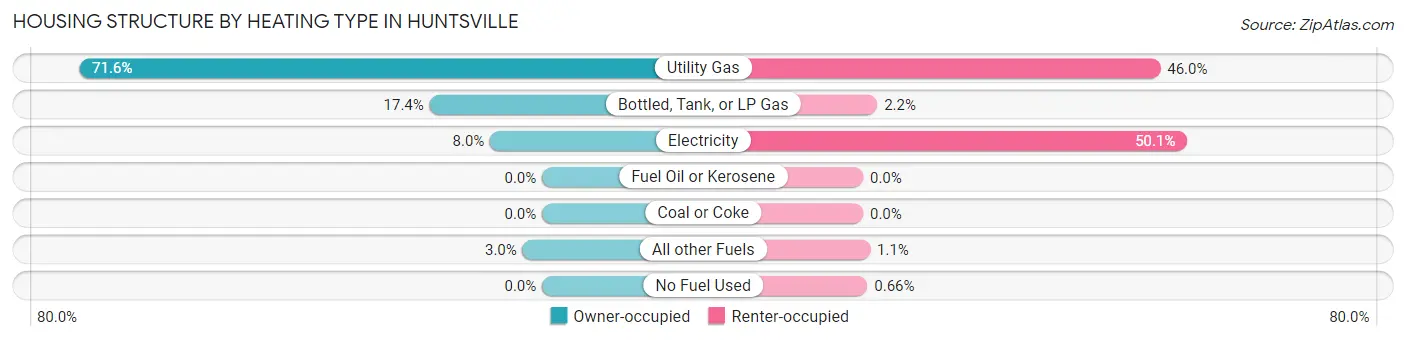
| Heating Type | Owner-occupied | Renter-occupied |
| Utility Gas | 214 (71.6%) | 210 (46.0%) |
| Bottled, Tank, or LP Gas | 52 (17.4%) | 10 (2.2%) |
| Electricity | 24 (8.0%) | 229 (50.1%) |
| Fuel Oil or Kerosene | 0 (0.0%) | 0 (0.0%) |
| Coal or Coke | 0 (0.0%) | 0 (0.0%) |
| All other Fuels | 9 (3.0%) | 5 (1.1%) |
| No Fuel Used | 0 (0.0%) | 3 (0.7%) |
| Total | 299 (100.0%) | 457 (100.0%) |
Household Vehicle Usage in Huntsville
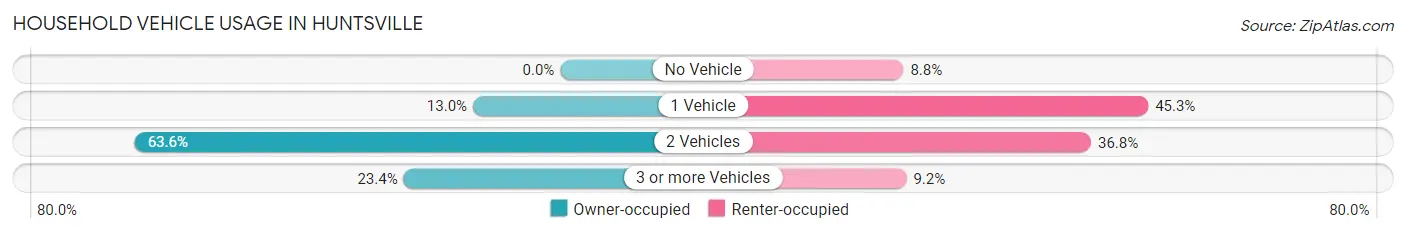
| Vehicles per Household | Owner-occupied | Renter-occupied |
| No Vehicle | 0 (0.0%) | 40 (8.7%) |
| 1 Vehicle | 39 (13.0%) | 207 (45.3%) |
| 2 Vehicles | 190 (63.5%) | 168 (36.8%) |
| 3 or more Vehicles | 70 (23.4%) | 42 (9.2%) |
| Total | 299 (100.0%) | 457 (100.0%) |
Real Estate & Mortgages in Huntsville
Real Estate and Mortgage Overview in Huntsville
| Characteristic | Without Mortgage | With Mortgage |
| Housing Units | 254 | 45 |
| Median Property Value | $103,400 | $239,300 |
| Median Household Income | $26,410 | $5 |
| Monthly Housing Costs | $357 | $0 |
| Real Estate Taxes | $388 | $0 |
Property Value by Mortgage Status in Huntsville
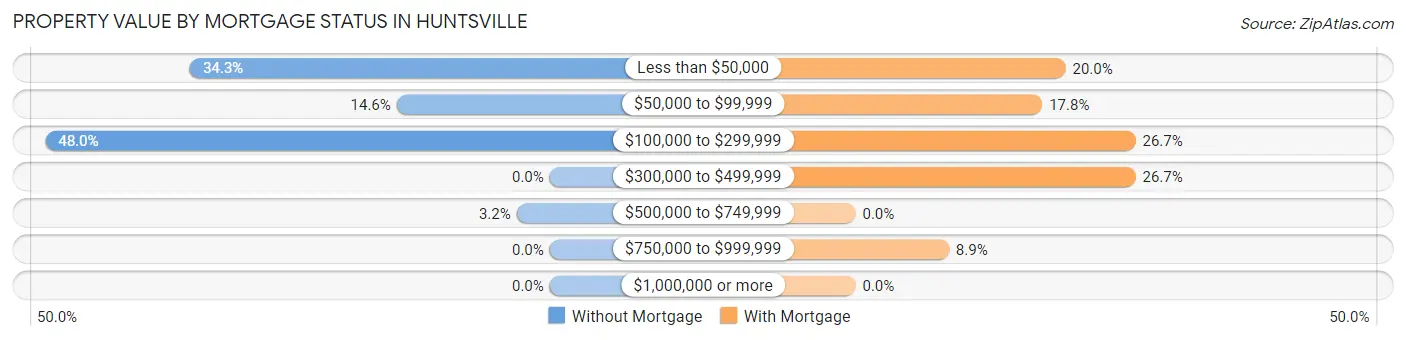
| Property Value | Without Mortgage | With Mortgage |
| Less than $50,000 | 87 (34.3%) | 9 (20.0%) |
| $50,000 to $99,999 | 37 (14.6%) | 8 (17.8%) |
| $100,000 to $299,999 | 122 (48.0%) | 12 (26.7%) |
| $300,000 to $499,999 | 0 (0.0%) | 12 (26.7%) |
| $500,000 to $749,999 | 8 (3.2%) | 0 (0.0%) |
| $750,000 to $999,999 | 0 (0.0%) | 4 (8.9%) |
| $1,000,000 or more | 0 (0.0%) | 0 (0.0%) |
| Total | 254 (100.0%) | 45 (100.0%) |
Household Income by Mortgage Status in Huntsville
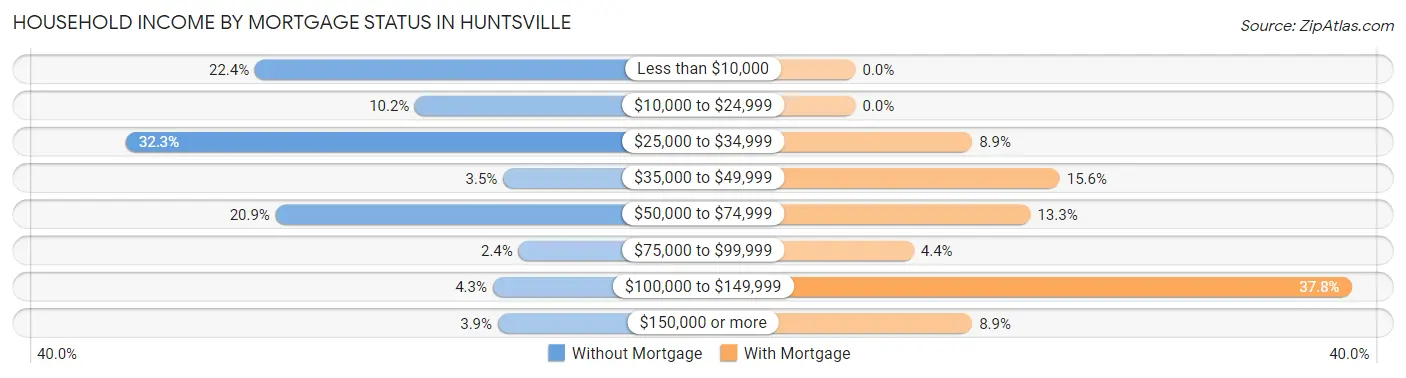
| Household Income | Without Mortgage | With Mortgage |
| Less than $10,000 | 57 (22.4%) | 0 (0.0%) |
| $10,000 to $24,999 | 26 (10.2%) | 0 (0.0%) |
| $25,000 to $34,999 | 82 (32.3%) | 4 (8.9%) |
| $35,000 to $49,999 | 9 (3.5%) | 7 (15.6%) |
| $50,000 to $74,999 | 53 (20.9%) | 6 (13.3%) |
| $75,000 to $99,999 | 6 (2.4%) | 2 (4.4%) |
| $100,000 to $149,999 | 11 (4.3%) | 17 (37.8%) |
| $150,000 or more | 10 (3.9%) | 4 (8.9%) |
| Total | 254 (100.0%) | 45 (100.0%) |
Property Value to Household Income Ratio in Huntsville
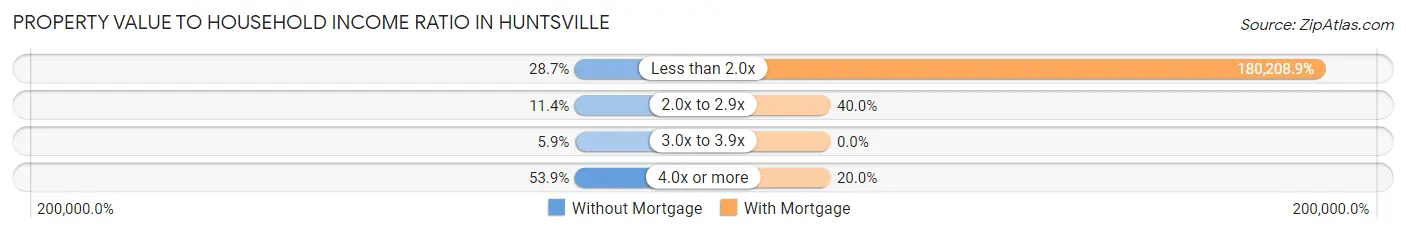
| Value-to-Income Ratio | Without Mortgage | With Mortgage |
| Less than 2.0x | 73 (28.7%) | 81,094 (180,208.9%) |
| 2.0x to 2.9x | 29 (11.4%) | 18 (40.0%) |
| 3.0x to 3.9x | 15 (5.9%) | 0 (0.0%) |
| 4.0x or more | 137 (53.9%) | 9 (20.0%) |
| Total | 254 (100.0%) | 45 (100.0%) |
Real Estate Taxes by Mortgage Status in Huntsville
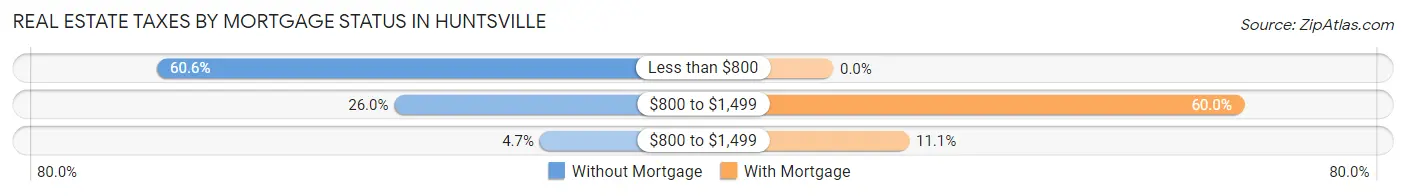
| Property Taxes | Without Mortgage | With Mortgage |
| Less than $800 | 154 (60.6%) | 0 (0.0%) |
| $800 to $1,499 | 66 (26.0%) | 27 (60.0%) |
| $800 to $1,499 | 12 (4.7%) | 5 (11.1%) |
| Total | 254 (100.0%) | 45 (100.0%) |
Health & Disability in Huntsville
Health Insurance Coverage by Age in Huntsville
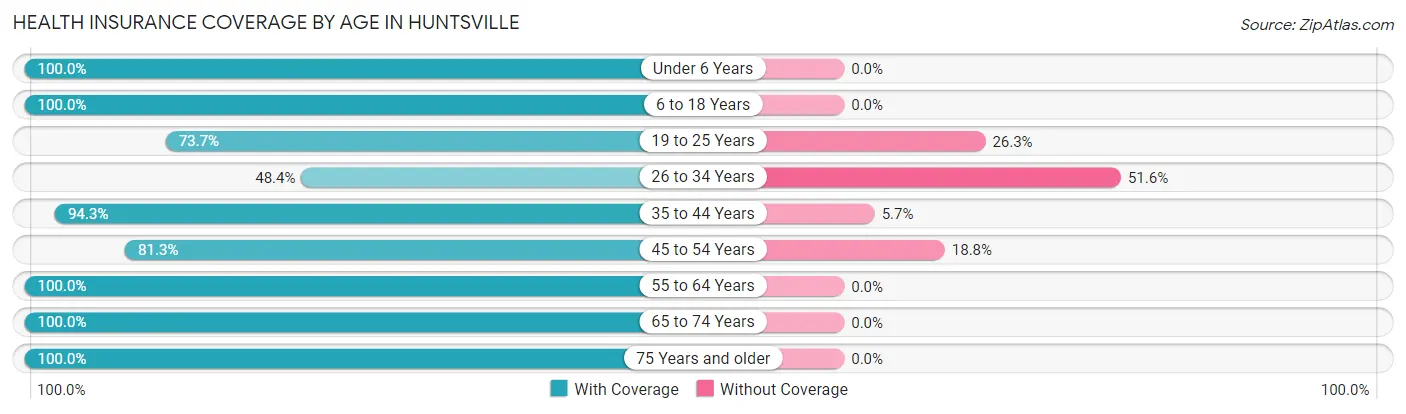
| Age Bracket | With Coverage | Without Coverage |
| Under 6 Years | 17 (100.0%) | 0 (0.0%) |
| 6 to 18 Years | 327 (100.0%) | 0 (0.0%) |
| 19 to 25 Years | 196 (73.7%) | 70 (26.3%) |
| 26 to 34 Years | 91 (48.4%) | 97 (51.6%) |
| 35 to 44 Years | 183 (94.3%) | 11 (5.7%) |
| 45 to 54 Years | 117 (81.2%) | 27 (18.8%) |
| 55 to 64 Years | 364 (100.0%) | 0 (0.0%) |
| 65 to 74 Years | 99 (100.0%) | 0 (0.0%) |
| 75 Years and older | 55 (100.0%) | 0 (0.0%) |
| Total | 1,449 (87.6%) | 205 (12.4%) |
Health Insurance Coverage by Citizenship Status in Huntsville
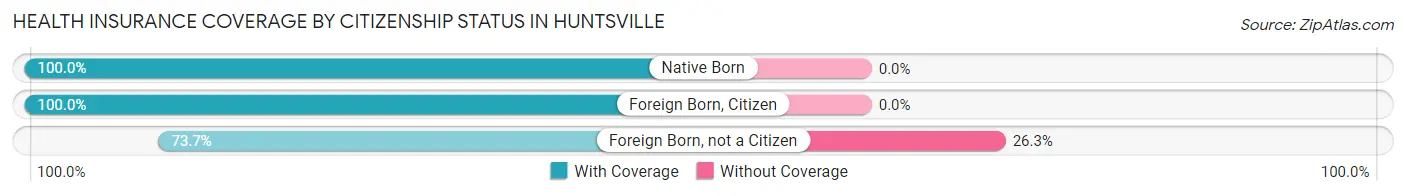
| Citizenship Status | With Coverage | Without Coverage |
| Native Born | 17 (100.0%) | 0 (0.0%) |
| Foreign Born, Citizen | 327 (100.0%) | 0 (0.0%) |
| Foreign Born, not a Citizen | 196 (73.7%) | 70 (26.3%) |
Health Insurance Coverage by Household Income in Huntsville
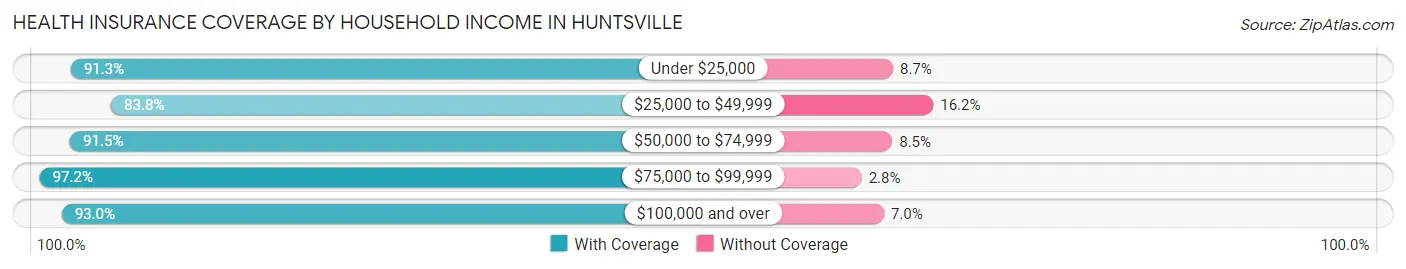
| Household Income | With Coverage | Without Coverage |
| Under $25,000 | 253 (91.3%) | 24 (8.7%) |
| $25,000 to $49,999 | 781 (83.8%) | 151 (16.2%) |
| $50,000 to $74,999 | 204 (91.5%) | 19 (8.5%) |
| $75,000 to $99,999 | 104 (97.2%) | 3 (2.8%) |
| $100,000 and over | 107 (93.0%) | 8 (7.0%) |
Public vs Private Health Insurance Coverage by Age in Huntsville
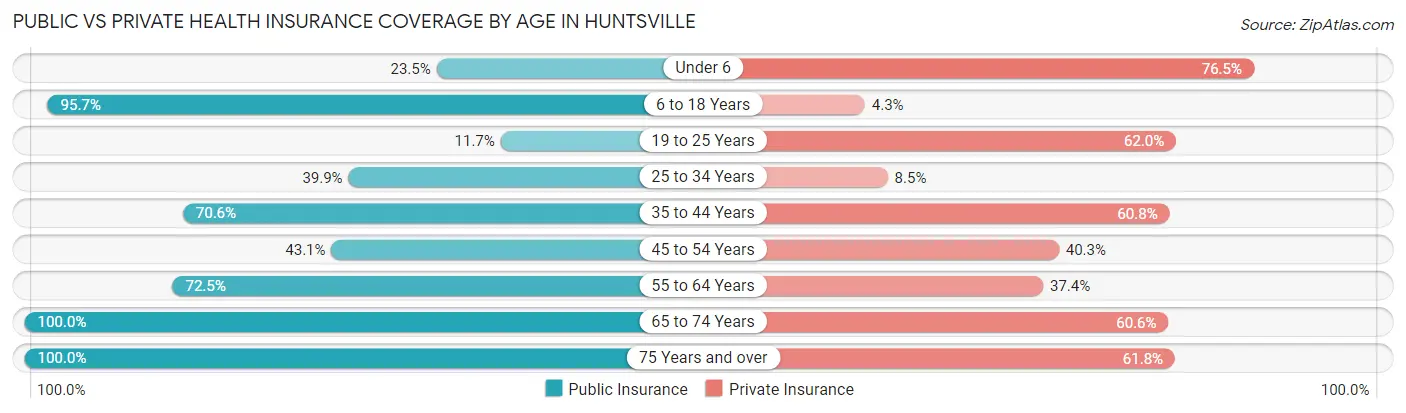
| Age Bracket | Public Insurance | Private Insurance |
| Under 6 | 4 (23.5%) | 13 (76.5%) |
| 6 to 18 Years | 313 (95.7%) | 14 (4.3%) |
| 19 to 25 Years | 31 (11.7%) | 165 (62.0%) |
| 25 to 34 Years | 75 (39.9%) | 16 (8.5%) |
| 35 to 44 Years | 137 (70.6%) | 118 (60.8%) |
| 45 to 54 Years | 62 (43.1%) | 58 (40.3%) |
| 55 to 64 Years | 264 (72.5%) | 136 (37.4%) |
| 65 to 74 Years | 99 (100.0%) | 60 (60.6%) |
| 75 Years and over | 55 (100.0%) | 34 (61.8%) |
| Total | 1,040 (62.9%) | 614 (37.1%) |
Disability Status by Sex by Age in Huntsville
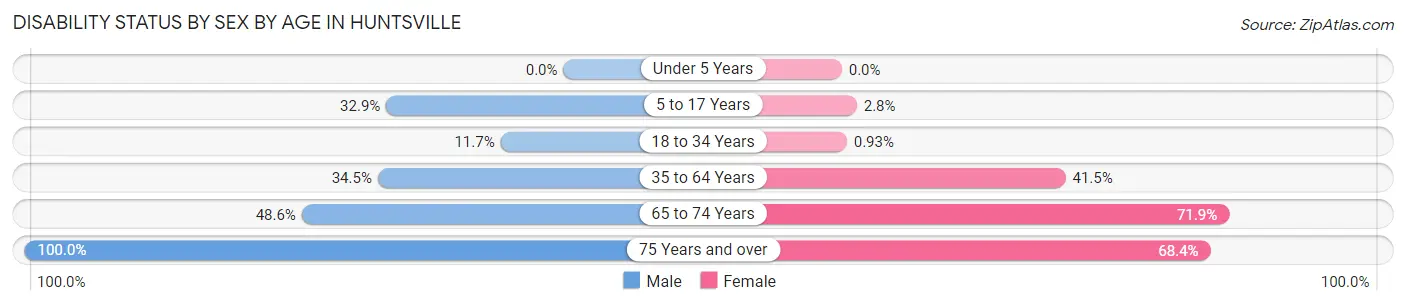
| Age Bracket | Male | Female |
| Under 5 Years | 0 (0.0%) | 0 (0.0%) |
| 5 to 17 Years | 25 (32.9%) | 7 (2.8%) |
| 18 to 34 Years | 28 (11.7%) | 2 (0.9%) |
| 35 to 64 Years | 134 (34.4%) | 130 (41.5%) |
| 65 to 74 Years | 17 (48.6%) | 46 (71.9%) |
| 75 Years and over | 17 (100.0%) | 26 (68.4%) |
Disability Class by Sex by Age in Huntsville
Disability Class: Hearing Difficulty
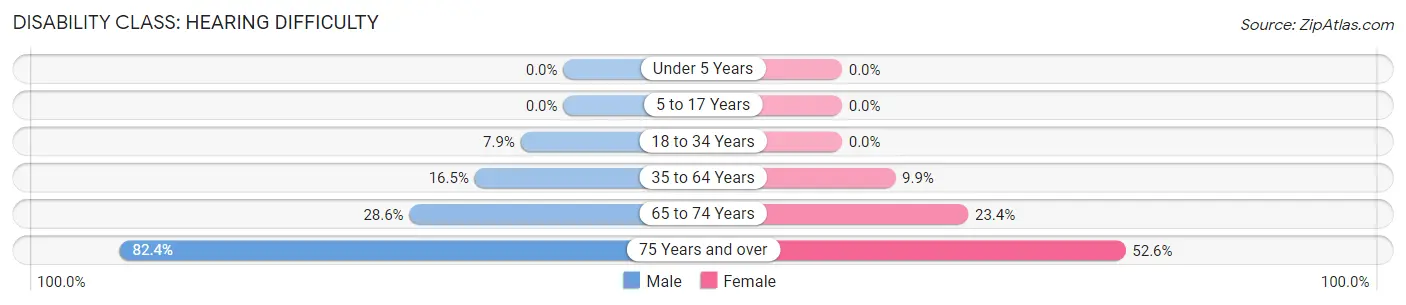
| Age Bracket | Male | Female |
| Under 5 Years | 0 (0.0%) | 0 (0.0%) |
| 5 to 17 Years | 0 (0.0%) | 0 (0.0%) |
| 18 to 34 Years | 19 (7.9%) | 0 (0.0%) |
| 35 to 64 Years | 64 (16.5%) | 31 (9.9%) |
| 65 to 74 Years | 10 (28.6%) | 15 (23.4%) |
| 75 Years and over | 14 (82.4%) | 20 (52.6%) |
Disability Class: Vision Difficulty
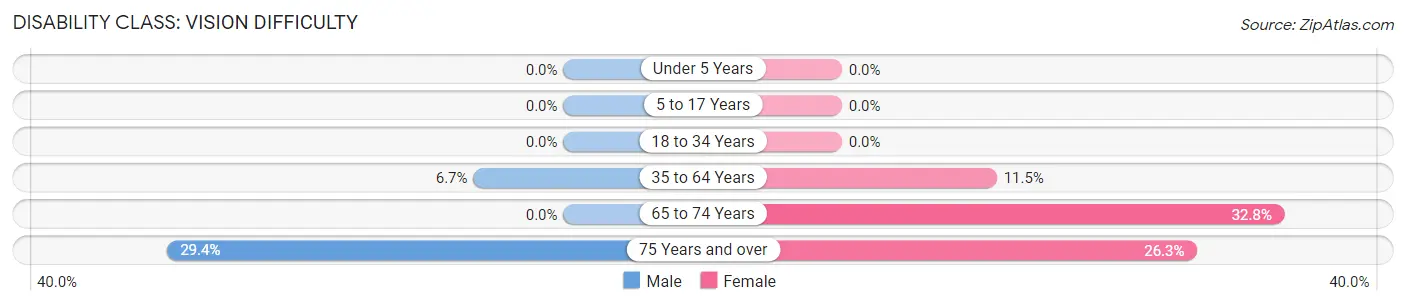
| Age Bracket | Male | Female |
| Under 5 Years | 0 (0.0%) | 0 (0.0%) |
| 5 to 17 Years | 0 (0.0%) | 0 (0.0%) |
| 18 to 34 Years | 0 (0.0%) | 0 (0.0%) |
| 35 to 64 Years | 26 (6.7%) | 36 (11.5%) |
| 65 to 74 Years | 0 (0.0%) | 21 (32.8%) |
| 75 Years and over | 5 (29.4%) | 10 (26.3%) |
Disability Class: Cognitive Difficulty
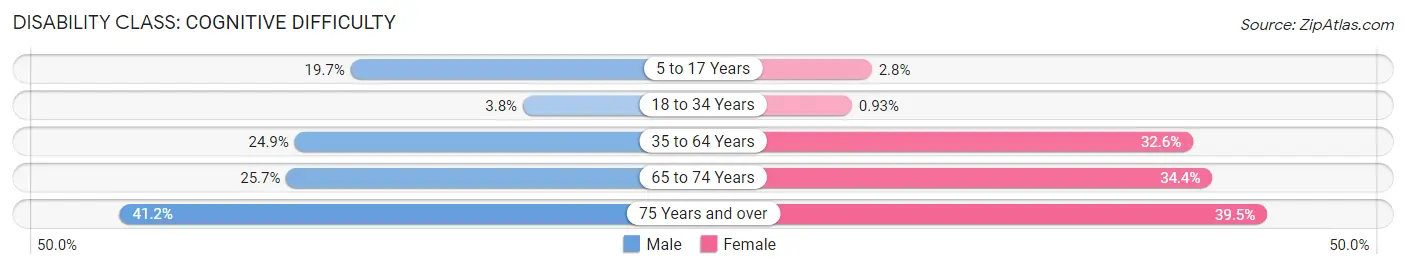
| Age Bracket | Male | Female |
| 5 to 17 Years | 15 (19.7%) | 7 (2.8%) |
| 18 to 34 Years | 9 (3.7%) | 2 (0.9%) |
| 35 to 64 Years | 97 (24.9%) | 102 (32.6%) |
| 65 to 74 Years | 9 (25.7%) | 22 (34.4%) |
| 75 Years and over | 7 (41.2%) | 15 (39.5%) |
Disability Class: Ambulatory Difficulty
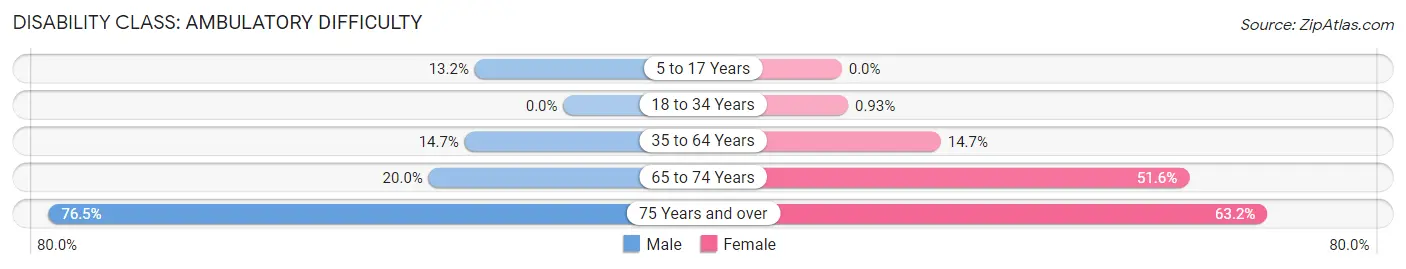
| Age Bracket | Male | Female |
| 5 to 17 Years | 10 (13.2%) | 0 (0.0%) |
| 18 to 34 Years | 0 (0.0%) | 2 (0.9%) |
| 35 to 64 Years | 57 (14.6%) | 46 (14.7%) |
| 65 to 74 Years | 7 (20.0%) | 33 (51.6%) |
| 75 Years and over | 13 (76.5%) | 24 (63.2%) |
Disability Class: Self-Care Difficulty
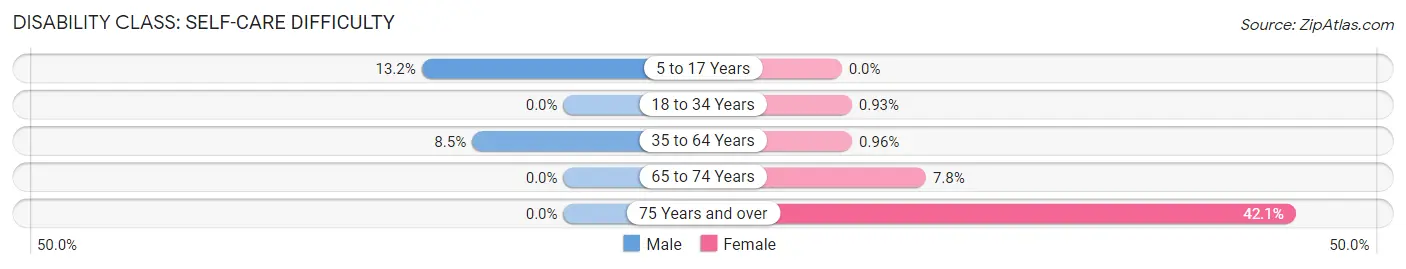
| Age Bracket | Male | Female |
| 5 to 17 Years | 10 (13.2%) | 0 (0.0%) |
| 18 to 34 Years | 0 (0.0%) | 2 (0.9%) |
| 35 to 64 Years | 33 (8.5%) | 3 (1.0%) |
| 65 to 74 Years | 0 (0.0%) | 5 (7.8%) |
| 75 Years and over | 0 (0.0%) | 16 (42.1%) |
Technology Access in Huntsville
Computing Device Access in Huntsville
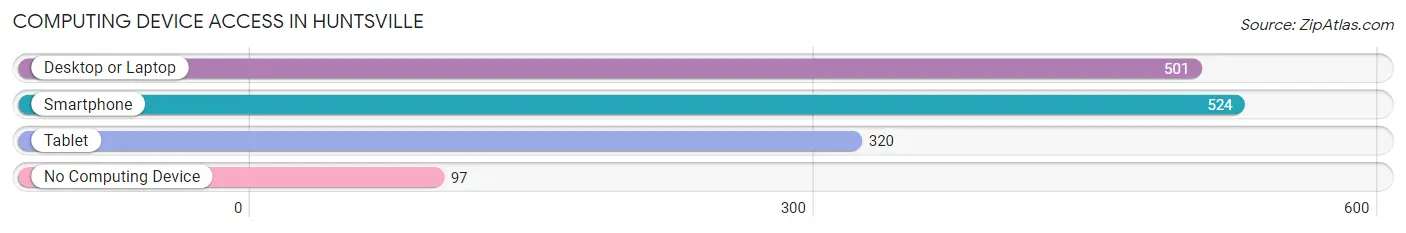
| Device Type | # Households | % Households |
| Desktop or Laptop | 501 | 66.3% |
| Smartphone | 524 | 69.3% |
| Tablet | 320 | 42.3% |
| No Computing Device | 97 | 12.8% |
| Total | 756 | 100.0% |
Internet Access in Huntsville
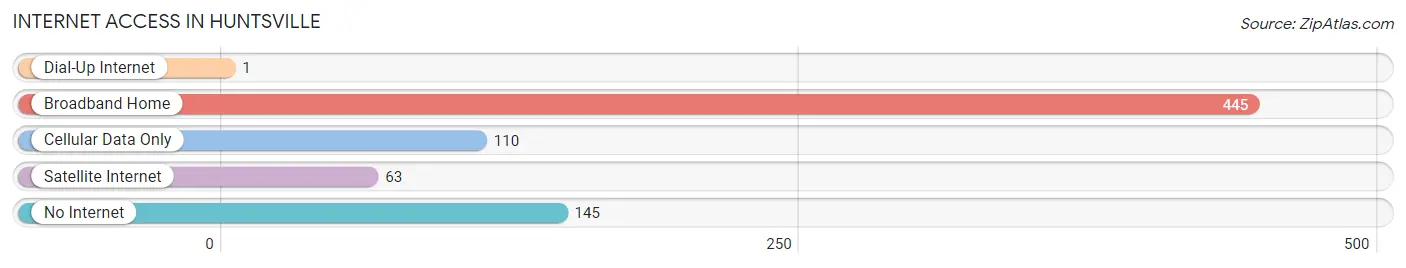
| Internet Type | # Households | % Households |
| Dial-Up Internet | 1 | 0.1% |
| Broadband Home | 445 | 58.9% |
| Cellular Data Only | 110 | 14.5% |
| Satellite Internet | 63 | 8.3% |
| No Internet | 145 | 19.2% |
| Total | 756 | 100.0% |
Huntsville Summary
Huntsville, Tennessee is a small town located in Scott County, Tennessee. It is situated in the foothills of the Great Smoky Mountains and is home to a population of approximately 1,500 people. The town was founded in 1807 and has a rich history of being a rural farming community.
Geography
Huntsville is located in the foothills of the Great Smoky Mountains, approximately 30 miles east of Knoxville. The town is situated in a valley surrounded by hills and mountains, with the Clinch River running through the center of town. The town is located at an elevation of 1,000 feet and has a total area of 1.2 square miles.
Economy
Huntsville’s economy is largely based on agriculture and tourism. The town is home to several farms, which produce a variety of crops, including corn, soybeans, and hay. The town also has a number of small businesses, including restaurants, shops, and a few manufacturing plants. Tourism is also an important part of the local economy, with visitors coming to the area to enjoy the natural beauty of the Great Smoky Mountains.
Demographics
As of the 2010 census, the population of Huntsville was 1,521. The racial makeup of the town was 95.3% White, 0.7% African American, 0.2% Native American, 0.2% Asian, 0.1% Pacific Islander, and 3.5% from other races. The median household income was $30,938, and the median family income was $37,813. The per capita income was $17,845.
History
Huntsville was founded in 1807 by a group of settlers from North Carolina. The town was named after a local settler, John Hunt, who was the first to settle in the area. The town quickly grew and became a thriving farming community. In the late 1800s, the town was home to several mills, which provided employment for many of the town’s residents.
In the early 1900s, the town began to decline as the local economy shifted away from agriculture. The town’s population began to decline, and by the 1950s, the town had become a virtual ghost town. In the late 1970s, the town began to experience a resurgence as people began to move back to the area. Today, Huntsville is a small but vibrant community, with a strong sense of community and a commitment to preserving its rural heritage.
Common Questions
What is Per Capita Income in Huntsville?
Per Capita income in Huntsville is $16,595.
What is the Median Family Income in Huntsville?
Median Family Income in Huntsville is $31,685.
What is the Median Household income in Huntsville?
Median Household Income in Huntsville is $28,750.
What is Income or Wage Gap in Huntsville?
Income or Wage Gap in Huntsville is 0.3%.
Women in Huntsville earn 99.7 cents for every dollar earned by a man.
What is Family Income Deficit in Huntsville?
Family Income Deficit in Huntsville is $7,660.
Families that are below poverty line in Huntsville earn $7,660 less on average than the poverty threshold level.
What is Inequality or Gini Index in Huntsville?
Inequality or Gini Index in Huntsville is 0.44.
What is the Total Population of Huntsville?
Total Population of Huntsville is 1,889.
What is the Total Male Population of Huntsville?
Total Male Population of Huntsville is 899.
What is the Total Female Population of Huntsville?
Total Female Population of Huntsville is 990.
What is the Ratio of Males per 100 Females in Huntsville?
There are 90.81 Males per 100 Females in Huntsville.
What is the Ratio of Females per 100 Males in Huntsville?
There are 110.12 Females per 100 Males in Huntsville.
What is the Median Population Age in Huntsville?
Median Population Age in Huntsville is 41.1 Years.
What is the Average Family Size in Huntsville
Average Family Size in Huntsville is 3.1 People.
What is the Average Household Size in Huntsville
Average Household Size in Huntsville is 2.2 People.
How Large is the Labor Force in Huntsville?
There are 687 People in the Labor Forcein in Huntsville.
What is the Percentage of People in the Labor Force in Huntsville?
42.7% of People are in the Labor Force in Huntsville.
What is the Unemployment Rate in Huntsville?
Unemployment Rate in Huntsville is 12.4%.