Huntland, TN Map & Demographics
Huntland Map
Huntland Overview
$25,762
PER CAPITA INCOME
$66,806
AVG FAMILY INCOME
$62,778
AVG HOUSEHOLD INCOME
14.4%
WAGE / INCOME GAP [ % ]
85.6¢/ $1
WAGE / INCOME GAP [ $ ]
0.39
INEQUALITY / GINI INDEX
1,218
TOTAL POPULATION
640
MALE POPULATION
578
FEMALE POPULATION
110.73
MALES / 100 FEMALES
90.31
FEMALES / 100 MALES
35.4
MEDIAN AGE
3.6
AVG FAMILY SIZE
3.0
AVG HOUSEHOLD SIZE
492
LABOR FORCE [ PEOPLE ]
55.2%
PERCENT IN LABOR FORCE
1.4%
UNEMPLOYMENT RATE
Huntland Zip Codes
Huntland Area Codes
Income in Huntland
Income Overview in Huntland
Per Capita Income in Huntland is $25,762, while median incomes of families and households are $66,806 and $62,778 respectively.
| Characteristic | Number | Measure |
| Per Capita Income | 1,218 | $25,762 |
| Median Family Income | 299 | $66,806 |
| Mean Family Income | 299 | $83,649 |
| Median Household Income | 408 | $62,778 |
| Mean Household Income | 408 | $72,197 |
| Income Deficit | 299 | $0 |
| Wage / Income Gap (%) | 1,218 | 14.40% |
| Wage / Income Gap ($) | 1,218 | 85.60¢ per $1 |
| Gini / Inequality Index | 1,218 | 0.39 |
Earnings by Sex in Huntland
Average Earnings in Huntland are $39,327, $41,563 for men and $35,577 for women, a difference of 14.4%.
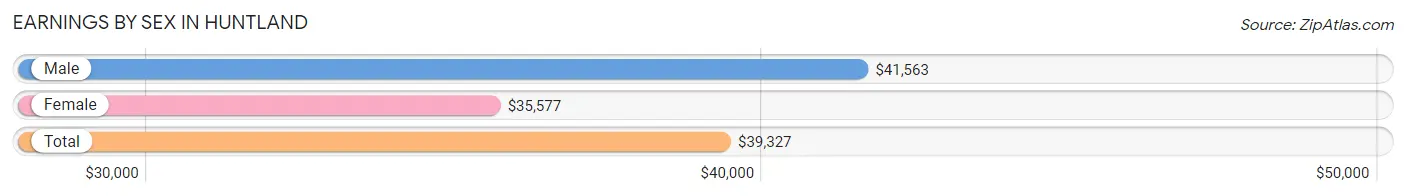
| Sex | Number | Average Earnings |
| Male | 279 (50.6%) | $41,563 |
| Female | 272 (49.4%) | $35,577 |
| Total | 551 (100.0%) | $39,327 |
Earnings by Sex by Income Bracket in Huntland
The most common earnings brackets in Huntland are $45,000 to $49,999 for men (46 | 16.5%) and $100,000+ for women (42 | 15.4%).
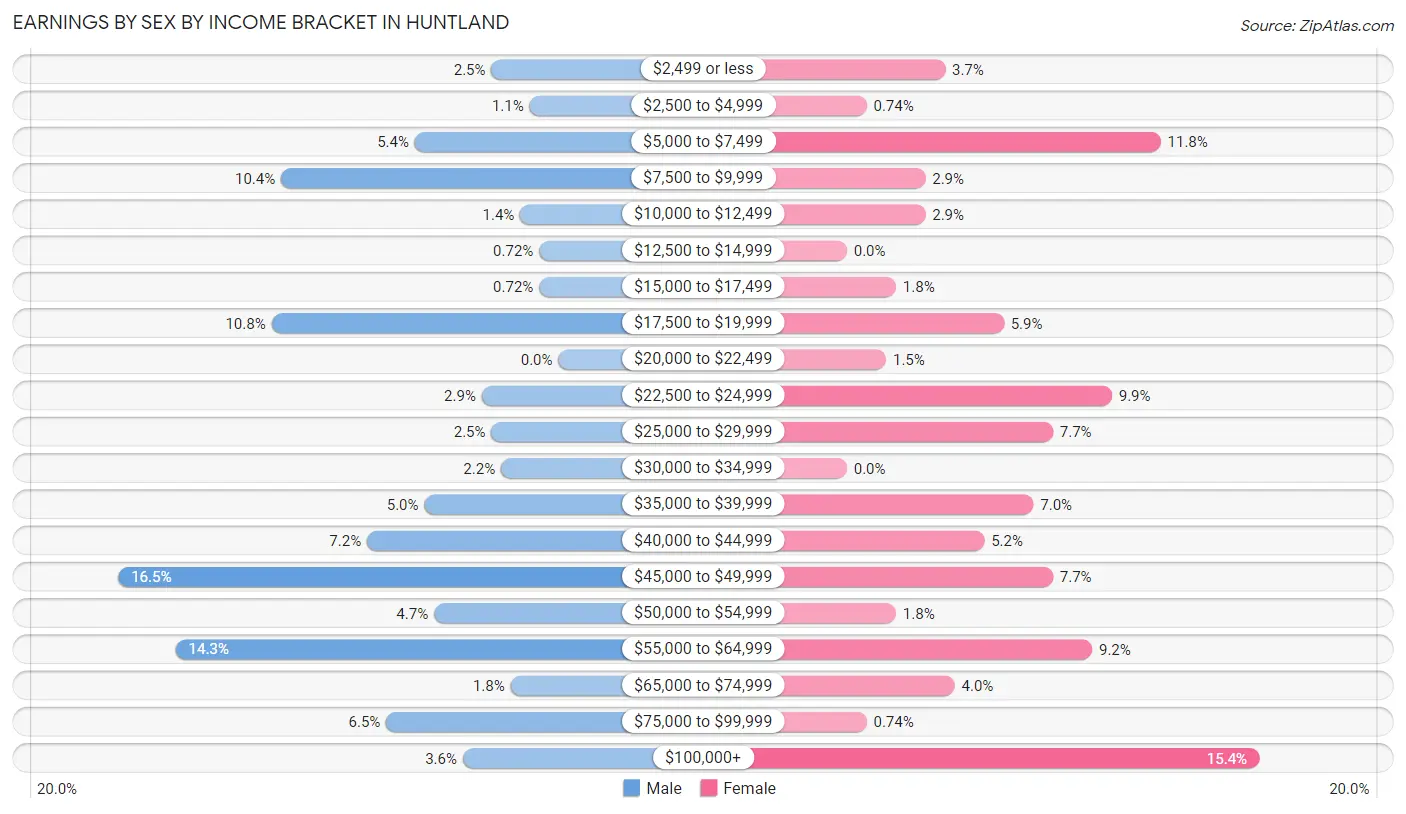
| Income | Male | Female |
| $2,499 or less | 7 (2.5%) | 10 (3.7%) |
| $2,500 to $4,999 | 3 (1.1%) | 2 (0.7%) |
| $5,000 to $7,499 | 15 (5.4%) | 32 (11.8%) |
| $7,500 to $9,999 | 29 (10.4%) | 8 (2.9%) |
| $10,000 to $12,499 | 4 (1.4%) | 8 (2.9%) |
| $12,500 to $14,999 | 2 (0.7%) | 0 (0.0%) |
| $15,000 to $17,499 | 2 (0.7%) | 5 (1.8%) |
| $17,500 to $19,999 | 30 (10.7%) | 16 (5.9%) |
| $20,000 to $22,499 | 0 (0.0%) | 4 (1.5%) |
| $22,500 to $24,999 | 8 (2.9%) | 27 (9.9%) |
| $25,000 to $29,999 | 7 (2.5%) | 21 (7.7%) |
| $30,000 to $34,999 | 6 (2.1%) | 0 (0.0%) |
| $35,000 to $39,999 | 14 (5.0%) | 19 (7.0%) |
| $40,000 to $44,999 | 20 (7.2%) | 14 (5.1%) |
| $45,000 to $49,999 | 46 (16.5%) | 21 (7.7%) |
| $50,000 to $54,999 | 13 (4.7%) | 5 (1.8%) |
| $55,000 to $64,999 | 40 (14.3%) | 25 (9.2%) |
| $65,000 to $74,999 | 5 (1.8%) | 11 (4.0%) |
| $75,000 to $99,999 | 18 (6.5%) | 2 (0.7%) |
| $100,000+ | 10 (3.6%) | 42 (15.4%) |
| Total | 279 (100.0%) | 272 (100.0%) |
Earnings by Sex by Educational Attainment in Huntland
Average earnings in Huntland are $45,594 for men and $38,125 for women, a difference of 16.4%. Men with an educational attainment of college or associate's degree enjoy the highest average annual earnings of $53,750, while those with bachelor's degree education earn the least with $42,321. Women with an educational attainment of college or associate's degree earn the most with the average annual earnings of $50,000, while those with high school diploma education have the smallest earnings of $23,929.
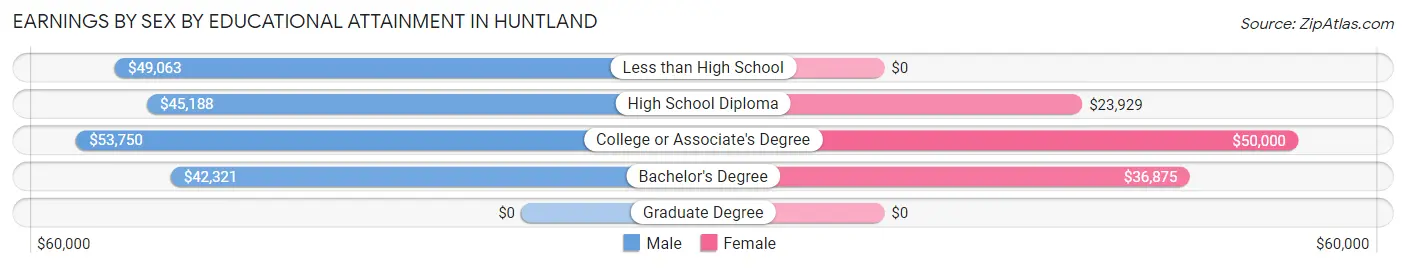
| Educational Attainment | Male Income | Female Income |
| Less than High School | $49,063 | $0 |
| High School Diploma | $45,188 | $23,929 |
| College or Associate's Degree | $53,750 | $50,000 |
| Bachelor's Degree | $42,321 | $36,875 |
| Graduate Degree | - | - |
| Total | $45,594 | $38,125 |
Family Income in Huntland
Family Income Brackets in Huntland
According to the Huntland family income data, there are 71 families falling into the $75,000 to $99,999 income range, which is the most common income bracket and makes up 23.7% of all families. Conversely, the $200,000+ income bracket is the least frequent group with only 3 families (1.0%) belonging to this category.
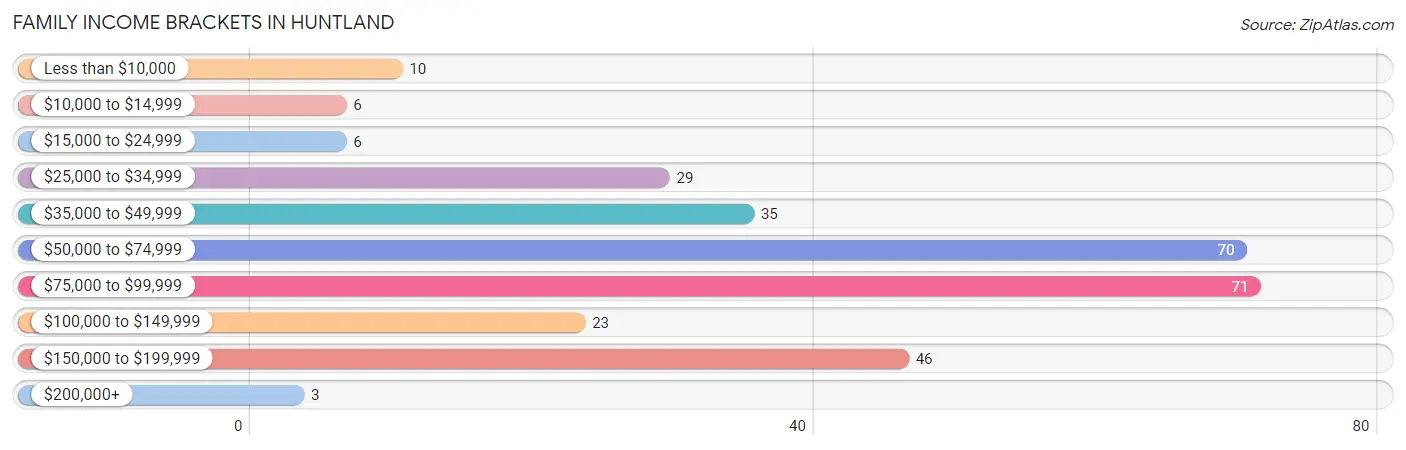
| Income Bracket | # Families | % Families |
| Less than $10,000 | 10 | 3.3% |
| $10,000 to $14,999 | 6 | 2.0% |
| $15,000 to $24,999 | 6 | 2.0% |
| $25,000 to $34,999 | 29 | 9.7% |
| $35,000 to $49,999 | 35 | 11.7% |
| $50,000 to $74,999 | 70 | 23.4% |
| $75,000 to $99,999 | 71 | 23.7% |
| $100,000 to $149,999 | 23 | 7.7% |
| $150,000 to $199,999 | 46 | 15.4% |
| $200,000+ | 3 | 1.0% |
Family Income by Famaliy Size in Huntland
6-person families (51 | 17.1%) account for the highest median family income in Huntland with $190,508 per family, while 6-person families (51 | 17.1%) have the highest median income of $31,751 per family member.
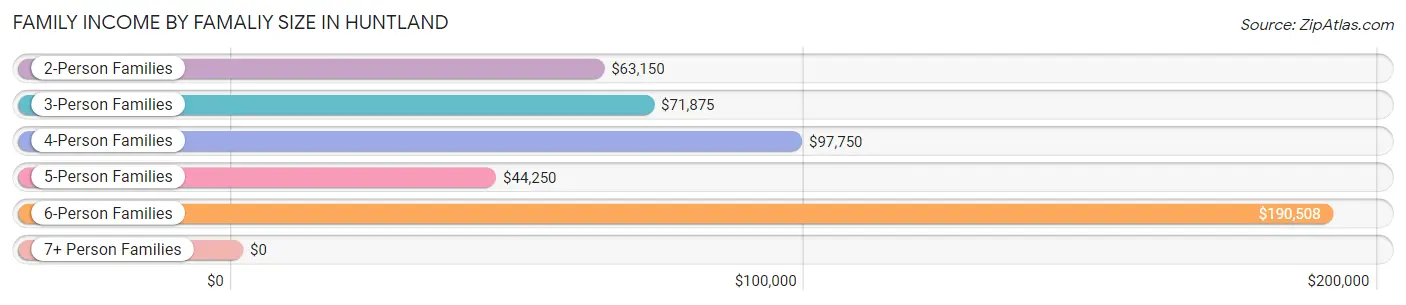
| Income Bracket | # Families | Median Income |
| 2-Person Families | 87 (29.1%) | $63,150 |
| 3-Person Families | 83 (27.8%) | $71,875 |
| 4-Person Families | 56 (18.7%) | $97,750 |
| 5-Person Families | 22 (7.4%) | $44,250 |
| 6-Person Families | 51 (17.1%) | $190,508 |
| 7+ Person Families | 0 (0.0%) | $0 |
| Total | 299 (100.0%) | $66,806 |
Family Income by Number of Earners in Huntland
The median family income in Huntland is $66,806, with families comprising 3+ earners (38) having the highest median family income of $191,016, while families with no earners (36) have the lowest median family income of $31,667, accounting for 12.7% and 12.0% of families, respectively.
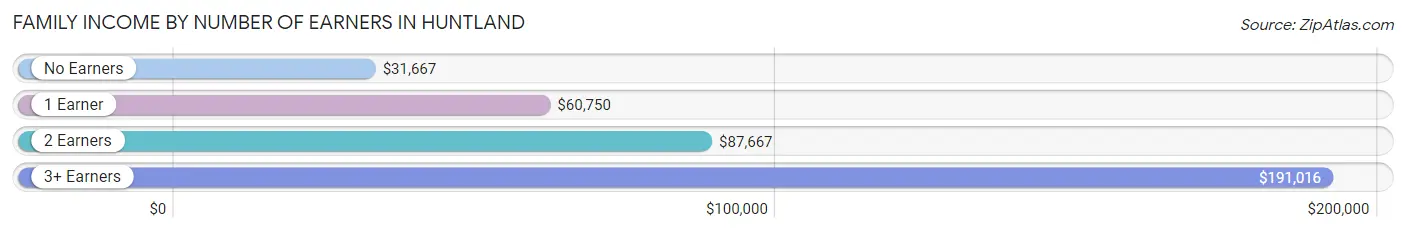
| Number of Earners | # Families | Median Income |
| No Earners | 36 (12.0%) | $31,667 |
| 1 Earner | 121 (40.5%) | $60,750 |
| 2 Earners | 104 (34.8%) | $87,667 |
| 3+ Earners | 38 (12.7%) | $191,016 |
| Total | 299 (100.0%) | $66,806 |
Household Income in Huntland
Household Income Brackets in Huntland
With 78 households falling in the category, the $75,000 to $99,999 income range is the most frequent in Huntland, accounting for 19.1% of all households. In contrast, only 3 households (0.7%) fall into the $200,000+ income bracket, making it the least populous group.
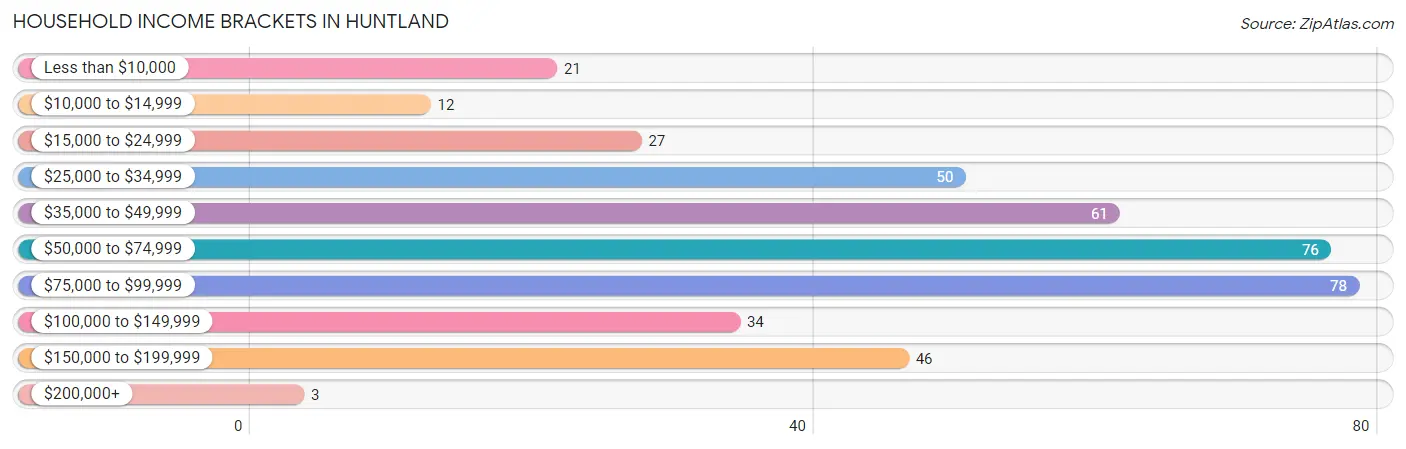
| Income Bracket | # Households | % Households |
| Less than $10,000 | 21 | 5.1% |
| $10,000 to $14,999 | 12 | 2.9% |
| $15,000 to $24,999 | 27 | 6.6% |
| $25,000 to $34,999 | 50 | 12.3% |
| $35,000 to $49,999 | 61 | 15.0% |
| $50,000 to $74,999 | 76 | 18.6% |
| $75,000 to $99,999 | 78 | 19.1% |
| $100,000 to $149,999 | 34 | 8.3% |
| $150,000 to $199,999 | 46 | 11.3% |
| $200,000+ | 3 | 0.7% |
Household Income by Householder Age in Huntland
The median household income in Huntland is $62,778, with the highest median household income of $88,750 found in the 15 to 24 years age bracket for the primary householder. A total of 10 households (2.5%) fall into this category. Meanwhile, the 65+ years age bracket for the primary householder has the lowest median household income of $48,125, with 136 households (33.3%) in this group.
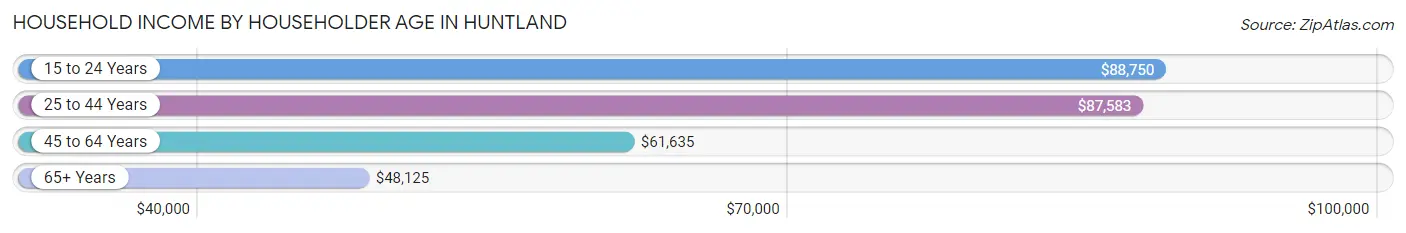
| Income Bracket | # Households | Median Income |
| 15 to 24 Years | 10 (2.5%) | $88,750 |
| 25 to 44 Years | 157 (38.5%) | $87,583 |
| 45 to 64 Years | 105 (25.7%) | $61,635 |
| 65+ Years | 136 (33.3%) | $48,125 |
| Total | 408 (100.0%) | $62,778 |
Poverty in Huntland
Income Below Poverty by Sex and Age in Huntland
With 7.2% poverty level for males and 5.7% for females among the residents of Huntland, 12 to 14 year old males and 55 to 64 year old females are the most vulnerable to poverty, with 15 males (25.4%) and 13 females (20.3%) in their respective age groups living below the poverty level.
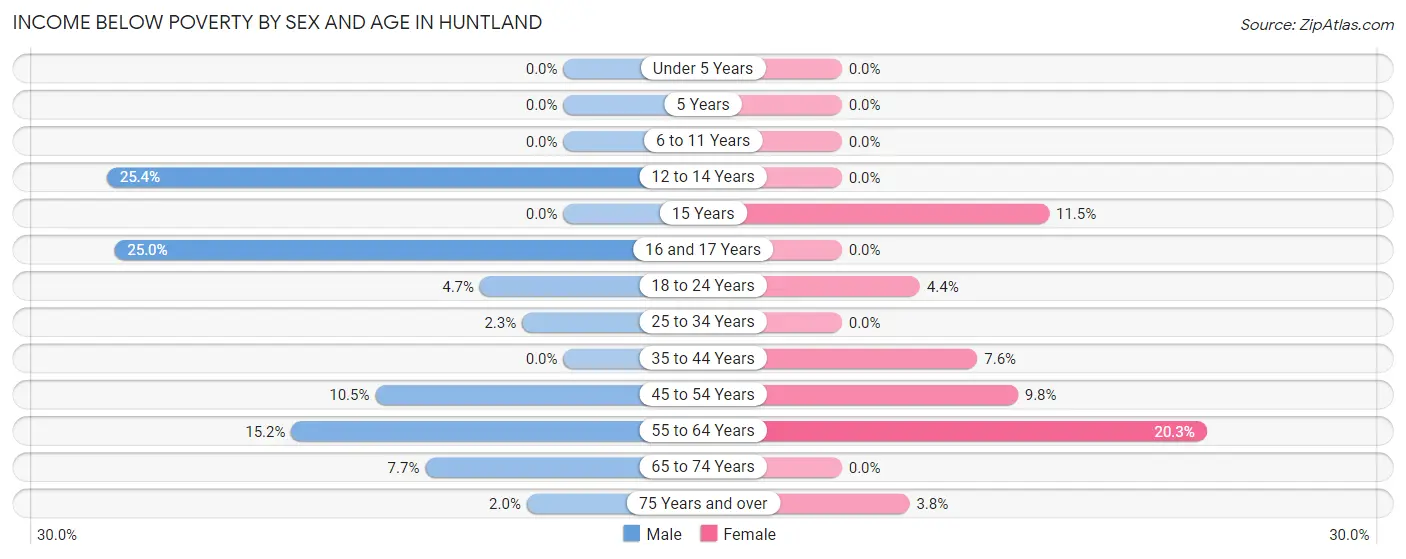
| Age Bracket | Male | Female |
| Under 5 Years | 0 (0.0%) | 0 (0.0%) |
| 5 Years | 0 (0.0%) | 0 (0.0%) |
| 6 to 11 Years | 0 (0.0%) | 0 (0.0%) |
| 12 to 14 Years | 15 (25.4%) | 0 (0.0%) |
| 15 Years | 0 (0.0%) | 3 (11.5%) |
| 16 and 17 Years | 5 (25.0%) | 0 (0.0%) |
| 18 to 24 Years | 2 (4.6%) | 2 (4.3%) |
| 25 to 34 Years | 2 (2.3%) | 0 (0.0%) |
| 35 to 44 Years | 0 (0.0%) | 8 (7.5%) |
| 45 to 54 Years | 9 (10.5%) | 5 (9.8%) |
| 55 to 64 Years | 10 (15.1%) | 13 (20.3%) |
| 65 to 74 Years | 2 (7.7%) | 0 (0.0%) |
| 75 Years and over | 1 (2.0%) | 2 (3.8%) |
| Total | 46 (7.2%) | 33 (5.7%) |
Income Above Poverty by Sex and Age in Huntland
According to the poverty statistics in Huntland, males aged under 5 years and females aged under 5 years are the age groups that are most secure financially, with 100.0% of males and 100.0% of females in these age groups living above the poverty line.
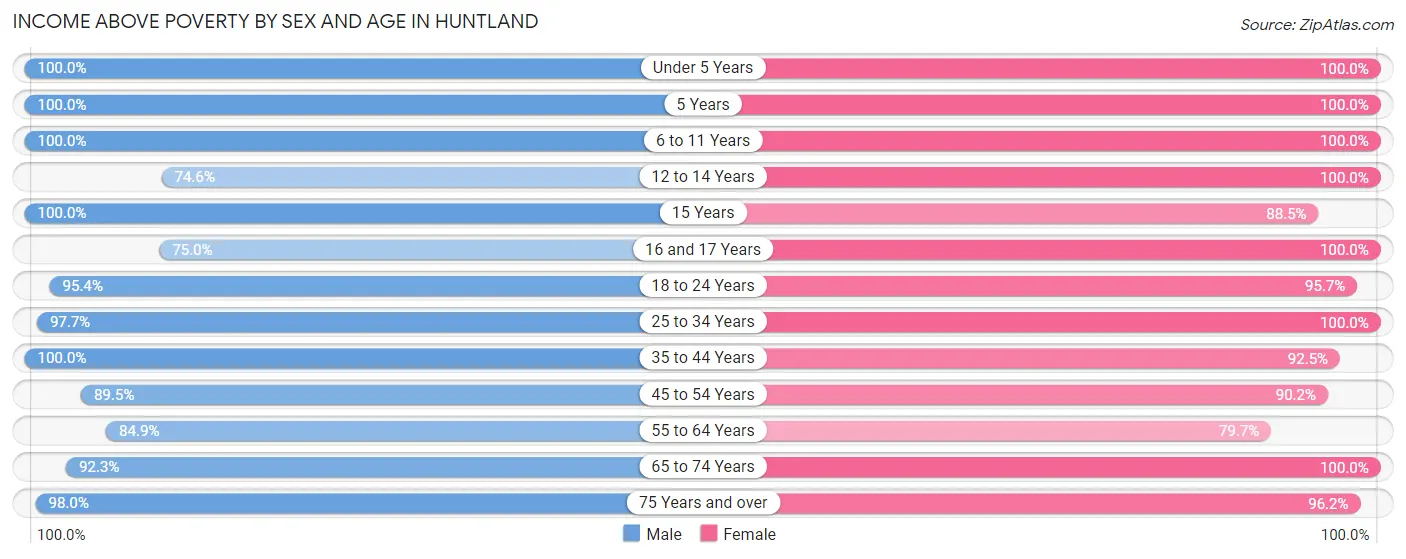
| Age Bracket | Male | Female |
| Under 5 Years | 35 (100.0%) | 9 (100.0%) |
| 5 Years | 6 (100.0%) | 4 (100.0%) |
| 6 to 11 Years | 119 (100.0%) | 36 (100.0%) |
| 12 to 14 Years | 44 (74.6%) | 20 (100.0%) |
| 15 Years | 12 (100.0%) | 23 (88.5%) |
| 16 and 17 Years | 15 (75.0%) | 2 (100.0%) |
| 18 to 24 Years | 41 (95.4%) | 44 (95.7%) |
| 25 to 34 Years | 85 (97.7%) | 76 (100.0%) |
| 35 to 44 Years | 32 (100.0%) | 98 (92.4%) |
| 45 to 54 Years | 77 (89.5%) | 46 (90.2%) |
| 55 to 64 Years | 56 (84.9%) | 51 (79.7%) |
| 65 to 74 Years | 24 (92.3%) | 85 (100.0%) |
| 75 Years and over | 48 (98.0%) | 51 (96.2%) |
| Total | 594 (92.8%) | 545 (94.3%) |
Income Below Poverty Among Married-Couple Families in Huntland
The poverty statistics for married-couple families in Huntland show that 4.1% or 10 of the total 247 families live below the poverty line. Families with no children have the highest poverty rate of 8.3%, comprising of 8 families. On the other hand, families with 3 or 4 children have the lowest poverty rate of 0.0%, which includes 0 families.
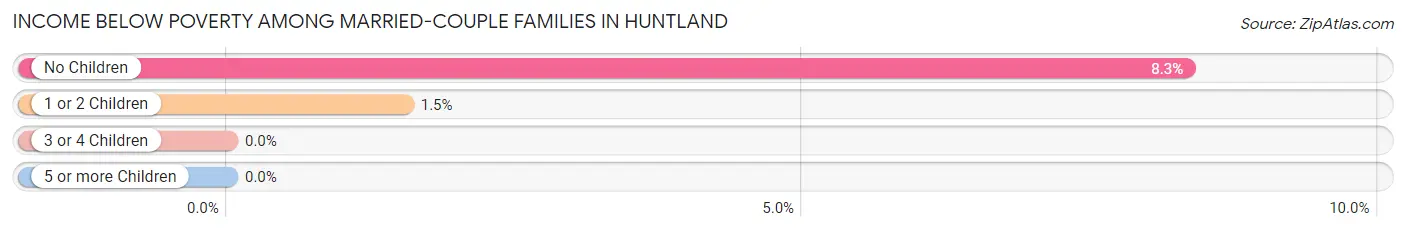
| Children | Above Poverty | Below Poverty |
| No Children | 88 (91.7%) | 8 (8.3%) |
| 1 or 2 Children | 129 (98.5%) | 2 (1.5%) |
| 3 or 4 Children | 20 (100.0%) | 0 (0.0%) |
| 5 or more Children | 0 (0.0%) | 0 (0.0%) |
| Total | 237 (96.0%) | 10 (4.1%) |
Income Below Poverty Among Single-Parent Households in Huntland
According to the poverty data in Huntland, 40.0% or 4 single-father households and 14.3% or 6 single-mother households are living below the poverty line. Among single-father households, those with no children have the highest poverty rate, with 2 households (50.0%) experiencing poverty. Likewise, among single-mother households, those with 1 or 2 children have the highest poverty rate, with 6 households (27.3%) falling below the poverty line.
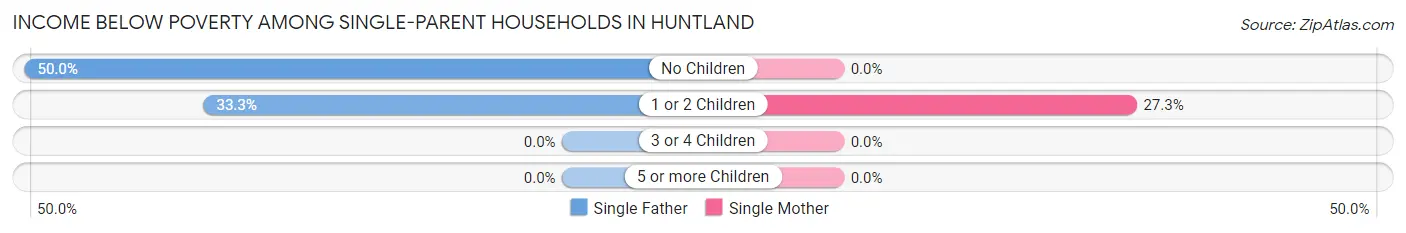
| Children | Single Father | Single Mother |
| No Children | 2 (50.0%) | 0 (0.0%) |
| 1 or 2 Children | 2 (33.3%) | 6 (27.3%) |
| 3 or 4 Children | 0 (0.0%) | 0 (0.0%) |
| 5 or more Children | 0 (0.0%) | 0 (0.0%) |
| Total | 4 (40.0%) | 6 (14.3%) |
Income Below Poverty Among Married-Couple vs Single-Parent Households in Huntland
The poverty data for Huntland shows that 10 of the married-couple family households (4.1%) and 10 of the single-parent households (19.2%) are living below the poverty level. Within the married-couple family households, those with no children have the highest poverty rate, with 8 households (8.3%) falling below the poverty line. Among the single-parent households, those with 1 or 2 children have the highest poverty rate, with 8 household (28.6%) living below poverty.
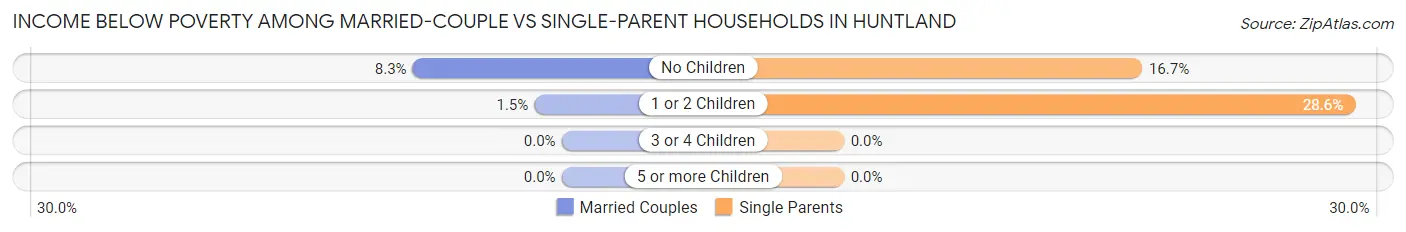
| Children | Married-Couple Families | Single-Parent Households |
| No Children | 8 (8.3%) | 2 (16.7%) |
| 1 or 2 Children | 2 (1.5%) | 8 (28.6%) |
| 3 or 4 Children | 0 (0.0%) | 0 (0.0%) |
| 5 or more Children | 0 (0.0%) | 0 (0.0%) |
| Total | 10 (4.1%) | 10 (19.2%) |
Race in Huntland
The most populous races in Huntland are White / Caucasian (1,144 | 93.9%), Black / African American (54 | 4.4%), and Two or more Races (15 | 1.2%).
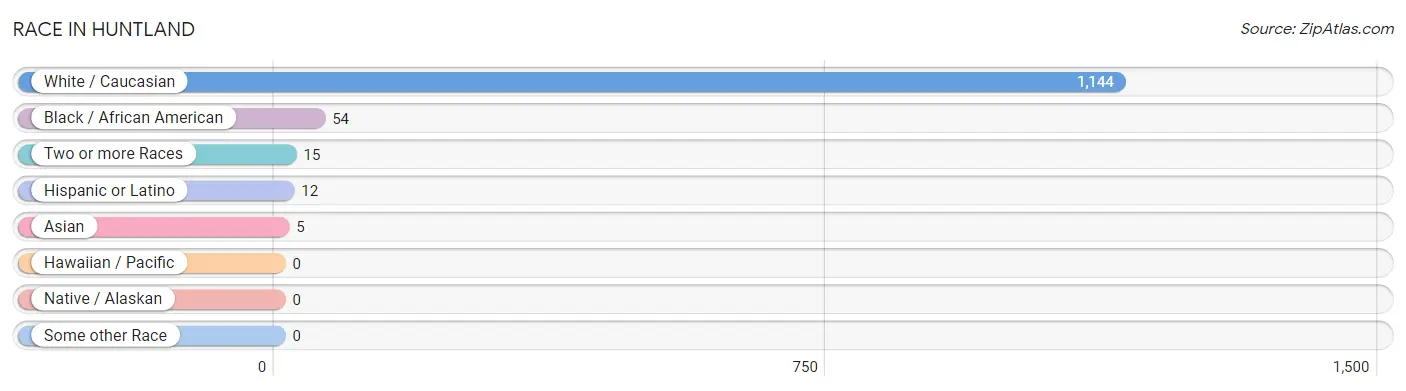
| Race | # Population | % Population |
| Asian | 5 | 0.4% |
| Black / African American | 54 | 4.4% |
| Hawaiian / Pacific | 0 | 0.0% |
| Hispanic or Latino | 12 | 1.0% |
| Native / Alaskan | 0 | 0.0% |
| White / Caucasian | 1,144 | 93.9% |
| Two or more Races | 15 | 1.2% |
| Some other Race | 0 | 0.0% |
| Total | 1,218 | 100.0% |
Ancestry in Huntland
The most populous ancestries reported in Huntland are American (181 | 14.9%), Irish (114 | 9.4%), German (82 | 6.7%), English (69 | 5.7%), and French (58 | 4.8%), together accounting for 41.4% of all Huntland residents.
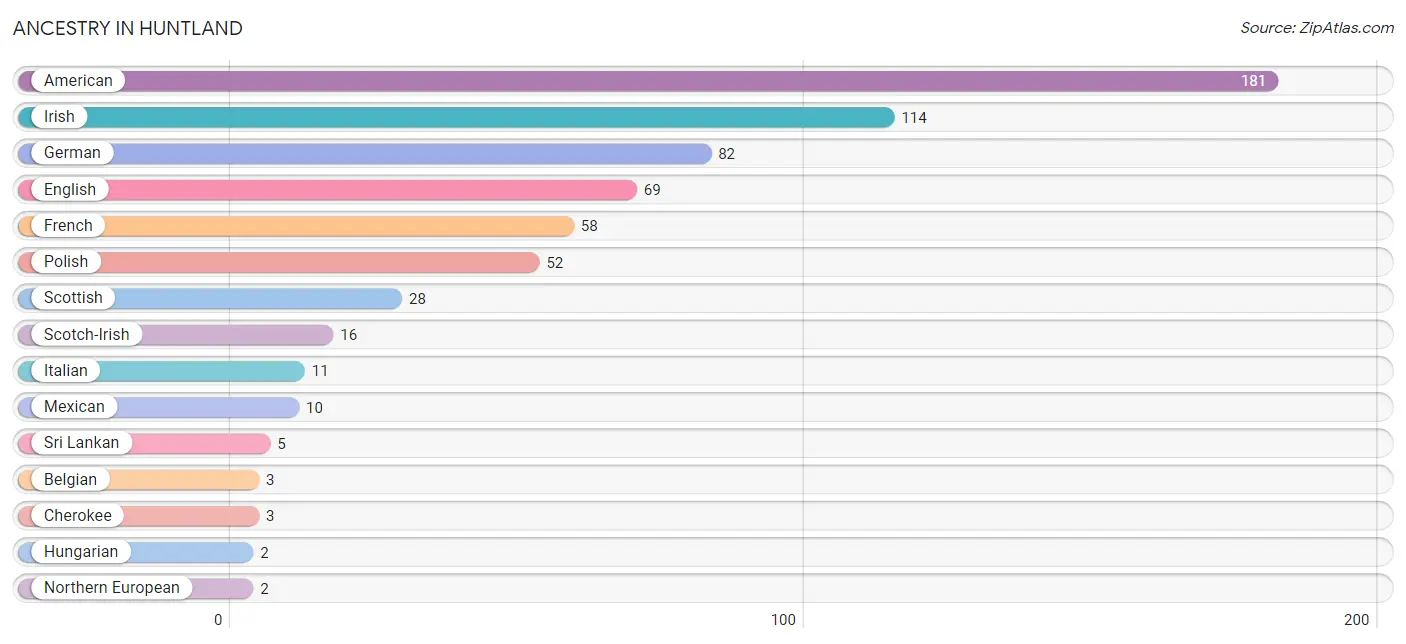
| Ancestry | # Population | % Population |
| American | 181 | 14.9% |
| Belgian | 3 | 0.3% |
| Cherokee | 3 | 0.3% |
| English | 69 | 5.7% |
| French | 58 | 4.8% |
| German | 82 | 6.7% |
| Hungarian | 2 | 0.2% |
| Irish | 114 | 9.4% |
| Italian | 11 | 0.9% |
| Mexican | 10 | 0.8% |
| Northern European | 2 | 0.2% |
| Polish | 52 | 4.3% |
| Russian | 2 | 0.2% |
| Scotch-Irish | 16 | 1.3% |
| Scottish | 28 | 2.3% |
| Spaniard | 2 | 0.2% |
| Sri Lankan | 5 | 0.4% | View All 17 Rows |
Immigrants in Huntland
The most numerous immigrant groups reported in Huntland came from Asia (5 | 0.4%), South Eastern Asia (5 | 0.4%), Vietnam (5 | 0.4%), Europe (3 | 0.3%), and Southern Europe (3 | 0.3%), together accounting for 1.7% of all Huntland residents.
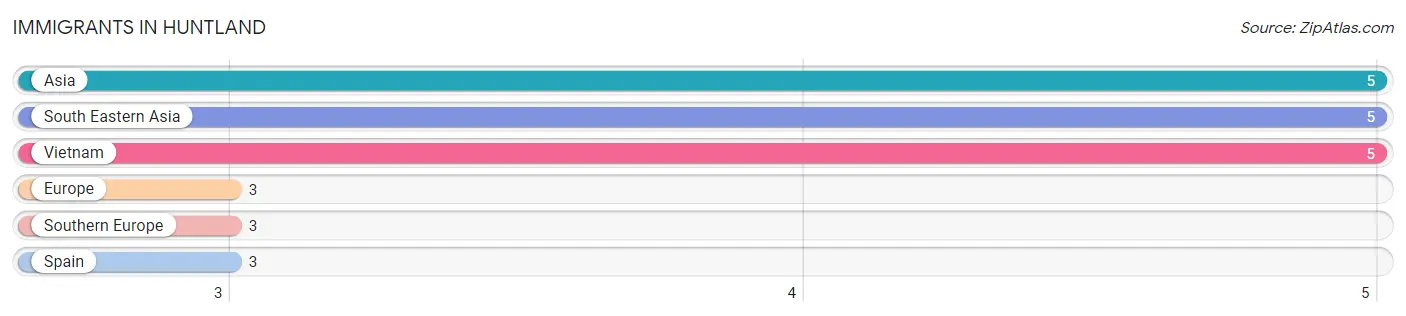
| Immigration Origin | # Population | % Population |
| Asia | 5 | 0.4% |
| Europe | 3 | 0.3% |
| South Eastern Asia | 5 | 0.4% |
| Southern Europe | 3 | 0.3% |
| Spain | 3 | 0.3% |
| Vietnam | 5 | 0.4% | View All 6 Rows |
Sex and Age in Huntland
Sex and Age in Huntland
The most populous age groups in Huntland are 10 to 14 Years (108 | 16.9%) for men and 40 to 44 Years (65 | 11.3%) for women.
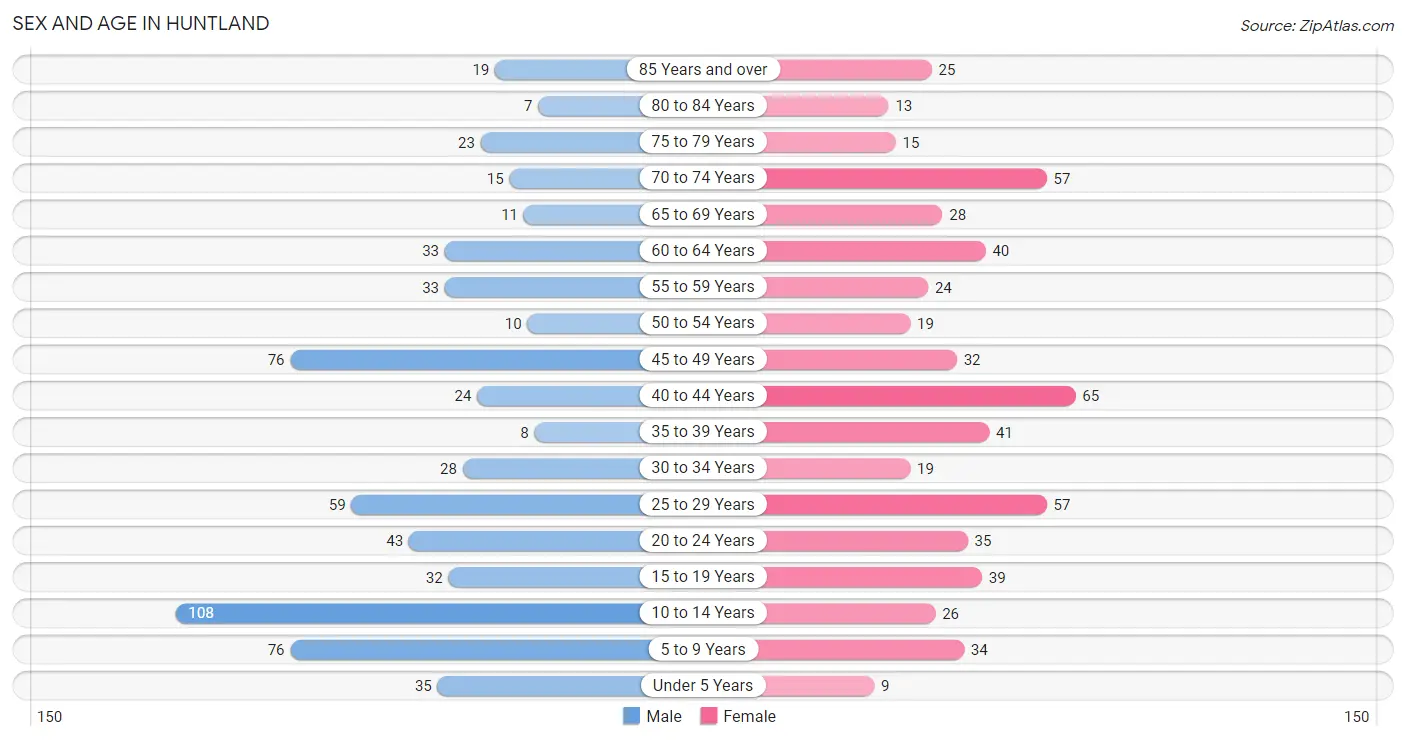
| Age Bracket | Male | Female |
| Under 5 Years | 35 (5.5%) | 9 (1.6%) |
| 5 to 9 Years | 76 (11.9%) | 34 (5.9%) |
| 10 to 14 Years | 108 (16.9%) | 26 (4.5%) |
| 15 to 19 Years | 32 (5.0%) | 39 (6.8%) |
| 20 to 24 Years | 43 (6.7%) | 35 (6.1%) |
| 25 to 29 Years | 59 (9.2%) | 57 (9.9%) |
| 30 to 34 Years | 28 (4.4%) | 19 (3.3%) |
| 35 to 39 Years | 8 (1.3%) | 41 (7.1%) |
| 40 to 44 Years | 24 (3.7%) | 65 (11.3%) |
| 45 to 49 Years | 76 (11.9%) | 32 (5.5%) |
| 50 to 54 Years | 10 (1.6%) | 19 (3.3%) |
| 55 to 59 Years | 33 (5.2%) | 24 (4.2%) |
| 60 to 64 Years | 33 (5.2%) | 40 (6.9%) |
| 65 to 69 Years | 11 (1.7%) | 28 (4.8%) |
| 70 to 74 Years | 15 (2.3%) | 57 (9.9%) |
| 75 to 79 Years | 23 (3.6%) | 15 (2.6%) |
| 80 to 84 Years | 7 (1.1%) | 13 (2.2%) |
| 85 Years and over | 19 (3.0%) | 25 (4.3%) |
| Total | 640 (100.0%) | 578 (100.0%) |
Families and Households in Huntland
Median Family Size in Huntland
The median family size in Huntland is 3.59 persons per family, with single female/mother families (42 | 14.1%) accounting for the largest median family size of 4.57 persons per family. On the other hand, single male/father families (10 | 3.3%) represent the smallest median family size with 2.70 persons per family.
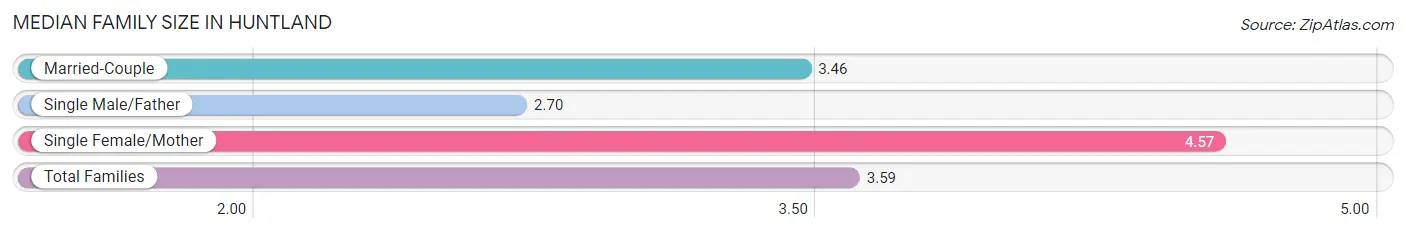
| Family Type | # Families | Family Size |
| Married-Couple | 247 (82.6%) | 3.46 |
| Single Male/Father | 10 (3.3%) | 2.70 |
| Single Female/Mother | 42 (14.1%) | 4.57 |
| Total Families | 299 (100.0%) | 3.59 |
Median Household Size in Huntland
The median household size in Huntland is 2.99 persons per household, with single female/mother households (42 | 10.3%) accounting for the largest median household size of 4.64 persons per household. non-family households (109 | 26.7%) represent the smallest median household size with 1.12 persons per household.
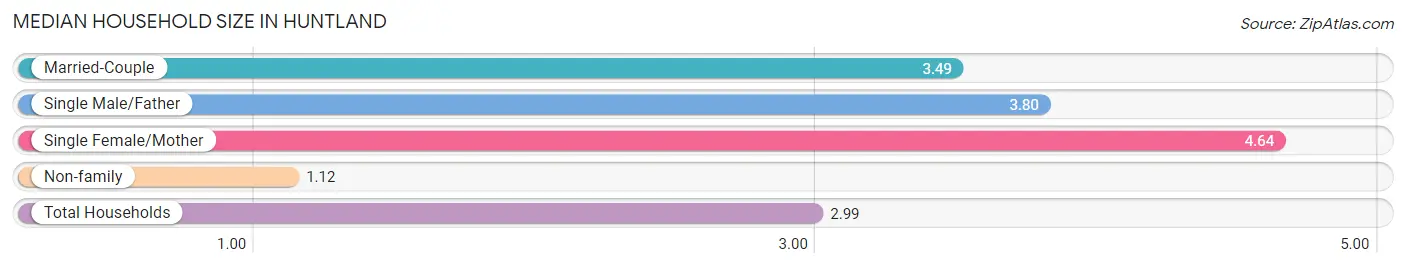
| Household Type | # Households | Household Size |
| Married-Couple | 247 (60.5%) | 3.49 |
| Single Male/Father | 10 (2.5%) | 3.80 |
| Single Female/Mother | 42 (10.3%) | 4.64 |
| Non-family | 109 (26.7%) | 1.12 |
| Total Households | 408 (100.0%) | 2.99 |
Household Size by Marriage Status in Huntland
Out of a total of 408 households in Huntland, 299 (73.3%) are family households, while 109 (26.7%) are nonfamily households. The most numerous type of family households are 3-person households, comprising 84, and the most common type of nonfamily households are 1-person households, comprising 96.
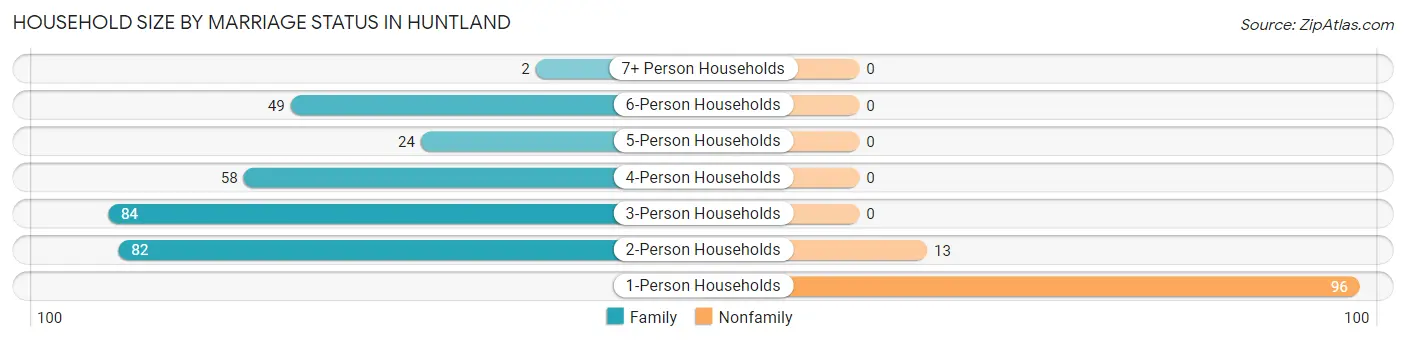
| Household Size | Family Households | Nonfamily Households |
| 1-Person Households | - | 96 (23.5%) |
| 2-Person Households | 82 (20.1%) | 13 (3.2%) |
| 3-Person Households | 84 (20.6%) | 0 (0.0%) |
| 4-Person Households | 58 (14.2%) | 0 (0.0%) |
| 5-Person Households | 24 (5.9%) | 0 (0.0%) |
| 6-Person Households | 49 (12.0%) | 0 (0.0%) |
| 7+ Person Households | 2 (0.5%) | 0 (0.0%) |
| Total | 299 (73.3%) | 109 (26.7%) |
Female Fertility in Huntland
Fertility by Age in Huntland
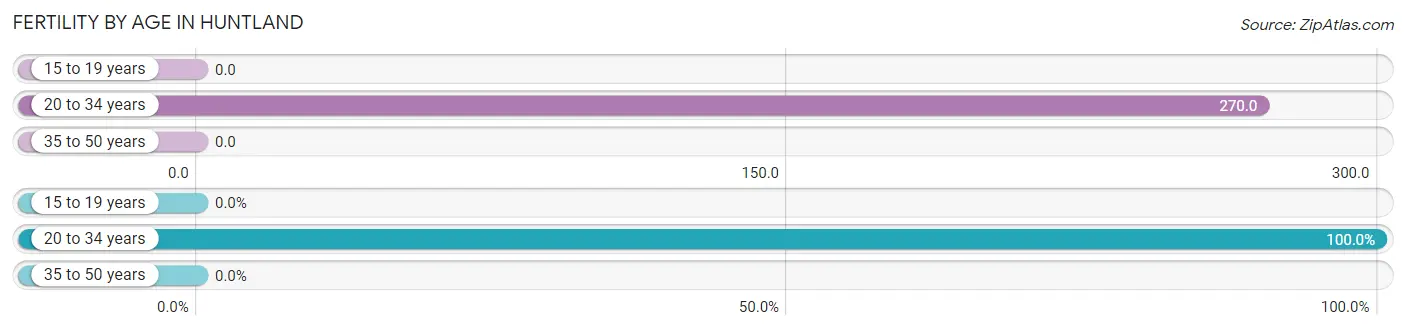
Average fertility rate in Huntland is 103.0 births per 1,000 women. Women in the age bracket of 20 to 34 years have the highest fertility rate with 270.0 births per 1,000 women. Women in the age bracket of 20 to 34 years acount for 100.0% of all women with births.
| Age Bracket | Women with Births | Births / 1,000 Women |
| 15 to 19 years | 0 (0.0%) | 0.0 |
| 20 to 34 years | 30 (100.0%) | 270.0 |
| 35 to 50 years | 0 (0.0%) | 0.0 |
| Total | 30 (100.0%) | 103.0 |
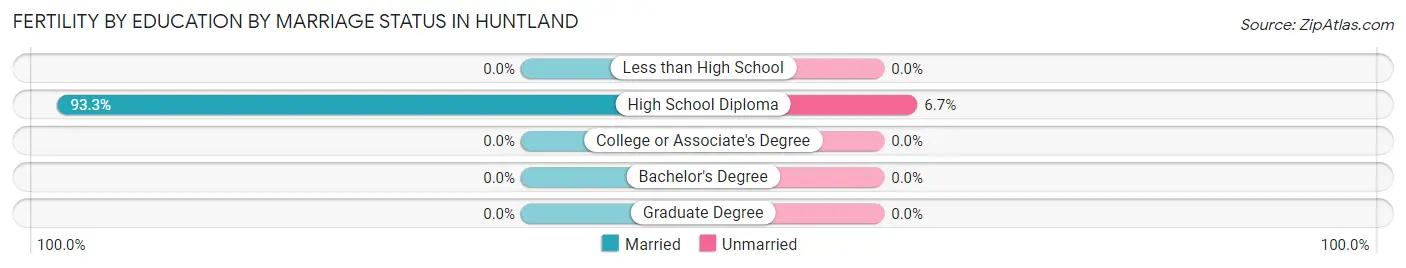
Fertility by Age by Marriage Status in Huntland
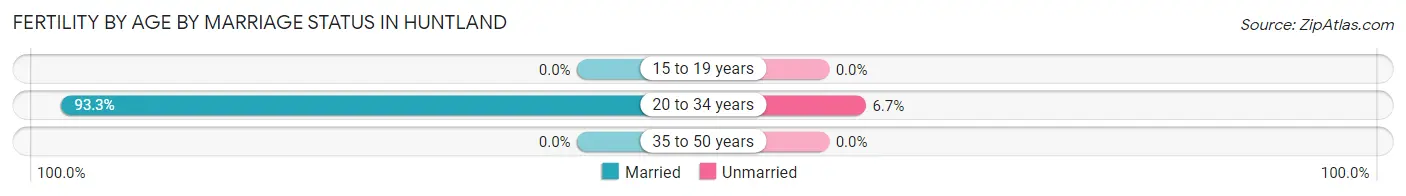
93.3% of women with births (30) in Huntland are married. The highest percentage of unmarried women with births falls into 20 to 34 years age bracket with 6.7% of them unmarried at the time of birth, while the lowest percentage of unmarried women with births belong to 20 to 34 years age bracket with 6.7% of them unmarried.
| Age Bracket | Married | Unmarried |
| 15 to 19 years | 0 (0.0%) | 0 (0.0%) |
| 20 to 34 years | 28 (93.3%) | 2 (6.7%) |
| 35 to 50 years | 0 (0.0%) | 0 (0.0%) |
| Total | 28 (93.3%) | 2 (6.7%) |
Fertility by Education in Huntland
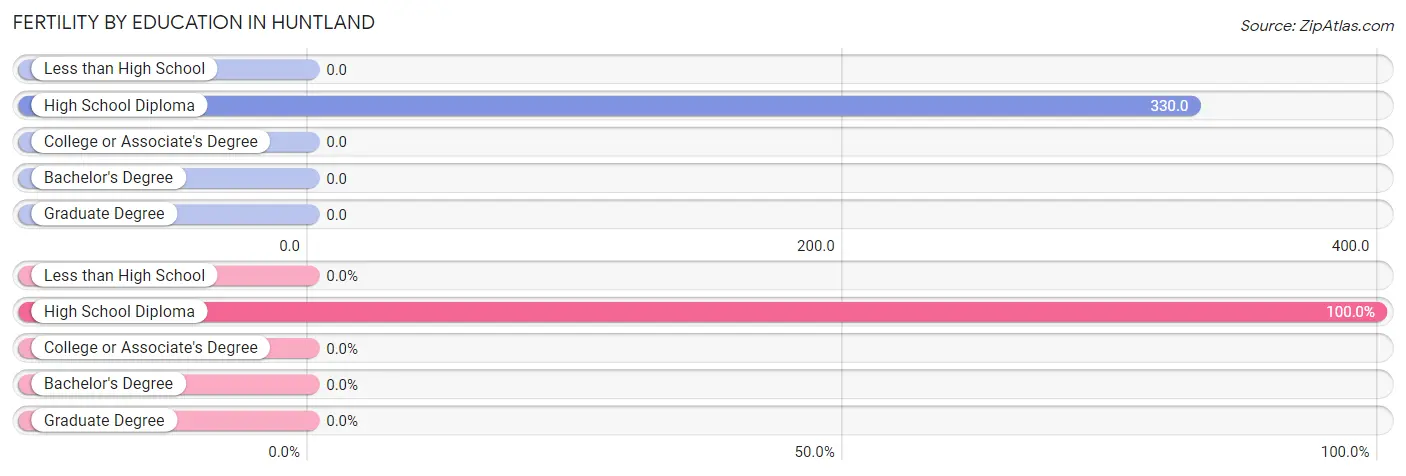
| Educational Attainment | Women with Births | Births / 1,000 Women |
| Less than High School | 0 (0.0%) | 0.0 |
| High School Diploma | 30 (100.0%) | 330.0 |
| College or Associate's Degree | 0 (0.0%) | 0.0 |
| Bachelor's Degree | 0 (0.0%) | 0.0 |
| Graduate Degree | 0 (0.0%) | 0.0 |
| Total | 30 (100.0%) | 103.0 |
Fertility by Education by Marriage Status in Huntland
6.7% of women with births in Huntland are unmarried. Women with the educational attainment of high school diploma are most likely to be married with 93.3% of them married at childbirth, while women with the educational attainment of high school diploma are least likely to be married with 6.7% of them unmarried at childbirth.
| Educational Attainment | Married | Unmarried |
| Less than High School | 0 (0.0%) | 0 (0.0%) |
| High School Diploma | 28 (93.3%) | 2 (6.7%) |
| College or Associate's Degree | 0 (0.0%) | 0 (0.0%) |
| Bachelor's Degree | 0 (0.0%) | 0 (0.0%) |
| Graduate Degree | 0 (0.0%) | 0 (0.0%) |
| Total | 28 (93.3%) | 2 (6.7%) |
Employment Characteristics in Huntland
Employment by Class of Employer in Huntland
Among the 485 employed individuals in Huntland, private company employees (394 | 81.2%), local government employees (25 | 5.1%), and self-employed (not incorporated) (23 | 4.7%) make up the most common classes of employment.
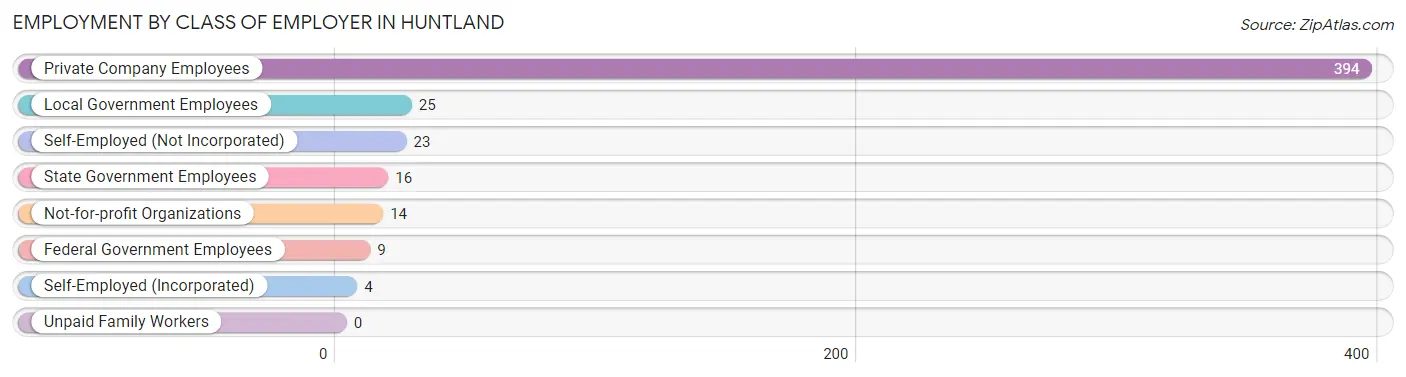
| Employer Class | # Employees | % Employees |
| Private Company Employees | 394 | 81.2% |
| Self-Employed (Incorporated) | 4 | 0.8% |
| Self-Employed (Not Incorporated) | 23 | 4.7% |
| Not-for-profit Organizations | 14 | 2.9% |
| Local Government Employees | 25 | 5.1% |
| State Government Employees | 16 | 3.3% |
| Federal Government Employees | 9 | 1.9% |
| Unpaid Family Workers | 0 | 0.0% |
| Total | 485 | 100.0% |
Employment Status by Age in Huntland
According to the labor force statistics for Huntland, out of the total population over 16 years of age (892), 55.2% or 492 individuals are in the labor force, with 1.4% or 7 of them unemployed. The age group with the highest labor force participation rate is 35 to 44 years, with 98.6% or 136 individuals in the labor force. Within the labor force, the 16 to 19 years age range has the highest percentage of unemployed individuals, with 100.0% or 3 of them being unemployed.
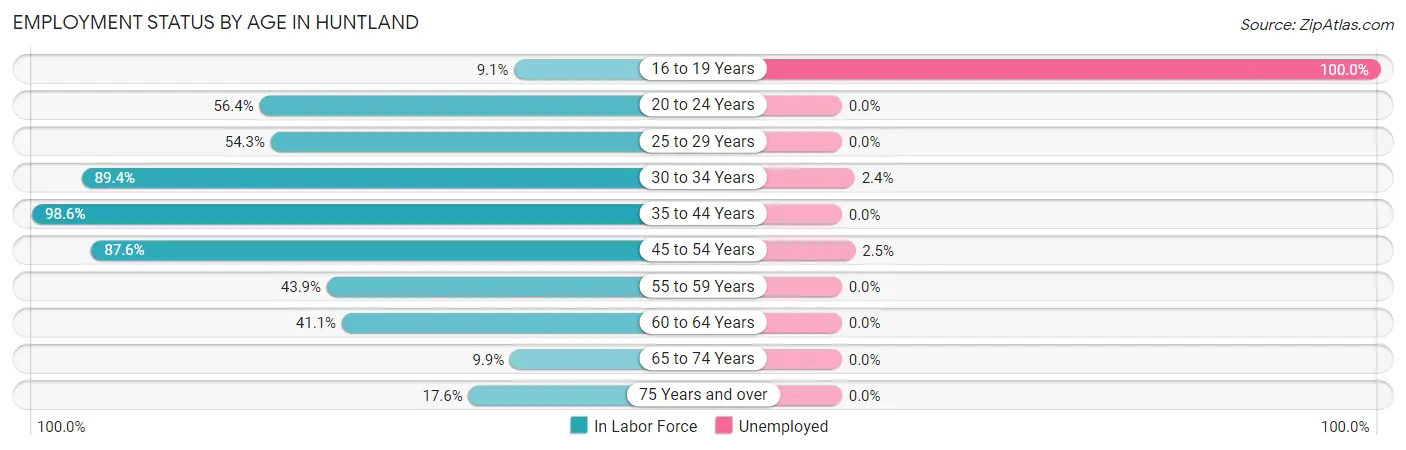
| Age Bracket | In Labor Force | Unemployed |
| 16 to 19 Years | 3 (9.1%) | 3 (100.0%) |
| 20 to 24 Years | 44 (56.4%) | 0 (0.0%) |
| 25 to 29 Years | 63 (54.3%) | 0 (0.0%) |
| 30 to 34 Years | 42 (89.4%) | 1 (2.4%) |
| 35 to 44 Years | 136 (98.6%) | 0 (0.0%) |
| 45 to 54 Years | 120 (87.6%) | 3 (2.5%) |
| 55 to 59 Years | 25 (43.9%) | 0 (0.0%) |
| 60 to 64 Years | 30 (41.1%) | 0 (0.0%) |
| 65 to 74 Years | 11 (9.9%) | 0 (0.0%) |
| 75 Years and over | 18 (17.6%) | 0 (0.0%) |
| Total | 492 (55.2%) | 7 (1.4%) |
Employment Status by Educational Attainment in Huntland
According to labor force statistics for Huntland, 73.2% of individuals (416) out of the total population between 25 and 64 years of age (568) are in the labor force, with 1.0% or 4 of them being unemployed. The group with the highest labor force participation rate are those with the educational attainment of college / associate degree, with 93.8% or 166 individuals in the labor force. Within the labor force, individuals with college / associate degree education have the highest percentage of unemployment, with 1.8% or 3 of them being unemployed.
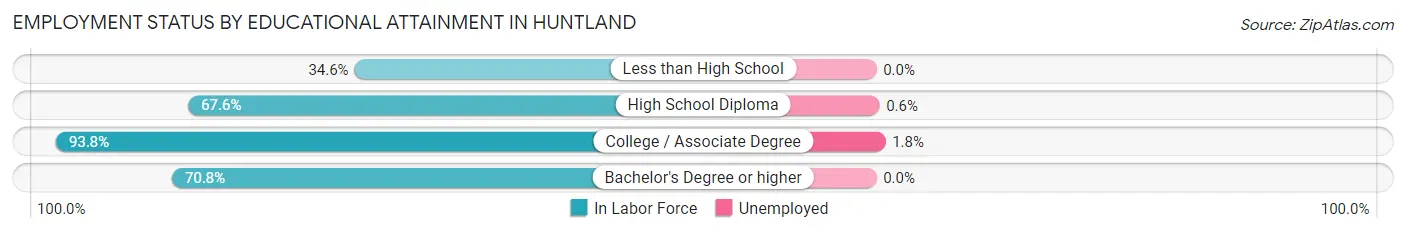
| Educational Attainment | In Labor Force | Unemployed |
| Less than High School | 18 (34.6%) | 0 (0.0%) |
| High School Diploma | 169 (67.6%) | 2 (0.6%) |
| College / Associate Degree | 166 (93.8%) | 3 (1.8%) |
| Bachelor's Degree or higher | 63 (70.8%) | 0 (0.0%) |
| Total | 416 (73.2%) | 6 (1.0%) |
Employment Occupations by Sex in Huntland
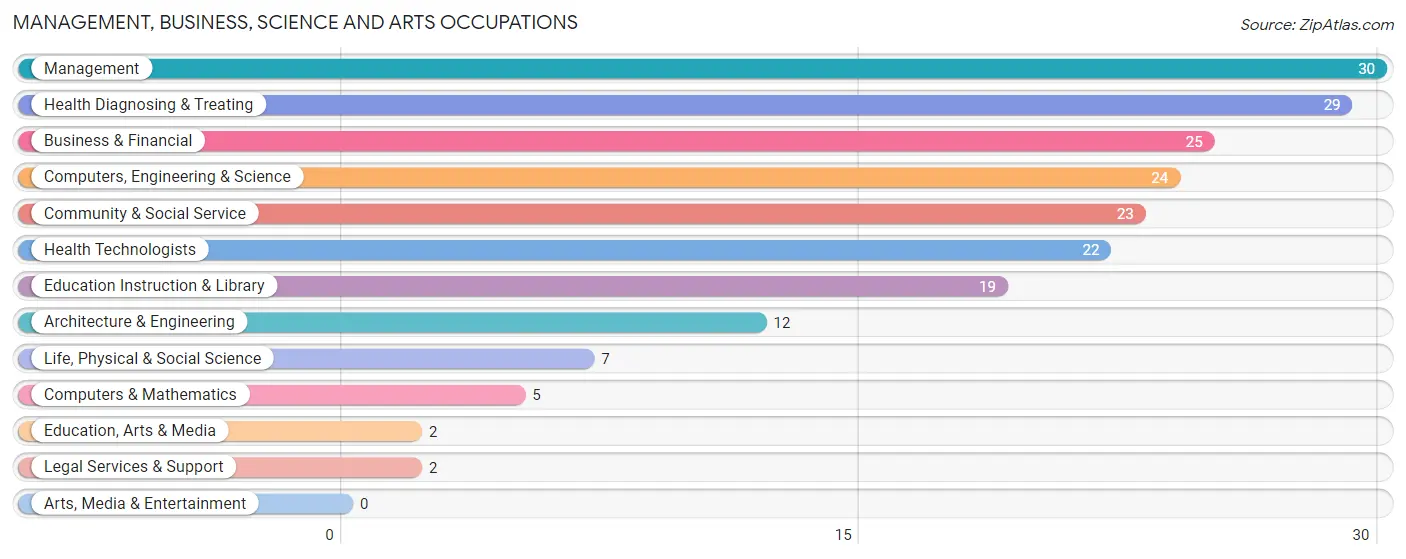
Management, Business, Science and Arts Occupations
The most common Management, Business, Science and Arts occupations in Huntland are Management (30 | 6.2%), Health Diagnosing & Treating (29 | 6.0%), Business & Financial (25 | 5.1%), Computers, Engineering & Science (24 | 5.0%), and Community & Social Service (23 | 4.7%).
Management, Business, Science and Arts Occupations by Sex
Within the Management, Business, Science and Arts occupations in Huntland, the most male-oriented occupations are Computers, Engineering & Science (100.0%), Computers & Mathematics (100.0%), and Architecture & Engineering (100.0%), while the most female-oriented occupations are Education, Arts & Media (100.0%), Legal Services & Support (100.0%), and Health Diagnosing & Treating (100.0%).
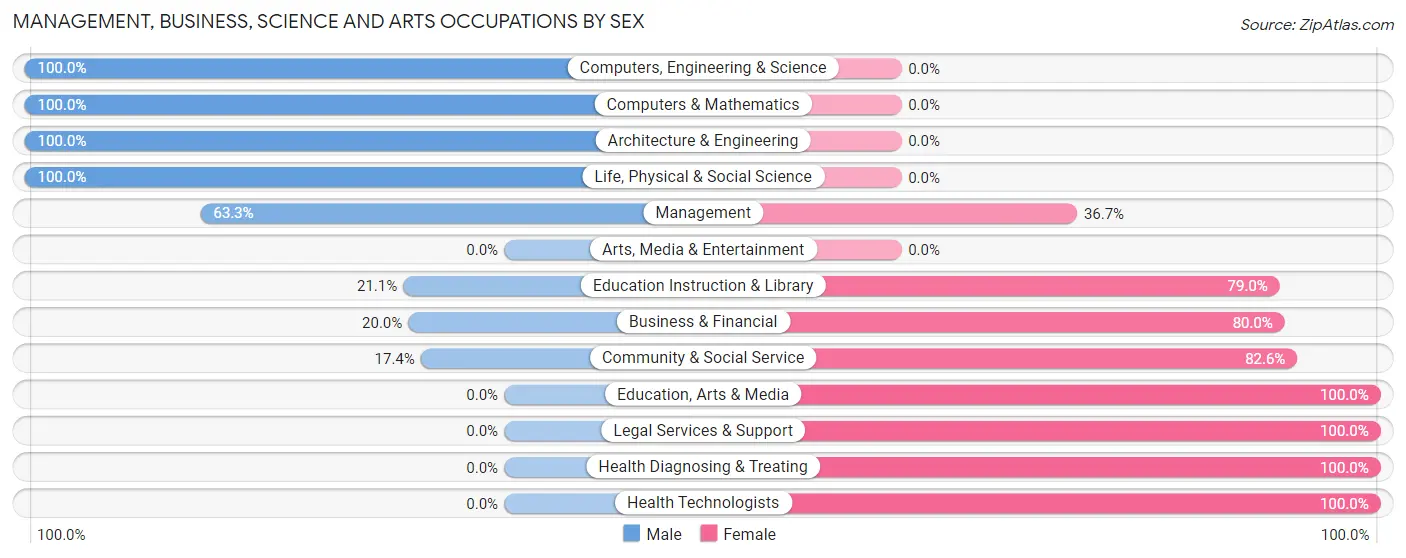
| Occupation | Male | Female |
| Management | 19 (63.3%) | 11 (36.7%) |
| Business & Financial | 5 (20.0%) | 20 (80.0%) |
| Computers, Engineering & Science | 24 (100.0%) | 0 (0.0%) |
| Computers & Mathematics | 5 (100.0%) | 0 (0.0%) |
| Architecture & Engineering | 12 (100.0%) | 0 (0.0%) |
| Life, Physical & Social Science | 7 (100.0%) | 0 (0.0%) |
| Community & Social Service | 4 (17.4%) | 19 (82.6%) |
| Education, Arts & Media | 0 (0.0%) | 2 (100.0%) |
| Legal Services & Support | 0 (0.0%) | 2 (100.0%) |
| Education Instruction & Library | 4 (21.0%) | 15 (78.9%) |
| Arts, Media & Entertainment | 0 (0.0%) | 0 (0.0%) |
| Health Diagnosing & Treating | 0 (0.0%) | 29 (100.0%) |
| Health Technologists | 0 (0.0%) | 22 (100.0%) |
| Total (Category) | 52 (39.7%) | 79 (60.3%) |
| Total (Overall) | 219 (45.2%) | 266 (54.8%) |
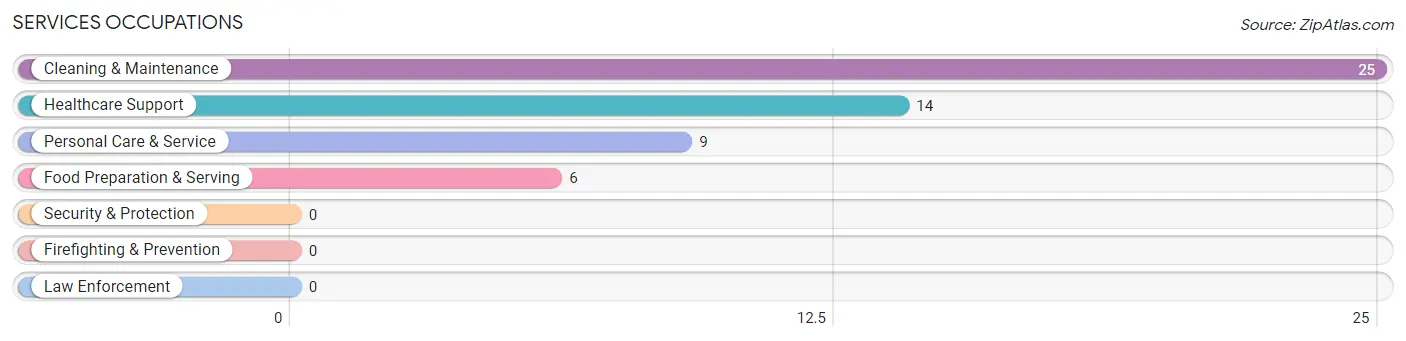
Services Occupations
The most common Services occupations in Huntland are Cleaning & Maintenance (25 | 5.1%), Healthcare Support (14 | 2.9%), Personal Care & Service (9 | 1.9%), and Food Preparation & Serving (6 | 1.2%).
Services Occupations by Sex
Within the Services occupations in Huntland, the most male-oriented occupations are Cleaning & Maintenance (68.0%), and Personal Care & Service (11.1%), while the most female-oriented occupations are Healthcare Support (100.0%), Food Preparation & Serving (100.0%), and Personal Care & Service (88.9%).
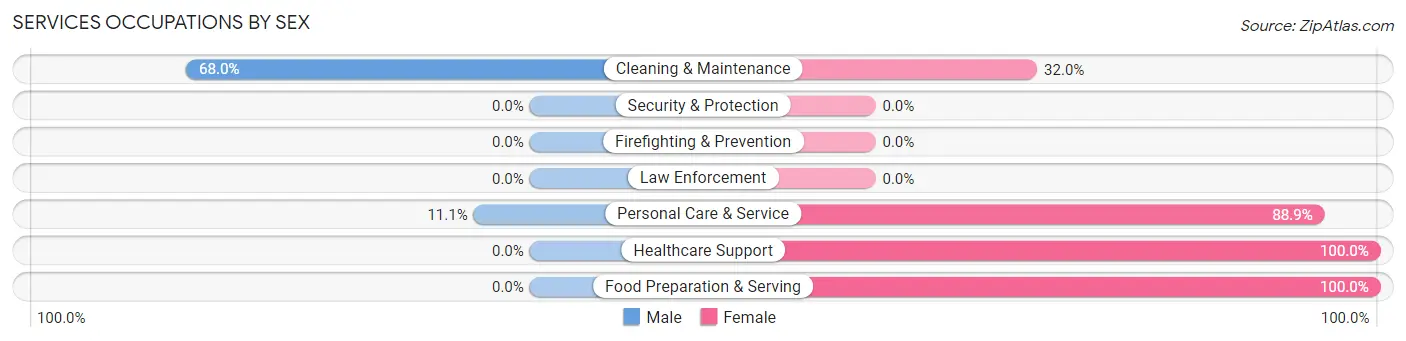
| Occupation | Male | Female |
| Healthcare Support | 0 (0.0%) | 14 (100.0%) |
| Security & Protection | 0 (0.0%) | 0 (0.0%) |
| Firefighting & Prevention | 0 (0.0%) | 0 (0.0%) |
| Law Enforcement | 0 (0.0%) | 0 (0.0%) |
| Food Preparation & Serving | 0 (0.0%) | 6 (100.0%) |
| Cleaning & Maintenance | 17 (68.0%) | 8 (32.0%) |
| Personal Care & Service | 1 (11.1%) | 8 (88.9%) |
| Total (Category) | 18 (33.3%) | 36 (66.7%) |
| Total (Overall) | 219 (45.2%) | 266 (54.8%) |
Sales and Office Occupations
The most common Sales and Office occupations in Huntland are Office & Administration (57 | 11.7%), and Sales & Related (54 | 11.1%).
Sales and Office Occupations by Sex
| Occupation | Male | Female |
| Sales & Related | 2 (3.7%) | 52 (96.3%) |
| Office & Administration | 3 (5.3%) | 54 (94.7%) |
| Total (Category) | 5 (4.5%) | 106 (95.5%) |
| Total (Overall) | 219 (45.2%) | 266 (54.8%) |
Natural Resources, Construction and Maintenance Occupations
The most common Natural Resources, Construction and Maintenance occupations in Huntland are Installation, Maintenance & Repair (25 | 5.1%), and Construction & Extraction (7 | 1.4%).
Natural Resources, Construction and Maintenance Occupations by Sex
| Occupation | Male | Female |
| Farming, Fishing & Forestry | 0 (0.0%) | 0 (0.0%) |
| Construction & Extraction | 7 (100.0%) | 0 (0.0%) |
| Installation, Maintenance & Repair | 25 (100.0%) | 0 (0.0%) |
| Total (Category) | 32 (100.0%) | 0 (0.0%) |
| Total (Overall) | 219 (45.2%) | 266 (54.8%) |
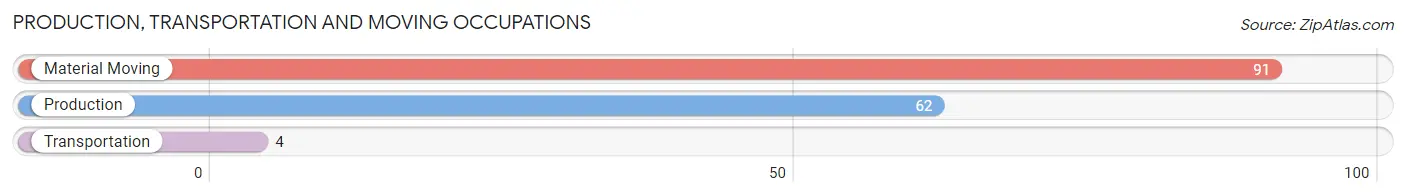
Production, Transportation and Moving Occupations
The most common Production, Transportation and Moving occupations in Huntland are Material Moving (91 | 18.8%), Production (62 | 12.8%), and Transportation (4 | 0.8%).
Production, Transportation and Moving Occupations by Sex
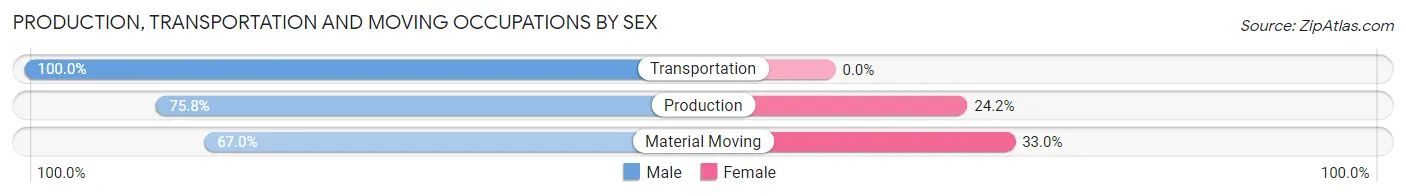
| Occupation | Male | Female |
| Production | 47 (75.8%) | 15 (24.2%) |
| Transportation | 4 (100.0%) | 0 (0.0%) |
| Material Moving | 61 (67.0%) | 30 (33.0%) |
| Total (Category) | 112 (71.3%) | 45 (28.7%) |
| Total (Overall) | 219 (45.2%) | 266 (54.8%) |
Employment Industries by Sex in Huntland
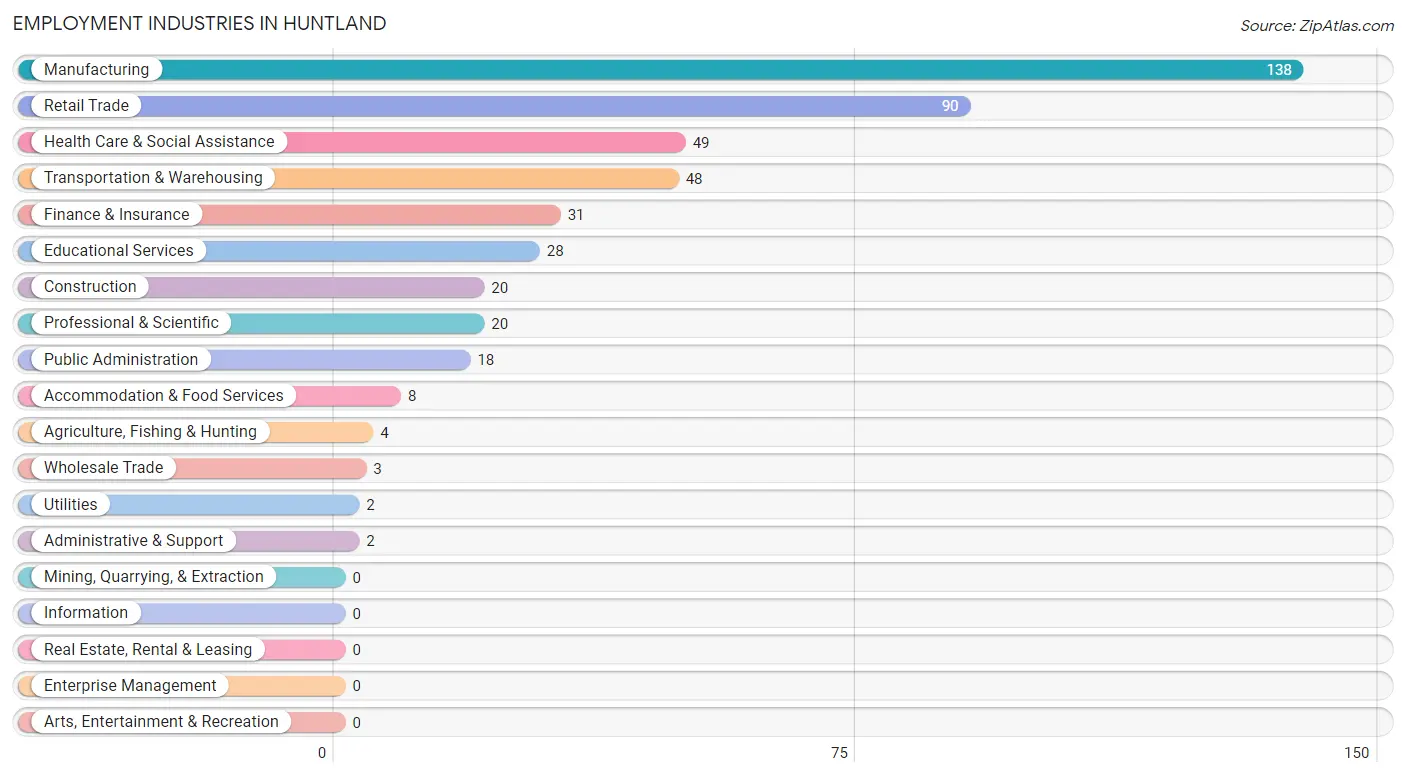
Employment Industries in Huntland
The major employment industries in Huntland include Manufacturing (138 | 28.4%), Retail Trade (90 | 18.6%), Health Care & Social Assistance (49 | 10.1%), Transportation & Warehousing (48 | 9.9%), and Finance & Insurance (31 | 6.4%).
Employment Industries by Sex in Huntland
The Huntland industries that see more men than women are Agriculture, Fishing & Hunting (100.0%), Wholesale Trade (100.0%), and Utilities (100.0%), whereas the industries that tend to have a higher number of women are Health Care & Social Assistance (100.0%), Accommodation & Food Services (100.0%), and Finance & Insurance (90.3%).
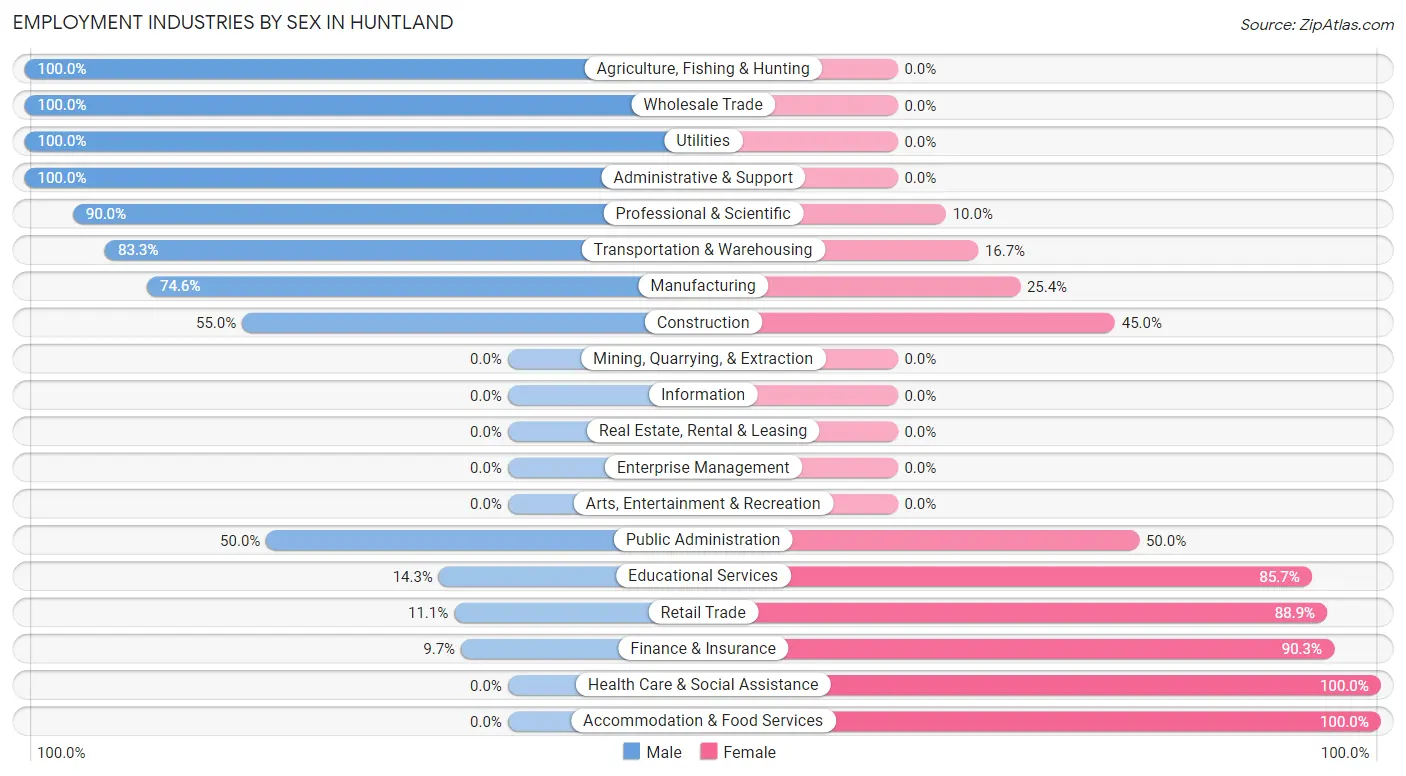
| Industry | Male | Female |
| Agriculture, Fishing & Hunting | 4 (100.0%) | 0 (0.0%) |
| Mining, Quarrying, & Extraction | 0 (0.0%) | 0 (0.0%) |
| Construction | 11 (55.0%) | 9 (45.0%) |
| Manufacturing | 103 (74.6%) | 35 (25.4%) |
| Wholesale Trade | 3 (100.0%) | 0 (0.0%) |
| Retail Trade | 10 (11.1%) | 80 (88.9%) |
| Transportation & Warehousing | 40 (83.3%) | 8 (16.7%) |
| Utilities | 2 (100.0%) | 0 (0.0%) |
| Information | 0 (0.0%) | 0 (0.0%) |
| Finance & Insurance | 3 (9.7%) | 28 (90.3%) |
| Real Estate, Rental & Leasing | 0 (0.0%) | 0 (0.0%) |
| Professional & Scientific | 18 (90.0%) | 2 (10.0%) |
| Enterprise Management | 0 (0.0%) | 0 (0.0%) |
| Administrative & Support | 2 (100.0%) | 0 (0.0%) |
| Educational Services | 4 (14.3%) | 24 (85.7%) |
| Health Care & Social Assistance | 0 (0.0%) | 49 (100.0%) |
| Arts, Entertainment & Recreation | 0 (0.0%) | 0 (0.0%) |
| Accommodation & Food Services | 0 (0.0%) | 8 (100.0%) |
| Public Administration | 9 (50.0%) | 9 (50.0%) |
| Total | 219 (45.2%) | 266 (54.8%) |
Education in Huntland
School Enrollment in Huntland
The most common levels of schooling among the 319 students in Huntland are middle school (130 | 40.7%), elementary school (104 | 32.6%), and high school (55 | 17.2%).
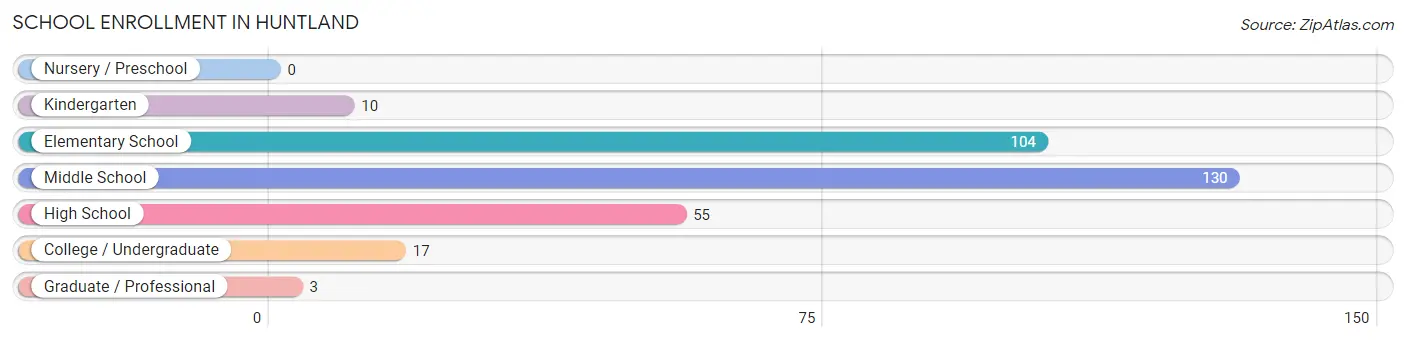
| School Level | # Students | % Students |
| Nursery / Preschool | 0 | 0.0% |
| Kindergarten | 10 | 3.1% |
| Elementary School | 104 | 32.6% |
| Middle School | 130 | 40.7% |
| High School | 55 | 17.2% |
| College / Undergraduate | 17 | 5.3% |
| Graduate / Professional | 3 | 0.9% |
| Total | 319 | 100.0% |
School Enrollment by Age by Funding Source in Huntland
Out of a total of 319 students who are enrolled in schools in Huntland, 7 (2.2%) attend a private institution, while the remaining 312 (97.8%) are enrolled in public schools. The age group of 15 to 17 year olds has the highest likelihood of being enrolled in private schools, with 3 (5.7% in the age bracket) enrolled. Conversely, the age group of 5 to 9 year old has the lowest likelihood of being enrolled in a private school, with 110 (100.0% in the age bracket) attending a public institution.
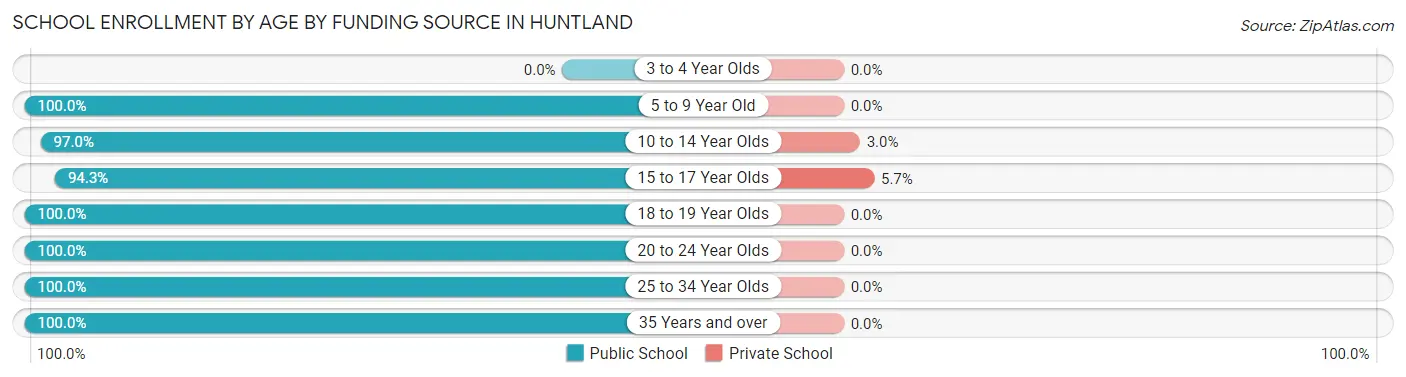
| Age Bracket | Public School | Private School |
| 3 to 4 Year Olds | 0 (0.0%) | 0 (0.0%) |
| 5 to 9 Year Old | 110 (100.0%) | 0 (0.0%) |
| 10 to 14 Year Olds | 130 (97.0%) | 4 (3.0%) |
| 15 to 17 Year Olds | 50 (94.3%) | 3 (5.7%) |
| 18 to 19 Year Olds | 7 (100.0%) | 0 (0.0%) |
| 20 to 24 Year Olds | 7 (100.0%) | 0 (0.0%) |
| 25 to 34 Year Olds | 5 (100.0%) | 0 (0.0%) |
| 35 Years and over | 3 (100.0%) | 0 (0.0%) |
| Total | 312 (97.8%) | 7 (2.2%) |
Educational Attainment by Field of Study in Huntland
Computers & mathematics (22 | 20.4%), business (16 | 14.8%), education (16 | 14.8%), bio, nature & agricultural (15 | 13.9%), and science & technology (14 | 13.0%) are the most common fields of study among 108 individuals in Huntland who have obtained a bachelor's degree or higher.
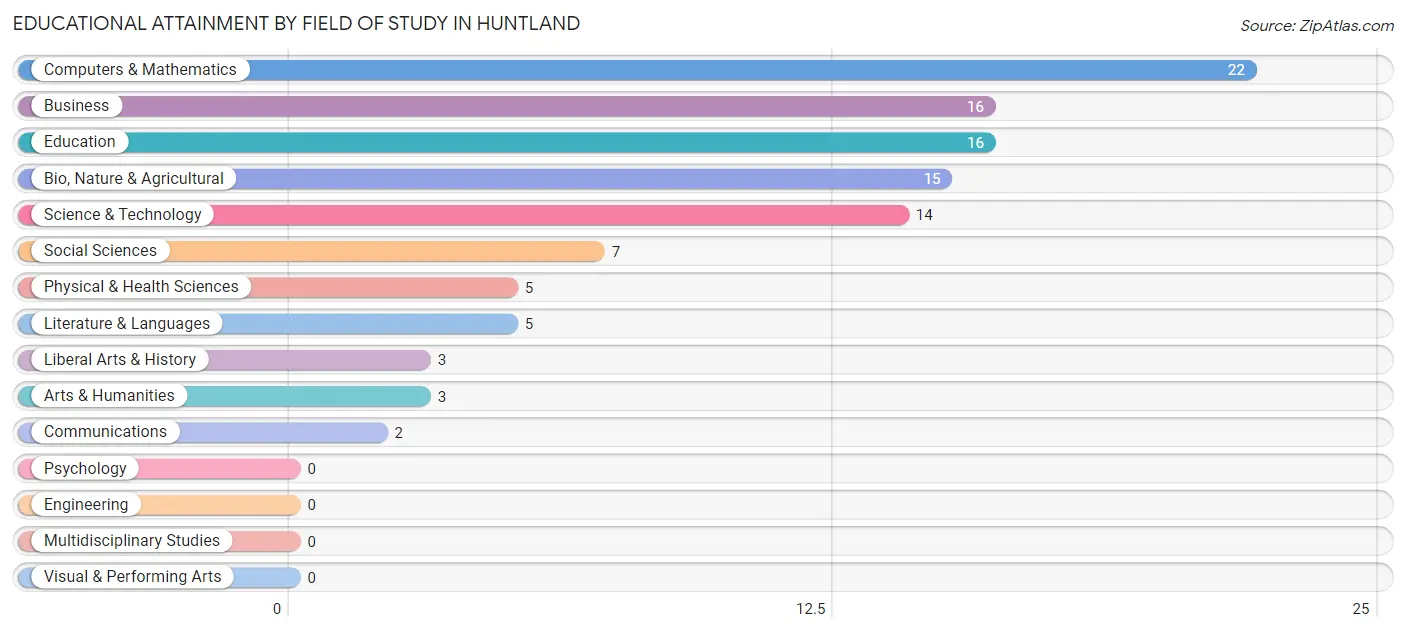
| Field of Study | # Graduates | % Graduates |
| Computers & Mathematics | 22 | 20.4% |
| Bio, Nature & Agricultural | 15 | 13.9% |
| Physical & Health Sciences | 5 | 4.6% |
| Psychology | 0 | 0.0% |
| Social Sciences | 7 | 6.5% |
| Engineering | 0 | 0.0% |
| Multidisciplinary Studies | 0 | 0.0% |
| Science & Technology | 14 | 13.0% |
| Business | 16 | 14.8% |
| Education | 16 | 14.8% |
| Literature & Languages | 5 | 4.6% |
| Liberal Arts & History | 3 | 2.8% |
| Visual & Performing Arts | 0 | 0.0% |
| Communications | 2 | 1.8% |
| Arts & Humanities | 3 | 2.8% |
| Total | 108 | 100.0% |
Transportation & Commute in Huntland
Vehicle Availability by Sex in Huntland
The most prevalent vehicle ownership categories in Huntland are males with 2 vehicles (80, accounting for 36.5%) and females with 2 vehicles (88, making up 30.1%).
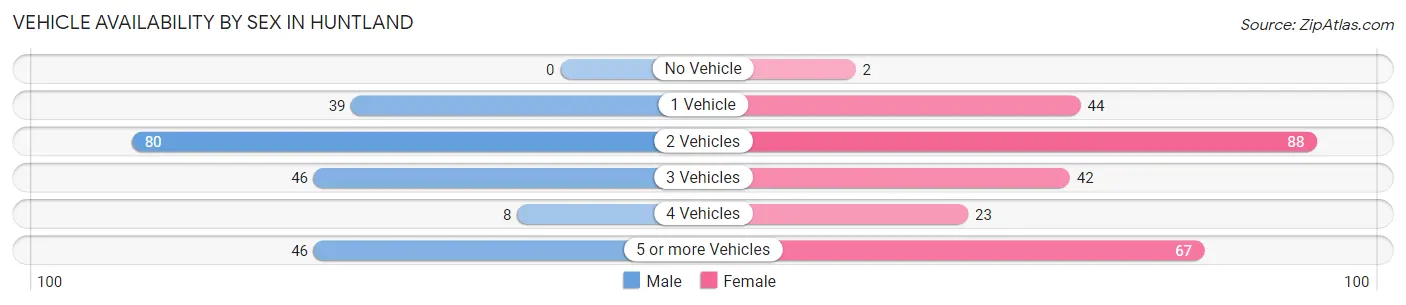
| Vehicles Available | Male | Female |
| No Vehicle | 0 (0.0%) | 2 (0.7%) |
| 1 Vehicle | 39 (17.8%) | 44 (16.5%) |
| 2 Vehicles | 80 (36.5%) | 88 (33.1%) |
| 3 Vehicles | 46 (21.0%) | 42 (15.8%) |
| 4 Vehicles | 8 (3.6%) | 23 (8.6%) |
| 5 or more Vehicles | 46 (21.0%) | 67 (25.2%) |
| Total | 219 (100.0%) | 266 (100.0%) |
Commute Time in Huntland
The most frequently occuring commute durations in Huntland are 20 to 24 minutes (131 commuters, 27.5%), 60 to 89 minutes (61 commuters, 12.8%), and less than 5 minutes (55 commuters, 11.5%).
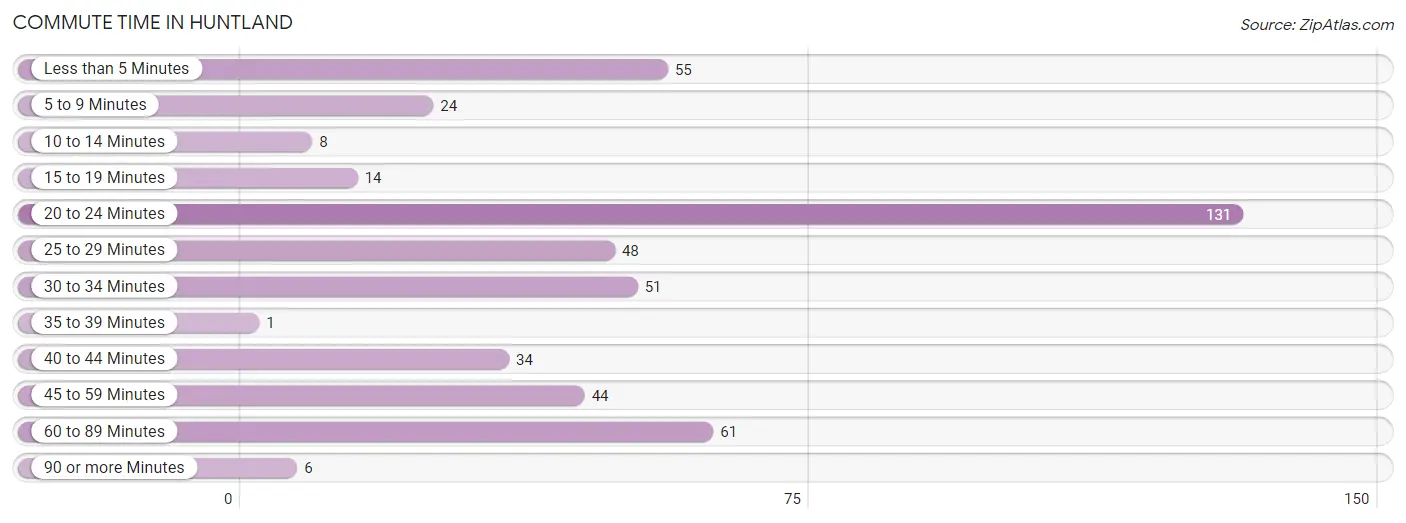
| Commute Time | # Commuters | % Commuters |
| Less than 5 Minutes | 55 | 11.5% |
| 5 to 9 Minutes | 24 | 5.0% |
| 10 to 14 Minutes | 8 | 1.7% |
| 15 to 19 Minutes | 14 | 2.9% |
| 20 to 24 Minutes | 131 | 27.5% |
| 25 to 29 Minutes | 48 | 10.1% |
| 30 to 34 Minutes | 51 | 10.7% |
| 35 to 39 Minutes | 1 | 0.2% |
| 40 to 44 Minutes | 34 | 7.1% |
| 45 to 59 Minutes | 44 | 9.2% |
| 60 to 89 Minutes | 61 | 12.8% |
| 90 or more Minutes | 6 | 1.3% |
Commute Time by Sex in Huntland
The most common commute times in Huntland are 20 to 24 minutes (64 commuters, 29.8%) for males and 20 to 24 minutes (67 commuters, 25.6%) for females.
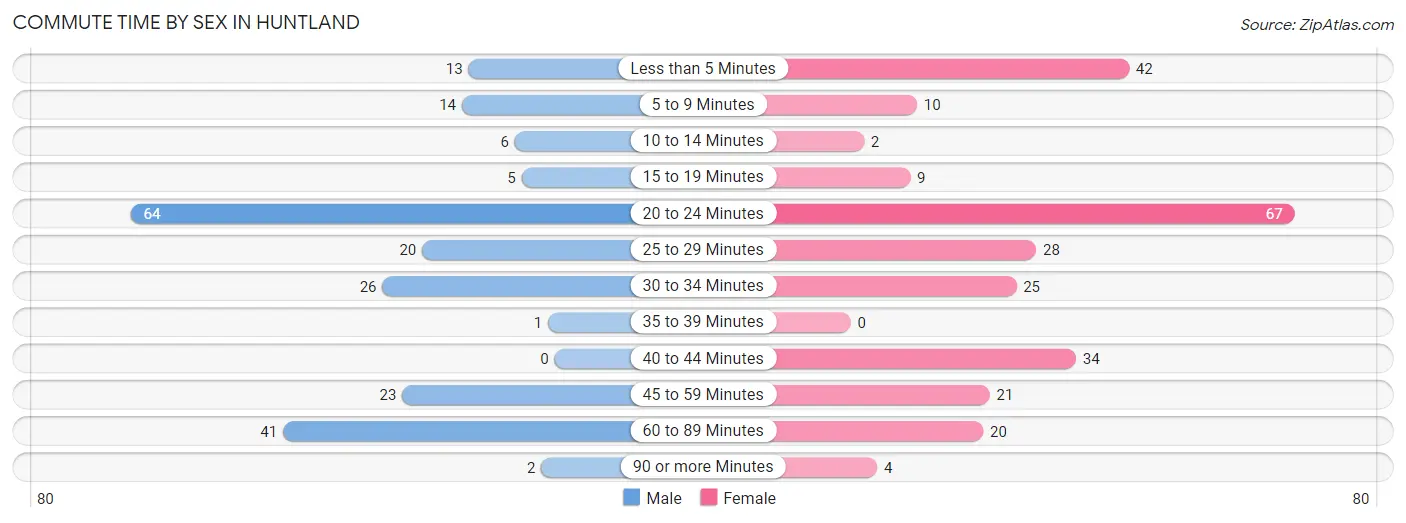
| Commute Time | Male | Female |
| Less than 5 Minutes | 13 (6.0%) | 42 (16.0%) |
| 5 to 9 Minutes | 14 (6.5%) | 10 (3.8%) |
| 10 to 14 Minutes | 6 (2.8%) | 2 (0.8%) |
| 15 to 19 Minutes | 5 (2.3%) | 9 (3.4%) |
| 20 to 24 Minutes | 64 (29.8%) | 67 (25.6%) |
| 25 to 29 Minutes | 20 (9.3%) | 28 (10.7%) |
| 30 to 34 Minutes | 26 (12.1%) | 25 (9.5%) |
| 35 to 39 Minutes | 1 (0.5%) | 0 (0.0%) |
| 40 to 44 Minutes | 0 (0.0%) | 34 (13.0%) |
| 45 to 59 Minutes | 23 (10.7%) | 21 (8.0%) |
| 60 to 89 Minutes | 41 (19.1%) | 20 (7.6%) |
| 90 or more Minutes | 2 (0.9%) | 4 (1.5%) |
Time of Departure to Work by Sex in Huntland
The most frequent times of departure to work in Huntland are 6:00 AM to 6:29 AM (45, 20.9%) for males and 7:30 AM to 7:59 AM (54, 20.6%) for females.
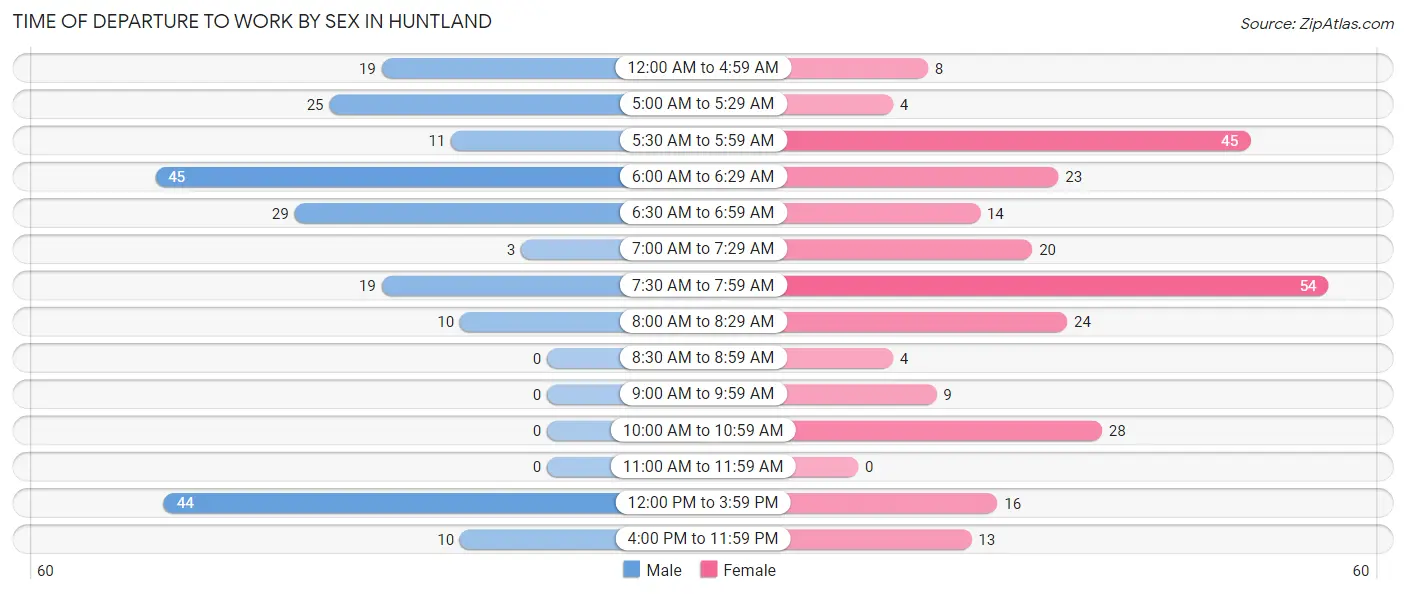
| Time of Departure | Male | Female |
| 12:00 AM to 4:59 AM | 19 (8.8%) | 8 (3.0%) |
| 5:00 AM to 5:29 AM | 25 (11.6%) | 4 (1.5%) |
| 5:30 AM to 5:59 AM | 11 (5.1%) | 45 (17.2%) |
| 6:00 AM to 6:29 AM | 45 (20.9%) | 23 (8.8%) |
| 6:30 AM to 6:59 AM | 29 (13.5%) | 14 (5.3%) |
| 7:00 AM to 7:29 AM | 3 (1.4%) | 20 (7.6%) |
| 7:30 AM to 7:59 AM | 19 (8.8%) | 54 (20.6%) |
| 8:00 AM to 8:29 AM | 10 (4.6%) | 24 (9.2%) |
| 8:30 AM to 8:59 AM | 0 (0.0%) | 4 (1.5%) |
| 9:00 AM to 9:59 AM | 0 (0.0%) | 9 (3.4%) |
| 10:00 AM to 10:59 AM | 0 (0.0%) | 28 (10.7%) |
| 11:00 AM to 11:59 AM | 0 (0.0%) | 0 (0.0%) |
| 12:00 PM to 3:59 PM | 44 (20.5%) | 16 (6.1%) |
| 4:00 PM to 11:59 PM | 10 (4.6%) | 13 (5.0%) |
| Total | 215 (100.0%) | 262 (100.0%) |
Housing Occupancy in Huntland
Occupancy by Ownership in Huntland
Of the total 408 dwellings in Huntland, owner-occupied units account for 345 (84.6%), while renter-occupied units make up 63 (15.4%).
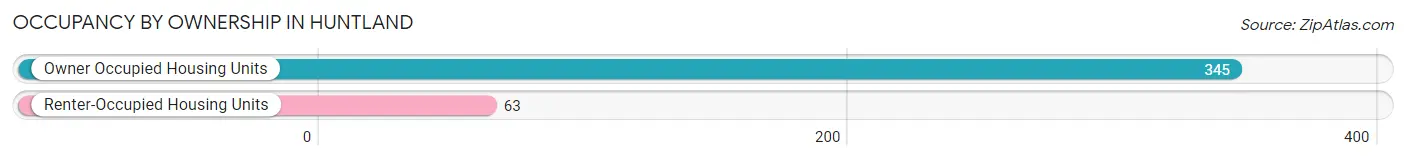
| Occupancy | # Housing Units | % Housing Units |
| Owner Occupied Housing Units | 345 | 84.6% |
| Renter-Occupied Housing Units | 63 | 15.4% |
| Total Occupied Housing Units | 408 | 100.0% |
Occupancy by Household Size in Huntland
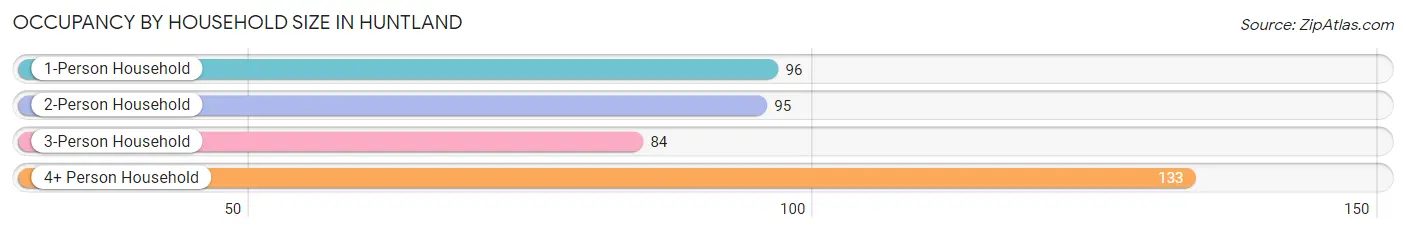
| Household Size | # Housing Units | % Housing Units |
| 1-Person Household | 96 | 23.5% |
| 2-Person Household | 95 | 23.3% |
| 3-Person Household | 84 | 20.6% |
| 4+ Person Household | 133 | 32.6% |
| Total Housing Units | 408 | 100.0% |
Occupancy by Ownership by Household Size in Huntland
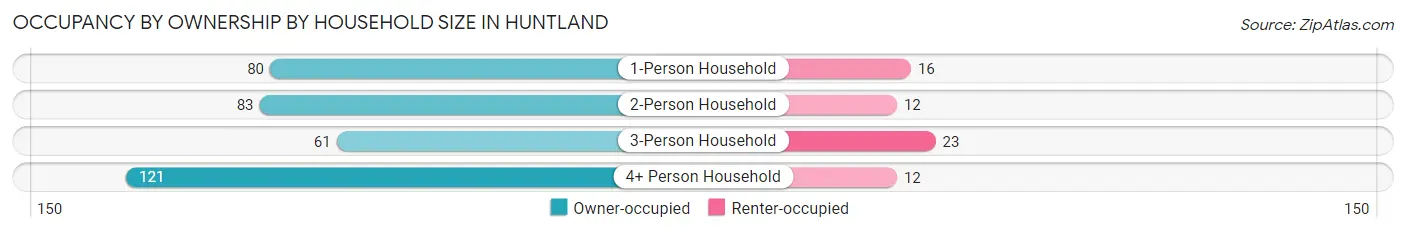
| Household Size | Owner-occupied | Renter-occupied |
| 1-Person Household | 80 (83.3%) | 16 (16.7%) |
| 2-Person Household | 83 (87.4%) | 12 (12.6%) |
| 3-Person Household | 61 (72.6%) | 23 (27.4%) |
| 4+ Person Household | 121 (91.0%) | 12 (9.0%) |
| Total Housing Units | 345 (84.6%) | 63 (15.4%) |
Occupancy by Educational Attainment in Huntland
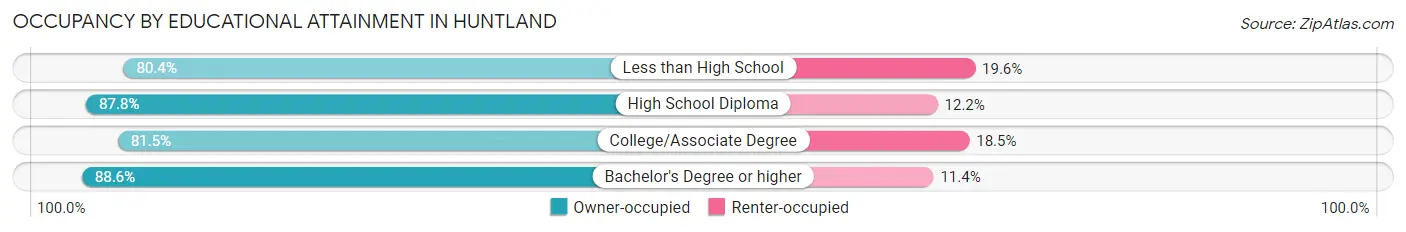
| Household Size | Owner-occupied | Renter-occupied |
| Less than High School | 41 (80.4%) | 10 (19.6%) |
| High School Diploma | 137 (87.8%) | 19 (12.2%) |
| College/Associate Degree | 128 (81.5%) | 29 (18.5%) |
| Bachelor's Degree or higher | 39 (88.6%) | 5 (11.4%) |
Occupancy by Age of Householder in Huntland
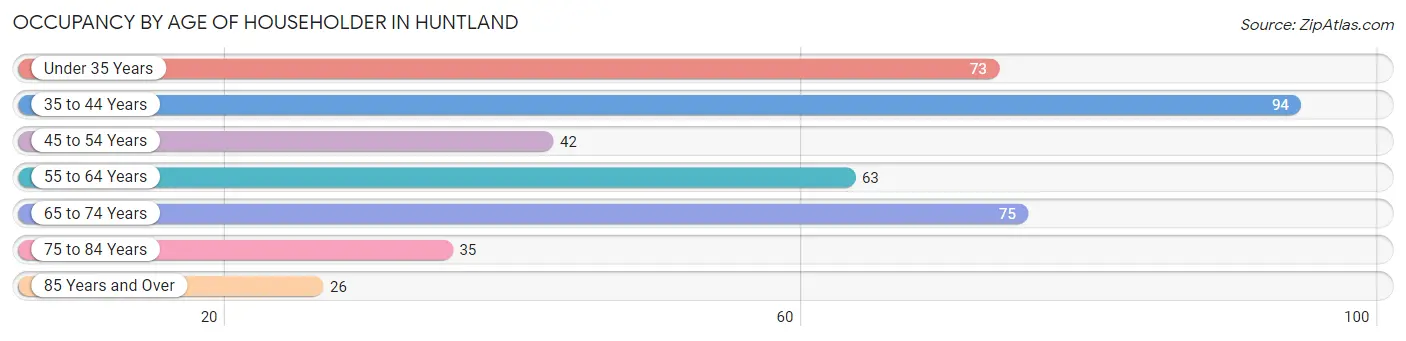
| Age Bracket | # Households | % Households |
| Under 35 Years | 73 | 17.9% |
| 35 to 44 Years | 94 | 23.0% |
| 45 to 54 Years | 42 | 10.3% |
| 55 to 64 Years | 63 | 15.4% |
| 65 to 74 Years | 75 | 18.4% |
| 75 to 84 Years | 35 | 8.6% |
| 85 Years and Over | 26 | 6.4% |
| Total | 408 | 100.0% |
Housing Finances in Huntland
Median Income by Occupancy in Huntland
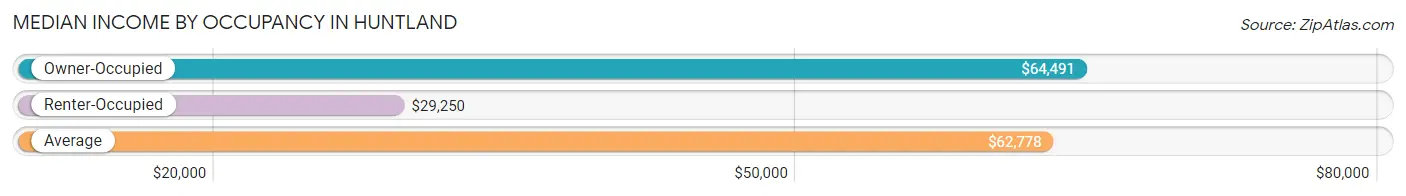
| Occupancy Type | # Households | Median Income |
| Owner-Occupied | 345 (84.6%) | $64,491 |
| Renter-Occupied | 63 (15.4%) | $29,250 |
| Average | 408 (100.0%) | $62,778 |
Occupancy by Householder Income Bracket in Huntland
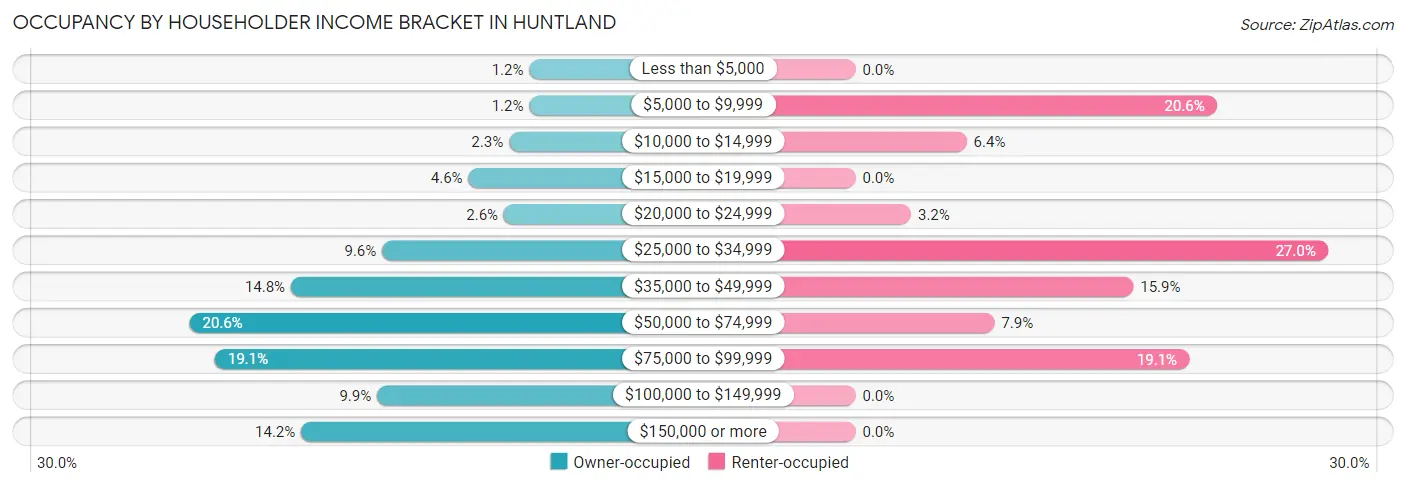
| Income Bracket | Owner-occupied | Renter-occupied |
| Less than $5,000 | 4 (1.2%) | 0 (0.0%) |
| $5,000 to $9,999 | 4 (1.2%) | 13 (20.6%) |
| $10,000 to $14,999 | 8 (2.3%) | 4 (6.4%) |
| $15,000 to $19,999 | 16 (4.6%) | 0 (0.0%) |
| $20,000 to $24,999 | 9 (2.6%) | 2 (3.2%) |
| $25,000 to $34,999 | 33 (9.6%) | 17 (27.0%) |
| $35,000 to $49,999 | 51 (14.8%) | 10 (15.9%) |
| $50,000 to $74,999 | 71 (20.6%) | 5 (7.9%) |
| $75,000 to $99,999 | 66 (19.1%) | 12 (19.1%) |
| $100,000 to $149,999 | 34 (9.9%) | 0 (0.0%) |
| $150,000 or more | 49 (14.2%) | 0 (0.0%) |
| Total | 345 (100.0%) | 63 (100.0%) |
Monthly Housing Cost Tiers in Huntland
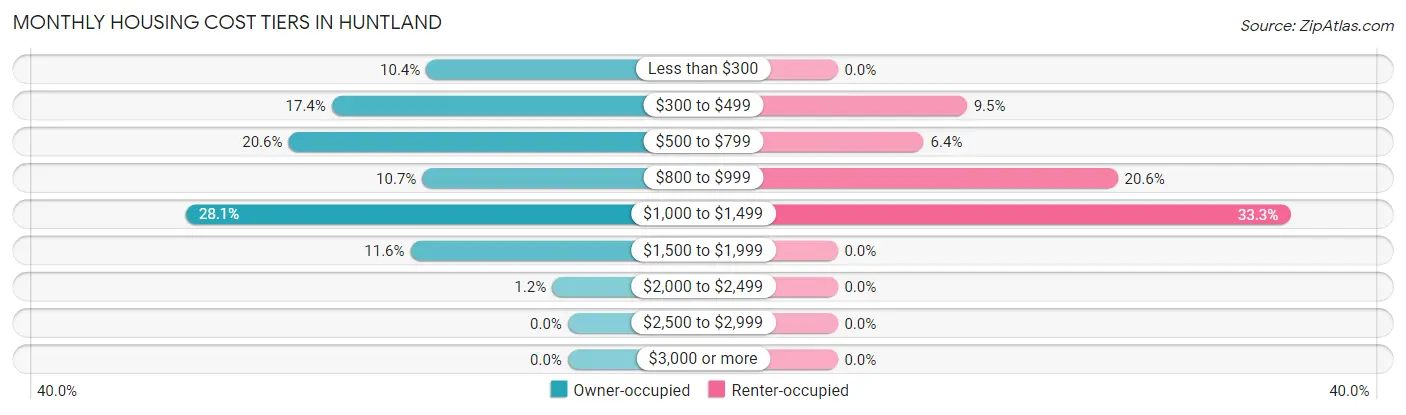
| Monthly Cost | Owner-occupied | Renter-occupied |
| Less than $300 | 36 (10.4%) | 0 (0.0%) |
| $300 to $499 | 60 (17.4%) | 6 (9.5%) |
| $500 to $799 | 71 (20.6%) | 4 (6.4%) |
| $800 to $999 | 37 (10.7%) | 13 (20.6%) |
| $1,000 to $1,499 | 97 (28.1%) | 21 (33.3%) |
| $1,500 to $1,999 | 40 (11.6%) | 0 (0.0%) |
| $2,000 to $2,499 | 4 (1.2%) | 0 (0.0%) |
| $2,500 to $2,999 | 0 (0.0%) | 0 (0.0%) |
| $3,000 or more | 0 (0.0%) | 0 (0.0%) |
| Total | 345 (100.0%) | 63 (100.0%) |
Physical Housing Characteristics in Huntland
Housing Structures in Huntland
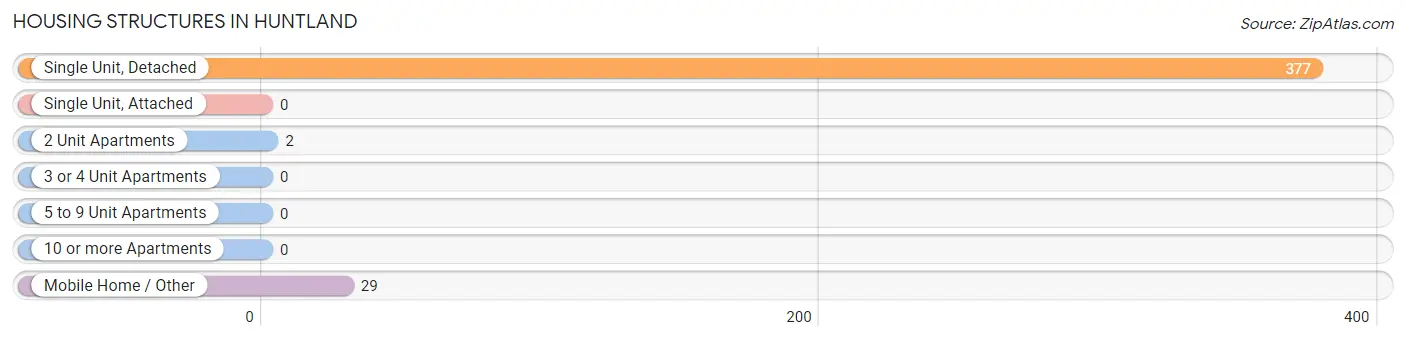
| Structure Type | # Housing Units | % Housing Units |
| Single Unit, Detached | 377 | 92.4% |
| Single Unit, Attached | 0 | 0.0% |
| 2 Unit Apartments | 2 | 0.5% |
| 3 or 4 Unit Apartments | 0 | 0.0% |
| 5 to 9 Unit Apartments | 0 | 0.0% |
| 10 or more Apartments | 0 | 0.0% |
| Mobile Home / Other | 29 | 7.1% |
| Total | 408 | 100.0% |
Housing Structures by Occupancy in Huntland
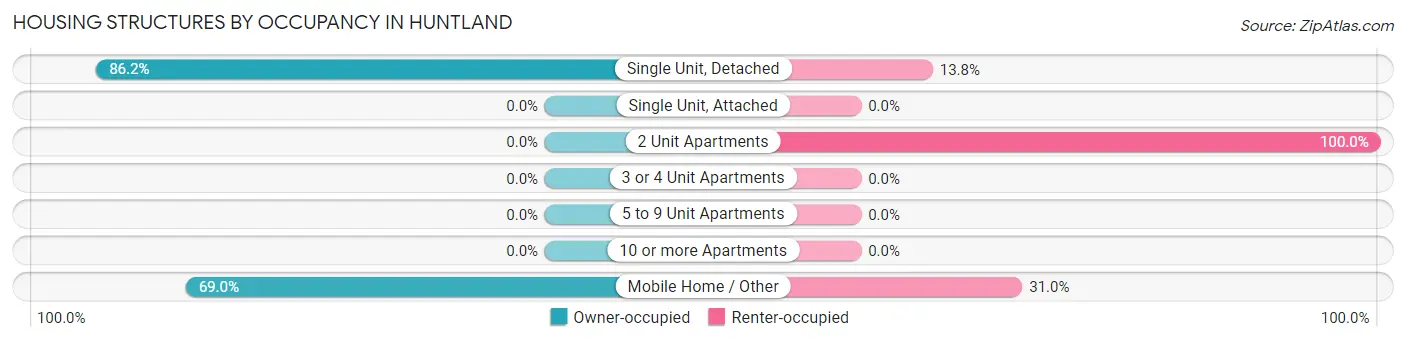
| Structure Type | Owner-occupied | Renter-occupied |
| Single Unit, Detached | 325 (86.2%) | 52 (13.8%) |
| Single Unit, Attached | 0 (0.0%) | 0 (0.0%) |
| 2 Unit Apartments | 0 (0.0%) | 2 (100.0%) |
| 3 or 4 Unit Apartments | 0 (0.0%) | 0 (0.0%) |
| 5 to 9 Unit Apartments | 0 (0.0%) | 0 (0.0%) |
| 10 or more Apartments | 0 (0.0%) | 0 (0.0%) |
| Mobile Home / Other | 20 (69.0%) | 9 (31.0%) |
| Total | 345 (84.6%) | 63 (15.4%) |
Housing Structures by Number of Rooms in Huntland
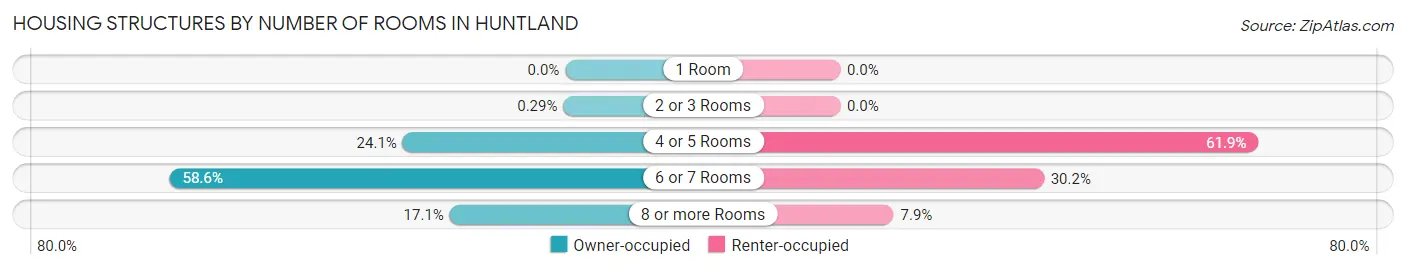
| Number of Rooms | Owner-occupied | Renter-occupied |
| 1 Room | 0 (0.0%) | 0 (0.0%) |
| 2 or 3 Rooms | 1 (0.3%) | 0 (0.0%) |
| 4 or 5 Rooms | 83 (24.1%) | 39 (61.9%) |
| 6 or 7 Rooms | 202 (58.6%) | 19 (30.2%) |
| 8 or more Rooms | 59 (17.1%) | 5 (7.9%) |
| Total | 345 (100.0%) | 63 (100.0%) |
Housing Structure by Heating Type in Huntland
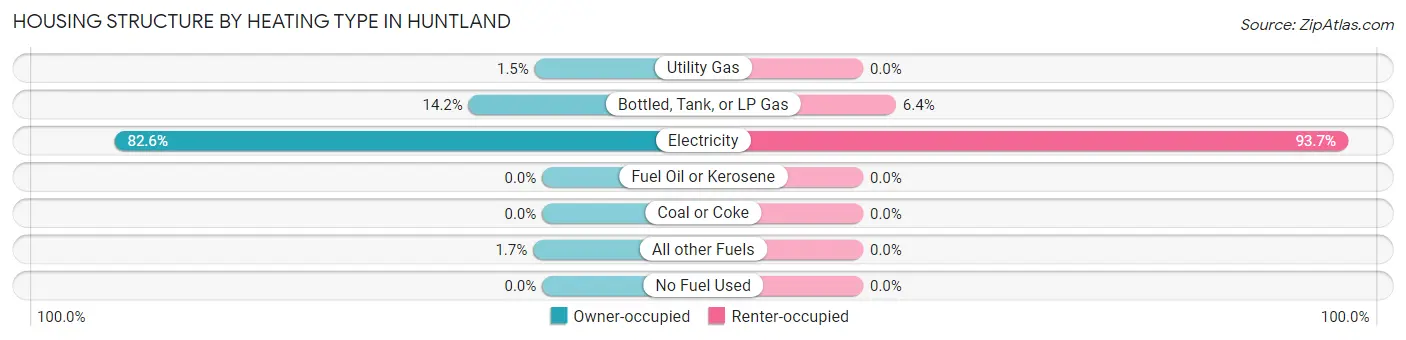
| Heating Type | Owner-occupied | Renter-occupied |
| Utility Gas | 5 (1.5%) | 0 (0.0%) |
| Bottled, Tank, or LP Gas | 49 (14.2%) | 4 (6.4%) |
| Electricity | 285 (82.6%) | 59 (93.6%) |
| Fuel Oil or Kerosene | 0 (0.0%) | 0 (0.0%) |
| Coal or Coke | 0 (0.0%) | 0 (0.0%) |
| All other Fuels | 6 (1.7%) | 0 (0.0%) |
| No Fuel Used | 0 (0.0%) | 0 (0.0%) |
| Total | 345 (100.0%) | 63 (100.0%) |
Household Vehicle Usage in Huntland
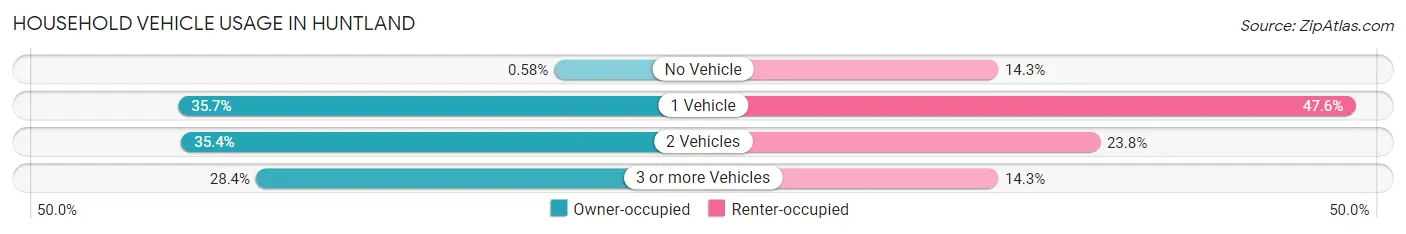
| Vehicles per Household | Owner-occupied | Renter-occupied |
| No Vehicle | 2 (0.6%) | 9 (14.3%) |
| 1 Vehicle | 123 (35.6%) | 30 (47.6%) |
| 2 Vehicles | 122 (35.4%) | 15 (23.8%) |
| 3 or more Vehicles | 98 (28.4%) | 9 (14.3%) |
| Total | 345 (100.0%) | 63 (100.0%) |
Real Estate & Mortgages in Huntland
Real Estate and Mortgage Overview in Huntland
| Characteristic | Without Mortgage | With Mortgage |
| Housing Units | 132 | 213 |
| Median Property Value | $117,900 | $141,700 |
| Median Household Income | $48,333 | $45 |
| Monthly Housing Costs | $380 | $0 |
| Real Estate Taxes | $729 | $11 |
Property Value by Mortgage Status in Huntland
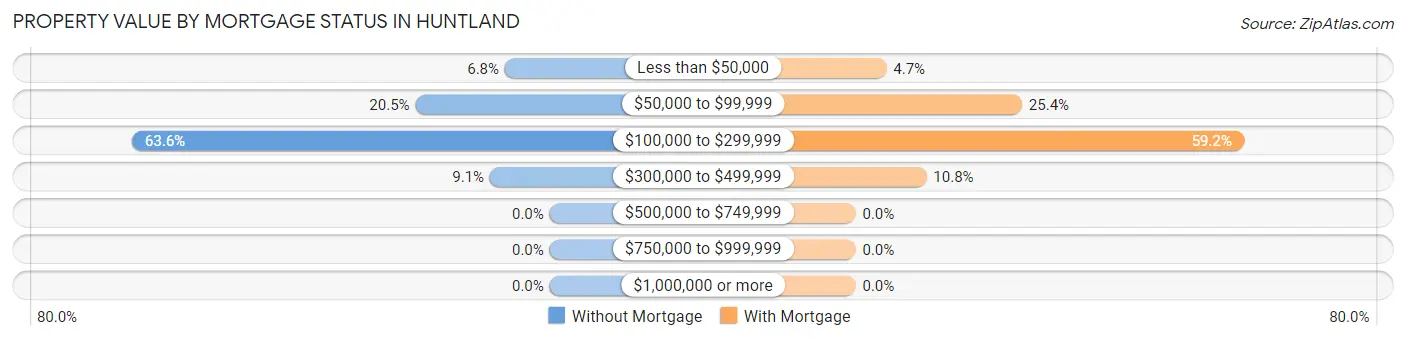
| Property Value | Without Mortgage | With Mortgage |
| Less than $50,000 | 9 (6.8%) | 10 (4.7%) |
| $50,000 to $99,999 | 27 (20.4%) | 54 (25.4%) |
| $100,000 to $299,999 | 84 (63.6%) | 126 (59.2%) |
| $300,000 to $499,999 | 12 (9.1%) | 23 (10.8%) |
| $500,000 to $749,999 | 0 (0.0%) | 0 (0.0%) |
| $750,000 to $999,999 | 0 (0.0%) | 0 (0.0%) |
| $1,000,000 or more | 0 (0.0%) | 0 (0.0%) |
| Total | 132 (100.0%) | 213 (100.0%) |
Household Income by Mortgage Status in Huntland
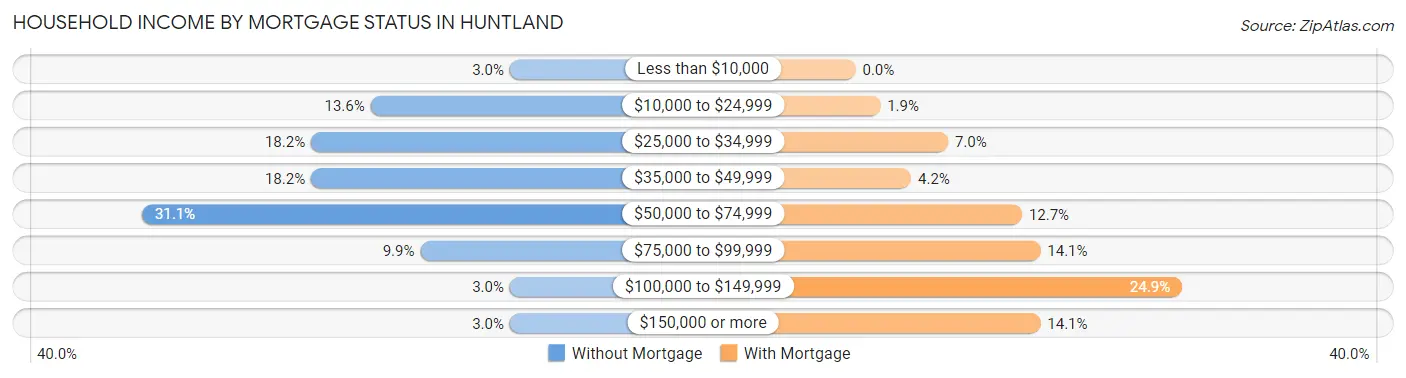
| Household Income | Without Mortgage | With Mortgage |
| Less than $10,000 | 4 (3.0%) | 0 (0.0%) |
| $10,000 to $24,999 | 18 (13.6%) | 4 (1.9%) |
| $25,000 to $34,999 | 24 (18.2%) | 15 (7.0%) |
| $35,000 to $49,999 | 24 (18.2%) | 9 (4.2%) |
| $50,000 to $74,999 | 41 (31.1%) | 27 (12.7%) |
| $75,000 to $99,999 | 13 (9.9%) | 30 (14.1%) |
| $100,000 to $149,999 | 4 (3.0%) | 53 (24.9%) |
| $150,000 or more | 4 (3.0%) | 30 (14.1%) |
| Total | 132 (100.0%) | 213 (100.0%) |
Property Value to Household Income Ratio in Huntland
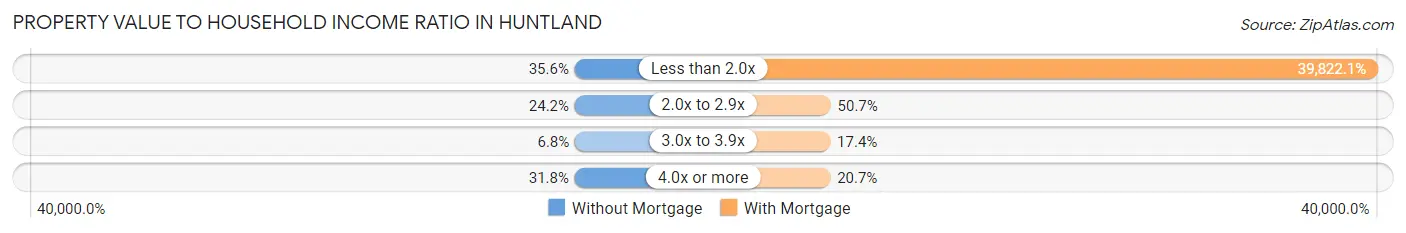
| Value-to-Income Ratio | Without Mortgage | With Mortgage |
| Less than 2.0x | 47 (35.6%) | 84,821 (39,822.1%) |
| 2.0x to 2.9x | 32 (24.2%) | 108 (50.7%) |
| 3.0x to 3.9x | 9 (6.8%) | 37 (17.4%) |
| 4.0x or more | 42 (31.8%) | 44 (20.7%) |
| Total | 132 (100.0%) | 213 (100.0%) |
Real Estate Taxes by Mortgage Status in Huntland
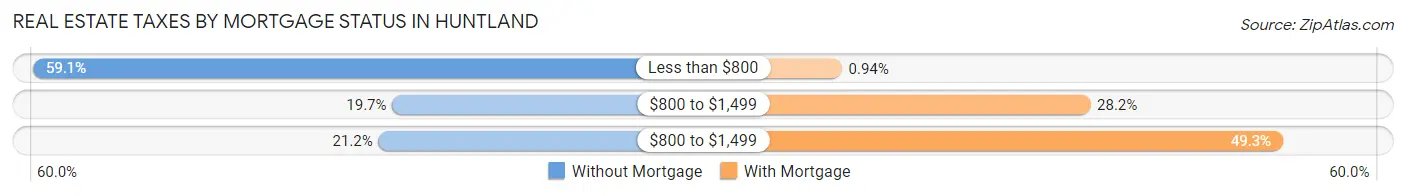
| Property Taxes | Without Mortgage | With Mortgage |
| Less than $800 | 78 (59.1%) | 2 (0.9%) |
| $800 to $1,499 | 26 (19.7%) | 60 (28.2%) |
| $800 to $1,499 | 28 (21.2%) | 105 (49.3%) |
| Total | 132 (100.0%) | 213 (100.0%) |
Health & Disability in Huntland
Health Insurance Coverage by Age in Huntland
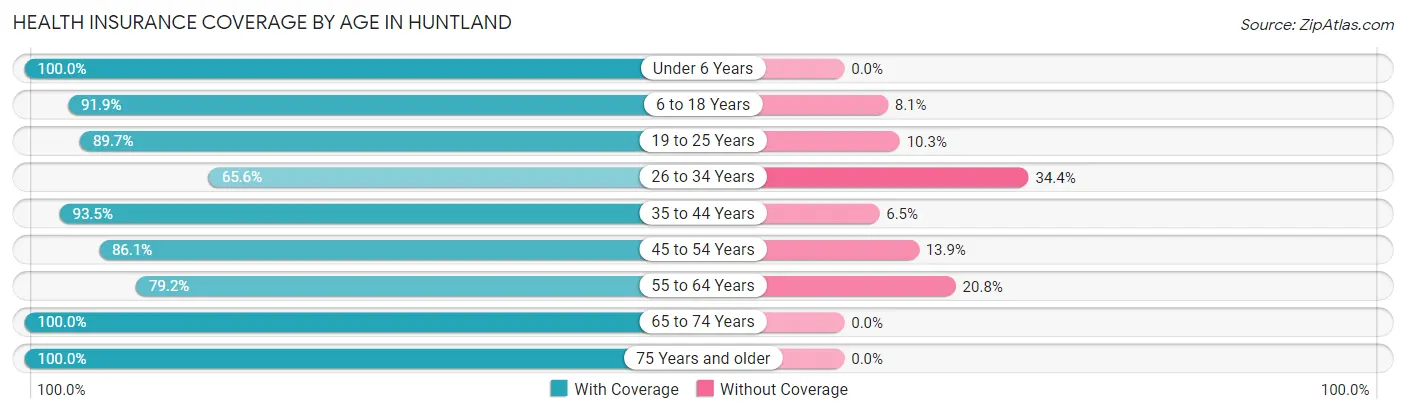
| Age Bracket | With Coverage | Without Coverage |
| Under 6 Years | 54 (100.0%) | 0 (0.0%) |
| 6 to 18 Years | 272 (91.9%) | 24 (8.1%) |
| 19 to 25 Years | 78 (89.7%) | 9 (10.3%) |
| 26 to 34 Years | 107 (65.6%) | 56 (34.4%) |
| 35 to 44 Years | 129 (93.5%) | 9 (6.5%) |
| 45 to 54 Years | 118 (86.1%) | 19 (13.9%) |
| 55 to 64 Years | 103 (79.2%) | 27 (20.8%) |
| 65 to 74 Years | 111 (100.0%) | 0 (0.0%) |
| 75 Years and older | 102 (100.0%) | 0 (0.0%) |
| Total | 1,074 (88.2%) | 144 (11.8%) |
Health Insurance Coverage by Citizenship Status in Huntland
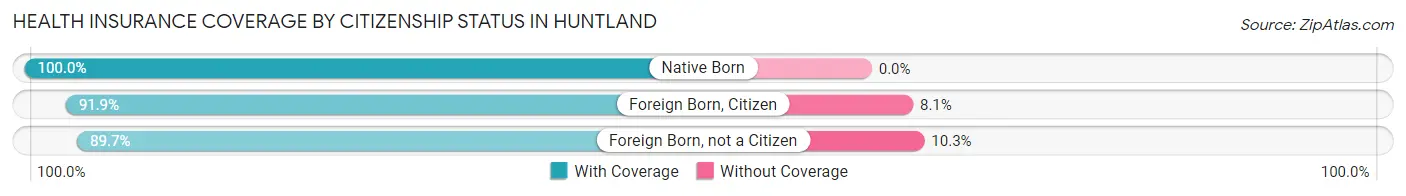
| Citizenship Status | With Coverage | Without Coverage |
| Native Born | 54 (100.0%) | 0 (0.0%) |
| Foreign Born, Citizen | 272 (91.9%) | 24 (8.1%) |
| Foreign Born, not a Citizen | 78 (89.7%) | 9 (10.3%) |
Health Insurance Coverage by Household Income in Huntland
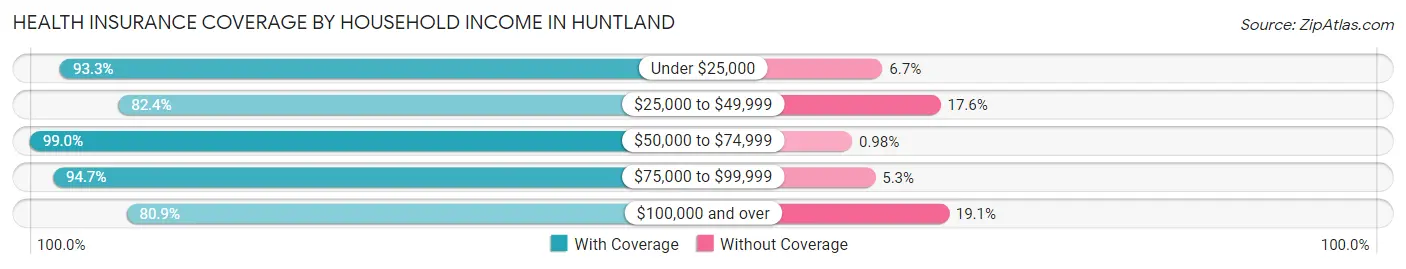
| Household Income | With Coverage | Without Coverage |
| Under $25,000 | 84 (93.3%) | 6 (6.7%) |
| $25,000 to $49,999 | 230 (82.4%) | 49 (17.6%) |
| $50,000 to $74,999 | 203 (99.0%) | 2 (1.0%) |
| $75,000 to $99,999 | 248 (94.7%) | 14 (5.3%) |
| $100,000 and over | 309 (80.9%) | 73 (19.1%) |
Public vs Private Health Insurance Coverage by Age in Huntland
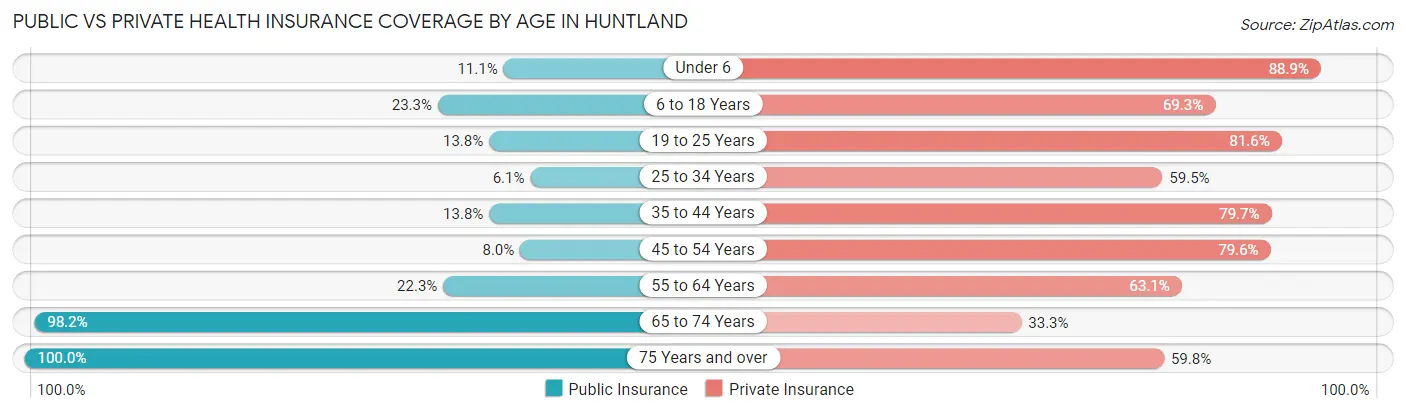
| Age Bracket | Public Insurance | Private Insurance |
| Under 6 | 6 (11.1%) | 48 (88.9%) |
| 6 to 18 Years | 69 (23.3%) | 205 (69.3%) |
| 19 to 25 Years | 12 (13.8%) | 71 (81.6%) |
| 25 to 34 Years | 10 (6.1%) | 97 (59.5%) |
| 35 to 44 Years | 19 (13.8%) | 110 (79.7%) |
| 45 to 54 Years | 11 (8.0%) | 109 (79.6%) |
| 55 to 64 Years | 29 (22.3%) | 82 (63.1%) |
| 65 to 74 Years | 109 (98.2%) | 37 (33.3%) |
| 75 Years and over | 102 (100.0%) | 61 (59.8%) |
| Total | 367 (30.1%) | 820 (67.3%) |
Disability Status by Sex by Age in Huntland
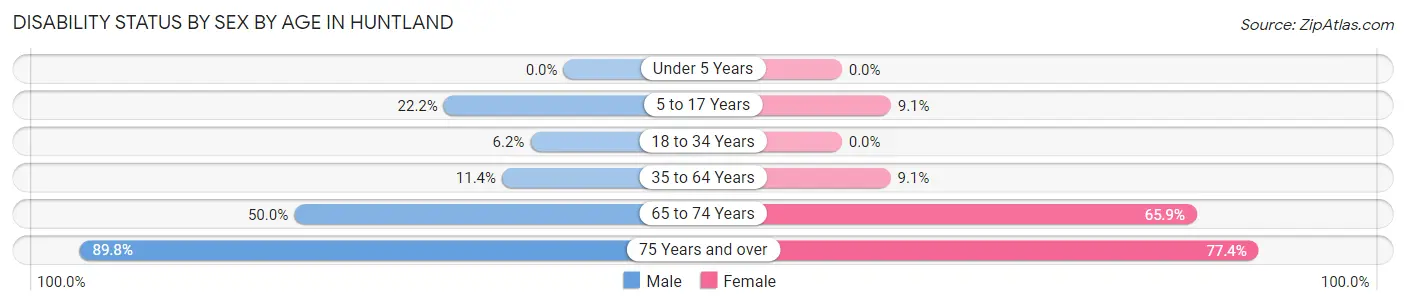
| Age Bracket | Male | Female |
| Under 5 Years | 0 (0.0%) | 0 (0.0%) |
| 5 to 17 Years | 48 (22.2%) | 8 (9.1%) |
| 18 to 34 Years | 8 (6.1%) | 0 (0.0%) |
| 35 to 64 Years | 21 (11.4%) | 20 (9.0%) |
| 65 to 74 Years | 13 (50.0%) | 56 (65.9%) |
| 75 Years and over | 44 (89.8%) | 41 (77.4%) |
Disability Class by Sex by Age in Huntland
Disability Class: Hearing Difficulty
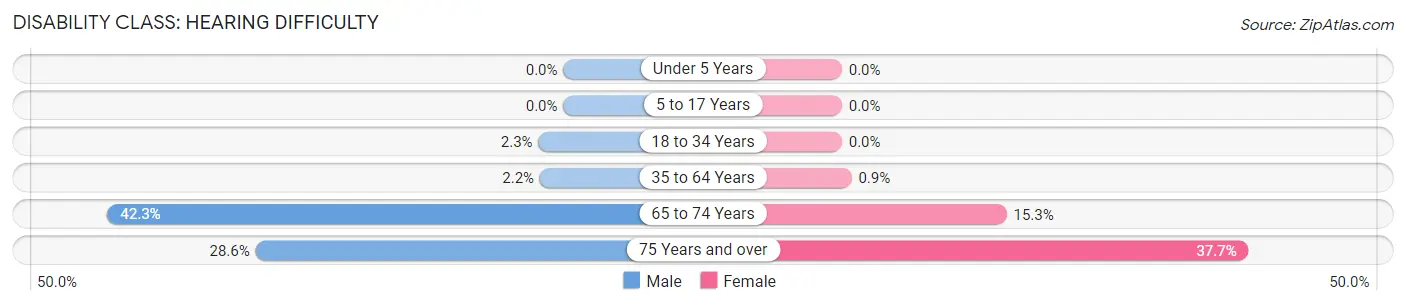
| Age Bracket | Male | Female |
| Under 5 Years | 0 (0.0%) | 0 (0.0%) |
| 5 to 17 Years | 0 (0.0%) | 0 (0.0%) |
| 18 to 34 Years | 3 (2.3%) | 0 (0.0%) |
| 35 to 64 Years | 4 (2.2%) | 2 (0.9%) |
| 65 to 74 Years | 11 (42.3%) | 13 (15.3%) |
| 75 Years and over | 14 (28.6%) | 20 (37.7%) |
Disability Class: Vision Difficulty
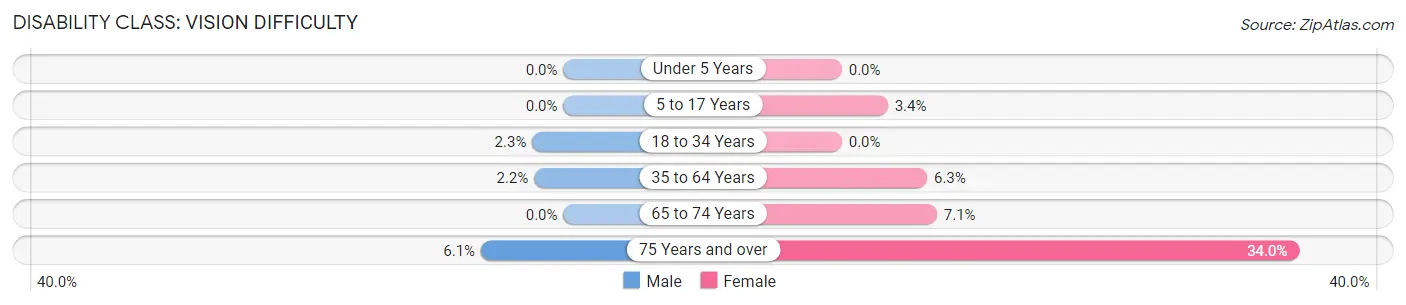
| Age Bracket | Male | Female |
| Under 5 Years | 0 (0.0%) | 0 (0.0%) |
| 5 to 17 Years | 0 (0.0%) | 3 (3.4%) |
| 18 to 34 Years | 3 (2.3%) | 0 (0.0%) |
| 35 to 64 Years | 4 (2.2%) | 14 (6.3%) |
| 65 to 74 Years | 0 (0.0%) | 6 (7.1%) |
| 75 Years and over | 3 (6.1%) | 18 (34.0%) |
Disability Class: Cognitive Difficulty
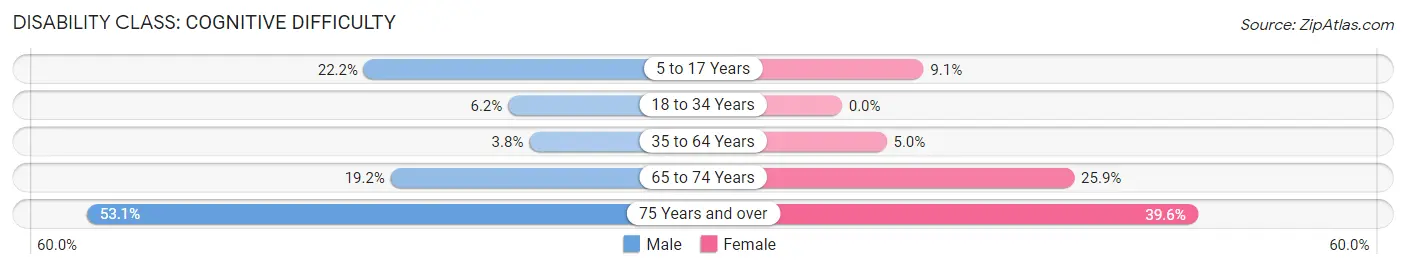
| Age Bracket | Male | Female |
| 5 to 17 Years | 48 (22.2%) | 8 (9.1%) |
| 18 to 34 Years | 8 (6.1%) | 0 (0.0%) |
| 35 to 64 Years | 7 (3.8%) | 11 (5.0%) |
| 65 to 74 Years | 5 (19.2%) | 22 (25.9%) |
| 75 Years and over | 26 (53.1%) | 21 (39.6%) |
Disability Class: Ambulatory Difficulty
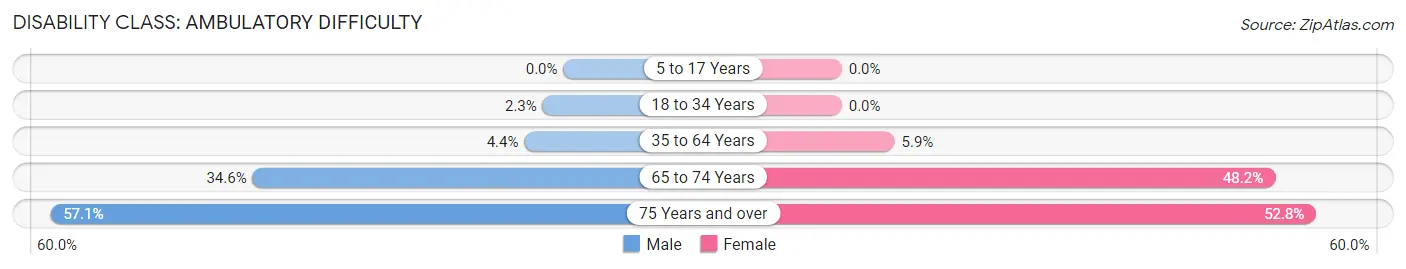
| Age Bracket | Male | Female |
| 5 to 17 Years | 0 (0.0%) | 0 (0.0%) |
| 18 to 34 Years | 3 (2.3%) | 0 (0.0%) |
| 35 to 64 Years | 8 (4.3%) | 13 (5.9%) |
| 65 to 74 Years | 9 (34.6%) | 41 (48.2%) |
| 75 Years and over | 28 (57.1%) | 28 (52.8%) |
Disability Class: Self-Care Difficulty
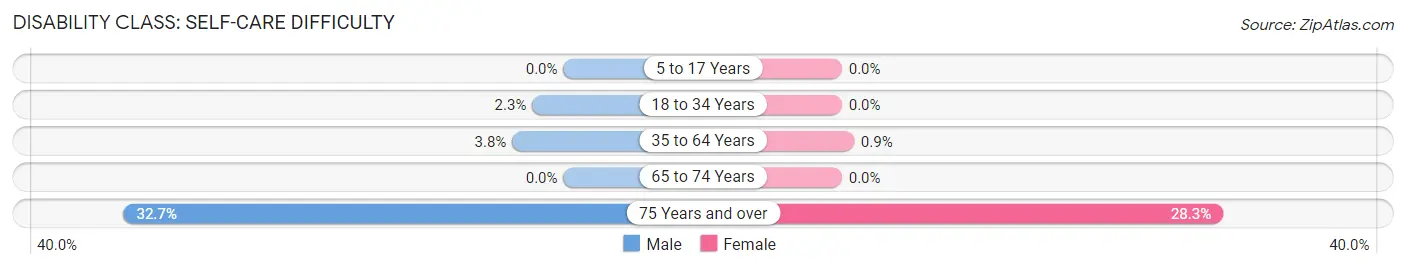
| Age Bracket | Male | Female |
| 5 to 17 Years | 0 (0.0%) | 0 (0.0%) |
| 18 to 34 Years | 3 (2.3%) | 0 (0.0%) |
| 35 to 64 Years | 7 (3.8%) | 2 (0.9%) |
| 65 to 74 Years | 0 (0.0%) | 0 (0.0%) |
| 75 Years and over | 16 (32.7%) | 15 (28.3%) |
Technology Access in Huntland
Computing Device Access in Huntland
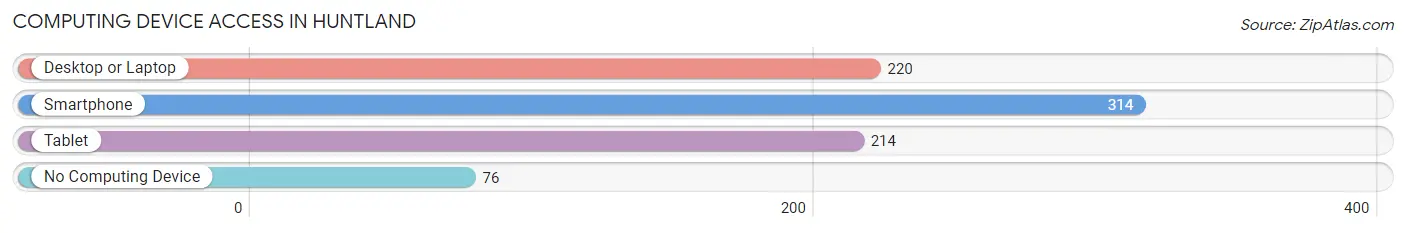
| Device Type | # Households | % Households |
| Desktop or Laptop | 220 | 53.9% |
| Smartphone | 314 | 77.0% |
| Tablet | 214 | 52.4% |
| No Computing Device | 76 | 18.6% |
| Total | 408 | 100.0% |
Internet Access in Huntland
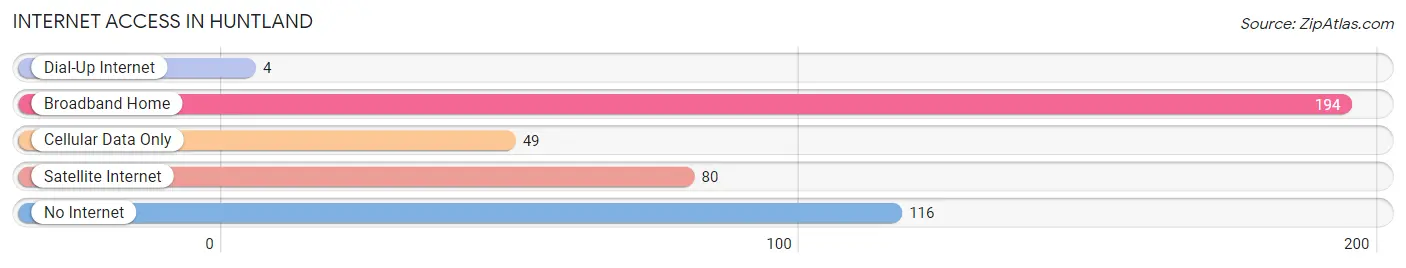
| Internet Type | # Households | % Households |
| Dial-Up Internet | 4 | 1.0% |
| Broadband Home | 194 | 47.5% |
| Cellular Data Only | 49 | 12.0% |
| Satellite Internet | 80 | 19.6% |
| No Internet | 116 | 28.4% |
| Total | 408 | 100.0% |
Huntland Summary
Huntland is a small town located in Franklin County, Tennessee. It is situated in the southern part of the state, about an hour and a half south of Nashville. The town has a population of just over 500 people, and is part of the Winchester, TN-AL Metropolitan Statistical Area.
History
Huntland was founded in 1887 by a group of settlers from Alabama. The town was named after the Hunt family, who were among the first settlers. The Hunts were farmers and the town was originally a farming community. The town grew slowly over the years, and by the early 1900s, it had a population of around 200 people.
In the early 1900s, Huntland began to experience a period of growth. The town was connected to the railroad in 1906, and this allowed for the transportation of goods and people to and from the town. This helped to spur economic growth in the area, and the population of the town began to increase.
By the mid-1900s, Huntland had become a thriving community. The town had a variety of businesses, including a bank, a grocery store, a hardware store, and a movie theater. The town also had a school, which was attended by students from the surrounding area.
Geography
Huntland is located in the southern part of Franklin County, Tennessee. It is situated in the foothills of the Cumberland Mountains, and is surrounded by rolling hills and farmland. The town is located about an hour and a half south of Nashville, and is about an hour and a half north of Chattanooga.
The town is situated along the Elk River, which flows through the area. The river provides a source of recreation for the town, as well as a source of water for the local farms.
Economy
The economy of Huntland is largely based on agriculture. The town is surrounded by farmland, and many of the residents are involved in farming. The town also has a few small businesses, including a grocery store, a hardware store, and a bank.
The town is also home to a few manufacturing companies, including a furniture factory and a plastics factory. These companies provide employment for many of the town’s residents.
Demographics
As of the 2010 census, the population of Huntland was 517 people. The town is predominantly white, with 92.3% of the population being white. The remaining 7.7% of the population is made up of African Americans, Hispanics, and other races.
The median household income in Huntland is $37,500, and the median age is 44. The town has a high rate of homeownership, with 81.3% of the population owning their own homes.
Huntland is a small town with a rich history and a strong sense of community. The town is surrounded by farmland, and the economy is largely based on agriculture. The town also has a few small businesses, and is home to a few manufacturing companies. The town has a population of just over 500 people, and is predominantly white.
Common Questions
What is Per Capita Income in Huntland?
Per Capita income in Huntland is $25,762.
What is the Median Family Income in Huntland?
Median Family Income in Huntland is $66,806.
What is the Median Household income in Huntland?
Median Household Income in Huntland is $62,778.
What is Income or Wage Gap in Huntland?
Income or Wage Gap in Huntland is 14.4%.
Women in Huntland earn 85.6 cents for every dollar earned by a man.
What is Inequality or Gini Index in Huntland?
Inequality or Gini Index in Huntland is 0.39.
What is the Total Population of Huntland?
Total Population of Huntland is 1,218.
What is the Total Male Population of Huntland?
Total Male Population of Huntland is 640.
What is the Total Female Population of Huntland?
Total Female Population of Huntland is 578.
What is the Ratio of Males per 100 Females in Huntland?
There are 110.73 Males per 100 Females in Huntland.
What is the Ratio of Females per 100 Males in Huntland?
There are 90.31 Females per 100 Males in Huntland.
What is the Median Population Age in Huntland?
Median Population Age in Huntland is 35.4 Years.
What is the Average Family Size in Huntland
Average Family Size in Huntland is 3.6 People.
What is the Average Household Size in Huntland
Average Household Size in Huntland is 3.0 People.
How Large is the Labor Force in Huntland?
There are 492 People in the Labor Forcein in Huntland.
What is the Percentage of People in the Labor Force in Huntland?
55.2% of People are in the Labor Force in Huntland.
What is the Unemployment Rate in Huntland?
Unemployment Rate in Huntland is 1.4%.