Hohenwald, TN Map & Demographics
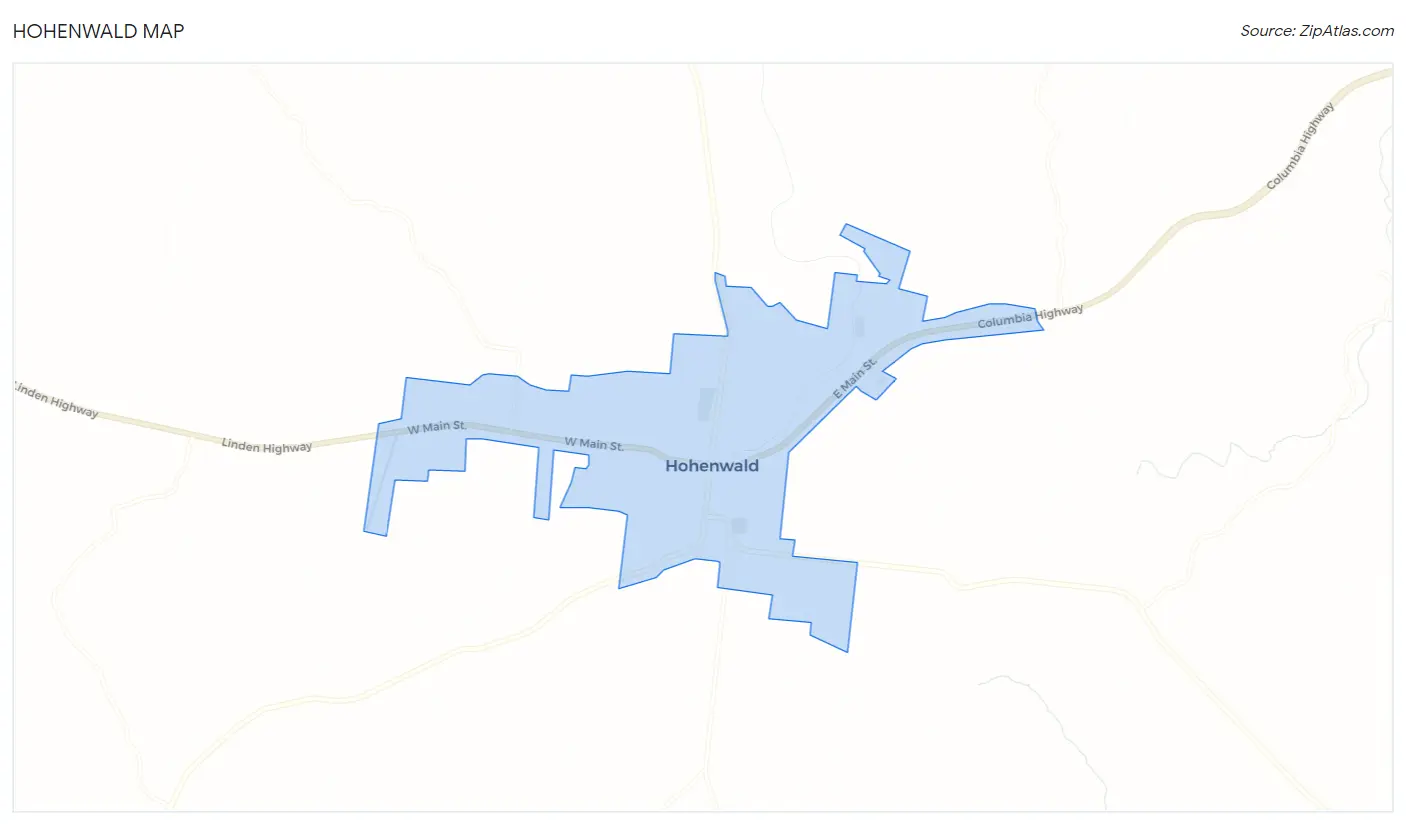
Hohenwald Map
Hohenwald Overview
$20,837
PER CAPITA INCOME
$46,458
AVG FAMILY INCOME
$36,523
AVG HOUSEHOLD INCOME
3.3%
WAGE / INCOME GAP [ % ]
96.7¢/ $1
WAGE / INCOME GAP [ $ ]
0.37
INEQUALITY / GINI INDEX
3,734
TOTAL POPULATION
2,159
MALE POPULATION
1,575
FEMALE POPULATION
137.08
MALES / 100 FEMALES
72.95
FEMALES / 100 MALES
43.0
MEDIAN AGE
3.3
AVG FAMILY SIZE
2.3
AVG HOUSEHOLD SIZE
1,565
LABOR FORCE [ PEOPLE ]
51.9%
PERCENT IN LABOR FORCE
13.8%
UNEMPLOYMENT RATE
Hohenwald Zip Codes
Hohenwald Area Codes
Income in Hohenwald
Income Overview in Hohenwald
Per Capita Income in Hohenwald is $20,837, while median incomes of families and households are $46,458 and $36,523 respectively.
| Characteristic | Number | Measure |
| Per Capita Income | 3,734 | $20,837 |
| Median Family Income | 813 | $46,458 |
| Mean Family Income | 813 | $53,136 |
| Median Household Income | 1,525 | $36,523 |
| Mean Household Income | 1,525 | $43,735 |
| Income Deficit | 813 | $0 |
| Wage / Income Gap (%) | 3,734 | 3.32% |
| Wage / Income Gap ($) | 3,734 | 96.68¢ per $1 |
| Gini / Inequality Index | 3,734 | 0.37 |
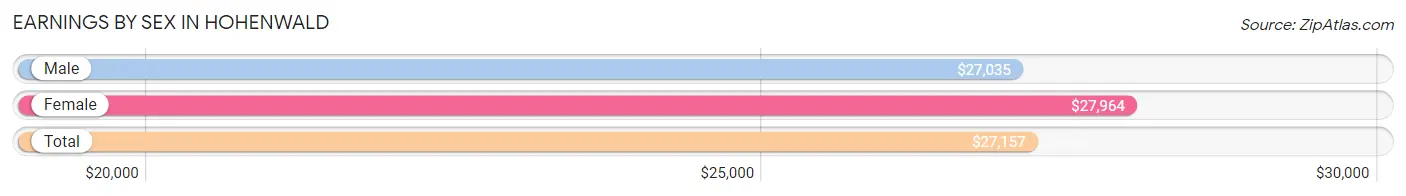
Earnings by Sex in Hohenwald
Average Earnings in Hohenwald are $27,157, $27,035 for men and $27,964 for women, a difference of 3.3%.
| Sex | Number | Average Earnings |
| Male | 1,069 (61.3%) | $27,035 |
| Female | 675 (38.7%) | $27,964 |
| Total | 1,744 (100.0%) | $27,157 |
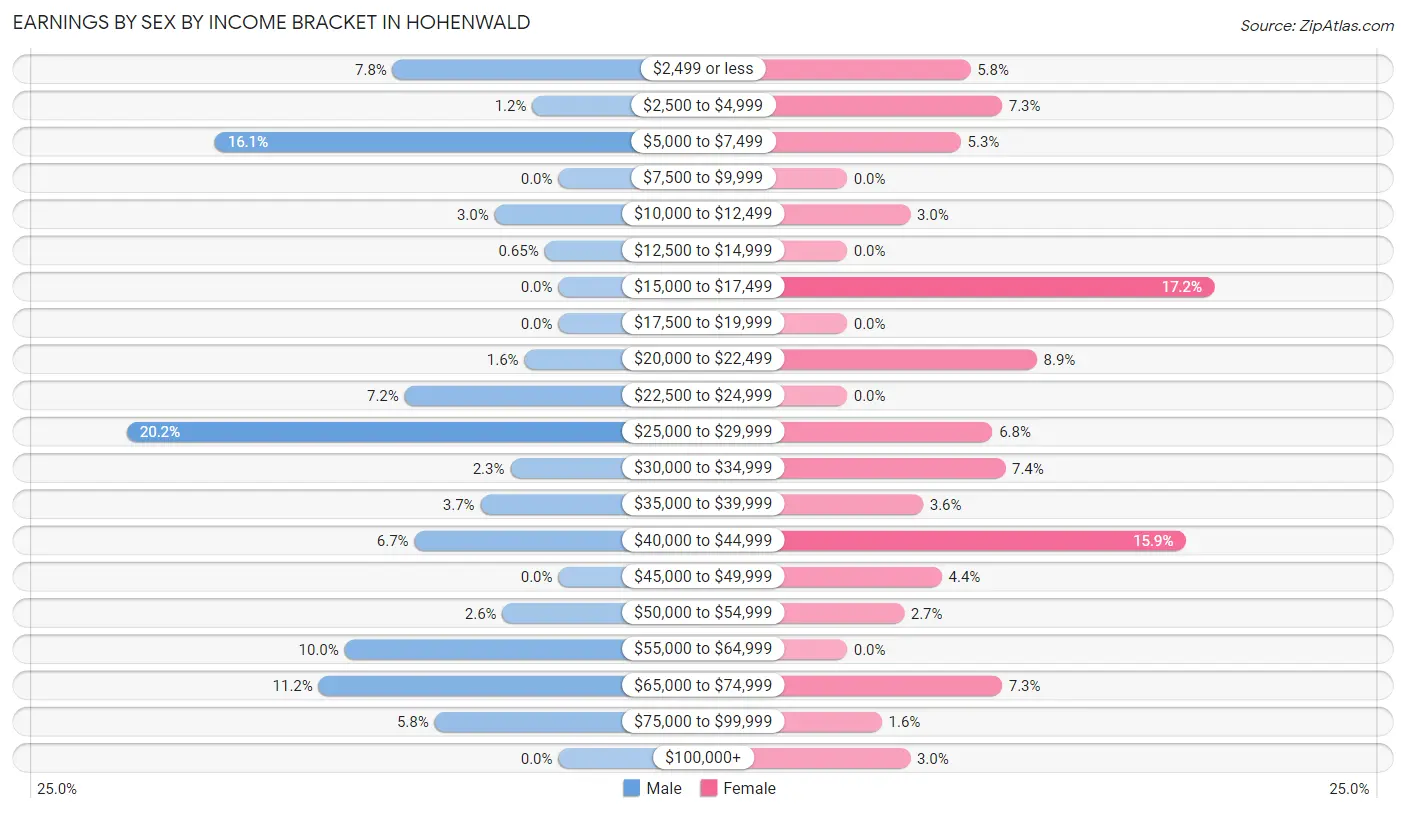
Earnings by Sex by Income Bracket in Hohenwald
The most common earnings brackets in Hohenwald are $25,000 to $29,999 for men (216 | 20.2%) and $15,000 to $17,499 for women (116 | 17.2%).
| Income | Male | Female |
| $2,499 or less | 83 (7.8%) | 39 (5.8%) |
| $2,500 to $4,999 | 13 (1.2%) | 49 (7.3%) |
| $5,000 to $7,499 | 172 (16.1%) | 36 (5.3%) |
| $7,500 to $9,999 | 0 (0.0%) | 0 (0.0%) |
| $10,000 to $12,499 | 32 (3.0%) | 20 (3.0%) |
| $12,500 to $14,999 | 7 (0.6%) | 0 (0.0%) |
| $15,000 to $17,499 | 0 (0.0%) | 116 (17.2%) |
| $17,500 to $19,999 | 0 (0.0%) | 0 (0.0%) |
| $20,000 to $22,499 | 17 (1.6%) | 60 (8.9%) |
| $22,500 to $24,999 | 77 (7.2%) | 0 (0.0%) |
| $25,000 to $29,999 | 216 (20.2%) | 46 (6.8%) |
| $30,000 to $34,999 | 24 (2.2%) | 50 (7.4%) |
| $35,000 to $39,999 | 39 (3.6%) | 24 (3.6%) |
| $40,000 to $44,999 | 72 (6.7%) | 107 (15.9%) |
| $45,000 to $49,999 | 0 (0.0%) | 30 (4.4%) |
| $50,000 to $54,999 | 28 (2.6%) | 18 (2.7%) |
| $55,000 to $64,999 | 107 (10.0%) | 0 (0.0%) |
| $65,000 to $74,999 | 120 (11.2%) | 49 (7.3%) |
| $75,000 to $99,999 | 62 (5.8%) | 11 (1.6%) |
| $100,000+ | 0 (0.0%) | 20 (3.0%) |
| Total | 1,069 (100.0%) | 675 (100.0%) |
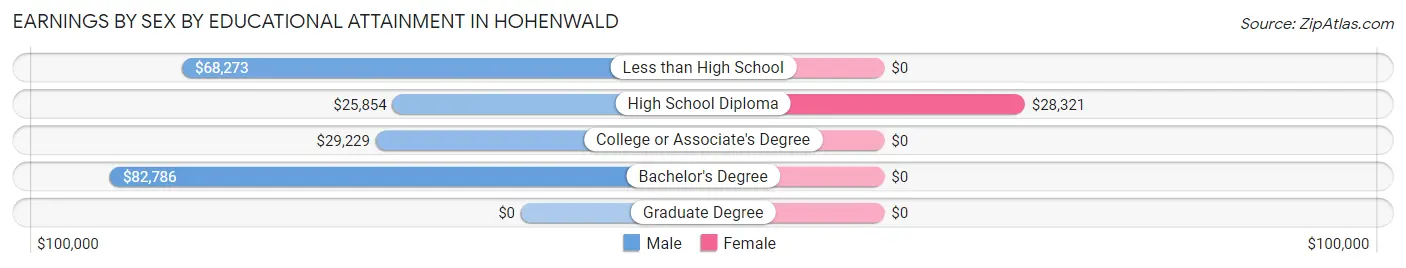
Earnings by Sex by Educational Attainment in Hohenwald
Average earnings in Hohenwald are $28,101 for men and $29,000 for women, a difference of 3.1%. Men with an educational attainment of bachelor's degree enjoy the highest average annual earnings of $82,786, while those with high school diploma education earn the least with $25,854. Women with an educational attainment of high school diploma earn the most with the average annual earnings of $28,321, while those with high school diploma education have the smallest earnings of $28,321.
| Educational Attainment | Male Income | Female Income |
| Less than High School | $68,273 | $0 |
| High School Diploma | $25,854 | $28,321 |
| College or Associate's Degree | $29,229 | $0 |
| Bachelor's Degree | $82,786 | $0 |
| Graduate Degree | - | - |
| Total | $28,101 | $29,000 |
Family Income in Hohenwald
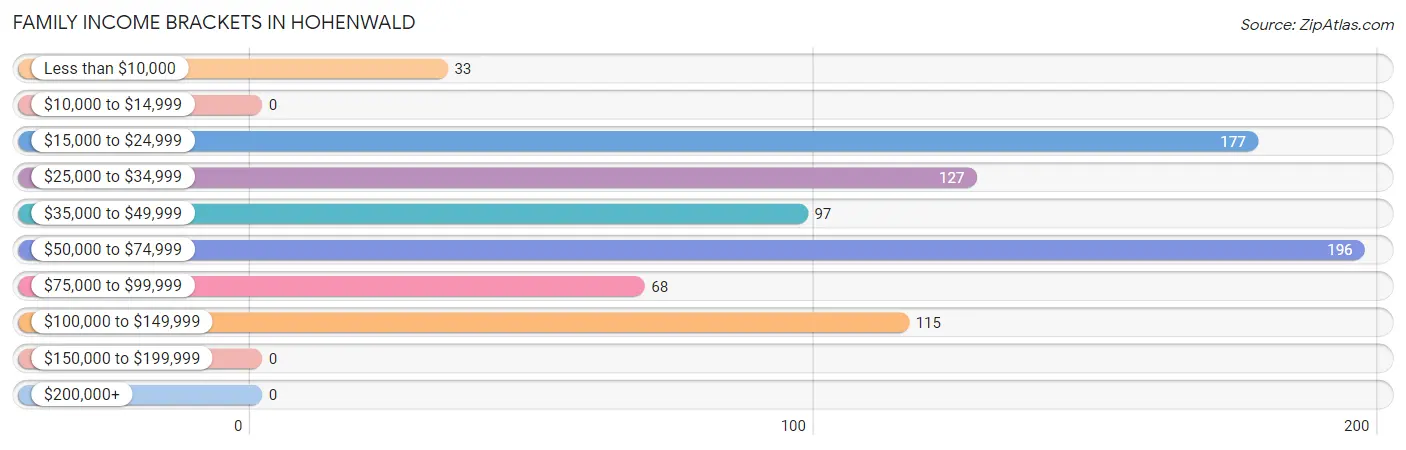
Family Income Brackets in Hohenwald
According to the Hohenwald family income data, there are 196 families falling into the $50,000 to $74,999 income range, which is the most common income bracket and makes up 24.1% of all families.
| Income Bracket | # Families | % Families |
| Less than $10,000 | 33 | 4.1% |
| $10,000 to $14,999 | 0 | 0.0% |
| $15,000 to $24,999 | 177 | 21.8% |
| $25,000 to $34,999 | 127 | 15.6% |
| $35,000 to $49,999 | 97 | 11.9% |
| $50,000 to $74,999 | 196 | 24.1% |
| $75,000 to $99,999 | 68 | 8.4% |
| $100,000 to $149,999 | 115 | 14.1% |
| $150,000 to $199,999 | 0 | 0.0% |
| $200,000+ | 0 | 0.0% |
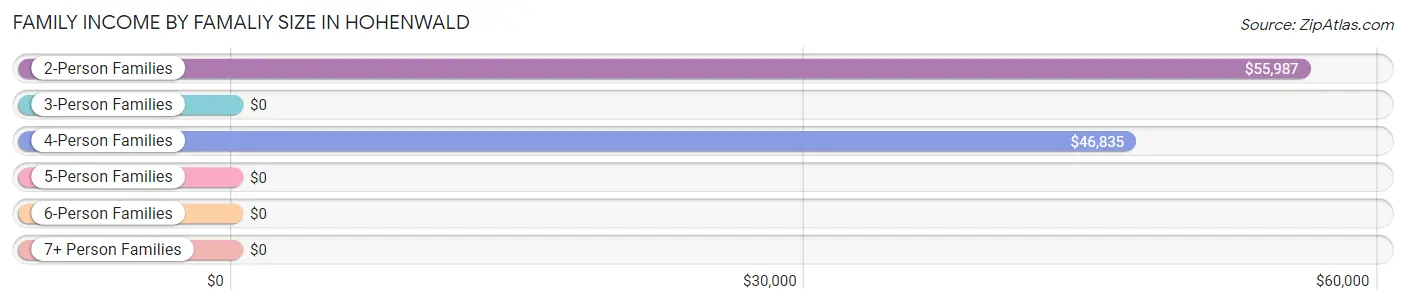
Family Income by Famaliy Size in Hohenwald
2-person families (383 | 47.1%) account for the highest median family income in Hohenwald with $55,987 per family, while 2-person families (383 | 47.1%) have the highest median income of $27,994 per family member.
| Income Bracket | # Families | Median Income |
| 2-Person Families | 383 (47.1%) | $55,987 |
| 3-Person Families | 100 (12.3%) | $0 |
| 4-Person Families | 165 (20.3%) | $46,835 |
| 5-Person Families | 61 (7.5%) | $0 |
| 6-Person Families | 4 (0.5%) | $0 |
| 7+ Person Families | 100 (12.3%) | $0 |
| Total | 813 (100.0%) | $46,458 |
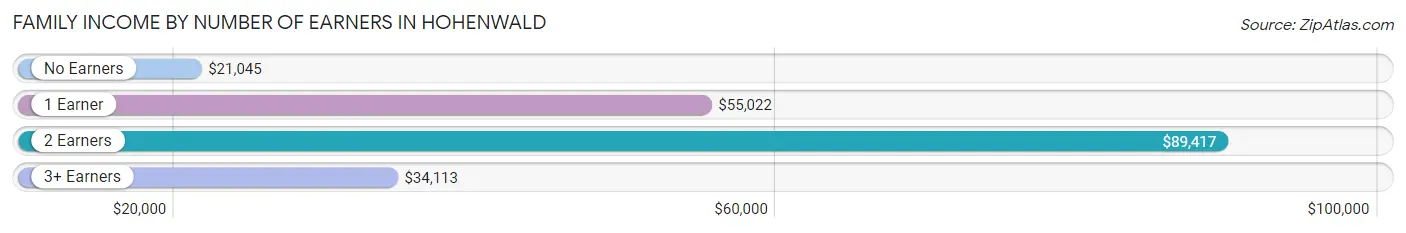
Family Income by Number of Earners in Hohenwald
The median family income in Hohenwald is $46,458, with families comprising 2 earners (276) having the highest median family income of $89,417, while families with no earners (131) have the lowest median family income of $21,045, accounting for 34.0% and 16.1% of families, respectively.
| Number of Earners | # Families | Median Income |
| No Earners | 131 (16.1%) | $21,045 |
| 1 Earner | 277 (34.1%) | $55,022 |
| 2 Earners | 276 (34.0%) | $89,417 |
| 3+ Earners | 129 (15.9%) | $34,113 |
| Total | 813 (100.0%) | $46,458 |
Household Income in Hohenwald
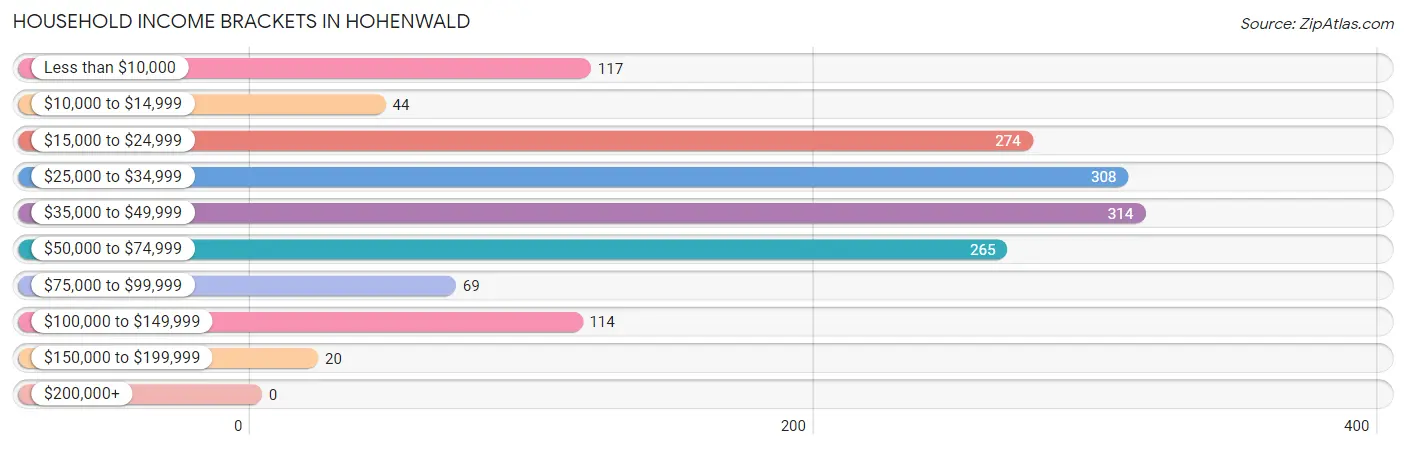
Household Income Brackets in Hohenwald
With 314 households falling in the category, the $35,000 to $49,999 income range is the most frequent in Hohenwald, accounting for 20.6% of all households.
| Income Bracket | # Households | % Households |
| Less than $10,000 | 117 | 7.7% |
| $10,000 to $14,999 | 44 | 2.9% |
| $15,000 to $24,999 | 274 | 18.0% |
| $25,000 to $34,999 | 308 | 20.2% |
| $35,000 to $49,999 | 314 | 20.6% |
| $50,000 to $74,999 | 265 | 17.4% |
| $75,000 to $99,999 | 69 | 4.5% |
| $100,000 to $149,999 | 114 | 7.5% |
| $150,000 to $199,999 | 20 | 1.3% |
| $200,000+ | 0 | 0.0% |
Household Income by Householder Age in Hohenwald
The median household income in Hohenwald is $36,523, with the highest median household income of $56,108 found in the 25 to 44 years age bracket for the primary householder. A total of 347 households (22.8%) fall into this category. Meanwhile, the 45 to 64 years age bracket for the primary householder has the lowest median household income of $33,476, with 654 households (42.9%) in this group.
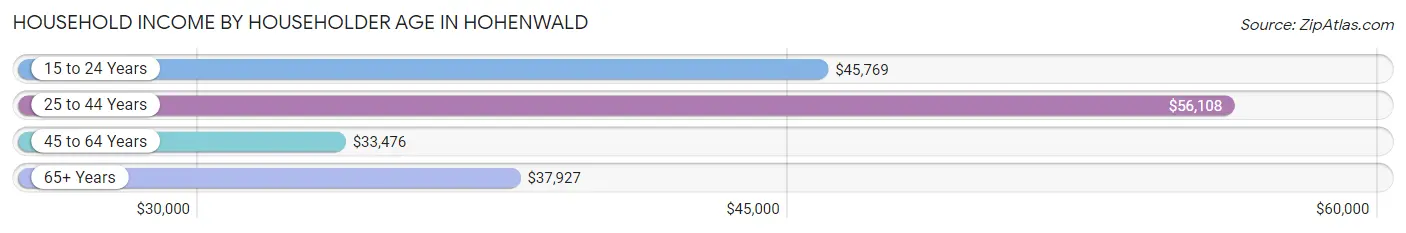
| Income Bracket | # Households | Median Income |
| 15 to 24 Years | 42 (2.8%) | $45,769 |
| 25 to 44 Years | 347 (22.8%) | $56,108 |
| 45 to 64 Years | 654 (42.9%) | $33,476 |
| 65+ Years | 482 (31.6%) | $37,927 |
| Total | 1,525 (100.0%) | $36,523 |
Poverty in Hohenwald
Income Below Poverty by Sex and Age in Hohenwald
With 34.8% poverty level for males and 18.6% for females among the residents of Hohenwald, 6 to 11 year old males and 18 to 24 year old females are the most vulnerable to poverty, with 29 males (78.4%) and 49 females (56.3%) in their respective age groups living below the poverty level.
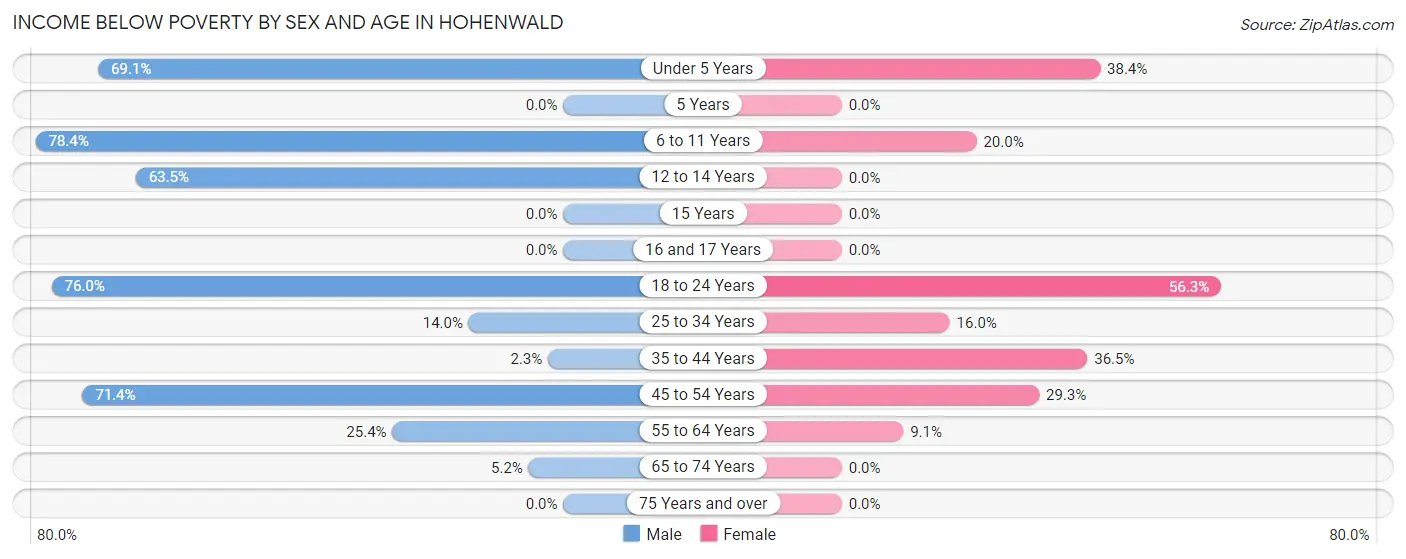
| Age Bracket | Male | Female |
| Under 5 Years | 161 (69.1%) | 28 (38.4%) |
| 5 Years | 0 (0.0%) | 0 (0.0%) |
| 6 to 11 Years | 29 (78.4%) | 34 (20.0%) |
| 12 to 14 Years | 87 (63.5%) | 0 (0.0%) |
| 15 Years | 0 (0.0%) | 0 (0.0%) |
| 16 and 17 Years | 0 (0.0%) | 0 (0.0%) |
| 18 to 24 Years | 171 (76.0%) | 49 (56.3%) |
| 25 to 34 Years | 32 (14.0%) | 33 (16.0%) |
| 35 to 44 Years | 6 (2.3%) | 70 (36.5%) |
| 45 to 54 Years | 100 (71.4%) | 41 (29.3%) |
| 55 to 64 Years | 117 (25.4%) | 25 (9.1%) |
| 65 to 74 Years | 17 (5.1%) | 0 (0.0%) |
| 75 Years and over | 0 (0.0%) | 0 (0.0%) |
| Total | 720 (34.8%) | 280 (18.6%) |
Income Above Poverty by Sex and Age in Hohenwald
According to the poverty statistics in Hohenwald, males aged 15 years and females aged 12 to 14 years are the age groups that are most secure financially, with 100.0% of males and 100.0% of females in these age groups living above the poverty line.
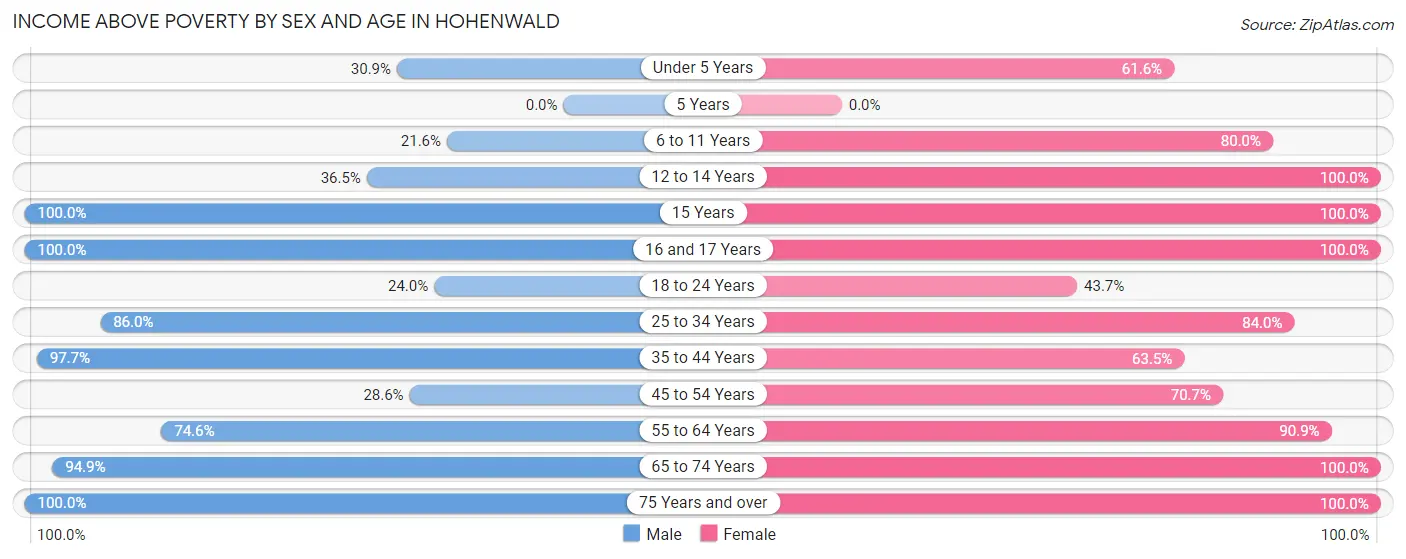
| Age Bracket | Male | Female |
| Under 5 Years | 72 (30.9%) | 45 (61.6%) |
| 5 Years | 0 (0.0%) | 0 (0.0%) |
| 6 to 11 Years | 8 (21.6%) | 136 (80.0%) |
| 12 to 14 Years | 50 (36.5%) | 42 (100.0%) |
| 15 Years | 10 (100.0%) | 17 (100.0%) |
| 16 and 17 Years | 4 (100.0%) | 13 (100.0%) |
| 18 to 24 Years | 54 (24.0%) | 38 (43.7%) |
| 25 to 34 Years | 196 (86.0%) | 173 (84.0%) |
| 35 to 44 Years | 258 (97.7%) | 122 (63.5%) |
| 45 to 54 Years | 40 (28.6%) | 99 (70.7%) |
| 55 to 64 Years | 344 (74.6%) | 249 (90.9%) |
| 65 to 74 Years | 313 (94.9%) | 231 (100.0%) |
| 75 Years and over | 1 (100.0%) | 64 (100.0%) |
| Total | 1,350 (65.2%) | 1,229 (81.4%) |
Income Below Poverty Among Married-Couple Families in Hohenwald
The poverty statistics for married-couple families in Hohenwald show that 24.3% or 141 of the total 580 families live below the poverty line. Families with 3 or 4 children have the highest poverty rate of 92.6%, comprising of 100 families. On the other hand, families with 1 or 2 children have the lowest poverty rate of 0.0%, which includes 0 families.
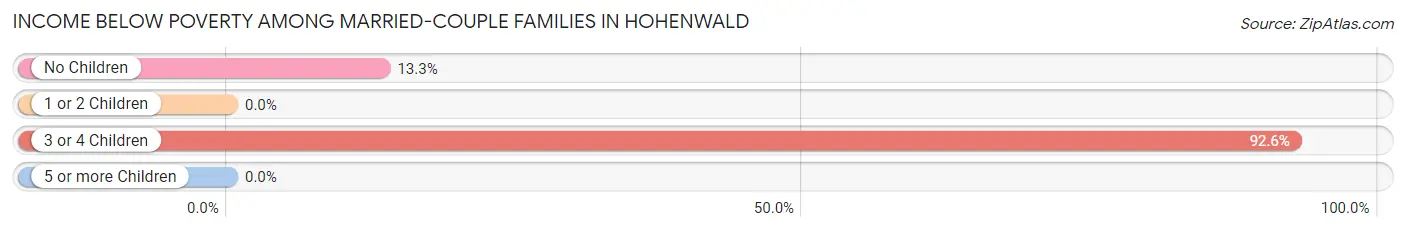
| Children | Above Poverty | Below Poverty |
| No Children | 268 (86.7%) | 41 (13.3%) |
| 1 or 2 Children | 163 (100.0%) | 0 (0.0%) |
| 3 or 4 Children | 8 (7.4%) | 100 (92.6%) |
| 5 or more Children | 0 (0.0%) | 0 (0.0%) |
| Total | 439 (75.7%) | 141 (24.3%) |
Income Below Poverty Among Single-Parent Households in Hohenwald
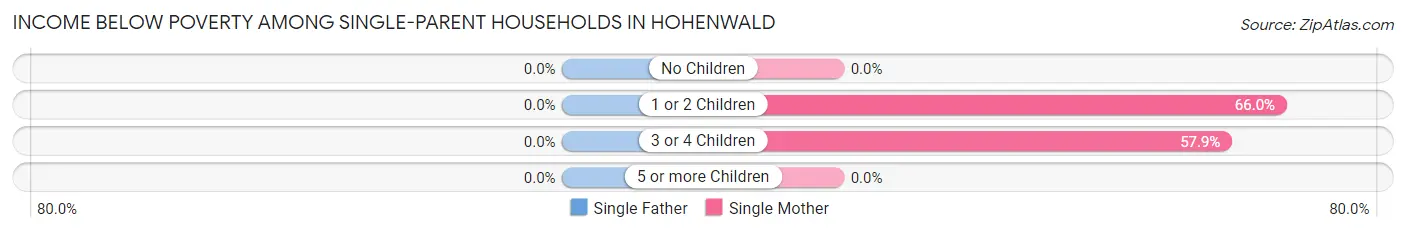
| Children | Single Father | Single Mother |
| No Children | 0 (0.0%) | 0 (0.0%) |
| 1 or 2 Children | 0 (0.0%) | 35 (66.0%) |
| 3 or 4 Children | 0 (0.0%) | 33 (57.9%) |
| 5 or more Children | 0 (0.0%) | 0 (0.0%) |
| Total | 0 (0.0%) | 68 (49.6%) |
Income Below Poverty Among Married-Couple vs Single-Parent Households in Hohenwald
The poverty data for Hohenwald shows that 141 of the married-couple family households (24.3%) and 68 of the single-parent households (29.2%) are living below the poverty level. Within the married-couple family households, those with 3 or 4 children have the highest poverty rate, with 100 households (92.6%) falling below the poverty line. Among the single-parent households, those with 1 or 2 children have the highest poverty rate, with 35 household (66.0%) living below poverty.
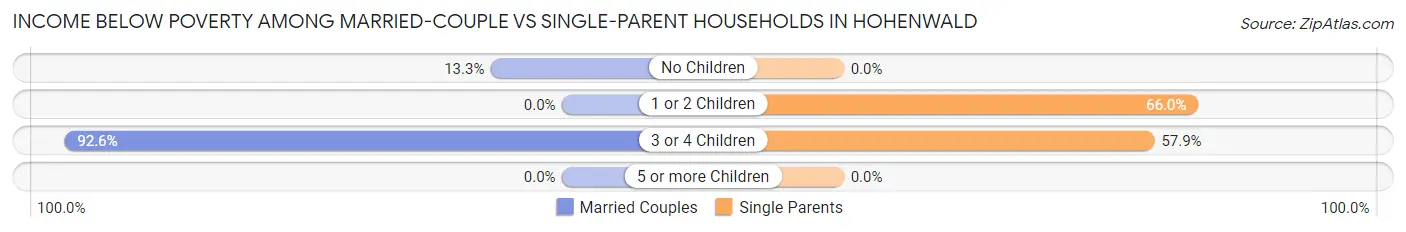
| Children | Married-Couple Families | Single-Parent Households |
| No Children | 41 (13.3%) | 0 (0.0%) |
| 1 or 2 Children | 0 (0.0%) | 35 (66.0%) |
| 3 or 4 Children | 100 (92.6%) | 33 (57.9%) |
| 5 or more Children | 0 (0.0%) | 0 (0.0%) |
| Total | 141 (24.3%) | 68 (29.2%) |
Race in Hohenwald
The most populous races in Hohenwald are White / Caucasian (3,509 | 94.0%), Two or more Races (125 | 3.4%), and Asian (85 | 2.3%).
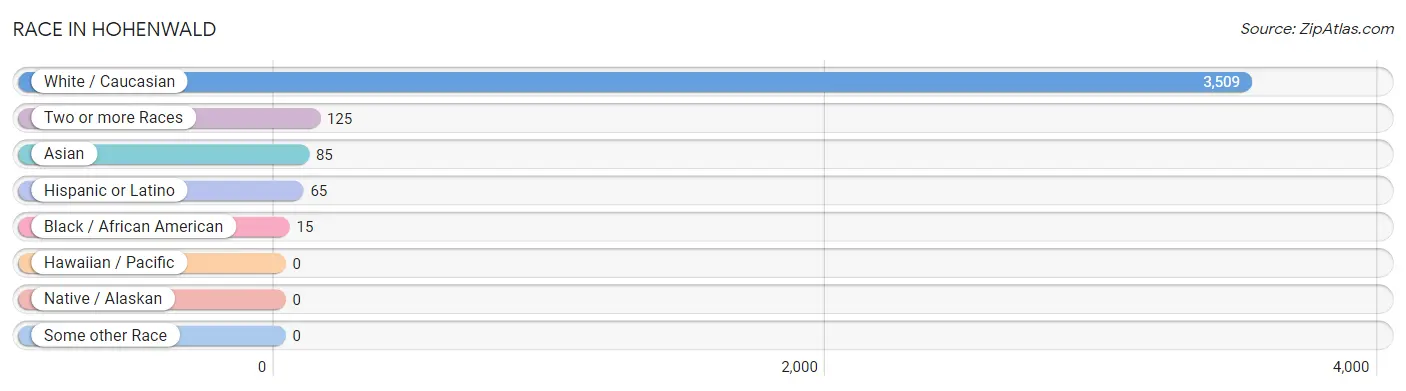
| Race | # Population | % Population |
| Asian | 85 | 2.3% |
| Black / African American | 15 | 0.4% |
| Hawaiian / Pacific | 0 | 0.0% |
| Hispanic or Latino | 65 | 1.7% |
| Native / Alaskan | 0 | 0.0% |
| White / Caucasian | 3,509 | 94.0% |
| Two or more Races | 125 | 3.4% |
| Some other Race | 0 | 0.0% |
| Total | 3,734 | 100.0% |
Ancestry in Hohenwald
The most populous ancestries reported in Hohenwald are American (884 | 23.7%), German (486 | 13.0%), English (398 | 10.7%), Irish (173 | 4.6%), and Dutch (100 | 2.7%), together accounting for 54.7% of all Hohenwald residents.
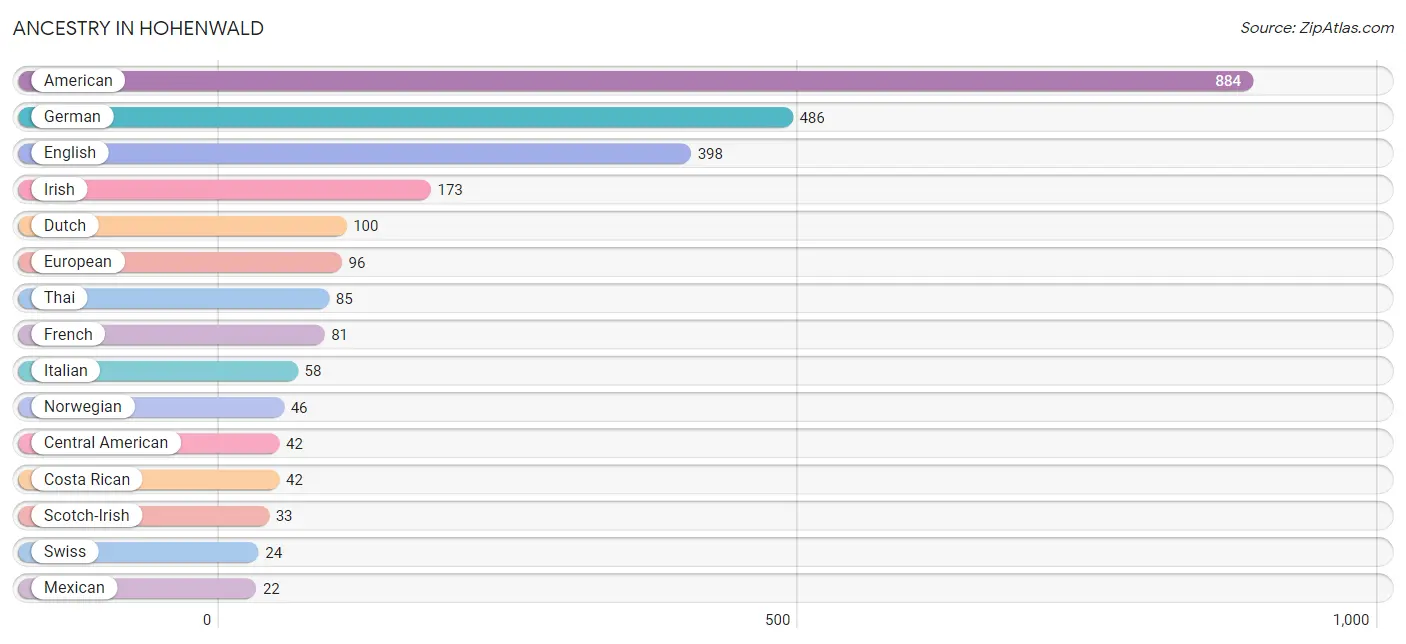
| Ancestry | # Population | % Population |
| American | 884 | 23.7% |
| Central American | 42 | 1.1% |
| Costa Rican | 42 | 1.1% |
| Dutch | 100 | 2.7% |
| English | 398 | 10.7% |
| European | 96 | 2.6% |
| French | 81 | 2.2% |
| German | 486 | 13.0% |
| Irish | 173 | 4.6% |
| Italian | 58 | 1.5% |
| Mexican | 22 | 0.6% |
| Norwegian | 46 | 1.2% |
| Polish | 11 | 0.3% |
| Russian | 11 | 0.3% |
| Scotch-Irish | 33 | 0.9% |
| Scottish | 5 | 0.1% |
| Spaniard | 1 | 0.0% |
| Swiss | 24 | 0.6% |
| Thai | 85 | 2.3% |
| Welsh | 4 | 0.1% | View All 20 Rows |
Immigrants in Hohenwald
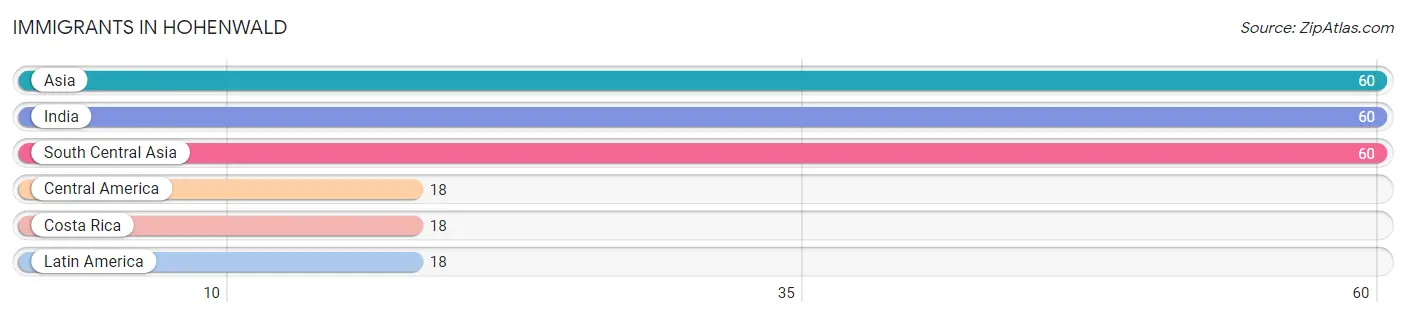
The most numerous immigrant groups reported in Hohenwald came from Asia (60 | 1.6%), India (60 | 1.6%), South Central Asia (60 | 1.6%), Central America (18 | 0.5%), and Costa Rica (18 | 0.5%), together accounting for 5.8% of all Hohenwald residents.
| Immigration Origin | # Population | % Population |
| Asia | 60 | 1.6% |
| Central America | 18 | 0.5% |
| Costa Rica | 18 | 0.5% |
| India | 60 | 1.6% |
| Latin America | 18 | 0.5% |
| South Central Asia | 60 | 1.6% | View All 6 Rows |
Sex and Age in Hohenwald
Sex and Age in Hohenwald
The most populous age groups in Hohenwald are 60 to 64 Years (427 | 19.8%) for men and 40 to 44 Years (162 | 10.3%) for women.
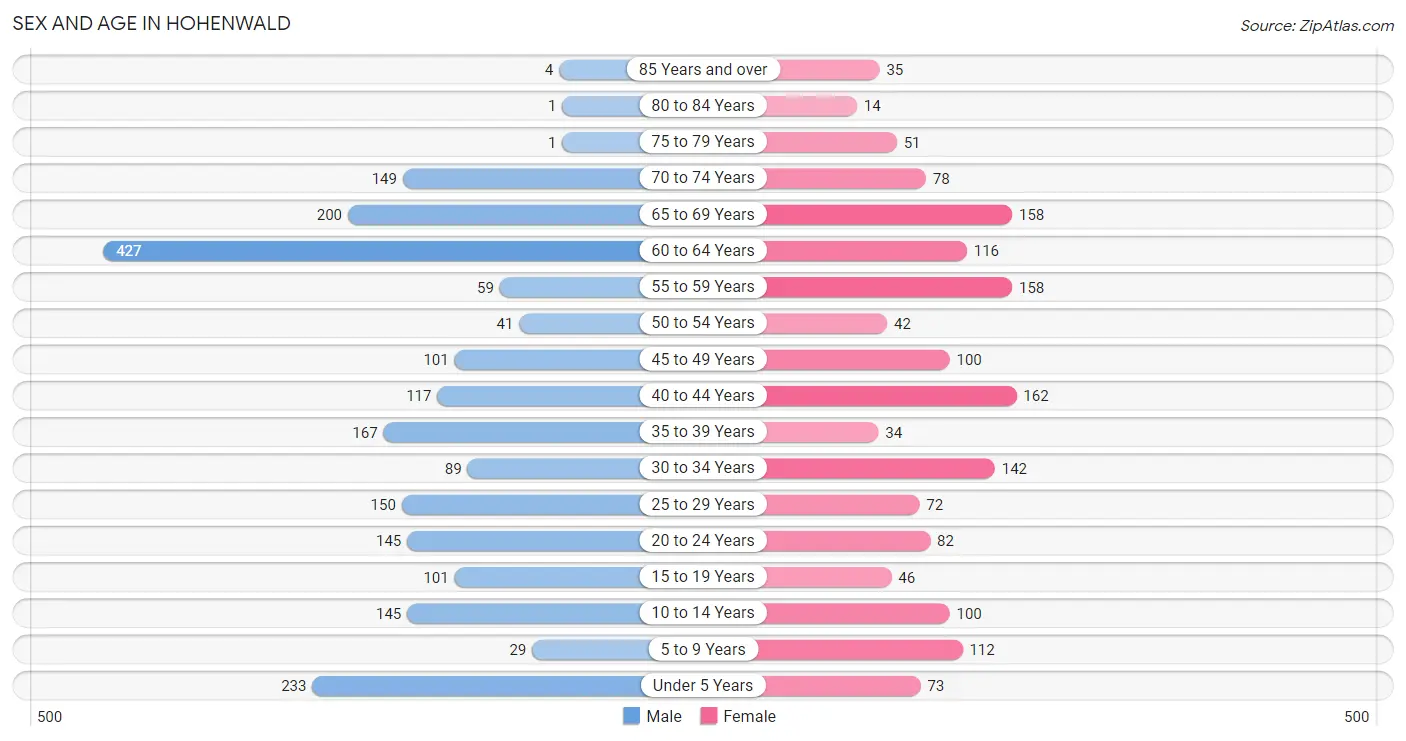
| Age Bracket | Male | Female |
| Under 5 Years | 233 (10.8%) | 73 (4.6%) |
| 5 to 9 Years | 29 (1.3%) | 112 (7.1%) |
| 10 to 14 Years | 145 (6.7%) | 100 (6.4%) |
| 15 to 19 Years | 101 (4.7%) | 46 (2.9%) |
| 20 to 24 Years | 145 (6.7%) | 82 (5.2%) |
| 25 to 29 Years | 150 (7.0%) | 72 (4.6%) |
| 30 to 34 Years | 89 (4.1%) | 142 (9.0%) |
| 35 to 39 Years | 167 (7.7%) | 34 (2.2%) |
| 40 to 44 Years | 117 (5.4%) | 162 (10.3%) |
| 45 to 49 Years | 101 (4.7%) | 100 (6.4%) |
| 50 to 54 Years | 41 (1.9%) | 42 (2.7%) |
| 55 to 59 Years | 59 (2.7%) | 158 (10.0%) |
| 60 to 64 Years | 427 (19.8%) | 116 (7.4%) |
| 65 to 69 Years | 200 (9.3%) | 158 (10.0%) |
| 70 to 74 Years | 149 (6.9%) | 78 (5.0%) |
| 75 to 79 Years | 1 (0.1%) | 51 (3.2%) |
| 80 to 84 Years | 1 (0.1%) | 14 (0.9%) |
| 85 Years and over | 4 (0.2%) | 35 (2.2%) |
| Total | 2,159 (100.0%) | 1,575 (100.0%) |
Families and Households in Hohenwald
Median Family Size in Hohenwald
The median family size in Hohenwald is 3.32 persons per family, with single female/mother families (137 | 16.9%) accounting for the largest median family size of 4.24 persons per family. On the other hand, single male/father families (96 | 11.8%) represent the smallest median family size with 2.05 persons per family.
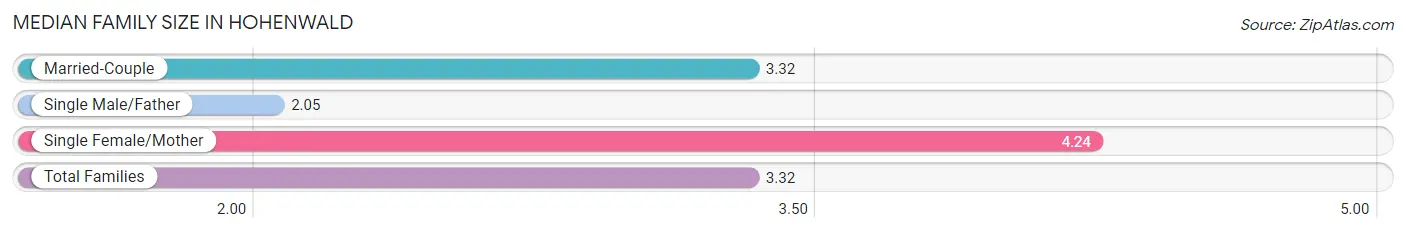
| Family Type | # Families | Family Size |
| Married-Couple | 580 (71.3%) | 3.32 |
| Single Male/Father | 96 (11.8%) | 2.05 |
| Single Female/Mother | 137 (16.9%) | 4.24 |
| Total Families | 813 (100.0%) | 3.32 |
Median Household Size in Hohenwald
The median household size in Hohenwald is 2.29 persons per household, with single female/mother households (137 | 9.0%) accounting for the largest median household size of 4.24 persons per household. non-family households (712 | 46.7%) represent the smallest median household size with 1.12 persons per household.
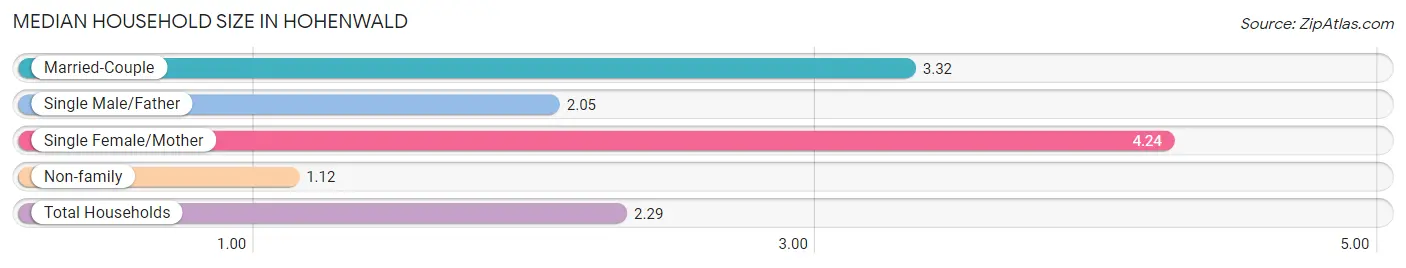
| Household Type | # Households | Household Size |
| Married-Couple | 580 (38.0%) | 3.32 |
| Single Male/Father | 96 (6.3%) | 2.05 |
| Single Female/Mother | 137 (9.0%) | 4.24 |
| Non-family | 712 (46.7%) | 1.12 |
| Total Households | 1,525 (100.0%) | 2.29 |
Household Size by Marriage Status in Hohenwald
Out of a total of 1,525 households in Hohenwald, 813 (53.3%) are family households, while 712 (46.7%) are nonfamily households. The most numerous type of family households are 2-person households, comprising 383, and the most common type of nonfamily households are 1-person households, comprising 656.
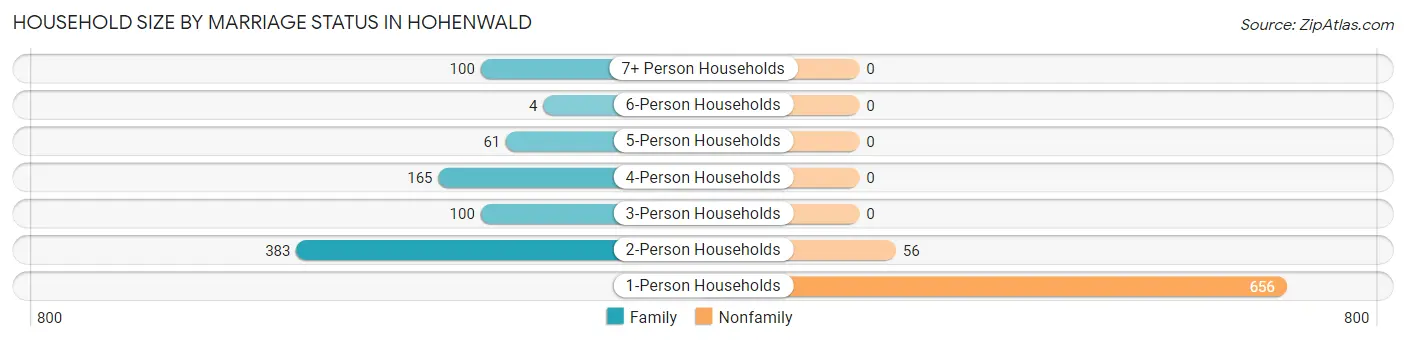
| Household Size | Family Households | Nonfamily Households |
| 1-Person Households | - | 656 (43.0%) |
| 2-Person Households | 383 (25.1%) | 56 (3.7%) |
| 3-Person Households | 100 (6.6%) | 0 (0.0%) |
| 4-Person Households | 165 (10.8%) | 0 (0.0%) |
| 5-Person Households | 61 (4.0%) | 0 (0.0%) |
| 6-Person Households | 4 (0.3%) | 0 (0.0%) |
| 7+ Person Households | 100 (6.6%) | 0 (0.0%) |
| Total | 813 (53.3%) | 712 (46.7%) |
Female Fertility in Hohenwald
Fertility by Age in Hohenwald
Average fertility rate in Hohenwald is 52.0 births per 1,000 women. Women in the age bracket of 20 to 34 years have the highest fertility rate with 111.0 births per 1,000 women. Women in the age bracket of 20 to 34 years acount for 100.0% of all women with births.
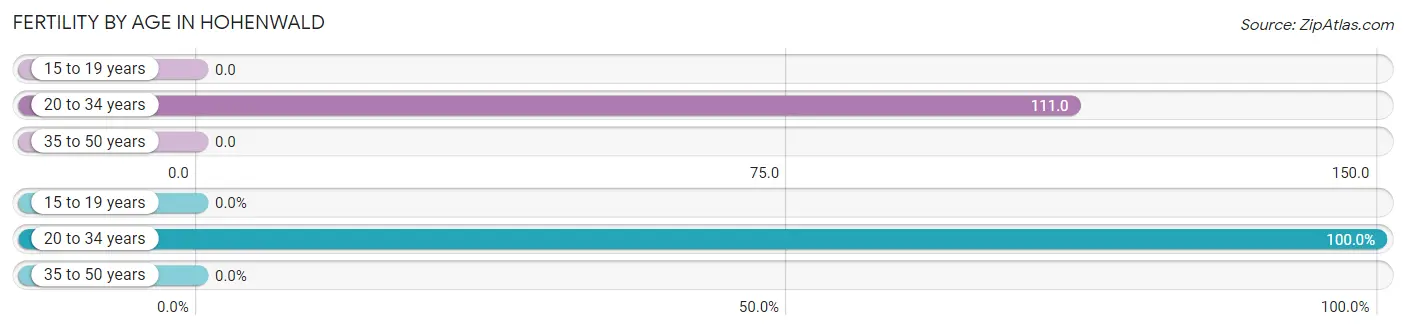
| Age Bracket | Women with Births | Births / 1,000 Women |
| 15 to 19 years | 0 (0.0%) | 0.0 |
| 20 to 34 years | 33 (100.0%) | 111.0 |
| 35 to 50 years | 0 (0.0%) | 0.0 |
| Total | 33 (100.0%) | 52.0 |
Fertility by Age by Marriage Status in Hohenwald
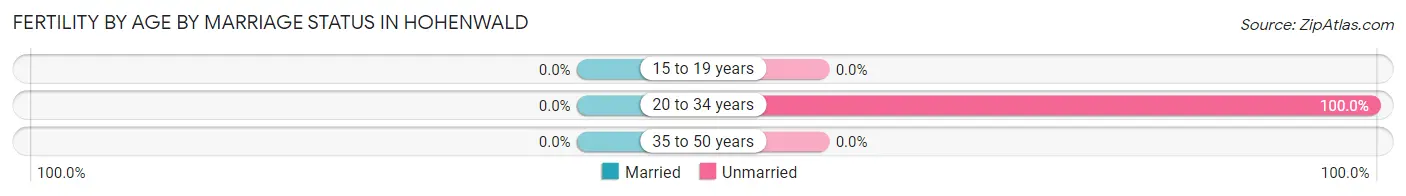
| Age Bracket | Married | Unmarried |
| 15 to 19 years | 0 (0.0%) | 0 (0.0%) |
| 20 to 34 years | 0 (0.0%) | 33 (100.0%) |
| 35 to 50 years | 0 (0.0%) | 0 (0.0%) |
| Total | 0 (0.0%) | 33 (100.0%) |
Fertility by Education in Hohenwald
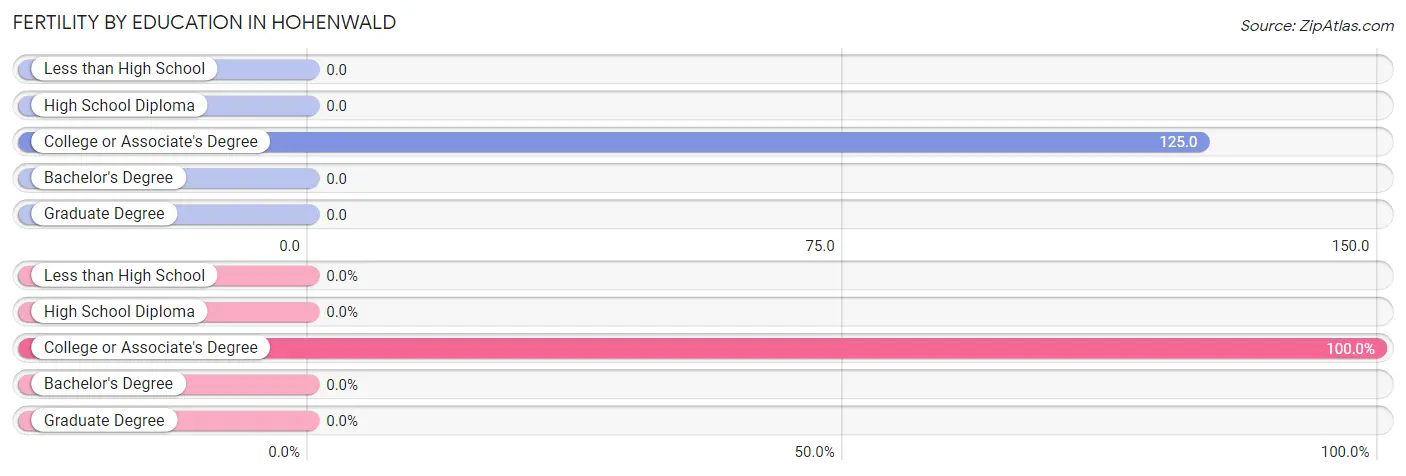
| Educational Attainment | Women with Births | Births / 1,000 Women |
| Less than High School | 0 (0.0%) | 0.0 |
| High School Diploma | 0 (0.0%) | 0.0 |
| College or Associate's Degree | 33 (100.0%) | 125.0 |
| Bachelor's Degree | 0 (0.0%) | 0.0 |
| Graduate Degree | 0 (0.0%) | 0.0 |
| Total | 33 (100.0%) | 52.0 |
Fertility by Education by Marriage Status in Hohenwald
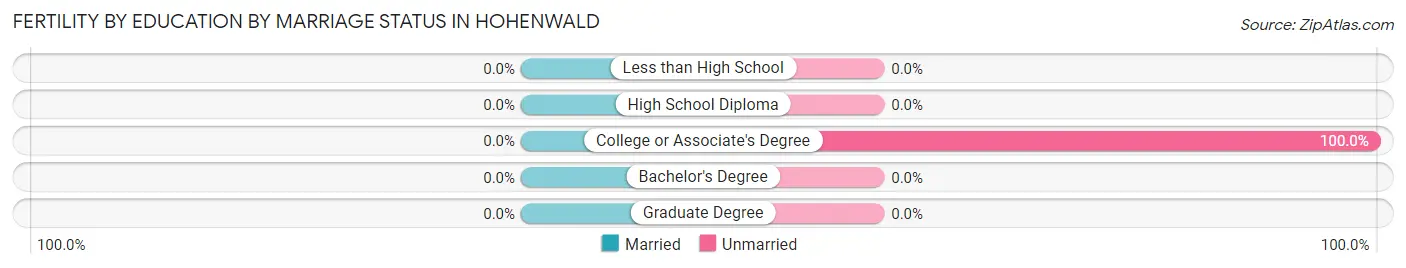
| Educational Attainment | Married | Unmarried |
| Less than High School | 0 (0.0%) | 0 (0.0%) |
| High School Diploma | 0 (0.0%) | 0 (0.0%) |
| College or Associate's Degree | 0 (0.0%) | 33 (100.0%) |
| Bachelor's Degree | 0 (0.0%) | 0 (0.0%) |
| Graduate Degree | 0 (0.0%) | 0 (0.0%) |
| Total | 0 (0.0%) | 33 (100.0%) |
Employment Characteristics in Hohenwald
Employment by Class of Employer in Hohenwald
Among the 1,350 employed individuals in Hohenwald, private company employees (783 | 58.0%), state government employees (211 | 15.6%), and self-employed (not incorporated) (182 | 13.5%) make up the most common classes of employment.
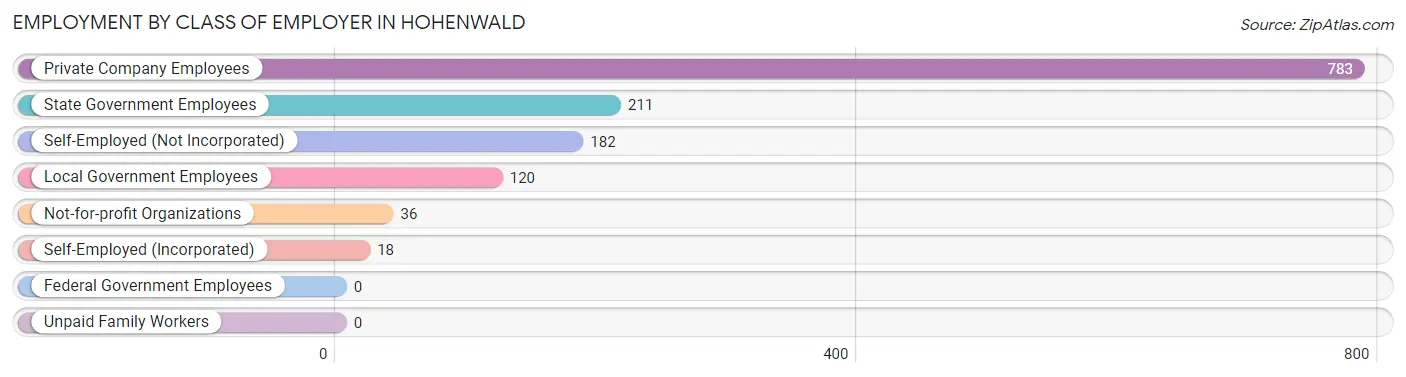
| Employer Class | # Employees | % Employees |
| Private Company Employees | 783 | 58.0% |
| Self-Employed (Incorporated) | 18 | 1.3% |
| Self-Employed (Not Incorporated) | 182 | 13.5% |
| Not-for-profit Organizations | 36 | 2.7% |
| Local Government Employees | 120 | 8.9% |
| State Government Employees | 211 | 15.6% |
| Federal Government Employees | 0 | 0.0% |
| Unpaid Family Workers | 0 | 0.0% |
| Total | 1,350 | 100.0% |
Employment Status by Age in Hohenwald
According to the labor force statistics for Hohenwald, out of the total population over 16 years of age (3,015), 51.9% or 1,565 individuals are in the labor force, with 13.8% or 216 of them unemployed. The age group with the highest labor force participation rate is 25 to 29 years, with 88.7% or 197 individuals in the labor force. Within the labor force, the 20 to 24 years age range has the highest percentage of unemployed individuals, with 82.6% or 128 of them being unemployed.
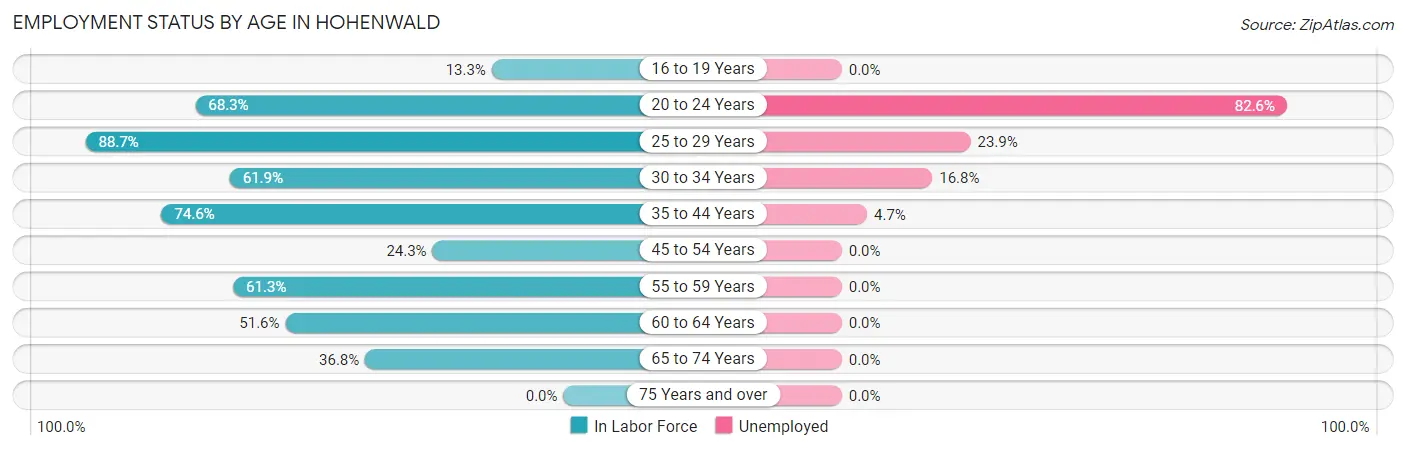
| Age Bracket | In Labor Force | Unemployed |
| 16 to 19 Years | 16 (13.3%) | 0 (0.0%) |
| 20 to 24 Years | 155 (68.3%) | 128 (82.6%) |
| 25 to 29 Years | 197 (88.7%) | 47 (23.9%) |
| 30 to 34 Years | 143 (61.9%) | 24 (16.8%) |
| 35 to 44 Years | 358 (74.6%) | 17 (4.7%) |
| 45 to 54 Years | 69 (24.3%) | 0 (0.0%) |
| 55 to 59 Years | 133 (61.3%) | 0 (0.0%) |
| 60 to 64 Years | 280 (51.6%) | 0 (0.0%) |
| 65 to 74 Years | 215 (36.8%) | 0 (0.0%) |
| 75 Years and over | 0 (0.0%) | 0 (0.0%) |
| Total | 1,565 (51.9%) | 216 (13.8%) |
Employment Status by Educational Attainment in Hohenwald
According to labor force statistics for Hohenwald, 59.7% of individuals (1,180) out of the total population between 25 and 64 years of age (1,977) are in the labor force, with 7.5% or 88 of them being unemployed. The group with the highest labor force participation rate are those with the educational attainment of bachelor's degree or higher, with 74.8% or 163 individuals in the labor force. Within the labor force, individuals with high school diploma education have the highest percentage of unemployment, with 11.8% or 47 of them being unemployed.
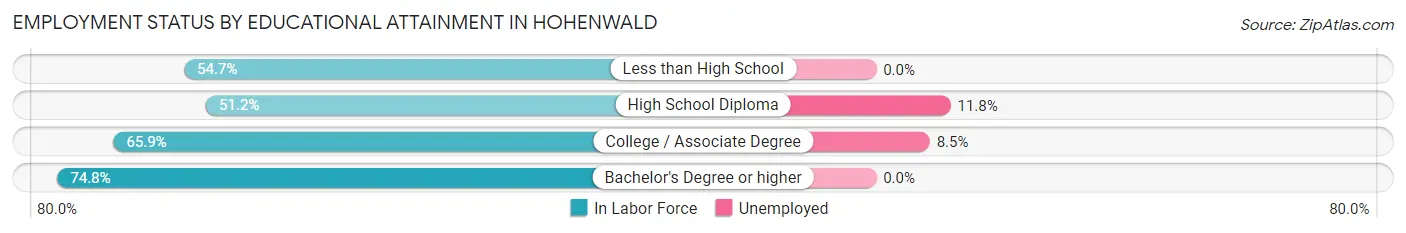
| Educational Attainment | In Labor Force | Unemployed |
| Less than High School | 134 (54.7%) | 0 (0.0%) |
| High School Diploma | 399 (51.2%) | 92 (11.8%) |
| College / Associate Degree | 484 (65.9%) | 62 (8.5%) |
| Bachelor's Degree or higher | 163 (74.8%) | 0 (0.0%) |
| Total | 1,180 (59.7%) | 148 (7.5%) |
Employment Occupations by Sex in Hohenwald
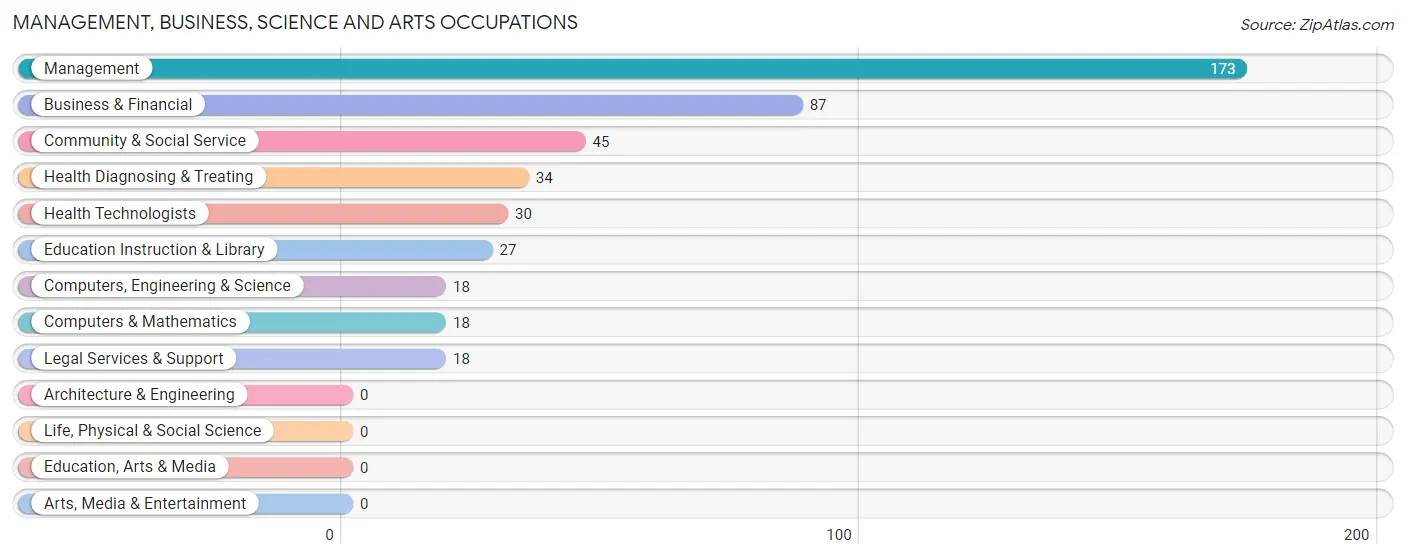
Management, Business, Science and Arts Occupations
The most common Management, Business, Science and Arts occupations in Hohenwald are Management (173 | 12.8%), Business & Financial (87 | 6.4%), Community & Social Service (45 | 3.3%), Health Diagnosing & Treating (34 | 2.5%), and Health Technologists (30 | 2.2%).
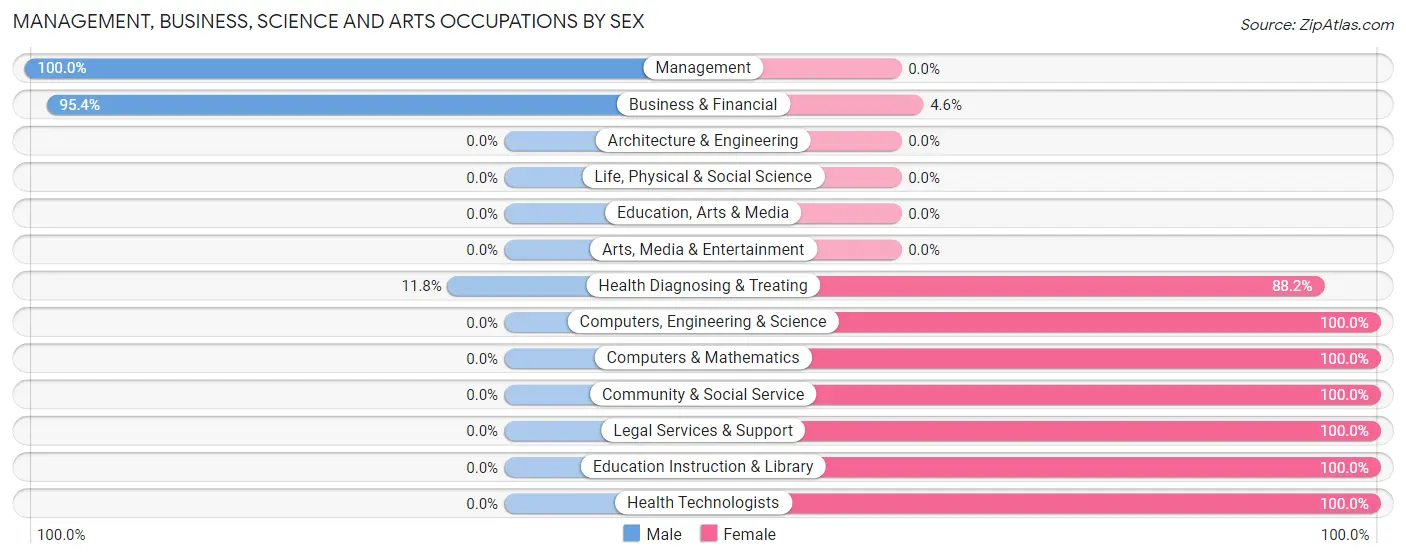
Management, Business, Science and Arts Occupations by Sex
Within the Management, Business, Science and Arts occupations in Hohenwald, the most male-oriented occupations are Management (100.0%), Business & Financial (95.4%), and Health Diagnosing & Treating (11.8%), while the most female-oriented occupations are Computers, Engineering & Science (100.0%), Computers & Mathematics (100.0%), and Community & Social Service (100.0%).
| Occupation | Male | Female |
| Management | 173 (100.0%) | 0 (0.0%) |
| Business & Financial | 83 (95.4%) | 4 (4.6%) |
| Computers, Engineering & Science | 0 (0.0%) | 18 (100.0%) |
| Computers & Mathematics | 0 (0.0%) | 18 (100.0%) |
| Architecture & Engineering | 0 (0.0%) | 0 (0.0%) |
| Life, Physical & Social Science | 0 (0.0%) | 0 (0.0%) |
| Community & Social Service | 0 (0.0%) | 45 (100.0%) |
| Education, Arts & Media | 0 (0.0%) | 0 (0.0%) |
| Legal Services & Support | 0 (0.0%) | 18 (100.0%) |
| Education Instruction & Library | 0 (0.0%) | 27 (100.0%) |
| Arts, Media & Entertainment | 0 (0.0%) | 0 (0.0%) |
| Health Diagnosing & Treating | 4 (11.8%) | 30 (88.2%) |
| Health Technologists | 0 (0.0%) | 30 (100.0%) |
| Total (Category) | 260 (72.8%) | 97 (27.2%) |
| Total (Overall) | 822 (60.9%) | 528 (39.1%) |
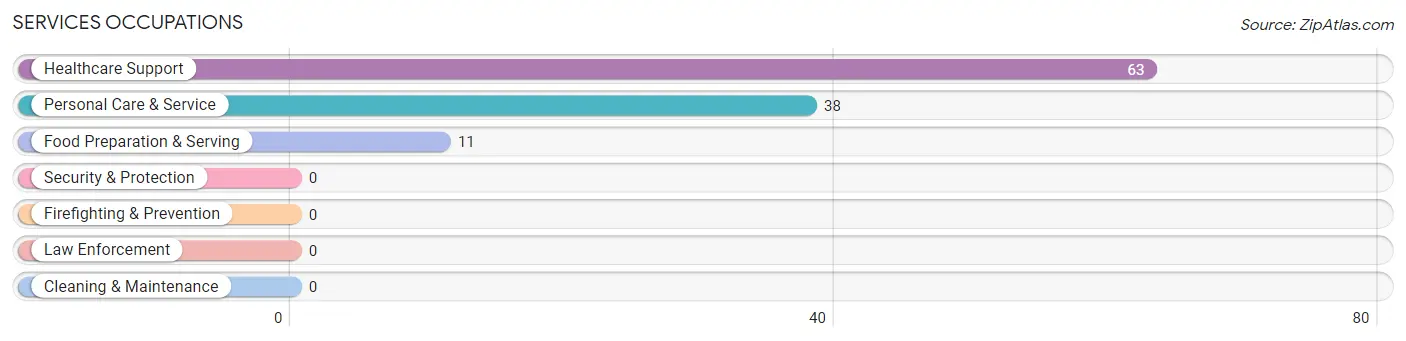
Services Occupations
The most common Services occupations in Hohenwald are Healthcare Support (63 | 4.7%), Personal Care & Service (38 | 2.8%), and Food Preparation & Serving (11 | 0.8%).
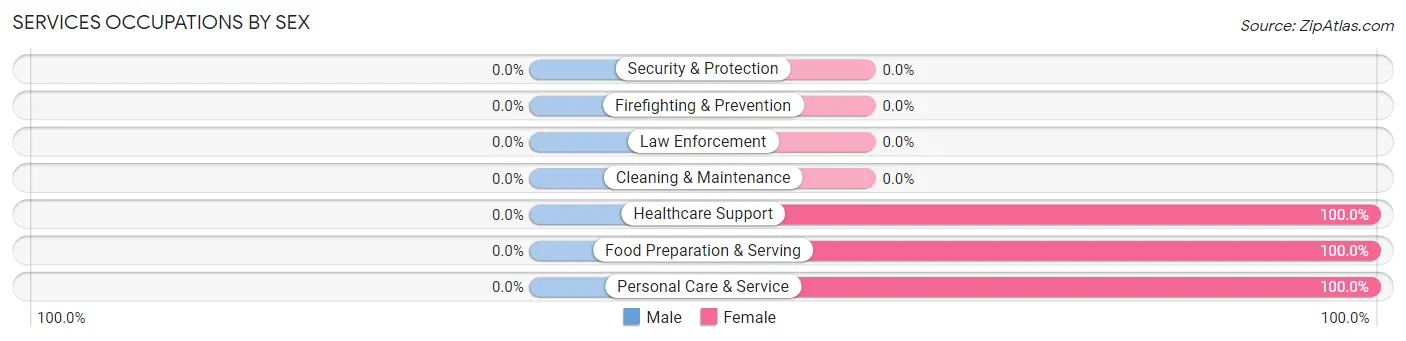
Services Occupations by Sex
| Occupation | Male | Female |
| Healthcare Support | 0 (0.0%) | 63 (100.0%) |
| Security & Protection | 0 (0.0%) | 0 (0.0%) |
| Firefighting & Prevention | 0 (0.0%) | 0 (0.0%) |
| Law Enforcement | 0 (0.0%) | 0 (0.0%) |
| Food Preparation & Serving | 0 (0.0%) | 11 (100.0%) |
| Cleaning & Maintenance | 0 (0.0%) | 0 (0.0%) |
| Personal Care & Service | 0 (0.0%) | 38 (100.0%) |
| Total (Category) | 0 (0.0%) | 112 (100.0%) |
| Total (Overall) | 822 (60.9%) | 528 (39.1%) |
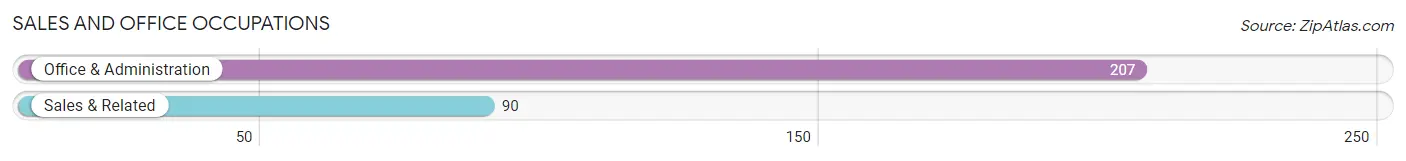
Sales and Office Occupations
The most common Sales and Office occupations in Hohenwald are Office & Administration (207 | 15.3%), and Sales & Related (90 | 6.7%).
Sales and Office Occupations by Sex
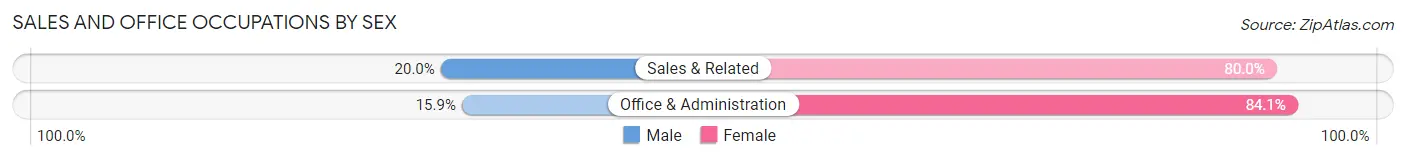
| Occupation | Male | Female |
| Sales & Related | 18 (20.0%) | 72 (80.0%) |
| Office & Administration | 33 (15.9%) | 174 (84.1%) |
| Total (Category) | 51 (17.2%) | 246 (82.8%) |
| Total (Overall) | 822 (60.9%) | 528 (39.1%) |
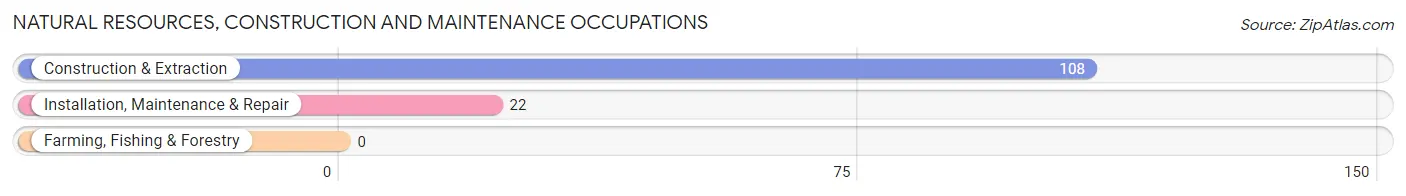
Natural Resources, Construction and Maintenance Occupations
The most common Natural Resources, Construction and Maintenance occupations in Hohenwald are Construction & Extraction (108 | 8.0%), and Installation, Maintenance & Repair (22 | 1.6%).
Natural Resources, Construction and Maintenance Occupations by Sex
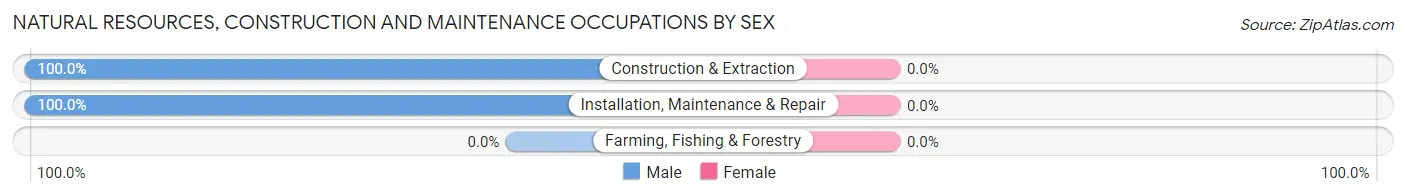
| Occupation | Male | Female |
| Farming, Fishing & Forestry | 0 (0.0%) | 0 (0.0%) |
| Construction & Extraction | 108 (100.0%) | 0 (0.0%) |
| Installation, Maintenance & Repair | 22 (100.0%) | 0 (0.0%) |
| Total (Category) | 130 (100.0%) | 0 (0.0%) |
| Total (Overall) | 822 (60.9%) | 528 (39.1%) |
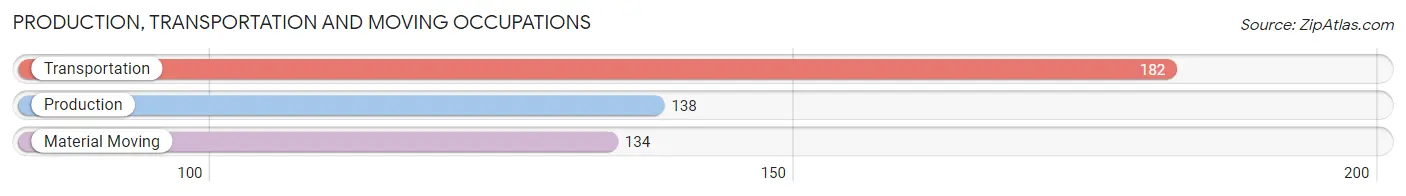
Production, Transportation and Moving Occupations
The most common Production, Transportation and Moving occupations in Hohenwald are Transportation (182 | 13.5%), Production (138 | 10.2%), and Material Moving (134 | 9.9%).
Production, Transportation and Moving Occupations by Sex
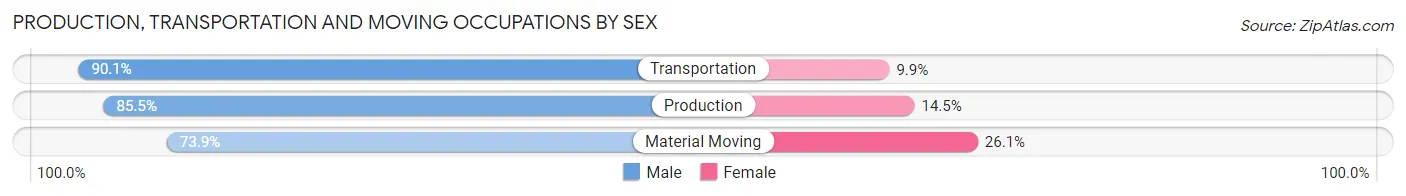
| Occupation | Male | Female |
| Production | 118 (85.5%) | 20 (14.5%) |
| Transportation | 164 (90.1%) | 18 (9.9%) |
| Material Moving | 99 (73.9%) | 35 (26.1%) |
| Total (Category) | 381 (83.9%) | 73 (16.1%) |
| Total (Overall) | 822 (60.9%) | 528 (39.1%) |
Employment Industries by Sex in Hohenwald
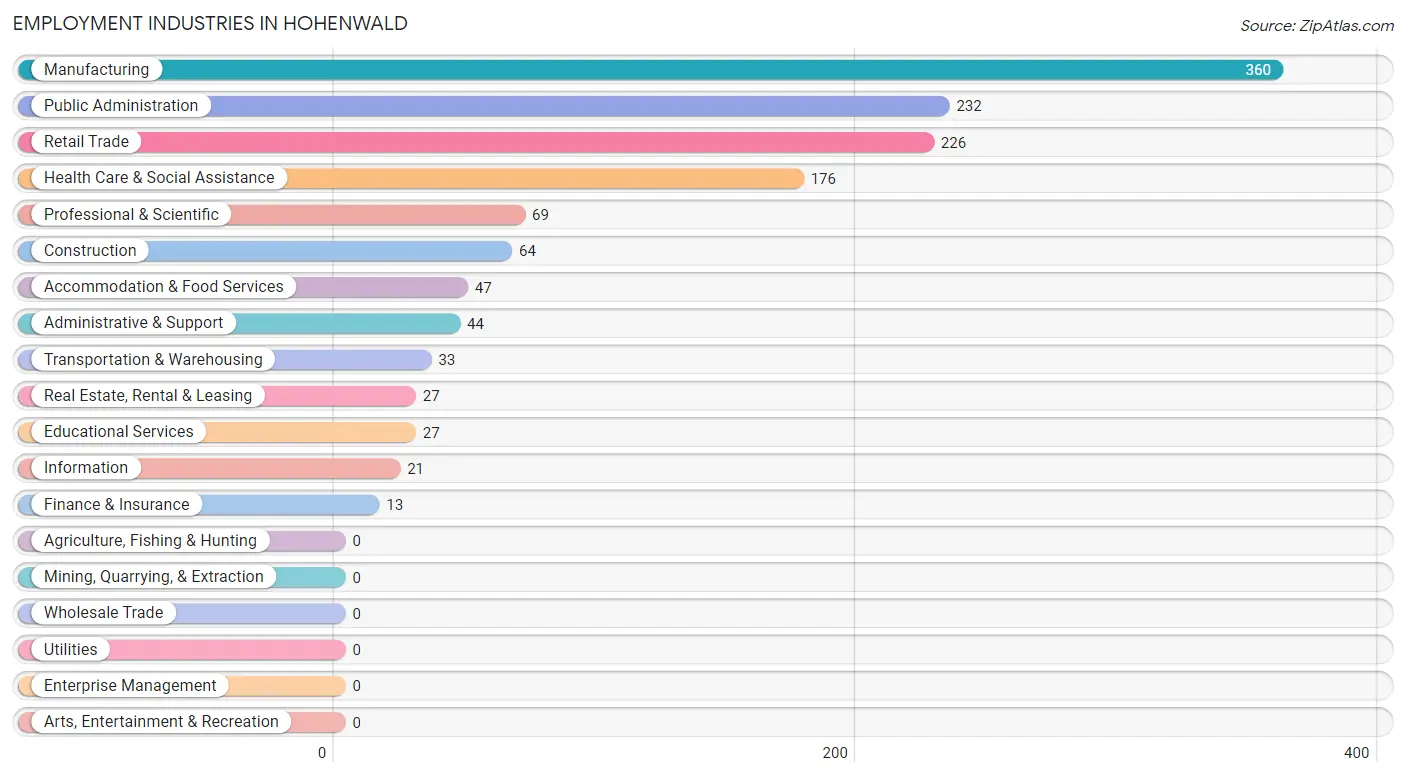
Employment Industries in Hohenwald
The major employment industries in Hohenwald include Manufacturing (360 | 26.7%), Public Administration (232 | 17.2%), Retail Trade (226 | 16.7%), Health Care & Social Assistance (176 | 13.0%), and Professional & Scientific (69 | 5.1%).
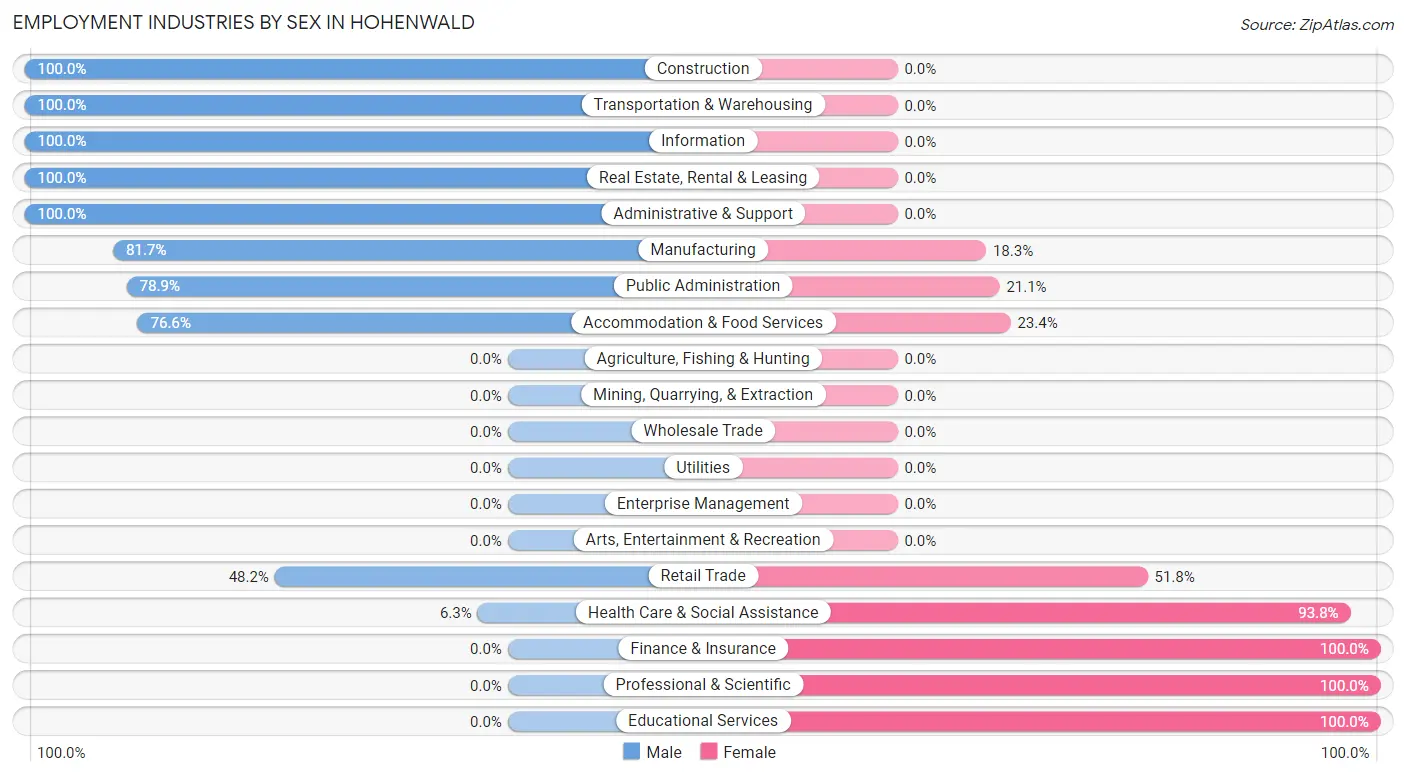
Employment Industries by Sex in Hohenwald
The Hohenwald industries that see more men than women are Construction (100.0%), Transportation & Warehousing (100.0%), and Information (100.0%), whereas the industries that tend to have a higher number of women are Finance & Insurance (100.0%), Professional & Scientific (100.0%), and Educational Services (100.0%).
| Industry | Male | Female |
| Agriculture, Fishing & Hunting | 0 (0.0%) | 0 (0.0%) |
| Mining, Quarrying, & Extraction | 0 (0.0%) | 0 (0.0%) |
| Construction | 64 (100.0%) | 0 (0.0%) |
| Manufacturing | 294 (81.7%) | 66 (18.3%) |
| Wholesale Trade | 0 (0.0%) | 0 (0.0%) |
| Retail Trade | 109 (48.2%) | 117 (51.8%) |
| Transportation & Warehousing | 33 (100.0%) | 0 (0.0%) |
| Utilities | 0 (0.0%) | 0 (0.0%) |
| Information | 21 (100.0%) | 0 (0.0%) |
| Finance & Insurance | 0 (0.0%) | 13 (100.0%) |
| Real Estate, Rental & Leasing | 27 (100.0%) | 0 (0.0%) |
| Professional & Scientific | 0 (0.0%) | 69 (100.0%) |
| Enterprise Management | 0 (0.0%) | 0 (0.0%) |
| Administrative & Support | 44 (100.0%) | 0 (0.0%) |
| Educational Services | 0 (0.0%) | 27 (100.0%) |
| Health Care & Social Assistance | 11 (6.2%) | 165 (93.8%) |
| Arts, Entertainment & Recreation | 0 (0.0%) | 0 (0.0%) |
| Accommodation & Food Services | 36 (76.6%) | 11 (23.4%) |
| Public Administration | 183 (78.9%) | 49 (21.1%) |
| Total | 822 (60.9%) | 528 (39.1%) |
Education in Hohenwald
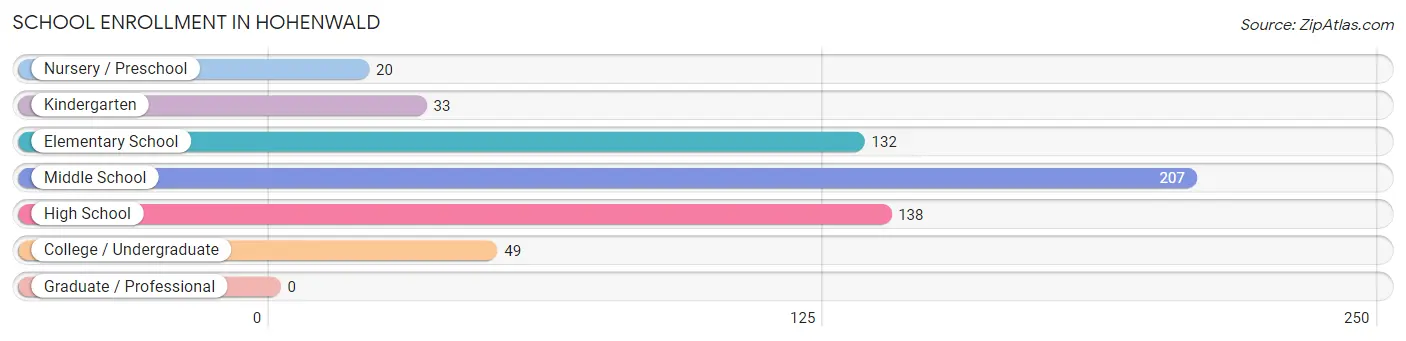
School Enrollment in Hohenwald
The most common levels of schooling among the 579 students in Hohenwald are middle school (207 | 35.7%), high school (138 | 23.8%), and elementary school (132 | 22.8%).
| School Level | # Students | % Students |
| Nursery / Preschool | 20 | 3.5% |
| Kindergarten | 33 | 5.7% |
| Elementary School | 132 | 22.8% |
| Middle School | 207 | 35.7% |
| High School | 138 | 23.8% |
| College / Undergraduate | 49 | 8.5% |
| Graduate / Professional | 0 | 0.0% |
| Total | 579 | 100.0% |
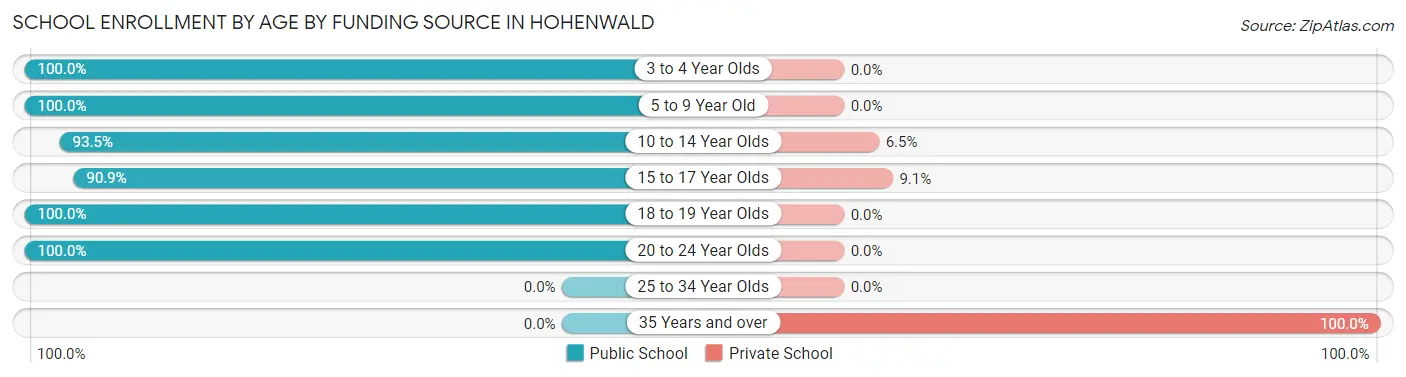
School Enrollment by Age by Funding Source in Hohenwald
Out of a total of 579 students who are enrolled in schools in Hohenwald, 31 (5.4%) attend a private institution, while the remaining 548 (94.6%) are enrolled in public schools. The age group of 35 years and over has the highest likelihood of being enrolled in private schools, with 11 (100.0% in the age bracket) enrolled. Conversely, the age group of 3 to 4 year olds has the lowest likelihood of being enrolled in a private school, with 20 (100.0% in the age bracket) attending a public institution.
| Age Bracket | Public School | Private School |
| 3 to 4 Year Olds | 20 (100.0%) | 0 (0.0%) |
| 5 to 9 Year Old | 141 (100.0%) | 0 (0.0%) |
| 10 to 14 Year Olds | 229 (93.5%) | 16 (6.5%) |
| 15 to 17 Year Olds | 40 (90.9%) | 4 (9.1%) |
| 18 to 19 Year Olds | 96 (100.0%) | 0 (0.0%) |
| 20 to 24 Year Olds | 22 (100.0%) | 0 (0.0%) |
| 25 to 34 Year Olds | 0 (0.0%) | 0 (0.0%) |
| 35 Years and over | 0 (0.0%) | 11 (100.0%) |
| Total | 548 (94.6%) | 31 (5.4%) |
Educational Attainment by Field of Study in Hohenwald
Business (116 | 39.7%), bio, nature & agricultural (75 | 25.7%), science & technology (38 | 13.0%), computers & mathematics (21 | 7.2%), and psychology (21 | 7.2%) are the most common fields of study among 292 individuals in Hohenwald who have obtained a bachelor's degree or higher.
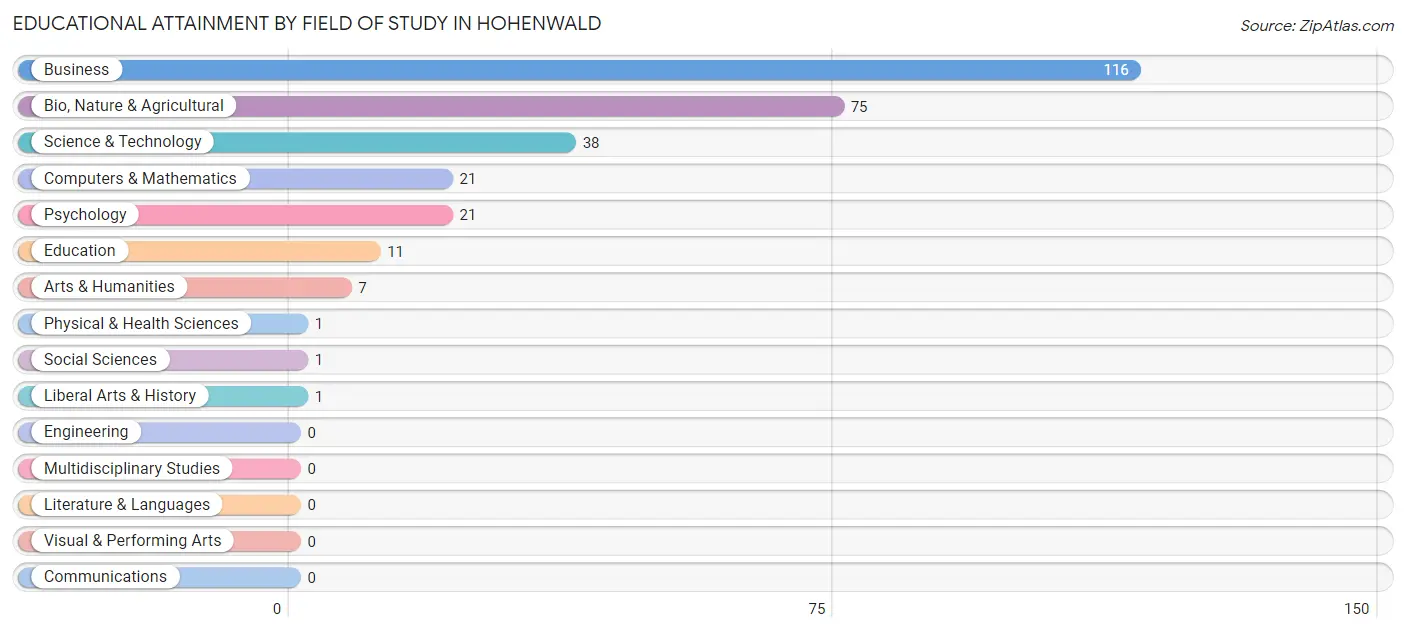
| Field of Study | # Graduates | % Graduates |
| Computers & Mathematics | 21 | 7.2% |
| Bio, Nature & Agricultural | 75 | 25.7% |
| Physical & Health Sciences | 1 | 0.3% |
| Psychology | 21 | 7.2% |
| Social Sciences | 1 | 0.3% |
| Engineering | 0 | 0.0% |
| Multidisciplinary Studies | 0 | 0.0% |
| Science & Technology | 38 | 13.0% |
| Business | 116 | 39.7% |
| Education | 11 | 3.8% |
| Literature & Languages | 0 | 0.0% |
| Liberal Arts & History | 1 | 0.3% |
| Visual & Performing Arts | 0 | 0.0% |
| Communications | 0 | 0.0% |
| Arts & Humanities | 7 | 2.4% |
| Total | 292 | 100.0% |
Transportation & Commute in Hohenwald
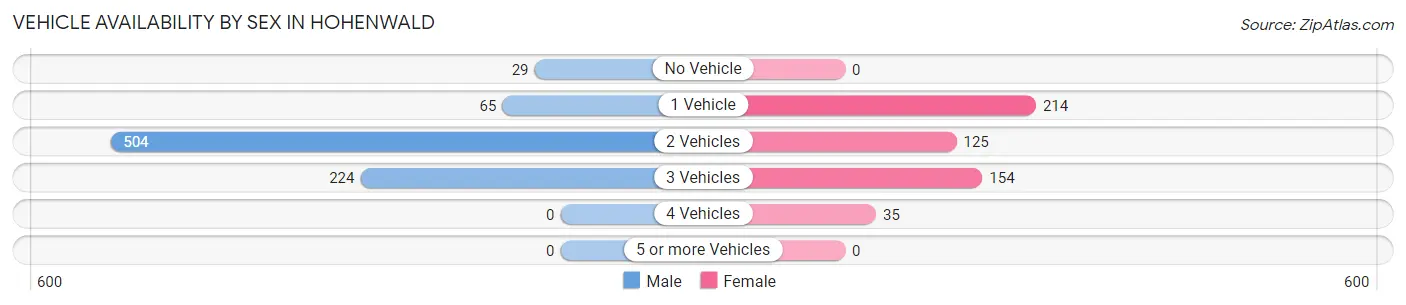
Vehicle Availability by Sex in Hohenwald
The most prevalent vehicle ownership categories in Hohenwald are males with 2 vehicles (504, accounting for 61.3%) and females with 2 vehicles (125, making up 95.5%).
| Vehicles Available | Male | Female |
| No Vehicle | 29 (3.5%) | 0 (0.0%) |
| 1 Vehicle | 65 (7.9%) | 214 (40.5%) |
| 2 Vehicles | 504 (61.3%) | 125 (23.7%) |
| 3 Vehicles | 224 (27.3%) | 154 (29.2%) |
| 4 Vehicles | 0 (0.0%) | 35 (6.6%) |
| 5 or more Vehicles | 0 (0.0%) | 0 (0.0%) |
| Total | 822 (100.0%) | 528 (100.0%) |
Commute Time in Hohenwald
The most frequently occuring commute durations in Hohenwald are less than 5 minutes (372 commuters, 28.6%), 45 to 59 minutes (271 commuters, 20.8%), and 10 to 14 minutes (236 commuters, 18.1%).
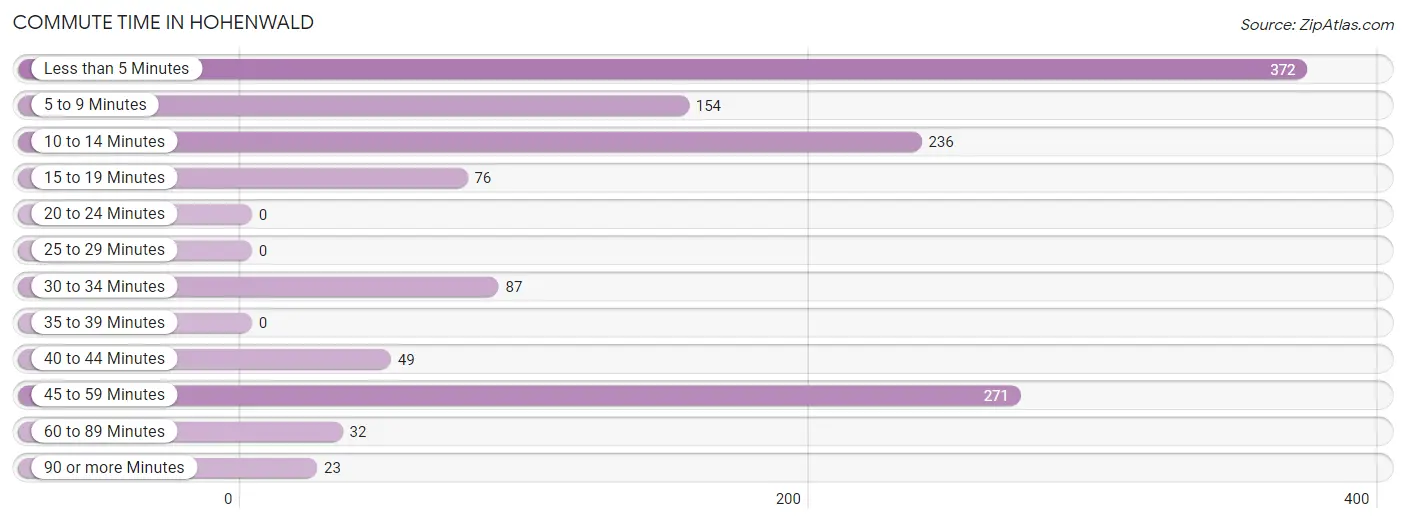
| Commute Time | # Commuters | % Commuters |
| Less than 5 Minutes | 372 | 28.6% |
| 5 to 9 Minutes | 154 | 11.8% |
| 10 to 14 Minutes | 236 | 18.1% |
| 15 to 19 Minutes | 76 | 5.9% |
| 20 to 24 Minutes | 0 | 0.0% |
| 25 to 29 Minutes | 0 | 0.0% |
| 30 to 34 Minutes | 87 | 6.7% |
| 35 to 39 Minutes | 0 | 0.0% |
| 40 to 44 Minutes | 49 | 3.8% |
| 45 to 59 Minutes | 271 | 20.8% |
| 60 to 89 Minutes | 32 | 2.5% |
| 90 or more Minutes | 23 | 1.8% |
Commute Time by Sex in Hohenwald
The most common commute times in Hohenwald are less than 5 minutes (260 commuters, 32.5%) for males and 10 to 14 minutes (178 commuters, 35.7%) for females.
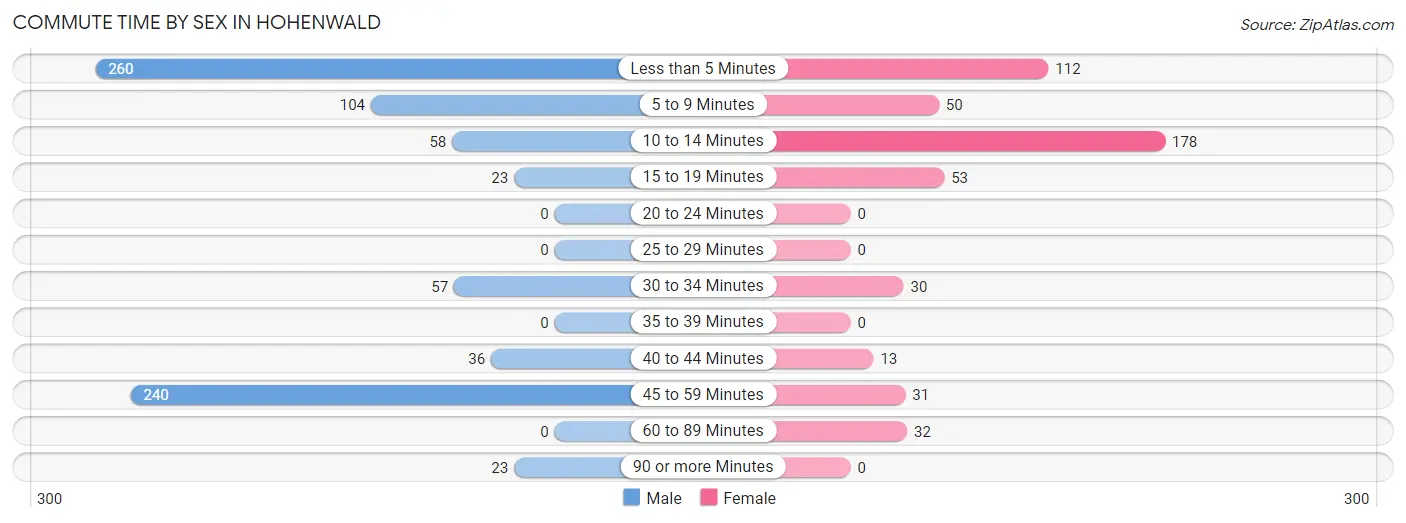
| Commute Time | Male | Female |
| Less than 5 Minutes | 260 (32.5%) | 112 (22.4%) |
| 5 to 9 Minutes | 104 (13.0%) | 50 (10.0%) |
| 10 to 14 Minutes | 58 (7.2%) | 178 (35.7%) |
| 15 to 19 Minutes | 23 (2.9%) | 53 (10.6%) |
| 20 to 24 Minutes | 0 (0.0%) | 0 (0.0%) |
| 25 to 29 Minutes | 0 (0.0%) | 0 (0.0%) |
| 30 to 34 Minutes | 57 (7.1%) | 30 (6.0%) |
| 35 to 39 Minutes | 0 (0.0%) | 0 (0.0%) |
| 40 to 44 Minutes | 36 (4.5%) | 13 (2.6%) |
| 45 to 59 Minutes | 240 (30.0%) | 31 (6.2%) |
| 60 to 89 Minutes | 0 (0.0%) | 32 (6.4%) |
| 90 or more Minutes | 23 (2.9%) | 0 (0.0%) |
Time of Departure to Work by Sex in Hohenwald
The most frequent times of departure to work in Hohenwald are 8:00 AM to 8:29 AM (256, 32.0%) for males and 7:30 AM to 7:59 AM (137, 27.5%) for females.
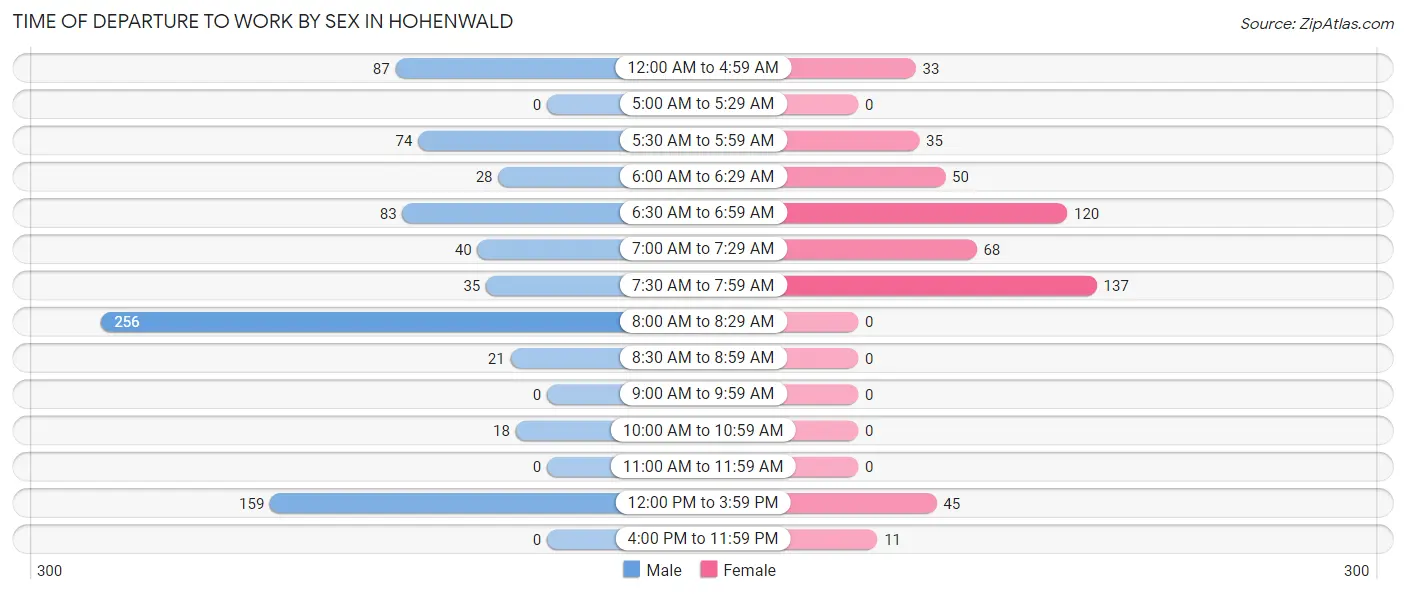
| Time of Departure | Male | Female |
| 12:00 AM to 4:59 AM | 87 (10.9%) | 33 (6.6%) |
| 5:00 AM to 5:29 AM | 0 (0.0%) | 0 (0.0%) |
| 5:30 AM to 5:59 AM | 74 (9.2%) | 35 (7.0%) |
| 6:00 AM to 6:29 AM | 28 (3.5%) | 50 (10.0%) |
| 6:30 AM to 6:59 AM | 83 (10.4%) | 120 (24.0%) |
| 7:00 AM to 7:29 AM | 40 (5.0%) | 68 (13.6%) |
| 7:30 AM to 7:59 AM | 35 (4.4%) | 137 (27.5%) |
| 8:00 AM to 8:29 AM | 256 (32.0%) | 0 (0.0%) |
| 8:30 AM to 8:59 AM | 21 (2.6%) | 0 (0.0%) |
| 9:00 AM to 9:59 AM | 0 (0.0%) | 0 (0.0%) |
| 10:00 AM to 10:59 AM | 18 (2.2%) | 0 (0.0%) |
| 11:00 AM to 11:59 AM | 0 (0.0%) | 0 (0.0%) |
| 12:00 PM to 3:59 PM | 159 (19.9%) | 45 (9.0%) |
| 4:00 PM to 11:59 PM | 0 (0.0%) | 11 (2.2%) |
| Total | 801 (100.0%) | 499 (100.0%) |
Housing Occupancy in Hohenwald
Occupancy by Ownership in Hohenwald
Of the total 1,525 dwellings in Hohenwald, owner-occupied units account for 1,095 (71.8%), while renter-occupied units make up 430 (28.2%).
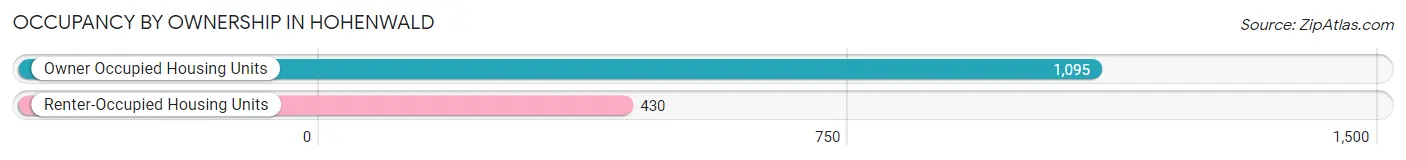
| Occupancy | # Housing Units | % Housing Units |
| Owner Occupied Housing Units | 1,095 | 71.8% |
| Renter-Occupied Housing Units | 430 | 28.2% |
| Total Occupied Housing Units | 1,525 | 100.0% |
Occupancy by Household Size in Hohenwald
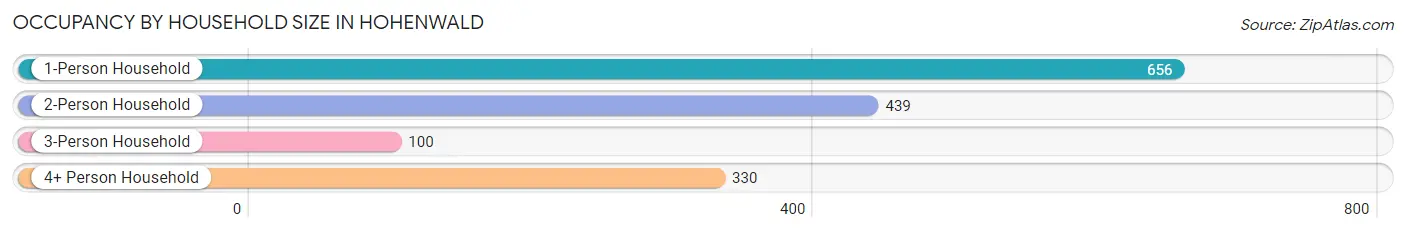
| Household Size | # Housing Units | % Housing Units |
| 1-Person Household | 656 | 43.0% |
| 2-Person Household | 439 | 28.8% |
| 3-Person Household | 100 | 6.6% |
| 4+ Person Household | 330 | 21.6% |
| Total Housing Units | 1,525 | 100.0% |
Occupancy by Ownership by Household Size in Hohenwald
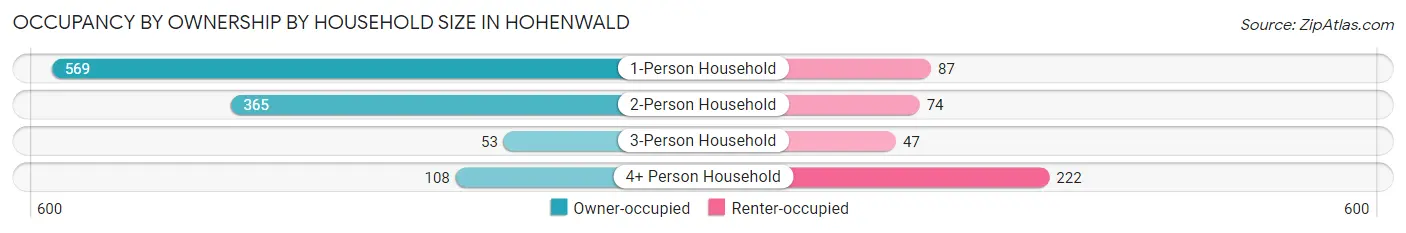
| Household Size | Owner-occupied | Renter-occupied |
| 1-Person Household | 569 (86.7%) | 87 (13.3%) |
| 2-Person Household | 365 (83.1%) | 74 (16.9%) |
| 3-Person Household | 53 (53.0%) | 47 (47.0%) |
| 4+ Person Household | 108 (32.7%) | 222 (67.3%) |
| Total Housing Units | 1,095 (71.8%) | 430 (28.2%) |
Occupancy by Educational Attainment in Hohenwald
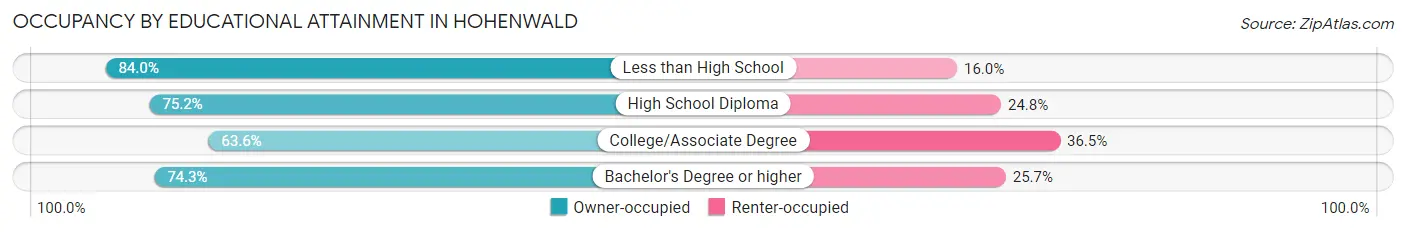
| Household Size | Owner-occupied | Renter-occupied |
| Less than High School | 89 (84.0%) | 17 (16.0%) |
| High School Diploma | 547 (75.2%) | 180 (24.8%) |
| College/Associate Degree | 326 (63.5%) | 187 (36.4%) |
| Bachelor's Degree or higher | 133 (74.3%) | 46 (25.7%) |
Occupancy by Age of Householder in Hohenwald
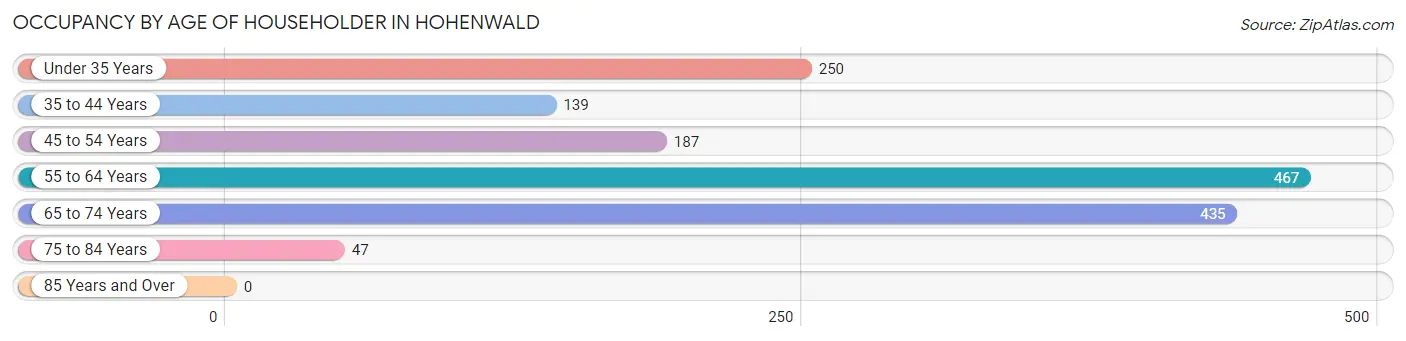
| Age Bracket | # Households | % Households |
| Under 35 Years | 250 | 16.4% |
| 35 to 44 Years | 139 | 9.1% |
| 45 to 54 Years | 187 | 12.3% |
| 55 to 64 Years | 467 | 30.6% |
| 65 to 74 Years | 435 | 28.5% |
| 75 to 84 Years | 47 | 3.1% |
| 85 Years and Over | 0 | 0.0% |
| Total | 1,525 | 100.0% |
Housing Finances in Hohenwald
Median Income by Occupancy in Hohenwald
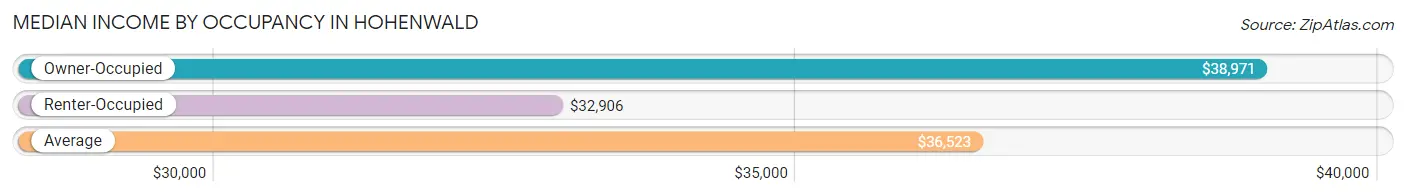
| Occupancy Type | # Households | Median Income |
| Owner-Occupied | 1,095 (71.8%) | $38,971 |
| Renter-Occupied | 430 (28.2%) | $32,906 |
| Average | 1,525 (100.0%) | $36,523 |
Occupancy by Householder Income Bracket in Hohenwald
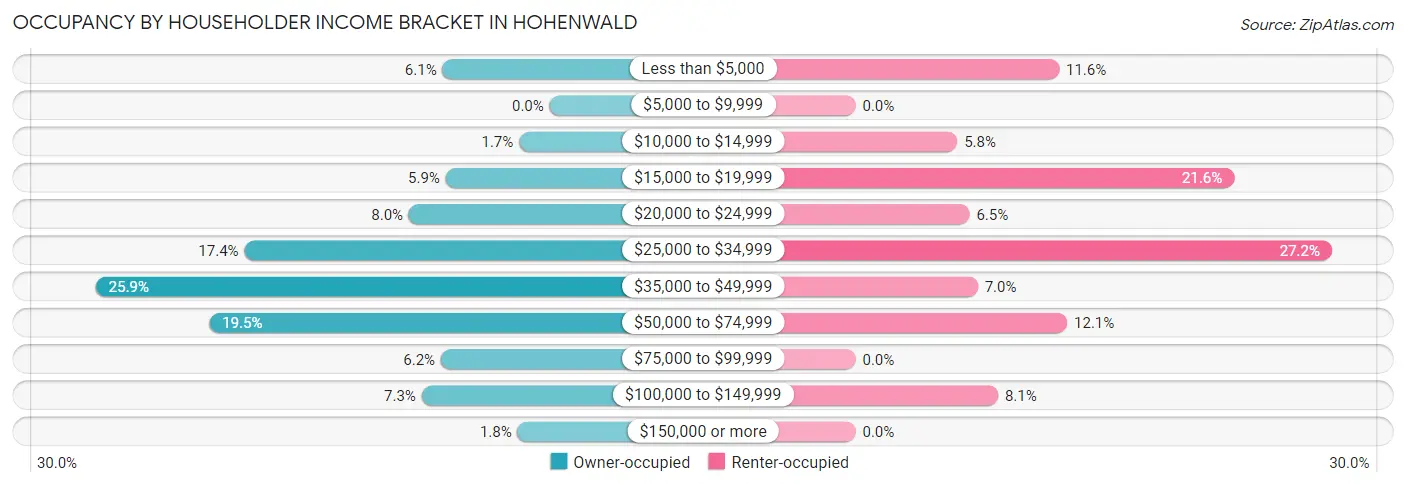
| Income Bracket | Owner-occupied | Renter-occupied |
| Less than $5,000 | 67 (6.1%) | 50 (11.6%) |
| $5,000 to $9,999 | 0 (0.0%) | 0 (0.0%) |
| $10,000 to $14,999 | 19 (1.7%) | 25 (5.8%) |
| $15,000 to $19,999 | 65 (5.9%) | 93 (21.6%) |
| $20,000 to $24,999 | 88 (8.0%) | 28 (6.5%) |
| $25,000 to $34,999 | 191 (17.4%) | 117 (27.2%) |
| $35,000 to $49,999 | 284 (25.9%) | 30 (7.0%) |
| $50,000 to $74,999 | 213 (19.5%) | 52 (12.1%) |
| $75,000 to $99,999 | 68 (6.2%) | 0 (0.0%) |
| $100,000 to $149,999 | 80 (7.3%) | 35 (8.1%) |
| $150,000 or more | 20 (1.8%) | 0 (0.0%) |
| Total | 1,095 (100.0%) | 430 (100.0%) |
Monthly Housing Cost Tiers in Hohenwald
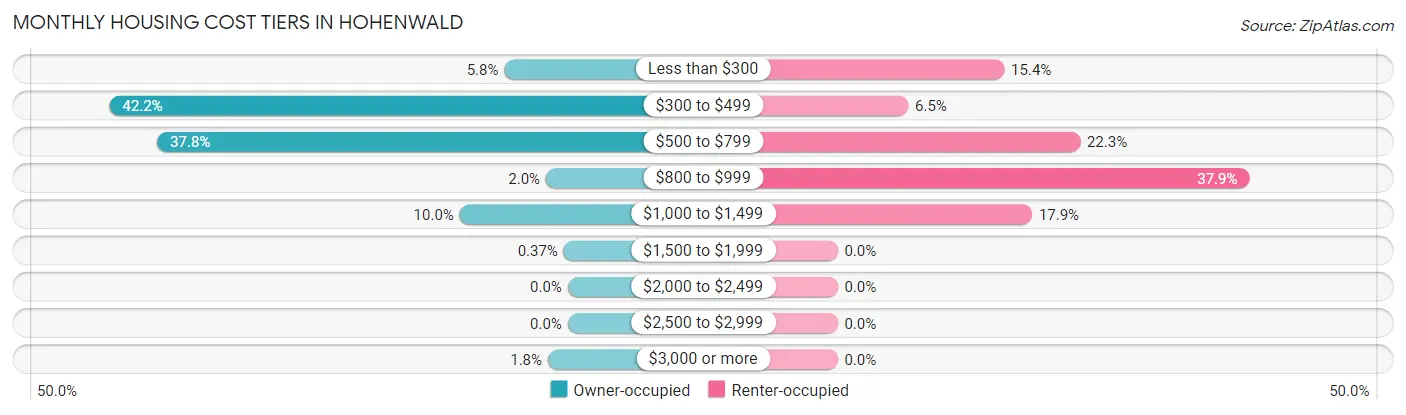
| Monthly Cost | Owner-occupied | Renter-occupied |
| Less than $300 | 64 (5.8%) | 66 (15.3%) |
| $300 to $499 | 462 (42.2%) | 28 (6.5%) |
| $500 to $799 | 414 (37.8%) | 96 (22.3%) |
| $800 to $999 | 22 (2.0%) | 163 (37.9%) |
| $1,000 to $1,499 | 109 (10.0%) | 77 (17.9%) |
| $1,500 to $1,999 | 4 (0.4%) | 0 (0.0%) |
| $2,000 to $2,499 | 0 (0.0%) | 0 (0.0%) |
| $2,500 to $2,999 | 0 (0.0%) | 0 (0.0%) |
| $3,000 or more | 20 (1.8%) | 0 (0.0%) |
| Total | 1,095 (100.0%) | 430 (100.0%) |
Physical Housing Characteristics in Hohenwald
Housing Structures in Hohenwald
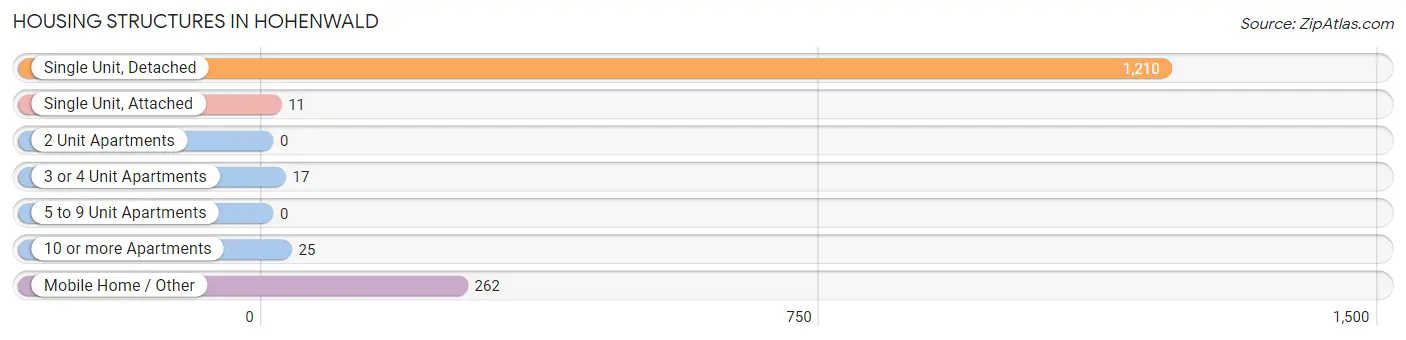
| Structure Type | # Housing Units | % Housing Units |
| Single Unit, Detached | 1,210 | 79.3% |
| Single Unit, Attached | 11 | 0.7% |
| 2 Unit Apartments | 0 | 0.0% |
| 3 or 4 Unit Apartments | 17 | 1.1% |
| 5 to 9 Unit Apartments | 0 | 0.0% |
| 10 or more Apartments | 25 | 1.6% |
| Mobile Home / Other | 262 | 17.2% |
| Total | 1,525 | 100.0% |
Housing Structures by Occupancy in Hohenwald
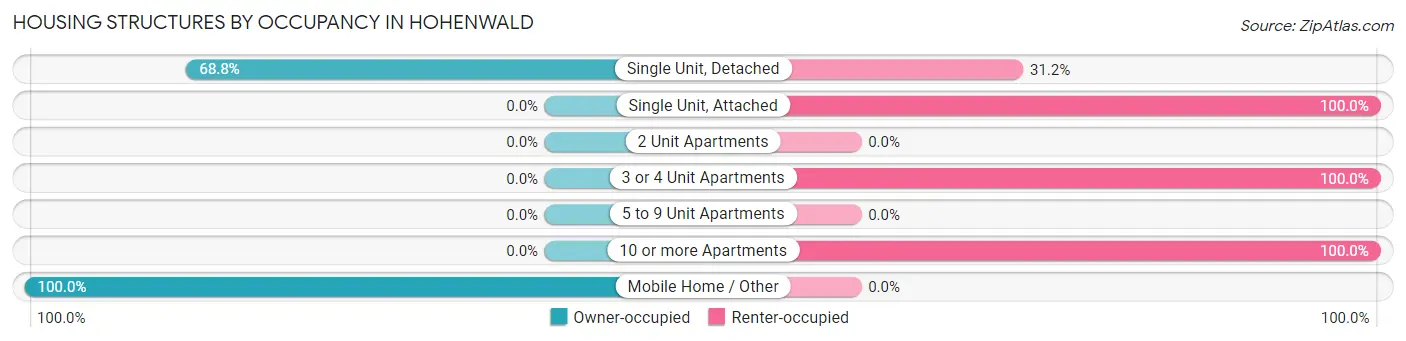
| Structure Type | Owner-occupied | Renter-occupied |
| Single Unit, Detached | 833 (68.8%) | 377 (31.2%) |
| Single Unit, Attached | 0 (0.0%) | 11 (100.0%) |
| 2 Unit Apartments | 0 (0.0%) | 0 (0.0%) |
| 3 or 4 Unit Apartments | 0 (0.0%) | 17 (100.0%) |
| 5 to 9 Unit Apartments | 0 (0.0%) | 0 (0.0%) |
| 10 or more Apartments | 0 (0.0%) | 25 (100.0%) |
| Mobile Home / Other | 262 (100.0%) | 0 (0.0%) |
| Total | 1,095 (71.8%) | 430 (28.2%) |
Housing Structures by Number of Rooms in Hohenwald
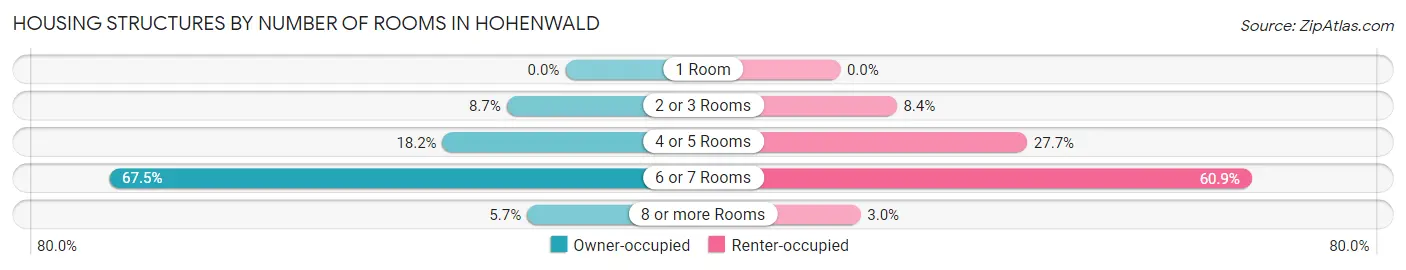
| Number of Rooms | Owner-occupied | Renter-occupied |
| 1 Room | 0 (0.0%) | 0 (0.0%) |
| 2 or 3 Rooms | 95 (8.7%) | 36 (8.4%) |
| 4 or 5 Rooms | 199 (18.2%) | 119 (27.7%) |
| 6 or 7 Rooms | 739 (67.5%) | 262 (60.9%) |
| 8 or more Rooms | 62 (5.7%) | 13 (3.0%) |
| Total | 1,095 (100.0%) | 430 (100.0%) |
Housing Structure by Heating Type in Hohenwald
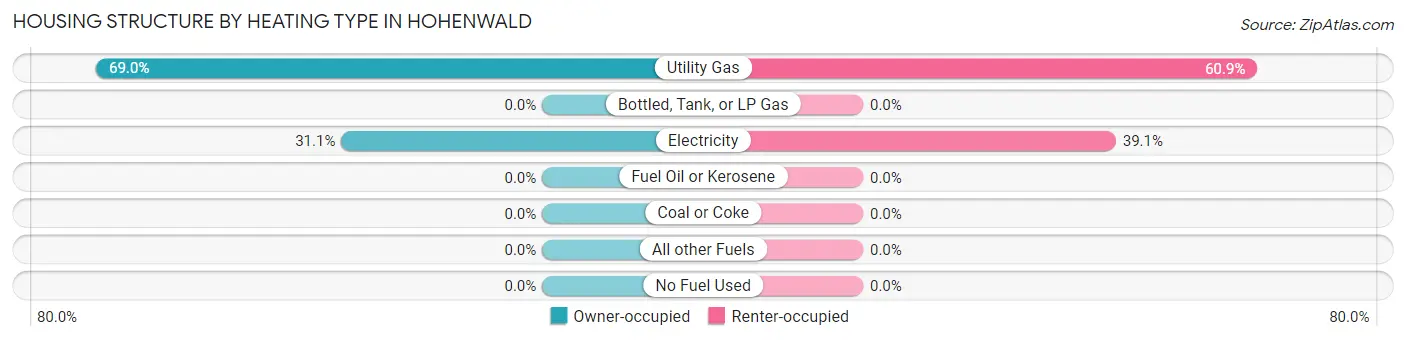
| Heating Type | Owner-occupied | Renter-occupied |
| Utility Gas | 755 (69.0%) | 262 (60.9%) |
| Bottled, Tank, or LP Gas | 0 (0.0%) | 0 (0.0%) |
| Electricity | 340 (31.0%) | 168 (39.1%) |
| Fuel Oil or Kerosene | 0 (0.0%) | 0 (0.0%) |
| Coal or Coke | 0 (0.0%) | 0 (0.0%) |
| All other Fuels | 0 (0.0%) | 0 (0.0%) |
| No Fuel Used | 0 (0.0%) | 0 (0.0%) |
| Total | 1,095 (100.0%) | 430 (100.0%) |
Household Vehicle Usage in Hohenwald
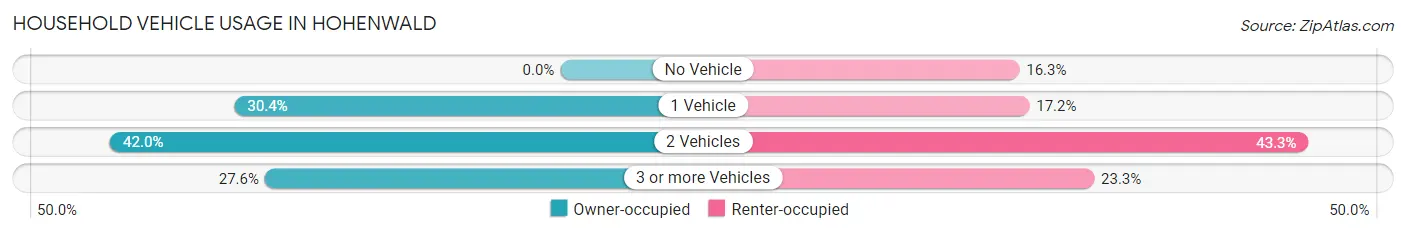
| Vehicles per Household | Owner-occupied | Renter-occupied |
| No Vehicle | 0 (0.0%) | 70 (16.3%) |
| 1 Vehicle | 333 (30.4%) | 74 (17.2%) |
| 2 Vehicles | 460 (42.0%) | 186 (43.3%) |
| 3 or more Vehicles | 302 (27.6%) | 100 (23.3%) |
| Total | 1,095 (100.0%) | 430 (100.0%) |
Real Estate & Mortgages in Hohenwald
Real Estate and Mortgage Overview in Hohenwald
| Characteristic | Without Mortgage | With Mortgage |
| Housing Units | 605 | 490 |
| Median Property Value | $99,400 | $55,900 |
| Median Household Income | $30,950 | $20 |
| Monthly Housing Costs | $377 | $20 |
| Real Estate Taxes | $618 | $23 |
Property Value by Mortgage Status in Hohenwald
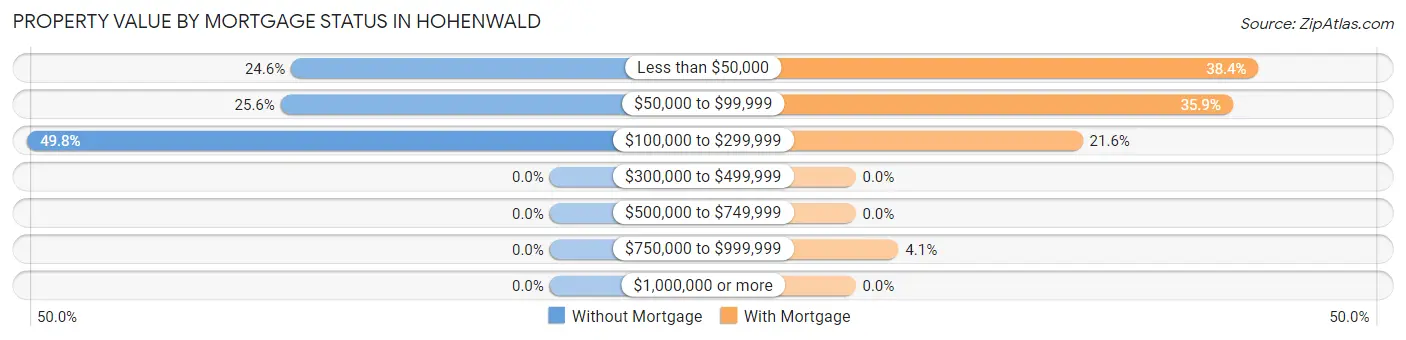
| Property Value | Without Mortgage | With Mortgage |
| Less than $50,000 | 149 (24.6%) | 188 (38.4%) |
| $50,000 to $99,999 | 155 (25.6%) | 176 (35.9%) |
| $100,000 to $299,999 | 301 (49.7%) | 106 (21.6%) |
| $300,000 to $499,999 | 0 (0.0%) | 0 (0.0%) |
| $500,000 to $749,999 | 0 (0.0%) | 0 (0.0%) |
| $750,000 to $999,999 | 0 (0.0%) | 20 (4.1%) |
| $1,000,000 or more | 0 (0.0%) | 0 (0.0%) |
| Total | 605 (100.0%) | 490 (100.0%) |
Household Income by Mortgage Status in Hohenwald
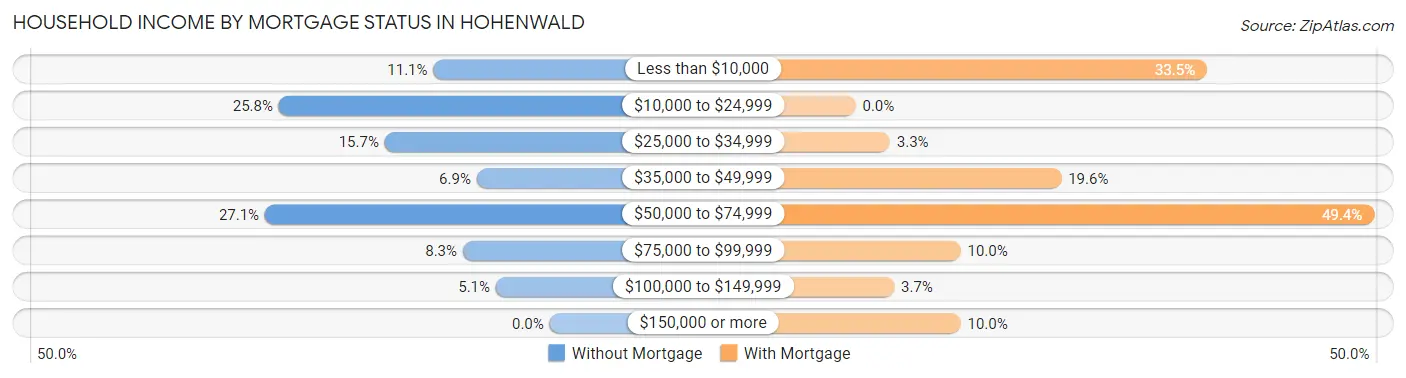
| Household Income | Without Mortgage | With Mortgage |
| Less than $10,000 | 67 (11.1%) | 164 (33.5%) |
| $10,000 to $24,999 | 156 (25.8%) | 0 (0.0%) |
| $25,000 to $34,999 | 95 (15.7%) | 16 (3.3%) |
| $35,000 to $49,999 | 42 (6.9%) | 96 (19.6%) |
| $50,000 to $74,999 | 164 (27.1%) | 242 (49.4%) |
| $75,000 to $99,999 | 50 (8.3%) | 49 (10.0%) |
| $100,000 to $149,999 | 31 (5.1%) | 18 (3.7%) |
| $150,000 or more | 0 (0.0%) | 49 (10.0%) |
| Total | 605 (100.0%) | 490 (100.0%) |
Property Value to Household Income Ratio in Hohenwald
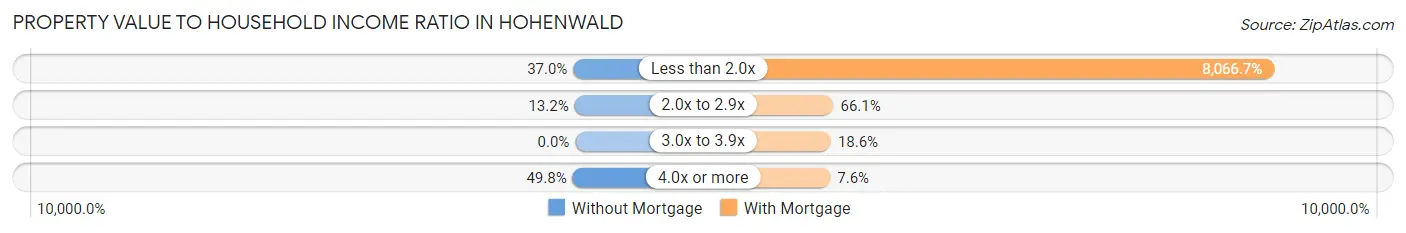
| Value-to-Income Ratio | Without Mortgage | With Mortgage |
| Less than 2.0x | 224 (37.0%) | 39,527 (8,066.7%) |
| 2.0x to 2.9x | 80 (13.2%) | 324 (66.1%) |
| 3.0x to 3.9x | 0 (0.0%) | 91 (18.6%) |
| 4.0x or more | 301 (49.7%) | 37 (7.5%) |
| Total | 605 (100.0%) | 490 (100.0%) |
Real Estate Taxes by Mortgage Status in Hohenwald
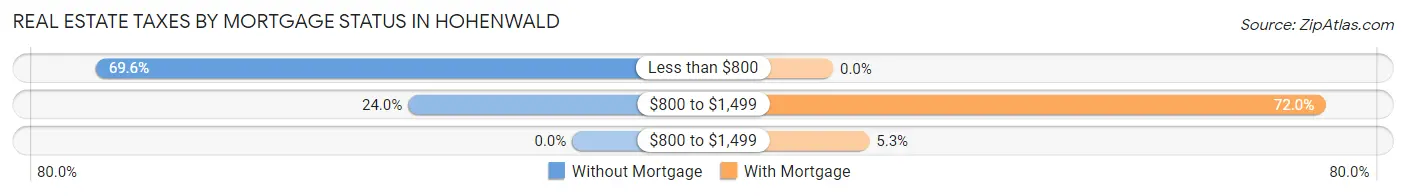
| Property Taxes | Without Mortgage | With Mortgage |
| Less than $800 | 421 (69.6%) | 0 (0.0%) |
| $800 to $1,499 | 145 (24.0%) | 353 (72.0%) |
| $800 to $1,499 | 0 (0.0%) | 26 (5.3%) |
| Total | 605 (100.0%) | 490 (100.0%) |
Health & Disability in Hohenwald
Health Insurance Coverage by Age in Hohenwald
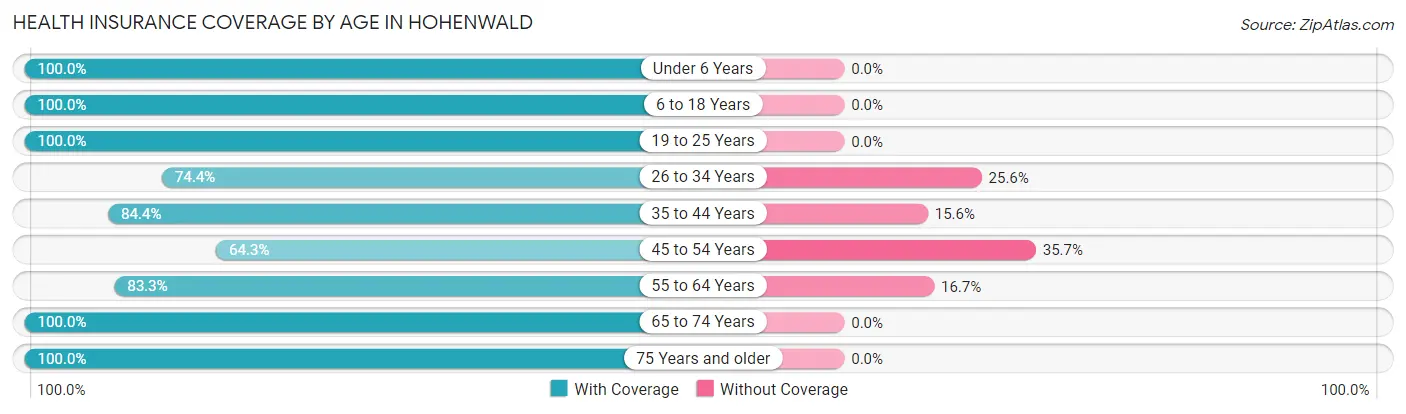
| Age Bracket | With Coverage | Without Coverage |
| Under 6 Years | 306 (100.0%) | 0 (0.0%) |
| 6 to 18 Years | 526 (100.0%) | 0 (0.0%) |
| 19 to 25 Years | 322 (100.0%) | 0 (0.0%) |
| 26 to 34 Years | 244 (74.4%) | 84 (25.6%) |
| 35 to 44 Years | 385 (84.4%) | 71 (15.6%) |
| 45 to 54 Years | 180 (64.3%) | 100 (35.7%) |
| 55 to 64 Years | 612 (83.3%) | 123 (16.7%) |
| 65 to 74 Years | 561 (100.0%) | 0 (0.0%) |
| 75 Years and older | 65 (100.0%) | 0 (0.0%) |
| Total | 3,201 (89.4%) | 378 (10.6%) |
Health Insurance Coverage by Citizenship Status in Hohenwald
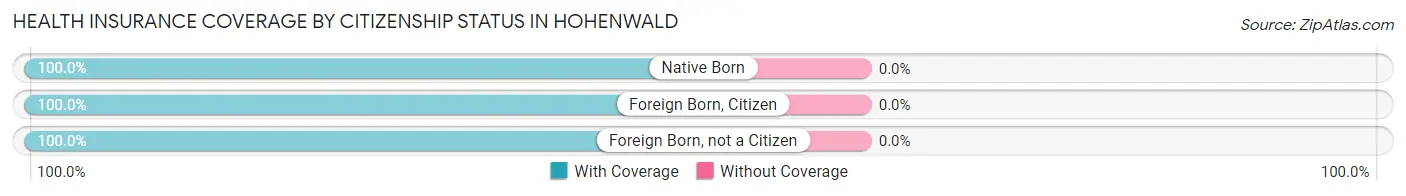
| Citizenship Status | With Coverage | Without Coverage |
| Native Born | 306 (100.0%) | 0 (0.0%) |
| Foreign Born, Citizen | 526 (100.0%) | 0 (0.0%) |
| Foreign Born, not a Citizen | 322 (100.0%) | 0 (0.0%) |
Health Insurance Coverage by Household Income in Hohenwald
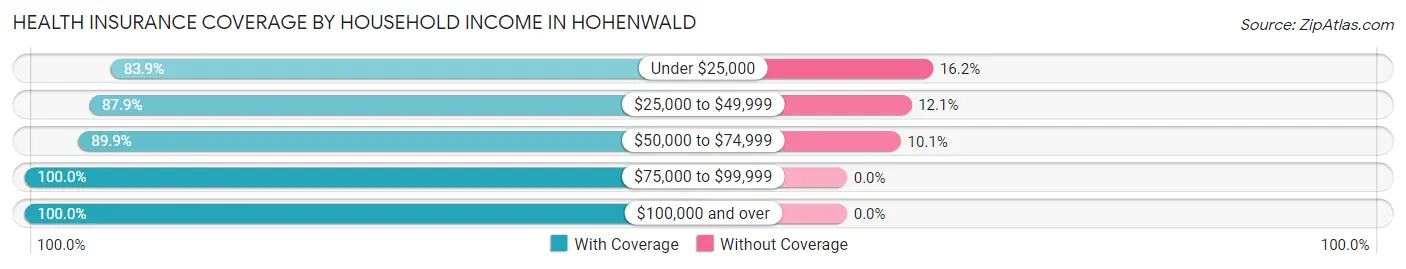
| Household Income | With Coverage | Without Coverage |
| Under $25,000 | 732 (83.9%) | 141 (16.2%) |
| $25,000 to $49,999 | 1,100 (87.9%) | 151 (12.1%) |
| $50,000 to $74,999 | 668 (89.9%) | 75 (10.1%) |
| $75,000 to $99,999 | 205 (100.0%) | 0 (0.0%) |
| $100,000 and over | 424 (100.0%) | 0 (0.0%) |
Public vs Private Health Insurance Coverage by Age in Hohenwald

| Age Bracket | Public Insurance | Private Insurance |
| Under 6 | 239 (78.1%) | 67 (21.9%) |
| 6 to 18 Years | 337 (64.1%) | 332 (63.1%) |
| 19 to 25 Years | 212 (65.8%) | 166 (51.5%) |
| 25 to 34 Years | 105 (32.0%) | 152 (46.3%) |
| 35 to 44 Years | 35 (7.7%) | 350 (76.7%) |
| 45 to 54 Years | 111 (39.6%) | 69 (24.6%) |
| 55 to 64 Years | 121 (16.5%) | 516 (70.2%) |
| 65 to 74 Years | 541 (96.4%) | 130 (23.2%) |
| 75 Years and over | 65 (100.0%) | 0 (0.0%) |
| Total | 1,766 (49.3%) | 1,782 (49.8%) |
Disability Status by Sex by Age in Hohenwald
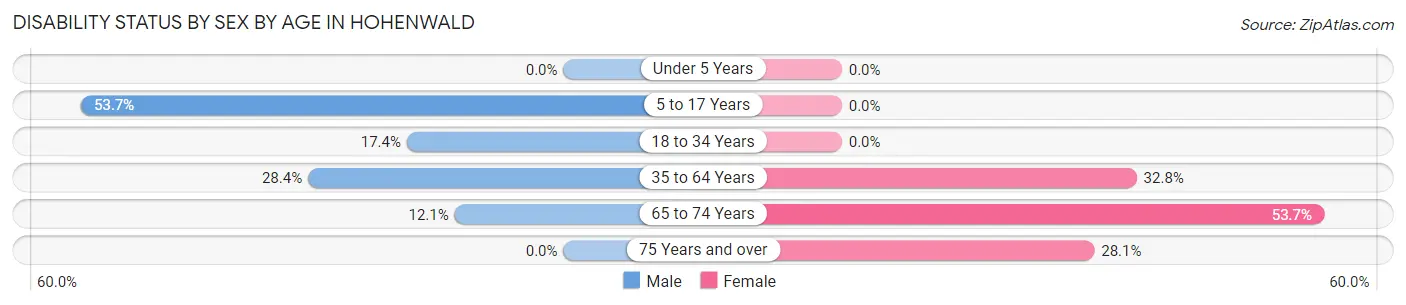
| Age Bracket | Male | Female |
| Under 5 Years | 0 (0.0%) | 0 (0.0%) |
| 5 to 17 Years | 101 (53.7%) | 0 (0.0%) |
| 18 to 34 Years | 79 (17.4%) | 0 (0.0%) |
| 35 to 64 Years | 246 (28.4%) | 199 (32.8%) |
| 65 to 74 Years | 40 (12.1%) | 124 (53.7%) |
| 75 Years and over | 0 (0.0%) | 18 (28.1%) |
Disability Class by Sex by Age in Hohenwald
Disability Class: Hearing Difficulty
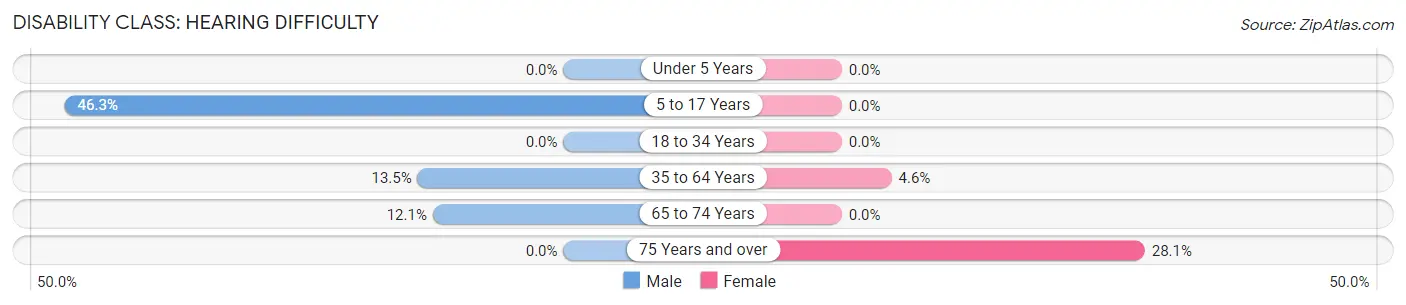
| Age Bracket | Male | Female |
| Under 5 Years | 0 (0.0%) | 0 (0.0%) |
| 5 to 17 Years | 87 (46.3%) | 0 (0.0%) |
| 18 to 34 Years | 0 (0.0%) | 0 (0.0%) |
| 35 to 64 Years | 117 (13.5%) | 28 (4.6%) |
| 65 to 74 Years | 40 (12.1%) | 0 (0.0%) |
| 75 Years and over | 0 (0.0%) | 18 (28.1%) |
Disability Class: Vision Difficulty
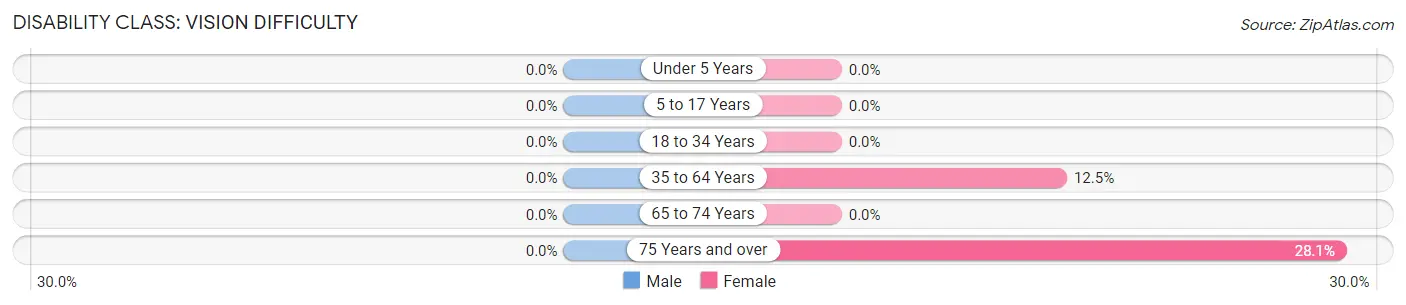
| Age Bracket | Male | Female |
| Under 5 Years | 0 (0.0%) | 0 (0.0%) |
| 5 to 17 Years | 0 (0.0%) | 0 (0.0%) |
| 18 to 34 Years | 0 (0.0%) | 0 (0.0%) |
| 35 to 64 Years | 0 (0.0%) | 76 (12.5%) |
| 65 to 74 Years | 0 (0.0%) | 0 (0.0%) |
| 75 Years and over | 0 (0.0%) | 18 (28.1%) |
Disability Class: Cognitive Difficulty
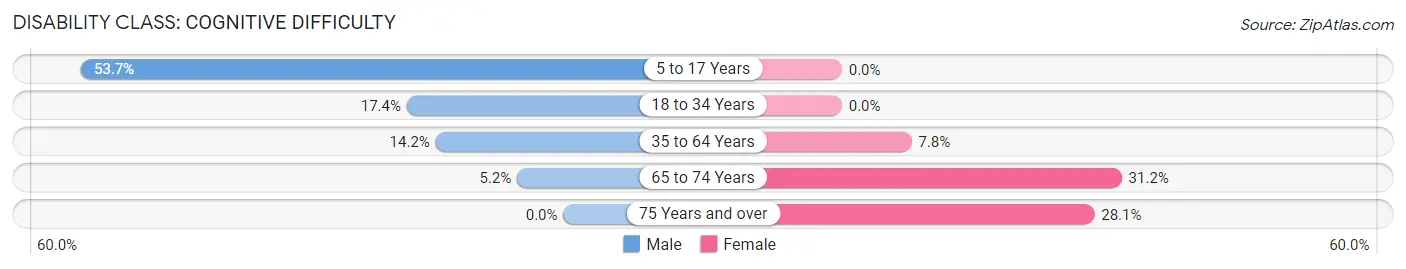
| Age Bracket | Male | Female |
| 5 to 17 Years | 101 (53.7%) | 0 (0.0%) |
| 18 to 34 Years | 79 (17.4%) | 0 (0.0%) |
| 35 to 64 Years | 123 (14.2%) | 47 (7.8%) |
| 65 to 74 Years | 17 (5.1%) | 72 (31.2%) |
| 75 Years and over | 0 (0.0%) | 18 (28.1%) |
Disability Class: Ambulatory Difficulty
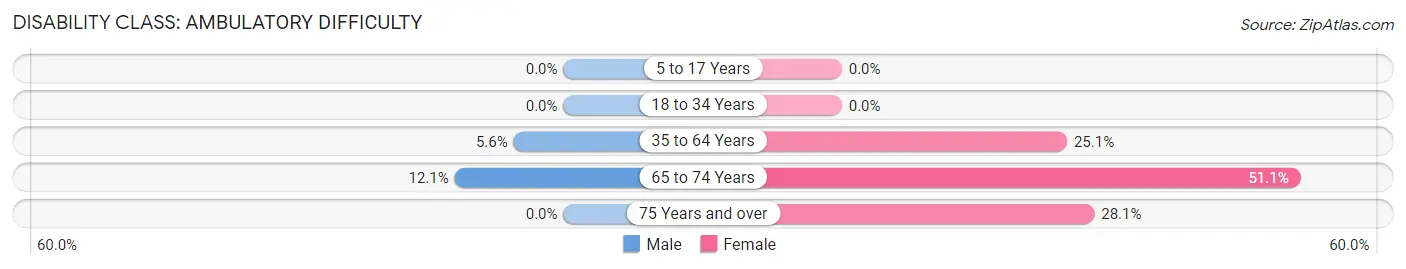
| Age Bracket | Male | Female |
| 5 to 17 Years | 0 (0.0%) | 0 (0.0%) |
| 18 to 34 Years | 0 (0.0%) | 0 (0.0%) |
| 35 to 64 Years | 48 (5.6%) | 152 (25.1%) |
| 65 to 74 Years | 40 (12.1%) | 118 (51.1%) |
| 75 Years and over | 0 (0.0%) | 18 (28.1%) |
Disability Class: Self-Care Difficulty
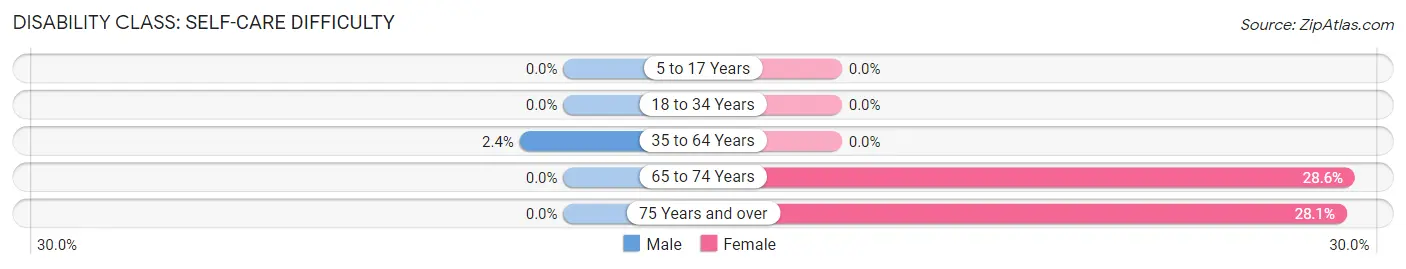
| Age Bracket | Male | Female |
| 5 to 17 Years | 0 (0.0%) | 0 (0.0%) |
| 18 to 34 Years | 0 (0.0%) | 0 (0.0%) |
| 35 to 64 Years | 21 (2.4%) | 0 (0.0%) |
| 65 to 74 Years | 0 (0.0%) | 66 (28.6%) |
| 75 Years and over | 0 (0.0%) | 18 (28.1%) |
Technology Access in Hohenwald
Computing Device Access in Hohenwald
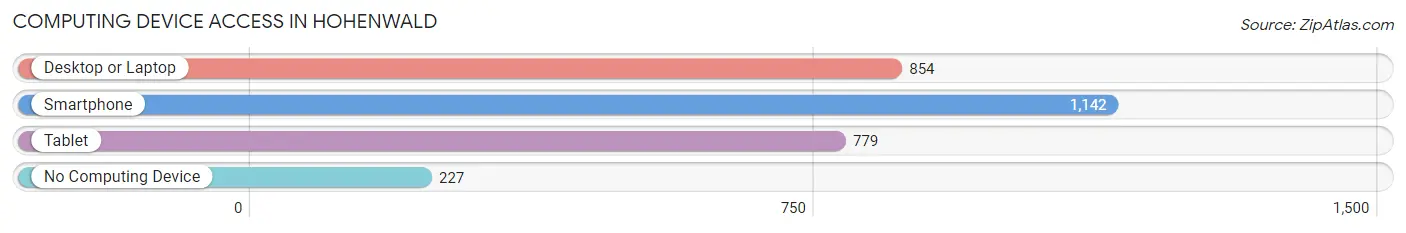
| Device Type | # Households | % Households |
| Desktop or Laptop | 854 | 56.0% |
| Smartphone | 1,142 | 74.9% |
| Tablet | 779 | 51.1% |
| No Computing Device | 227 | 14.9% |
| Total | 1,525 | 100.0% |
Internet Access in Hohenwald
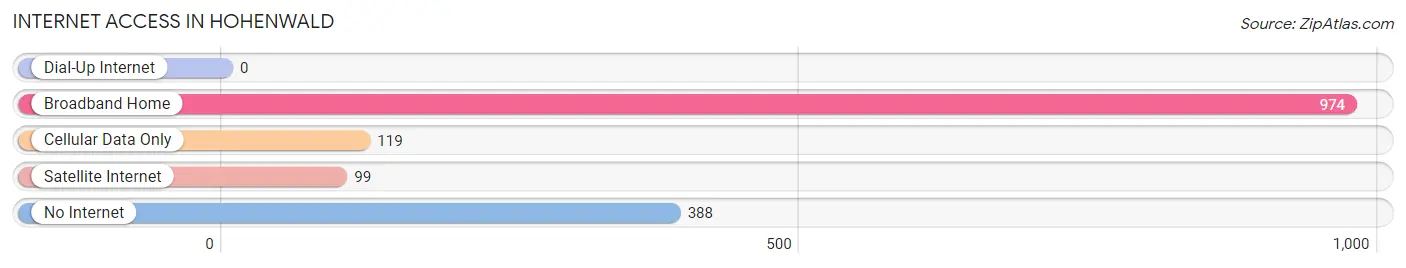
| Internet Type | # Households | % Households |
| Dial-Up Internet | 0 | 0.0% |
| Broadband Home | 974 | 63.9% |
| Cellular Data Only | 119 | 7.8% |
| Satellite Internet | 99 | 6.5% |
| No Internet | 388 | 25.4% |
| Total | 1,525 | 100.0% |
Hohenwald Summary
Hohenwald, Tennessee is a small town located in Lewis County, in the south-central part of the state. It is situated along the banks of the Duck River, and is the county seat of Lewis County. The town was founded in 1858 and was named after the nearby Hohenwald Mountains. The population of Hohenwald was 2,845 as of the 2010 census.
Geography
Hohenwald is located at 35°30'25"N 87°37'45"W (35.5069, -87.6293). It is situated along the banks of the Duck River, and is the county seat of Lewis County. The town is located in the Highland Rim region of Tennessee, and is surrounded by rolling hills and forests. The town is located approximately 60 miles southwest of Nashville, and is accessible via Interstate 65.
Climate
Hohenwald has a humid subtropical climate, with hot, humid summers and mild winters. The average annual temperature is 61°F, with an average high of 79°F in July and an average low of 43°F in January. The average annual precipitation is 45.5 inches, with the wettest month being May, with an average of 5.5 inches of rain.
Economy
Hohenwald’s economy is largely based on agriculture and tourism. The town is home to several farms, which produce a variety of crops, including corn, soybeans, wheat, and hay. The town is also home to several tourist attractions, including the Hohenwald Elephant Sanctuary, the Lewis County Museum, and the Hohenwald Depot Museum.
Demographics
As of the 2010 census, the population of Hohenwald was 2,845. The racial makeup of the town was 95.2% White, 1.2% African American, 0.3% Native American, 0.3% Asian, 0.1% Pacific Islander, 1.2% from other races, and 1.7% from two or more races. Hispanic or Latino of any race were 2.3% of the population.
The median income for a household in Hohenwald was $30,938, and the median income for a family was $37,917. The per capita income for the town was $17,845. About 17.2% of families and 20.2% of the population were below the poverty line, including 28.2% of those under age 18 and 16.2% of those age 65 or over.
Hohenwald is served by the Lewis County School District, which consists of three elementary schools, one middle school, and one high school. The town is also home to the Hohenwald Public Library, which offers a variety of services, including books, magazines, newspapers, and internet access.
Hohenwald is a small town with a rich history and a vibrant economy. It is home to a variety of attractions, including the Hohenwald Elephant Sanctuary, the Lewis County Museum, and the Hohenwald Depot Museum. The town is also home to several farms, which produce a variety of crops, and is served by the Lewis County School District. The population of Hohenwald was 2,845 as of the 2010 census, and the median income for a household was $30,938.
Common Questions
What is Per Capita Income in Hohenwald?
Per Capita income in Hohenwald is $20,837.
What is the Median Family Income in Hohenwald?
Median Family Income in Hohenwald is $46,458.
What is the Median Household income in Hohenwald?
Median Household Income in Hohenwald is $36,523.
What is Income or Wage Gap in Hohenwald?
Income or Wage Gap in Hohenwald is 3.3%.
Women in Hohenwald earn 96.7 cents for every dollar earned by a man.
What is Inequality or Gini Index in Hohenwald?
Inequality or Gini Index in Hohenwald is 0.37.
What is the Total Population of Hohenwald?
Total Population of Hohenwald is 3,734.
What is the Total Male Population of Hohenwald?
Total Male Population of Hohenwald is 2,159.
What is the Total Female Population of Hohenwald?
Total Female Population of Hohenwald is 1,575.
What is the Ratio of Males per 100 Females in Hohenwald?
There are 137.08 Males per 100 Females in Hohenwald.
What is the Ratio of Females per 100 Males in Hohenwald?
There are 72.95 Females per 100 Males in Hohenwald.
What is the Median Population Age in Hohenwald?
Median Population Age in Hohenwald is 43.0 Years.
What is the Average Family Size in Hohenwald
Average Family Size in Hohenwald is 3.3 People.
What is the Average Household Size in Hohenwald
Average Household Size in Hohenwald is 2.3 People.
How Large is the Labor Force in Hohenwald?
There are 1,565 People in the Labor Forcein in Hohenwald.
What is the Percentage of People in the Labor Force in Hohenwald?
51.9% of People are in the Labor Force in Hohenwald.
What is the Unemployment Rate in Hohenwald?
Unemployment Rate in Hohenwald is 13.8%.