Gruetli Laager, TN Map & Demographics
Gruetli Laager Map
Gruetli Laager Overview
$18,841
PER CAPITA INCOME
$50,722
AVG FAMILY INCOME
$48,145
AVG HOUSEHOLD INCOME
61.5%
WAGE / INCOME GAP [ % ]
38.5¢/ $1
WAGE / INCOME GAP [ $ ]
0.39
INEQUALITY / GINI INDEX
1,585
TOTAL POPULATION
833
MALE POPULATION
752
FEMALE POPULATION
110.77
MALES / 100 FEMALES
90.28
FEMALES / 100 MALES
41.3
MEDIAN AGE
3.6
AVG FAMILY SIZE
3.2
AVG HOUSEHOLD SIZE
669
LABOR FORCE [ PEOPLE ]
57.9%
PERCENT IN LABOR FORCE
8.4%
UNEMPLOYMENT RATE
Gruetli Laager Zip Codes
Gruetli Laager Area Codes
Income in Gruetli Laager
Income Overview in Gruetli Laager
Per Capita Income in Gruetli Laager is $18,841, while median incomes of families and households are $50,722 and $48,145 respectively.
| Characteristic | Number | Measure |
| Per Capita Income | 1,585 | $18,841 |
| Median Family Income | 388 | $50,722 |
| Mean Family Income | 388 | $63,285 |
| Median Household Income | 498 | $48,145 |
| Mean Household Income | 498 | $56,557 |
| Income Deficit | 388 | $0 |
| Wage / Income Gap (%) | 1,585 | 61.50% |
| Wage / Income Gap ($) | 1,585 | 38.50¢ per $1 |
| Gini / Inequality Index | 1,585 | 0.39 |
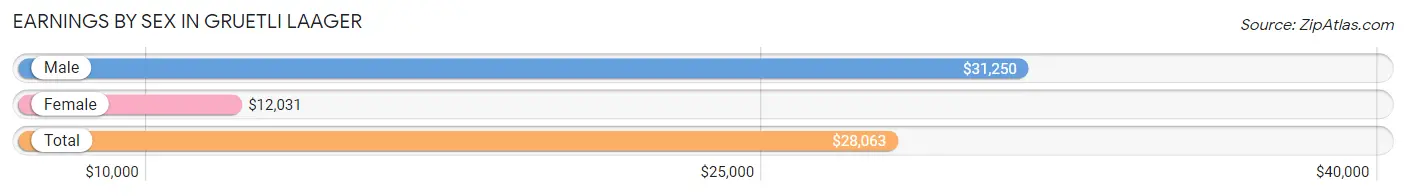
Earnings by Sex in Gruetli Laager
Average Earnings in Gruetli Laager are $28,063, $31,250 for men and $12,031 for women, a difference of 61.5%.
| Sex | Number | Average Earnings |
| Male | 422 (61.5%) | $31,250 |
| Female | 264 (38.5%) | $12,031 |
| Total | 686 (100.0%) | $28,063 |
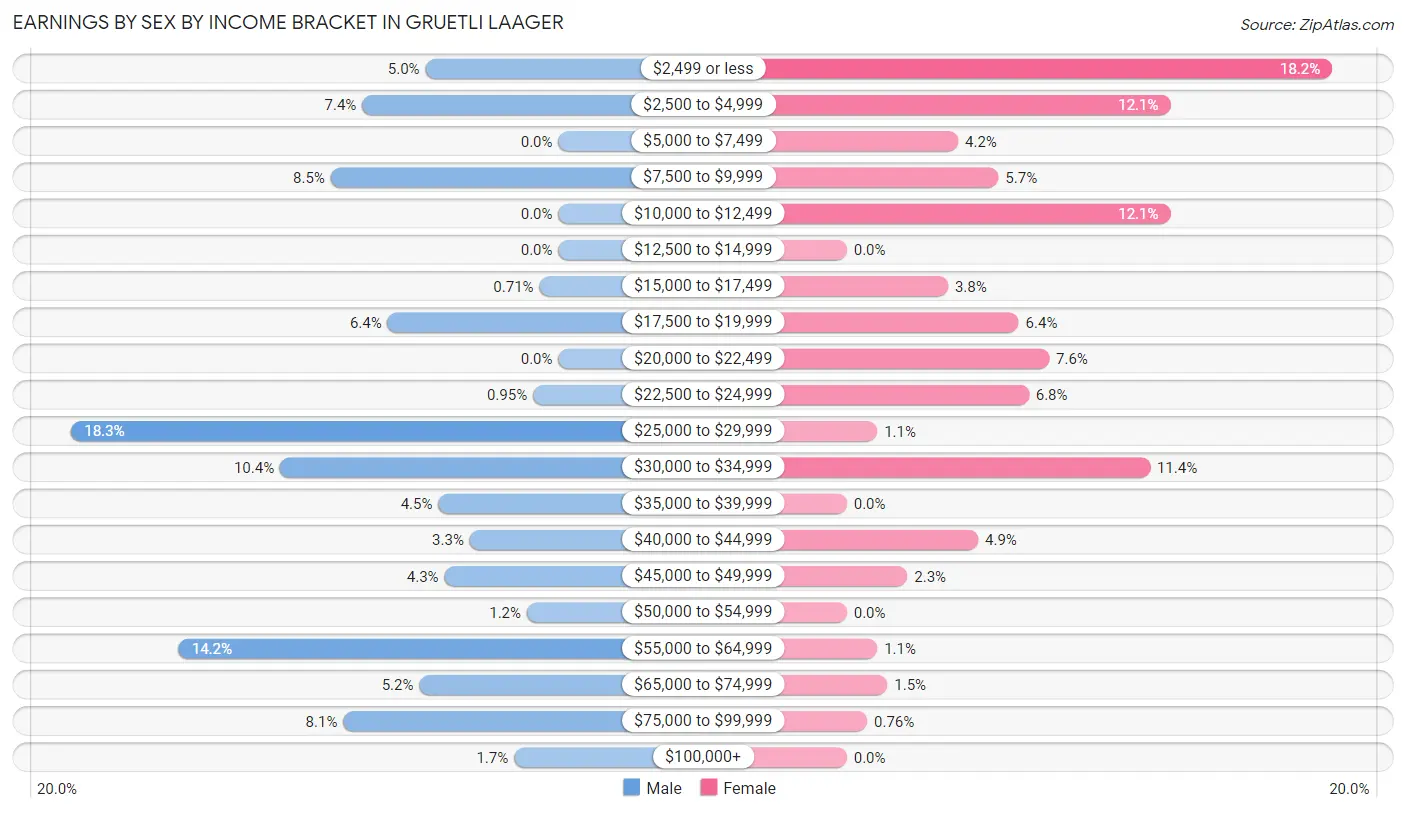
Earnings by Sex by Income Bracket in Gruetli Laager
The most common earnings brackets in Gruetli Laager are $25,000 to $29,999 for men (77 | 18.2%) and $2,499 or less for women (48 | 18.2%).
| Income | Male | Female |
| $2,499 or less | 21 (5.0%) | 48 (18.2%) |
| $2,500 to $4,999 | 31 (7.3%) | 32 (12.1%) |
| $5,000 to $7,499 | 0 (0.0%) | 11 (4.2%) |
| $7,500 to $9,999 | 36 (8.5%) | 15 (5.7%) |
| $10,000 to $12,499 | 0 (0.0%) | 32 (12.1%) |
| $12,500 to $14,999 | 0 (0.0%) | 0 (0.0%) |
| $15,000 to $17,499 | 3 (0.7%) | 10 (3.8%) |
| $17,500 to $19,999 | 27 (6.4%) | 17 (6.4%) |
| $20,000 to $22,499 | 0 (0.0%) | 20 (7.6%) |
| $22,500 to $24,999 | 4 (0.9%) | 18 (6.8%) |
| $25,000 to $29,999 | 77 (18.2%) | 3 (1.1%) |
| $30,000 to $34,999 | 44 (10.4%) | 30 (11.4%) |
| $35,000 to $39,999 | 19 (4.5%) | 0 (0.0%) |
| $40,000 to $44,999 | 14 (3.3%) | 13 (4.9%) |
| $45,000 to $49,999 | 18 (4.3%) | 6 (2.3%) |
| $50,000 to $54,999 | 5 (1.2%) | 0 (0.0%) |
| $55,000 to $64,999 | 60 (14.2%) | 3 (1.1%) |
| $65,000 to $74,999 | 22 (5.2%) | 4 (1.5%) |
| $75,000 to $99,999 | 34 (8.1%) | 2 (0.8%) |
| $100,000+ | 7 (1.7%) | 0 (0.0%) |
| Total | 422 (100.0%) | 264 (100.0%) |
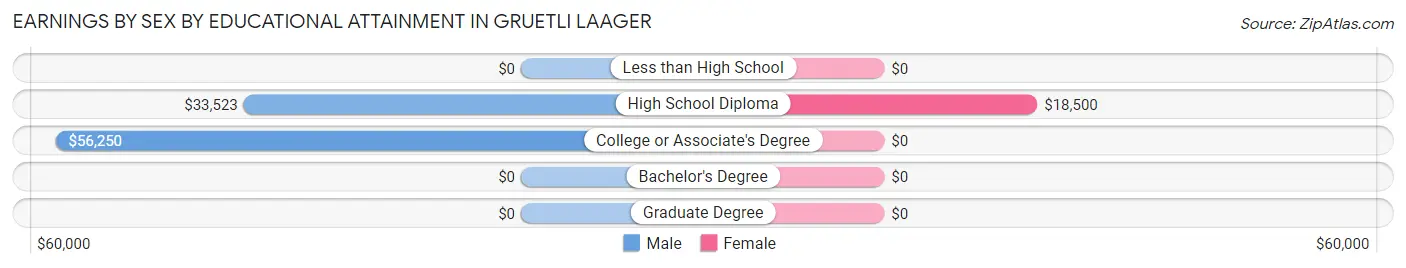
Earnings by Sex by Educational Attainment in Gruetli Laager
Average earnings in Gruetli Laager are $34,313 for men and $11,211 for women, a difference of 67.3%. Men with an educational attainment of college or associate's degree enjoy the highest average annual earnings of $56,250, while those with high school diploma education earn the least with $33,523. Women with an educational attainment of high school diploma earn the most with the average annual earnings of $18,500, while those with high school diploma education have the smallest earnings of $18,500.
| Educational Attainment | Male Income | Female Income |
| Less than High School | - | - |
| High School Diploma | $33,523 | $18,500 |
| College or Associate's Degree | $56,250 | $0 |
| Bachelor's Degree | - | - |
| Graduate Degree | - | - |
| Total | $34,313 | $11,211 |
Family Income in Gruetli Laager
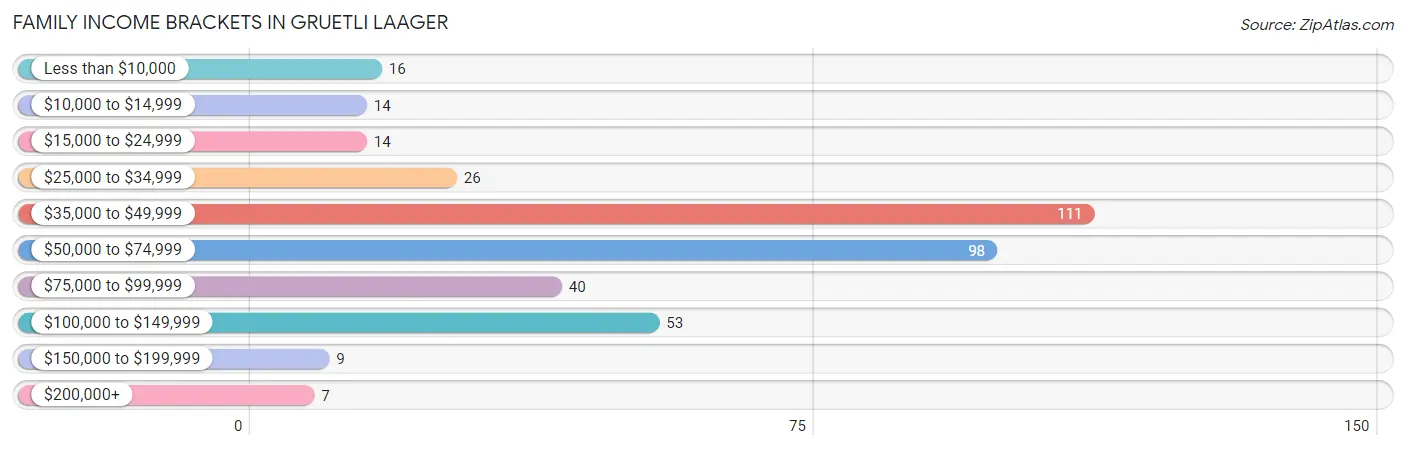
Family Income Brackets in Gruetli Laager
According to the Gruetli Laager family income data, there are 111 families falling into the $35,000 to $49,999 income range, which is the most common income bracket and makes up 28.6% of all families. Conversely, the $200,000+ income bracket is the least frequent group with only 7 families (1.8%) belonging to this category.
| Income Bracket | # Families | % Families |
| Less than $10,000 | 16 | 4.1% |
| $10,000 to $14,999 | 14 | 3.6% |
| $15,000 to $24,999 | 14 | 3.6% |
| $25,000 to $34,999 | 26 | 6.7% |
| $35,000 to $49,999 | 111 | 28.6% |
| $50,000 to $74,999 | 98 | 25.3% |
| $75,000 to $99,999 | 40 | 10.3% |
| $100,000 to $149,999 | 53 | 13.7% |
| $150,000 to $199,999 | 9 | 2.3% |
| $200,000+ | 7 | 1.8% |
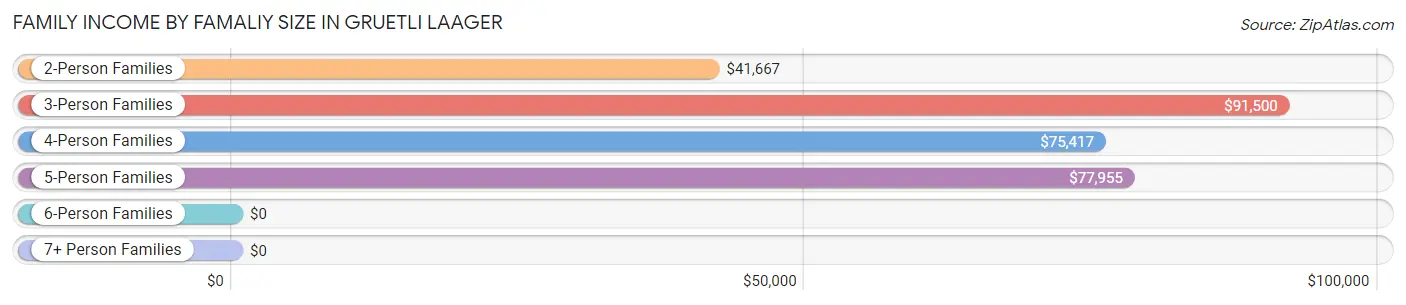
Family Income by Famaliy Size in Gruetli Laager
3-person families (32 | 8.3%) account for the highest median family income in Gruetli Laager with $91,500 per family, while 3-person families (32 | 8.3%) have the highest median income of $30,500 per family member.
| Income Bracket | # Families | Median Income |
| 2-Person Families | 202 (52.1%) | $41,667 |
| 3-Person Families | 32 (8.3%) | $91,500 |
| 4-Person Families | 96 (24.7%) | $75,417 |
| 5-Person Families | 50 (12.9%) | $77,955 |
| 6-Person Families | 8 (2.1%) | $0 |
| 7+ Person Families | 0 (0.0%) | $0 |
| Total | 388 (100.0%) | $50,722 |
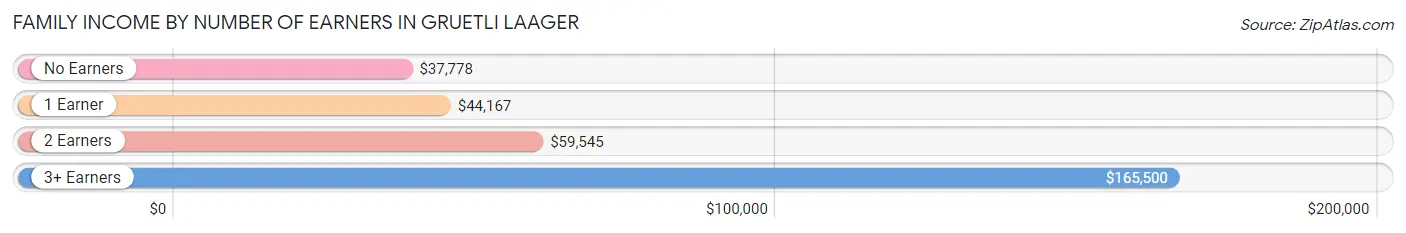
Family Income by Number of Earners in Gruetli Laager
The median family income in Gruetli Laager is $50,722, with families comprising 3+ earners (16) having the highest median family income of $165,500, while families with no earners (70) have the lowest median family income of $37,778, accounting for 4.1% and 18.0% of families, respectively.
| Number of Earners | # Families | Median Income |
| No Earners | 70 (18.0%) | $37,778 |
| 1 Earner | 126 (32.5%) | $44,167 |
| 2 Earners | 176 (45.4%) | $59,545 |
| 3+ Earners | 16 (4.1%) | $165,500 |
| Total | 388 (100.0%) | $50,722 |
Household Income in Gruetli Laager
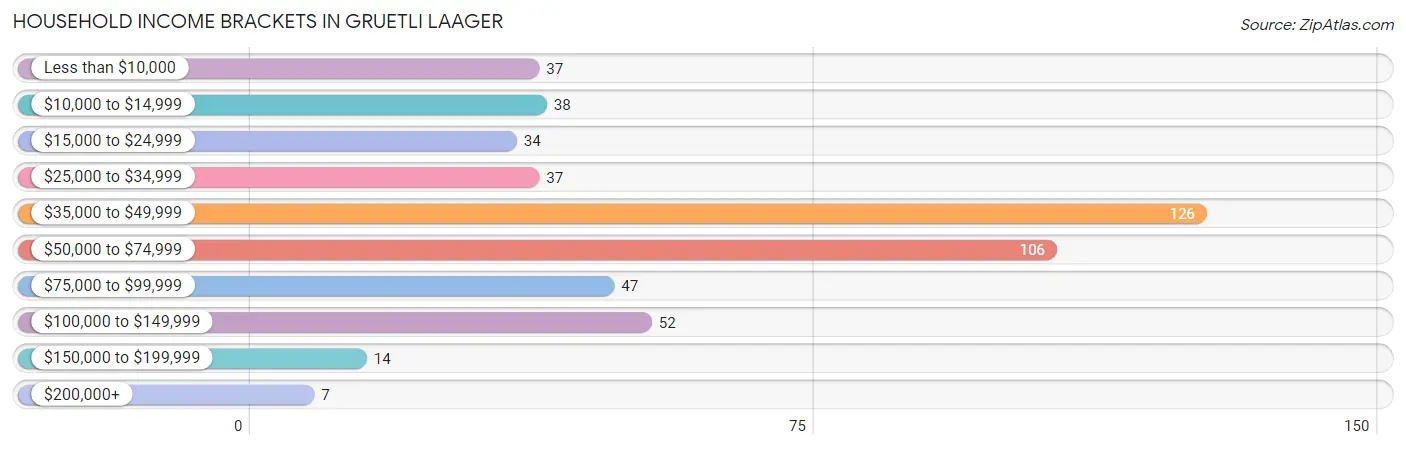
Household Income Brackets in Gruetli Laager
With 126 households falling in the category, the $35,000 to $49,999 income range is the most frequent in Gruetli Laager, accounting for 25.3% of all households. In contrast, only 7 households (1.4%) fall into the $200,000+ income bracket, making it the least populous group.
| Income Bracket | # Households | % Households |
| Less than $10,000 | 37 | 7.4% |
| $10,000 to $14,999 | 38 | 7.6% |
| $15,000 to $24,999 | 34 | 6.8% |
| $25,000 to $34,999 | 37 | 7.4% |
| $35,000 to $49,999 | 126 | 25.3% |
| $50,000 to $74,999 | 106 | 21.3% |
| $75,000 to $99,999 | 47 | 9.4% |
| $100,000 to $149,999 | 52 | 10.4% |
| $150,000 to $199,999 | 14 | 2.8% |
| $200,000+ | 7 | 1.4% |
Household Income by Householder Age in Gruetli Laager
The median household income in Gruetli Laager is $48,145, with the highest median household income of $68,333 found in the 25 to 44 years age bracket for the primary householder. A total of 116 households (23.3%) fall into this category. Meanwhile, the 15 to 24 years age bracket for the primary householder has the lowest median household income of $0, with 15 households (3.0%) in this group.
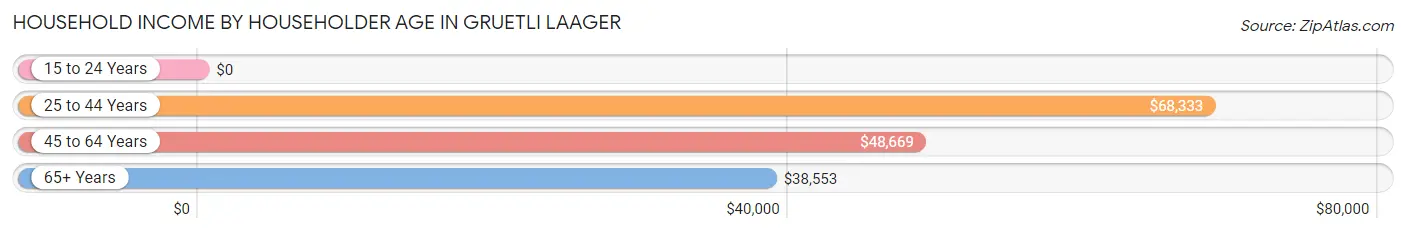
| Income Bracket | # Households | Median Income |
| 15 to 24 Years | 15 (3.0%) | $0 |
| 25 to 44 Years | 116 (23.3%) | $68,333 |
| 45 to 64 Years | 177 (35.5%) | $48,669 |
| 65+ Years | 190 (38.2%) | $38,553 |
| Total | 498 (100.0%) | $48,145 |
Poverty in Gruetli Laager
Income Below Poverty by Sex and Age in Gruetli Laager
With 18.9% poverty level for males and 19.5% for females among the residents of Gruetli Laager, 18 to 24 year old males and 25 to 34 year old females are the most vulnerable to poverty, with 25 males (33.8%) and 33 females (53.2%) in their respective age groups living below the poverty level.
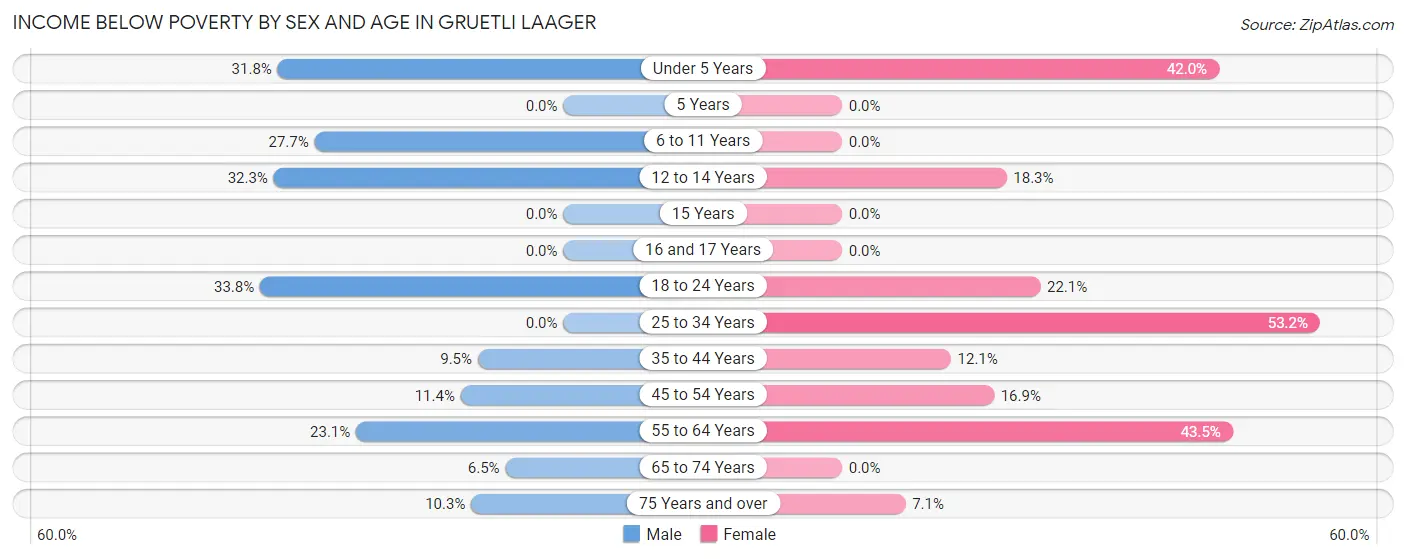
| Age Bracket | Male | Female |
| Under 5 Years | 28 (31.8%) | 21 (42.0%) |
| 5 Years | 0 (0.0%) | 0 (0.0%) |
| 6 to 11 Years | 23 (27.7%) | 0 (0.0%) |
| 12 to 14 Years | 10 (32.3%) | 11 (18.3%) |
| 15 Years | 0 (0.0%) | 0 (0.0%) |
| 16 and 17 Years | 0 (0.0%) | 0 (0.0%) |
| 18 to 24 Years | 25 (33.8%) | 17 (22.1%) |
| 25 to 34 Years | 0 (0.0%) | 33 (53.2%) |
| 35 to 44 Years | 10 (9.5%) | 8 (12.1%) |
| 45 to 54 Years | 12 (11.4%) | 11 (16.9%) |
| 55 to 64 Years | 39 (23.1%) | 37 (43.5%) |
| 65 to 74 Years | 2 (6.5%) | 0 (0.0%) |
| 75 Years and over | 8 (10.3%) | 6 (7.1%) |
| Total | 157 (18.9%) | 144 (19.5%) |
Income Above Poverty by Sex and Age in Gruetli Laager
According to the poverty statistics in Gruetli Laager, males aged 15 years and females aged 5 years are the age groups that are most secure financially, with 100.0% of males and 100.0% of females in these age groups living above the poverty line.
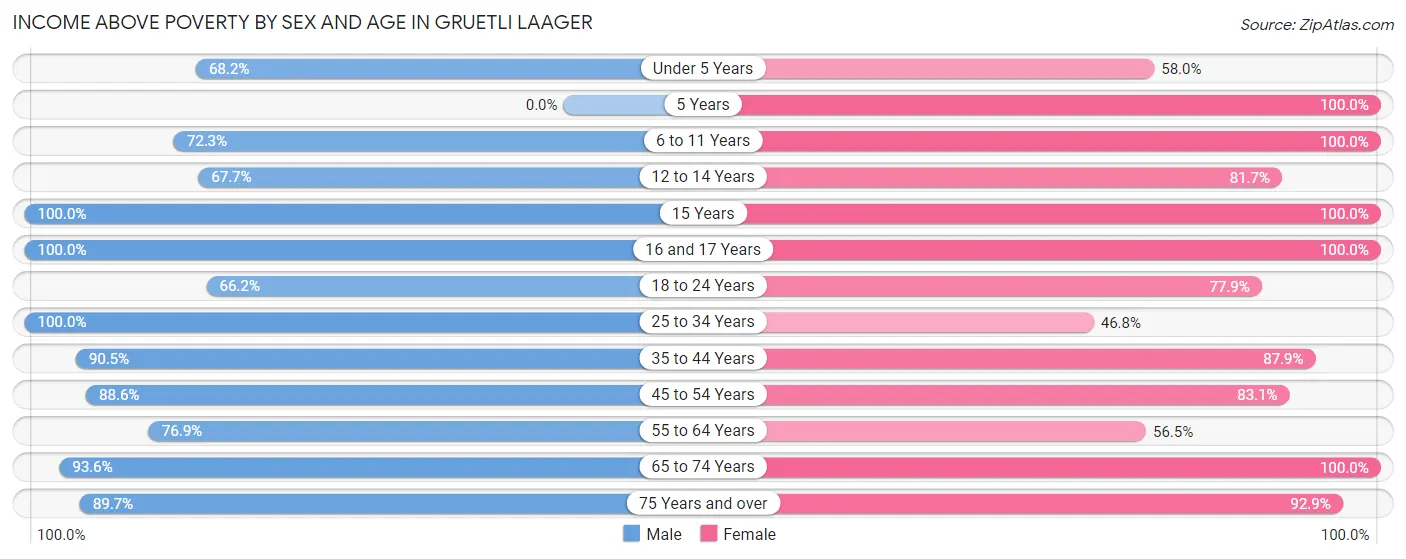
| Age Bracket | Male | Female |
| Under 5 Years | 60 (68.2%) | 29 (58.0%) |
| 5 Years | 0 (0.0%) | 19 (100.0%) |
| 6 to 11 Years | 60 (72.3%) | 71 (100.0%) |
| 12 to 14 Years | 21 (67.7%) | 49 (81.7%) |
| 15 Years | 4 (100.0%) | 12 (100.0%) |
| 16 and 17 Years | 17 (100.0%) | 9 (100.0%) |
| 18 to 24 Years | 49 (66.2%) | 60 (77.9%) |
| 25 to 34 Years | 48 (100.0%) | 29 (46.8%) |
| 35 to 44 Years | 95 (90.5%) | 58 (87.9%) |
| 45 to 54 Years | 93 (88.6%) | 54 (83.1%) |
| 55 to 64 Years | 130 (76.9%) | 48 (56.5%) |
| 65 to 74 Years | 29 (93.5%) | 79 (100.0%) |
| 75 Years and over | 70 (89.7%) | 79 (92.9%) |
| Total | 676 (81.1%) | 596 (80.5%) |
Income Below Poverty Among Married-Couple Families in Gruetli Laager
The poverty statistics for married-couple families in Gruetli Laager show that 11.3% or 36 of the total 318 families live below the poverty line. Families with 3 or 4 children have the highest poverty rate of 25.0%, comprising of 5 families. On the other hand, families with 1 or 2 children have the lowest poverty rate of 5.4%, which includes 6 families.
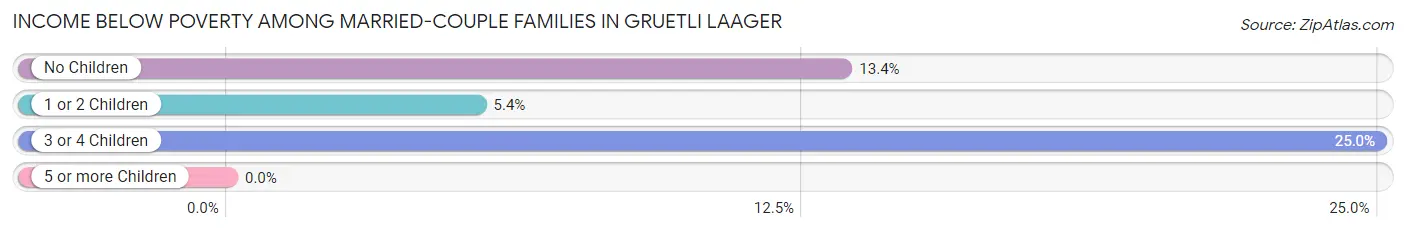
| Children | Above Poverty | Below Poverty |
| No Children | 162 (86.6%) | 25 (13.4%) |
| 1 or 2 Children | 105 (94.6%) | 6 (5.4%) |
| 3 or 4 Children | 15 (75.0%) | 5 (25.0%) |
| 5 or more Children | 0 (0.0%) | 0 (0.0%) |
| Total | 282 (88.7%) | 36 (11.3%) |
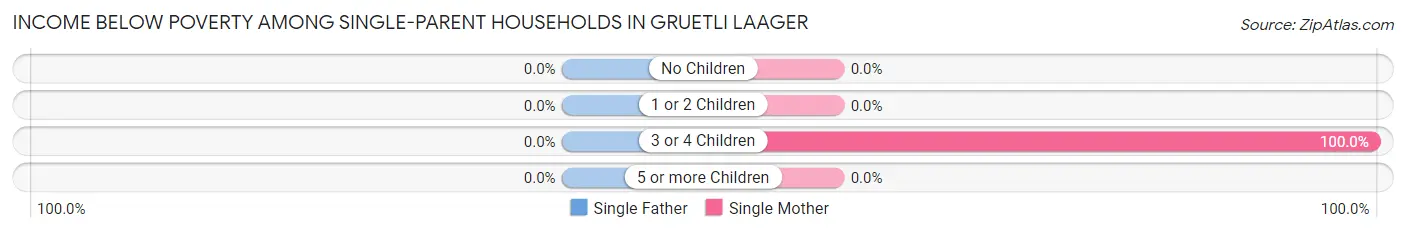
Income Below Poverty Among Single-Parent Households in Gruetli Laager
| Children | Single Father | Single Mother |
| No Children | 0 (0.0%) | 0 (0.0%) |
| 1 or 2 Children | 0 (0.0%) | 0 (0.0%) |
| 3 or 4 Children | 0 (0.0%) | 8 (100.0%) |
| 5 or more Children | 0 (0.0%) | 0 (0.0%) |
| Total | 0 (0.0%) | 8 (22.2%) |
Income Below Poverty Among Married-Couple vs Single-Parent Households in Gruetli Laager
The poverty data for Gruetli Laager shows that 36 of the married-couple family households (11.3%) and 8 of the single-parent households (11.4%) are living below the poverty level. Within the married-couple family households, those with 3 or 4 children have the highest poverty rate, with 5 households (25.0%) falling below the poverty line. Among the single-parent households, those with 3 or 4 children have the highest poverty rate, with 8 household (66.7%) living below poverty.
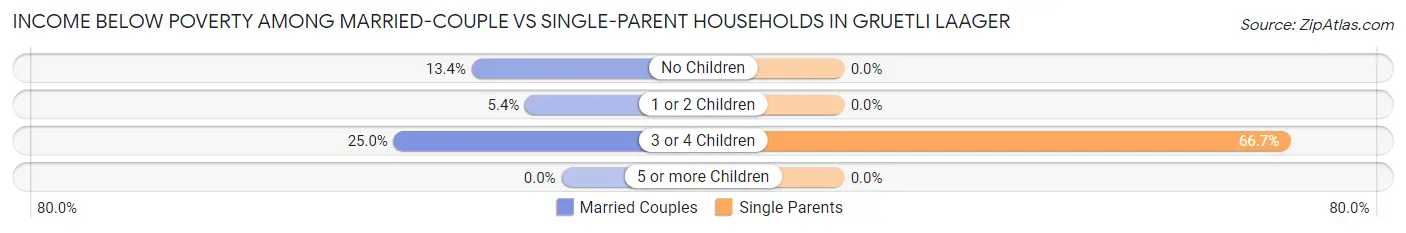
| Children | Married-Couple Families | Single-Parent Households |
| No Children | 25 (13.4%) | 0 (0.0%) |
| 1 or 2 Children | 6 (5.4%) | 0 (0.0%) |
| 3 or 4 Children | 5 (25.0%) | 8 (66.7%) |
| 5 or more Children | 0 (0.0%) | 0 (0.0%) |
| Total | 36 (11.3%) | 8 (11.4%) |
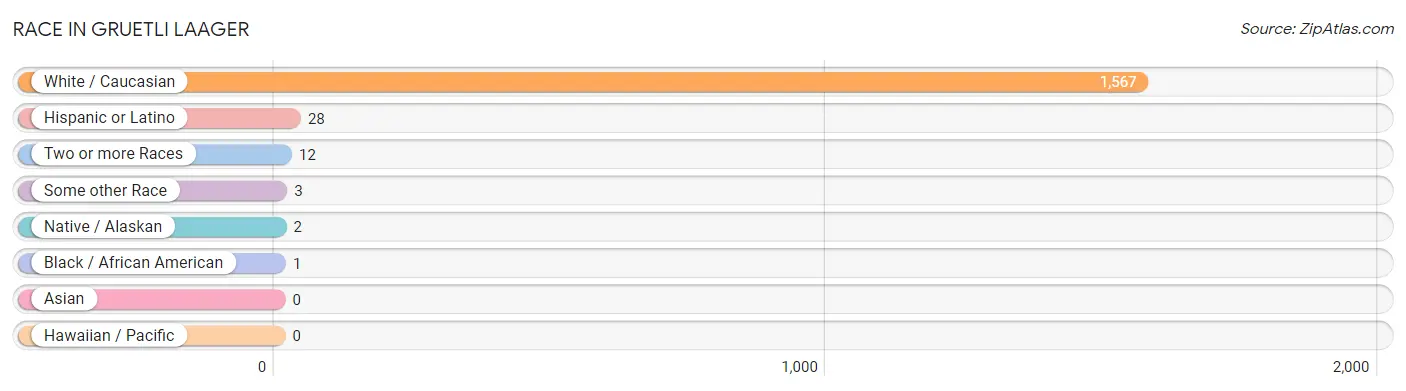
Race in Gruetli Laager
The most populous races in Gruetli Laager are White / Caucasian (1,567 | 98.9%), Hispanic or Latino (28 | 1.8%), and Two or more Races (12 | 0.8%).
| Race | # Population | % Population |
| Asian | 0 | 0.0% |
| Black / African American | 1 | 0.1% |
| Hawaiian / Pacific | 0 | 0.0% |
| Hispanic or Latino | 28 | 1.8% |
| Native / Alaskan | 2 | 0.1% |
| White / Caucasian | 1,567 | 98.9% |
| Two or more Races | 12 | 0.8% |
| Some other Race | 3 | 0.2% |
| Total | 1,585 | 100.0% |
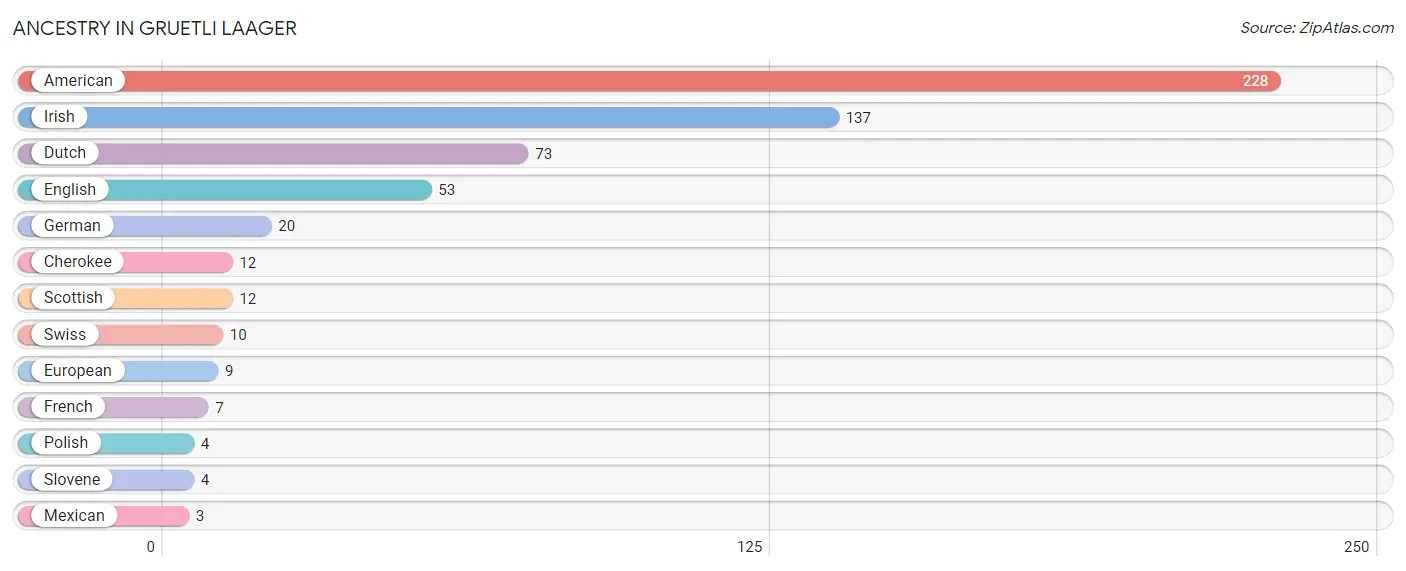
Ancestry in Gruetli Laager
The most populous ancestries reported in Gruetli Laager are American (228 | 14.4%), Irish (137 | 8.6%), Dutch (73 | 4.6%), English (53 | 3.3%), and German (20 | 1.3%), together accounting for 32.2% of all Gruetli Laager residents.
| Ancestry | # Population | % Population |
| American | 228 | 14.4% |
| Cherokee | 12 | 0.8% |
| Dutch | 73 | 4.6% |
| English | 53 | 3.3% |
| European | 9 | 0.6% |
| French | 7 | 0.4% |
| German | 20 | 1.3% |
| Irish | 137 | 8.6% |
| Mexican | 3 | 0.2% |
| Polish | 4 | 0.3% |
| Scottish | 12 | 0.8% |
| Slovene | 4 | 0.3% |
| Swiss | 10 | 0.6% | View All 13 Rows |
Immigrants in Gruetli Laager

| Immigration Origin | # Population | % Population | View All 0 Rows |
Sex and Age in Gruetli Laager
Sex and Age in Gruetli Laager
The most populous age groups in Gruetli Laager are Under 5 Years (88 | 10.6%) for men and 10 to 14 Years (92 | 12.2%) for women.
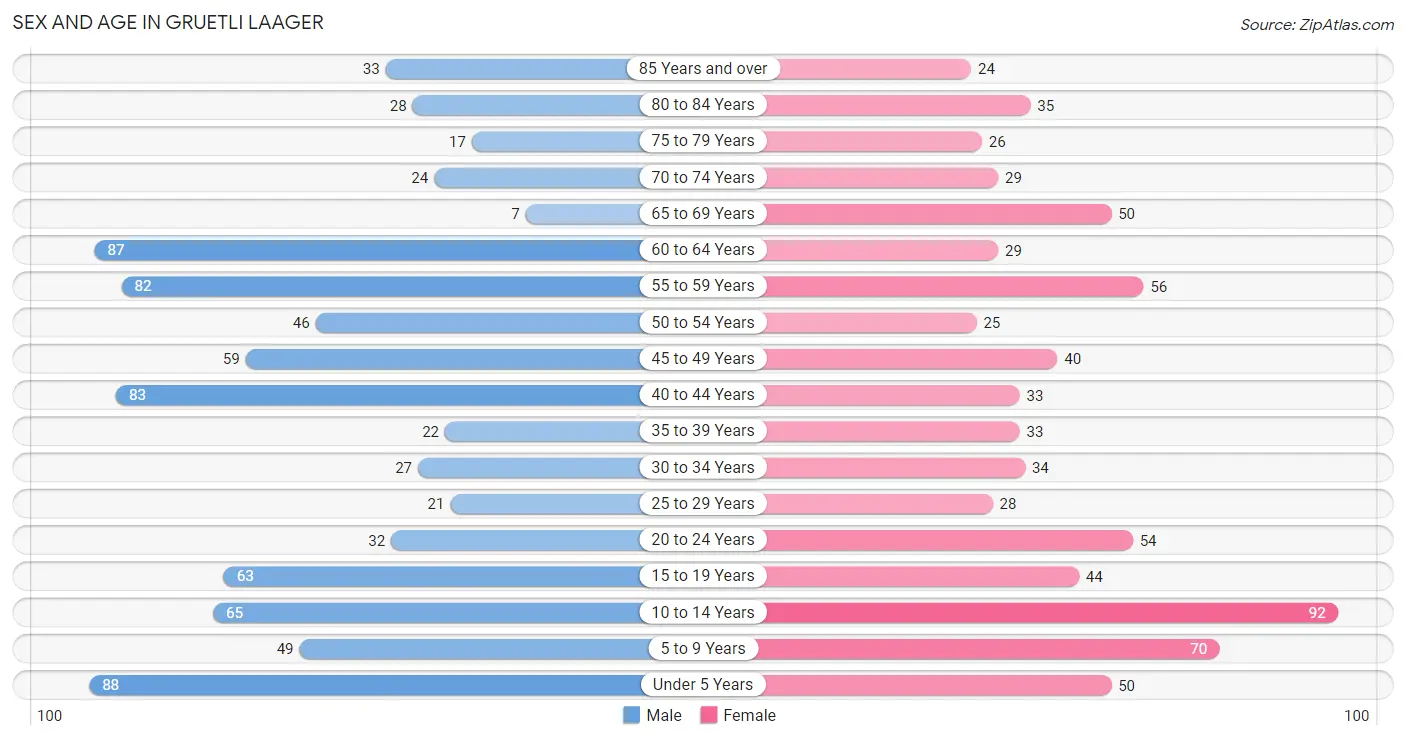
| Age Bracket | Male | Female |
| Under 5 Years | 88 (10.6%) | 50 (6.7%) |
| 5 to 9 Years | 49 (5.9%) | 70 (9.3%) |
| 10 to 14 Years | 65 (7.8%) | 92 (12.2%) |
| 15 to 19 Years | 63 (7.6%) | 44 (5.9%) |
| 20 to 24 Years | 32 (3.8%) | 54 (7.2%) |
| 25 to 29 Years | 21 (2.5%) | 28 (3.7%) |
| 30 to 34 Years | 27 (3.2%) | 34 (4.5%) |
| 35 to 39 Years | 22 (2.6%) | 33 (4.4%) |
| 40 to 44 Years | 83 (10.0%) | 33 (4.4%) |
| 45 to 49 Years | 59 (7.1%) | 40 (5.3%) |
| 50 to 54 Years | 46 (5.5%) | 25 (3.3%) |
| 55 to 59 Years | 82 (9.8%) | 56 (7.4%) |
| 60 to 64 Years | 87 (10.4%) | 29 (3.9%) |
| 65 to 69 Years | 7 (0.8%) | 50 (6.7%) |
| 70 to 74 Years | 24 (2.9%) | 29 (3.9%) |
| 75 to 79 Years | 17 (2.0%) | 26 (3.5%) |
| 80 to 84 Years | 28 (3.4%) | 35 (4.6%) |
| 85 Years and over | 33 (4.0%) | 24 (3.2%) |
| Total | 833 (100.0%) | 752 (100.0%) |
Families and Households in Gruetli Laager
Median Family Size in Gruetli Laager
The median family size in Gruetli Laager is 3.63 persons per family, with married-couple families (318 | 82.0%) accounting for the largest median family size of 3.67 persons per family. On the other hand, single female/mother families (36 | 9.3%) represent the smallest median family size with 3.31 persons per family.
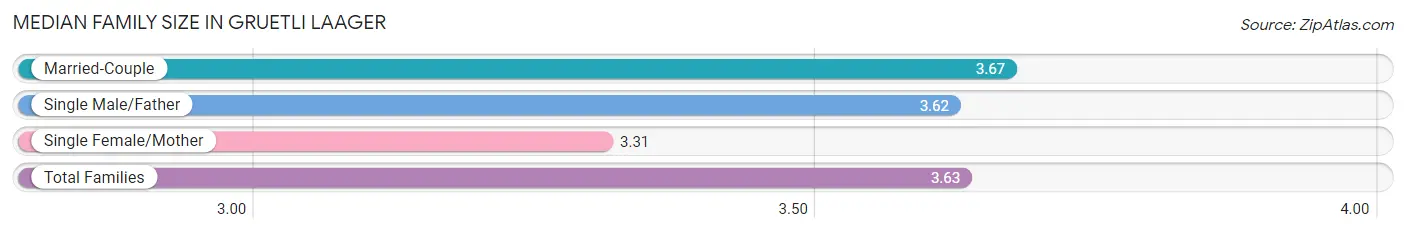
| Family Type | # Families | Family Size |
| Married-Couple | 318 (82.0%) | 3.67 |
| Single Male/Father | 34 (8.8%) | 3.62 |
| Single Female/Mother | 36 (9.3%) | 3.31 |
| Total Families | 388 (100.0%) | 3.63 |
Median Household Size in Gruetli Laager
The median household size in Gruetli Laager is 3.18 persons per household, with single male/father households (34 | 6.8%) accounting for the largest median household size of 4.38 persons per household. non-family households (110 | 22.1%) represent the smallest median household size with 1.05 persons per household.
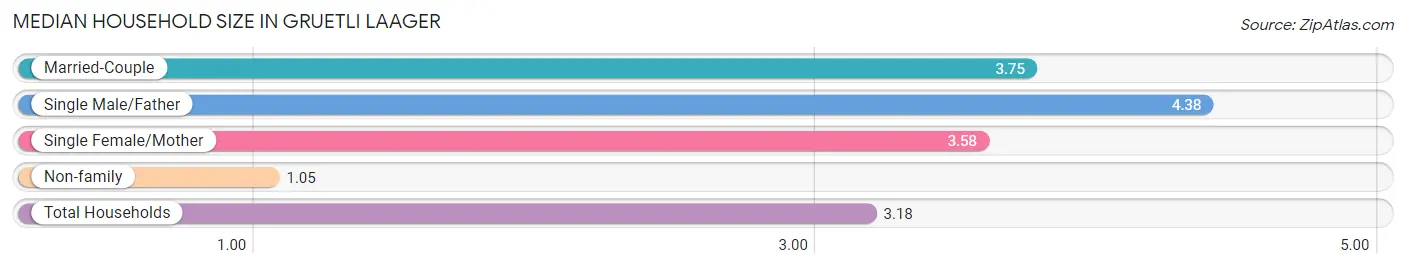
| Household Type | # Households | Household Size |
| Married-Couple | 318 (63.9%) | 3.75 |
| Single Male/Father | 34 (6.8%) | 4.38 |
| Single Female/Mother | 36 (7.2%) | 3.58 |
| Non-family | 110 (22.1%) | 1.05 |
| Total Households | 498 (100.0%) | 3.18 |
Household Size by Marriage Status in Gruetli Laager
Out of a total of 498 households in Gruetli Laager, 388 (77.9%) are family households, while 110 (22.1%) are nonfamily households. The most numerous type of family households are 2-person households, comprising 187, and the most common type of nonfamily households are 1-person households, comprising 99.
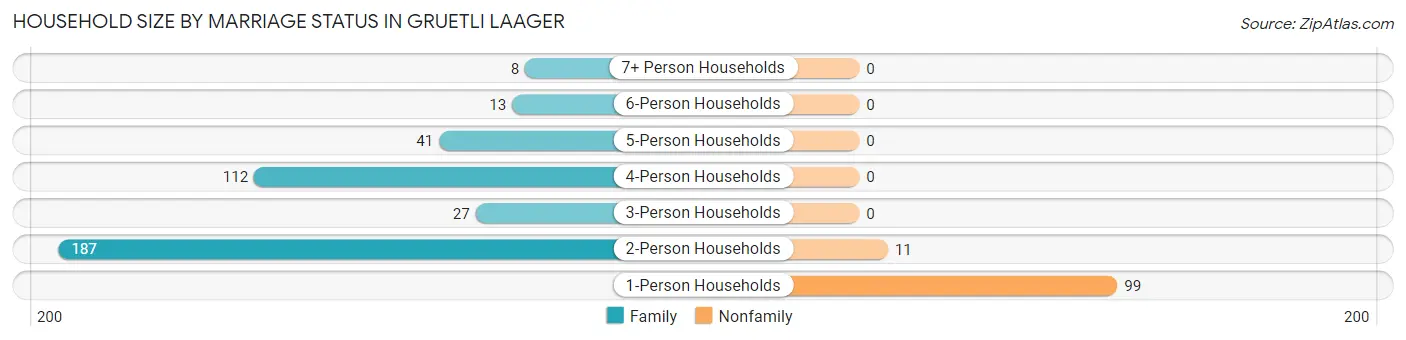
| Household Size | Family Households | Nonfamily Households |
| 1-Person Households | - | 99 (19.9%) |
| 2-Person Households | 187 (37.6%) | 11 (2.2%) |
| 3-Person Households | 27 (5.4%) | 0 (0.0%) |
| 4-Person Households | 112 (22.5%) | 0 (0.0%) |
| 5-Person Households | 41 (8.2%) | 0 (0.0%) |
| 6-Person Households | 13 (2.6%) | 0 (0.0%) |
| 7+ Person Households | 8 (1.6%) | 0 (0.0%) |
| Total | 388 (77.9%) | 110 (22.1%) |
Female Fertility in Gruetli Laager
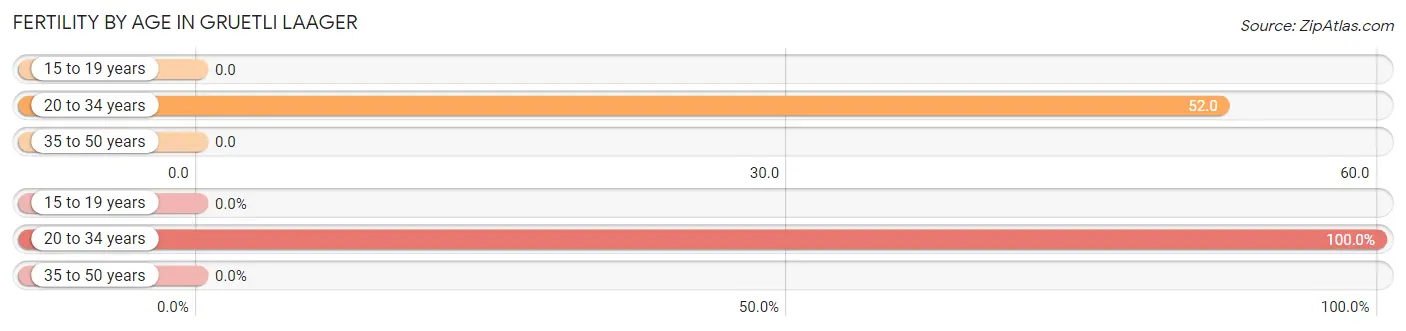
Fertility by Age in Gruetli Laager
Average fertility rate in Gruetli Laager is 22.0 births per 1,000 women. Women in the age bracket of 20 to 34 years have the highest fertility rate with 52.0 births per 1,000 women. Women in the age bracket of 20 to 34 years acount for 100.0% of all women with births.
| Age Bracket | Women with Births | Births / 1,000 Women |
| 15 to 19 years | 0 (0.0%) | 0.0 |
| 20 to 34 years | 6 (100.0%) | 52.0 |
| 35 to 50 years | 0 (0.0%) | 0.0 |
| Total | 6 (100.0%) | 22.0 |
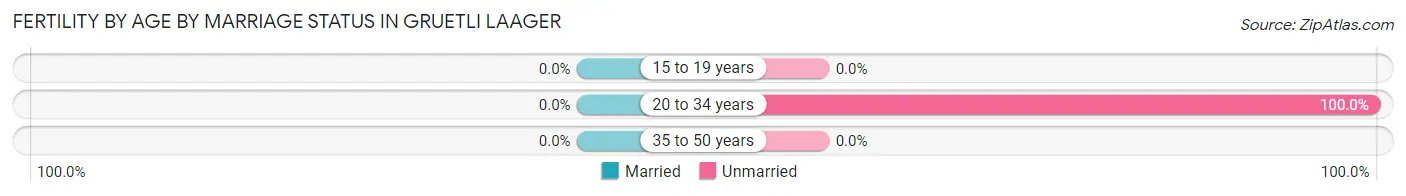
Fertility by Age by Marriage Status in Gruetli Laager
| Age Bracket | Married | Unmarried |
| 15 to 19 years | 0 (0.0%) | 0 (0.0%) |
| 20 to 34 years | 0 (0.0%) | 6 (100.0%) |
| 35 to 50 years | 0 (0.0%) | 0 (0.0%) |
| Total | 0 (0.0%) | 6 (100.0%) |
Fertility by Education in Gruetli Laager
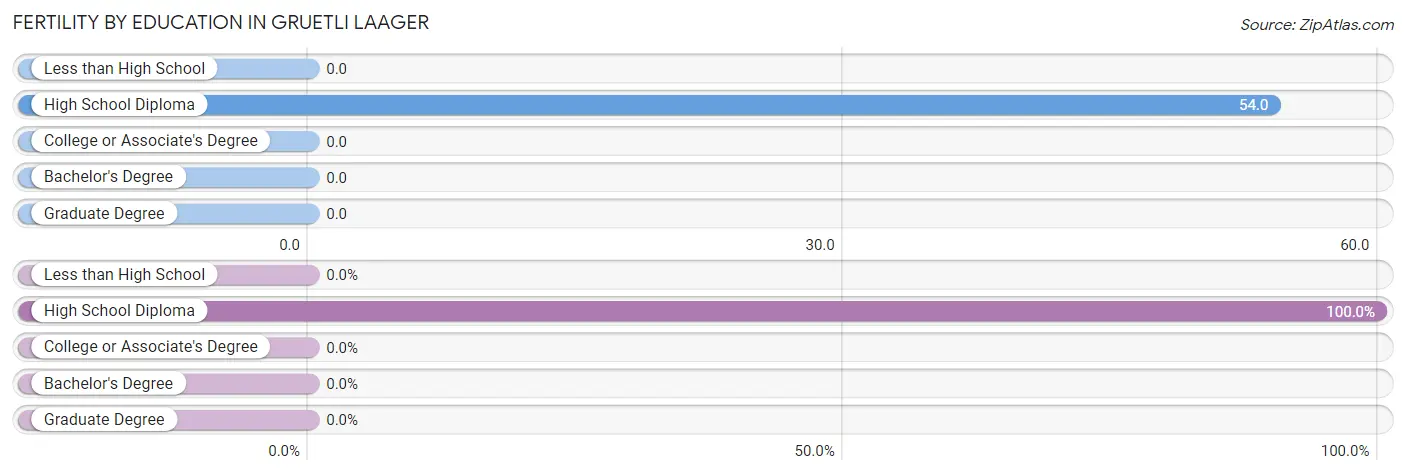
| Educational Attainment | Women with Births | Births / 1,000 Women |
| Less than High School | 0 (0.0%) | 0.0 |
| High School Diploma | 6 (100.0%) | 54.0 |
| College or Associate's Degree | 0 (0.0%) | 0.0 |
| Bachelor's Degree | 0 (0.0%) | 0.0 |
| Graduate Degree | 0 (0.0%) | 0.0 |
| Total | 6 (100.0%) | 22.0 |
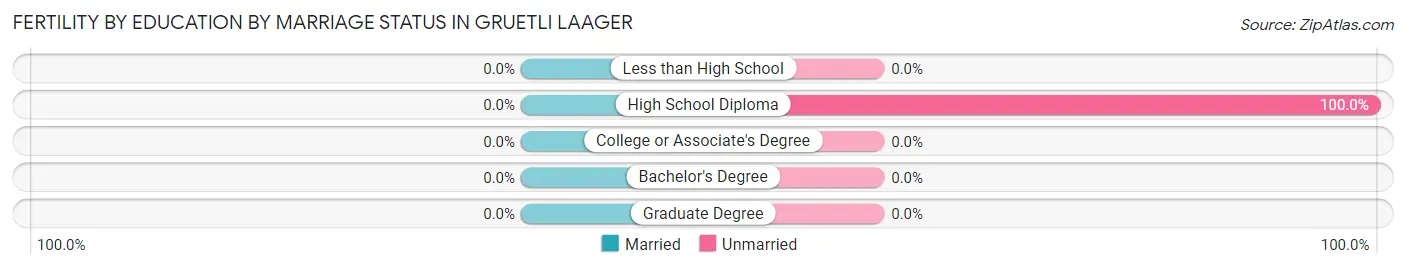
Fertility by Education by Marriage Status in Gruetli Laager
| Educational Attainment | Married | Unmarried |
| Less than High School | 0 (0.0%) | 0 (0.0%) |
| High School Diploma | 0 (0.0%) | 6 (100.0%) |
| College or Associate's Degree | 0 (0.0%) | 0 (0.0%) |
| Bachelor's Degree | 0 (0.0%) | 0 (0.0%) |
| Graduate Degree | 0 (0.0%) | 0 (0.0%) |
| Total | 0 (0.0%) | 6 (100.0%) |
Employment Characteristics in Gruetli Laager
Employment by Class of Employer in Gruetli Laager
Among the 599 employed individuals in Gruetli Laager, private company employees (415 | 69.3%), self-employed (not incorporated) (96 | 16.0%), and local government employees (34 | 5.7%) make up the most common classes of employment.
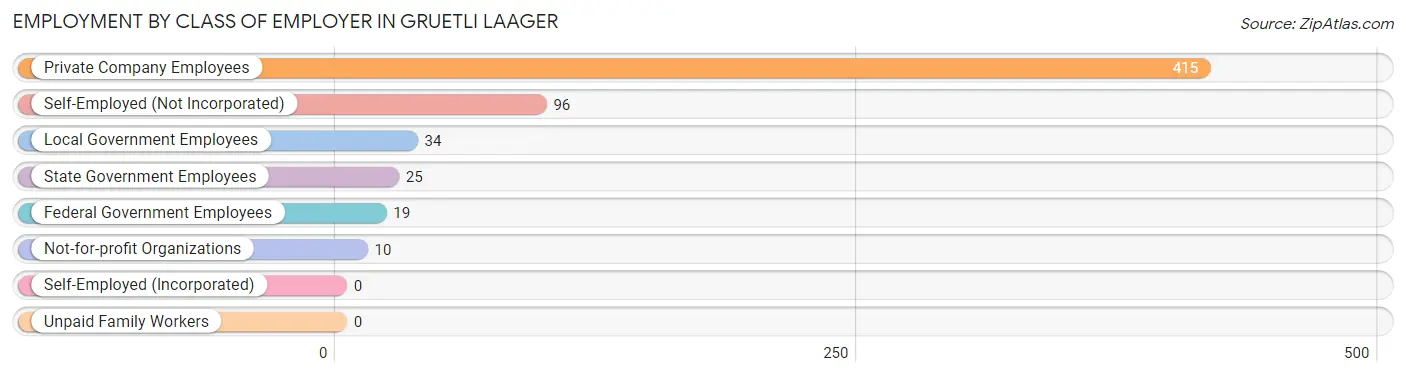
| Employer Class | # Employees | % Employees |
| Private Company Employees | 415 | 69.3% |
| Self-Employed (Incorporated) | 0 | 0.0% |
| Self-Employed (Not Incorporated) | 96 | 16.0% |
| Not-for-profit Organizations | 10 | 1.7% |
| Local Government Employees | 34 | 5.7% |
| State Government Employees | 25 | 4.2% |
| Federal Government Employees | 19 | 3.2% |
| Unpaid Family Workers | 0 | 0.0% |
| Total | 599 | 100.0% |
Employment Status by Age in Gruetli Laager
According to the labor force statistics for Gruetli Laager, out of the total population over 16 years of age (1,155), 57.9% or 669 individuals are in the labor force, with 8.4% or 56 of them unemployed. The age group with the highest labor force participation rate is 30 to 34 years, with 100.0% or 61 individuals in the labor force. Within the labor force, the 55 to 59 years age range has the highest percentage of unemployed individuals, with 32.5% or 27 of them being unemployed.
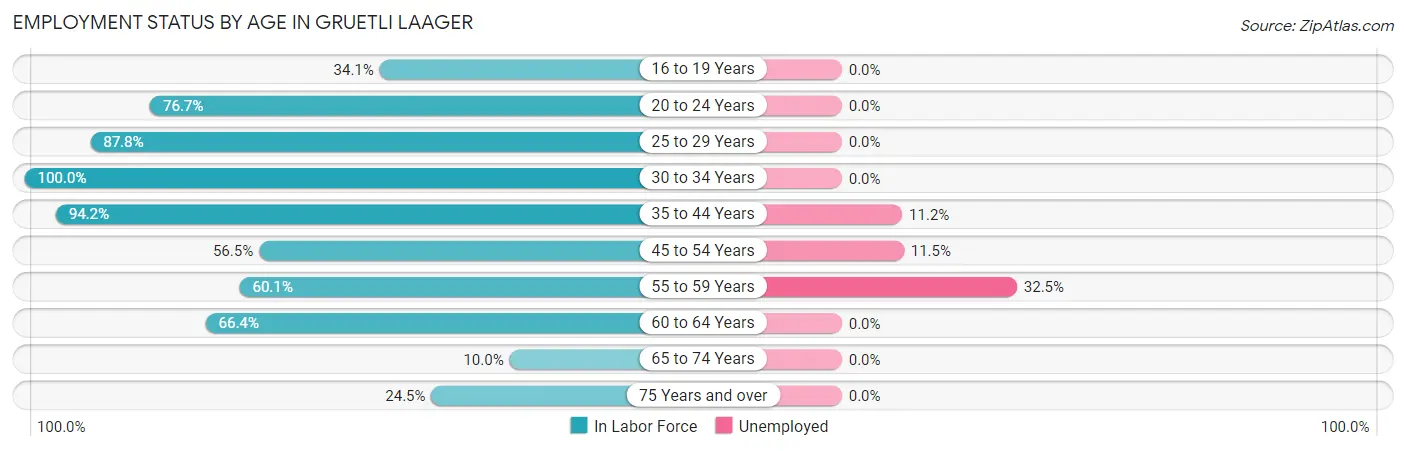
| Age Bracket | In Labor Force | Unemployed |
| 16 to 19 Years | 31 (34.1%) | 0 (0.0%) |
| 20 to 24 Years | 66 (76.7%) | 0 (0.0%) |
| 25 to 29 Years | 43 (87.8%) | 0 (0.0%) |
| 30 to 34 Years | 61 (100.0%) | 0 (0.0%) |
| 35 to 44 Years | 161 (94.2%) | 18 (11.2%) |
| 45 to 54 Years | 96 (56.5%) | 11 (11.5%) |
| 55 to 59 Years | 83 (60.1%) | 27 (32.5%) |
| 60 to 64 Years | 77 (66.4%) | 0 (0.0%) |
| 65 to 74 Years | 11 (10.0%) | 0 (0.0%) |
| 75 Years and over | 40 (24.5%) | 0 (0.0%) |
| Total | 669 (57.9%) | 56 (8.4%) |
Employment Status by Educational Attainment in Gruetli Laager
According to labor force statistics for Gruetli Laager, 73.9% of individuals (521) out of the total population between 25 and 64 years of age (705) are in the labor force, with 10.7% or 56 of them being unemployed. The group with the highest labor force participation rate are those with the educational attainment of bachelor's degree or higher, with 100.0% or 13 individuals in the labor force. Within the labor force, individuals with less than high school education have the highest percentage of unemployment, with 27.6% or 21 of them being unemployed.
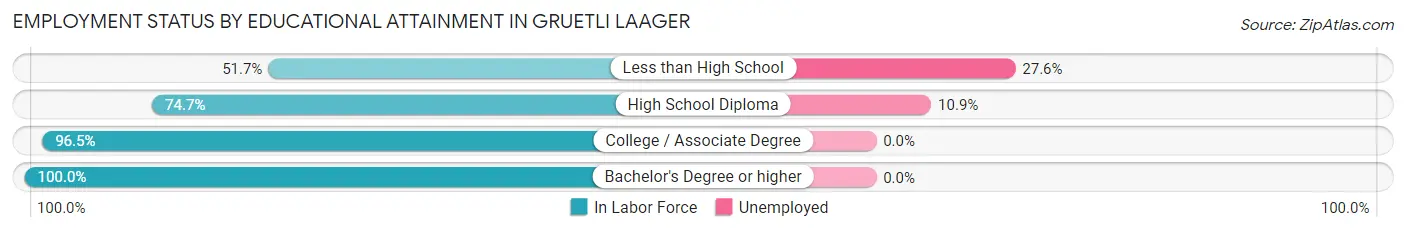
| Educational Attainment | In Labor Force | Unemployed |
| Less than High School | 76 (51.7%) | 41 (27.6%) |
| High School Diploma | 322 (74.7%) | 47 (10.9%) |
| College / Associate Degree | 110 (96.5%) | 0 (0.0%) |
| Bachelor's Degree or higher | 13 (100.0%) | 0 (0.0%) |
| Total | 521 (73.9%) | 75 (10.7%) |
Employment Occupations by Sex in Gruetli Laager
Management, Business, Science and Arts Occupations
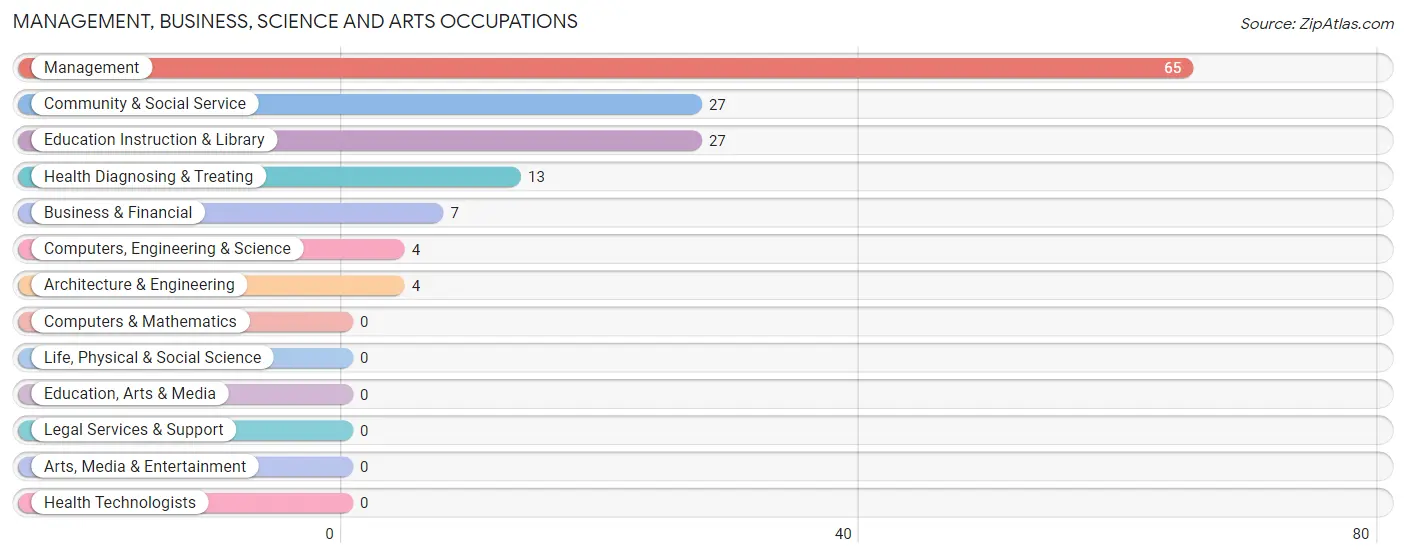
The most common Management, Business, Science and Arts occupations in Gruetli Laager are Management (65 | 10.6%), Community & Social Service (27 | 4.4%), Education Instruction & Library (27 | 4.4%), Health Diagnosing & Treating (13 | 2.1%), and Business & Financial (7 | 1.1%).
Management, Business, Science and Arts Occupations by Sex
Within the Management, Business, Science and Arts occupations in Gruetli Laager, the most male-oriented occupations are Computers, Engineering & Science (100.0%), Architecture & Engineering (100.0%), and Management (67.7%), while the most female-oriented occupations are Business & Financial (100.0%), Community & Social Service (100.0%), and Education Instruction & Library (100.0%).
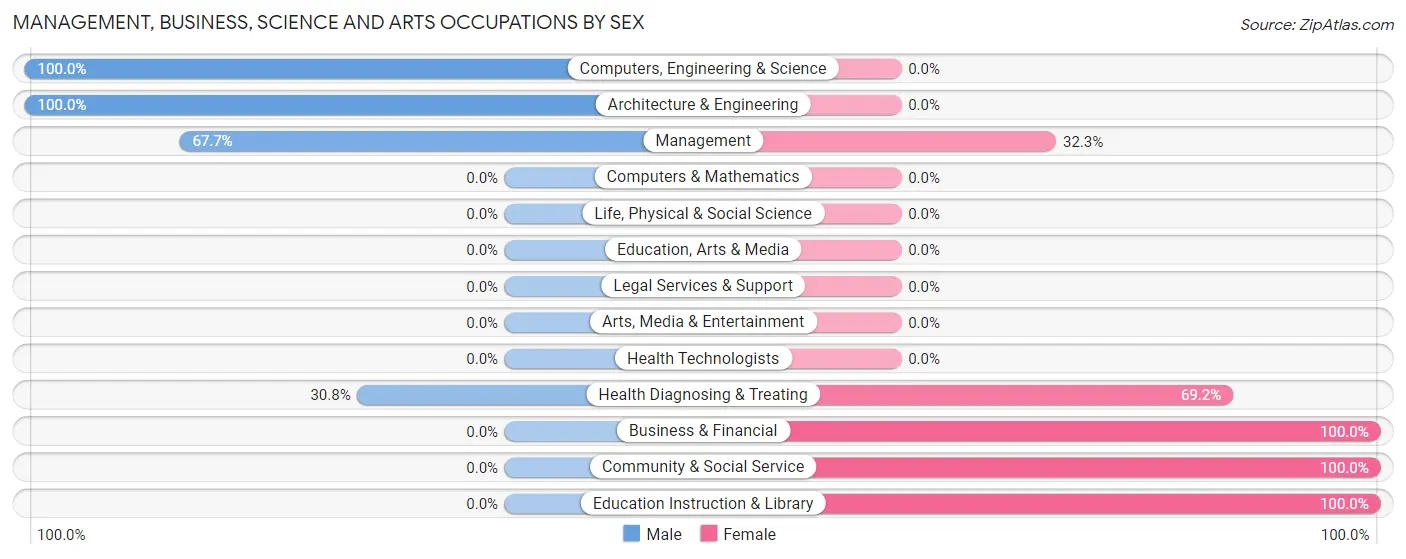
| Occupation | Male | Female |
| Management | 44 (67.7%) | 21 (32.3%) |
| Business & Financial | 0 (0.0%) | 7 (100.0%) |
| Computers, Engineering & Science | 4 (100.0%) | 0 (0.0%) |
| Computers & Mathematics | 0 (0.0%) | 0 (0.0%) |
| Architecture & Engineering | 4 (100.0%) | 0 (0.0%) |
| Life, Physical & Social Science | 0 (0.0%) | 0 (0.0%) |
| Community & Social Service | 0 (0.0%) | 27 (100.0%) |
| Education, Arts & Media | 0 (0.0%) | 0 (0.0%) |
| Legal Services & Support | 0 (0.0%) | 0 (0.0%) |
| Education Instruction & Library | 0 (0.0%) | 27 (100.0%) |
| Arts, Media & Entertainment | 0 (0.0%) | 0 (0.0%) |
| Health Diagnosing & Treating | 4 (30.8%) | 9 (69.2%) |
| Health Technologists | 0 (0.0%) | 0 (0.0%) |
| Total (Category) | 52 (44.8%) | 64 (55.2%) |
| Total (Overall) | 371 (60.5%) | 242 (39.5%) |
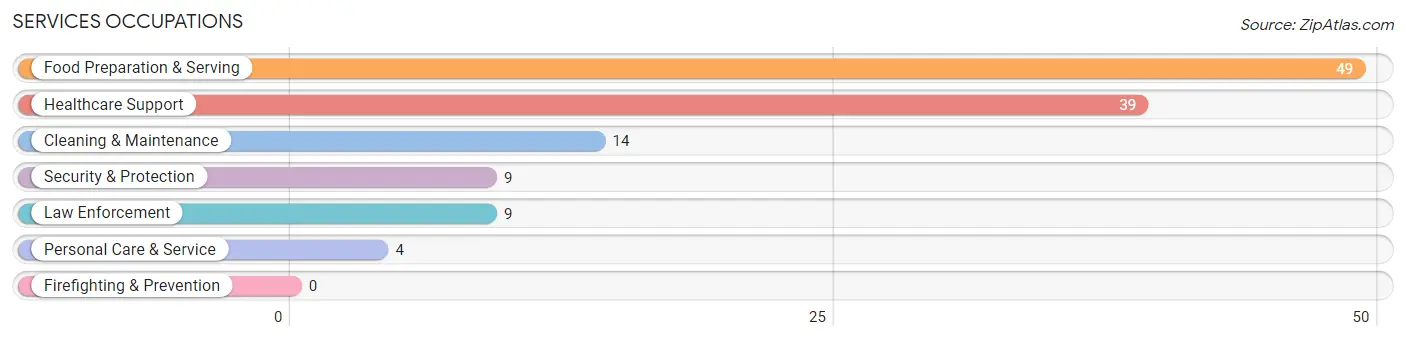
Services Occupations
The most common Services occupations in Gruetli Laager are Food Preparation & Serving (49 | 8.0%), Healthcare Support (39 | 6.4%), Cleaning & Maintenance (14 | 2.3%), Security & Protection (9 | 1.5%), and Law Enforcement (9 | 1.5%).
Services Occupations by Sex
Within the Services occupations in Gruetli Laager, the most male-oriented occupations are Security & Protection (100.0%), Law Enforcement (100.0%), and Healthcare Support (59.0%), while the most female-oriented occupations are Personal Care & Service (100.0%), Food Preparation & Serving (83.7%), and Cleaning & Maintenance (64.3%).
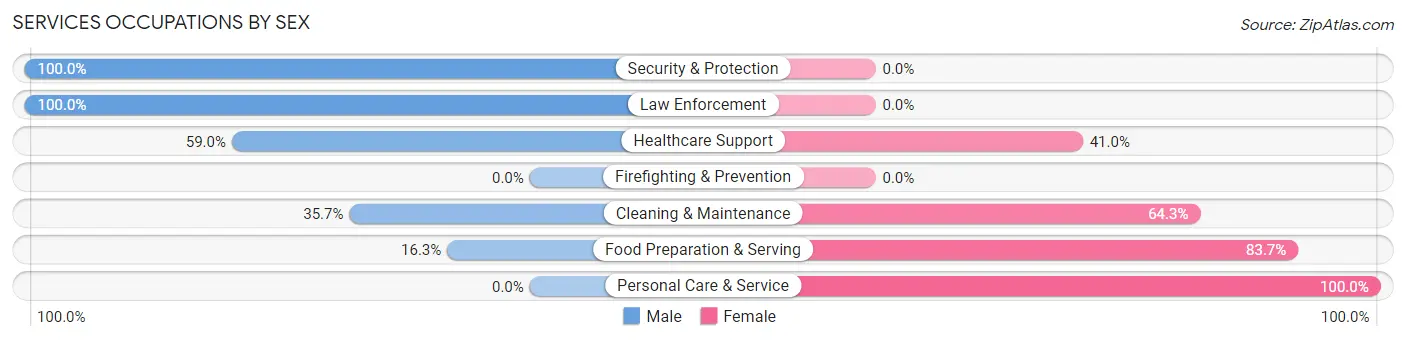
| Occupation | Male | Female |
| Healthcare Support | 23 (59.0%) | 16 (41.0%) |
| Security & Protection | 9 (100.0%) | 0 (0.0%) |
| Firefighting & Prevention | 0 (0.0%) | 0 (0.0%) |
| Law Enforcement | 9 (100.0%) | 0 (0.0%) |
| Food Preparation & Serving | 8 (16.3%) | 41 (83.7%) |
| Cleaning & Maintenance | 5 (35.7%) | 9 (64.3%) |
| Personal Care & Service | 0 (0.0%) | 4 (100.0%) |
| Total (Category) | 45 (39.1%) | 70 (60.9%) |
| Total (Overall) | 371 (60.5%) | 242 (39.5%) |
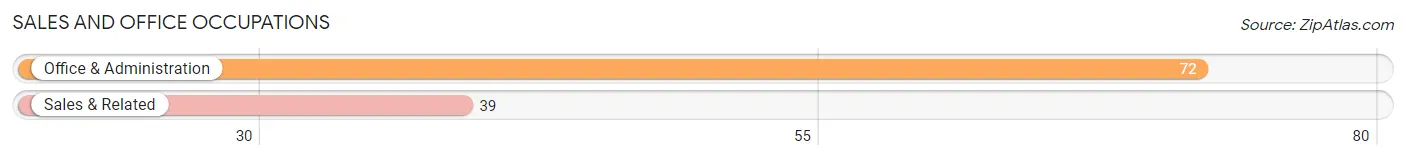
Sales and Office Occupations
The most common Sales and Office occupations in Gruetli Laager are Office & Administration (72 | 11.7%), and Sales & Related (39 | 6.4%).
Sales and Office Occupations by Sex
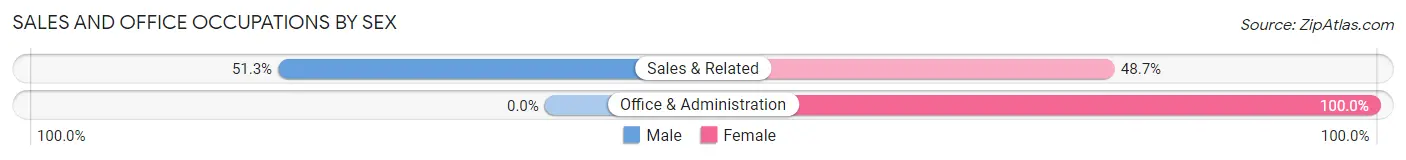
| Occupation | Male | Female |
| Sales & Related | 20 (51.3%) | 19 (48.7%) |
| Office & Administration | 0 (0.0%) | 72 (100.0%) |
| Total (Category) | 20 (18.0%) | 91 (82.0%) |
| Total (Overall) | 371 (60.5%) | 242 (39.5%) |
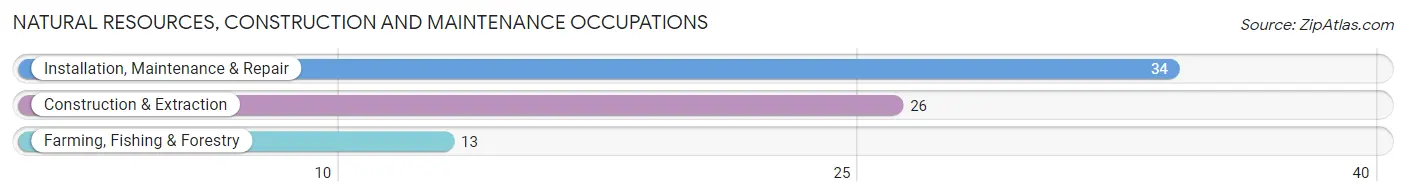
Natural Resources, Construction and Maintenance Occupations
The most common Natural Resources, Construction and Maintenance occupations in Gruetli Laager are Installation, Maintenance & Repair (34 | 5.6%), Construction & Extraction (26 | 4.2%), and Farming, Fishing & Forestry (13 | 2.1%).
Natural Resources, Construction and Maintenance Occupations by Sex
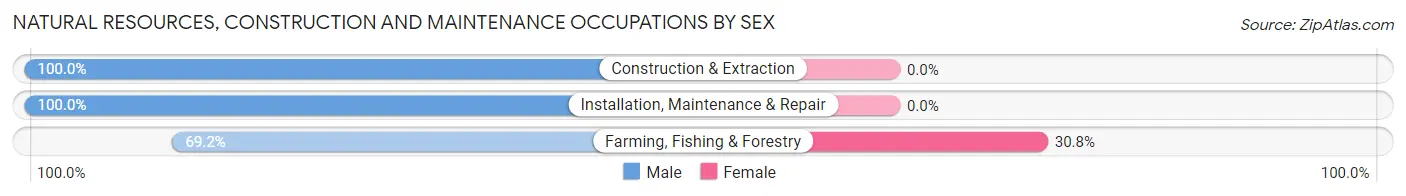
| Occupation | Male | Female |
| Farming, Fishing & Forestry | 9 (69.2%) | 4 (30.8%) |
| Construction & Extraction | 26 (100.0%) | 0 (0.0%) |
| Installation, Maintenance & Repair | 34 (100.0%) | 0 (0.0%) |
| Total (Category) | 69 (94.5%) | 4 (5.5%) |
| Total (Overall) | 371 (60.5%) | 242 (39.5%) |
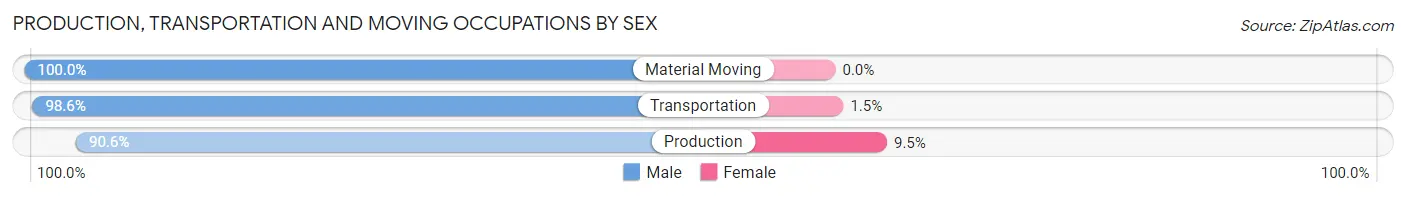
Production, Transportation and Moving Occupations
The most common Production, Transportation and Moving occupations in Gruetli Laager are Production (127 | 20.7%), Transportation (69 | 11.3%), and Material Moving (2 | 0.3%).
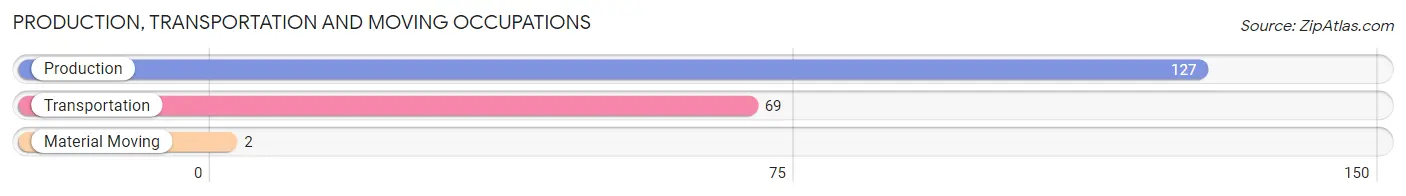
Production, Transportation and Moving Occupations by Sex
| Occupation | Male | Female |
| Production | 115 (90.5%) | 12 (9.5%) |
| Transportation | 68 (98.6%) | 1 (1.5%) |
| Material Moving | 2 (100.0%) | 0 (0.0%) |
| Total (Category) | 185 (93.4%) | 13 (6.6%) |
| Total (Overall) | 371 (60.5%) | 242 (39.5%) |
Employment Industries by Sex in Gruetli Laager
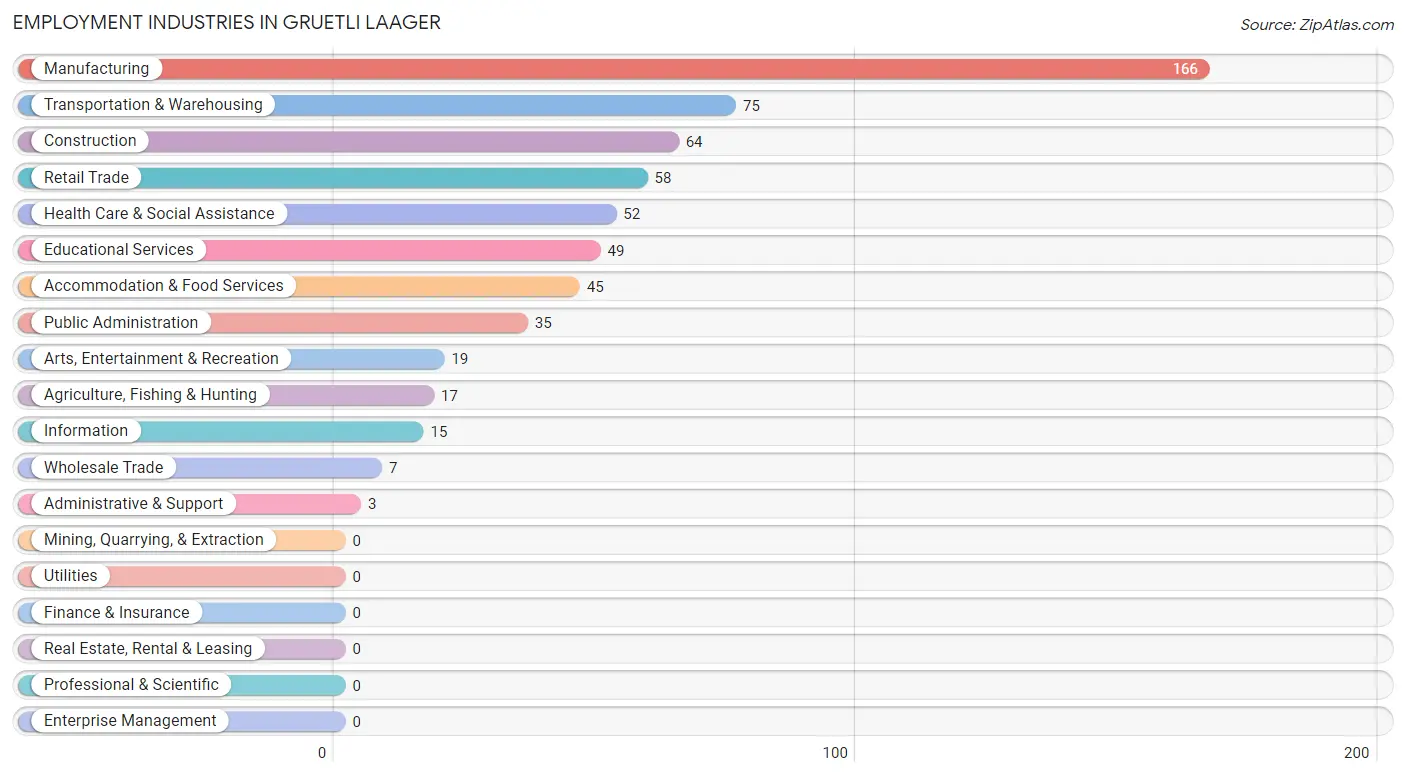
Employment Industries in Gruetli Laager
The major employment industries in Gruetli Laager include Manufacturing (166 | 27.1%), Transportation & Warehousing (75 | 12.2%), Construction (64 | 10.4%), Retail Trade (58 | 9.5%), and Health Care & Social Assistance (52 | 8.5%).
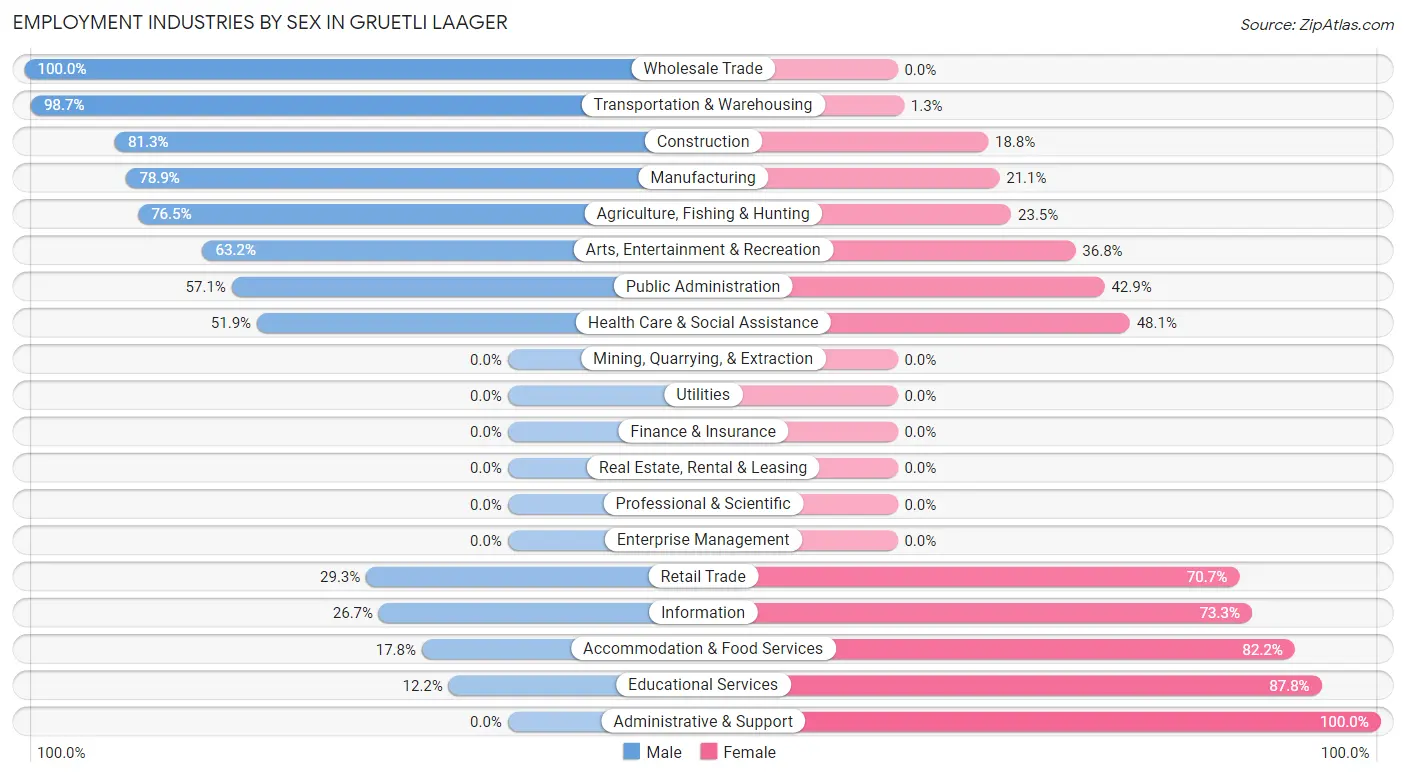
Employment Industries by Sex in Gruetli Laager
The Gruetli Laager industries that see more men than women are Wholesale Trade (100.0%), Transportation & Warehousing (98.7%), and Construction (81.2%), whereas the industries that tend to have a higher number of women are Administrative & Support (100.0%), Educational Services (87.8%), and Accommodation & Food Services (82.2%).
| Industry | Male | Female |
| Agriculture, Fishing & Hunting | 13 (76.5%) | 4 (23.5%) |
| Mining, Quarrying, & Extraction | 0 (0.0%) | 0 (0.0%) |
| Construction | 52 (81.2%) | 12 (18.8%) |
| Manufacturing | 131 (78.9%) | 35 (21.1%) |
| Wholesale Trade | 7 (100.0%) | 0 (0.0%) |
| Retail Trade | 17 (29.3%) | 41 (70.7%) |
| Transportation & Warehousing | 74 (98.7%) | 1 (1.3%) |
| Utilities | 0 (0.0%) | 0 (0.0%) |
| Information | 4 (26.7%) | 11 (73.3%) |
| Finance & Insurance | 0 (0.0%) | 0 (0.0%) |
| Real Estate, Rental & Leasing | 0 (0.0%) | 0 (0.0%) |
| Professional & Scientific | 0 (0.0%) | 0 (0.0%) |
| Enterprise Management | 0 (0.0%) | 0 (0.0%) |
| Administrative & Support | 0 (0.0%) | 3 (100.0%) |
| Educational Services | 6 (12.2%) | 43 (87.8%) |
| Health Care & Social Assistance | 27 (51.9%) | 25 (48.1%) |
| Arts, Entertainment & Recreation | 12 (63.2%) | 7 (36.8%) |
| Accommodation & Food Services | 8 (17.8%) | 37 (82.2%) |
| Public Administration | 20 (57.1%) | 15 (42.9%) |
| Total | 371 (60.5%) | 242 (39.5%) |
Education in Gruetli Laager
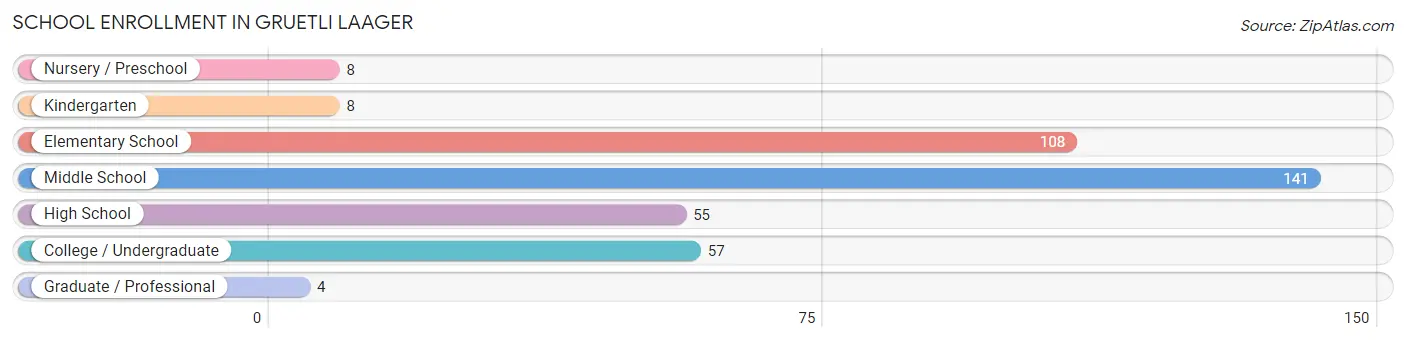
School Enrollment in Gruetli Laager
The most common levels of schooling among the 381 students in Gruetli Laager are middle school (141 | 37.0%), elementary school (108 | 28.3%), and college / undergraduate (57 | 15.0%).
| School Level | # Students | % Students |
| Nursery / Preschool | 8 | 2.1% |
| Kindergarten | 8 | 2.1% |
| Elementary School | 108 | 28.3% |
| Middle School | 141 | 37.0% |
| High School | 55 | 14.4% |
| College / Undergraduate | 57 | 15.0% |
| Graduate / Professional | 4 | 1.1% |
| Total | 381 | 100.0% |
School Enrollment by Age by Funding Source in Gruetli Laager
Out of a total of 381 students who are enrolled in schools in Gruetli Laager, 21 (5.5%) attend a private institution, while the remaining 360 (94.5%) are enrolled in public schools. The age group of 3 to 4 year olds has the highest likelihood of being enrolled in private schools, with 3 (100.0% in the age bracket) enrolled. Conversely, the age group of 15 to 17 year olds has the lowest likelihood of being enrolled in a private school, with 42 (100.0% in the age bracket) attending a public institution.
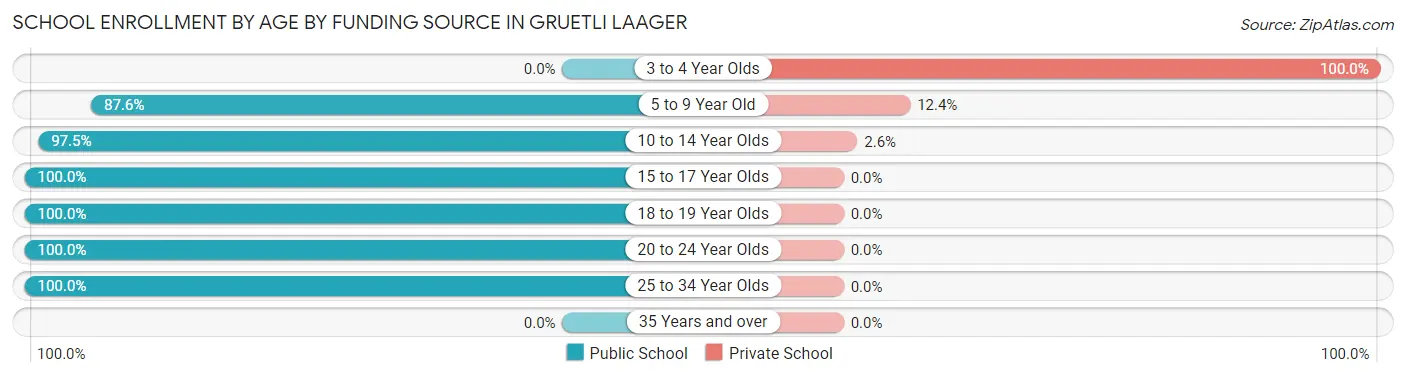
| Age Bracket | Public School | Private School |
| 3 to 4 Year Olds | 0 (0.0%) | 3 (100.0%) |
| 5 to 9 Year Old | 99 (87.6%) | 14 (12.4%) |
| 10 to 14 Year Olds | 153 (97.5%) | 4 (2.5%) |
| 15 to 17 Year Olds | 42 (100.0%) | 0 (0.0%) |
| 18 to 19 Year Olds | 31 (100.0%) | 0 (0.0%) |
| 20 to 24 Year Olds | 31 (100.0%) | 0 (0.0%) |
| 25 to 34 Year Olds | 4 (100.0%) | 0 (0.0%) |
| 35 Years and over | 0 (0.0%) | 0 (0.0%) |
| Total | 360 (94.5%) | 21 (5.5%) |
Educational Attainment by Field of Study in Gruetli Laager
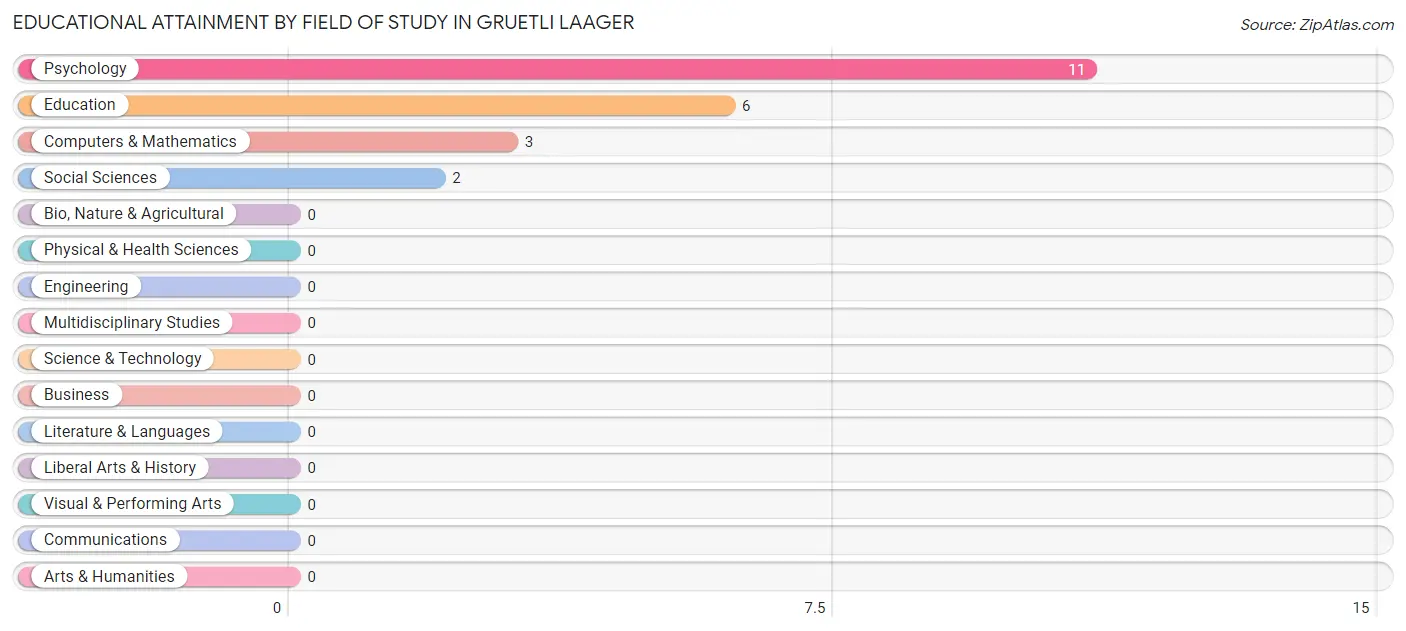
Psychology (11 | 50.0%), education (6 | 27.3%), computers & mathematics (3 | 13.6%), and social sciences (2 | 9.1%) are the most common fields of study among 22 individuals in Gruetli Laager who have obtained a bachelor's degree or higher.
| Field of Study | # Graduates | % Graduates |
| Computers & Mathematics | 3 | 13.6% |
| Bio, Nature & Agricultural | 0 | 0.0% |
| Physical & Health Sciences | 0 | 0.0% |
| Psychology | 11 | 50.0% |
| Social Sciences | 2 | 9.1% |
| Engineering | 0 | 0.0% |
| Multidisciplinary Studies | 0 | 0.0% |
| Science & Technology | 0 | 0.0% |
| Business | 0 | 0.0% |
| Education | 6 | 27.3% |
| Literature & Languages | 0 | 0.0% |
| Liberal Arts & History | 0 | 0.0% |
| Visual & Performing Arts | 0 | 0.0% |
| Communications | 0 | 0.0% |
| Arts & Humanities | 0 | 0.0% |
| Total | 22 | 100.0% |
Transportation & Commute in Gruetli Laager
Vehicle Availability by Sex in Gruetli Laager
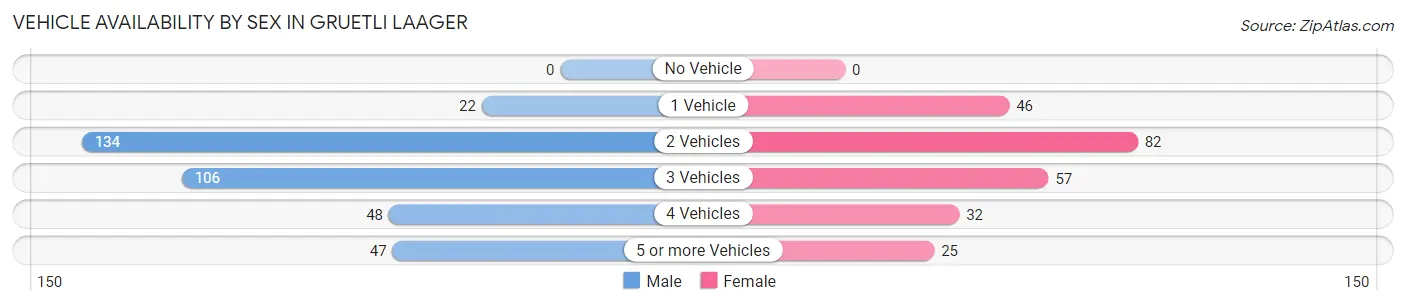
The most prevalent vehicle ownership categories in Gruetli Laager are males with 2 vehicles (134, accounting for 37.5%) and females with 2 vehicles (82, making up 55.4%).
| Vehicles Available | Male | Female |
| No Vehicle | 0 (0.0%) | 0 (0.0%) |
| 1 Vehicle | 22 (6.2%) | 46 (19.0%) |
| 2 Vehicles | 134 (37.5%) | 82 (33.9%) |
| 3 Vehicles | 106 (29.7%) | 57 (23.5%) |
| 4 Vehicles | 48 (13.5%) | 32 (13.2%) |
| 5 or more Vehicles | 47 (13.2%) | 25 (10.3%) |
| Total | 357 (100.0%) | 242 (100.0%) |
Commute Time in Gruetli Laager
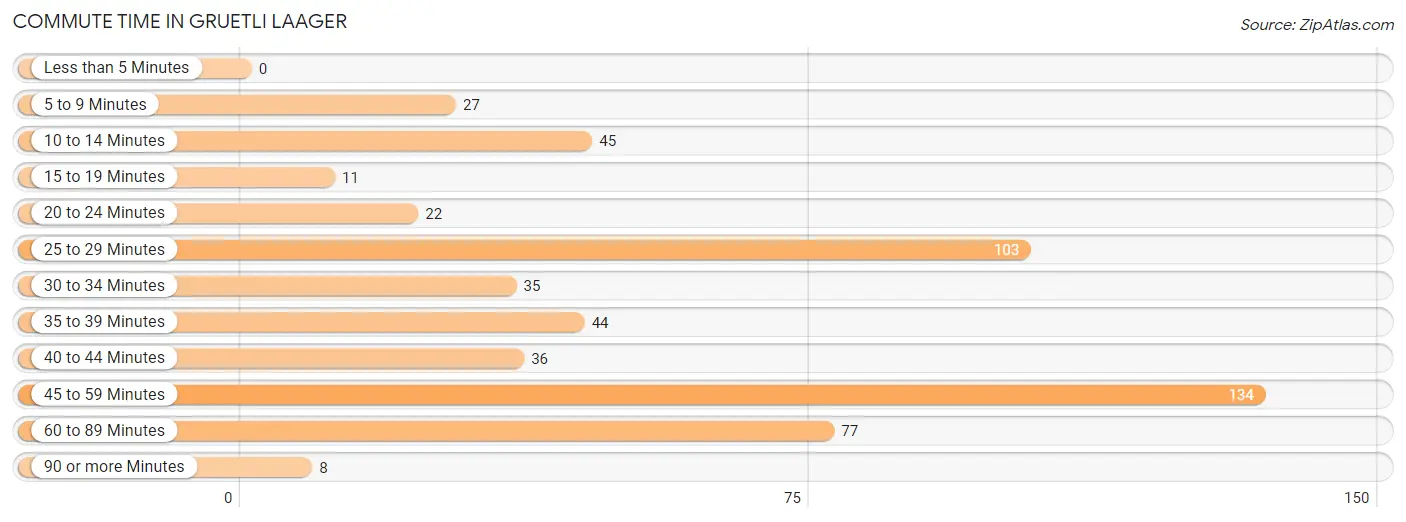
The most frequently occuring commute durations in Gruetli Laager are 45 to 59 minutes (134 commuters, 24.7%), 25 to 29 minutes (103 commuters, 19.0%), and 60 to 89 minutes (77 commuters, 14.2%).
| Commute Time | # Commuters | % Commuters |
| Less than 5 Minutes | 0 | 0.0% |
| 5 to 9 Minutes | 27 | 5.0% |
| 10 to 14 Minutes | 45 | 8.3% |
| 15 to 19 Minutes | 11 | 2.0% |
| 20 to 24 Minutes | 22 | 4.1% |
| 25 to 29 Minutes | 103 | 19.0% |
| 30 to 34 Minutes | 35 | 6.5% |
| 35 to 39 Minutes | 44 | 8.1% |
| 40 to 44 Minutes | 36 | 6.6% |
| 45 to 59 Minutes | 134 | 24.7% |
| 60 to 89 Minutes | 77 | 14.2% |
| 90 or more Minutes | 8 | 1.5% |
Commute Time by Sex in Gruetli Laager
The most common commute times in Gruetli Laager are 45 to 59 minutes (88 commuters, 27.9%) for males and 45 to 59 minutes (46 commuters, 20.3%) for females.
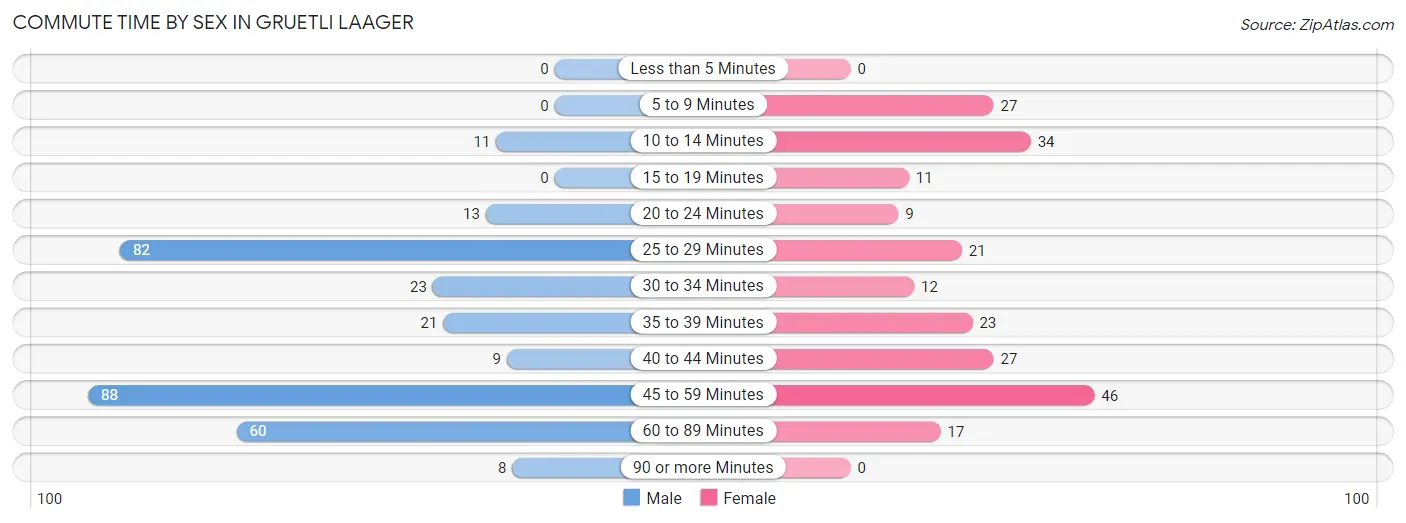
| Commute Time | Male | Female |
| Less than 5 Minutes | 0 (0.0%) | 0 (0.0%) |
| 5 to 9 Minutes | 0 (0.0%) | 27 (11.9%) |
| 10 to 14 Minutes | 11 (3.5%) | 34 (15.0%) |
| 15 to 19 Minutes | 0 (0.0%) | 11 (4.9%) |
| 20 to 24 Minutes | 13 (4.1%) | 9 (4.0%) |
| 25 to 29 Minutes | 82 (26.0%) | 21 (9.2%) |
| 30 to 34 Minutes | 23 (7.3%) | 12 (5.3%) |
| 35 to 39 Minutes | 21 (6.7%) | 23 (10.1%) |
| 40 to 44 Minutes | 9 (2.9%) | 27 (11.9%) |
| 45 to 59 Minutes | 88 (27.9%) | 46 (20.3%) |
| 60 to 89 Minutes | 60 (19.1%) | 17 (7.5%) |
| 90 or more Minutes | 8 (2.5%) | 0 (0.0%) |
Time of Departure to Work by Sex in Gruetli Laager
The most frequent times of departure to work in Gruetli Laager are 12:00 AM to 4:59 AM (81, 25.7%) for males and 7:30 AM to 7:59 AM (41, 18.1%) for females.
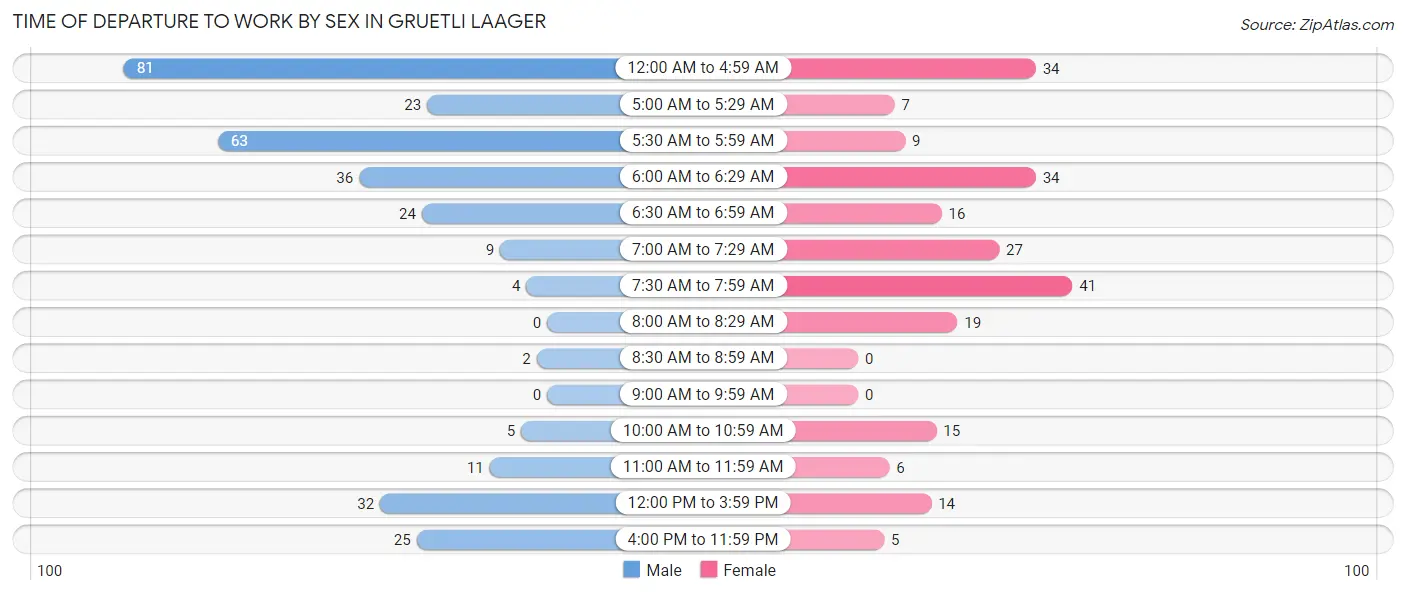
| Time of Departure | Male | Female |
| 12:00 AM to 4:59 AM | 81 (25.7%) | 34 (15.0%) |
| 5:00 AM to 5:29 AM | 23 (7.3%) | 7 (3.1%) |
| 5:30 AM to 5:59 AM | 63 (20.0%) | 9 (4.0%) |
| 6:00 AM to 6:29 AM | 36 (11.4%) | 34 (15.0%) |
| 6:30 AM to 6:59 AM | 24 (7.6%) | 16 (7.0%) |
| 7:00 AM to 7:29 AM | 9 (2.9%) | 27 (11.9%) |
| 7:30 AM to 7:59 AM | 4 (1.3%) | 41 (18.1%) |
| 8:00 AM to 8:29 AM | 0 (0.0%) | 19 (8.4%) |
| 8:30 AM to 8:59 AM | 2 (0.6%) | 0 (0.0%) |
| 9:00 AM to 9:59 AM | 0 (0.0%) | 0 (0.0%) |
| 10:00 AM to 10:59 AM | 5 (1.6%) | 15 (6.6%) |
| 11:00 AM to 11:59 AM | 11 (3.5%) | 6 (2.6%) |
| 12:00 PM to 3:59 PM | 32 (10.2%) | 14 (6.2%) |
| 4:00 PM to 11:59 PM | 25 (7.9%) | 5 (2.2%) |
| Total | 315 (100.0%) | 227 (100.0%) |
Housing Occupancy in Gruetli Laager
Occupancy by Ownership in Gruetli Laager
Of the total 498 dwellings in Gruetli Laager, owner-occupied units account for 441 (88.5%), while renter-occupied units make up 57 (11.5%).
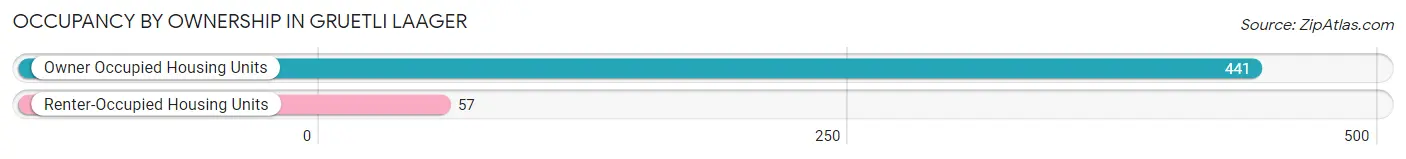
| Occupancy | # Housing Units | % Housing Units |
| Owner Occupied Housing Units | 441 | 88.5% |
| Renter-Occupied Housing Units | 57 | 11.5% |
| Total Occupied Housing Units | 498 | 100.0% |
Occupancy by Household Size in Gruetli Laager
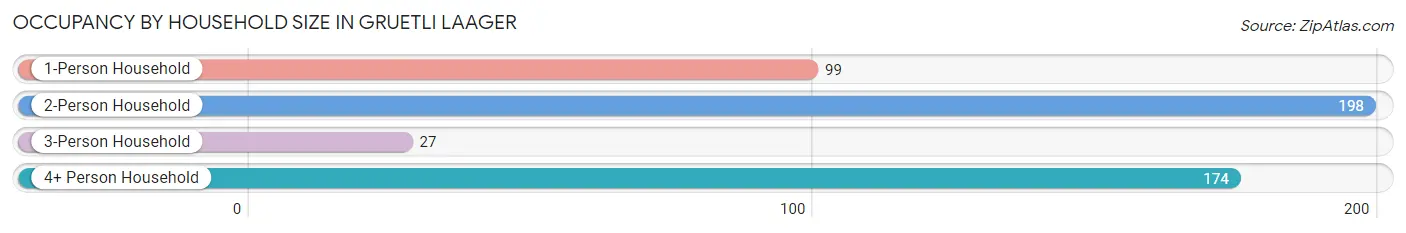
| Household Size | # Housing Units | % Housing Units |
| 1-Person Household | 99 | 19.9% |
| 2-Person Household | 198 | 39.8% |
| 3-Person Household | 27 | 5.4% |
| 4+ Person Household | 174 | 34.9% |
| Total Housing Units | 498 | 100.0% |
Occupancy by Ownership by Household Size in Gruetli Laager
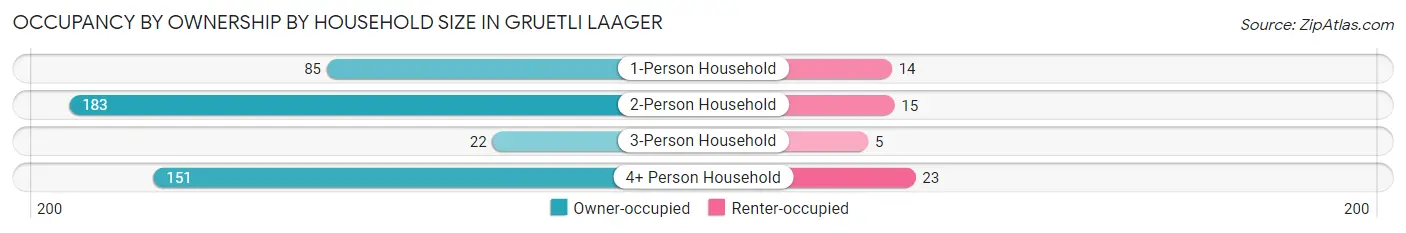
| Household Size | Owner-occupied | Renter-occupied |
| 1-Person Household | 85 (85.9%) | 14 (14.1%) |
| 2-Person Household | 183 (92.4%) | 15 (7.6%) |
| 3-Person Household | 22 (81.5%) | 5 (18.5%) |
| 4+ Person Household | 151 (86.8%) | 23 (13.2%) |
| Total Housing Units | 441 (88.5%) | 57 (11.5%) |
Occupancy by Educational Attainment in Gruetli Laager
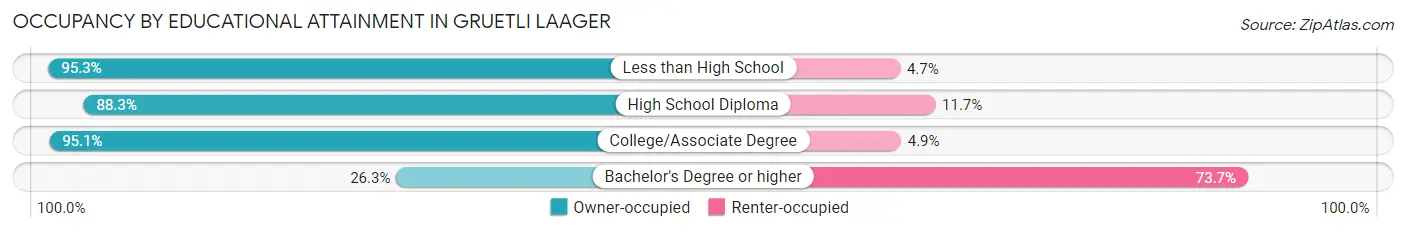
| Household Size | Owner-occupied | Renter-occupied |
| Less than High School | 101 (95.3%) | 5 (4.7%) |
| High School Diploma | 257 (88.3%) | 34 (11.7%) |
| College/Associate Degree | 78 (95.1%) | 4 (4.9%) |
| Bachelor's Degree or higher | 5 (26.3%) | 14 (73.7%) |
Occupancy by Age of Householder in Gruetli Laager
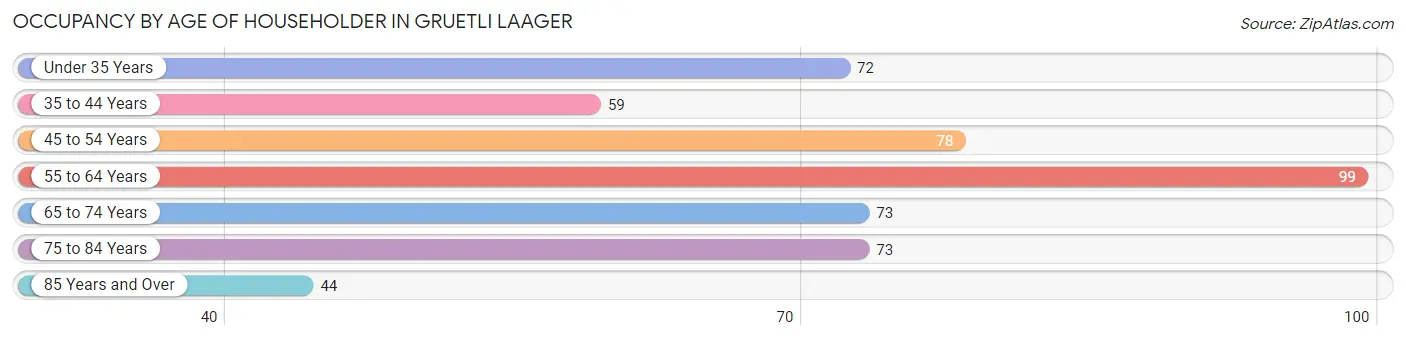
| Age Bracket | # Households | % Households |
| Under 35 Years | 72 | 14.5% |
| 35 to 44 Years | 59 | 11.8% |
| 45 to 54 Years | 78 | 15.7% |
| 55 to 64 Years | 99 | 19.9% |
| 65 to 74 Years | 73 | 14.7% |
| 75 to 84 Years | 73 | 14.7% |
| 85 Years and Over | 44 | 8.8% |
| Total | 498 | 100.0% |
Housing Finances in Gruetli Laager
Median Income by Occupancy in Gruetli Laager
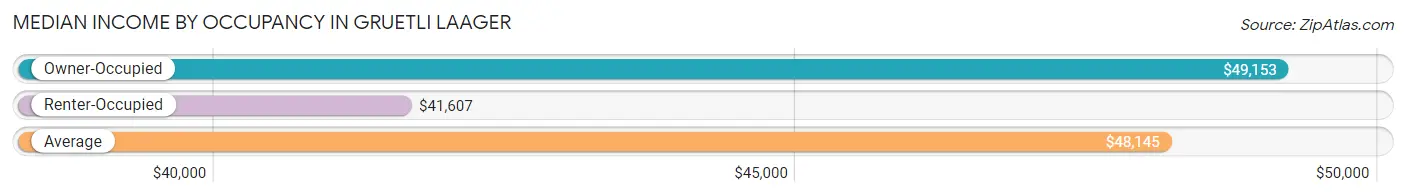
| Occupancy Type | # Households | Median Income |
| Owner-Occupied | 441 (88.5%) | $49,153 |
| Renter-Occupied | 57 (11.5%) | $41,607 |
| Average | 498 (100.0%) | $48,145 |
Occupancy by Householder Income Bracket in Gruetli Laager
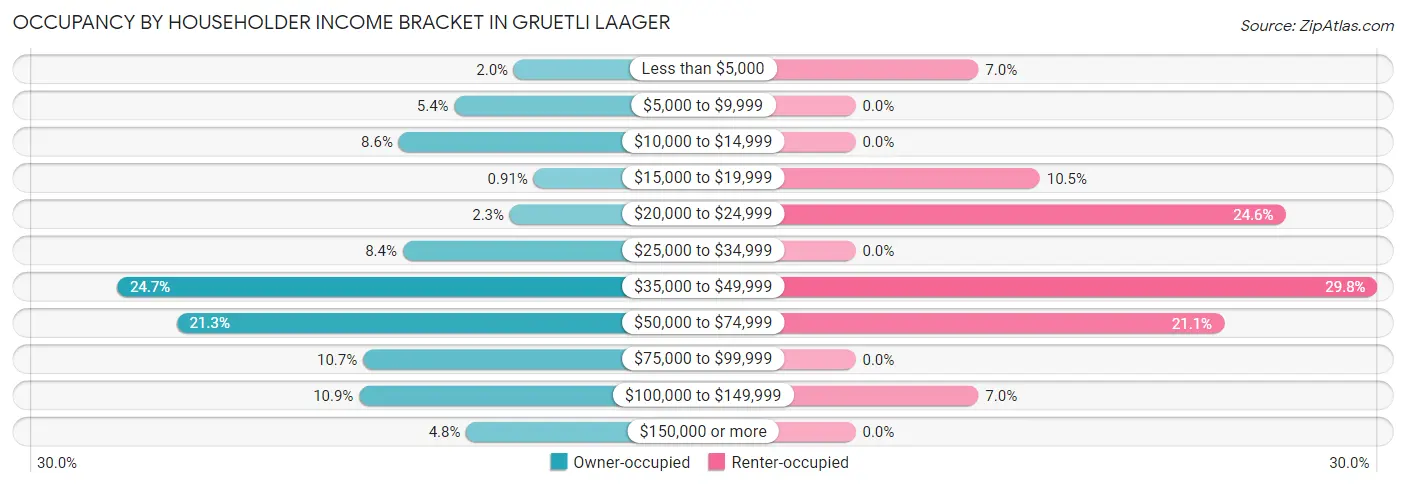
| Income Bracket | Owner-occupied | Renter-occupied |
| Less than $5,000 | 9 (2.0%) | 4 (7.0%) |
| $5,000 to $9,999 | 24 (5.4%) | 0 (0.0%) |
| $10,000 to $14,999 | 38 (8.6%) | 0 (0.0%) |
| $15,000 to $19,999 | 4 (0.9%) | 6 (10.5%) |
| $20,000 to $24,999 | 10 (2.3%) | 14 (24.6%) |
| $25,000 to $34,999 | 37 (8.4%) | 0 (0.0%) |
| $35,000 to $49,999 | 109 (24.7%) | 17 (29.8%) |
| $50,000 to $74,999 | 94 (21.3%) | 12 (21.0%) |
| $75,000 to $99,999 | 47 (10.7%) | 0 (0.0%) |
| $100,000 to $149,999 | 48 (10.9%) | 4 (7.0%) |
| $150,000 or more | 21 (4.8%) | 0 (0.0%) |
| Total | 441 (100.0%) | 57 (100.0%) |
Monthly Housing Cost Tiers in Gruetli Laager
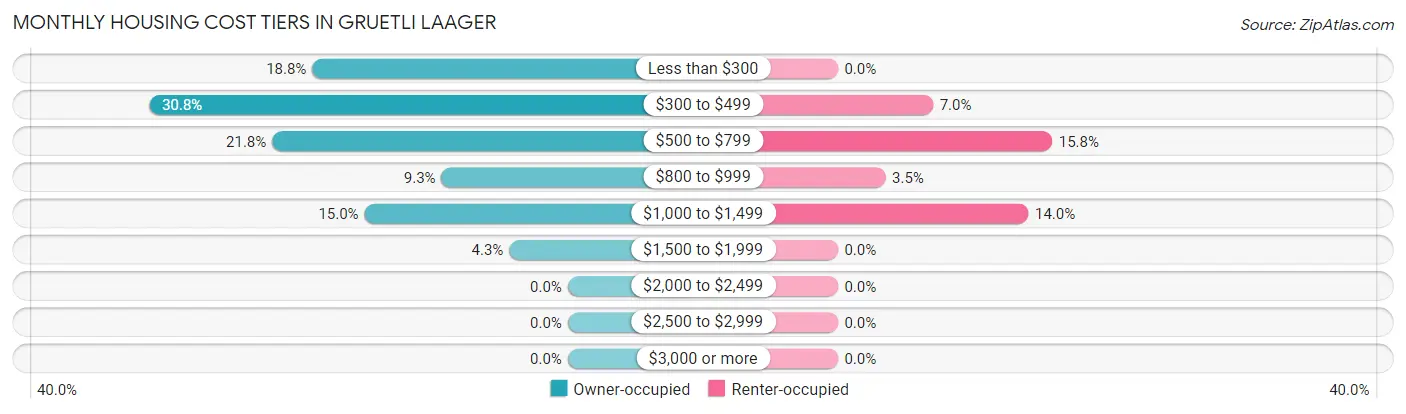
| Monthly Cost | Owner-occupied | Renter-occupied |
| Less than $300 | 83 (18.8%) | 0 (0.0%) |
| $300 to $499 | 136 (30.8%) | 4 (7.0%) |
| $500 to $799 | 96 (21.8%) | 9 (15.8%) |
| $800 to $999 | 41 (9.3%) | 2 (3.5%) |
| $1,000 to $1,499 | 66 (15.0%) | 8 (14.0%) |
| $1,500 to $1,999 | 19 (4.3%) | 0 (0.0%) |
| $2,000 to $2,499 | 0 (0.0%) | 0 (0.0%) |
| $2,500 to $2,999 | 0 (0.0%) | 0 (0.0%) |
| $3,000 or more | 0 (0.0%) | 0 (0.0%) |
| Total | 441 (100.0%) | 57 (100.0%) |
Physical Housing Characteristics in Gruetli Laager
Housing Structures in Gruetli Laager
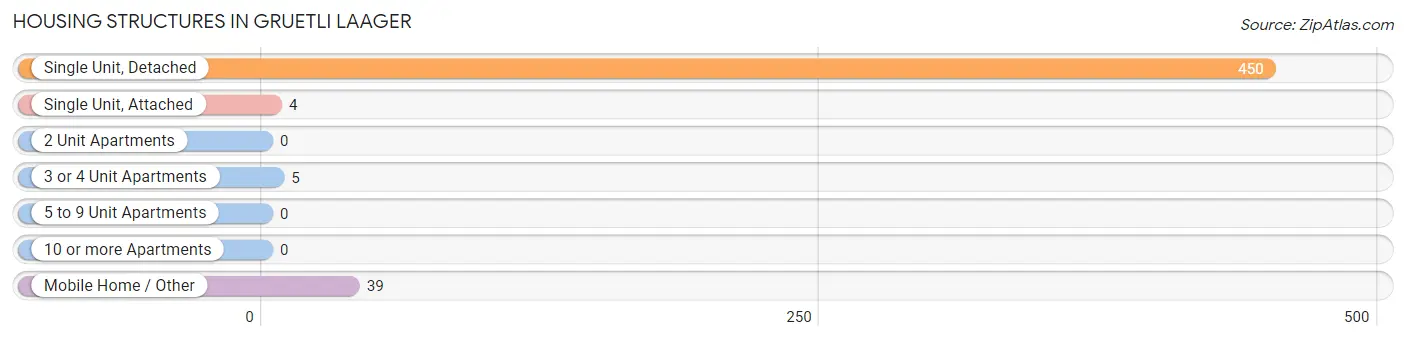
| Structure Type | # Housing Units | % Housing Units |
| Single Unit, Detached | 450 | 90.4% |
| Single Unit, Attached | 4 | 0.8% |
| 2 Unit Apartments | 0 | 0.0% |
| 3 or 4 Unit Apartments | 5 | 1.0% |
| 5 to 9 Unit Apartments | 0 | 0.0% |
| 10 or more Apartments | 0 | 0.0% |
| Mobile Home / Other | 39 | 7.8% |
| Total | 498 | 100.0% |
Housing Structures by Occupancy in Gruetli Laager
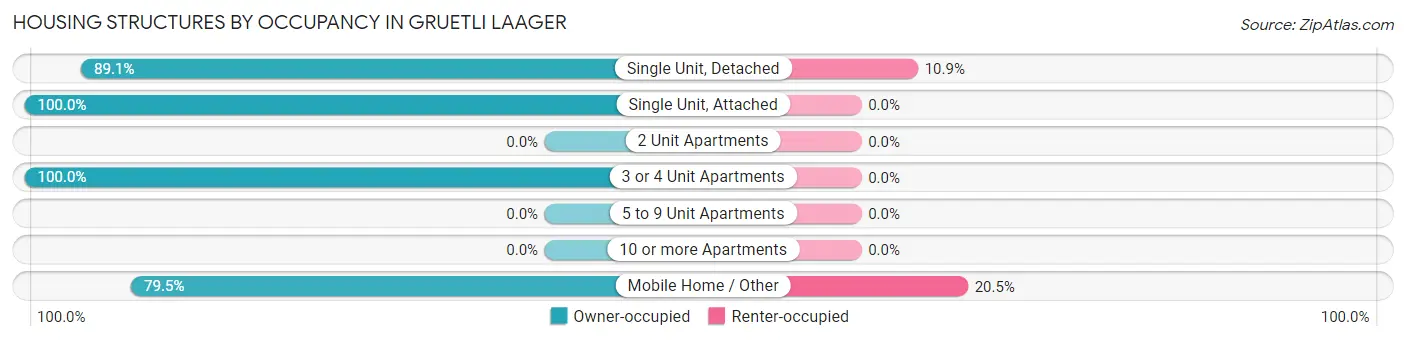
| Structure Type | Owner-occupied | Renter-occupied |
| Single Unit, Detached | 401 (89.1%) | 49 (10.9%) |
| Single Unit, Attached | 4 (100.0%) | 0 (0.0%) |
| 2 Unit Apartments | 0 (0.0%) | 0 (0.0%) |
| 3 or 4 Unit Apartments | 5 (100.0%) | 0 (0.0%) |
| 5 to 9 Unit Apartments | 0 (0.0%) | 0 (0.0%) |
| 10 or more Apartments | 0 (0.0%) | 0 (0.0%) |
| Mobile Home / Other | 31 (79.5%) | 8 (20.5%) |
| Total | 441 (88.5%) | 57 (11.5%) |
Housing Structures by Number of Rooms in Gruetli Laager
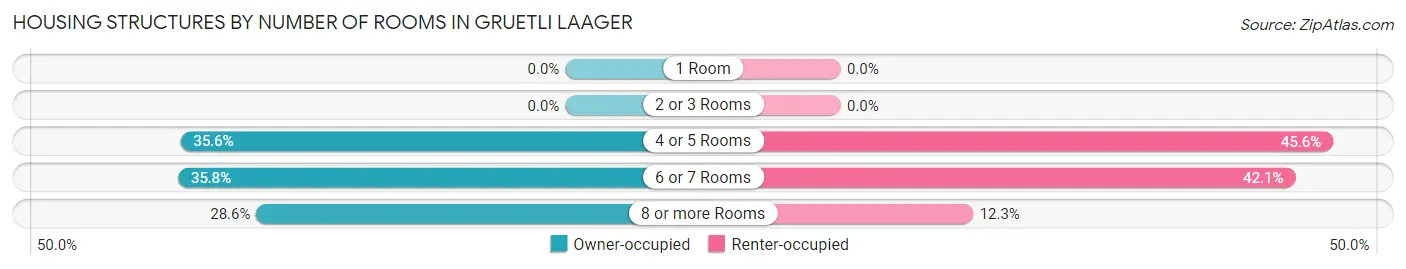
| Number of Rooms | Owner-occupied | Renter-occupied |
| 1 Room | 0 (0.0%) | 0 (0.0%) |
| 2 or 3 Rooms | 0 (0.0%) | 0 (0.0%) |
| 4 or 5 Rooms | 157 (35.6%) | 26 (45.6%) |
| 6 or 7 Rooms | 158 (35.8%) | 24 (42.1%) |
| 8 or more Rooms | 126 (28.6%) | 7 (12.3%) |
| Total | 441 (100.0%) | 57 (100.0%) |
Housing Structure by Heating Type in Gruetli Laager
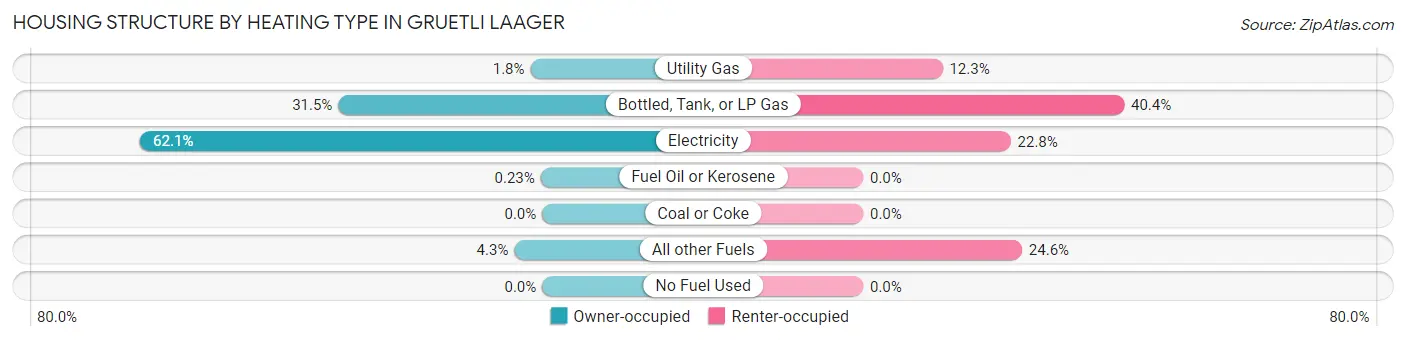
| Heating Type | Owner-occupied | Renter-occupied |
| Utility Gas | 8 (1.8%) | 7 (12.3%) |
| Bottled, Tank, or LP Gas | 139 (31.5%) | 23 (40.4%) |
| Electricity | 274 (62.1%) | 13 (22.8%) |
| Fuel Oil or Kerosene | 1 (0.2%) | 0 (0.0%) |
| Coal or Coke | 0 (0.0%) | 0 (0.0%) |
| All other Fuels | 19 (4.3%) | 14 (24.6%) |
| No Fuel Used | 0 (0.0%) | 0 (0.0%) |
| Total | 441 (100.0%) | 57 (100.0%) |
Household Vehicle Usage in Gruetli Laager
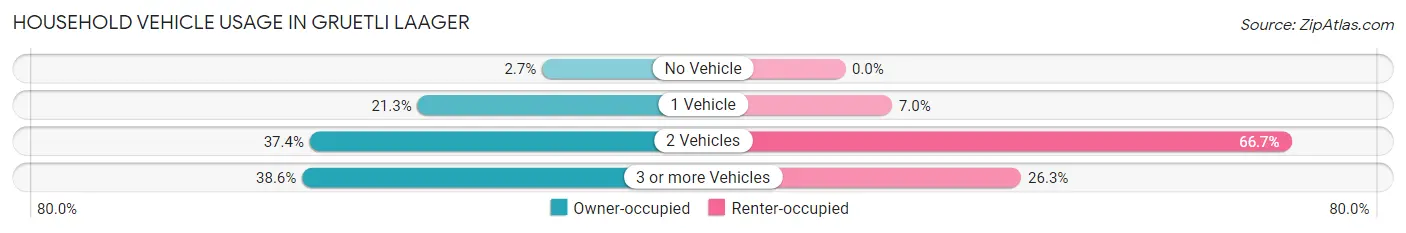
| Vehicles per Household | Owner-occupied | Renter-occupied |
| No Vehicle | 12 (2.7%) | 0 (0.0%) |
| 1 Vehicle | 94 (21.3%) | 4 (7.0%) |
| 2 Vehicles | 165 (37.4%) | 38 (66.7%) |
| 3 or more Vehicles | 170 (38.6%) | 15 (26.3%) |
| Total | 441 (100.0%) | 57 (100.0%) |
Real Estate & Mortgages in Gruetli Laager
Real Estate and Mortgage Overview in Gruetli Laager
| Characteristic | Without Mortgage | With Mortgage |
| Housing Units | 269 | 172 |
| Median Property Value | $137,800 | $97,900 |
| Median Household Income | $40,179 | $5 |
| Monthly Housing Costs | $374 | $0 |
| Real Estate Taxes | $671 | $4 |
Property Value by Mortgage Status in Gruetli Laager
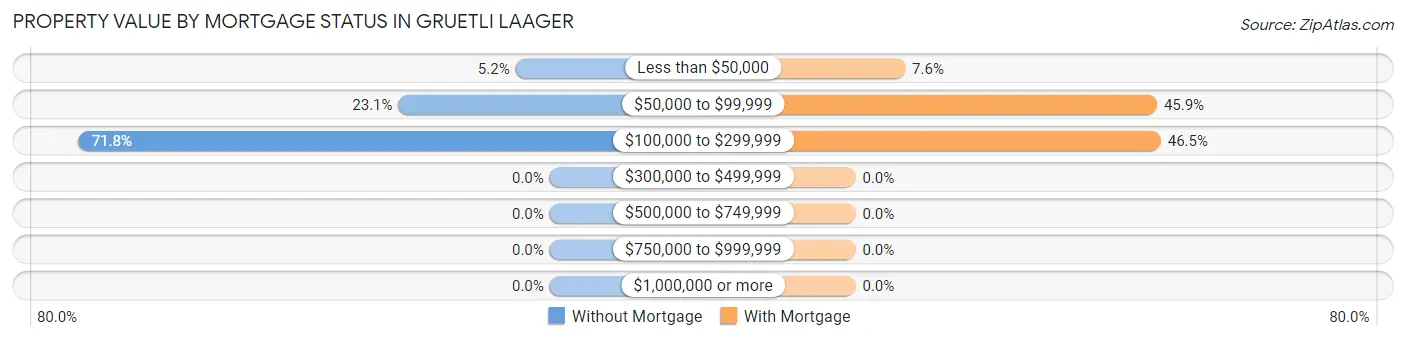
| Property Value | Without Mortgage | With Mortgage |
| Less than $50,000 | 14 (5.2%) | 13 (7.6%) |
| $50,000 to $99,999 | 62 (23.1%) | 79 (45.9%) |
| $100,000 to $299,999 | 193 (71.8%) | 80 (46.5%) |
| $300,000 to $499,999 | 0 (0.0%) | 0 (0.0%) |
| $500,000 to $749,999 | 0 (0.0%) | 0 (0.0%) |
| $750,000 to $999,999 | 0 (0.0%) | 0 (0.0%) |
| $1,000,000 or more | 0 (0.0%) | 0 (0.0%) |
| Total | 269 (100.0%) | 172 (100.0%) |
Household Income by Mortgage Status in Gruetli Laager
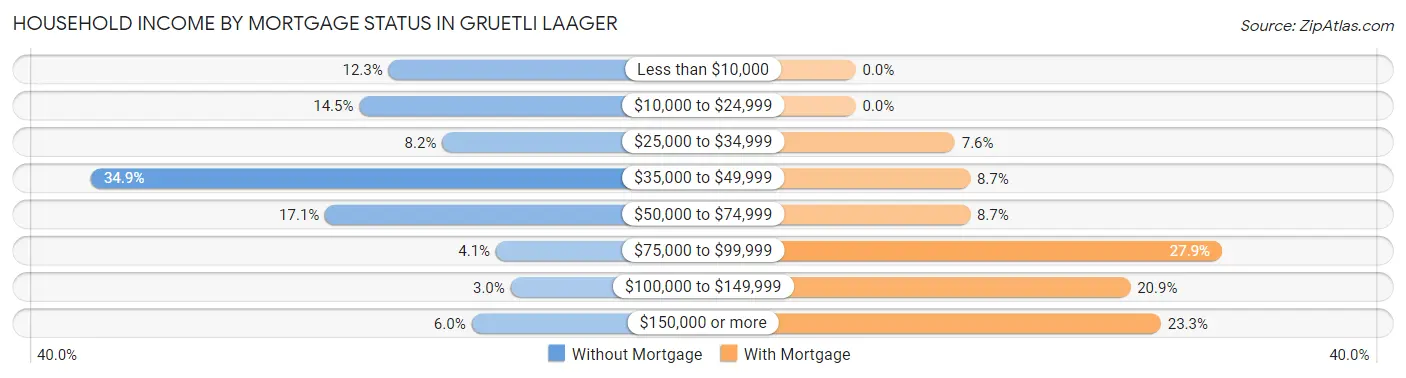
| Household Income | Without Mortgage | With Mortgage |
| Less than $10,000 | 33 (12.3%) | 0 (0.0%) |
| $10,000 to $24,999 | 39 (14.5%) | 0 (0.0%) |
| $25,000 to $34,999 | 22 (8.2%) | 13 (7.6%) |
| $35,000 to $49,999 | 94 (34.9%) | 15 (8.7%) |
| $50,000 to $74,999 | 46 (17.1%) | 15 (8.7%) |
| $75,000 to $99,999 | 11 (4.1%) | 48 (27.9%) |
| $100,000 to $149,999 | 8 (3.0%) | 36 (20.9%) |
| $150,000 or more | 16 (5.9%) | 40 (23.3%) |
| Total | 269 (100.0%) | 172 (100.0%) |
Property Value to Household Income Ratio in Gruetli Laager
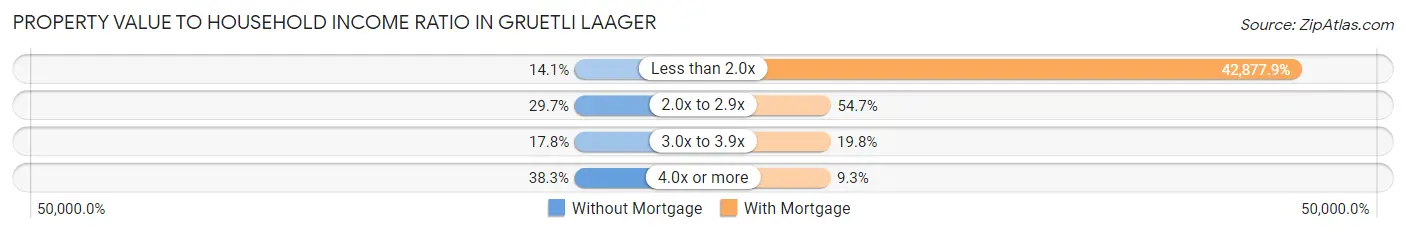
| Value-to-Income Ratio | Without Mortgage | With Mortgage |
| Less than 2.0x | 38 (14.1%) | 73,750 (42,877.9%) |
| 2.0x to 2.9x | 80 (29.7%) | 94 (54.6%) |
| 3.0x to 3.9x | 48 (17.8%) | 34 (19.8%) |
| 4.0x or more | 103 (38.3%) | 16 (9.3%) |
| Total | 269 (100.0%) | 172 (100.0%) |
Real Estate Taxes by Mortgage Status in Gruetli Laager
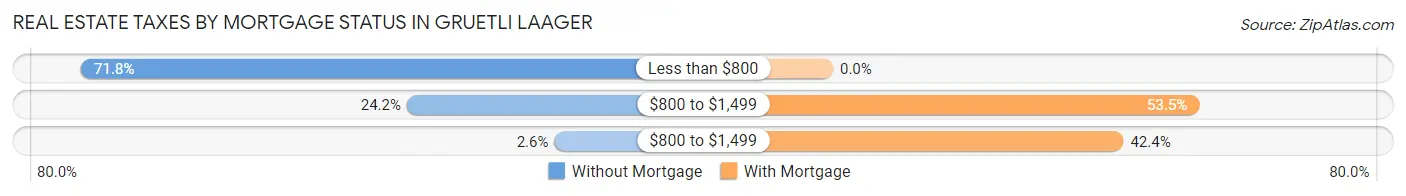
| Property Taxes | Without Mortgage | With Mortgage |
| Less than $800 | 193 (71.8%) | 0 (0.0%) |
| $800 to $1,499 | 65 (24.2%) | 92 (53.5%) |
| $800 to $1,499 | 7 (2.6%) | 73 (42.4%) |
| Total | 269 (100.0%) | 172 (100.0%) |
Health & Disability in Gruetli Laager
Health Insurance Coverage by Age in Gruetli Laager
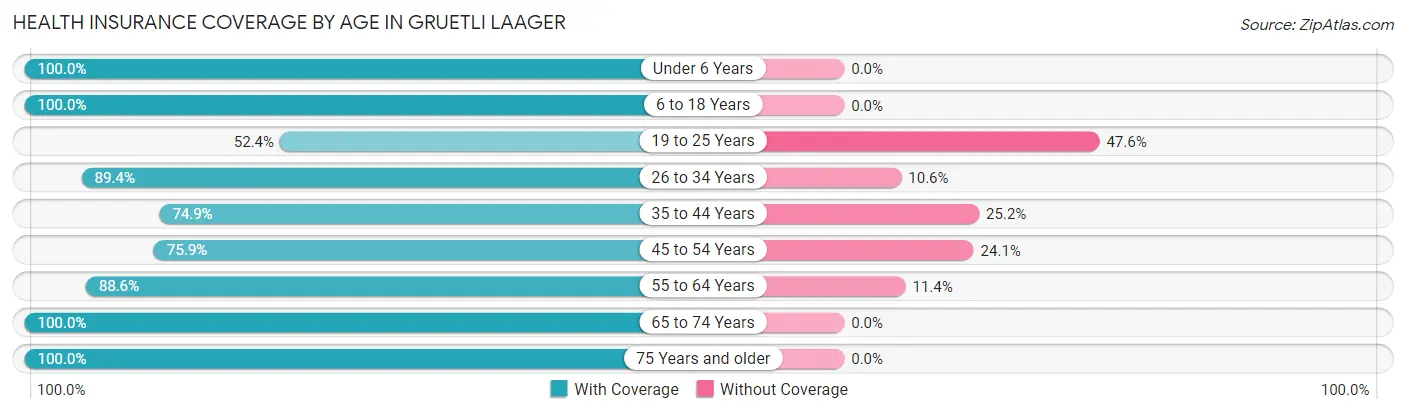
| Age Bracket | With Coverage | Without Coverage |
| Under 6 Years | 157 (100.0%) | 0 (0.0%) |
| 6 to 18 Years | 321 (100.0%) | 0 (0.0%) |
| 19 to 25 Years | 76 (52.4%) | 69 (47.6%) |
| 26 to 34 Years | 84 (89.4%) | 10 (10.6%) |
| 35 to 44 Years | 128 (74.9%) | 43 (25.2%) |
| 45 to 54 Years | 129 (75.9%) | 41 (24.1%) |
| 55 to 64 Years | 225 (88.6%) | 29 (11.4%) |
| 65 to 74 Years | 110 (100.0%) | 0 (0.0%) |
| 75 Years and older | 163 (100.0%) | 0 (0.0%) |
| Total | 1,393 (87.9%) | 192 (12.1%) |
Health Insurance Coverage by Citizenship Status in Gruetli Laager
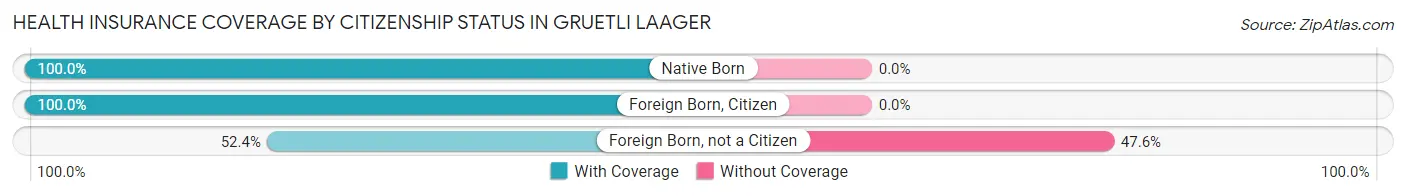
| Citizenship Status | With Coverage | Without Coverage |
| Native Born | 157 (100.0%) | 0 (0.0%) |
| Foreign Born, Citizen | 321 (100.0%) | 0 (0.0%) |
| Foreign Born, not a Citizen | 76 (52.4%) | 69 (47.6%) |
Health Insurance Coverage by Household Income in Gruetli Laager
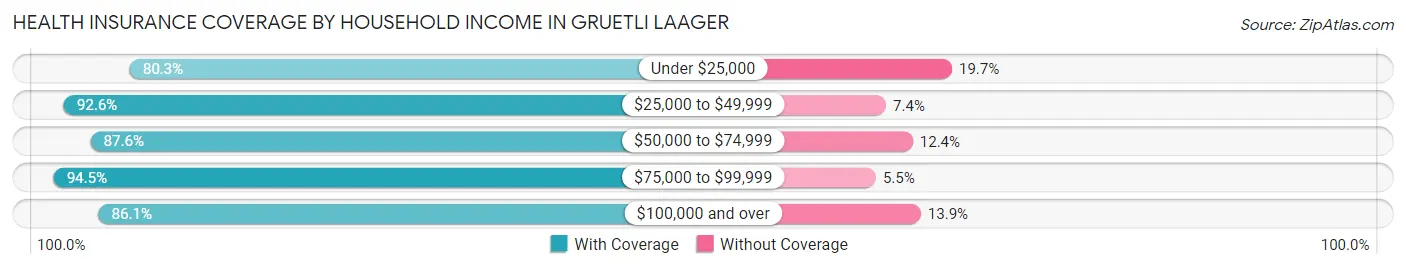
| Household Income | With Coverage | Without Coverage |
| Under $25,000 | 228 (80.3%) | 56 (19.7%) |
| $25,000 to $49,999 | 327 (92.6%) | 26 (7.4%) |
| $50,000 to $74,999 | 361 (87.6%) | 51 (12.4%) |
| $75,000 to $99,999 | 173 (94.5%) | 10 (5.5%) |
| $100,000 and over | 304 (86.1%) | 49 (13.9%) |
Public vs Private Health Insurance Coverage by Age in Gruetli Laager
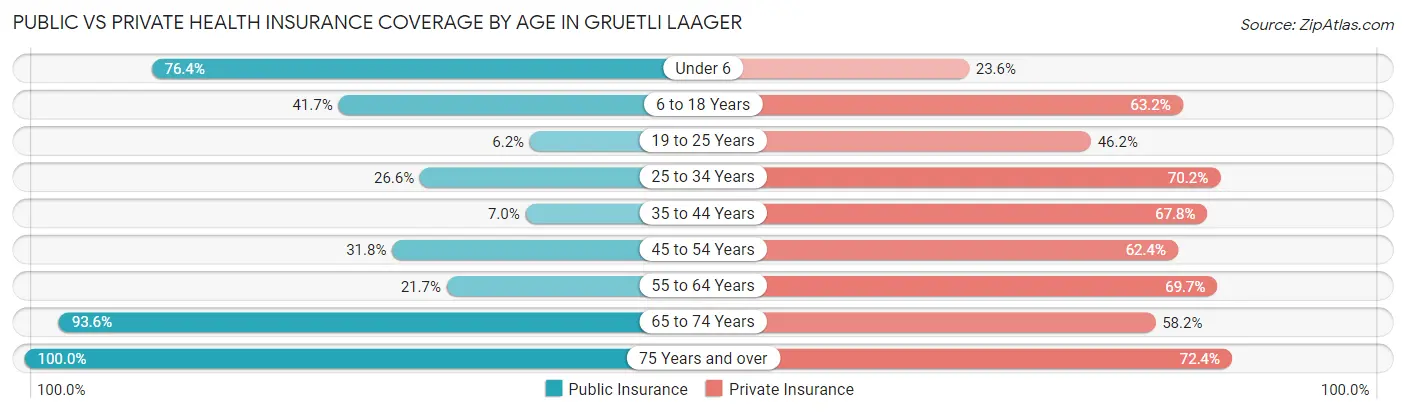
| Age Bracket | Public Insurance | Private Insurance |
| Under 6 | 120 (76.4%) | 37 (23.6%) |
| 6 to 18 Years | 134 (41.7%) | 203 (63.2%) |
| 19 to 25 Years | 9 (6.2%) | 67 (46.2%) |
| 25 to 34 Years | 25 (26.6%) | 66 (70.2%) |
| 35 to 44 Years | 12 (7.0%) | 116 (67.8%) |
| 45 to 54 Years | 54 (31.8%) | 106 (62.4%) |
| 55 to 64 Years | 55 (21.6%) | 177 (69.7%) |
| 65 to 74 Years | 103 (93.6%) | 64 (58.2%) |
| 75 Years and over | 163 (100.0%) | 118 (72.4%) |
| Total | 675 (42.6%) | 954 (60.2%) |
Disability Status by Sex by Age in Gruetli Laager
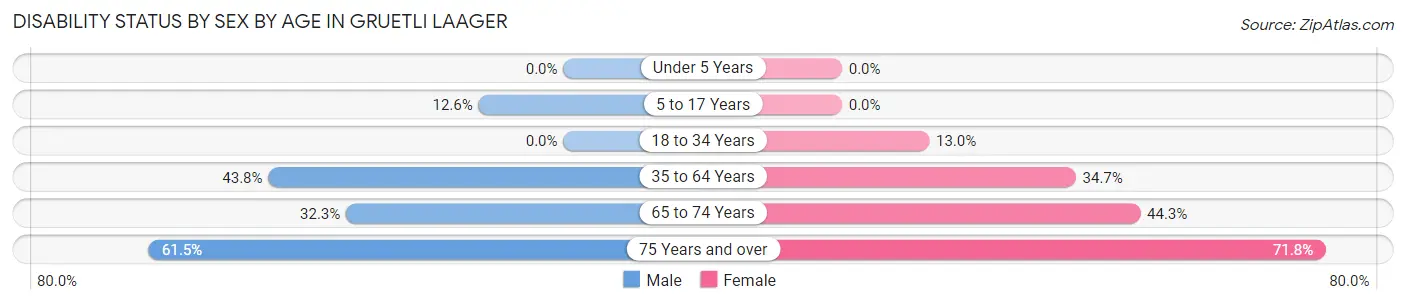
| Age Bracket | Male | Female |
| Under 5 Years | 0 (0.0%) | 0 (0.0%) |
| 5 to 17 Years | 17 (12.6%) | 0 (0.0%) |
| 18 to 34 Years | 0 (0.0%) | 18 (13.0%) |
| 35 to 64 Years | 166 (43.8%) | 75 (34.7%) |
| 65 to 74 Years | 10 (32.3%) | 35 (44.3%) |
| 75 Years and over | 48 (61.5%) | 61 (71.8%) |
Disability Class by Sex by Age in Gruetli Laager
Disability Class: Hearing Difficulty
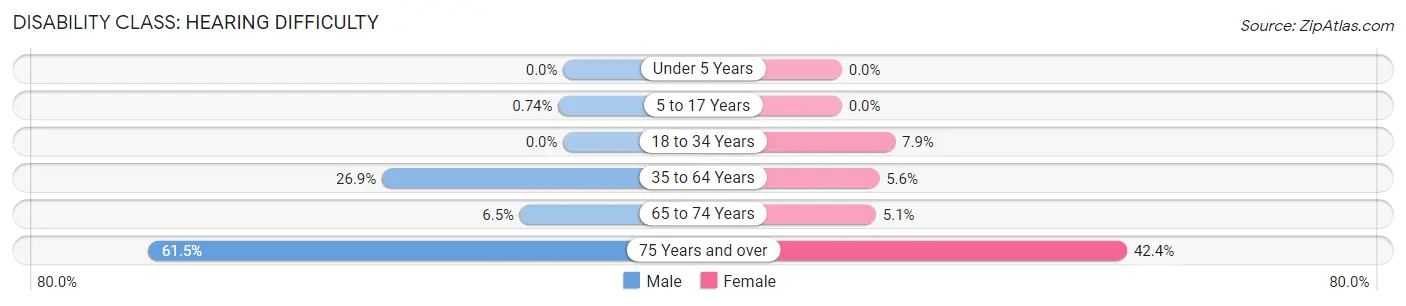
| Age Bracket | Male | Female |
| Under 5 Years | 0 (0.0%) | 0 (0.0%) |
| 5 to 17 Years | 1 (0.7%) | 0 (0.0%) |
| 18 to 34 Years | 0 (0.0%) | 11 (7.9%) |
| 35 to 64 Years | 102 (26.9%) | 12 (5.6%) |
| 65 to 74 Years | 2 (6.5%) | 4 (5.1%) |
| 75 Years and over | 48 (61.5%) | 36 (42.3%) |
Disability Class: Vision Difficulty
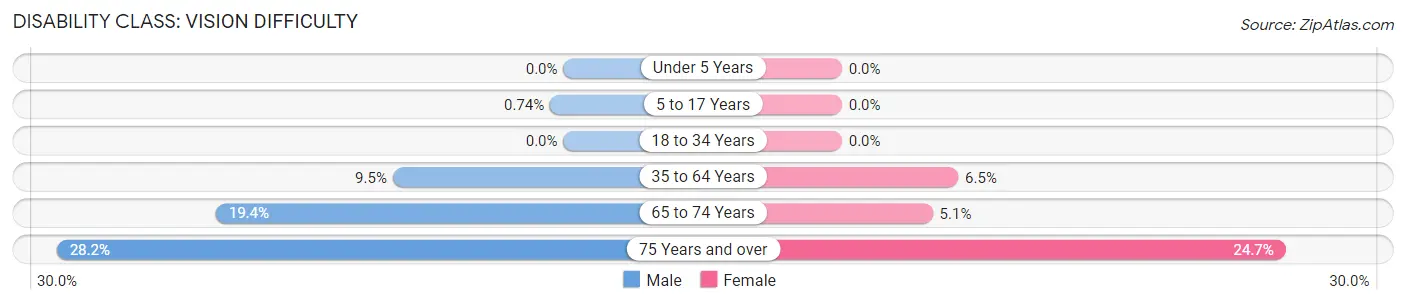
| Age Bracket | Male | Female |
| Under 5 Years | 0 (0.0%) | 0 (0.0%) |
| 5 to 17 Years | 1 (0.7%) | 0 (0.0%) |
| 18 to 34 Years | 0 (0.0%) | 0 (0.0%) |
| 35 to 64 Years | 36 (9.5%) | 14 (6.5%) |
| 65 to 74 Years | 6 (19.4%) | 4 (5.1%) |
| 75 Years and over | 22 (28.2%) | 21 (24.7%) |
Disability Class: Cognitive Difficulty
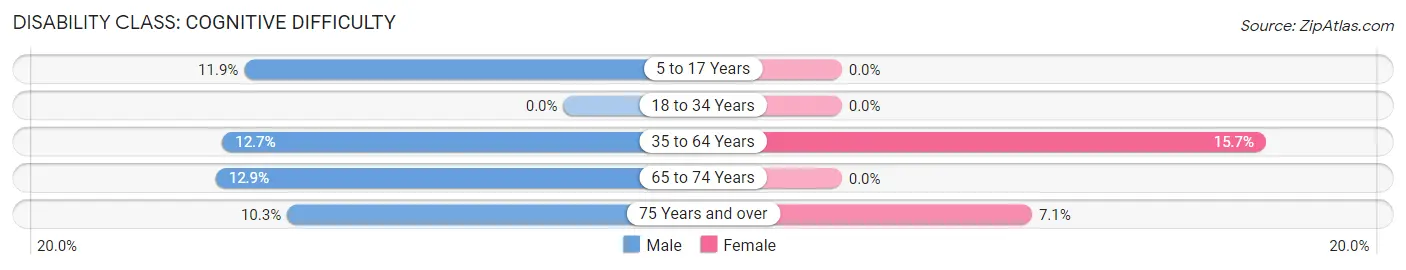
| Age Bracket | Male | Female |
| 5 to 17 Years | 16 (11.8%) | 0 (0.0%) |
| 18 to 34 Years | 0 (0.0%) | 0 (0.0%) |
| 35 to 64 Years | 48 (12.7%) | 34 (15.7%) |
| 65 to 74 Years | 4 (12.9%) | 0 (0.0%) |
| 75 Years and over | 8 (10.3%) | 6 (7.1%) |
Disability Class: Ambulatory Difficulty
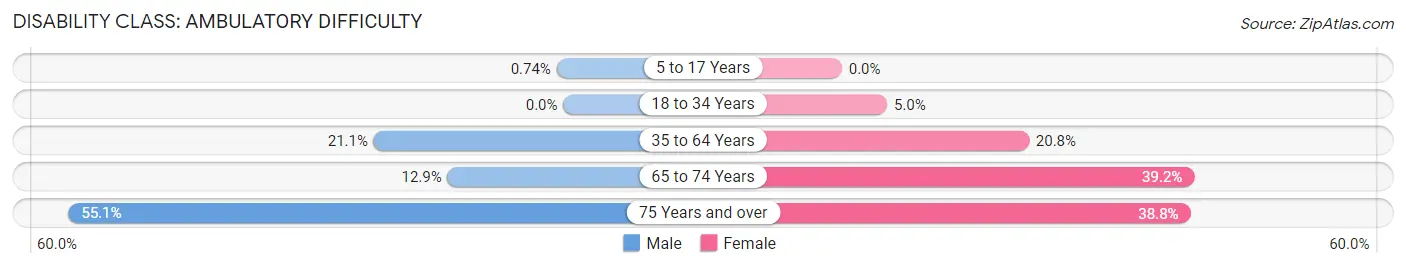
| Age Bracket | Male | Female |
| 5 to 17 Years | 1 (0.7%) | 0 (0.0%) |
| 18 to 34 Years | 0 (0.0%) | 7 (5.0%) |
| 35 to 64 Years | 80 (21.1%) | 45 (20.8%) |
| 65 to 74 Years | 4 (12.9%) | 31 (39.2%) |
| 75 Years and over | 43 (55.1%) | 33 (38.8%) |
Disability Class: Self-Care Difficulty
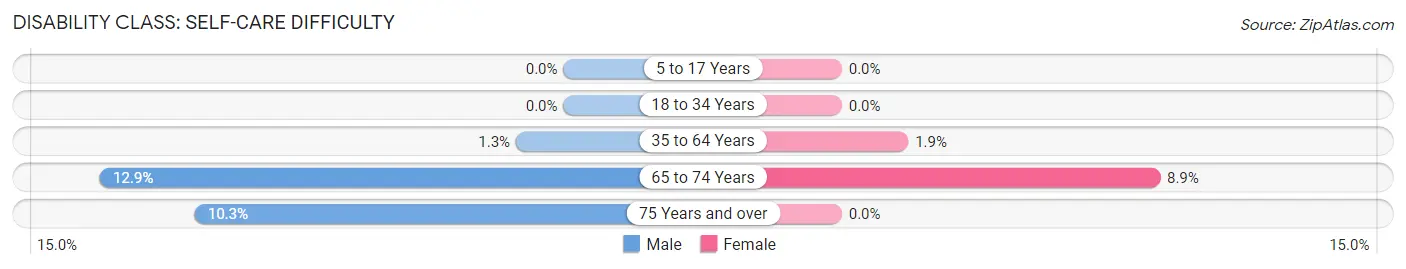
| Age Bracket | Male | Female |
| 5 to 17 Years | 0 (0.0%) | 0 (0.0%) |
| 18 to 34 Years | 0 (0.0%) | 0 (0.0%) |
| 35 to 64 Years | 5 (1.3%) | 4 (1.8%) |
| 65 to 74 Years | 4 (12.9%) | 7 (8.9%) |
| 75 Years and over | 8 (10.3%) | 0 (0.0%) |
Technology Access in Gruetli Laager
Computing Device Access in Gruetli Laager
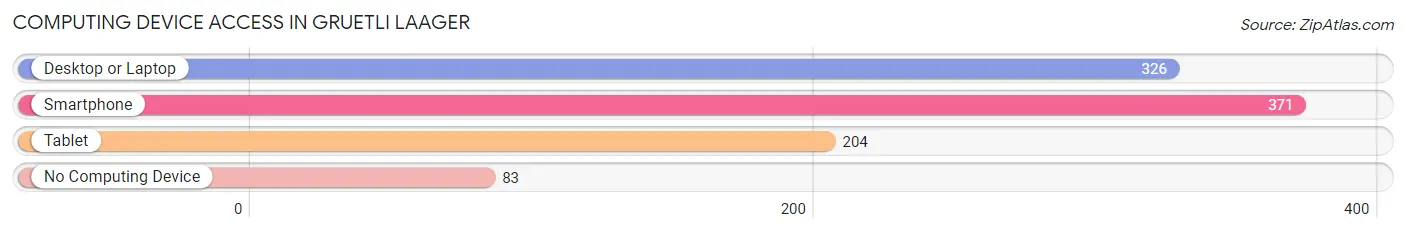
| Device Type | # Households | % Households |
| Desktop or Laptop | 326 | 65.5% |
| Smartphone | 371 | 74.5% |
| Tablet | 204 | 41.0% |
| No Computing Device | 83 | 16.7% |
| Total | 498 | 100.0% |
Internet Access in Gruetli Laager
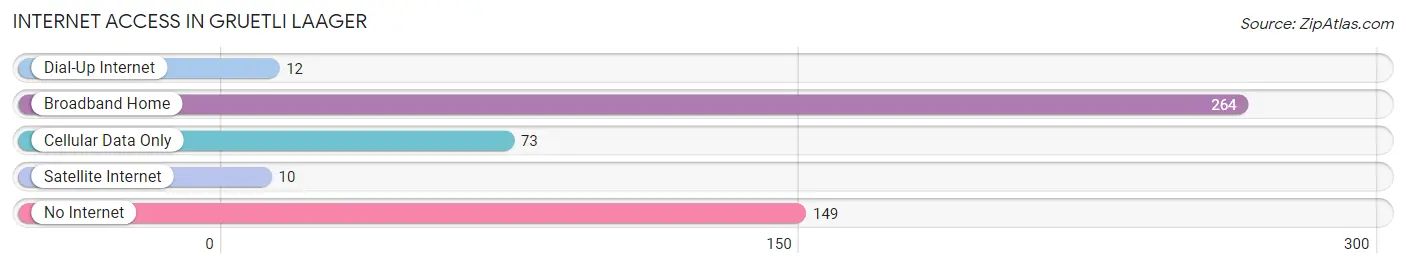
| Internet Type | # Households | % Households |
| Dial-Up Internet | 12 | 2.4% |
| Broadband Home | 264 | 53.0% |
| Cellular Data Only | 73 | 14.7% |
| Satellite Internet | 10 | 2.0% |
| No Internet | 149 | 29.9% |
| Total | 498 | 100.0% |
Gruetli Laager Summary
Gruetli Laager is a small town located in Grundy County, Tennessee, United States. It is situated in the foothills of the Cumberland Plateau, approximately halfway between Chattanooga and Nashville. The town was founded in 1844 by Swiss immigrants who had come to the area in search of religious freedom. The town was named after the Swiss canton of Grütli, and the name is still used today.
Geography
Gruetli Laager is located at 35°14'25"N, 85°45'45"W (35.240278, -85.7625). The town is situated in the foothills of the Cumberland Plateau, approximately halfway between Chattanooga and Nashville. The town is located in a rural area, with the nearest major city being Chattanooga, which is about 40 miles away. The town is surrounded by rolling hills and forests, and is home to several small lakes and streams.
Demographics
As of the 2010 census, Gruetli Laager had a population of 1,879. The racial makeup of the town was 97.2% White, 0.7% African American, 0.2% Native American, 0.2% Asian, 0.1% Pacific Islander, 0.7% from other races, and 0.9% from two or more races. Hispanic or Latino of any race were 1.3% of the population.
Economy
Gruetli Laager is a small, rural town with a limited economy. The town is home to several small businesses, including a grocery store, a hardware store, and a few restaurants. The town also has a few small manufacturing companies, which produce a variety of products, including furniture, clothing, and automotive parts. The town is also home to a few small farms, which produce a variety of crops, including corn, soybeans, and hay.
History
Gruetli Laager was founded in 1844 by Swiss immigrants who had come to the area in search of religious freedom. The town was named after the Swiss canton of Grütli, and the name is still used today. The town was originally a farming community, and the Swiss immigrants brought with them their traditional farming methods. The town grew slowly over the years, and by the early 1900s, it had become a small but thriving community.
In the early 1900s, the town was home to several small businesses, including a general store, a blacksmith shop, and a few restaurants. The town also had a small school, which served the local children. In the late 1940s, the town began to experience a decline in population, as many of the younger residents moved away in search of better job opportunities.
Today, Gruetli Laager is a small, rural town with a limited economy. The town is home to several small businesses, including a grocery store, a hardware store, and a few restaurants. The town also has a few small manufacturing companies, which produce a variety of products, including furniture, clothing, and automotive parts. The town is also home to a few small farms, which produce a variety of crops, including corn, soybeans, and hay. Despite its small size, Gruetli Laager is a vibrant community, and its residents take pride in their Swiss heritage.
Common Questions
What is Per Capita Income in Gruetli Laager?
Per Capita income in Gruetli Laager is $18,841.
What is the Median Family Income in Gruetli Laager?
Median Family Income in Gruetli Laager is $50,722.
What is the Median Household income in Gruetli Laager?
Median Household Income in Gruetli Laager is $48,145.
What is Income or Wage Gap in Gruetli Laager?
Income or Wage Gap in Gruetli Laager is 61.5%.
Women in Gruetli Laager earn 38.5 cents for every dollar earned by a man.
What is Inequality or Gini Index in Gruetli Laager?
Inequality or Gini Index in Gruetli Laager is 0.39.
What is the Total Population of Gruetli Laager?
Total Population of Gruetli Laager is 1,585.
What is the Total Male Population of Gruetli Laager?
Total Male Population of Gruetli Laager is 833.
What is the Total Female Population of Gruetli Laager?
Total Female Population of Gruetli Laager is 752.
What is the Ratio of Males per 100 Females in Gruetli Laager?
There are 110.77 Males per 100 Females in Gruetli Laager.
What is the Ratio of Females per 100 Males in Gruetli Laager?
There are 90.28 Females per 100 Males in Gruetli Laager.
What is the Median Population Age in Gruetli Laager?
Median Population Age in Gruetli Laager is 41.3 Years.
What is the Average Family Size in Gruetli Laager
Average Family Size in Gruetli Laager is 3.6 People.
What is the Average Household Size in Gruetli Laager
Average Household Size in Gruetli Laager is 3.2 People.
How Large is the Labor Force in Gruetli Laager?
There are 669 People in the Labor Forcein in Gruetli Laager.
What is the Percentage of People in the Labor Force in Gruetli Laager?
57.9% of People are in the Labor Force in Gruetli Laager.
What is the Unemployment Rate in Gruetli Laager?
Unemployment Rate in Gruetli Laager is 8.4%.