Graysville, TN Map & Demographics
Graysville Map
Graysville Overview
$20,646
PER CAPITA INCOME
$41,136
AVG FAMILY INCOME
$38,281
AVG HOUSEHOLD INCOME
25.5%
WAGE / INCOME GAP [ % ]
74.5¢/ $1
WAGE / INCOME GAP [ $ ]
0.40
INEQUALITY / GINI INDEX
1,548
TOTAL POPULATION
801
MALE POPULATION
747
FEMALE POPULATION
107.23
MALES / 100 FEMALES
93.26
FEMALES / 100 MALES
37.5
MEDIAN AGE
2.9
AVG FAMILY SIZE
2.7
AVG HOUSEHOLD SIZE
715
LABOR FORCE [ PEOPLE ]
59.7%
PERCENT IN LABOR FORCE
14.1%
UNEMPLOYMENT RATE
Graysville Zip Codes
Graysville Area Codes
Income in Graysville
Income Overview in Graysville
Per Capita Income in Graysville is $20,646, while median incomes of families and households are $41,136 and $38,281 respectively.
| Characteristic | Number | Measure |
| Per Capita Income | 1,548 | $20,646 |
| Median Family Income | 388 | $41,136 |
| Mean Family Income | 388 | $58,411 |
| Median Household Income | 577 | $38,281 |
| Mean Household Income | 577 | $52,877 |
| Income Deficit | 388 | $0 |
| Wage / Income Gap (%) | 1,548 | 25.46% |
| Wage / Income Gap ($) | 1,548 | 74.54¢ per $1 |
| Gini / Inequality Index | 1,548 | 0.40 |
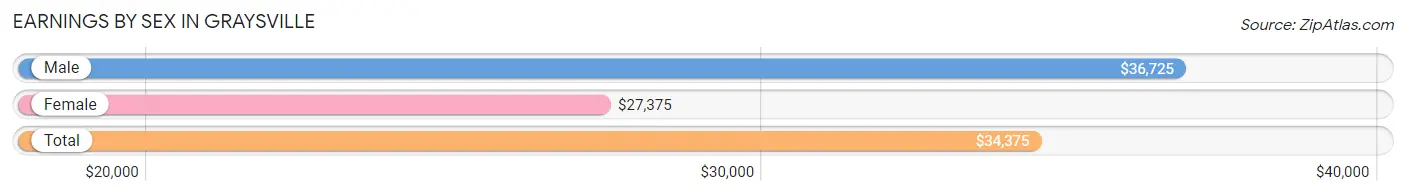
Earnings by Sex in Graysville
Average Earnings in Graysville are $34,375, $36,725 for men and $27,375 for women, a difference of 25.5%.
| Sex | Number | Average Earnings |
| Male | 391 (56.8%) | $36,725 |
| Female | 297 (43.2%) | $27,375 |
| Total | 688 (100.0%) | $34,375 |
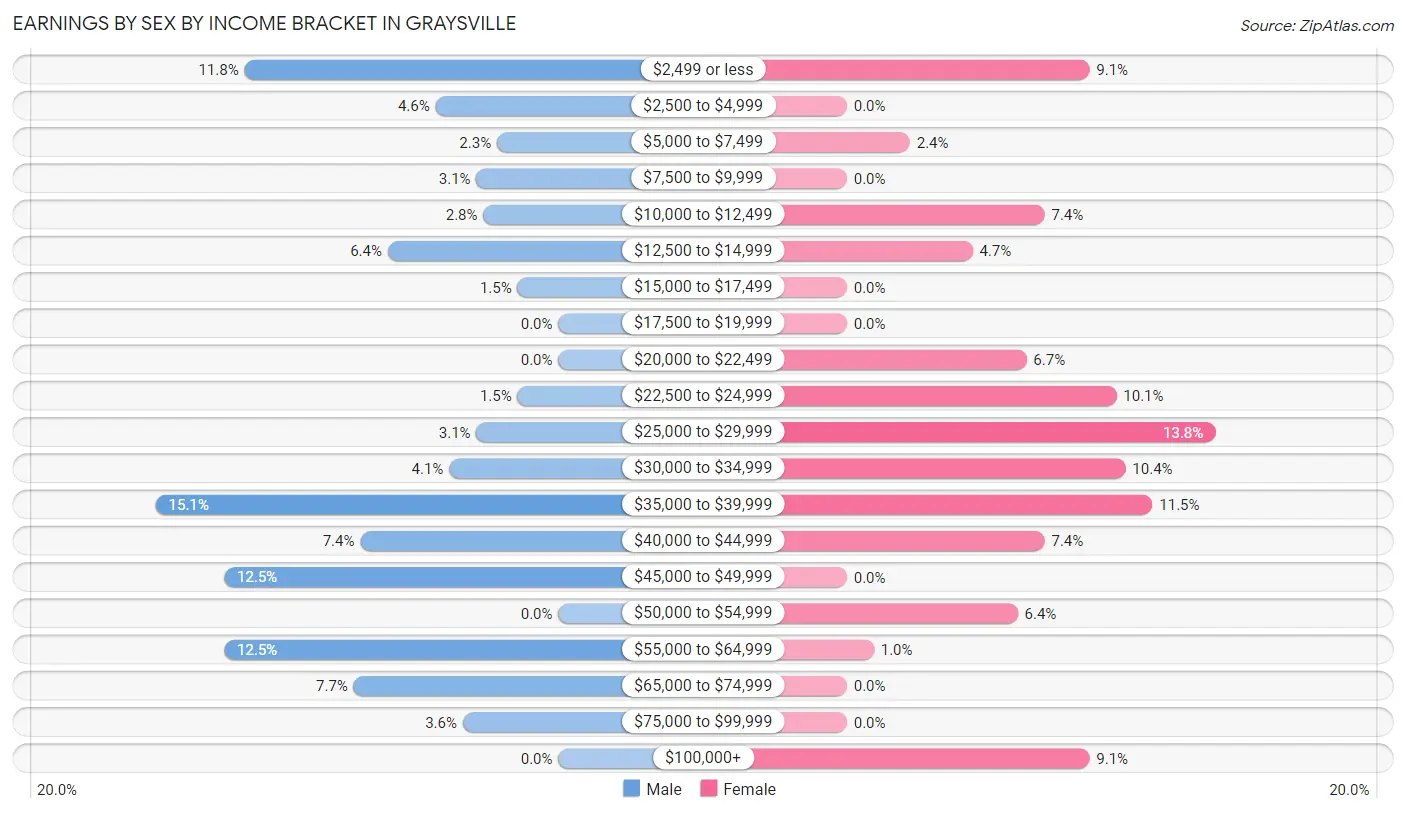
Earnings by Sex by Income Bracket in Graysville
The most common earnings brackets in Graysville are $35,000 to $39,999 for men (59 | 15.1%) and $25,000 to $29,999 for women (41 | 13.8%).
| Income | Male | Female |
| $2,499 or less | 46 (11.8%) | 27 (9.1%) |
| $2,500 to $4,999 | 18 (4.6%) | 0 (0.0%) |
| $5,000 to $7,499 | 9 (2.3%) | 7 (2.4%) |
| $7,500 to $9,999 | 12 (3.1%) | 0 (0.0%) |
| $10,000 to $12,499 | 11 (2.8%) | 22 (7.4%) |
| $12,500 to $14,999 | 25 (6.4%) | 14 (4.7%) |
| $15,000 to $17,499 | 6 (1.5%) | 0 (0.0%) |
| $17,500 to $19,999 | 0 (0.0%) | 0 (0.0%) |
| $20,000 to $22,499 | 0 (0.0%) | 20 (6.7%) |
| $22,500 to $24,999 | 6 (1.5%) | 30 (10.1%) |
| $25,000 to $29,999 | 12 (3.1%) | 41 (13.8%) |
| $30,000 to $34,999 | 16 (4.1%) | 31 (10.4%) |
| $35,000 to $39,999 | 59 (15.1%) | 34 (11.5%) |
| $40,000 to $44,999 | 29 (7.4%) | 22 (7.4%) |
| $45,000 to $49,999 | 49 (12.5%) | 0 (0.0%) |
| $50,000 to $54,999 | 0 (0.0%) | 19 (6.4%) |
| $55,000 to $64,999 | 49 (12.5%) | 3 (1.0%) |
| $65,000 to $74,999 | 30 (7.7%) | 0 (0.0%) |
| $75,000 to $99,999 | 14 (3.6%) | 0 (0.0%) |
| $100,000+ | 0 (0.0%) | 27 (9.1%) |
| Total | 391 (100.0%) | 297 (100.0%) |
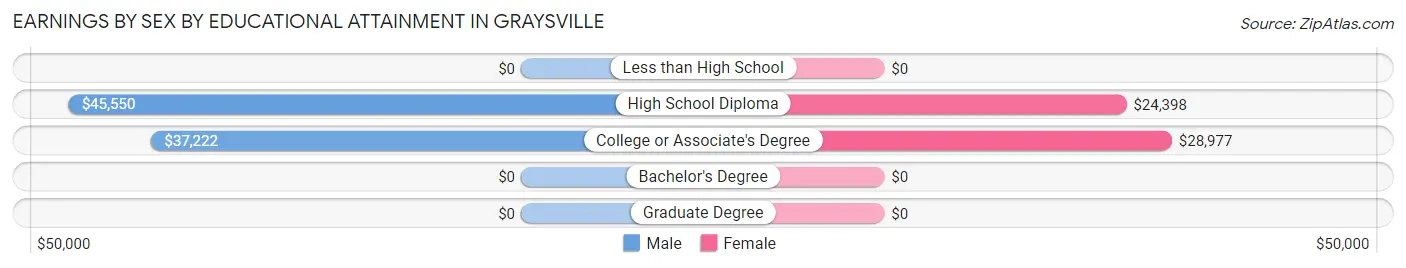
Earnings by Sex by Educational Attainment in Graysville
Average earnings in Graysville are $40,147 for men and $31,667 for women, a difference of 21.1%. Men with an educational attainment of high school diploma enjoy the highest average annual earnings of $45,550, while those with college or associate's degree education earn the least with $37,222. Women with an educational attainment of college or associate's degree earn the most with the average annual earnings of $28,977, while those with high school diploma education have the smallest earnings of $24,398.
| Educational Attainment | Male Income | Female Income |
| Less than High School | - | - |
| High School Diploma | $45,550 | $24,398 |
| College or Associate's Degree | $37,222 | $28,977 |
| Bachelor's Degree | - | - |
| Graduate Degree | - | - |
| Total | $40,147 | $31,667 |
Family Income in Graysville
Family Income Brackets in Graysville
According to the Graysville family income data, there are 68 families falling into the $35,000 to $49,999 income range, which is the most common income bracket and makes up 17.5% of all families.
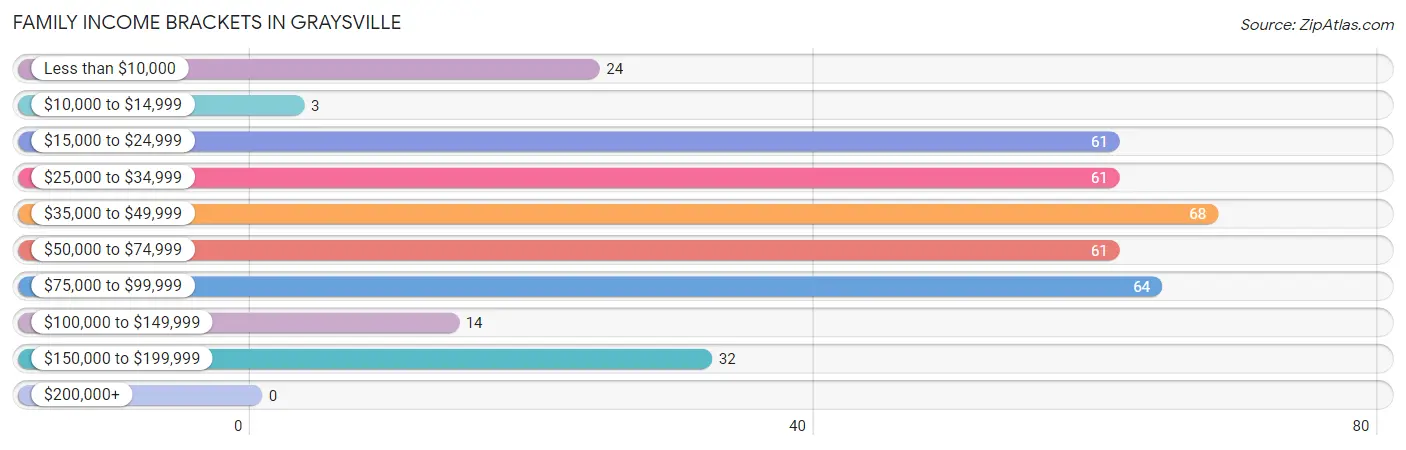
| Income Bracket | # Families | % Families |
| Less than $10,000 | 24 | 6.2% |
| $10,000 to $14,999 | 3 | 0.8% |
| $15,000 to $24,999 | 61 | 15.7% |
| $25,000 to $34,999 | 61 | 15.7% |
| $35,000 to $49,999 | 68 | 17.5% |
| $50,000 to $74,999 | 61 | 15.7% |
| $75,000 to $99,999 | 64 | 16.5% |
| $100,000 to $149,999 | 14 | 3.6% |
| $150,000 to $199,999 | 32 | 8.2% |
| $200,000+ | 0 | 0.0% |
Family Income by Famaliy Size in Graysville
5-person families (44 | 11.3%) account for the highest median family income in Graysville with $87,763 per family, while 2-person families (210 | 54.1%) have the highest median income of $24,519 per family member.
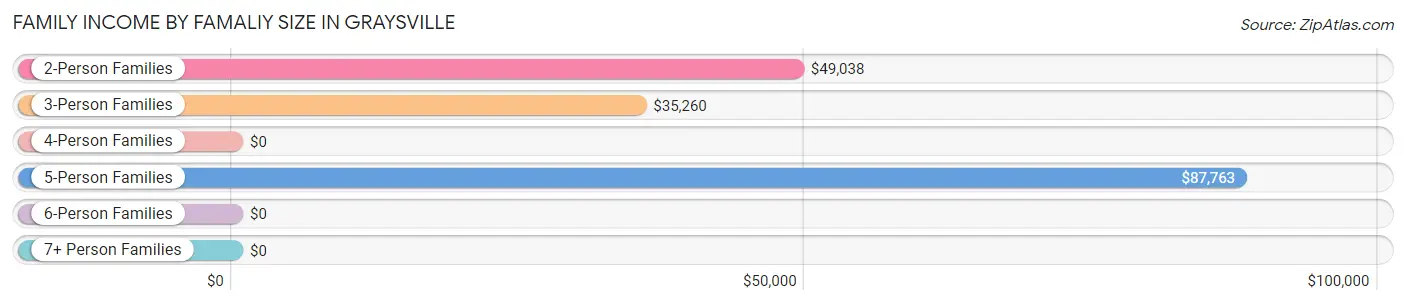
| Income Bracket | # Families | Median Income |
| 2-Person Families | 210 (54.1%) | $49,038 |
| 3-Person Families | 109 (28.1%) | $35,260 |
| 4-Person Families | 25 (6.4%) | $0 |
| 5-Person Families | 44 (11.3%) | $87,763 |
| 6-Person Families | 0 (0.0%) | $0 |
| 7+ Person Families | 0 (0.0%) | $0 |
| Total | 388 (100.0%) | $41,136 |
Family Income by Number of Earners in Graysville
The median family income in Graysville is $41,136, with families comprising 2 earners (92) having the highest median family income of $89,722, while families with no earners (82) have the lowest median family income of $27,500, accounting for 23.7% and 21.1% of families, respectively.
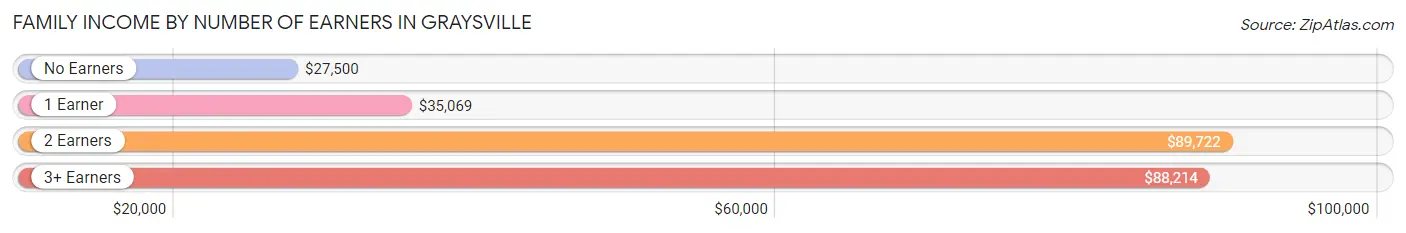
| Number of Earners | # Families | Median Income |
| No Earners | 82 (21.1%) | $27,500 |
| 1 Earner | 174 (44.9%) | $35,069 |
| 2 Earners | 92 (23.7%) | $89,722 |
| 3+ Earners | 40 (10.3%) | $88,214 |
| Total | 388 (100.0%) | $41,136 |
Household Income in Graysville
Household Income Brackets in Graysville
With 124 households falling in the category, the $35,000 to $49,999 income range is the most frequent in Graysville, accounting for 21.5% of all households.
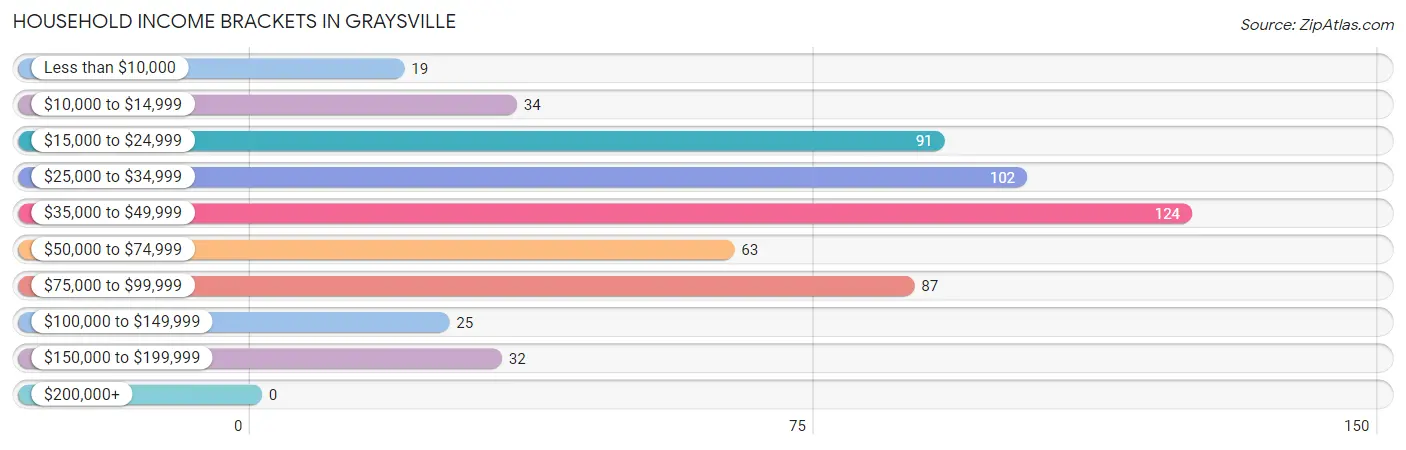
| Income Bracket | # Households | % Households |
| Less than $10,000 | 19 | 3.3% |
| $10,000 to $14,999 | 34 | 5.9% |
| $15,000 to $24,999 | 91 | 15.8% |
| $25,000 to $34,999 | 102 | 17.7% |
| $35,000 to $49,999 | 124 | 21.5% |
| $50,000 to $74,999 | 63 | 10.9% |
| $75,000 to $99,999 | 87 | 15.1% |
| $100,000 to $149,999 | 25 | 4.3% |
| $150,000 to $199,999 | 32 | 5.5% |
| $200,000+ | 0 | 0.0% |
Household Income by Householder Age in Graysville
The median household income in Graysville is $38,281, with the highest median household income of $46,964 found in the 45 to 64 years age bracket for the primary householder. A total of 219 households (38.0%) fall into this category. Meanwhile, the 15 to 24 years age bracket for the primary householder has the lowest median household income of $29,792, with 13 households (2.2%) in this group.
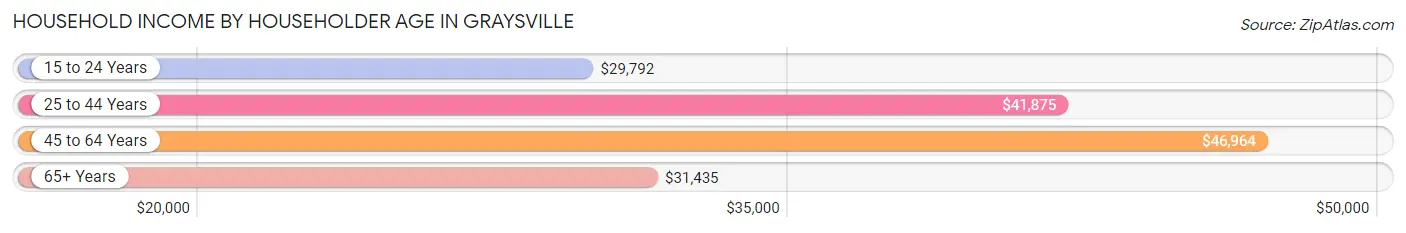
| Income Bracket | # Households | Median Income |
| 15 to 24 Years | 13 (2.2%) | $29,792 |
| 25 to 44 Years | 190 (32.9%) | $41,875 |
| 45 to 64 Years | 219 (38.0%) | $46,964 |
| 65+ Years | 155 (26.9%) | $31,435 |
| Total | 577 (100.0%) | $38,281 |
Poverty in Graysville
Income Below Poverty by Sex and Age in Graysville
With 22.5% poverty level for males and 16.8% for females among the residents of Graysville, 6 to 11 year old males and 5 year old females are the most vulnerable to poverty, with 33 males (100.0%) and 5 females (100.0%) in their respective age groups living below the poverty level.
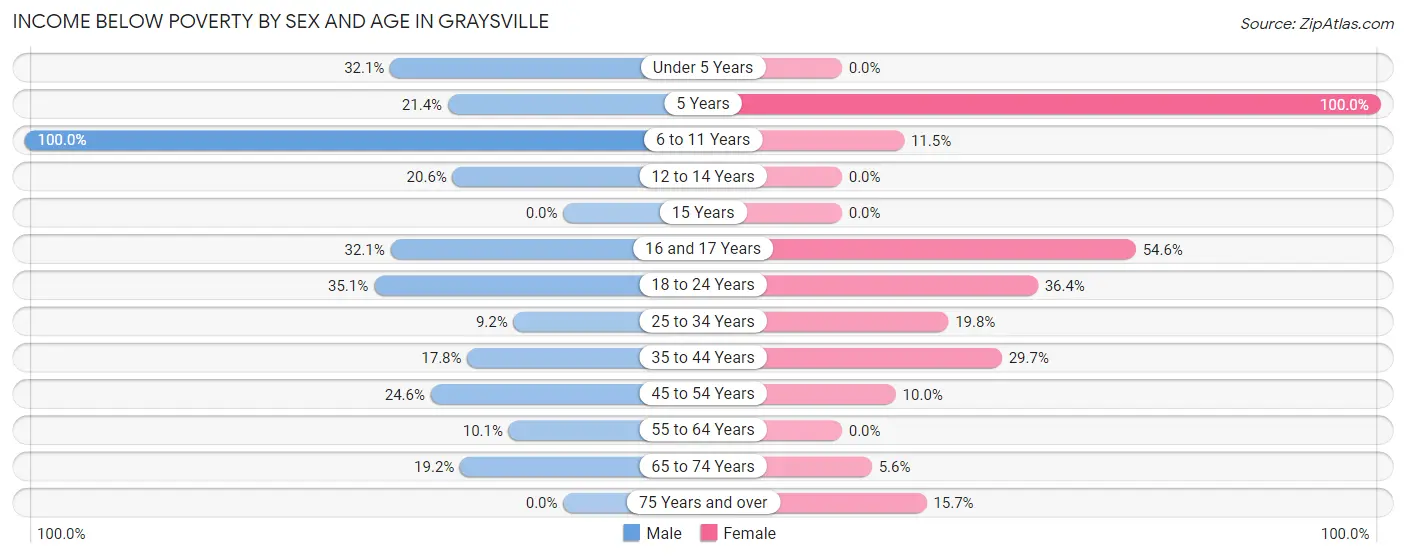
| Age Bracket | Male | Female |
| Under 5 Years | 9 (32.1%) | 0 (0.0%) |
| 5 Years | 3 (21.4%) | 5 (100.0%) |
| 6 to 11 Years | 33 (100.0%) | 9 (11.5%) |
| 12 to 14 Years | 15 (20.5%) | 0 (0.0%) |
| 15 Years | 0 (0.0%) | 0 (0.0%) |
| 16 and 17 Years | 17 (32.1%) | 12 (54.5%) |
| 18 to 24 Years | 13 (35.1%) | 12 (36.4%) |
| 25 to 34 Years | 11 (9.2%) | 16 (19.8%) |
| 35 to 44 Years | 18 (17.8%) | 38 (29.7%) |
| 45 to 54 Years | 31 (24.6%) | 12 (10.0%) |
| 55 to 64 Years | 8 (10.1%) | 0 (0.0%) |
| 65 to 74 Years | 9 (19.2%) | 4 (5.6%) |
| 75 Years and over | 0 (0.0%) | 11 (15.7%) |
| Total | 167 (22.5%) | 119 (16.8%) |
Income Above Poverty by Sex and Age in Graysville
According to the poverty statistics in Graysville, males aged 75 years and over and females aged under 5 years are the age groups that are most secure financially, with 100.0% of males and 100.0% of females in these age groups living above the poverty line.
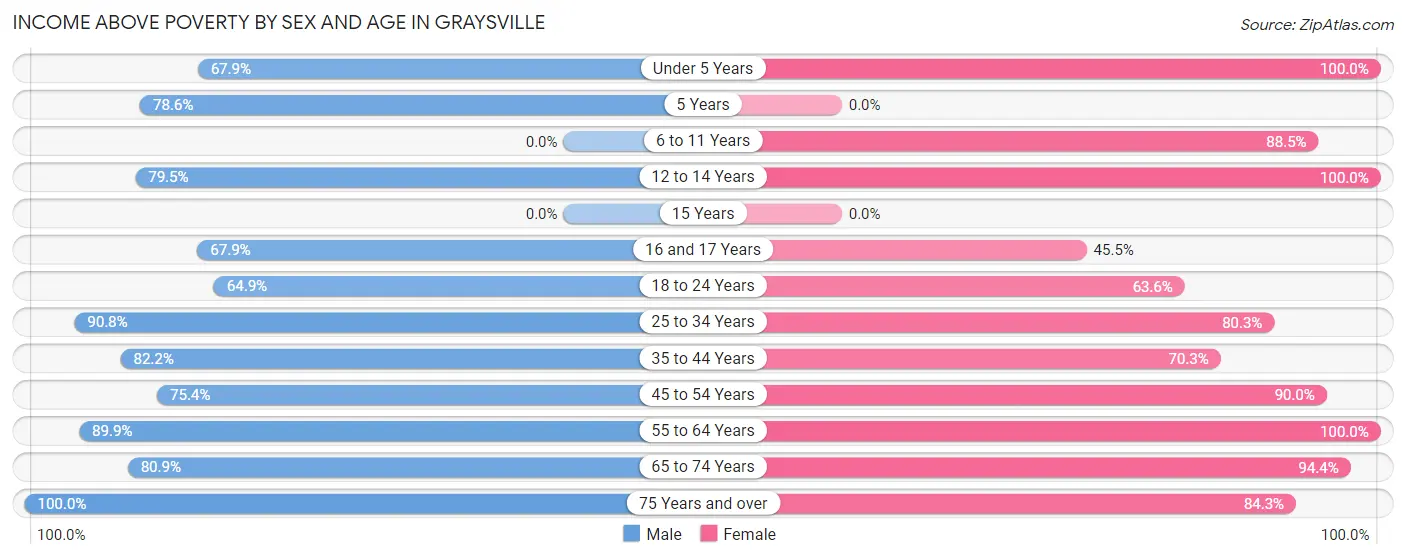
| Age Bracket | Male | Female |
| Under 5 Years | 19 (67.9%) | 17 (100.0%) |
| 5 Years | 11 (78.6%) | 0 (0.0%) |
| 6 to 11 Years | 0 (0.0%) | 69 (88.5%) |
| 12 to 14 Years | 58 (79.4%) | 3 (100.0%) |
| 15 Years | 0 (0.0%) | 0 (0.0%) |
| 16 and 17 Years | 36 (67.9%) | 10 (45.5%) |
| 18 to 24 Years | 24 (64.9%) | 21 (63.6%) |
| 25 to 34 Years | 108 (90.8%) | 65 (80.2%) |
| 35 to 44 Years | 83 (82.2%) | 90 (70.3%) |
| 45 to 54 Years | 95 (75.4%) | 108 (90.0%) |
| 55 to 64 Years | 71 (89.9%) | 78 (100.0%) |
| 65 to 74 Years | 38 (80.8%) | 68 (94.4%) |
| 75 Years and over | 32 (100.0%) | 59 (84.3%) |
| Total | 575 (77.5%) | 588 (83.2%) |
Income Below Poverty Among Married-Couple Families in Graysville
The poverty statistics for married-couple families in Graysville show that 4.4% or 8 of the total 182 families live below the poverty line. Families with 1 or 2 children have the highest poverty rate of 17.4%, comprising of 4 families. On the other hand, families with 3 or 4 children have the lowest poverty rate of 0.0%, which includes 0 families.
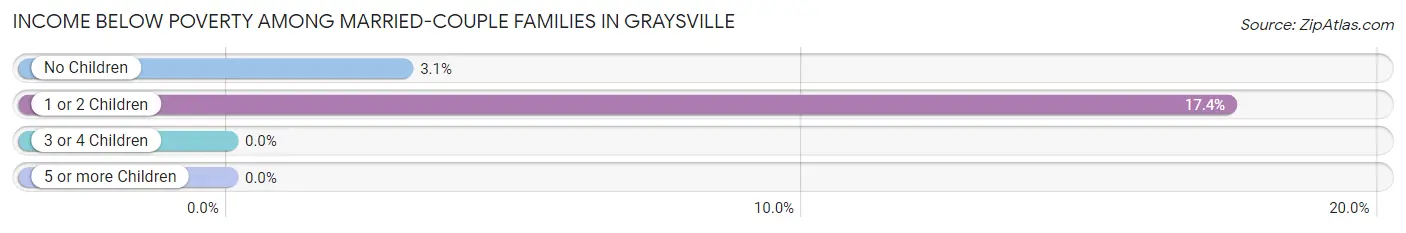
| Children | Above Poverty | Below Poverty |
| No Children | 127 (97.0%) | 4 (3.0%) |
| 1 or 2 Children | 19 (82.6%) | 4 (17.4%) |
| 3 or 4 Children | 28 (100.0%) | 0 (0.0%) |
| 5 or more Children | 0 (0.0%) | 0 (0.0%) |
| Total | 174 (95.6%) | 8 (4.4%) |
Income Below Poverty Among Single-Parent Households in Graysville
According to the poverty data in Graysville, 7.8% or 4 single-father households and 16.8% or 26 single-mother households are living below the poverty line. Among single-father households, those with 1 or 2 children have the highest poverty rate, with 4 households (15.4%) experiencing poverty. Likewise, among single-mother households, those with 3 or 4 children have the highest poverty rate, with 10 households (76.9%) falling below the poverty line.
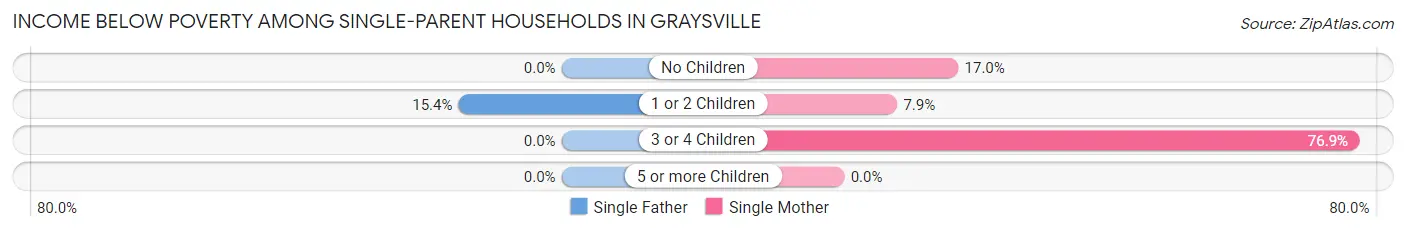
| Children | Single Father | Single Mother |
| No Children | 0 (0.0%) | 9 (17.0%) |
| 1 or 2 Children | 4 (15.4%) | 7 (7.9%) |
| 3 or 4 Children | 0 (0.0%) | 10 (76.9%) |
| 5 or more Children | 0 (0.0%) | 0 (0.0%) |
| Total | 4 (7.8%) | 26 (16.8%) |
Income Below Poverty Among Married-Couple vs Single-Parent Households in Graysville
The poverty data for Graysville shows that 8 of the married-couple family households (4.4%) and 30 of the single-parent households (14.6%) are living below the poverty level. Within the married-couple family households, those with 1 or 2 children have the highest poverty rate, with 4 households (17.4%) falling below the poverty line. Among the single-parent households, those with 3 or 4 children have the highest poverty rate, with 10 household (76.9%) living below poverty.
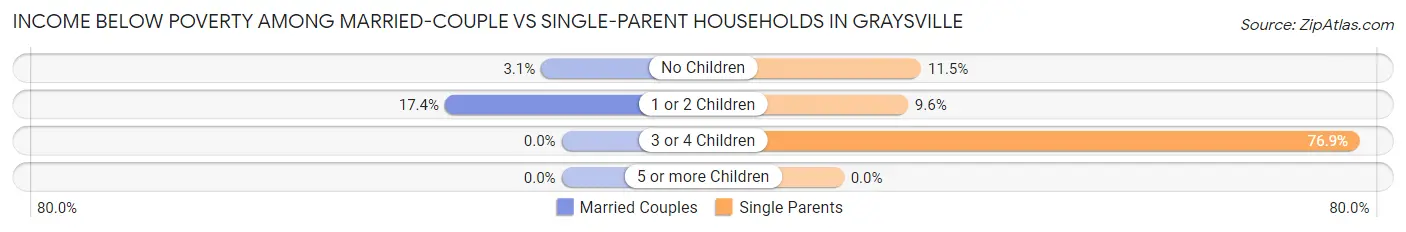
| Children | Married-Couple Families | Single-Parent Households |
| No Children | 4 (3.0%) | 9 (11.5%) |
| 1 or 2 Children | 4 (17.4%) | 11 (9.6%) |
| 3 or 4 Children | 0 (0.0%) | 10 (76.9%) |
| 5 or more Children | 0 (0.0%) | 0 (0.0%) |
| Total | 8 (4.4%) | 30 (14.6%) |
Race in Graysville
The most populous races in Graysville are White / Caucasian (1,452 | 93.8%), Two or more Races (92 | 5.9%), and Hispanic or Latino (71 | 4.6%).
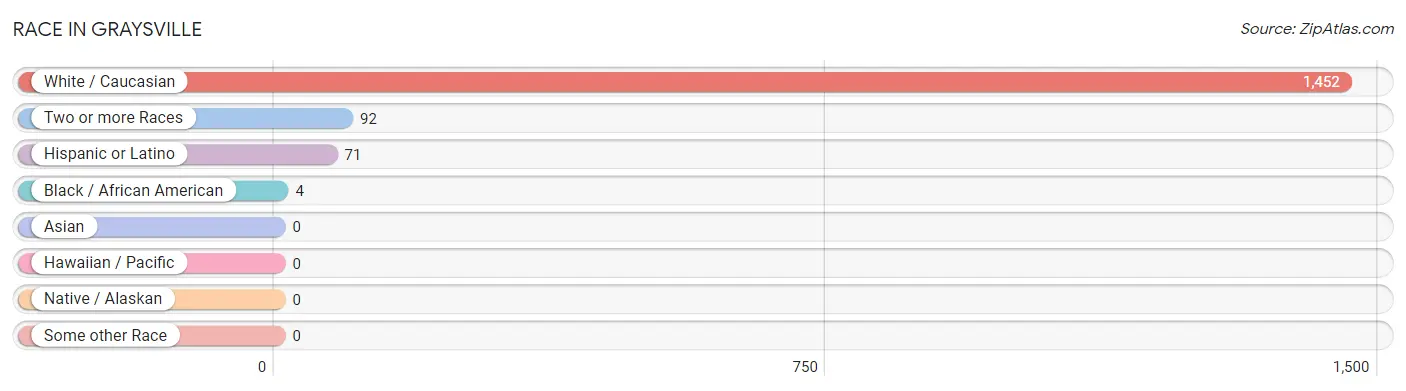
| Race | # Population | % Population |
| Asian | 0 | 0.0% |
| Black / African American | 4 | 0.3% |
| Hawaiian / Pacific | 0 | 0.0% |
| Hispanic or Latino | 71 | 4.6% |
| Native / Alaskan | 0 | 0.0% |
| White / Caucasian | 1,452 | 93.8% |
| Two or more Races | 92 | 5.9% |
| Some other Race | 0 | 0.0% |
| Total | 1,548 | 100.0% |
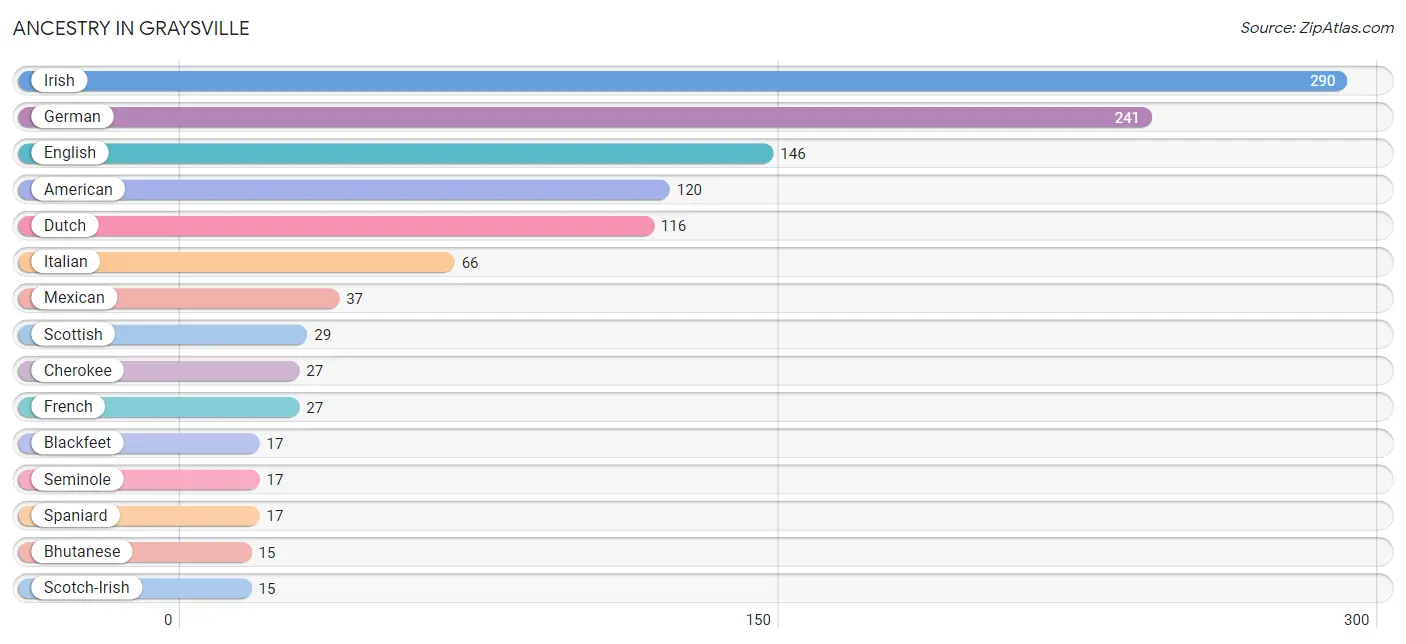
Ancestry in Graysville
The most populous ancestries reported in Graysville are Irish (290 | 18.7%), German (241 | 15.6%), English (146 | 9.4%), American (120 | 7.7%), and Dutch (116 | 7.5%), together accounting for 59.0% of all Graysville residents.
| Ancestry | # Population | % Population |
| American | 120 | 7.7% |
| Bhutanese | 15 | 1.0% |
| Blackfeet | 17 | 1.1% |
| Cherokee | 27 | 1.7% |
| Dutch | 116 | 7.5% |
| English | 146 | 9.4% |
| French | 27 | 1.7% |
| French Canadian | 7 | 0.4% |
| German | 241 | 15.6% |
| Irish | 290 | 18.7% |
| Italian | 66 | 4.3% |
| Mexican | 37 | 2.4% |
| Northern European | 1 | 0.1% |
| Puerto Rican | 4 | 0.3% |
| Scotch-Irish | 15 | 1.0% |
| Scottish | 29 | 1.9% |
| Seminole | 17 | 1.1% |
| Spaniard | 17 | 1.1% |
| Spanish | 13 | 0.8% | View All 19 Rows |
Immigrants in Graysville
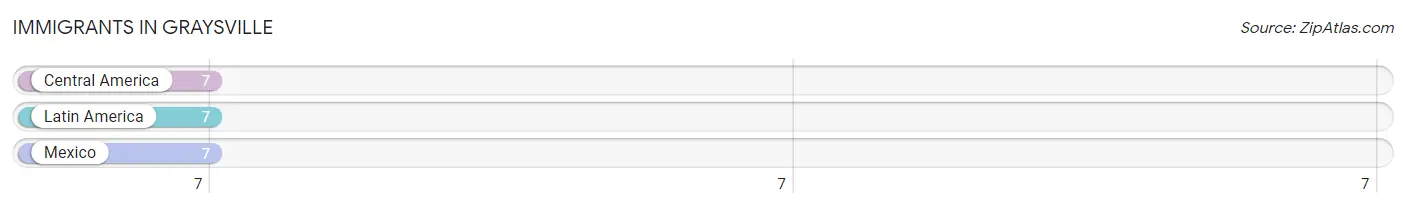
The most numerous immigrant groups reported in Graysville came from Central America (7 | 0.4%), Latin America (7 | 0.4%), and Mexico (7 | 0.4%), together accounting for 1.3% of all Graysville residents.
| Immigration Origin | # Population | % Population |
| Central America | 7 | 0.4% |
| Latin America | 7 | 0.4% |
| Mexico | 7 | 0.4% | View All 3 Rows |
Sex and Age in Graysville
Sex and Age in Graysville
The most populous age groups in Graysville are 10 to 14 Years (88 | 11.0%) for men and 5 to 9 Years (101 | 13.5%) for women.
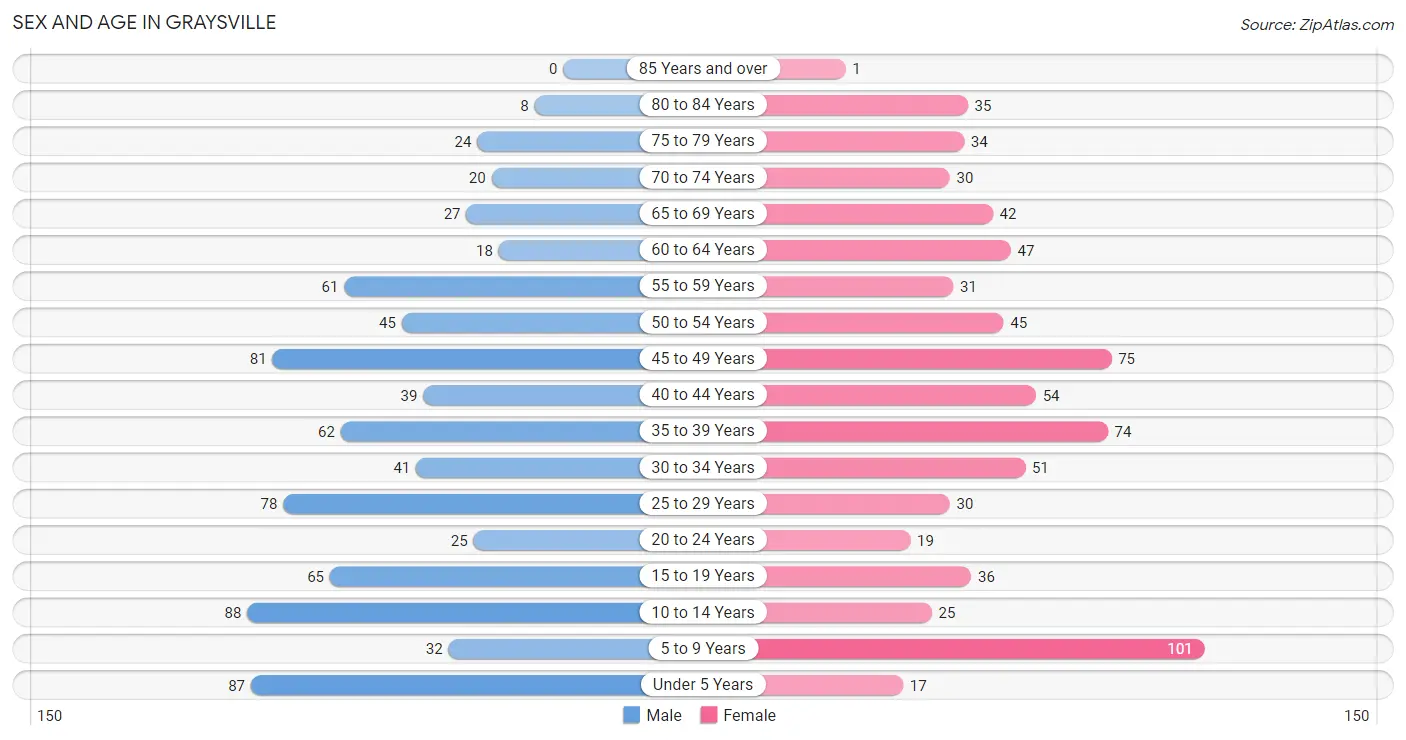
| Age Bracket | Male | Female |
| Under 5 Years | 87 (10.9%) | 17 (2.3%) |
| 5 to 9 Years | 32 (4.0%) | 101 (13.5%) |
| 10 to 14 Years | 88 (11.0%) | 25 (3.4%) |
| 15 to 19 Years | 65 (8.1%) | 36 (4.8%) |
| 20 to 24 Years | 25 (3.1%) | 19 (2.5%) |
| 25 to 29 Years | 78 (9.7%) | 30 (4.0%) |
| 30 to 34 Years | 41 (5.1%) | 51 (6.8%) |
| 35 to 39 Years | 62 (7.7%) | 74 (9.9%) |
| 40 to 44 Years | 39 (4.9%) | 54 (7.2%) |
| 45 to 49 Years | 81 (10.1%) | 75 (10.0%) |
| 50 to 54 Years | 45 (5.6%) | 45 (6.0%) |
| 55 to 59 Years | 61 (7.6%) | 31 (4.2%) |
| 60 to 64 Years | 18 (2.2%) | 47 (6.3%) |
| 65 to 69 Years | 27 (3.4%) | 42 (5.6%) |
| 70 to 74 Years | 20 (2.5%) | 30 (4.0%) |
| 75 to 79 Years | 24 (3.0%) | 34 (4.5%) |
| 80 to 84 Years | 8 (1.0%) | 35 (4.7%) |
| 85 Years and over | 0 (0.0%) | 1 (0.1%) |
| Total | 801 (100.0%) | 747 (100.0%) |
Families and Households in Graysville
Median Family Size in Graysville
The median family size in Graysville is 2.91 persons per family, with married-couple families (182 | 46.9%) accounting for the largest median family size of 3.12 persons per family. On the other hand, single male/father families (51 | 13.1%) represent the smallest median family size with 2.31 persons per family.
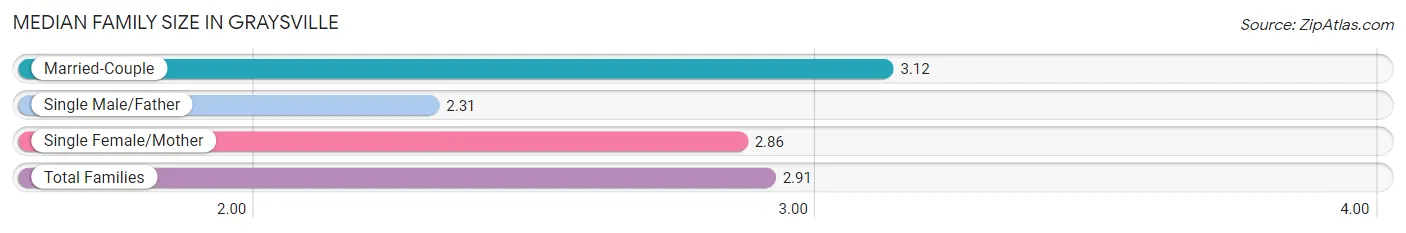
| Family Type | # Families | Family Size |
| Married-Couple | 182 (46.9%) | 3.12 |
| Single Male/Father | 51 (13.1%) | 2.31 |
| Single Female/Mother | 155 (40.0%) | 2.86 |
| Total Families | 388 (100.0%) | 2.91 |
Median Household Size in Graysville
The median household size in Graysville is 2.68 persons per household, with single female/mother households (155 | 26.9%) accounting for the largest median household size of 3.72 persons per household. non-family households (189 | 32.8%) represent the smallest median household size with 1.39 persons per household.
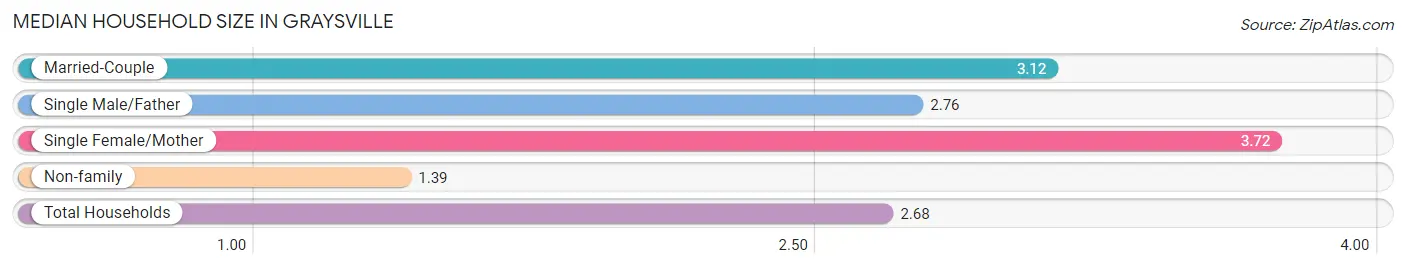
| Household Type | # Households | Household Size |
| Married-Couple | 182 (31.5%) | 3.12 |
| Single Male/Father | 51 (8.8%) | 2.76 |
| Single Female/Mother | 155 (26.9%) | 3.72 |
| Non-family | 189 (32.8%) | 1.39 |
| Total Households | 577 (100.0%) | 2.68 |
Household Size by Marriage Status in Graysville
Out of a total of 577 households in Graysville, 388 (67.2%) are family households, while 189 (32.8%) are nonfamily households. The most numerous type of family households are 2-person households, comprising 190, and the most common type of nonfamily households are 1-person households, comprising 105.
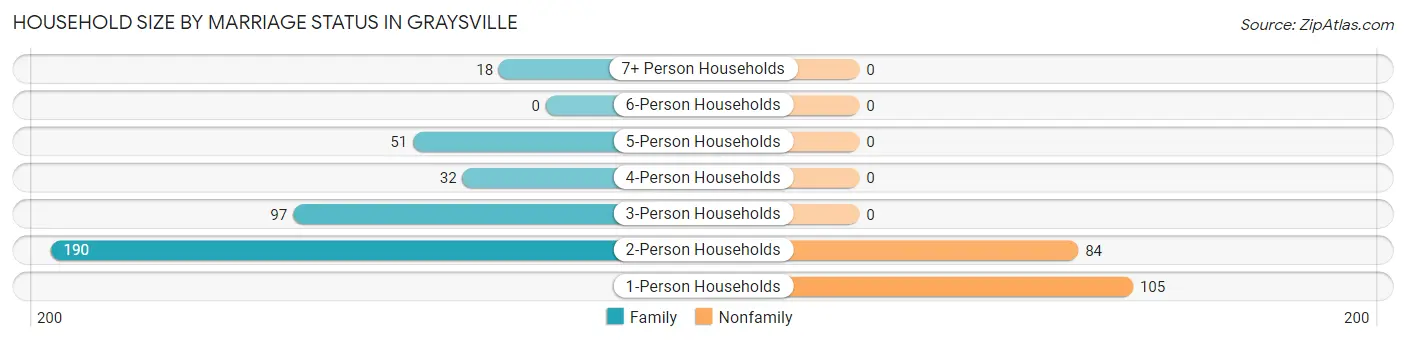
| Household Size | Family Households | Nonfamily Households |
| 1-Person Households | - | 105 (18.2%) |
| 2-Person Households | 190 (32.9%) | 84 (14.6%) |
| 3-Person Households | 97 (16.8%) | 0 (0.0%) |
| 4-Person Households | 32 (5.6%) | 0 (0.0%) |
| 5-Person Households | 51 (8.8%) | 0 (0.0%) |
| 6-Person Households | 0 (0.0%) | 0 (0.0%) |
| 7+ Person Households | 18 (3.1%) | 0 (0.0%) |
| Total | 388 (67.2%) | 189 (32.8%) |
Female Fertility in Graysville
Fertility by Age in Graysville
Average fertility rate in Graysville is 23.0 births per 1,000 women. Women in the age bracket of 20 to 34 years have the highest fertility rate with 80.0 births per 1,000 women. Women in the age bracket of 20 to 34 years acount for 100.0% of all women with births.
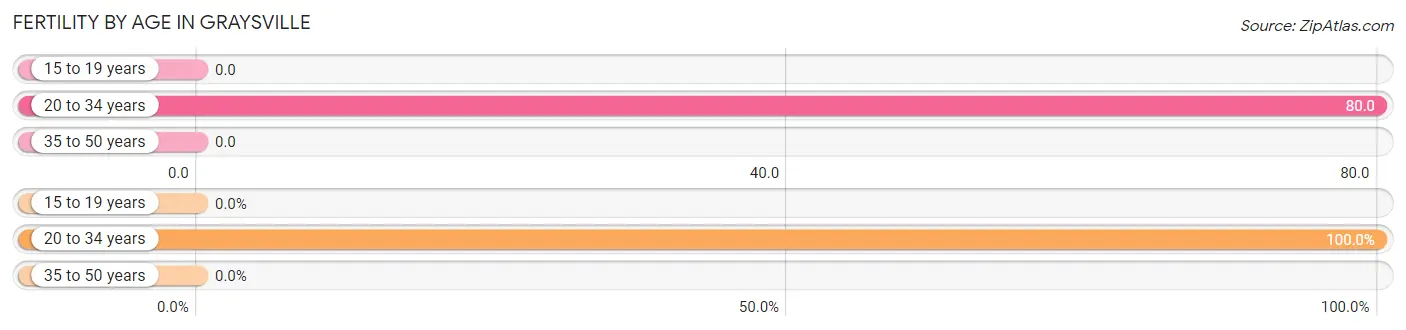
| Age Bracket | Women with Births | Births / 1,000 Women |
| 15 to 19 years | 0 (0.0%) | 0.0 |
| 20 to 34 years | 8 (100.0%) | 80.0 |
| 35 to 50 years | 0 (0.0%) | 0.0 |
| Total | 8 (100.0%) | 23.0 |
Fertility by Age by Marriage Status in Graysville
62.5% of women with births (8) in Graysville are married. The highest percentage of unmarried women with births falls into 20 to 34 years age bracket with 37.5% of them unmarried at the time of birth, while the lowest percentage of unmarried women with births belong to 20 to 34 years age bracket with 37.5% of them unmarried.
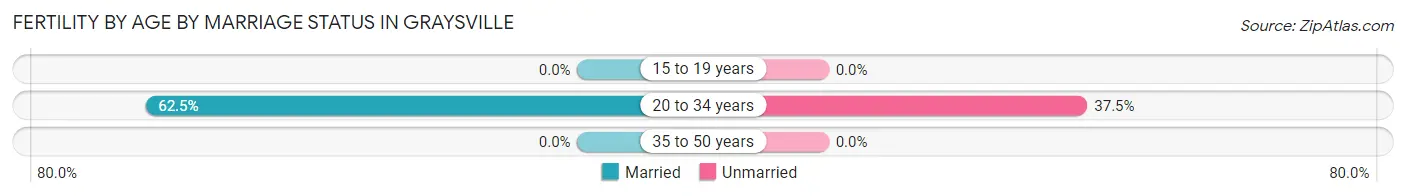
| Age Bracket | Married | Unmarried |
| 15 to 19 years | 0 (0.0%) | 0 (0.0%) |
| 20 to 34 years | 5 (62.5%) | 3 (37.5%) |
| 35 to 50 years | 0 (0.0%) | 0 (0.0%) |
| Total | 5 (62.5%) | 3 (37.5%) |
Fertility by Education in Graysville
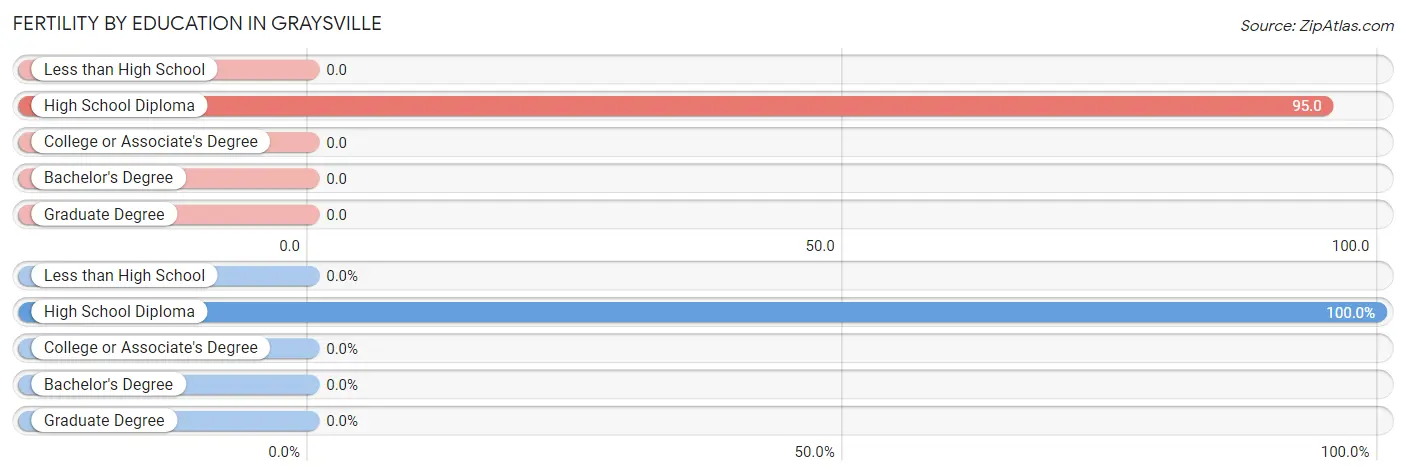
| Educational Attainment | Women with Births | Births / 1,000 Women |
| Less than High School | 0 (0.0%) | 0.0 |
| High School Diploma | 8 (100.0%) | 95.0 |
| College or Associate's Degree | 0 (0.0%) | 0.0 |
| Bachelor's Degree | 0 (0.0%) | 0.0 |
| Graduate Degree | 0 (0.0%) | 0.0 |
| Total | 8 (100.0%) | 23.0 |
Fertility by Education by Marriage Status in Graysville
37.5% of women with births in Graysville are unmarried. Women with the educational attainment of high school diploma are most likely to be married with 62.5% of them married at childbirth, while women with the educational attainment of high school diploma are least likely to be married with 37.5% of them unmarried at childbirth.
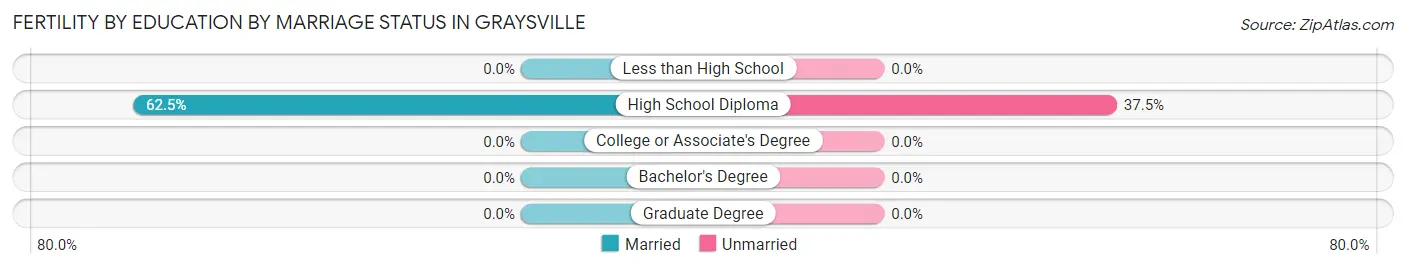
| Educational Attainment | Married | Unmarried |
| Less than High School | 0 (0.0%) | 0 (0.0%) |
| High School Diploma | 5 (62.5%) | 3 (37.5%) |
| College or Associate's Degree | 0 (0.0%) | 0 (0.0%) |
| Bachelor's Degree | 0 (0.0%) | 0 (0.0%) |
| Graduate Degree | 0 (0.0%) | 0 (0.0%) |
| Total | 5 (62.5%) | 3 (37.5%) |
Employment Characteristics in Graysville
Employment by Class of Employer in Graysville
Among the 607 employed individuals in Graysville, private company employees (418 | 68.9%), local government employees (73 | 12.0%), and self-employed (not incorporated) (69 | 11.4%) make up the most common classes of employment.
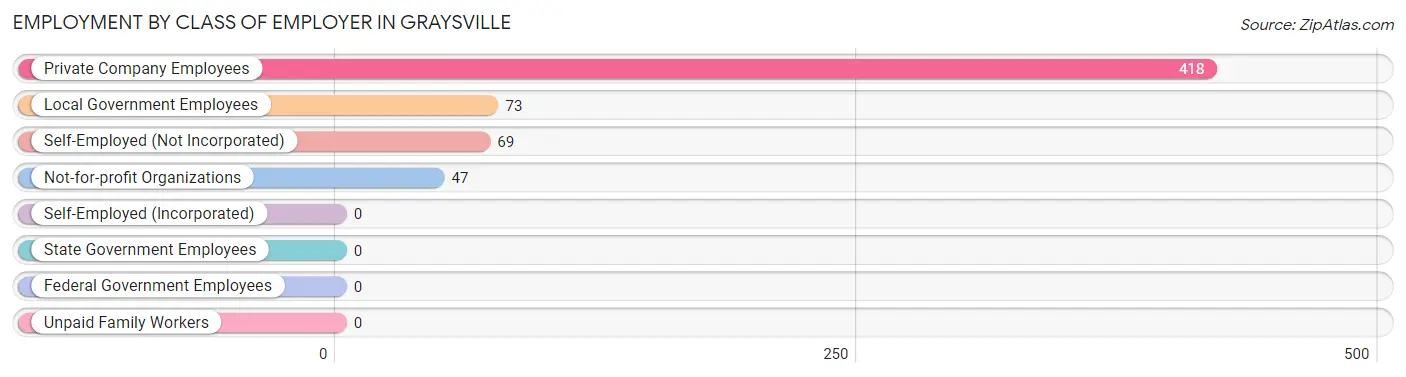
| Employer Class | # Employees | % Employees |
| Private Company Employees | 418 | 68.9% |
| Self-Employed (Incorporated) | 0 | 0.0% |
| Self-Employed (Not Incorporated) | 69 | 11.4% |
| Not-for-profit Organizations | 47 | 7.7% |
| Local Government Employees | 73 | 12.0% |
| State Government Employees | 0 | 0.0% |
| Federal Government Employees | 0 | 0.0% |
| Unpaid Family Workers | 0 | 0.0% |
| Total | 607 | 100.0% |
Employment Status by Age in Graysville
According to the labor force statistics for Graysville, out of the total population over 16 years of age (1,198), 59.7% or 715 individuals are in the labor force, with 14.1% or 101 of them unemployed. The age group with the highest labor force participation rate is 30 to 34 years, with 87.0% or 80 individuals in the labor force. Within the labor force, the 75 years and over age range has the highest percentage of unemployed individuals, with 47.4% or 9 of them being unemployed.
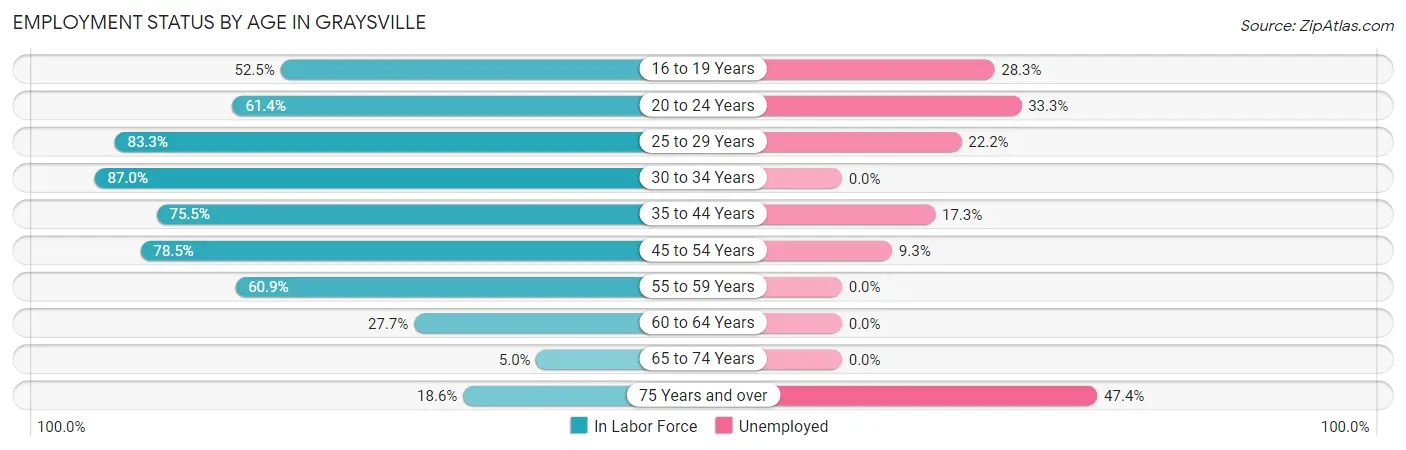
| Age Bracket | In Labor Force | Unemployed |
| 16 to 19 Years | 53 (52.5%) | 15 (28.3%) |
| 20 to 24 Years | 27 (61.4%) | 9 (33.3%) |
| 25 to 29 Years | 90 (83.3%) | 20 (22.2%) |
| 30 to 34 Years | 80 (87.0%) | 0 (0.0%) |
| 35 to 44 Years | 173 (75.5%) | 30 (17.3%) |
| 45 to 54 Years | 193 (78.5%) | 18 (9.3%) |
| 55 to 59 Years | 56 (60.9%) | 0 (0.0%) |
| 60 to 64 Years | 18 (27.7%) | 0 (0.0%) |
| 65 to 74 Years | 6 (5.0%) | 0 (0.0%) |
| 75 Years and over | 19 (18.6%) | 9 (47.4%) |
| Total | 715 (59.7%) | 101 (14.1%) |
Employment Status by Educational Attainment in Graysville
According to labor force statistics for Graysville, 73.3% of individuals (610) out of the total population between 25 and 64 years of age (832) are in the labor force, with 11.1% or 68 of them being unemployed. The group with the highest labor force participation rate are those with the educational attainment of college / associate degree, with 85.2% or 259 individuals in the labor force. Within the labor force, individuals with high school diploma education have the highest percentage of unemployment, with 18.1% or 38 of them being unemployed.
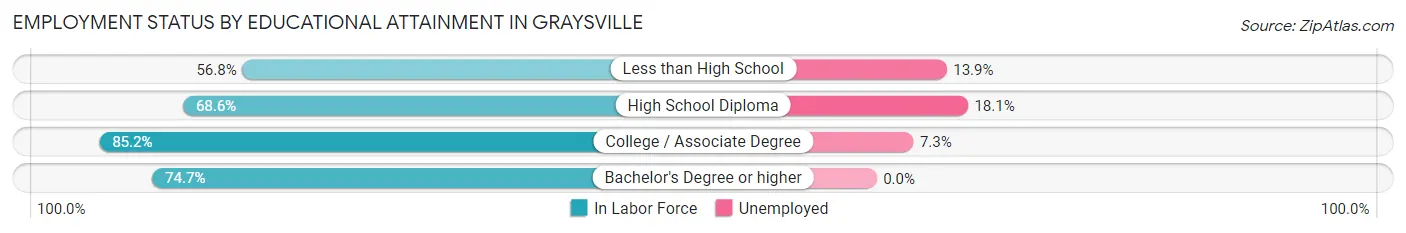
| Educational Attainment | In Labor Force | Unemployed |
| Less than High School | 79 (56.8%) | 19 (13.9%) |
| High School Diploma | 210 (68.6%) | 55 (18.1%) |
| College / Associate Degree | 259 (85.2%) | 22 (7.3%) |
| Bachelor's Degree or higher | 62 (74.7%) | 0 (0.0%) |
| Total | 610 (73.3%) | 92 (11.1%) |
Employment Occupations by Sex in Graysville
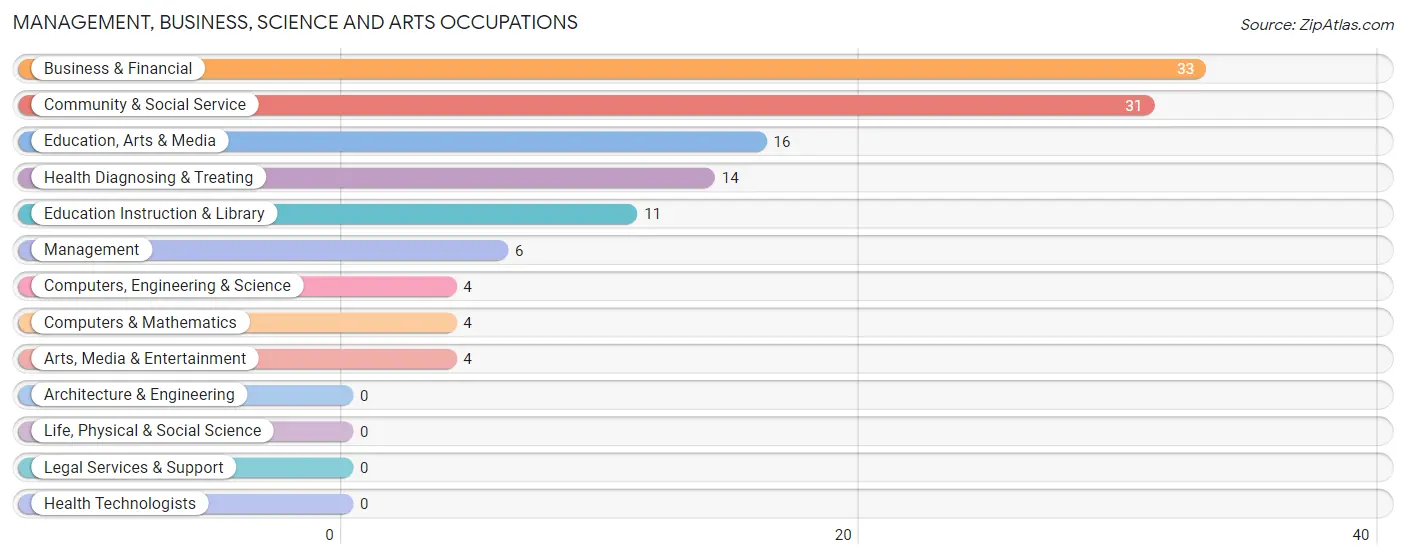
Management, Business, Science and Arts Occupations
The most common Management, Business, Science and Arts occupations in Graysville are Business & Financial (33 | 5.4%), Community & Social Service (31 | 5.1%), Education, Arts & Media (16 | 2.6%), Health Diagnosing & Treating (14 | 2.3%), and Education Instruction & Library (11 | 1.8%).
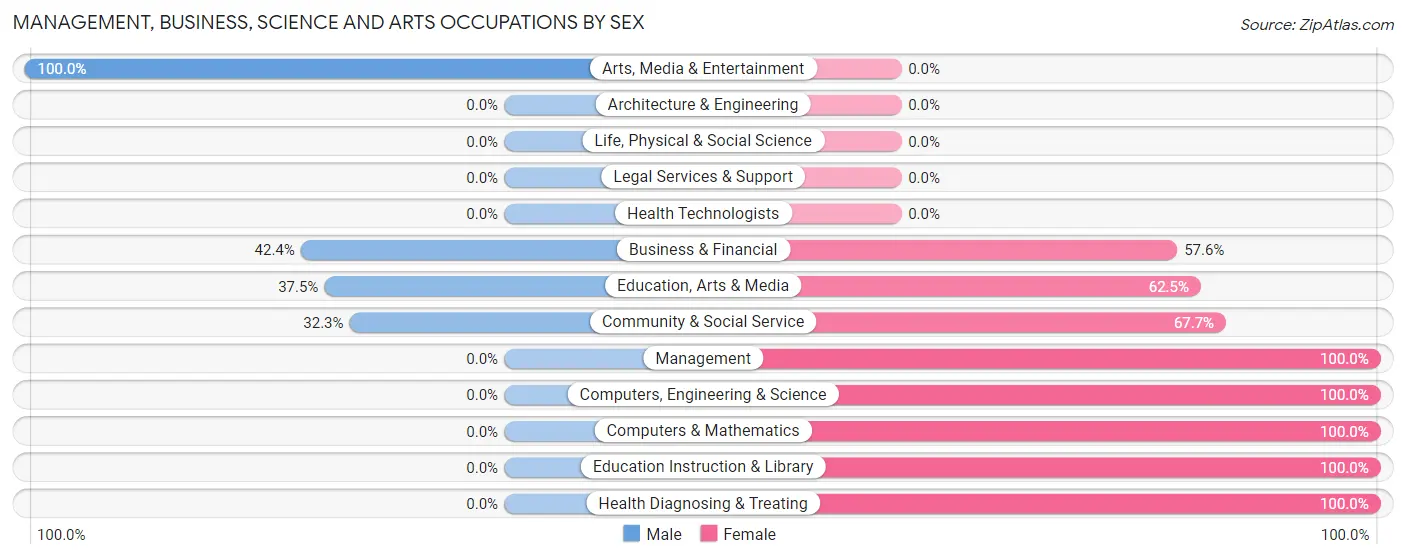
Management, Business, Science and Arts Occupations by Sex
Within the Management, Business, Science and Arts occupations in Graysville, the most male-oriented occupations are Arts, Media & Entertainment (100.0%), Business & Financial (42.4%), and Education, Arts & Media (37.5%), while the most female-oriented occupations are Management (100.0%), Computers, Engineering & Science (100.0%), and Computers & Mathematics (100.0%).
| Occupation | Male | Female |
| Management | 0 (0.0%) | 6 (100.0%) |
| Business & Financial | 14 (42.4%) | 19 (57.6%) |
| Computers, Engineering & Science | 0 (0.0%) | 4 (100.0%) |
| Computers & Mathematics | 0 (0.0%) | 4 (100.0%) |
| Architecture & Engineering | 0 (0.0%) | 0 (0.0%) |
| Life, Physical & Social Science | 0 (0.0%) | 0 (0.0%) |
| Community & Social Service | 10 (32.3%) | 21 (67.7%) |
| Education, Arts & Media | 6 (37.5%) | 10 (62.5%) |
| Legal Services & Support | 0 (0.0%) | 0 (0.0%) |
| Education Instruction & Library | 0 (0.0%) | 11 (100.0%) |
| Arts, Media & Entertainment | 4 (100.0%) | 0 (0.0%) |
| Health Diagnosing & Treating | 0 (0.0%) | 14 (100.0%) |
| Health Technologists | 0 (0.0%) | 0 (0.0%) |
| Total (Category) | 24 (27.3%) | 64 (72.7%) |
| Total (Overall) | 345 (56.2%) | 269 (43.8%) |
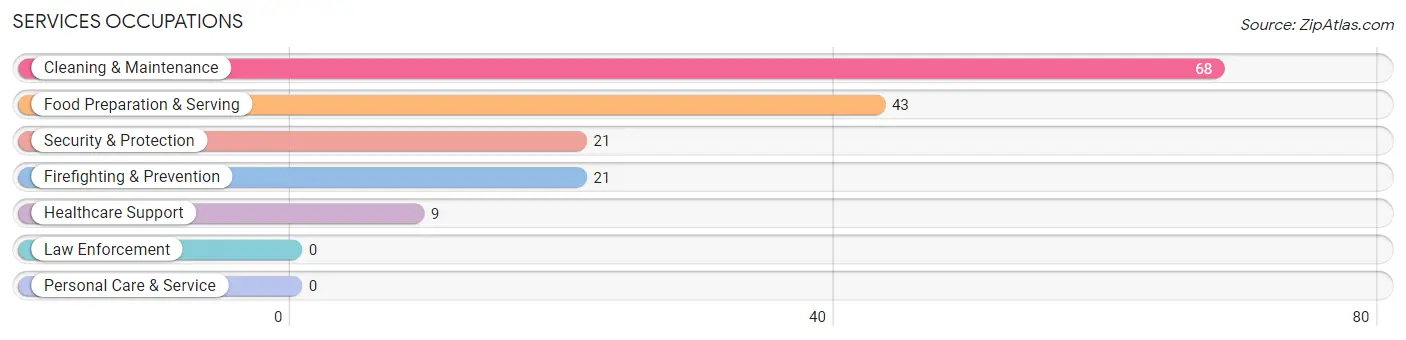
Services Occupations
The most common Services occupations in Graysville are Cleaning & Maintenance (68 | 11.1%), Food Preparation & Serving (43 | 7.0%), Security & Protection (21 | 3.4%), Firefighting & Prevention (21 | 3.4%), and Healthcare Support (9 | 1.5%).
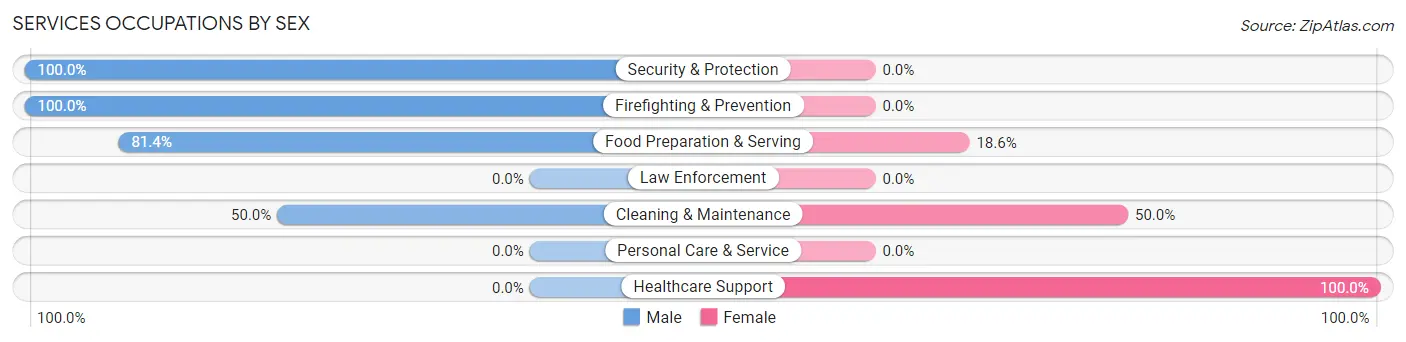
Services Occupations by Sex
Within the Services occupations in Graysville, the most male-oriented occupations are Security & Protection (100.0%), Firefighting & Prevention (100.0%), and Food Preparation & Serving (81.4%), while the most female-oriented occupations are Healthcare Support (100.0%), Cleaning & Maintenance (50.0%), and Food Preparation & Serving (18.6%).
| Occupation | Male | Female |
| Healthcare Support | 0 (0.0%) | 9 (100.0%) |
| Security & Protection | 21 (100.0%) | 0 (0.0%) |
| Firefighting & Prevention | 21 (100.0%) | 0 (0.0%) |
| Law Enforcement | 0 (0.0%) | 0 (0.0%) |
| Food Preparation & Serving | 35 (81.4%) | 8 (18.6%) |
| Cleaning & Maintenance | 34 (50.0%) | 34 (50.0%) |
| Personal Care & Service | 0 (0.0%) | 0 (0.0%) |
| Total (Category) | 90 (63.8%) | 51 (36.2%) |
| Total (Overall) | 345 (56.2%) | 269 (43.8%) |
Sales and Office Occupations
The most common Sales and Office occupations in Graysville are Sales & Related (51 | 8.3%), and Office & Administration (40 | 6.5%).
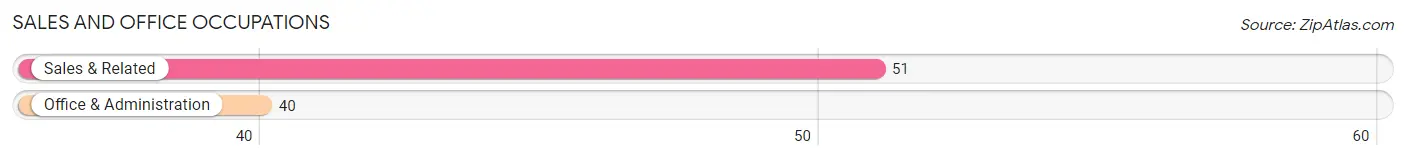
Sales and Office Occupations by Sex
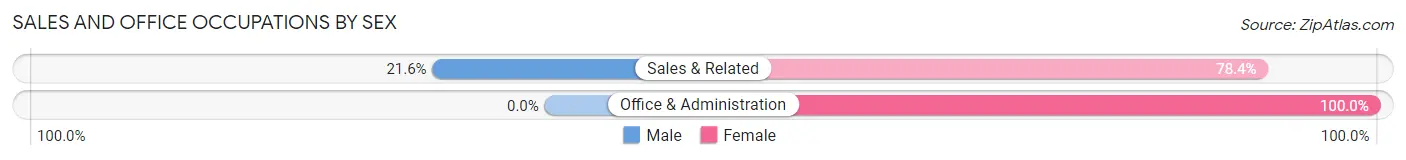
| Occupation | Male | Female |
| Sales & Related | 11 (21.6%) | 40 (78.4%) |
| Office & Administration | 0 (0.0%) | 40 (100.0%) |
| Total (Category) | 11 (12.1%) | 80 (87.9%) |
| Total (Overall) | 345 (56.2%) | 269 (43.8%) |
Natural Resources, Construction and Maintenance Occupations
The most common Natural Resources, Construction and Maintenance occupations in Graysville are Construction & Extraction (72 | 11.7%), and Installation, Maintenance & Repair (41 | 6.7%).
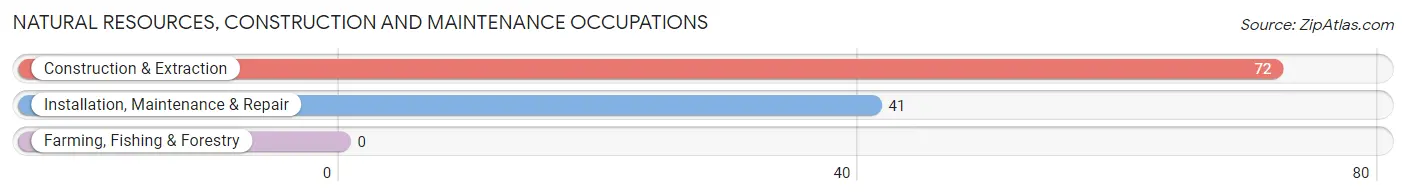
Natural Resources, Construction and Maintenance Occupations by Sex
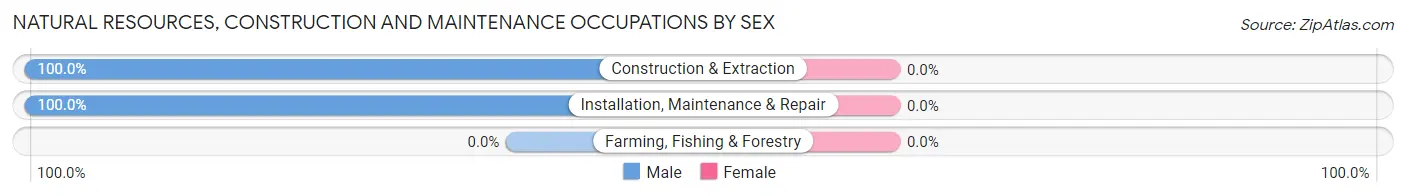
| Occupation | Male | Female |
| Farming, Fishing & Forestry | 0 (0.0%) | 0 (0.0%) |
| Construction & Extraction | 72 (100.0%) | 0 (0.0%) |
| Installation, Maintenance & Repair | 41 (100.0%) | 0 (0.0%) |
| Total (Category) | 113 (100.0%) | 0 (0.0%) |
| Total (Overall) | 345 (56.2%) | 269 (43.8%) |
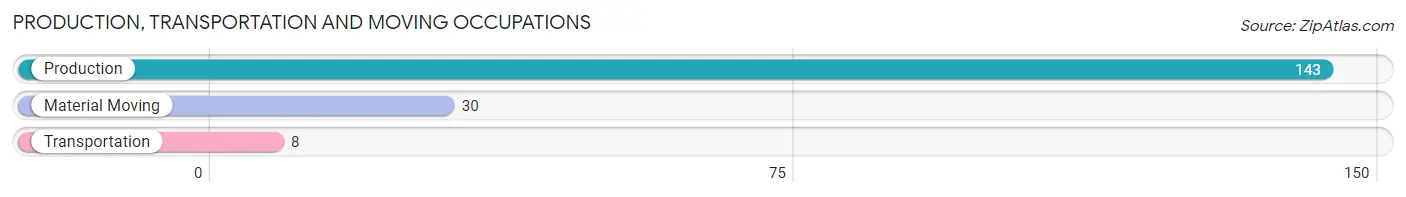
Production, Transportation and Moving Occupations
The most common Production, Transportation and Moving occupations in Graysville are Production (143 | 23.3%), Material Moving (30 | 4.9%), and Transportation (8 | 1.3%).
Production, Transportation and Moving Occupations by Sex
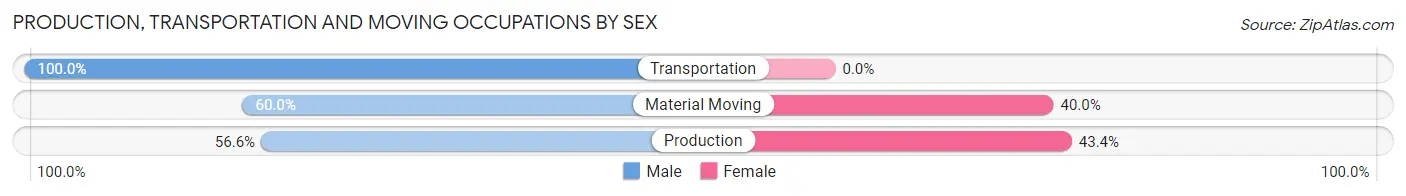
| Occupation | Male | Female |
| Production | 81 (56.6%) | 62 (43.4%) |
| Transportation | 8 (100.0%) | 0 (0.0%) |
| Material Moving | 18 (60.0%) | 12 (40.0%) |
| Total (Category) | 107 (59.1%) | 74 (40.9%) |
| Total (Overall) | 345 (56.2%) | 269 (43.8%) |
Employment Industries by Sex in Graysville
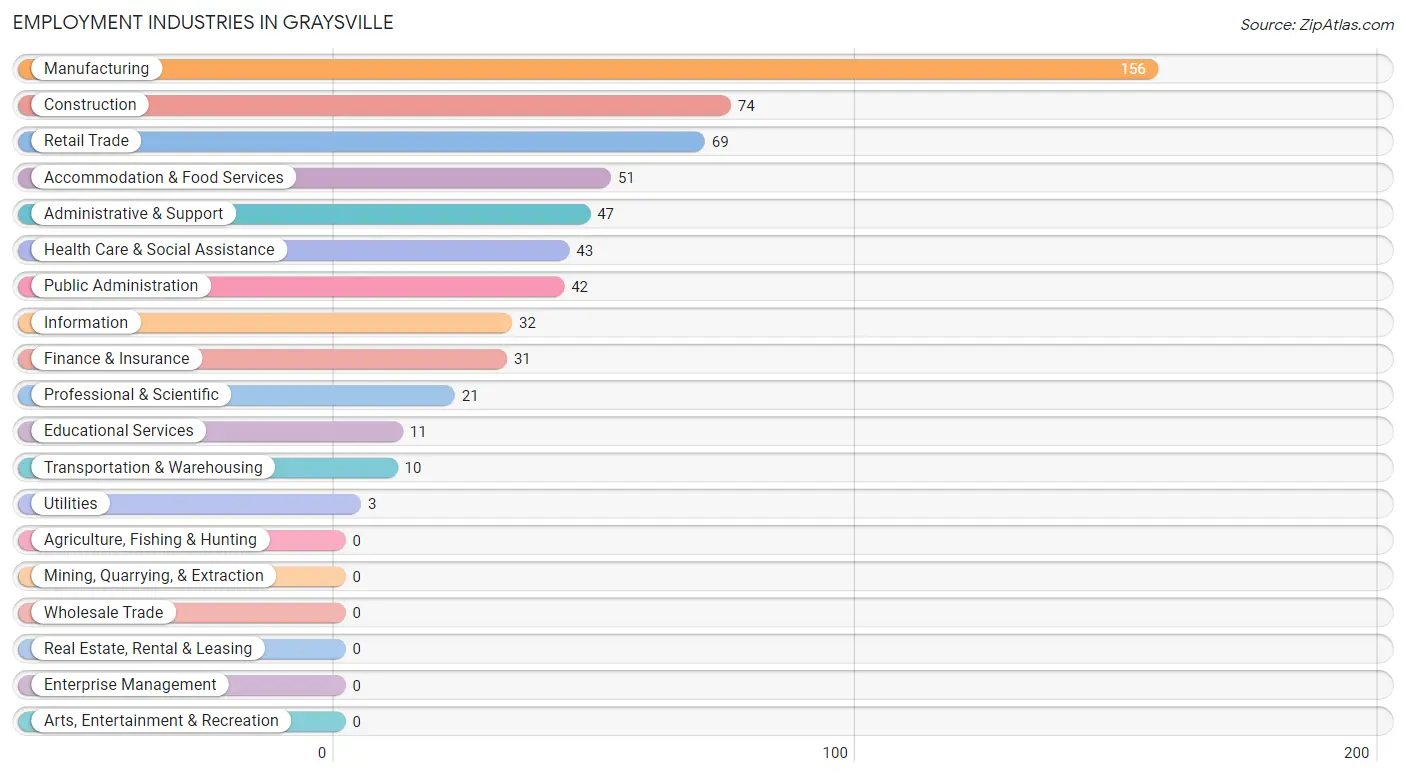
Employment Industries in Graysville
The major employment industries in Graysville include Manufacturing (156 | 25.4%), Construction (74 | 12.0%), Retail Trade (69 | 11.2%), Accommodation & Food Services (51 | 8.3%), and Administrative & Support (47 | 7.6%).
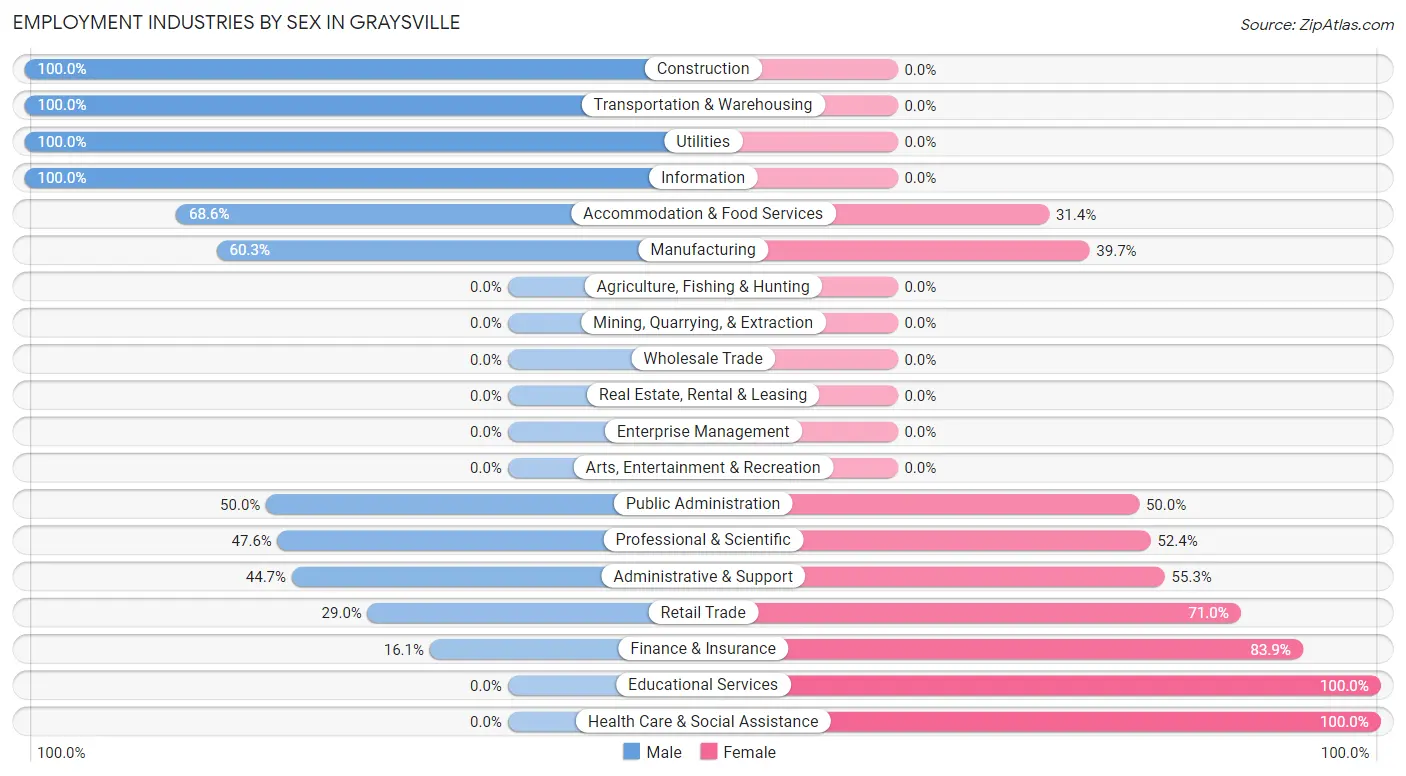
Employment Industries by Sex in Graysville
The Graysville industries that see more men than women are Construction (100.0%), Transportation & Warehousing (100.0%), and Utilities (100.0%), whereas the industries that tend to have a higher number of women are Educational Services (100.0%), Health Care & Social Assistance (100.0%), and Finance & Insurance (83.9%).
| Industry | Male | Female |
| Agriculture, Fishing & Hunting | 0 (0.0%) | 0 (0.0%) |
| Mining, Quarrying, & Extraction | 0 (0.0%) | 0 (0.0%) |
| Construction | 74 (100.0%) | 0 (0.0%) |
| Manufacturing | 94 (60.3%) | 62 (39.7%) |
| Wholesale Trade | 0 (0.0%) | 0 (0.0%) |
| Retail Trade | 20 (29.0%) | 49 (71.0%) |
| Transportation & Warehousing | 10 (100.0%) | 0 (0.0%) |
| Utilities | 3 (100.0%) | 0 (0.0%) |
| Information | 32 (100.0%) | 0 (0.0%) |
| Finance & Insurance | 5 (16.1%) | 26 (83.9%) |
| Real Estate, Rental & Leasing | 0 (0.0%) | 0 (0.0%) |
| Professional & Scientific | 10 (47.6%) | 11 (52.4%) |
| Enterprise Management | 0 (0.0%) | 0 (0.0%) |
| Administrative & Support | 21 (44.7%) | 26 (55.3%) |
| Educational Services | 0 (0.0%) | 11 (100.0%) |
| Health Care & Social Assistance | 0 (0.0%) | 43 (100.0%) |
| Arts, Entertainment & Recreation | 0 (0.0%) | 0 (0.0%) |
| Accommodation & Food Services | 35 (68.6%) | 16 (31.4%) |
| Public Administration | 21 (50.0%) | 21 (50.0%) |
| Total | 345 (56.2%) | 269 (43.8%) |
Education in Graysville
School Enrollment in Graysville
The most common levels of schooling among the 351 students in Graysville are elementary school (107 | 30.5%), high school (105 | 29.9%), and middle school (85 | 24.2%).
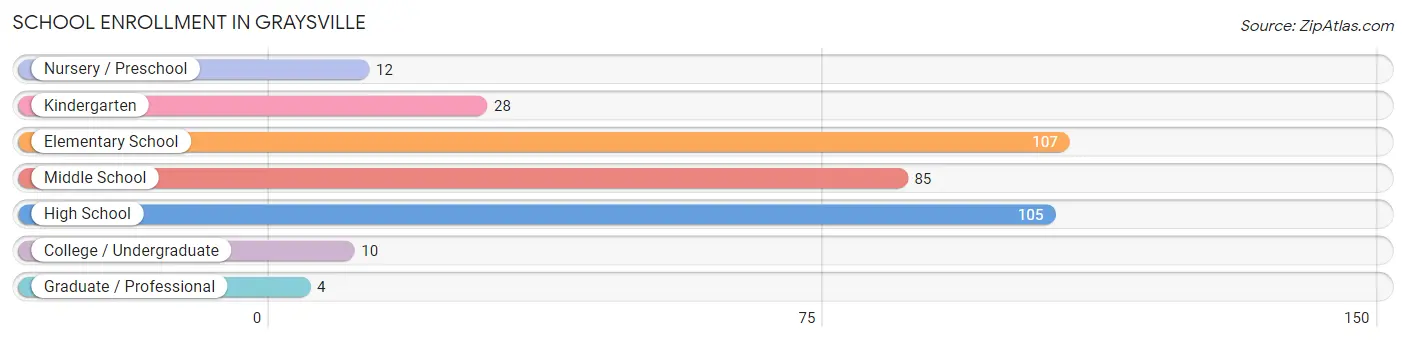
| School Level | # Students | % Students |
| Nursery / Preschool | 12 | 3.4% |
| Kindergarten | 28 | 8.0% |
| Elementary School | 107 | 30.5% |
| Middle School | 85 | 24.2% |
| High School | 105 | 29.9% |
| College / Undergraduate | 10 | 2.9% |
| Graduate / Professional | 4 | 1.1% |
| Total | 351 | 100.0% |
School Enrollment by Age by Funding Source in Graysville
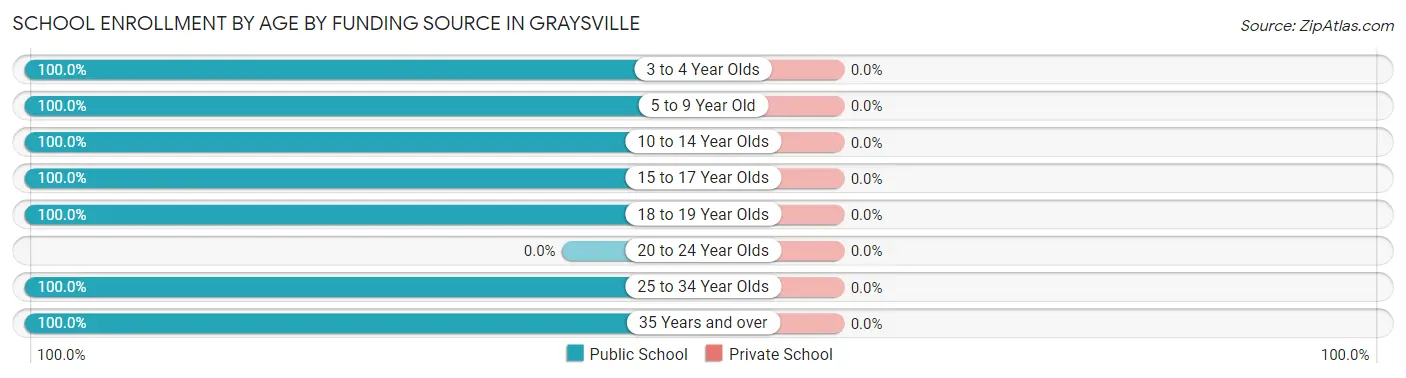
| Age Bracket | Public School | Private School |
| 3 to 4 Year Olds | 12 (100.0%) | 0 (0.0%) |
| 5 to 9 Year Old | 117 (100.0%) | 0 (0.0%) |
| 10 to 14 Year Olds | 113 (100.0%) | 0 (0.0%) |
| 15 to 17 Year Olds | 75 (100.0%) | 0 (0.0%) |
| 18 to 19 Year Olds | 23 (100.0%) | 0 (0.0%) |
| 20 to 24 Year Olds | 0 (0.0%) | 0 (0.0%) |
| 25 to 34 Year Olds | 7 (100.0%) | 0 (0.0%) |
| 35 Years and over | 4 (100.0%) | 0 (0.0%) |
| Total | 351 (100.0%) | 0 (0.0%) |
Educational Attainment by Field of Study in Graysville
Bio, nature & agricultural (23 | 20.2%), liberal arts & history (21 | 18.4%), engineering (12 | 10.5%), computers & mathematics (10 | 8.8%), and education (10 | 8.8%) are the most common fields of study among 114 individuals in Graysville who have obtained a bachelor's degree or higher.
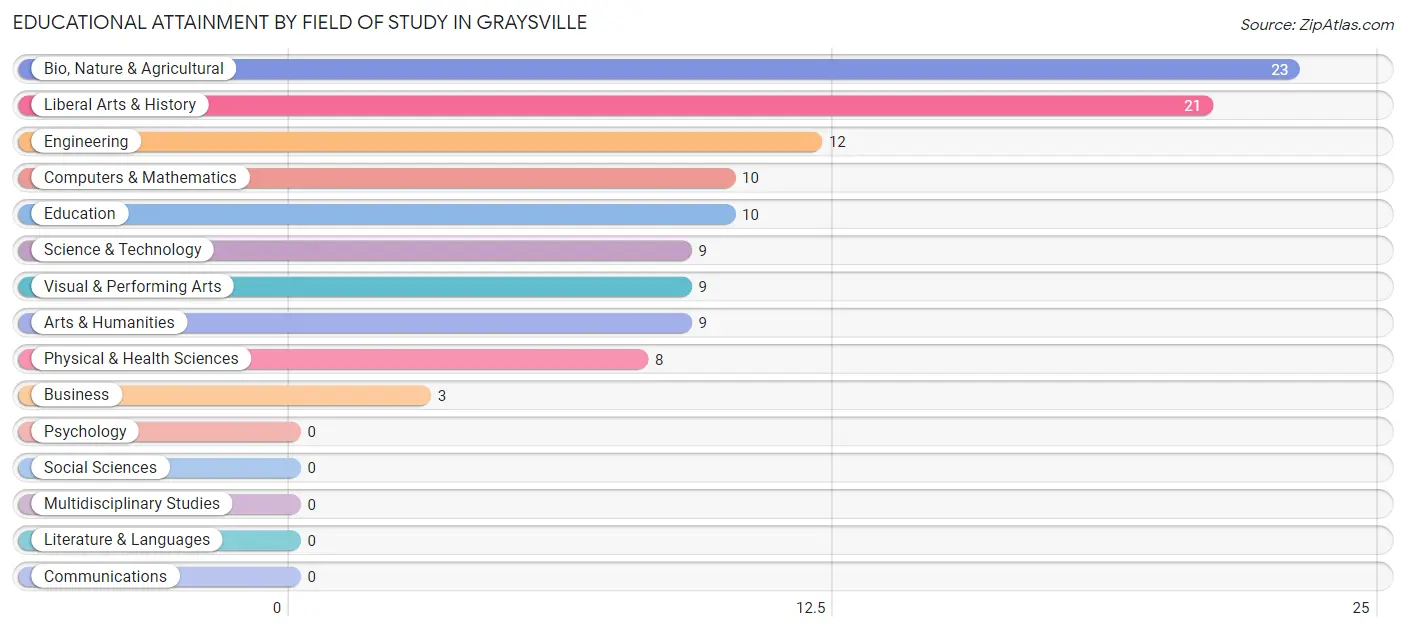
| Field of Study | # Graduates | % Graduates |
| Computers & Mathematics | 10 | 8.8% |
| Bio, Nature & Agricultural | 23 | 20.2% |
| Physical & Health Sciences | 8 | 7.0% |
| Psychology | 0 | 0.0% |
| Social Sciences | 0 | 0.0% |
| Engineering | 12 | 10.5% |
| Multidisciplinary Studies | 0 | 0.0% |
| Science & Technology | 9 | 7.9% |
| Business | 3 | 2.6% |
| Education | 10 | 8.8% |
| Literature & Languages | 0 | 0.0% |
| Liberal Arts & History | 21 | 18.4% |
| Visual & Performing Arts | 9 | 7.9% |
| Communications | 0 | 0.0% |
| Arts & Humanities | 9 | 7.9% |
| Total | 114 | 100.0% |
Transportation & Commute in Graysville
Vehicle Availability by Sex in Graysville
The most prevalent vehicle ownership categories in Graysville are males with 2 vehicles (195, accounting for 57.7%) and females with 2 vehicles (158, making up 72.5%).
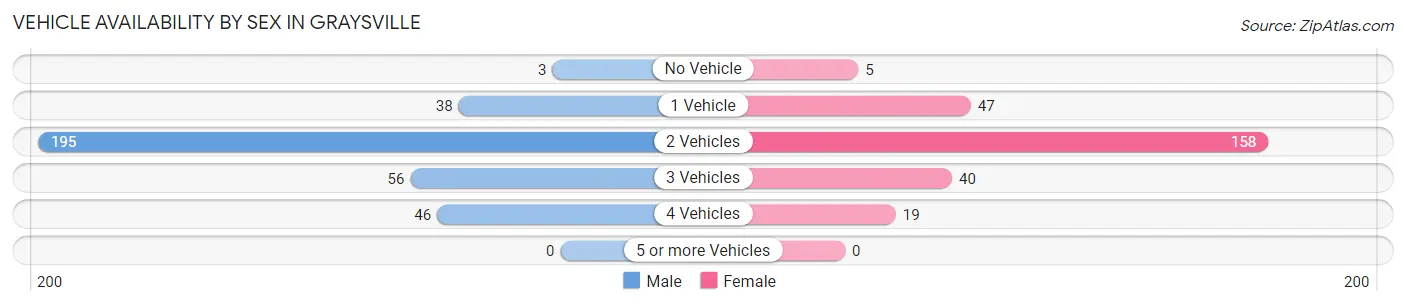
| Vehicles Available | Male | Female |
| No Vehicle | 3 (0.9%) | 5 (1.9%) |
| 1 Vehicle | 38 (11.2%) | 47 (17.5%) |
| 2 Vehicles | 195 (57.7%) | 158 (58.7%) |
| 3 Vehicles | 56 (16.6%) | 40 (14.9%) |
| 4 Vehicles | 46 (13.6%) | 19 (7.1%) |
| 5 or more Vehicles | 0 (0.0%) | 0 (0.0%) |
| Total | 338 (100.0%) | 269 (100.0%) |
Commute Time in Graysville
The most frequently occuring commute durations in Graysville are 10 to 14 minutes (123 commuters, 22.1%), 15 to 19 minutes (110 commuters, 19.8%), and 45 to 59 minutes (102 commuters, 18.3%).
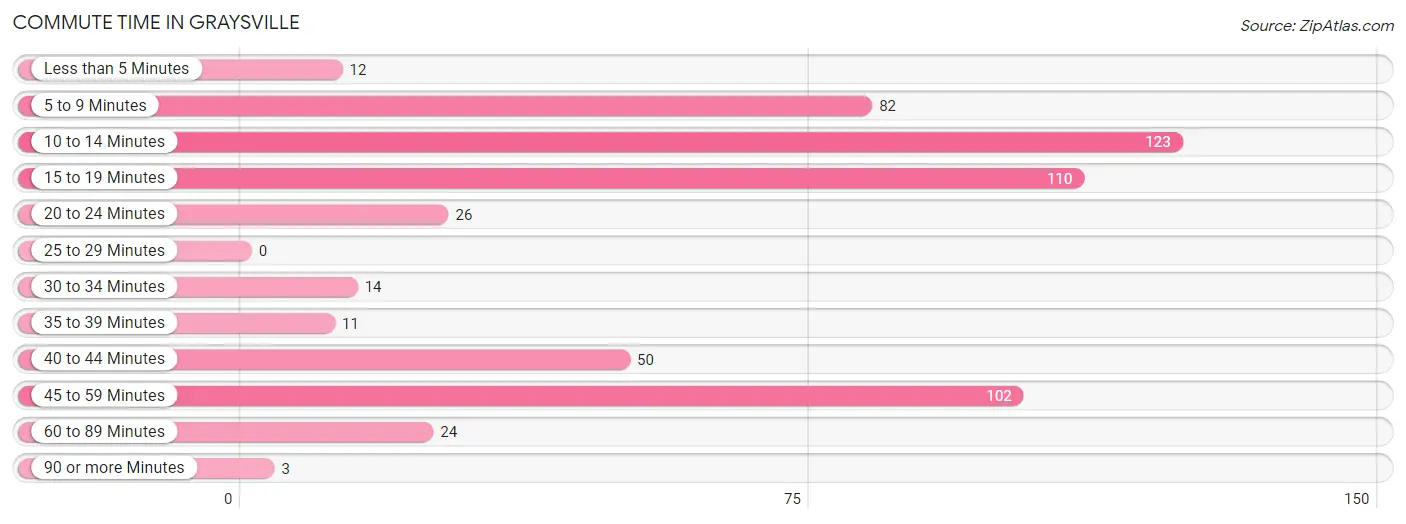
| Commute Time | # Commuters | % Commuters |
| Less than 5 Minutes | 12 | 2.1% |
| 5 to 9 Minutes | 82 | 14.7% |
| 10 to 14 Minutes | 123 | 22.1% |
| 15 to 19 Minutes | 110 | 19.8% |
| 20 to 24 Minutes | 26 | 4.7% |
| 25 to 29 Minutes | 0 | 0.0% |
| 30 to 34 Minutes | 14 | 2.5% |
| 35 to 39 Minutes | 11 | 2.0% |
| 40 to 44 Minutes | 50 | 9.0% |
| 45 to 59 Minutes | 102 | 18.3% |
| 60 to 89 Minutes | 24 | 4.3% |
| 90 or more Minutes | 3 | 0.5% |
Commute Time by Sex in Graysville
The most common commute times in Graysville are 45 to 59 minutes (72 commuters, 21.3%) for males and 10 to 14 minutes (54 commuters, 24.7%) for females.
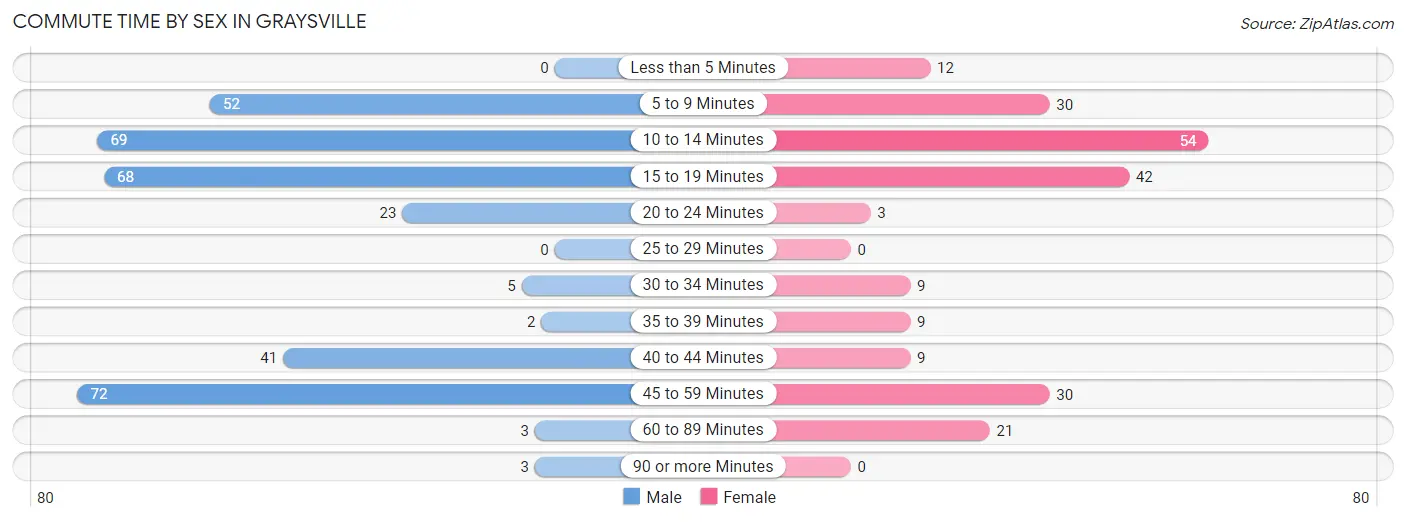
| Commute Time | Male | Female |
| Less than 5 Minutes | 0 (0.0%) | 12 (5.5%) |
| 5 to 9 Minutes | 52 (15.4%) | 30 (13.7%) |
| 10 to 14 Minutes | 69 (20.4%) | 54 (24.7%) |
| 15 to 19 Minutes | 68 (20.1%) | 42 (19.2%) |
| 20 to 24 Minutes | 23 (6.8%) | 3 (1.4%) |
| 25 to 29 Minutes | 0 (0.0%) | 0 (0.0%) |
| 30 to 34 Minutes | 5 (1.5%) | 9 (4.1%) |
| 35 to 39 Minutes | 2 (0.6%) | 9 (4.1%) |
| 40 to 44 Minutes | 41 (12.1%) | 9 (4.1%) |
| 45 to 59 Minutes | 72 (21.3%) | 30 (13.7%) |
| 60 to 89 Minutes | 3 (0.9%) | 21 (9.6%) |
| 90 or more Minutes | 3 (0.9%) | 0 (0.0%) |
Time of Departure to Work by Sex in Graysville
The most frequent times of departure to work in Graysville are 7:00 AM to 7:29 AM (54, 16.0%) for males and 6:30 AM to 6:59 AM (55, 25.1%) for females.
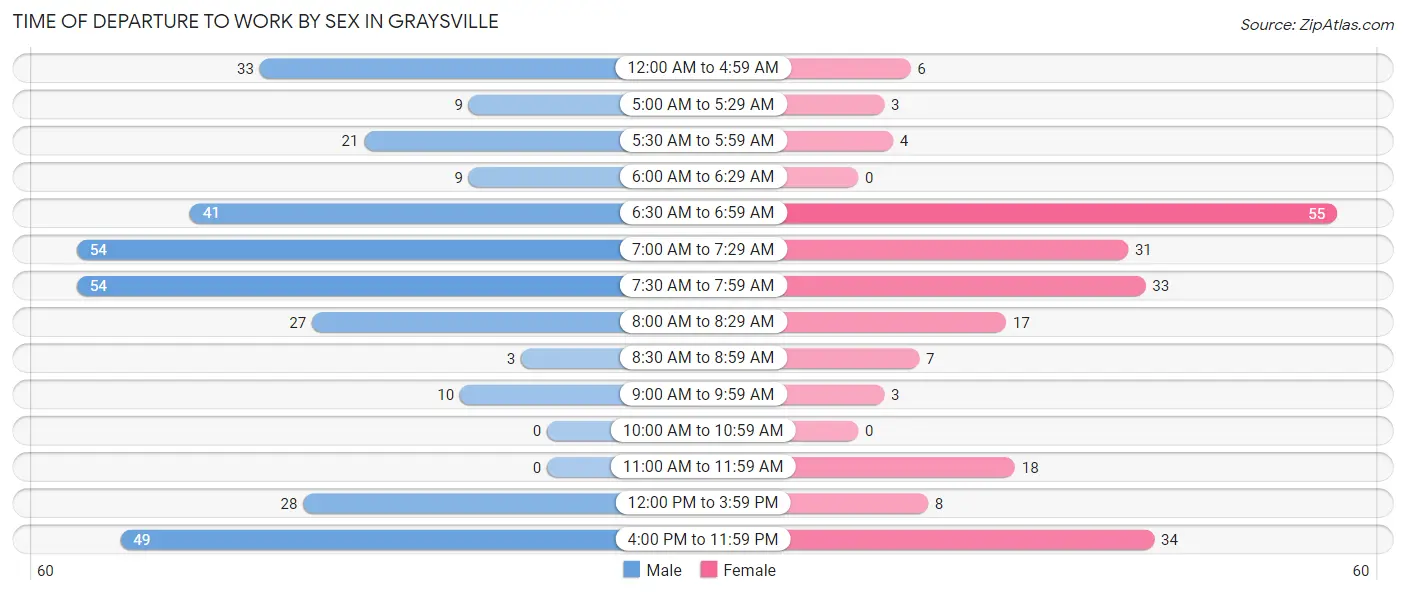
| Time of Departure | Male | Female |
| 12:00 AM to 4:59 AM | 33 (9.8%) | 6 (2.7%) |
| 5:00 AM to 5:29 AM | 9 (2.7%) | 3 (1.4%) |
| 5:30 AM to 5:59 AM | 21 (6.2%) | 4 (1.8%) |
| 6:00 AM to 6:29 AM | 9 (2.7%) | 0 (0.0%) |
| 6:30 AM to 6:59 AM | 41 (12.1%) | 55 (25.1%) |
| 7:00 AM to 7:29 AM | 54 (16.0%) | 31 (14.2%) |
| 7:30 AM to 7:59 AM | 54 (16.0%) | 33 (15.1%) |
| 8:00 AM to 8:29 AM | 27 (8.0%) | 17 (7.8%) |
| 8:30 AM to 8:59 AM | 3 (0.9%) | 7 (3.2%) |
| 9:00 AM to 9:59 AM | 10 (3.0%) | 3 (1.4%) |
| 10:00 AM to 10:59 AM | 0 (0.0%) | 0 (0.0%) |
| 11:00 AM to 11:59 AM | 0 (0.0%) | 18 (8.2%) |
| 12:00 PM to 3:59 PM | 28 (8.3%) | 8 (3.6%) |
| 4:00 PM to 11:59 PM | 49 (14.5%) | 34 (15.5%) |
| Total | 338 (100.0%) | 219 (100.0%) |
Housing Occupancy in Graysville
Occupancy by Ownership in Graysville
Of the total 577 dwellings in Graysville, owner-occupied units account for 322 (55.8%), while renter-occupied units make up 255 (44.2%).
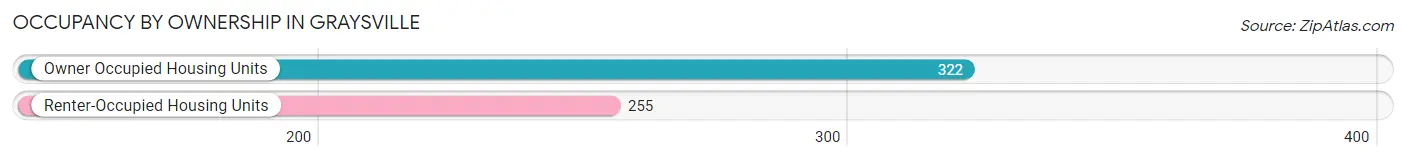
| Occupancy | # Housing Units | % Housing Units |
| Owner Occupied Housing Units | 322 | 55.8% |
| Renter-Occupied Housing Units | 255 | 44.2% |
| Total Occupied Housing Units | 577 | 100.0% |
Occupancy by Household Size in Graysville
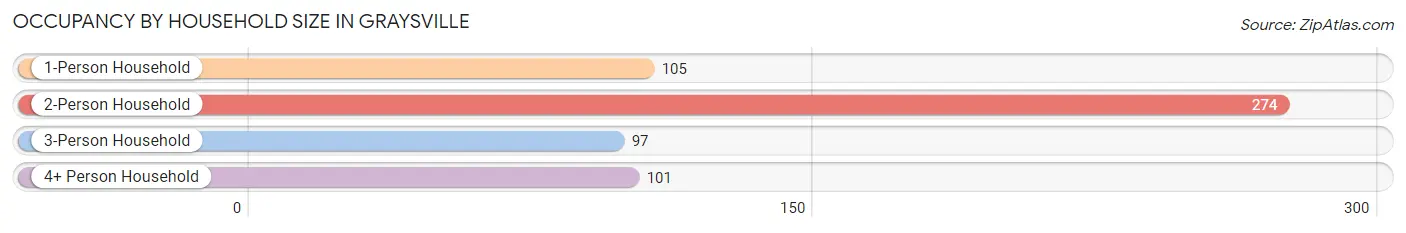
| Household Size | # Housing Units | % Housing Units |
| 1-Person Household | 105 | 18.2% |
| 2-Person Household | 274 | 47.5% |
| 3-Person Household | 97 | 16.8% |
| 4+ Person Household | 101 | 17.5% |
| Total Housing Units | 577 | 100.0% |
Occupancy by Ownership by Household Size in Graysville
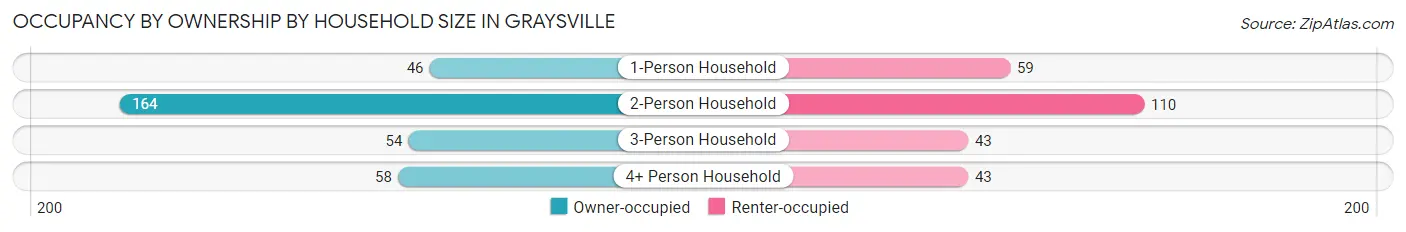
| Household Size | Owner-occupied | Renter-occupied |
| 1-Person Household | 46 (43.8%) | 59 (56.2%) |
| 2-Person Household | 164 (59.9%) | 110 (40.2%) |
| 3-Person Household | 54 (55.7%) | 43 (44.3%) |
| 4+ Person Household | 58 (57.4%) | 43 (42.6%) |
| Total Housing Units | 322 (55.8%) | 255 (44.2%) |
Occupancy by Educational Attainment in Graysville
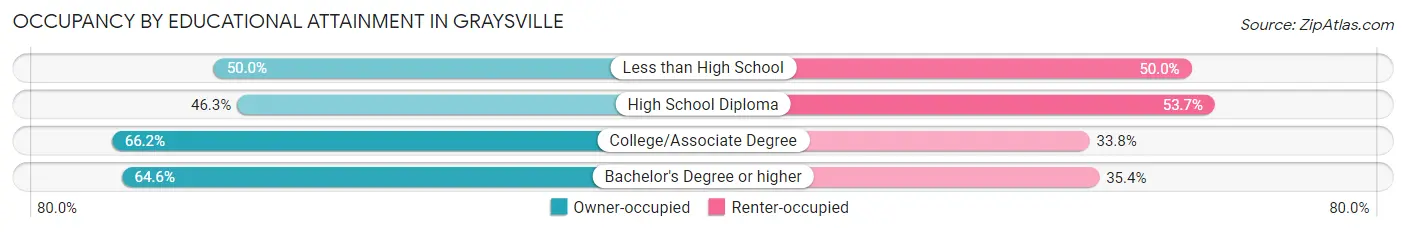
| Household Size | Owner-occupied | Renter-occupied |
| Less than High School | 49 (50.0%) | 49 (50.0%) |
| High School Diploma | 100 (46.3%) | 116 (53.7%) |
| College/Associate Degree | 131 (66.2%) | 67 (33.8%) |
| Bachelor's Degree or higher | 42 (64.6%) | 23 (35.4%) |
Occupancy by Age of Householder in Graysville
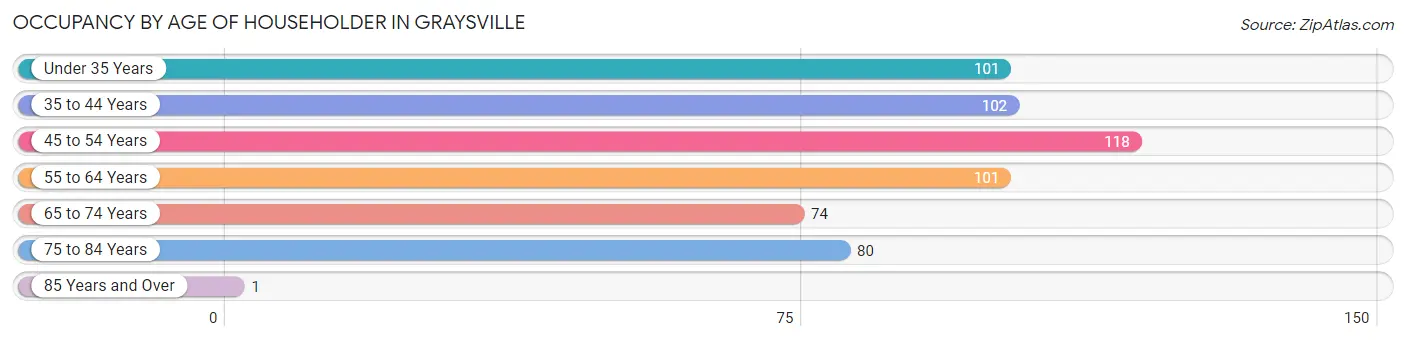
| Age Bracket | # Households | % Households |
| Under 35 Years | 101 | 17.5% |
| 35 to 44 Years | 102 | 17.7% |
| 45 to 54 Years | 118 | 20.4% |
| 55 to 64 Years | 101 | 17.5% |
| 65 to 74 Years | 74 | 12.8% |
| 75 to 84 Years | 80 | 13.9% |
| 85 Years and Over | 1 | 0.2% |
| Total | 577 | 100.0% |
Housing Finances in Graysville
Median Income by Occupancy in Graysville
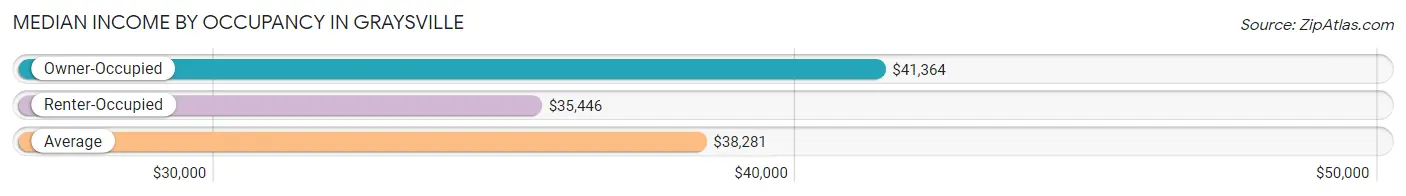
| Occupancy Type | # Households | Median Income |
| Owner-Occupied | 322 (55.8%) | $41,364 |
| Renter-Occupied | 255 (44.2%) | $35,446 |
| Average | 577 (100.0%) | $38,281 |
Occupancy by Householder Income Bracket in Graysville
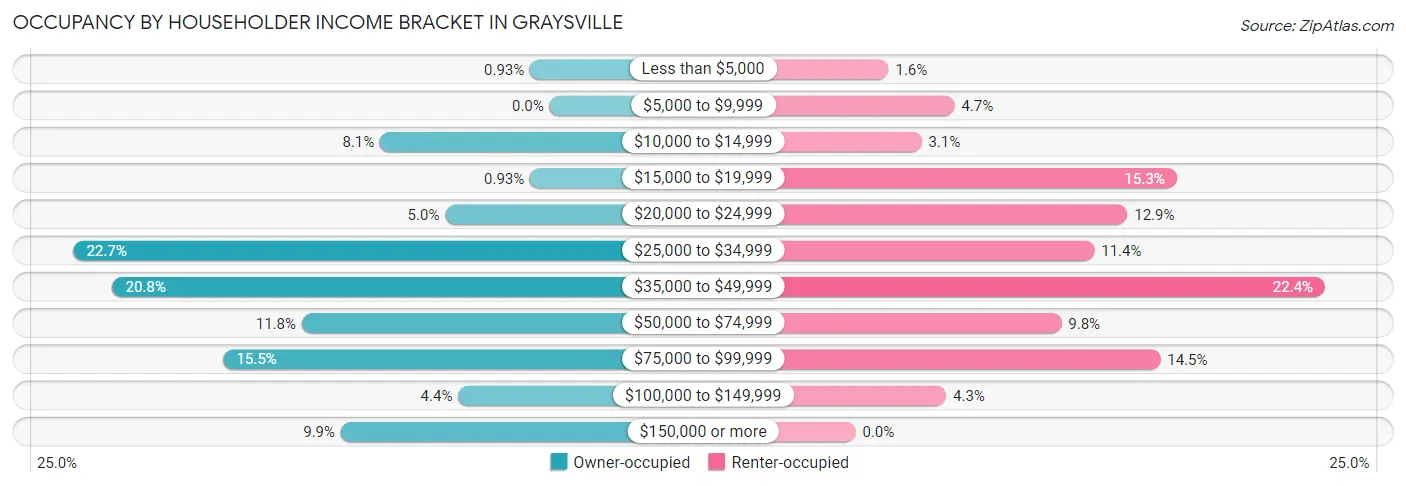
| Income Bracket | Owner-occupied | Renter-occupied |
| Less than $5,000 | 3 (0.9%) | 4 (1.6%) |
| $5,000 to $9,999 | 0 (0.0%) | 12 (4.7%) |
| $10,000 to $14,999 | 26 (8.1%) | 8 (3.1%) |
| $15,000 to $19,999 | 3 (0.9%) | 39 (15.3%) |
| $20,000 to $24,999 | 16 (5.0%) | 33 (12.9%) |
| $25,000 to $34,999 | 73 (22.7%) | 29 (11.4%) |
| $35,000 to $49,999 | 67 (20.8%) | 57 (22.4%) |
| $50,000 to $74,999 | 38 (11.8%) | 25 (9.8%) |
| $75,000 to $99,999 | 50 (15.5%) | 37 (14.5%) |
| $100,000 to $149,999 | 14 (4.3%) | 11 (4.3%) |
| $150,000 or more | 32 (9.9%) | 0 (0.0%) |
| Total | 322 (100.0%) | 255 (100.0%) |
Monthly Housing Cost Tiers in Graysville
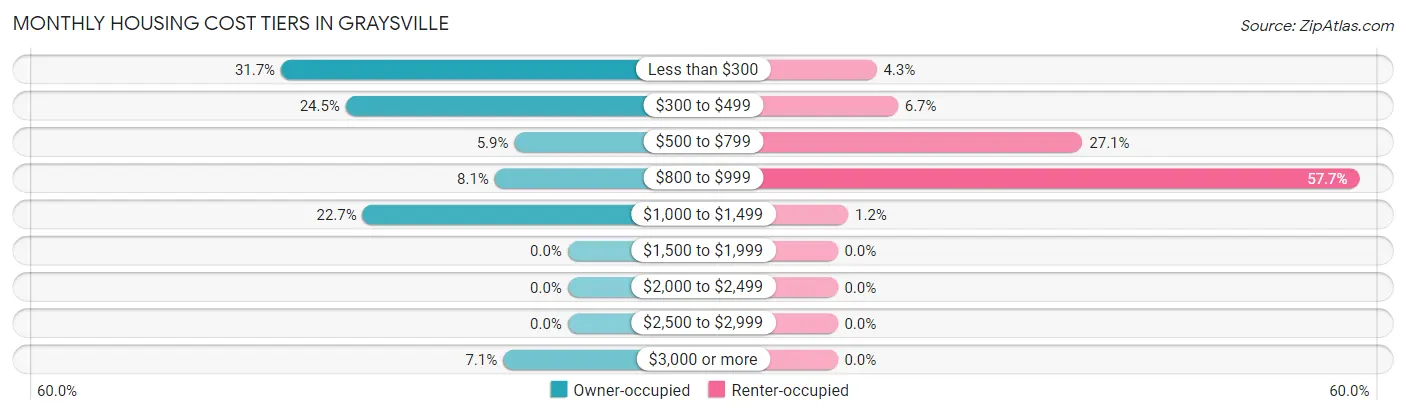
| Monthly Cost | Owner-occupied | Renter-occupied |
| Less than $300 | 102 (31.7%) | 11 (4.3%) |
| $300 to $499 | 79 (24.5%) | 17 (6.7%) |
| $500 to $799 | 19 (5.9%) | 69 (27.1%) |
| $800 to $999 | 26 (8.1%) | 147 (57.7%) |
| $1,000 to $1,499 | 73 (22.7%) | 3 (1.2%) |
| $1,500 to $1,999 | 0 (0.0%) | 0 (0.0%) |
| $2,000 to $2,499 | 0 (0.0%) | 0 (0.0%) |
| $2,500 to $2,999 | 0 (0.0%) | 0 (0.0%) |
| $3,000 or more | 23 (7.1%) | 0 (0.0%) |
| Total | 322 (100.0%) | 255 (100.0%) |
Physical Housing Characteristics in Graysville
Housing Structures in Graysville
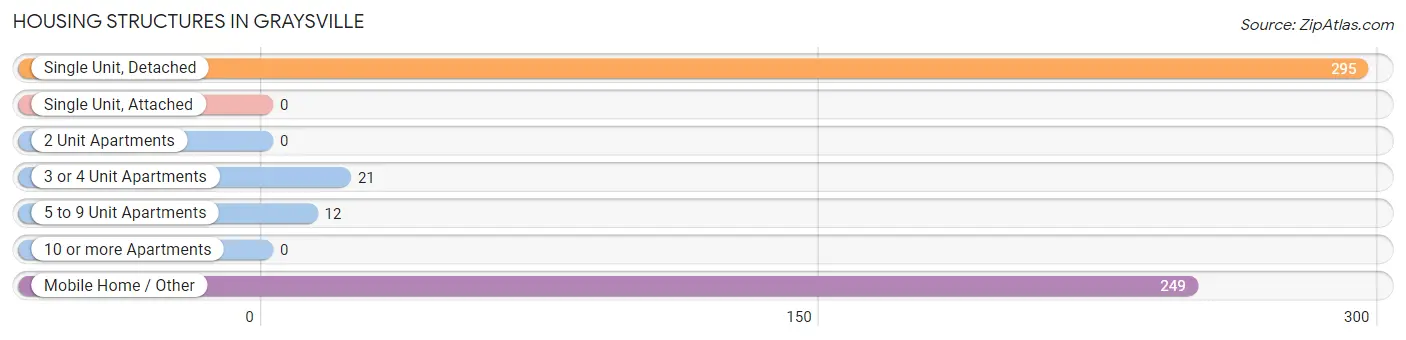
| Structure Type | # Housing Units | % Housing Units |
| Single Unit, Detached | 295 | 51.1% |
| Single Unit, Attached | 0 | 0.0% |
| 2 Unit Apartments | 0 | 0.0% |
| 3 or 4 Unit Apartments | 21 | 3.6% |
| 5 to 9 Unit Apartments | 12 | 2.1% |
| 10 or more Apartments | 0 | 0.0% |
| Mobile Home / Other | 249 | 43.1% |
| Total | 577 | 100.0% |
Housing Structures by Occupancy in Graysville
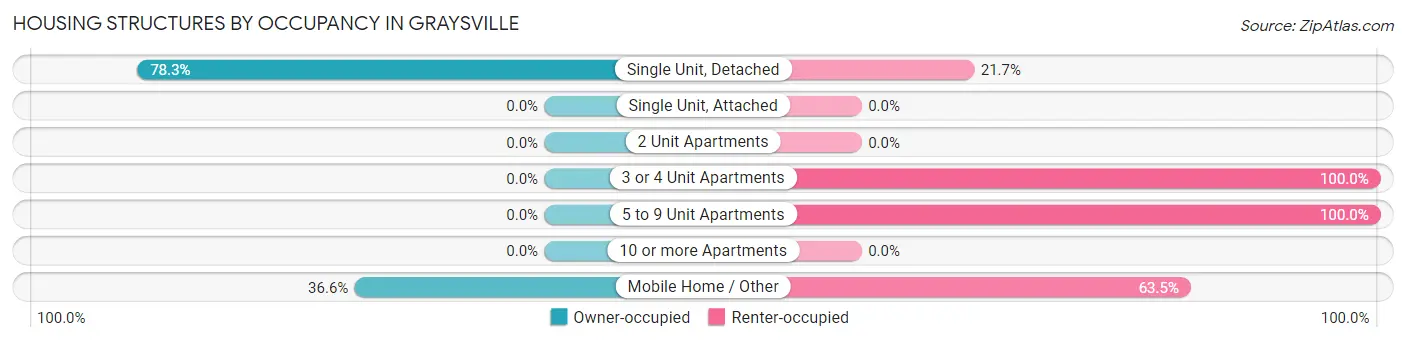
| Structure Type | Owner-occupied | Renter-occupied |
| Single Unit, Detached | 231 (78.3%) | 64 (21.7%) |
| Single Unit, Attached | 0 (0.0%) | 0 (0.0%) |
| 2 Unit Apartments | 0 (0.0%) | 0 (0.0%) |
| 3 or 4 Unit Apartments | 0 (0.0%) | 21 (100.0%) |
| 5 to 9 Unit Apartments | 0 (0.0%) | 12 (100.0%) |
| 10 or more Apartments | 0 (0.0%) | 0 (0.0%) |
| Mobile Home / Other | 91 (36.5%) | 158 (63.4%) |
| Total | 322 (55.8%) | 255 (44.2%) |
Housing Structures by Number of Rooms in Graysville
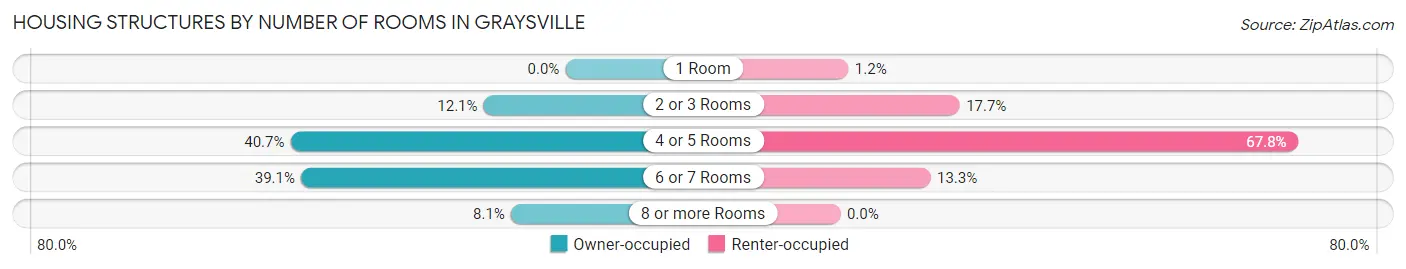
| Number of Rooms | Owner-occupied | Renter-occupied |
| 1 Room | 0 (0.0%) | 3 (1.2%) |
| 2 or 3 Rooms | 39 (12.1%) | 45 (17.6%) |
| 4 or 5 Rooms | 131 (40.7%) | 173 (67.8%) |
| 6 or 7 Rooms | 126 (39.1%) | 34 (13.3%) |
| 8 or more Rooms | 26 (8.1%) | 0 (0.0%) |
| Total | 322 (100.0%) | 255 (100.0%) |
Housing Structure by Heating Type in Graysville
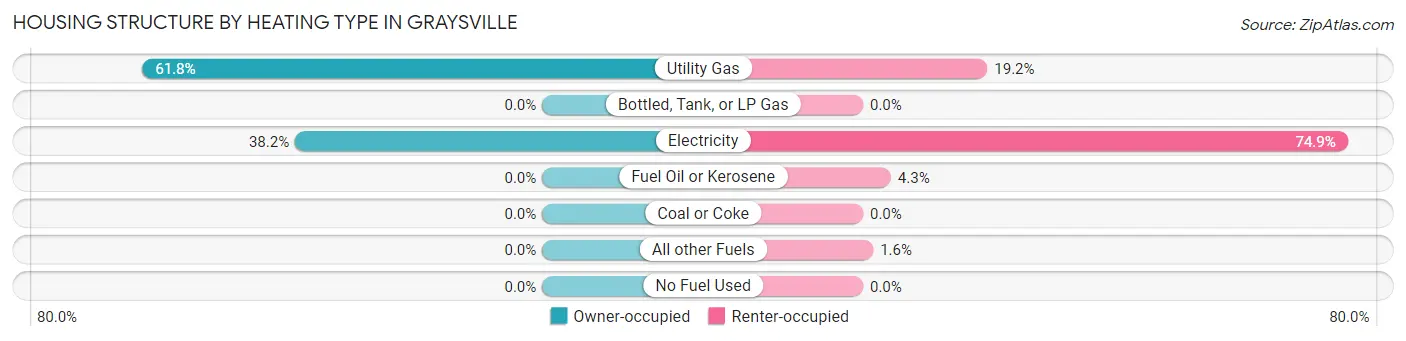
| Heating Type | Owner-occupied | Renter-occupied |
| Utility Gas | 199 (61.8%) | 49 (19.2%) |
| Bottled, Tank, or LP Gas | 0 (0.0%) | 0 (0.0%) |
| Electricity | 123 (38.2%) | 191 (74.9%) |
| Fuel Oil or Kerosene | 0 (0.0%) | 11 (4.3%) |
| Coal or Coke | 0 (0.0%) | 0 (0.0%) |
| All other Fuels | 0 (0.0%) | 4 (1.6%) |
| No Fuel Used | 0 (0.0%) | 0 (0.0%) |
| Total | 322 (100.0%) | 255 (100.0%) |
Household Vehicle Usage in Graysville
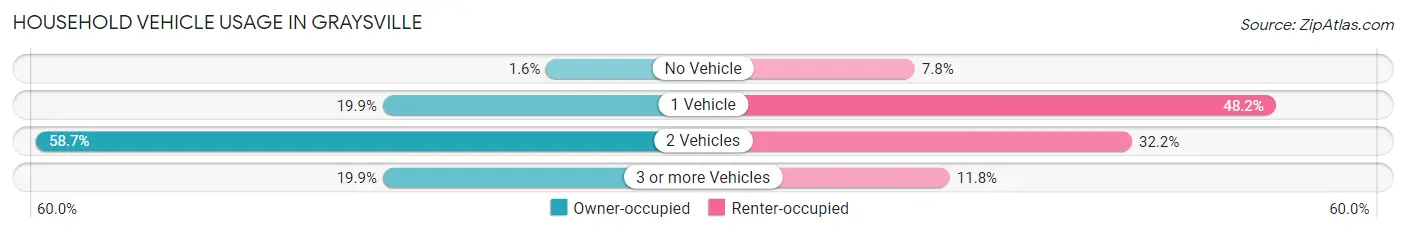
| Vehicles per Household | Owner-occupied | Renter-occupied |
| No Vehicle | 5 (1.5%) | 20 (7.8%) |
| 1 Vehicle | 64 (19.9%) | 123 (48.2%) |
| 2 Vehicles | 189 (58.7%) | 82 (32.2%) |
| 3 or more Vehicles | 64 (19.9%) | 30 (11.8%) |
| Total | 322 (100.0%) | 255 (100.0%) |
Real Estate & Mortgages in Graysville
Real Estate and Mortgage Overview in Graysville
| Characteristic | Without Mortgage | With Mortgage |
| Housing Units | 190 | 132 |
| Median Property Value | $59,300 | $168,800 |
| Median Household Income | $34,375 | $32 |
| Monthly Housing Costs | $287 | $23 |
| Real Estate Taxes | $421 | $0 |
Property Value by Mortgage Status in Graysville
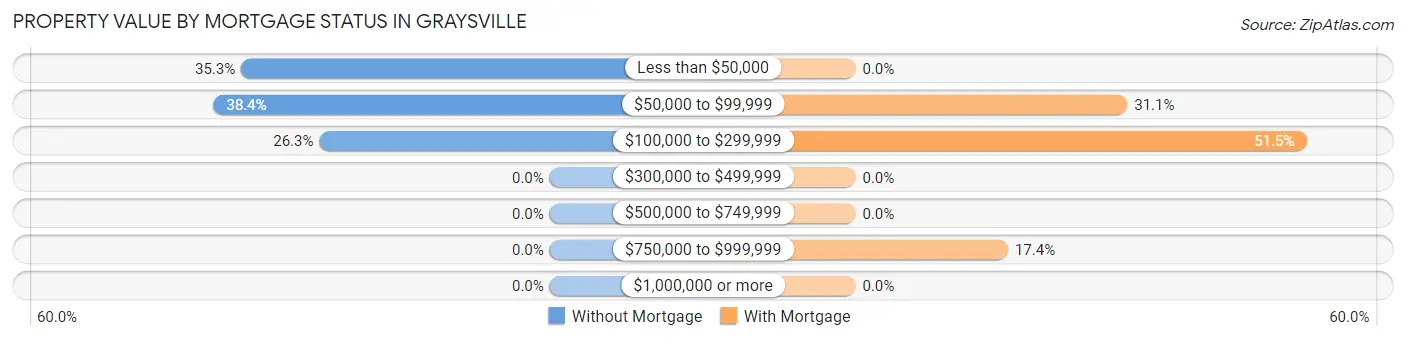
| Property Value | Without Mortgage | With Mortgage |
| Less than $50,000 | 67 (35.3%) | 0 (0.0%) |
| $50,000 to $99,999 | 73 (38.4%) | 41 (31.1%) |
| $100,000 to $299,999 | 50 (26.3%) | 68 (51.5%) |
| $300,000 to $499,999 | 0 (0.0%) | 0 (0.0%) |
| $500,000 to $749,999 | 0 (0.0%) | 0 (0.0%) |
| $750,000 to $999,999 | 0 (0.0%) | 23 (17.4%) |
| $1,000,000 or more | 0 (0.0%) | 0 (0.0%) |
| Total | 190 (100.0%) | 132 (100.0%) |
Household Income by Mortgage Status in Graysville
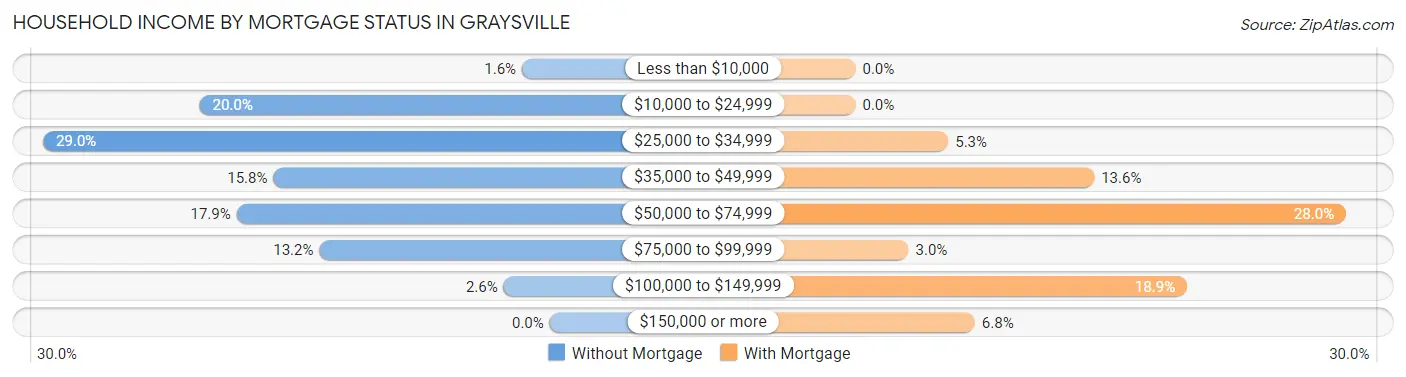
| Household Income | Without Mortgage | With Mortgage |
| Less than $10,000 | 3 (1.6%) | 0 (0.0%) |
| $10,000 to $24,999 | 38 (20.0%) | 0 (0.0%) |
| $25,000 to $34,999 | 55 (28.9%) | 7 (5.3%) |
| $35,000 to $49,999 | 30 (15.8%) | 18 (13.6%) |
| $50,000 to $74,999 | 34 (17.9%) | 37 (28.0%) |
| $75,000 to $99,999 | 25 (13.2%) | 4 (3.0%) |
| $100,000 to $149,999 | 5 (2.6%) | 25 (18.9%) |
| $150,000 or more | 0 (0.0%) | 9 (6.8%) |
| Total | 190 (100.0%) | 132 (100.0%) |
Property Value to Household Income Ratio in Graysville
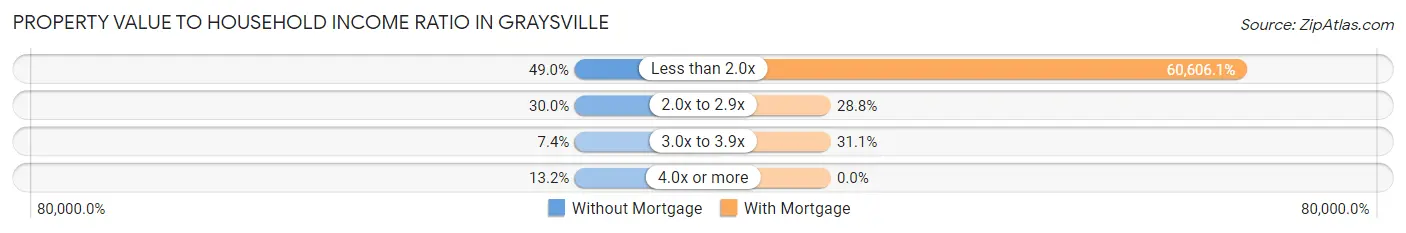
| Value-to-Income Ratio | Without Mortgage | With Mortgage |
| Less than 2.0x | 93 (48.9%) | 80,000 (60,606.1%) |
| 2.0x to 2.9x | 57 (30.0%) | 38 (28.8%) |
| 3.0x to 3.9x | 14 (7.4%) | 41 (31.1%) |
| 4.0x or more | 25 (13.2%) | 0 (0.0%) |
| Total | 190 (100.0%) | 132 (100.0%) |
Real Estate Taxes by Mortgage Status in Graysville
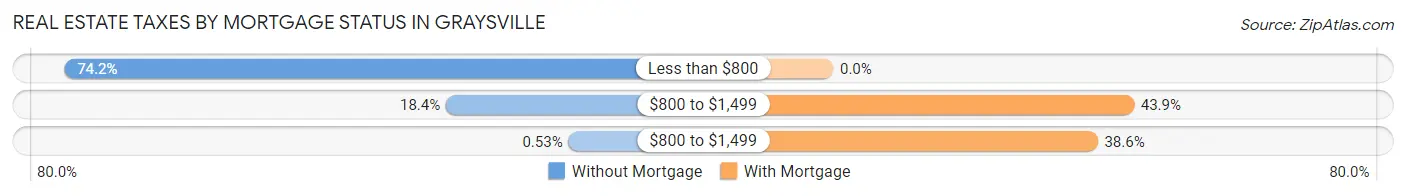
| Property Taxes | Without Mortgage | With Mortgage |
| Less than $800 | 141 (74.2%) | 0 (0.0%) |
| $800 to $1,499 | 35 (18.4%) | 58 (43.9%) |
| $800 to $1,499 | 1 (0.5%) | 51 (38.6%) |
| Total | 190 (100.0%) | 132 (100.0%) |
Health & Disability in Graysville
Health Insurance Coverage by Age in Graysville
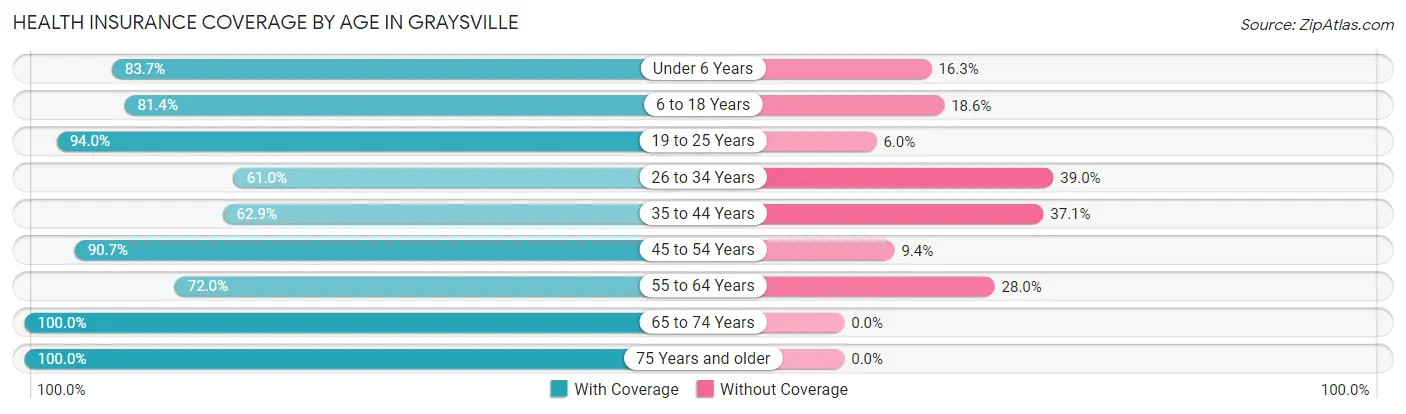
| Age Bracket | With Coverage | Without Coverage |
| Under 6 Years | 103 (83.7%) | 20 (16.3%) |
| 6 to 18 Years | 262 (81.4%) | 60 (18.6%) |
| 19 to 25 Years | 47 (94.0%) | 3 (6.0%) |
| 26 to 34 Years | 122 (61.0%) | 78 (39.0%) |
| 35 to 44 Years | 144 (62.9%) | 85 (37.1%) |
| 45 to 54 Years | 223 (90.6%) | 23 (9.3%) |
| 55 to 64 Years | 113 (72.0%) | 44 (28.0%) |
| 65 to 74 Years | 119 (100.0%) | 0 (0.0%) |
| 75 Years and older | 102 (100.0%) | 0 (0.0%) |
| Total | 1,235 (79.8%) | 313 (20.2%) |
Health Insurance Coverage by Citizenship Status in Graysville
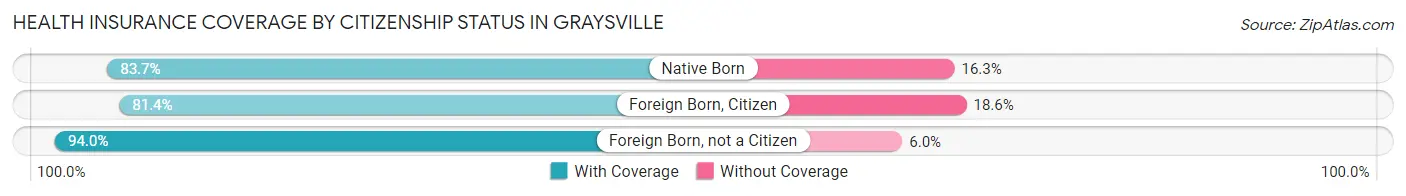
| Citizenship Status | With Coverage | Without Coverage |
| Native Born | 103 (83.7%) | 20 (16.3%) |
| Foreign Born, Citizen | 262 (81.4%) | 60 (18.6%) |
| Foreign Born, not a Citizen | 47 (94.0%) | 3 (6.0%) |
Health Insurance Coverage by Household Income in Graysville
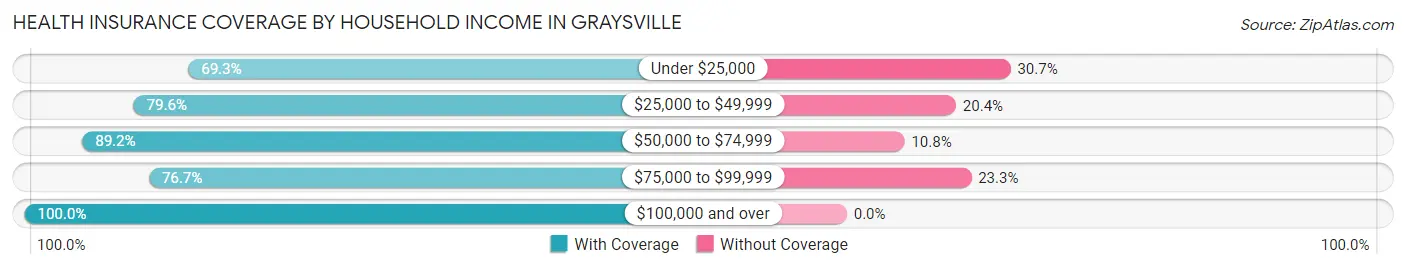
| Household Income | With Coverage | Without Coverage |
| Under $25,000 | 208 (69.3%) | 92 (30.7%) |
| $25,000 to $49,999 | 502 (79.6%) | 129 (20.4%) |
| $50,000 to $74,999 | 132 (89.2%) | 16 (10.8%) |
| $75,000 to $99,999 | 250 (76.7%) | 76 (23.3%) |
| $100,000 and over | 143 (100.0%) | 0 (0.0%) |
Public vs Private Health Insurance Coverage by Age in Graysville
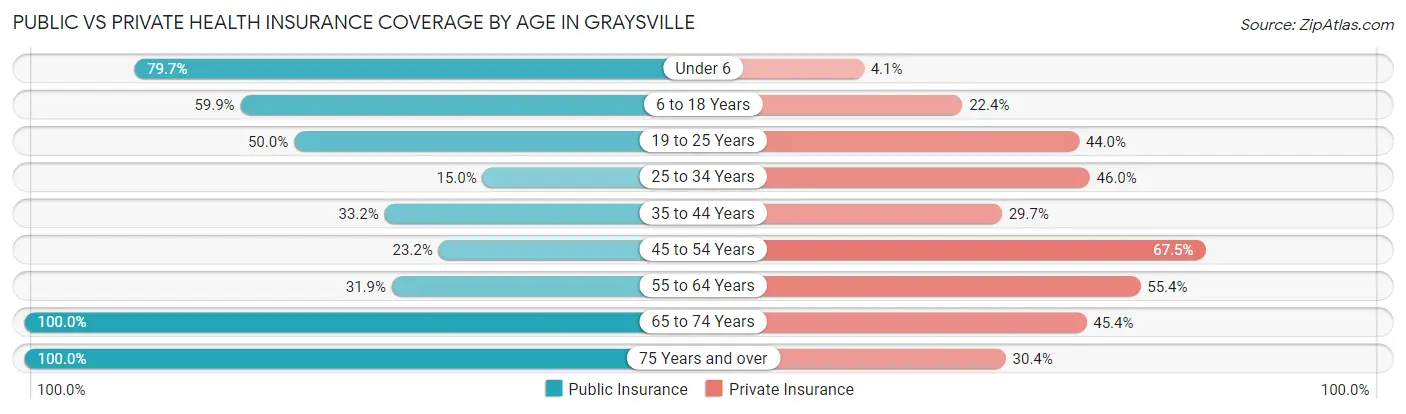
| Age Bracket | Public Insurance | Private Insurance |
| Under 6 | 98 (79.7%) | 5 (4.1%) |
| 6 to 18 Years | 193 (59.9%) | 72 (22.4%) |
| 19 to 25 Years | 25 (50.0%) | 22 (44.0%) |
| 25 to 34 Years | 30 (15.0%) | 92 (46.0%) |
| 35 to 44 Years | 76 (33.2%) | 68 (29.7%) |
| 45 to 54 Years | 57 (23.2%) | 166 (67.5%) |
| 55 to 64 Years | 50 (31.9%) | 87 (55.4%) |
| 65 to 74 Years | 119 (100.0%) | 54 (45.4%) |
| 75 Years and over | 102 (100.0%) | 31 (30.4%) |
| Total | 750 (48.4%) | 597 (38.6%) |
Disability Status by Sex by Age in Graysville
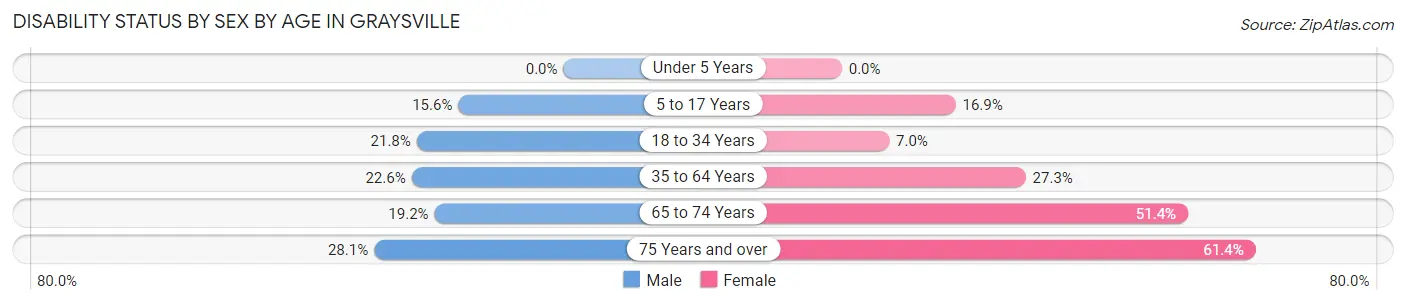
| Age Bracket | Male | Female |
| Under 5 Years | 0 (0.0%) | 0 (0.0%) |
| 5 to 17 Years | 27 (15.6%) | 25 (16.9%) |
| 18 to 34 Years | 34 (21.8%) | 8 (7.0%) |
| 35 to 64 Years | 69 (22.6%) | 89 (27.3%) |
| 65 to 74 Years | 9 (19.2%) | 37 (51.4%) |
| 75 Years and over | 9 (28.1%) | 43 (61.4%) |
Disability Class by Sex by Age in Graysville
Disability Class: Hearing Difficulty
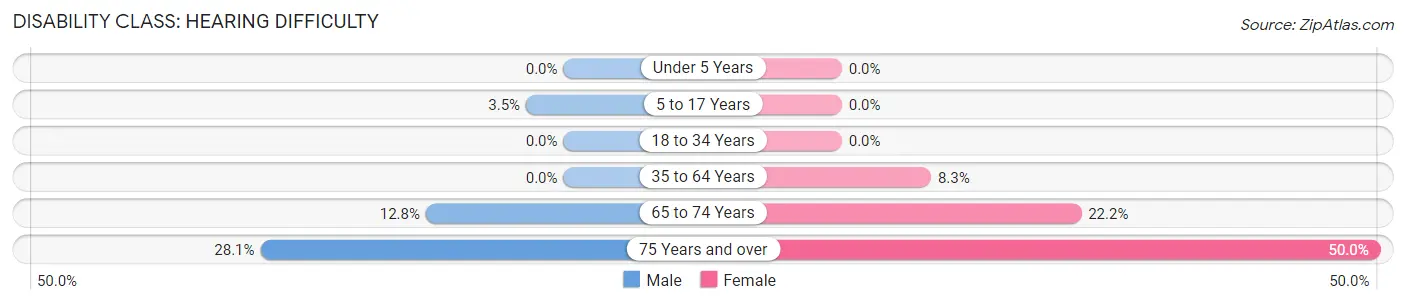
| Age Bracket | Male | Female |
| Under 5 Years | 0 (0.0%) | 0 (0.0%) |
| 5 to 17 Years | 6 (3.5%) | 0 (0.0%) |
| 18 to 34 Years | 0 (0.0%) | 0 (0.0%) |
| 35 to 64 Years | 0 (0.0%) | 27 (8.3%) |
| 65 to 74 Years | 6 (12.8%) | 16 (22.2%) |
| 75 Years and over | 9 (28.1%) | 35 (50.0%) |
Disability Class: Vision Difficulty
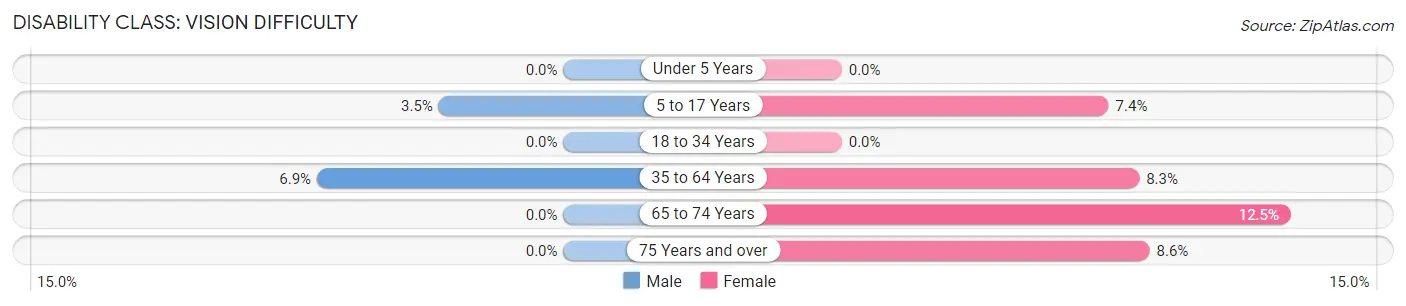
| Age Bracket | Male | Female |
| Under 5 Years | 0 (0.0%) | 0 (0.0%) |
| 5 to 17 Years | 6 (3.5%) | 11 (7.4%) |
| 18 to 34 Years | 0 (0.0%) | 0 (0.0%) |
| 35 to 64 Years | 21 (6.9%) | 27 (8.3%) |
| 65 to 74 Years | 0 (0.0%) | 9 (12.5%) |
| 75 Years and over | 0 (0.0%) | 6 (8.6%) |
Disability Class: Cognitive Difficulty
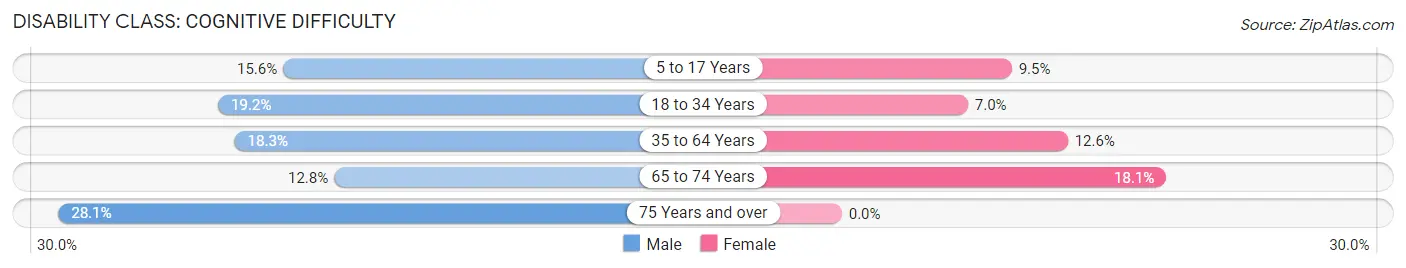
| Age Bracket | Male | Female |
| 5 to 17 Years | 27 (15.6%) | 14 (9.5%) |
| 18 to 34 Years | 30 (19.2%) | 8 (7.0%) |
| 35 to 64 Years | 56 (18.3%) | 41 (12.6%) |
| 65 to 74 Years | 6 (12.8%) | 13 (18.1%) |
| 75 Years and over | 9 (28.1%) | 0 (0.0%) |
Disability Class: Ambulatory Difficulty
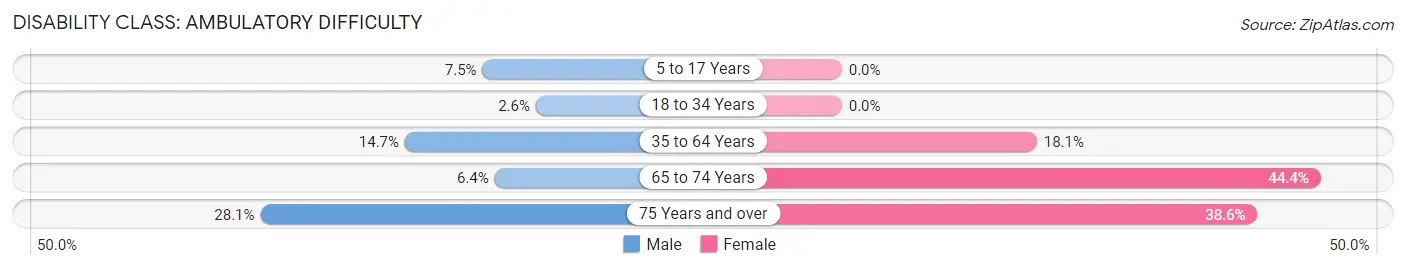
| Age Bracket | Male | Female |
| 5 to 17 Years | 13 (7.5%) | 0 (0.0%) |
| 18 to 34 Years | 4 (2.6%) | 0 (0.0%) |
| 35 to 64 Years | 45 (14.7%) | 59 (18.1%) |
| 65 to 74 Years | 3 (6.4%) | 32 (44.4%) |
| 75 Years and over | 9 (28.1%) | 27 (38.6%) |
Disability Class: Self-Care Difficulty
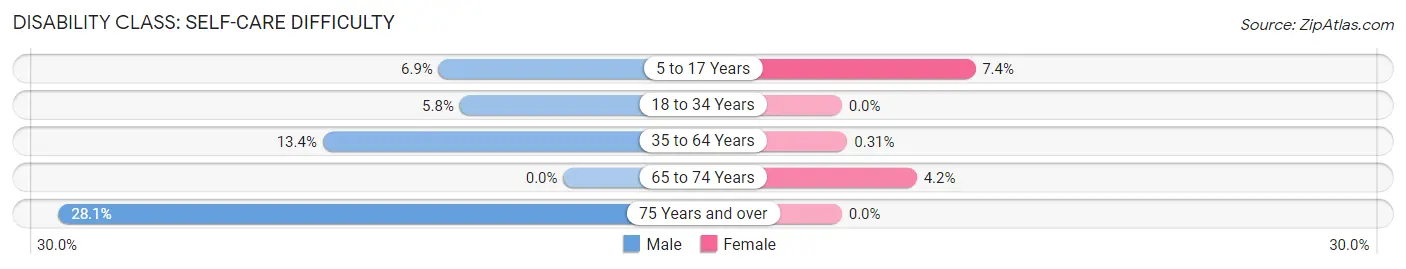
| Age Bracket | Male | Female |
| 5 to 17 Years | 12 (6.9%) | 11 (7.4%) |
| 18 to 34 Years | 9 (5.8%) | 0 (0.0%) |
| 35 to 64 Years | 41 (13.4%) | 1 (0.3%) |
| 65 to 74 Years | 0 (0.0%) | 3 (4.2%) |
| 75 Years and over | 9 (28.1%) | 0 (0.0%) |
Technology Access in Graysville
Computing Device Access in Graysville
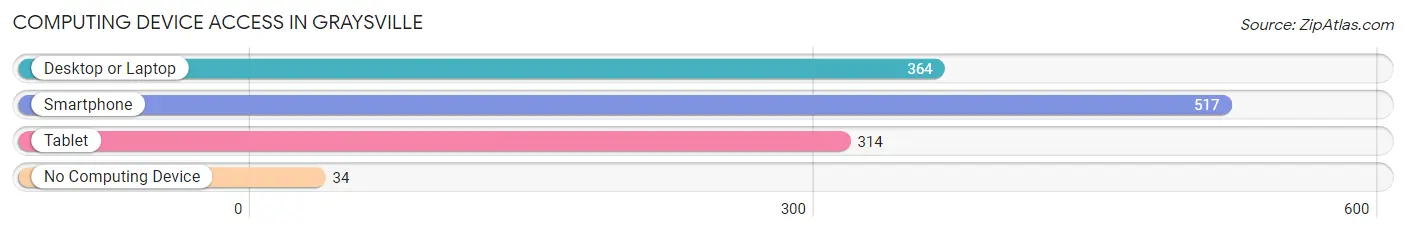
| Device Type | # Households | % Households |
| Desktop or Laptop | 364 | 63.1% |
| Smartphone | 517 | 89.6% |
| Tablet | 314 | 54.4% |
| No Computing Device | 34 | 5.9% |
| Total | 577 | 100.0% |
Internet Access in Graysville
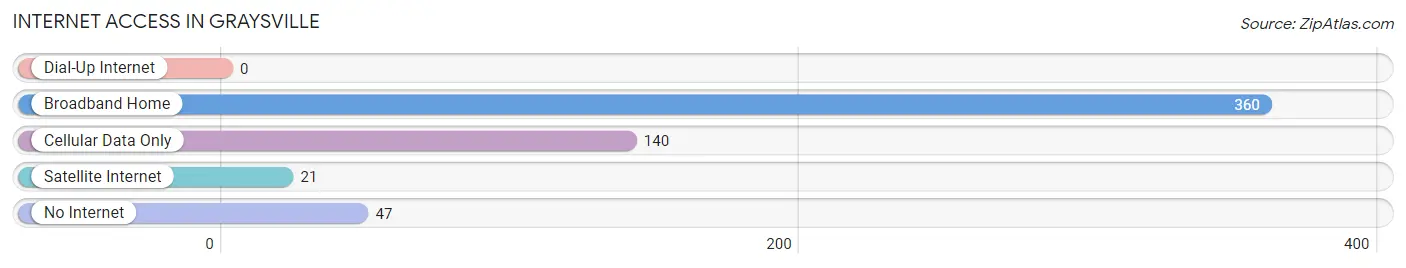
| Internet Type | # Households | % Households |
| Dial-Up Internet | 0 | 0.0% |
| Broadband Home | 360 | 62.4% |
| Cellular Data Only | 140 | 24.3% |
| Satellite Internet | 21 | 3.6% |
| No Internet | 47 | 8.2% |
| Total | 577 | 100.0% |
Graysville Summary
Graysville, Tennessee is a small town located in the southeastern corner of the state, in Rhea County. It is situated on the banks of the Tennessee River, and is home to a population of just over 1,000 people. The town was founded in 1820, and has a rich history that is intertwined with the development of the region.
Geography
Graysville is located in the Appalachian Mountains, and is surrounded by rolling hills and lush forests. The town is situated on the banks of the Tennessee River, and is bordered by the Sequatchie River to the north and the Hiwassee River to the south. The town is located in the foothills of the Cumberland Plateau, and is just a few miles from the Great Smoky Mountains National Park. The town is also close to the cities of Chattanooga and Knoxville, both of which are about an hour away.
The climate in Graysville is mild and humid, with temperatures ranging from the low 30s in the winter to the mid-80s in the summer. The town receives an average of 45 inches of rain per year, and is known for its mild winters and hot summers.
Economy
Graysville’s economy is largely based on agriculture and tourism. The town is home to several farms, which produce a variety of crops, including corn, soybeans, wheat, and hay. The town is also home to several small businesses, including restaurants, shops, and a few manufacturing plants.
Tourism is an important part of the local economy, as the town is located close to several popular attractions, including the Great Smoky Mountains National Park, the Tennessee Aquarium, and the Chattanooga Choo Choo. The town also hosts several festivals throughout the year, including the Graysville Music Festival and the Graysville Fall Festival.
Demographics
As of the 2010 census, Graysville had a population of 1,072 people. The racial makeup of the town was 95.3% White, 1.2% African American, 0.7% Native American, 0.3% Asian, 0.1% Pacific Islander, and 2.4% from other races. The median household income was $30,938, and the median family income was $37,813.
Graysville is a small town with a rich history and a vibrant economy. The town is home to a diverse population, and is a great place to live, work, and play. With its close proximity to several major cities, Graysville is an ideal place to call home.
Common Questions
What is Per Capita Income in Graysville?
Per Capita income in Graysville is $20,646.
What is the Median Family Income in Graysville?
Median Family Income in Graysville is $41,136.
What is the Median Household income in Graysville?
Median Household Income in Graysville is $38,281.
What is Income or Wage Gap in Graysville?
Income or Wage Gap in Graysville is 25.5%.
Women in Graysville earn 74.5 cents for every dollar earned by a man.
What is Inequality or Gini Index in Graysville?
Inequality or Gini Index in Graysville is 0.40.
What is the Total Population of Graysville?
Total Population of Graysville is 1,548.
What is the Total Male Population of Graysville?
Total Male Population of Graysville is 801.
What is the Total Female Population of Graysville?
Total Female Population of Graysville is 747.
What is the Ratio of Males per 100 Females in Graysville?
There are 107.23 Males per 100 Females in Graysville.
What is the Ratio of Females per 100 Males in Graysville?
There are 93.26 Females per 100 Males in Graysville.
What is the Median Population Age in Graysville?
Median Population Age in Graysville is 37.5 Years.
What is the Average Family Size in Graysville
Average Family Size in Graysville is 2.9 People.
What is the Average Household Size in Graysville
Average Household Size in Graysville is 2.7 People.
How Large is the Labor Force in Graysville?
There are 715 People in the Labor Forcein in Graysville.
What is the Percentage of People in the Labor Force in Graysville?
59.7% of People are in the Labor Force in Graysville.
What is the Unemployment Rate in Graysville?
Unemployment Rate in Graysville is 14.1%.