Flintville, TN Map & Demographics
Flintville Map
Flintville Overview
$36,301
PER CAPITA INCOME
$97,656
AVG FAMILY INCOME
$55,114
AVG HOUSEHOLD INCOME
76.0%
WAGE / INCOME GAP [ % ]
24.0¢/ $1
WAGE / INCOME GAP [ $ ]
0.36
INEQUALITY / GINI INDEX
430
TOTAL POPULATION
222
MALE POPULATION
208
FEMALE POPULATION
106.73
MALES / 100 FEMALES
93.69
FEMALES / 100 MALES
56.8
MEDIAN AGE
2.7
AVG FAMILY SIZE
2.0
AVG HOUSEHOLD SIZE
176
LABOR FORCE [ PEOPLE ]
43.6%
PERCENT IN LABOR FORCE
Flintville Zip Codes
Flintville Area Codes
Income in Flintville
Income Overview in Flintville
Per Capita Income in Flintville is $36,301, while median incomes of families and households are $97,656 and $55,114 respectively.
| Characteristic | Number | Measure |
| Per Capita Income | 430 | $36,301 |
| Median Family Income | 127 | $97,656 |
| Mean Family Income | 127 | $94,625 |
| Median Household Income | 219 | $55,114 |
| Mean Household Income | 219 | $71,044 |
| Income Deficit | 127 | $0 |
| Wage / Income Gap (%) | 430 | 75.99% |
| Wage / Income Gap ($) | 430 | 24.01¢ per $1 |
| Gini / Inequality Index | 430 | 0.36 |
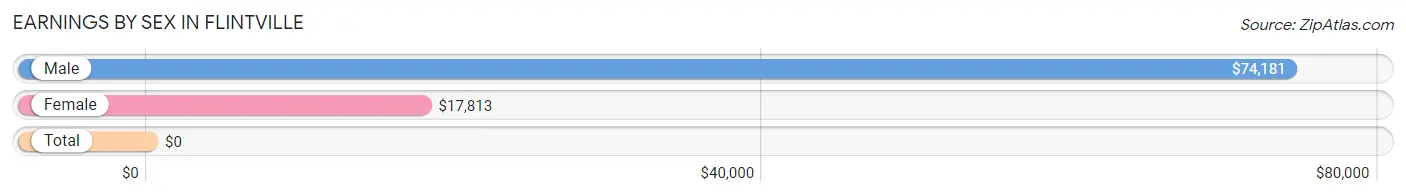
Earnings by Sex in Flintville
| Sex | Number | Average Earnings |
| Male | 131 (60.4%) | $74,181 |
| Female | 86 (39.6%) | $17,813 |
| Total | 217 (100.0%) | $0 |
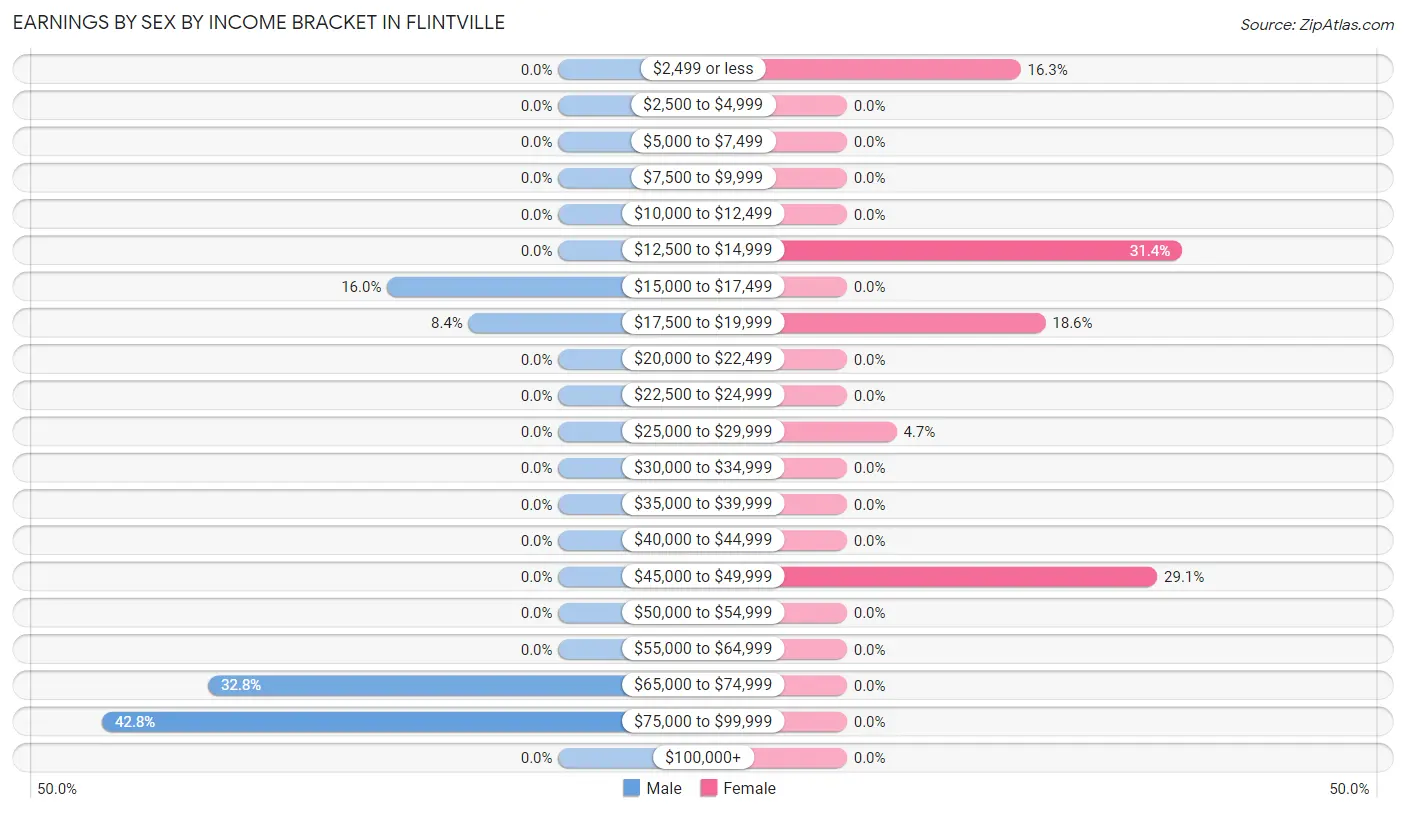
Earnings by Sex by Income Bracket in Flintville
The most common earnings brackets in Flintville are $75,000 to $99,999 for men (56 | 42.7%) and $12,500 to $14,999 for women (27 | 31.4%).
| Income | Male | Female |
| $2,499 or less | 0 (0.0%) | 14 (16.3%) |
| $2,500 to $4,999 | 0 (0.0%) | 0 (0.0%) |
| $5,000 to $7,499 | 0 (0.0%) | 0 (0.0%) |
| $7,500 to $9,999 | 0 (0.0%) | 0 (0.0%) |
| $10,000 to $12,499 | 0 (0.0%) | 0 (0.0%) |
| $12,500 to $14,999 | 0 (0.0%) | 27 (31.4%) |
| $15,000 to $17,499 | 21 (16.0%) | 0 (0.0%) |
| $17,500 to $19,999 | 11 (8.4%) | 16 (18.6%) |
| $20,000 to $22,499 | 0 (0.0%) | 0 (0.0%) |
| $22,500 to $24,999 | 0 (0.0%) | 0 (0.0%) |
| $25,000 to $29,999 | 0 (0.0%) | 4 (4.6%) |
| $30,000 to $34,999 | 0 (0.0%) | 0 (0.0%) |
| $35,000 to $39,999 | 0 (0.0%) | 0 (0.0%) |
| $40,000 to $44,999 | 0 (0.0%) | 0 (0.0%) |
| $45,000 to $49,999 | 0 (0.0%) | 25 (29.1%) |
| $50,000 to $54,999 | 0 (0.0%) | 0 (0.0%) |
| $55,000 to $64,999 | 0 (0.0%) | 0 (0.0%) |
| $65,000 to $74,999 | 43 (32.8%) | 0 (0.0%) |
| $75,000 to $99,999 | 56 (42.7%) | 0 (0.0%) |
| $100,000+ | 0 (0.0%) | 0 (0.0%) |
| Total | 131 (100.0%) | 86 (100.0%) |
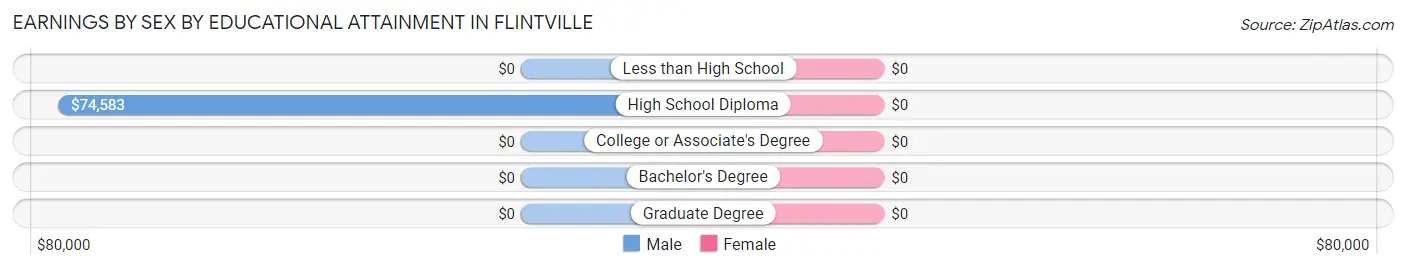
Earnings by Sex by Educational Attainment in Flintville
| Educational Attainment | Male Income | Female Income |
| Less than High School | - | - |
| High School Diploma | $74,583 | $0 |
| College or Associate's Degree | - | - |
| Bachelor's Degree | - | - |
| Graduate Degree | - | - |
| Total | $80,147 | $0 |
Family Income in Flintville
Family Income Brackets in Flintville
According to the Flintville family income data, there are 39 families falling into the $100,000 to $149,999 income range, which is the most common income bracket and makes up 30.7% of all families.
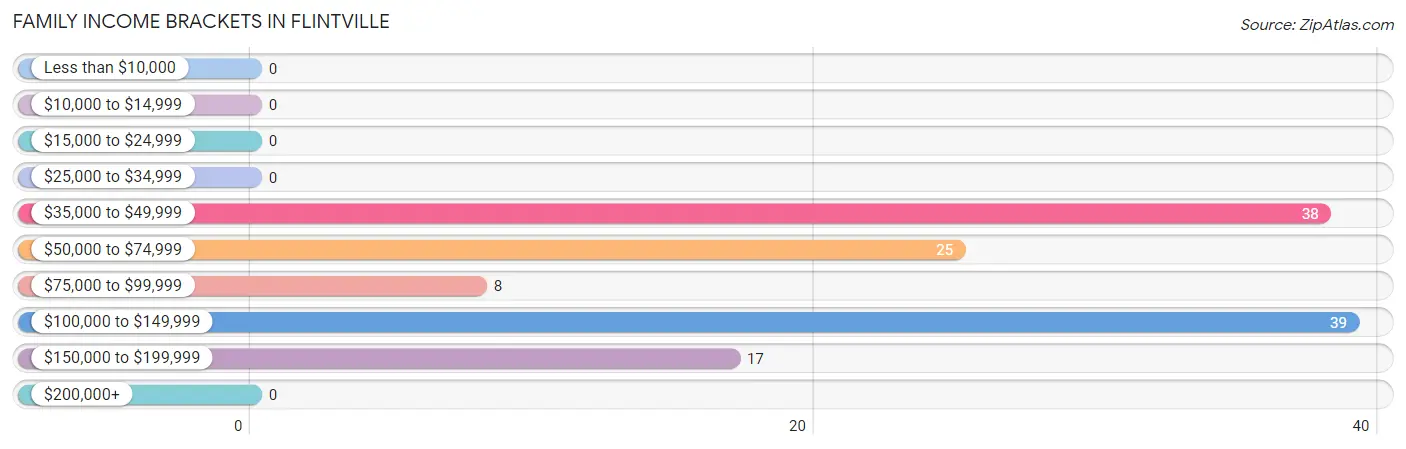
| Income Bracket | # Families | % Families |
| Less than $10,000 | 0 | 0.0% |
| $10,000 to $14,999 | 0 | 0.0% |
| $15,000 to $24,999 | 0 | 0.0% |
| $25,000 to $34,999 | 0 | 0.0% |
| $35,000 to $49,999 | 38 | 29.9% |
| $50,000 to $74,999 | 25 | 19.7% |
| $75,000 to $99,999 | 8 | 6.3% |
| $100,000 to $149,999 | 39 | 30.7% |
| $150,000 to $199,999 | 17 | 13.4% |
| $200,000+ | 0 | 0.0% |
Family Income by Famaliy Size in Flintville
| Income Bracket | # Families | Median Income |
| 2-Person Families | 99 (77.9%) | $0 |
| 3-Person Families | 0 (0.0%) | $0 |
| 4-Person Families | 11 (8.7%) | $0 |
| 5-Person Families | 17 (13.4%) | $0 |
| 6-Person Families | 0 (0.0%) | $0 |
| 7+ Person Families | 0 (0.0%) | $0 |
| Total | 127 (100.0%) | $97,656 |
Family Income by Number of Earners in Flintville
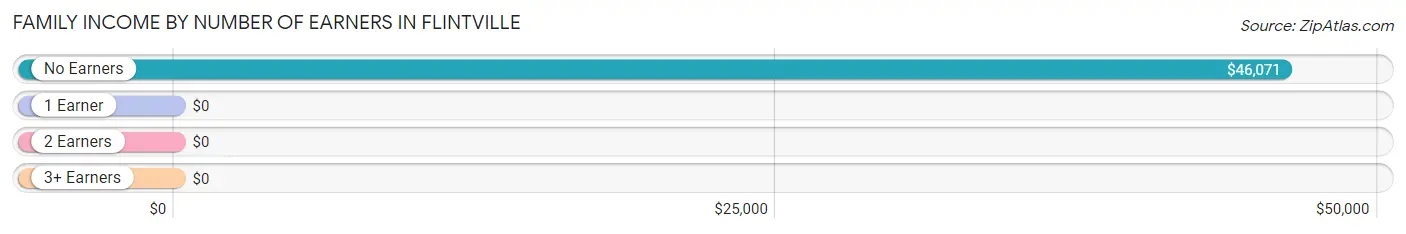
| Number of Earners | # Families | Median Income |
| No Earners | 38 (29.9%) | $46,071 |
| 1 Earner | 50 (39.4%) | $0 |
| 2 Earners | 22 (17.3%) | $0 |
| 3+ Earners | 17 (13.4%) | $0 |
| Total | 127 (100.0%) | $97,656 |
Household Income in Flintville
Household Income Brackets in Flintville
With 57 households falling in the category, the $50,000 to $74,999 income range is the most frequent in Flintville, accounting for 26.0% of all households.
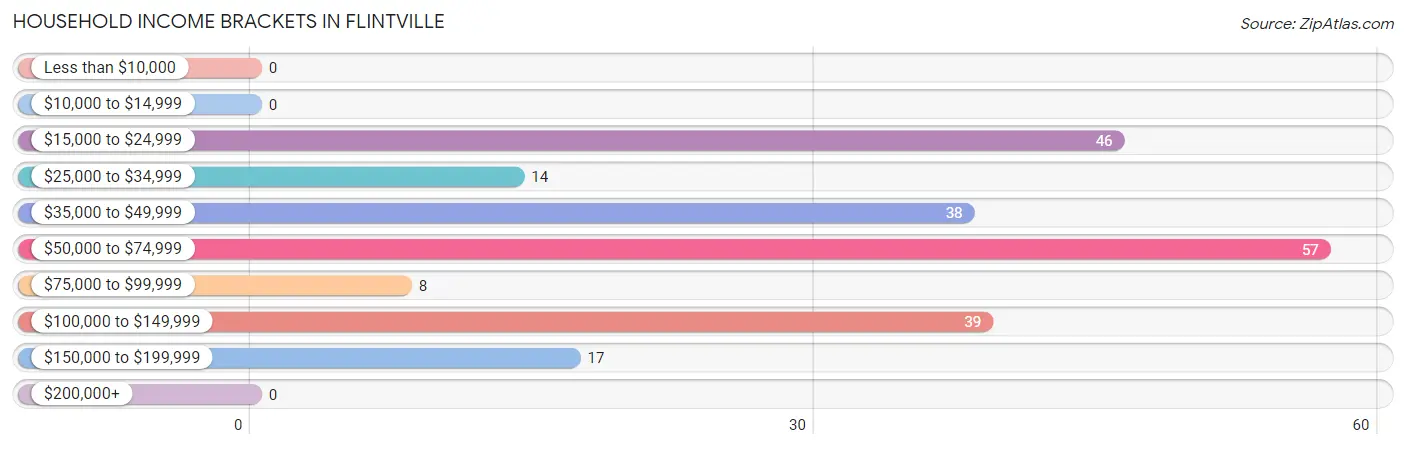
| Income Bracket | # Households | % Households |
| Less than $10,000 | 0 | 0.0% |
| $10,000 to $14,999 | 0 | 0.0% |
| $15,000 to $24,999 | 46 | 21.0% |
| $25,000 to $34,999 | 14 | 6.4% |
| $35,000 to $49,999 | 38 | 17.4% |
| $50,000 to $74,999 | 57 | 26.0% |
| $75,000 to $99,999 | 8 | 3.7% |
| $100,000 to $149,999 | 39 | 17.8% |
| $150,000 to $199,999 | 17 | 7.8% |
| $200,000+ | 0 | 0.0% |
Household Income by Householder Age in Flintville
The median household income in Flintville is $55,114, with the highest median household income of $73,452 found in the 45 to 64 years age bracket for the primary householder. A total of 76 households (34.7%) fall into this category.
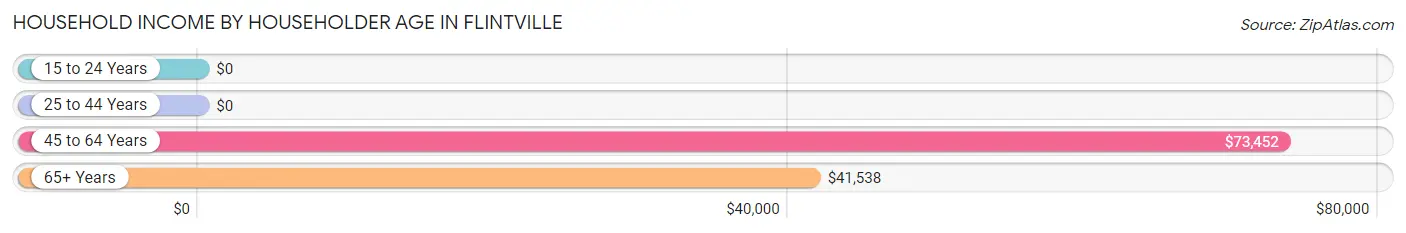
| Income Bracket | # Households | Median Income |
| 15 to 24 Years | 0 (0.0%) | $0 |
| 25 to 44 Years | 39 (17.8%) | $0 |
| 45 to 64 Years | 76 (34.7%) | $73,452 |
| 65+ Years | 104 (47.5%) | $41,538 |
| Total | 219 (100.0%) | $55,114 |
Poverty in Flintville
Income Below Poverty by Sex and Age in Flintville
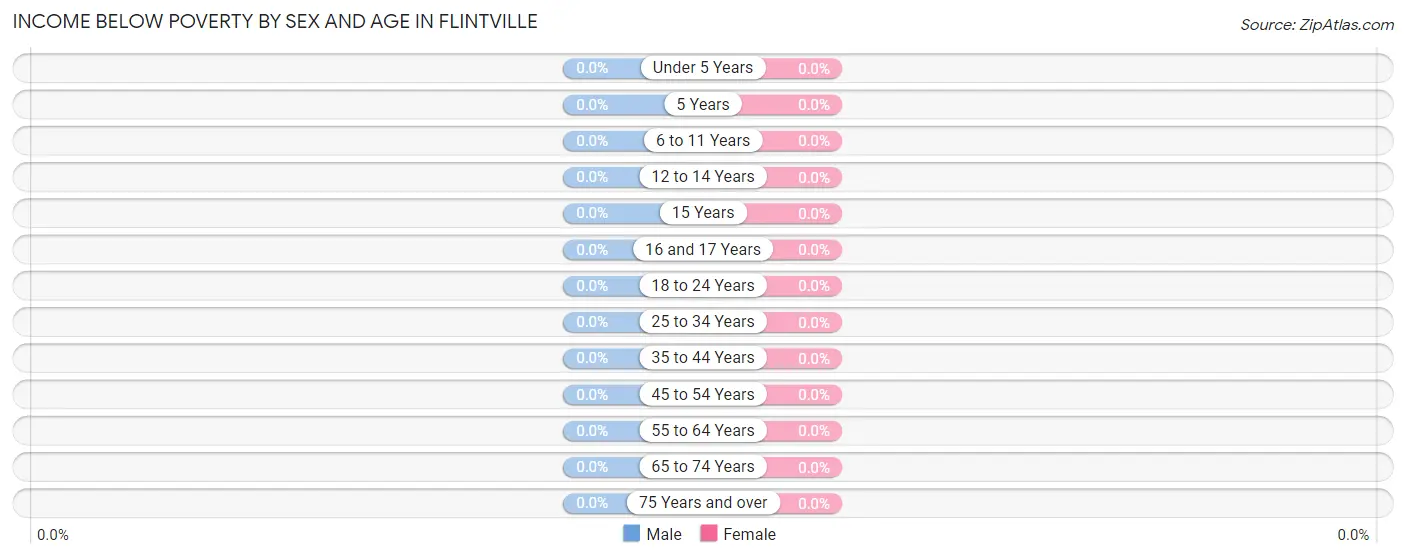
| Age Bracket | Male | Female |
| Under 5 Years | 0 (0.0%) | 0 (0.0%) |
| 5 Years | 0 (0.0%) | 0 (0.0%) |
| 6 to 11 Years | 0 (0.0%) | 0 (0.0%) |
| 12 to 14 Years | 0 (0.0%) | 0 (0.0%) |
| 15 Years | 0 (0.0%) | 0 (0.0%) |
| 16 and 17 Years | 0 (0.0%) | 0 (0.0%) |
| 18 to 24 Years | 0 (0.0%) | 0 (0.0%) |
| 25 to 34 Years | 0 (0.0%) | 0 (0.0%) |
| 35 to 44 Years | 0 (0.0%) | 0 (0.0%) |
| 45 to 54 Years | 0 (0.0%) | 0 (0.0%) |
| 55 to 64 Years | 0 (0.0%) | 0 (0.0%) |
| 65 to 74 Years | 0 (0.0%) | 0 (0.0%) |
| 75 Years and over | 0 (0.0%) | 0 (0.0%) |
| Total | 0 (0.0%) | 0 (0.0%) |
Income Above Poverty by Sex and Age in Flintville
According to the poverty statistics in Flintville, males aged 6 to 11 years and females aged 12 to 14 years are the age groups that are most secure financially, with 100.0% of males and 100.0% of females in these age groups living above the poverty line.
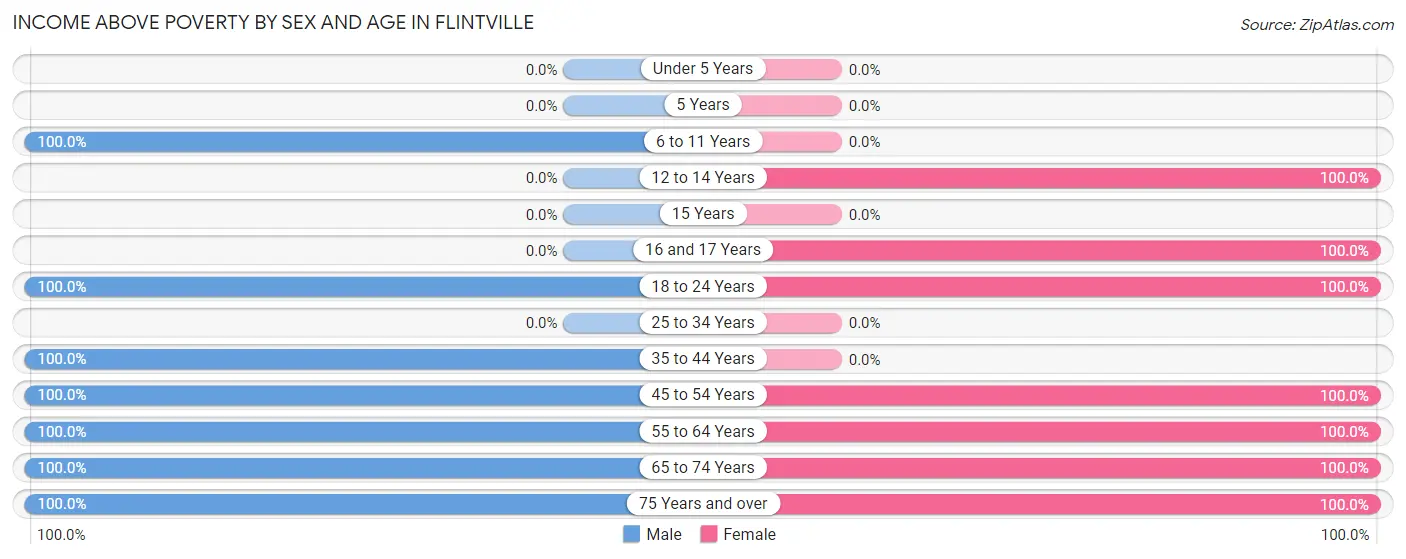
| Age Bracket | Male | Female |
| Under 5 Years | 0 (0.0%) | 0 (0.0%) |
| 5 Years | 0 (0.0%) | 0 (0.0%) |
| 6 to 11 Years | 13 (100.0%) | 0 (0.0%) |
| 12 to 14 Years | 0 (0.0%) | 13 (100.0%) |
| 15 Years | 0 (0.0%) | 0 (0.0%) |
| 16 and 17 Years | 0 (0.0%) | 14 (100.0%) |
| 18 to 24 Years | 21 (100.0%) | 30 (100.0%) |
| 25 to 34 Years | 0 (0.0%) | 0 (0.0%) |
| 35 to 44 Years | 39 (100.0%) | 0 (0.0%) |
| 45 to 54 Years | 17 (100.0%) | 34 (100.0%) |
| 55 to 64 Years | 43 (100.0%) | 14 (100.0%) |
| 65 to 74 Years | 38 (100.0%) | 84 (100.0%) |
| 75 Years and over | 51 (100.0%) | 19 (100.0%) |
| Total | 222 (100.0%) | 208 (100.0%) |
Income Below Poverty Among Married-Couple Families in Flintville
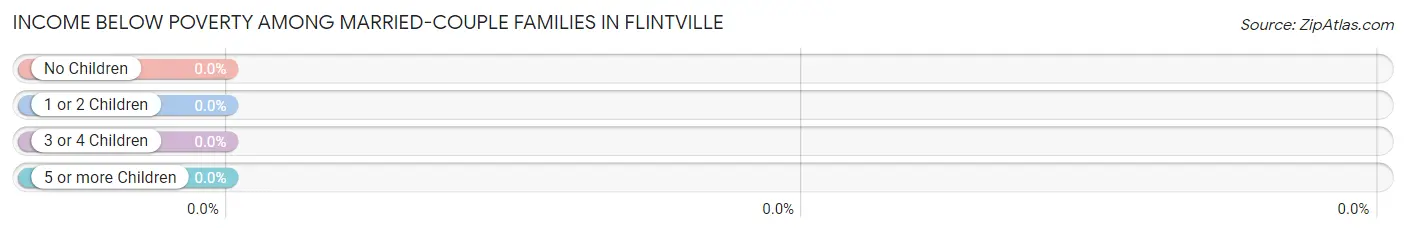
| Children | Above Poverty | Below Poverty |
| No Children | 60 (100.0%) | 0 (0.0%) |
| 1 or 2 Children | 17 (100.0%) | 0 (0.0%) |
| 3 or 4 Children | 0 (0.0%) | 0 (0.0%) |
| 5 or more Children | 0 (0.0%) | 0 (0.0%) |
| Total | 77 (100.0%) | 0 (0.0%) |
Income Below Poverty Among Single-Parent Households in Flintville
| Children | Single Father | Single Mother |
| No Children | 0 (0.0%) | 0 (0.0%) |
| 1 or 2 Children | 0 (0.0%) | 0 (0.0%) |
| 3 or 4 Children | 0 (0.0%) | 0 (0.0%) |
| 5 or more Children | 0 (0.0%) | 0 (0.0%) |
| Total | 0 (0.0%) | 0 (0.0%) |
Income Below Poverty Among Married-Couple vs Single-Parent Households in Flintville
| Children | Married-Couple Families | Single-Parent Households |
| No Children | 0 (0.0%) | 0 (0.0%) |
| 1 or 2 Children | 0 (0.0%) | 0 (0.0%) |
| 3 or 4 Children | 0 (0.0%) | 0 (0.0%) |
| 5 or more Children | 0 (0.0%) | 0 (0.0%) |
| Total | 0 (0.0%) | 0 (0.0%) |
Race in Flintville
The most populous races in Flintville are White / Caucasian (419 | 97.4%), and Two or more Races (11 | 2.6%).
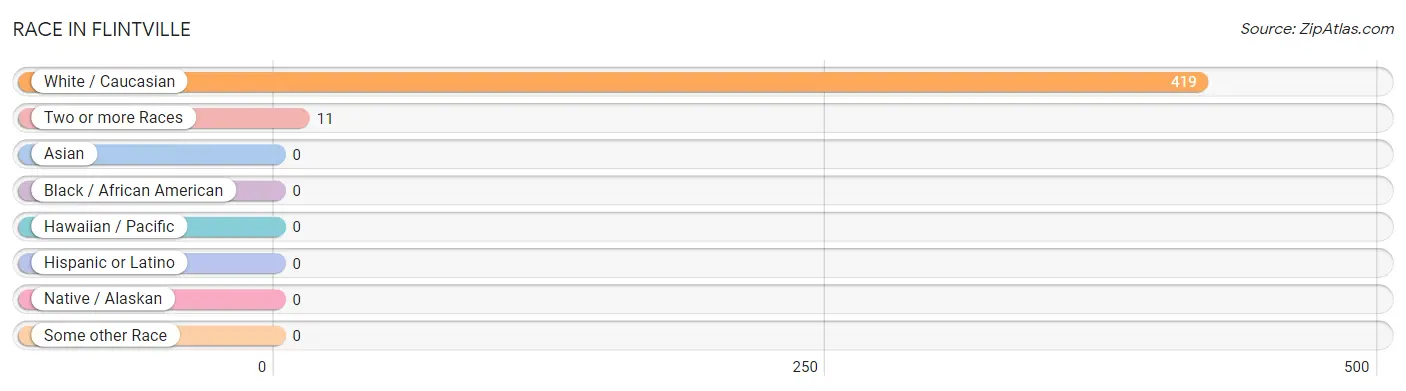
| Race | # Population | % Population |
| Asian | 0 | 0.0% |
| Black / African American | 0 | 0.0% |
| Hawaiian / Pacific | 0 | 0.0% |
| Hispanic or Latino | 0 | 0.0% |
| Native / Alaskan | 0 | 0.0% |
| White / Caucasian | 419 | 97.4% |
| Two or more Races | 11 | 2.6% |
| Some other Race | 0 | 0.0% |
| Total | 430 | 100.0% |
Ancestry in Flintville
The most populous ancestries reported in Flintville are American (212 | 49.3%), Dutch (26 | 6.0%), German (26 | 6.0%), English (25 | 5.8%), and Italian (16 | 3.7%), together accounting for 70.9% of all Flintville residents.
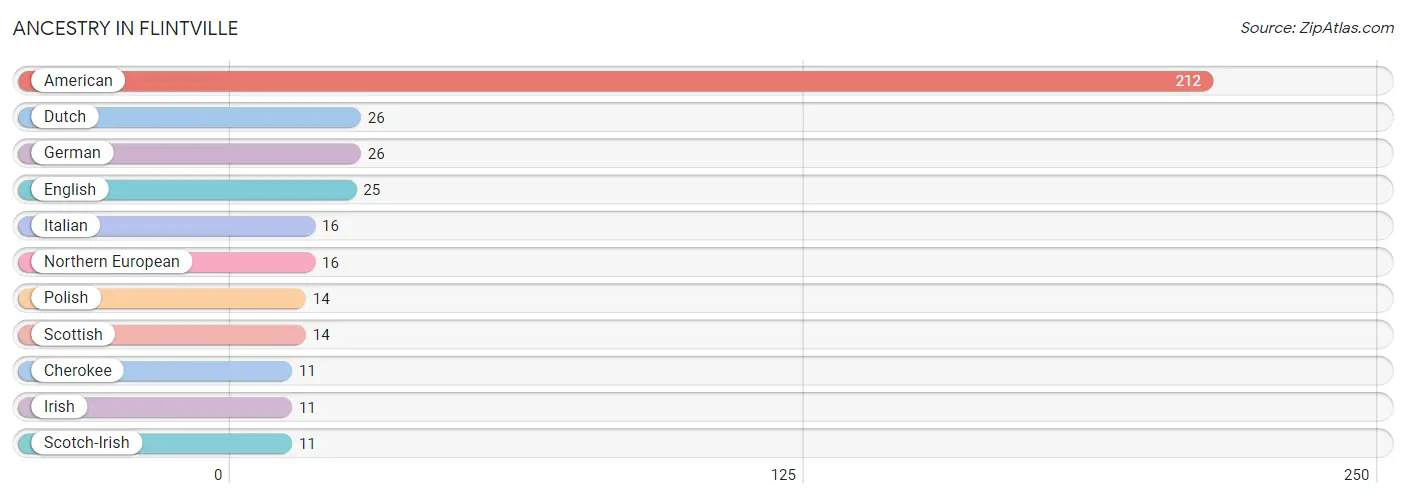
| Ancestry | # Population | % Population |
| American | 212 | 49.3% |
| Cherokee | 11 | 2.6% |
| Dutch | 26 | 6.0% |
| English | 25 | 5.8% |
| German | 26 | 6.0% |
| Irish | 11 | 2.6% |
| Italian | 16 | 3.7% |
| Northern European | 16 | 3.7% |
| Polish | 14 | 3.3% |
| Scotch-Irish | 11 | 2.6% |
| Scottish | 14 | 3.3% | View All 11 Rows |
Immigrants in Flintville

| Immigration Origin | # Population | % Population | View All 0 Rows |
Sex and Age in Flintville
Sex and Age in Flintville
The most populous age groups in Flintville are 80 to 84 Years (51 | 23.0%) for men and 70 to 74 Years (60 | 28.8%) for women.
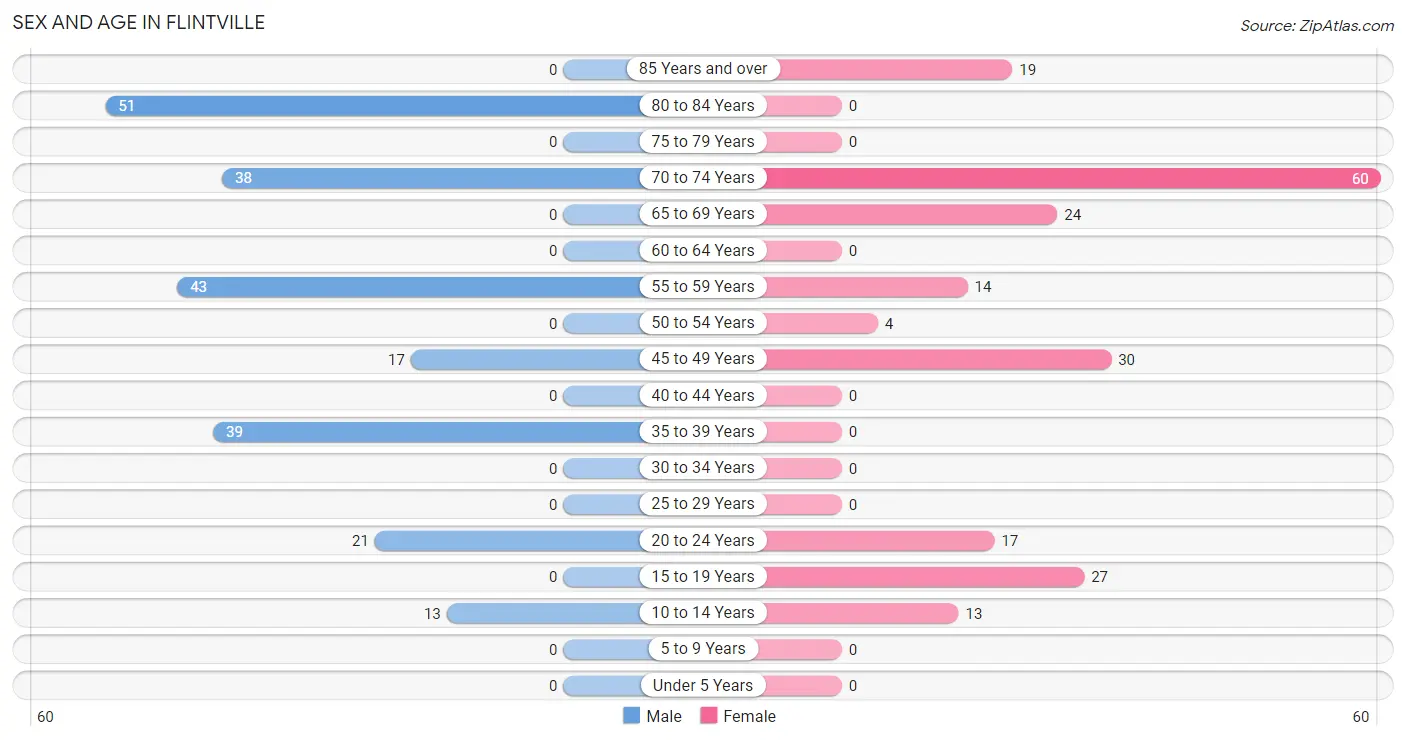
| Age Bracket | Male | Female |
| Under 5 Years | 0 (0.0%) | 0 (0.0%) |
| 5 to 9 Years | 0 (0.0%) | 0 (0.0%) |
| 10 to 14 Years | 13 (5.9%) | 13 (6.2%) |
| 15 to 19 Years | 0 (0.0%) | 27 (13.0%) |
| 20 to 24 Years | 21 (9.5%) | 17 (8.2%) |
| 25 to 29 Years | 0 (0.0%) | 0 (0.0%) |
| 30 to 34 Years | 0 (0.0%) | 0 (0.0%) |
| 35 to 39 Years | 39 (17.6%) | 0 (0.0%) |
| 40 to 44 Years | 0 (0.0%) | 0 (0.0%) |
| 45 to 49 Years | 17 (7.7%) | 30 (14.4%) |
| 50 to 54 Years | 0 (0.0%) | 4 (1.9%) |
| 55 to 59 Years | 43 (19.4%) | 14 (6.7%) |
| 60 to 64 Years | 0 (0.0%) | 0 (0.0%) |
| 65 to 69 Years | 0 (0.0%) | 24 (11.5%) |
| 70 to 74 Years | 38 (17.1%) | 60 (28.8%) |
| 75 to 79 Years | 0 (0.0%) | 0 (0.0%) |
| 80 to 84 Years | 51 (23.0%) | 0 (0.0%) |
| 85 Years and over | 0 (0.0%) | 19 (9.1%) |
| Total | 222 (100.0%) | 208 (100.0%) |
Families and Households in Flintville
Median Family Size in Flintville
The median family size in Flintville is 2.66 persons per family, with single female/mother families (11 | 8.7%) accounting for the largest median family size of 4.91 persons per family. On the other hand, single male/father families (39 | 30.7%) represent the smallest median family size with 2.31 persons per family.
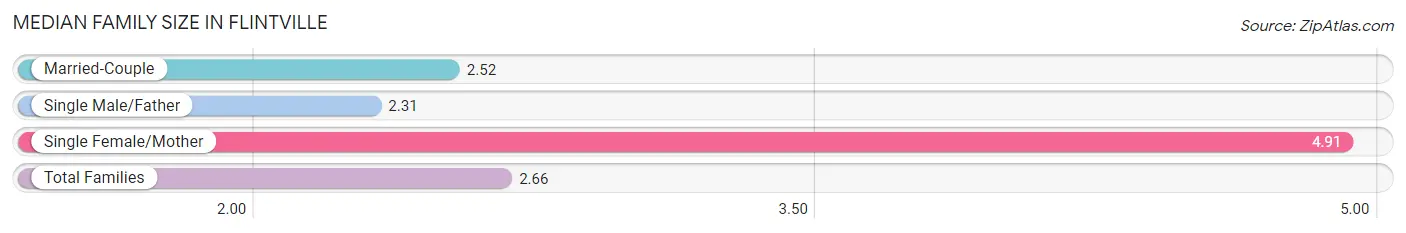
| Family Type | # Families | Family Size |
| Married-Couple | 77 (60.6%) | 2.52 |
| Single Male/Father | 39 (30.7%) | 2.31 |
| Single Female/Mother | 11 (8.7%) | 4.91 |
| Total Families | 127 (100.0%) | 2.66 |
Median Household Size in Flintville
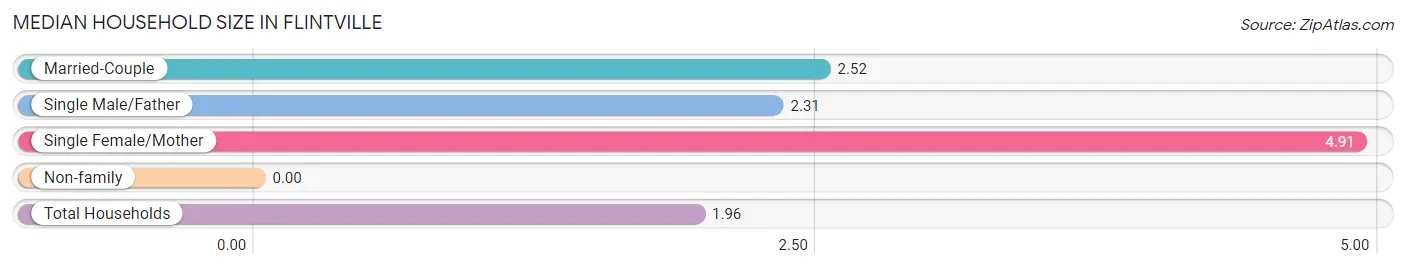
| Household Type | # Households | Household Size |
| Married-Couple | 77 (35.2%) | 2.52 |
| Single Male/Father | 39 (17.8%) | 2.31 |
| Single Female/Mother | 11 (5.0%) | 4.91 |
| Non-family | 92 (42.0%) | - |
| Total Households | 219 (100.0%) | 1.96 |
Household Size by Marriage Status in Flintville
Out of a total of 219 households in Flintville, 127 (58.0%) are family households, while 92 (42.0%) are nonfamily households. The most numerous type of family households are 2-person households, comprising 99, and the most common type of nonfamily households are 1-person households, comprising 92.
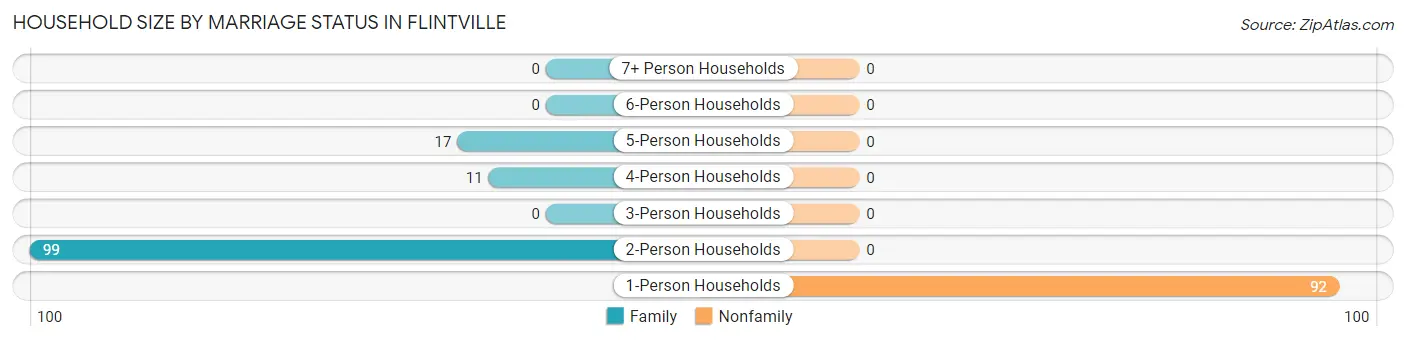
| Household Size | Family Households | Nonfamily Households |
| 1-Person Households | - | 92 (42.0%) |
| 2-Person Households | 99 (45.2%) | 0 (0.0%) |
| 3-Person Households | 0 (0.0%) | 0 (0.0%) |
| 4-Person Households | 11 (5.0%) | 0 (0.0%) |
| 5-Person Households | 17 (7.8%) | 0 (0.0%) |
| 6-Person Households | 0 (0.0%) | 0 (0.0%) |
| 7+ Person Households | 0 (0.0%) | 0 (0.0%) |
| Total | 127 (58.0%) | 92 (42.0%) |
Female Fertility in Flintville
Fertility by Age in Flintville
| Age Bracket | Women with Births | Births / 1,000 Women |
| 15 to 19 years | 0 (0.0%) | 0.0 |
| 20 to 34 years | 0 (0.0%) | 0.0 |
| 35 to 50 years | 0 (0.0%) | 0.0 |
| Total | 0 (0.0%) | 0.0 |
Fertility by Age by Marriage Status in Flintville
| Age Bracket | Married | Unmarried |
| 15 to 19 years | 0 (0.0%) | 0 (0.0%) |
| 20 to 34 years | 0 (0.0%) | 0 (0.0%) |
| 35 to 50 years | 0 (0.0%) | 0 (0.0%) |
| Total | 0 (0.0%) | 0 (0.0%) |
Fertility by Education in Flintville
| Educational Attainment | Women with Births | Births / 1,000 Women |
| Less than High School | 0 (0.0%) | 0.0 |
| High School Diploma | 0 (0.0%) | 0.0 |
| College or Associate's Degree | 0 (0.0%) | 0.0 |
| Bachelor's Degree | 0 (0.0%) | 0.0 |
| Graduate Degree | 0 (0.0%) | 0.0 |
| Total | 0 (0.0%) | 0.0 |
Fertility by Education by Marriage Status in Flintville
| Educational Attainment | Married | Unmarried |
| Less than High School | 0 (0.0%) | 0 (0.0%) |
| High School Diploma | 0 (0.0%) | 0 (0.0%) |
| College or Associate's Degree | 0 (0.0%) | 0 (0.0%) |
| Bachelor's Degree | 0 (0.0%) | 0 (0.0%) |
| Graduate Degree | 0 (0.0%) | 0 (0.0%) |
| Total | 0 (0.0%) | 0 (0.0%) |
Employment Characteristics in Flintville
Employment by Class of Employer in Flintville
Among the 176 employed individuals in Flintville, private company employees (139 | 79.0%), local government employees (33 | 18.8%), and not-for-profit organizations (4 | 2.3%) make up the most common classes of employment.
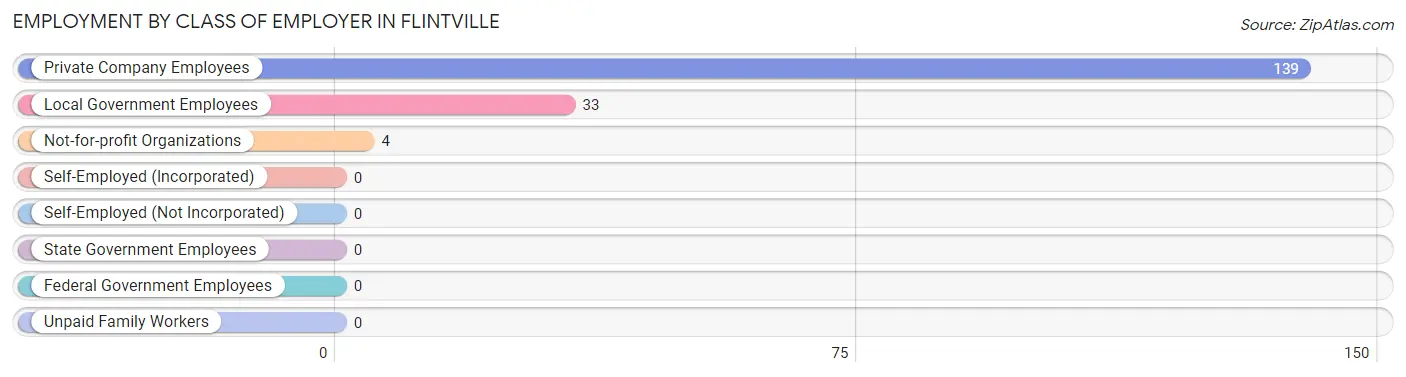
| Employer Class | # Employees | % Employees |
| Private Company Employees | 139 | 79.0% |
| Self-Employed (Incorporated) | 0 | 0.0% |
| Self-Employed (Not Incorporated) | 0 | 0.0% |
| Not-for-profit Organizations | 4 | 2.3% |
| Local Government Employees | 33 | 18.8% |
| State Government Employees | 0 | 0.0% |
| Federal Government Employees | 0 | 0.0% |
| Unpaid Family Workers | 0 | 0.0% |
| Total | 176 | 100.0% |
Employment Status by Age in Flintville
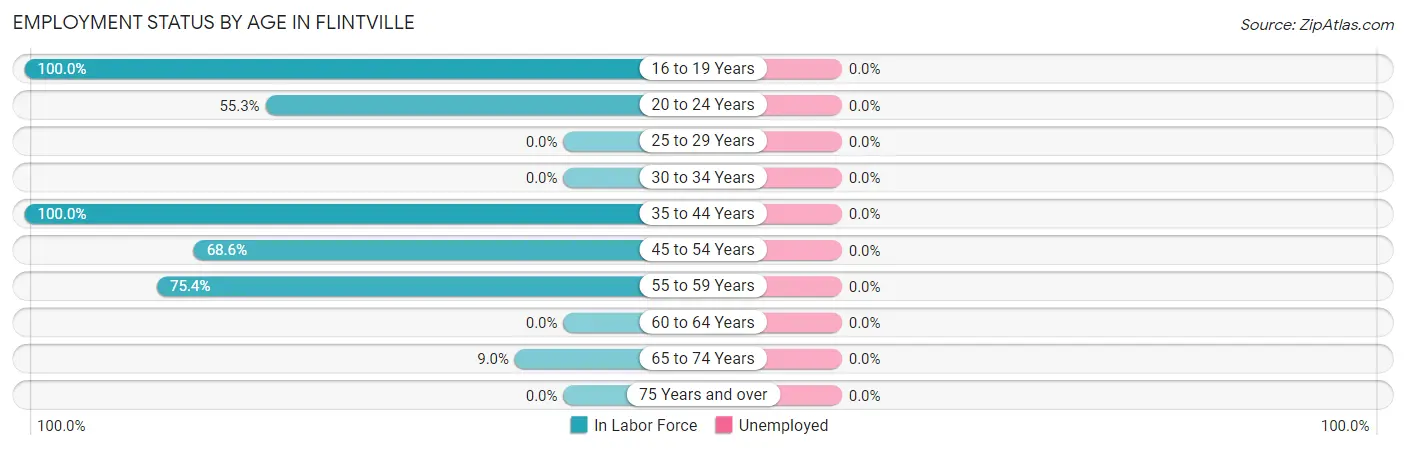
| Age Bracket | In Labor Force | Unemployed |
| 16 to 19 Years | 27 (100.0%) | 0 (0.0%) |
| 20 to 24 Years | 21 (55.3%) | 0 (0.0%) |
| 25 to 29 Years | 0 (0.0%) | 0 (0.0%) |
| 30 to 34 Years | 0 (0.0%) | 0 (0.0%) |
| 35 to 44 Years | 39 (100.0%) | 0 (0.0%) |
| 45 to 54 Years | 35 (68.6%) | 0 (0.0%) |
| 55 to 59 Years | 43 (75.4%) | 0 (0.0%) |
| 60 to 64 Years | 0 (0.0%) | 0 (0.0%) |
| 65 to 74 Years | 11 (9.0%) | 0 (0.0%) |
| 75 Years and over | 0 (0.0%) | 0 (0.0%) |
| Total | 176 (43.6%) | 0 (0.0%) |
Employment Status by Educational Attainment in Flintville
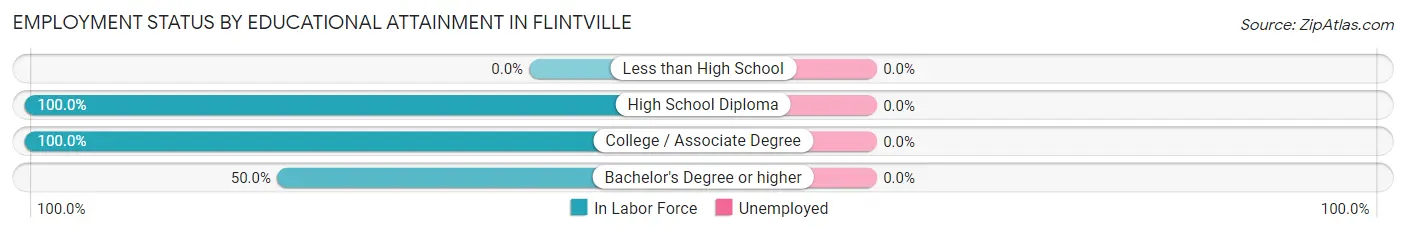
| Educational Attainment | In Labor Force | Unemployed |
| Less than High School | 0 (0.0%) | 0 (0.0%) |
| High School Diploma | 74 (100.0%) | 0 (0.0%) |
| College / Associate Degree | 29 (100.0%) | 0 (0.0%) |
| Bachelor's Degree or higher | 14 (50.0%) | 0 (0.0%) |
| Total | 117 (79.6%) | 0 (0.0%) |
Employment Occupations by Sex in Flintville
Management, Business, Science and Arts Occupations
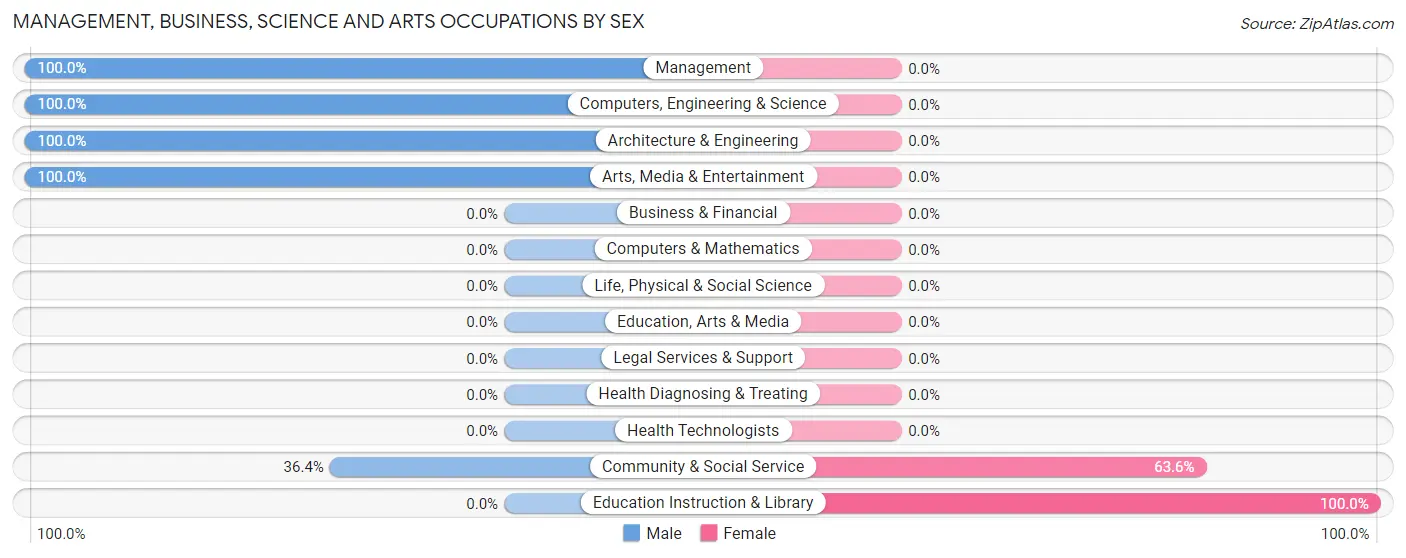
The most common Management, Business, Science and Arts occupations in Flintville are Management (38 | 21.6%), Community & Social Service (22 | 12.5%), Computers, Engineering & Science (21 | 11.9%), Architecture & Engineering (21 | 11.9%), and Education Instruction & Library (14 | 8.0%).
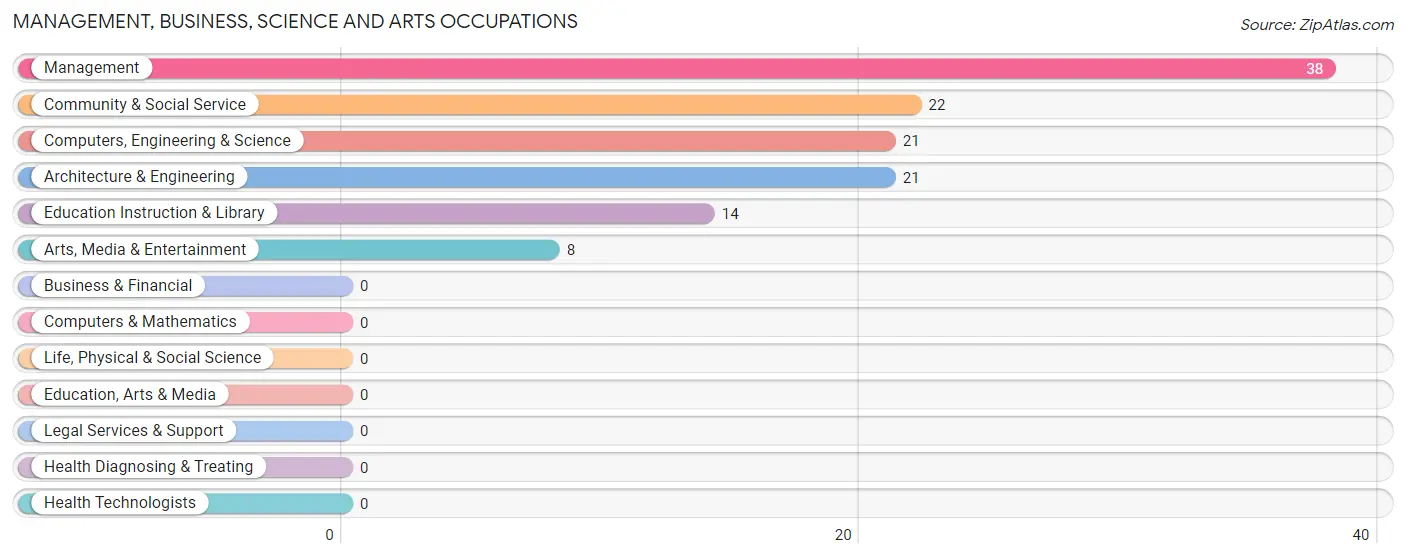
Management, Business, Science and Arts Occupations by Sex
Within the Management, Business, Science and Arts occupations in Flintville, the most male-oriented occupations are Management (100.0%), Computers, Engineering & Science (100.0%), and Architecture & Engineering (100.0%), while the most female-oriented occupations are Education Instruction & Library (100.0%), and Community & Social Service (63.6%).
| Occupation | Male | Female |
| Management | 38 (100.0%) | 0 (0.0%) |
| Business & Financial | 0 (0.0%) | 0 (0.0%) |
| Computers, Engineering & Science | 21 (100.0%) | 0 (0.0%) |
| Computers & Mathematics | 0 (0.0%) | 0 (0.0%) |
| Architecture & Engineering | 21 (100.0%) | 0 (0.0%) |
| Life, Physical & Social Science | 0 (0.0%) | 0 (0.0%) |
| Community & Social Service | 8 (36.4%) | 14 (63.6%) |
| Education, Arts & Media | 0 (0.0%) | 0 (0.0%) |
| Legal Services & Support | 0 (0.0%) | 0 (0.0%) |
| Education Instruction & Library | 0 (0.0%) | 14 (100.0%) |
| Arts, Media & Entertainment | 8 (100.0%) | 0 (0.0%) |
| Health Diagnosing & Treating | 0 (0.0%) | 0 (0.0%) |
| Health Technologists | 0 (0.0%) | 0 (0.0%) |
| Total (Category) | 67 (82.7%) | 14 (17.3%) |
| Total (Overall) | 131 (74.4%) | 45 (25.6%) |
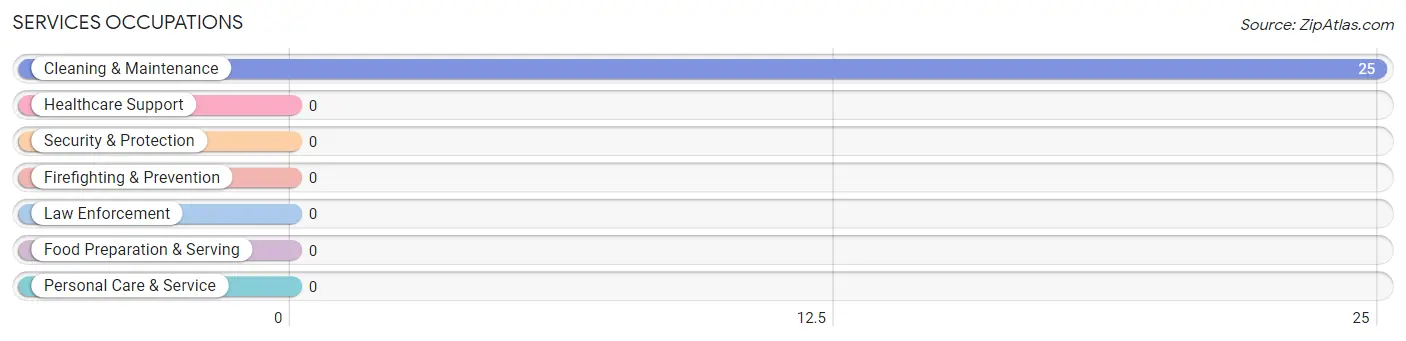
Services Occupations
The most common Services occupations in Flintville are , and Cleaning & Maintenance (25 | 14.2%).
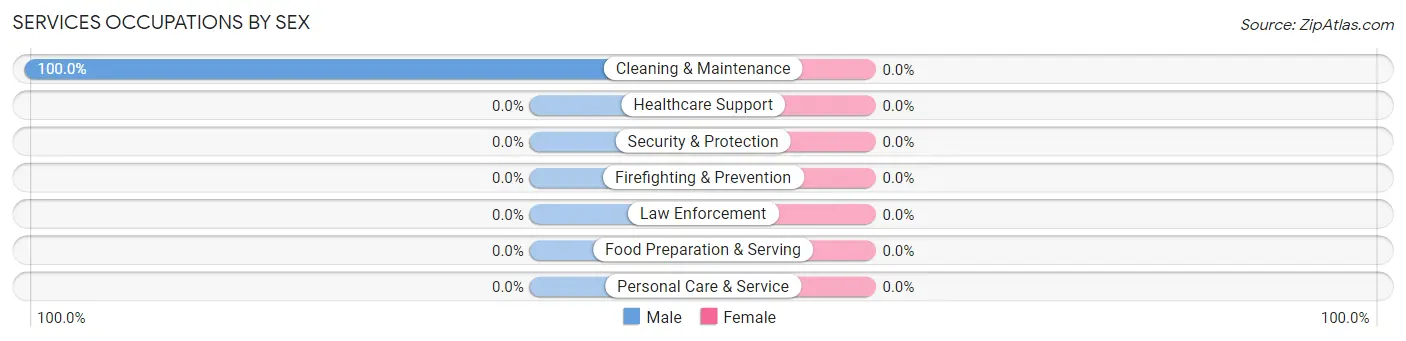
Services Occupations by Sex
| Occupation | Male | Female |
| Healthcare Support | 0 (0.0%) | 0 (0.0%) |
| Security & Protection | 0 (0.0%) | 0 (0.0%) |
| Firefighting & Prevention | 0 (0.0%) | 0 (0.0%) |
| Law Enforcement | 0 (0.0%) | 0 (0.0%) |
| Food Preparation & Serving | 0 (0.0%) | 0 (0.0%) |
| Cleaning & Maintenance | 25 (100.0%) | 0 (0.0%) |
| Personal Care & Service | 0 (0.0%) | 0 (0.0%) |
| Total (Category) | 25 (100.0%) | 0 (0.0%) |
| Total (Overall) | 131 (74.4%) | 45 (25.6%) |
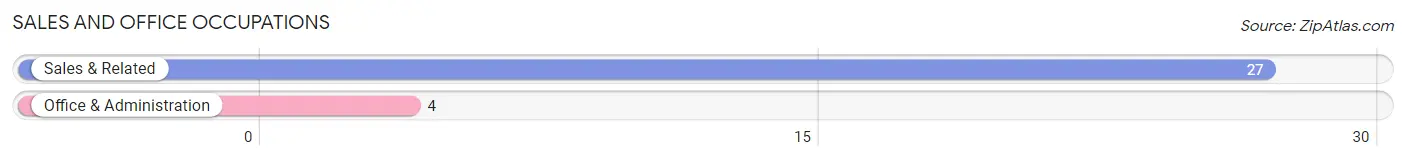
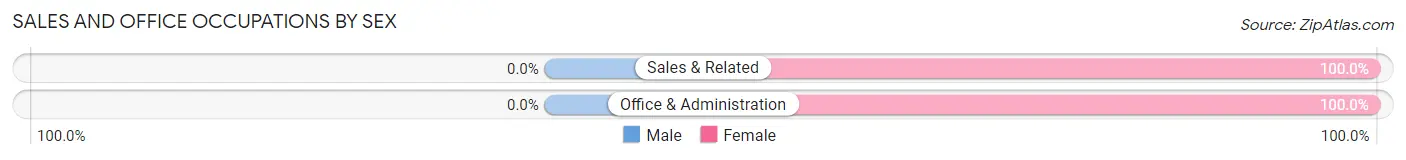
Sales and Office Occupations
The most common Sales and Office occupations in Flintville are Sales & Related (27 | 15.3%), and Office & Administration (4 | 2.3%).
Sales and Office Occupations by Sex
| Occupation | Male | Female |
| Sales & Related | 0 (0.0%) | 27 (100.0%) |
| Office & Administration | 0 (0.0%) | 4 (100.0%) |
| Total (Category) | 0 (0.0%) | 31 (100.0%) |
| Total (Overall) | 131 (74.4%) | 45 (25.6%) |
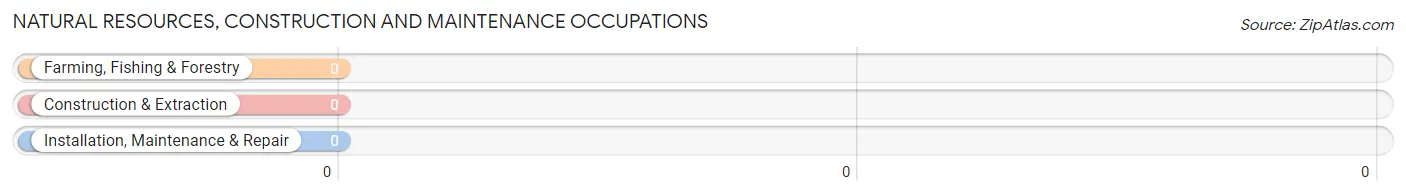
Natural Resources, Construction and Maintenance Occupations
Natural Resources, Construction and Maintenance Occupations by Sex
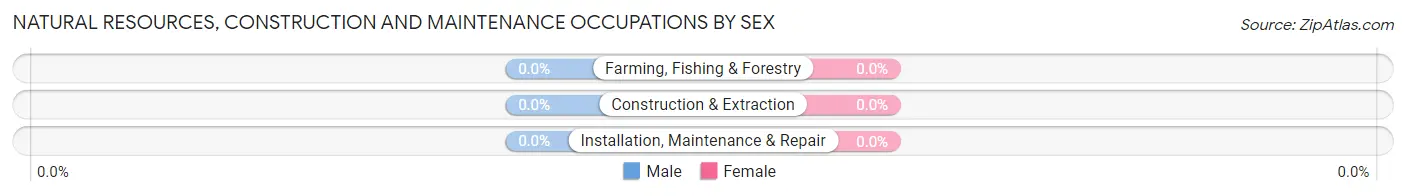
| Occupation | Male | Female |
| Farming, Fishing & Forestry | 0 (0.0%) | 0 (0.0%) |
| Construction & Extraction | 0 (0.0%) | 0 (0.0%) |
| Installation, Maintenance & Repair | 0 (0.0%) | 0 (0.0%) |
| Total (Category) | 0 (0.0%) | 0 (0.0%) |
| Total (Overall) | 131 (74.4%) | 45 (25.6%) |
Production, Transportation and Moving Occupations
The most common Production, Transportation and Moving occupations in Flintville are , and Transportation (39 | 22.2%).
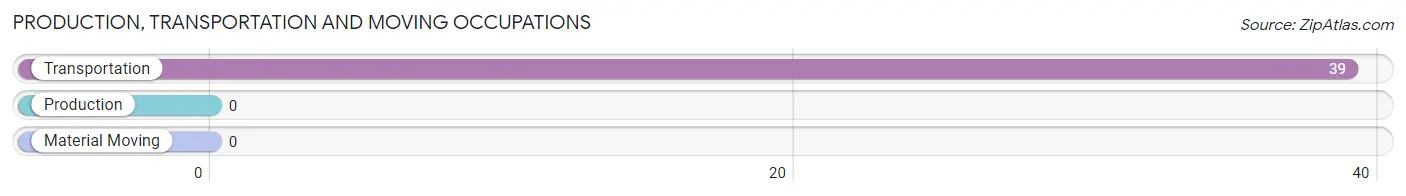
Production, Transportation and Moving Occupations by Sex
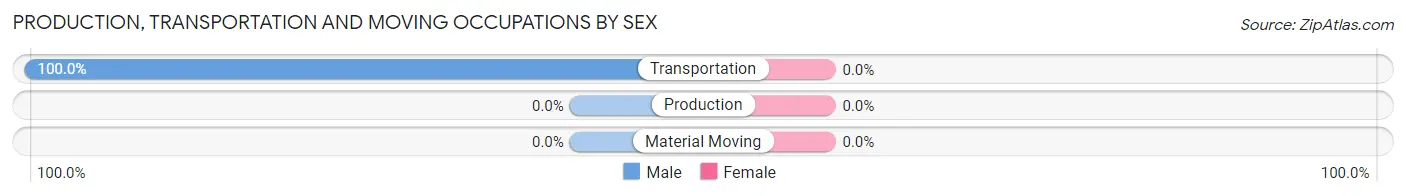
| Occupation | Male | Female |
| Production | 0 (0.0%) | 0 (0.0%) |
| Transportation | 39 (100.0%) | 0 (0.0%) |
| Material Moving | 0 (0.0%) | 0 (0.0%) |
| Total (Category) | 39 (100.0%) | 0 (0.0%) |
| Total (Overall) | 131 (74.4%) | 45 (25.6%) |
Employment Industries by Sex in Flintville
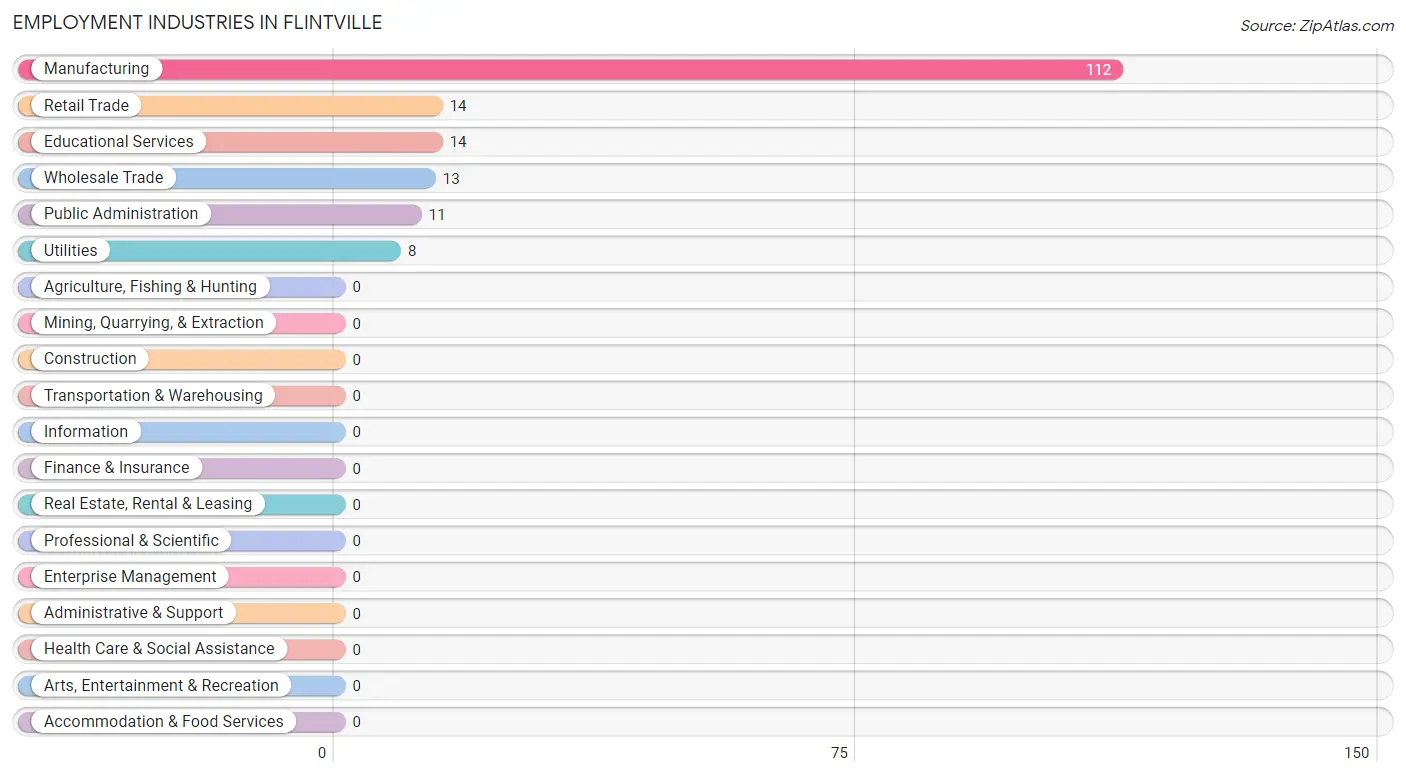
Employment Industries in Flintville
The major employment industries in Flintville include Manufacturing (112 | 63.6%), Retail Trade (14 | 8.0%), Educational Services (14 | 8.0%), Wholesale Trade (13 | 7.4%), and Public Administration (11 | 6.2%).
Employment Industries by Sex in Flintville
The Flintville industries that see more men than women are Manufacturing (100.0%), Utilities (100.0%), and Public Administration (100.0%), whereas the industries that tend to have a higher number of women are Wholesale Trade (100.0%), Retail Trade (100.0%), and Educational Services (100.0%).
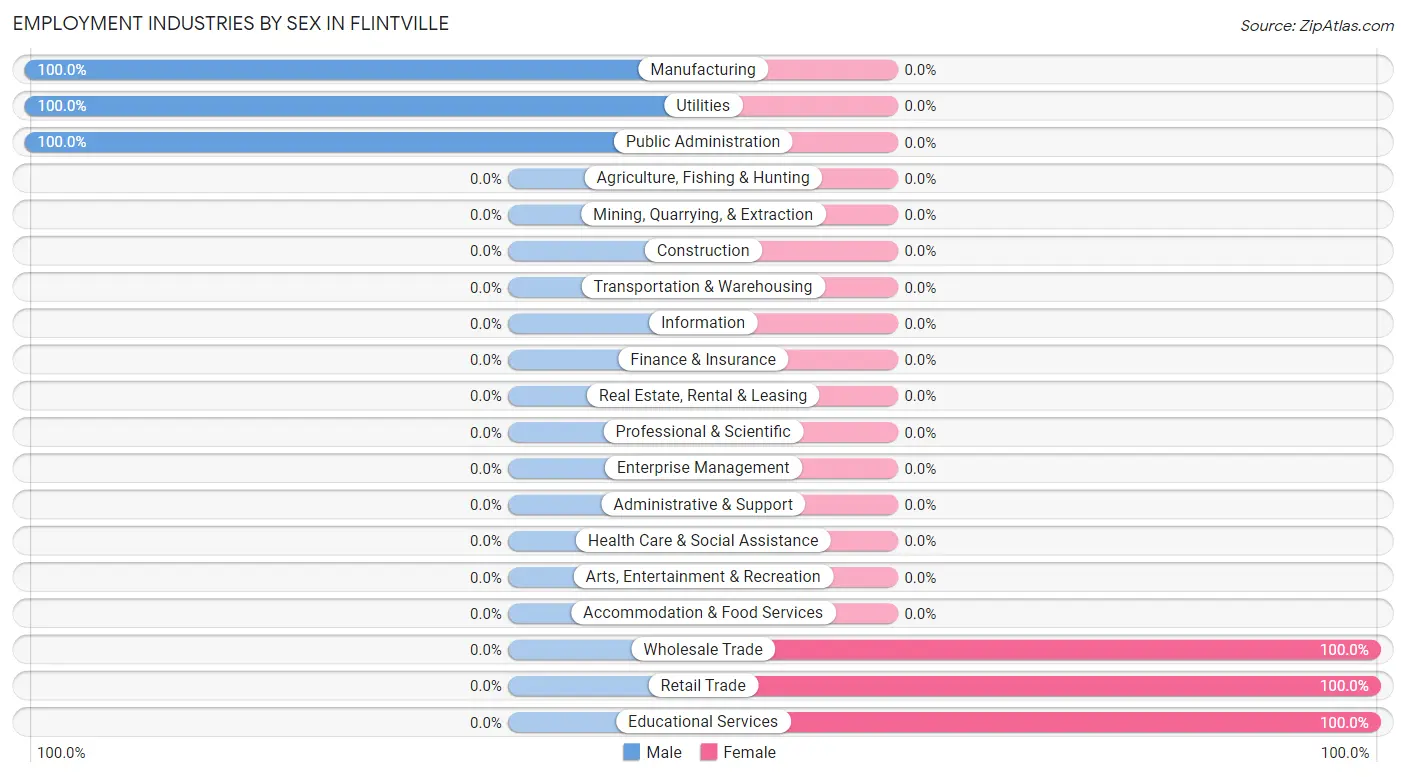
| Industry | Male | Female |
| Agriculture, Fishing & Hunting | 0 (0.0%) | 0 (0.0%) |
| Mining, Quarrying, & Extraction | 0 (0.0%) | 0 (0.0%) |
| Construction | 0 (0.0%) | 0 (0.0%) |
| Manufacturing | 112 (100.0%) | 0 (0.0%) |
| Wholesale Trade | 0 (0.0%) | 13 (100.0%) |
| Retail Trade | 0 (0.0%) | 14 (100.0%) |
| Transportation & Warehousing | 0 (0.0%) | 0 (0.0%) |
| Utilities | 8 (100.0%) | 0 (0.0%) |
| Information | 0 (0.0%) | 0 (0.0%) |
| Finance & Insurance | 0 (0.0%) | 0 (0.0%) |
| Real Estate, Rental & Leasing | 0 (0.0%) | 0 (0.0%) |
| Professional & Scientific | 0 (0.0%) | 0 (0.0%) |
| Enterprise Management | 0 (0.0%) | 0 (0.0%) |
| Administrative & Support | 0 (0.0%) | 0 (0.0%) |
| Educational Services | 0 (0.0%) | 14 (100.0%) |
| Health Care & Social Assistance | 0 (0.0%) | 0 (0.0%) |
| Arts, Entertainment & Recreation | 0 (0.0%) | 0 (0.0%) |
| Accommodation & Food Services | 0 (0.0%) | 0 (0.0%) |
| Public Administration | 11 (100.0%) | 0 (0.0%) |
| Total | 131 (74.4%) | 45 (25.6%) |
Education in Flintville
School Enrollment in Flintville
The most common levels of schooling among the 74 students in Flintville are college / undergraduate (34 | 46.0%), middle school (26 | 35.1%), and high school (14 | 18.9%).
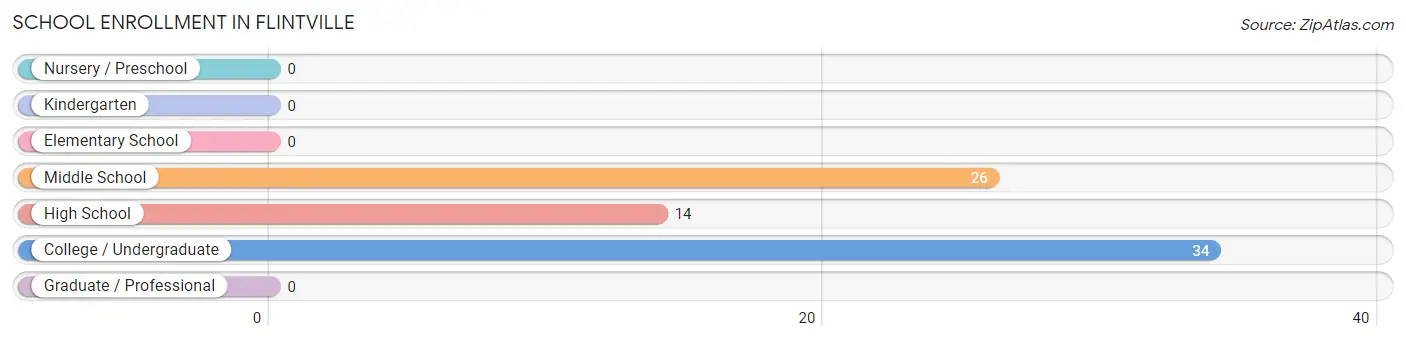
| School Level | # Students | % Students |
| Nursery / Preschool | 0 | 0.0% |
| Kindergarten | 0 | 0.0% |
| Elementary School | 0 | 0.0% |
| Middle School | 26 | 35.1% |
| High School | 14 | 18.9% |
| College / Undergraduate | 34 | 46.0% |
| Graduate / Professional | 0 | 0.0% |
| Total | 74 | 100.0% |
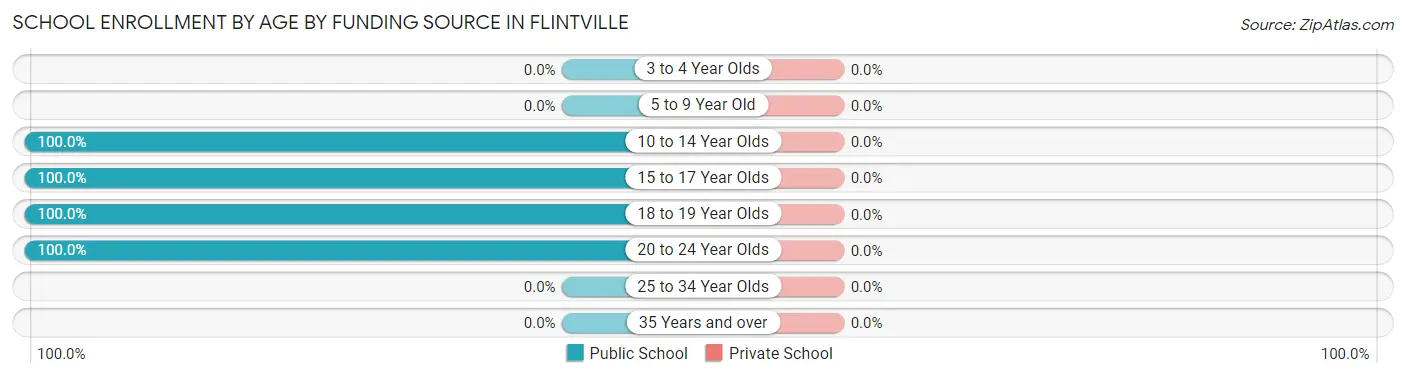
School Enrollment by Age by Funding Source in Flintville
| Age Bracket | Public School | Private School |
| 3 to 4 Year Olds | 0 (0.0%) | 0 (0.0%) |
| 5 to 9 Year Old | 0 (0.0%) | 0 (0.0%) |
| 10 to 14 Year Olds | 26 (100.0%) | 0 (0.0%) |
| 15 to 17 Year Olds | 14 (100.0%) | 0 (0.0%) |
| 18 to 19 Year Olds | 13 (100.0%) | 0 (0.0%) |
| 20 to 24 Year Olds | 21 (100.0%) | 0 (0.0%) |
| 25 to 34 Year Olds | 0 (0.0%) | 0 (0.0%) |
| 35 Years and over | 0 (0.0%) | 0 (0.0%) |
| Total | 74 (100.0%) | 0 (0.0%) |
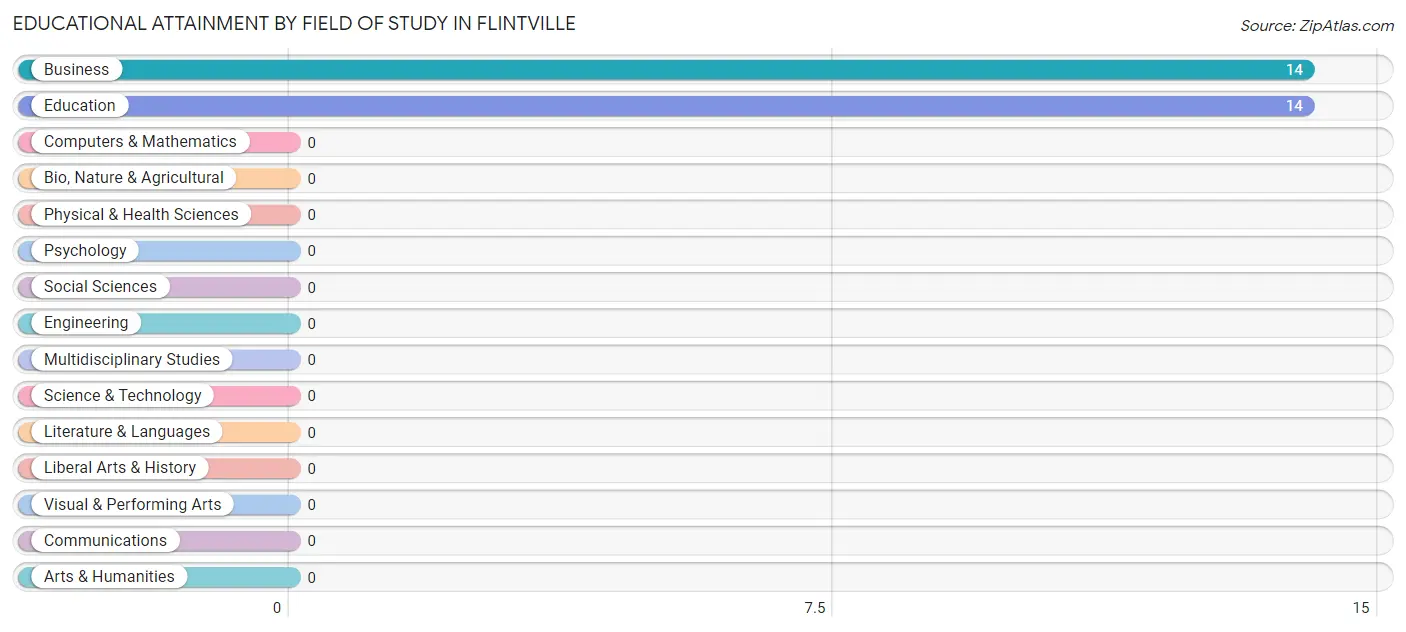
Educational Attainment by Field of Study in Flintville
Business (14 | 50.0%), and education (14 | 50.0%) are the most common fields of study among 28 individuals in Flintville who have obtained a bachelor's degree or higher.
| Field of Study | # Graduates | % Graduates |
| Computers & Mathematics | 0 | 0.0% |
| Bio, Nature & Agricultural | 0 | 0.0% |
| Physical & Health Sciences | 0 | 0.0% |
| Psychology | 0 | 0.0% |
| Social Sciences | 0 | 0.0% |
| Engineering | 0 | 0.0% |
| Multidisciplinary Studies | 0 | 0.0% |
| Science & Technology | 0 | 0.0% |
| Business | 14 | 50.0% |
| Education | 14 | 50.0% |
| Literature & Languages | 0 | 0.0% |
| Liberal Arts & History | 0 | 0.0% |
| Visual & Performing Arts | 0 | 0.0% |
| Communications | 0 | 0.0% |
| Arts & Humanities | 0 | 0.0% |
| Total | 28 | 100.0% |
Transportation & Commute in Flintville
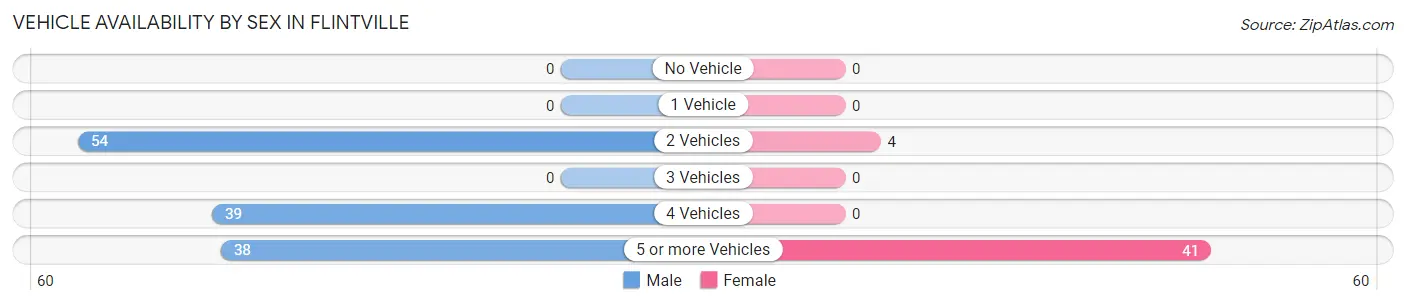
Vehicle Availability by Sex in Flintville
The most prevalent vehicle ownership categories in Flintville are males with 2 vehicles (54, accounting for 41.2%) and females with 2 vehicles (4, making up 120.0%).
| Vehicles Available | Male | Female |
| No Vehicle | 0 (0.0%) | 0 (0.0%) |
| 1 Vehicle | 0 (0.0%) | 0 (0.0%) |
| 2 Vehicles | 54 (41.2%) | 4 (8.9%) |
| 3 Vehicles | 0 (0.0%) | 0 (0.0%) |
| 4 Vehicles | 39 (29.8%) | 0 (0.0%) |
| 5 or more Vehicles | 38 (29.0%) | 41 (91.1%) |
| Total | 131 (100.0%) | 45 (100.0%) |
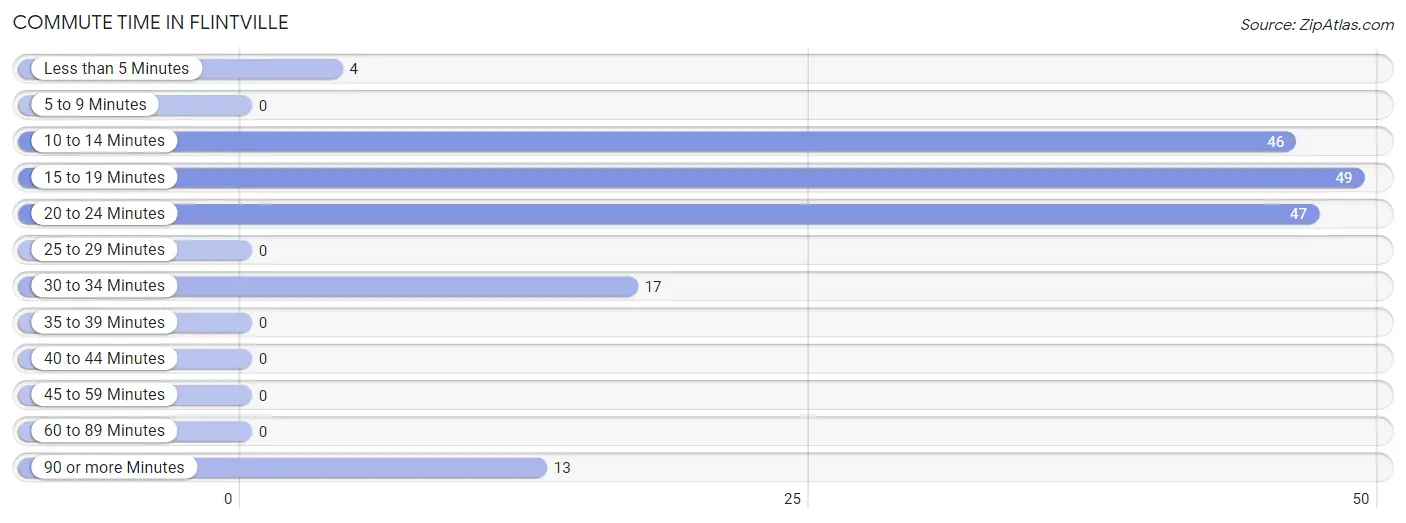
Commute Time in Flintville
The most frequently occuring commute durations in Flintville are 15 to 19 minutes (49 commuters, 27.8%), 20 to 24 minutes (47 commuters, 26.7%), and 10 to 14 minutes (46 commuters, 26.1%).
| Commute Time | # Commuters | % Commuters |
| Less than 5 Minutes | 4 | 2.3% |
| 5 to 9 Minutes | 0 | 0.0% |
| 10 to 14 Minutes | 46 | 26.1% |
| 15 to 19 Minutes | 49 | 27.8% |
| 20 to 24 Minutes | 47 | 26.7% |
| 25 to 29 Minutes | 0 | 0.0% |
| 30 to 34 Minutes | 17 | 9.7% |
| 35 to 39 Minutes | 0 | 0.0% |
| 40 to 44 Minutes | 0 | 0.0% |
| 45 to 59 Minutes | 0 | 0.0% |
| 60 to 89 Minutes | 0 | 0.0% |
| 90 or more Minutes | 13 | 7.4% |
Commute Time by Sex in Flintville
The most common commute times in Flintville are 20 to 24 minutes (47 commuters, 35.9%) for males and 15 to 19 minutes (28 commuters, 62.2%) for females.
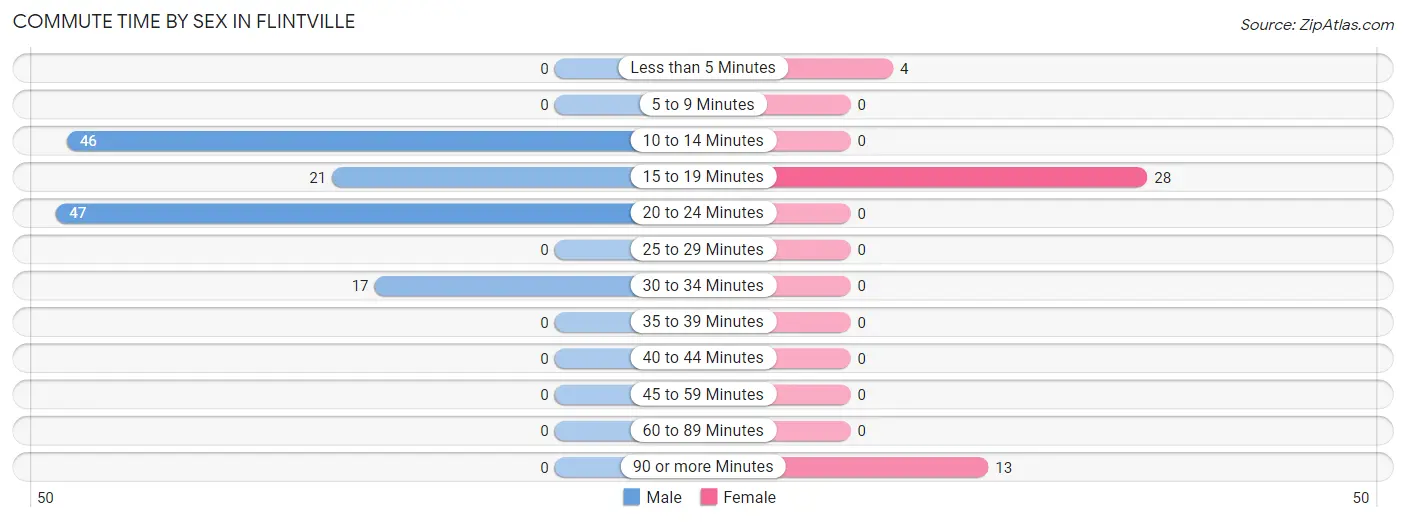
| Commute Time | Male | Female |
| Less than 5 Minutes | 0 (0.0%) | 4 (8.9%) |
| 5 to 9 Minutes | 0 (0.0%) | 0 (0.0%) |
| 10 to 14 Minutes | 46 (35.1%) | 0 (0.0%) |
| 15 to 19 Minutes | 21 (16.0%) | 28 (62.2%) |
| 20 to 24 Minutes | 47 (35.9%) | 0 (0.0%) |
| 25 to 29 Minutes | 0 (0.0%) | 0 (0.0%) |
| 30 to 34 Minutes | 17 (13.0%) | 0 (0.0%) |
| 35 to 39 Minutes | 0 (0.0%) | 0 (0.0%) |
| 40 to 44 Minutes | 0 (0.0%) | 0 (0.0%) |
| 45 to 59 Minutes | 0 (0.0%) | 0 (0.0%) |
| 60 to 89 Minutes | 0 (0.0%) | 0 (0.0%) |
| 90 or more Minutes | 0 (0.0%) | 13 (28.9%) |
Time of Departure to Work by Sex in Flintville
The most frequent times of departure to work in Flintville are 12:00 AM to 4:59 AM (60, 45.8%) for males and 6:00 AM to 6:29 AM (14, 31.1%) for females.
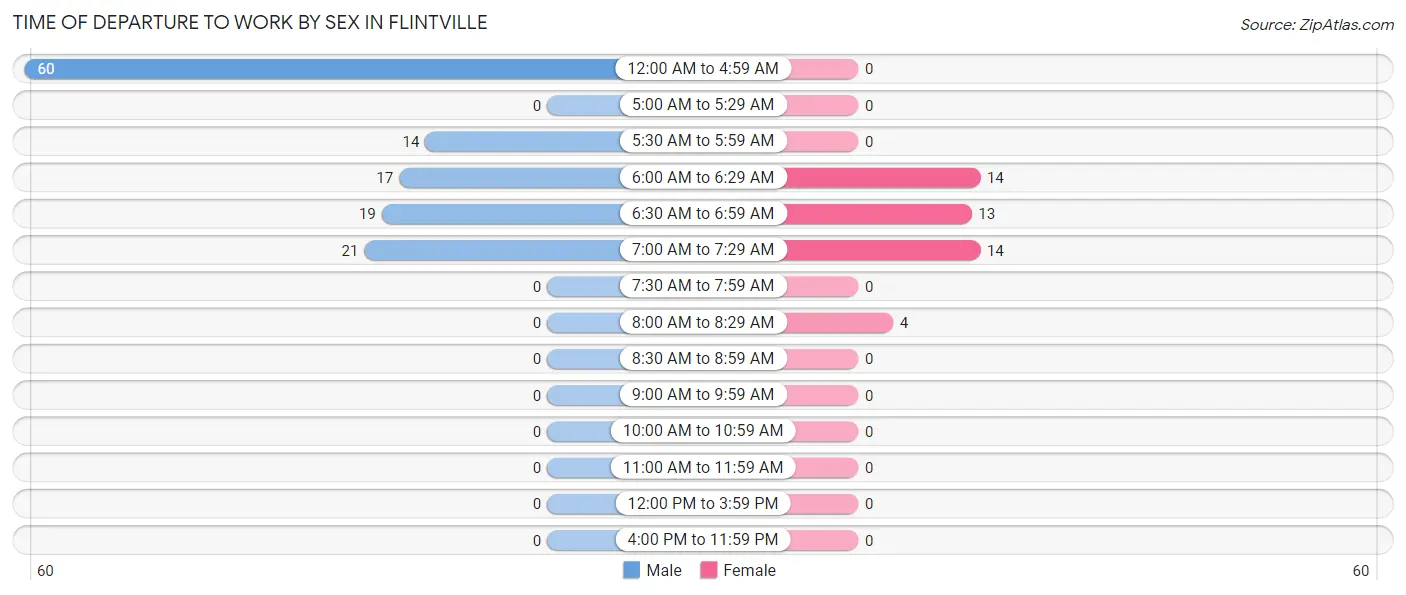
| Time of Departure | Male | Female |
| 12:00 AM to 4:59 AM | 60 (45.8%) | 0 (0.0%) |
| 5:00 AM to 5:29 AM | 0 (0.0%) | 0 (0.0%) |
| 5:30 AM to 5:59 AM | 14 (10.7%) | 0 (0.0%) |
| 6:00 AM to 6:29 AM | 17 (13.0%) | 14 (31.1%) |
| 6:30 AM to 6:59 AM | 19 (14.5%) | 13 (28.9%) |
| 7:00 AM to 7:29 AM | 21 (16.0%) | 14 (31.1%) |
| 7:30 AM to 7:59 AM | 0 (0.0%) | 0 (0.0%) |
| 8:00 AM to 8:29 AM | 0 (0.0%) | 4 (8.9%) |
| 8:30 AM to 8:59 AM | 0 (0.0%) | 0 (0.0%) |
| 9:00 AM to 9:59 AM | 0 (0.0%) | 0 (0.0%) |
| 10:00 AM to 10:59 AM | 0 (0.0%) | 0 (0.0%) |
| 11:00 AM to 11:59 AM | 0 (0.0%) | 0 (0.0%) |
| 12:00 PM to 3:59 PM | 0 (0.0%) | 0 (0.0%) |
| 4:00 PM to 11:59 PM | 0 (0.0%) | 0 (0.0%) |
| Total | 131 (100.0%) | 45 (100.0%) |
Housing Occupancy in Flintville
Occupancy by Ownership in Flintville
Of the total 219 dwellings in Flintville, owner-occupied units account for 182 (83.1%), while renter-occupied units make up 37 (16.9%).
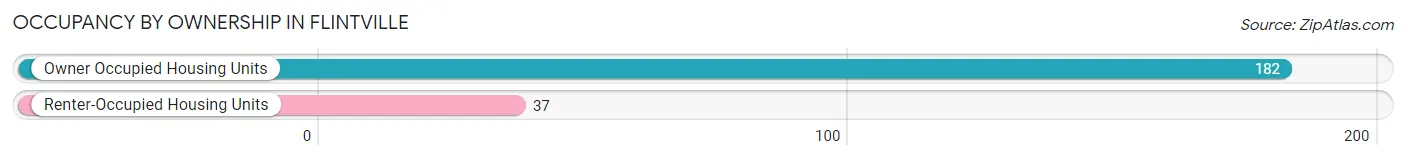
| Occupancy | # Housing Units | % Housing Units |
| Owner Occupied Housing Units | 182 | 83.1% |
| Renter-Occupied Housing Units | 37 | 16.9% |
| Total Occupied Housing Units | 219 | 100.0% |
Occupancy by Household Size in Flintville
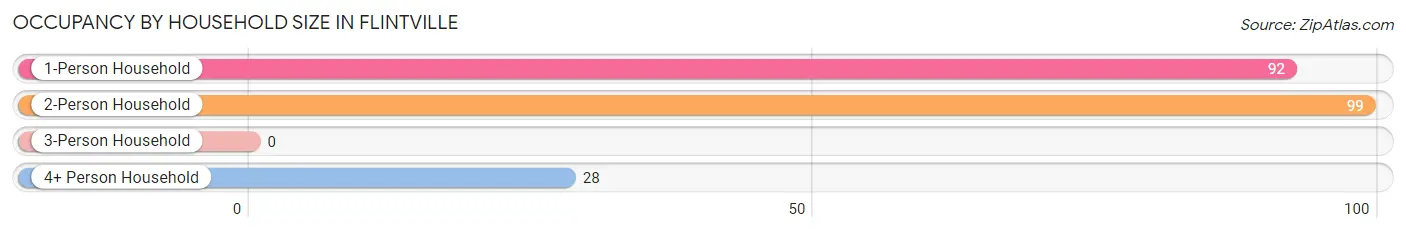
| Household Size | # Housing Units | % Housing Units |
| 1-Person Household | 92 | 42.0% |
| 2-Person Household | 99 | 45.2% |
| 3-Person Household | 0 | 0.0% |
| 4+ Person Household | 28 | 12.8% |
| Total Housing Units | 219 | 100.0% |
Occupancy by Ownership by Household Size in Flintville
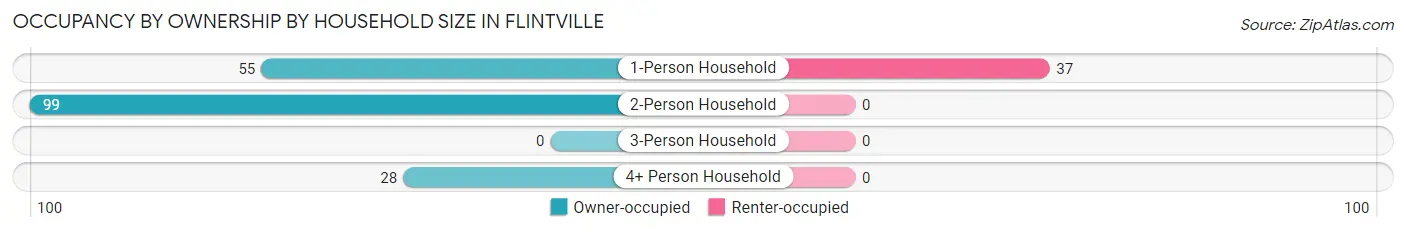
| Household Size | Owner-occupied | Renter-occupied |
| 1-Person Household | 55 (59.8%) | 37 (40.2%) |
| 2-Person Household | 99 (100.0%) | 0 (0.0%) |
| 3-Person Household | 0 (0.0%) | 0 (0.0%) |
| 4+ Person Household | 28 (100.0%) | 0 (0.0%) |
| Total Housing Units | 182 (83.1%) | 37 (16.9%) |
Occupancy by Educational Attainment in Flintville
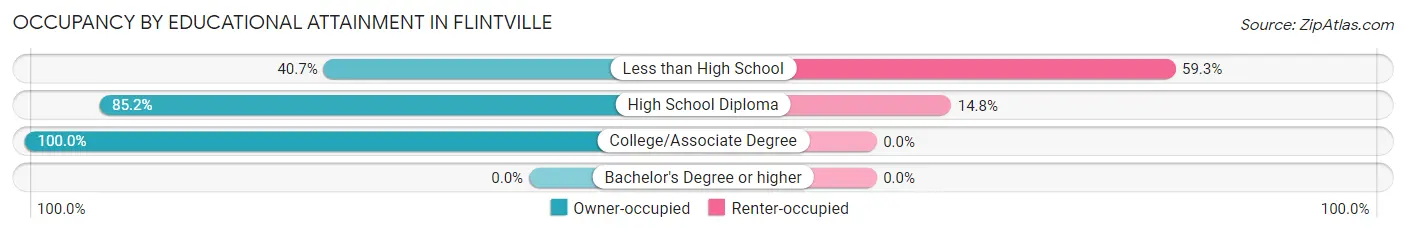
| Household Size | Owner-occupied | Renter-occupied |
| Less than High School | 11 (40.7%) | 16 (59.3%) |
| High School Diploma | 121 (85.2%) | 21 (14.8%) |
| College/Associate Degree | 50 (100.0%) | 0 (0.0%) |
| Bachelor's Degree or higher | 0 (0.0%) | 0 (0.0%) |
Occupancy by Age of Householder in Flintville
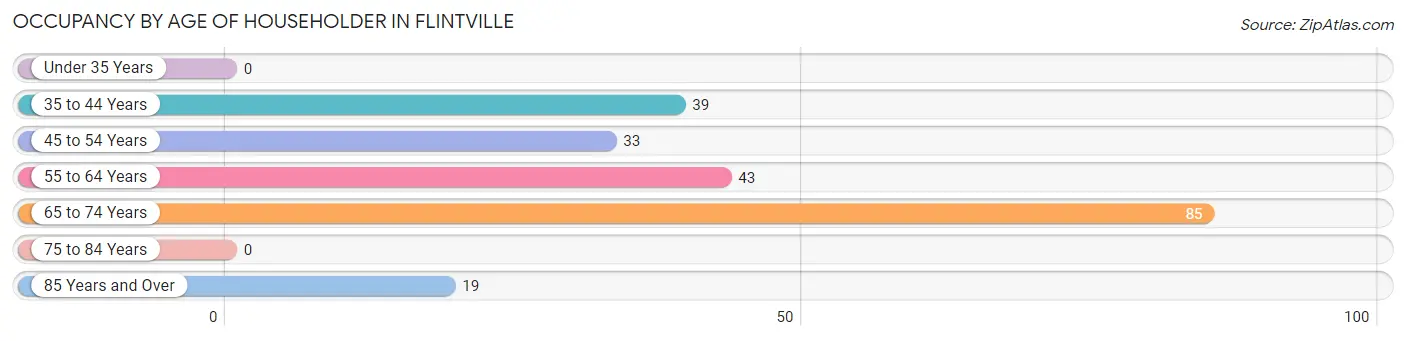
| Age Bracket | # Households | % Households |
| Under 35 Years | 0 | 0.0% |
| 35 to 44 Years | 39 | 17.8% |
| 45 to 54 Years | 33 | 15.1% |
| 55 to 64 Years | 43 | 19.6% |
| 65 to 74 Years | 85 | 38.8% |
| 75 to 84 Years | 0 | 0.0% |
| 85 Years and Over | 19 | 8.7% |
| Total | 219 | 100.0% |
Housing Finances in Flintville
Median Income by Occupancy in Flintville
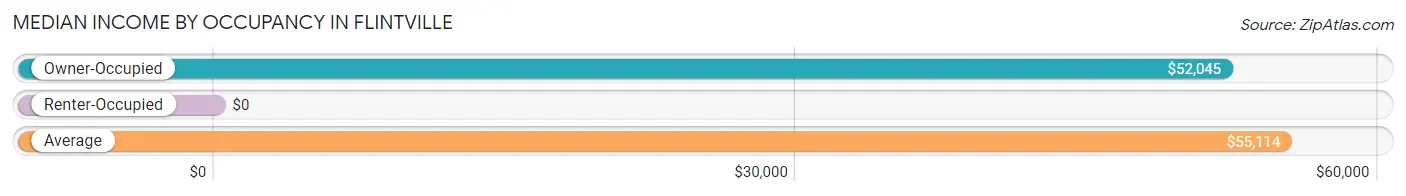
| Occupancy Type | # Households | Median Income |
| Owner-Occupied | 182 (83.1%) | $52,045 |
| Renter-Occupied | 37 (16.9%) | $0 |
| Average | 219 (100.0%) | $55,114 |
Occupancy by Householder Income Bracket in Flintville
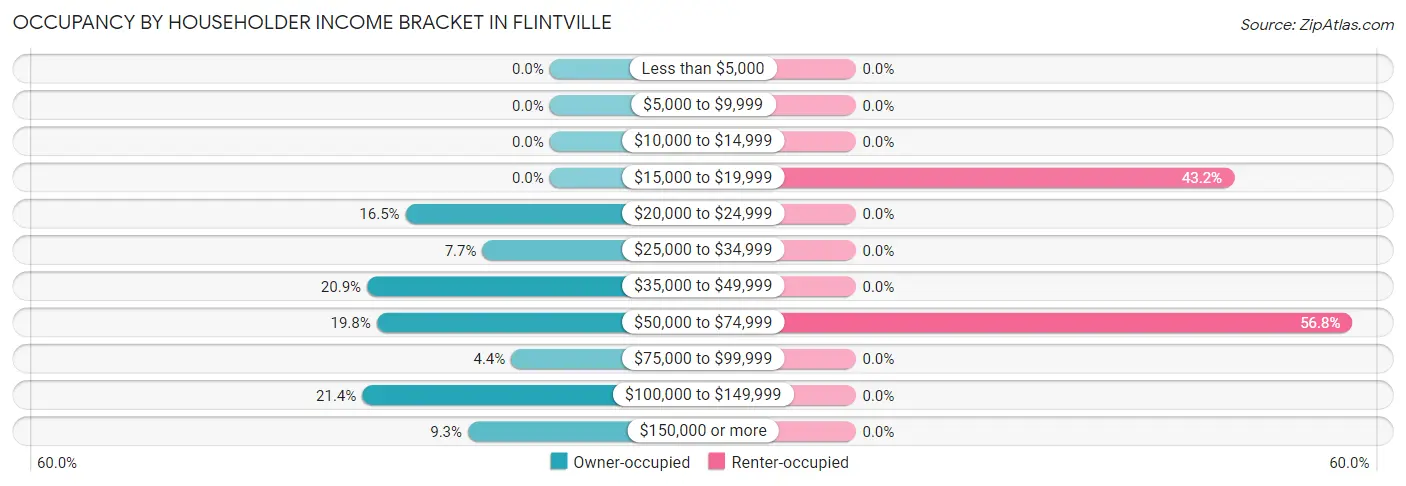
| Income Bracket | Owner-occupied | Renter-occupied |
| Less than $5,000 | 0 (0.0%) | 0 (0.0%) |
| $5,000 to $9,999 | 0 (0.0%) | 0 (0.0%) |
| $10,000 to $14,999 | 0 (0.0%) | 0 (0.0%) |
| $15,000 to $19,999 | 0 (0.0%) | 16 (43.2%) |
| $20,000 to $24,999 | 30 (16.5%) | 0 (0.0%) |
| $25,000 to $34,999 | 14 (7.7%) | 0 (0.0%) |
| $35,000 to $49,999 | 38 (20.9%) | 0 (0.0%) |
| $50,000 to $74,999 | 36 (19.8%) | 21 (56.8%) |
| $75,000 to $99,999 | 8 (4.4%) | 0 (0.0%) |
| $100,000 to $149,999 | 39 (21.4%) | 0 (0.0%) |
| $150,000 or more | 17 (9.3%) | 0 (0.0%) |
| Total | 182 (100.0%) | 37 (100.0%) |
Monthly Housing Cost Tiers in Flintville
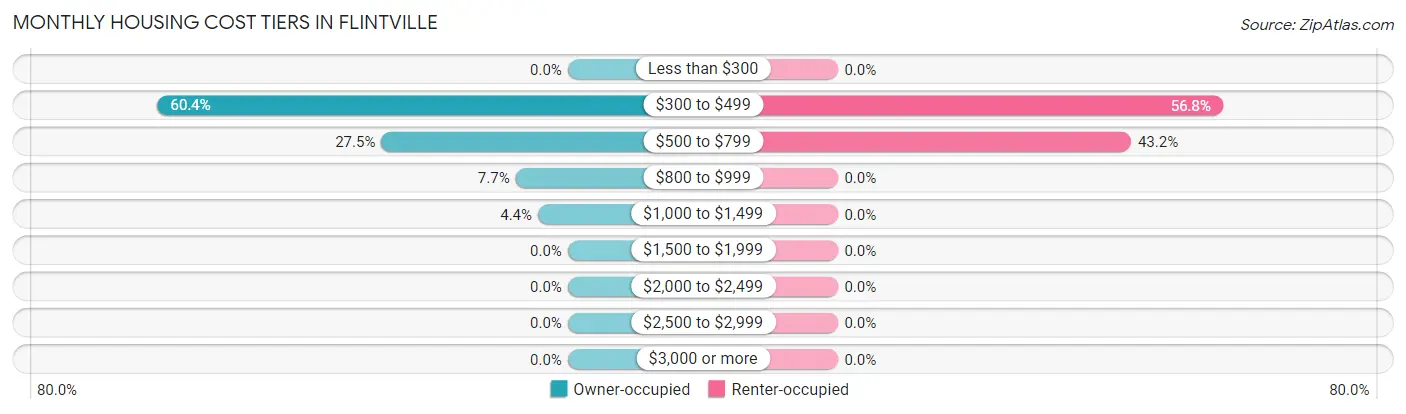
| Monthly Cost | Owner-occupied | Renter-occupied |
| Less than $300 | 0 (0.0%) | 0 (0.0%) |
| $300 to $499 | 110 (60.4%) | 21 (56.8%) |
| $500 to $799 | 50 (27.5%) | 16 (43.2%) |
| $800 to $999 | 14 (7.7%) | 0 (0.0%) |
| $1,000 to $1,499 | 8 (4.4%) | 0 (0.0%) |
| $1,500 to $1,999 | 0 (0.0%) | 0 (0.0%) |
| $2,000 to $2,499 | 0 (0.0%) | 0 (0.0%) |
| $2,500 to $2,999 | 0 (0.0%) | 0 (0.0%) |
| $3,000 or more | 0 (0.0%) | 0 (0.0%) |
| Total | 182 (100.0%) | 37 (100.0%) |
Physical Housing Characteristics in Flintville
Housing Structures in Flintville
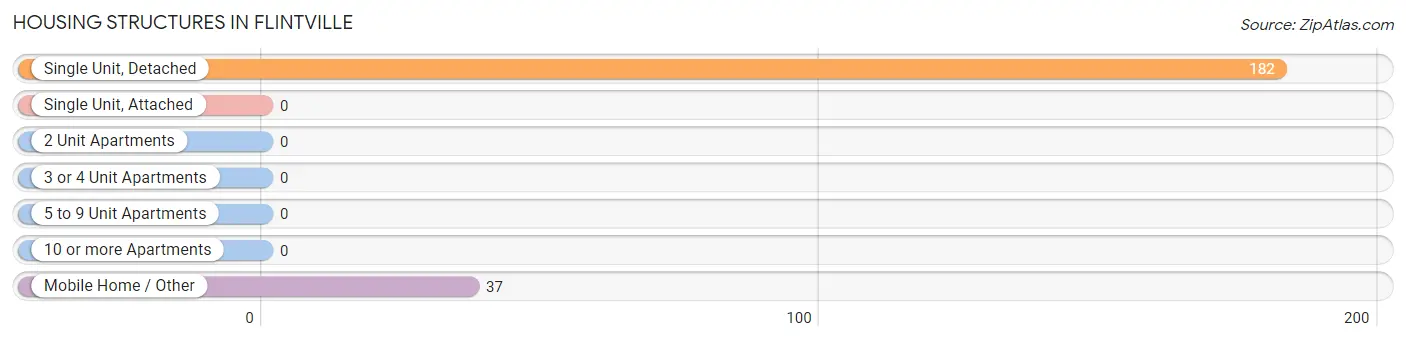
| Structure Type | # Housing Units | % Housing Units |
| Single Unit, Detached | 182 | 83.1% |
| Single Unit, Attached | 0 | 0.0% |
| 2 Unit Apartments | 0 | 0.0% |
| 3 or 4 Unit Apartments | 0 | 0.0% |
| 5 to 9 Unit Apartments | 0 | 0.0% |
| 10 or more Apartments | 0 | 0.0% |
| Mobile Home / Other | 37 | 16.9% |
| Total | 219 | 100.0% |
Housing Structures by Occupancy in Flintville
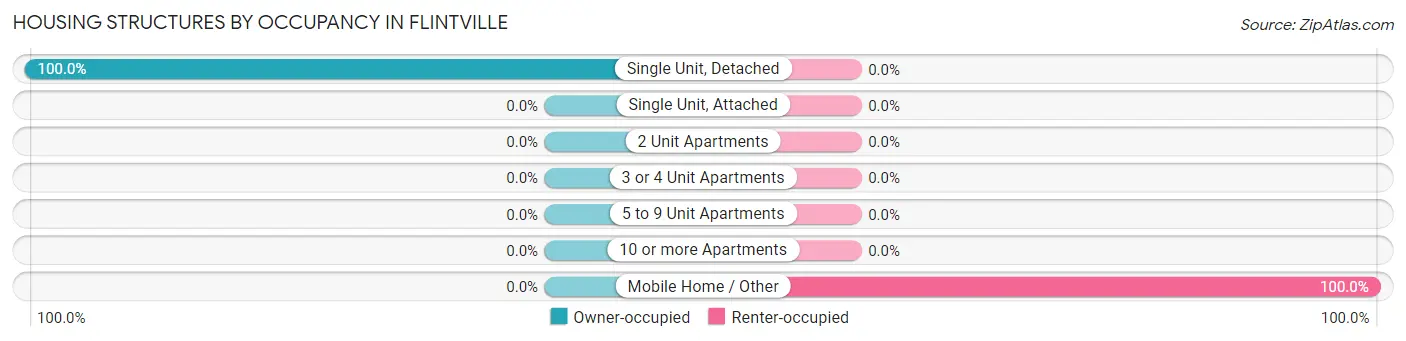
| Structure Type | Owner-occupied | Renter-occupied |
| Single Unit, Detached | 182 (100.0%) | 0 (0.0%) |
| Single Unit, Attached | 0 (0.0%) | 0 (0.0%) |
| 2 Unit Apartments | 0 (0.0%) | 0 (0.0%) |
| 3 or 4 Unit Apartments | 0 (0.0%) | 0 (0.0%) |
| 5 to 9 Unit Apartments | 0 (0.0%) | 0 (0.0%) |
| 10 or more Apartments | 0 (0.0%) | 0 (0.0%) |
| Mobile Home / Other | 0 (0.0%) | 37 (100.0%) |
| Total | 182 (83.1%) | 37 (16.9%) |
Housing Structures by Number of Rooms in Flintville
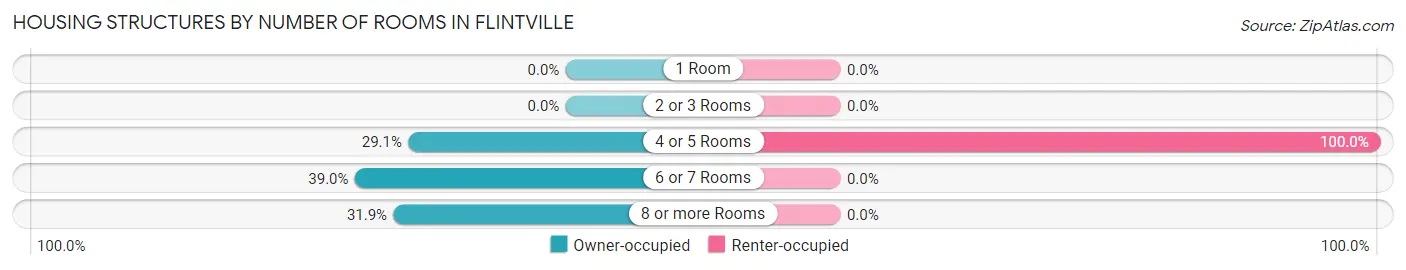
| Number of Rooms | Owner-occupied | Renter-occupied |
| 1 Room | 0 (0.0%) | 0 (0.0%) |
| 2 or 3 Rooms | 0 (0.0%) | 0 (0.0%) |
| 4 or 5 Rooms | 53 (29.1%) | 37 (100.0%) |
| 6 or 7 Rooms | 71 (39.0%) | 0 (0.0%) |
| 8 or more Rooms | 58 (31.9%) | 0 (0.0%) |
| Total | 182 (100.0%) | 37 (100.0%) |
Housing Structure by Heating Type in Flintville
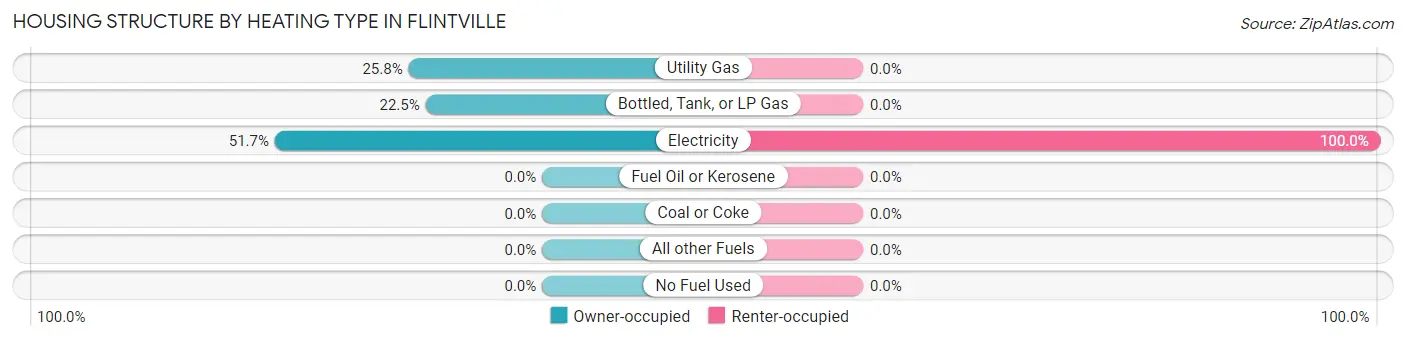
| Heating Type | Owner-occupied | Renter-occupied |
| Utility Gas | 47 (25.8%) | 0 (0.0%) |
| Bottled, Tank, or LP Gas | 41 (22.5%) | 0 (0.0%) |
| Electricity | 94 (51.6%) | 37 (100.0%) |
| Fuel Oil or Kerosene | 0 (0.0%) | 0 (0.0%) |
| Coal or Coke | 0 (0.0%) | 0 (0.0%) |
| All other Fuels | 0 (0.0%) | 0 (0.0%) |
| No Fuel Used | 0 (0.0%) | 0 (0.0%) |
| Total | 182 (100.0%) | 37 (100.0%) |
Household Vehicle Usage in Flintville
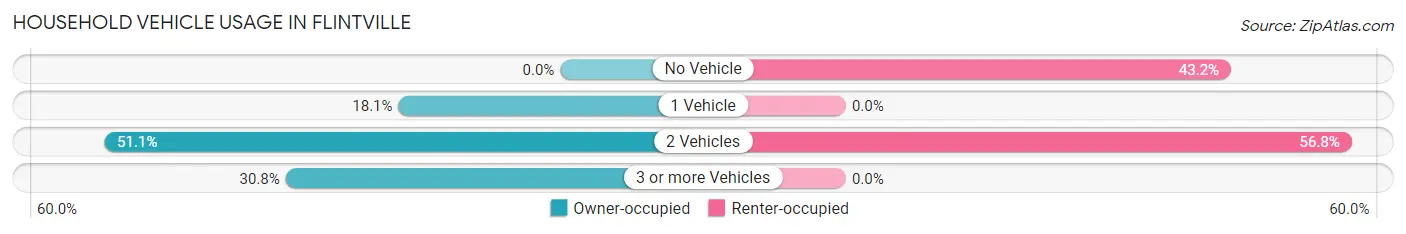
| Vehicles per Household | Owner-occupied | Renter-occupied |
| No Vehicle | 0 (0.0%) | 16 (43.2%) |
| 1 Vehicle | 33 (18.1%) | 0 (0.0%) |
| 2 Vehicles | 93 (51.1%) | 21 (56.8%) |
| 3 or more Vehicles | 56 (30.8%) | 0 (0.0%) |
| Total | 182 (100.0%) | 37 (100.0%) |
Real Estate & Mortgages in Flintville
Real Estate and Mortgage Overview in Flintville
| Characteristic | Without Mortgage | With Mortgage |
| Housing Units | 149 | 33 |
| Median Property Value | $159,600 | $182,800 |
| Median Household Income | - | - |
| Monthly Housing Costs | $419 | $0 |
| Real Estate Taxes | $787 | $0 |
Property Value by Mortgage Status in Flintville
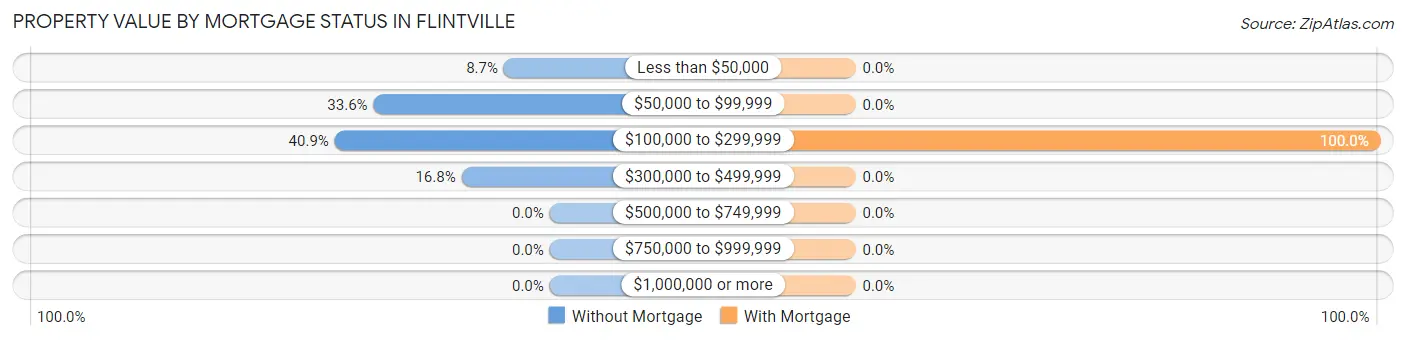
| Property Value | Without Mortgage | With Mortgage |
| Less than $50,000 | 13 (8.7%) | 0 (0.0%) |
| $50,000 to $99,999 | 50 (33.6%) | 0 (0.0%) |
| $100,000 to $299,999 | 61 (40.9%) | 33 (100.0%) |
| $300,000 to $499,999 | 25 (16.8%) | 0 (0.0%) |
| $500,000 to $749,999 | 0 (0.0%) | 0 (0.0%) |
| $750,000 to $999,999 | 0 (0.0%) | 0 (0.0%) |
| $1,000,000 or more | 0 (0.0%) | 0 (0.0%) |
| Total | 149 (100.0%) | 33 (100.0%) |
Household Income by Mortgage Status in Flintville
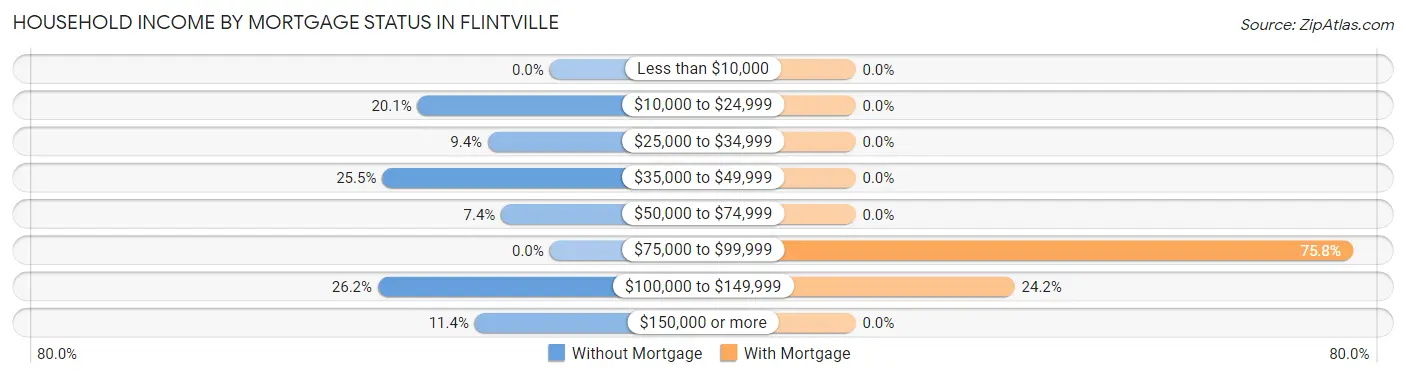
| Household Income | Without Mortgage | With Mortgage |
| Less than $10,000 | 0 (0.0%) | 0 (0.0%) |
| $10,000 to $24,999 | 30 (20.1%) | 0 (0.0%) |
| $25,000 to $34,999 | 14 (9.4%) | 0 (0.0%) |
| $35,000 to $49,999 | 38 (25.5%) | 0 (0.0%) |
| $50,000 to $74,999 | 11 (7.4%) | 0 (0.0%) |
| $75,000 to $99,999 | 0 (0.0%) | 25 (75.8%) |
| $100,000 to $149,999 | 39 (26.2%) | 8 (24.2%) |
| $150,000 or more | 17 (11.4%) | 0 (0.0%) |
| Total | 149 (100.0%) | 33 (100.0%) |
Property Value to Household Income Ratio in Flintville
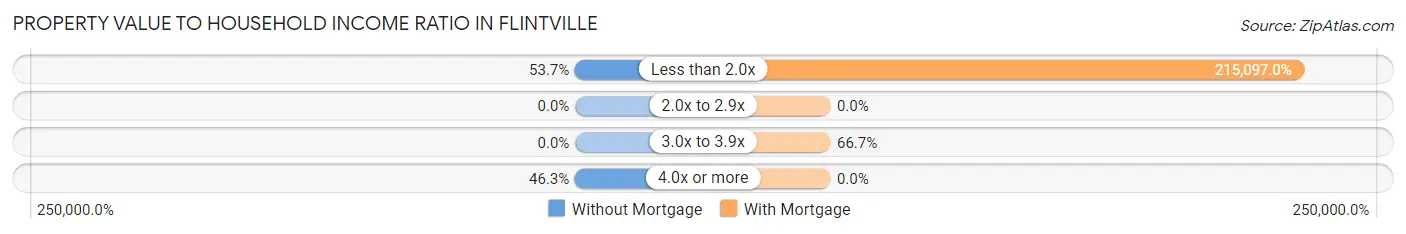
| Value-to-Income Ratio | Without Mortgage | With Mortgage |
| Less than 2.0x | 80 (53.7%) | 70,982 (215,097.0%) |
| 2.0x to 2.9x | 0 (0.0%) | 0 (0.0%) |
| 3.0x to 3.9x | 0 (0.0%) | 22 (66.7%) |
| 4.0x or more | 69 (46.3%) | 0 (0.0%) |
| Total | 149 (100.0%) | 33 (100.0%) |
Real Estate Taxes by Mortgage Status in Flintville
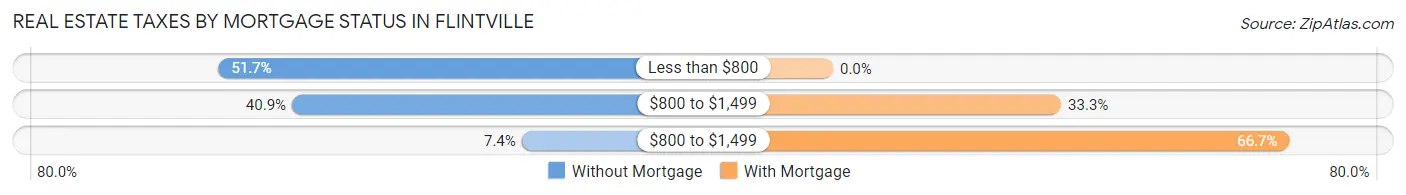
| Property Taxes | Without Mortgage | With Mortgage |
| Less than $800 | 77 (51.7%) | 0 (0.0%) |
| $800 to $1,499 | 61 (40.9%) | 11 (33.3%) |
| $800 to $1,499 | 11 (7.4%) | 22 (66.7%) |
| Total | 149 (100.0%) | 33 (100.0%) |
Health & Disability in Flintville
Health Insurance Coverage by Age in Flintville
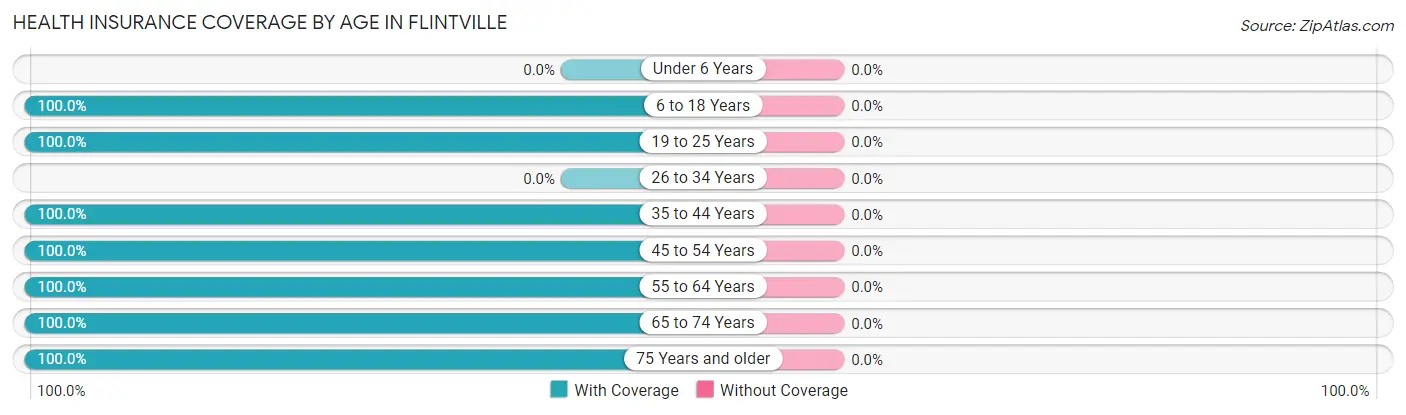
| Age Bracket | With Coverage | Without Coverage |
| Under 6 Years | 0 (0.0%) | 0 (0.0%) |
| 6 to 18 Years | 40 (100.0%) | 0 (0.0%) |
| 19 to 25 Years | 51 (100.0%) | 0 (0.0%) |
| 26 to 34 Years | 0 (0.0%) | 0 (0.0%) |
| 35 to 44 Years | 39 (100.0%) | 0 (0.0%) |
| 45 to 54 Years | 51 (100.0%) | 0 (0.0%) |
| 55 to 64 Years | 57 (100.0%) | 0 (0.0%) |
| 65 to 74 Years | 122 (100.0%) | 0 (0.0%) |
| 75 Years and older | 70 (100.0%) | 0 (0.0%) |
| Total | 430 (100.0%) | 0 (0.0%) |
Health Insurance Coverage by Citizenship Status in Flintville
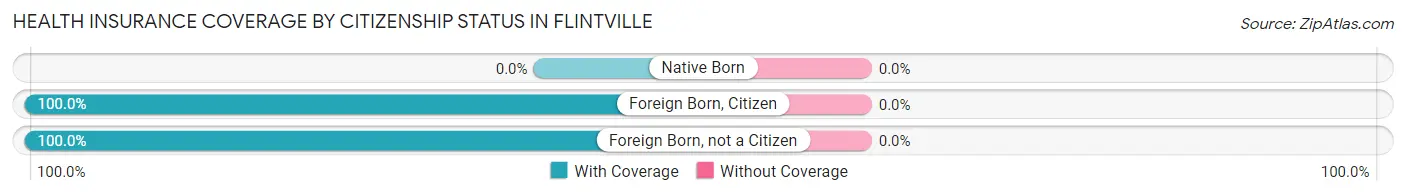
| Citizenship Status | With Coverage | Without Coverage |
| Native Born | 0 (0.0%) | 0 (0.0%) |
| Foreign Born, Citizen | 40 (100.0%) | 0 (0.0%) |
| Foreign Born, not a Citizen | 51 (100.0%) | 0 (0.0%) |
Health Insurance Coverage by Household Income in Flintville
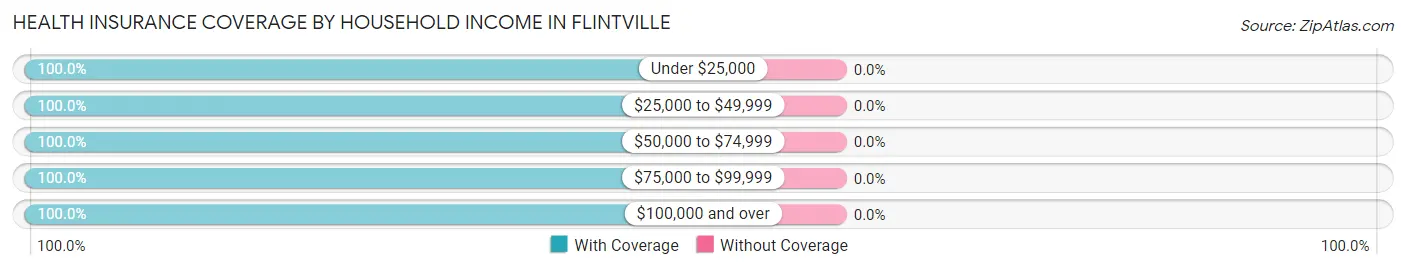
| Household Income | With Coverage | Without Coverage |
| Under $25,000 | 46 (100.0%) | 0 (0.0%) |
| $25,000 to $49,999 | 89 (100.0%) | 0 (0.0%) |
| $50,000 to $74,999 | 114 (100.0%) | 0 (0.0%) |
| $75,000 to $99,999 | 12 (100.0%) | 0 (0.0%) |
| $100,000 and over | 169 (100.0%) | 0 (0.0%) |
Public vs Private Health Insurance Coverage by Age in Flintville
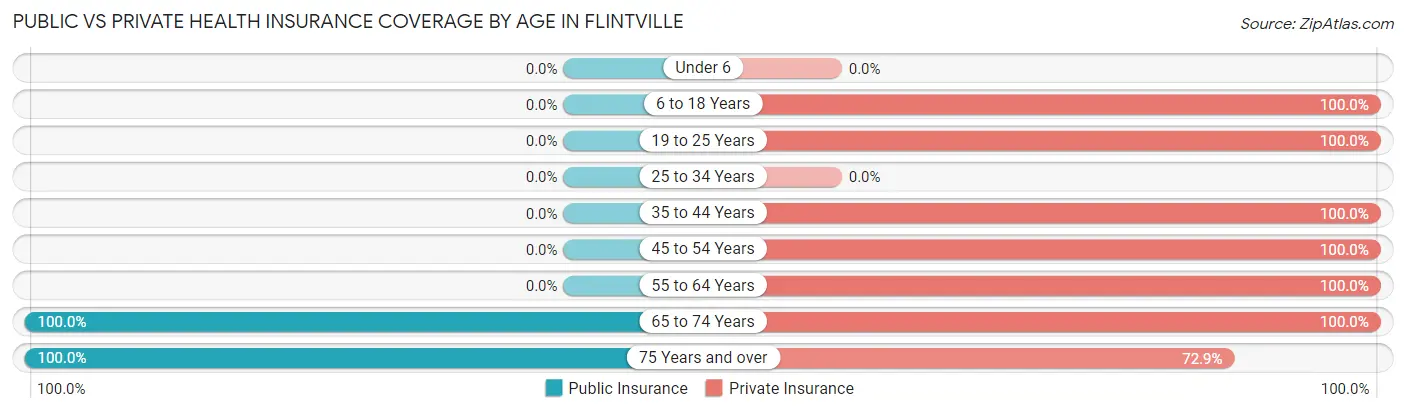
| Age Bracket | Public Insurance | Private Insurance |
| Under 6 | 0 (0.0%) | 0 (0.0%) |
| 6 to 18 Years | 0 (0.0%) | 40 (100.0%) |
| 19 to 25 Years | 0 (0.0%) | 51 (100.0%) |
| 25 to 34 Years | 0 (0.0%) | 0 (0.0%) |
| 35 to 44 Years | 0 (0.0%) | 39 (100.0%) |
| 45 to 54 Years | 0 (0.0%) | 51 (100.0%) |
| 55 to 64 Years | 0 (0.0%) | 57 (100.0%) |
| 65 to 74 Years | 122 (100.0%) | 122 (100.0%) |
| 75 Years and over | 70 (100.0%) | 51 (72.9%) |
| Total | 192 (44.7%) | 411 (95.6%) |
Disability Status by Sex by Age in Flintville
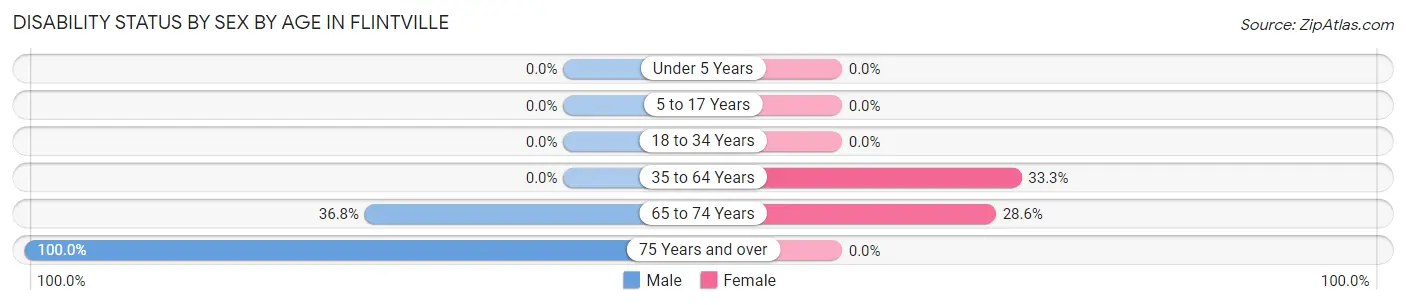
| Age Bracket | Male | Female |
| Under 5 Years | 0 (0.0%) | 0 (0.0%) |
| 5 to 17 Years | 0 (0.0%) | 0 (0.0%) |
| 18 to 34 Years | 0 (0.0%) | 0 (0.0%) |
| 35 to 64 Years | 0 (0.0%) | 16 (33.3%) |
| 65 to 74 Years | 14 (36.8%) | 24 (28.6%) |
| 75 Years and over | 51 (100.0%) | 0 (0.0%) |
Disability Class by Sex by Age in Flintville
Disability Class: Hearing Difficulty
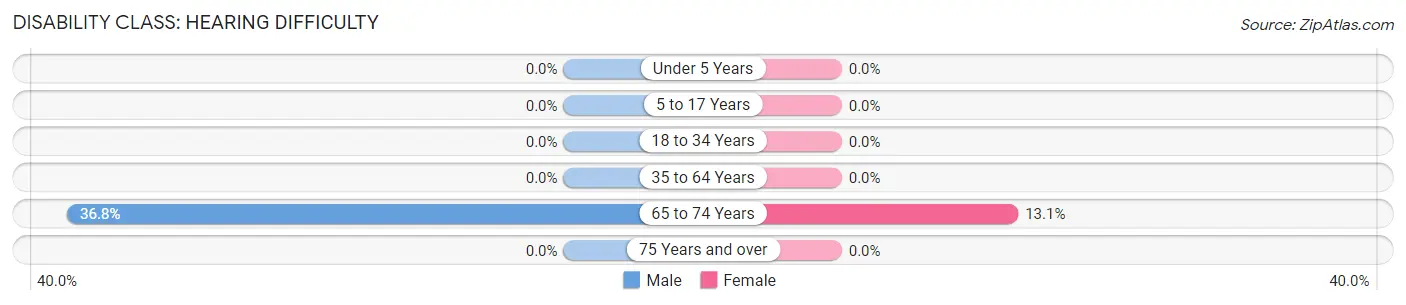
| Age Bracket | Male | Female |
| Under 5 Years | 0 (0.0%) | 0 (0.0%) |
| 5 to 17 Years | 0 (0.0%) | 0 (0.0%) |
| 18 to 34 Years | 0 (0.0%) | 0 (0.0%) |
| 35 to 64 Years | 0 (0.0%) | 0 (0.0%) |
| 65 to 74 Years | 14 (36.8%) | 11 (13.1%) |
| 75 Years and over | 0 (0.0%) | 0 (0.0%) |
Disability Class: Vision Difficulty
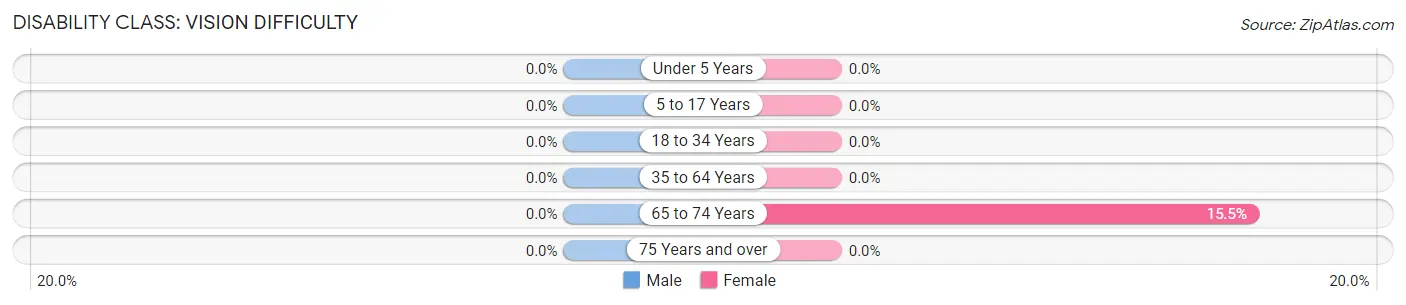
| Age Bracket | Male | Female |
| Under 5 Years | 0 (0.0%) | 0 (0.0%) |
| 5 to 17 Years | 0 (0.0%) | 0 (0.0%) |
| 18 to 34 Years | 0 (0.0%) | 0 (0.0%) |
| 35 to 64 Years | 0 (0.0%) | 0 (0.0%) |
| 65 to 74 Years | 0 (0.0%) | 13 (15.5%) |
| 75 Years and over | 0 (0.0%) | 0 (0.0%) |
Disability Class: Cognitive Difficulty
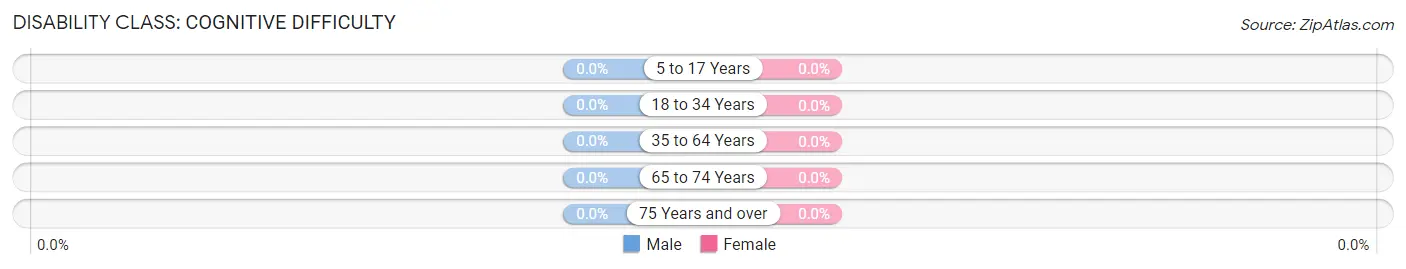
| Age Bracket | Male | Female |
| 5 to 17 Years | 0 (0.0%) | 0 (0.0%) |
| 18 to 34 Years | 0 (0.0%) | 0 (0.0%) |
| 35 to 64 Years | 0 (0.0%) | 0 (0.0%) |
| 65 to 74 Years | 0 (0.0%) | 0 (0.0%) |
| 75 Years and over | 0 (0.0%) | 0 (0.0%) |
Disability Class: Ambulatory Difficulty
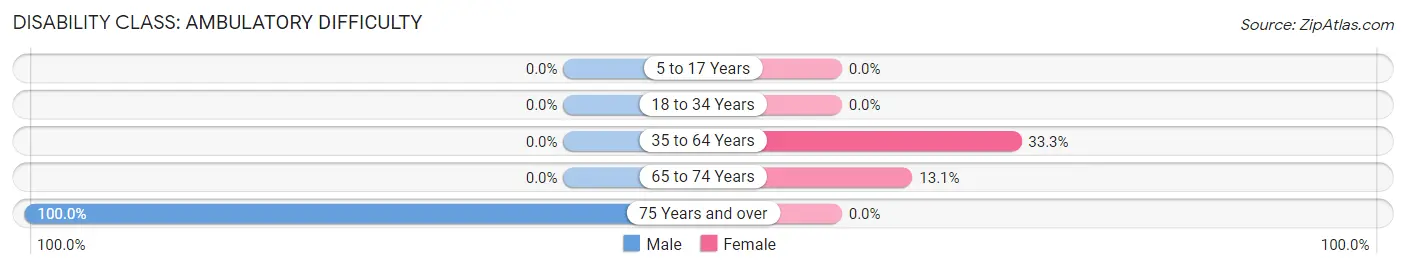
| Age Bracket | Male | Female |
| 5 to 17 Years | 0 (0.0%) | 0 (0.0%) |
| 18 to 34 Years | 0 (0.0%) | 0 (0.0%) |
| 35 to 64 Years | 0 (0.0%) | 16 (33.3%) |
| 65 to 74 Years | 0 (0.0%) | 11 (13.1%) |
| 75 Years and over | 51 (100.0%) | 0 (0.0%) |
Disability Class: Self-Care Difficulty
| Age Bracket | Male | Female |
| 5 to 17 Years | 0 (0.0%) | 0 (0.0%) |
| 18 to 34 Years | 0 (0.0%) | 0 (0.0%) |
| 35 to 64 Years | 0 (0.0%) | 0 (0.0%) |
| 65 to 74 Years | 0 (0.0%) | 0 (0.0%) |
| 75 Years and over | 0 (0.0%) | 0 (0.0%) |
Technology Access in Flintville
Computing Device Access in Flintville
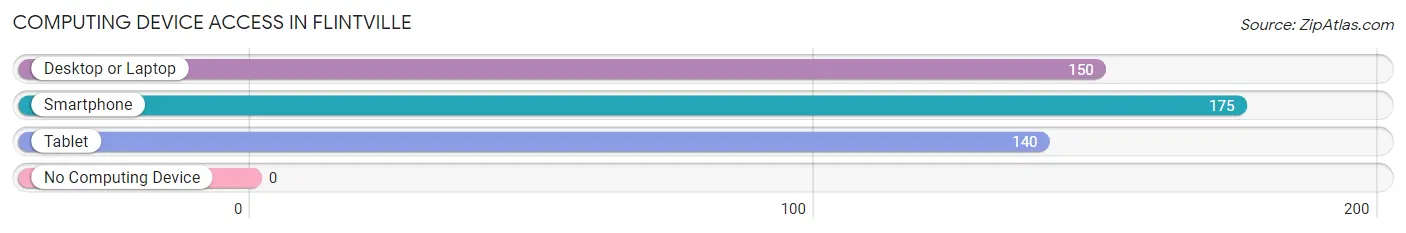
| Device Type | # Households | % Households |
| Desktop or Laptop | 150 | 68.5% |
| Smartphone | 175 | 79.9% |
| Tablet | 140 | 63.9% |
| No Computing Device | 0 | 0.0% |
| Total | 219 | 100.0% |
Internet Access in Flintville
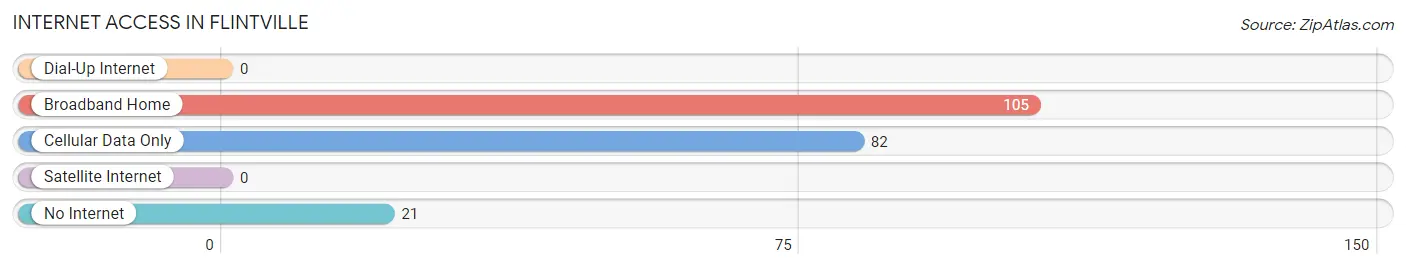
| Internet Type | # Households | % Households |
| Dial-Up Internet | 0 | 0.0% |
| Broadband Home | 105 | 47.9% |
| Cellular Data Only | 82 | 37.4% |
| Satellite Internet | 0 | 0.0% |
| No Internet | 21 | 9.6% |
| Total | 219 | 100.0% |
Flintville Summary
Flintville is a small unincorporated community located in Lincoln County, Tennessee. It is situated along the banks of the Elk River, approximately 20 miles south of Fayetteville and 40 miles north of Huntsville, Alabama. The population of Flintville was estimated to be around 1,000 in 2020.
History
Flintville was first settled in the early 1800s by a group of settlers from North Carolina. The town was named after the abundance of flint found in the area. The town was incorporated in 1845 and was the first town in Lincoln County.
In the late 1800s, Flintville was a thriving community with a variety of businesses, including a grist mill, a sawmill, a cotton gin, a blacksmith shop, and a general store. The town also had a post office, a school, and a church.
In the early 1900s, the town began to decline as the railroad bypassed it and the population began to move away. By the mid-1900s, Flintville was a small, quiet community with a population of less than 500.
Geography
Flintville is located in the foothills of the Appalachian Mountains in the southeastern corner of Lincoln County. The town is situated along the banks of the Elk River, which flows through the town and provides a scenic backdrop. The town is surrounded by rolling hills and lush forests.
The climate in Flintville is mild and humid, with temperatures ranging from the mid-30s in the winter to the mid-80s in the summer. The town receives an average of 48 inches of rain per year.
Economy
The economy of Flintville is largely based on agriculture and forestry. The town is home to several farms, which produce a variety of crops, including corn, soybeans, and hay. The town also has several sawmills and lumber companies, which provide jobs for many of the town’s residents.
In addition to agriculture and forestry, Flintville is home to several small businesses, including a grocery store, a hardware store, and a few restaurants. The town also has a few bed and breakfasts, which attract visitors from nearby cities.
Demographics
The population of Flintville was estimated to be around 1,000 in 2020. The town is predominantly white, with a small African American population. The median household income in Flintville is $35,000, and the median home value is $90,000.
The town is served by the Lincoln County School District, which includes two elementary schools, a middle school, and a high school. The town also has a public library and a community center.
Flintville is a small, quiet community with a rich history and a strong sense of community. The town is a great place to live and work, and it offers a variety of activities and amenities for its residents.
Common Questions
What is Per Capita Income in Flintville?
Per Capita income in Flintville is $36,301.
What is the Median Family Income in Flintville?
Median Family Income in Flintville is $97,656.
What is the Median Household income in Flintville?
Median Household Income in Flintville is $55,114.
What is Income or Wage Gap in Flintville?
Income or Wage Gap in Flintville is 76.0%.
Women in Flintville earn 24.0 cents for every dollar earned by a man.
What is Inequality or Gini Index in Flintville?
Inequality or Gini Index in Flintville is 0.36.
What is the Total Population of Flintville?
Total Population of Flintville is 430.
What is the Total Male Population of Flintville?
Total Male Population of Flintville is 222.
What is the Total Female Population of Flintville?
Total Female Population of Flintville is 208.
What is the Ratio of Males per 100 Females in Flintville?
There are 106.73 Males per 100 Females in Flintville.
What is the Ratio of Females per 100 Males in Flintville?
There are 93.69 Females per 100 Males in Flintville.
What is the Median Population Age in Flintville?
Median Population Age in Flintville is 56.8 Years.
What is the Average Family Size in Flintville
Average Family Size in Flintville is 2.7 People.
What is the Average Household Size in Flintville
Average Household Size in Flintville is 2.0 People.
How Large is the Labor Force in Flintville?
There are 176 People in the Labor Forcein in Flintville.
What is the Percentage of People in the Labor Force in Flintville?
43.6% of People are in the Labor Force in Flintville.