Estill Springs, TN Map & Demographics
Estill Springs Map
Estill Springs Overview
$26,187
PER CAPITA INCOME
$66,250
AVG FAMILY INCOME
$53,313
AVG HOUSEHOLD INCOME
39.9%
WAGE / INCOME GAP [ % ]
60.1¢/ $1
WAGE / INCOME GAP [ $ ]
0.40
INEQUALITY / GINI INDEX
2,022
TOTAL POPULATION
958
MALE POPULATION
1,064
FEMALE POPULATION
90.04
MALES / 100 FEMALES
111.06
FEMALES / 100 MALES
41.0
MEDIAN AGE
3.0
AVG FAMILY SIZE
2.5
AVG HOUSEHOLD SIZE
877
LABOR FORCE [ PEOPLE ]
56.3%
PERCENT IN LABOR FORCE
8.1%
UNEMPLOYMENT RATE
Estill Springs Zip Codes
Estill Springs Area Codes
Income in Estill Springs
Income Overview in Estill Springs
Per Capita Income in Estill Springs is $26,187, while median incomes of families and households are $66,250 and $53,313 respectively.
| Characteristic | Number | Measure |
| Per Capita Income | 2,022 | $26,187 |
| Median Family Income | 577 | $66,250 |
| Mean Family Income | 577 | $74,095 |
| Median Household Income | 799 | $53,313 |
| Mean Household Income | 799 | $64,062 |
| Income Deficit | 577 | $0 |
| Wage / Income Gap (%) | 2,022 | 39.86% |
| Wage / Income Gap ($) | 2,022 | 60.14¢ per $1 |
| Gini / Inequality Index | 2,022 | 0.40 |
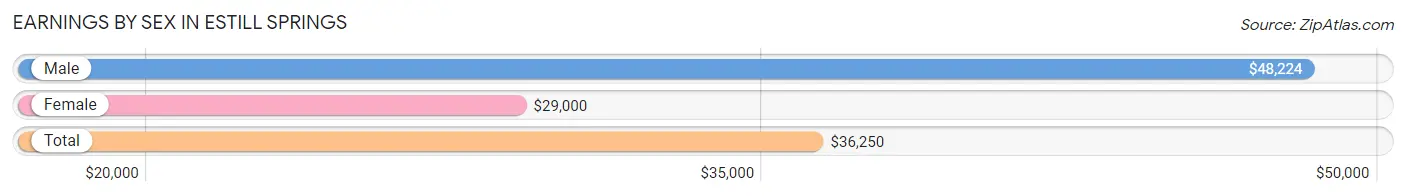
Earnings by Sex in Estill Springs
Average Earnings in Estill Springs are $36,250, $48,224 for men and $29,000 for women, a difference of 39.9%.
| Sex | Number | Average Earnings |
| Male | 445 (48.7%) | $48,224 |
| Female | 468 (51.3%) | $29,000 |
| Total | 913 (100.0%) | $36,250 |
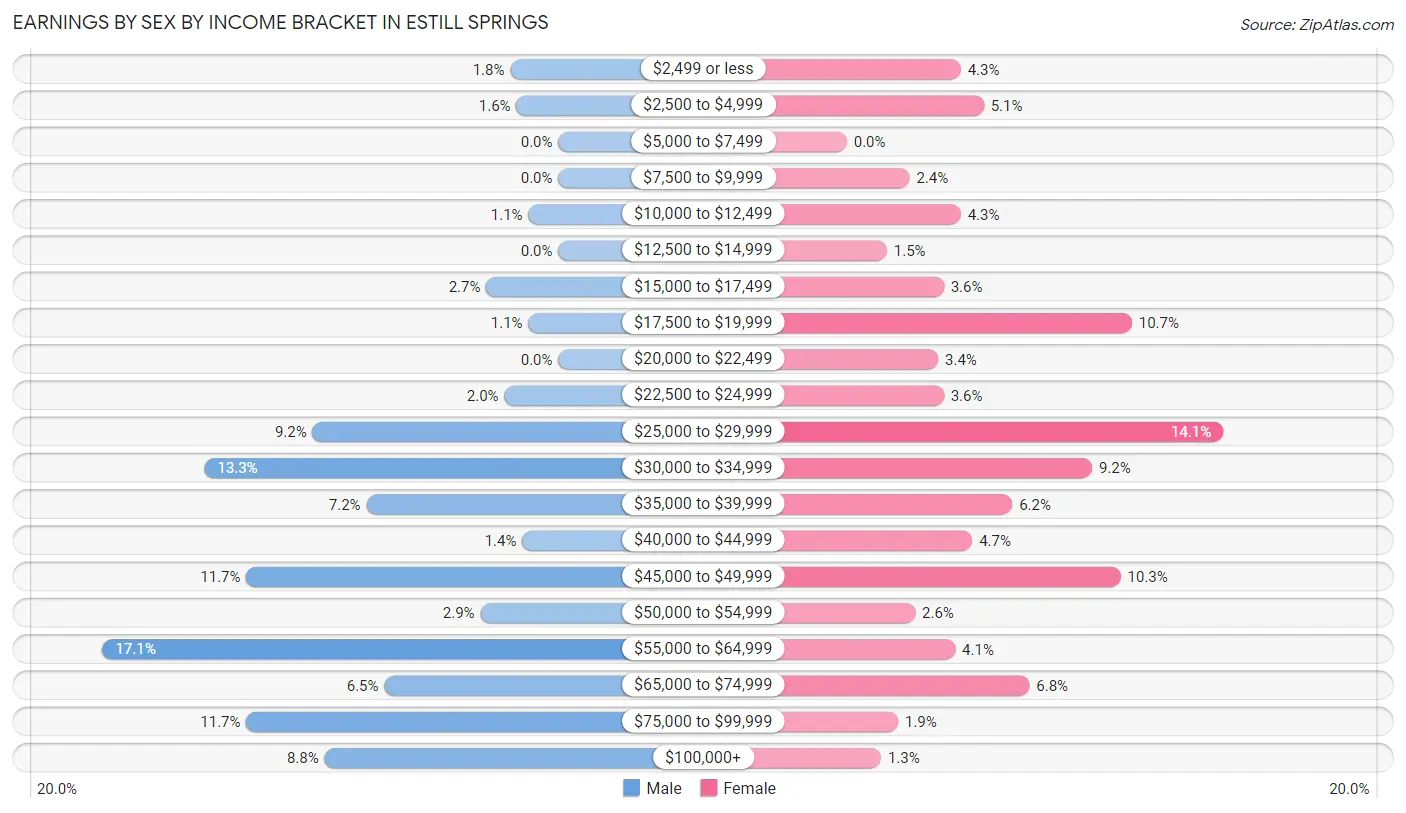
Earnings by Sex by Income Bracket in Estill Springs
The most common earnings brackets in Estill Springs are $55,000 to $64,999 for men (76 | 17.1%) and $25,000 to $29,999 for women (66 | 14.1%).
| Income | Male | Female |
| $2,499 or less | 8 (1.8%) | 20 (4.3%) |
| $2,500 to $4,999 | 7 (1.6%) | 24 (5.1%) |
| $5,000 to $7,499 | 0 (0.0%) | 0 (0.0%) |
| $7,500 to $9,999 | 0 (0.0%) | 11 (2.4%) |
| $10,000 to $12,499 | 5 (1.1%) | 20 (4.3%) |
| $12,500 to $14,999 | 0 (0.0%) | 7 (1.5%) |
| $15,000 to $17,499 | 12 (2.7%) | 17 (3.6%) |
| $17,500 to $19,999 | 5 (1.1%) | 50 (10.7%) |
| $20,000 to $22,499 | 0 (0.0%) | 16 (3.4%) |
| $22,500 to $24,999 | 9 (2.0%) | 17 (3.6%) |
| $25,000 to $29,999 | 41 (9.2%) | 66 (14.1%) |
| $30,000 to $34,999 | 59 (13.3%) | 43 (9.2%) |
| $35,000 to $39,999 | 32 (7.2%) | 29 (6.2%) |
| $40,000 to $44,999 | 6 (1.3%) | 22 (4.7%) |
| $45,000 to $49,999 | 52 (11.7%) | 48 (10.3%) |
| $50,000 to $54,999 | 13 (2.9%) | 12 (2.6%) |
| $55,000 to $64,999 | 76 (17.1%) | 19 (4.1%) |
| $65,000 to $74,999 | 29 (6.5%) | 32 (6.8%) |
| $75,000 to $99,999 | 52 (11.7%) | 9 (1.9%) |
| $100,000+ | 39 (8.8%) | 6 (1.3%) |
| Total | 445 (100.0%) | 468 (100.0%) |
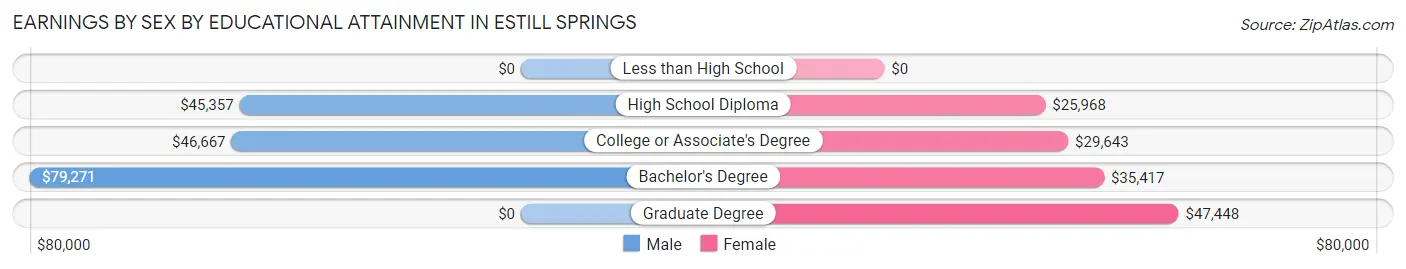
Earnings by Sex by Educational Attainment in Estill Springs
Average earnings in Estill Springs are $49,013 for men and $29,893 for women, a difference of 39.0%. Men with an educational attainment of bachelor's degree enjoy the highest average annual earnings of $79,271, while those with high school diploma education earn the least with $45,357. Women with an educational attainment of graduate degree earn the most with the average annual earnings of $47,448, while those with high school diploma education have the smallest earnings of $25,968.
| Educational Attainment | Male Income | Female Income |
| Less than High School | - | - |
| High School Diploma | $45,357 | $25,968 |
| College or Associate's Degree | $46,667 | $29,643 |
| Bachelor's Degree | $79,271 | $35,417 |
| Graduate Degree | - | - |
| Total | $49,013 | $29,893 |
Family Income in Estill Springs
Family Income Brackets in Estill Springs
According to the Estill Springs family income data, there are 123 families falling into the $75,000 to $99,999 income range, which is the most common income bracket and makes up 21.3% of all families. Conversely, the less than $10,000 income bracket is the least frequent group with only 7 families (1.2%) belonging to this category.
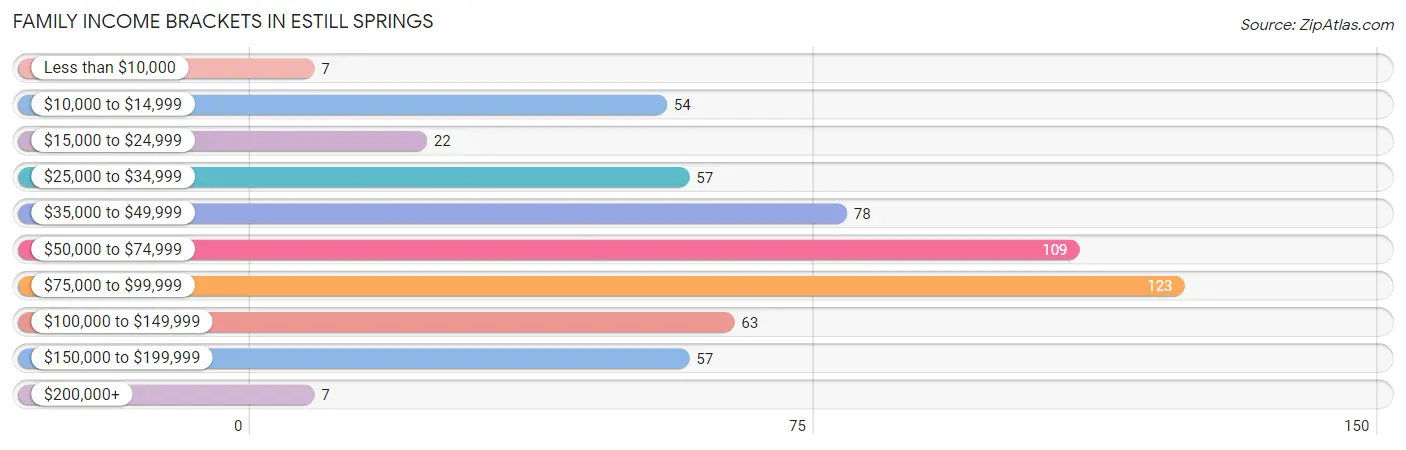
| Income Bracket | # Families | % Families |
| Less than $10,000 | 7 | 1.2% |
| $10,000 to $14,999 | 54 | 9.4% |
| $15,000 to $24,999 | 22 | 3.8% |
| $25,000 to $34,999 | 57 | 9.9% |
| $35,000 to $49,999 | 78 | 13.5% |
| $50,000 to $74,999 | 109 | 18.9% |
| $75,000 to $99,999 | 123 | 21.3% |
| $100,000 to $149,999 | 63 | 10.9% |
| $150,000 to $199,999 | 57 | 9.9% |
| $200,000+ | 7 | 1.2% |
Family Income by Famaliy Size in Estill Springs
3-person families (196 | 34.0%) account for the highest median family income in Estill Springs with $69,531 per family, while 2-person families (256 | 44.4%) have the highest median income of $28,462 per family member.
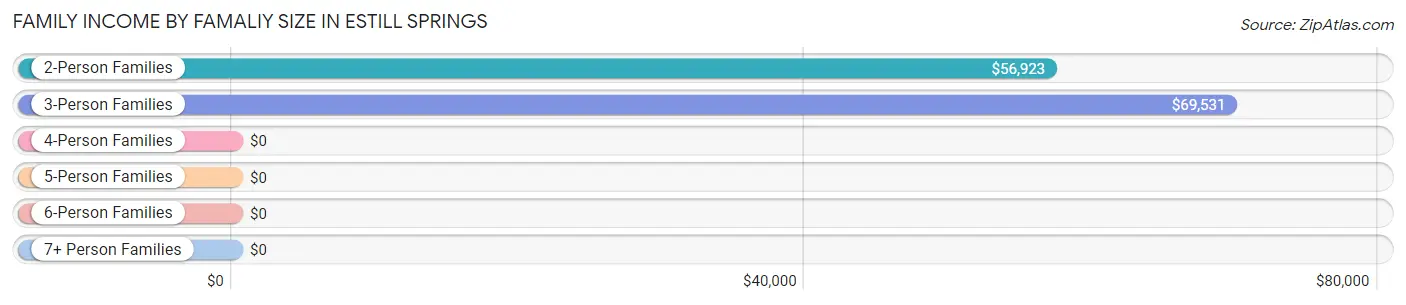
| Income Bracket | # Families | Median Income |
| 2-Person Families | 256 (44.4%) | $56,923 |
| 3-Person Families | 196 (34.0%) | $69,531 |
| 4-Person Families | 86 (14.9%) | $0 |
| 5-Person Families | 13 (2.2%) | $0 |
| 6-Person Families | 16 (2.8%) | $0 |
| 7+ Person Families | 10 (1.7%) | $0 |
| Total | 577 (100.0%) | $66,250 |
Family Income by Number of Earners in Estill Springs
The median family income in Estill Springs is $66,250, with families comprising 3+ earners (18) having the highest median family income of $119,375, while families with no earners (92) have the lowest median family income of $33,750, accounting for 3.1% and 15.9% of families, respectively.
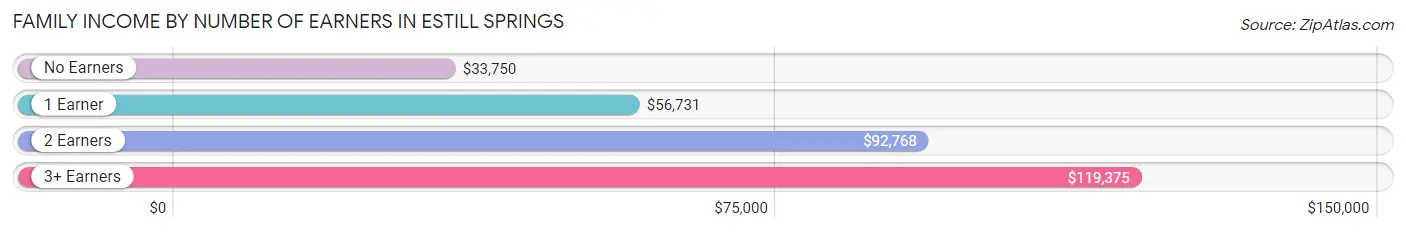
| Number of Earners | # Families | Median Income |
| No Earners | 92 (15.9%) | $33,750 |
| 1 Earner | 258 (44.7%) | $56,731 |
| 2 Earners | 209 (36.2%) | $92,768 |
| 3+ Earners | 18 (3.1%) | $119,375 |
| Total | 577 (100.0%) | $66,250 |
Household Income in Estill Springs
Household Income Brackets in Estill Springs
With 142 households falling in the category, the $50,000 to $74,999 income range is the most frequent in Estill Springs, accounting for 17.8% of all households. In contrast, only 7 households (0.9%) fall into the $200,000+ income bracket, making it the least populous group.
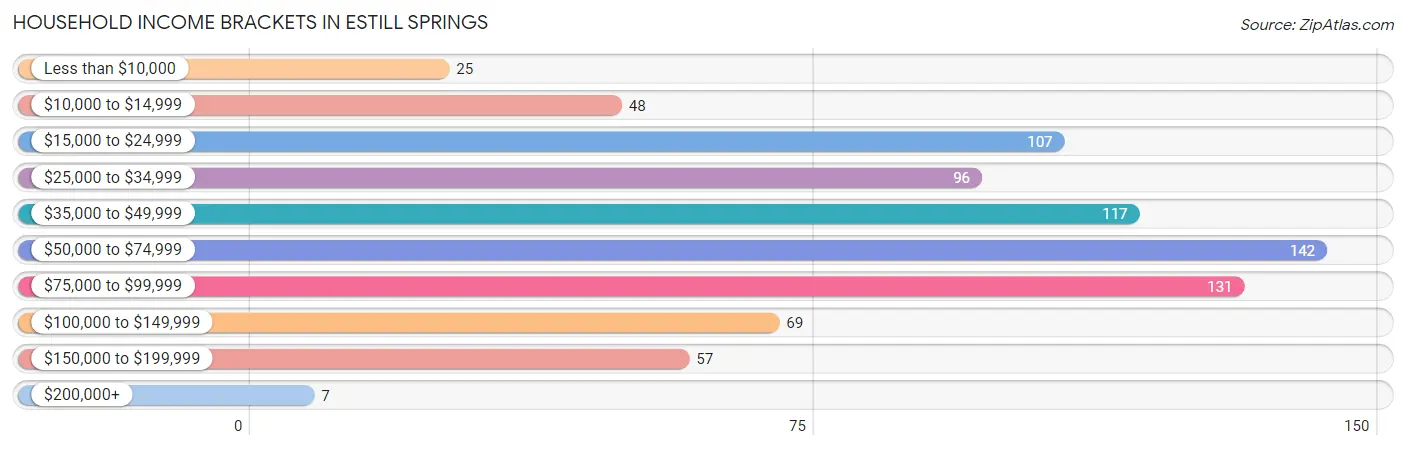
| Income Bracket | # Households | % Households |
| Less than $10,000 | 25 | 3.1% |
| $10,000 to $14,999 | 48 | 6.0% |
| $15,000 to $24,999 | 107 | 13.4% |
| $25,000 to $34,999 | 96 | 12.0% |
| $35,000 to $49,999 | 117 | 14.6% |
| $50,000 to $74,999 | 142 | 17.8% |
| $75,000 to $99,999 | 131 | 16.4% |
| $100,000 to $149,999 | 69 | 8.6% |
| $150,000 to $199,999 | 57 | 7.1% |
| $200,000+ | 7 | 0.9% |
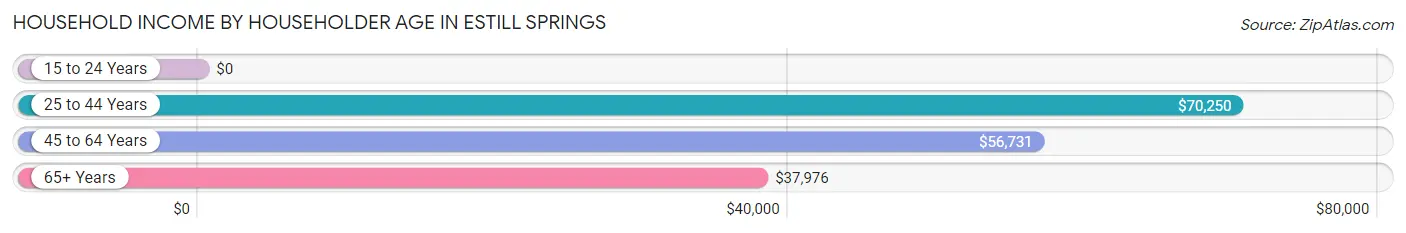
Household Income by Householder Age in Estill Springs
The median household income in Estill Springs is $53,313, with the highest median household income of $70,250 found in the 25 to 44 years age bracket for the primary householder. A total of 263 households (32.9%) fall into this category.
| Income Bracket | # Households | Median Income |
| 15 to 24 Years | 0 (0.0%) | $0 |
| 25 to 44 Years | 263 (32.9%) | $70,250 |
| 45 to 64 Years | 312 (39.1%) | $56,731 |
| 65+ Years | 224 (28.0%) | $37,976 |
| Total | 799 (100.0%) | $53,313 |
Poverty in Estill Springs
Income Below Poverty by Sex and Age in Estill Springs
With 12.9% poverty level for males and 19.4% for females among the residents of Estill Springs, under 5 year old males and 5 year old females are the most vulnerable to poverty, with 26 males (52.0%) and 6 females (100.0%) in their respective age groups living below the poverty level.
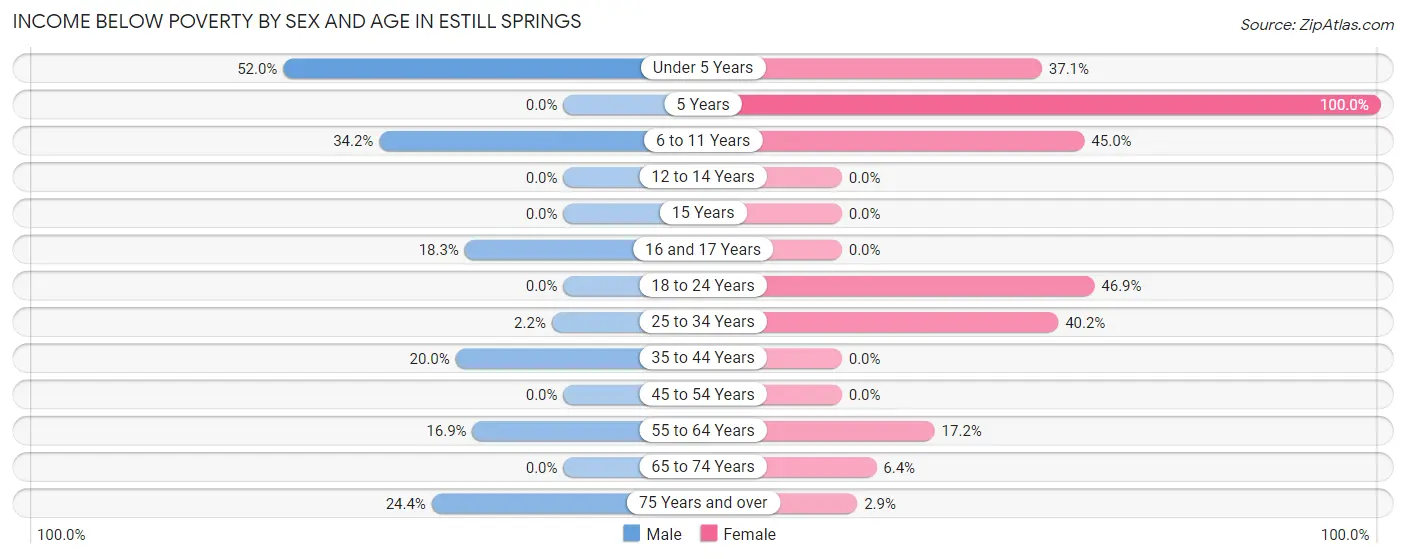
| Age Bracket | Male | Female |
| Under 5 Years | 26 (52.0%) | 13 (37.1%) |
| 5 Years | 0 (0.0%) | 6 (100.0%) |
| 6 to 11 Years | 27 (34.2%) | 86 (45.0%) |
| 12 to 14 Years | 0 (0.0%) | 0 (0.0%) |
| 15 Years | 0 (0.0%) | 0 (0.0%) |
| 16 and 17 Years | 13 (18.3%) | 0 (0.0%) |
| 18 to 24 Years | 0 (0.0%) | 15 (46.9%) |
| 25 to 34 Years | 4 (2.2%) | 47 (40.2%) |
| 35 to 44 Years | 16 (20.0%) | 0 (0.0%) |
| 45 to 54 Years | 0 (0.0%) | 0 (0.0%) |
| 55 to 64 Years | 27 (16.9%) | 30 (17.2%) |
| 65 to 74 Years | 0 (0.0%) | 5 (6.4%) |
| 75 Years and over | 11 (24.4%) | 4 (2.9%) |
| Total | 124 (12.9%) | 206 (19.4%) |
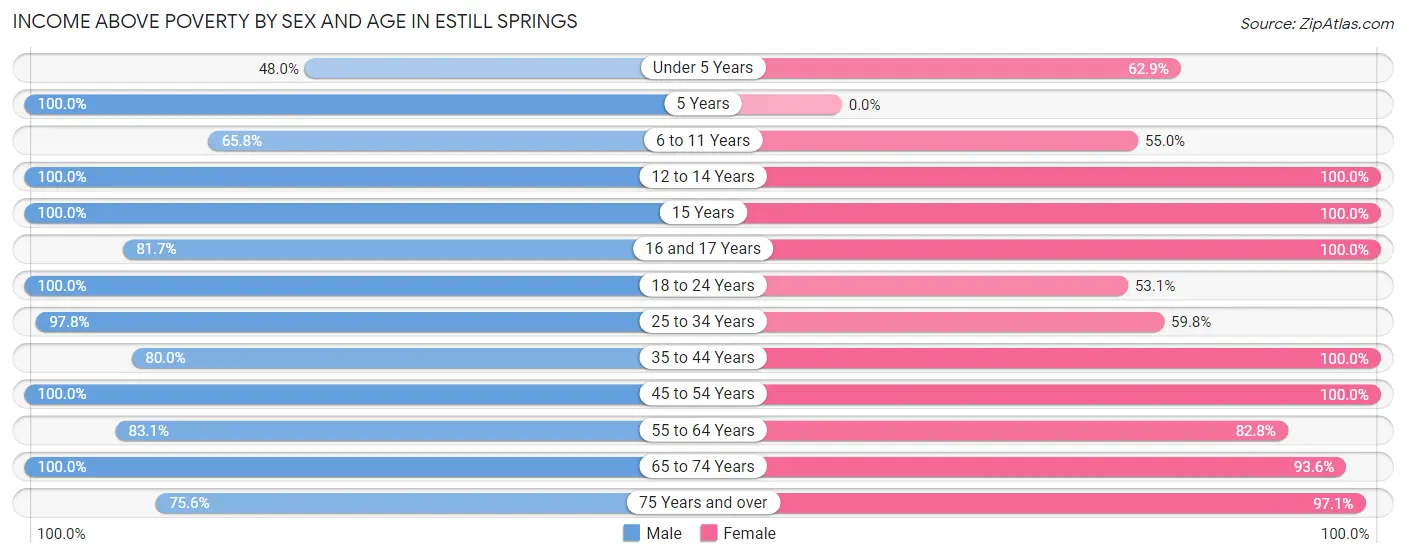
Income Above Poverty by Sex and Age in Estill Springs
According to the poverty statistics in Estill Springs, males aged 5 years and females aged 12 to 14 years are the age groups that are most secure financially, with 100.0% of males and 100.0% of females in these age groups living above the poverty line.
| Age Bracket | Male | Female |
| Under 5 Years | 24 (48.0%) | 22 (62.9%) |
| 5 Years | 23 (100.0%) | 0 (0.0%) |
| 6 to 11 Years | 52 (65.8%) | 105 (55.0%) |
| 12 to 14 Years | 16 (100.0%) | 28 (100.0%) |
| 15 Years | 19 (100.0%) | 18 (100.0%) |
| 16 and 17 Years | 58 (81.7%) | 9 (100.0%) |
| 18 to 24 Years | 12 (100.0%) | 17 (53.1%) |
| 25 to 34 Years | 181 (97.8%) | 70 (59.8%) |
| 35 to 44 Years | 64 (80.0%) | 129 (100.0%) |
| 45 to 54 Years | 147 (100.0%) | 107 (100.0%) |
| 55 to 64 Years | 133 (83.1%) | 144 (82.8%) |
| 65 to 74 Years | 71 (100.0%) | 73 (93.6%) |
| 75 Years and over | 34 (75.6%) | 136 (97.1%) |
| Total | 834 (87.1%) | 858 (80.6%) |
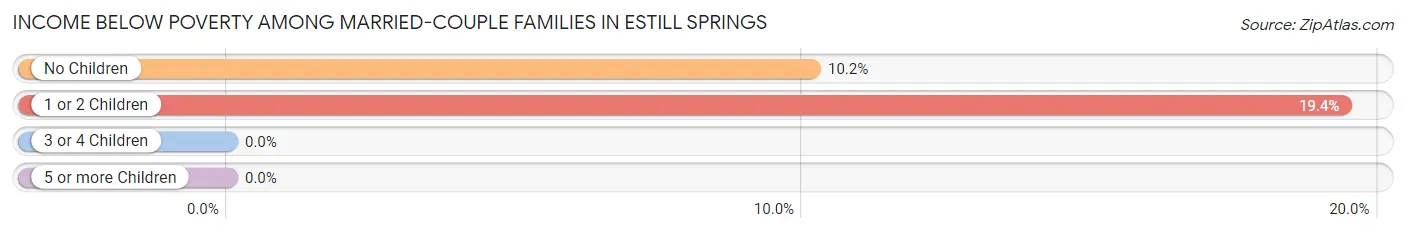
Income Below Poverty Among Married-Couple Families in Estill Springs
The poverty statistics for married-couple families in Estill Springs show that 13.9% or 51 of the total 367 families live below the poverty line. Families with 1 or 2 children have the highest poverty rate of 19.4%, comprising of 31 families. On the other hand, families with 3 or 4 children have the lowest poverty rate of 0.0%, which includes 0 families.
| Children | Above Poverty | Below Poverty |
| No Children | 177 (89.8%) | 20 (10.2%) |
| 1 or 2 Children | 129 (80.6%) | 31 (19.4%) |
| 3 or 4 Children | 10 (100.0%) | 0 (0.0%) |
| 5 or more Children | 0 (0.0%) | 0 (0.0%) |
| Total | 316 (86.1%) | 51 (13.9%) |
Income Below Poverty Among Single-Parent Households in Estill Springs
According to the poverty data in Estill Springs, 6.9% or 4 single-father households and 15.1% or 23 single-mother households are living below the poverty line. Among single-father households, those with 1 or 2 children have the highest poverty rate, with 4 households (16.7%) experiencing poverty. Likewise, among single-mother households, those with 5 or more children have the highest poverty rate, with 16 households (100.0%) falling below the poverty line.
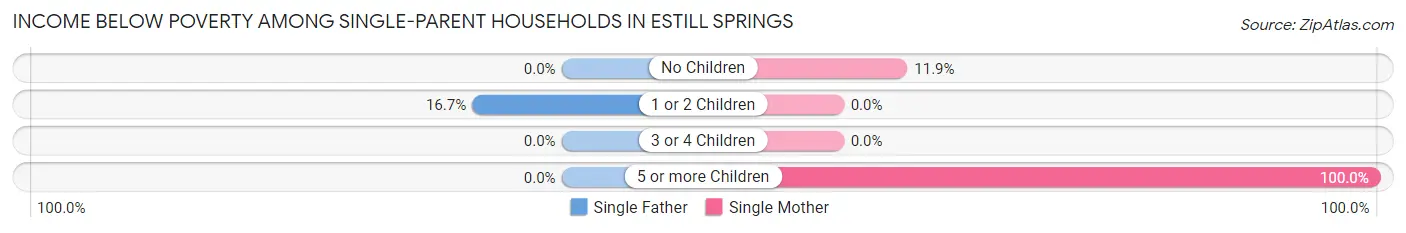
| Children | Single Father | Single Mother |
| No Children | 0 (0.0%) | 7 (11.9%) |
| 1 or 2 Children | 4 (16.7%) | 0 (0.0%) |
| 3 or 4 Children | 0 (0.0%) | 0 (0.0%) |
| 5 or more Children | 0 (0.0%) | 16 (100.0%) |
| Total | 4 (6.9%) | 23 (15.1%) |
Income Below Poverty Among Married-Couple vs Single-Parent Households in Estill Springs
The poverty data for Estill Springs shows that 51 of the married-couple family households (13.9%) and 27 of the single-parent households (12.9%) are living below the poverty level. Within the married-couple family households, those with 1 or 2 children have the highest poverty rate, with 31 households (19.4%) falling below the poverty line. Among the single-parent households, those with 5 or more children have the highest poverty rate, with 16 household (100.0%) living below poverty.
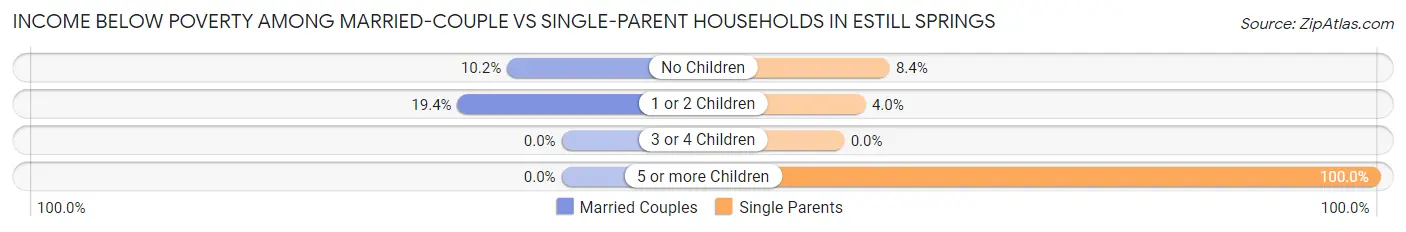
| Children | Married-Couple Families | Single-Parent Households |
| No Children | 20 (10.2%) | 7 (8.4%) |
| 1 or 2 Children | 31 (19.4%) | 4 (4.0%) |
| 3 or 4 Children | 0 (0.0%) | 0 (0.0%) |
| 5 or more Children | 0 (0.0%) | 16 (100.0%) |
| Total | 51 (13.9%) | 27 (12.9%) |
Race in Estill Springs
The most populous races in Estill Springs are White / Caucasian (1,858 | 91.9%), Two or more Races (90 | 4.4%), and Black / African American (59 | 2.9%).
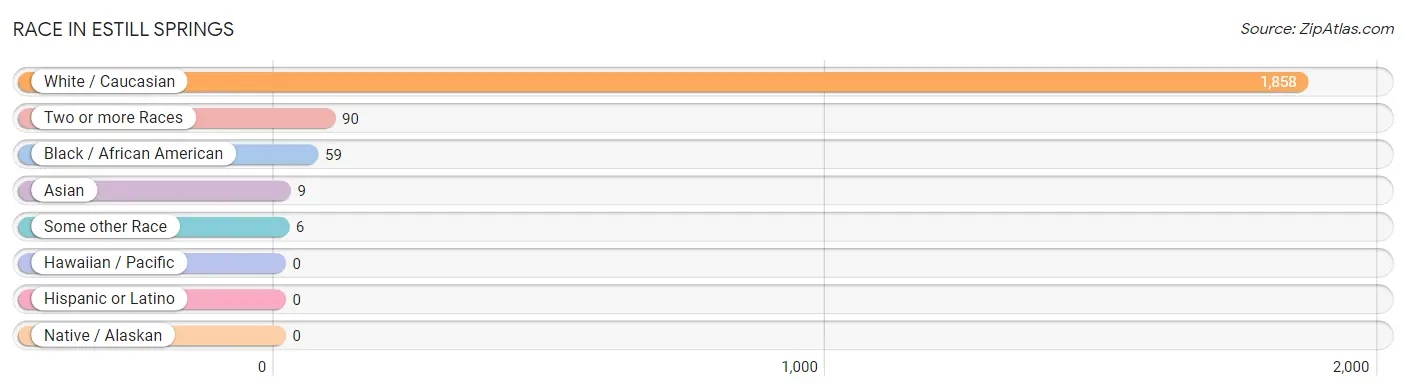
| Race | # Population | % Population |
| Asian | 9 | 0.4% |
| Black / African American | 59 | 2.9% |
| Hawaiian / Pacific | 0 | 0.0% |
| Hispanic or Latino | 0 | 0.0% |
| Native / Alaskan | 0 | 0.0% |
| White / Caucasian | 1,858 | 91.9% |
| Two or more Races | 90 | 4.4% |
| Some other Race | 6 | 0.3% |
| Total | 2,022 | 100.0% |
Ancestry in Estill Springs
The most populous ancestries reported in Estill Springs are American (357 | 17.7%), German (316 | 15.6%), English (184 | 9.1%), Irish (144 | 7.1%), and Nigerian (72 | 3.6%), together accounting for 53.1% of all Estill Springs residents.
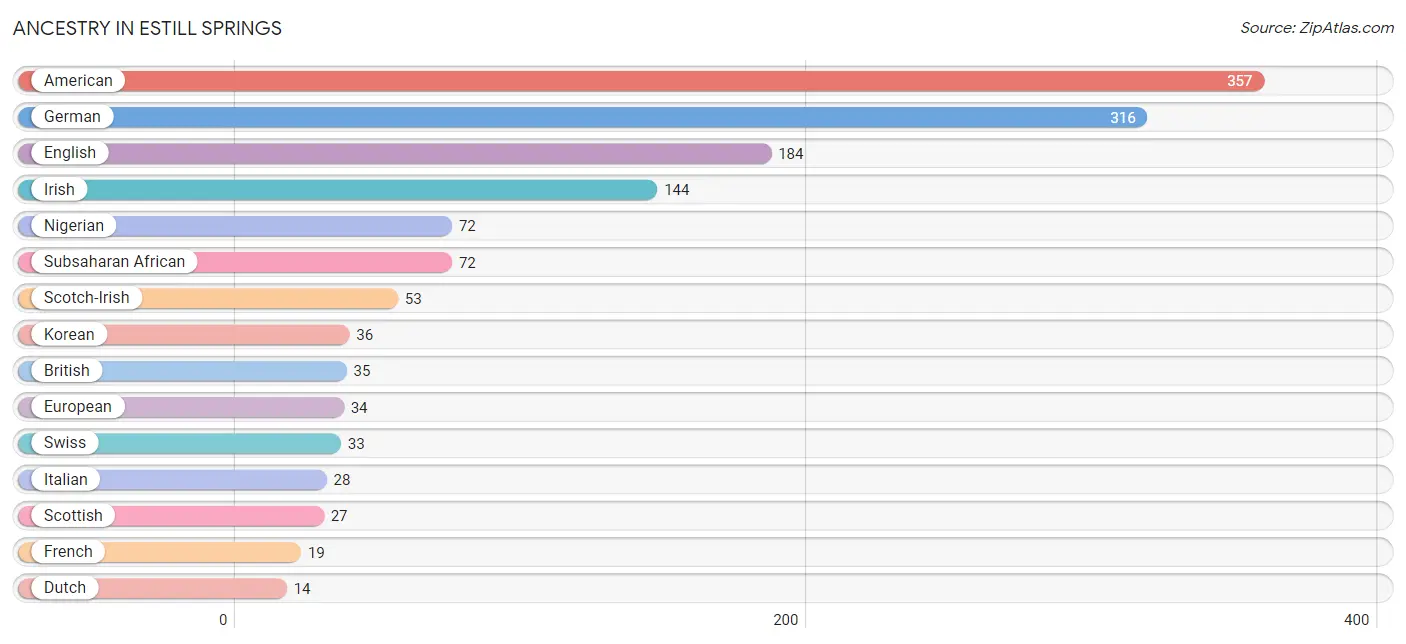
| Ancestry | # Population | % Population |
| American | 357 | 17.7% |
| British | 35 | 1.7% |
| Danish | 7 | 0.4% |
| Dutch | 14 | 0.7% |
| English | 184 | 9.1% |
| European | 34 | 1.7% |
| Filipino | 3 | 0.2% |
| French | 19 | 0.9% |
| German | 316 | 15.6% |
| Guamanian / Chamorro | 12 | 0.6% |
| Irish | 144 | 7.1% |
| Italian | 28 | 1.4% |
| Korean | 36 | 1.8% |
| Nigerian | 72 | 3.6% |
| Polish | 13 | 0.6% |
| Scotch-Irish | 53 | 2.6% |
| Scottish | 27 | 1.3% |
| Sioux | 3 | 0.2% |
| Sri Lankan | 3 | 0.2% |
| Subsaharan African | 72 | 3.6% |
| Swedish | 10 | 0.5% |
| Swiss | 33 | 1.6% | View All 22 Rows |
Immigrants in Estill Springs
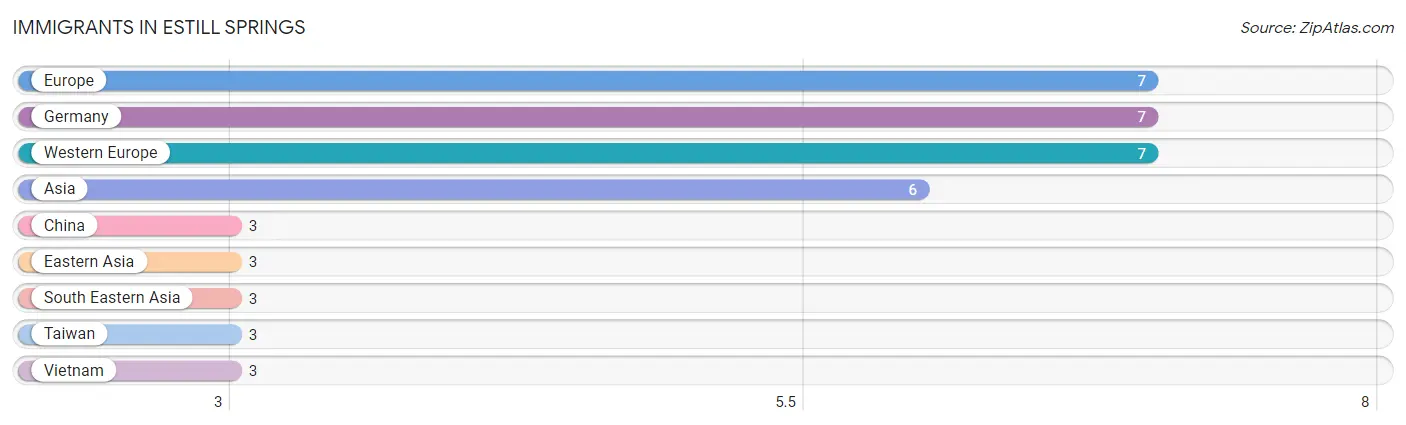
The most numerous immigrant groups reported in Estill Springs came from Europe (7 | 0.4%), Germany (7 | 0.4%), Western Europe (7 | 0.4%), Asia (6 | 0.3%), and China (3 | 0.2%), together accounting for 1.5% of all Estill Springs residents.
| Immigration Origin | # Population | % Population |
| Asia | 6 | 0.3% |
| China | 3 | 0.2% |
| Eastern Asia | 3 | 0.2% |
| Europe | 7 | 0.4% |
| Germany | 7 | 0.4% |
| South Eastern Asia | 3 | 0.2% |
| Taiwan | 3 | 0.2% |
| Vietnam | 3 | 0.2% |
| Western Europe | 7 | 0.4% | View All 9 Rows |
Sex and Age in Estill Springs
Sex and Age in Estill Springs
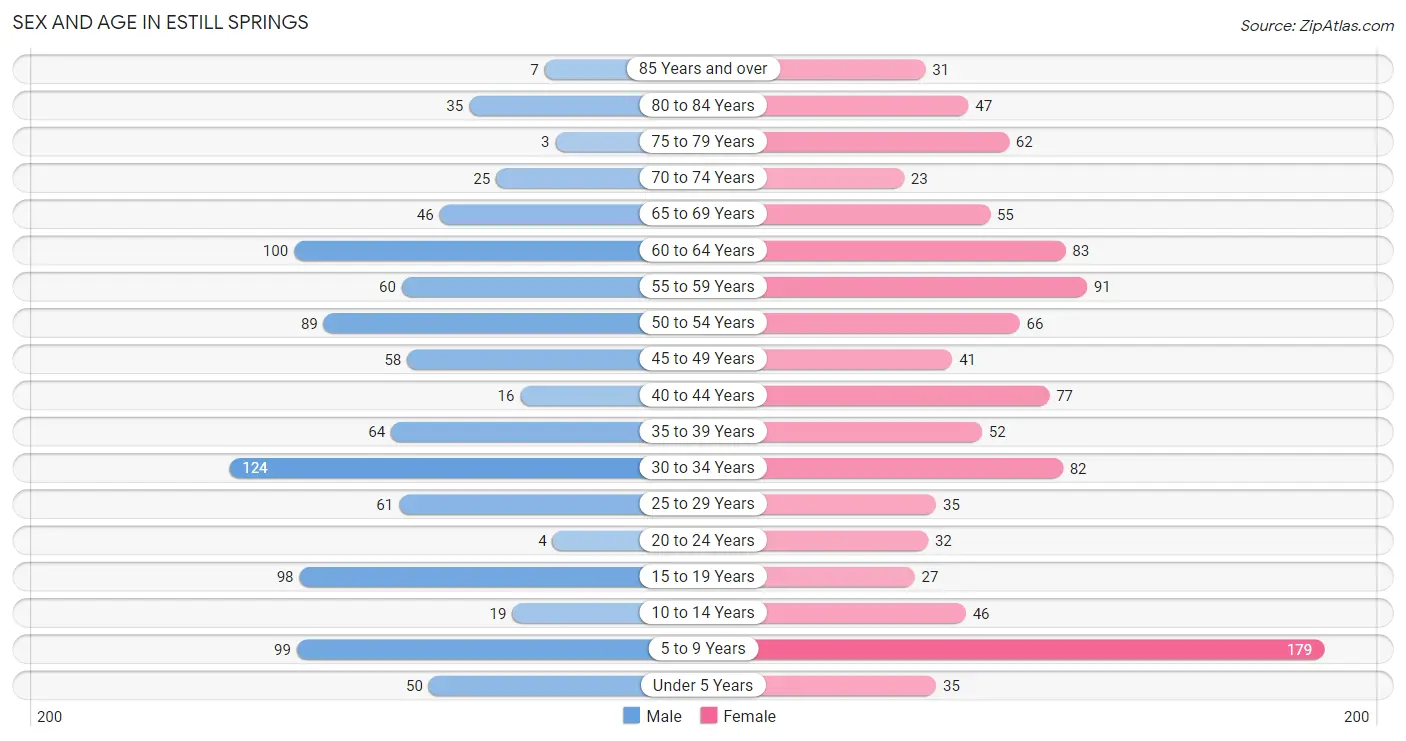
The most populous age groups in Estill Springs are 30 to 34 Years (124 | 12.9%) for men and 5 to 9 Years (179 | 16.8%) for women.
| Age Bracket | Male | Female |
| Under 5 Years | 50 (5.2%) | 35 (3.3%) |
| 5 to 9 Years | 99 (10.3%) | 179 (16.8%) |
| 10 to 14 Years | 19 (2.0%) | 46 (4.3%) |
| 15 to 19 Years | 98 (10.2%) | 27 (2.5%) |
| 20 to 24 Years | 4 (0.4%) | 32 (3.0%) |
| 25 to 29 Years | 61 (6.4%) | 35 (3.3%) |
| 30 to 34 Years | 124 (12.9%) | 82 (7.7%) |
| 35 to 39 Years | 64 (6.7%) | 52 (4.9%) |
| 40 to 44 Years | 16 (1.7%) | 77 (7.2%) |
| 45 to 49 Years | 58 (6.0%) | 41 (3.8%) |
| 50 to 54 Years | 89 (9.3%) | 66 (6.2%) |
| 55 to 59 Years | 60 (6.3%) | 91 (8.6%) |
| 60 to 64 Years | 100 (10.4%) | 83 (7.8%) |
| 65 to 69 Years | 46 (4.8%) | 55 (5.2%) |
| 70 to 74 Years | 25 (2.6%) | 23 (2.2%) |
| 75 to 79 Years | 3 (0.3%) | 62 (5.8%) |
| 80 to 84 Years | 35 (3.6%) | 47 (4.4%) |
| 85 Years and over | 7 (0.7%) | 31 (2.9%) |
| Total | 958 (100.0%) | 1,064 (100.0%) |
Families and Households in Estill Springs
Median Family Size in Estill Springs
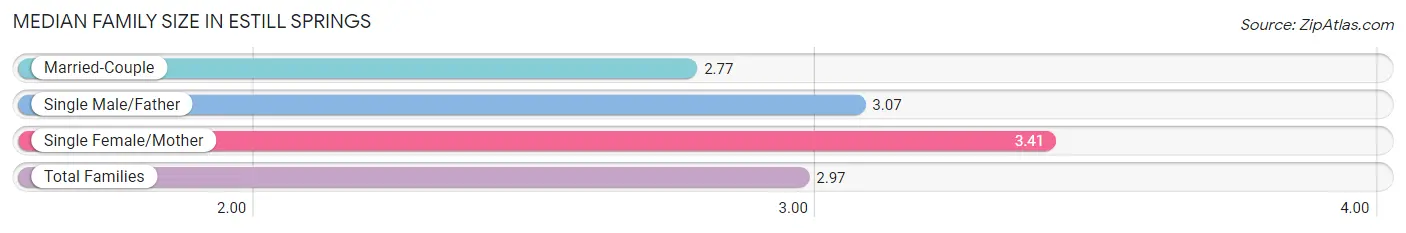
The median family size in Estill Springs is 2.97 persons per family, with single female/mother families (152 | 26.3%) accounting for the largest median family size of 3.41 persons per family. On the other hand, married-couple families (367 | 63.6%) represent the smallest median family size with 2.77 persons per family.
| Family Type | # Families | Family Size |
| Married-Couple | 367 (63.6%) | 2.77 |
| Single Male/Father | 58 (10.1%) | 3.07 |
| Single Female/Mother | 152 (26.3%) | 3.41 |
| Total Families | 577 (100.0%) | 2.97 |
Median Household Size in Estill Springs
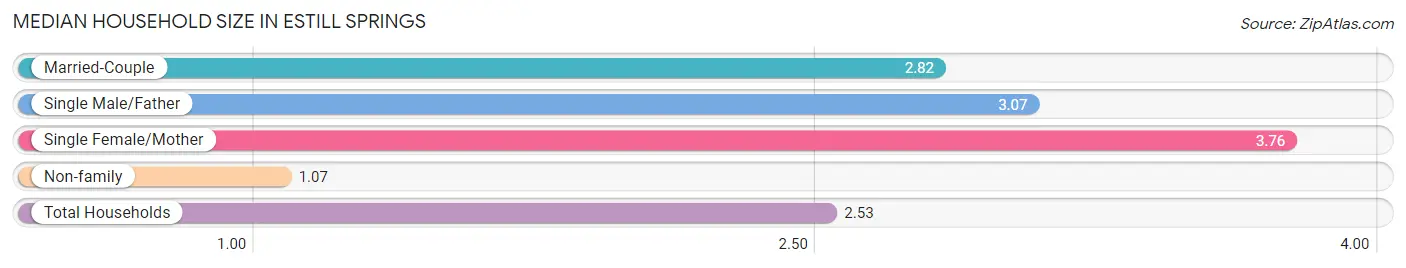
The median household size in Estill Springs is 2.53 persons per household, with single female/mother households (152 | 19.0%) accounting for the largest median household size of 3.76 persons per household. non-family households (222 | 27.8%) represent the smallest median household size with 1.07 persons per household.
| Household Type | # Households | Household Size |
| Married-Couple | 367 (45.9%) | 2.82 |
| Single Male/Father | 58 (7.3%) | 3.07 |
| Single Female/Mother | 152 (19.0%) | 3.76 |
| Non-family | 222 (27.8%) | 1.07 |
| Total Households | 799 (100.0%) | 2.53 |
Household Size by Marriage Status in Estill Springs
Out of a total of 799 households in Estill Springs, 577 (72.2%) are family households, while 222 (27.8%) are nonfamily households. The most numerous type of family households are 2-person households, comprising 256, and the most common type of nonfamily households are 1-person households, comprising 211.
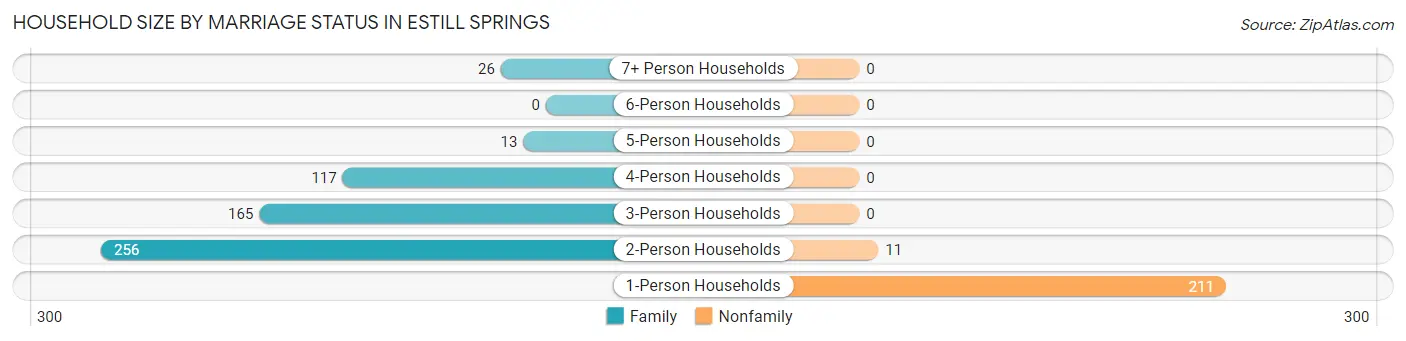
| Household Size | Family Households | Nonfamily Households |
| 1-Person Households | - | 211 (26.4%) |
| 2-Person Households | 256 (32.0%) | 11 (1.4%) |
| 3-Person Households | 165 (20.6%) | 0 (0.0%) |
| 4-Person Households | 117 (14.6%) | 0 (0.0%) |
| 5-Person Households | 13 (1.6%) | 0 (0.0%) |
| 6-Person Households | 0 (0.0%) | 0 (0.0%) |
| 7+ Person Households | 26 (3.3%) | 0 (0.0%) |
| Total | 577 (72.2%) | 222 (27.8%) |
Female Fertility in Estill Springs
Fertility by Age in Estill Springs
Average fertility rate in Estill Springs is 46.0 births per 1,000 women. Women in the age bracket of 20 to 34 years have the highest fertility rate with 107.0 births per 1,000 women. Women in the age bracket of 20 to 34 years acount for 100.0% of all women with births.
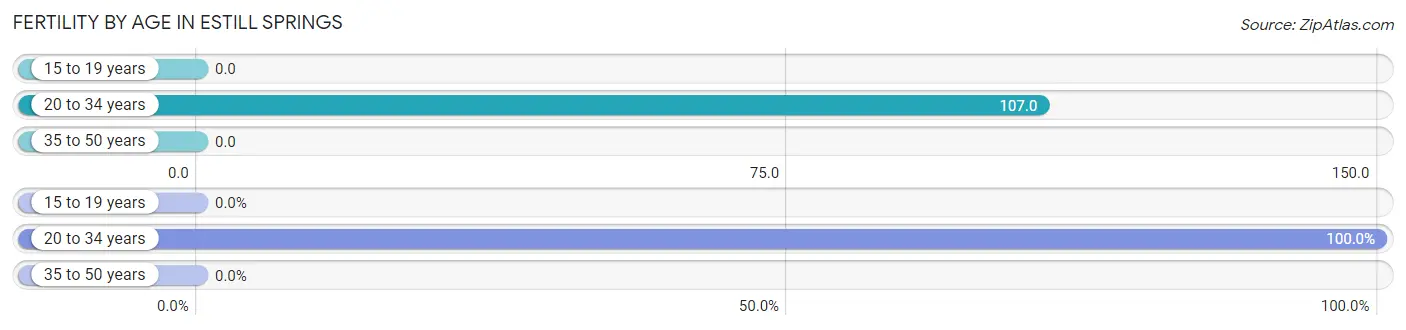
| Age Bracket | Women with Births | Births / 1,000 Women |
| 15 to 19 years | 0 (0.0%) | 0.0 |
| 20 to 34 years | 16 (100.0%) | 107.0 |
| 35 to 50 years | 0 (0.0%) | 0.0 |
| Total | 16 (100.0%) | 46.0 |
Fertility by Age by Marriage Status in Estill Springs
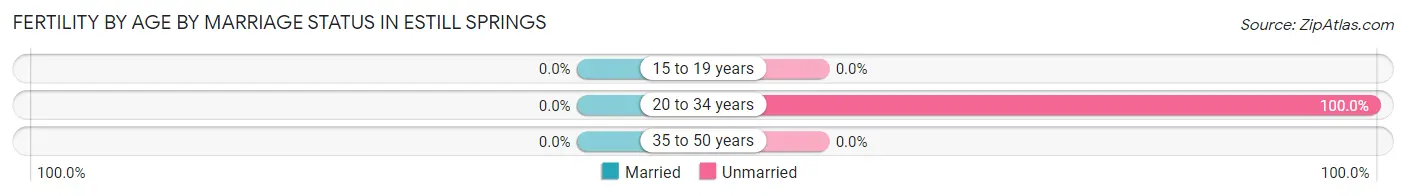
| Age Bracket | Married | Unmarried |
| 15 to 19 years | 0 (0.0%) | 0 (0.0%) |
| 20 to 34 years | 0 (0.0%) | 16 (100.0%) |
| 35 to 50 years | 0 (0.0%) | 0 (0.0%) |
| Total | 0 (0.0%) | 16 (100.0%) |
Fertility by Education in Estill Springs
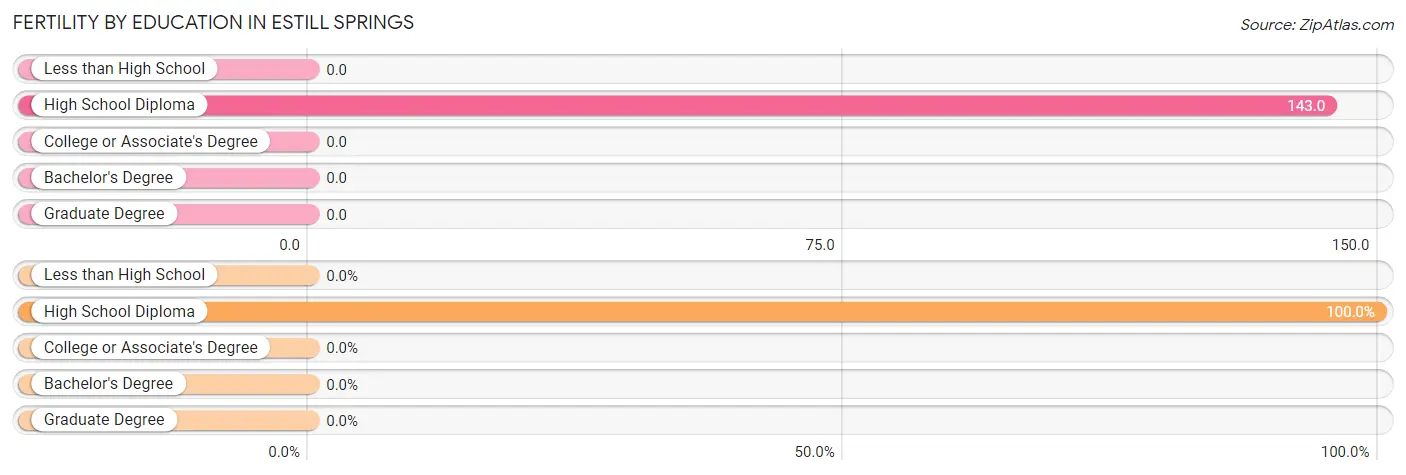
| Educational Attainment | Women with Births | Births / 1,000 Women |
| Less than High School | 0 (0.0%) | 0.0 |
| High School Diploma | 16 (100.0%) | 143.0 |
| College or Associate's Degree | 0 (0.0%) | 0.0 |
| Bachelor's Degree | 0 (0.0%) | 0.0 |
| Graduate Degree | 0 (0.0%) | 0.0 |
| Total | 16 (100.0%) | 46.0 |
Fertility by Education by Marriage Status in Estill Springs
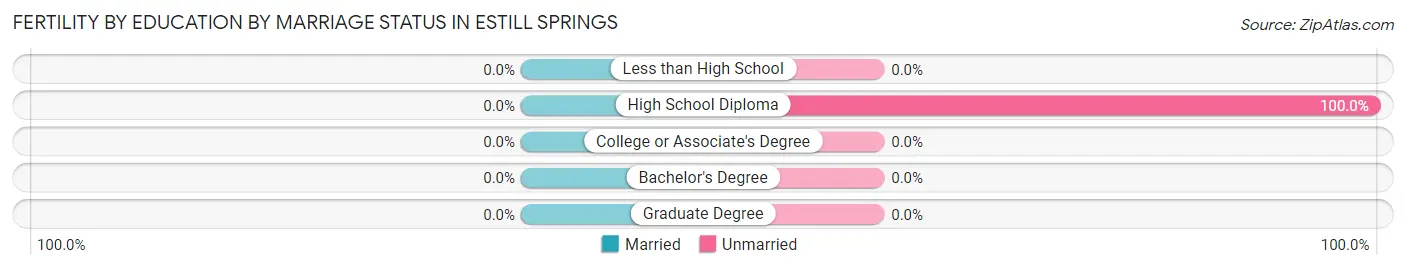
| Educational Attainment | Married | Unmarried |
| Less than High School | 0 (0.0%) | 0 (0.0%) |
| High School Diploma | 0 (0.0%) | 16 (100.0%) |
| College or Associate's Degree | 0 (0.0%) | 0 (0.0%) |
| Bachelor's Degree | 0 (0.0%) | 0 (0.0%) |
| Graduate Degree | 0 (0.0%) | 0 (0.0%) |
| Total | 0 (0.0%) | 16 (100.0%) |
Employment Characteristics in Estill Springs
Employment by Class of Employer in Estill Springs
Among the 785 employed individuals in Estill Springs, private company employees (620 | 79.0%), self-employed (not incorporated) (58 | 7.4%), and local government employees (57 | 7.3%) make up the most common classes of employment.
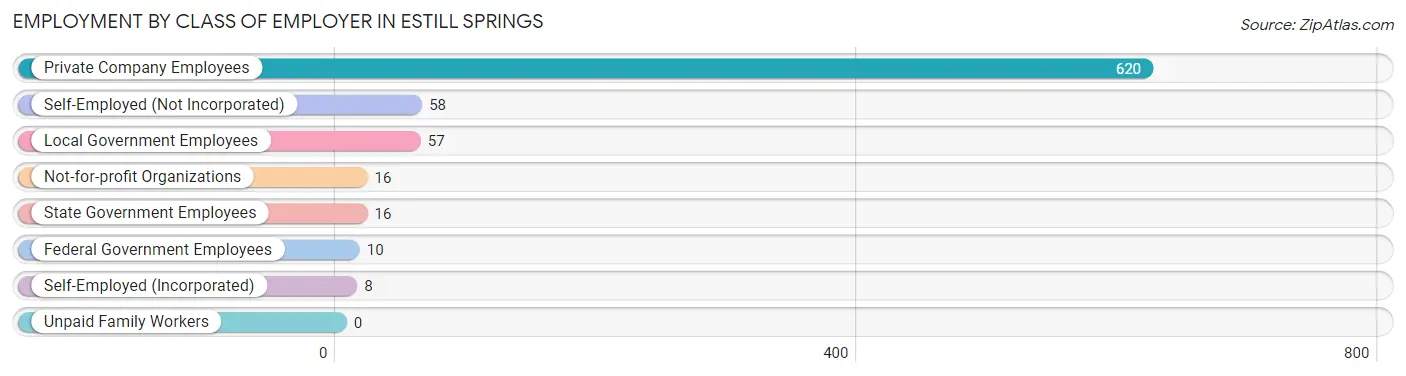
| Employer Class | # Employees | % Employees |
| Private Company Employees | 620 | 79.0% |
| Self-Employed (Incorporated) | 8 | 1.0% |
| Self-Employed (Not Incorporated) | 58 | 7.4% |
| Not-for-profit Organizations | 16 | 2.0% |
| Local Government Employees | 57 | 7.3% |
| State Government Employees | 16 | 2.0% |
| Federal Government Employees | 10 | 1.3% |
| Unpaid Family Workers | 0 | 0.0% |
| Total | 785 | 100.0% |
Employment Status by Age in Estill Springs
According to the labor force statistics for Estill Springs, out of the total population over 16 years of age (1,557), 56.3% or 877 individuals are in the labor force, with 8.1% or 71 of them unemployed. The age group with the highest labor force participation rate is 35 to 44 years, with 88.5% or 185 individuals in the labor force. Within the labor force, the 20 to 24 years age range has the highest percentage of unemployed individuals, with 71.4% or 15 of them being unemployed.
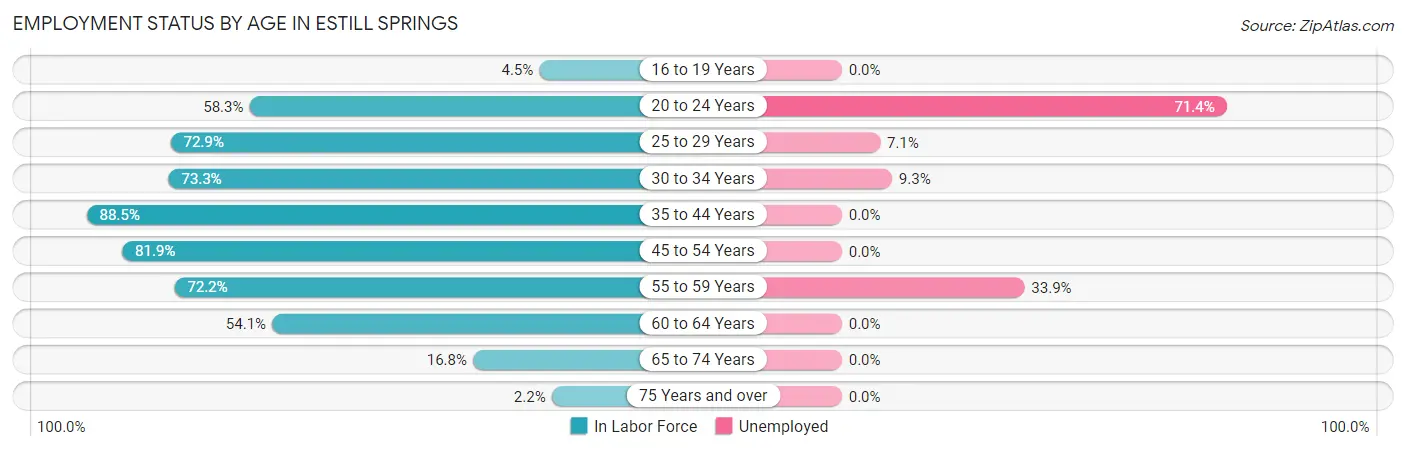
| Age Bracket | In Labor Force | Unemployed |
| 16 to 19 Years | 4 (4.5%) | 0 (0.0%) |
| 20 to 24 Years | 21 (58.3%) | 15 (71.4%) |
| 25 to 29 Years | 70 (72.9%) | 5 (7.1%) |
| 30 to 34 Years | 151 (73.3%) | 14 (9.3%) |
| 35 to 44 Years | 185 (88.5%) | 0 (0.0%) |
| 45 to 54 Years | 208 (81.9%) | 0 (0.0%) |
| 55 to 59 Years | 109 (72.2%) | 37 (33.9%) |
| 60 to 64 Years | 99 (54.1%) | 0 (0.0%) |
| 65 to 74 Years | 25 (16.8%) | 0 (0.0%) |
| 75 Years and over | 4 (2.2%) | 0 (0.0%) |
| Total | 877 (56.3%) | 71 (8.1%) |
Employment Status by Educational Attainment in Estill Springs
According to labor force statistics for Estill Springs, 74.8% of individuals (822) out of the total population between 25 and 64 years of age (1,099) are in the labor force, with 6.8% or 56 of them being unemployed. The group with the highest labor force participation rate are those with the educational attainment of bachelor's degree or higher, with 87.7% or 179 individuals in the labor force. Within the labor force, individuals with high school diploma education have the highest percentage of unemployment, with 10.5% or 37 of them being unemployed.
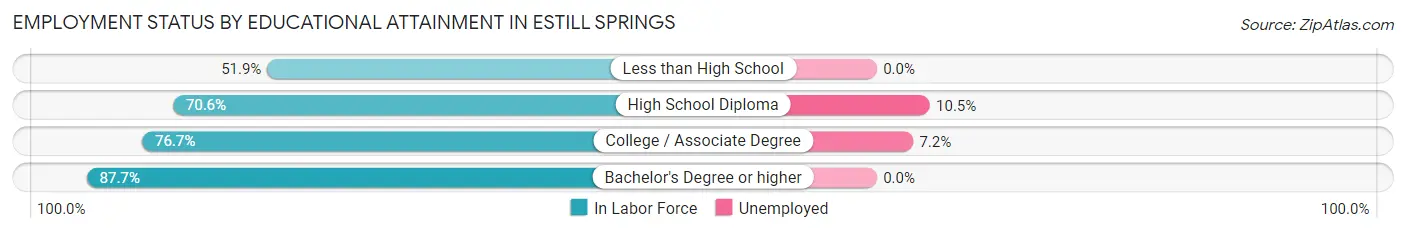
| Educational Attainment | In Labor Force | Unemployed |
| Less than High School | 28 (51.9%) | 0 (0.0%) |
| High School Diploma | 351 (70.6%) | 52 (10.5%) |
| College / Associate Degree | 264 (76.7%) | 25 (7.2%) |
| Bachelor's Degree or higher | 179 (87.7%) | 0 (0.0%) |
| Total | 822 (74.8%) | 75 (6.8%) |
Employment Occupations by Sex in Estill Springs
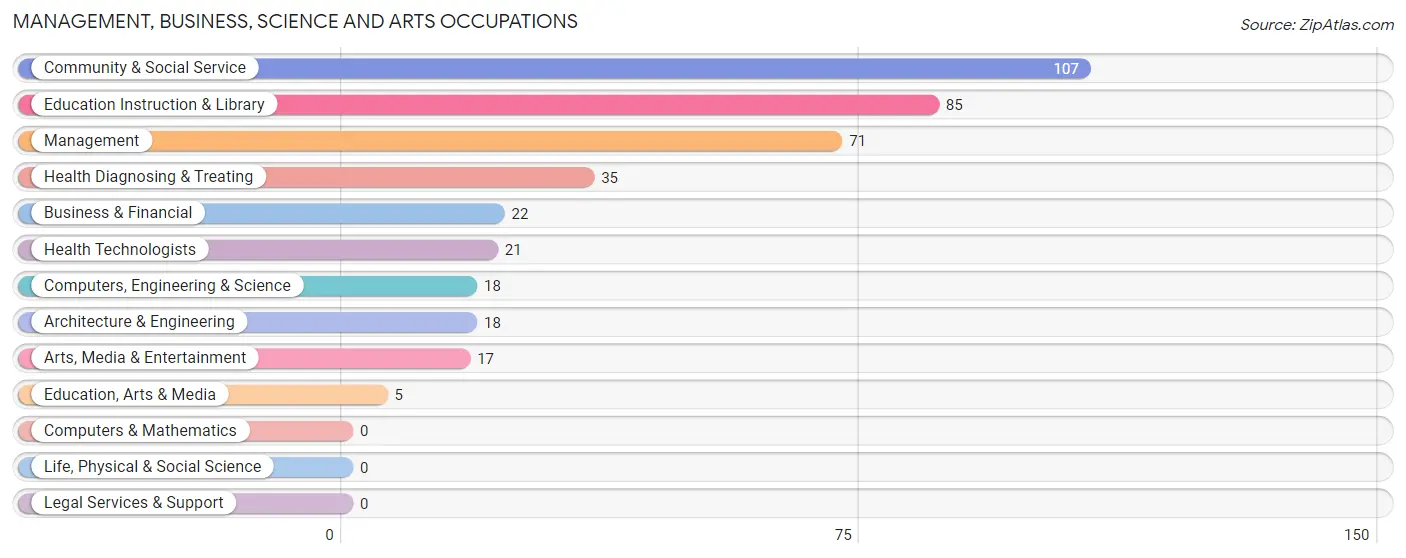
Management, Business, Science and Arts Occupations
The most common Management, Business, Science and Arts occupations in Estill Springs are Community & Social Service (107 | 13.3%), Education Instruction & Library (85 | 10.6%), Management (71 | 8.8%), Health Diagnosing & Treating (35 | 4.3%), and Business & Financial (22 | 2.7%).
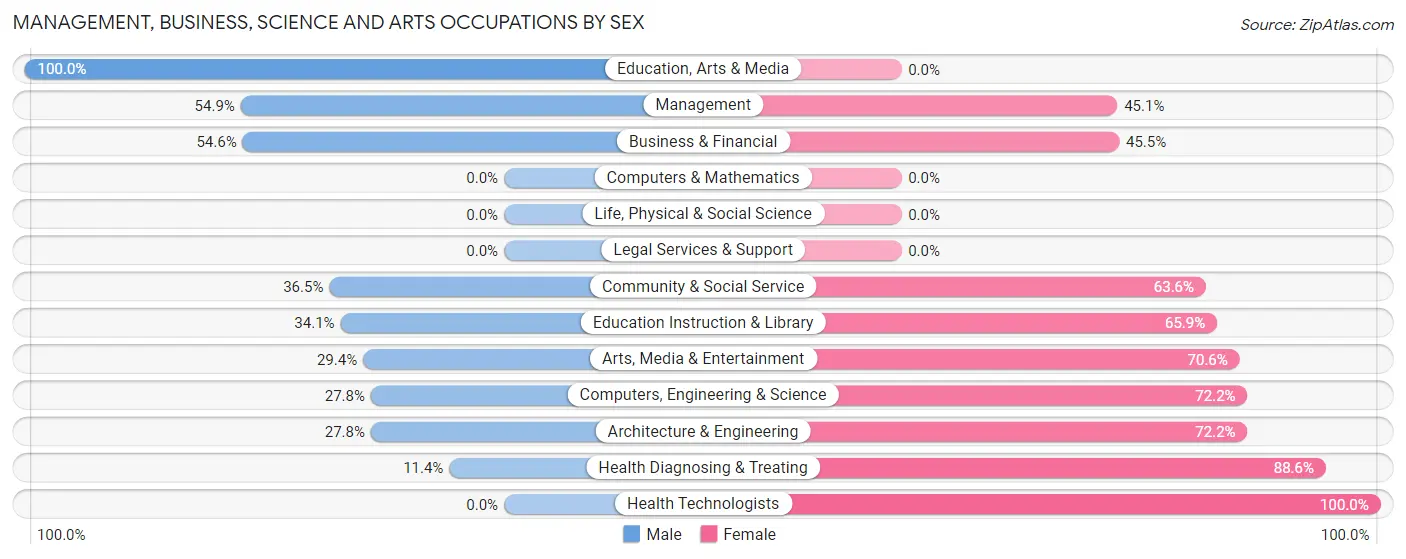
Management, Business, Science and Arts Occupations by Sex
Within the Management, Business, Science and Arts occupations in Estill Springs, the most male-oriented occupations are Education, Arts & Media (100.0%), Management (54.9%), and Business & Financial (54.5%), while the most female-oriented occupations are Health Technologists (100.0%), Health Diagnosing & Treating (88.6%), and Computers, Engineering & Science (72.2%).
| Occupation | Male | Female |
| Management | 39 (54.9%) | 32 (45.1%) |
| Business & Financial | 12 (54.5%) | 10 (45.5%) |
| Computers, Engineering & Science | 5 (27.8%) | 13 (72.2%) |
| Computers & Mathematics | 0 (0.0%) | 0 (0.0%) |
| Architecture & Engineering | 5 (27.8%) | 13 (72.2%) |
| Life, Physical & Social Science | 0 (0.0%) | 0 (0.0%) |
| Community & Social Service | 39 (36.4%) | 68 (63.5%) |
| Education, Arts & Media | 5 (100.0%) | 0 (0.0%) |
| Legal Services & Support | 0 (0.0%) | 0 (0.0%) |
| Education Instruction & Library | 29 (34.1%) | 56 (65.9%) |
| Arts, Media & Entertainment | 5 (29.4%) | 12 (70.6%) |
| Health Diagnosing & Treating | 4 (11.4%) | 31 (88.6%) |
| Health Technologists | 0 (0.0%) | 21 (100.0%) |
| Total (Category) | 99 (39.1%) | 154 (60.9%) |
| Total (Overall) | 417 (51.8%) | 388 (48.2%) |
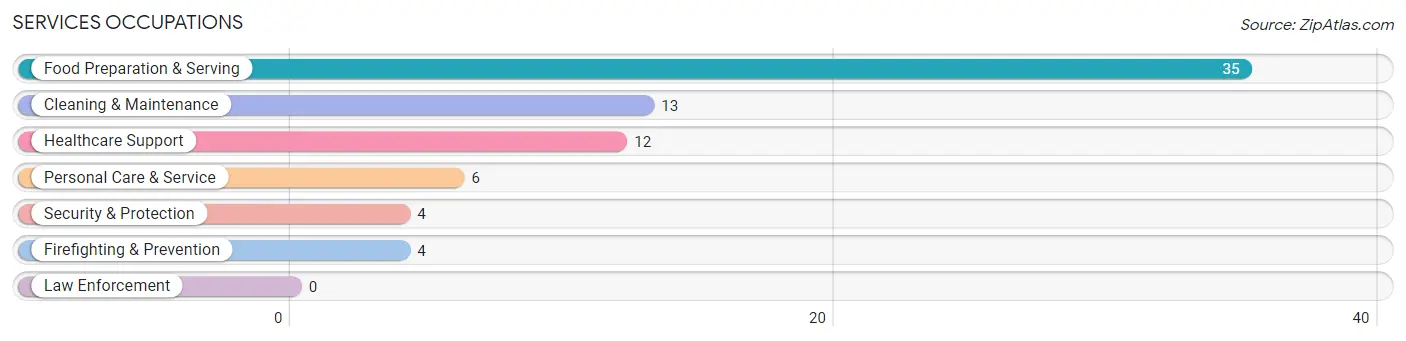
Services Occupations
The most common Services occupations in Estill Springs are Food Preparation & Serving (35 | 4.3%), Cleaning & Maintenance (13 | 1.6%), Healthcare Support (12 | 1.5%), Personal Care & Service (6 | 0.7%), and Security & Protection (4 | 0.5%).
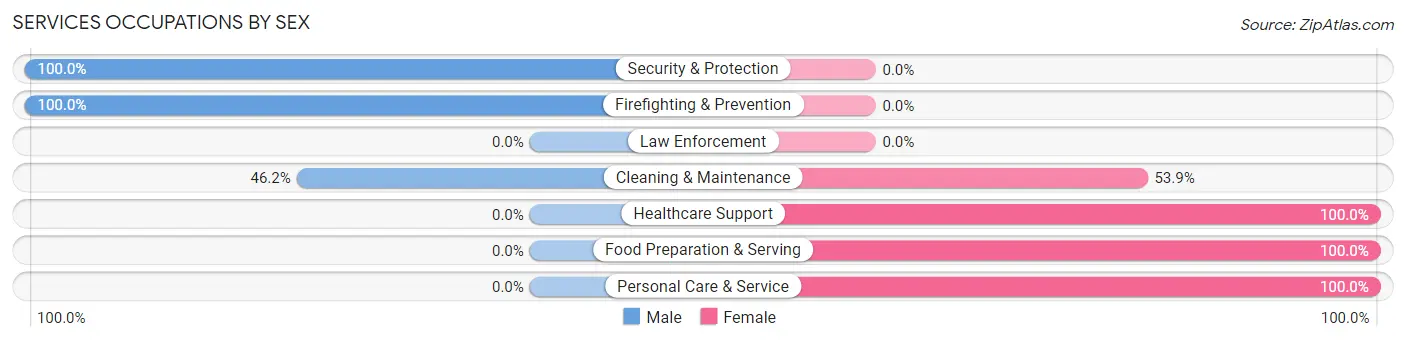
Services Occupations by Sex
Within the Services occupations in Estill Springs, the most male-oriented occupations are Security & Protection (100.0%), Firefighting & Prevention (100.0%), and Cleaning & Maintenance (46.2%), while the most female-oriented occupations are Healthcare Support (100.0%), Food Preparation & Serving (100.0%), and Personal Care & Service (100.0%).
| Occupation | Male | Female |
| Healthcare Support | 0 (0.0%) | 12 (100.0%) |
| Security & Protection | 4 (100.0%) | 0 (0.0%) |
| Firefighting & Prevention | 4 (100.0%) | 0 (0.0%) |
| Law Enforcement | 0 (0.0%) | 0 (0.0%) |
| Food Preparation & Serving | 0 (0.0%) | 35 (100.0%) |
| Cleaning & Maintenance | 6 (46.2%) | 7 (53.8%) |
| Personal Care & Service | 0 (0.0%) | 6 (100.0%) |
| Total (Category) | 10 (14.3%) | 60 (85.7%) |
| Total (Overall) | 417 (51.8%) | 388 (48.2%) |
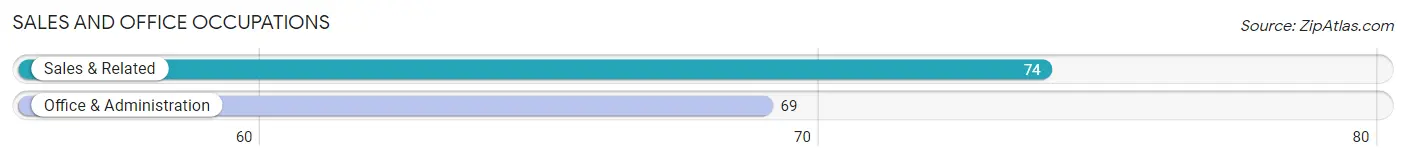
Sales and Office Occupations
The most common Sales and Office occupations in Estill Springs are Sales & Related (74 | 9.2%), and Office & Administration (69 | 8.6%).
Sales and Office Occupations by Sex
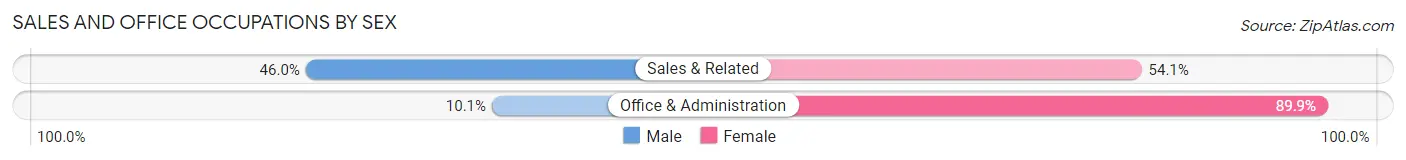
| Occupation | Male | Female |
| Sales & Related | 34 (46.0%) | 40 (54.0%) |
| Office & Administration | 7 (10.1%) | 62 (89.9%) |
| Total (Category) | 41 (28.7%) | 102 (71.3%) |
| Total (Overall) | 417 (51.8%) | 388 (48.2%) |
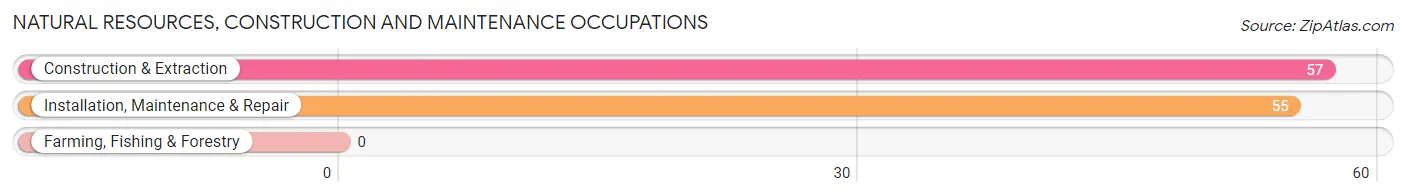
Natural Resources, Construction and Maintenance Occupations
The most common Natural Resources, Construction and Maintenance occupations in Estill Springs are Construction & Extraction (57 | 7.1%), and Installation, Maintenance & Repair (55 | 6.8%).
Natural Resources, Construction and Maintenance Occupations by Sex
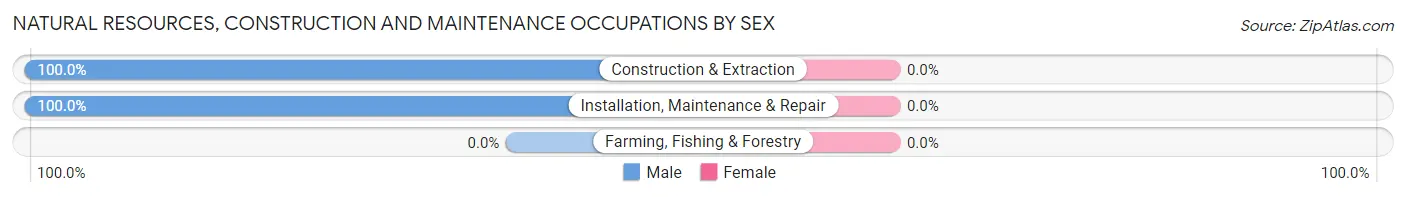
| Occupation | Male | Female |
| Farming, Fishing & Forestry | 0 (0.0%) | 0 (0.0%) |
| Construction & Extraction | 57 (100.0%) | 0 (0.0%) |
| Installation, Maintenance & Repair | 55 (100.0%) | 0 (0.0%) |
| Total (Category) | 112 (100.0%) | 0 (0.0%) |
| Total (Overall) | 417 (51.8%) | 388 (48.2%) |
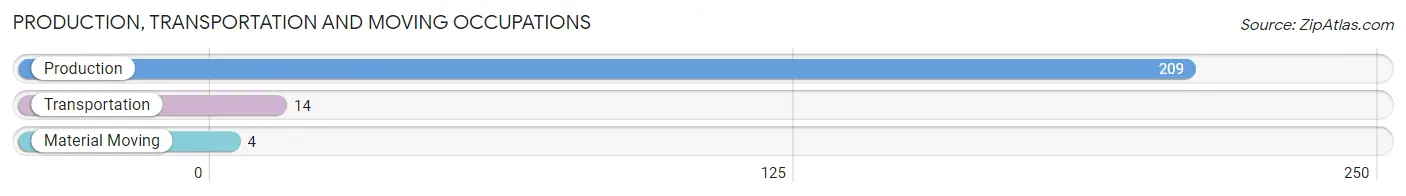
Production, Transportation and Moving Occupations
The most common Production, Transportation and Moving occupations in Estill Springs are Production (209 | 26.0%), Transportation (14 | 1.7%), and Material Moving (4 | 0.5%).
Production, Transportation and Moving Occupations by Sex
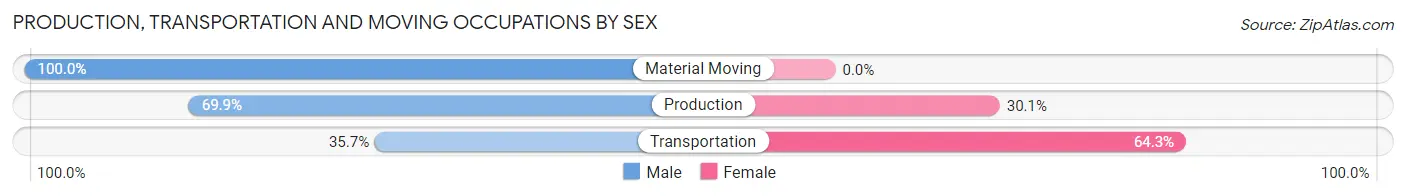
| Occupation | Male | Female |
| Production | 146 (69.9%) | 63 (30.1%) |
| Transportation | 5 (35.7%) | 9 (64.3%) |
| Material Moving | 4 (100.0%) | 0 (0.0%) |
| Total (Category) | 155 (68.3%) | 72 (31.7%) |
| Total (Overall) | 417 (51.8%) | 388 (48.2%) |
Employment Industries by Sex in Estill Springs
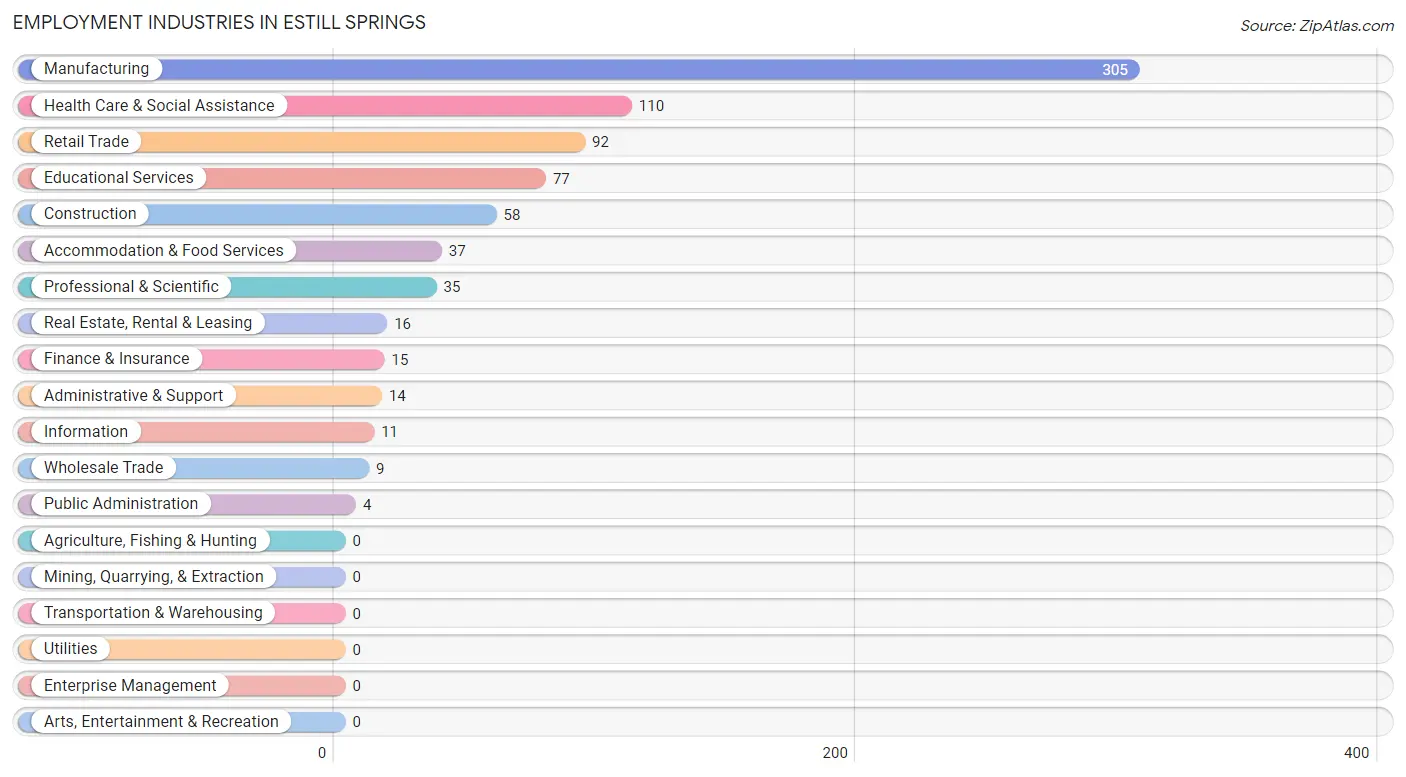
Employment Industries in Estill Springs
The major employment industries in Estill Springs include Manufacturing (305 | 37.9%), Health Care & Social Assistance (110 | 13.7%), Retail Trade (92 | 11.4%), Educational Services (77 | 9.6%), and Construction (58 | 7.2%).
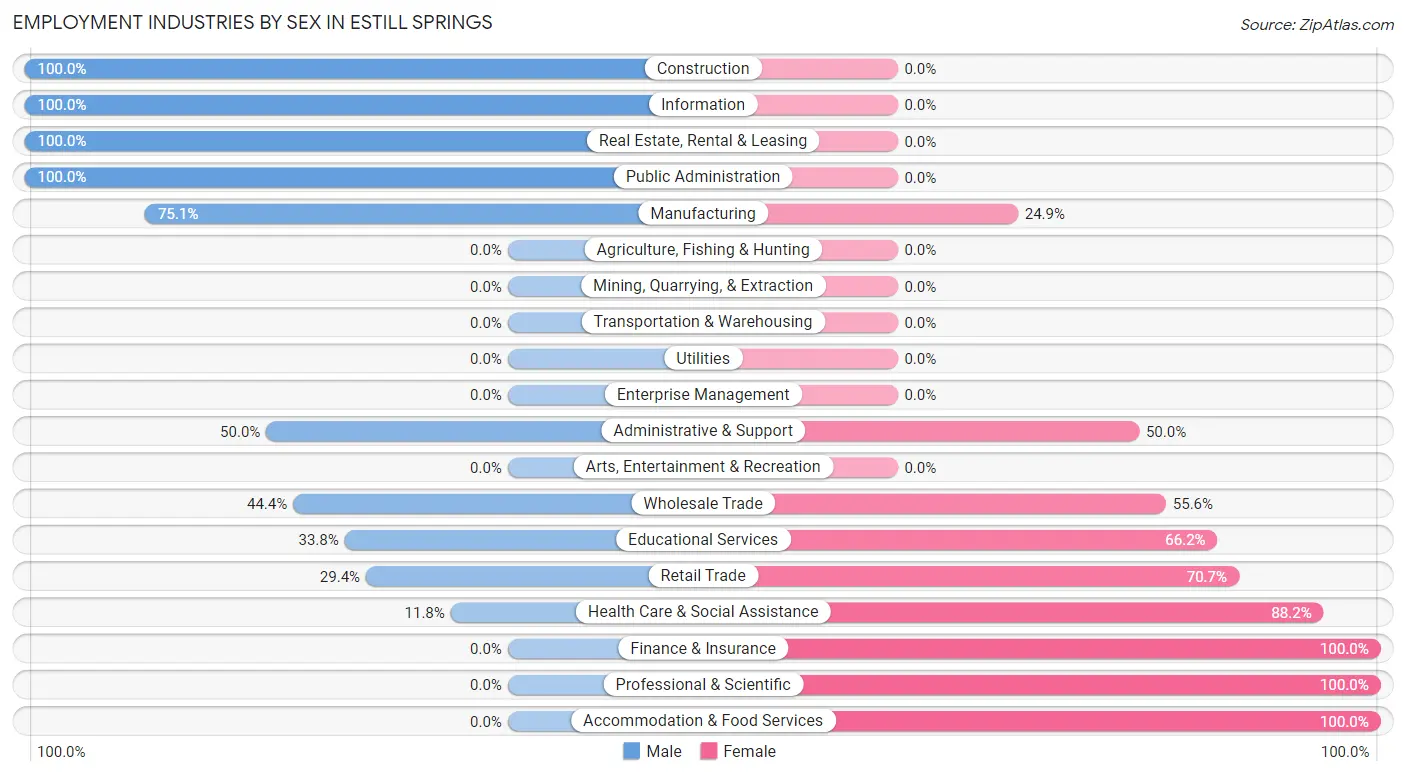
Employment Industries by Sex in Estill Springs
The Estill Springs industries that see more men than women are Construction (100.0%), Information (100.0%), and Real Estate, Rental & Leasing (100.0%), whereas the industries that tend to have a higher number of women are Finance & Insurance (100.0%), Professional & Scientific (100.0%), and Accommodation & Food Services (100.0%).
| Industry | Male | Female |
| Agriculture, Fishing & Hunting | 0 (0.0%) | 0 (0.0%) |
| Mining, Quarrying, & Extraction | 0 (0.0%) | 0 (0.0%) |
| Construction | 58 (100.0%) | 0 (0.0%) |
| Manufacturing | 229 (75.1%) | 76 (24.9%) |
| Wholesale Trade | 4 (44.4%) | 5 (55.6%) |
| Retail Trade | 27 (29.3%) | 65 (70.7%) |
| Transportation & Warehousing | 0 (0.0%) | 0 (0.0%) |
| Utilities | 0 (0.0%) | 0 (0.0%) |
| Information | 11 (100.0%) | 0 (0.0%) |
| Finance & Insurance | 0 (0.0%) | 15 (100.0%) |
| Real Estate, Rental & Leasing | 16 (100.0%) | 0 (0.0%) |
| Professional & Scientific | 0 (0.0%) | 35 (100.0%) |
| Enterprise Management | 0 (0.0%) | 0 (0.0%) |
| Administrative & Support | 7 (50.0%) | 7 (50.0%) |
| Educational Services | 26 (33.8%) | 51 (66.2%) |
| Health Care & Social Assistance | 13 (11.8%) | 97 (88.2%) |
| Arts, Entertainment & Recreation | 0 (0.0%) | 0 (0.0%) |
| Accommodation & Food Services | 0 (0.0%) | 37 (100.0%) |
| Public Administration | 4 (100.0%) | 0 (0.0%) |
| Total | 417 (51.8%) | 388 (48.2%) |
Education in Estill Springs
School Enrollment in Estill Springs
The most common levels of schooling among the 516 students in Estill Springs are elementary school (220 | 42.6%), high school (122 | 23.6%), and middle school (85 | 16.5%).
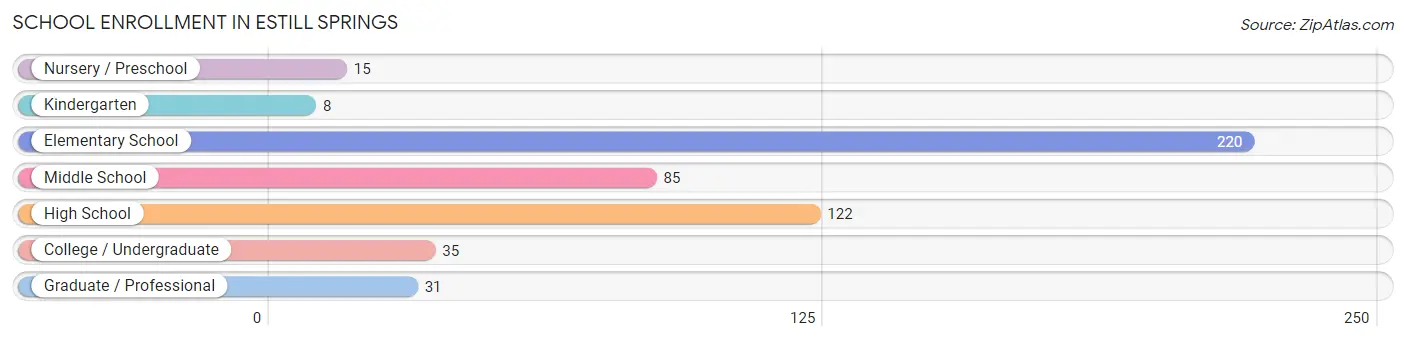
| School Level | # Students | % Students |
| Nursery / Preschool | 15 | 2.9% |
| Kindergarten | 8 | 1.5% |
| Elementary School | 220 | 42.6% |
| Middle School | 85 | 16.5% |
| High School | 122 | 23.6% |
| College / Undergraduate | 35 | 6.8% |
| Graduate / Professional | 31 | 6.0% |
| Total | 516 | 100.0% |
School Enrollment by Age by Funding Source in Estill Springs
Out of a total of 516 students who are enrolled in schools in Estill Springs, 50 (9.7%) attend a private institution, while the remaining 466 (90.3%) are enrolled in public schools. The age group of 25 to 34 year olds has the highest likelihood of being enrolled in private schools, with 14 (100.0% in the age bracket) enrolled. Conversely, the age group of 18 to 19 year olds has the lowest likelihood of being enrolled in a private school, with 8 (100.0% in the age bracket) attending a public institution.
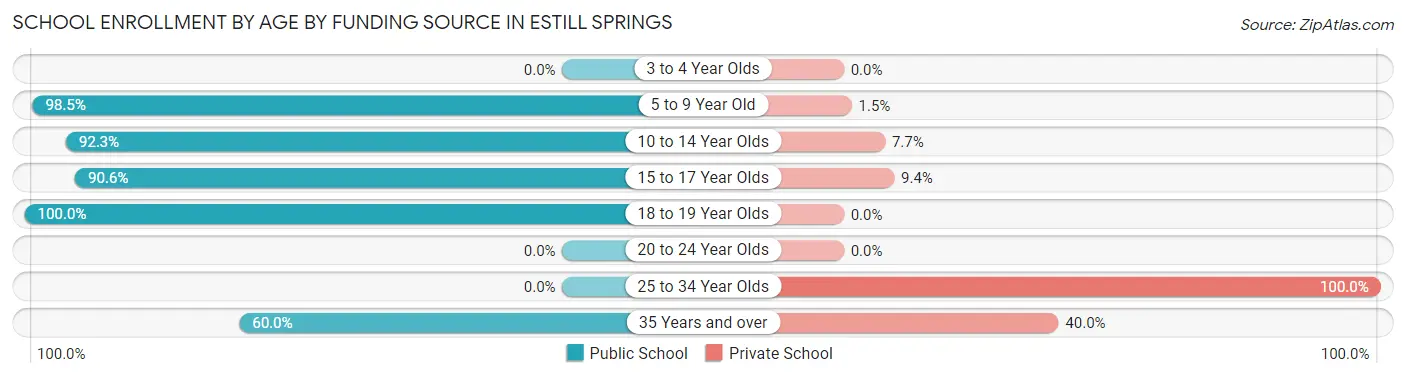
| Age Bracket | Public School | Private School |
| 3 to 4 Year Olds | 0 (0.0%) | 0 (0.0%) |
| 5 to 9 Year Old | 268 (98.5%) | 4 (1.5%) |
| 10 to 14 Year Olds | 60 (92.3%) | 5 (7.7%) |
| 15 to 17 Year Olds | 106 (90.6%) | 11 (9.4%) |
| 18 to 19 Year Olds | 8 (100.0%) | 0 (0.0%) |
| 20 to 24 Year Olds | 0 (0.0%) | 0 (0.0%) |
| 25 to 34 Year Olds | 0 (0.0%) | 14 (100.0%) |
| 35 Years and over | 24 (60.0%) | 16 (40.0%) |
| Total | 466 (90.3%) | 50 (9.7%) |
Educational Attainment by Field of Study in Estill Springs
Business (76 | 27.2%), education (74 | 26.5%), science & technology (56 | 20.1%), engineering (37 | 13.3%), and liberal arts & history (11 | 3.9%) are the most common fields of study among 279 individuals in Estill Springs who have obtained a bachelor's degree or higher.
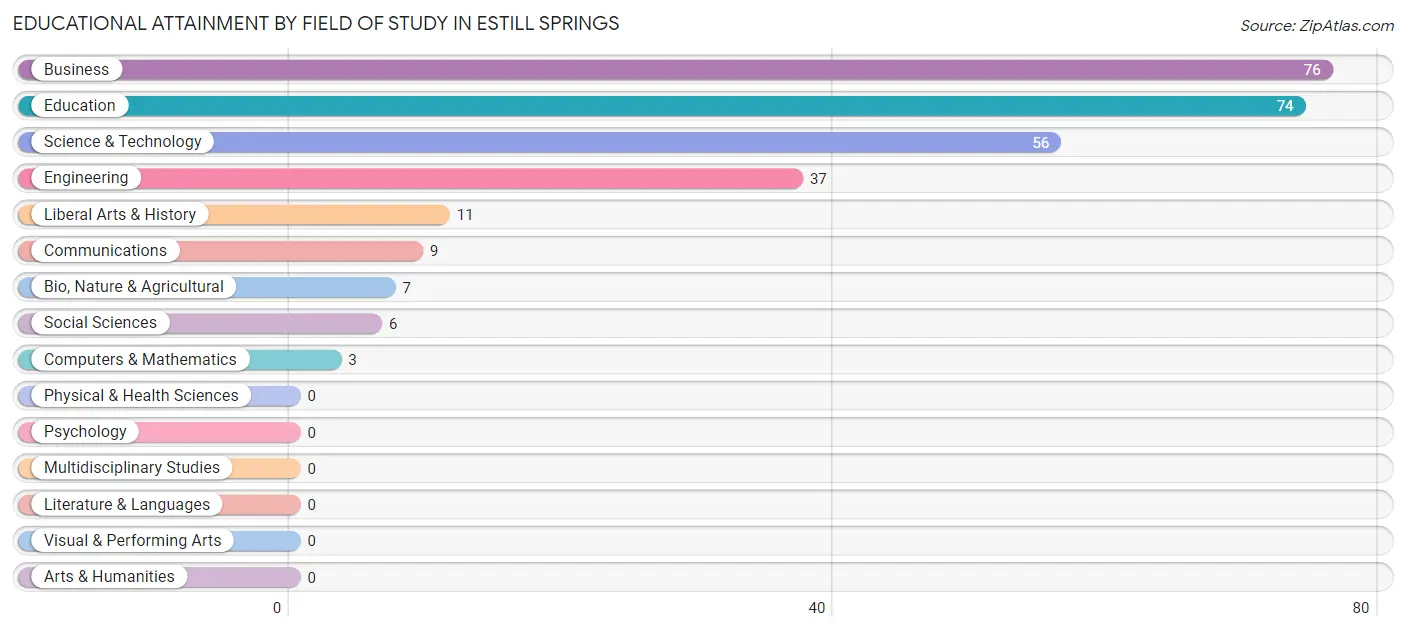
| Field of Study | # Graduates | % Graduates |
| Computers & Mathematics | 3 | 1.1% |
| Bio, Nature & Agricultural | 7 | 2.5% |
| Physical & Health Sciences | 0 | 0.0% |
| Psychology | 0 | 0.0% |
| Social Sciences | 6 | 2.1% |
| Engineering | 37 | 13.3% |
| Multidisciplinary Studies | 0 | 0.0% |
| Science & Technology | 56 | 20.1% |
| Business | 76 | 27.2% |
| Education | 74 | 26.5% |
| Literature & Languages | 0 | 0.0% |
| Liberal Arts & History | 11 | 3.9% |
| Visual & Performing Arts | 0 | 0.0% |
| Communications | 9 | 3.2% |
| Arts & Humanities | 0 | 0.0% |
| Total | 279 | 100.0% |
Transportation & Commute in Estill Springs
Vehicle Availability by Sex in Estill Springs
The most prevalent vehicle ownership categories in Estill Springs are males with 2 vehicles (235, accounting for 56.4%) and females with 2 vehicles (156, making up 63.9%).
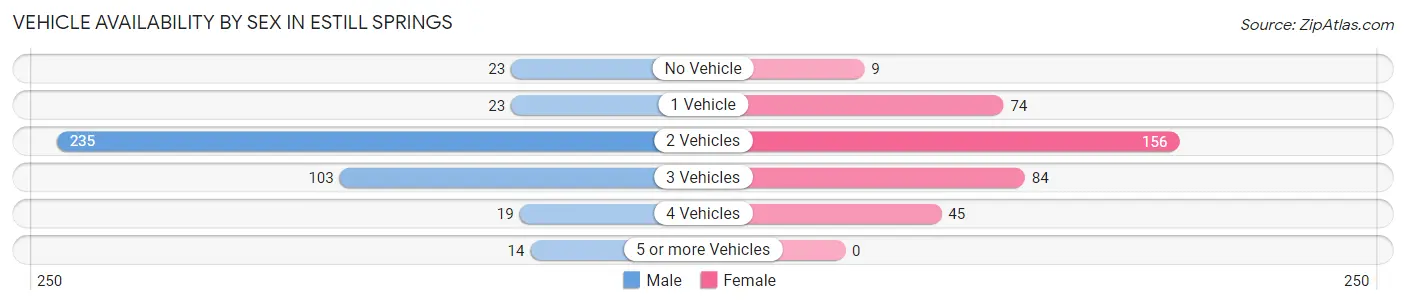
| Vehicles Available | Male | Female |
| No Vehicle | 23 (5.5%) | 9 (2.5%) |
| 1 Vehicle | 23 (5.5%) | 74 (20.1%) |
| 2 Vehicles | 235 (56.4%) | 156 (42.4%) |
| 3 Vehicles | 103 (24.7%) | 84 (22.8%) |
| 4 Vehicles | 19 (4.6%) | 45 (12.2%) |
| 5 or more Vehicles | 14 (3.4%) | 0 (0.0%) |
| Total | 417 (100.0%) | 368 (100.0%) |
Commute Time in Estill Springs
The most frequently occuring commute durations in Estill Springs are 15 to 19 minutes (264 commuters, 36.7%), 20 to 24 minutes (195 commuters, 27.1%), and 30 to 34 minutes (115 commuters, 16.0%).
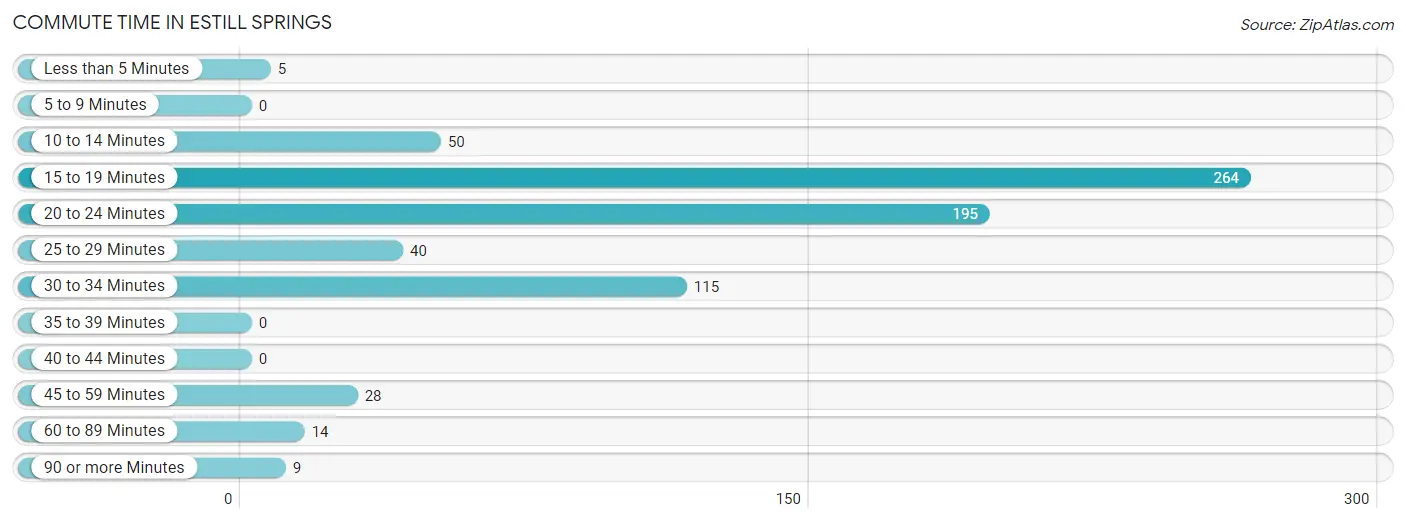
| Commute Time | # Commuters | % Commuters |
| Less than 5 Minutes | 5 | 0.7% |
| 5 to 9 Minutes | 0 | 0.0% |
| 10 to 14 Minutes | 50 | 6.9% |
| 15 to 19 Minutes | 264 | 36.7% |
| 20 to 24 Minutes | 195 | 27.1% |
| 25 to 29 Minutes | 40 | 5.6% |
| 30 to 34 Minutes | 115 | 16.0% |
| 35 to 39 Minutes | 0 | 0.0% |
| 40 to 44 Minutes | 0 | 0.0% |
| 45 to 59 Minutes | 28 | 3.9% |
| 60 to 89 Minutes | 14 | 1.9% |
| 90 or more Minutes | 9 | 1.3% |
Commute Time by Sex in Estill Springs
The most common commute times in Estill Springs are 20 to 24 minutes (132 commuters, 36.5%) for males and 15 to 19 minutes (180 commuters, 50.3%) for females.
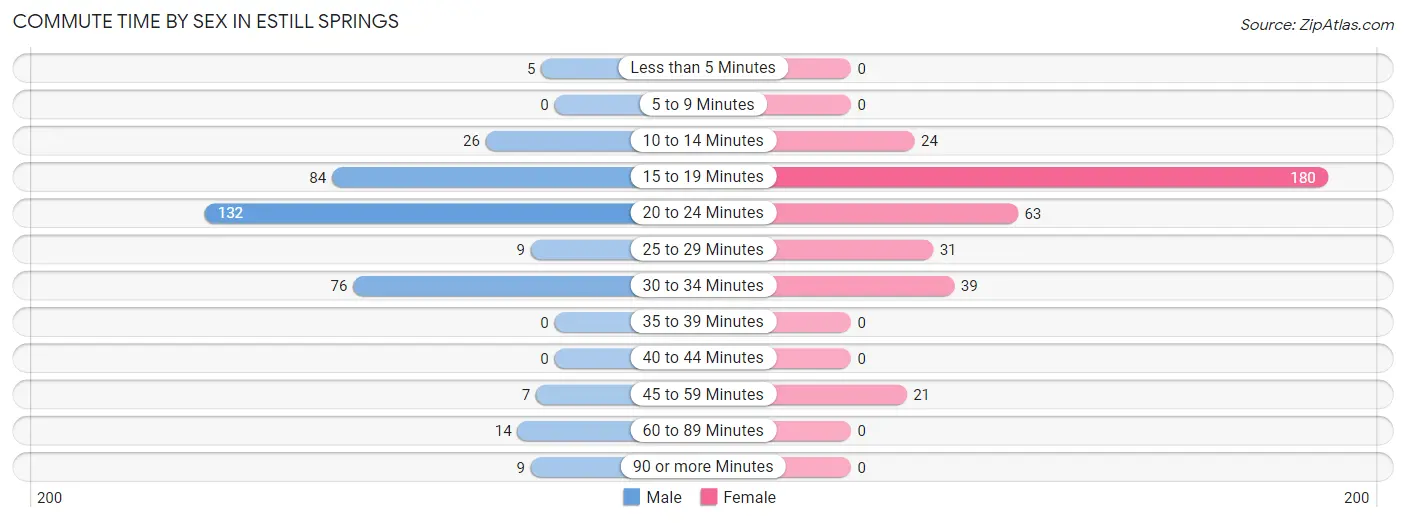
| Commute Time | Male | Female |
| Less than 5 Minutes | 5 (1.4%) | 0 (0.0%) |
| 5 to 9 Minutes | 0 (0.0%) | 0 (0.0%) |
| 10 to 14 Minutes | 26 (7.2%) | 24 (6.7%) |
| 15 to 19 Minutes | 84 (23.2%) | 180 (50.3%) |
| 20 to 24 Minutes | 132 (36.5%) | 63 (17.6%) |
| 25 to 29 Minutes | 9 (2.5%) | 31 (8.7%) |
| 30 to 34 Minutes | 76 (21.0%) | 39 (10.9%) |
| 35 to 39 Minutes | 0 (0.0%) | 0 (0.0%) |
| 40 to 44 Minutes | 0 (0.0%) | 0 (0.0%) |
| 45 to 59 Minutes | 7 (1.9%) | 21 (5.9%) |
| 60 to 89 Minutes | 14 (3.9%) | 0 (0.0%) |
| 90 or more Minutes | 9 (2.5%) | 0 (0.0%) |
Time of Departure to Work by Sex in Estill Springs
The most frequent times of departure to work in Estill Springs are 7:00 AM to 7:29 AM (72, 19.9%) for males and 7:00 AM to 7:29 AM (85, 23.7%) for females.
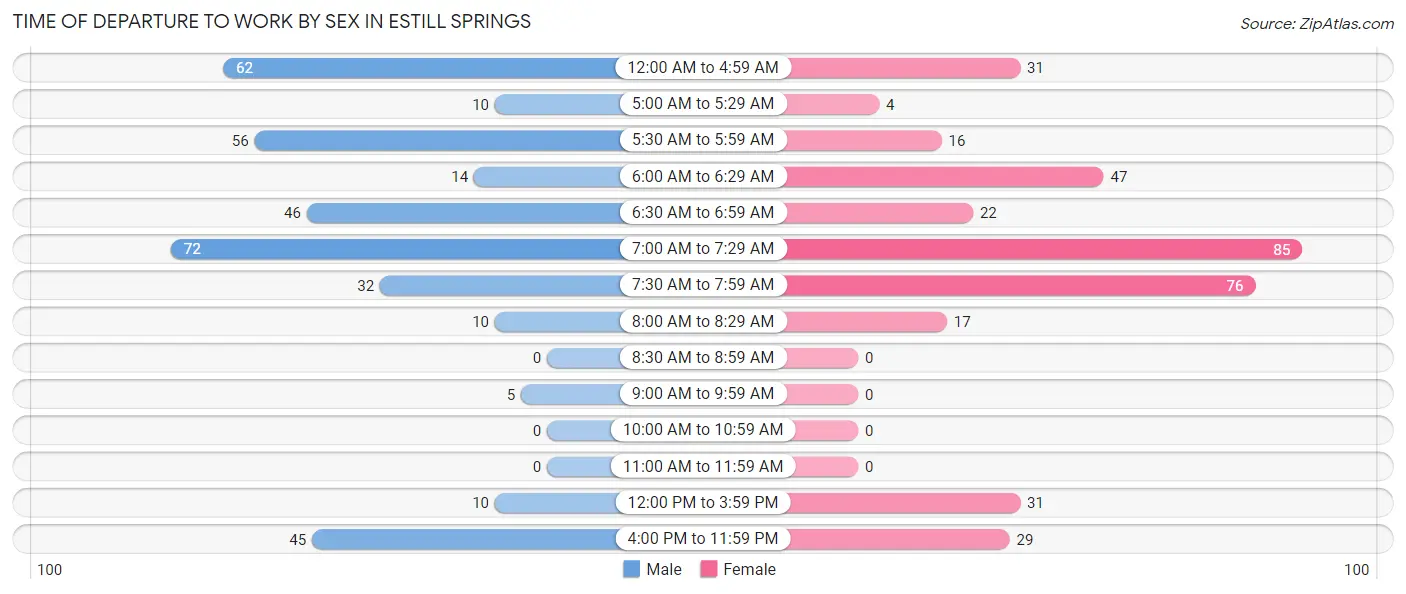
| Time of Departure | Male | Female |
| 12:00 AM to 4:59 AM | 62 (17.1%) | 31 (8.7%) |
| 5:00 AM to 5:29 AM | 10 (2.8%) | 4 (1.1%) |
| 5:30 AM to 5:59 AM | 56 (15.5%) | 16 (4.5%) |
| 6:00 AM to 6:29 AM | 14 (3.9%) | 47 (13.1%) |
| 6:30 AM to 6:59 AM | 46 (12.7%) | 22 (6.1%) |
| 7:00 AM to 7:29 AM | 72 (19.9%) | 85 (23.7%) |
| 7:30 AM to 7:59 AM | 32 (8.8%) | 76 (21.2%) |
| 8:00 AM to 8:29 AM | 10 (2.8%) | 17 (4.8%) |
| 8:30 AM to 8:59 AM | 0 (0.0%) | 0 (0.0%) |
| 9:00 AM to 9:59 AM | 5 (1.4%) | 0 (0.0%) |
| 10:00 AM to 10:59 AM | 0 (0.0%) | 0 (0.0%) |
| 11:00 AM to 11:59 AM | 0 (0.0%) | 0 (0.0%) |
| 12:00 PM to 3:59 PM | 10 (2.8%) | 31 (8.7%) |
| 4:00 PM to 11:59 PM | 45 (12.4%) | 29 (8.1%) |
| Total | 362 (100.0%) | 358 (100.0%) |
Housing Occupancy in Estill Springs
Occupancy by Ownership in Estill Springs
Of the total 799 dwellings in Estill Springs, owner-occupied units account for 645 (80.7%), while renter-occupied units make up 154 (19.3%).
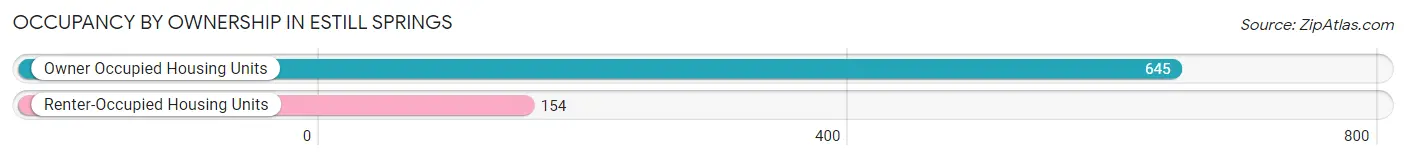
| Occupancy | # Housing Units | % Housing Units |
| Owner Occupied Housing Units | 645 | 80.7% |
| Renter-Occupied Housing Units | 154 | 19.3% |
| Total Occupied Housing Units | 799 | 100.0% |
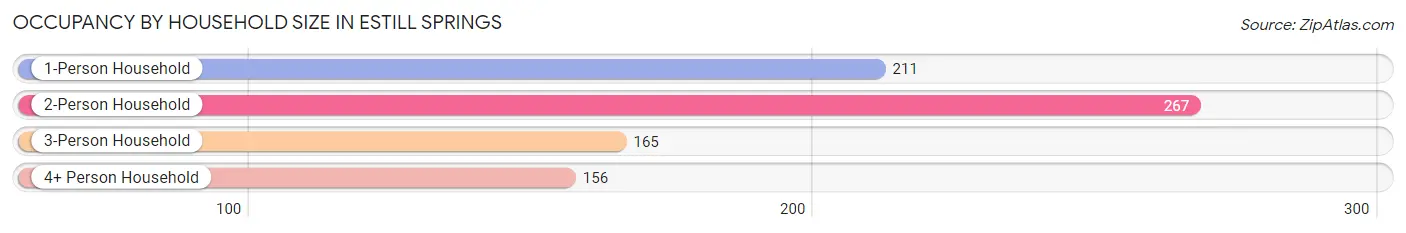
Occupancy by Household Size in Estill Springs
| Household Size | # Housing Units | % Housing Units |
| 1-Person Household | 211 | 26.4% |
| 2-Person Household | 267 | 33.4% |
| 3-Person Household | 165 | 20.6% |
| 4+ Person Household | 156 | 19.5% |
| Total Housing Units | 799 | 100.0% |
Occupancy by Ownership by Household Size in Estill Springs
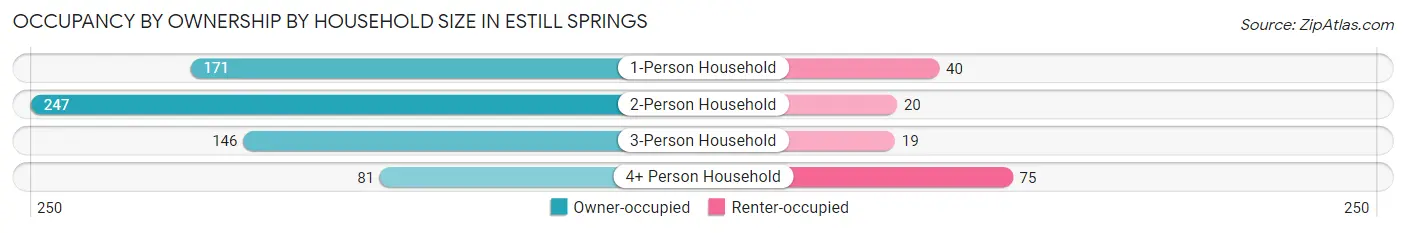
| Household Size | Owner-occupied | Renter-occupied |
| 1-Person Household | 171 (81.0%) | 40 (19.0%) |
| 2-Person Household | 247 (92.5%) | 20 (7.5%) |
| 3-Person Household | 146 (88.5%) | 19 (11.5%) |
| 4+ Person Household | 81 (51.9%) | 75 (48.1%) |
| Total Housing Units | 645 (80.7%) | 154 (19.3%) |
Occupancy by Educational Attainment in Estill Springs
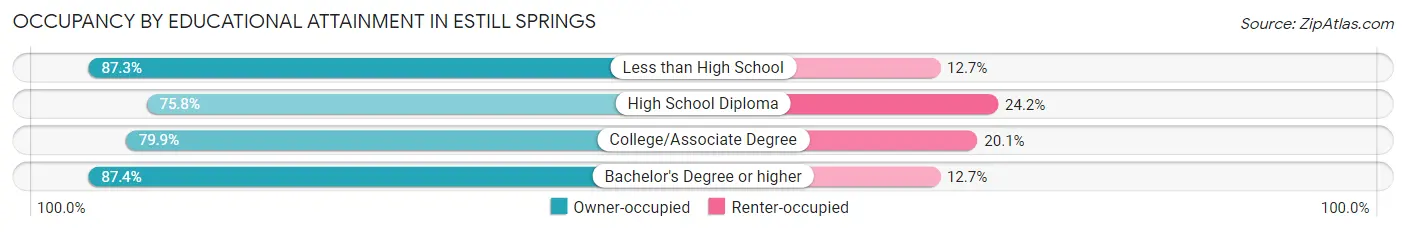
| Household Size | Owner-occupied | Renter-occupied |
| Less than High School | 62 (87.3%) | 9 (12.7%) |
| High School Diploma | 207 (75.8%) | 66 (24.2%) |
| College/Associate Degree | 231 (79.9%) | 58 (20.1%) |
| Bachelor's Degree or higher | 145 (87.4%) | 21 (12.7%) |
Occupancy by Age of Householder in Estill Springs
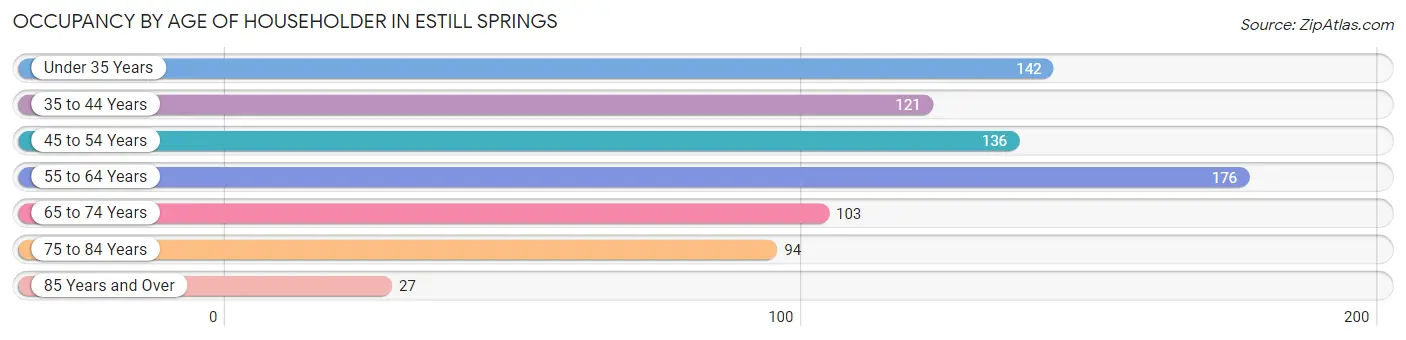
| Age Bracket | # Households | % Households |
| Under 35 Years | 142 | 17.8% |
| 35 to 44 Years | 121 | 15.1% |
| 45 to 54 Years | 136 | 17.0% |
| 55 to 64 Years | 176 | 22.0% |
| 65 to 74 Years | 103 | 12.9% |
| 75 to 84 Years | 94 | 11.8% |
| 85 Years and Over | 27 | 3.4% |
| Total | 799 | 100.0% |
Housing Finances in Estill Springs
Median Income by Occupancy in Estill Springs
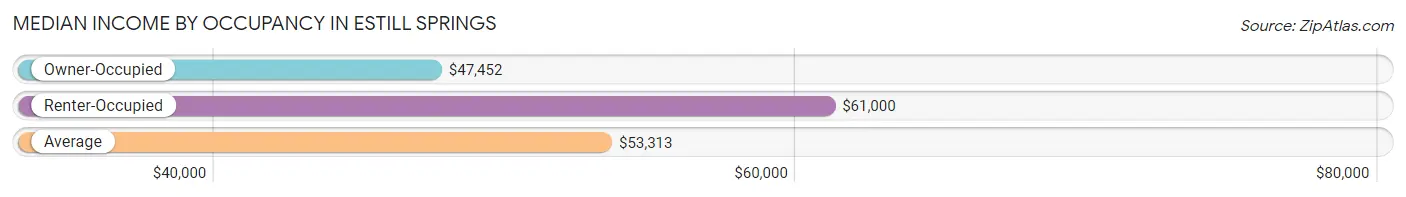
| Occupancy Type | # Households | Median Income |
| Owner-Occupied | 645 (80.7%) | $47,452 |
| Renter-Occupied | 154 (19.3%) | $61,000 |
| Average | 799 (100.0%) | $53,313 |
Occupancy by Householder Income Bracket in Estill Springs
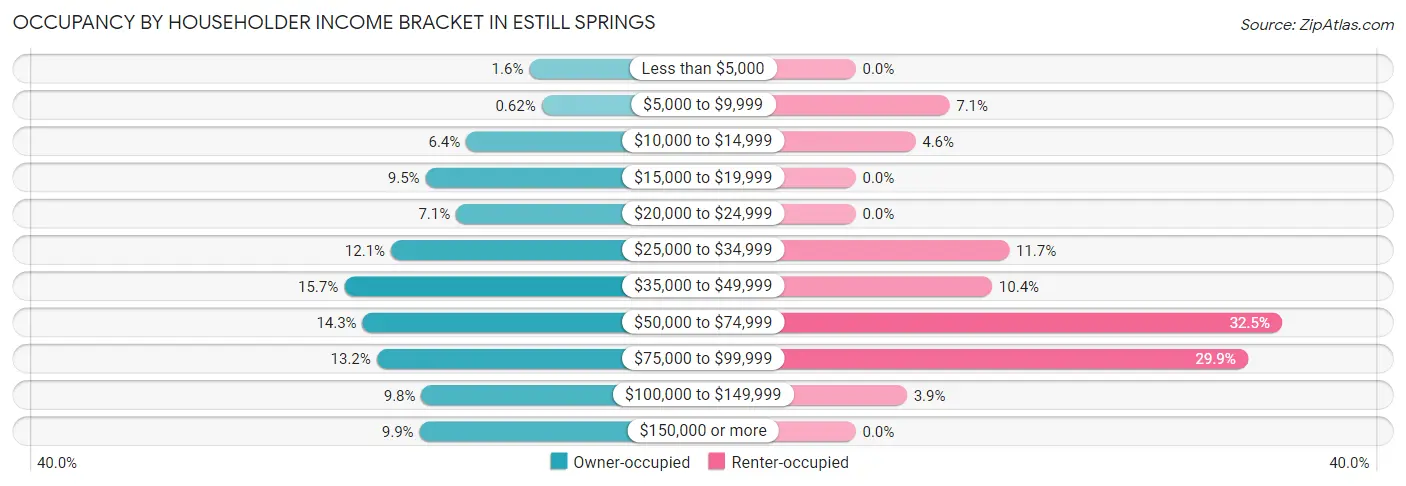
| Income Bracket | Owner-occupied | Renter-occupied |
| Less than $5,000 | 10 (1.5%) | 0 (0.0%) |
| $5,000 to $9,999 | 4 (0.6%) | 11 (7.1%) |
| $10,000 to $14,999 | 41 (6.4%) | 7 (4.5%) |
| $15,000 to $19,999 | 61 (9.5%) | 0 (0.0%) |
| $20,000 to $24,999 | 46 (7.1%) | 0 (0.0%) |
| $25,000 to $34,999 | 78 (12.1%) | 18 (11.7%) |
| $35,000 to $49,999 | 101 (15.7%) | 16 (10.4%) |
| $50,000 to $74,999 | 92 (14.3%) | 50 (32.5%) |
| $75,000 to $99,999 | 85 (13.2%) | 46 (29.9%) |
| $100,000 to $149,999 | 63 (9.8%) | 6 (3.9%) |
| $150,000 or more | 64 (9.9%) | 0 (0.0%) |
| Total | 645 (100.0%) | 154 (100.0%) |
Monthly Housing Cost Tiers in Estill Springs
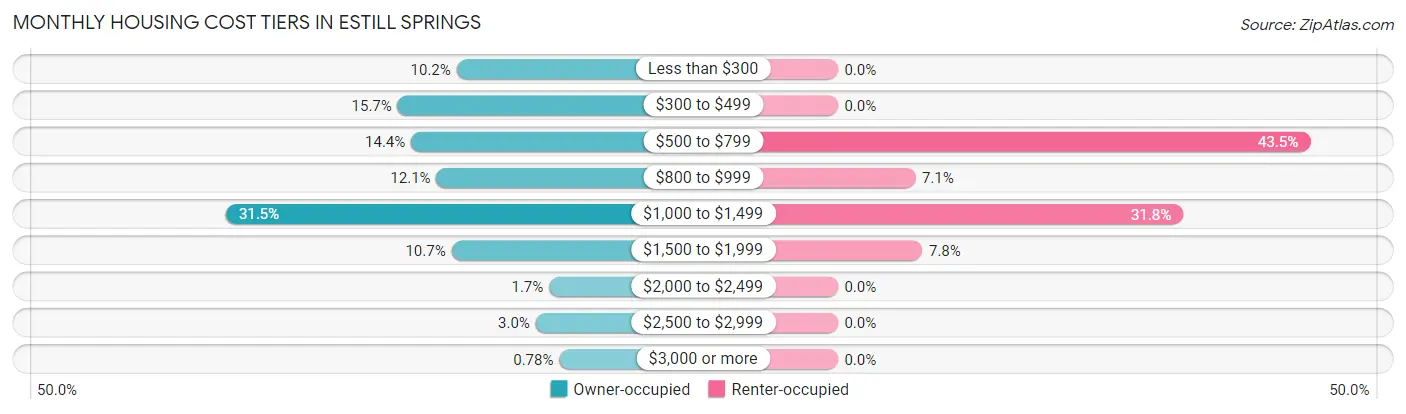
| Monthly Cost | Owner-occupied | Renter-occupied |
| Less than $300 | 66 (10.2%) | 0 (0.0%) |
| $300 to $499 | 101 (15.7%) | 0 (0.0%) |
| $500 to $799 | 93 (14.4%) | 67 (43.5%) |
| $800 to $999 | 78 (12.1%) | 11 (7.1%) |
| $1,000 to $1,499 | 203 (31.5%) | 49 (31.8%) |
| $1,500 to $1,999 | 69 (10.7%) | 12 (7.8%) |
| $2,000 to $2,499 | 11 (1.7%) | 0 (0.0%) |
| $2,500 to $2,999 | 19 (2.9%) | 0 (0.0%) |
| $3,000 or more | 5 (0.8%) | 0 (0.0%) |
| Total | 645 (100.0%) | 154 (100.0%) |
Physical Housing Characteristics in Estill Springs
Housing Structures in Estill Springs
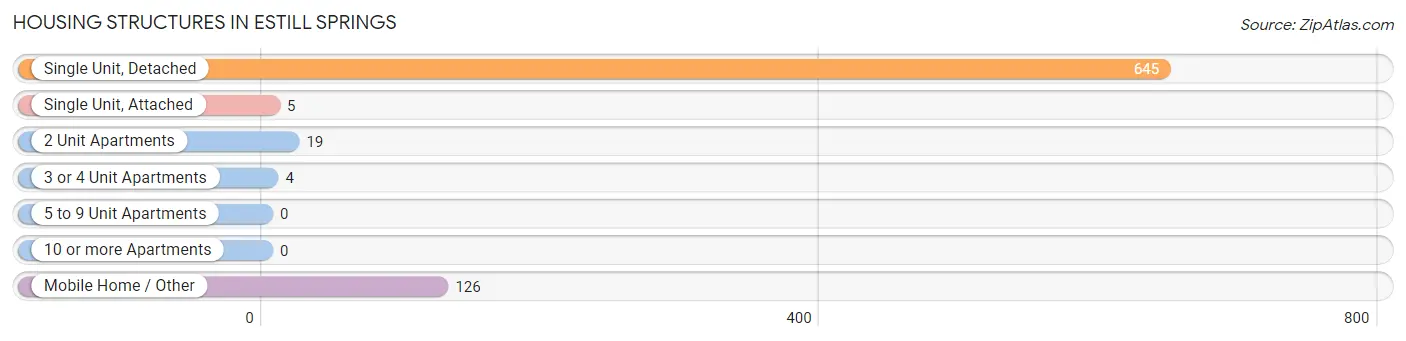
| Structure Type | # Housing Units | % Housing Units |
| Single Unit, Detached | 645 | 80.7% |
| Single Unit, Attached | 5 | 0.6% |
| 2 Unit Apartments | 19 | 2.4% |
| 3 or 4 Unit Apartments | 4 | 0.5% |
| 5 to 9 Unit Apartments | 0 | 0.0% |
| 10 or more Apartments | 0 | 0.0% |
| Mobile Home / Other | 126 | 15.8% |
| Total | 799 | 100.0% |
Housing Structures by Occupancy in Estill Springs
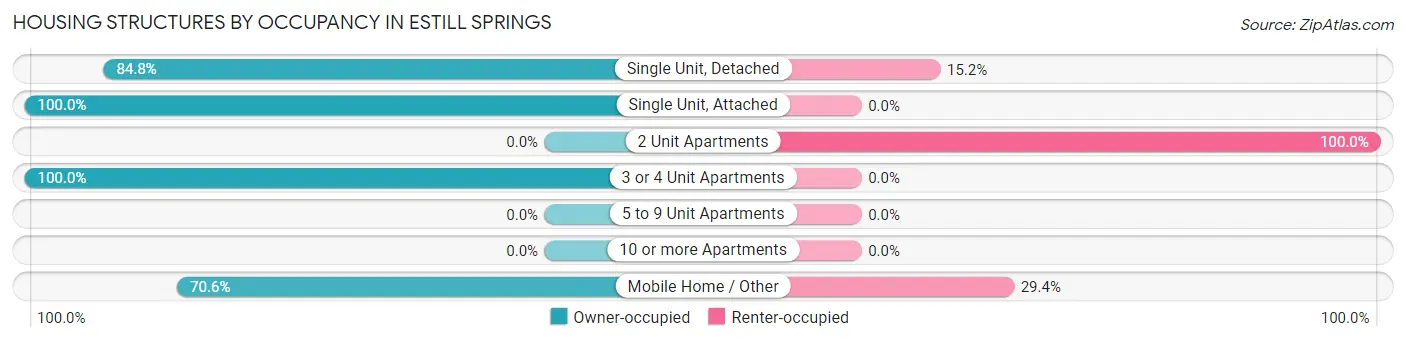
| Structure Type | Owner-occupied | Renter-occupied |
| Single Unit, Detached | 547 (84.8%) | 98 (15.2%) |
| Single Unit, Attached | 5 (100.0%) | 0 (0.0%) |
| 2 Unit Apartments | 0 (0.0%) | 19 (100.0%) |
| 3 or 4 Unit Apartments | 4 (100.0%) | 0 (0.0%) |
| 5 to 9 Unit Apartments | 0 (0.0%) | 0 (0.0%) |
| 10 or more Apartments | 0 (0.0%) | 0 (0.0%) |
| Mobile Home / Other | 89 (70.6%) | 37 (29.4%) |
| Total | 645 (80.7%) | 154 (19.3%) |
Housing Structures by Number of Rooms in Estill Springs
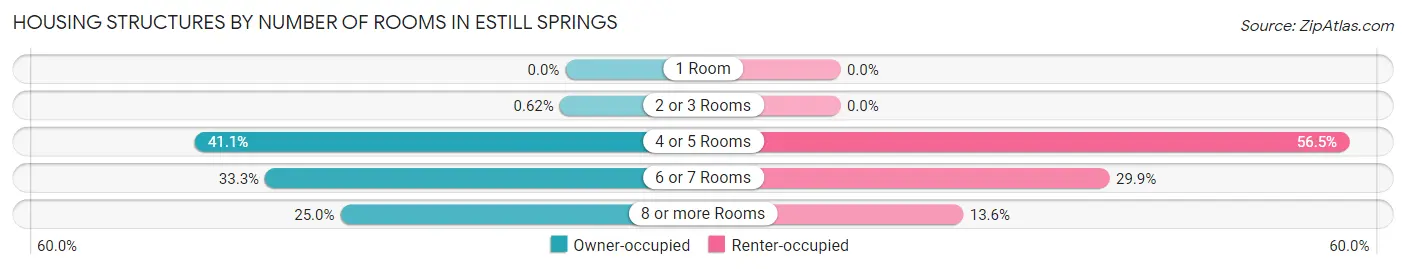
| Number of Rooms | Owner-occupied | Renter-occupied |
| 1 Room | 0 (0.0%) | 0 (0.0%) |
| 2 or 3 Rooms | 4 (0.6%) | 0 (0.0%) |
| 4 or 5 Rooms | 265 (41.1%) | 87 (56.5%) |
| 6 or 7 Rooms | 215 (33.3%) | 46 (29.9%) |
| 8 or more Rooms | 161 (25.0%) | 21 (13.6%) |
| Total | 645 (100.0%) | 154 (100.0%) |
Housing Structure by Heating Type in Estill Springs
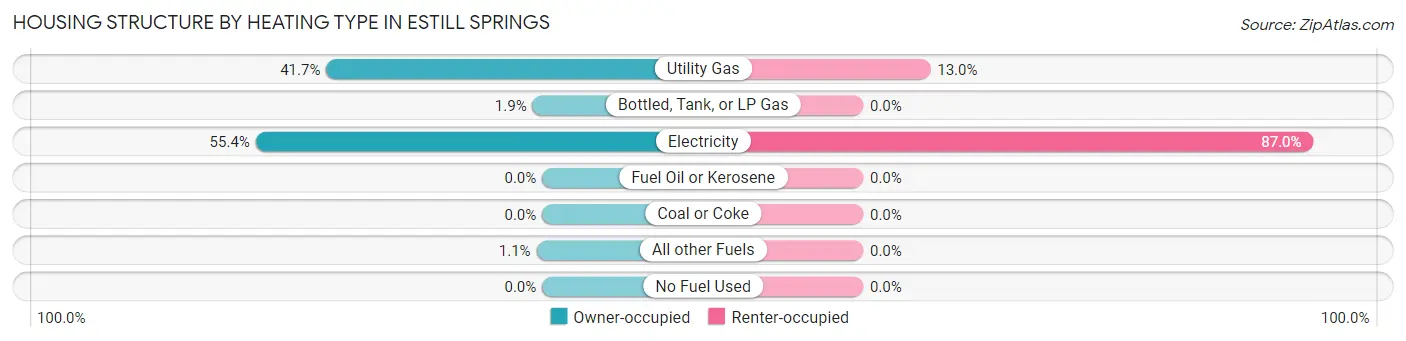
| Heating Type | Owner-occupied | Renter-occupied |
| Utility Gas | 269 (41.7%) | 20 (13.0%) |
| Bottled, Tank, or LP Gas | 12 (1.9%) | 0 (0.0%) |
| Electricity | 357 (55.3%) | 134 (87.0%) |
| Fuel Oil or Kerosene | 0 (0.0%) | 0 (0.0%) |
| Coal or Coke | 0 (0.0%) | 0 (0.0%) |
| All other Fuels | 7 (1.1%) | 0 (0.0%) |
| No Fuel Used | 0 (0.0%) | 0 (0.0%) |
| Total | 645 (100.0%) | 154 (100.0%) |
Household Vehicle Usage in Estill Springs
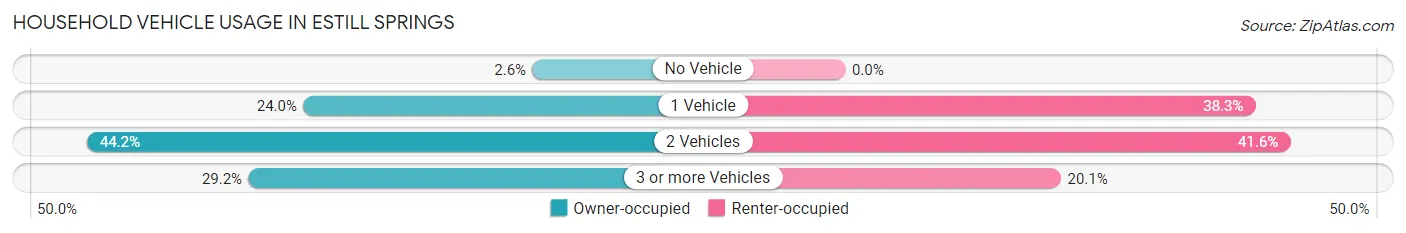
| Vehicles per Household | Owner-occupied | Renter-occupied |
| No Vehicle | 17 (2.6%) | 0 (0.0%) |
| 1 Vehicle | 155 (24.0%) | 59 (38.3%) |
| 2 Vehicles | 285 (44.2%) | 64 (41.6%) |
| 3 or more Vehicles | 188 (29.1%) | 31 (20.1%) |
| Total | 645 (100.0%) | 154 (100.0%) |
Real Estate & Mortgages in Estill Springs
Real Estate and Mortgage Overview in Estill Springs
| Characteristic | Without Mortgage | With Mortgage |
| Housing Units | 213 | 432 |
| Median Property Value | $170,400 | $162,800 |
| Median Household Income | $39,148 | $53 |
| Monthly Housing Costs | $373 | $5 |
| Real Estate Taxes | $1,096 | $14 |
Property Value by Mortgage Status in Estill Springs
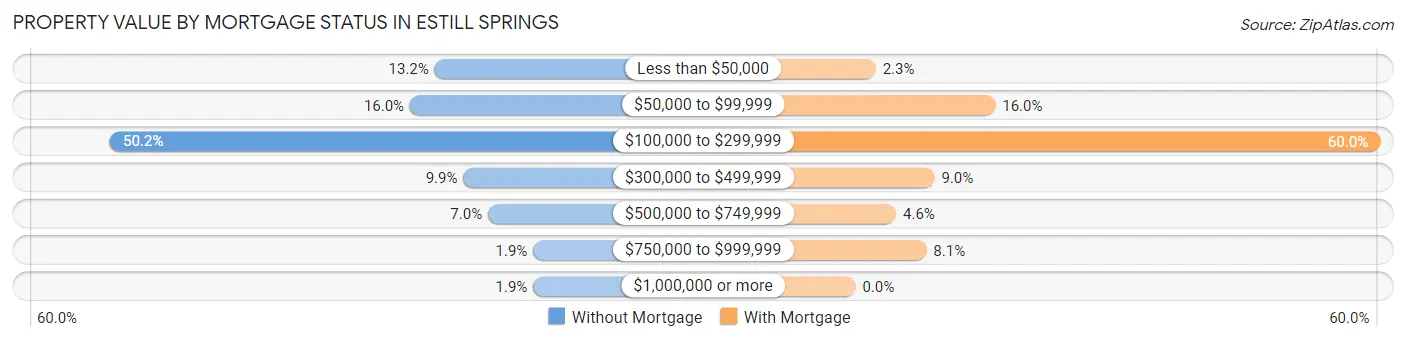
| Property Value | Without Mortgage | With Mortgage |
| Less than $50,000 | 28 (13.2%) | 10 (2.3%) |
| $50,000 to $99,999 | 34 (16.0%) | 69 (16.0%) |
| $100,000 to $299,999 | 107 (50.2%) | 259 (60.0%) |
| $300,000 to $499,999 | 21 (9.9%) | 39 (9.0%) |
| $500,000 to $749,999 | 15 (7.0%) | 20 (4.6%) |
| $750,000 to $999,999 | 4 (1.9%) | 35 (8.1%) |
| $1,000,000 or more | 4 (1.9%) | 0 (0.0%) |
| Total | 213 (100.0%) | 432 (100.0%) |
Household Income by Mortgage Status in Estill Springs
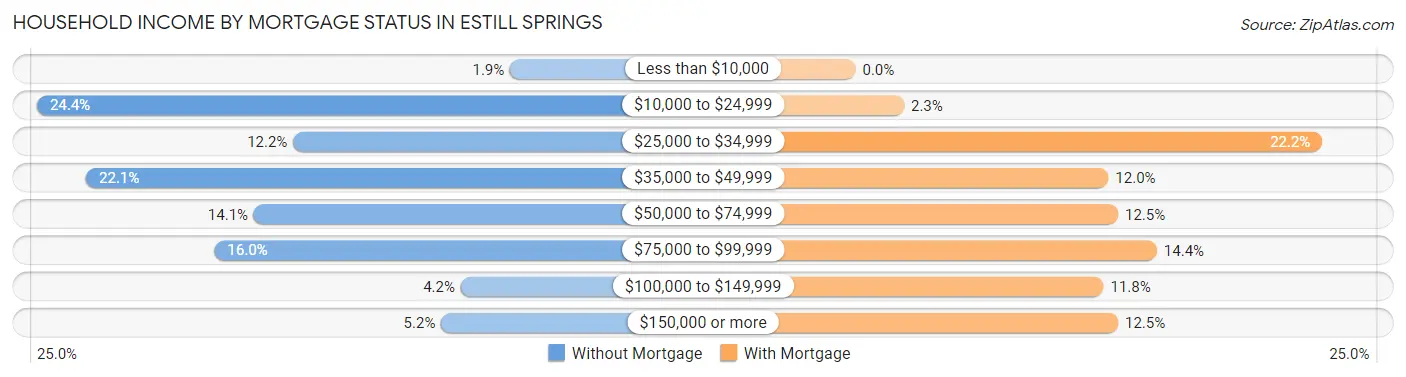
| Household Income | Without Mortgage | With Mortgage |
| Less than $10,000 | 4 (1.9%) | 0 (0.0%) |
| $10,000 to $24,999 | 52 (24.4%) | 10 (2.3%) |
| $25,000 to $34,999 | 26 (12.2%) | 96 (22.2%) |
| $35,000 to $49,999 | 47 (22.1%) | 52 (12.0%) |
| $50,000 to $74,999 | 30 (14.1%) | 54 (12.5%) |
| $75,000 to $99,999 | 34 (16.0%) | 62 (14.3%) |
| $100,000 to $149,999 | 9 (4.2%) | 51 (11.8%) |
| $150,000 or more | 11 (5.2%) | 54 (12.5%) |
| Total | 213 (100.0%) | 432 (100.0%) |
Property Value to Household Income Ratio in Estill Springs
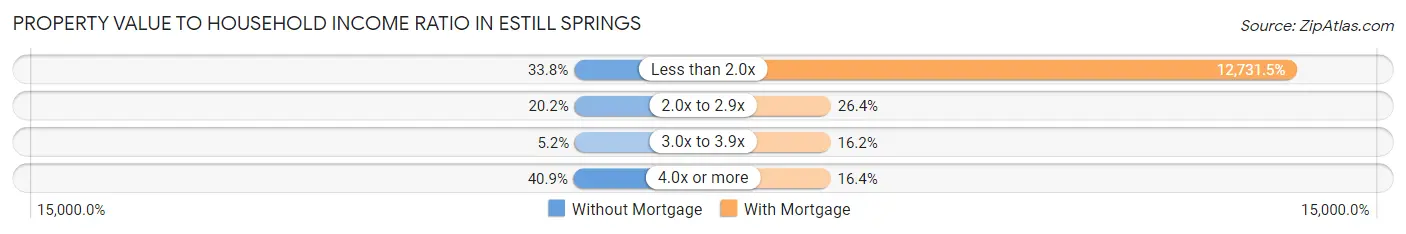
| Value-to-Income Ratio | Without Mortgage | With Mortgage |
| Less than 2.0x | 72 (33.8%) | 55,000 (12,731.5%) |
| 2.0x to 2.9x | 43 (20.2%) | 114 (26.4%) |
| 3.0x to 3.9x | 11 (5.2%) | 70 (16.2%) |
| 4.0x or more | 87 (40.8%) | 71 (16.4%) |
| Total | 213 (100.0%) | 432 (100.0%) |
Real Estate Taxes by Mortgage Status in Estill Springs
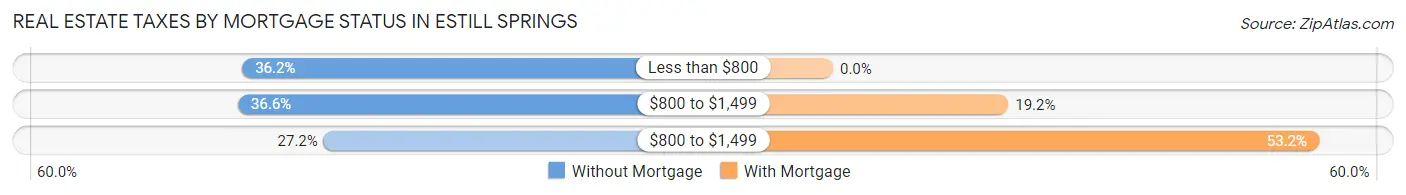
| Property Taxes | Without Mortgage | With Mortgage |
| Less than $800 | 77 (36.1%) | 0 (0.0%) |
| $800 to $1,499 | 78 (36.6%) | 83 (19.2%) |
| $800 to $1,499 | 58 (27.2%) | 230 (53.2%) |
| Total | 213 (100.0%) | 432 (100.0%) |
Health & Disability in Estill Springs
Health Insurance Coverage by Age in Estill Springs
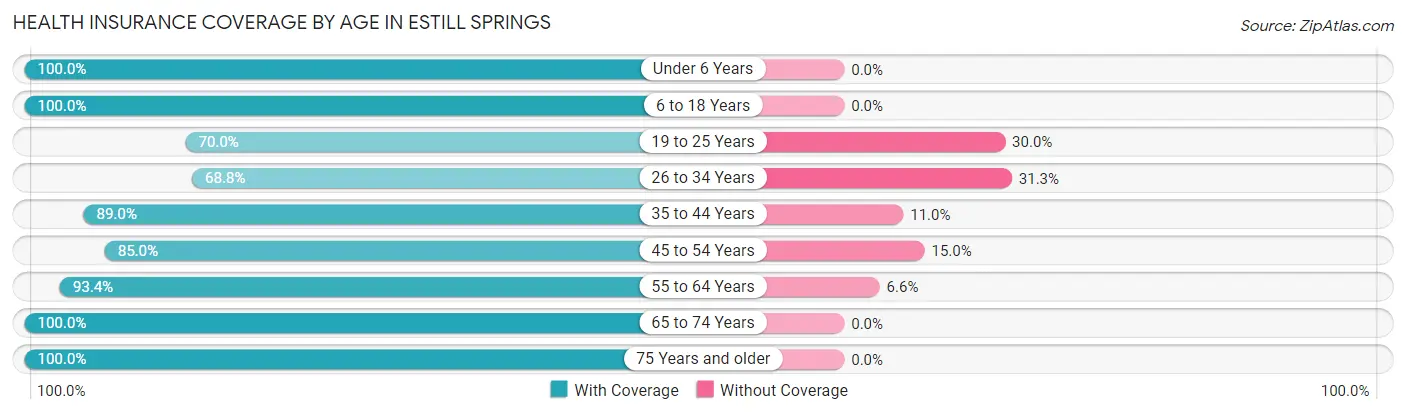
| Age Bracket | With Coverage | Without Coverage |
| Under 6 Years | 114 (100.0%) | 0 (0.0%) |
| 6 to 18 Years | 439 (100.0%) | 0 (0.0%) |
| 19 to 25 Years | 35 (70.0%) | 15 (30.0%) |
| 26 to 34 Years | 198 (68.8%) | 90 (31.2%) |
| 35 to 44 Years | 186 (89.0%) | 23 (11.0%) |
| 45 to 54 Years | 216 (85.0%) | 38 (15.0%) |
| 55 to 64 Years | 312 (93.4%) | 22 (6.6%) |
| 65 to 74 Years | 149 (100.0%) | 0 (0.0%) |
| 75 Years and older | 185 (100.0%) | 0 (0.0%) |
| Total | 1,834 (90.7%) | 188 (9.3%) |
Health Insurance Coverage by Citizenship Status in Estill Springs
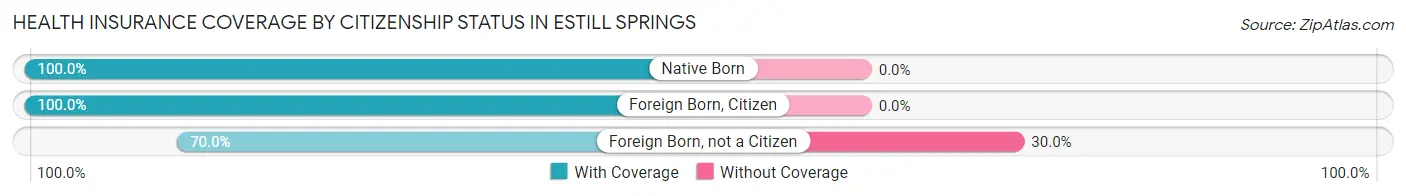
| Citizenship Status | With Coverage | Without Coverage |
| Native Born | 114 (100.0%) | 0 (0.0%) |
| Foreign Born, Citizen | 439 (100.0%) | 0 (0.0%) |
| Foreign Born, not a Citizen | 35 (70.0%) | 15 (30.0%) |
Health Insurance Coverage by Household Income in Estill Springs
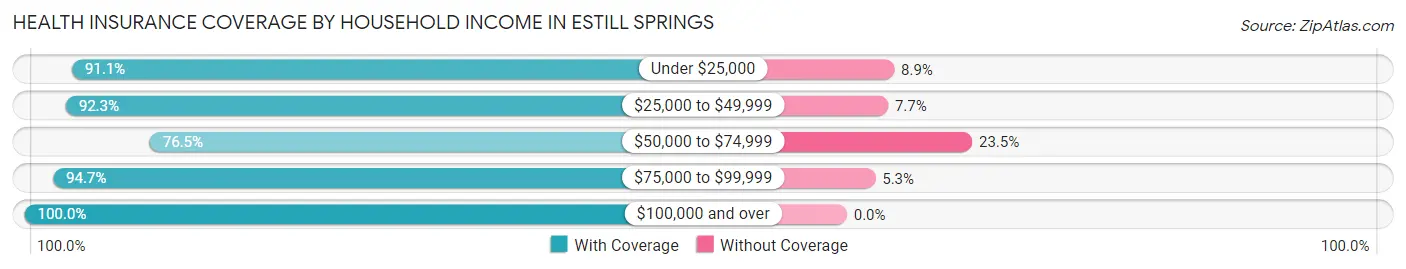
| Household Income | With Coverage | Without Coverage |
| Under $25,000 | 257 (91.1%) | 25 (8.9%) |
| $25,000 to $49,999 | 502 (92.3%) | 42 (7.7%) |
| $50,000 to $74,999 | 326 (76.5%) | 100 (23.5%) |
| $75,000 to $99,999 | 372 (94.7%) | 21 (5.3%) |
| $100,000 and over | 377 (100.0%) | 0 (0.0%) |
Public vs Private Health Insurance Coverage by Age in Estill Springs
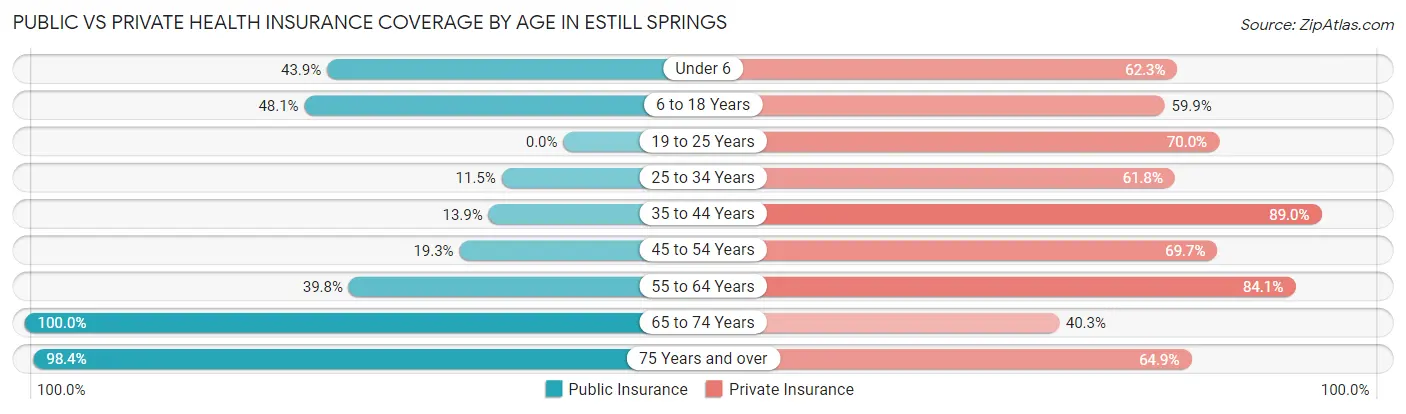
| Age Bracket | Public Insurance | Private Insurance |
| Under 6 | 50 (43.9%) | 71 (62.3%) |
| 6 to 18 Years | 211 (48.1%) | 263 (59.9%) |
| 19 to 25 Years | 0 (0.0%) | 35 (70.0%) |
| 25 to 34 Years | 33 (11.5%) | 178 (61.8%) |
| 35 to 44 Years | 29 (13.9%) | 186 (89.0%) |
| 45 to 54 Years | 49 (19.3%) | 177 (69.7%) |
| 55 to 64 Years | 133 (39.8%) | 281 (84.1%) |
| 65 to 74 Years | 149 (100.0%) | 60 (40.3%) |
| 75 Years and over | 182 (98.4%) | 120 (64.9%) |
| Total | 836 (41.3%) | 1,371 (67.8%) |
Disability Status by Sex by Age in Estill Springs
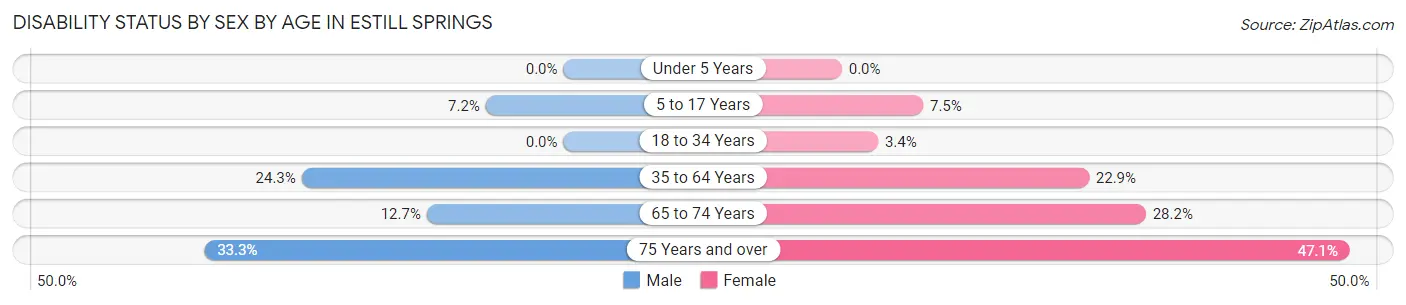
| Age Bracket | Male | Female |
| Under 5 Years | 0 (0.0%) | 0 (0.0%) |
| 5 to 17 Years | 15 (7.2%) | 19 (7.5%) |
| 18 to 34 Years | 0 (0.0%) | 5 (3.4%) |
| 35 to 64 Years | 94 (24.3%) | 94 (22.9%) |
| 65 to 74 Years | 9 (12.7%) | 22 (28.2%) |
| 75 Years and over | 15 (33.3%) | 66 (47.1%) |
Disability Class by Sex by Age in Estill Springs
Disability Class: Hearing Difficulty
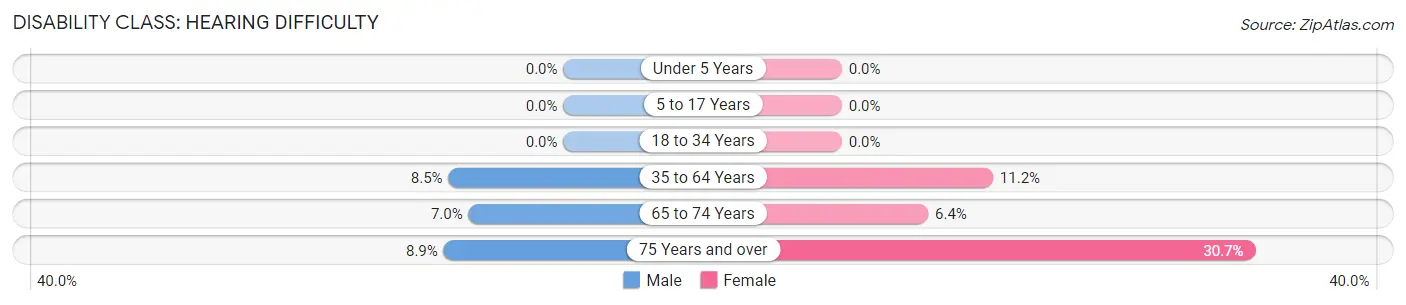
| Age Bracket | Male | Female |
| Under 5 Years | 0 (0.0%) | 0 (0.0%) |
| 5 to 17 Years | 0 (0.0%) | 0 (0.0%) |
| 18 to 34 Years | 0 (0.0%) | 0 (0.0%) |
| 35 to 64 Years | 33 (8.5%) | 46 (11.2%) |
| 65 to 74 Years | 5 (7.0%) | 5 (6.4%) |
| 75 Years and over | 4 (8.9%) | 43 (30.7%) |
Disability Class: Vision Difficulty
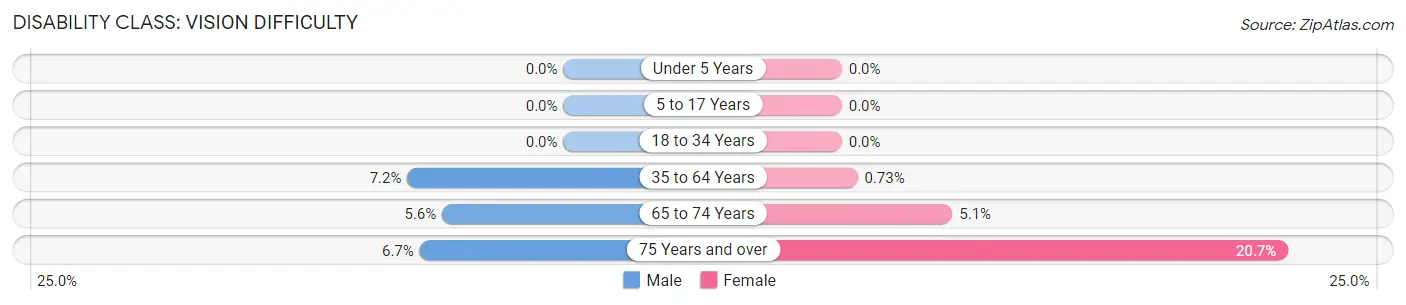
| Age Bracket | Male | Female |
| Under 5 Years | 0 (0.0%) | 0 (0.0%) |
| 5 to 17 Years | 0 (0.0%) | 0 (0.0%) |
| 18 to 34 Years | 0 (0.0%) | 0 (0.0%) |
| 35 to 64 Years | 28 (7.2%) | 3 (0.7%) |
| 65 to 74 Years | 4 (5.6%) | 4 (5.1%) |
| 75 Years and over | 3 (6.7%) | 29 (20.7%) |
Disability Class: Cognitive Difficulty
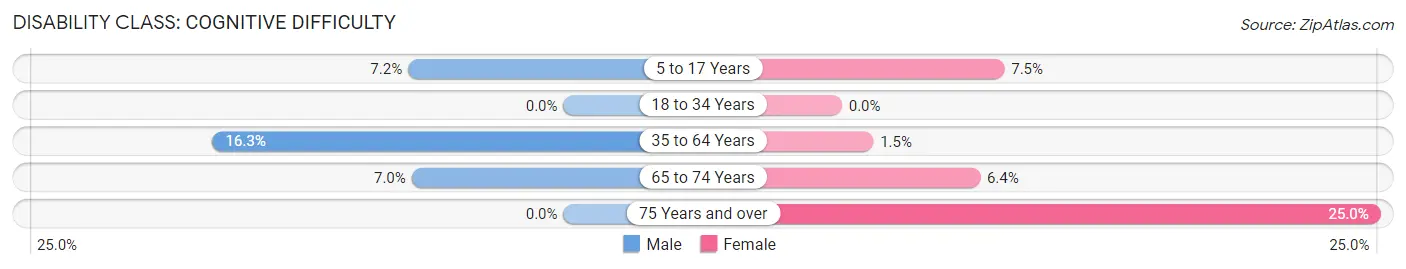
| Age Bracket | Male | Female |
| 5 to 17 Years | 15 (7.2%) | 19 (7.5%) |
| 18 to 34 Years | 0 (0.0%) | 0 (0.0%) |
| 35 to 64 Years | 63 (16.3%) | 6 (1.5%) |
| 65 to 74 Years | 5 (7.0%) | 5 (6.4%) |
| 75 Years and over | 0 (0.0%) | 35 (25.0%) |
Disability Class: Ambulatory Difficulty
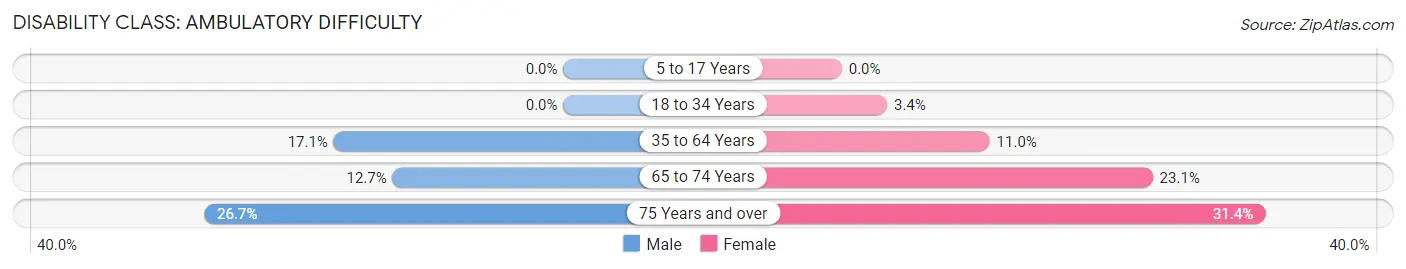
| Age Bracket | Male | Female |
| 5 to 17 Years | 0 (0.0%) | 0 (0.0%) |
| 18 to 34 Years | 0 (0.0%) | 5 (3.4%) |
| 35 to 64 Years | 66 (17.1%) | 45 (11.0%) |
| 65 to 74 Years | 9 (12.7%) | 18 (23.1%) |
| 75 Years and over | 12 (26.7%) | 44 (31.4%) |
Disability Class: Self-Care Difficulty
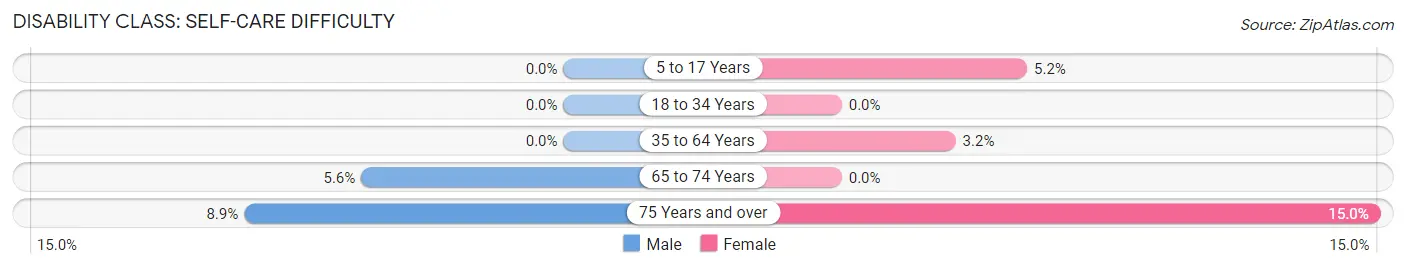
| Age Bracket | Male | Female |
| 5 to 17 Years | 0 (0.0%) | 13 (5.2%) |
| 18 to 34 Years | 0 (0.0%) | 0 (0.0%) |
| 35 to 64 Years | 0 (0.0%) | 13 (3.2%) |
| 65 to 74 Years | 4 (5.6%) | 0 (0.0%) |
| 75 Years and over | 4 (8.9%) | 21 (15.0%) |
Technology Access in Estill Springs
Computing Device Access in Estill Springs
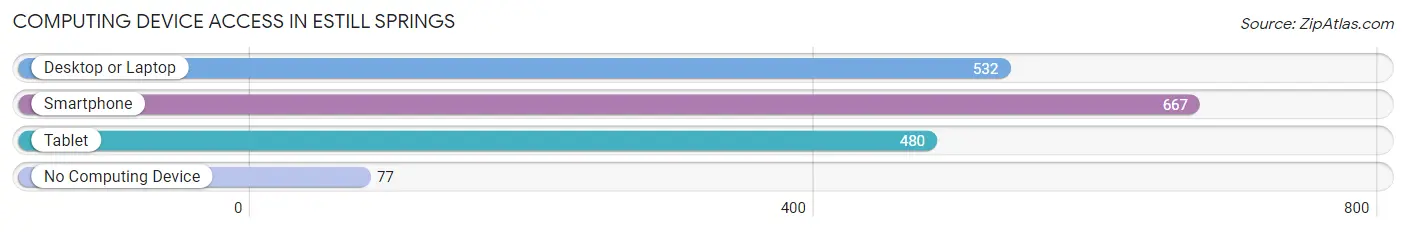
| Device Type | # Households | % Households |
| Desktop or Laptop | 532 | 66.6% |
| Smartphone | 667 | 83.5% |
| Tablet | 480 | 60.1% |
| No Computing Device | 77 | 9.6% |
| Total | 799 | 100.0% |
Internet Access in Estill Springs
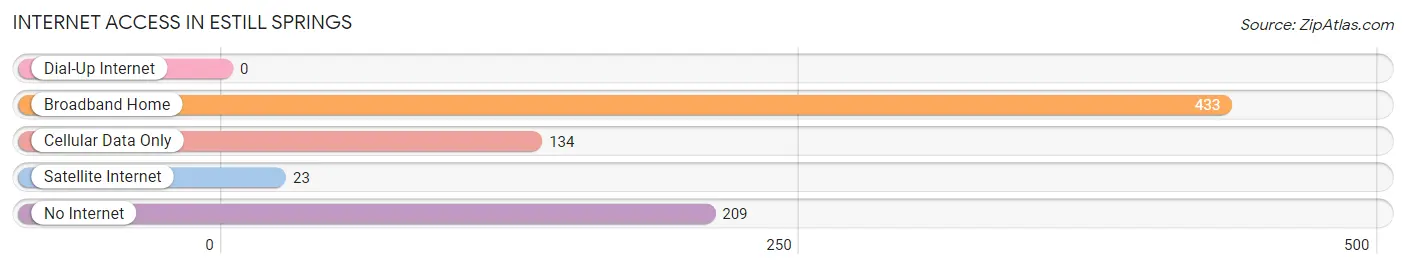
| Internet Type | # Households | % Households |
| Dial-Up Internet | 0 | 0.0% |
| Broadband Home | 433 | 54.2% |
| Cellular Data Only | 134 | 16.8% |
| Satellite Internet | 23 | 2.9% |
| No Internet | 209 | 26.2% |
| Total | 799 | 100.0% |
Estill Springs Summary
Estill Springs is a small town located in Franklin County, Tennessee. It is situated in the south-central part of the state, about 25 miles south of Nashville. The town was founded in 1820 and has a population of 1,717 as of the 2010 census.
History
Estill Springs was founded in 1820 by William Estill, a Revolutionary War veteran. He named the town after his family, who had settled in the area in the late 1700s. The town was originally known as Estill's Springs, but the name was eventually shortened to Estill Springs.
The town was an important stop on the stagecoach route between Nashville and Chattanooga. It was also a popular destination for travelers, as it was located near several natural springs.
In the late 1800s, Estill Springs became a popular resort town. It was home to several hotels and resorts, including the Estill Springs Hotel, which was built in 1887. The hotel was a popular destination for wealthy travelers from Nashville and other nearby cities.
In the early 1900s, Estill Springs became a popular destination for hunters and fishermen. The town was also home to several factories, including a cotton mill and a furniture factory.
Geography
Estill Springs is located in the south-central part of Tennessee, about 25 miles south of Nashville. The town is situated in a valley between two hills, and is surrounded by rolling hills and farmland. The Duck River runs through the town, and there are several small creeks and streams in the area.
The climate in Estill Springs is humid subtropical, with hot summers and mild winters. The average annual temperature is around 60 degrees Fahrenheit.
Economy
Estill Springs is a small, rural town with a limited economy. The town is home to several small businesses, including a grocery store, a hardware store, and a few restaurants. The town is also home to several manufacturing companies, including a furniture factory and a cotton mill.
The town is also home to several farms, which produce a variety of crops, including corn, soybeans, and hay. The town is also home to several wineries, which produce a variety of wines.
Demographics
As of the 2010 census, Estill Springs had a population of 1,717. The town is predominantly white, with a small African American population. The median household income is $37,000, and the median home value is $90,000.
Estill Springs is home to several churches, including the Estill Springs United Methodist Church, the Estill Springs Baptist Church, and the Estill Springs Church of Christ. The town is also home to several schools, including Estill Springs Elementary School and Estill Springs High School.
Conclusion
Estill Springs is a small, rural town located in Franklin County, Tennessee. It was founded in 1820 and has a population of 1,717 as of the 2010 census. The town is home to several small businesses, manufacturing companies, farms, and wineries. The town is predominantly white, with a small African American population. Estill Springs is home to several churches and schools, and is a popular destination for hunters and fishermen.
Common Questions
What is Per Capita Income in Estill Springs?
Per Capita income in Estill Springs is $26,187.
What is the Median Family Income in Estill Springs?
Median Family Income in Estill Springs is $66,250.
What is the Median Household income in Estill Springs?
Median Household Income in Estill Springs is $53,313.
What is Income or Wage Gap in Estill Springs?
Income or Wage Gap in Estill Springs is 39.9%.
Women in Estill Springs earn 60.1 cents for every dollar earned by a man.
What is Inequality or Gini Index in Estill Springs?
Inequality or Gini Index in Estill Springs is 0.40.
What is the Total Population of Estill Springs?
Total Population of Estill Springs is 2,022.
What is the Total Male Population of Estill Springs?
Total Male Population of Estill Springs is 958.
What is the Total Female Population of Estill Springs?
Total Female Population of Estill Springs is 1,064.
What is the Ratio of Males per 100 Females in Estill Springs?
There are 90.04 Males per 100 Females in Estill Springs.
What is the Ratio of Females per 100 Males in Estill Springs?
There are 111.06 Females per 100 Males in Estill Springs.
What is the Median Population Age in Estill Springs?
Median Population Age in Estill Springs is 41.0 Years.
What is the Average Family Size in Estill Springs
Average Family Size in Estill Springs is 3.0 People.
What is the Average Household Size in Estill Springs
Average Household Size in Estill Springs is 2.5 People.
How Large is the Labor Force in Estill Springs?
There are 877 People in the Labor Forcein in Estill Springs.
What is the Percentage of People in the Labor Force in Estill Springs?
56.3% of People are in the Labor Force in Estill Springs.
What is the Unemployment Rate in Estill Springs?
Unemployment Rate in Estill Springs is 8.1%.