Erwin, TN Map & Demographics
Erwin Map
Erwin Overview
$24,973
PER CAPITA INCOME
$55,795
AVG FAMILY INCOME
$40,670
AVG HOUSEHOLD INCOME
9.2%
WAGE / INCOME GAP [ % ]
90.8¢/ $1
WAGE / INCOME GAP [ $ ]
0.48
INEQUALITY / GINI INDEX
6,026
TOTAL POPULATION
2,976
MALE POPULATION
3,050
FEMALE POPULATION
97.57
MALES / 100 FEMALES
102.49
FEMALES / 100 MALES
46.8
MEDIAN AGE
2.7
AVG FAMILY SIZE
2.2
AVG HOUSEHOLD SIZE
2,726
LABOR FORCE [ PEOPLE ]
52.5%
PERCENT IN LABOR FORCE
4.9%
UNEMPLOYMENT RATE
Erwin Zip Codes
Erwin Area Codes
Income in Erwin
Income Overview in Erwin
Per Capita Income in Erwin is $24,973, while median incomes of families and households are $55,795 and $40,670 respectively.
| Characteristic | Number | Measure |
| Per Capita Income | 6,026 | $24,973 |
| Median Family Income | 1,764 | $55,795 |
| Mean Family Income | 1,764 | $69,790 |
| Median Household Income | 2,603 | $40,670 |
| Mean Household Income | 2,603 | $58,465 |
| Income Deficit | 1,764 | $0 |
| Wage / Income Gap (%) | 6,026 | 9.17% |
| Wage / Income Gap ($) | 6,026 | 90.83¢ per $1 |
| Gini / Inequality Index | 6,026 | 0.48 |
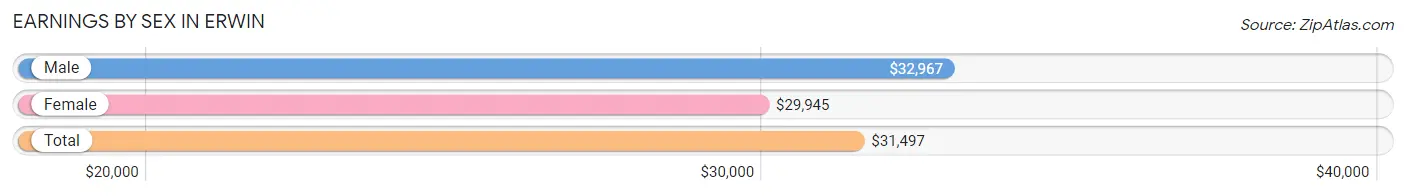
Earnings by Sex in Erwin
Average Earnings in Erwin are $31,497, $32,967 for men and $29,945 for women, a difference of 9.2%.
| Sex | Number | Average Earnings |
| Male | 1,508 (51.6%) | $32,967 |
| Female | 1,416 (48.4%) | $29,945 |
| Total | 2,924 (100.0%) | $31,497 |
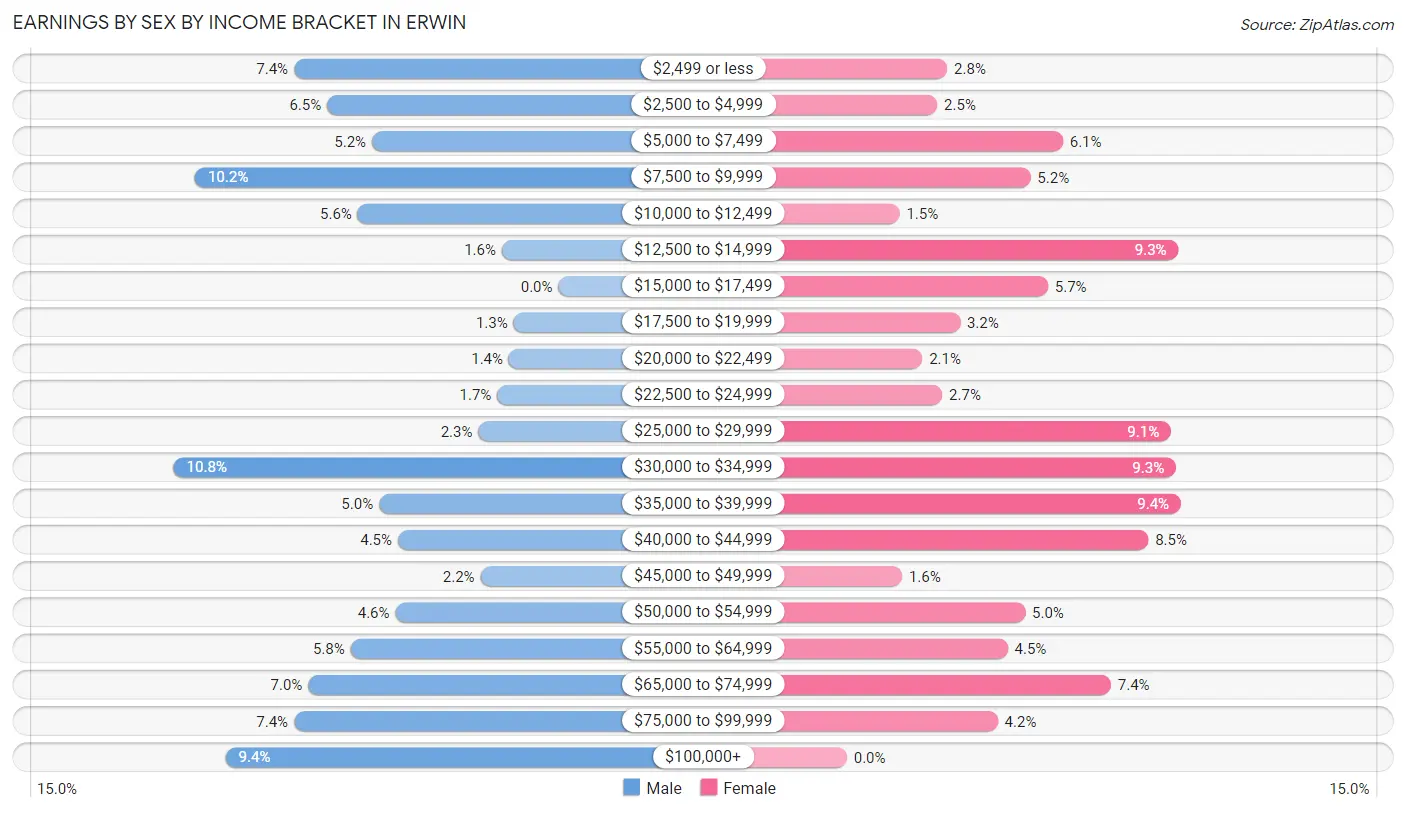
Earnings by Sex by Income Bracket in Erwin
The most common earnings brackets in Erwin are $30,000 to $34,999 for men (163 | 10.8%) and $35,000 to $39,999 for women (133 | 9.4%).
| Income | Male | Female |
| $2,499 or less | 112 (7.4%) | 40 (2.8%) |
| $2,500 to $4,999 | 98 (6.5%) | 36 (2.5%) |
| $5,000 to $7,499 | 79 (5.2%) | 86 (6.1%) |
| $7,500 to $9,999 | 154 (10.2%) | 73 (5.2%) |
| $10,000 to $12,499 | 85 (5.6%) | 21 (1.5%) |
| $12,500 to $14,999 | 24 (1.6%) | 132 (9.3%) |
| $15,000 to $17,499 | 0 (0.0%) | 80 (5.7%) |
| $17,500 to $19,999 | 19 (1.3%) | 45 (3.2%) |
| $20,000 to $22,499 | 21 (1.4%) | 30 (2.1%) |
| $22,500 to $24,999 | 26 (1.7%) | 38 (2.7%) |
| $25,000 to $29,999 | 34 (2.2%) | 129 (9.1%) |
| $30,000 to $34,999 | 163 (10.8%) | 131 (9.2%) |
| $35,000 to $39,999 | 76 (5.0%) | 133 (9.4%) |
| $40,000 to $44,999 | 68 (4.5%) | 120 (8.5%) |
| $45,000 to $49,999 | 33 (2.2%) | 22 (1.5%) |
| $50,000 to $54,999 | 69 (4.6%) | 71 (5.0%) |
| $55,000 to $64,999 | 88 (5.8%) | 64 (4.5%) |
| $65,000 to $74,999 | 106 (7.0%) | 105 (7.4%) |
| $75,000 to $99,999 | 112 (7.4%) | 60 (4.2%) |
| $100,000+ | 141 (9.3%) | 0 (0.0%) |
| Total | 1,508 (100.0%) | 1,416 (100.0%) |
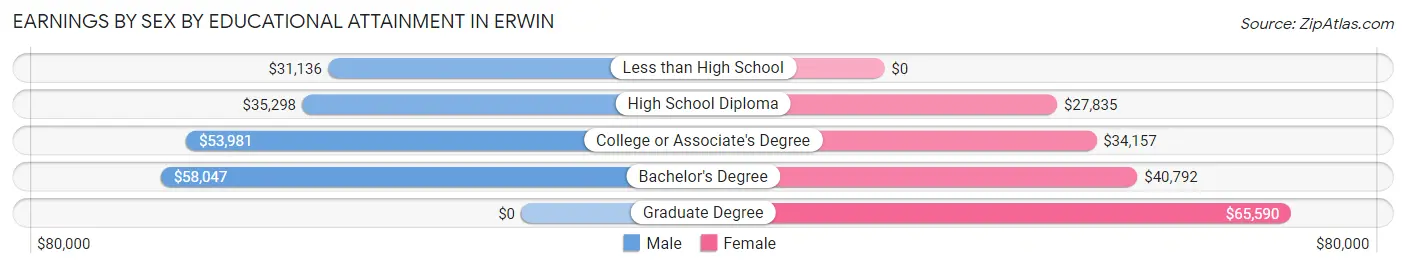
Earnings by Sex by Educational Attainment in Erwin
Average earnings in Erwin are $41,654 for men and $32,481 for women, a difference of 22.0%. Men with an educational attainment of bachelor's degree enjoy the highest average annual earnings of $58,047, while those with less than high school education earn the least with $31,136. Women with an educational attainment of graduate degree earn the most with the average annual earnings of $65,590, while those with high school diploma education have the smallest earnings of $27,835.
| Educational Attainment | Male Income | Female Income |
| Less than High School | $31,136 | $0 |
| High School Diploma | $35,298 | $27,835 |
| College or Associate's Degree | $53,981 | $34,157 |
| Bachelor's Degree | $58,047 | $40,792 |
| Graduate Degree | - | - |
| Total | $41,654 | $32,481 |
Family Income in Erwin
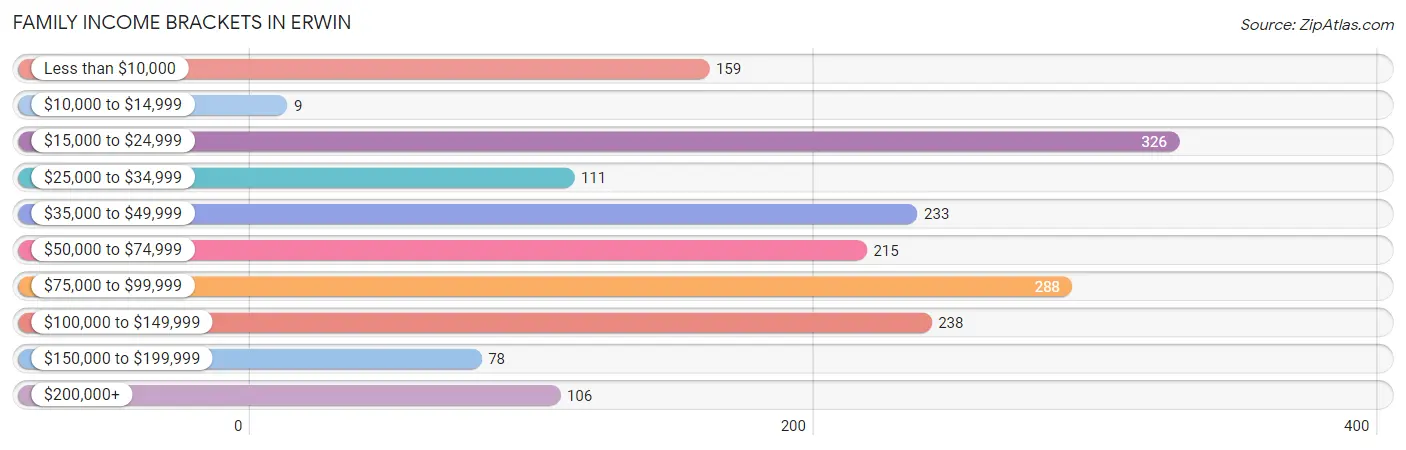
Family Income Brackets in Erwin
According to the Erwin family income data, there are 326 families falling into the $15,000 to $24,999 income range, which is the most common income bracket and makes up 18.5% of all families. Conversely, the $10,000 to $14,999 income bracket is the least frequent group with only 9 families (0.5%) belonging to this category.
| Income Bracket | # Families | % Families |
| Less than $10,000 | 159 | 9.0% |
| $10,000 to $14,999 | 9 | 0.5% |
| $15,000 to $24,999 | 326 | 18.5% |
| $25,000 to $34,999 | 111 | 6.3% |
| $35,000 to $49,999 | 233 | 13.2% |
| $50,000 to $74,999 | 215 | 12.2% |
| $75,000 to $99,999 | 288 | 16.3% |
| $100,000 to $149,999 | 238 | 13.5% |
| $150,000 to $199,999 | 78 | 4.4% |
| $200,000+ | 106 | 6.0% |
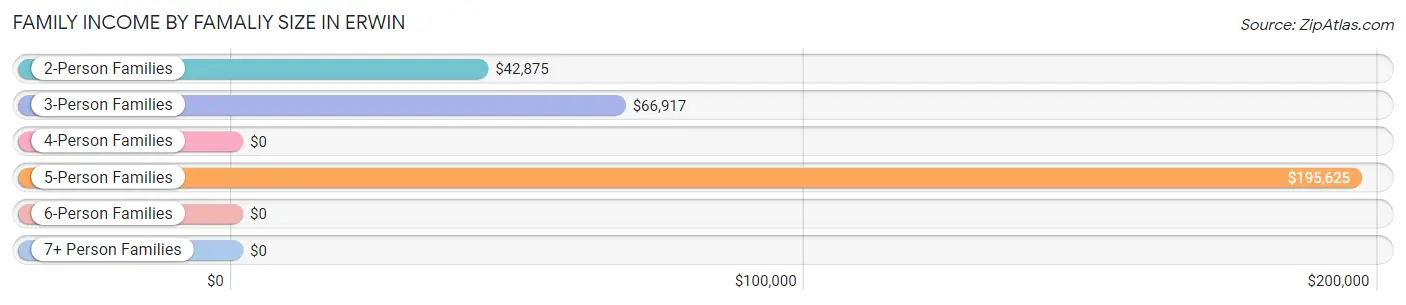
Family Income by Famaliy Size in Erwin
5-person families (31 | 1.8%) account for the highest median family income in Erwin with $195,625 per family, while 5-person families (31 | 1.8%) have the highest median income of $39,125 per family member.
| Income Bracket | # Families | Median Income |
| 2-Person Families | 942 (53.4%) | $42,875 |
| 3-Person Families | 471 (26.7%) | $66,917 |
| 4-Person Families | 302 (17.1%) | $0 |
| 5-Person Families | 31 (1.8%) | $195,625 |
| 6-Person Families | 15 (0.9%) | $0 |
| 7+ Person Families | 3 (0.2%) | $0 |
| Total | 1,764 (100.0%) | $55,795 |
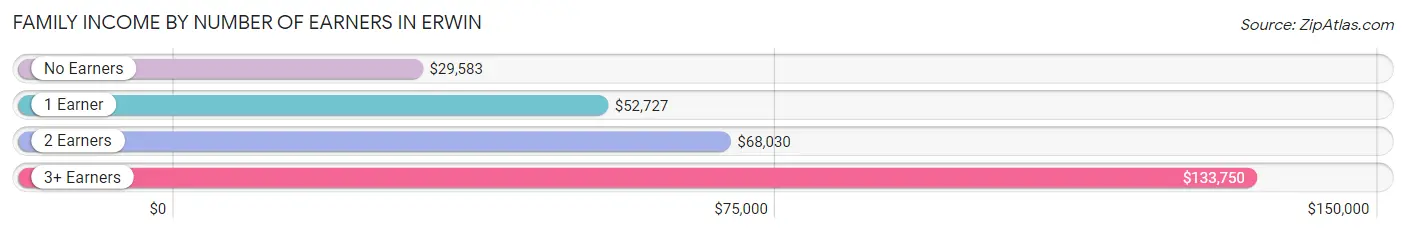
Family Income by Number of Earners in Erwin
The median family income in Erwin is $55,795, with families comprising 3+ earners (141) having the highest median family income of $133,750, while families with no earners (413) have the lowest median family income of $29,583, accounting for 8.0% and 23.4% of families, respectively.
| Number of Earners | # Families | Median Income |
| No Earners | 413 (23.4%) | $29,583 |
| 1 Earner | 466 (26.4%) | $52,727 |
| 2 Earners | 744 (42.2%) | $68,030 |
| 3+ Earners | 141 (8.0%) | $133,750 |
| Total | 1,764 (100.0%) | $55,795 |
Household Income in Erwin
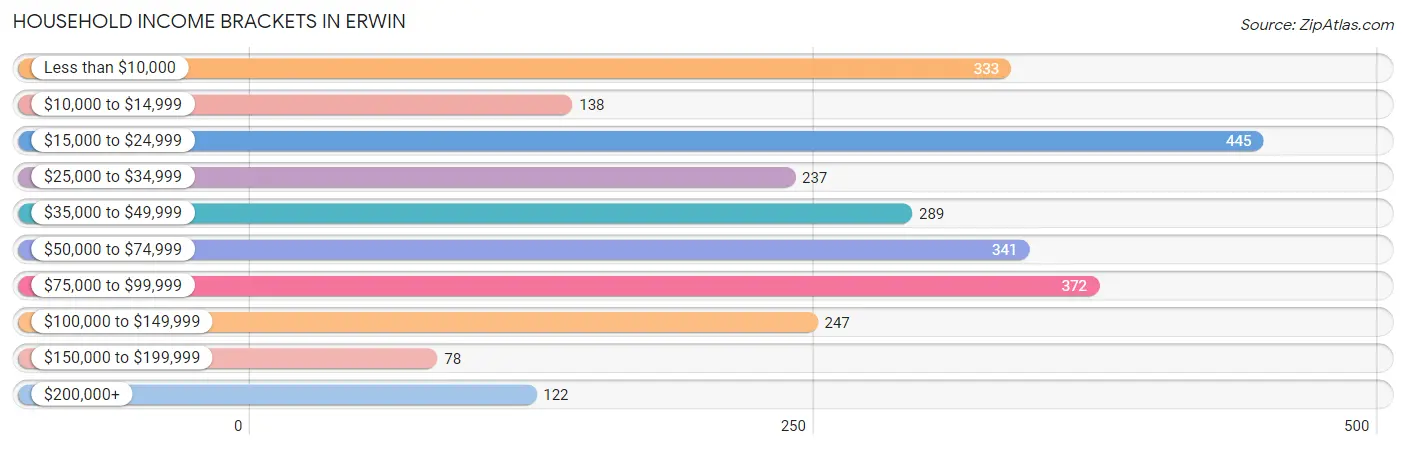
Household Income Brackets in Erwin
With 445 households falling in the category, the $15,000 to $24,999 income range is the most frequent in Erwin, accounting for 17.1% of all households. In contrast, only 78 households (3.0%) fall into the $150,000 to $199,999 income bracket, making it the least populous group.
| Income Bracket | # Households | % Households |
| Less than $10,000 | 333 | 12.8% |
| $10,000 to $14,999 | 138 | 5.3% |
| $15,000 to $24,999 | 445 | 17.1% |
| $25,000 to $34,999 | 237 | 9.1% |
| $35,000 to $49,999 | 289 | 11.1% |
| $50,000 to $74,999 | 341 | 13.1% |
| $75,000 to $99,999 | 372 | 14.3% |
| $100,000 to $149,999 | 247 | 9.5% |
| $150,000 to $199,999 | 78 | 3.0% |
| $200,000+ | 122 | 4.7% |
Household Income by Householder Age in Erwin
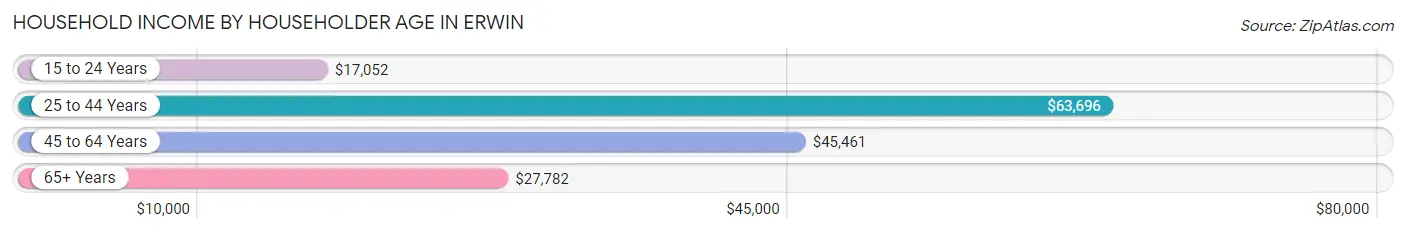
The median household income in Erwin is $40,670, with the highest median household income of $63,696 found in the 25 to 44 years age bracket for the primary householder. A total of 710 households (27.3%) fall into this category. Meanwhile, the 15 to 24 years age bracket for the primary householder has the lowest median household income of $17,052, with 110 households (4.2%) in this group.
| Income Bracket | # Households | Median Income |
| 15 to 24 Years | 110 (4.2%) | $17,052 |
| 25 to 44 Years | 710 (27.3%) | $63,696 |
| 45 to 64 Years | 921 (35.4%) | $45,461 |
| 65+ Years | 862 (33.1%) | $27,782 |
| Total | 2,603 (100.0%) | $40,670 |
Poverty in Erwin
Income Below Poverty by Sex and Age in Erwin
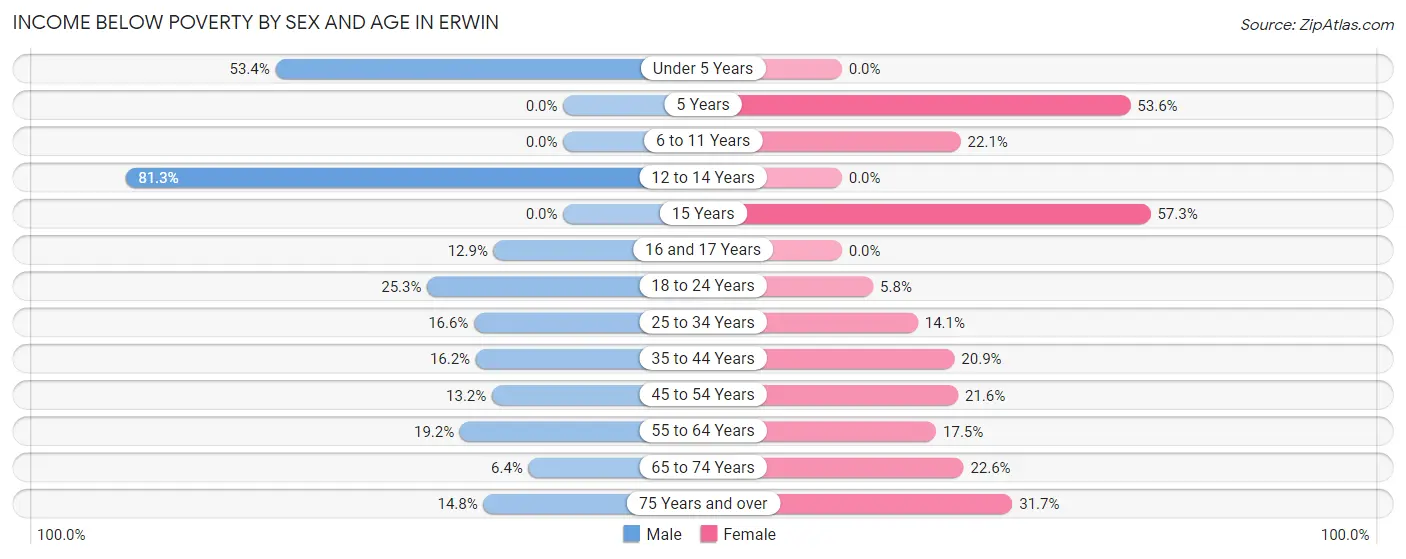
With 18.6% poverty level for males and 21.1% for females among the residents of Erwin, 12 to 14 year old males and 15 year old females are the most vulnerable to poverty, with 100 males (81.3%) and 51 females (57.3%) in their respective age groups living below the poverty level.
| Age Bracket | Male | Female |
| Under 5 Years | 39 (53.4%) | 0 (0.0%) |
| 5 Years | 0 (0.0%) | 15 (53.6%) |
| 6 to 11 Years | 0 (0.0%) | 45 (22.1%) |
| 12 to 14 Years | 100 (81.3%) | 0 (0.0%) |
| 15 Years | 0 (0.0%) | 51 (57.3%) |
| 16 and 17 Years | 23 (12.9%) | 0 (0.0%) |
| 18 to 24 Years | 97 (25.3%) | 11 (5.8%) |
| 25 to 34 Years | 46 (16.6%) | 45 (14.1%) |
| 35 to 44 Years | 42 (16.2%) | 98 (20.9%) |
| 45 to 54 Years | 69 (13.2%) | 101 (21.6%) |
| 55 to 64 Years | 61 (19.2%) | 62 (17.5%) |
| 65 to 74 Years | 18 (6.4%) | 77 (22.6%) |
| 75 Years and over | 40 (14.8%) | 113 (31.7%) |
| Total | 535 (18.6%) | 618 (21.1%) |
Income Above Poverty by Sex and Age in Erwin
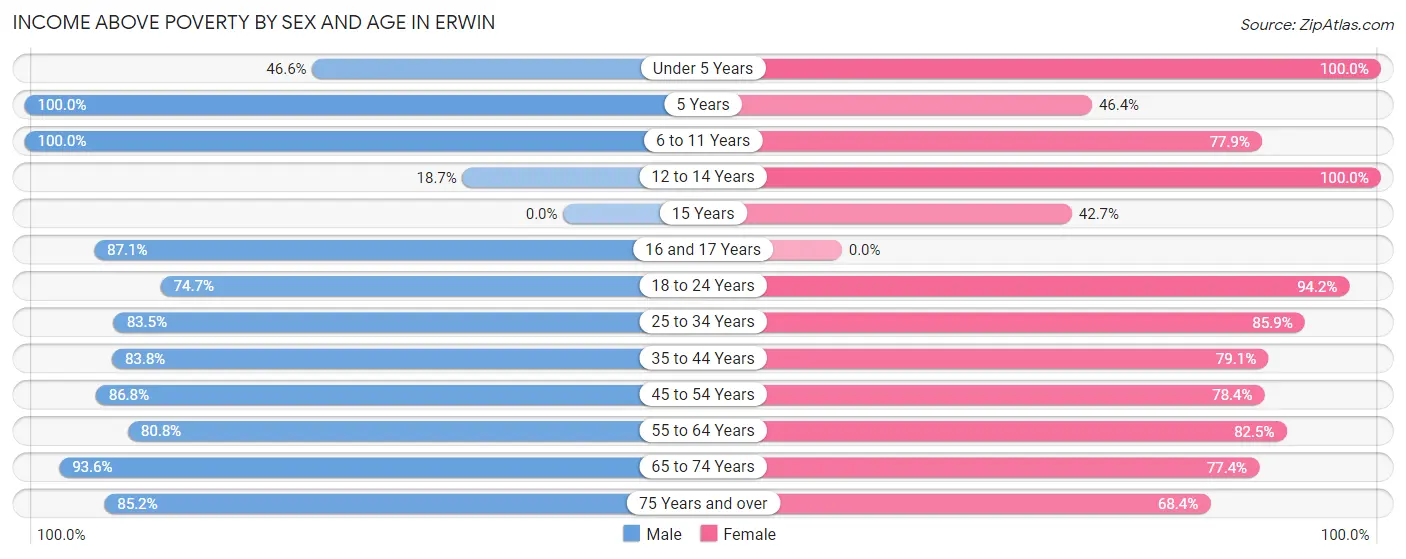
According to the poverty statistics in Erwin, males aged 5 years and females aged under 5 years are the age groups that are most secure financially, with 100.0% of males and 100.0% of females in these age groups living above the poverty line.
| Age Bracket | Male | Female |
| Under 5 Years | 34 (46.6%) | 45 (100.0%) |
| 5 Years | 21 (100.0%) | 13 (46.4%) |
| 6 to 11 Years | 175 (100.0%) | 159 (77.9%) |
| 12 to 14 Years | 23 (18.7%) | 61 (100.0%) |
| 15 Years | 0 (0.0%) | 38 (42.7%) |
| 16 and 17 Years | 155 (87.1%) | 0 (0.0%) |
| 18 to 24 Years | 287 (74.7%) | 178 (94.2%) |
| 25 to 34 Years | 232 (83.5%) | 274 (85.9%) |
| 35 to 44 Years | 217 (83.8%) | 371 (79.1%) |
| 45 to 54 Years | 453 (86.8%) | 367 (78.4%) |
| 55 to 64 Years | 257 (80.8%) | 292 (82.5%) |
| 65 to 74 Years | 262 (93.6%) | 264 (77.4%) |
| 75 Years and over | 230 (85.2%) | 244 (68.3%) |
| Total | 2,346 (81.4%) | 2,306 (78.9%) |
Income Below Poverty Among Married-Couple Families in Erwin
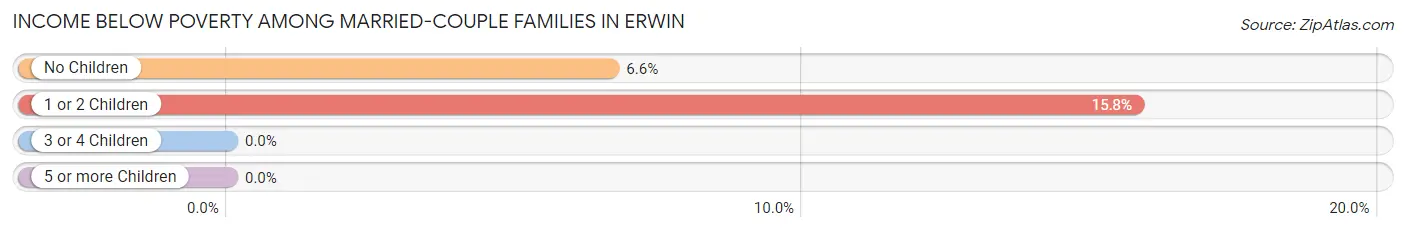
The poverty statistics for married-couple families in Erwin show that 10.1% or 142 of the total 1,409 families live below the poverty line. Families with 1 or 2 children have the highest poverty rate of 15.8%, comprising of 85 families. On the other hand, families with 3 or 4 children have the lowest poverty rate of 0.0%, which includes 0 families.
| Children | Above Poverty | Below Poverty |
| No Children | 802 (93.4%) | 57 (6.6%) |
| 1 or 2 Children | 454 (84.2%) | 85 (15.8%) |
| 3 or 4 Children | 11 (100.0%) | 0 (0.0%) |
| 5 or more Children | 0 (0.0%) | 0 (0.0%) |
| Total | 1,267 (89.9%) | 142 (10.1%) |
Income Below Poverty Among Single-Parent Households in Erwin
According to the poverty data in Erwin, 59.3% or 67 single-father households and 34.7% or 84 single-mother households are living below the poverty line. Among single-father households, those with 1 or 2 children have the highest poverty rate, with 67 households (83.8%) experiencing poverty. Likewise, among single-mother households, those with 3 or 4 children have the highest poverty rate, with 24 households (100.0%) falling below the poverty line.
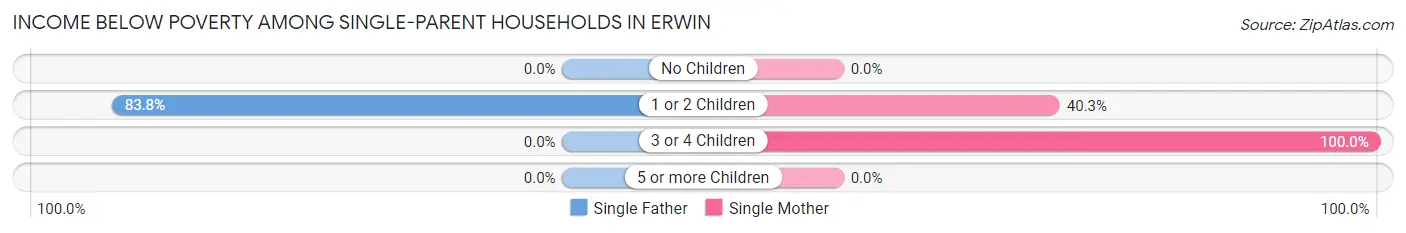
| Children | Single Father | Single Mother |
| No Children | 0 (0.0%) | 0 (0.0%) |
| 1 or 2 Children | 67 (83.8%) | 60 (40.3%) |
| 3 or 4 Children | 0 (0.0%) | 24 (100.0%) |
| 5 or more Children | 0 (0.0%) | 0 (0.0%) |
| Total | 67 (59.3%) | 84 (34.7%) |
Income Below Poverty Among Married-Couple vs Single-Parent Households in Erwin
The poverty data for Erwin shows that 142 of the married-couple family households (10.1%) and 151 of the single-parent households (42.5%) are living below the poverty level. Within the married-couple family households, those with 1 or 2 children have the highest poverty rate, with 85 households (15.8%) falling below the poverty line. Among the single-parent households, those with 3 or 4 children have the highest poverty rate, with 24 household (100.0%) living below poverty.
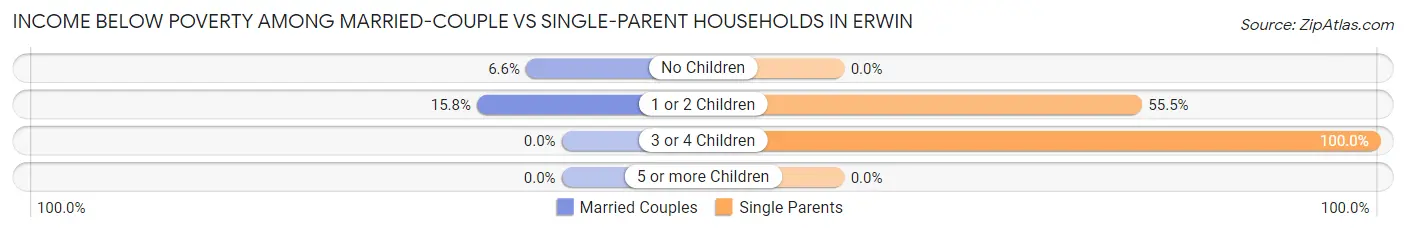
| Children | Married-Couple Families | Single-Parent Households |
| No Children | 57 (6.6%) | 0 (0.0%) |
| 1 or 2 Children | 85 (15.8%) | 127 (55.5%) |
| 3 or 4 Children | 0 (0.0%) | 24 (100.0%) |
| 5 or more Children | 0 (0.0%) | 0 (0.0%) |
| Total | 142 (10.1%) | 151 (42.5%) |
Race in Erwin
The most populous races in Erwin are White / Caucasian (5,444 | 90.3%), Hispanic or Latino (480 | 8.0%), and Some other Race (278 | 4.6%).
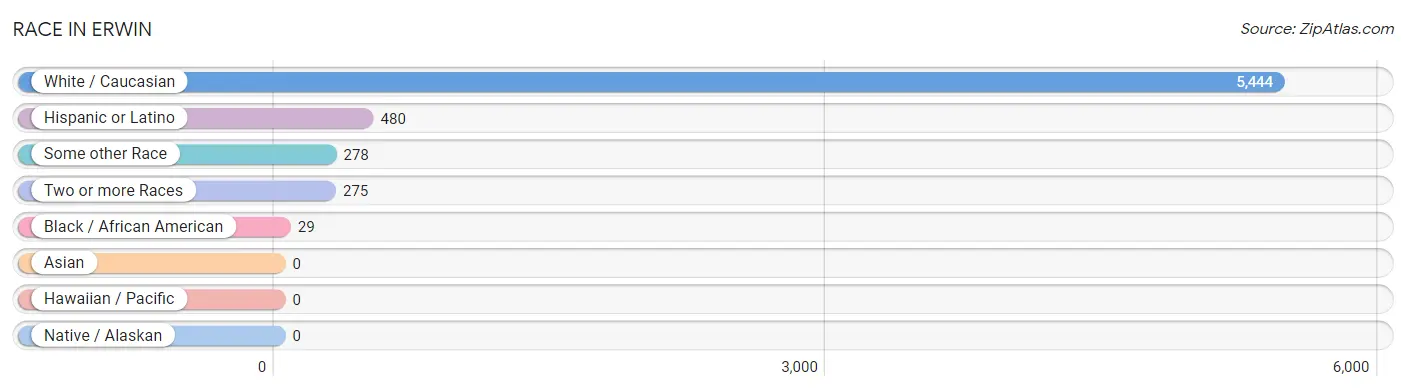
| Race | # Population | % Population |
| Asian | 0 | 0.0% |
| Black / African American | 29 | 0.5% |
| Hawaiian / Pacific | 0 | 0.0% |
| Hispanic or Latino | 480 | 8.0% |
| Native / Alaskan | 0 | 0.0% |
| White / Caucasian | 5,444 | 90.3% |
| Two or more Races | 275 | 4.6% |
| Some other Race | 278 | 4.6% |
| Total | 6,026 | 100.0% |
Ancestry in Erwin
The most populous ancestries reported in Erwin are American (1,603 | 26.6%), English (898 | 14.9%), German (593 | 9.8%), Irish (423 | 7.0%), and Mexican (316 | 5.2%), together accounting for 63.6% of all Erwin residents.
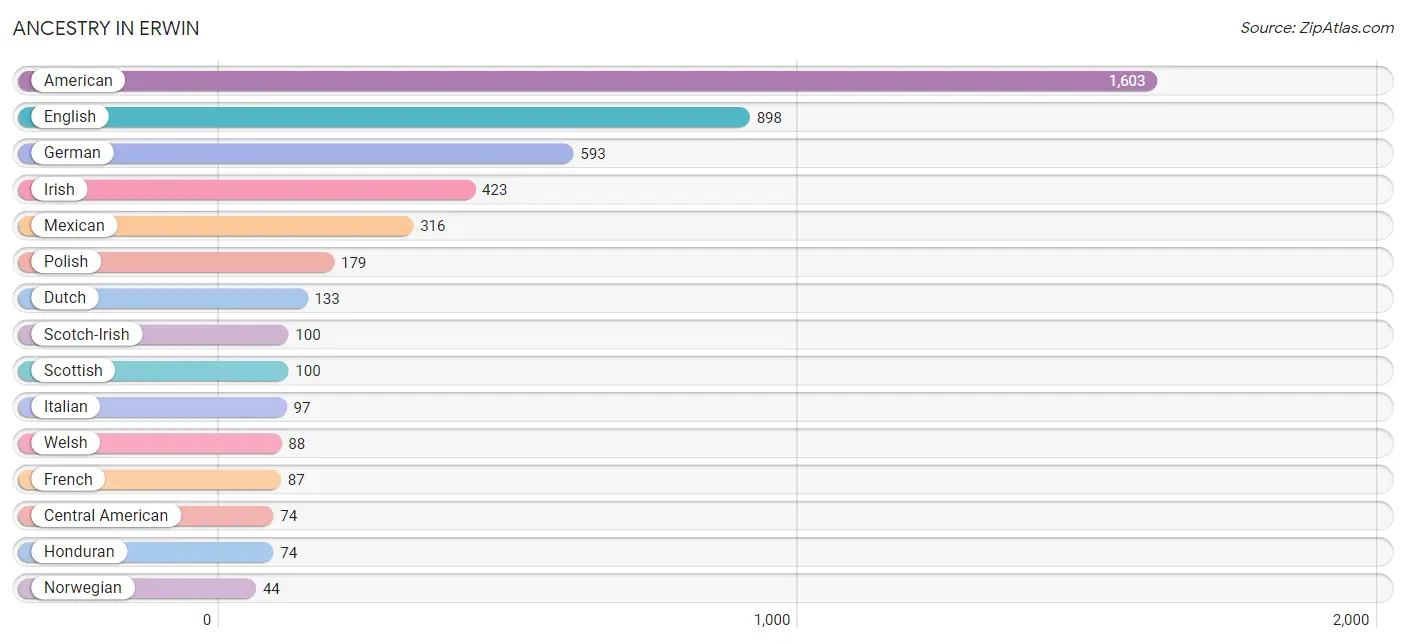
| Ancestry | # Population | % Population |
| American | 1,603 | 26.6% |
| British | 20 | 0.3% |
| Burmese | 9 | 0.2% |
| Central American | 74 | 1.2% |
| Cherokee | 3 | 0.1% |
| Dutch | 133 | 2.2% |
| English | 898 | 14.9% |
| European | 40 | 0.7% |
| French | 87 | 1.4% |
| German | 593 | 9.8% |
| Honduran | 74 | 1.2% |
| Irish | 423 | 7.0% |
| Italian | 97 | 1.6% |
| Mexican | 316 | 5.2% |
| Norwegian | 44 | 0.7% |
| Polish | 179 | 3.0% |
| Puerto Rican | 22 | 0.4% |
| Scotch-Irish | 100 | 1.7% |
| Scottish | 100 | 1.7% |
| Spaniard | 8 | 0.1% |
| Trinidadian and Tobagonian | 22 | 0.4% |
| Welsh | 88 | 1.5% | View All 22 Rows |
Immigrants in Erwin
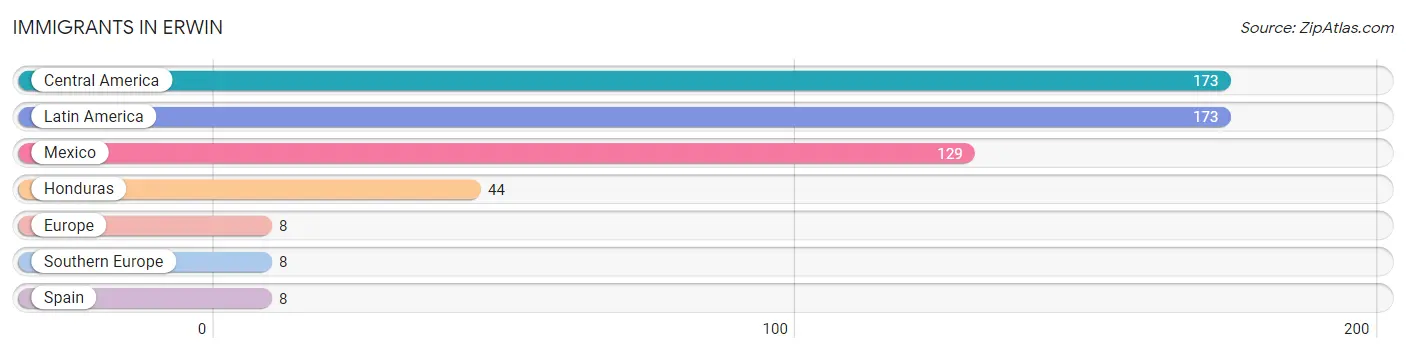
The most numerous immigrant groups reported in Erwin came from Central America (173 | 2.9%), Latin America (173 | 2.9%), Mexico (129 | 2.1%), Honduras (44 | 0.7%), and Europe (8 | 0.1%), together accounting for 8.7% of all Erwin residents.
| Immigration Origin | # Population | % Population |
| Central America | 173 | 2.9% |
| Europe | 8 | 0.1% |
| Honduras | 44 | 0.7% |
| Latin America | 173 | 2.9% |
| Mexico | 129 | 2.1% |
| Southern Europe | 8 | 0.1% |
| Spain | 8 | 0.1% | View All 7 Rows |
Sex and Age in Erwin
Sex and Age in Erwin
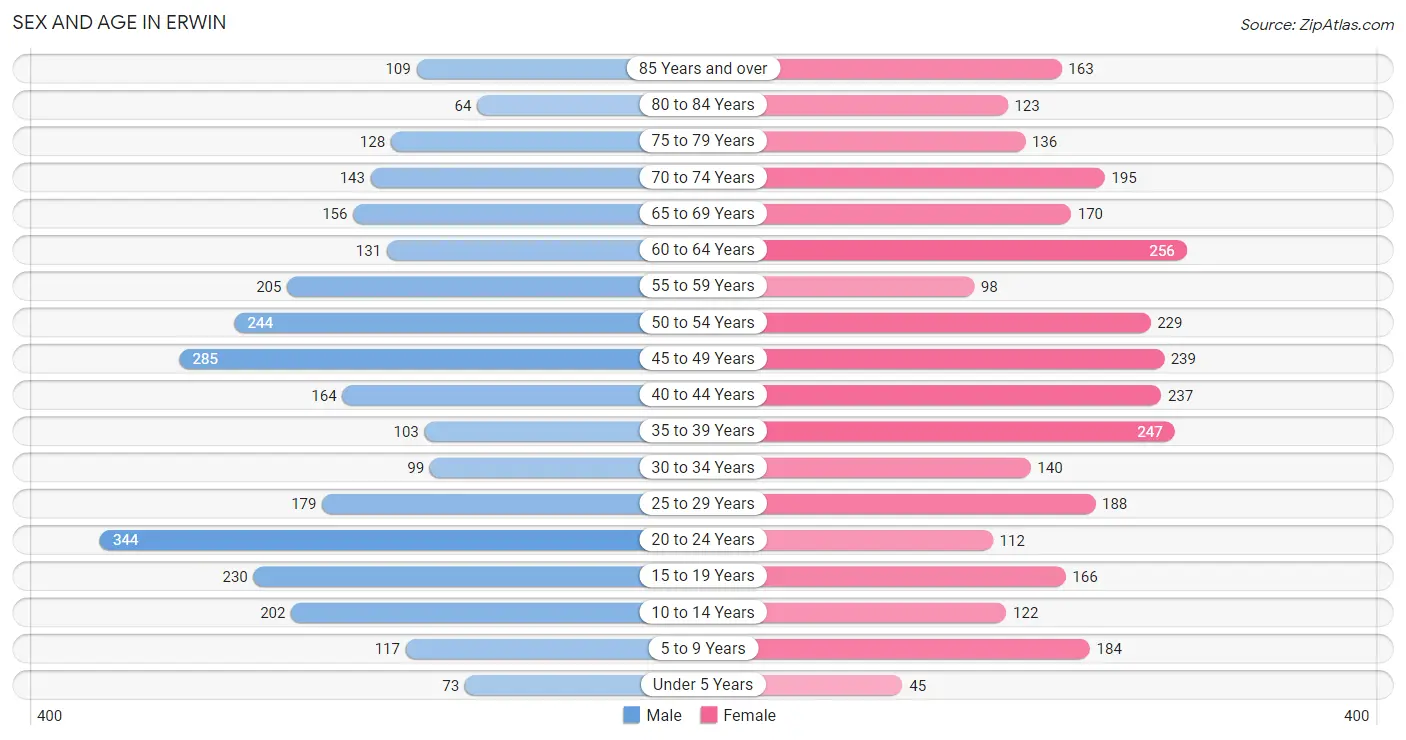
The most populous age groups in Erwin are 20 to 24 Years (344 | 11.6%) for men and 60 to 64 Years (256 | 8.4%) for women.
| Age Bracket | Male | Female |
| Under 5 Years | 73 (2.5%) | 45 (1.5%) |
| 5 to 9 Years | 117 (3.9%) | 184 (6.0%) |
| 10 to 14 Years | 202 (6.8%) | 122 (4.0%) |
| 15 to 19 Years | 230 (7.7%) | 166 (5.4%) |
| 20 to 24 Years | 344 (11.6%) | 112 (3.7%) |
| 25 to 29 Years | 179 (6.0%) | 188 (6.2%) |
| 30 to 34 Years | 99 (3.3%) | 140 (4.6%) |
| 35 to 39 Years | 103 (3.5%) | 247 (8.1%) |
| 40 to 44 Years | 164 (5.5%) | 237 (7.8%) |
| 45 to 49 Years | 285 (9.6%) | 239 (7.8%) |
| 50 to 54 Years | 244 (8.2%) | 229 (7.5%) |
| 55 to 59 Years | 205 (6.9%) | 98 (3.2%) |
| 60 to 64 Years | 131 (4.4%) | 256 (8.4%) |
| 65 to 69 Years | 156 (5.2%) | 170 (5.6%) |
| 70 to 74 Years | 143 (4.8%) | 195 (6.4%) |
| 75 to 79 Years | 128 (4.3%) | 136 (4.5%) |
| 80 to 84 Years | 64 (2.1%) | 123 (4.0%) |
| 85 Years and over | 109 (3.7%) | 163 (5.3%) |
| Total | 2,976 (100.0%) | 3,050 (100.0%) |
Families and Households in Erwin
Median Family Size in Erwin
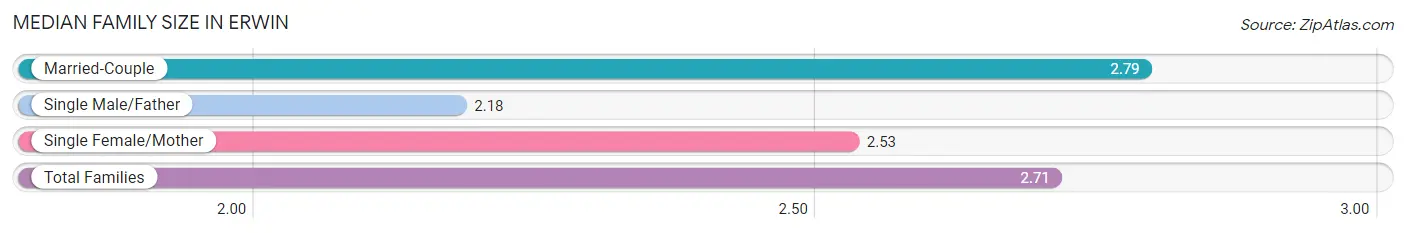
The median family size in Erwin is 2.71 persons per family, with married-couple families (1,409 | 79.9%) accounting for the largest median family size of 2.79 persons per family. On the other hand, single male/father families (113 | 6.4%) represent the smallest median family size with 2.18 persons per family.
| Family Type | # Families | Family Size |
| Married-Couple | 1,409 (79.9%) | 2.79 |
| Single Male/Father | 113 (6.4%) | 2.18 |
| Single Female/Mother | 242 (13.7%) | 2.53 |
| Total Families | 1,764 (100.0%) | 2.71 |
Median Household Size in Erwin
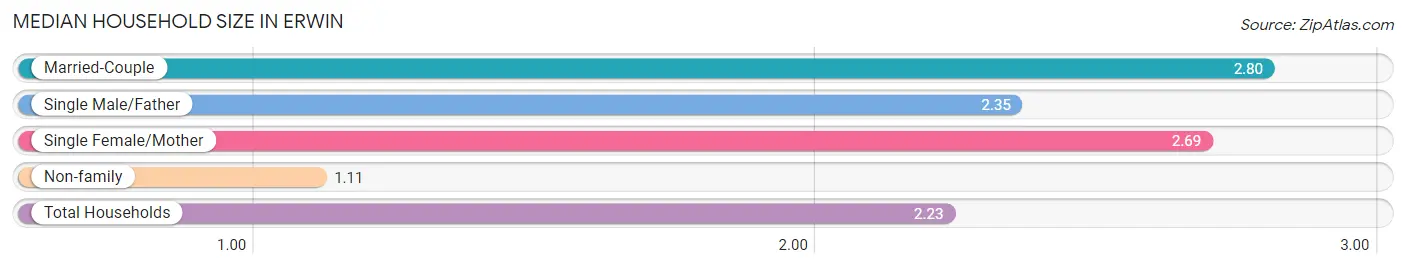
The median household size in Erwin is 2.23 persons per household, with married-couple households (1,409 | 54.1%) accounting for the largest median household size of 2.8 persons per household. non-family households (839 | 32.2%) represent the smallest median household size with 1.11 persons per household.
| Household Type | # Households | Household Size |
| Married-Couple | 1,409 (54.1%) | 2.80 |
| Single Male/Father | 113 (4.3%) | 2.35 |
| Single Female/Mother | 242 (9.3%) | 2.69 |
| Non-family | 839 (32.2%) | 1.11 |
| Total Households | 2,603 (100.0%) | 2.23 |
Household Size by Marriage Status in Erwin
Out of a total of 2,603 households in Erwin, 1,764 (67.8%) are family households, while 839 (32.2%) are nonfamily households. The most numerous type of family households are 2-person households, comprising 867, and the most common type of nonfamily households are 1-person households, comprising 743.
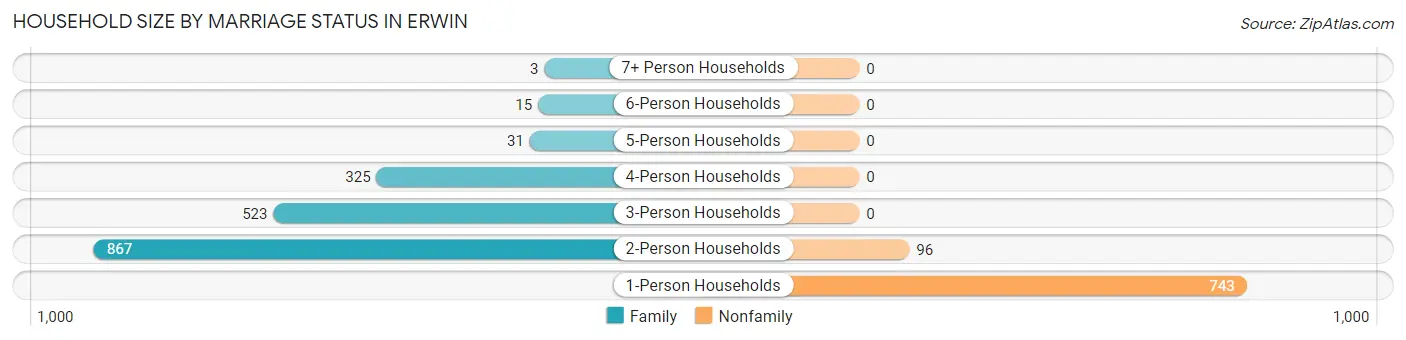
| Household Size | Family Households | Nonfamily Households |
| 1-Person Households | - | 743 (28.5%) |
| 2-Person Households | 867 (33.3%) | 96 (3.7%) |
| 3-Person Households | 523 (20.1%) | 0 (0.0%) |
| 4-Person Households | 325 (12.5%) | 0 (0.0%) |
| 5-Person Households | 31 (1.2%) | 0 (0.0%) |
| 6-Person Households | 15 (0.6%) | 0 (0.0%) |
| 7+ Person Households | 3 (0.1%) | 0 (0.0%) |
| Total | 1,764 (67.8%) | 839 (32.2%) |
Female Fertility in Erwin
Fertility by Age in Erwin
Average fertility rate in Erwin is 17.0 births per 1,000 women. Women in the age bracket of 35 to 50 years have the highest fertility rate with 29.0 births per 1,000 women. Women in the age bracket of 35 to 50 years acount for 100.0% of all women with births.
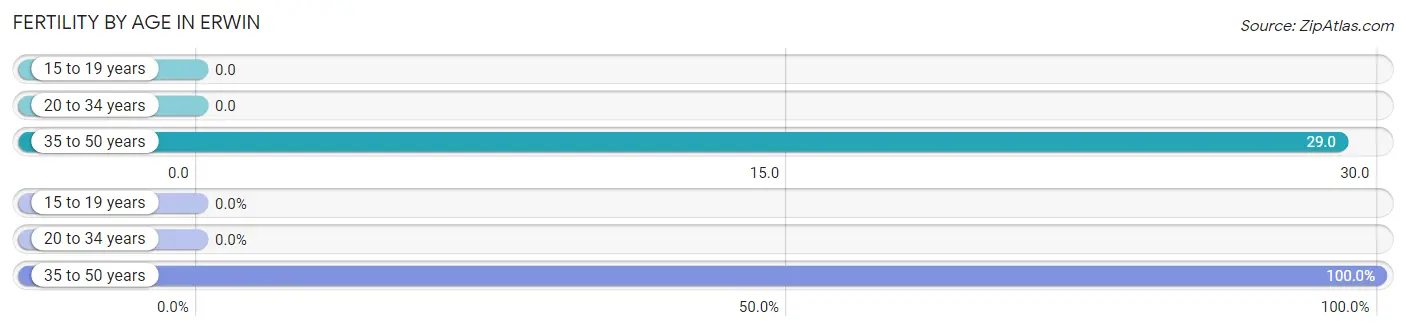
| Age Bracket | Women with Births | Births / 1,000 Women |
| 15 to 19 years | 0 (0.0%) | 0.0 |
| 20 to 34 years | 0 (0.0%) | 0.0 |
| 35 to 50 years | 24 (100.0%) | 29.0 |
| Total | 24 (100.0%) | 17.0 |
Fertility by Age by Marriage Status in Erwin
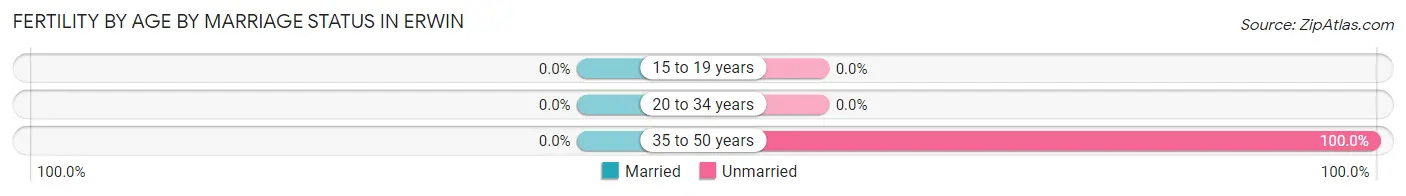
| Age Bracket | Married | Unmarried |
| 15 to 19 years | 0 (0.0%) | 0 (0.0%) |
| 20 to 34 years | 0 (0.0%) | 0 (0.0%) |
| 35 to 50 years | 0 (0.0%) | 24 (100.0%) |
| Total | 0 (0.0%) | 24 (100.0%) |
Fertility by Education in Erwin
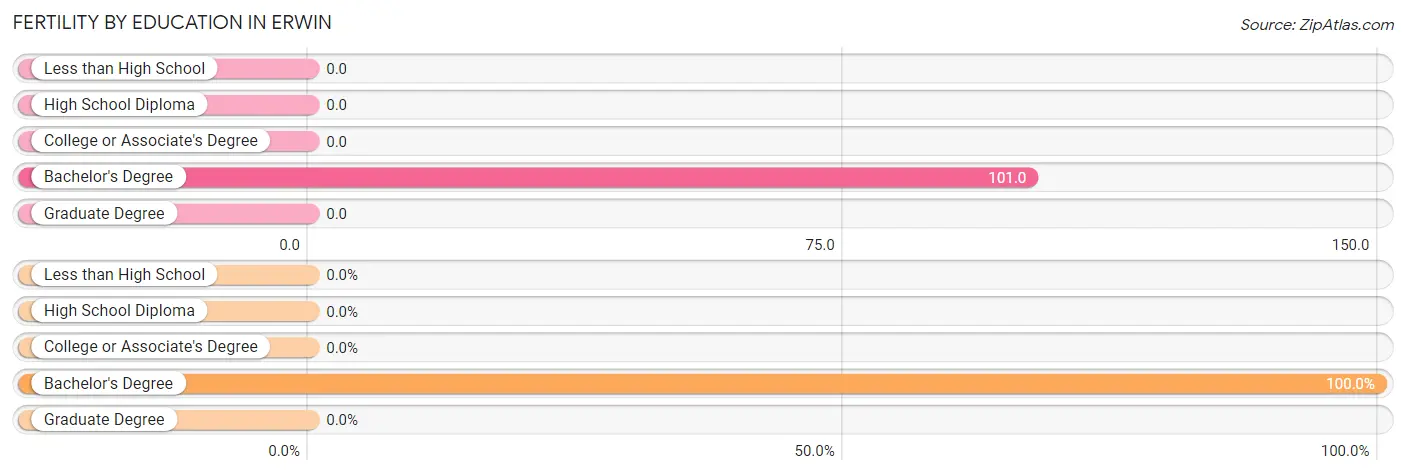
| Educational Attainment | Women with Births | Births / 1,000 Women |
| Less than High School | 0 (0.0%) | 0.0 |
| High School Diploma | 0 (0.0%) | 0.0 |
| College or Associate's Degree | 0 (0.0%) | 0.0 |
| Bachelor's Degree | 24 (100.0%) | 101.0 |
| Graduate Degree | 0 (0.0%) | 0.0 |
| Total | 24 (100.0%) | 17.0 |
Fertility by Education by Marriage Status in Erwin
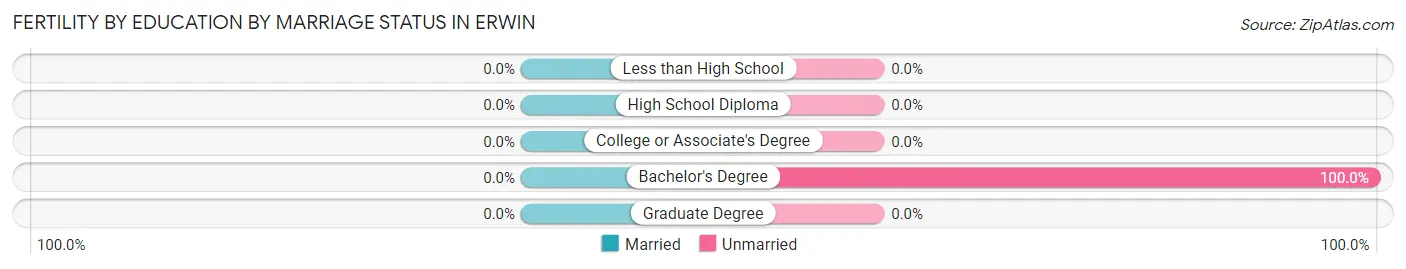
| Educational Attainment | Married | Unmarried |
| Less than High School | 0 (0.0%) | 0 (0.0%) |
| High School Diploma | 0 (0.0%) | 0 (0.0%) |
| College or Associate's Degree | 0 (0.0%) | 0 (0.0%) |
| Bachelor's Degree | 0 (0.0%) | 24 (100.0%) |
| Graduate Degree | 0 (0.0%) | 0 (0.0%) |
| Total | 0 (0.0%) | 24 (100.0%) |
Employment Characteristics in Erwin
Employment by Class of Employer in Erwin
Among the 2,551 employed individuals in Erwin, private company employees (1,669 | 65.4%), not-for-profit organizations (337 | 13.2%), and local government employees (225 | 8.8%) make up the most common classes of employment.
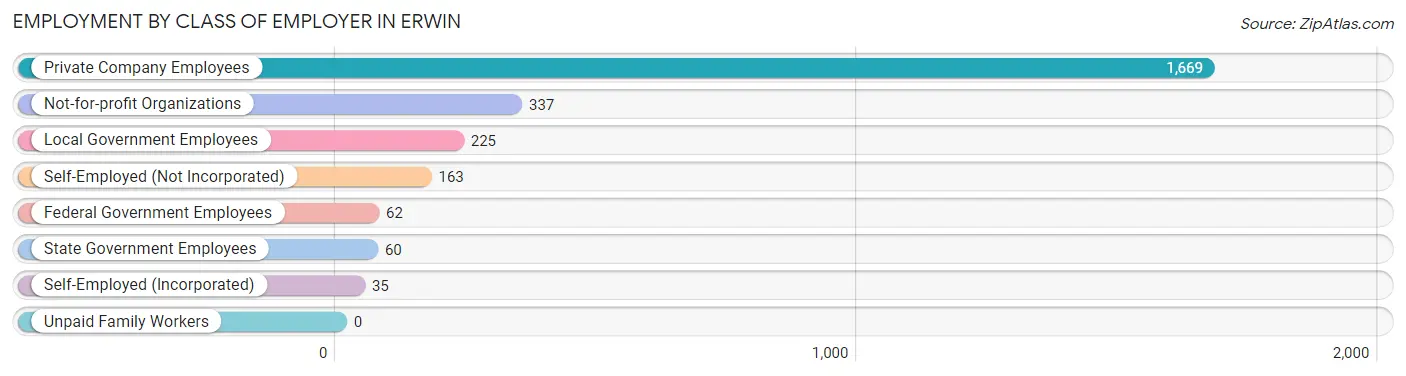
| Employer Class | # Employees | % Employees |
| Private Company Employees | 1,669 | 65.4% |
| Self-Employed (Incorporated) | 35 | 1.4% |
| Self-Employed (Not Incorporated) | 163 | 6.4% |
| Not-for-profit Organizations | 337 | 13.2% |
| Local Government Employees | 225 | 8.8% |
| State Government Employees | 60 | 2.4% |
| Federal Government Employees | 62 | 2.4% |
| Unpaid Family Workers | 0 | 0.0% |
| Total | 2,551 | 100.0% |
Employment Status by Age in Erwin
According to the labor force statistics for Erwin, out of the total population over 16 years of age (5,193), 52.5% or 2,726 individuals are in the labor force, with 4.9% or 134 of them unemployed. The age group with the highest labor force participation rate is 20 to 24 years, with 89.9% or 410 individuals in the labor force. Within the labor force, the 35 to 44 years age range has the highest percentage of unemployed individuals, with 14.8% or 87 of them being unemployed.
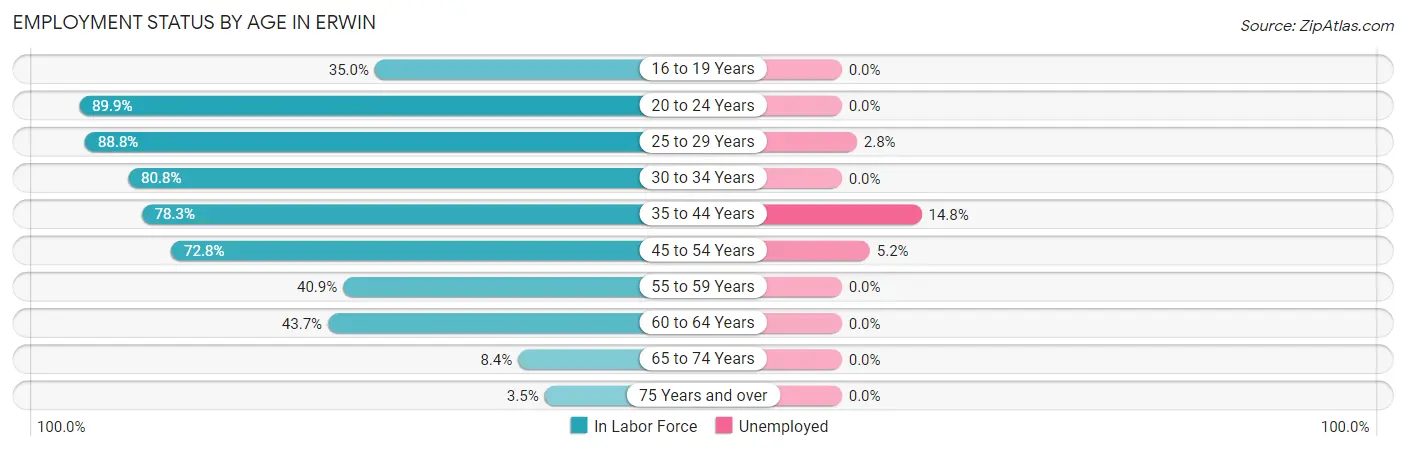
| Age Bracket | In Labor Force | Unemployed |
| 16 to 19 Years | 107 (35.0%) | 0 (0.0%) |
| 20 to 24 Years | 410 (89.9%) | 0 (0.0%) |
| 25 to 29 Years | 326 (88.8%) | 9 (2.8%) |
| 30 to 34 Years | 193 (80.8%) | 0 (0.0%) |
| 35 to 44 Years | 588 (78.3%) | 87 (14.8%) |
| 45 to 54 Years | 726 (72.8%) | 38 (5.2%) |
| 55 to 59 Years | 124 (40.9%) | 0 (0.0%) |
| 60 to 64 Years | 169 (43.7%) | 0 (0.0%) |
| 65 to 74 Years | 56 (8.4%) | 0 (0.0%) |
| 75 Years and over | 25 (3.5%) | 0 (0.0%) |
| Total | 2,726 (52.5%) | 134 (4.9%) |
Employment Status by Educational Attainment in Erwin
According to labor force statistics for Erwin, 69.8% of individuals (2,125) out of the total population between 25 and 64 years of age (3,044) are in the labor force, with 6.3% or 134 of them being unemployed. The group with the highest labor force participation rate are those with the educational attainment of bachelor's degree or higher, with 88.5% or 470 individuals in the labor force. Within the labor force, individuals with high school diploma education have the highest percentage of unemployment, with 8.5% or 64 of them being unemployed.
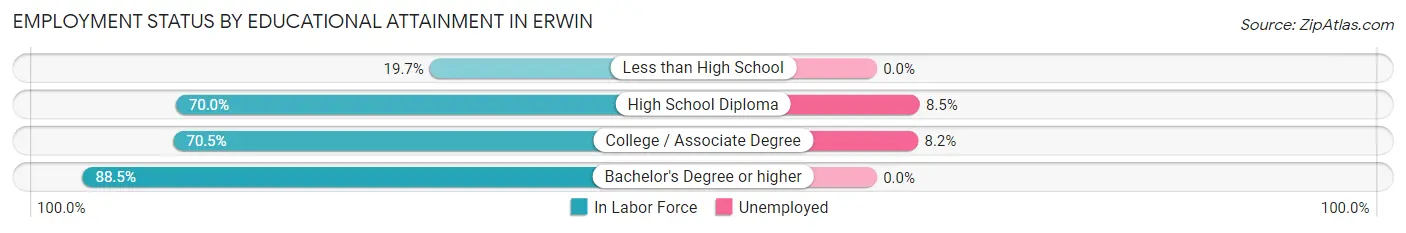
| Educational Attainment | In Labor Force | Unemployed |
| Less than High School | 43 (19.7%) | 0 (0.0%) |
| High School Diploma | 756 (70.0%) | 92 (8.5%) |
| College / Associate Degree | 857 (70.5%) | 100 (8.2%) |
| Bachelor's Degree or higher | 470 (88.5%) | 0 (0.0%) |
| Total | 2,125 (69.8%) | 192 (6.3%) |
Employment Occupations by Sex in Erwin
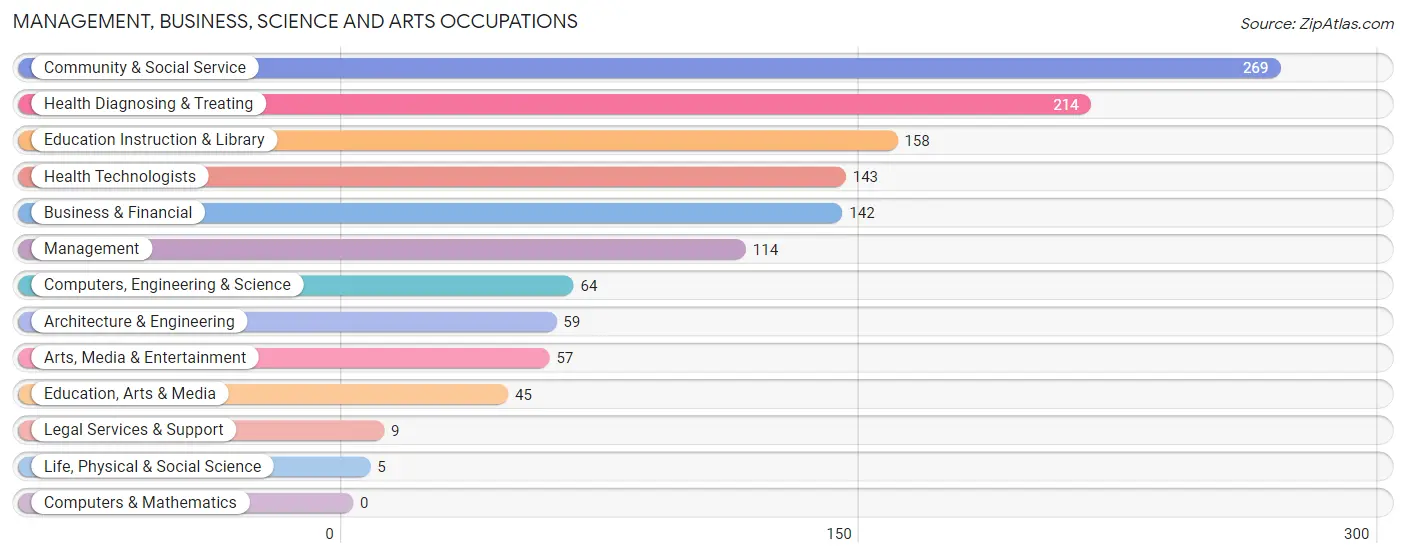
Management, Business, Science and Arts Occupations
The most common Management, Business, Science and Arts occupations in Erwin are Community & Social Service (269 | 10.4%), Health Diagnosing & Treating (214 | 8.3%), Education Instruction & Library (158 | 6.1%), Health Technologists (143 | 5.5%), and Business & Financial (142 | 5.5%).
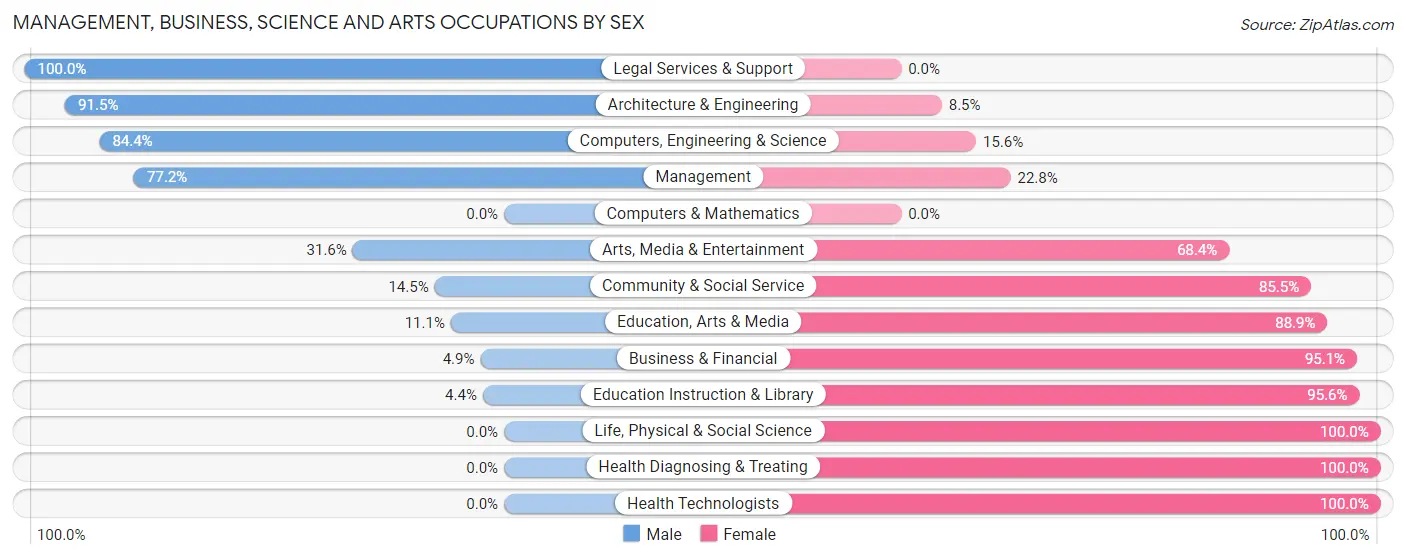
Management, Business, Science and Arts Occupations by Sex
Within the Management, Business, Science and Arts occupations in Erwin, the most male-oriented occupations are Legal Services & Support (100.0%), Architecture & Engineering (91.5%), and Computers, Engineering & Science (84.4%), while the most female-oriented occupations are Life, Physical & Social Science (100.0%), Health Diagnosing & Treating (100.0%), and Health Technologists (100.0%).
| Occupation | Male | Female |
| Management | 88 (77.2%) | 26 (22.8%) |
| Business & Financial | 7 (4.9%) | 135 (95.1%) |
| Computers, Engineering & Science | 54 (84.4%) | 10 (15.6%) |
| Computers & Mathematics | 0 (0.0%) | 0 (0.0%) |
| Architecture & Engineering | 54 (91.5%) | 5 (8.5%) |
| Life, Physical & Social Science | 0 (0.0%) | 5 (100.0%) |
| Community & Social Service | 39 (14.5%) | 230 (85.5%) |
| Education, Arts & Media | 5 (11.1%) | 40 (88.9%) |
| Legal Services & Support | 9 (100.0%) | 0 (0.0%) |
| Education Instruction & Library | 7 (4.4%) | 151 (95.6%) |
| Arts, Media & Entertainment | 18 (31.6%) | 39 (68.4%) |
| Health Diagnosing & Treating | 0 (0.0%) | 214 (100.0%) |
| Health Technologists | 0 (0.0%) | 143 (100.0%) |
| Total (Category) | 188 (23.4%) | 615 (76.6%) |
| Total (Overall) | 1,324 (51.1%) | 1,266 (48.9%) |
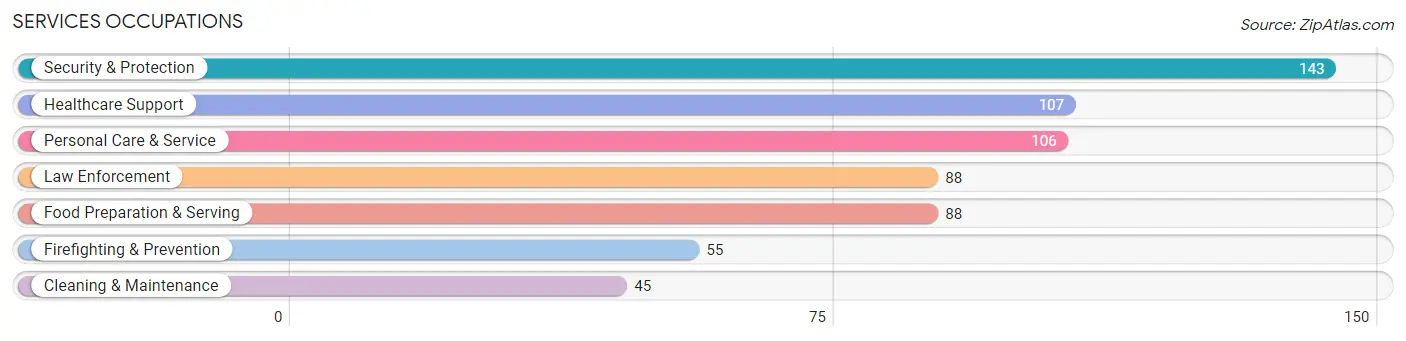
Services Occupations
The most common Services occupations in Erwin are Security & Protection (143 | 5.5%), Healthcare Support (107 | 4.1%), Personal Care & Service (106 | 4.1%), Law Enforcement (88 | 3.4%), and Food Preparation & Serving (88 | 3.4%).
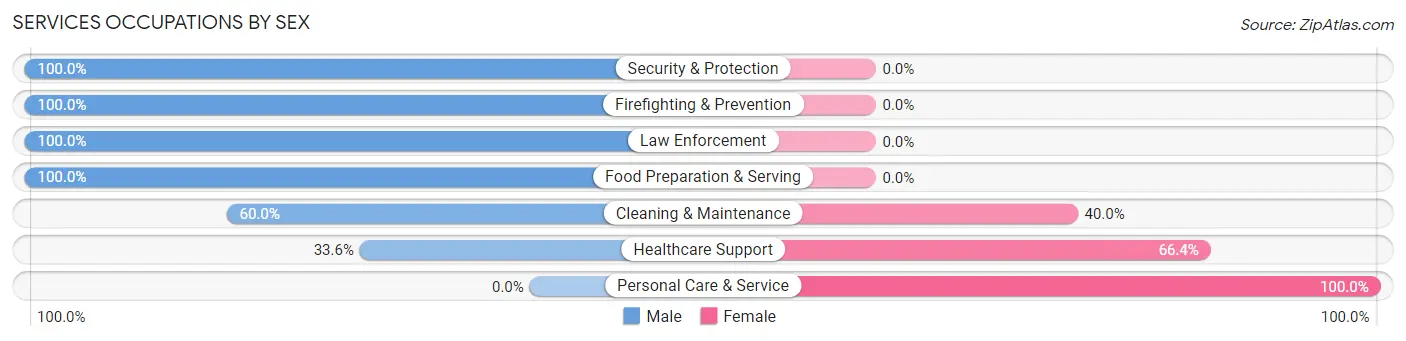
Services Occupations by Sex
Within the Services occupations in Erwin, the most male-oriented occupations are Security & Protection (100.0%), Firefighting & Prevention (100.0%), and Law Enforcement (100.0%), while the most female-oriented occupations are Personal Care & Service (100.0%), Healthcare Support (66.4%), and Cleaning & Maintenance (40.0%).
| Occupation | Male | Female |
| Healthcare Support | 36 (33.6%) | 71 (66.4%) |
| Security & Protection | 143 (100.0%) | 0 (0.0%) |
| Firefighting & Prevention | 55 (100.0%) | 0 (0.0%) |
| Law Enforcement | 88 (100.0%) | 0 (0.0%) |
| Food Preparation & Serving | 88 (100.0%) | 0 (0.0%) |
| Cleaning & Maintenance | 27 (60.0%) | 18 (40.0%) |
| Personal Care & Service | 0 (0.0%) | 106 (100.0%) |
| Total (Category) | 294 (60.1%) | 195 (39.9%) |
| Total (Overall) | 1,324 (51.1%) | 1,266 (48.9%) |
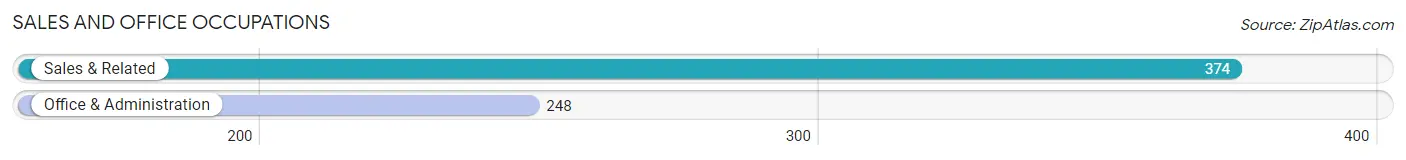
Sales and Office Occupations
The most common Sales and Office occupations in Erwin are Sales & Related (374 | 14.4%), and Office & Administration (248 | 9.6%).
Sales and Office Occupations by Sex
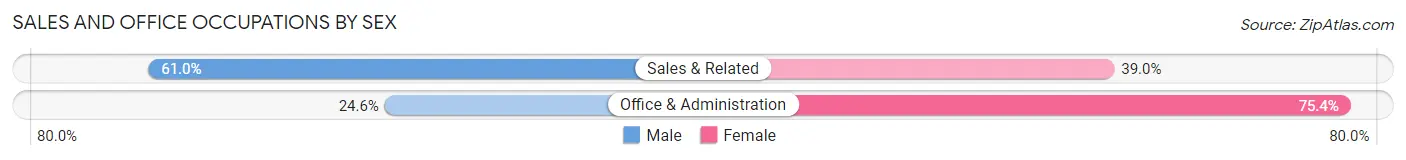
| Occupation | Male | Female |
| Sales & Related | 228 (61.0%) | 146 (39.0%) |
| Office & Administration | 61 (24.6%) | 187 (75.4%) |
| Total (Category) | 289 (46.5%) | 333 (53.5%) |
| Total (Overall) | 1,324 (51.1%) | 1,266 (48.9%) |
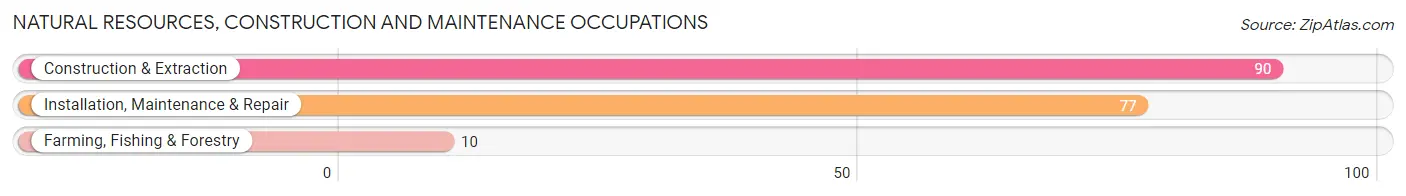
Natural Resources, Construction and Maintenance Occupations
The most common Natural Resources, Construction and Maintenance occupations in Erwin are Construction & Extraction (90 | 3.5%), Installation, Maintenance & Repair (77 | 3.0%), and Farming, Fishing & Forestry (10 | 0.4%).
Natural Resources, Construction and Maintenance Occupations by Sex
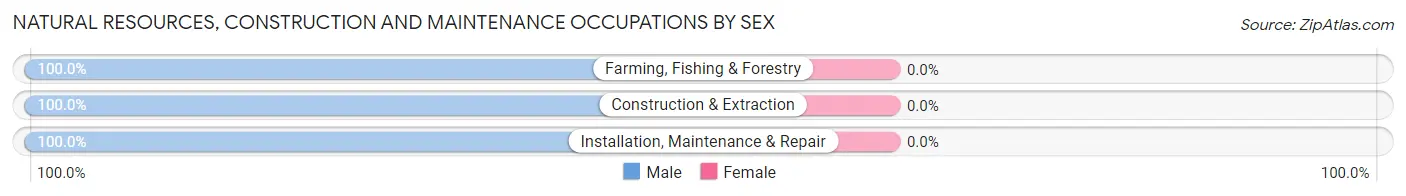
| Occupation | Male | Female |
| Farming, Fishing & Forestry | 10 (100.0%) | 0 (0.0%) |
| Construction & Extraction | 90 (100.0%) | 0 (0.0%) |
| Installation, Maintenance & Repair | 77 (100.0%) | 0 (0.0%) |
| Total (Category) | 177 (100.0%) | 0 (0.0%) |
| Total (Overall) | 1,324 (51.1%) | 1,266 (48.9%) |
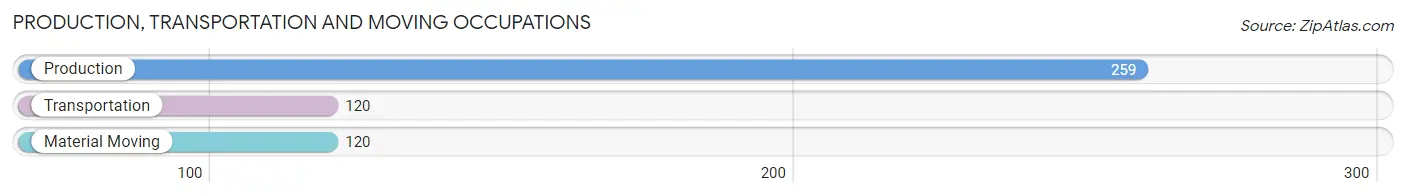
Production, Transportation and Moving Occupations
The most common Production, Transportation and Moving occupations in Erwin are Production (259 | 10.0%), Transportation (120 | 4.6%), and Material Moving (120 | 4.6%).
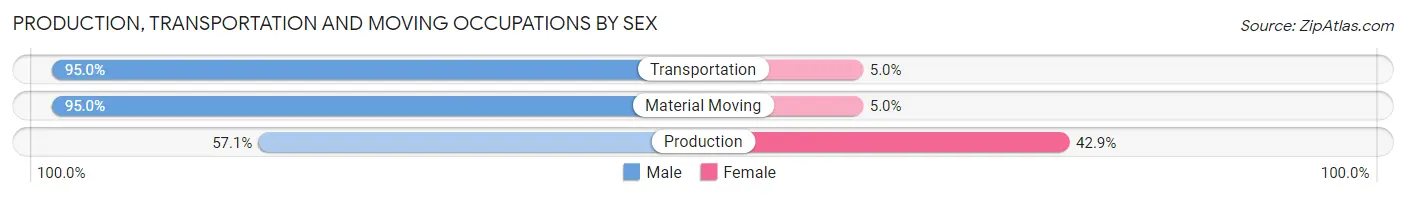
Production, Transportation and Moving Occupations by Sex
| Occupation | Male | Female |
| Production | 148 (57.1%) | 111 (42.9%) |
| Transportation | 114 (95.0%) | 6 (5.0%) |
| Material Moving | 114 (95.0%) | 6 (5.0%) |
| Total (Category) | 376 (75.3%) | 123 (24.6%) |
| Total (Overall) | 1,324 (51.1%) | 1,266 (48.9%) |
Employment Industries by Sex in Erwin
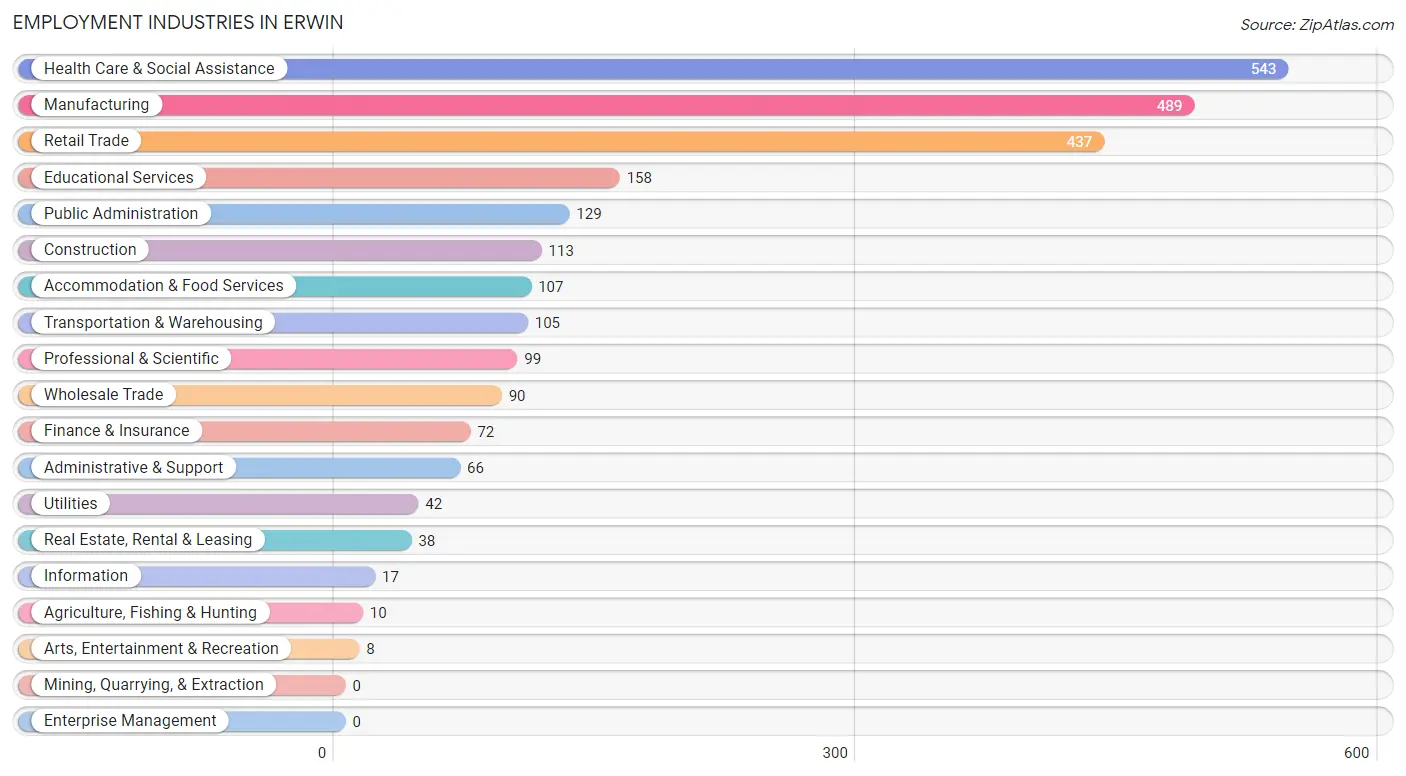
Employment Industries in Erwin
The major employment industries in Erwin include Health Care & Social Assistance (543 | 21.0%), Manufacturing (489 | 18.9%), Retail Trade (437 | 16.9%), Educational Services (158 | 6.1%), and Public Administration (129 | 5.0%).
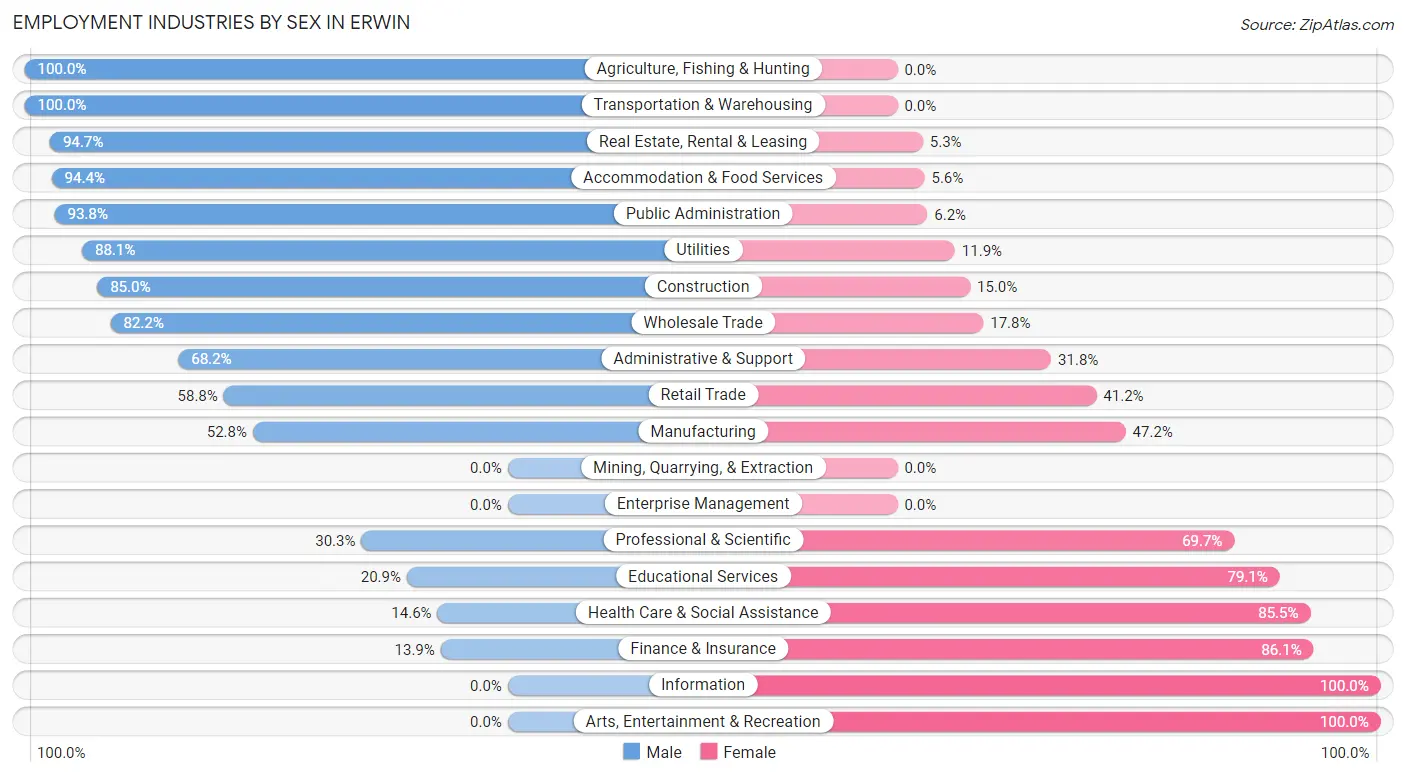
Employment Industries by Sex in Erwin
The Erwin industries that see more men than women are Agriculture, Fishing & Hunting (100.0%), Transportation & Warehousing (100.0%), and Real Estate, Rental & Leasing (94.7%), whereas the industries that tend to have a higher number of women are Information (100.0%), Arts, Entertainment & Recreation (100.0%), and Finance & Insurance (86.1%).
| Industry | Male | Female |
| Agriculture, Fishing & Hunting | 10 (100.0%) | 0 (0.0%) |
| Mining, Quarrying, & Extraction | 0 (0.0%) | 0 (0.0%) |
| Construction | 96 (85.0%) | 17 (15.0%) |
| Manufacturing | 258 (52.8%) | 231 (47.2%) |
| Wholesale Trade | 74 (82.2%) | 16 (17.8%) |
| Retail Trade | 257 (58.8%) | 180 (41.2%) |
| Transportation & Warehousing | 105 (100.0%) | 0 (0.0%) |
| Utilities | 37 (88.1%) | 5 (11.9%) |
| Information | 0 (0.0%) | 17 (100.0%) |
| Finance & Insurance | 10 (13.9%) | 62 (86.1%) |
| Real Estate, Rental & Leasing | 36 (94.7%) | 2 (5.3%) |
| Professional & Scientific | 30 (30.3%) | 69 (69.7%) |
| Enterprise Management | 0 (0.0%) | 0 (0.0%) |
| Administrative & Support | 45 (68.2%) | 21 (31.8%) |
| Educational Services | 33 (20.9%) | 125 (79.1%) |
| Health Care & Social Assistance | 79 (14.5%) | 464 (85.5%) |
| Arts, Entertainment & Recreation | 0 (0.0%) | 8 (100.0%) |
| Accommodation & Food Services | 101 (94.4%) | 6 (5.6%) |
| Public Administration | 121 (93.8%) | 8 (6.2%) |
| Total | 1,324 (51.1%) | 1,266 (48.9%) |
Education in Erwin
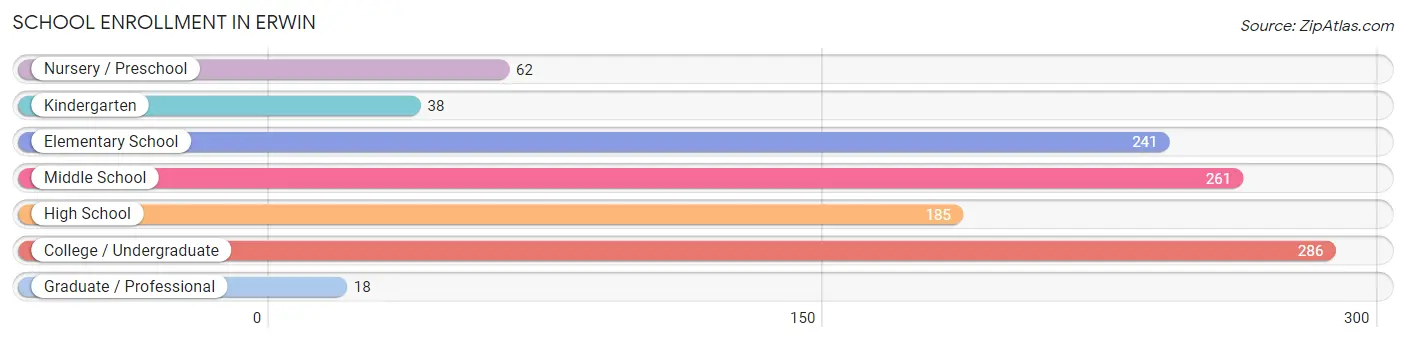
School Enrollment in Erwin
The most common levels of schooling among the 1,091 students in Erwin are college / undergraduate (286 | 26.2%), middle school (261 | 23.9%), and elementary school (241 | 22.1%).
| School Level | # Students | % Students |
| Nursery / Preschool | 62 | 5.7% |
| Kindergarten | 38 | 3.5% |
| Elementary School | 241 | 22.1% |
| Middle School | 261 | 23.9% |
| High School | 185 | 17.0% |
| College / Undergraduate | 286 | 26.2% |
| Graduate / Professional | 18 | 1.7% |
| Total | 1,091 | 100.0% |
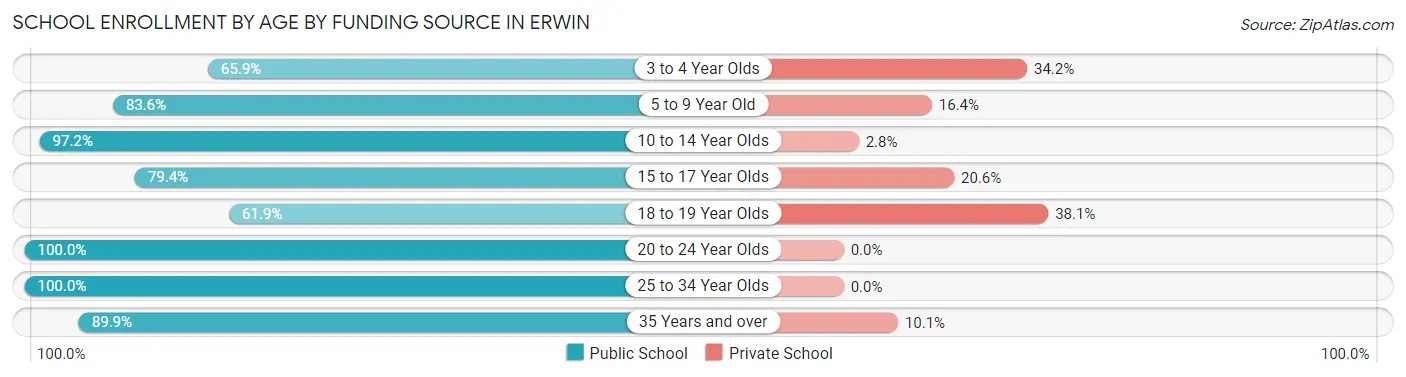
School Enrollment by Age by Funding Source in Erwin
Out of a total of 1,091 students who are enrolled in schools in Erwin, 122 (11.2%) attend a private institution, while the remaining 969 (88.8%) are enrolled in public schools. The age group of 18 to 19 year olds has the highest likelihood of being enrolled in private schools, with 8 (38.1% in the age bracket) enrolled. Conversely, the age group of 20 to 24 year olds has the lowest likelihood of being enrolled in a private school, with 157 (100.0% in the age bracket) attending a public institution.
| Age Bracket | Public School | Private School |
| 3 to 4 Year Olds | 27 (65.8%) | 14 (34.2%) |
| 5 to 9 Year Old | 234 (83.6%) | 46 (16.4%) |
| 10 to 14 Year Olds | 278 (97.2%) | 8 (2.8%) |
| 15 to 17 Year Olds | 143 (79.4%) | 37 (20.6%) |
| 18 to 19 Year Olds | 13 (61.9%) | 8 (38.1%) |
| 20 to 24 Year Olds | 157 (100.0%) | 0 (0.0%) |
| 25 to 34 Year Olds | 37 (100.0%) | 0 (0.0%) |
| 35 Years and over | 80 (89.9%) | 9 (10.1%) |
| Total | 969 (88.8%) | 122 (11.2%) |
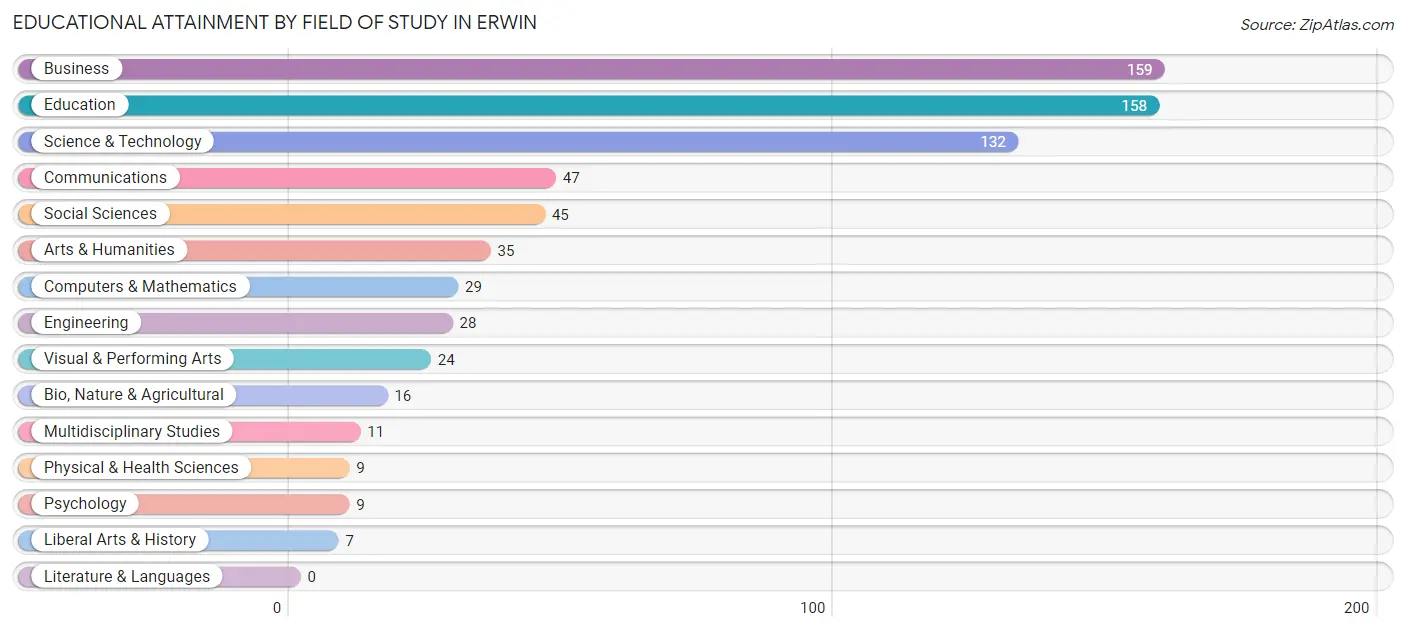
Educational Attainment by Field of Study in Erwin
Business (159 | 22.4%), education (158 | 22.3%), science & technology (132 | 18.6%), communications (47 | 6.6%), and social sciences (45 | 6.4%) are the most common fields of study among 709 individuals in Erwin who have obtained a bachelor's degree or higher.
| Field of Study | # Graduates | % Graduates |
| Computers & Mathematics | 29 | 4.1% |
| Bio, Nature & Agricultural | 16 | 2.3% |
| Physical & Health Sciences | 9 | 1.3% |
| Psychology | 9 | 1.3% |
| Social Sciences | 45 | 6.4% |
| Engineering | 28 | 4.0% |
| Multidisciplinary Studies | 11 | 1.5% |
| Science & Technology | 132 | 18.6% |
| Business | 159 | 22.4% |
| Education | 158 | 22.3% |
| Literature & Languages | 0 | 0.0% |
| Liberal Arts & History | 7 | 1.0% |
| Visual & Performing Arts | 24 | 3.4% |
| Communications | 47 | 6.6% |
| Arts & Humanities | 35 | 4.9% |
| Total | 709 | 100.0% |
Transportation & Commute in Erwin
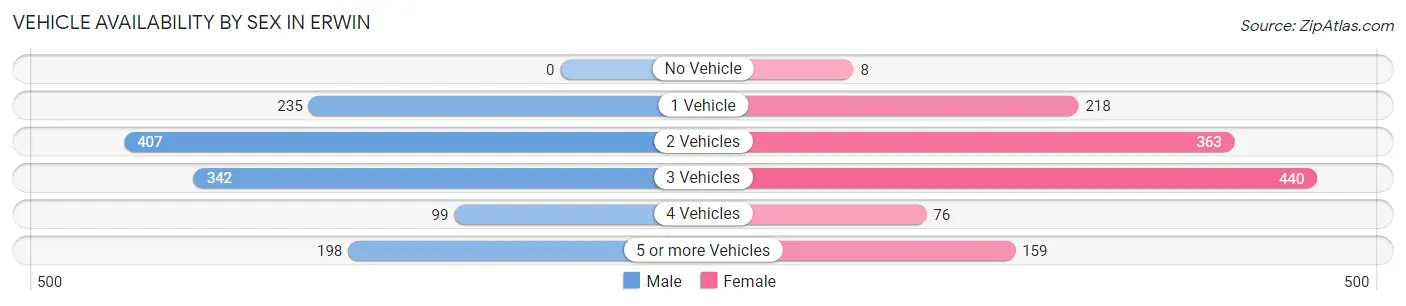
Vehicle Availability by Sex in Erwin
The most prevalent vehicle ownership categories in Erwin are males with 2 vehicles (407, accounting for 31.8%) and females with 2 vehicles (363, making up 32.2%).
| Vehicles Available | Male | Female |
| No Vehicle | 0 (0.0%) | 8 (0.6%) |
| 1 Vehicle | 235 (18.3%) | 218 (17.2%) |
| 2 Vehicles | 407 (31.8%) | 363 (28.7%) |
| 3 Vehicles | 342 (26.7%) | 440 (34.8%) |
| 4 Vehicles | 99 (7.7%) | 76 (6.0%) |
| 5 or more Vehicles | 198 (15.5%) | 159 (12.6%) |
| Total | 1,281 (100.0%) | 1,264 (100.0%) |
Commute Time in Erwin
The most frequently occuring commute durations in Erwin are 5 to 9 minutes (646 commuters, 26.3%), 20 to 24 minutes (312 commuters, 12.7%), and 15 to 19 minutes (297 commuters, 12.1%).
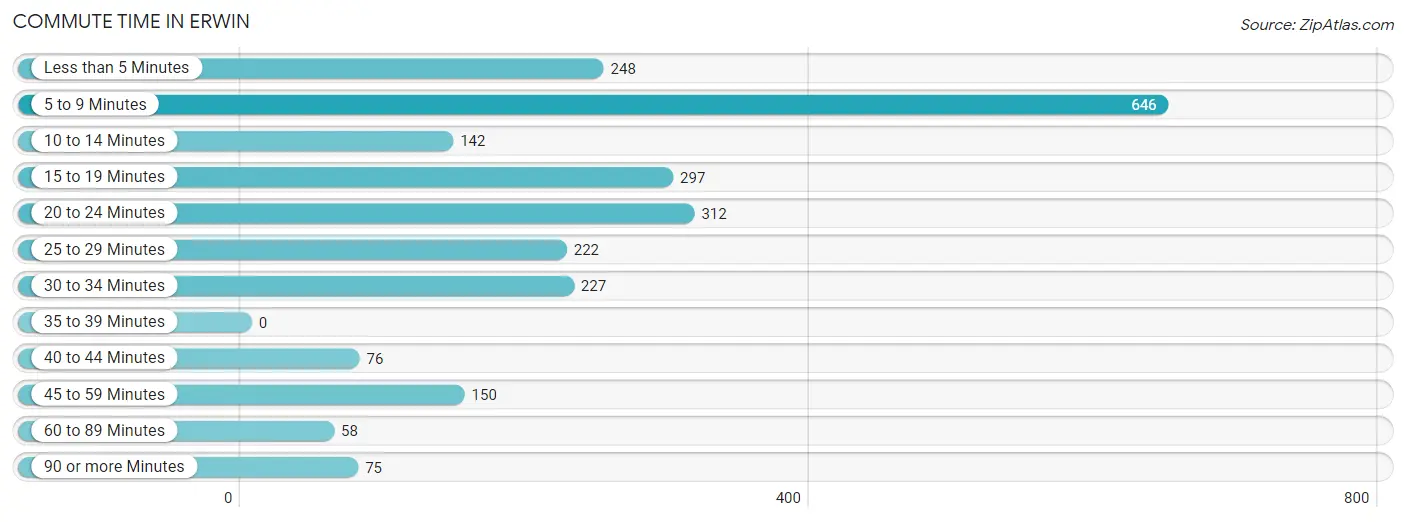
| Commute Time | # Commuters | % Commuters |
| Less than 5 Minutes | 248 | 10.1% |
| 5 to 9 Minutes | 646 | 26.3% |
| 10 to 14 Minutes | 142 | 5.8% |
| 15 to 19 Minutes | 297 | 12.1% |
| 20 to 24 Minutes | 312 | 12.7% |
| 25 to 29 Minutes | 222 | 9.0% |
| 30 to 34 Minutes | 227 | 9.2% |
| 35 to 39 Minutes | 0 | 0.0% |
| 40 to 44 Minutes | 76 | 3.1% |
| 45 to 59 Minutes | 150 | 6.1% |
| 60 to 89 Minutes | 58 | 2.4% |
| 90 or more Minutes | 75 | 3.1% |
Commute Time by Sex in Erwin
The most common commute times in Erwin are 5 to 9 minutes (361 commuters, 29.5%) for males and 5 to 9 minutes (285 commuters, 23.2%) for females.
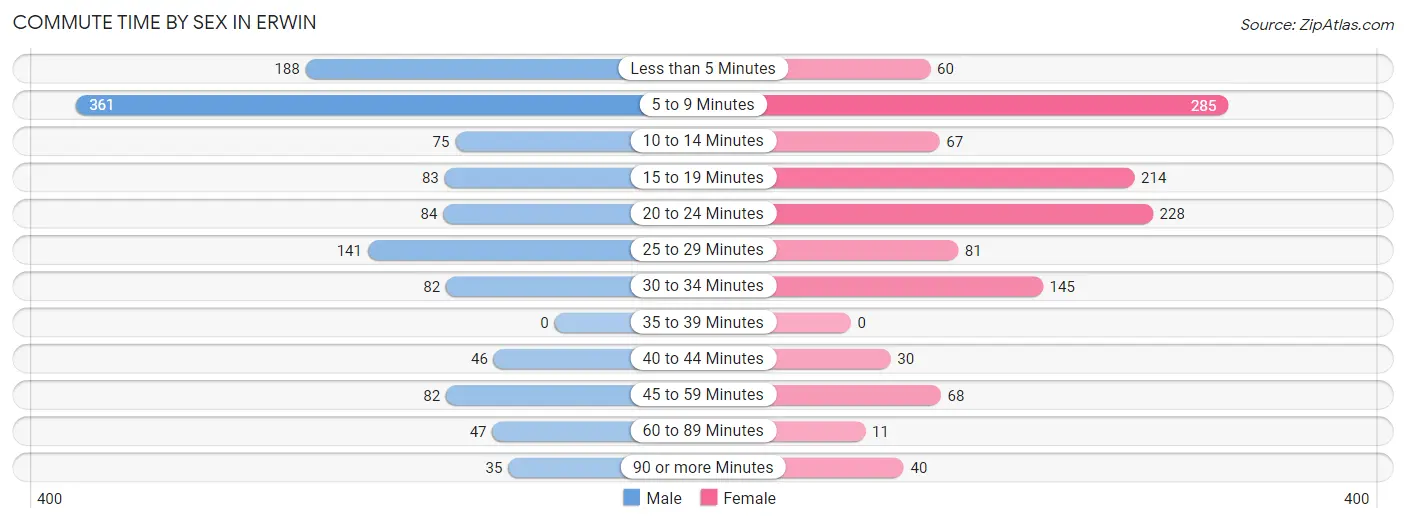
| Commute Time | Male | Female |
| Less than 5 Minutes | 188 (15.4%) | 60 (4.9%) |
| 5 to 9 Minutes | 361 (29.5%) | 285 (23.2%) |
| 10 to 14 Minutes | 75 (6.1%) | 67 (5.4%) |
| 15 to 19 Minutes | 83 (6.8%) | 214 (17.4%) |
| 20 to 24 Minutes | 84 (6.9%) | 228 (18.5%) |
| 25 to 29 Minutes | 141 (11.5%) | 81 (6.6%) |
| 30 to 34 Minutes | 82 (6.7%) | 145 (11.8%) |
| 35 to 39 Minutes | 0 (0.0%) | 0 (0.0%) |
| 40 to 44 Minutes | 46 (3.8%) | 30 (2.4%) |
| 45 to 59 Minutes | 82 (6.7%) | 68 (5.5%) |
| 60 to 89 Minutes | 47 (3.8%) | 11 (0.9%) |
| 90 or more Minutes | 35 (2.9%) | 40 (3.3%) |
Time of Departure to Work by Sex in Erwin
The most frequent times of departure to work in Erwin are 7:00 AM to 7:29 AM (225, 18.4%) for males and 7:00 AM to 7:29 AM (318, 25.9%) for females.
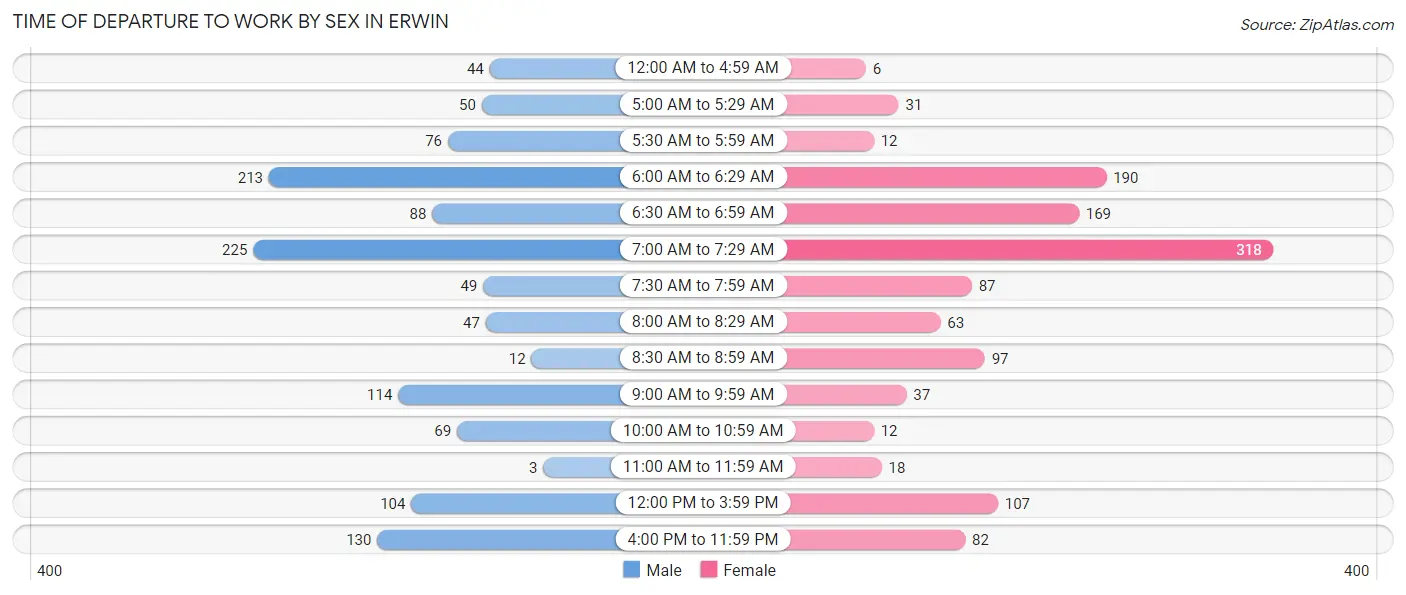
| Time of Departure | Male | Female |
| 12:00 AM to 4:59 AM | 44 (3.6%) | 6 (0.5%) |
| 5:00 AM to 5:29 AM | 50 (4.1%) | 31 (2.5%) |
| 5:30 AM to 5:59 AM | 76 (6.2%) | 12 (1.0%) |
| 6:00 AM to 6:29 AM | 213 (17.4%) | 190 (15.5%) |
| 6:30 AM to 6:59 AM | 88 (7.2%) | 169 (13.8%) |
| 7:00 AM to 7:29 AM | 225 (18.4%) | 318 (25.9%) |
| 7:30 AM to 7:59 AM | 49 (4.0%) | 87 (7.1%) |
| 8:00 AM to 8:29 AM | 47 (3.8%) | 63 (5.1%) |
| 8:30 AM to 8:59 AM | 12 (1.0%) | 97 (7.9%) |
| 9:00 AM to 9:59 AM | 114 (9.3%) | 37 (3.0%) |
| 10:00 AM to 10:59 AM | 69 (5.6%) | 12 (1.0%) |
| 11:00 AM to 11:59 AM | 3 (0.3%) | 18 (1.5%) |
| 12:00 PM to 3:59 PM | 104 (8.5%) | 107 (8.7%) |
| 4:00 PM to 11:59 PM | 130 (10.6%) | 82 (6.7%) |
| Total | 1,224 (100.0%) | 1,229 (100.0%) |
Housing Occupancy in Erwin
Occupancy by Ownership in Erwin
Of the total 2,603 dwellings in Erwin, owner-occupied units account for 1,729 (66.4%), while renter-occupied units make up 874 (33.6%).
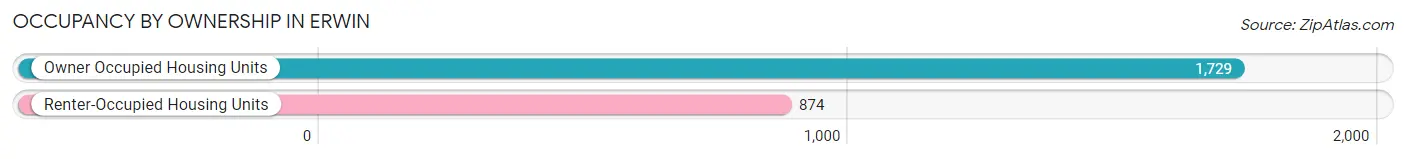
| Occupancy | # Housing Units | % Housing Units |
| Owner Occupied Housing Units | 1,729 | 66.4% |
| Renter-Occupied Housing Units | 874 | 33.6% |
| Total Occupied Housing Units | 2,603 | 100.0% |
Occupancy by Household Size in Erwin
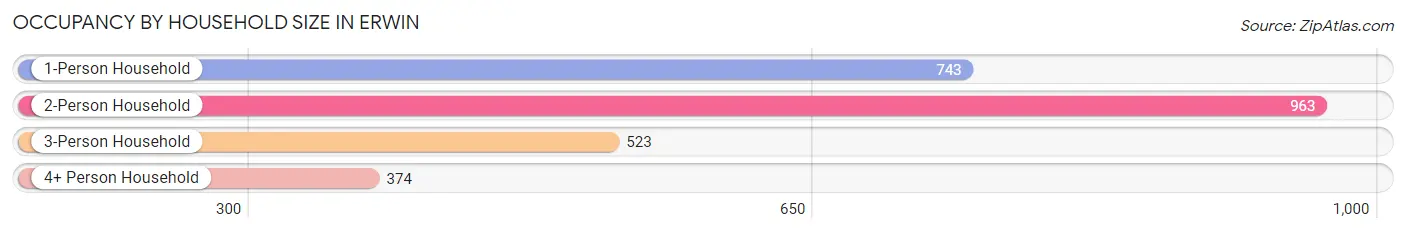
| Household Size | # Housing Units | % Housing Units |
| 1-Person Household | 743 | 28.5% |
| 2-Person Household | 963 | 37.0% |
| 3-Person Household | 523 | 20.1% |
| 4+ Person Household | 374 | 14.4% |
| Total Housing Units | 2,603 | 100.0% |
Occupancy by Ownership by Household Size in Erwin
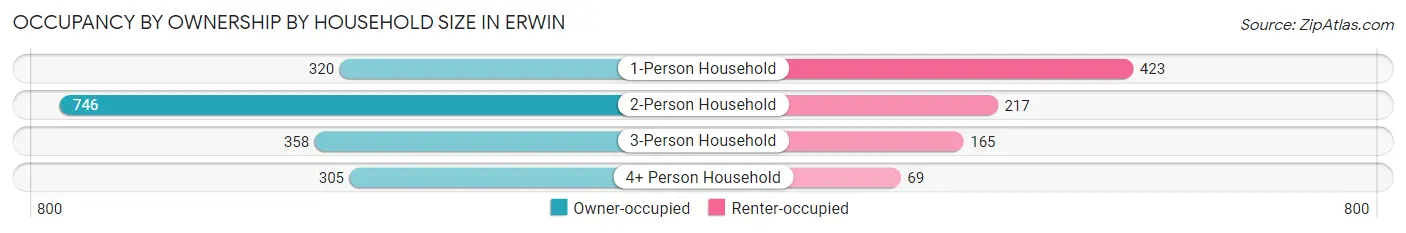
| Household Size | Owner-occupied | Renter-occupied |
| 1-Person Household | 320 (43.1%) | 423 (56.9%) |
| 2-Person Household | 746 (77.5%) | 217 (22.5%) |
| 3-Person Household | 358 (68.4%) | 165 (31.6%) |
| 4+ Person Household | 305 (81.6%) | 69 (18.4%) |
| Total Housing Units | 1,729 (66.4%) | 874 (33.6%) |
Occupancy by Educational Attainment in Erwin
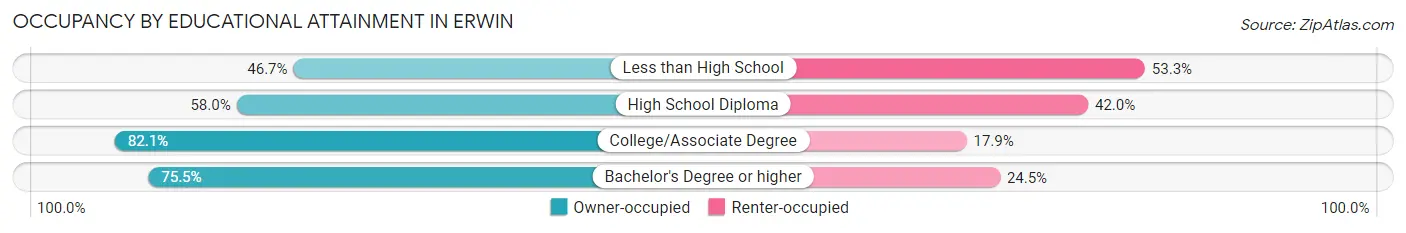
| Household Size | Owner-occupied | Renter-occupied |
| Less than High School | 178 (46.7%) | 203 (53.3%) |
| High School Diploma | 588 (58.0%) | 426 (42.0%) |
| College/Associate Degree | 637 (82.1%) | 139 (17.9%) |
| Bachelor's Degree or higher | 326 (75.5%) | 106 (24.5%) |
Occupancy by Age of Householder in Erwin
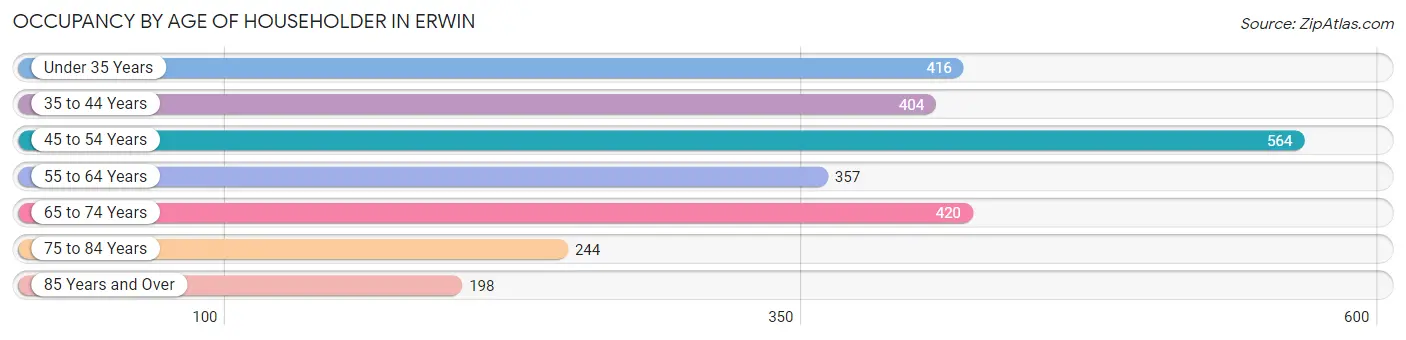
| Age Bracket | # Households | % Households |
| Under 35 Years | 416 | 16.0% |
| 35 to 44 Years | 404 | 15.5% |
| 45 to 54 Years | 564 | 21.7% |
| 55 to 64 Years | 357 | 13.7% |
| 65 to 74 Years | 420 | 16.1% |
| 75 to 84 Years | 244 | 9.4% |
| 85 Years and Over | 198 | 7.6% |
| Total | 2,603 | 100.0% |
Housing Finances in Erwin
Median Income by Occupancy in Erwin
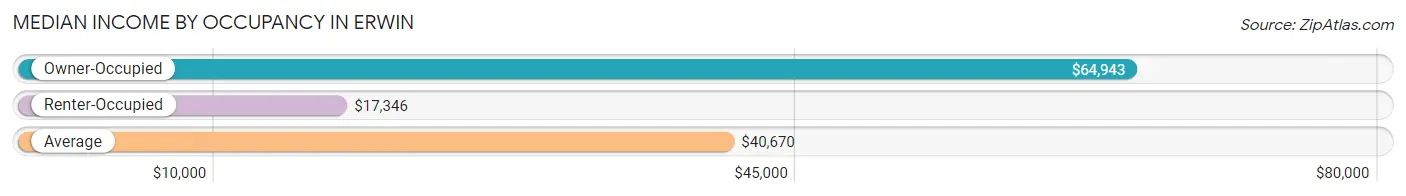
| Occupancy Type | # Households | Median Income |
| Owner-Occupied | 1,729 (66.4%) | $64,943 |
| Renter-Occupied | 874 (33.6%) | $17,346 |
| Average | 2,603 (100.0%) | $40,670 |
Occupancy by Householder Income Bracket in Erwin
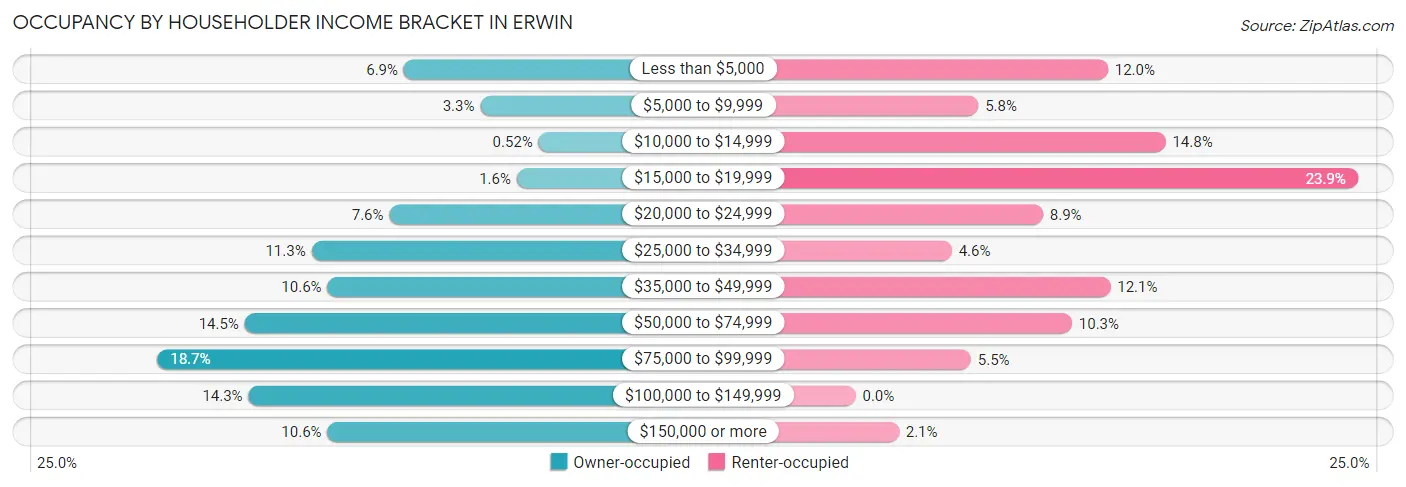
| Income Bracket | Owner-occupied | Renter-occupied |
| Less than $5,000 | 120 (6.9%) | 105 (12.0%) |
| $5,000 to $9,999 | 57 (3.3%) | 51 (5.8%) |
| $10,000 to $14,999 | 9 (0.5%) | 129 (14.8%) |
| $15,000 to $19,999 | 27 (1.6%) | 209 (23.9%) |
| $20,000 to $24,999 | 132 (7.6%) | 78 (8.9%) |
| $25,000 to $34,999 | 196 (11.3%) | 40 (4.6%) |
| $35,000 to $49,999 | 183 (10.6%) | 106 (12.1%) |
| $50,000 to $74,999 | 251 (14.5%) | 90 (10.3%) |
| $75,000 to $99,999 | 323 (18.7%) | 48 (5.5%) |
| $100,000 to $149,999 | 248 (14.3%) | 0 (0.0%) |
| $150,000 or more | 183 (10.6%) | 18 (2.1%) |
| Total | 1,729 (100.0%) | 874 (100.0%) |
Monthly Housing Cost Tiers in Erwin
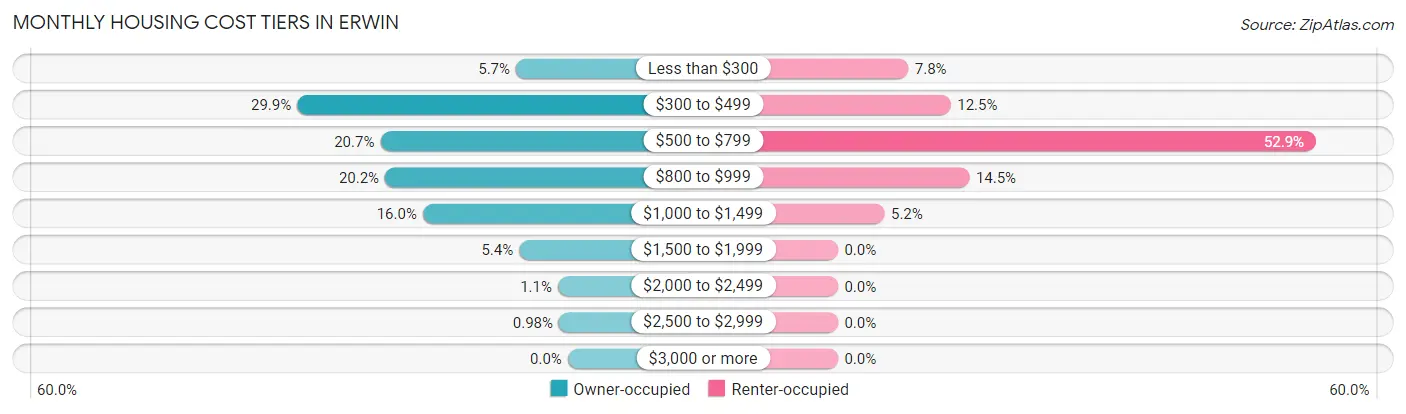
| Monthly Cost | Owner-occupied | Renter-occupied |
| Less than $300 | 99 (5.7%) | 68 (7.8%) |
| $300 to $499 | 517 (29.9%) | 109 (12.5%) |
| $500 to $799 | 358 (20.7%) | 462 (52.9%) |
| $800 to $999 | 349 (20.2%) | 127 (14.5%) |
| $1,000 to $1,499 | 277 (16.0%) | 45 (5.1%) |
| $1,500 to $1,999 | 93 (5.4%) | 0 (0.0%) |
| $2,000 to $2,499 | 19 (1.1%) | 0 (0.0%) |
| $2,500 to $2,999 | 17 (1.0%) | 0 (0.0%) |
| $3,000 or more | 0 (0.0%) | 0 (0.0%) |
| Total | 1,729 (100.0%) | 874 (100.0%) |
Physical Housing Characteristics in Erwin
Housing Structures in Erwin
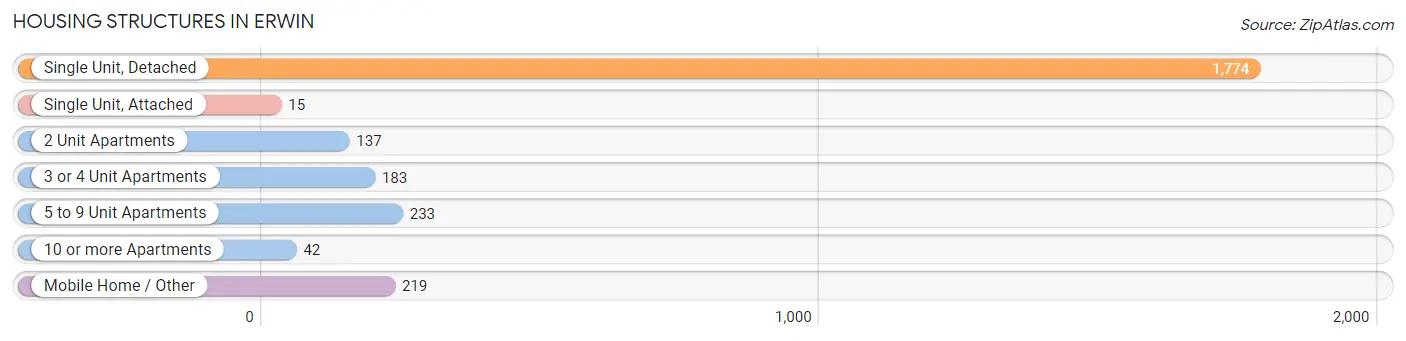
| Structure Type | # Housing Units | % Housing Units |
| Single Unit, Detached | 1,774 | 68.1% |
| Single Unit, Attached | 15 | 0.6% |
| 2 Unit Apartments | 137 | 5.3% |
| 3 or 4 Unit Apartments | 183 | 7.0% |
| 5 to 9 Unit Apartments | 233 | 8.9% |
| 10 or more Apartments | 42 | 1.6% |
| Mobile Home / Other | 219 | 8.4% |
| Total | 2,603 | 100.0% |
Housing Structures by Occupancy in Erwin
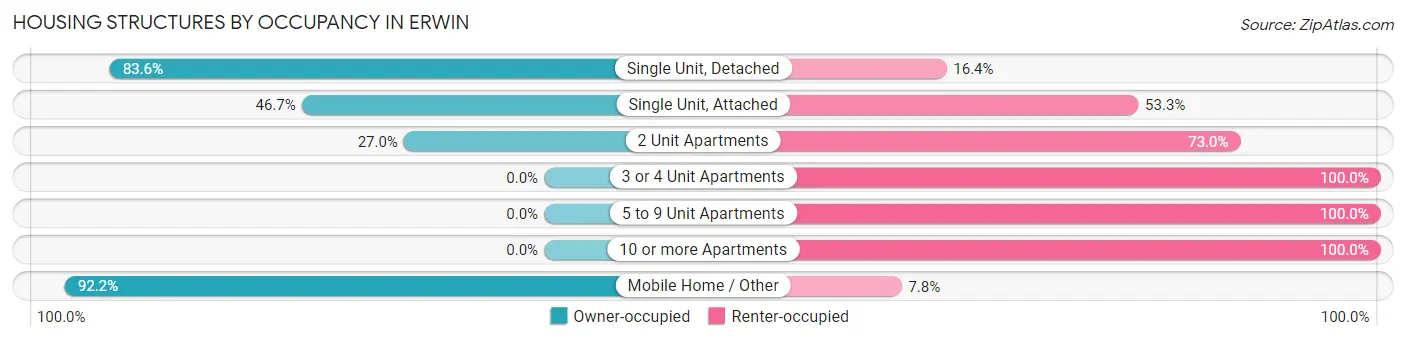
| Structure Type | Owner-occupied | Renter-occupied |
| Single Unit, Detached | 1,483 (83.6%) | 291 (16.4%) |
| Single Unit, Attached | 7 (46.7%) | 8 (53.3%) |
| 2 Unit Apartments | 37 (27.0%) | 100 (73.0%) |
| 3 or 4 Unit Apartments | 0 (0.0%) | 183 (100.0%) |
| 5 to 9 Unit Apartments | 0 (0.0%) | 233 (100.0%) |
| 10 or more Apartments | 0 (0.0%) | 42 (100.0%) |
| Mobile Home / Other | 202 (92.2%) | 17 (7.8%) |
| Total | 1,729 (66.4%) | 874 (33.6%) |
Housing Structures by Number of Rooms in Erwin
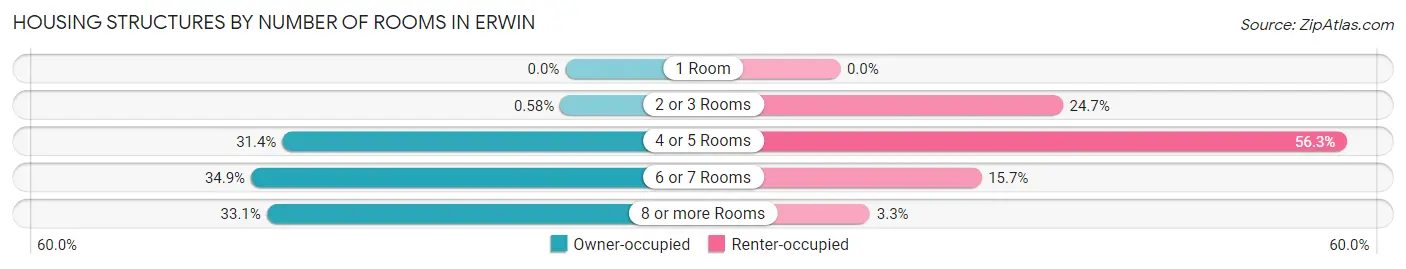
| Number of Rooms | Owner-occupied | Renter-occupied |
| 1 Room | 0 (0.0%) | 0 (0.0%) |
| 2 or 3 Rooms | 10 (0.6%) | 216 (24.7%) |
| 4 or 5 Rooms | 543 (31.4%) | 492 (56.3%) |
| 6 or 7 Rooms | 603 (34.9%) | 137 (15.7%) |
| 8 or more Rooms | 573 (33.1%) | 29 (3.3%) |
| Total | 1,729 (100.0%) | 874 (100.0%) |
Housing Structure by Heating Type in Erwin
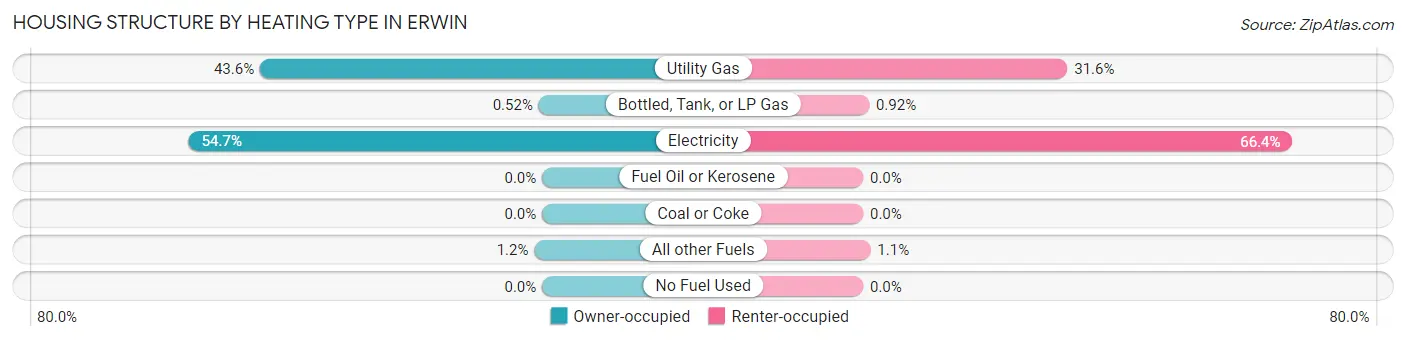
| Heating Type | Owner-occupied | Renter-occupied |
| Utility Gas | 754 (43.6%) | 276 (31.6%) |
| Bottled, Tank, or LP Gas | 9 (0.5%) | 8 (0.9%) |
| Electricity | 945 (54.7%) | 580 (66.4%) |
| Fuel Oil or Kerosene | 0 (0.0%) | 0 (0.0%) |
| Coal or Coke | 0 (0.0%) | 0 (0.0%) |
| All other Fuels | 21 (1.2%) | 10 (1.1%) |
| No Fuel Used | 0 (0.0%) | 0 (0.0%) |
| Total | 1,729 (100.0%) | 874 (100.0%) |
Household Vehicle Usage in Erwin
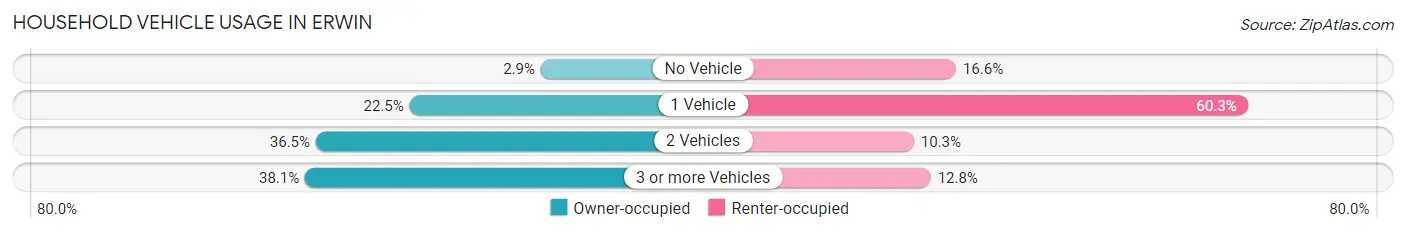
| Vehicles per Household | Owner-occupied | Renter-occupied |
| No Vehicle | 50 (2.9%) | 145 (16.6%) |
| 1 Vehicle | 389 (22.5%) | 527 (60.3%) |
| 2 Vehicles | 631 (36.5%) | 90 (10.3%) |
| 3 or more Vehicles | 659 (38.1%) | 112 (12.8%) |
| Total | 1,729 (100.0%) | 874 (100.0%) |
Real Estate & Mortgages in Erwin
Real Estate and Mortgage Overview in Erwin
| Characteristic | Without Mortgage | With Mortgage |
| Housing Units | 873 | 856 |
| Median Property Value | $133,100 | $173,900 |
| Median Household Income | $39,125 | $68 |
| Monthly Housing Costs | $413 | $0 |
| Real Estate Taxes | $1,094 | $29 |
Property Value by Mortgage Status in Erwin
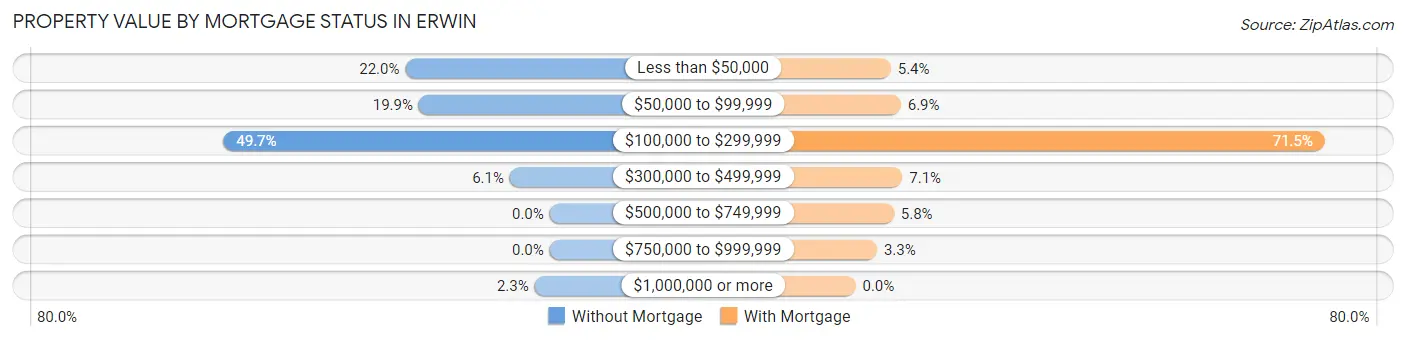
| Property Value | Without Mortgage | With Mortgage |
| Less than $50,000 | 192 (22.0%) | 46 (5.4%) |
| $50,000 to $99,999 | 174 (19.9%) | 59 (6.9%) |
| $100,000 to $299,999 | 434 (49.7%) | 612 (71.5%) |
| $300,000 to $499,999 | 53 (6.1%) | 61 (7.1%) |
| $500,000 to $749,999 | 0 (0.0%) | 50 (5.8%) |
| $750,000 to $999,999 | 0 (0.0%) | 28 (3.3%) |
| $1,000,000 or more | 20 (2.3%) | 0 (0.0%) |
| Total | 873 (100.0%) | 856 (100.0%) |
Household Income by Mortgage Status in Erwin
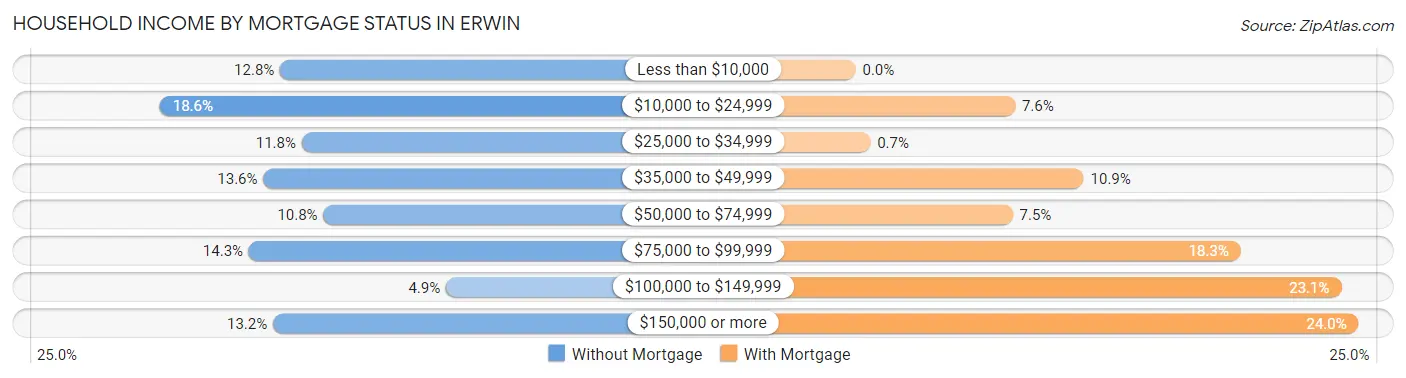
| Household Income | Without Mortgage | With Mortgage |
| Less than $10,000 | 112 (12.8%) | 0 (0.0%) |
| $10,000 to $24,999 | 162 (18.6%) | 65 (7.6%) |
| $25,000 to $34,999 | 103 (11.8%) | 6 (0.7%) |
| $35,000 to $49,999 | 119 (13.6%) | 93 (10.9%) |
| $50,000 to $74,999 | 94 (10.8%) | 64 (7.5%) |
| $75,000 to $99,999 | 125 (14.3%) | 157 (18.3%) |
| $100,000 to $149,999 | 43 (4.9%) | 198 (23.1%) |
| $150,000 or more | 115 (13.2%) | 205 (23.9%) |
| Total | 873 (100.0%) | 856 (100.0%) |
Property Value to Household Income Ratio in Erwin
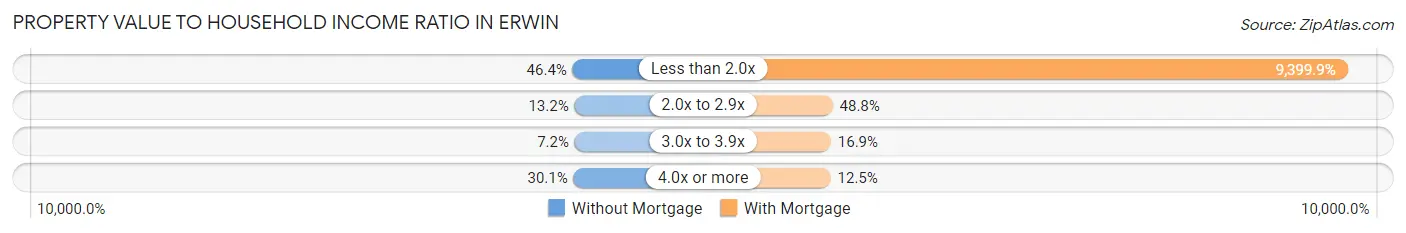
| Value-to-Income Ratio | Without Mortgage | With Mortgage |
| Less than 2.0x | 405 (46.4%) | 80,463 (9,399.9%) |
| 2.0x to 2.9x | 115 (13.2%) | 418 (48.8%) |
| 3.0x to 3.9x | 63 (7.2%) | 145 (16.9%) |
| 4.0x or more | 263 (30.1%) | 107 (12.5%) |
| Total | 873 (100.0%) | 856 (100.0%) |
Real Estate Taxes by Mortgage Status in Erwin
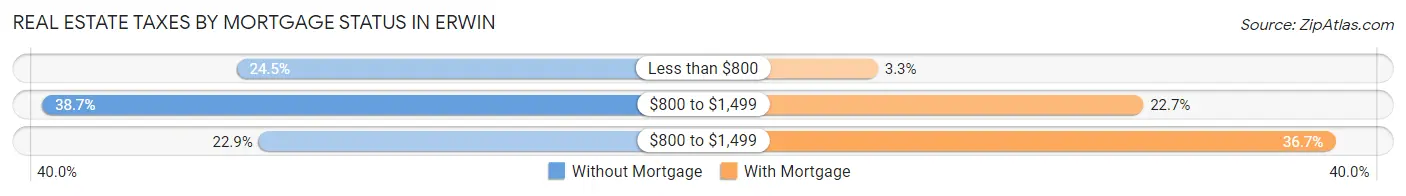
| Property Taxes | Without Mortgage | With Mortgage |
| Less than $800 | 214 (24.5%) | 28 (3.3%) |
| $800 to $1,499 | 338 (38.7%) | 194 (22.7%) |
| $800 to $1,499 | 200 (22.9%) | 314 (36.7%) |
| Total | 873 (100.0%) | 856 (100.0%) |
Health & Disability in Erwin
Health Insurance Coverage by Age in Erwin
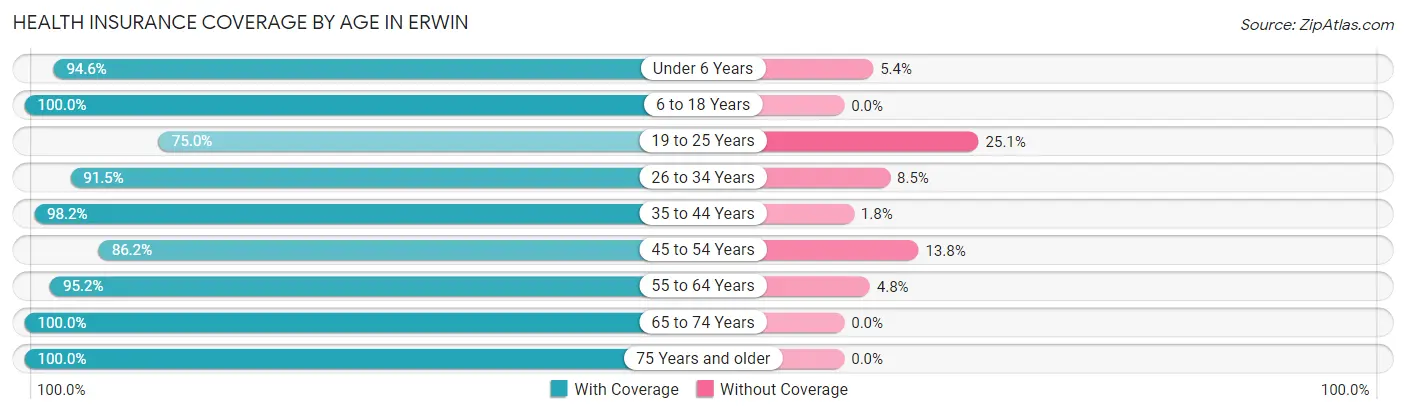
| Age Bracket | With Coverage | Without Coverage |
| Under 6 Years | 158 (94.6%) | 9 (5.4%) |
| 6 to 18 Years | 908 (100.0%) | 0 (0.0%) |
| 19 to 25 Years | 407 (75.0%) | 136 (25.1%) |
| 26 to 34 Years | 514 (91.5%) | 48 (8.5%) |
| 35 to 44 Years | 715 (98.2%) | 13 (1.8%) |
| 45 to 54 Years | 853 (86.2%) | 137 (13.8%) |
| 55 to 64 Years | 640 (95.2%) | 32 (4.8%) |
| 65 to 74 Years | 621 (100.0%) | 0 (0.0%) |
| 75 Years and older | 627 (100.0%) | 0 (0.0%) |
| Total | 5,443 (93.5%) | 375 (6.5%) |
Health Insurance Coverage by Citizenship Status in Erwin
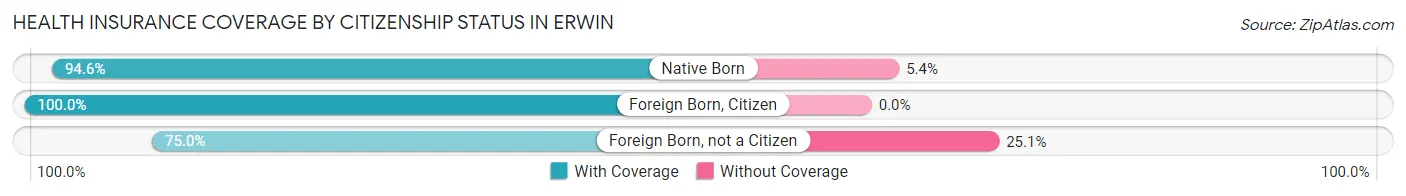
| Citizenship Status | With Coverage | Without Coverage |
| Native Born | 158 (94.6%) | 9 (5.4%) |
| Foreign Born, Citizen | 908 (100.0%) | 0 (0.0%) |
| Foreign Born, not a Citizen | 407 (75.0%) | 136 (25.1%) |
Health Insurance Coverage by Household Income in Erwin
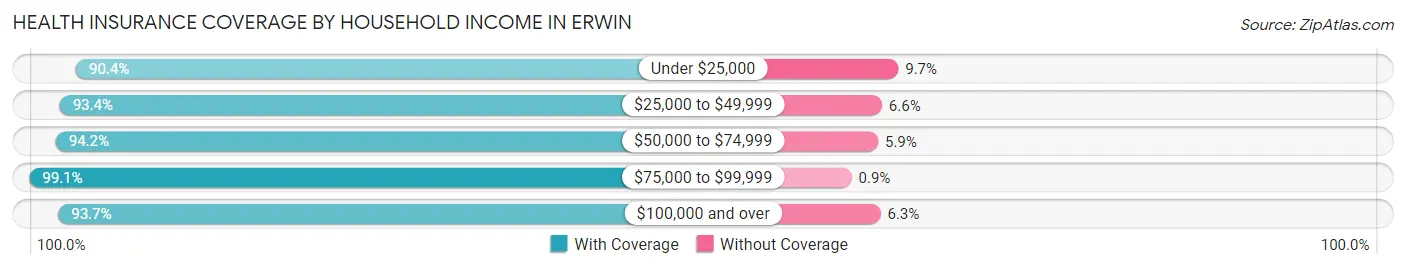
| Household Income | With Coverage | Without Coverage |
| Under $25,000 | 1,414 (90.3%) | 151 (9.7%) |
| $25,000 to $49,999 | 979 (93.4%) | 69 (6.6%) |
| $50,000 to $74,999 | 676 (94.2%) | 42 (5.9%) |
| $75,000 to $99,999 | 876 (99.1%) | 8 (0.9%) |
| $100,000 and over | 1,482 (93.7%) | 100 (6.3%) |
Public vs Private Health Insurance Coverage by Age in Erwin
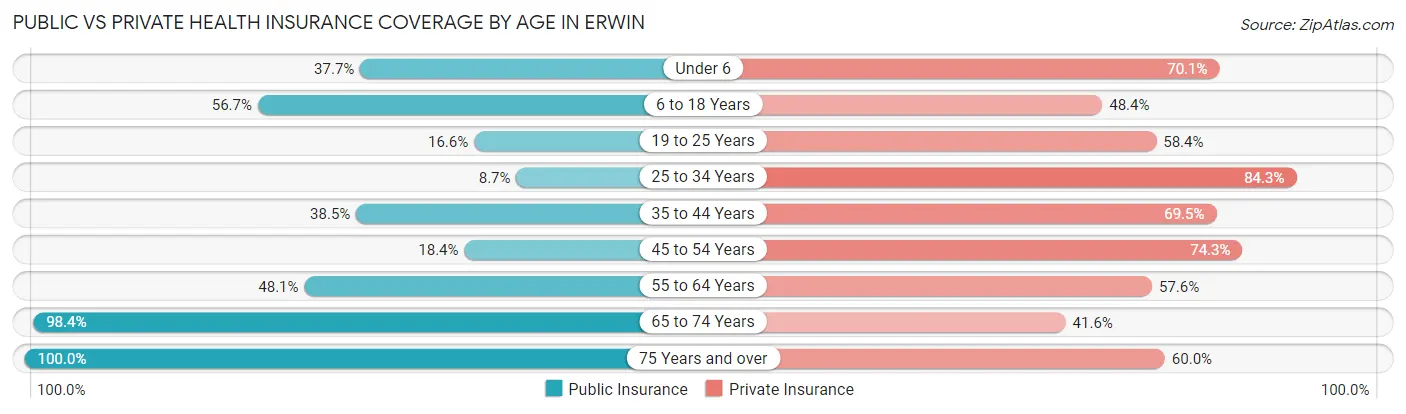
| Age Bracket | Public Insurance | Private Insurance |
| Under 6 | 63 (37.7%) | 117 (70.1%) |
| 6 to 18 Years | 515 (56.7%) | 439 (48.3%) |
| 19 to 25 Years | 90 (16.6%) | 317 (58.4%) |
| 25 to 34 Years | 49 (8.7%) | 474 (84.3%) |
| 35 to 44 Years | 280 (38.5%) | 506 (69.5%) |
| 45 to 54 Years | 182 (18.4%) | 736 (74.3%) |
| 55 to 64 Years | 323 (48.1%) | 387 (57.6%) |
| 65 to 74 Years | 611 (98.4%) | 258 (41.5%) |
| 75 Years and over | 627 (100.0%) | 376 (60.0%) |
| Total | 2,740 (47.1%) | 3,610 (62.1%) |
Disability Status by Sex by Age in Erwin
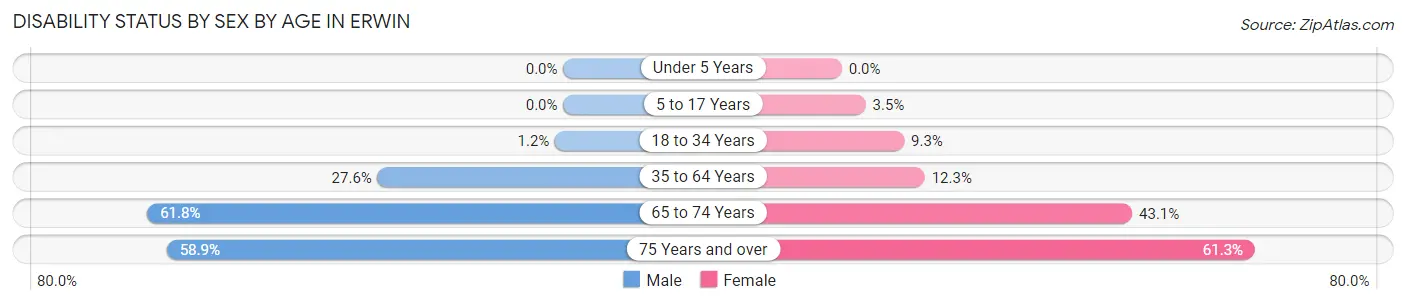
| Age Bracket | Male | Female |
| Under 5 Years | 0 (0.0%) | 0 (0.0%) |
| 5 to 17 Years | 0 (0.0%) | 14 (3.5%) |
| 18 to 34 Years | 8 (1.2%) | 47 (9.2%) |
| 35 to 64 Years | 303 (27.6%) | 159 (12.3%) |
| 65 to 74 Years | 173 (61.8%) | 147 (43.1%) |
| 75 Years and over | 159 (58.9%) | 219 (61.3%) |
Disability Class by Sex by Age in Erwin
Disability Class: Hearing Difficulty
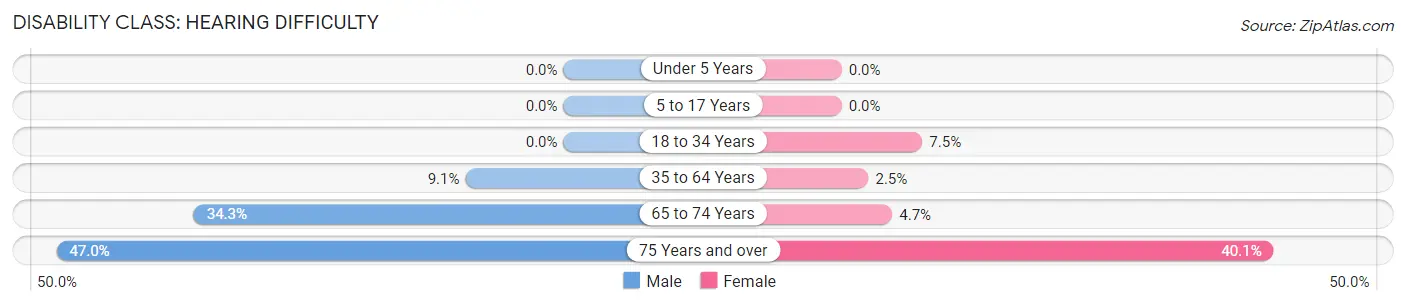
| Age Bracket | Male | Female |
| Under 5 Years | 0 (0.0%) | 0 (0.0%) |
| 5 to 17 Years | 0 (0.0%) | 0 (0.0%) |
| 18 to 34 Years | 0 (0.0%) | 38 (7.5%) |
| 35 to 64 Years | 100 (9.1%) | 32 (2.5%) |
| 65 to 74 Years | 96 (34.3%) | 16 (4.7%) |
| 75 Years and over | 127 (47.0%) | 143 (40.1%) |
Disability Class: Vision Difficulty
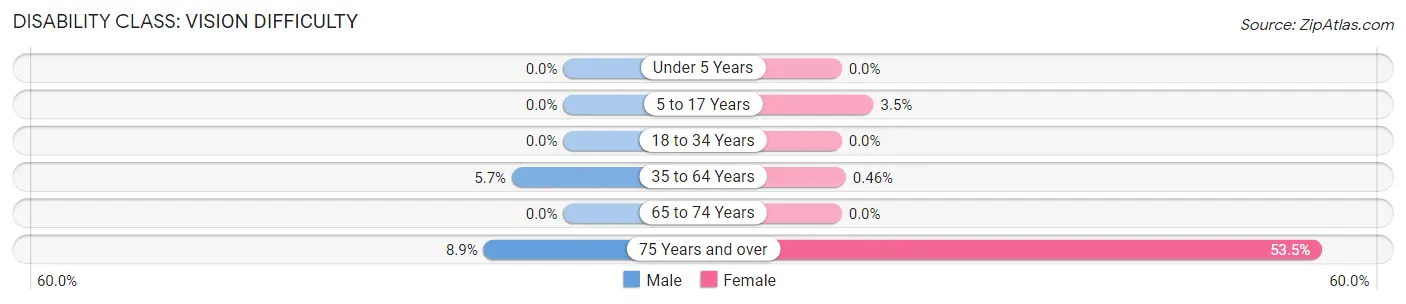
| Age Bracket | Male | Female |
| Under 5 Years | 0 (0.0%) | 0 (0.0%) |
| 5 to 17 Years | 0 (0.0%) | 14 (3.5%) |
| 18 to 34 Years | 0 (0.0%) | 0 (0.0%) |
| 35 to 64 Years | 63 (5.7%) | 6 (0.5%) |
| 65 to 74 Years | 0 (0.0%) | 0 (0.0%) |
| 75 Years and over | 24 (8.9%) | 191 (53.5%) |
Disability Class: Cognitive Difficulty
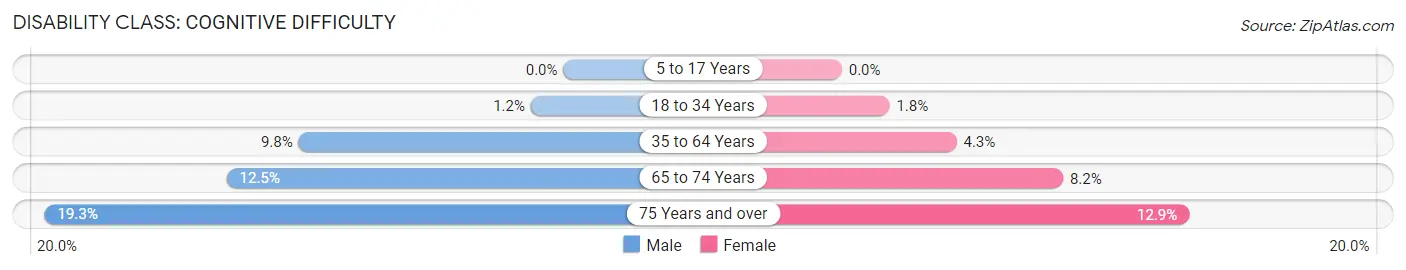
| Age Bracket | Male | Female |
| 5 to 17 Years | 0 (0.0%) | 0 (0.0%) |
| 18 to 34 Years | 8 (1.2%) | 9 (1.8%) |
| 35 to 64 Years | 108 (9.8%) | 55 (4.3%) |
| 65 to 74 Years | 35 (12.5%) | 28 (8.2%) |
| 75 Years and over | 52 (19.3%) | 46 (12.9%) |
Disability Class: Ambulatory Difficulty
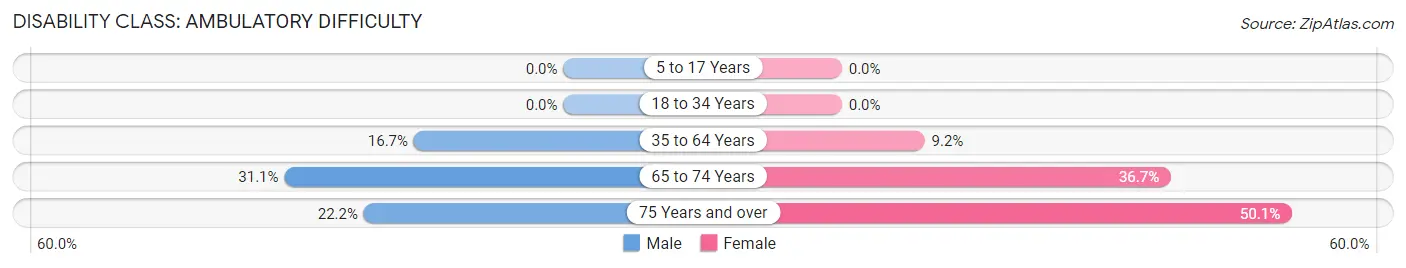
| Age Bracket | Male | Female |
| 5 to 17 Years | 0 (0.0%) | 0 (0.0%) |
| 18 to 34 Years | 0 (0.0%) | 0 (0.0%) |
| 35 to 64 Years | 183 (16.7%) | 119 (9.2%) |
| 65 to 74 Years | 87 (31.1%) | 125 (36.7%) |
| 75 Years and over | 60 (22.2%) | 179 (50.1%) |
Disability Class: Self-Care Difficulty
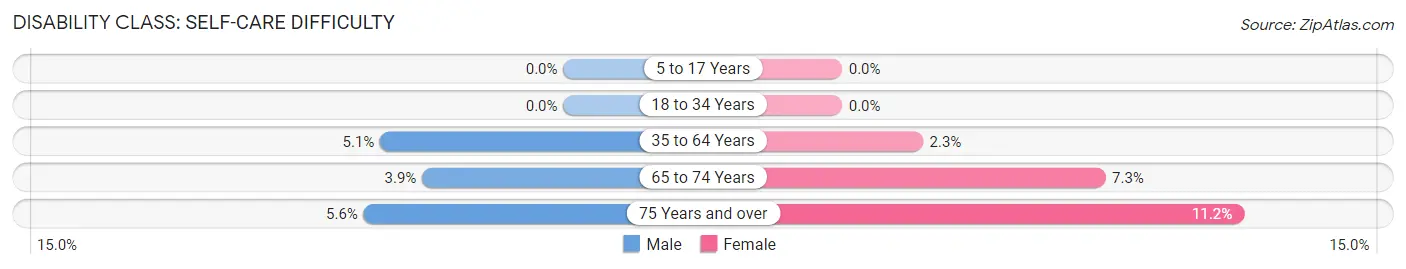
| Age Bracket | Male | Female |
| 5 to 17 Years | 0 (0.0%) | 0 (0.0%) |
| 18 to 34 Years | 0 (0.0%) | 0 (0.0%) |
| 35 to 64 Years | 56 (5.1%) | 29 (2.2%) |
| 65 to 74 Years | 11 (3.9%) | 25 (7.3%) |
| 75 Years and over | 15 (5.6%) | 40 (11.2%) |
Technology Access in Erwin
Computing Device Access in Erwin
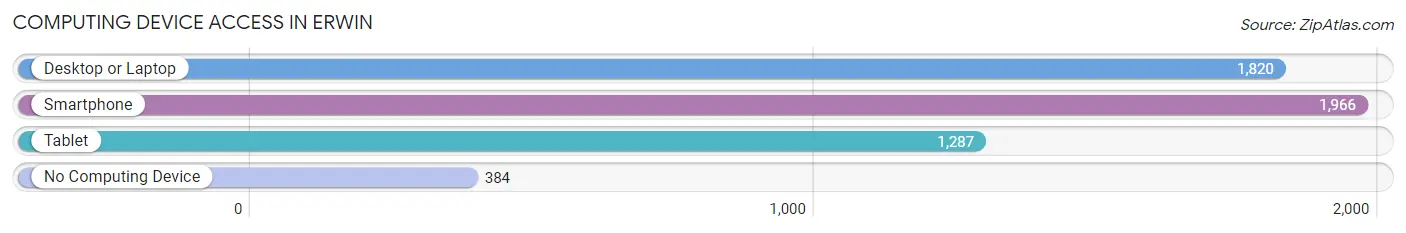
| Device Type | # Households | % Households |
| Desktop or Laptop | 1,820 | 69.9% |
| Smartphone | 1,966 | 75.5% |
| Tablet | 1,287 | 49.4% |
| No Computing Device | 384 | 14.7% |
| Total | 2,603 | 100.0% |
Internet Access in Erwin
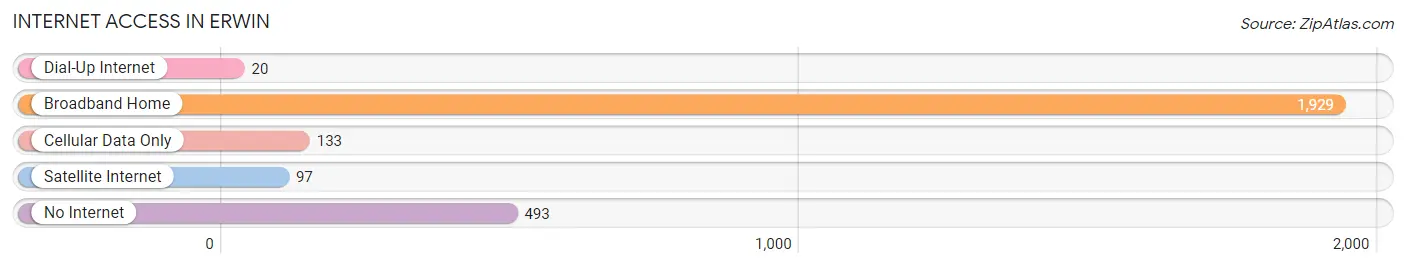
| Internet Type | # Households | % Households |
| Dial-Up Internet | 20 | 0.8% |
| Broadband Home | 1,929 | 74.1% |
| Cellular Data Only | 133 | 5.1% |
| Satellite Internet | 97 | 3.7% |
| No Internet | 493 | 18.9% |
| Total | 2,603 | 100.0% |
Erwin Summary
Erwin, Tennessee is a small town located in Unicoi County, in the northeastern corner of the state. It is situated in the foothills of the Appalachian Mountains, and is surrounded by the Cherokee National Forest. The town is home to a population of approximately 6,000 people, and is the county seat of Unicoi County.
History
Erwin was founded in 1876, and was named after Colonel William Erwin, a prominent local politician and businessman. The town was originally a small farming community, but it quickly grew into a bustling center of commerce and industry. The railroad arrived in 1881, and the town was incorporated in 1882.
In the early 1900s, Erwin became a major hub for the lumber industry. The town was home to several large sawmills, and the lumber industry provided jobs for many of the town’s residents. The town also became a center for the coal mining industry, and several coal mines were established in the area.
In the late 20th century, Erwin began to experience a decline in its economy. The lumber industry began to decline, and the coal mines began to close. The town’s population began to decline as well, and by the year 2000, the population had dropped to just over 6,000 people.
Geography
Erwin is located in the northeastern corner of Tennessee, in Unicoi County. The town is situated in the foothills of the Appalachian Mountains, and is surrounded by the Cherokee National Forest. The town is located along the Nolichucky River, and is approximately 25 miles from the North Carolina border.
The town has a total area of 4.2 square miles, and has an elevation of 1,845 feet. The climate in Erwin is humid subtropical, with hot, humid summers and mild winters. The average annual temperature is around 57 degrees Fahrenheit, and the average annual precipitation is around 45 inches.
Economy
Erwin’s economy is largely based on tourism and manufacturing. The town is home to several tourist attractions, including the Unicoi County Historical Museum, the Erwin Railroad Museum, and the Erwin National Fish Hatchery. The town is also home to several manufacturing companies, including a furniture factory, a plastics factory, and a paper mill.
The town is also home to several retail stores, restaurants, and other businesses. The town is served by the Erwin Municipal Airport, and is located along several major highways, including Interstate 26 and U.S. Route 23.
Demographics
As of the 2010 census, Erwin had a population of 6,072 people. The racial makeup of the town was 95.3% White, 1.2% African American, 0.3% Native American, 0.7% Asian, 0.1% Pacific Islander, 0.7% from other races, and 1.7% from two or more races. Hispanic or Latino of any race were 2.2% of the population.
The median household income in Erwin was $30,938, and the median family income was $37,813. The per capita income for the town was $17,845. About 17.2% of the population was below the poverty line.
Common Questions
What is Per Capita Income in Erwin?
Per Capita income in Erwin is $24,973.
What is the Median Family Income in Erwin?
Median Family Income in Erwin is $55,795.
What is the Median Household income in Erwin?
Median Household Income in Erwin is $40,670.
What is Income or Wage Gap in Erwin?
Income or Wage Gap in Erwin is 9.2%.
Women in Erwin earn 90.8 cents for every dollar earned by a man.
What is Inequality or Gini Index in Erwin?
Inequality or Gini Index in Erwin is 0.48.
What is the Total Population of Erwin?
Total Population of Erwin is 6,026.
What is the Total Male Population of Erwin?
Total Male Population of Erwin is 2,976.
What is the Total Female Population of Erwin?
Total Female Population of Erwin is 3,050.
What is the Ratio of Males per 100 Females in Erwin?
There are 97.57 Males per 100 Females in Erwin.
What is the Ratio of Females per 100 Males in Erwin?
There are 102.49 Females per 100 Males in Erwin.
What is the Median Population Age in Erwin?
Median Population Age in Erwin is 46.8 Years.
What is the Average Family Size in Erwin
Average Family Size in Erwin is 2.7 People.
What is the Average Household Size in Erwin
Average Household Size in Erwin is 2.2 People.
How Large is the Labor Force in Erwin?
There are 2,726 People in the Labor Forcein in Erwin.
What is the Percentage of People in the Labor Force in Erwin?
52.5% of People are in the Labor Force in Erwin.
What is the Unemployment Rate in Erwin?
Unemployment Rate in Erwin is 4.9%.