Englewood, TN Map & Demographics
Englewood Map
Englewood Overview
$21,042
PER CAPITA INCOME
$51,689
AVG FAMILY INCOME
$45,946
AVG HOUSEHOLD INCOME
26.8%
WAGE / INCOME GAP [ % ]
73.2¢/ $1
WAGE / INCOME GAP [ $ ]
$13,669
FAMILY INCOME DEFICIT
0.37
INEQUALITY / GINI INDEX
1,645
TOTAL POPULATION
692
MALE POPULATION
953
FEMALE POPULATION
72.61
MALES / 100 FEMALES
137.72
FEMALES / 100 MALES
40.3
MEDIAN AGE
2.9
AVG FAMILY SIZE
2.4
AVG HOUSEHOLD SIZE
683
LABOR FORCE [ PEOPLE ]
53.7%
PERCENT IN LABOR FORCE
14.5%
UNEMPLOYMENT RATE
Englewood Zip Codes
Englewood Area Codes
Income in Englewood
Income Overview in Englewood
Per Capita Income in Englewood is $21,042, while median incomes of families and households are $51,689 and $45,946 respectively.
| Characteristic | Number | Measure |
| Per Capita Income | 1,645 | $21,042 |
| Median Family Income | 490 | $51,689 |
| Mean Family Income | 490 | $61,303 |
| Median Household Income | 676 | $45,946 |
| Mean Household Income | 676 | $52,924 |
| Income Deficit | 490 | $13,669 |
| Wage / Income Gap (%) | 1,645 | 26.84% |
| Wage / Income Gap ($) | 1,645 | 73.16¢ per $1 |
| Gini / Inequality Index | 1,645 | 0.37 |
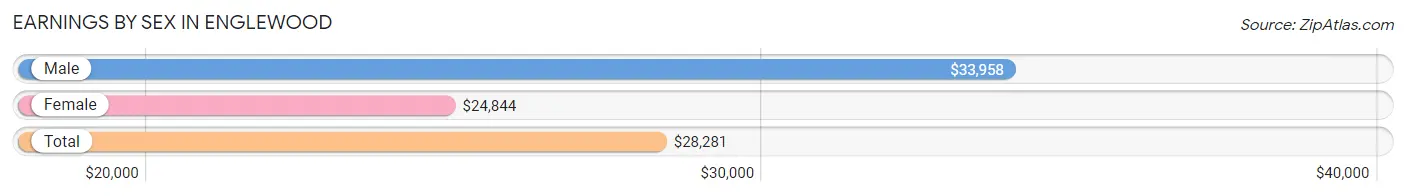
Earnings by Sex in Englewood
Average Earnings in Englewood are $28,281, $33,958 for men and $24,844 for women, a difference of 26.8%.
| Sex | Number | Average Earnings |
| Male | 340 (49.2%) | $33,958 |
| Female | 351 (50.8%) | $24,844 |
| Total | 691 (100.0%) | $28,281 |
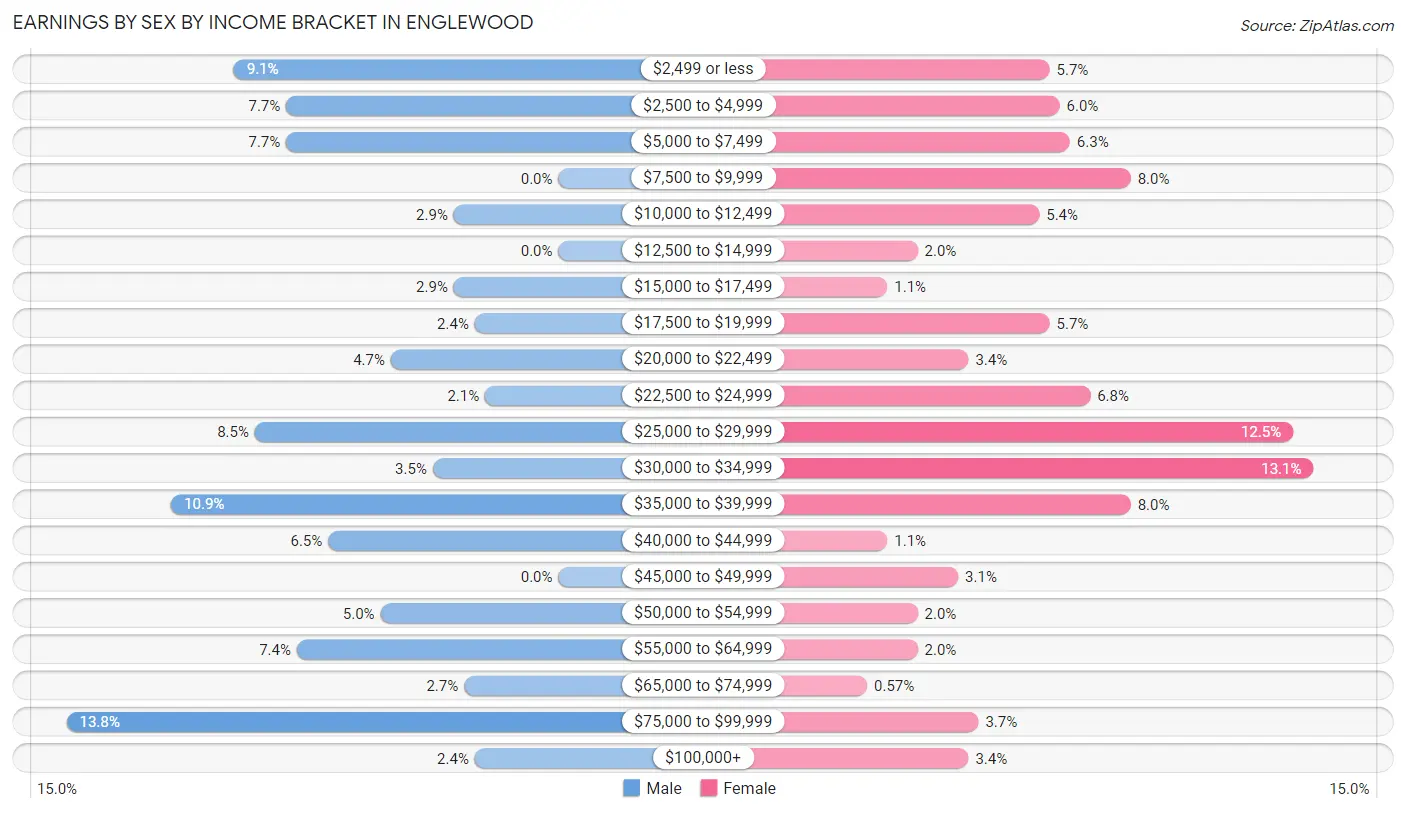
Earnings by Sex by Income Bracket in Englewood
The most common earnings brackets in Englewood are $75,000 to $99,999 for men (47 | 13.8%) and $30,000 to $34,999 for women (46 | 13.1%).
| Income | Male | Female |
| $2,499 or less | 31 (9.1%) | 20 (5.7%) |
| $2,500 to $4,999 | 26 (7.6%) | 21 (6.0%) |
| $5,000 to $7,499 | 26 (7.6%) | 22 (6.3%) |
| $7,500 to $9,999 | 0 (0.0%) | 28 (8.0%) |
| $10,000 to $12,499 | 10 (2.9%) | 19 (5.4%) |
| $12,500 to $14,999 | 0 (0.0%) | 7 (2.0%) |
| $15,000 to $17,499 | 10 (2.9%) | 4 (1.1%) |
| $17,500 to $19,999 | 8 (2.4%) | 20 (5.7%) |
| $20,000 to $22,499 | 16 (4.7%) | 12 (3.4%) |
| $22,500 to $24,999 | 7 (2.1%) | 24 (6.8%) |
| $25,000 to $29,999 | 29 (8.5%) | 44 (12.5%) |
| $30,000 to $34,999 | 12 (3.5%) | 46 (13.1%) |
| $35,000 to $39,999 | 37 (10.9%) | 28 (8.0%) |
| $40,000 to $44,999 | 22 (6.5%) | 4 (1.1%) |
| $45,000 to $49,999 | 0 (0.0%) | 11 (3.1%) |
| $50,000 to $54,999 | 17 (5.0%) | 7 (2.0%) |
| $55,000 to $64,999 | 25 (7.3%) | 7 (2.0%) |
| $65,000 to $74,999 | 9 (2.6%) | 2 (0.6%) |
| $75,000 to $99,999 | 47 (13.8%) | 13 (3.7%) |
| $100,000+ | 8 (2.4%) | 12 (3.4%) |
| Total | 340 (100.0%) | 351 (100.0%) |
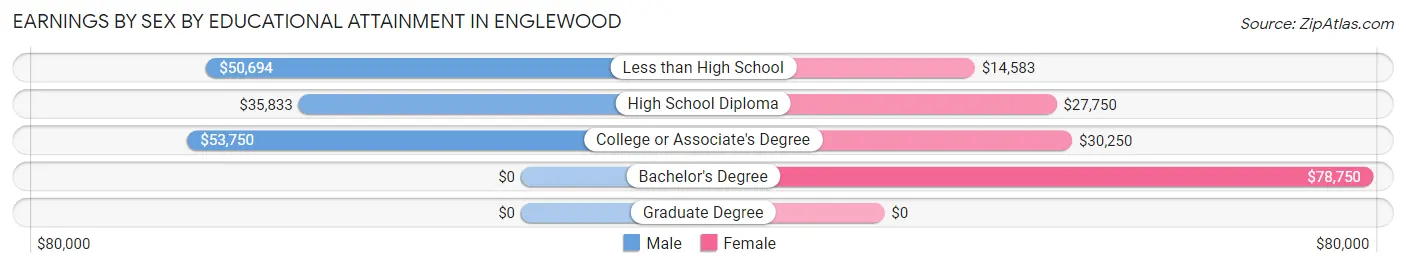
Earnings by Sex by Educational Attainment in Englewood
Average earnings in Englewood are $39,226 for men and $29,904 for women, a difference of 23.8%. Men with an educational attainment of college or associate's degree enjoy the highest average annual earnings of $53,750, while those with high school diploma education earn the least with $35,833. Women with an educational attainment of bachelor's degree earn the most with the average annual earnings of $78,750, while those with less than high school education have the smallest earnings of $14,583.
| Educational Attainment | Male Income | Female Income |
| Less than High School | $50,694 | $14,583 |
| High School Diploma | $35,833 | $27,750 |
| College or Associate's Degree | $53,750 | $30,250 |
| Bachelor's Degree | - | - |
| Graduate Degree | - | - |
| Total | $39,226 | $29,904 |
Family Income in Englewood
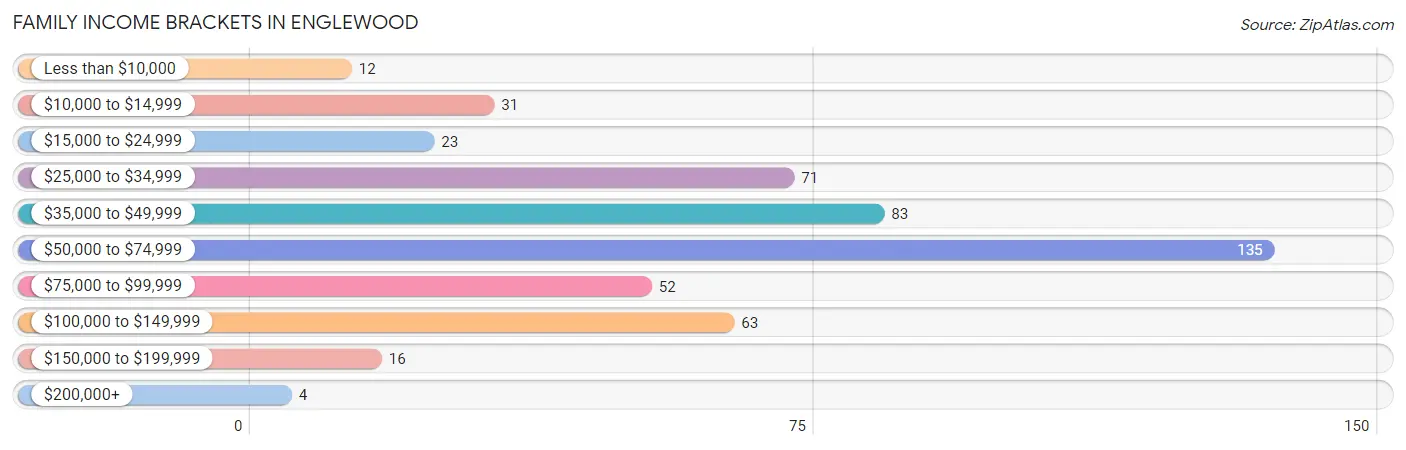
Family Income Brackets in Englewood
According to the Englewood family income data, there are 135 families falling into the $50,000 to $74,999 income range, which is the most common income bracket and makes up 27.6% of all families. Conversely, the $200,000+ income bracket is the least frequent group with only 4 families (0.8%) belonging to this category.
| Income Bracket | # Families | % Families |
| Less than $10,000 | 12 | 2.4% |
| $10,000 to $14,999 | 31 | 6.3% |
| $15,000 to $24,999 | 23 | 4.7% |
| $25,000 to $34,999 | 71 | 14.5% |
| $35,000 to $49,999 | 83 | 16.9% |
| $50,000 to $74,999 | 135 | 27.6% |
| $75,000 to $99,999 | 52 | 10.6% |
| $100,000 to $149,999 | 63 | 12.9% |
| $150,000 to $199,999 | 16 | 3.3% |
| $200,000+ | 4 | 0.8% |
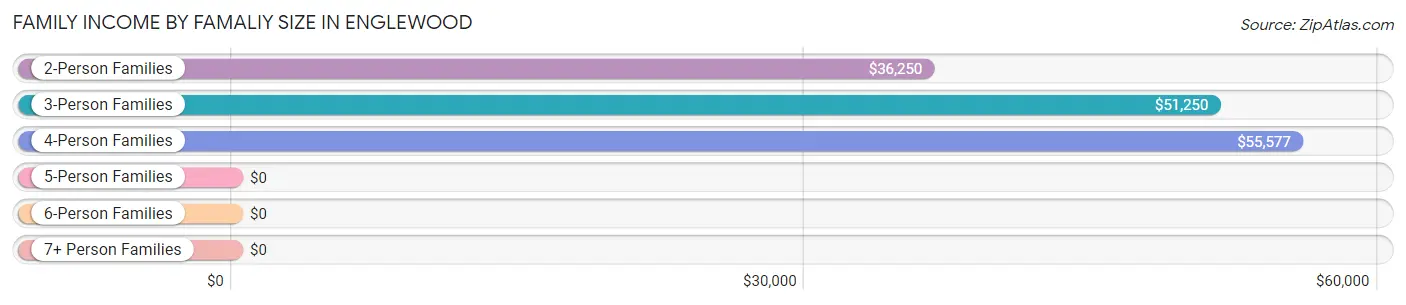
Family Income by Famaliy Size in Englewood
4-person families (84 | 17.1%) account for the highest median family income in Englewood with $55,577 per family, while 2-person families (210 | 42.9%) have the highest median income of $18,125 per family member.
| Income Bracket | # Families | Median Income |
| 2-Person Families | 210 (42.9%) | $36,250 |
| 3-Person Families | 163 (33.3%) | $51,250 |
| 4-Person Families | 84 (17.1%) | $55,577 |
| 5-Person Families | 21 (4.3%) | $0 |
| 6-Person Families | 3 (0.6%) | $0 |
| 7+ Person Families | 9 (1.8%) | $0 |
| Total | 490 (100.0%) | $51,689 |
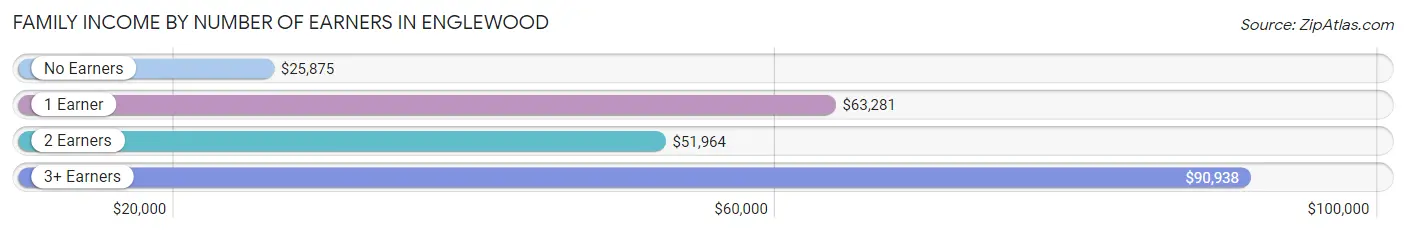
Family Income by Number of Earners in Englewood
The median family income in Englewood is $51,689, with families comprising 3+ earners (57) having the highest median family income of $90,938, while families with no earners (139) have the lowest median family income of $25,875, accounting for 11.6% and 28.4% of families, respectively.
| Number of Earners | # Families | Median Income |
| No Earners | 139 (28.4%) | $25,875 |
| 1 Earner | 163 (33.3%) | $63,281 |
| 2 Earners | 131 (26.7%) | $51,964 |
| 3+ Earners | 57 (11.6%) | $90,938 |
| Total | 490 (100.0%) | $51,689 |
Household Income in Englewood
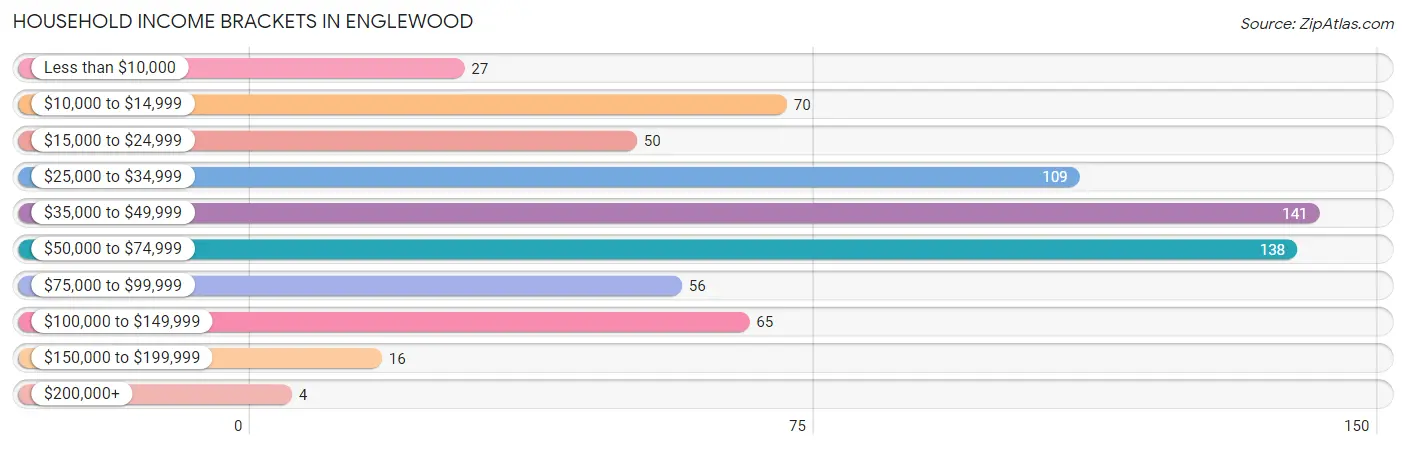
Household Income Brackets in Englewood
With 141 households falling in the category, the $35,000 to $49,999 income range is the most frequent in Englewood, accounting for 20.9% of all households. In contrast, only 4 households (0.6%) fall into the $200,000+ income bracket, making it the least populous group.
| Income Bracket | # Households | % Households |
| Less than $10,000 | 27 | 4.0% |
| $10,000 to $14,999 | 70 | 10.4% |
| $15,000 to $24,999 | 50 | 7.4% |
| $25,000 to $34,999 | 109 | 16.1% |
| $35,000 to $49,999 | 141 | 20.9% |
| $50,000 to $74,999 | 138 | 20.4% |
| $75,000 to $99,999 | 56 | 8.3% |
| $100,000 to $149,999 | 65 | 9.6% |
| $150,000 to $199,999 | 16 | 2.4% |
| $200,000+ | 4 | 0.6% |
Household Income by Householder Age in Englewood
The median household income in Englewood is $45,946, with the highest median household income of $55,625 found in the 25 to 44 years age bracket for the primary householder. A total of 147 households (21.7%) fall into this category. Meanwhile, the 65+ years age bracket for the primary householder has the lowest median household income of $33,438, with 260 households (38.5%) in this group.
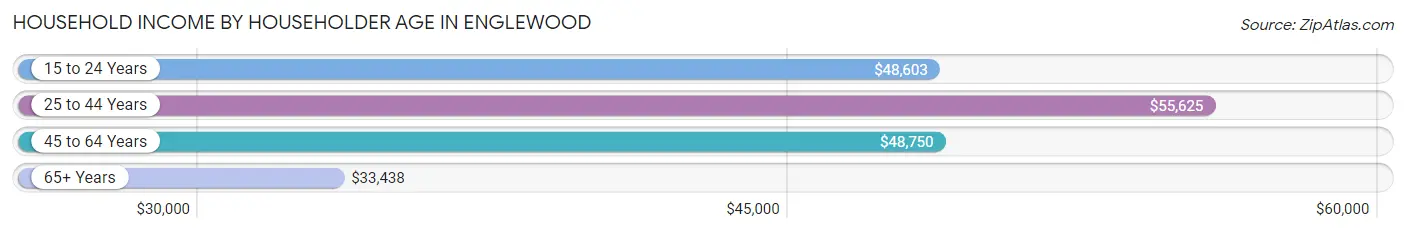
| Income Bracket | # Households | Median Income |
| 15 to 24 Years | 27 (4.0%) | $48,603 |
| 25 to 44 Years | 147 (21.7%) | $55,625 |
| 45 to 64 Years | 242 (35.8%) | $48,750 |
| 65+ Years | 260 (38.5%) | $33,438 |
| Total | 676 (100.0%) | $45,946 |
Poverty in Englewood
Income Below Poverty by Sex and Age in Englewood
With 13.4% poverty level for males and 20.3% for females among the residents of Englewood, 5 year old males and 5 year old females are the most vulnerable to poverty, with 8 males (100.0%) and 7 females (63.6%) in their respective age groups living below the poverty level.
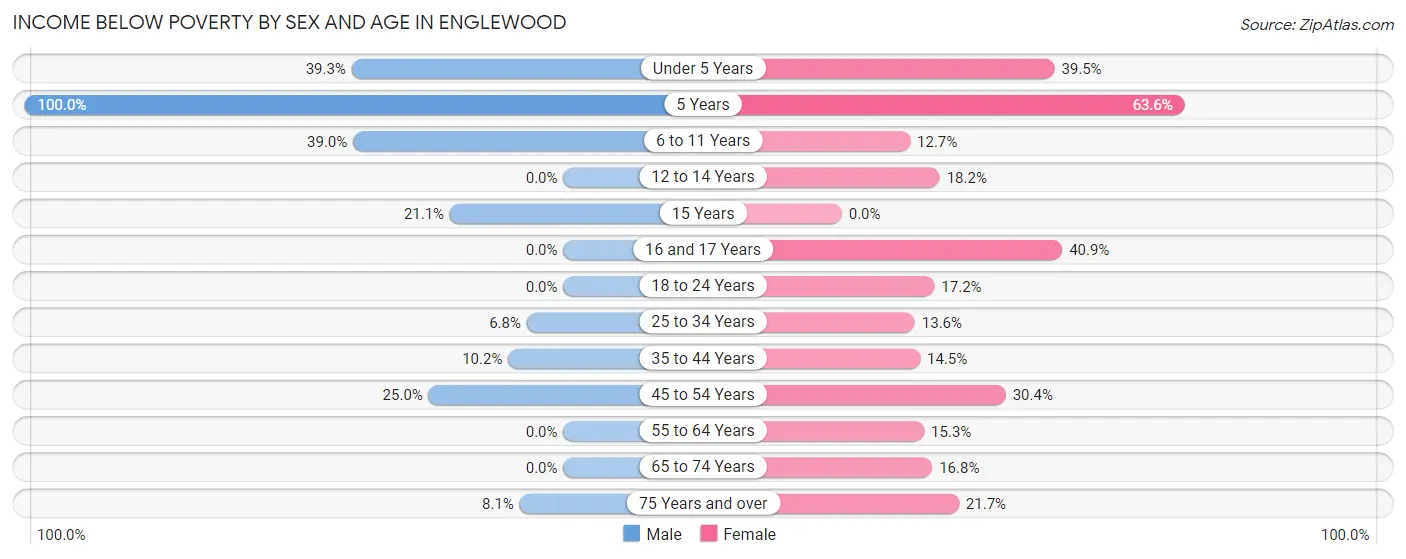
| Age Bracket | Male | Female |
| Under 5 Years | 22 (39.3%) | 15 (39.5%) |
| 5 Years | 8 (100.0%) | 7 (63.6%) |
| 6 to 11 Years | 16 (39.0%) | 9 (12.7%) |
| 12 to 14 Years | 0 (0.0%) | 8 (18.2%) |
| 15 Years | 4 (21.0%) | 0 (0.0%) |
| 16 and 17 Years | 0 (0.0%) | 18 (40.9%) |
| 18 to 24 Years | 0 (0.0%) | 11 (17.2%) |
| 25 to 34 Years | 4 (6.8%) | 8 (13.6%) |
| 35 to 44 Years | 9 (10.2%) | 18 (14.5%) |
| 45 to 54 Years | 25 (25.0%) | 42 (30.4%) |
| 55 to 64 Years | 0 (0.0%) | 13 (15.3%) |
| 65 to 74 Years | 0 (0.0%) | 23 (16.8%) |
| 75 Years and over | 3 (8.1%) | 20 (21.7%) |
| Total | 91 (13.4%) | 192 (20.3%) |
Income Above Poverty by Sex and Age in Englewood
According to the poverty statistics in Englewood, males aged 12 to 14 years and females aged 15 years are the age groups that are most secure financially, with 100.0% of males and 100.0% of females in these age groups living above the poverty line.
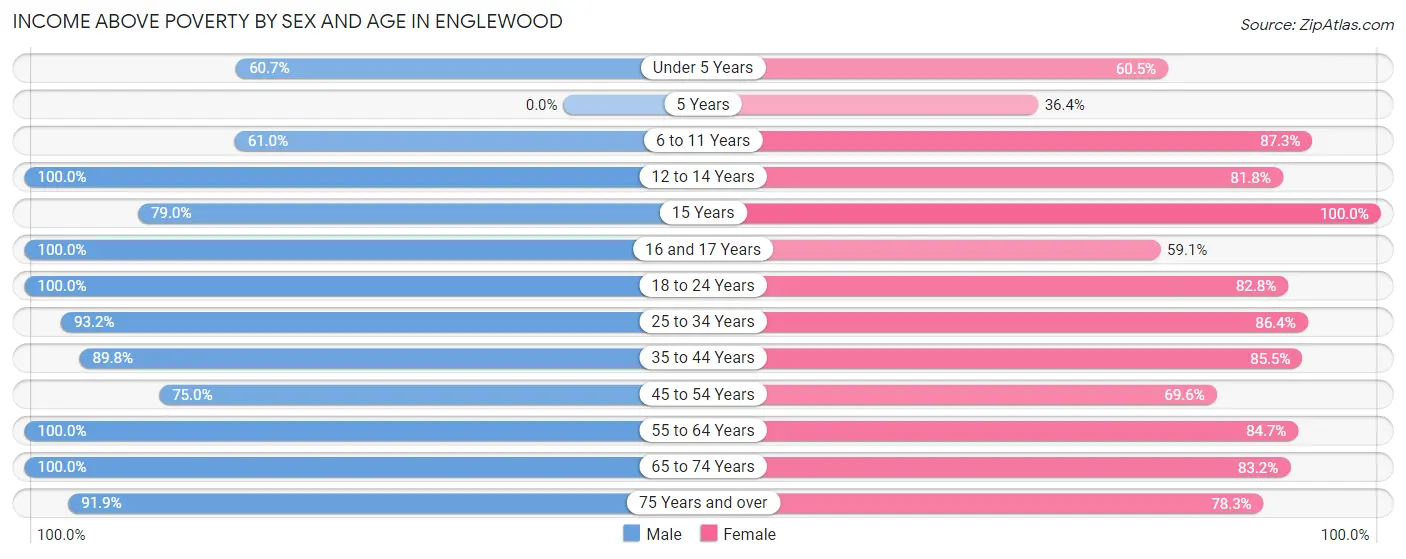
| Age Bracket | Male | Female |
| Under 5 Years | 34 (60.7%) | 23 (60.5%) |
| 5 Years | 0 (0.0%) | 4 (36.4%) |
| 6 to 11 Years | 25 (61.0%) | 62 (87.3%) |
| 12 to 14 Years | 25 (100.0%) | 36 (81.8%) |
| 15 Years | 15 (78.9%) | 39 (100.0%) |
| 16 and 17 Years | 26 (100.0%) | 26 (59.1%) |
| 18 to 24 Years | 65 (100.0%) | 53 (82.8%) |
| 25 to 34 Years | 55 (93.2%) | 51 (86.4%) |
| 35 to 44 Years | 79 (89.8%) | 106 (85.5%) |
| 45 to 54 Years | 75 (75.0%) | 96 (69.6%) |
| 55 to 64 Years | 80 (100.0%) | 72 (84.7%) |
| 65 to 74 Years | 74 (100.0%) | 114 (83.2%) |
| 75 Years and over | 34 (91.9%) | 72 (78.3%) |
| Total | 587 (86.6%) | 754 (79.7%) |
Income Below Poverty Among Married-Couple Families in Englewood
The poverty statistics for married-couple families in Englewood show that 9.9% or 34 of the total 342 families live below the poverty line. Families with 5 or more children have the highest poverty rate of 100.0%, comprising of 9 families. On the other hand, families with 1 or 2 children have the lowest poverty rate of 0.0%, which includes 0 families.
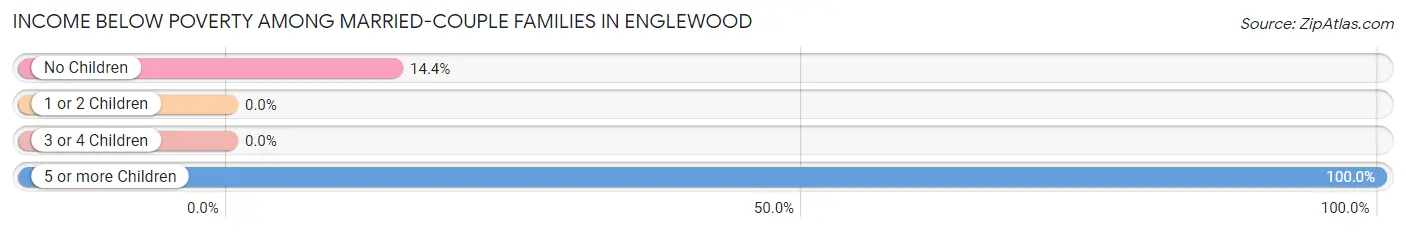
| Children | Above Poverty | Below Poverty |
| No Children | 149 (85.6%) | 25 (14.4%) |
| 1 or 2 Children | 156 (100.0%) | 0 (0.0%) |
| 3 or 4 Children | 3 (100.0%) | 0 (0.0%) |
| 5 or more Children | 0 (0.0%) | 9 (100.0%) |
| Total | 308 (90.1%) | 34 (9.9%) |
Income Below Poverty Among Single-Parent Households in Englewood
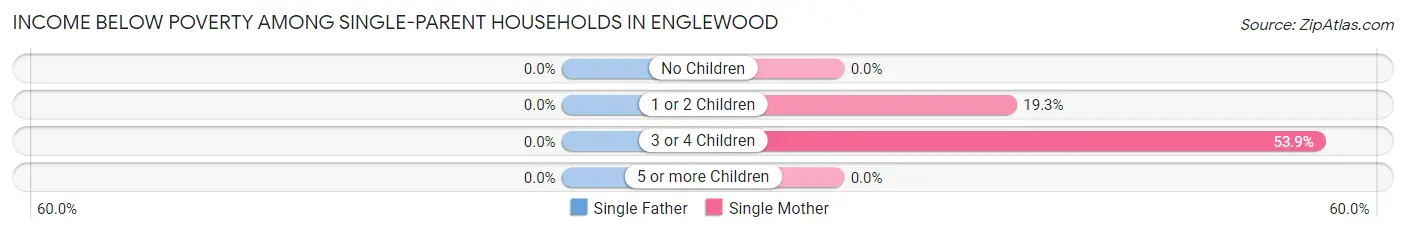
| Children | Single Father | Single Mother |
| No Children | 0 (0.0%) | 0 (0.0%) |
| 1 or 2 Children | 0 (0.0%) | 11 (19.3%) |
| 3 or 4 Children | 0 (0.0%) | 7 (53.8%) |
| 5 or more Children | 0 (0.0%) | 0 (0.0%) |
| Total | 0 (0.0%) | 18 (16.1%) |
Income Below Poverty Among Married-Couple vs Single-Parent Households in Englewood
The poverty data for Englewood shows that 34 of the married-couple family households (9.9%) and 18 of the single-parent households (12.2%) are living below the poverty level. Within the married-couple family households, those with 5 or more children have the highest poverty rate, with 9 households (100.0%) falling below the poverty line. Among the single-parent households, those with 3 or 4 children have the highest poverty rate, with 7 household (53.8%) living below poverty.
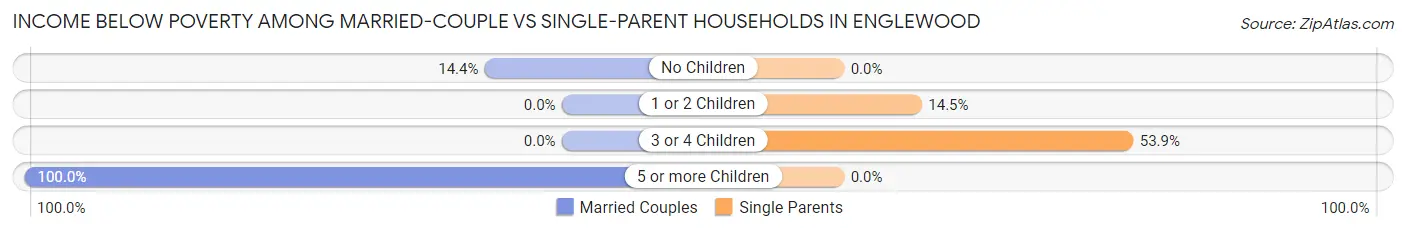
| Children | Married-Couple Families | Single-Parent Households |
| No Children | 25 (14.4%) | 0 (0.0%) |
| 1 or 2 Children | 0 (0.0%) | 11 (14.5%) |
| 3 or 4 Children | 0 (0.0%) | 7 (53.8%) |
| 5 or more Children | 9 (100.0%) | 0 (0.0%) |
| Total | 34 (9.9%) | 18 (12.2%) |
Race in Englewood
The most populous races in Englewood are White / Caucasian (1,482 | 90.1%), Two or more Races (133 | 8.1%), and Hispanic or Latino (27 | 1.6%).
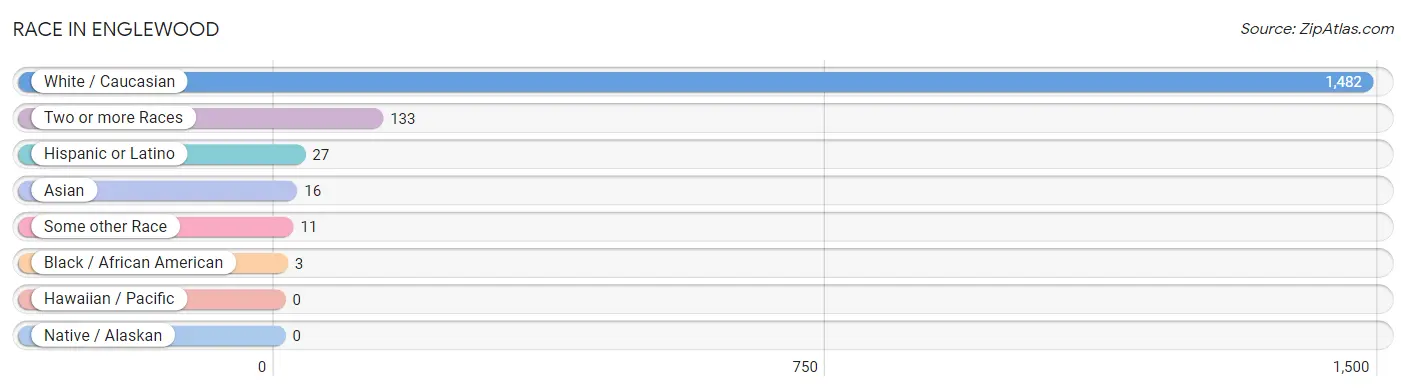
| Race | # Population | % Population |
| Asian | 16 | 1.0% |
| Black / African American | 3 | 0.2% |
| Hawaiian / Pacific | 0 | 0.0% |
| Hispanic or Latino | 27 | 1.6% |
| Native / Alaskan | 0 | 0.0% |
| White / Caucasian | 1,482 | 90.1% |
| Two or more Races | 133 | 8.1% |
| Some other Race | 11 | 0.7% |
| Total | 1,645 | 100.0% |
Ancestry in Englewood
The most populous ancestries reported in Englewood are Irish (327 | 19.9%), American (205 | 12.5%), English (175 | 10.6%), German (50 | 3.0%), and French (49 | 3.0%), together accounting for 49.0% of all Englewood residents.
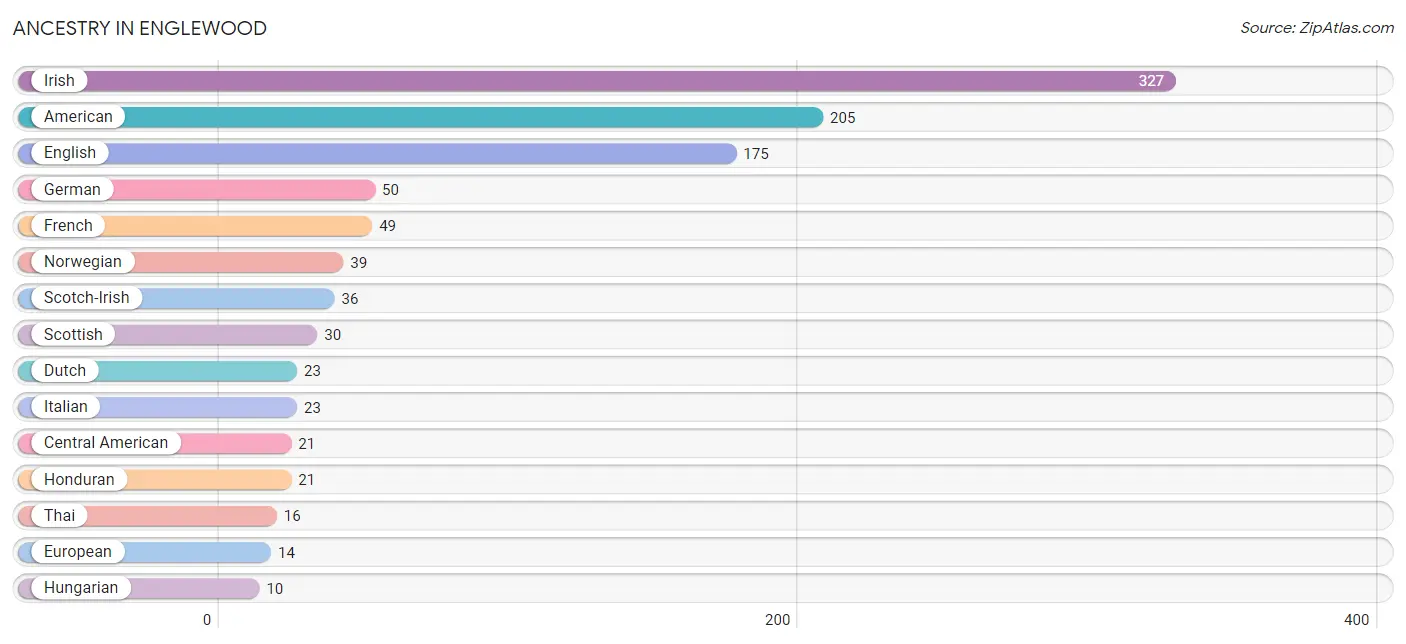
| Ancestry | # Population | % Population |
| American | 205 | 12.5% |
| Apache | 2 | 0.1% |
| British | 2 | 0.1% |
| Central American | 21 | 1.3% |
| Cherokee | 9 | 0.5% |
| Czechoslovakian | 2 | 0.1% |
| Dutch | 23 | 1.4% |
| Eastern European | 6 | 0.4% |
| English | 175 | 10.6% |
| European | 14 | 0.9% |
| French | 49 | 3.0% |
| French Canadian | 3 | 0.2% |
| German | 50 | 3.0% |
| Honduran | 21 | 1.3% |
| Hungarian | 10 | 0.6% |
| Irish | 327 | 19.9% |
| Italian | 23 | 1.4% |
| Mexican | 6 | 0.4% |
| Norwegian | 39 | 2.4% |
| Russian | 9 | 0.5% |
| Scandinavian | 6 | 0.4% |
| Scotch-Irish | 36 | 2.2% |
| Scottish | 30 | 1.8% |
| Thai | 16 | 1.0% | View All 24 Rows |
Immigrants in Englewood
The most numerous immigrant groups reported in Englewood came from Central America (14 | 0.9%), Honduras (14 | 0.9%), Latin America (14 | 0.9%), Asia (7 | 0.4%), and India (7 | 0.4%), together accounting for 3.4% of all Englewood residents.
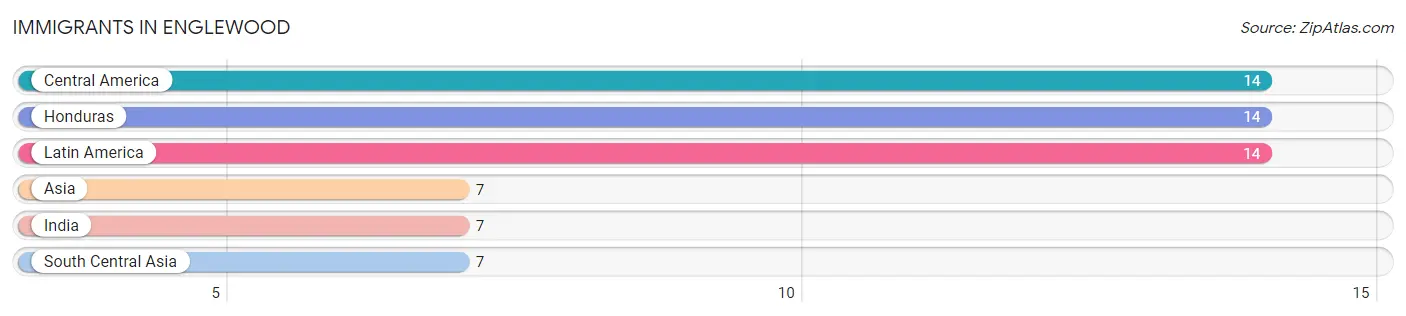
| Immigration Origin | # Population | % Population |
| Asia | 7 | 0.4% |
| Central America | 14 | 0.9% |
| Honduras | 14 | 0.9% |
| India | 7 | 0.4% |
| Latin America | 14 | 0.9% |
| South Central Asia | 7 | 0.4% | View All 6 Rows |
Sex and Age in Englewood
Sex and Age in Englewood
The most populous age groups in Englewood are 15 to 19 Years (74 | 10.7%) for men and 15 to 19 Years (99 | 10.4%) for women.
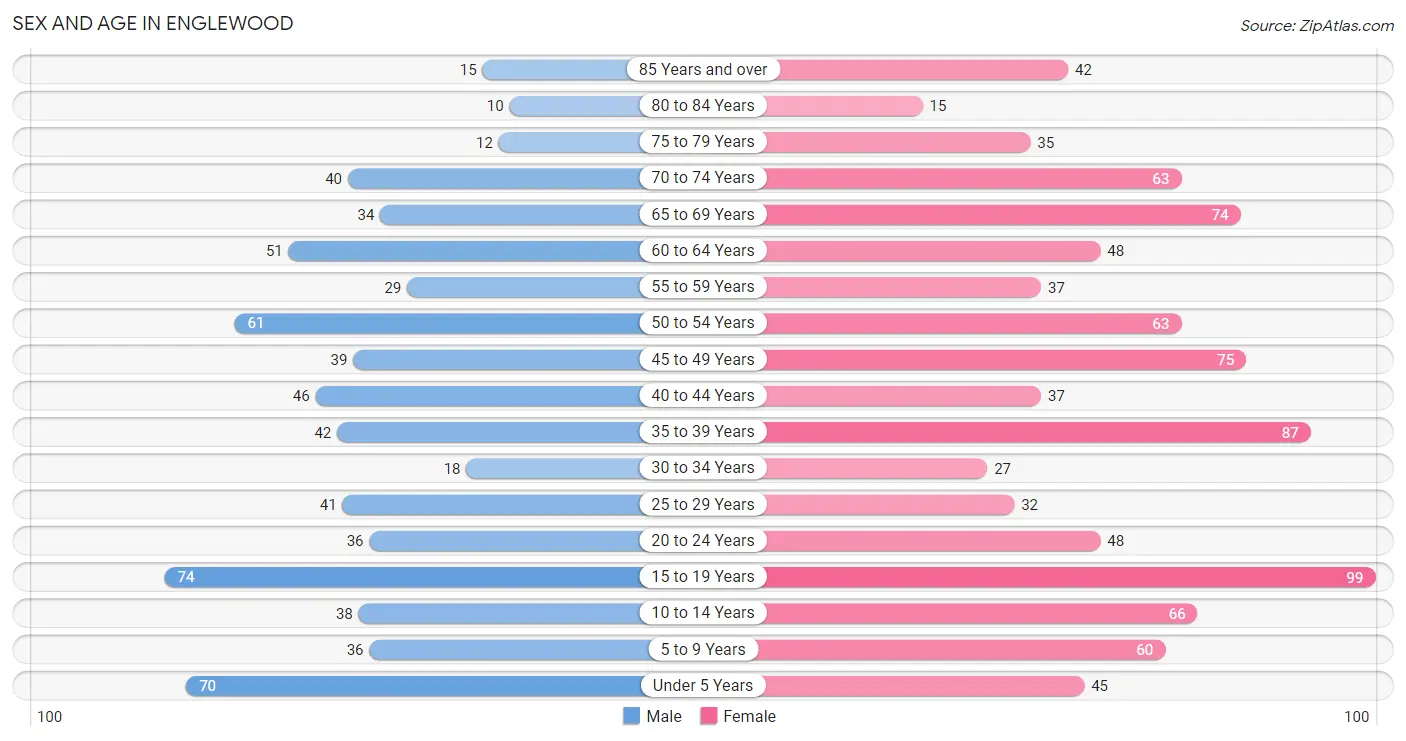
| Age Bracket | Male | Female |
| Under 5 Years | 70 (10.1%) | 45 (4.7%) |
| 5 to 9 Years | 36 (5.2%) | 60 (6.3%) |
| 10 to 14 Years | 38 (5.5%) | 66 (6.9%) |
| 15 to 19 Years | 74 (10.7%) | 99 (10.4%) |
| 20 to 24 Years | 36 (5.2%) | 48 (5.0%) |
| 25 to 29 Years | 41 (5.9%) | 32 (3.4%) |
| 30 to 34 Years | 18 (2.6%) | 27 (2.8%) |
| 35 to 39 Years | 42 (6.1%) | 87 (9.1%) |
| 40 to 44 Years | 46 (6.7%) | 37 (3.9%) |
| 45 to 49 Years | 39 (5.6%) | 75 (7.9%) |
| 50 to 54 Years | 61 (8.8%) | 63 (6.6%) |
| 55 to 59 Years | 29 (4.2%) | 37 (3.9%) |
| 60 to 64 Years | 51 (7.4%) | 48 (5.0%) |
| 65 to 69 Years | 34 (4.9%) | 74 (7.8%) |
| 70 to 74 Years | 40 (5.8%) | 63 (6.6%) |
| 75 to 79 Years | 12 (1.7%) | 35 (3.7%) |
| 80 to 84 Years | 10 (1.5%) | 15 (1.6%) |
| 85 Years and over | 15 (2.2%) | 42 (4.4%) |
| Total | 692 (100.0%) | 953 (100.0%) |
Families and Households in Englewood
Median Family Size in Englewood
The median family size in Englewood is 2.89 persons per family, with married-couple families (342 | 69.8%) accounting for the largest median family size of 2.97 persons per family. On the other hand, single male/father families (36 | 7.3%) represent the smallest median family size with 2.47 persons per family.
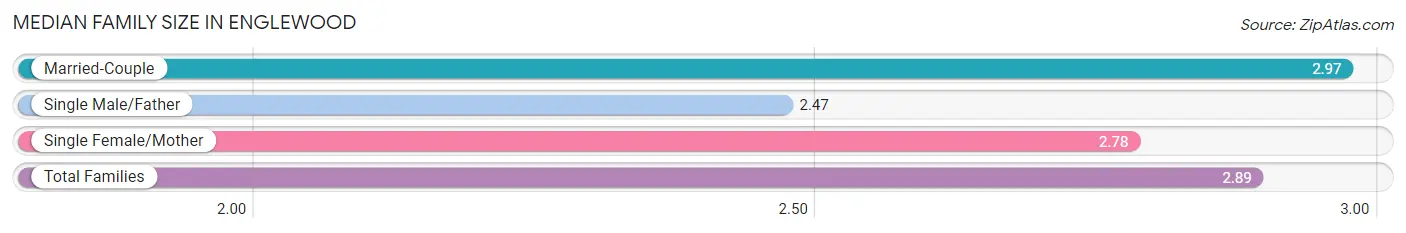
| Family Type | # Families | Family Size |
| Married-Couple | 342 (69.8%) | 2.97 |
| Single Male/Father | 36 (7.3%) | 2.47 |
| Single Female/Mother | 112 (22.9%) | 2.78 |
| Total Families | 490 (100.0%) | 2.89 |
Median Household Size in Englewood
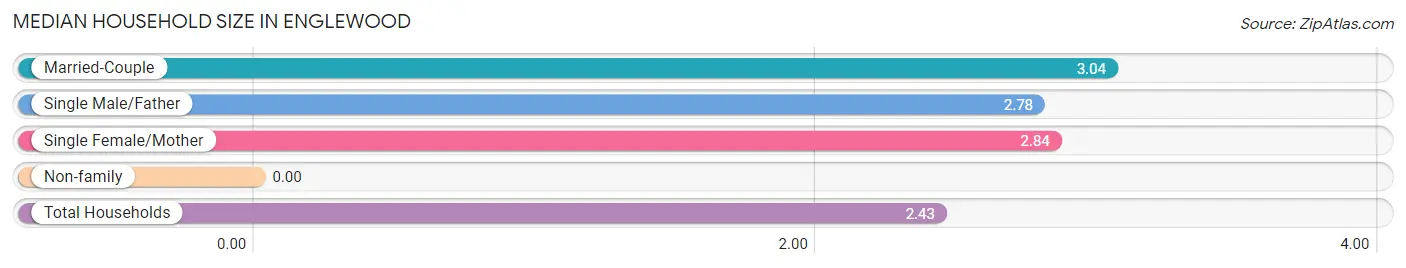
| Household Type | # Households | Household Size |
| Married-Couple | 342 (50.6%) | 3.04 |
| Single Male/Father | 36 (5.3%) | 2.78 |
| Single Female/Mother | 112 (16.6%) | 2.84 |
| Non-family | 186 (27.5%) | - |
| Total Households | 676 (100.0%) | 2.43 |
Household Size by Marriage Status in Englewood
Out of a total of 676 households in Englewood, 490 (72.5%) are family households, while 186 (27.5%) are nonfamily households. The most numerous type of family households are 2-person households, comprising 205, and the most common type of nonfamily households are 1-person households, comprising 186.
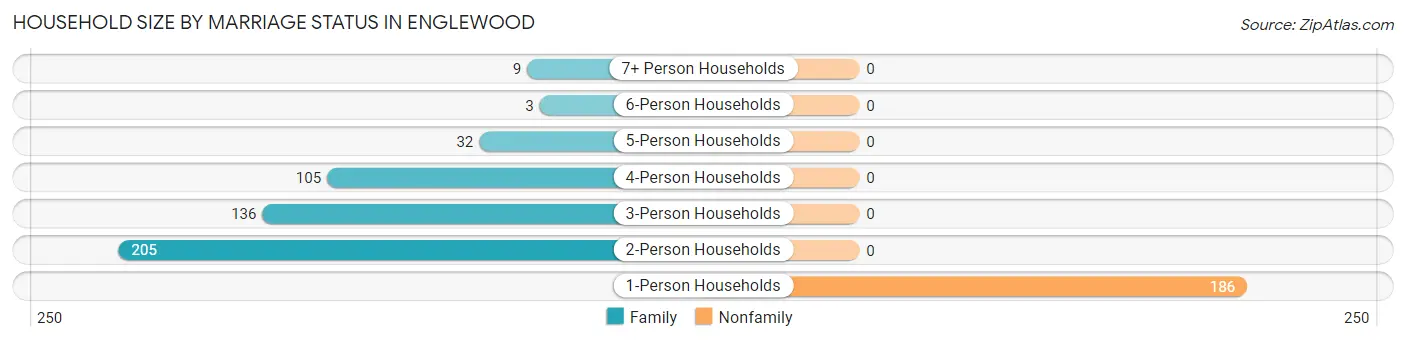
| Household Size | Family Households | Nonfamily Households |
| 1-Person Households | - | 186 (27.5%) |
| 2-Person Households | 205 (30.3%) | 0 (0.0%) |
| 3-Person Households | 136 (20.1%) | 0 (0.0%) |
| 4-Person Households | 105 (15.5%) | 0 (0.0%) |
| 5-Person Households | 32 (4.7%) | 0 (0.0%) |
| 6-Person Households | 3 (0.4%) | 0 (0.0%) |
| 7+ Person Households | 9 (1.3%) | 0 (0.0%) |
| Total | 490 (72.5%) | 186 (27.5%) |
Female Fertility in Englewood
Fertility by Age in Englewood
Average fertility rate in Englewood is 32.0 births per 1,000 women. Women in the age bracket of 35 to 50 years have the highest fertility rate with 48.0 births per 1,000 women. Women in the age bracket of 35 to 50 years acount for 78.6% of all women with births.
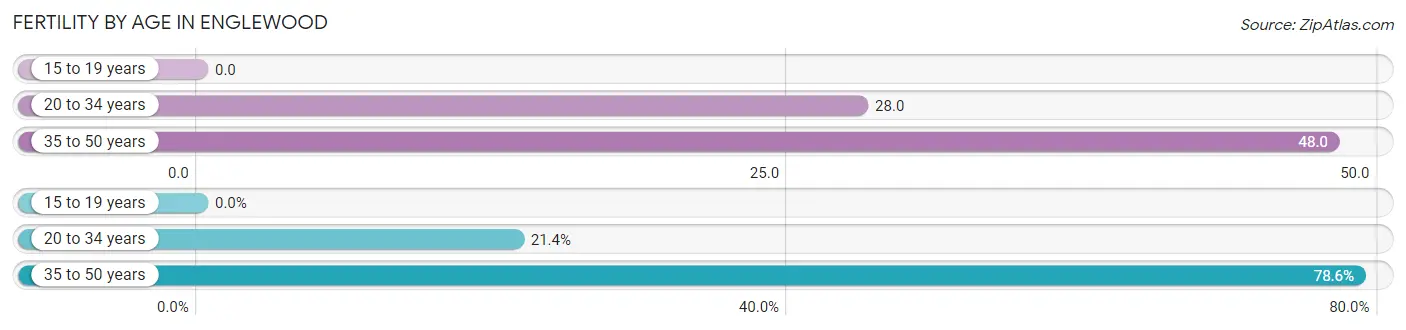
| Age Bracket | Women with Births | Births / 1,000 Women |
| 15 to 19 years | 0 (0.0%) | 0.0 |
| 20 to 34 years | 3 (21.4%) | 28.0 |
| 35 to 50 years | 11 (78.6%) | 48.0 |
| Total | 14 (100.0%) | 32.0 |
Fertility by Age by Marriage Status in Englewood
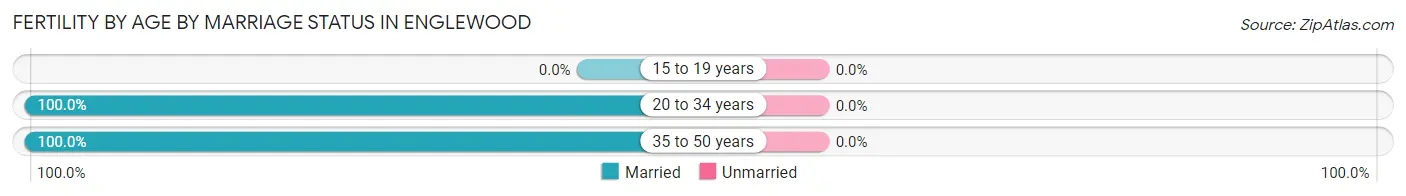
| Age Bracket | Married | Unmarried |
| 15 to 19 years | 0 (0.0%) | 0 (0.0%) |
| 20 to 34 years | 3 (100.0%) | 0 (0.0%) |
| 35 to 50 years | 11 (100.0%) | 0 (0.0%) |
| Total | 14 (100.0%) | 0 (0.0%) |
Fertility by Education in Englewood
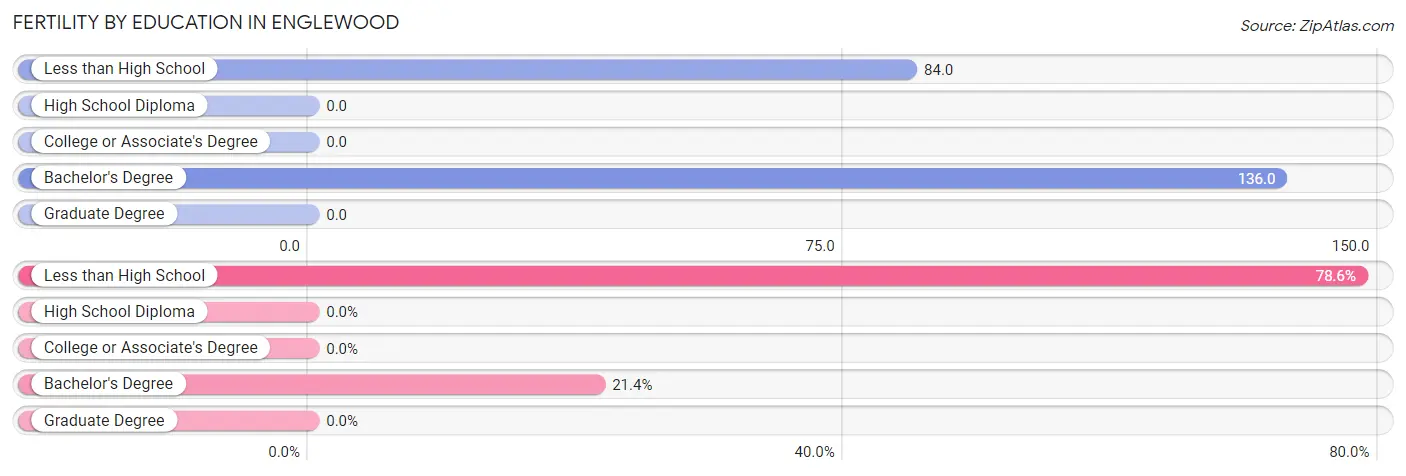
| Educational Attainment | Women with Births | Births / 1,000 Women |
| Less than High School | 11 (78.6%) | 84.0 |
| High School Diploma | 0 (0.0%) | 0.0 |
| College or Associate's Degree | 0 (0.0%) | 0.0 |
| Bachelor's Degree | 3 (21.4%) | 136.0 |
| Graduate Degree | 0 (0.0%) | 0.0 |
| Total | 14 (100.0%) | 32.0 |
Fertility by Education by Marriage Status in Englewood
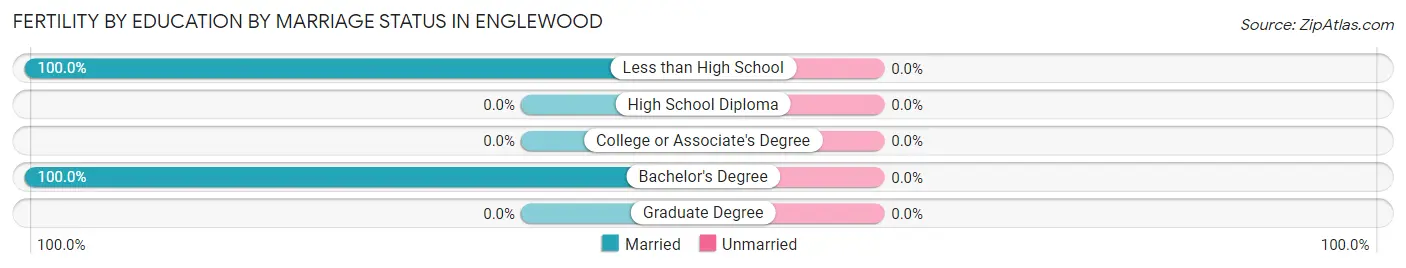
| Educational Attainment | Married | Unmarried |
| Less than High School | 11 (100.0%) | 0 (0.0%) |
| High School Diploma | 0 (0.0%) | 0 (0.0%) |
| College or Associate's Degree | 0 (0.0%) | 0 (0.0%) |
| Bachelor's Degree | 3 (100.0%) | 0 (0.0%) |
| Graduate Degree | 0 (0.0%) | 0 (0.0%) |
| Total | 14 (100.0%) | 0 (0.0%) |
Employment Characteristics in Englewood
Employment by Class of Employer in Englewood
Among the 571 employed individuals in Englewood, private company employees (446 | 78.1%), local government employees (46 | 8.1%), and federal government employees (23 | 4.0%) make up the most common classes of employment.
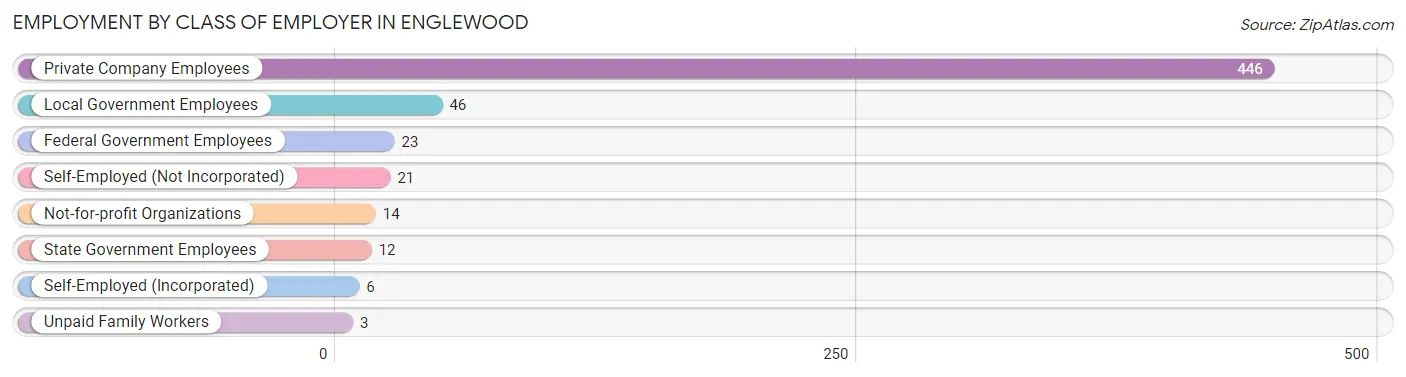
| Employer Class | # Employees | % Employees |
| Private Company Employees | 446 | 78.1% |
| Self-Employed (Incorporated) | 6 | 1.1% |
| Self-Employed (Not Incorporated) | 21 | 3.7% |
| Not-for-profit Organizations | 14 | 2.5% |
| Local Government Employees | 46 | 8.1% |
| State Government Employees | 12 | 2.1% |
| Federal Government Employees | 23 | 4.0% |
| Unpaid Family Workers | 3 | 0.5% |
| Total | 571 | 100.0% |
Employment Status by Age in Englewood
According to the labor force statistics for Englewood, out of the total population over 16 years of age (1,272), 53.7% or 683 individuals are in the labor force, with 14.5% or 99 of them unemployed. The age group with the highest labor force participation rate is 20 to 24 years, with 92.9% or 78 individuals in the labor force. Within the labor force, the 25 to 29 years age range has the highest percentage of unemployed individuals, with 48.1% or 25 of them being unemployed.
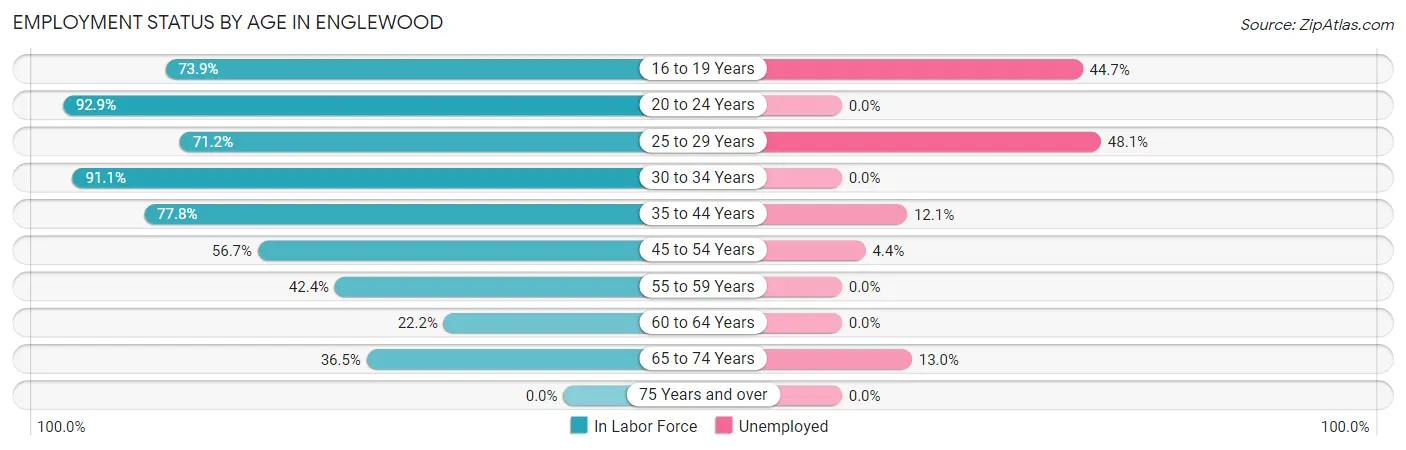
| Age Bracket | In Labor Force | Unemployed |
| 16 to 19 Years | 85 (73.9%) | 38 (44.7%) |
| 20 to 24 Years | 78 (92.9%) | 0 (0.0%) |
| 25 to 29 Years | 52 (71.2%) | 25 (48.1%) |
| 30 to 34 Years | 41 (91.1%) | 0 (0.0%) |
| 35 to 44 Years | 165 (77.8%) | 20 (12.1%) |
| 45 to 54 Years | 135 (56.7%) | 6 (4.4%) |
| 55 to 59 Years | 28 (42.4%) | 0 (0.0%) |
| 60 to 64 Years | 22 (22.2%) | 0 (0.0%) |
| 65 to 74 Years | 77 (36.5%) | 10 (13.0%) |
| 75 Years and over | 0 (0.0%) | 0 (0.0%) |
| Total | 683 (53.7%) | 99 (14.5%) |
Employment Status by Educational Attainment in Englewood
According to labor force statistics for Englewood, 60.4% of individuals (443) out of the total population between 25 and 64 years of age (733) are in the labor force, with 11.5% or 51 of them being unemployed. The group with the highest labor force participation rate are those with the educational attainment of bachelor's degree or higher, with 86.0% or 37 individuals in the labor force. Within the labor force, individuals with less than high school education have the highest percentage of unemployment, with 25.5% or 14 of them being unemployed.
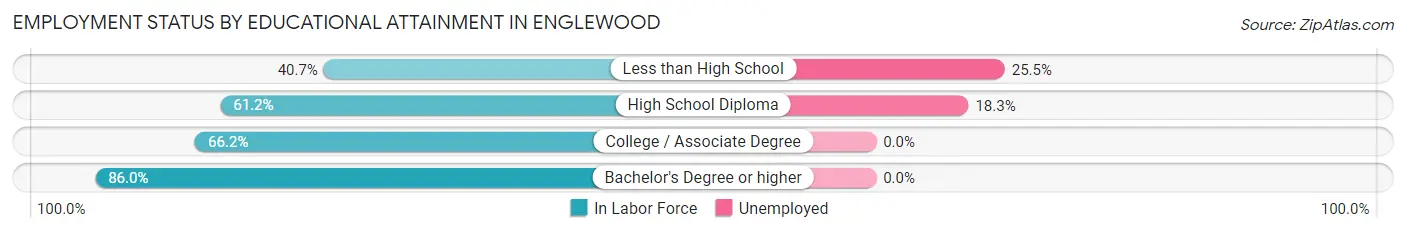
| Educational Attainment | In Labor Force | Unemployed |
| Less than High School | 55 (40.7%) | 34 (25.5%) |
| High School Diploma | 202 (61.2%) | 60 (18.3%) |
| College / Associate Degree | 149 (66.2%) | 0 (0.0%) |
| Bachelor's Degree or higher | 37 (86.0%) | 0 (0.0%) |
| Total | 443 (60.4%) | 84 (11.5%) |
Employment Occupations by Sex in Englewood
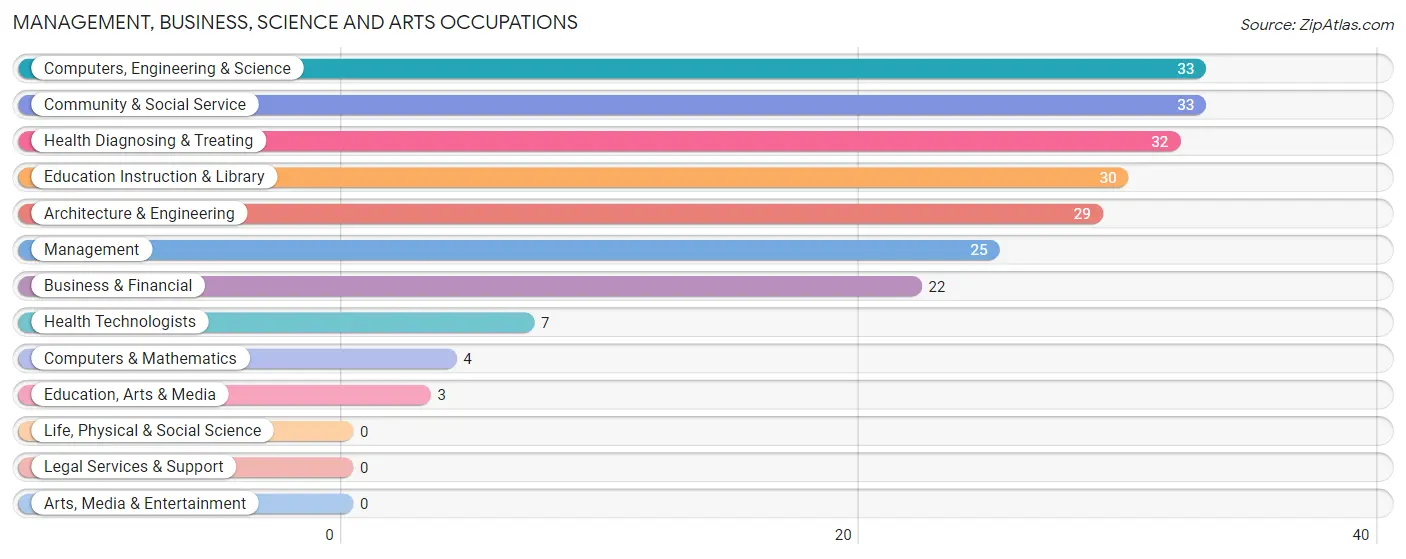
Management, Business, Science and Arts Occupations
The most common Management, Business, Science and Arts occupations in Englewood are Computers, Engineering & Science (33 | 5.7%), Community & Social Service (33 | 5.7%), Health Diagnosing & Treating (32 | 5.5%), Education Instruction & Library (30 | 5.1%), and Architecture & Engineering (29 | 5.0%).
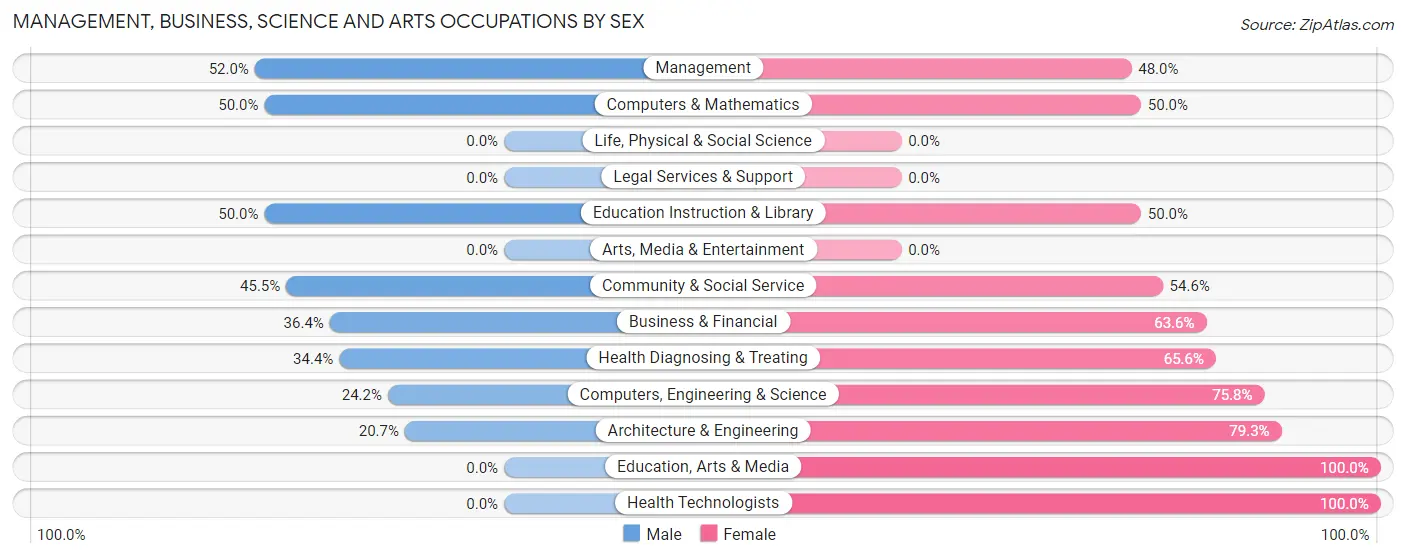
Management, Business, Science and Arts Occupations by Sex
Within the Management, Business, Science and Arts occupations in Englewood, the most male-oriented occupations are Management (52.0%), Computers & Mathematics (50.0%), and Education Instruction & Library (50.0%), while the most female-oriented occupations are Education, Arts & Media (100.0%), Health Technologists (100.0%), and Architecture & Engineering (79.3%).
| Occupation | Male | Female |
| Management | 13 (52.0%) | 12 (48.0%) |
| Business & Financial | 8 (36.4%) | 14 (63.6%) |
| Computers, Engineering & Science | 8 (24.2%) | 25 (75.8%) |
| Computers & Mathematics | 2 (50.0%) | 2 (50.0%) |
| Architecture & Engineering | 6 (20.7%) | 23 (79.3%) |
| Life, Physical & Social Science | 0 (0.0%) | 0 (0.0%) |
| Community & Social Service | 15 (45.5%) | 18 (54.5%) |
| Education, Arts & Media | 0 (0.0%) | 3 (100.0%) |
| Legal Services & Support | 0 (0.0%) | 0 (0.0%) |
| Education Instruction & Library | 15 (50.0%) | 15 (50.0%) |
| Arts, Media & Entertainment | 0 (0.0%) | 0 (0.0%) |
| Health Diagnosing & Treating | 11 (34.4%) | 21 (65.6%) |
| Health Technologists | 0 (0.0%) | 7 (100.0%) |
| Total (Category) | 55 (37.9%) | 90 (62.1%) |
| Total (Overall) | 268 (45.9%) | 316 (54.1%) |
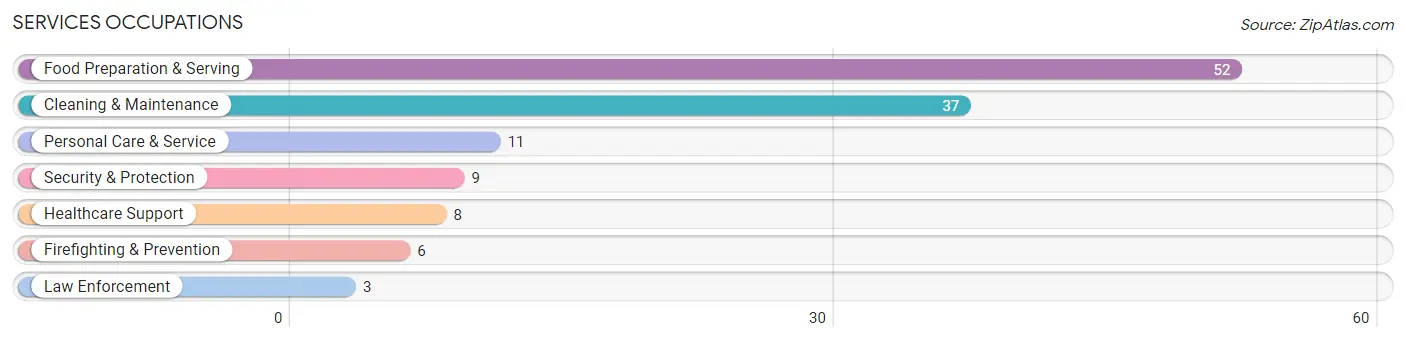
Services Occupations
The most common Services occupations in Englewood are Food Preparation & Serving (52 | 8.9%), Cleaning & Maintenance (37 | 6.3%), Personal Care & Service (11 | 1.9%), Security & Protection (9 | 1.5%), and Healthcare Support (8 | 1.4%).
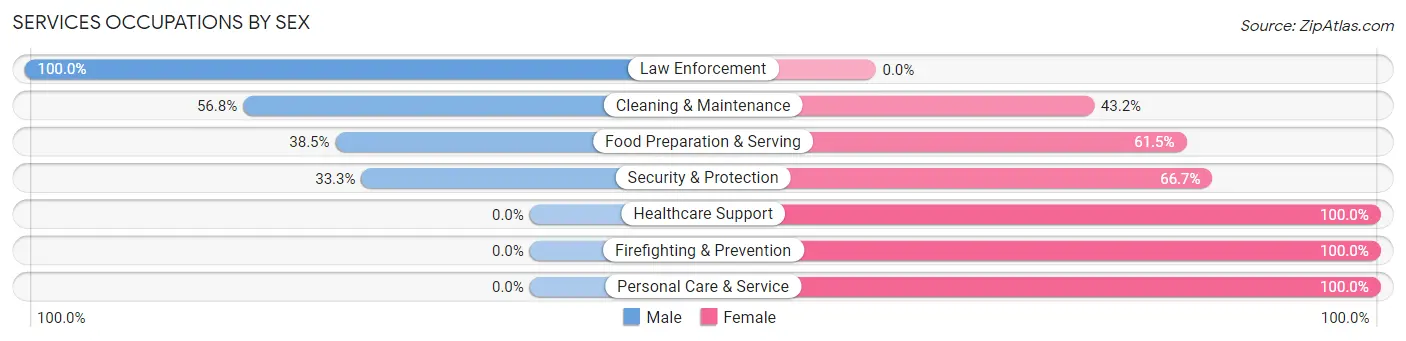
Services Occupations by Sex
Within the Services occupations in Englewood, the most male-oriented occupations are Law Enforcement (100.0%), Cleaning & Maintenance (56.8%), and Food Preparation & Serving (38.5%), while the most female-oriented occupations are Healthcare Support (100.0%), Firefighting & Prevention (100.0%), and Personal Care & Service (100.0%).
| Occupation | Male | Female |
| Healthcare Support | 0 (0.0%) | 8 (100.0%) |
| Security & Protection | 3 (33.3%) | 6 (66.7%) |
| Firefighting & Prevention | 0 (0.0%) | 6 (100.0%) |
| Law Enforcement | 3 (100.0%) | 0 (0.0%) |
| Food Preparation & Serving | 20 (38.5%) | 32 (61.5%) |
| Cleaning & Maintenance | 21 (56.8%) | 16 (43.2%) |
| Personal Care & Service | 0 (0.0%) | 11 (100.0%) |
| Total (Category) | 44 (37.6%) | 73 (62.4%) |
| Total (Overall) | 268 (45.9%) | 316 (54.1%) |
Sales and Office Occupations
The most common Sales and Office occupations in Englewood are Office & Administration (91 | 15.6%), and Sales & Related (47 | 8.1%).
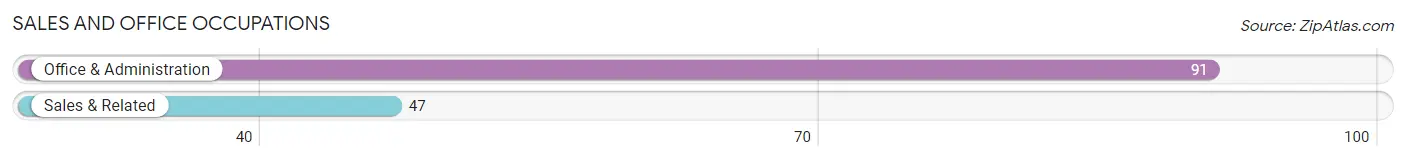
Sales and Office Occupations by Sex
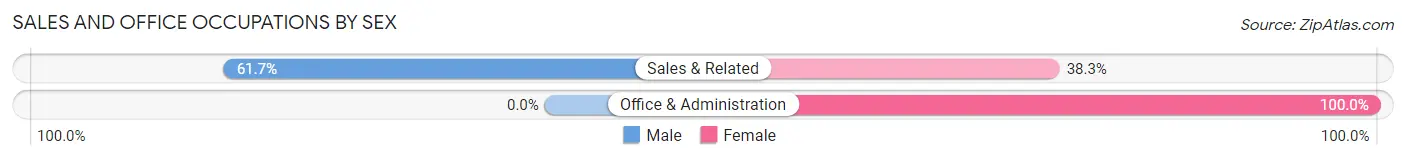
| Occupation | Male | Female |
| Sales & Related | 29 (61.7%) | 18 (38.3%) |
| Office & Administration | 0 (0.0%) | 91 (100.0%) |
| Total (Category) | 29 (21.0%) | 109 (79.0%) |
| Total (Overall) | 268 (45.9%) | 316 (54.1%) |
Natural Resources, Construction and Maintenance Occupations
The most common Natural Resources, Construction and Maintenance occupations in Englewood are Construction & Extraction (17 | 2.9%), Installation, Maintenance & Repair (5 | 0.9%), and Farming, Fishing & Forestry (2 | 0.3%).
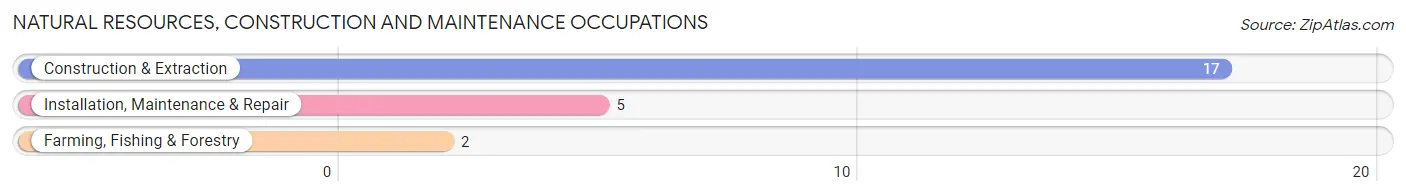
Natural Resources, Construction and Maintenance Occupations by Sex
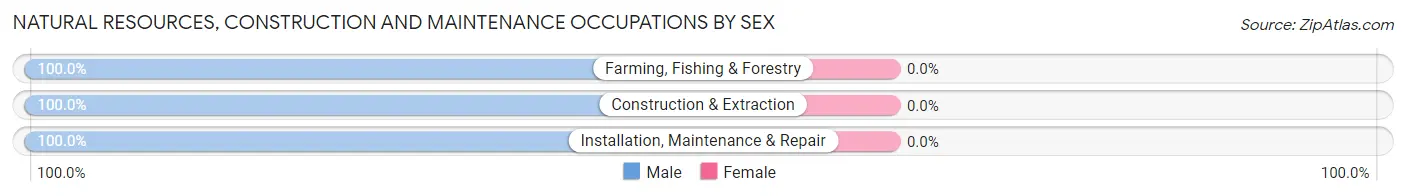
| Occupation | Male | Female |
| Farming, Fishing & Forestry | 2 (100.0%) | 0 (0.0%) |
| Construction & Extraction | 17 (100.0%) | 0 (0.0%) |
| Installation, Maintenance & Repair | 5 (100.0%) | 0 (0.0%) |
| Total (Category) | 24 (100.0%) | 0 (0.0%) |
| Total (Overall) | 268 (45.9%) | 316 (54.1%) |
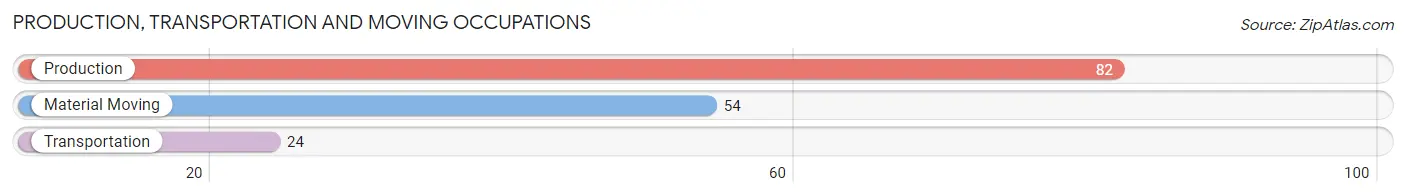
Production, Transportation and Moving Occupations
The most common Production, Transportation and Moving occupations in Englewood are Production (82 | 14.0%), Material Moving (54 | 9.2%), and Transportation (24 | 4.1%).
Production, Transportation and Moving Occupations by Sex
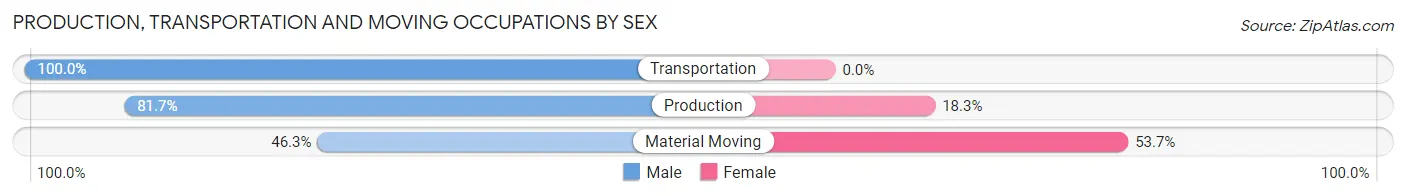
| Occupation | Male | Female |
| Production | 67 (81.7%) | 15 (18.3%) |
| Transportation | 24 (100.0%) | 0 (0.0%) |
| Material Moving | 25 (46.3%) | 29 (53.7%) |
| Total (Category) | 116 (72.5%) | 44 (27.5%) |
| Total (Overall) | 268 (45.9%) | 316 (54.1%) |
Employment Industries by Sex in Englewood
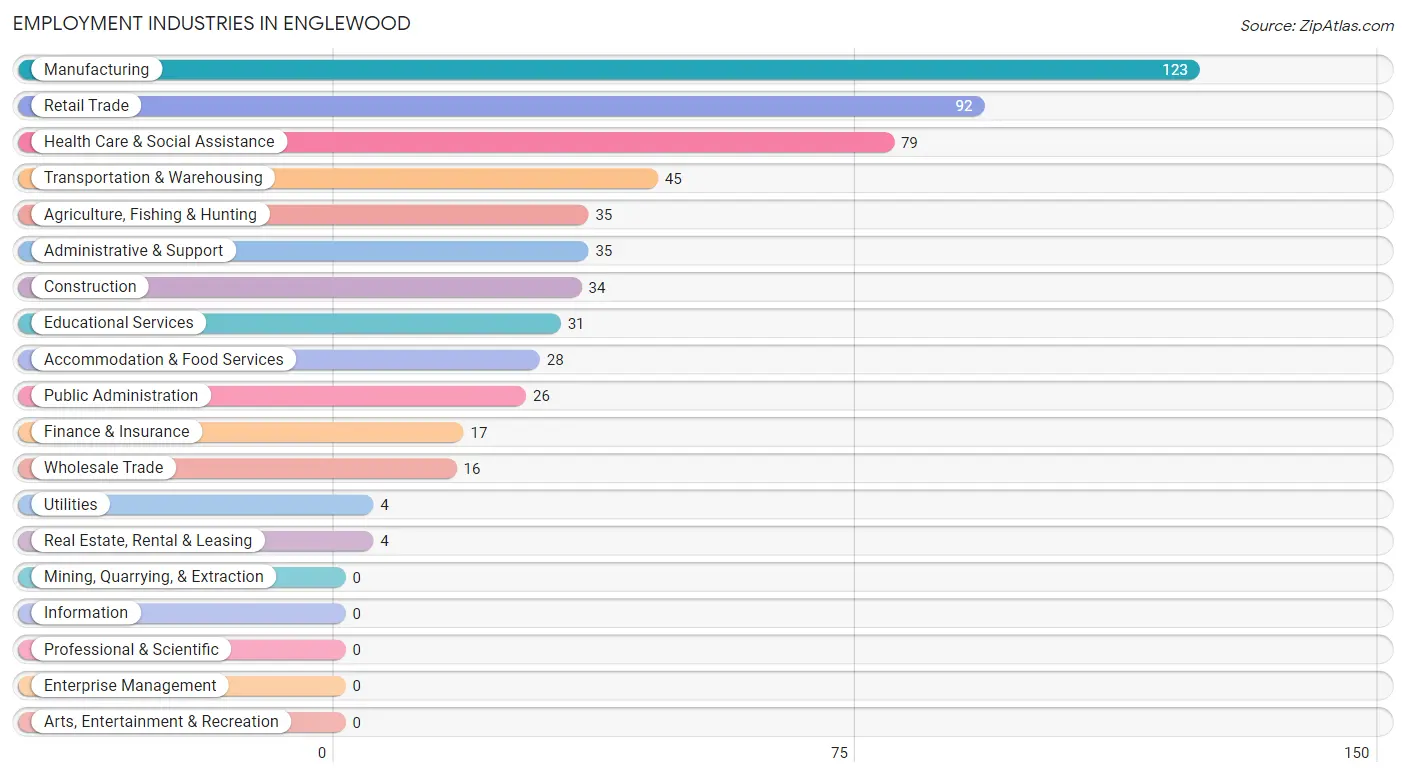
Employment Industries in Englewood
The major employment industries in Englewood include Manufacturing (123 | 21.1%), Retail Trade (92 | 15.8%), Health Care & Social Assistance (79 | 13.5%), Transportation & Warehousing (45 | 7.7%), and Agriculture, Fishing & Hunting (35 | 6.0%).
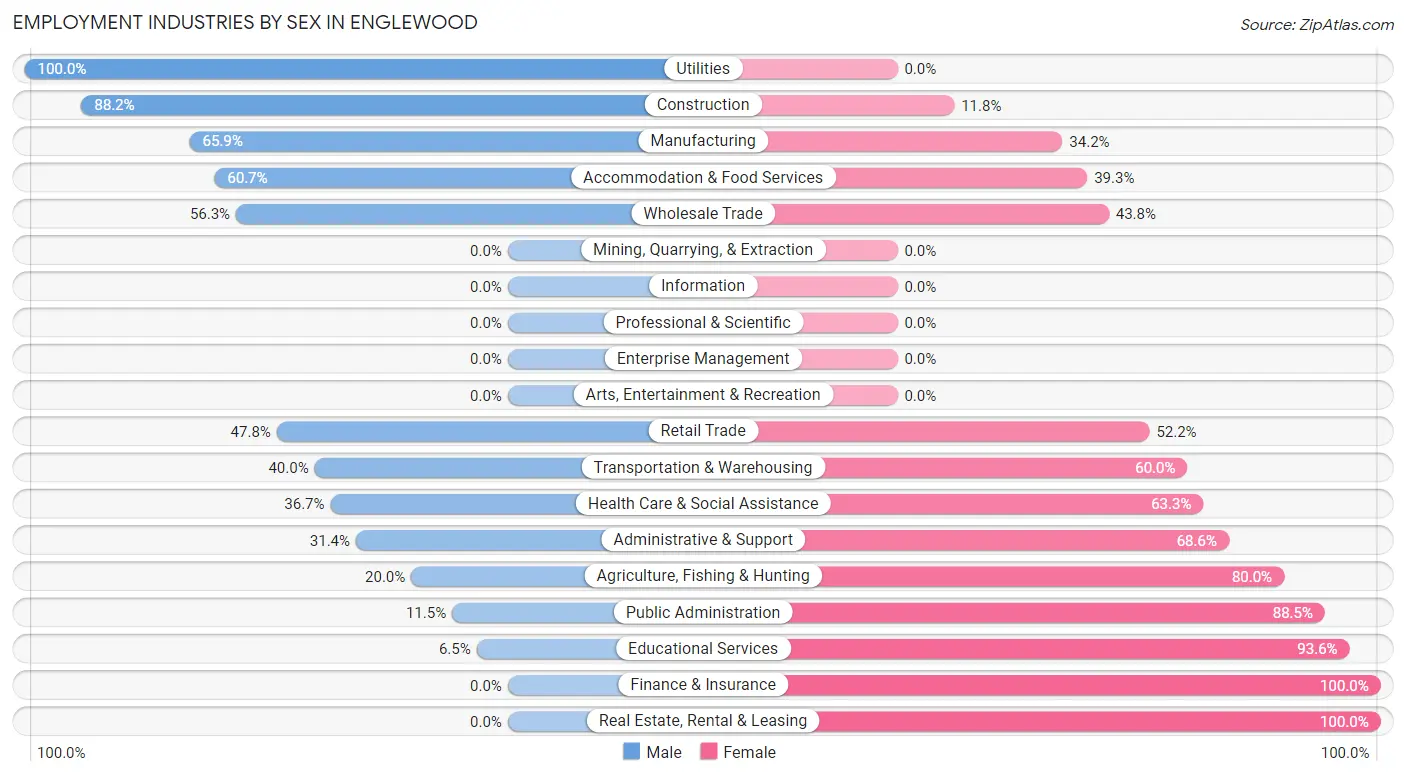
Employment Industries by Sex in Englewood
The Englewood industries that see more men than women are Utilities (100.0%), Construction (88.2%), and Manufacturing (65.8%), whereas the industries that tend to have a higher number of women are Finance & Insurance (100.0%), Real Estate, Rental & Leasing (100.0%), and Educational Services (93.5%).
| Industry | Male | Female |
| Agriculture, Fishing & Hunting | 7 (20.0%) | 28 (80.0%) |
| Mining, Quarrying, & Extraction | 0 (0.0%) | 0 (0.0%) |
| Construction | 30 (88.2%) | 4 (11.8%) |
| Manufacturing | 81 (65.8%) | 42 (34.2%) |
| Wholesale Trade | 9 (56.2%) | 7 (43.8%) |
| Retail Trade | 44 (47.8%) | 48 (52.2%) |
| Transportation & Warehousing | 18 (40.0%) | 27 (60.0%) |
| Utilities | 4 (100.0%) | 0 (0.0%) |
| Information | 0 (0.0%) | 0 (0.0%) |
| Finance & Insurance | 0 (0.0%) | 17 (100.0%) |
| Real Estate, Rental & Leasing | 0 (0.0%) | 4 (100.0%) |
| Professional & Scientific | 0 (0.0%) | 0 (0.0%) |
| Enterprise Management | 0 (0.0%) | 0 (0.0%) |
| Administrative & Support | 11 (31.4%) | 24 (68.6%) |
| Educational Services | 2 (6.5%) | 29 (93.5%) |
| Health Care & Social Assistance | 29 (36.7%) | 50 (63.3%) |
| Arts, Entertainment & Recreation | 0 (0.0%) | 0 (0.0%) |
| Accommodation & Food Services | 17 (60.7%) | 11 (39.3%) |
| Public Administration | 3 (11.5%) | 23 (88.5%) |
| Total | 268 (45.9%) | 316 (54.1%) |
Education in Englewood
School Enrollment in Englewood
The most common levels of schooling among the 352 students in Englewood are high school (137 | 38.9%), elementary school (85 | 24.1%), and middle school (82 | 23.3%).
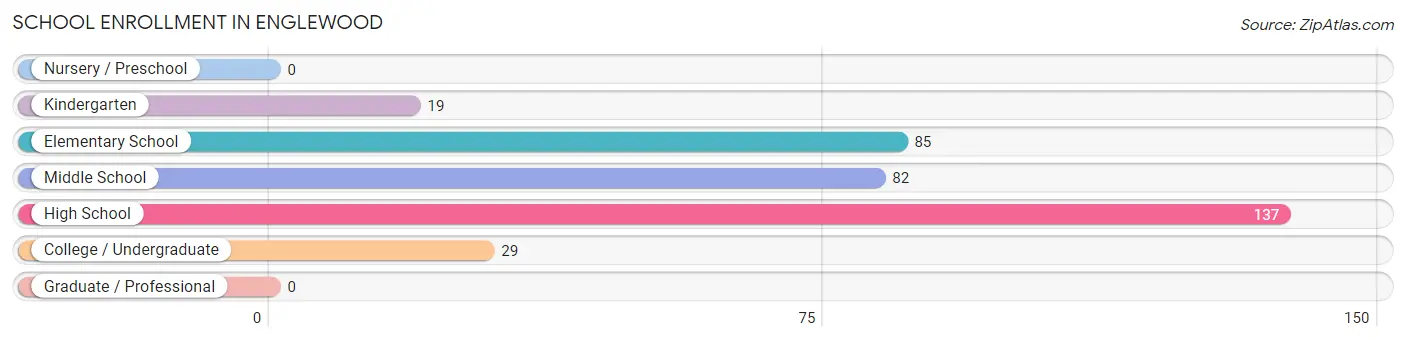
| School Level | # Students | % Students |
| Nursery / Preschool | 0 | 0.0% |
| Kindergarten | 19 | 5.4% |
| Elementary School | 85 | 24.1% |
| Middle School | 82 | 23.3% |
| High School | 137 | 38.9% |
| College / Undergraduate | 29 | 8.2% |
| Graduate / Professional | 0 | 0.0% |
| Total | 352 | 100.0% |
School Enrollment by Age by Funding Source in Englewood
Out of a total of 352 students who are enrolled in schools in Englewood, 10 (2.8%) attend a private institution, while the remaining 342 (97.2%) are enrolled in public schools. The age group of 5 to 9 year old has the highest likelihood of being enrolled in private schools, with 10 (11.1% in the age bracket) enrolled. Conversely, the age group of 10 to 14 year olds has the lowest likelihood of being enrolled in a private school, with 99 (100.0% in the age bracket) attending a public institution.
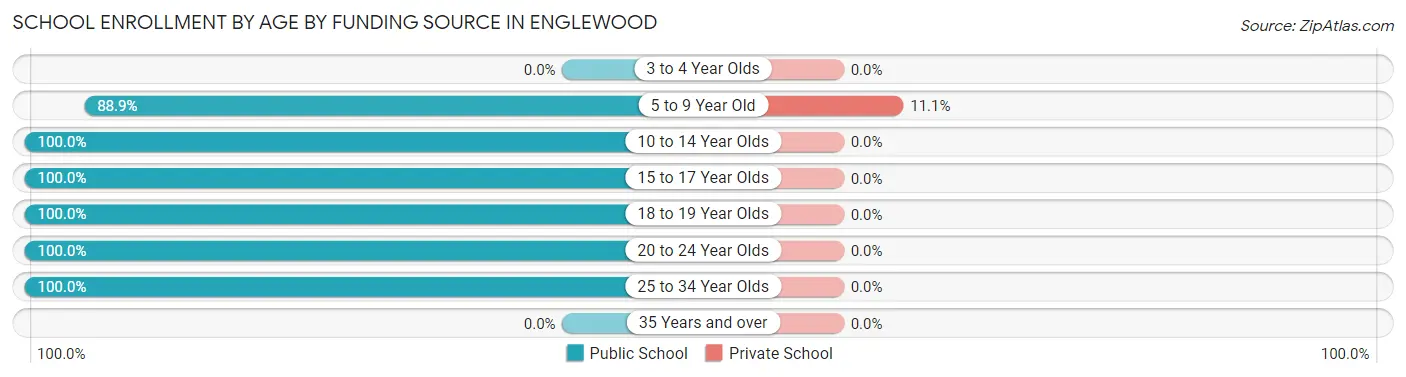
| Age Bracket | Public School | Private School |
| 3 to 4 Year Olds | 0 (0.0%) | 0 (0.0%) |
| 5 to 9 Year Old | 80 (88.9%) | 10 (11.1%) |
| 10 to 14 Year Olds | 99 (100.0%) | 0 (0.0%) |
| 15 to 17 Year Olds | 128 (100.0%) | 0 (0.0%) |
| 18 to 19 Year Olds | 24 (100.0%) | 0 (0.0%) |
| 20 to 24 Year Olds | 4 (100.0%) | 0 (0.0%) |
| 25 to 34 Year Olds | 7 (100.0%) | 0 (0.0%) |
| 35 Years and over | 0 (0.0%) | 0 (0.0%) |
| Total | 342 (97.2%) | 10 (2.8%) |
Educational Attainment by Field of Study in Englewood
Bio, nature & agricultural (15 | 26.8%), business (11 | 19.6%), education (9 | 16.1%), science & technology (7 | 12.5%), and arts & humanities (5 | 8.9%) are the most common fields of study among 56 individuals in Englewood who have obtained a bachelor's degree or higher.
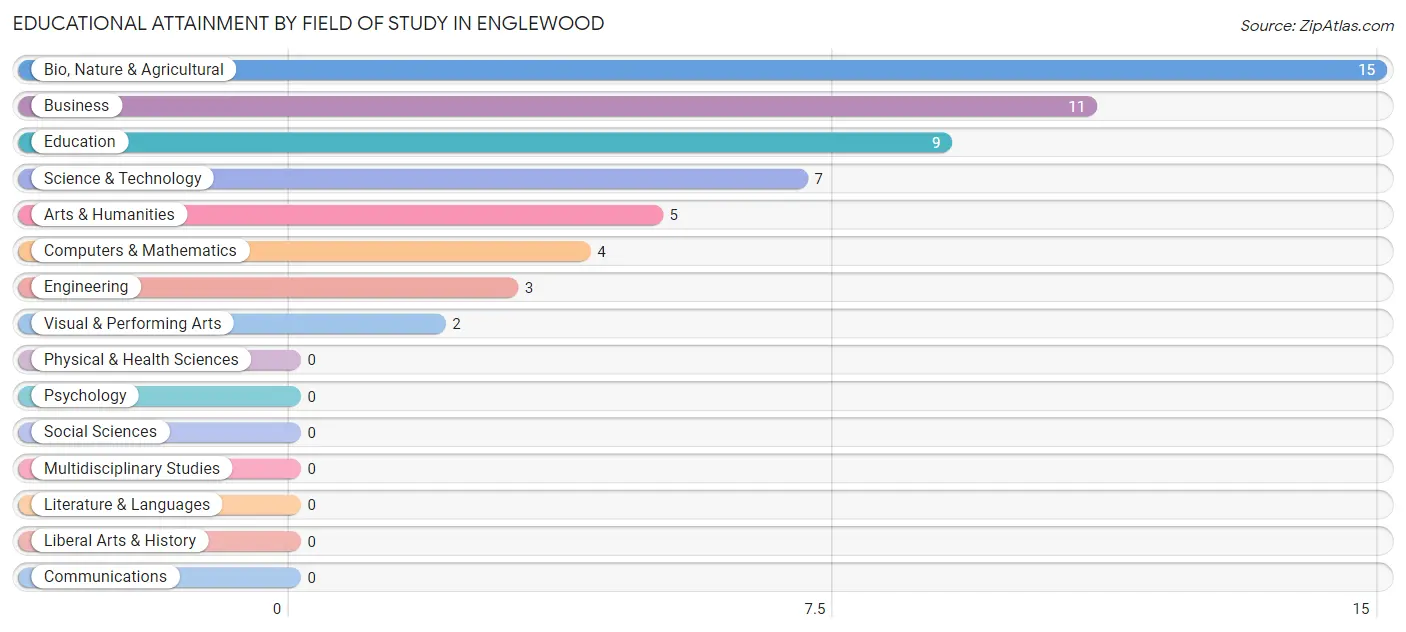
| Field of Study | # Graduates | % Graduates |
| Computers & Mathematics | 4 | 7.1% |
| Bio, Nature & Agricultural | 15 | 26.8% |
| Physical & Health Sciences | 0 | 0.0% |
| Psychology | 0 | 0.0% |
| Social Sciences | 0 | 0.0% |
| Engineering | 3 | 5.4% |
| Multidisciplinary Studies | 0 | 0.0% |
| Science & Technology | 7 | 12.5% |
| Business | 11 | 19.6% |
| Education | 9 | 16.1% |
| Literature & Languages | 0 | 0.0% |
| Liberal Arts & History | 0 | 0.0% |
| Visual & Performing Arts | 2 | 3.6% |
| Communications | 0 | 0.0% |
| Arts & Humanities | 5 | 8.9% |
| Total | 56 | 100.0% |
Transportation & Commute in Englewood
Vehicle Availability by Sex in Englewood
The most prevalent vehicle ownership categories in Englewood are males with 2 vehicles (83, accounting for 32.6%) and females with 2 vehicles (97, making up 26.3%).
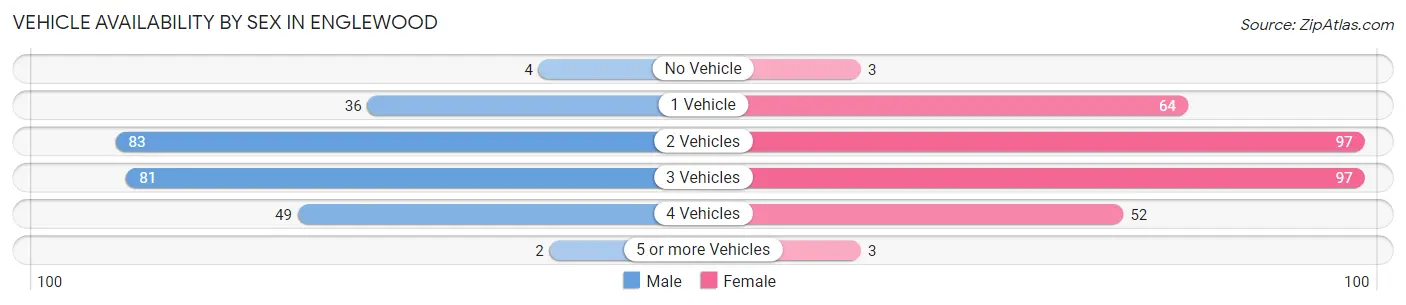
| Vehicles Available | Male | Female |
| No Vehicle | 4 (1.6%) | 3 (0.9%) |
| 1 Vehicle | 36 (14.1%) | 64 (20.3%) |
| 2 Vehicles | 83 (32.6%) | 97 (30.7%) |
| 3 Vehicles | 81 (31.8%) | 97 (30.7%) |
| 4 Vehicles | 49 (19.2%) | 52 (16.5%) |
| 5 or more Vehicles | 2 (0.8%) | 3 (0.9%) |
| Total | 255 (100.0%) | 316 (100.0%) |
Commute Time in Englewood
The most frequently occuring commute durations in Englewood are 15 to 19 minutes (133 commuters, 24.1%), 30 to 34 minutes (96 commuters, 17.4%), and 10 to 14 minutes (81 commuters, 14.7%).
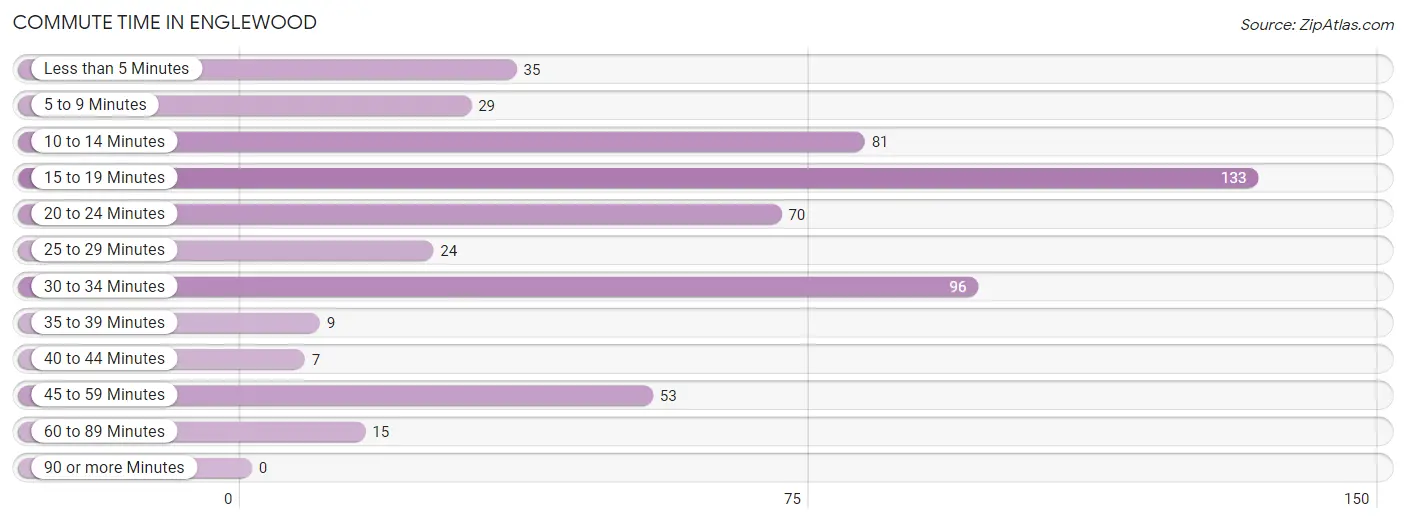
| Commute Time | # Commuters | % Commuters |
| Less than 5 Minutes | 35 | 6.3% |
| 5 to 9 Minutes | 29 | 5.2% |
| 10 to 14 Minutes | 81 | 14.7% |
| 15 to 19 Minutes | 133 | 24.1% |
| 20 to 24 Minutes | 70 | 12.7% |
| 25 to 29 Minutes | 24 | 4.3% |
| 30 to 34 Minutes | 96 | 17.4% |
| 35 to 39 Minutes | 9 | 1.6% |
| 40 to 44 Minutes | 7 | 1.3% |
| 45 to 59 Minutes | 53 | 9.6% |
| 60 to 89 Minutes | 15 | 2.7% |
| 90 or more Minutes | 0 | 0.0% |
Commute Time by Sex in Englewood
The most common commute times in Englewood are 15 to 19 minutes (66 commuters, 26.2%) for males and 10 to 14 minutes (72 commuters, 24.0%) for females.
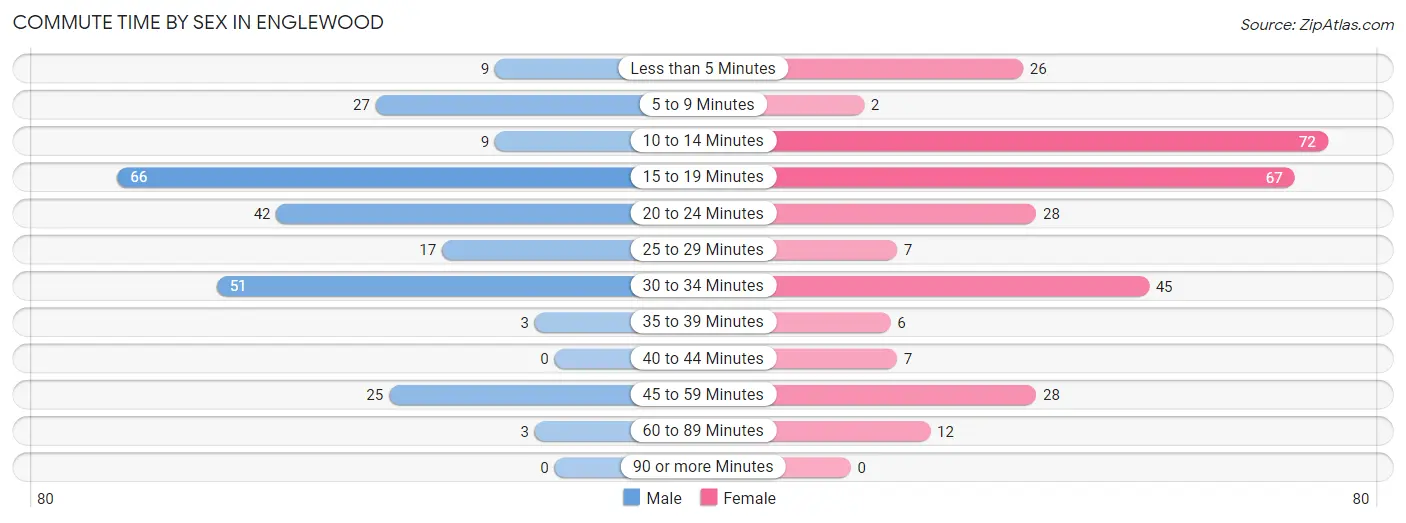
| Commute Time | Male | Female |
| Less than 5 Minutes | 9 (3.6%) | 26 (8.7%) |
| 5 to 9 Minutes | 27 (10.7%) | 2 (0.7%) |
| 10 to 14 Minutes | 9 (3.6%) | 72 (24.0%) |
| 15 to 19 Minutes | 66 (26.2%) | 67 (22.3%) |
| 20 to 24 Minutes | 42 (16.7%) | 28 (9.3%) |
| 25 to 29 Minutes | 17 (6.8%) | 7 (2.3%) |
| 30 to 34 Minutes | 51 (20.2%) | 45 (15.0%) |
| 35 to 39 Minutes | 3 (1.2%) | 6 (2.0%) |
| 40 to 44 Minutes | 0 (0.0%) | 7 (2.3%) |
| 45 to 59 Minutes | 25 (9.9%) | 28 (9.3%) |
| 60 to 89 Minutes | 3 (1.2%) | 12 (4.0%) |
| 90 or more Minutes | 0 (0.0%) | 0 (0.0%) |
Time of Departure to Work by Sex in Englewood
The most frequent times of departure to work in Englewood are 5:00 AM to 5:29 AM (41, 16.3%) for males and 7:30 AM to 7:59 AM (54, 18.0%) for females.
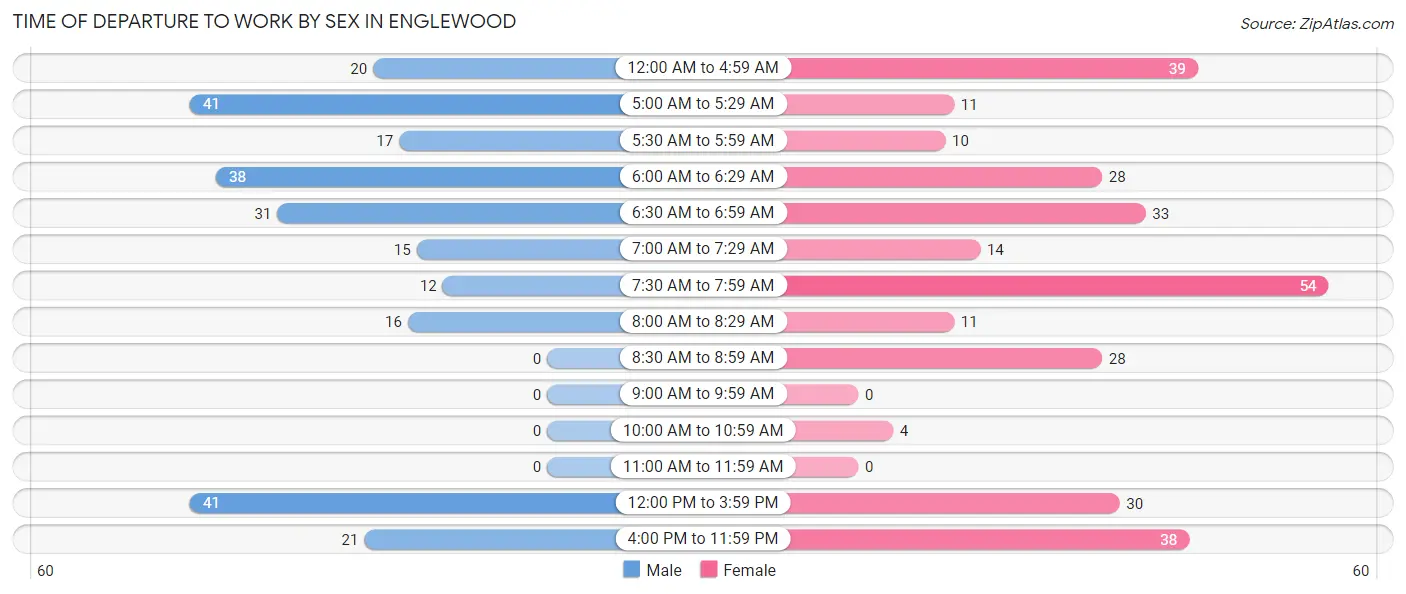
| Time of Departure | Male | Female |
| 12:00 AM to 4:59 AM | 20 (7.9%) | 39 (13.0%) |
| 5:00 AM to 5:29 AM | 41 (16.3%) | 11 (3.7%) |
| 5:30 AM to 5:59 AM | 17 (6.8%) | 10 (3.3%) |
| 6:00 AM to 6:29 AM | 38 (15.1%) | 28 (9.3%) |
| 6:30 AM to 6:59 AM | 31 (12.3%) | 33 (11.0%) |
| 7:00 AM to 7:29 AM | 15 (5.9%) | 14 (4.7%) |
| 7:30 AM to 7:59 AM | 12 (4.8%) | 54 (18.0%) |
| 8:00 AM to 8:29 AM | 16 (6.4%) | 11 (3.7%) |
| 8:30 AM to 8:59 AM | 0 (0.0%) | 28 (9.3%) |
| 9:00 AM to 9:59 AM | 0 (0.0%) | 0 (0.0%) |
| 10:00 AM to 10:59 AM | 0 (0.0%) | 4 (1.3%) |
| 11:00 AM to 11:59 AM | 0 (0.0%) | 0 (0.0%) |
| 12:00 PM to 3:59 PM | 41 (16.3%) | 30 (10.0%) |
| 4:00 PM to 11:59 PM | 21 (8.3%) | 38 (12.7%) |
| Total | 252 (100.0%) | 300 (100.0%) |
Housing Occupancy in Englewood
Occupancy by Ownership in Englewood
Of the total 676 dwellings in Englewood, owner-occupied units account for 445 (65.8%), while renter-occupied units make up 231 (34.2%).
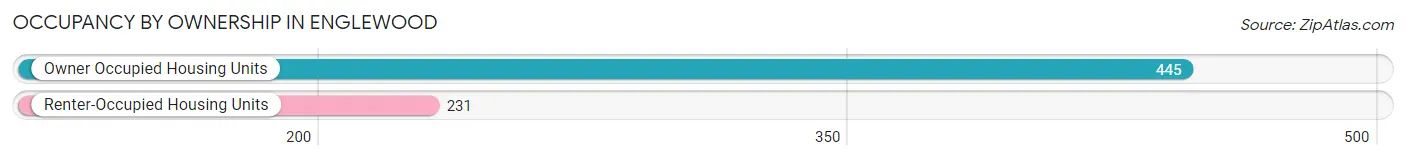
| Occupancy | # Housing Units | % Housing Units |
| Owner Occupied Housing Units | 445 | 65.8% |
| Renter-Occupied Housing Units | 231 | 34.2% |
| Total Occupied Housing Units | 676 | 100.0% |
Occupancy by Household Size in Englewood
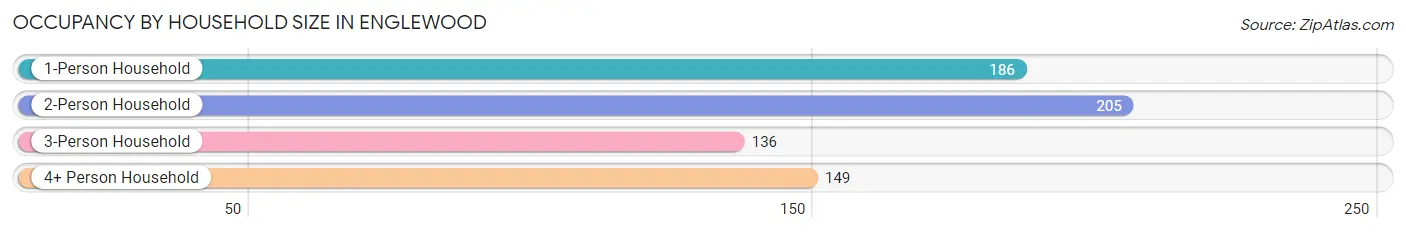
| Household Size | # Housing Units | % Housing Units |
| 1-Person Household | 186 | 27.5% |
| 2-Person Household | 205 | 30.3% |
| 3-Person Household | 136 | 20.1% |
| 4+ Person Household | 149 | 22.0% |
| Total Housing Units | 676 | 100.0% |
Occupancy by Ownership by Household Size in Englewood
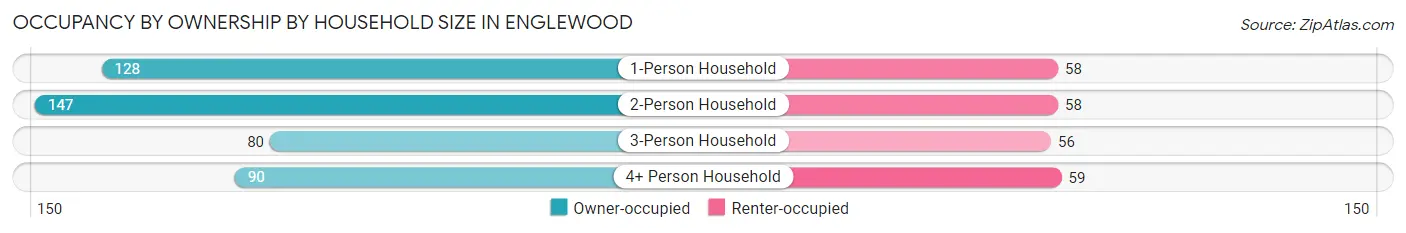
| Household Size | Owner-occupied | Renter-occupied |
| 1-Person Household | 128 (68.8%) | 58 (31.2%) |
| 2-Person Household | 147 (71.7%) | 58 (28.3%) |
| 3-Person Household | 80 (58.8%) | 56 (41.2%) |
| 4+ Person Household | 90 (60.4%) | 59 (39.6%) |
| Total Housing Units | 445 (65.8%) | 231 (34.2%) |
Occupancy by Educational Attainment in Englewood
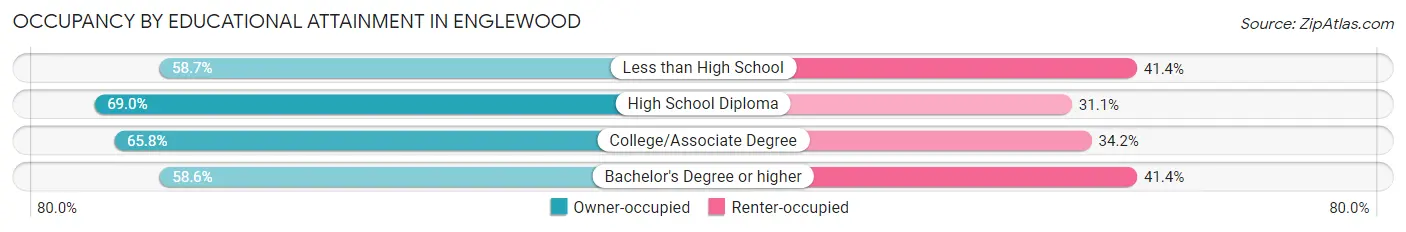
| Household Size | Owner-occupied | Renter-occupied |
| Less than High School | 61 (58.7%) | 43 (41.3%) |
| High School Diploma | 211 (69.0%) | 95 (31.0%) |
| College/Associate Degree | 156 (65.8%) | 81 (34.2%) |
| Bachelor's Degree or higher | 17 (58.6%) | 12 (41.4%) |
Occupancy by Age of Householder in Englewood
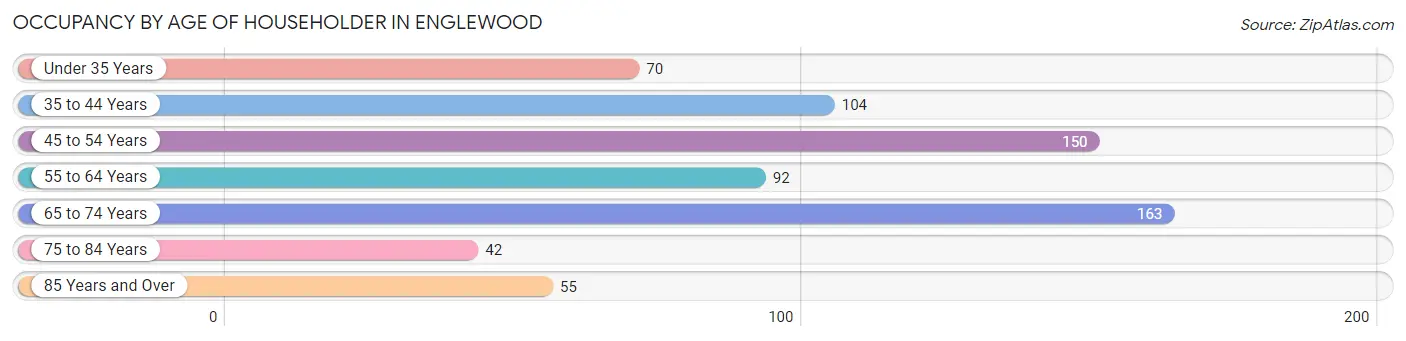
| Age Bracket | # Households | % Households |
| Under 35 Years | 70 | 10.4% |
| 35 to 44 Years | 104 | 15.4% |
| 45 to 54 Years | 150 | 22.2% |
| 55 to 64 Years | 92 | 13.6% |
| 65 to 74 Years | 163 | 24.1% |
| 75 to 84 Years | 42 | 6.2% |
| 85 Years and Over | 55 | 8.1% |
| Total | 676 | 100.0% |
Housing Finances in Englewood
Median Income by Occupancy in Englewood
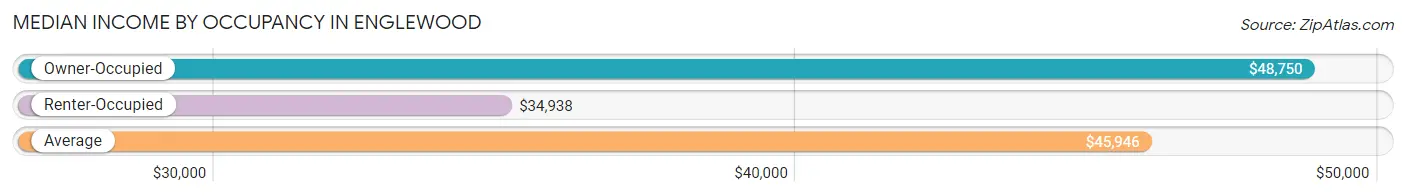
| Occupancy Type | # Households | Median Income |
| Owner-Occupied | 445 (65.8%) | $48,750 |
| Renter-Occupied | 231 (34.2%) | $34,938 |
| Average | 676 (100.0%) | $45,946 |
Occupancy by Householder Income Bracket in Englewood
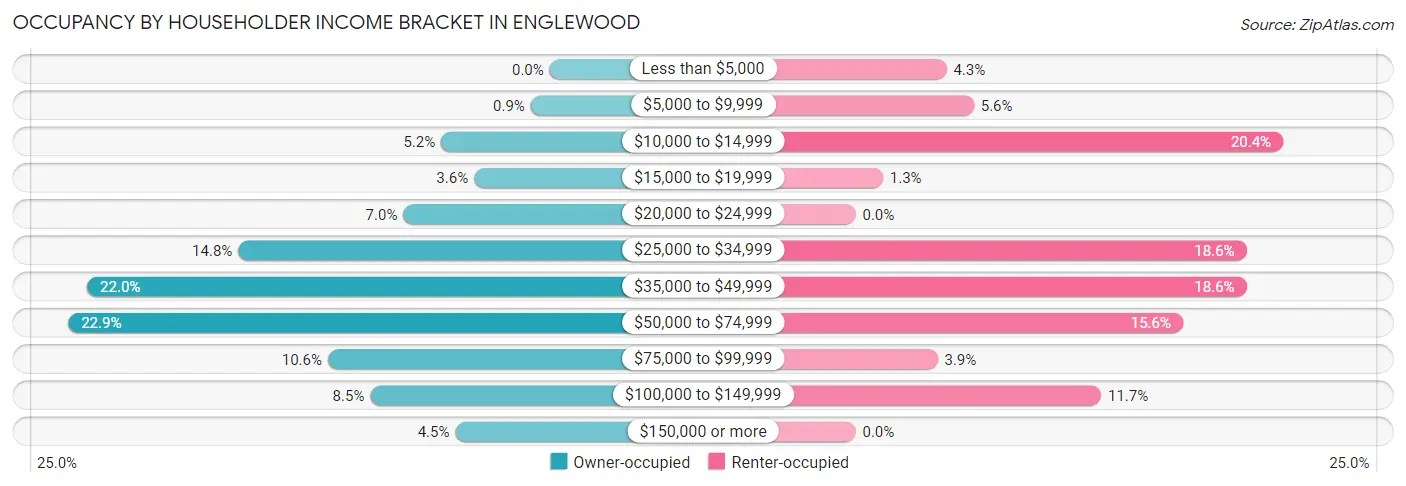
| Income Bracket | Owner-occupied | Renter-occupied |
| Less than $5,000 | 0 (0.0%) | 10 (4.3%) |
| $5,000 to $9,999 | 4 (0.9%) | 13 (5.6%) |
| $10,000 to $14,999 | 23 (5.2%) | 47 (20.3%) |
| $15,000 to $19,999 | 16 (3.6%) | 3 (1.3%) |
| $20,000 to $24,999 | 31 (7.0%) | 0 (0.0%) |
| $25,000 to $34,999 | 66 (14.8%) | 43 (18.6%) |
| $35,000 to $49,999 | 98 (22.0%) | 43 (18.6%) |
| $50,000 to $74,999 | 102 (22.9%) | 36 (15.6%) |
| $75,000 to $99,999 | 47 (10.6%) | 9 (3.9%) |
| $100,000 to $149,999 | 38 (8.5%) | 27 (11.7%) |
| $150,000 or more | 20 (4.5%) | 0 (0.0%) |
| Total | 445 (100.0%) | 231 (100.0%) |
Monthly Housing Cost Tiers in Englewood
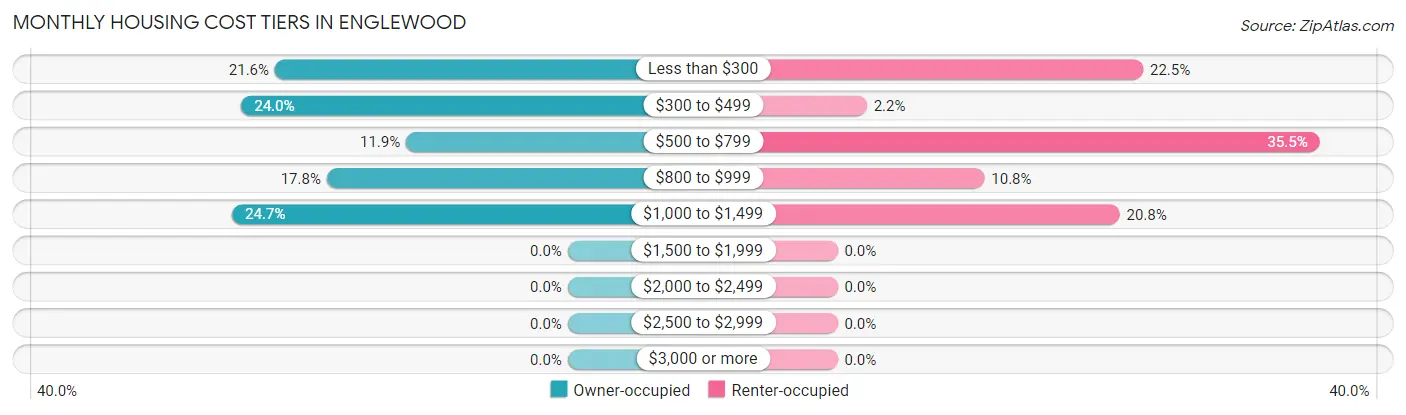
| Monthly Cost | Owner-occupied | Renter-occupied |
| Less than $300 | 96 (21.6%) | 52 (22.5%) |
| $300 to $499 | 107 (24.0%) | 5 (2.2%) |
| $500 to $799 | 53 (11.9%) | 82 (35.5%) |
| $800 to $999 | 79 (17.7%) | 25 (10.8%) |
| $1,000 to $1,499 | 110 (24.7%) | 48 (20.8%) |
| $1,500 to $1,999 | 0 (0.0%) | 0 (0.0%) |
| $2,000 to $2,499 | 0 (0.0%) | 0 (0.0%) |
| $2,500 to $2,999 | 0 (0.0%) | 0 (0.0%) |
| $3,000 or more | 0 (0.0%) | 0 (0.0%) |
| Total | 445 (100.0%) | 231 (100.0%) |
Physical Housing Characteristics in Englewood
Housing Structures in Englewood
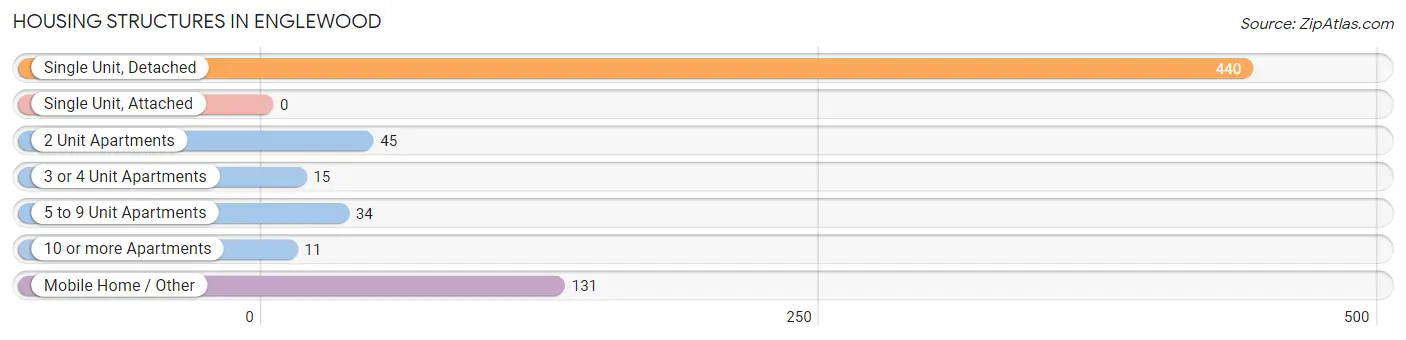
| Structure Type | # Housing Units | % Housing Units |
| Single Unit, Detached | 440 | 65.1% |
| Single Unit, Attached | 0 | 0.0% |
| 2 Unit Apartments | 45 | 6.7% |
| 3 or 4 Unit Apartments | 15 | 2.2% |
| 5 to 9 Unit Apartments | 34 | 5.0% |
| 10 or more Apartments | 11 | 1.6% |
| Mobile Home / Other | 131 | 19.4% |
| Total | 676 | 100.0% |
Housing Structures by Occupancy in Englewood
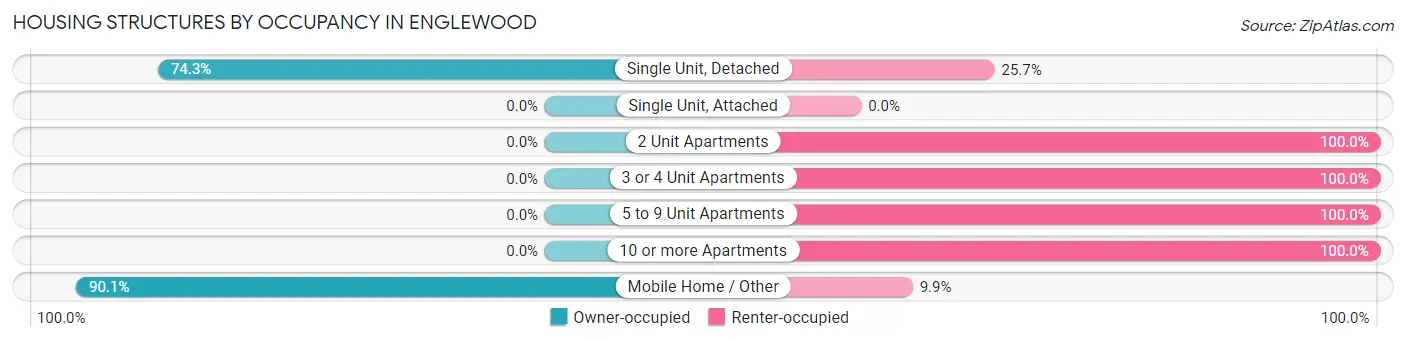
| Structure Type | Owner-occupied | Renter-occupied |
| Single Unit, Detached | 327 (74.3%) | 113 (25.7%) |
| Single Unit, Attached | 0 (0.0%) | 0 (0.0%) |
| 2 Unit Apartments | 0 (0.0%) | 45 (100.0%) |
| 3 or 4 Unit Apartments | 0 (0.0%) | 15 (100.0%) |
| 5 to 9 Unit Apartments | 0 (0.0%) | 34 (100.0%) |
| 10 or more Apartments | 0 (0.0%) | 11 (100.0%) |
| Mobile Home / Other | 118 (90.1%) | 13 (9.9%) |
| Total | 445 (65.8%) | 231 (34.2%) |
Housing Structures by Number of Rooms in Englewood
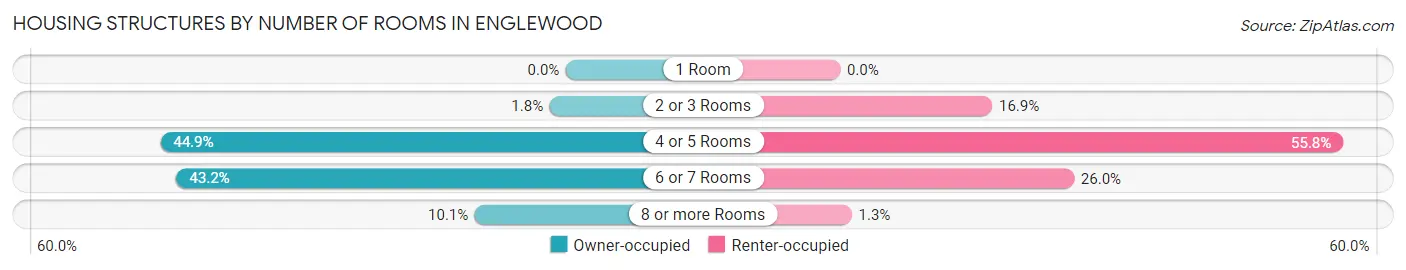
| Number of Rooms | Owner-occupied | Renter-occupied |
| 1 Room | 0 (0.0%) | 0 (0.0%) |
| 2 or 3 Rooms | 8 (1.8%) | 39 (16.9%) |
| 4 or 5 Rooms | 200 (44.9%) | 129 (55.8%) |
| 6 or 7 Rooms | 192 (43.1%) | 60 (26.0%) |
| 8 or more Rooms | 45 (10.1%) | 3 (1.3%) |
| Total | 445 (100.0%) | 231 (100.0%) |
Housing Structure by Heating Type in Englewood
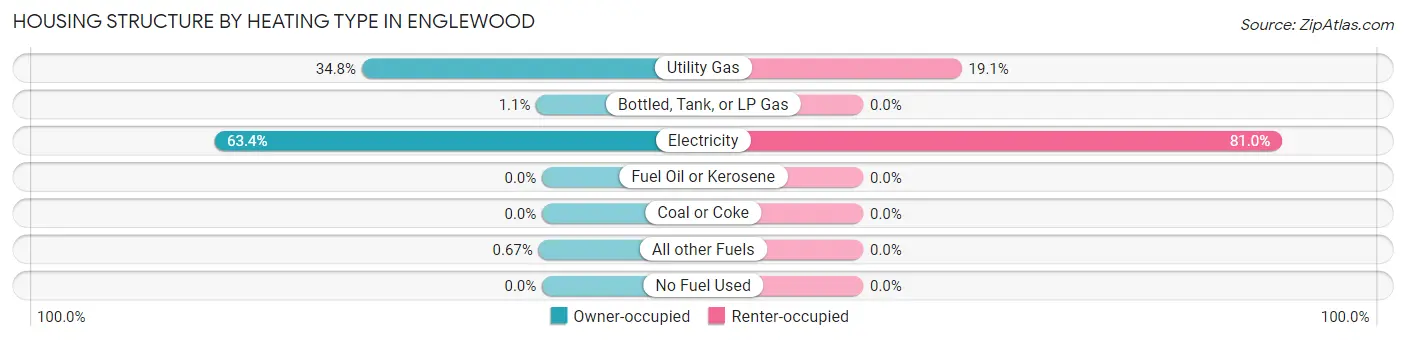
| Heating Type | Owner-occupied | Renter-occupied |
| Utility Gas | 155 (34.8%) | 44 (19.1%) |
| Bottled, Tank, or LP Gas | 5 (1.1%) | 0 (0.0%) |
| Electricity | 282 (63.4%) | 187 (80.9%) |
| Fuel Oil or Kerosene | 0 (0.0%) | 0 (0.0%) |
| Coal or Coke | 0 (0.0%) | 0 (0.0%) |
| All other Fuels | 3 (0.7%) | 0 (0.0%) |
| No Fuel Used | 0 (0.0%) | 0 (0.0%) |
| Total | 445 (100.0%) | 231 (100.0%) |
Household Vehicle Usage in Englewood
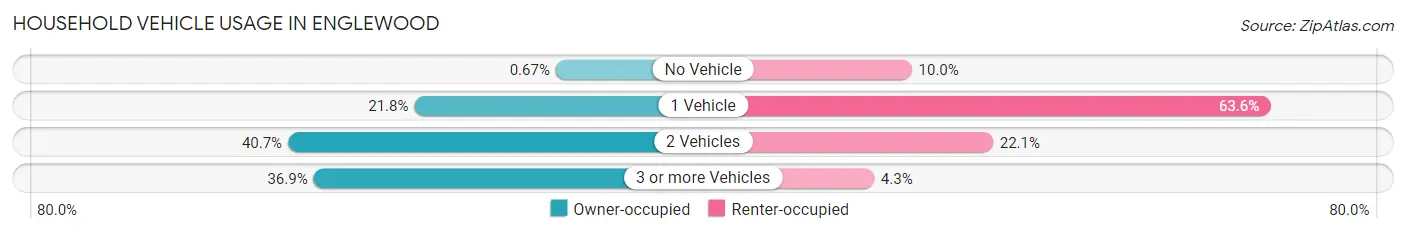
| Vehicles per Household | Owner-occupied | Renter-occupied |
| No Vehicle | 3 (0.7%) | 23 (10.0%) |
| 1 Vehicle | 97 (21.8%) | 147 (63.6%) |
| 2 Vehicles | 181 (40.7%) | 51 (22.1%) |
| 3 or more Vehicles | 164 (36.8%) | 10 (4.3%) |
| Total | 445 (100.0%) | 231 (100.0%) |
Real Estate & Mortgages in Englewood
Real Estate and Mortgage Overview in Englewood
| Characteristic | Without Mortgage | With Mortgage |
| Housing Units | 226 | 219 |
| Median Property Value | $86,800 | $110,900 |
| Median Household Income | $45,726 | $11 |
| Monthly Housing Costs | $315 | $0 |
| Real Estate Taxes | $586 | $0 |
Property Value by Mortgage Status in Englewood
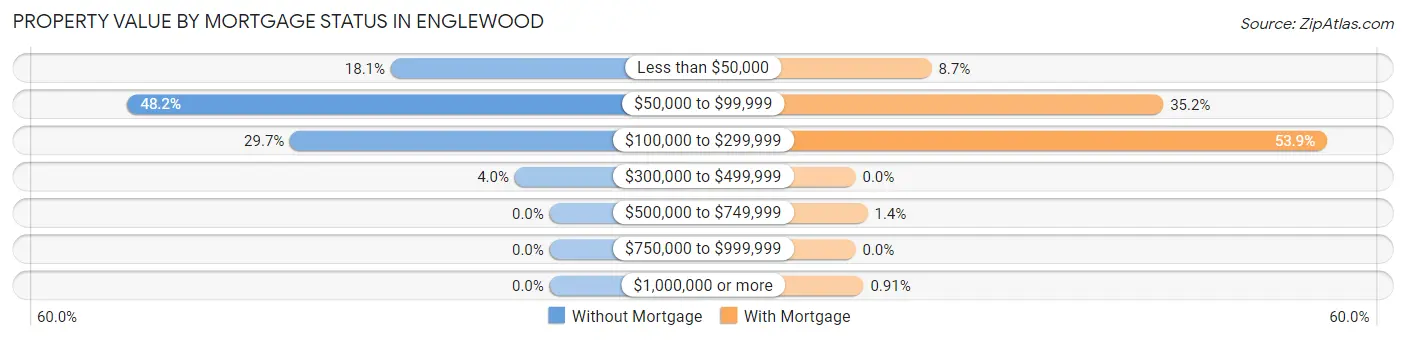
| Property Value | Without Mortgage | With Mortgage |
| Less than $50,000 | 41 (18.1%) | 19 (8.7%) |
| $50,000 to $99,999 | 109 (48.2%) | 77 (35.2%) |
| $100,000 to $299,999 | 67 (29.6%) | 118 (53.9%) |
| $300,000 to $499,999 | 9 (4.0%) | 0 (0.0%) |
| $500,000 to $749,999 | 0 (0.0%) | 3 (1.4%) |
| $750,000 to $999,999 | 0 (0.0%) | 0 (0.0%) |
| $1,000,000 or more | 0 (0.0%) | 2 (0.9%) |
| Total | 226 (100.0%) | 219 (100.0%) |
Household Income by Mortgage Status in Englewood
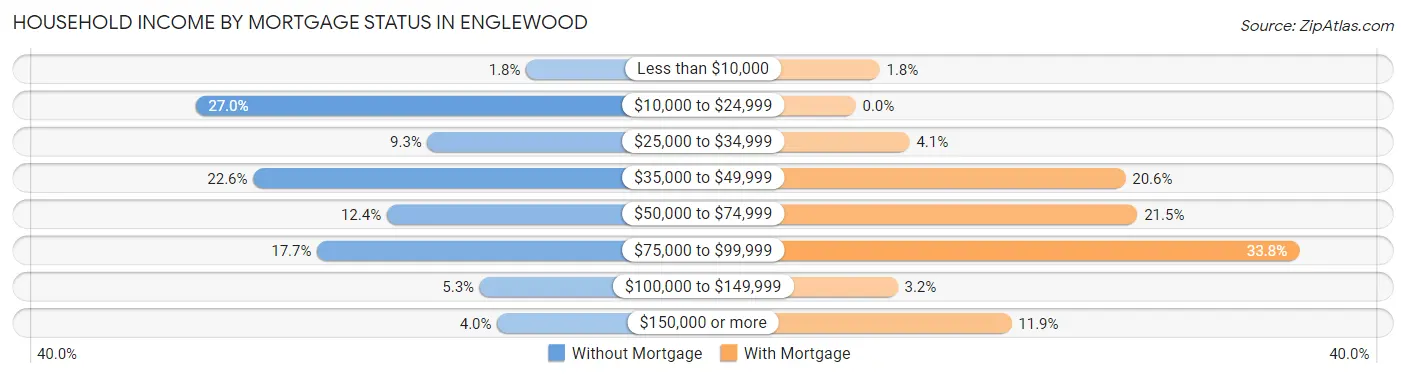
| Household Income | Without Mortgage | With Mortgage |
| Less than $10,000 | 4 (1.8%) | 4 (1.8%) |
| $10,000 to $24,999 | 61 (27.0%) | 0 (0.0%) |
| $25,000 to $34,999 | 21 (9.3%) | 9 (4.1%) |
| $35,000 to $49,999 | 51 (22.6%) | 45 (20.5%) |
| $50,000 to $74,999 | 28 (12.4%) | 47 (21.5%) |
| $75,000 to $99,999 | 40 (17.7%) | 74 (33.8%) |
| $100,000 to $149,999 | 12 (5.3%) | 7 (3.2%) |
| $150,000 or more | 9 (4.0%) | 26 (11.9%) |
| Total | 226 (100.0%) | 219 (100.0%) |
Property Value to Household Income Ratio in Englewood
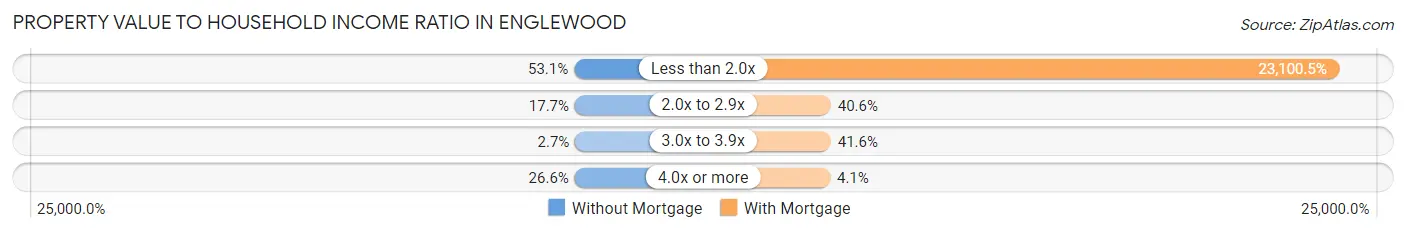
| Value-to-Income Ratio | Without Mortgage | With Mortgage |
| Less than 2.0x | 120 (53.1%) | 50,590 (23,100.5%) |
| 2.0x to 2.9x | 40 (17.7%) | 89 (40.6%) |
| 3.0x to 3.9x | 6 (2.6%) | 91 (41.5%) |
| 4.0x or more | 60 (26.6%) | 9 (4.1%) |
| Total | 226 (100.0%) | 219 (100.0%) |
Real Estate Taxes by Mortgage Status in Englewood
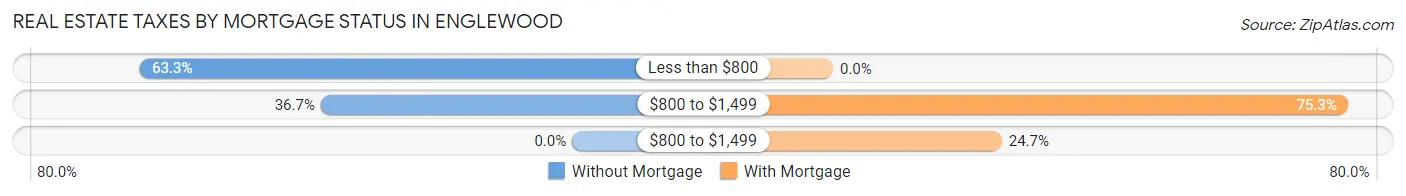
| Property Taxes | Without Mortgage | With Mortgage |
| Less than $800 | 143 (63.3%) | 0 (0.0%) |
| $800 to $1,499 | 83 (36.7%) | 165 (75.3%) |
| $800 to $1,499 | 0 (0.0%) | 54 (24.7%) |
| Total | 226 (100.0%) | 219 (100.0%) |
Health & Disability in Englewood
Health Insurance Coverage by Age in Englewood
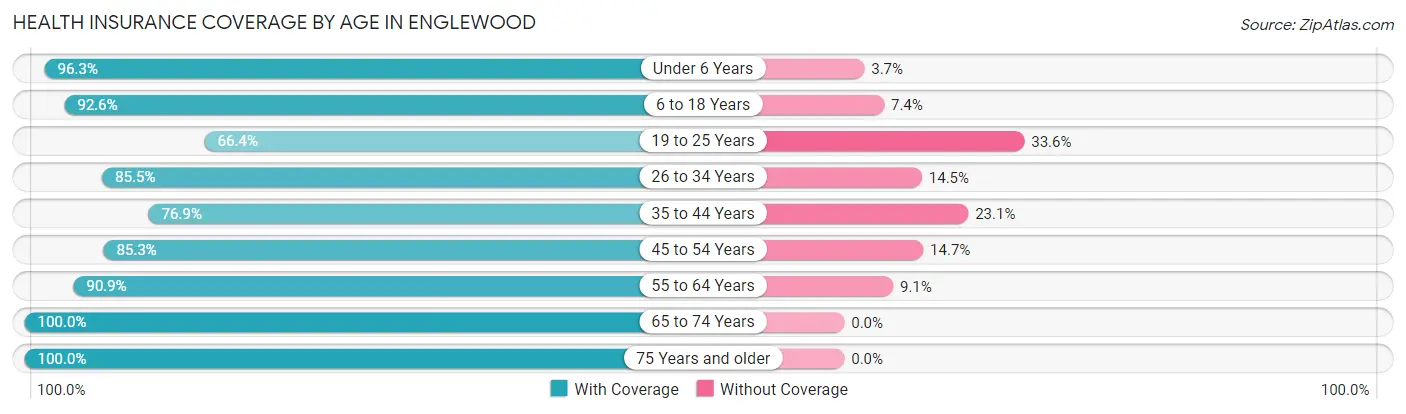
| Age Bracket | With Coverage | Without Coverage |
| Under 6 Years | 129 (96.3%) | 5 (3.7%) |
| 6 to 18 Years | 300 (92.6%) | 24 (7.4%) |
| 19 to 25 Years | 99 (66.4%) | 50 (33.6%) |
| 26 to 34 Years | 71 (85.5%) | 12 (14.5%) |
| 35 to 44 Years | 163 (76.9%) | 49 (23.1%) |
| 45 to 54 Years | 203 (85.3%) | 35 (14.7%) |
| 55 to 64 Years | 150 (90.9%) | 15 (9.1%) |
| 65 to 74 Years | 211 (100.0%) | 0 (0.0%) |
| 75 Years and older | 129 (100.0%) | 0 (0.0%) |
| Total | 1,455 (88.4%) | 190 (11.6%) |
Health Insurance Coverage by Citizenship Status in Englewood
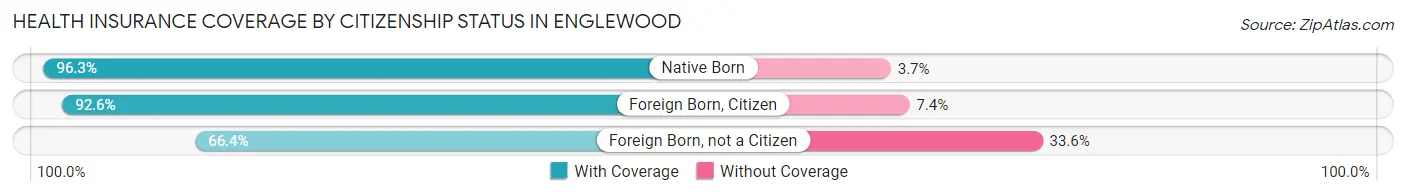
| Citizenship Status | With Coverage | Without Coverage |
| Native Born | 129 (96.3%) | 5 (3.7%) |
| Foreign Born, Citizen | 300 (92.6%) | 24 (7.4%) |
| Foreign Born, not a Citizen | 99 (66.4%) | 50 (33.6%) |
Health Insurance Coverage by Household Income in Englewood
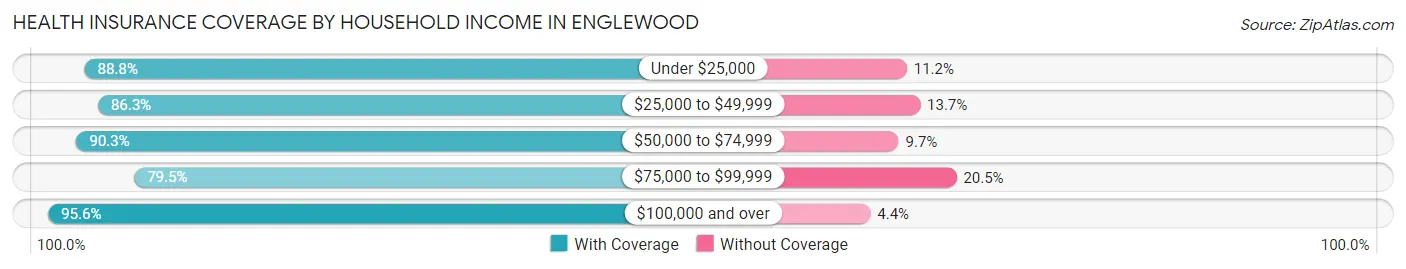
| Household Income | With Coverage | Without Coverage |
| Under $25,000 | 221 (88.8%) | 28 (11.2%) |
| $25,000 to $49,999 | 471 (86.3%) | 75 (13.7%) |
| $50,000 to $74,999 | 335 (90.3%) | 36 (9.7%) |
| $75,000 to $99,999 | 147 (79.5%) | 38 (20.5%) |
| $100,000 and over | 281 (95.6%) | 13 (4.4%) |
Public vs Private Health Insurance Coverage by Age in Englewood
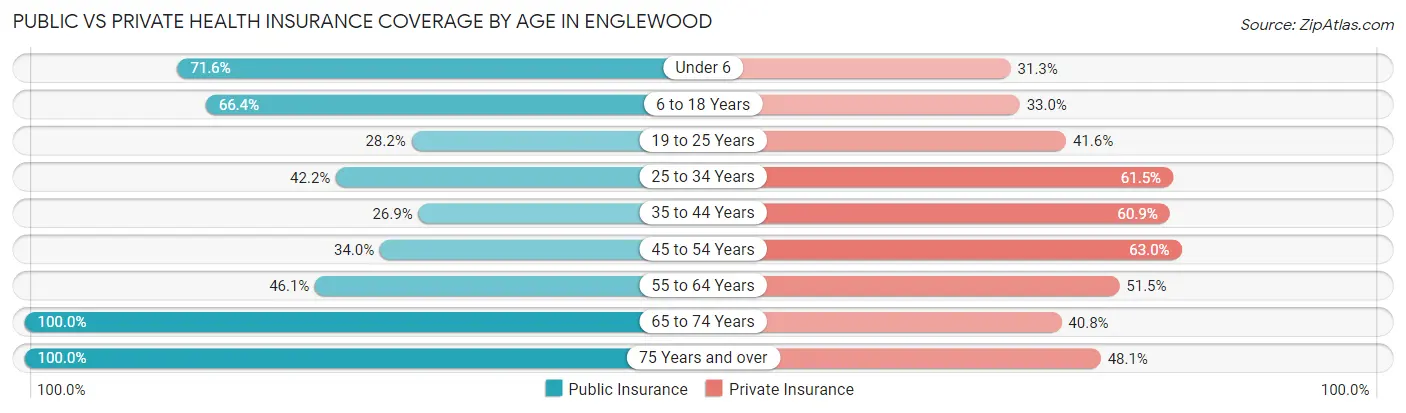
| Age Bracket | Public Insurance | Private Insurance |
| Under 6 | 96 (71.6%) | 42 (31.3%) |
| 6 to 18 Years | 215 (66.4%) | 107 (33.0%) |
| 19 to 25 Years | 42 (28.2%) | 62 (41.6%) |
| 25 to 34 Years | 35 (42.2%) | 51 (61.5%) |
| 35 to 44 Years | 57 (26.9%) | 129 (60.9%) |
| 45 to 54 Years | 81 (34.0%) | 150 (63.0%) |
| 55 to 64 Years | 76 (46.1%) | 85 (51.5%) |
| 65 to 74 Years | 211 (100.0%) | 86 (40.8%) |
| 75 Years and over | 129 (100.0%) | 62 (48.1%) |
| Total | 942 (57.3%) | 774 (47.0%) |
Disability Status by Sex by Age in Englewood
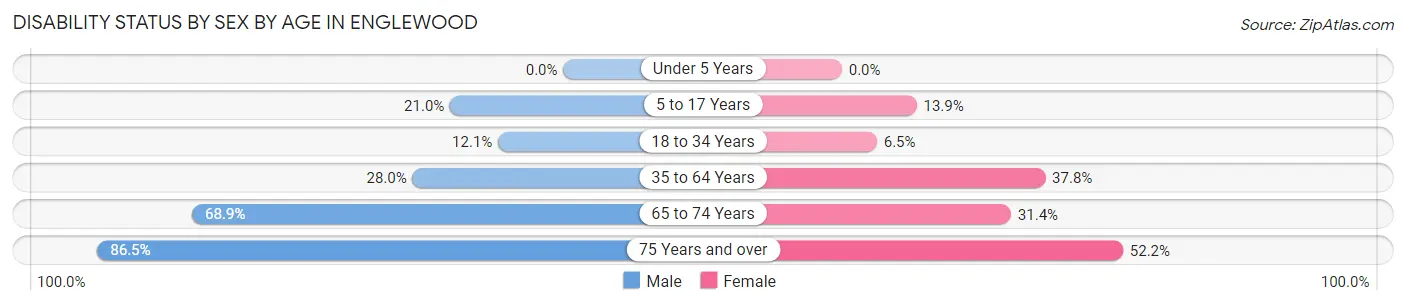
| Age Bracket | Male | Female |
| Under 5 Years | 0 (0.0%) | 0 (0.0%) |
| 5 to 17 Years | 25 (21.0%) | 29 (13.9%) |
| 18 to 34 Years | 15 (12.1%) | 8 (6.5%) |
| 35 to 64 Years | 75 (28.0%) | 131 (37.8%) |
| 65 to 74 Years | 51 (68.9%) | 43 (31.4%) |
| 75 Years and over | 32 (86.5%) | 48 (52.2%) |
Disability Class by Sex by Age in Englewood
Disability Class: Hearing Difficulty
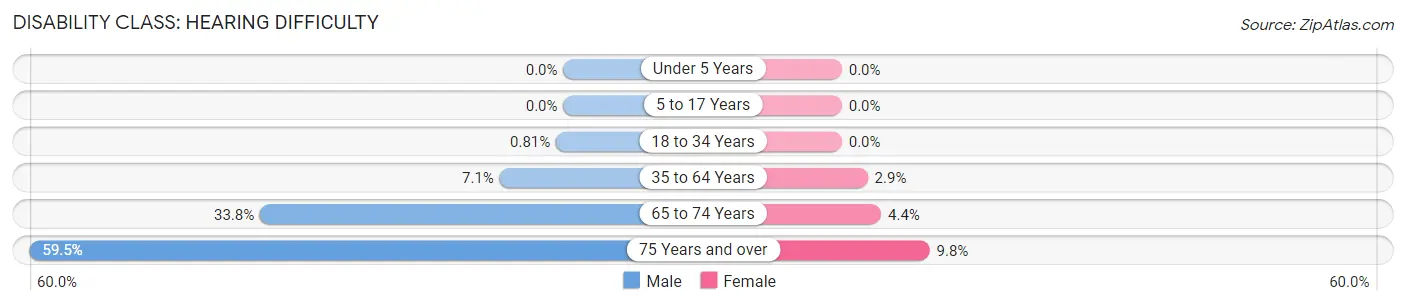
| Age Bracket | Male | Female |
| Under 5 Years | 0 (0.0%) | 0 (0.0%) |
| 5 to 17 Years | 0 (0.0%) | 0 (0.0%) |
| 18 to 34 Years | 1 (0.8%) | 0 (0.0%) |
| 35 to 64 Years | 19 (7.1%) | 10 (2.9%) |
| 65 to 74 Years | 25 (33.8%) | 6 (4.4%) |
| 75 Years and over | 22 (59.5%) | 9 (9.8%) |
Disability Class: Vision Difficulty
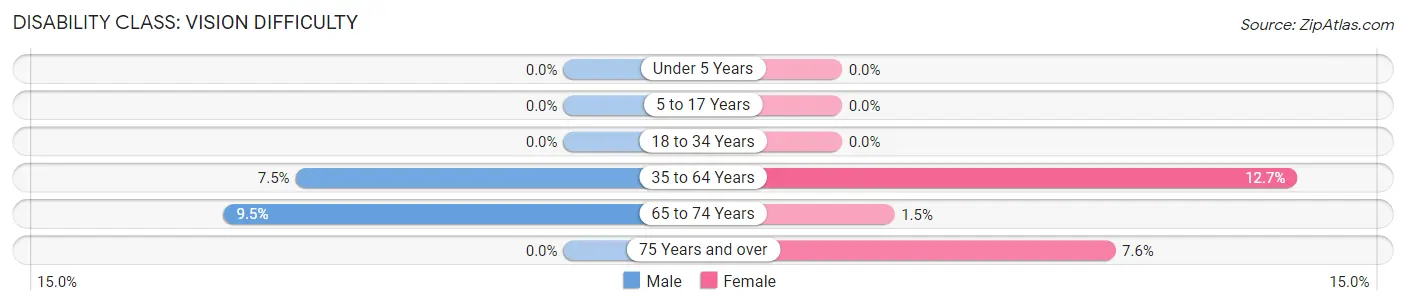
| Age Bracket | Male | Female |
| Under 5 Years | 0 (0.0%) | 0 (0.0%) |
| 5 to 17 Years | 0 (0.0%) | 0 (0.0%) |
| 18 to 34 Years | 0 (0.0%) | 0 (0.0%) |
| 35 to 64 Years | 20 (7.5%) | 44 (12.7%) |
| 65 to 74 Years | 7 (9.5%) | 2 (1.5%) |
| 75 Years and over | 0 (0.0%) | 7 (7.6%) |
Disability Class: Cognitive Difficulty
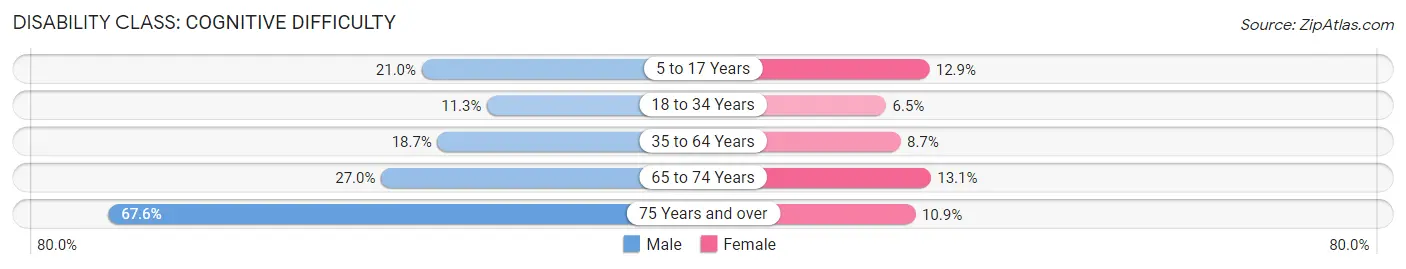
| Age Bracket | Male | Female |
| 5 to 17 Years | 25 (21.0%) | 27 (12.9%) |
| 18 to 34 Years | 14 (11.3%) | 8 (6.5%) |
| 35 to 64 Years | 50 (18.7%) | 30 (8.6%) |
| 65 to 74 Years | 20 (27.0%) | 18 (13.1%) |
| 75 Years and over | 25 (67.6%) | 10 (10.9%) |
Disability Class: Ambulatory Difficulty
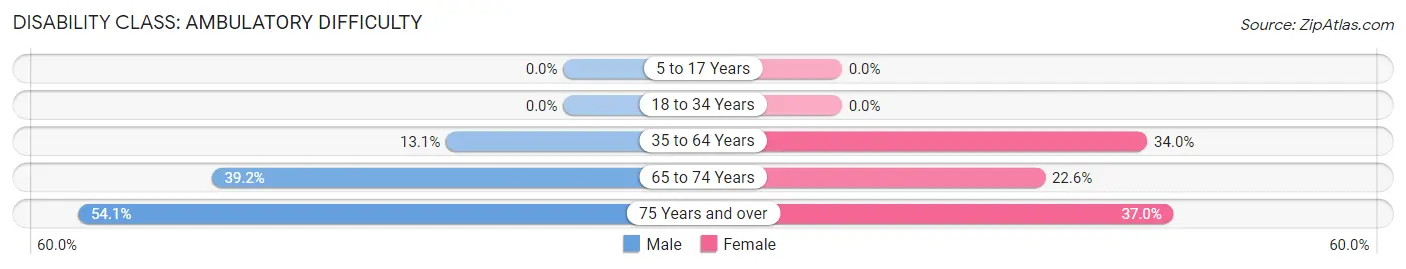
| Age Bracket | Male | Female |
| 5 to 17 Years | 0 (0.0%) | 0 (0.0%) |
| 18 to 34 Years | 0 (0.0%) | 0 (0.0%) |
| 35 to 64 Years | 35 (13.1%) | 118 (34.0%) |
| 65 to 74 Years | 29 (39.2%) | 31 (22.6%) |
| 75 Years and over | 20 (54.0%) | 34 (37.0%) |
Disability Class: Self-Care Difficulty
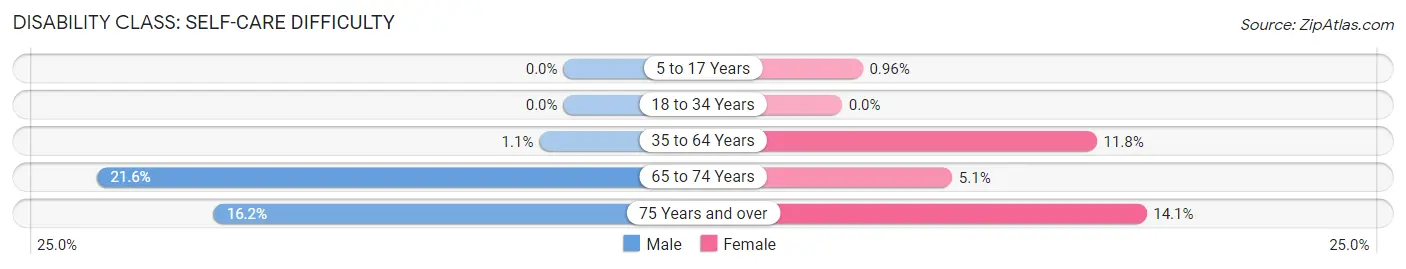
| Age Bracket | Male | Female |
| 5 to 17 Years | 0 (0.0%) | 2 (1.0%) |
| 18 to 34 Years | 0 (0.0%) | 0 (0.0%) |
| 35 to 64 Years | 3 (1.1%) | 41 (11.8%) |
| 65 to 74 Years | 16 (21.6%) | 7 (5.1%) |
| 75 Years and over | 6 (16.2%) | 13 (14.1%) |
Technology Access in Englewood
Computing Device Access in Englewood
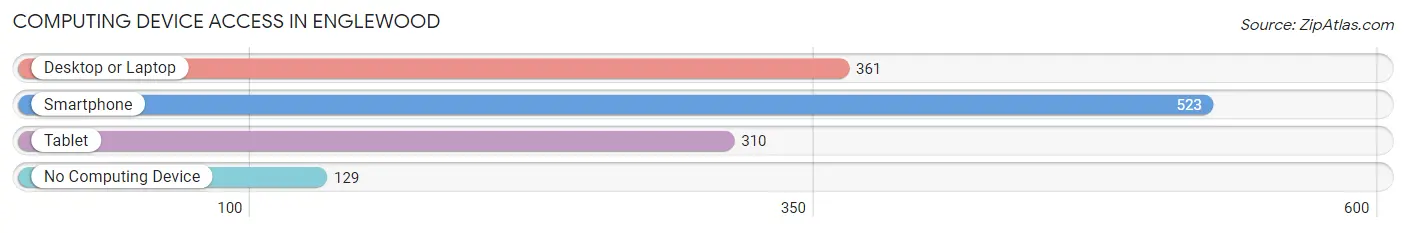
| Device Type | # Households | % Households |
| Desktop or Laptop | 361 | 53.4% |
| Smartphone | 523 | 77.4% |
| Tablet | 310 | 45.9% |
| No Computing Device | 129 | 19.1% |
| Total | 676 | 100.0% |
Internet Access in Englewood
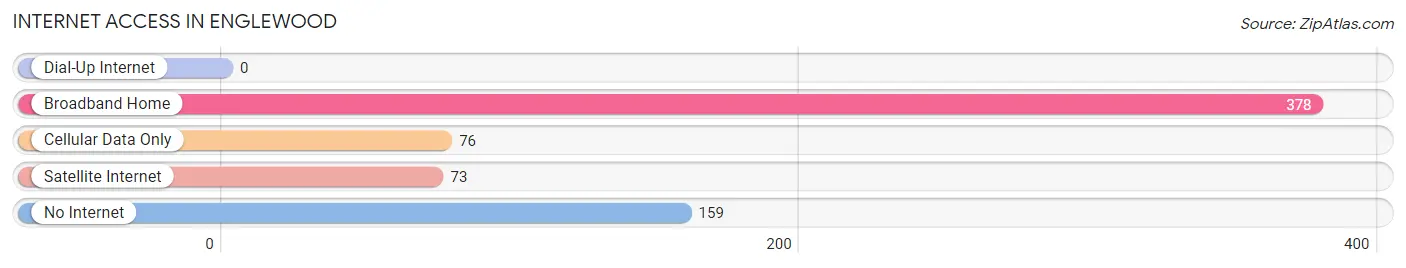
| Internet Type | # Households | % Households |
| Dial-Up Internet | 0 | 0.0% |
| Broadband Home | 378 | 55.9% |
| Cellular Data Only | 76 | 11.2% |
| Satellite Internet | 73 | 10.8% |
| No Internet | 159 | 23.5% |
| Total | 676 | 100.0% |
Englewood Summary
Englewood, Tennessee is a small town located in the northeastern corner of the state, just south of the Kentucky border. It is part of the greater Chattanooga metropolitan area and is situated in the foothills of the Appalachian Mountains. The town has a population of just over 2,000 people and is known for its rural charm and friendly atmosphere.
Geography
Englewood is located in the northeastern corner of Tennessee, just south of the Kentucky border. It is situated in the foothills of the Appalachian Mountains and is part of the greater Chattanooga metropolitan area. The town is located on the banks of the Hiwassee River, which flows through the area. The town is surrounded by rolling hills and lush forests, making it a popular destination for outdoor activities such as hiking, camping, and fishing.
History
Englewood was founded in 1883 by a group of settlers from Kentucky. The town was originally known as “Englewood Station” and was a stop on the Cincinnati Southern Railway. The town was officially incorporated in 1887 and was named after the nearby Englewood Plantation. The town grew steadily throughout the late 19th and early 20th centuries, and by the 1950s, it had become a popular tourist destination.
Economy
Englewood’s economy is largely based on tourism and agriculture. The town is home to several small businesses, including restaurants, shops, and galleries. The town is also home to several farms, which produce a variety of crops, including corn, soybeans, and hay. The town is also home to several manufacturing plants, which produce a variety of products, including furniture, clothing, and automotive parts.
Demographics
As of the 2010 census, Englewood had a population of 2,072 people. The racial makeup of the town was 95.3% White, 1.2% African American, 0.3% Native American, 0.3% Asian, 0.1% Pacific Islander, and 2.8% from other races. The median household income was $37,917, and the median family income was $45,938. The town’s population is largely Christian, with the majority of residents belonging to the Baptist and Methodist denominations.
Conclusion
Englewood, Tennessee is a small town located in the northeastern corner of the state, just south of the Kentucky border. It is part of the greater Chattanooga metropolitan area and is situated in the foothills of the Appalachian Mountains. The town has a population of just over 2,000 people and is known for its rural charm and friendly atmosphere. The town’s economy is largely based on tourism and agriculture, and the town is home to several small businesses, farms, and manufacturing plants. The town’s population is largely Christian, with the majority of residents belonging to the Baptist and Methodist denominations.
Common Questions
What is Per Capita Income in Englewood?
Per Capita income in Englewood is $21,042.
What is the Median Family Income in Englewood?
Median Family Income in Englewood is $51,689.
What is the Median Household income in Englewood?
Median Household Income in Englewood is $45,946.
What is Income or Wage Gap in Englewood?
Income or Wage Gap in Englewood is 26.8%.
Women in Englewood earn 73.2 cents for every dollar earned by a man.
What is Family Income Deficit in Englewood?
Family Income Deficit in Englewood is $13,669.
Families that are below poverty line in Englewood earn $13,669 less on average than the poverty threshold level.
What is Inequality or Gini Index in Englewood?
Inequality or Gini Index in Englewood is 0.37.
What is the Total Population of Englewood?
Total Population of Englewood is 1,645.
What is the Total Male Population of Englewood?
Total Male Population of Englewood is 692.
What is the Total Female Population of Englewood?
Total Female Population of Englewood is 953.
What is the Ratio of Males per 100 Females in Englewood?
There are 72.61 Males per 100 Females in Englewood.
What is the Ratio of Females per 100 Males in Englewood?
There are 137.72 Females per 100 Males in Englewood.
What is the Median Population Age in Englewood?
Median Population Age in Englewood is 40.3 Years.
What is the Average Family Size in Englewood
Average Family Size in Englewood is 2.9 People.
What is the Average Household Size in Englewood
Average Household Size in Englewood is 2.4 People.
How Large is the Labor Force in Englewood?
There are 683 People in the Labor Forcein in Englewood.
What is the Percentage of People in the Labor Force in Englewood?
53.7% of People are in the Labor Force in Englewood.
What is the Unemployment Rate in Englewood?
Unemployment Rate in Englewood is 14.5%.