Dresden, TN Map & Demographics
Dresden Map
Dresden Overview
$39,952
PER CAPITA INCOME
$68,889
AVG FAMILY INCOME
$50,595
AVG HOUSEHOLD INCOME
29.1%
WAGE / INCOME GAP [ % ]
70.9¢/ $1
WAGE / INCOME GAP [ $ ]
0.54
INEQUALITY / GINI INDEX
2,983
TOTAL POPULATION
1,487
MALE POPULATION
1,496
FEMALE POPULATION
99.40
MALES / 100 FEMALES
100.61
FEMALES / 100 MALES
41.8
MEDIAN AGE
3.0
AVG FAMILY SIZE
2.1
AVG HOUSEHOLD SIZE
1,512
LABOR FORCE [ PEOPLE ]
59.9%
PERCENT IN LABOR FORCE
2.4%
UNEMPLOYMENT RATE
Dresden Zip Codes
Dresden Area Codes
Income in Dresden
Income Overview in Dresden
Per Capita Income in Dresden is $39,952, while median incomes of families and households are $68,889 and $50,595 respectively.
| Characteristic | Number | Measure |
| Per Capita Income | 2,983 | $39,952 |
| Median Family Income | 778 | $68,889 |
| Mean Family Income | 778 | $122,544 |
| Median Household Income | 1,330 | $50,595 |
| Mean Household Income | 1,330 | $85,994 |
| Income Deficit | 778 | $0 |
| Wage / Income Gap (%) | 2,983 | 29.12% |
| Wage / Income Gap ($) | 2,983 | 70.88¢ per $1 |
| Gini / Inequality Index | 2,983 | 0.54 |
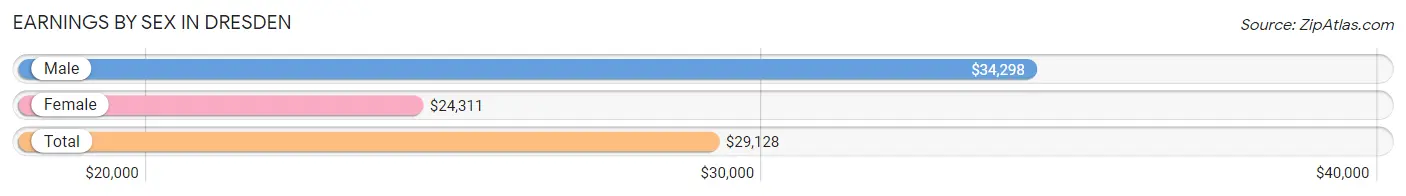
Earnings by Sex in Dresden
Average Earnings in Dresden are $29,128, $34,298 for men and $24,311 for women, a difference of 29.1%.
| Sex | Number | Average Earnings |
| Male | 991 (62.1%) | $34,298 |
| Female | 605 (37.9%) | $24,311 |
| Total | 1,596 (100.0%) | $29,128 |
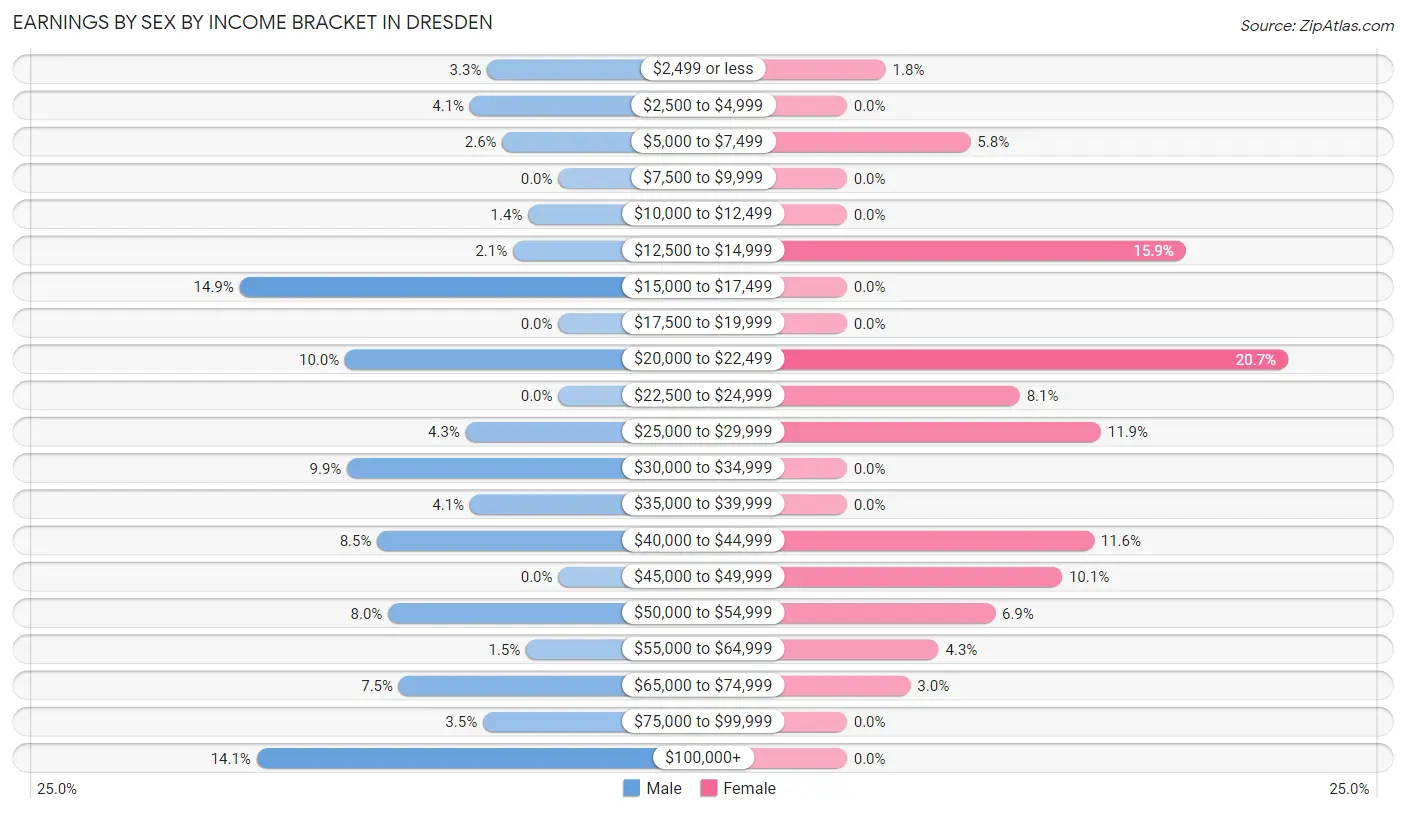
Earnings by Sex by Income Bracket in Dresden
The most common earnings brackets in Dresden are $15,000 to $17,499 for men (148 | 14.9%) and $20,000 to $22,499 for women (125 | 20.7%).
| Income | Male | Female |
| $2,499 or less | 33 (3.3%) | 11 (1.8%) |
| $2,500 to $4,999 | 41 (4.1%) | 0 (0.0%) |
| $5,000 to $7,499 | 26 (2.6%) | 35 (5.8%) |
| $7,500 to $9,999 | 0 (0.0%) | 0 (0.0%) |
| $10,000 to $12,499 | 14 (1.4%) | 0 (0.0%) |
| $12,500 to $14,999 | 21 (2.1%) | 96 (15.9%) |
| $15,000 to $17,499 | 148 (14.9%) | 0 (0.0%) |
| $17,500 to $19,999 | 0 (0.0%) | 0 (0.0%) |
| $20,000 to $22,499 | 99 (10.0%) | 125 (20.7%) |
| $22,500 to $24,999 | 0 (0.0%) | 49 (8.1%) |
| $25,000 to $29,999 | 43 (4.3%) | 72 (11.9%) |
| $30,000 to $34,999 | 98 (9.9%) | 0 (0.0%) |
| $35,000 to $39,999 | 41 (4.1%) | 0 (0.0%) |
| $40,000 to $44,999 | 84 (8.5%) | 70 (11.6%) |
| $45,000 to $49,999 | 0 (0.0%) | 61 (10.1%) |
| $50,000 to $54,999 | 79 (8.0%) | 42 (6.9%) |
| $55,000 to $64,999 | 15 (1.5%) | 26 (4.3%) |
| $65,000 to $74,999 | 74 (7.5%) | 18 (3.0%) |
| $75,000 to $99,999 | 35 (3.5%) | 0 (0.0%) |
| $100,000+ | 140 (14.1%) | 0 (0.0%) |
| Total | 991 (100.0%) | 605 (100.0%) |
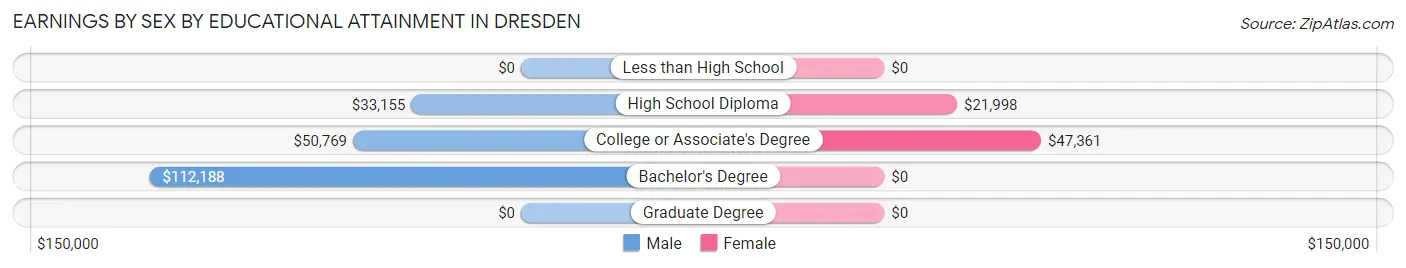
Earnings by Sex by Educational Attainment in Dresden
Average earnings in Dresden are $34,834 for men and $22,577 for women, a difference of 35.2%. Men with an educational attainment of bachelor's degree enjoy the highest average annual earnings of $112,188, while those with high school diploma education earn the least with $33,155. Women with an educational attainment of college or associate's degree earn the most with the average annual earnings of $47,361, while those with high school diploma education have the smallest earnings of $21,998.
| Educational Attainment | Male Income | Female Income |
| Less than High School | - | - |
| High School Diploma | $33,155 | $21,998 |
| College or Associate's Degree | $50,769 | $47,361 |
| Bachelor's Degree | $112,188 | $0 |
| Graduate Degree | - | - |
| Total | $34,834 | $22,577 |
Family Income in Dresden
Family Income Brackets in Dresden
According to the Dresden family income data, there are 275 families falling into the $50,000 to $74,999 income range, which is the most common income bracket and makes up 35.3% of all families.
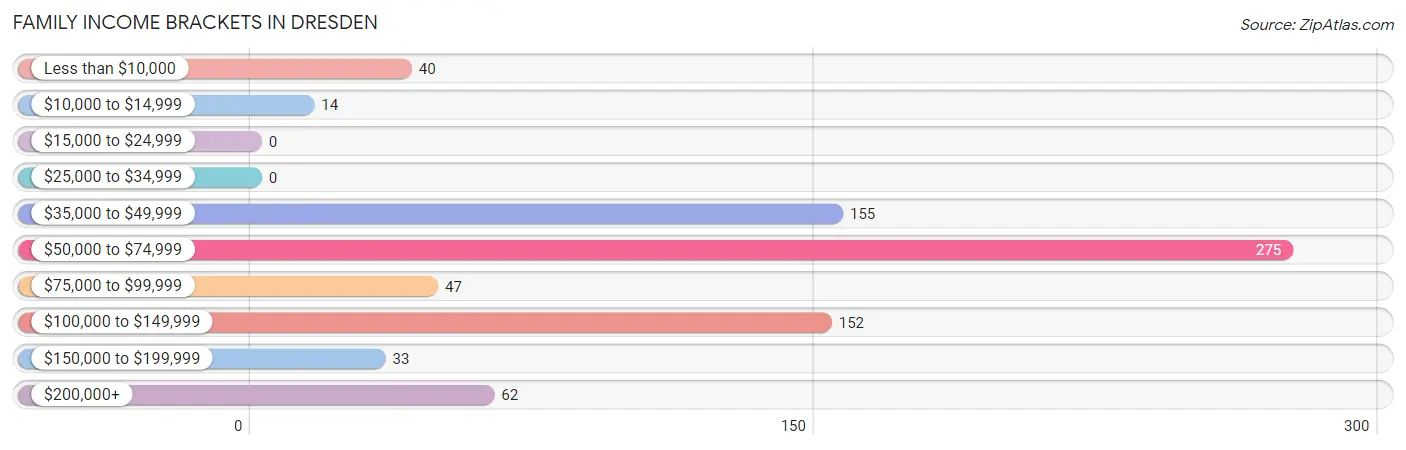
| Income Bracket | # Families | % Families |
| Less than $10,000 | 40 | 5.1% |
| $10,000 to $14,999 | 14 | 1.8% |
| $15,000 to $24,999 | 0 | 0.0% |
| $25,000 to $34,999 | 0 | 0.0% |
| $35,000 to $49,999 | 155 | 19.9% |
| $50,000 to $74,999 | 275 | 35.3% |
| $75,000 to $99,999 | 47 | 6.0% |
| $100,000 to $149,999 | 152 | 19.5% |
| $150,000 to $199,999 | 33 | 4.2% |
| $200,000+ | 62 | 8.0% |
Family Income by Famaliy Size in Dresden
3-person families (393 | 50.5%) account for the highest median family income in Dresden with $68,490 per family, while 2-person families (243 | 31.2%) have the highest median income of $29,504 per family member.
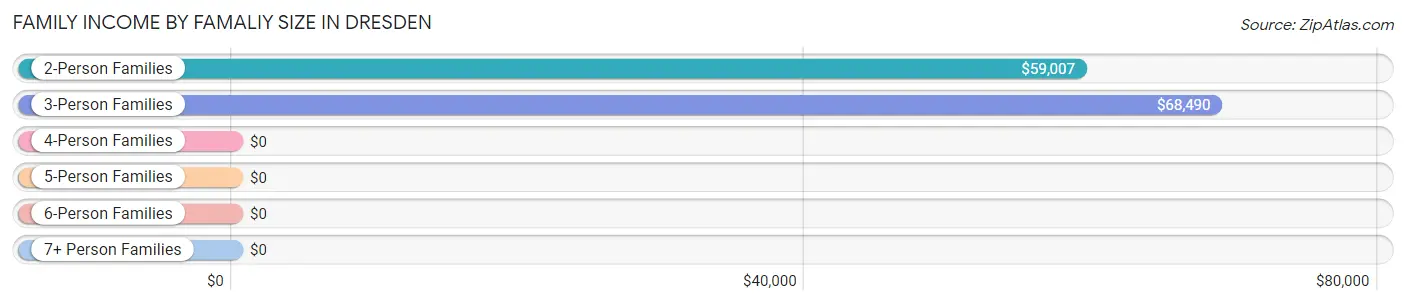
| Income Bracket | # Families | Median Income |
| 2-Person Families | 243 (31.2%) | $59,007 |
| 3-Person Families | 393 (50.5%) | $68,490 |
| 4-Person Families | 93 (11.9%) | $0 |
| 5-Person Families | 19 (2.4%) | $0 |
| 6-Person Families | 30 (3.9%) | $0 |
| 7+ Person Families | 0 (0.0%) | $0 |
| Total | 778 (100.0%) | $68,889 |
Family Income by Number of Earners in Dresden
The median family income in Dresden is $68,889, with families comprising 3+ earners (89) having the highest median family income of $160,341, while families with no earners (78) have the lowest median family income of $2,499, accounting for 11.4% and 10.0% of families, respectively.
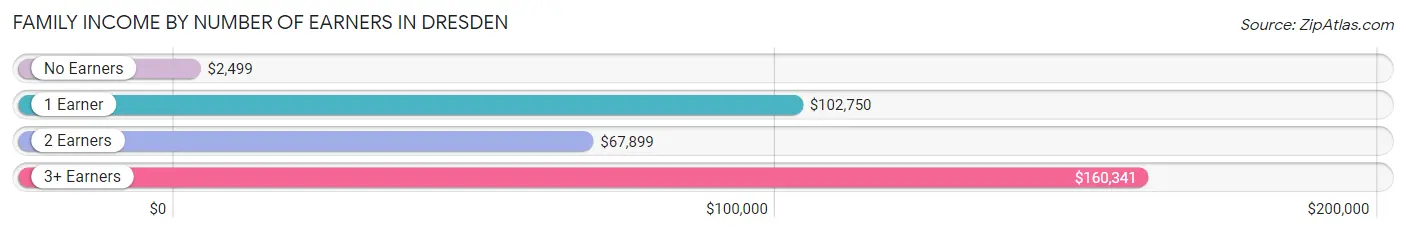
| Number of Earners | # Families | Median Income |
| No Earners | 78 (10.0%) | $2,499 |
| 1 Earner | 170 (21.8%) | $102,750 |
| 2 Earners | 441 (56.7%) | $67,899 |
| 3+ Earners | 89 (11.4%) | $160,341 |
| Total | 778 (100.0%) | $68,889 |
Household Income in Dresden
Household Income Brackets in Dresden
With 362 households falling in the category, the $50,000 to $74,999 income range is the most frequent in Dresden, accounting for 27.2% of all households. In contrast, only 33 households (2.5%) fall into the $150,000 to $199,999 income bracket, making it the least populous group.
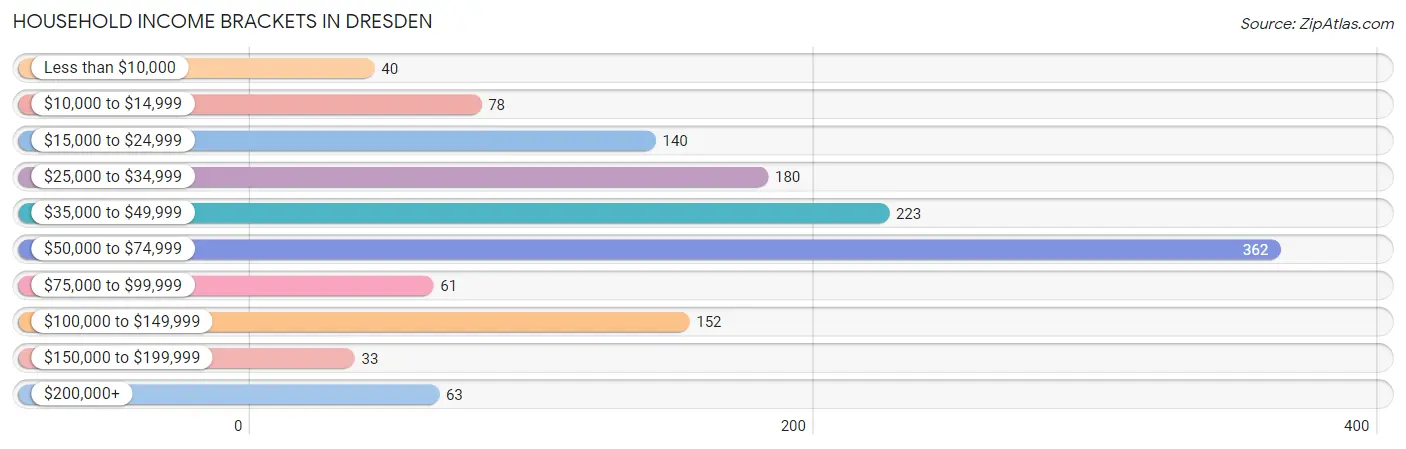
| Income Bracket | # Households | % Households |
| Less than $10,000 | 40 | 3.0% |
| $10,000 to $14,999 | 78 | 5.9% |
| $15,000 to $24,999 | 140 | 10.5% |
| $25,000 to $34,999 | 180 | 13.5% |
| $35,000 to $49,999 | 223 | 16.8% |
| $50,000 to $74,999 | 362 | 27.2% |
| $75,000 to $99,999 | 61 | 4.6% |
| $100,000 to $149,999 | 152 | 11.4% |
| $150,000 to $199,999 | 33 | 2.5% |
| $200,000+ | 63 | 4.7% |
Household Income by Householder Age in Dresden
The median household income in Dresden is $50,595, with the highest median household income of $95,469 found in the 45 to 64 years age bracket for the primary householder. A total of 286 households (21.5%) fall into this category. Meanwhile, the 15 to 24 years age bracket for the primary householder has the lowest median household income of $0, with 151 households (11.4%) in this group.
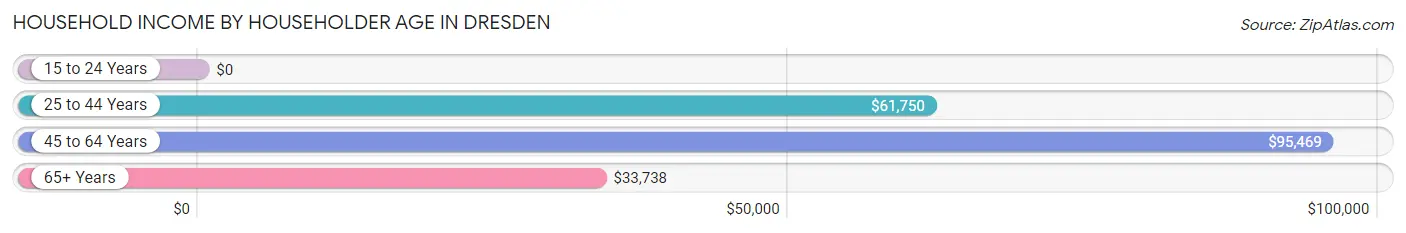
| Income Bracket | # Households | Median Income |
| 15 to 24 Years | 151 (11.4%) | $0 |
| 25 to 44 Years | 376 (28.3%) | $61,750 |
| 45 to 64 Years | 286 (21.5%) | $95,469 |
| 65+ Years | 517 (38.9%) | $33,738 |
| Total | 1,330 (100.0%) | $50,595 |
Poverty in Dresden
Income Below Poverty by Sex and Age in Dresden
With 5.8% poverty level for males and 9.9% for females among the residents of Dresden, under 5 year old males and 16 and 17 year old females are the most vulnerable to poverty, with 40 males (24.5%) and 21 females (65.6%) in their respective age groups living below the poverty level.
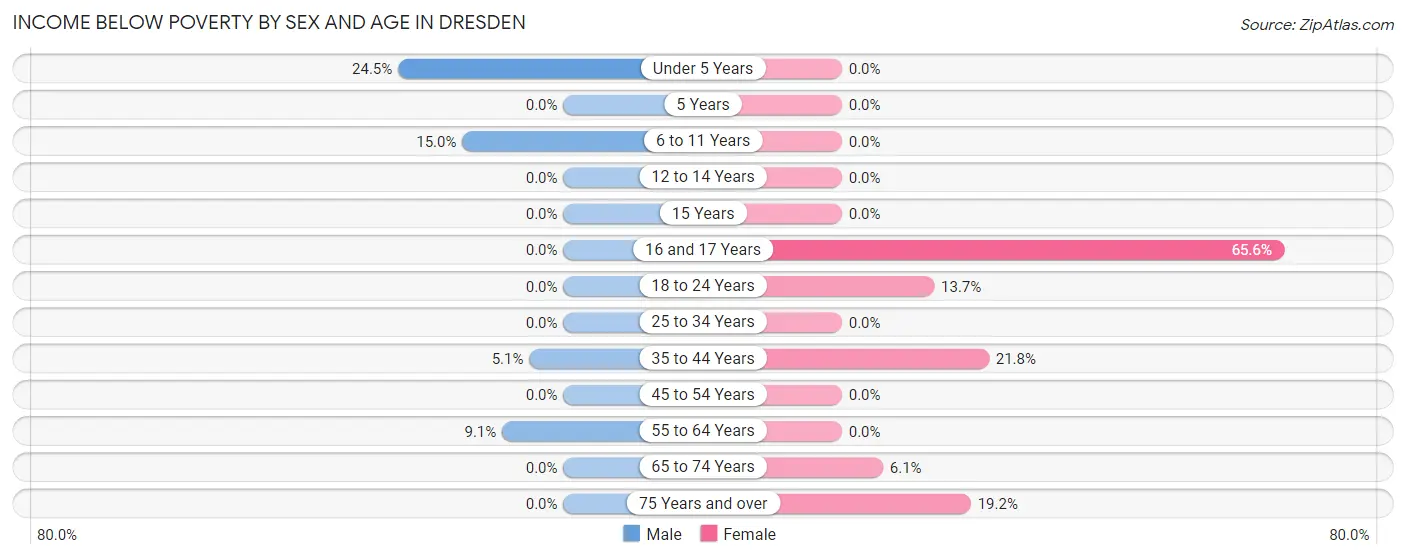
| Age Bracket | Male | Female |
| Under 5 Years | 40 (24.5%) | 0 (0.0%) |
| 5 Years | 0 (0.0%) | 0 (0.0%) |
| 6 to 11 Years | 12 (15.0%) | 0 (0.0%) |
| 12 to 14 Years | 0 (0.0%) | 0 (0.0%) |
| 15 Years | 0 (0.0%) | 0 (0.0%) |
| 16 and 17 Years | 0 (0.0%) | 21 (65.6%) |
| 18 to 24 Years | 0 (0.0%) | 27 (13.7%) |
| 25 to 34 Years | 0 (0.0%) | 0 (0.0%) |
| 35 to 44 Years | 14 (5.1%) | 55 (21.8%) |
| 45 to 54 Years | 0 (0.0%) | 0 (0.0%) |
| 55 to 64 Years | 14 (9.1%) | 0 (0.0%) |
| 65 to 74 Years | 0 (0.0%) | 15 (6.1%) |
| 75 Years and over | 0 (0.0%) | 27 (19.2%) |
| Total | 80 (5.8%) | 145 (9.9%) |
Income Above Poverty by Sex and Age in Dresden
According to the poverty statistics in Dresden, males aged 12 to 14 years and females aged 6 to 11 years are the age groups that are most secure financially, with 100.0% of males and 100.0% of females in these age groups living above the poverty line.
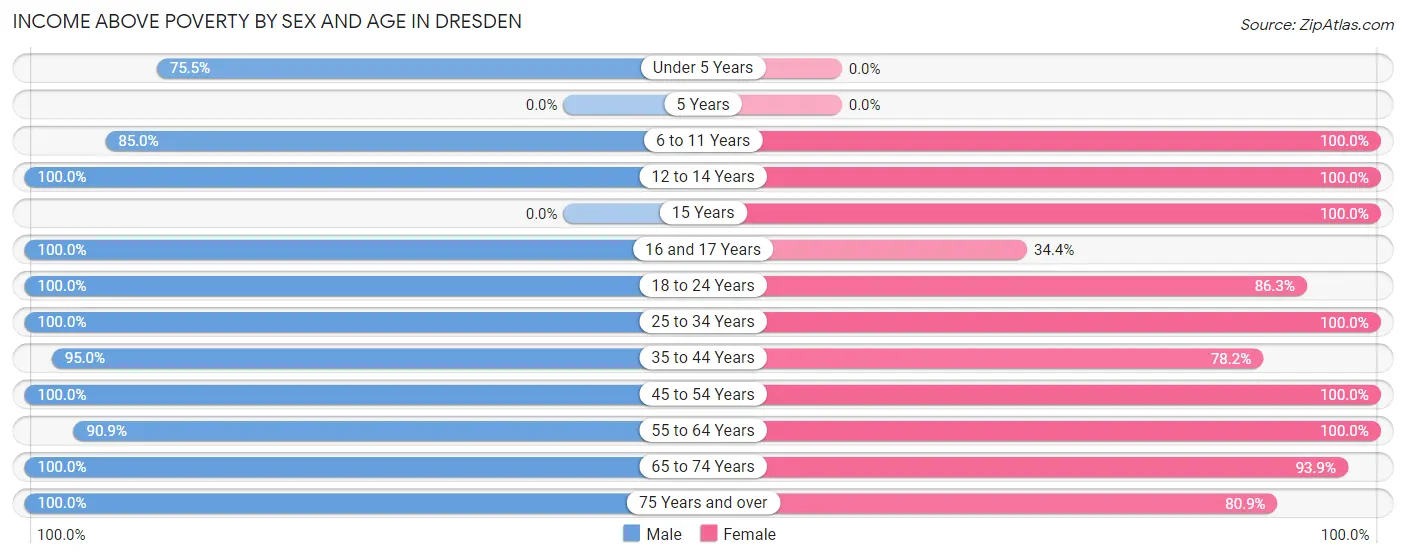
| Age Bracket | Male | Female |
| Under 5 Years | 123 (75.5%) | 0 (0.0%) |
| 5 Years | 0 (0.0%) | 0 (0.0%) |
| 6 to 11 Years | 68 (85.0%) | 89 (100.0%) |
| 12 to 14 Years | 48 (100.0%) | 42 (100.0%) |
| 15 Years | 0 (0.0%) | 37 (100.0%) |
| 16 and 17 Years | 41 (100.0%) | 11 (34.4%) |
| 18 to 24 Years | 105 (100.0%) | 170 (86.3%) |
| 25 to 34 Years | 166 (100.0%) | 69 (100.0%) |
| 35 to 44 Years | 263 (95.0%) | 197 (78.2%) |
| 45 to 54 Years | 66 (100.0%) | 249 (100.0%) |
| 55 to 64 Years | 140 (90.9%) | 117 (100.0%) |
| 65 to 74 Years | 175 (100.0%) | 231 (93.9%) |
| 75 Years and over | 116 (100.0%) | 114 (80.8%) |
| Total | 1,311 (94.3%) | 1,326 (90.1%) |
Income Below Poverty Among Married-Couple Families in Dresden
The poverty statistics for married-couple families in Dresden show that 2.3% or 14 of the total 610 families live below the poverty line. Families with 1 or 2 children have the highest poverty rate of 4.8%, comprising of 14 families. On the other hand, families with no children have the lowest poverty rate of 0.0%, which includes 0 families.
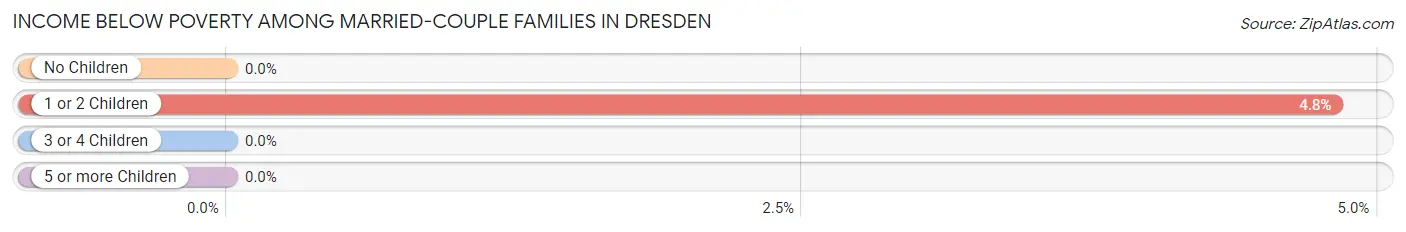
| Children | Above Poverty | Below Poverty |
| No Children | 289 (100.0%) | 0 (0.0%) |
| 1 or 2 Children | 277 (95.2%) | 14 (4.8%) |
| 3 or 4 Children | 30 (100.0%) | 0 (0.0%) |
| 5 or more Children | 0 (0.0%) | 0 (0.0%) |
| Total | 596 (97.7%) | 14 (2.3%) |
Income Below Poverty Among Single-Parent Households in Dresden
According to the poverty data in Dresden, 20.0% or 14 single-father households and 26.5% or 26 single-mother households are living below the poverty line. Among single-father households, those with 1 or 2 children have the highest poverty rate, with 14 households (40.0%) experiencing poverty. Likewise, among single-mother households, those with 1 or 2 children have the highest poverty rate, with 26 households (100.0%) falling below the poverty line.
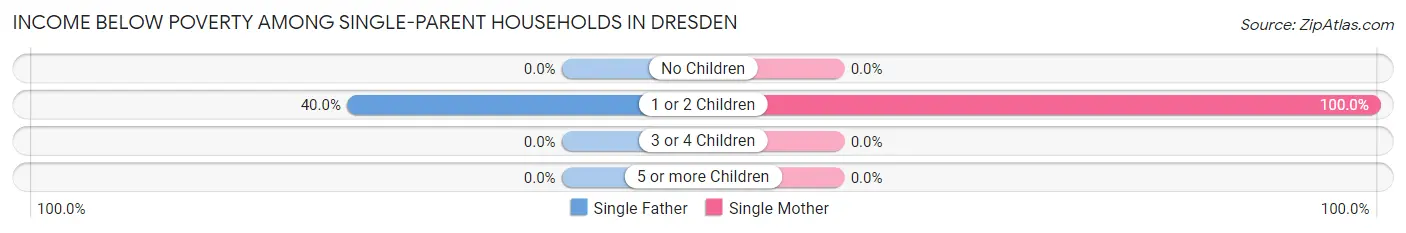
| Children | Single Father | Single Mother |
| No Children | 0 (0.0%) | 0 (0.0%) |
| 1 or 2 Children | 14 (40.0%) | 26 (100.0%) |
| 3 or 4 Children | 0 (0.0%) | 0 (0.0%) |
| 5 or more Children | 0 (0.0%) | 0 (0.0%) |
| Total | 14 (20.0%) | 26 (26.5%) |
Income Below Poverty Among Married-Couple vs Single-Parent Households in Dresden
The poverty data for Dresden shows that 14 of the married-couple family households (2.3%) and 40 of the single-parent households (23.8%) are living below the poverty level. Within the married-couple family households, those with 1 or 2 children have the highest poverty rate, with 14 households (4.8%) falling below the poverty line. Among the single-parent households, those with 1 or 2 children have the highest poverty rate, with 40 household (65.6%) living below poverty.
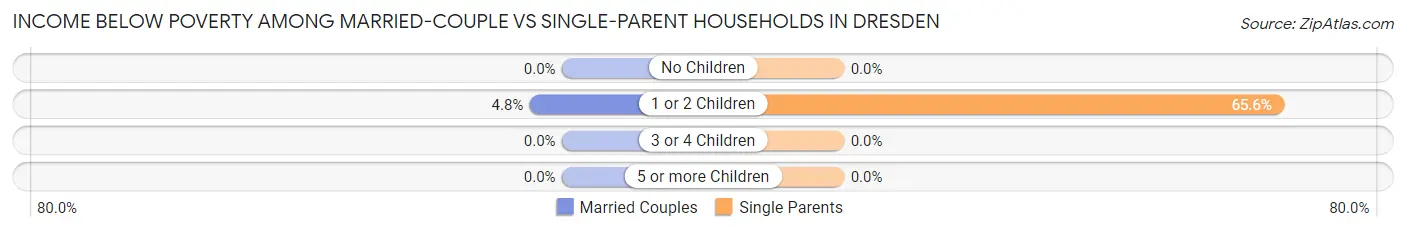
| Children | Married-Couple Families | Single-Parent Households |
| No Children | 0 (0.0%) | 0 (0.0%) |
| 1 or 2 Children | 14 (4.8%) | 40 (65.6%) |
| 3 or 4 Children | 0 (0.0%) | 0 (0.0%) |
| 5 or more Children | 0 (0.0%) | 0 (0.0%) |
| Total | 14 (2.3%) | 40 (23.8%) |
Race in Dresden
The most populous races in Dresden are White / Caucasian (2,796 | 93.7%), Black / African American (184 | 6.2%), and Hispanic or Latino (59 | 2.0%).
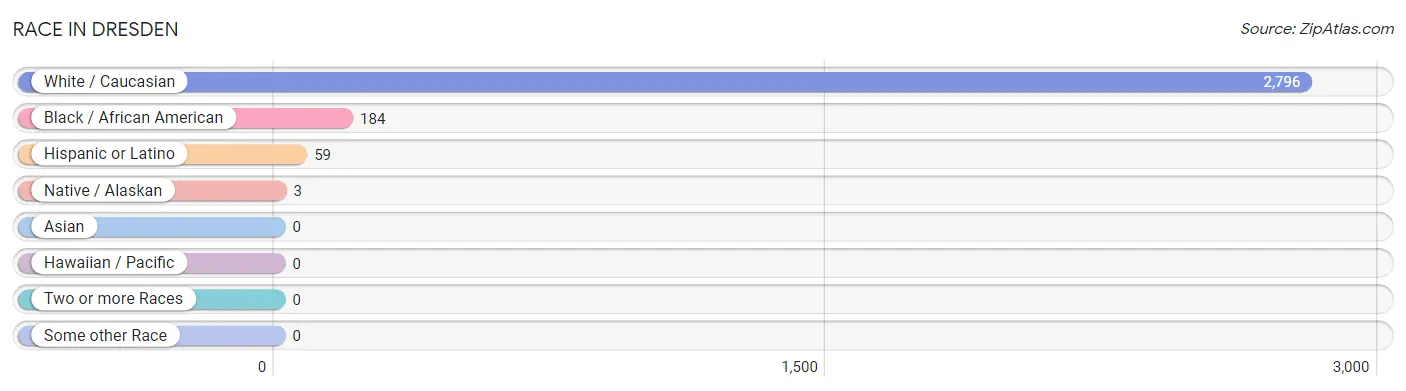
| Race | # Population | % Population |
| Asian | 0 | 0.0% |
| Black / African American | 184 | 6.2% |
| Hawaiian / Pacific | 0 | 0.0% |
| Hispanic or Latino | 59 | 2.0% |
| Native / Alaskan | 3 | 0.1% |
| White / Caucasian | 2,796 | 93.7% |
| Two or more Races | 0 | 0.0% |
| Some other Race | 0 | 0.0% |
| Total | 2,983 | 100.0% |
Ancestry in Dresden
The most populous ancestries reported in Dresden are American (1,145 | 38.4%), English (488 | 16.4%), Irish (247 | 8.3%), Italian (79 | 2.6%), and German (61 | 2.0%), together accounting for 67.7% of all Dresden residents.
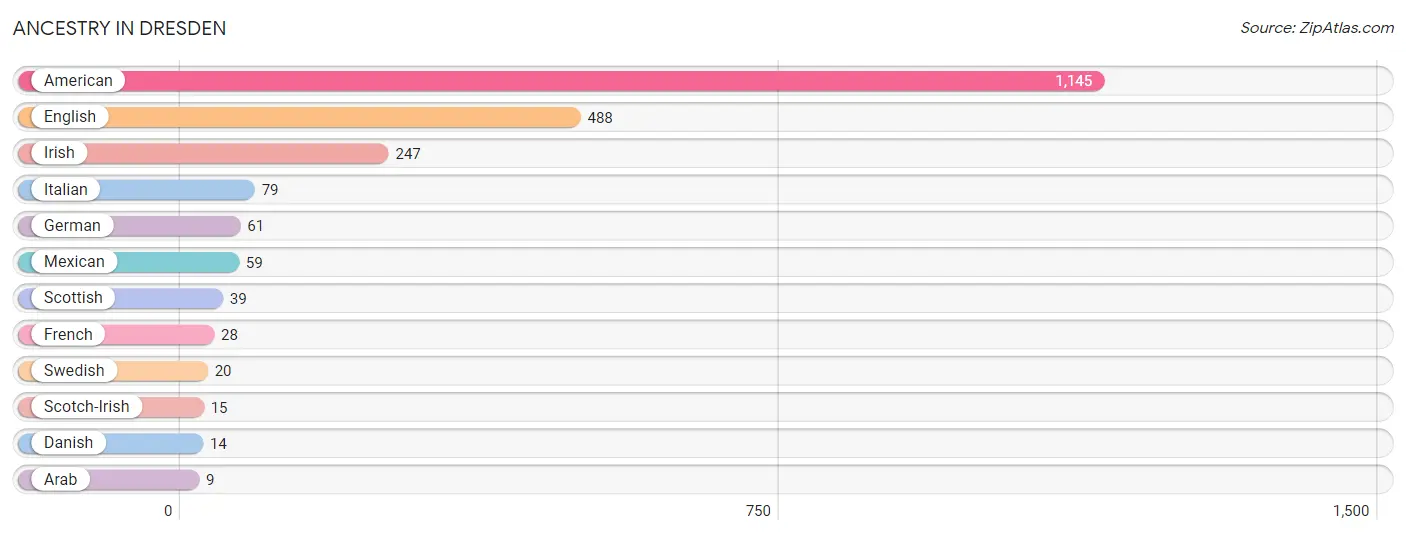
| Ancestry | # Population | % Population |
| American | 1,145 | 38.4% |
| Arab | 9 | 0.3% |
| Danish | 14 | 0.5% |
| English | 488 | 16.4% |
| French | 28 | 0.9% |
| German | 61 | 2.0% |
| Irish | 247 | 8.3% |
| Italian | 79 | 2.6% |
| Mexican | 59 | 2.0% |
| Scotch-Irish | 15 | 0.5% |
| Scottish | 39 | 1.3% |
| Swedish | 20 | 0.7% | View All 12 Rows |
Immigrants in Dresden

| Immigration Origin | # Population | % Population | View All 0 Rows |
Sex and Age in Dresden
Sex and Age in Dresden
The most populous age groups in Dresden are 40 to 44 Years (203 | 13.7%) for men and 15 to 19 Years (187 | 12.5%) for women.
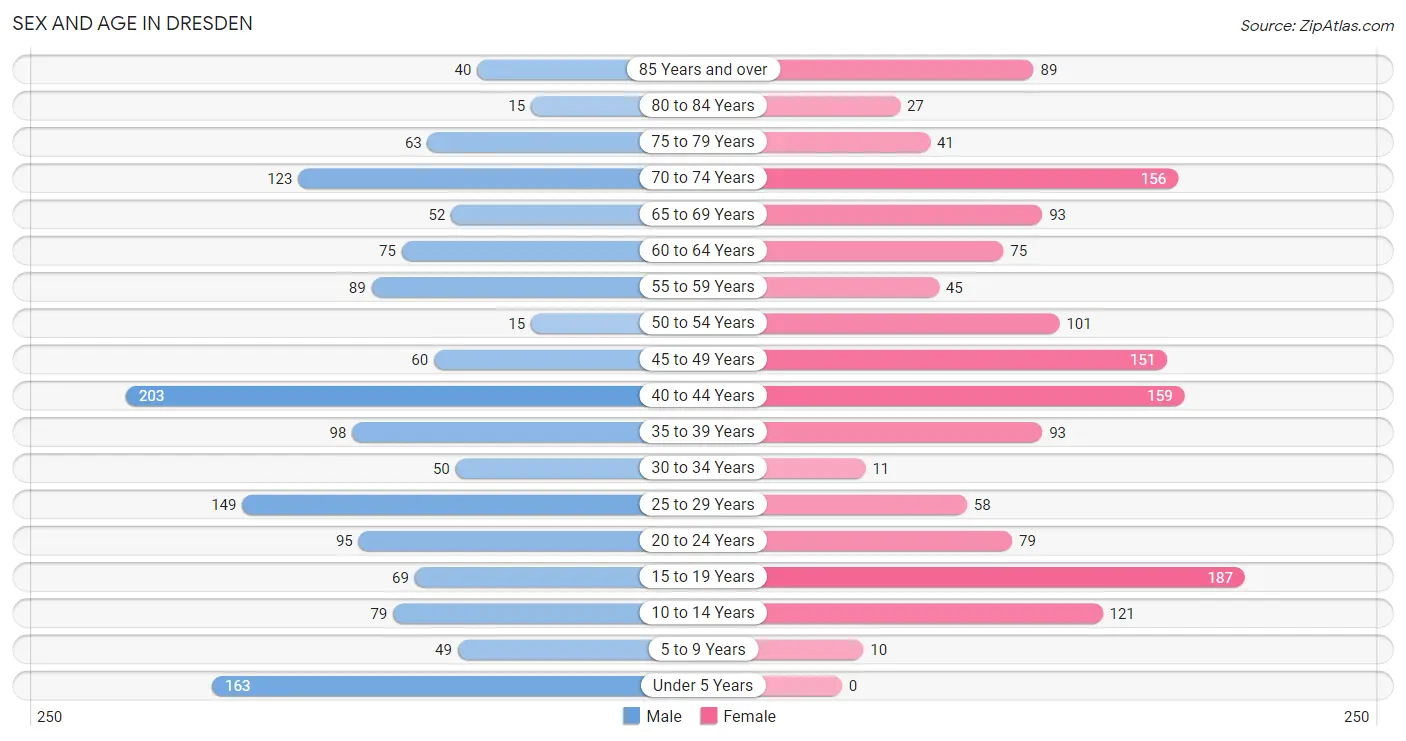
| Age Bracket | Male | Female |
| Under 5 Years | 163 (11.0%) | 0 (0.0%) |
| 5 to 9 Years | 49 (3.3%) | 10 (0.7%) |
| 10 to 14 Years | 79 (5.3%) | 121 (8.1%) |
| 15 to 19 Years | 69 (4.6%) | 187 (12.5%) |
| 20 to 24 Years | 95 (6.4%) | 79 (5.3%) |
| 25 to 29 Years | 149 (10.0%) | 58 (3.9%) |
| 30 to 34 Years | 50 (3.4%) | 11 (0.7%) |
| 35 to 39 Years | 98 (6.6%) | 93 (6.2%) |
| 40 to 44 Years | 203 (13.7%) | 159 (10.6%) |
| 45 to 49 Years | 60 (4.0%) | 151 (10.1%) |
| 50 to 54 Years | 15 (1.0%) | 101 (6.8%) |
| 55 to 59 Years | 89 (6.0%) | 45 (3.0%) |
| 60 to 64 Years | 75 (5.0%) | 75 (5.0%) |
| 65 to 69 Years | 52 (3.5%) | 93 (6.2%) |
| 70 to 74 Years | 123 (8.3%) | 156 (10.4%) |
| 75 to 79 Years | 63 (4.2%) | 41 (2.7%) |
| 80 to 84 Years | 15 (1.0%) | 27 (1.8%) |
| 85 Years and over | 40 (2.7%) | 89 (5.9%) |
| Total | 1,487 (100.0%) | 1,496 (100.0%) |
Families and Households in Dresden
Median Family Size in Dresden
The median family size in Dresden is 2.95 persons per family, with single female/mother families (98 | 12.6%) accounting for the largest median family size of 3.34 persons per family. On the other hand, single male/father families (70 | 9.0%) represent the smallest median family size with 1.97 persons per family.
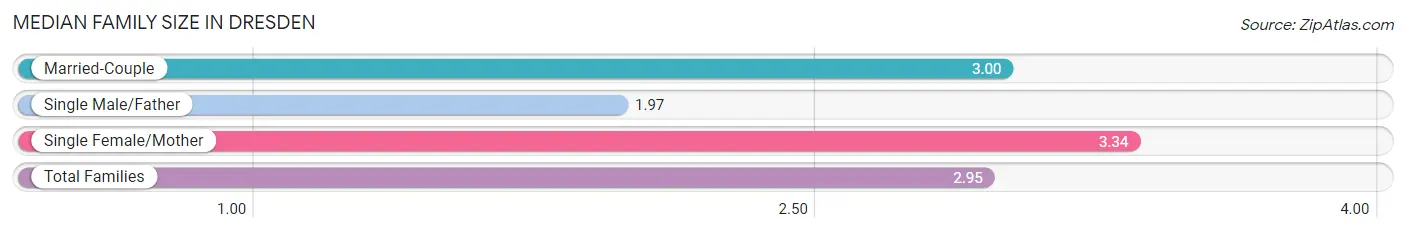
| Family Type | # Families | Family Size |
| Married-Couple | 610 (78.4%) | 3.00 |
| Single Male/Father | 70 (9.0%) | 1.97 |
| Single Female/Mother | 98 (12.6%) | 3.34 |
| Total Families | 778 (100.0%) | 2.95 |
Median Household Size in Dresden
The median household size in Dresden is 2.15 persons per household, with single female/mother households (98 | 7.4%) accounting for the largest median household size of 3.34 persons per household. non-family households (552 | 41.5%) represent the smallest median household size with 1.03 persons per household.
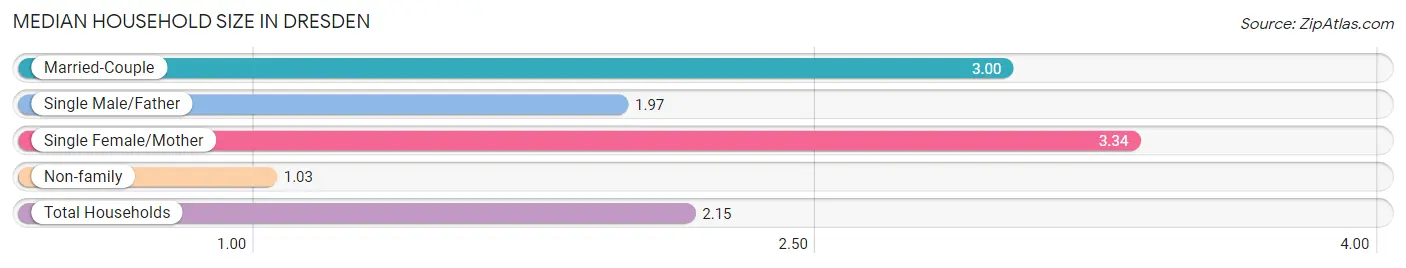
| Household Type | # Households | Household Size |
| Married-Couple | 610 (45.9%) | 3.00 |
| Single Male/Father | 70 (5.3%) | 1.97 |
| Single Female/Mother | 98 (7.4%) | 3.34 |
| Non-family | 552 (41.5%) | 1.03 |
| Total Households | 1,330 (100.0%) | 2.15 |
Household Size by Marriage Status in Dresden
Out of a total of 1,330 households in Dresden, 778 (58.5%) are family households, while 552 (41.5%) are nonfamily households. The most numerous type of family households are 3-person households, comprising 393, and the most common type of nonfamily households are 1-person households, comprising 494.
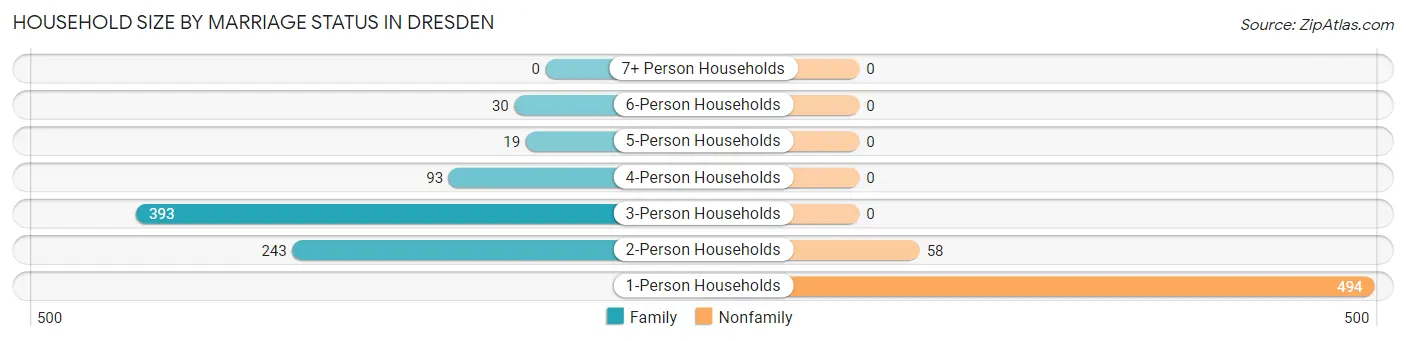
| Household Size | Family Households | Nonfamily Households |
| 1-Person Households | - | 494 (37.1%) |
| 2-Person Households | 243 (18.3%) | 58 (4.4%) |
| 3-Person Households | 393 (29.5%) | 0 (0.0%) |
| 4-Person Households | 93 (7.0%) | 0 (0.0%) |
| 5-Person Households | 19 (1.4%) | 0 (0.0%) |
| 6-Person Households | 30 (2.3%) | 0 (0.0%) |
| 7+ Person Households | 0 (0.0%) | 0 (0.0%) |
| Total | 778 (58.5%) | 552 (41.5%) |
Female Fertility in Dresden
Fertility by Age in Dresden
Average fertility rate in Dresden is 25.0 births per 1,000 women. Women in the age bracket of 35 to 50 years have the highest fertility rate with 45.0 births per 1,000 women. Women in the age bracket of 35 to 50 years acount for 100.0% of all women with births.
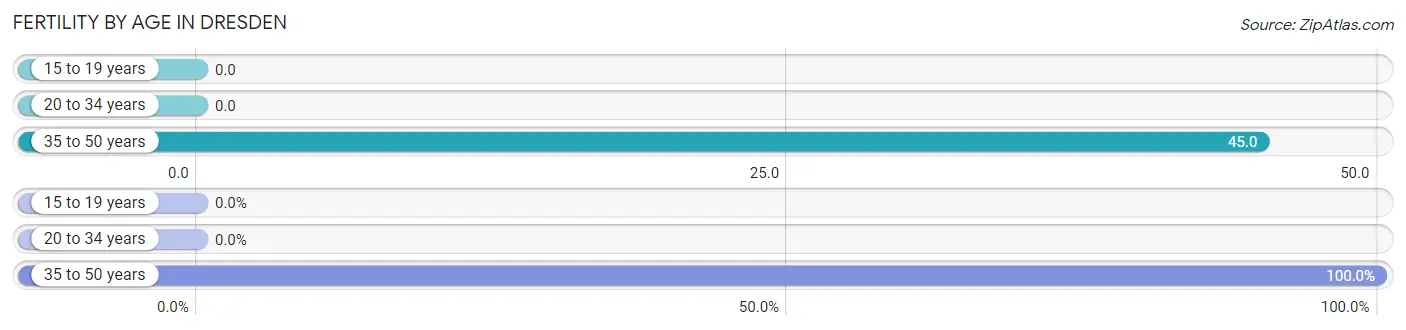
| Age Bracket | Women with Births | Births / 1,000 Women |
| 15 to 19 years | 0 (0.0%) | 0.0 |
| 20 to 34 years | 0 (0.0%) | 0.0 |
| 35 to 50 years | 19 (100.0%) | 45.0 |
| Total | 19 (100.0%) | 25.0 |
Fertility by Age by Marriage Status in Dresden
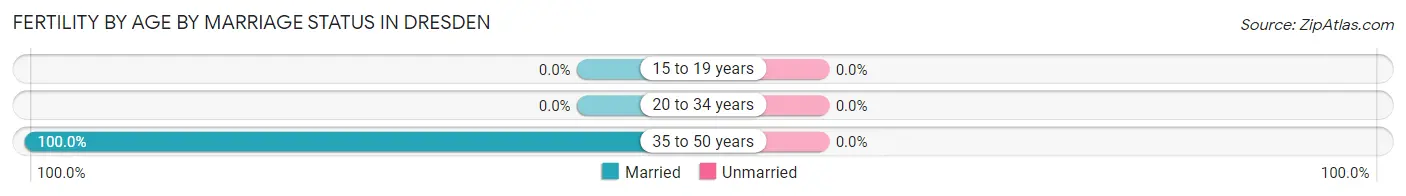
| Age Bracket | Married | Unmarried |
| 15 to 19 years | 0 (0.0%) | 0 (0.0%) |
| 20 to 34 years | 0 (0.0%) | 0 (0.0%) |
| 35 to 50 years | 19 (100.0%) | 0 (0.0%) |
| Total | 19 (100.0%) | 0 (0.0%) |
Fertility by Education in Dresden
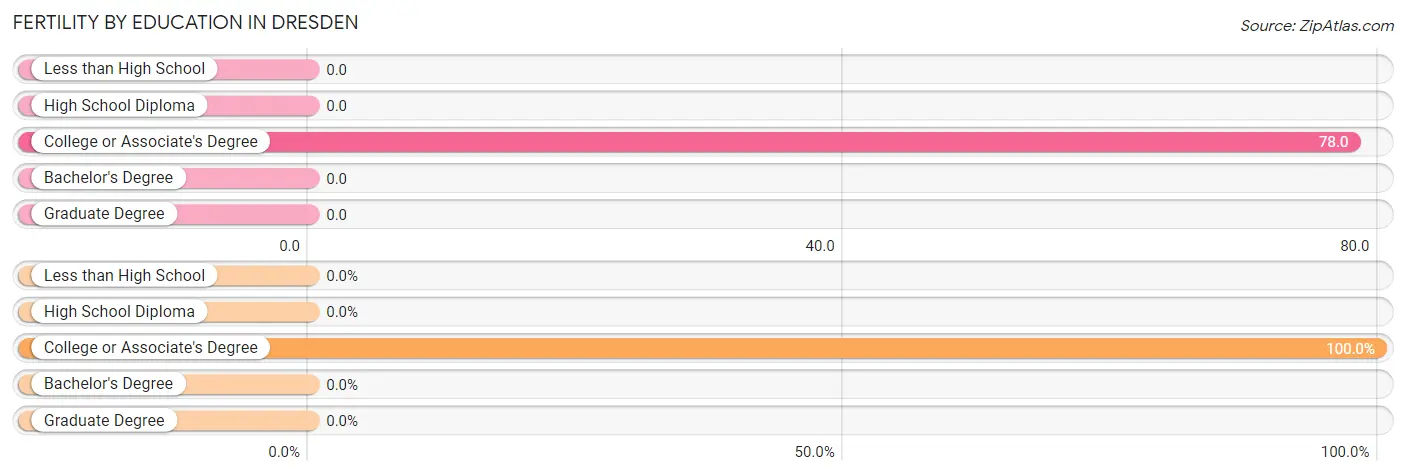
| Educational Attainment | Women with Births | Births / 1,000 Women |
| Less than High School | 0 (0.0%) | 0.0 |
| High School Diploma | 0 (0.0%) | 0.0 |
| College or Associate's Degree | 19 (100.0%) | 78.0 |
| Bachelor's Degree | 0 (0.0%) | 0.0 |
| Graduate Degree | 0 (0.0%) | 0.0 |
| Total | 19 (100.0%) | 25.0 |
Fertility by Education by Marriage Status in Dresden
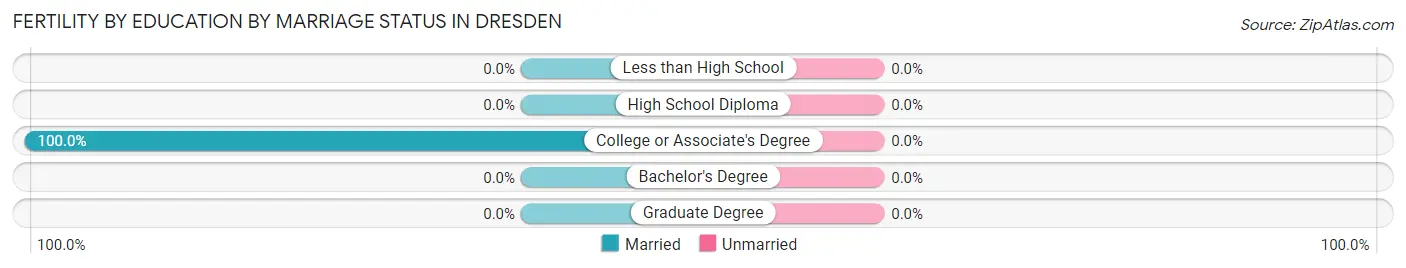
| Educational Attainment | Married | Unmarried |
| Less than High School | 0 (0.0%) | 0 (0.0%) |
| High School Diploma | 0 (0.0%) | 0 (0.0%) |
| College or Associate's Degree | 19 (100.0%) | 0 (0.0%) |
| Bachelor's Degree | 0 (0.0%) | 0 (0.0%) |
| Graduate Degree | 0 (0.0%) | 0 (0.0%) |
| Total | 19 (100.0%) | 0 (0.0%) |
Employment Characteristics in Dresden
Employment by Class of Employer in Dresden
Among the 1,475 employed individuals in Dresden, private company employees (1,181 | 80.1%), local government employees (145 | 9.8%), and self-employed (not incorporated) (99 | 6.7%) make up the most common classes of employment.
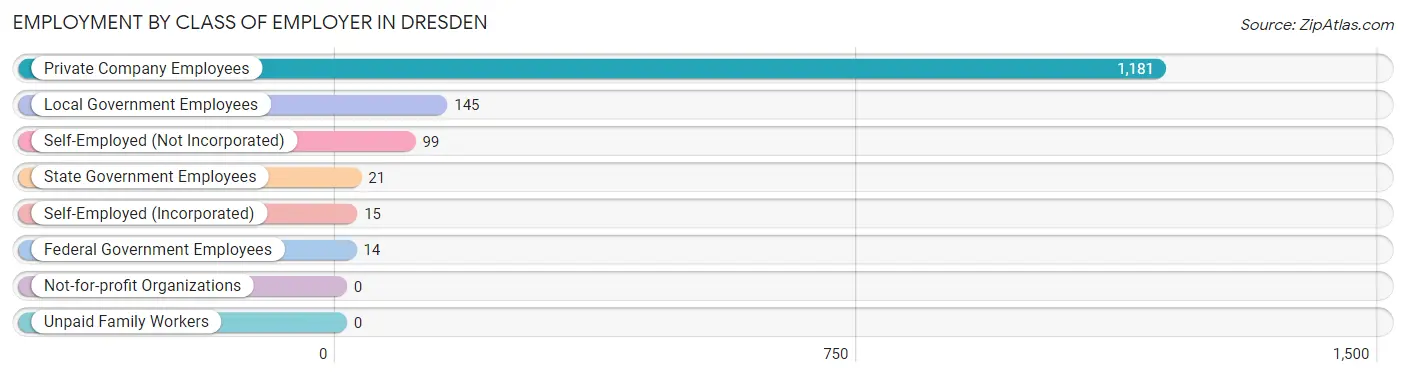
| Employer Class | # Employees | % Employees |
| Private Company Employees | 1,181 | 80.1% |
| Self-Employed (Incorporated) | 15 | 1.0% |
| Self-Employed (Not Incorporated) | 99 | 6.7% |
| Not-for-profit Organizations | 0 | 0.0% |
| Local Government Employees | 145 | 9.8% |
| State Government Employees | 21 | 1.4% |
| Federal Government Employees | 14 | 0.9% |
| Unpaid Family Workers | 0 | 0.0% |
| Total | 1,475 | 100.0% |
Employment Status by Age in Dresden
According to the labor force statistics for Dresden, out of the total population over 16 years of age (2,524), 59.9% or 1,512 individuals are in the labor force, with 2.4% or 36 of them unemployed. The age group with the highest labor force participation rate is 25 to 29 years, with 91.3% or 189 individuals in the labor force. Within the labor force, the 25 to 29 years age range has the highest percentage of unemployed individuals, with 10.1% or 19 of them being unemployed.
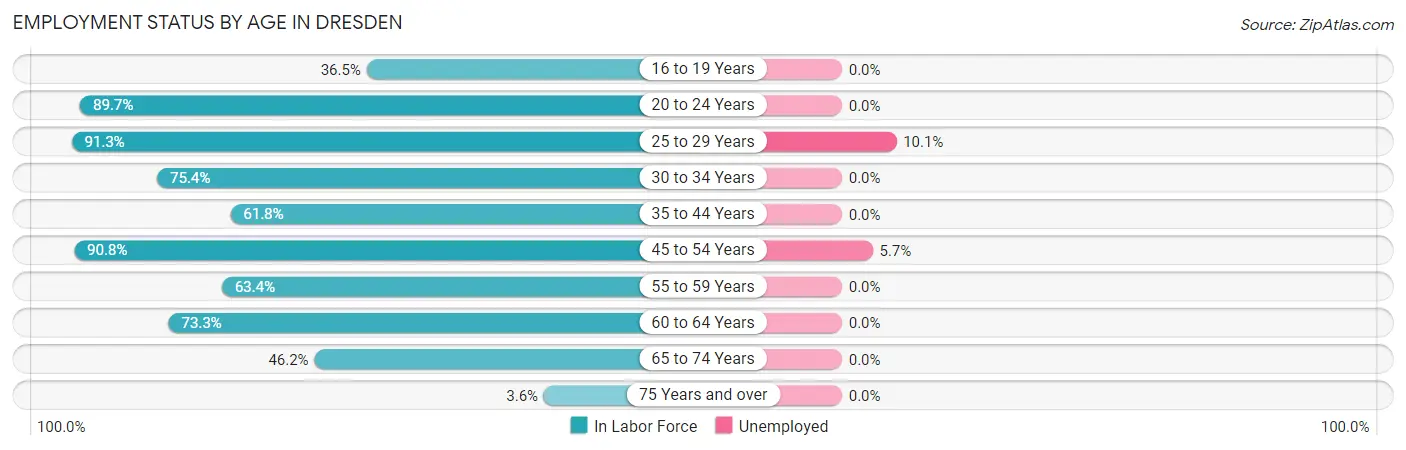
| Age Bracket | In Labor Force | Unemployed |
| 16 to 19 Years | 80 (36.5%) | 0 (0.0%) |
| 20 to 24 Years | 156 (89.7%) | 0 (0.0%) |
| 25 to 29 Years | 189 (91.3%) | 19 (10.1%) |
| 30 to 34 Years | 46 (75.4%) | 0 (0.0%) |
| 35 to 44 Years | 342 (61.8%) | 0 (0.0%) |
| 45 to 54 Years | 297 (90.8%) | 17 (5.7%) |
| 55 to 59 Years | 85 (63.4%) | 0 (0.0%) |
| 60 to 64 Years | 110 (73.3%) | 0 (0.0%) |
| 65 to 74 Years | 196 (46.2%) | 0 (0.0%) |
| 75 Years and over | 10 (3.6%) | 0 (0.0%) |
| Total | 1,512 (59.9%) | 36 (2.4%) |
Employment Status by Educational Attainment in Dresden
According to labor force statistics for Dresden, 74.7% of individuals (1,070) out of the total population between 25 and 64 years of age (1,432) are in the labor force, with 3.4% or 36 of them being unemployed. The group with the highest labor force participation rate are those with the educational attainment of bachelor's degree or higher, with 91.0% or 182 individuals in the labor force. Within the labor force, individuals with college / associate degree education have the highest percentage of unemployment, with 14.4% or 36 of them being unemployed.
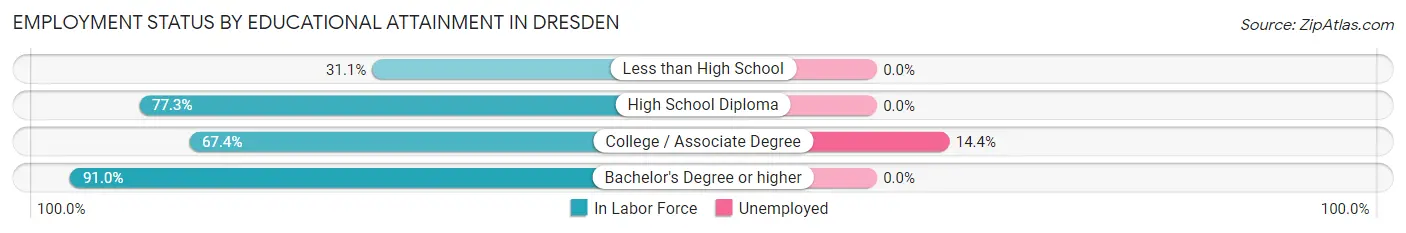
| Educational Attainment | In Labor Force | Unemployed |
| Less than High School | 19 (31.1%) | 0 (0.0%) |
| High School Diploma | 618 (77.3%) | 0 (0.0%) |
| College / Associate Degree | 250 (67.4%) | 53 (14.4%) |
| Bachelor's Degree or higher | 182 (91.0%) | 0 (0.0%) |
| Total | 1,070 (74.7%) | 49 (3.4%) |
Employment Occupations by Sex in Dresden
Management, Business, Science and Arts Occupations
The most common Management, Business, Science and Arts occupations in Dresden are Community & Social Service (110 | 7.5%), Health Diagnosing & Treating (109 | 7.4%), Computers, Engineering & Science (105 | 7.1%), Computers & Mathematics (89 | 6.0%), and Management (83 | 5.6%).
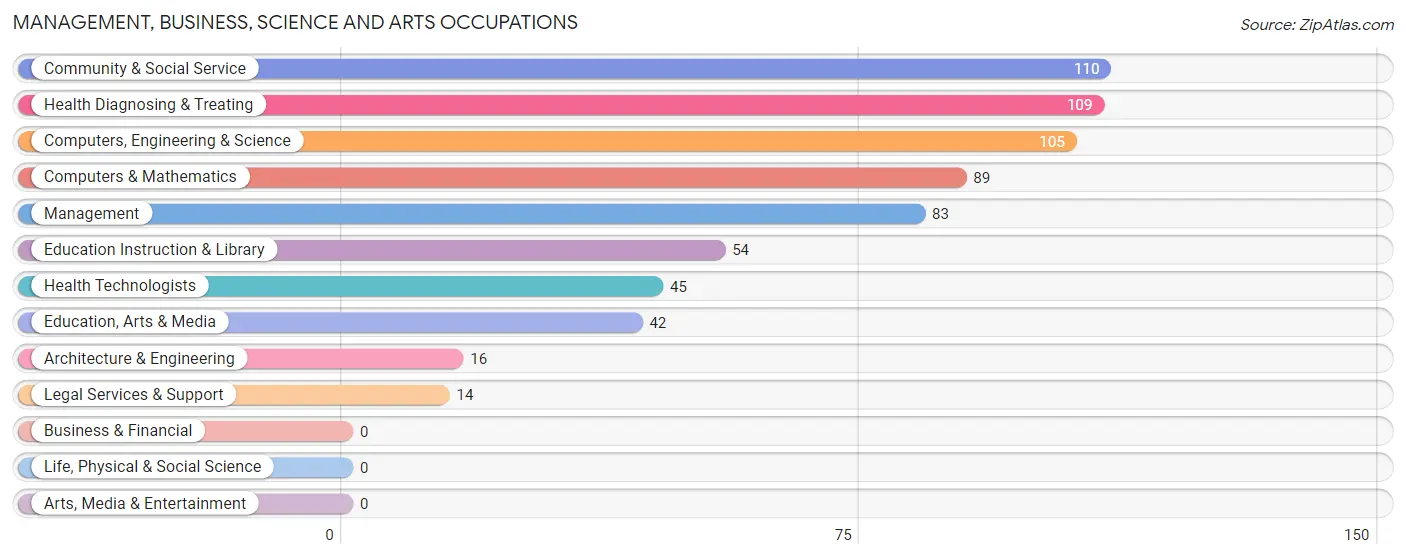
Management, Business, Science and Arts Occupations by Sex
Within the Management, Business, Science and Arts occupations in Dresden, the most male-oriented occupations are Management (100.0%), Architecture & Engineering (100.0%), and Legal Services & Support (100.0%), while the most female-oriented occupations are Education, Arts & Media (100.0%), Health Diagnosing & Treating (72.5%), and Community & Social Service (70.0%).
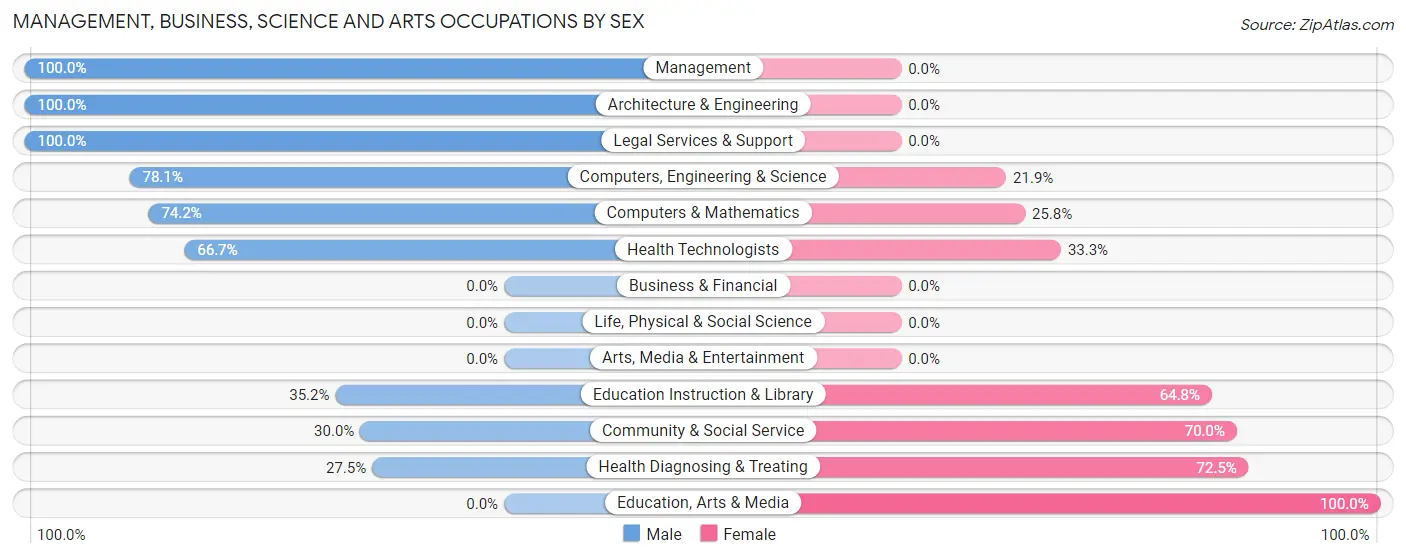
| Occupation | Male | Female |
| Management | 83 (100.0%) | 0 (0.0%) |
| Business & Financial | 0 (0.0%) | 0 (0.0%) |
| Computers, Engineering & Science | 82 (78.1%) | 23 (21.9%) |
| Computers & Mathematics | 66 (74.2%) | 23 (25.8%) |
| Architecture & Engineering | 16 (100.0%) | 0 (0.0%) |
| Life, Physical & Social Science | 0 (0.0%) | 0 (0.0%) |
| Community & Social Service | 33 (30.0%) | 77 (70.0%) |
| Education, Arts & Media | 0 (0.0%) | 42 (100.0%) |
| Legal Services & Support | 14 (100.0%) | 0 (0.0%) |
| Education Instruction & Library | 19 (35.2%) | 35 (64.8%) |
| Arts, Media & Entertainment | 0 (0.0%) | 0 (0.0%) |
| Health Diagnosing & Treating | 30 (27.5%) | 79 (72.5%) |
| Health Technologists | 30 (66.7%) | 15 (33.3%) |
| Total (Category) | 228 (56.0%) | 179 (44.0%) |
| Total (Overall) | 888 (60.2%) | 587 (39.8%) |
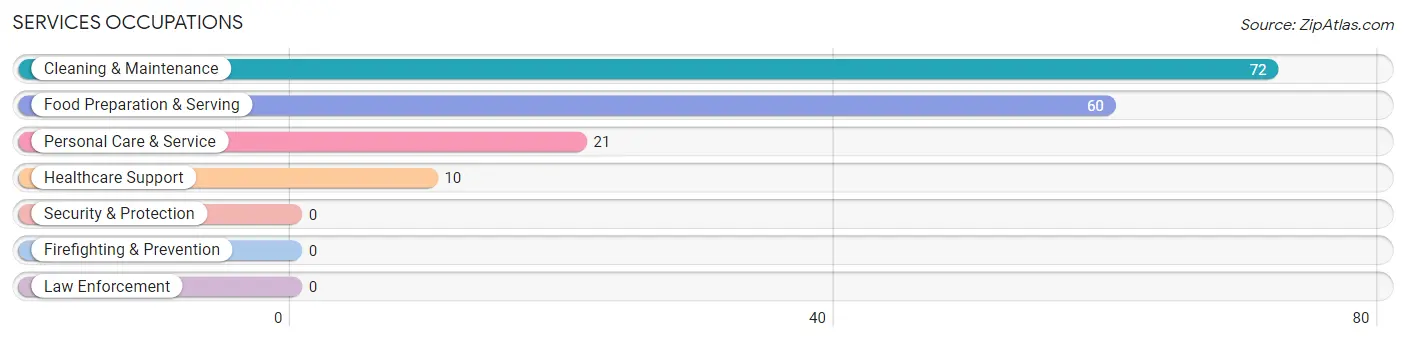
Services Occupations
The most common Services occupations in Dresden are Cleaning & Maintenance (72 | 4.9%), Food Preparation & Serving (60 | 4.1%), Personal Care & Service (21 | 1.4%), and Healthcare Support (10 | 0.7%).
Services Occupations by Sex
Within the Services occupations in Dresden, the most male-oriented occupations are Personal Care & Service (100.0%), and Food Preparation & Serving (81.7%), while the most female-oriented occupations are Healthcare Support (100.0%), Cleaning & Maintenance (100.0%), and Food Preparation & Serving (18.3%).
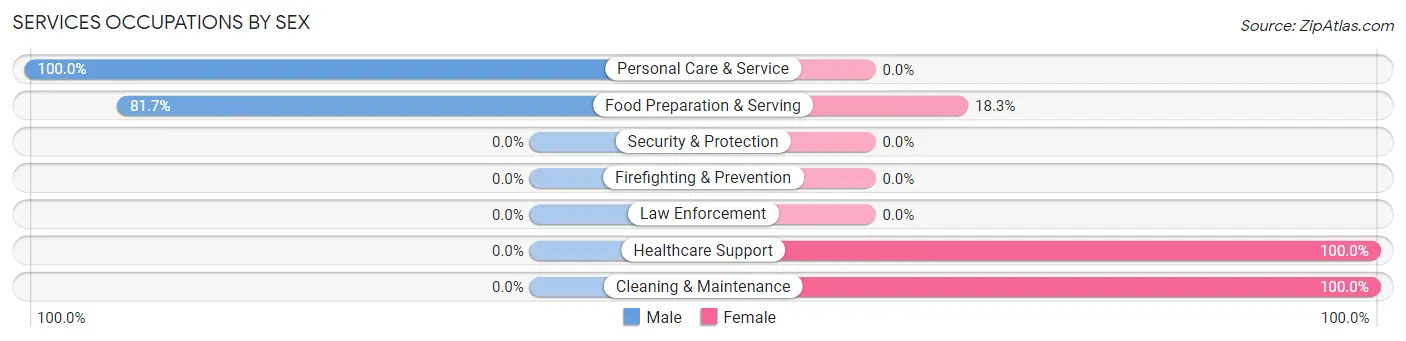
| Occupation | Male | Female |
| Healthcare Support | 0 (0.0%) | 10 (100.0%) |
| Security & Protection | 0 (0.0%) | 0 (0.0%) |
| Firefighting & Prevention | 0 (0.0%) | 0 (0.0%) |
| Law Enforcement | 0 (0.0%) | 0 (0.0%) |
| Food Preparation & Serving | 49 (81.7%) | 11 (18.3%) |
| Cleaning & Maintenance | 0 (0.0%) | 72 (100.0%) |
| Personal Care & Service | 21 (100.0%) | 0 (0.0%) |
| Total (Category) | 70 (42.9%) | 93 (57.1%) |
| Total (Overall) | 888 (60.2%) | 587 (39.8%) |
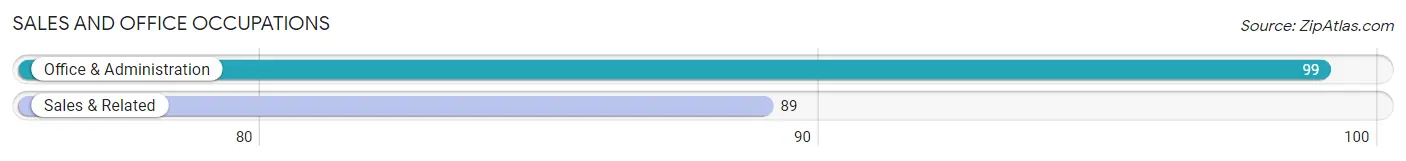
Sales and Office Occupations
The most common Sales and Office occupations in Dresden are Office & Administration (99 | 6.7%), and Sales & Related (89 | 6.0%).
Sales and Office Occupations by Sex
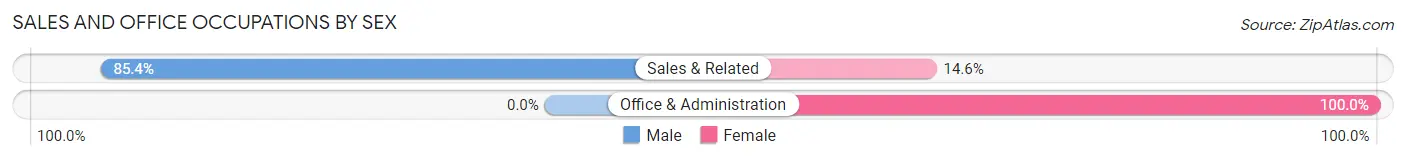
| Occupation | Male | Female |
| Sales & Related | 76 (85.4%) | 13 (14.6%) |
| Office & Administration | 0 (0.0%) | 99 (100.0%) |
| Total (Category) | 76 (40.4%) | 112 (59.6%) |
| Total (Overall) | 888 (60.2%) | 587 (39.8%) |
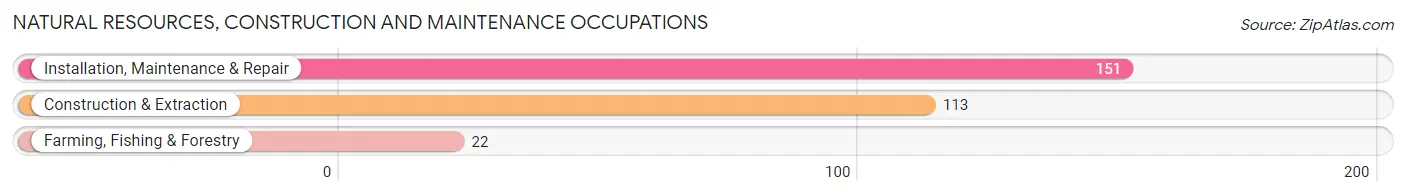
Natural Resources, Construction and Maintenance Occupations
The most common Natural Resources, Construction and Maintenance occupations in Dresden are Installation, Maintenance & Repair (151 | 10.2%), Construction & Extraction (113 | 7.7%), and Farming, Fishing & Forestry (22 | 1.5%).
Natural Resources, Construction and Maintenance Occupations by Sex
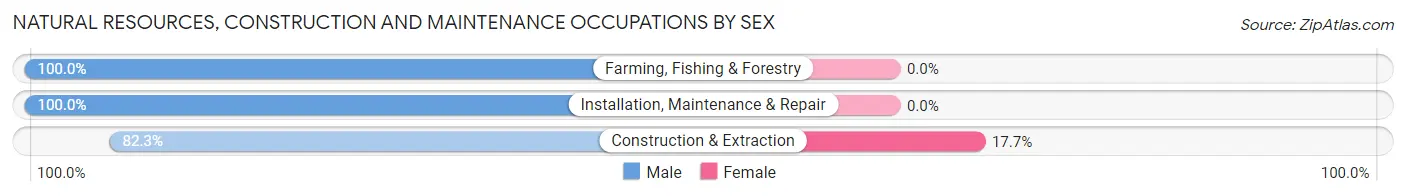
| Occupation | Male | Female |
| Farming, Fishing & Forestry | 22 (100.0%) | 0 (0.0%) |
| Construction & Extraction | 93 (82.3%) | 20 (17.7%) |
| Installation, Maintenance & Repair | 151 (100.0%) | 0 (0.0%) |
| Total (Category) | 266 (93.0%) | 20 (7.0%) |
| Total (Overall) | 888 (60.2%) | 587 (39.8%) |
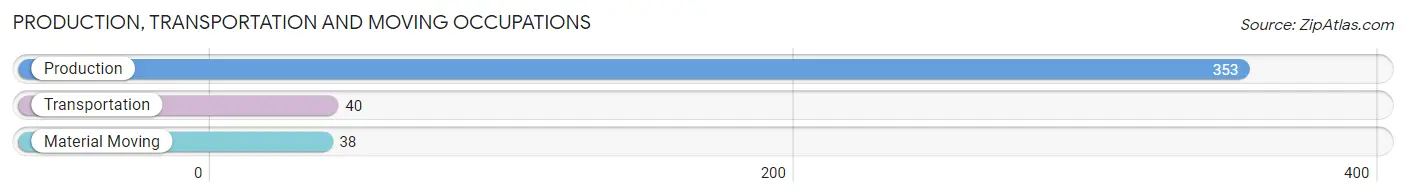
Production, Transportation and Moving Occupations
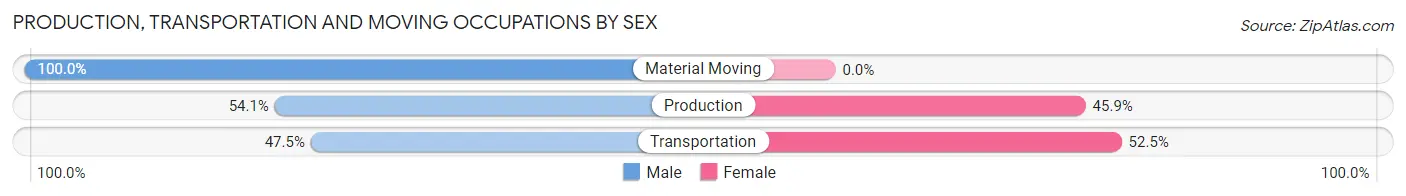
The most common Production, Transportation and Moving occupations in Dresden are Production (353 | 23.9%), Transportation (40 | 2.7%), and Material Moving (38 | 2.6%).
Production, Transportation and Moving Occupations by Sex
| Occupation | Male | Female |
| Production | 191 (54.1%) | 162 (45.9%) |
| Transportation | 19 (47.5%) | 21 (52.5%) |
| Material Moving | 38 (100.0%) | 0 (0.0%) |
| Total (Category) | 248 (57.5%) | 183 (42.5%) |
| Total (Overall) | 888 (60.2%) | 587 (39.8%) |
Employment Industries by Sex in Dresden
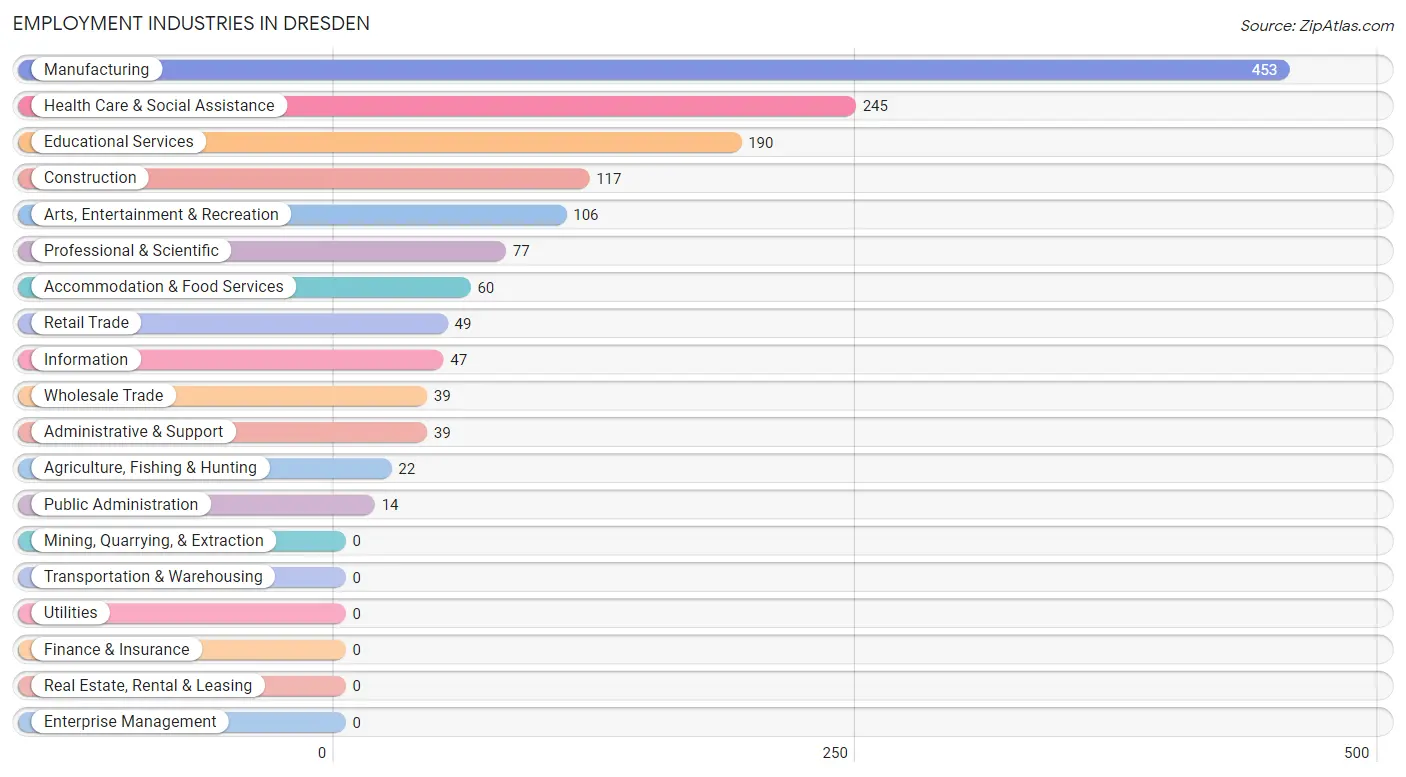
Employment Industries in Dresden
The major employment industries in Dresden include Manufacturing (453 | 30.7%), Health Care & Social Assistance (245 | 16.6%), Educational Services (190 | 12.9%), Construction (117 | 7.9%), and Arts, Entertainment & Recreation (106 | 7.2%).
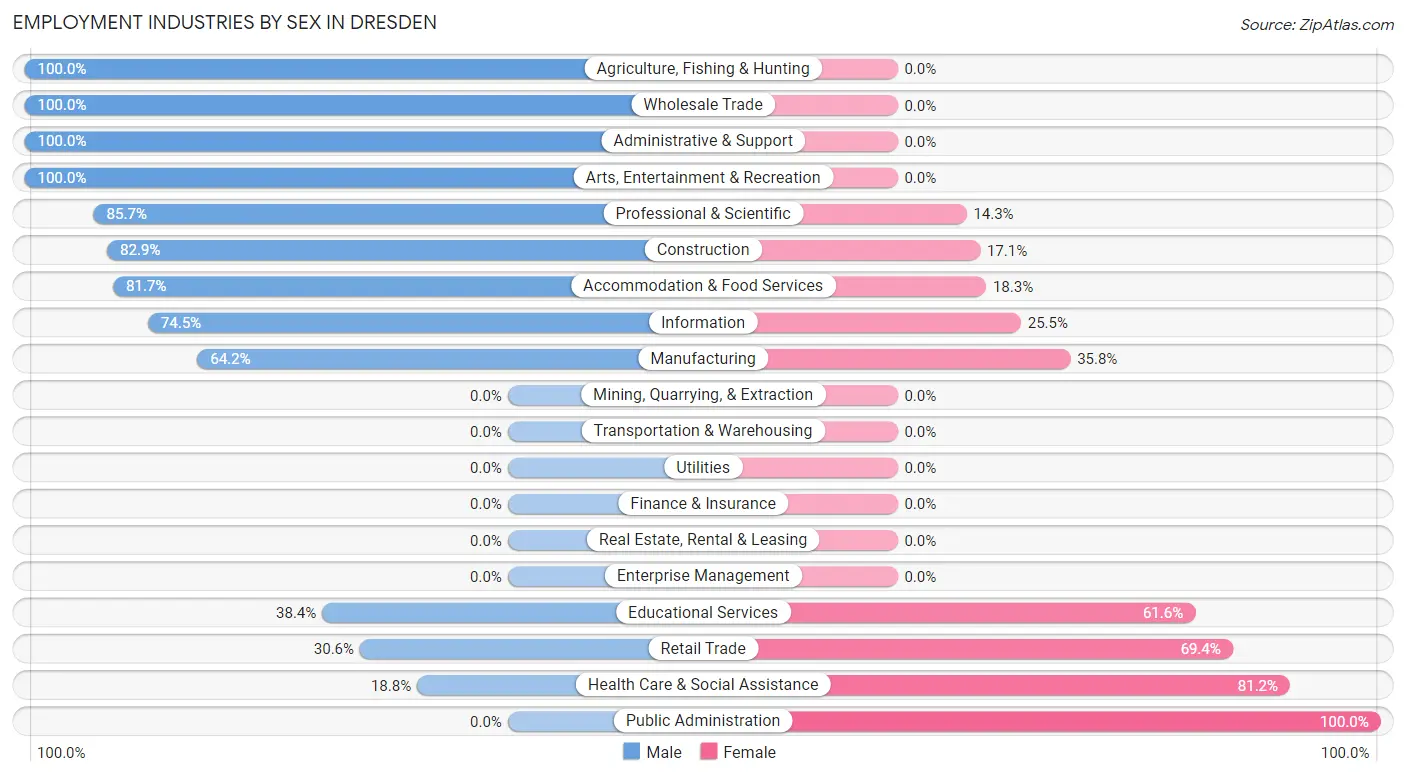
Employment Industries by Sex in Dresden
The Dresden industries that see more men than women are Agriculture, Fishing & Hunting (100.0%), Wholesale Trade (100.0%), and Administrative & Support (100.0%), whereas the industries that tend to have a higher number of women are Public Administration (100.0%), Health Care & Social Assistance (81.2%), and Retail Trade (69.4%).
| Industry | Male | Female |
| Agriculture, Fishing & Hunting | 22 (100.0%) | 0 (0.0%) |
| Mining, Quarrying, & Extraction | 0 (0.0%) | 0 (0.0%) |
| Construction | 97 (82.9%) | 20 (17.1%) |
| Manufacturing | 291 (64.2%) | 162 (35.8%) |
| Wholesale Trade | 39 (100.0%) | 0 (0.0%) |
| Retail Trade | 15 (30.6%) | 34 (69.4%) |
| Transportation & Warehousing | 0 (0.0%) | 0 (0.0%) |
| Utilities | 0 (0.0%) | 0 (0.0%) |
| Information | 35 (74.5%) | 12 (25.5%) |
| Finance & Insurance | 0 (0.0%) | 0 (0.0%) |
| Real Estate, Rental & Leasing | 0 (0.0%) | 0 (0.0%) |
| Professional & Scientific | 66 (85.7%) | 11 (14.3%) |
| Enterprise Management | 0 (0.0%) | 0 (0.0%) |
| Administrative & Support | 39 (100.0%) | 0 (0.0%) |
| Educational Services | 73 (38.4%) | 117 (61.6%) |
| Health Care & Social Assistance | 46 (18.8%) | 199 (81.2%) |
| Arts, Entertainment & Recreation | 106 (100.0%) | 0 (0.0%) |
| Accommodation & Food Services | 49 (81.7%) | 11 (18.3%) |
| Public Administration | 0 (0.0%) | 14 (100.0%) |
| Total | 888 (60.2%) | 587 (39.8%) |
Education in Dresden
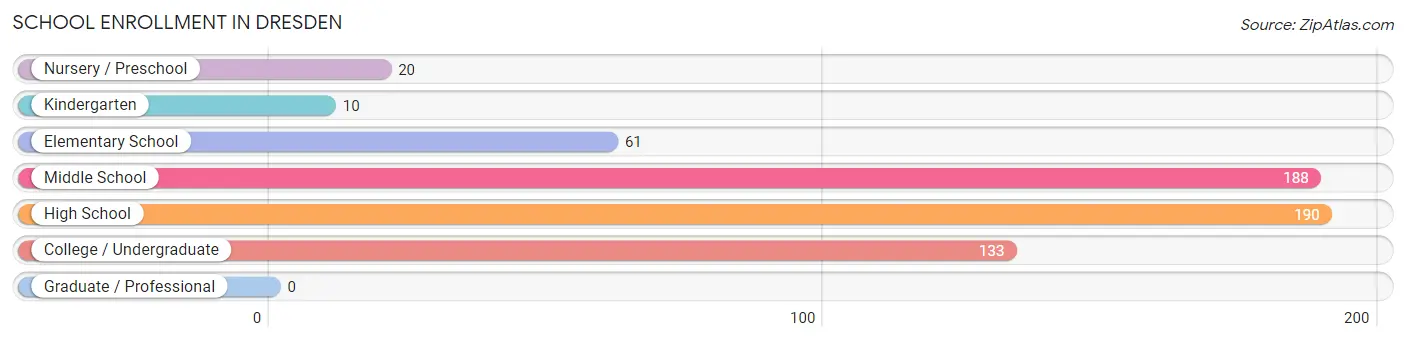
School Enrollment in Dresden
The most common levels of schooling among the 602 students in Dresden are high school (190 | 31.6%), middle school (188 | 31.2%), and college / undergraduate (133 | 22.1%).
| School Level | # Students | % Students |
| Nursery / Preschool | 20 | 3.3% |
| Kindergarten | 10 | 1.7% |
| Elementary School | 61 | 10.1% |
| Middle School | 188 | 31.2% |
| High School | 190 | 31.6% |
| College / Undergraduate | 133 | 22.1% |
| Graduate / Professional | 0 | 0.0% |
| Total | 602 | 100.0% |
School Enrollment by Age by Funding Source in Dresden
Out of a total of 602 students who are enrolled in schools in Dresden, 39 (6.5%) attend a private institution, while the remaining 563 (93.5%) are enrolled in public schools. The age group of 3 to 4 year olds has the highest likelihood of being enrolled in private schools, with 20 (100.0% in the age bracket) enrolled. Conversely, the age group of 5 to 9 year old has the lowest likelihood of being enrolled in a private school, with 59 (100.0% in the age bracket) attending a public institution.
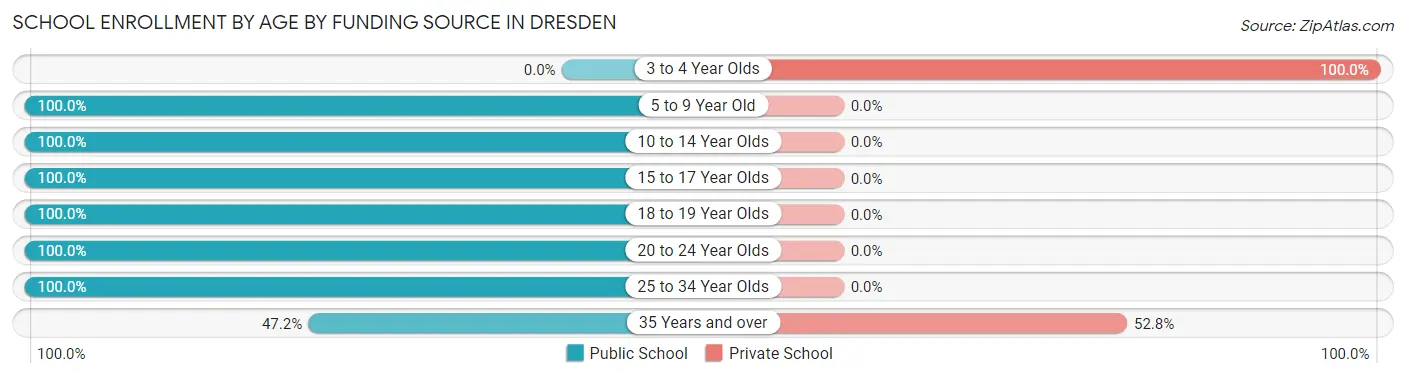
| Age Bracket | Public School | Private School |
| 3 to 4 Year Olds | 0 (0.0%) | 20 (100.0%) |
| 5 to 9 Year Old | 59 (100.0%) | 0 (0.0%) |
| 10 to 14 Year Olds | 200 (100.0%) | 0 (0.0%) |
| 15 to 17 Year Olds | 110 (100.0%) | 0 (0.0%) |
| 18 to 19 Year Olds | 126 (100.0%) | 0 (0.0%) |
| 20 to 24 Year Olds | 21 (100.0%) | 0 (0.0%) |
| 25 to 34 Year Olds | 30 (100.0%) | 0 (0.0%) |
| 35 Years and over | 17 (47.2%) | 19 (52.8%) |
| Total | 563 (93.5%) | 39 (6.5%) |
Educational Attainment by Field of Study in Dresden
Social sciences (79 | 18.1%), arts & humanities (77 | 17.7%), education (76 | 17.4%), psychology (75 | 17.2%), and computers & mathematics (67 | 15.4%) are the most common fields of study among 436 individuals in Dresden who have obtained a bachelor's degree or higher.
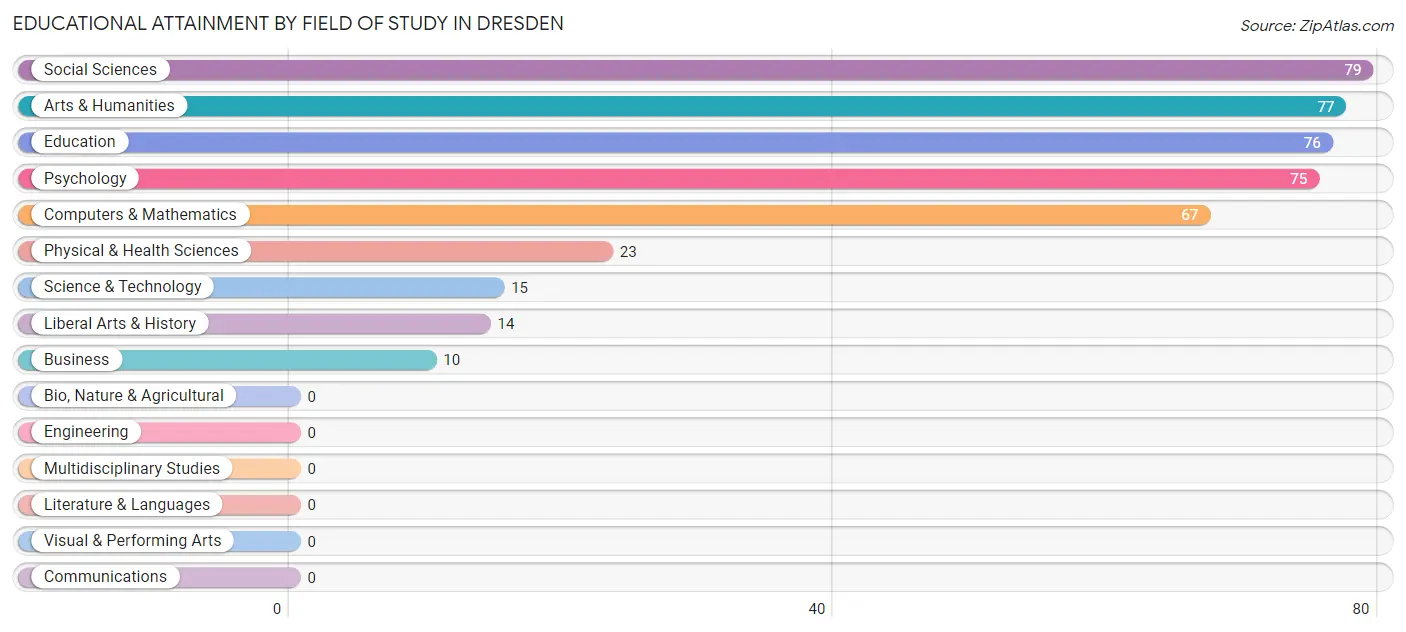
| Field of Study | # Graduates | % Graduates |
| Computers & Mathematics | 67 | 15.4% |
| Bio, Nature & Agricultural | 0 | 0.0% |
| Physical & Health Sciences | 23 | 5.3% |
| Psychology | 75 | 17.2% |
| Social Sciences | 79 | 18.1% |
| Engineering | 0 | 0.0% |
| Multidisciplinary Studies | 0 | 0.0% |
| Science & Technology | 15 | 3.4% |
| Business | 10 | 2.3% |
| Education | 76 | 17.4% |
| Literature & Languages | 0 | 0.0% |
| Liberal Arts & History | 14 | 3.2% |
| Visual & Performing Arts | 0 | 0.0% |
| Communications | 0 | 0.0% |
| Arts & Humanities | 77 | 17.7% |
| Total | 436 | 100.0% |
Transportation & Commute in Dresden
Vehicle Availability by Sex in Dresden
The most prevalent vehicle ownership categories in Dresden are males with 2 vehicles (520, accounting for 58.6%) and females with 2 vehicles (183, making up 88.6%).
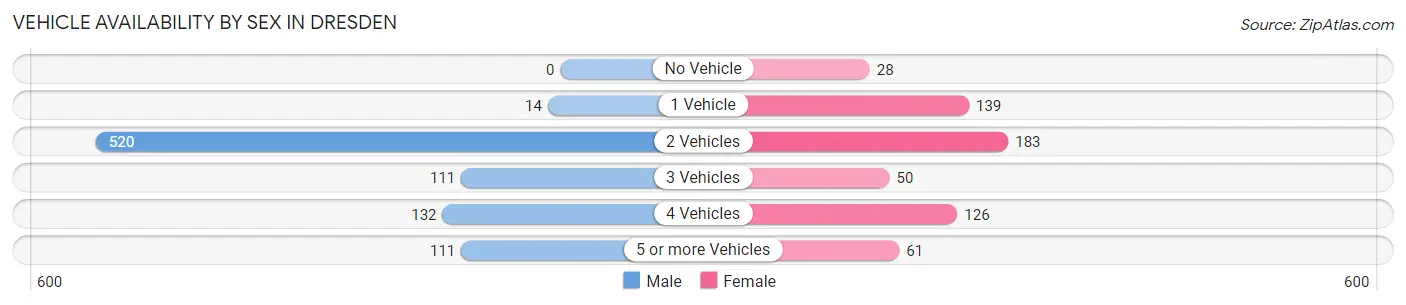
| Vehicles Available | Male | Female |
| No Vehicle | 0 (0.0%) | 28 (4.8%) |
| 1 Vehicle | 14 (1.6%) | 139 (23.7%) |
| 2 Vehicles | 520 (58.6%) | 183 (31.2%) |
| 3 Vehicles | 111 (12.5%) | 50 (8.5%) |
| 4 Vehicles | 132 (14.9%) | 126 (21.5%) |
| 5 or more Vehicles | 111 (12.5%) | 61 (10.4%) |
| Total | 888 (100.0%) | 587 (100.0%) |
Commute Time in Dresden
The most frequently occuring commute durations in Dresden are 15 to 19 minutes (361 commuters, 25.4%), 5 to 9 minutes (353 commuters, 24.8%), and 30 to 34 minutes (185 commuters, 13.0%).
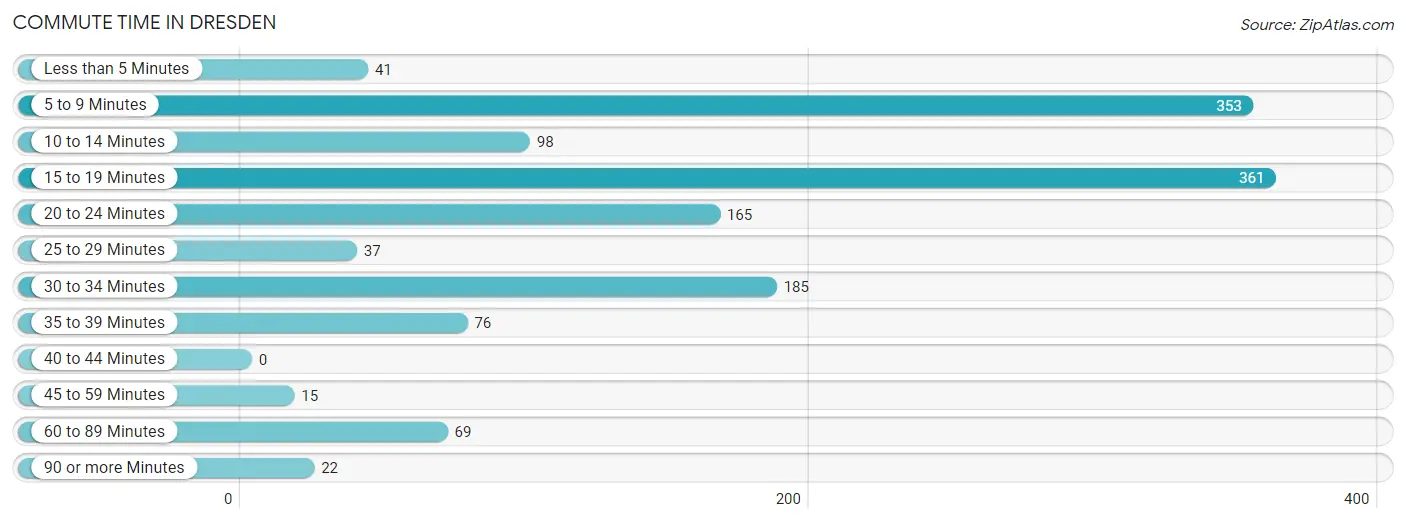
| Commute Time | # Commuters | % Commuters |
| Less than 5 Minutes | 41 | 2.9% |
| 5 to 9 Minutes | 353 | 24.8% |
| 10 to 14 Minutes | 98 | 6.9% |
| 15 to 19 Minutes | 361 | 25.4% |
| 20 to 24 Minutes | 165 | 11.6% |
| 25 to 29 Minutes | 37 | 2.6% |
| 30 to 34 Minutes | 185 | 13.0% |
| 35 to 39 Minutes | 76 | 5.3% |
| 40 to 44 Minutes | 0 | 0.0% |
| 45 to 59 Minutes | 15 | 1.1% |
| 60 to 89 Minutes | 69 | 4.9% |
| 90 or more Minutes | 22 | 1.5% |
Commute Time by Sex in Dresden
The most common commute times in Dresden are 5 to 9 minutes (317 commuters, 36.1%) for males and 15 to 19 minutes (238 commuters, 43.8%) for females.
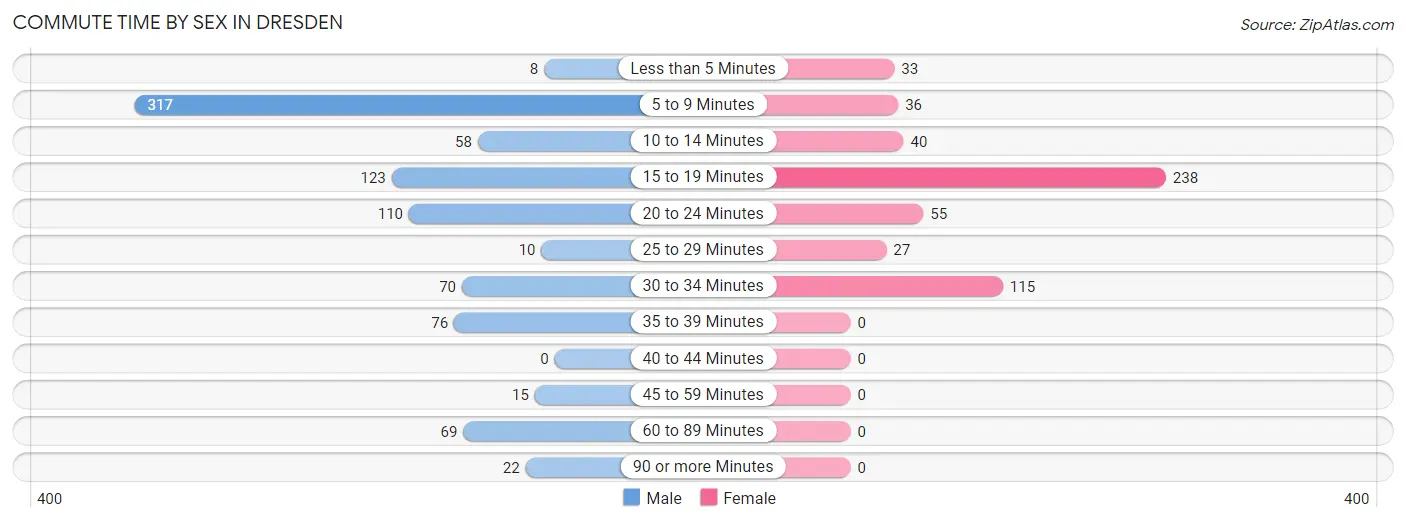
| Commute Time | Male | Female |
| Less than 5 Minutes | 8 (0.9%) | 33 (6.1%) |
| 5 to 9 Minutes | 317 (36.1%) | 36 (6.6%) |
| 10 to 14 Minutes | 58 (6.6%) | 40 (7.3%) |
| 15 to 19 Minutes | 123 (14.0%) | 238 (43.8%) |
| 20 to 24 Minutes | 110 (12.5%) | 55 (10.1%) |
| 25 to 29 Minutes | 10 (1.1%) | 27 (5.0%) |
| 30 to 34 Minutes | 70 (8.0%) | 115 (21.1%) |
| 35 to 39 Minutes | 76 (8.7%) | 0 (0.0%) |
| 40 to 44 Minutes | 0 (0.0%) | 0 (0.0%) |
| 45 to 59 Minutes | 15 (1.7%) | 0 (0.0%) |
| 60 to 89 Minutes | 69 (7.9%) | 0 (0.0%) |
| 90 or more Minutes | 22 (2.5%) | 0 (0.0%) |
Time of Departure to Work by Sex in Dresden
The most frequent times of departure to work in Dresden are 7:00 AM to 7:29 AM (175, 19.9%) for males and 7:00 AM to 7:29 AM (240, 44.1%) for females.
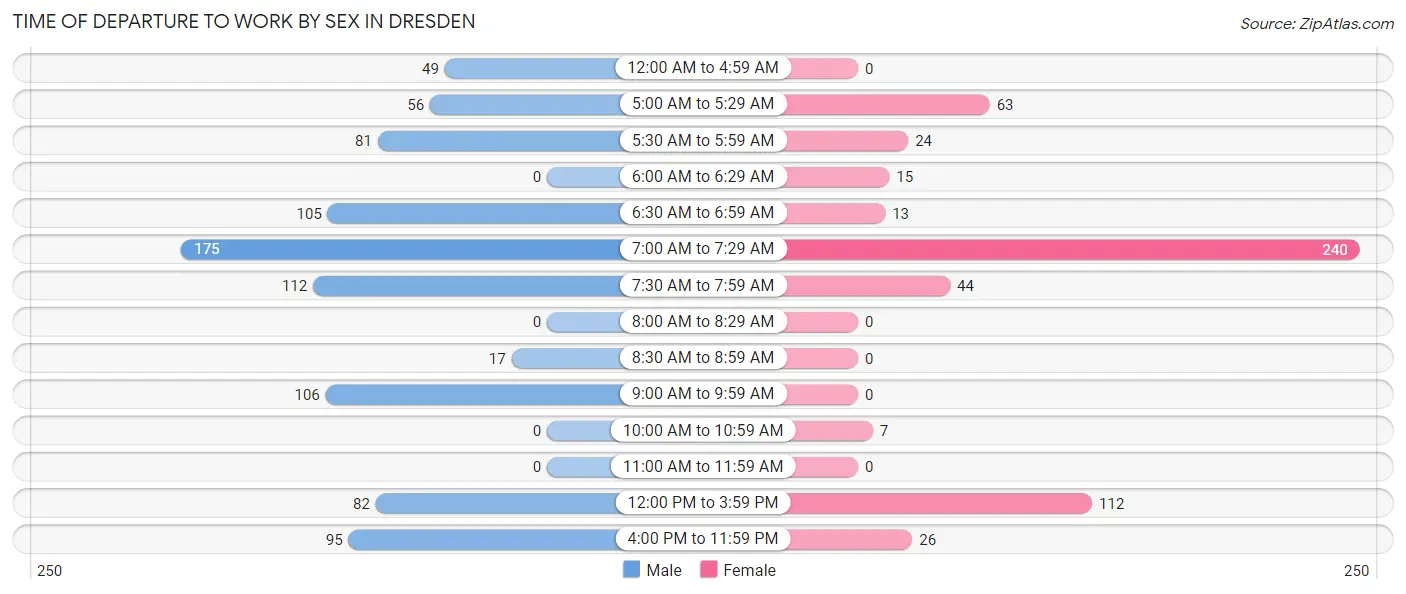
| Time of Departure | Male | Female |
| 12:00 AM to 4:59 AM | 49 (5.6%) | 0 (0.0%) |
| 5:00 AM to 5:29 AM | 56 (6.4%) | 63 (11.6%) |
| 5:30 AM to 5:59 AM | 81 (9.2%) | 24 (4.4%) |
| 6:00 AM to 6:29 AM | 0 (0.0%) | 15 (2.8%) |
| 6:30 AM to 6:59 AM | 105 (12.0%) | 13 (2.4%) |
| 7:00 AM to 7:29 AM | 175 (19.9%) | 240 (44.1%) |
| 7:30 AM to 7:59 AM | 112 (12.8%) | 44 (8.1%) |
| 8:00 AM to 8:29 AM | 0 (0.0%) | 0 (0.0%) |
| 8:30 AM to 8:59 AM | 17 (1.9%) | 0 (0.0%) |
| 9:00 AM to 9:59 AM | 106 (12.1%) | 0 (0.0%) |
| 10:00 AM to 10:59 AM | 0 (0.0%) | 7 (1.3%) |
| 11:00 AM to 11:59 AM | 0 (0.0%) | 0 (0.0%) |
| 12:00 PM to 3:59 PM | 82 (9.3%) | 112 (20.6%) |
| 4:00 PM to 11:59 PM | 95 (10.8%) | 26 (4.8%) |
| Total | 878 (100.0%) | 544 (100.0%) |
Housing Occupancy in Dresden
Occupancy by Ownership in Dresden
Of the total 1,330 dwellings in Dresden, owner-occupied units account for 813 (61.1%), while renter-occupied units make up 517 (38.9%).
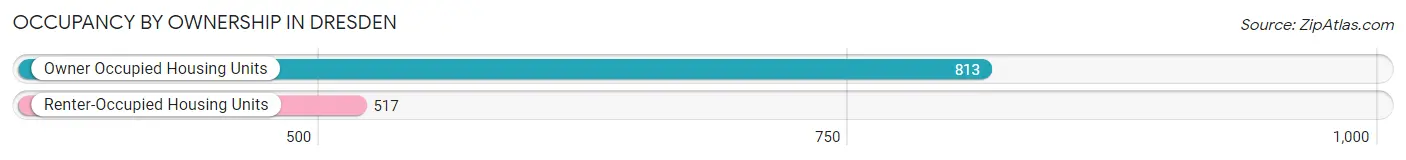
| Occupancy | # Housing Units | % Housing Units |
| Owner Occupied Housing Units | 813 | 61.1% |
| Renter-Occupied Housing Units | 517 | 38.9% |
| Total Occupied Housing Units | 1,330 | 100.0% |
Occupancy by Household Size in Dresden
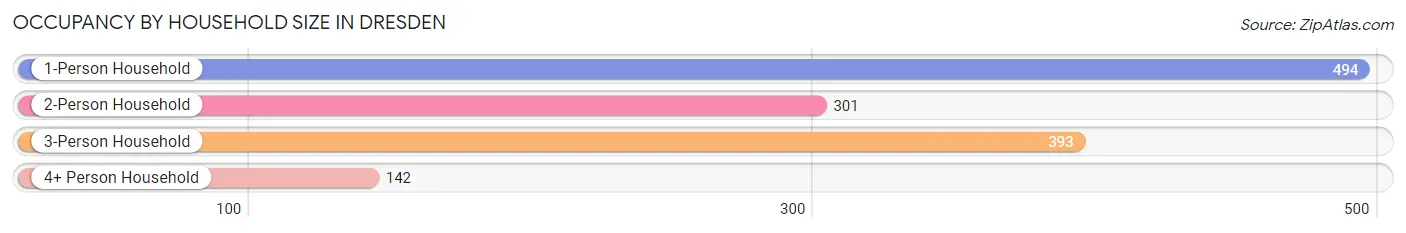
| Household Size | # Housing Units | % Housing Units |
| 1-Person Household | 494 | 37.1% |
| 2-Person Household | 301 | 22.6% |
| 3-Person Household | 393 | 29.5% |
| 4+ Person Household | 142 | 10.7% |
| Total Housing Units | 1,330 | 100.0% |
Occupancy by Ownership by Household Size in Dresden
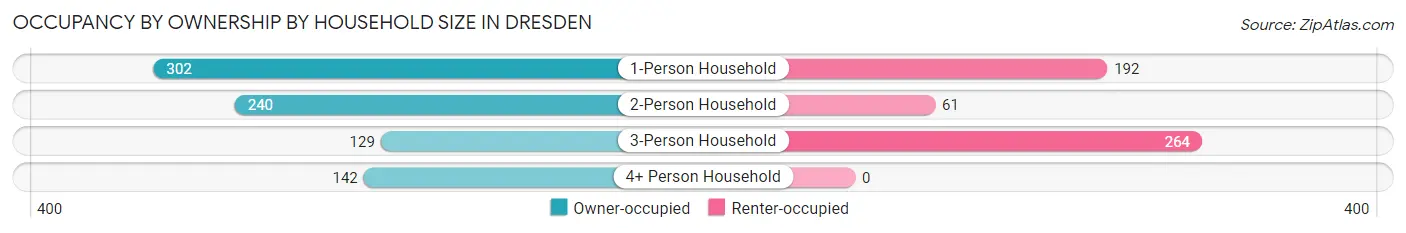
| Household Size | Owner-occupied | Renter-occupied |
| 1-Person Household | 302 (61.1%) | 192 (38.9%) |
| 2-Person Household | 240 (79.7%) | 61 (20.3%) |
| 3-Person Household | 129 (32.8%) | 264 (67.2%) |
| 4+ Person Household | 142 (100.0%) | 0 (0.0%) |
| Total Housing Units | 813 (61.1%) | 517 (38.9%) |
Occupancy by Educational Attainment in Dresden
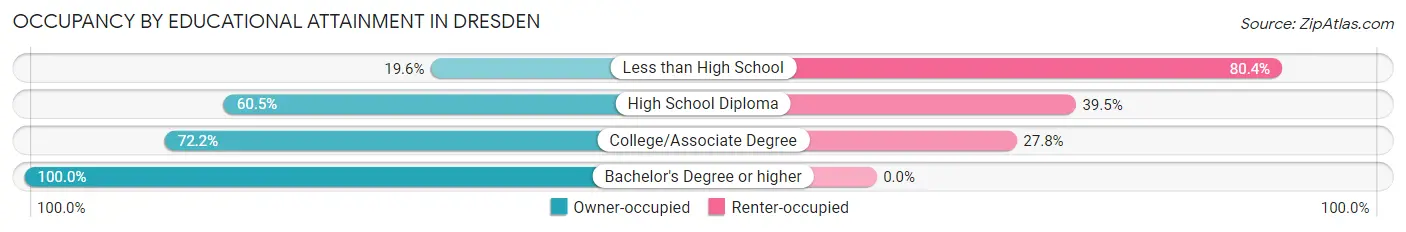
| Household Size | Owner-occupied | Renter-occupied |
| Less than High School | 44 (19.6%) | 181 (80.4%) |
| High School Diploma | 404 (60.5%) | 264 (39.5%) |
| College/Associate Degree | 187 (72.2%) | 72 (27.8%) |
| Bachelor's Degree or higher | 178 (100.0%) | 0 (0.0%) |
Occupancy by Age of Householder in Dresden
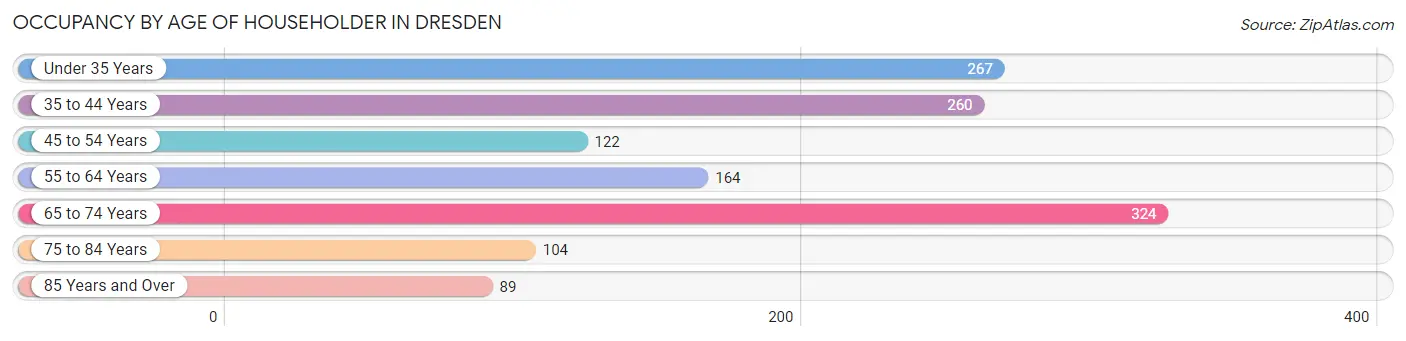
| Age Bracket | # Households | % Households |
| Under 35 Years | 267 | 20.1% |
| 35 to 44 Years | 260 | 19.6% |
| 45 to 54 Years | 122 | 9.2% |
| 55 to 64 Years | 164 | 12.3% |
| 65 to 74 Years | 324 | 24.4% |
| 75 to 84 Years | 104 | 7.8% |
| 85 Years and Over | 89 | 6.7% |
| Total | 1,330 | 100.0% |
Housing Finances in Dresden
Median Income by Occupancy in Dresden
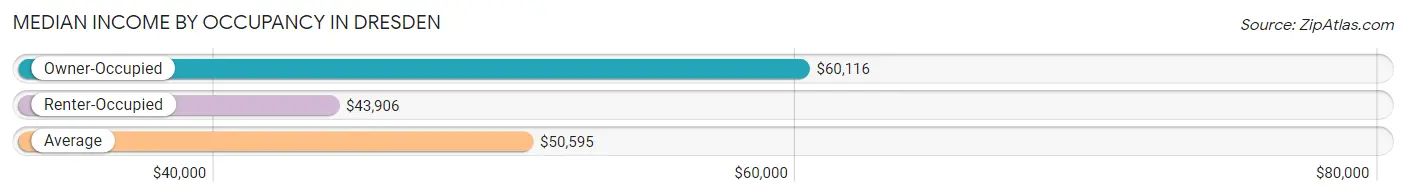
| Occupancy Type | # Households | Median Income |
| Owner-Occupied | 813 (61.1%) | $60,116 |
| Renter-Occupied | 517 (38.9%) | $43,906 |
| Average | 1,330 (100.0%) | $50,595 |
Occupancy by Householder Income Bracket in Dresden
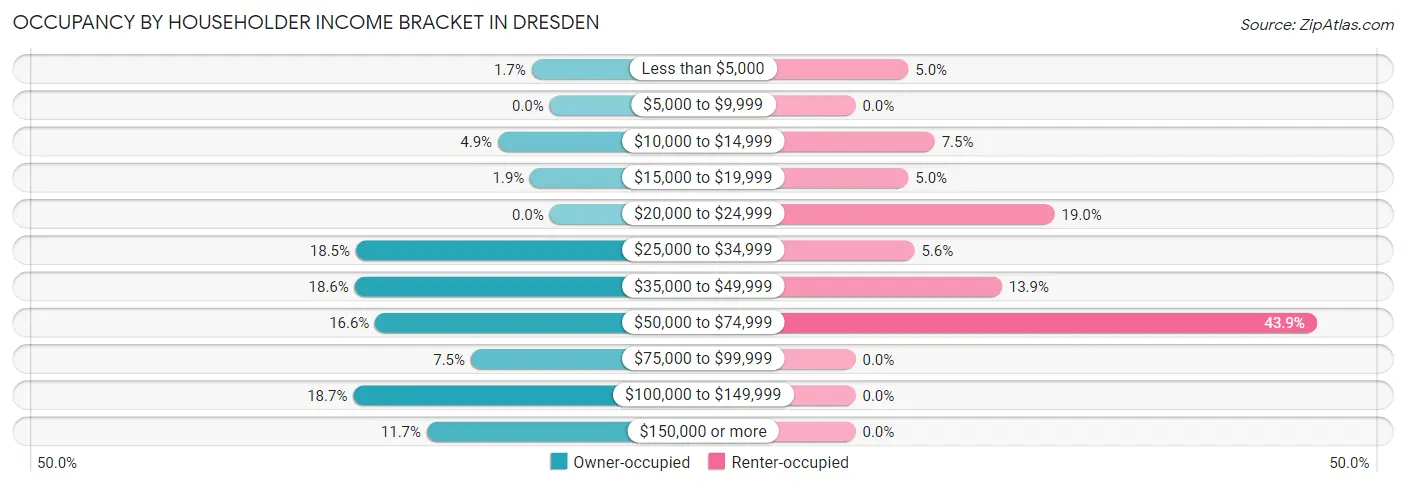
| Income Bracket | Owner-occupied | Renter-occupied |
| Less than $5,000 | 14 (1.7%) | 26 (5.0%) |
| $5,000 to $9,999 | 0 (0.0%) | 0 (0.0%) |
| $10,000 to $14,999 | 40 (4.9%) | 39 (7.5%) |
| $15,000 to $19,999 | 15 (1.8%) | 26 (5.0%) |
| $20,000 to $24,999 | 0 (0.0%) | 98 (19.0%) |
| $25,000 to $34,999 | 150 (18.4%) | 29 (5.6%) |
| $35,000 to $49,999 | 151 (18.6%) | 72 (13.9%) |
| $50,000 to $74,999 | 135 (16.6%) | 227 (43.9%) |
| $75,000 to $99,999 | 61 (7.5%) | 0 (0.0%) |
| $100,000 to $149,999 | 152 (18.7%) | 0 (0.0%) |
| $150,000 or more | 95 (11.7%) | 0 (0.0%) |
| Total | 813 (100.0%) | 517 (100.0%) |
Monthly Housing Cost Tiers in Dresden
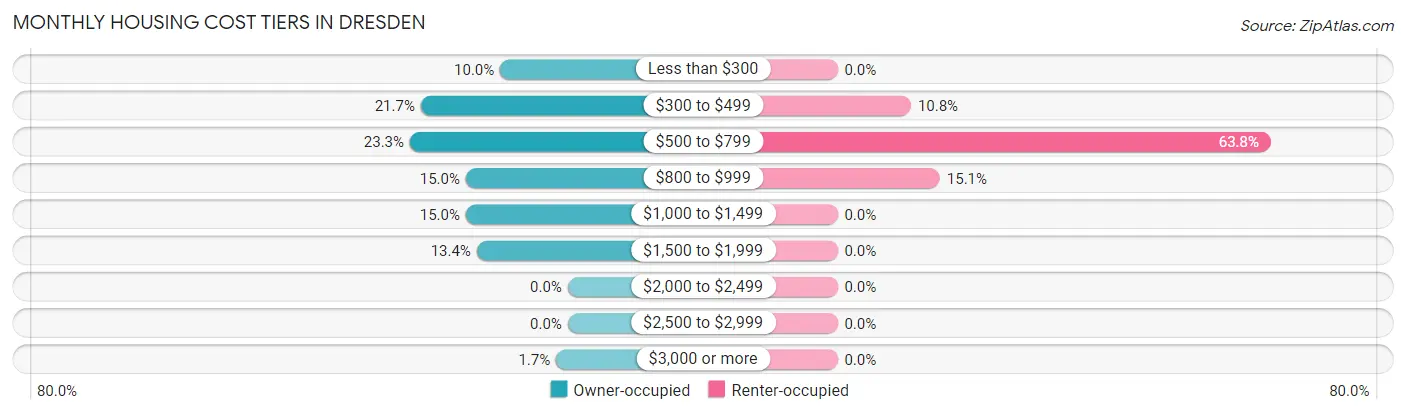
| Monthly Cost | Owner-occupied | Renter-occupied |
| Less than $300 | 81 (10.0%) | 0 (0.0%) |
| $300 to $499 | 176 (21.6%) | 56 (10.8%) |
| $500 to $799 | 189 (23.3%) | 330 (63.8%) |
| $800 to $999 | 122 (15.0%) | 78 (15.1%) |
| $1,000 to $1,499 | 122 (15.0%) | 0 (0.0%) |
| $1,500 to $1,999 | 109 (13.4%) | 0 (0.0%) |
| $2,000 to $2,499 | 0 (0.0%) | 0 (0.0%) |
| $2,500 to $2,999 | 0 (0.0%) | 0 (0.0%) |
| $3,000 or more | 14 (1.7%) | 0 (0.0%) |
| Total | 813 (100.0%) | 517 (100.0%) |
Physical Housing Characteristics in Dresden
Housing Structures in Dresden
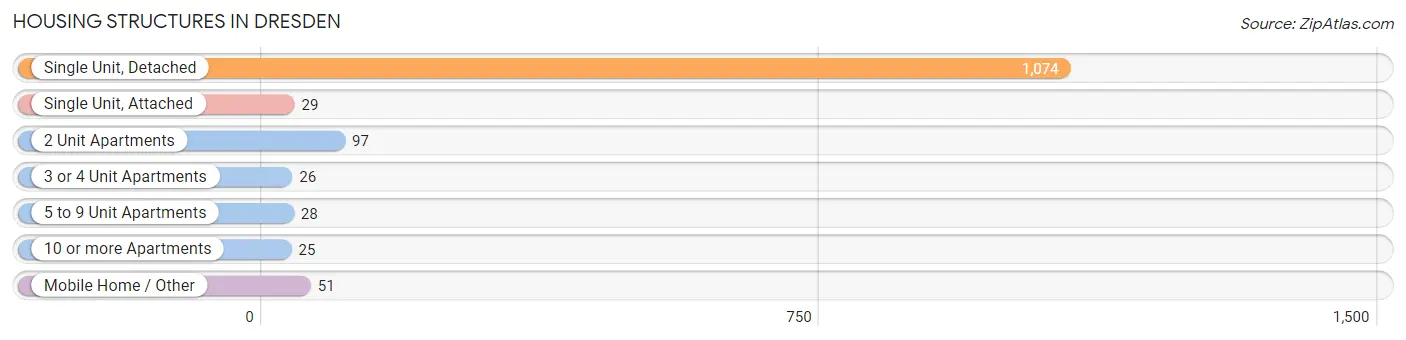
| Structure Type | # Housing Units | % Housing Units |
| Single Unit, Detached | 1,074 | 80.7% |
| Single Unit, Attached | 29 | 2.2% |
| 2 Unit Apartments | 97 | 7.3% |
| 3 or 4 Unit Apartments | 26 | 1.9% |
| 5 to 9 Unit Apartments | 28 | 2.1% |
| 10 or more Apartments | 25 | 1.9% |
| Mobile Home / Other | 51 | 3.8% |
| Total | 1,330 | 100.0% |
Housing Structures by Occupancy in Dresden
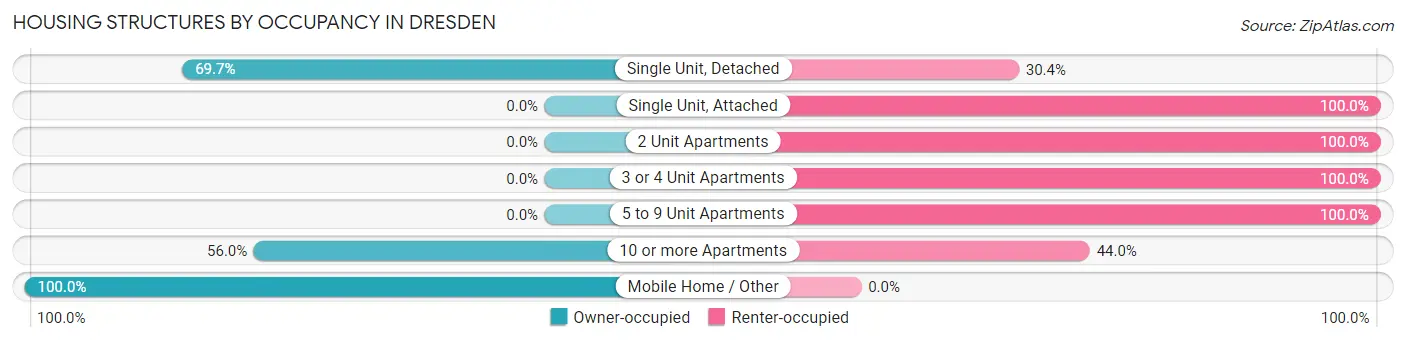
| Structure Type | Owner-occupied | Renter-occupied |
| Single Unit, Detached | 748 (69.7%) | 326 (30.3%) |
| Single Unit, Attached | 0 (0.0%) | 29 (100.0%) |
| 2 Unit Apartments | 0 (0.0%) | 97 (100.0%) |
| 3 or 4 Unit Apartments | 0 (0.0%) | 26 (100.0%) |
| 5 to 9 Unit Apartments | 0 (0.0%) | 28 (100.0%) |
| 10 or more Apartments | 14 (56.0%) | 11 (44.0%) |
| Mobile Home / Other | 51 (100.0%) | 0 (0.0%) |
| Total | 813 (61.1%) | 517 (38.9%) |
Housing Structures by Number of Rooms in Dresden
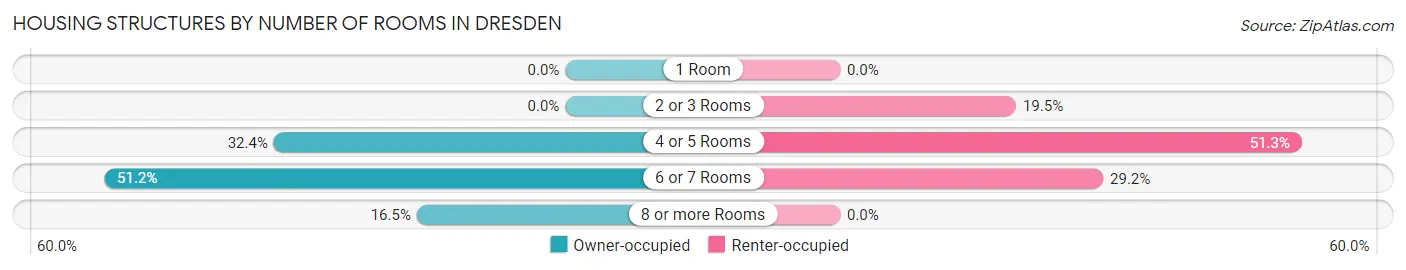
| Number of Rooms | Owner-occupied | Renter-occupied |
| 1 Room | 0 (0.0%) | 0 (0.0%) |
| 2 or 3 Rooms | 0 (0.0%) | 101 (19.5%) |
| 4 or 5 Rooms | 263 (32.4%) | 265 (51.3%) |
| 6 or 7 Rooms | 416 (51.2%) | 151 (29.2%) |
| 8 or more Rooms | 134 (16.5%) | 0 (0.0%) |
| Total | 813 (100.0%) | 517 (100.0%) |
Housing Structure by Heating Type in Dresden
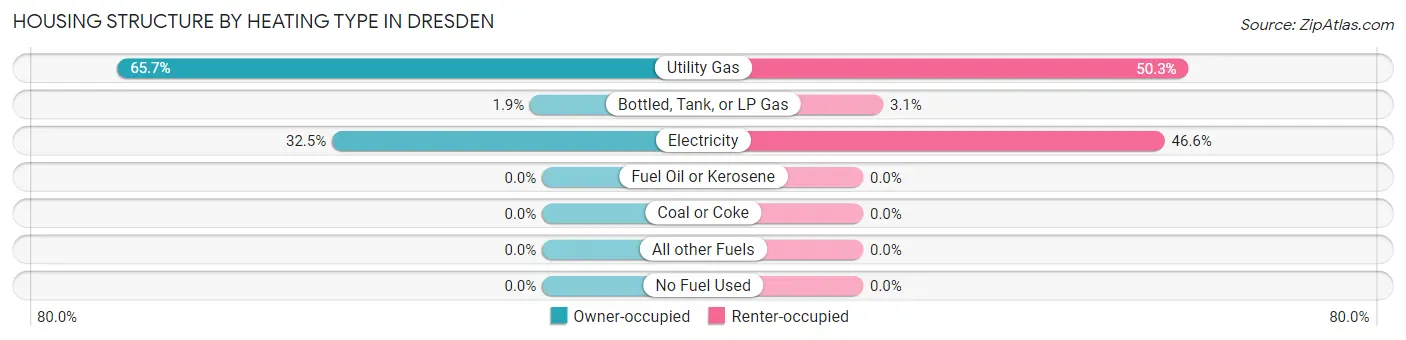
| Heating Type | Owner-occupied | Renter-occupied |
| Utility Gas | 534 (65.7%) | 260 (50.3%) |
| Bottled, Tank, or LP Gas | 15 (1.8%) | 16 (3.1%) |
| Electricity | 264 (32.5%) | 241 (46.6%) |
| Fuel Oil or Kerosene | 0 (0.0%) | 0 (0.0%) |
| Coal or Coke | 0 (0.0%) | 0 (0.0%) |
| All other Fuels | 0 (0.0%) | 0 (0.0%) |
| No Fuel Used | 0 (0.0%) | 0 (0.0%) |
| Total | 813 (100.0%) | 517 (100.0%) |
Household Vehicle Usage in Dresden
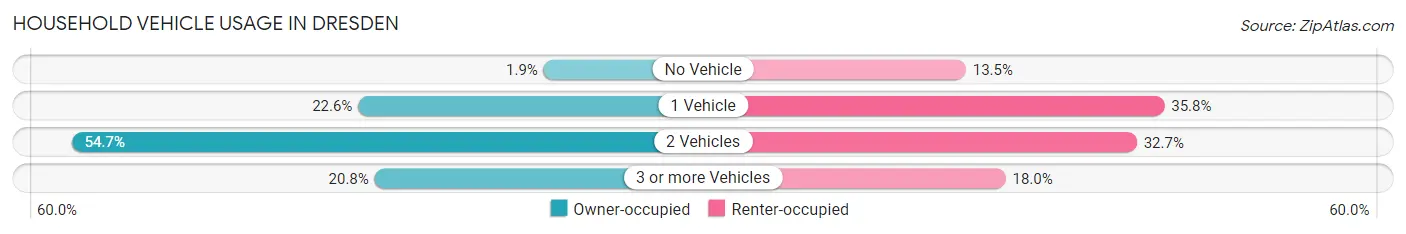
| Vehicles per Household | Owner-occupied | Renter-occupied |
| No Vehicle | 15 (1.8%) | 70 (13.5%) |
| 1 Vehicle | 184 (22.6%) | 185 (35.8%) |
| 2 Vehicles | 445 (54.7%) | 169 (32.7%) |
| 3 or more Vehicles | 169 (20.8%) | 93 (18.0%) |
| Total | 813 (100.0%) | 517 (100.0%) |
Real Estate & Mortgages in Dresden
Real Estate and Mortgage Overview in Dresden
| Characteristic | Without Mortgage | With Mortgage |
| Housing Units | 324 | 489 |
| Median Property Value | $84,300 | $132,600 |
| Median Household Income | $38,971 | $79 |
| Monthly Housing Costs | $367 | $14 |
| Real Estate Taxes | $847 | $0 |
Property Value by Mortgage Status in Dresden
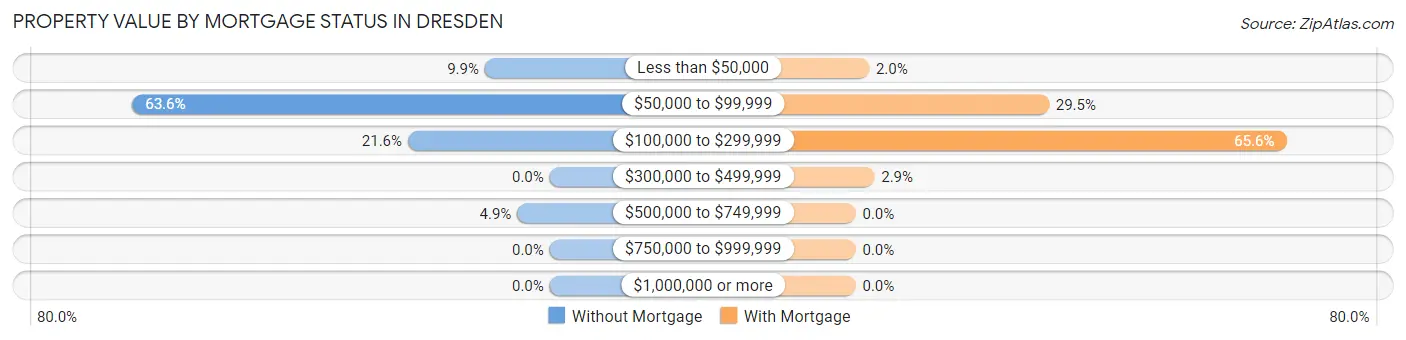
| Property Value | Without Mortgage | With Mortgage |
| Less than $50,000 | 32 (9.9%) | 10 (2.0%) |
| $50,000 to $99,999 | 206 (63.6%) | 144 (29.4%) |
| $100,000 to $299,999 | 70 (21.6%) | 321 (65.6%) |
| $300,000 to $499,999 | 0 (0.0%) | 14 (2.9%) |
| $500,000 to $749,999 | 16 (4.9%) | 0 (0.0%) |
| $750,000 to $999,999 | 0 (0.0%) | 0 (0.0%) |
| $1,000,000 or more | 0 (0.0%) | 0 (0.0%) |
| Total | 324 (100.0%) | 489 (100.0%) |
Household Income by Mortgage Status in Dresden
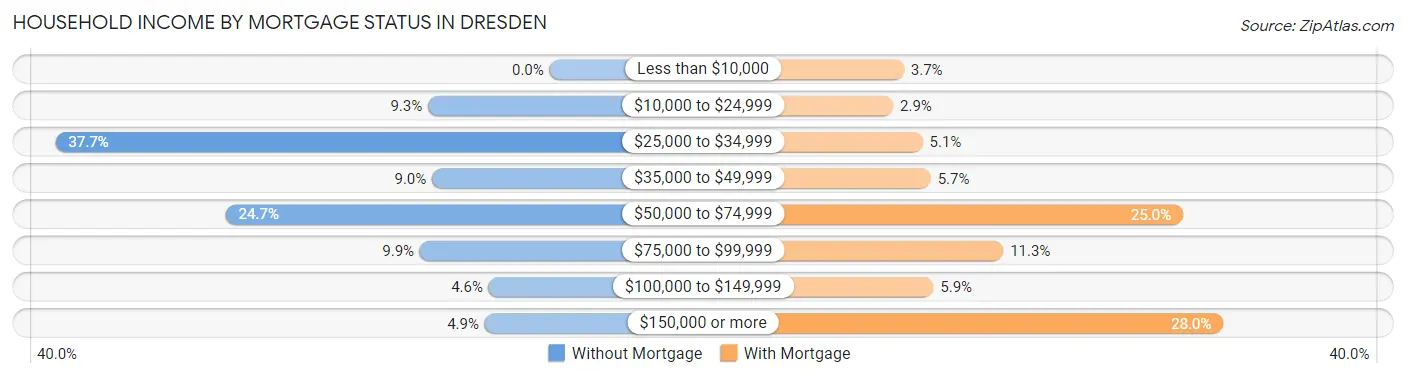
| Household Income | Without Mortgage | With Mortgage |
| Less than $10,000 | 0 (0.0%) | 18 (3.7%) |
| $10,000 to $24,999 | 30 (9.3%) | 14 (2.9%) |
| $25,000 to $34,999 | 122 (37.7%) | 25 (5.1%) |
| $35,000 to $49,999 | 29 (8.9%) | 28 (5.7%) |
| $50,000 to $74,999 | 80 (24.7%) | 122 (24.9%) |
| $75,000 to $99,999 | 32 (9.9%) | 55 (11.3%) |
| $100,000 to $149,999 | 15 (4.6%) | 29 (5.9%) |
| $150,000 or more | 16 (4.9%) | 137 (28.0%) |
| Total | 324 (100.0%) | 489 (100.0%) |
Property Value to Household Income Ratio in Dresden
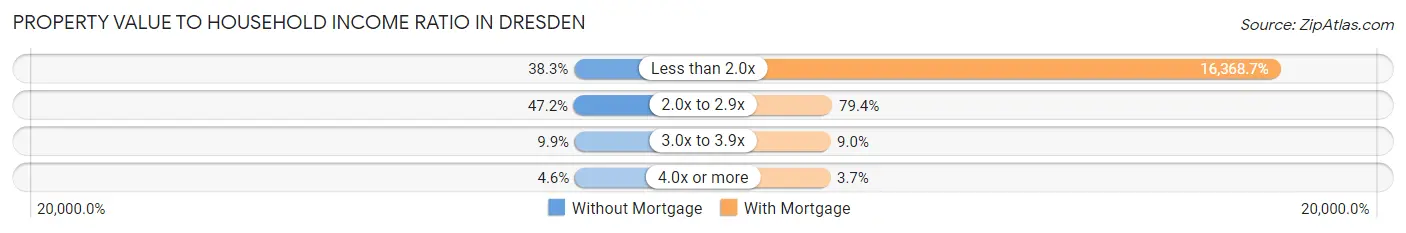
| Value-to-Income Ratio | Without Mortgage | With Mortgage |
| Less than 2.0x | 124 (38.3%) | 80,043 (16,368.7%) |
| 2.0x to 2.9x | 153 (47.2%) | 388 (79.3%) |
| 3.0x to 3.9x | 32 (9.9%) | 44 (9.0%) |
| 4.0x or more | 15 (4.6%) | 18 (3.7%) |
| Total | 324 (100.0%) | 489 (100.0%) |
Real Estate Taxes by Mortgage Status in Dresden
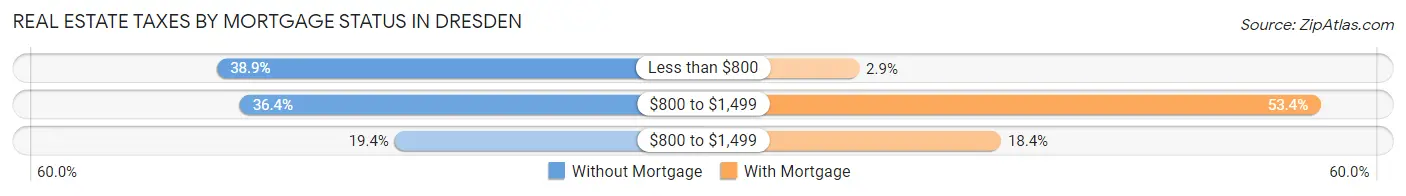
| Property Taxes | Without Mortgage | With Mortgage |
| Less than $800 | 126 (38.9%) | 14 (2.9%) |
| $800 to $1,499 | 118 (36.4%) | 261 (53.4%) |
| $800 to $1,499 | 63 (19.4%) | 90 (18.4%) |
| Total | 324 (100.0%) | 489 (100.0%) |
Health & Disability in Dresden
Health Insurance Coverage by Age in Dresden
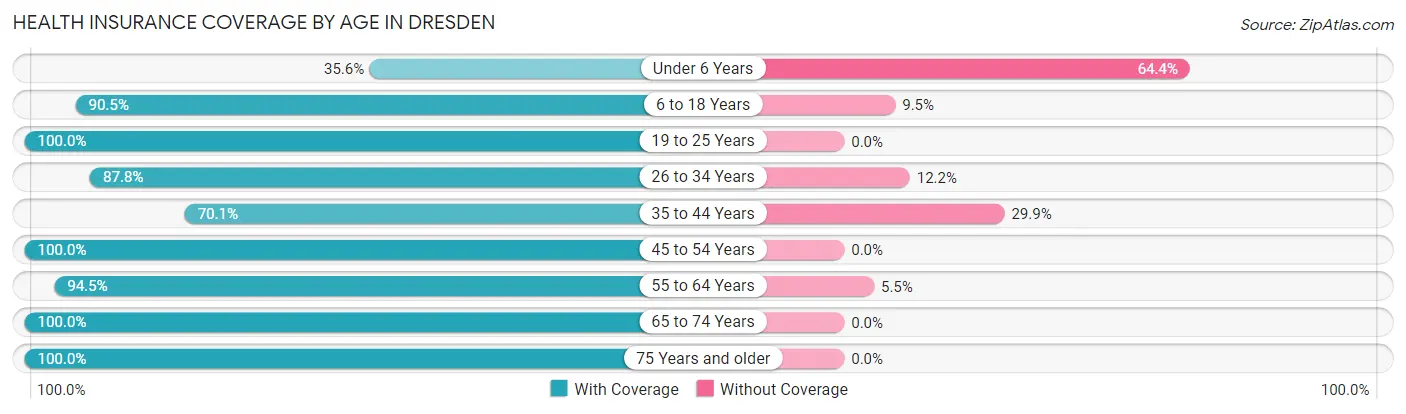
| Age Bracket | With Coverage | Without Coverage |
| Under 6 Years | 58 (35.6%) | 105 (64.4%) |
| 6 to 18 Years | 466 (90.5%) | 49 (9.5%) |
| 19 to 25 Years | 211 (100.0%) | 0 (0.0%) |
| 26 to 34 Years | 158 (87.8%) | 22 (12.2%) |
| 35 to 44 Years | 371 (70.1%) | 158 (29.9%) |
| 45 to 54 Years | 315 (100.0%) | 0 (0.0%) |
| 55 to 64 Years | 256 (94.5%) | 15 (5.5%) |
| 65 to 74 Years | 421 (100.0%) | 0 (0.0%) |
| 75 Years and older | 257 (100.0%) | 0 (0.0%) |
| Total | 2,513 (87.8%) | 349 (12.2%) |
Health Insurance Coverage by Citizenship Status in Dresden
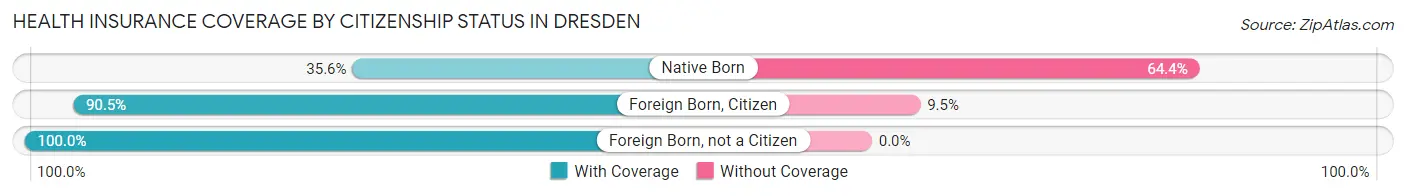
| Citizenship Status | With Coverage | Without Coverage |
| Native Born | 58 (35.6%) | 105 (64.4%) |
| Foreign Born, Citizen | 466 (90.5%) | 49 (9.5%) |
| Foreign Born, not a Citizen | 211 (100.0%) | 0 (0.0%) |
Health Insurance Coverage by Household Income in Dresden
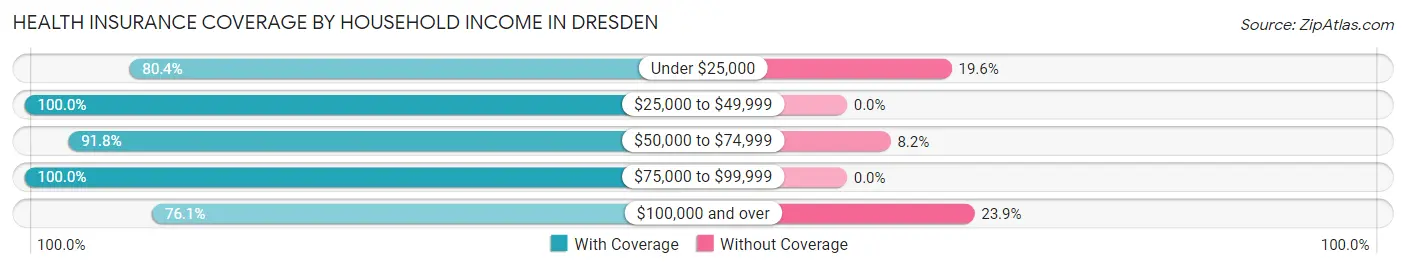
| Household Income | With Coverage | Without Coverage |
| Under $25,000 | 303 (80.4%) | 74 (19.6%) |
| $25,000 to $49,999 | 663 (100.0%) | 0 (0.0%) |
| $50,000 to $74,999 | 730 (91.8%) | 65 (8.2%) |
| $75,000 to $99,999 | 148 (100.0%) | 0 (0.0%) |
| $100,000 and over | 669 (76.1%) | 210 (23.9%) |
Public vs Private Health Insurance Coverage by Age in Dresden
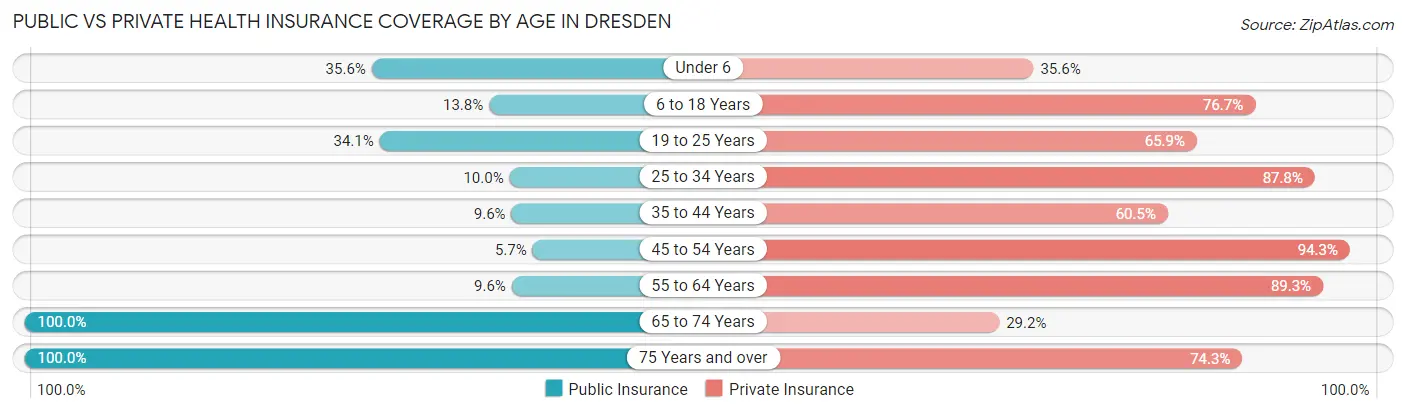
| Age Bracket | Public Insurance | Private Insurance |
| Under 6 | 58 (35.6%) | 58 (35.6%) |
| 6 to 18 Years | 71 (13.8%) | 395 (76.7%) |
| 19 to 25 Years | 72 (34.1%) | 139 (65.9%) |
| 25 to 34 Years | 18 (10.0%) | 158 (87.8%) |
| 35 to 44 Years | 51 (9.6%) | 320 (60.5%) |
| 45 to 54 Years | 18 (5.7%) | 297 (94.3%) |
| 55 to 64 Years | 26 (9.6%) | 242 (89.3%) |
| 65 to 74 Years | 421 (100.0%) | 123 (29.2%) |
| 75 Years and over | 257 (100.0%) | 191 (74.3%) |
| Total | 992 (34.7%) | 1,923 (67.2%) |
Disability Status by Sex by Age in Dresden
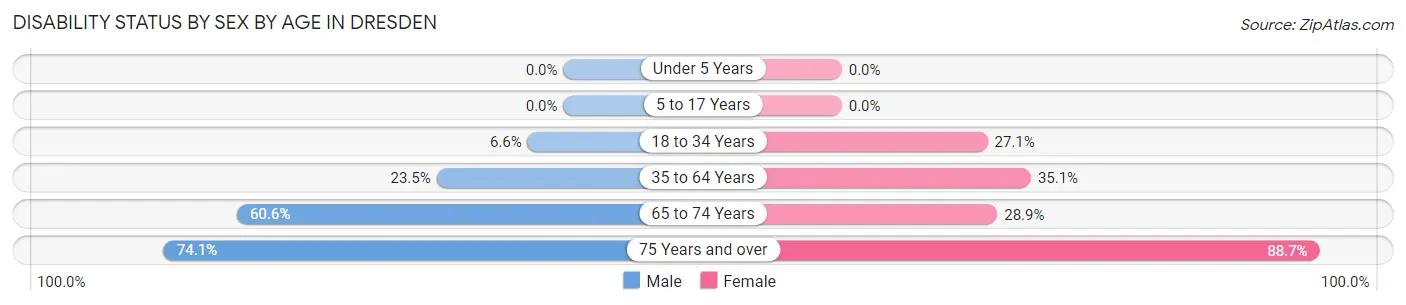
| Age Bracket | Male | Female |
| Under 5 Years | 0 (0.0%) | 0 (0.0%) |
| 5 to 17 Years | 0 (0.0%) | 0 (0.0%) |
| 18 to 34 Years | 18 (6.6%) | 72 (27.1%) |
| 35 to 64 Years | 117 (23.5%) | 217 (35.1%) |
| 65 to 74 Years | 106 (60.6%) | 71 (28.9%) |
| 75 Years and over | 86 (74.1%) | 125 (88.6%) |
Disability Class by Sex by Age in Dresden
Disability Class: Hearing Difficulty
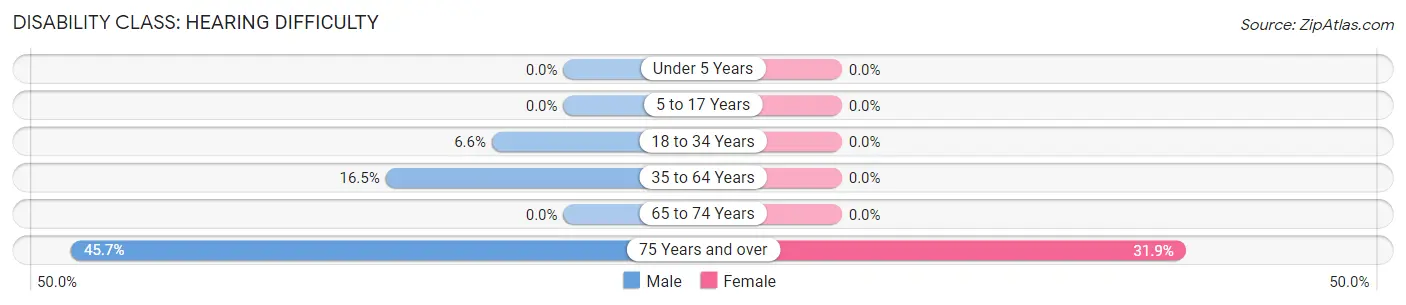
| Age Bracket | Male | Female |
| Under 5 Years | 0 (0.0%) | 0 (0.0%) |
| 5 to 17 Years | 0 (0.0%) | 0 (0.0%) |
| 18 to 34 Years | 18 (6.6%) | 0 (0.0%) |
| 35 to 64 Years | 82 (16.5%) | 0 (0.0%) |
| 65 to 74 Years | 0 (0.0%) | 0 (0.0%) |
| 75 Years and over | 53 (45.7%) | 45 (31.9%) |
Disability Class: Vision Difficulty
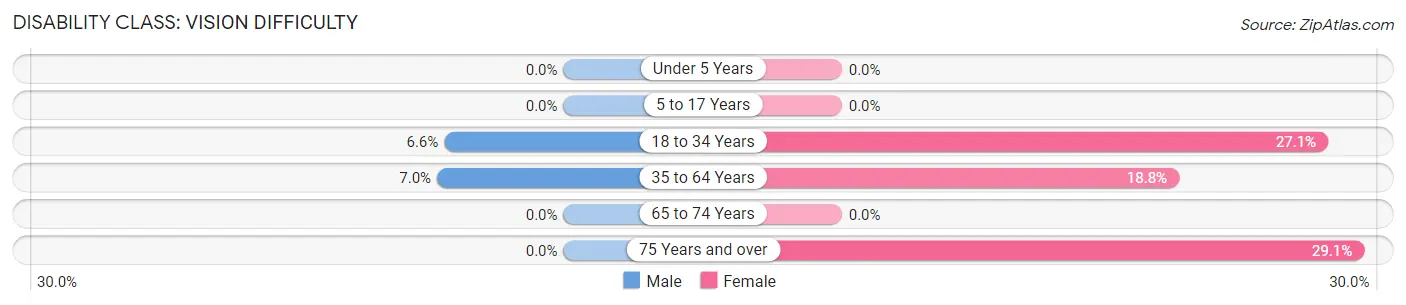
| Age Bracket | Male | Female |
| Under 5 Years | 0 (0.0%) | 0 (0.0%) |
| 5 to 17 Years | 0 (0.0%) | 0 (0.0%) |
| 18 to 34 Years | 18 (6.6%) | 72 (27.1%) |
| 35 to 64 Years | 35 (7.0%) | 116 (18.8%) |
| 65 to 74 Years | 0 (0.0%) | 0 (0.0%) |
| 75 Years and over | 0 (0.0%) | 41 (29.1%) |
Disability Class: Cognitive Difficulty
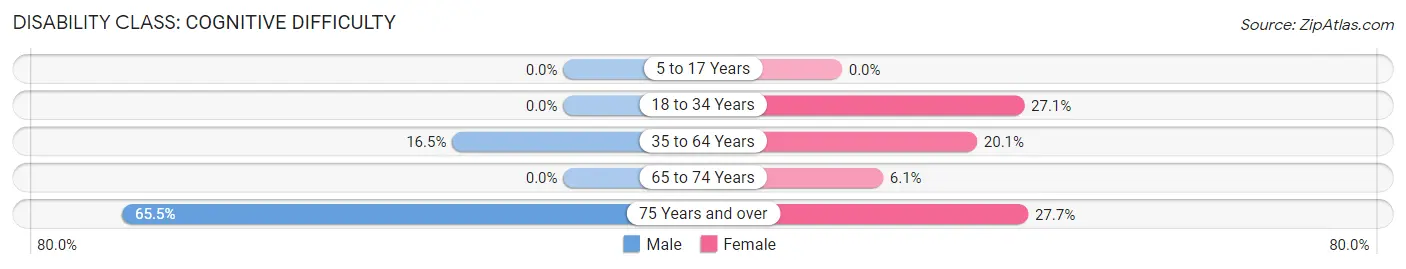
| Age Bracket | Male | Female |
| 5 to 17 Years | 0 (0.0%) | 0 (0.0%) |
| 18 to 34 Years | 0 (0.0%) | 72 (27.1%) |
| 35 to 64 Years | 82 (16.5%) | 124 (20.1%) |
| 65 to 74 Years | 0 (0.0%) | 15 (6.1%) |
| 75 Years and over | 76 (65.5%) | 39 (27.7%) |
Disability Class: Ambulatory Difficulty
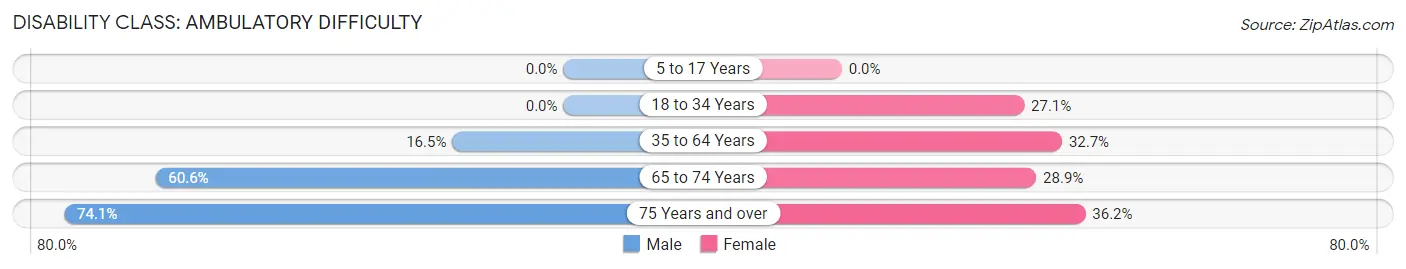
| Age Bracket | Male | Female |
| 5 to 17 Years | 0 (0.0%) | 0 (0.0%) |
| 18 to 34 Years | 0 (0.0%) | 72 (27.1%) |
| 35 to 64 Years | 82 (16.5%) | 202 (32.7%) |
| 65 to 74 Years | 106 (60.6%) | 71 (28.9%) |
| 75 Years and over | 86 (74.1%) | 51 (36.2%) |
Disability Class: Self-Care Difficulty
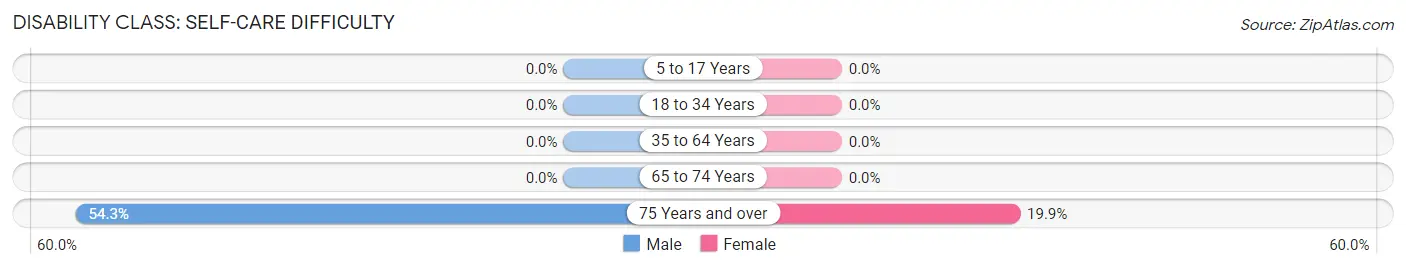
| Age Bracket | Male | Female |
| 5 to 17 Years | 0 (0.0%) | 0 (0.0%) |
| 18 to 34 Years | 0 (0.0%) | 0 (0.0%) |
| 35 to 64 Years | 0 (0.0%) | 0 (0.0%) |
| 65 to 74 Years | 0 (0.0%) | 0 (0.0%) |
| 75 Years and over | 63 (54.3%) | 28 (19.9%) |
Technology Access in Dresden
Computing Device Access in Dresden
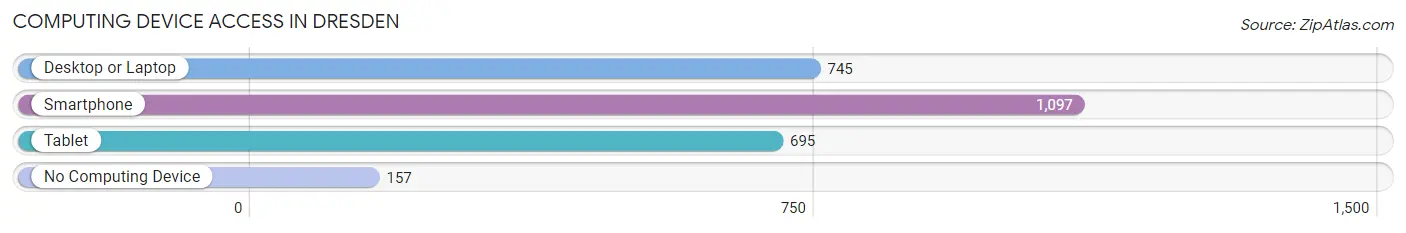
| Device Type | # Households | % Households |
| Desktop or Laptop | 745 | 56.0% |
| Smartphone | 1,097 | 82.5% |
| Tablet | 695 | 52.3% |
| No Computing Device | 157 | 11.8% |
| Total | 1,330 | 100.0% |
Internet Access in Dresden
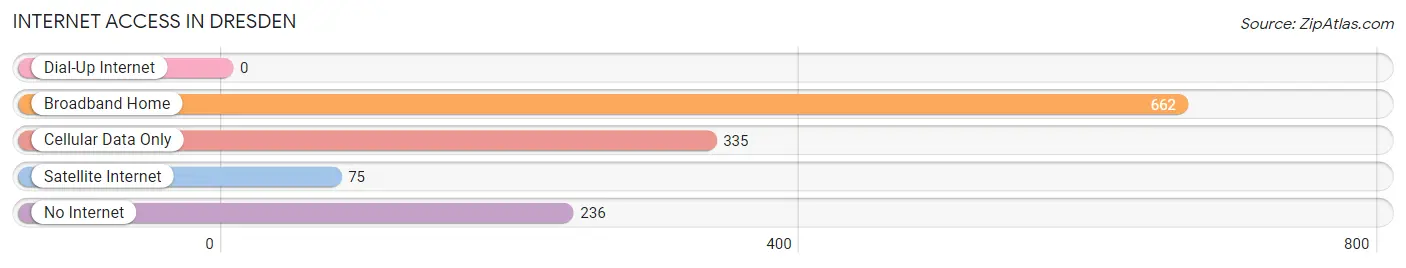
| Internet Type | # Households | % Households |
| Dial-Up Internet | 0 | 0.0% |
| Broadband Home | 662 | 49.8% |
| Cellular Data Only | 335 | 25.2% |
| Satellite Internet | 75 | 5.6% |
| No Internet | 236 | 17.7% |
| Total | 1,330 | 100.0% |
Dresden Summary
Dresden is a small town located in Weakley County, Tennessee. It is situated on the banks of the Obion River, approximately 20 miles east of the city of Martin. The town has a population of approximately 3,000 people and is known for its rural charm and friendly atmosphere.
History
Dresden was founded in 1819 by a group of settlers from North Carolina. The town was named after the city of Dresden in Germany. The settlers were attracted to the area due to its fertile soil and abundant natural resources. The town quickly grew and by the mid-1800s, it had become a thriving agricultural center.
In the late 1800s, the town began to experience a period of industrialization. The first industry to arrive was a cotton mill, which was followed by a furniture factory and a shoe factory. These industries provided employment for many of the town’s residents and helped to spur economic growth.
In the early 1900s, Dresden experienced a period of decline. The cotton mill closed in the 1920s and the furniture and shoe factories followed suit in the 1930s. The town’s population began to decline as people moved away in search of better economic opportunities.
In the 1950s, Dresden began to experience a period of revitalization. The town’s population began to grow again as new businesses opened and the economy began to improve. Today, Dresden is a thriving small town with a strong sense of community.
Geography
Dresden is located in the northwest corner of Weakley County, Tennessee. It is situated on the banks of the Obion River, approximately 20 miles east of the city of Martin. The town is surrounded by rolling hills and farmland. The climate is mild and humid, with average temperatures ranging from the mid-50s in the winter to the mid-80s in the summer.
Economy
Dresden’s economy is largely based on agriculture. The town is home to several large farms that produce a variety of crops, including corn, soybeans, and cotton. The town also has a thriving timber industry, with several sawmills located in the area.
In addition to agriculture, Dresden is home to several small businesses. These include restaurants, retail stores, and service providers. The town also has a small manufacturing sector, which produces a variety of products, including furniture and clothing.
Demographics
As of the 2010 census, Dresden had a population of 3,000 people. The racial makeup of the town was 95.3% White, 2.3% African American, 0.3% Native American, 0.3% Asian, and 1.7% from other races. The median household income was $30,000, and the median age was 38.
Conclusion
Dresden is a small town located in Weakley County, Tennessee. It is situated on the banks of the Obion River, approximately 20 miles east of the city of Martin. The town has a population of approximately 3,000 people and is known for its rural charm and friendly atmosphere. Dresden’s economy is largely based on agriculture, with several large farms producing a variety of crops. The town also has a thriving timber industry and a small manufacturing sector. The racial makeup of the town is predominantly White, with a small percentage of African American, Native American, and Asian residents. The median household income is $30,000, and the median age is 38.
Common Questions
What is Per Capita Income in Dresden?
Per Capita income in Dresden is $39,952.
What is the Median Family Income in Dresden?
Median Family Income in Dresden is $68,889.
What is the Median Household income in Dresden?
Median Household Income in Dresden is $50,595.
What is Income or Wage Gap in Dresden?
Income or Wage Gap in Dresden is 29.1%.
Women in Dresden earn 70.9 cents for every dollar earned by a man.
What is Inequality or Gini Index in Dresden?
Inequality or Gini Index in Dresden is 0.54.
What is the Total Population of Dresden?
Total Population of Dresden is 2,983.
What is the Total Male Population of Dresden?
Total Male Population of Dresden is 1,487.
What is the Total Female Population of Dresden?
Total Female Population of Dresden is 1,496.
What is the Ratio of Males per 100 Females in Dresden?
There are 99.40 Males per 100 Females in Dresden.
What is the Ratio of Females per 100 Males in Dresden?
There are 100.61 Females per 100 Males in Dresden.
What is the Median Population Age in Dresden?
Median Population Age in Dresden is 41.8 Years.
What is the Average Family Size in Dresden
Average Family Size in Dresden is 3.0 People.
What is the Average Household Size in Dresden
Average Household Size in Dresden is 2.1 People.
How Large is the Labor Force in Dresden?
There are 1,512 People in the Labor Forcein in Dresden.
What is the Percentage of People in the Labor Force in Dresden?
59.9% of People are in the Labor Force in Dresden.
What is the Unemployment Rate in Dresden?
Unemployment Rate in Dresden is 2.4%.