Dover, TN Map & Demographics
Dover Map
Dover Overview
$27,896
PER CAPITA INCOME
$83,750
AVG FAMILY INCOME
$63,603
AVG HOUSEHOLD INCOME
39.4%
WAGE / INCOME GAP [ % ]
60.6¢/ $1
WAGE / INCOME GAP [ $ ]
0.42
INEQUALITY / GINI INDEX
1,985
TOTAL POPULATION
955
MALE POPULATION
1,030
FEMALE POPULATION
92.72
MALES / 100 FEMALES
107.85
FEMALES / 100 MALES
43.5
MEDIAN AGE
3.9
AVG FAMILY SIZE
2.6
AVG HOUSEHOLD SIZE
857
LABOR FORCE [ PEOPLE ]
51.6%
PERCENT IN LABOR FORCE
6.2%
UNEMPLOYMENT RATE
Dover Zip Codes
Dover Area Codes
Income in Dover
Income Overview in Dover
Per Capita Income in Dover is $27,896, while median incomes of families and households are $83,750 and $63,603 respectively.
| Characteristic | Number | Measure |
| Per Capita Income | 1,985 | $27,896 |
| Median Family Income | 381 | $83,750 |
| Mean Family Income | 381 | $90,243 |
| Median Household Income | 705 | $63,603 |
| Mean Household Income | 705 | $69,349 |
| Income Deficit | 381 | $0 |
| Wage / Income Gap (%) | 1,985 | 39.35% |
| Wage / Income Gap ($) | 1,985 | 60.65¢ per $1 |
| Gini / Inequality Index | 1,985 | 0.42 |
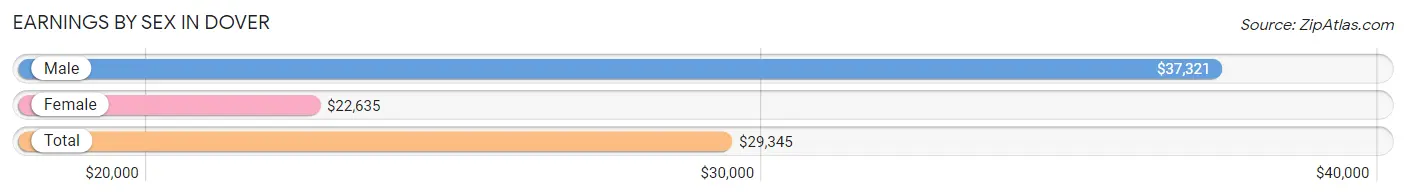
Earnings by Sex in Dover
Average Earnings in Dover are $29,345, $37,321 for men and $22,635 for women, a difference of 39.4%.
| Sex | Number | Average Earnings |
| Male | 535 (54.4%) | $37,321 |
| Female | 448 (45.6%) | $22,635 |
| Total | 983 (100.0%) | $29,345 |
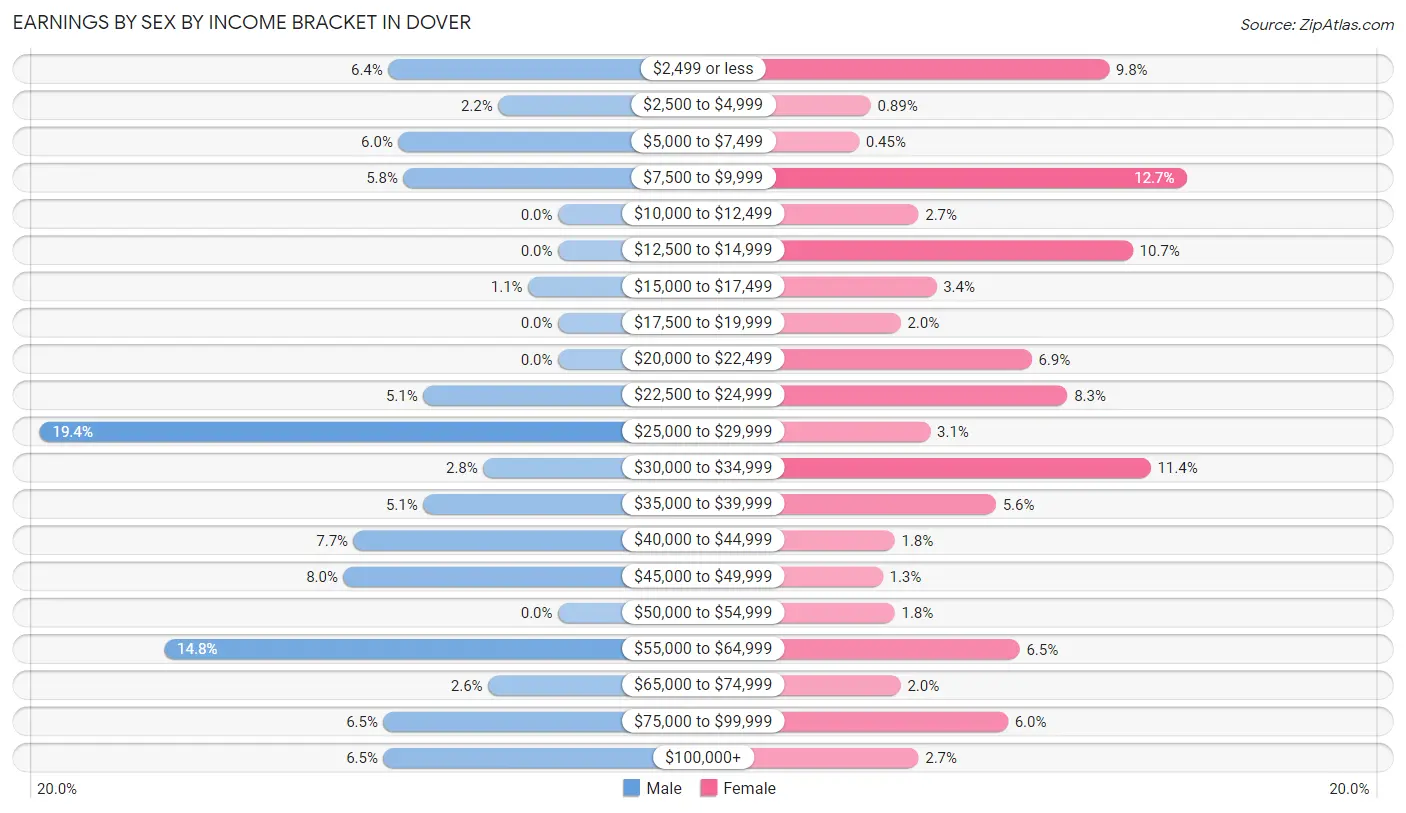
Earnings by Sex by Income Bracket in Dover
The most common earnings brackets in Dover are $25,000 to $29,999 for men (104 | 19.4%) and $7,500 to $9,999 for women (57 | 12.7%).
| Income | Male | Female |
| $2,499 or less | 34 (6.4%) | 44 (9.8%) |
| $2,500 to $4,999 | 12 (2.2%) | 4 (0.9%) |
| $5,000 to $7,499 | 32 (6.0%) | 2 (0.4%) |
| $7,500 to $9,999 | 31 (5.8%) | 57 (12.7%) |
| $10,000 to $12,499 | 0 (0.0%) | 12 (2.7%) |
| $12,500 to $14,999 | 0 (0.0%) | 48 (10.7%) |
| $15,000 to $17,499 | 6 (1.1%) | 15 (3.4%) |
| $17,500 to $19,999 | 0 (0.0%) | 9 (2.0%) |
| $20,000 to $22,499 | 0 (0.0%) | 31 (6.9%) |
| $22,500 to $24,999 | 27 (5.1%) | 37 (8.3%) |
| $25,000 to $29,999 | 104 (19.4%) | 14 (3.1%) |
| $30,000 to $34,999 | 15 (2.8%) | 51 (11.4%) |
| $35,000 to $39,999 | 27 (5.1%) | 25 (5.6%) |
| $40,000 to $44,999 | 41 (7.7%) | 8 (1.8%) |
| $45,000 to $49,999 | 43 (8.0%) | 6 (1.3%) |
| $50,000 to $54,999 | 0 (0.0%) | 8 (1.8%) |
| $55,000 to $64,999 | 79 (14.8%) | 29 (6.5%) |
| $65,000 to $74,999 | 14 (2.6%) | 9 (2.0%) |
| $75,000 to $99,999 | 35 (6.5%) | 27 (6.0%) |
| $100,000+ | 35 (6.5%) | 12 (2.7%) |
| Total | 535 (100.0%) | 448 (100.0%) |
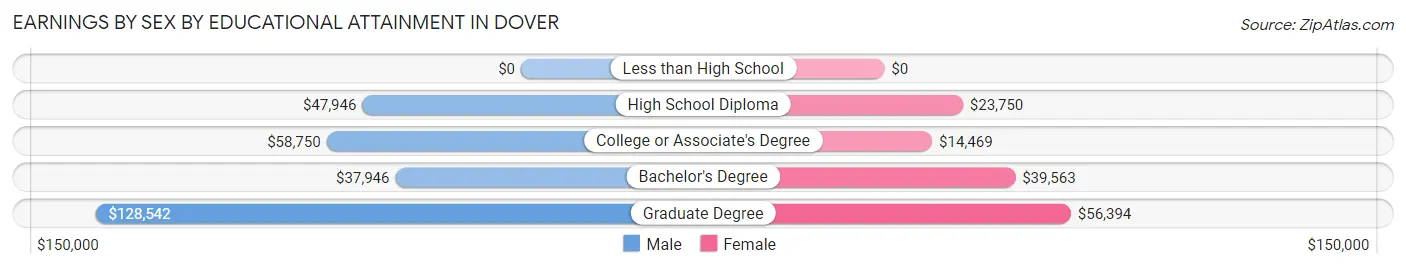
Earnings by Sex by Educational Attainment in Dover
Average earnings in Dover are $41,067 for men and $32,368 for women, a difference of 21.2%. Men with an educational attainment of graduate degree enjoy the highest average annual earnings of $128,542, while those with bachelor's degree education earn the least with $37,946. Women with an educational attainment of graduate degree earn the most with the average annual earnings of $56,394, while those with college or associate's degree education have the smallest earnings of $14,469.
| Educational Attainment | Male Income | Female Income |
| Less than High School | - | - |
| High School Diploma | $47,946 | $23,750 |
| College or Associate's Degree | $58,750 | $14,469 |
| Bachelor's Degree | $37,946 | $39,563 |
| Graduate Degree | $128,542 | $56,394 |
| Total | $41,067 | $32,368 |
Family Income in Dover
Family Income Brackets in Dover
According to the Dover family income data, there are 105 families falling into the $100,000 to $149,999 income range, which is the most common income bracket and makes up 27.6% of all families. Conversely, the $200,000+ income bracket is the least frequent group with only 7 families (1.8%) belonging to this category.
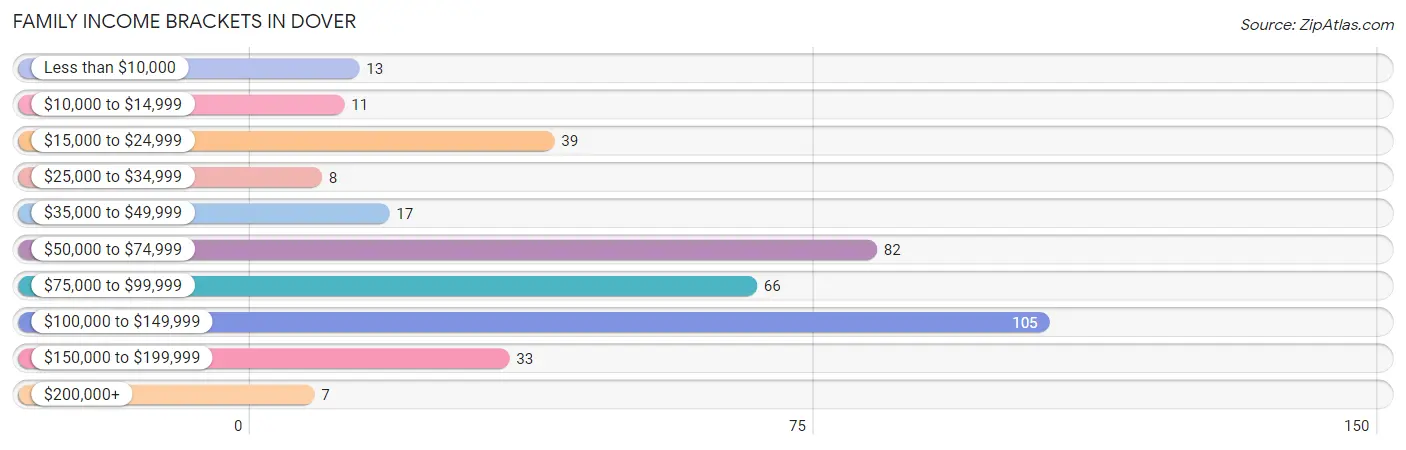
| Income Bracket | # Families | % Families |
| Less than $10,000 | 13 | 3.4% |
| $10,000 to $14,999 | 11 | 2.9% |
| $15,000 to $24,999 | 39 | 10.2% |
| $25,000 to $34,999 | 8 | 2.1% |
| $35,000 to $49,999 | 17 | 4.5% |
| $50,000 to $74,999 | 82 | 21.5% |
| $75,000 to $99,999 | 66 | 17.3% |
| $100,000 to $149,999 | 105 | 27.6% |
| $150,000 to $199,999 | 33 | 8.7% |
| $200,000+ | 7 | 1.8% |
Family Income by Famaliy Size in Dover
4-person families (102 | 26.8%) account for the highest median family income in Dover with $111,635 per family, while 2-person families (175 | 45.9%) have the highest median income of $33,125 per family member.
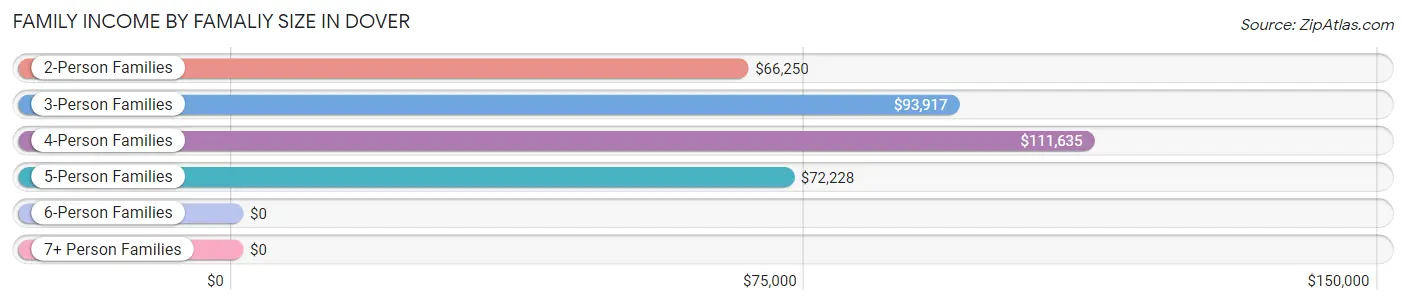
| Income Bracket | # Families | Median Income |
| 2-Person Families | 175 (45.9%) | $66,250 |
| 3-Person Families | 63 (16.5%) | $93,917 |
| 4-Person Families | 102 (26.8%) | $111,635 |
| 5-Person Families | 41 (10.8%) | $72,228 |
| 6-Person Families | 0 (0.0%) | $0 |
| 7+ Person Families | 0 (0.0%) | $0 |
| Total | 381 (100.0%) | $83,750 |
Family Income by Number of Earners in Dover
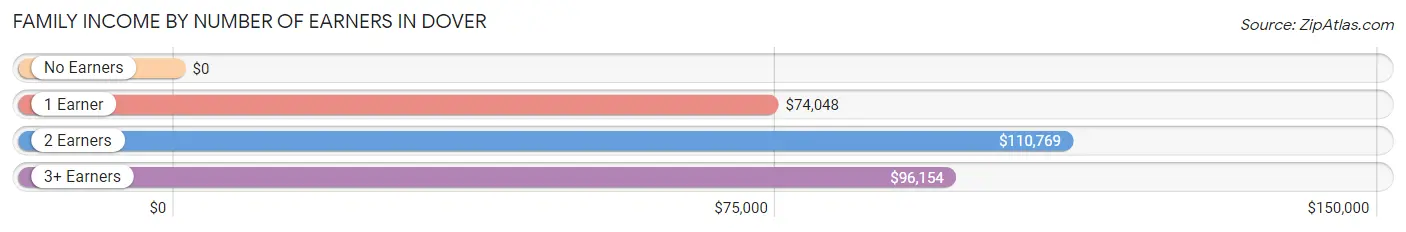
| Number of Earners | # Families | Median Income |
| No Earners | 77 (20.2%) | $0 |
| 1 Earner | 96 (25.2%) | $74,048 |
| 2 Earners | 146 (38.3%) | $110,769 |
| 3+ Earners | 62 (16.3%) | $96,154 |
| Total | 381 (100.0%) | $83,750 |
Household Income in Dover
Household Income Brackets in Dover
With 156 households falling in the category, the $50,000 to $74,999 income range is the most frequent in Dover, accounting for 22.1% of all households. In contrast, only 12 households (1.7%) fall into the $200,000+ income bracket, making it the least populous group.
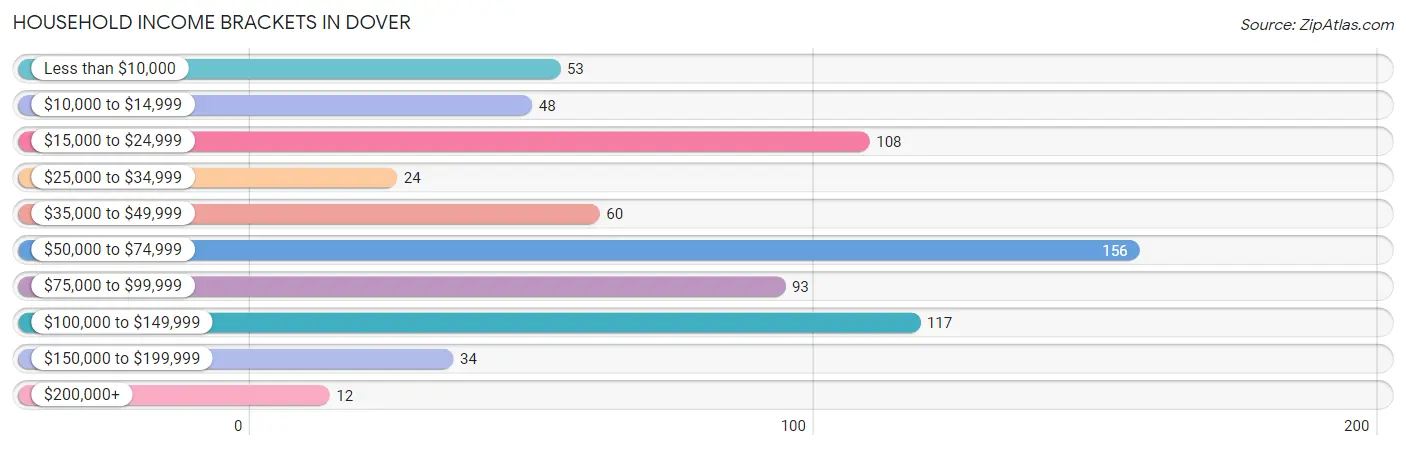
| Income Bracket | # Households | % Households |
| Less than $10,000 | 53 | 7.5% |
| $10,000 to $14,999 | 48 | 6.8% |
| $15,000 to $24,999 | 108 | 15.3% |
| $25,000 to $34,999 | 24 | 3.4% |
| $35,000 to $49,999 | 60 | 8.5% |
| $50,000 to $74,999 | 156 | 22.1% |
| $75,000 to $99,999 | 93 | 13.2% |
| $100,000 to $149,999 | 117 | 16.6% |
| $150,000 to $199,999 | 34 | 4.8% |
| $200,000+ | 12 | 1.7% |
Household Income by Householder Age in Dover
The median household income in Dover is $63,603, with the highest median household income of $83,900 found in the 45 to 64 years age bracket for the primary householder. A total of 242 households (34.3%) fall into this category. Meanwhile, the 15 to 24 years age bracket for the primary householder has the lowest median household income of $0, with 25 households (3.5%) in this group.
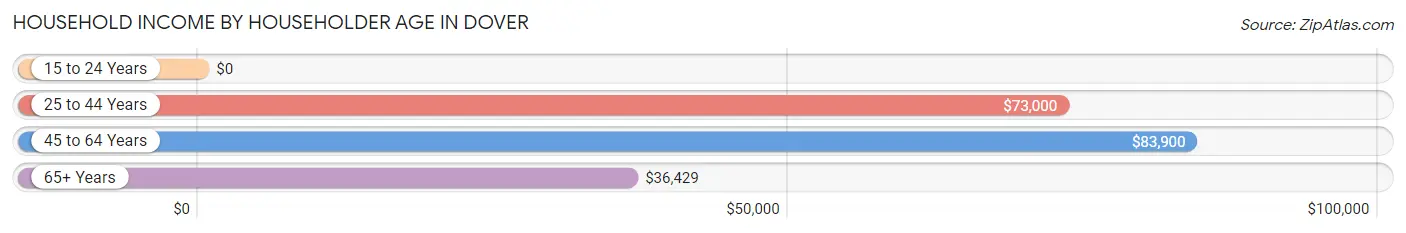
| Income Bracket | # Households | Median Income |
| 15 to 24 Years | 25 (3.5%) | $0 |
| 25 to 44 Years | 186 (26.4%) | $73,000 |
| 45 to 64 Years | 242 (34.3%) | $83,900 |
| 65+ Years | 252 (35.7%) | $36,429 |
| Total | 705 (100.0%) | $63,603 |
Poverty in Dover
Income Below Poverty by Sex and Age in Dover
With 15.0% poverty level for males and 12.2% for females among the residents of Dover, 25 to 34 year old males and 15 year old females are the most vulnerable to poverty, with 53 males (49.1%) and 6 females (100.0%) in their respective age groups living below the poverty level.
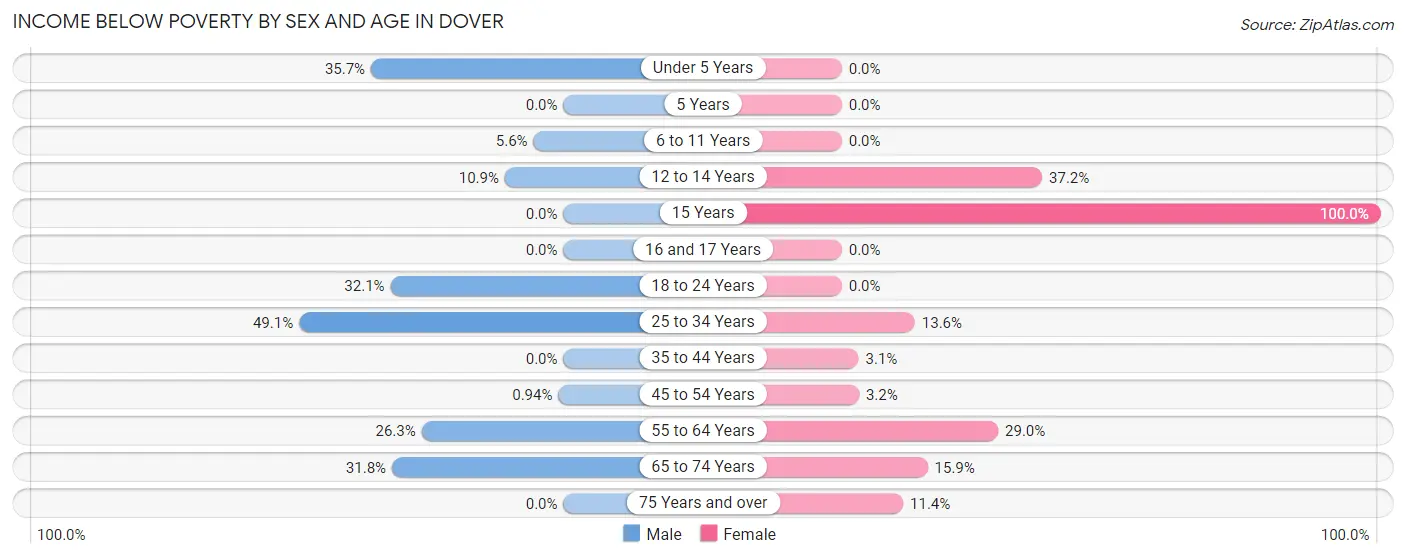
| Age Bracket | Male | Female |
| Under 5 Years | 5 (35.7%) | 0 (0.0%) |
| 5 Years | 0 (0.0%) | 0 (0.0%) |
| 6 to 11 Years | 5 (5.6%) | 0 (0.0%) |
| 12 to 14 Years | 5 (10.9%) | 29 (37.2%) |
| 15 Years | 0 (0.0%) | 6 (100.0%) |
| 16 and 17 Years | 0 (0.0%) | 0 (0.0%) |
| 18 to 24 Years | 26 (32.1%) | 0 (0.0%) |
| 25 to 34 Years | 53 (49.1%) | 8 (13.6%) |
| 35 to 44 Years | 0 (0.0%) | 4 (3.1%) |
| 45 to 54 Years | 2 (0.9%) | 3 (3.2%) |
| 55 to 64 Years | 15 (26.3%) | 38 (29.0%) |
| 65 to 74 Years | 21 (31.8%) | 18 (15.9%) |
| 75 Years and over | 0 (0.0%) | 14 (11.4%) |
| Total | 132 (15.0%) | 120 (12.2%) |
Income Above Poverty by Sex and Age in Dover
According to the poverty statistics in Dover, males aged 16 and 17 years and females aged under 5 years are the age groups that are most secure financially, with 100.0% of males and 100.0% of females in these age groups living above the poverty line.
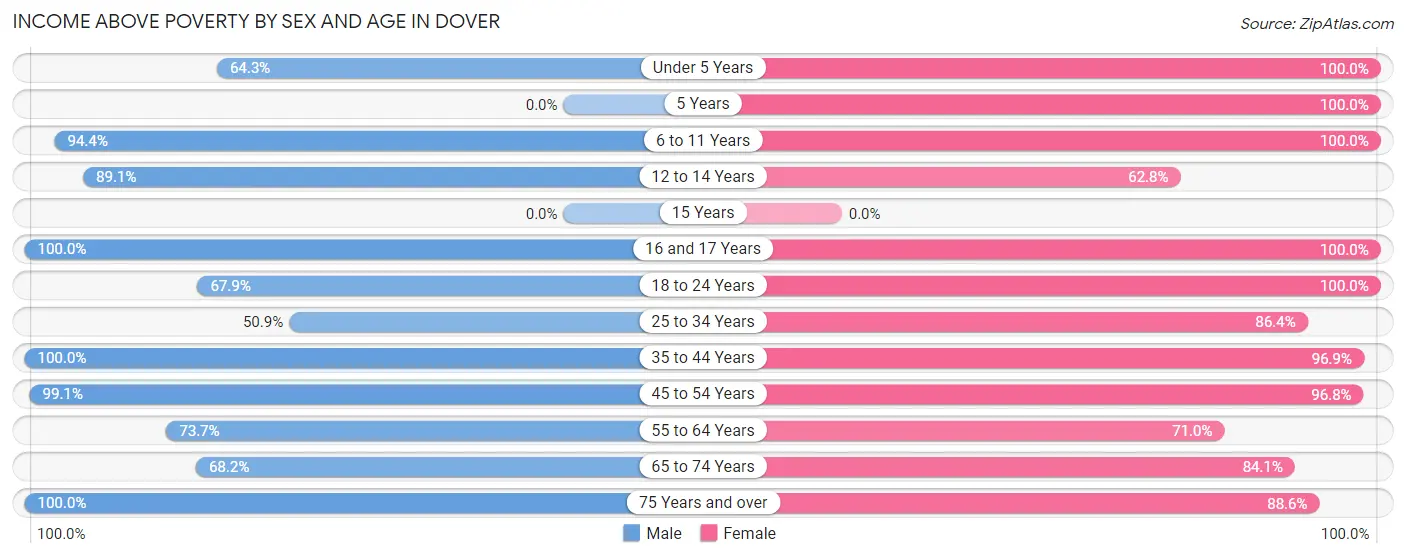
| Age Bracket | Male | Female |
| Under 5 Years | 9 (64.3%) | 16 (100.0%) |
| 5 Years | 0 (0.0%) | 14 (100.0%) |
| 6 to 11 Years | 85 (94.4%) | 61 (100.0%) |
| 12 to 14 Years | 41 (89.1%) | 49 (62.8%) |
| 15 Years | 0 (0.0%) | 0 (0.0%) |
| 16 and 17 Years | 52 (100.0%) | 19 (100.0%) |
| 18 to 24 Years | 55 (67.9%) | 144 (100.0%) |
| 25 to 34 Years | 55 (50.9%) | 51 (86.4%) |
| 35 to 44 Years | 115 (100.0%) | 124 (96.9%) |
| 45 to 54 Years | 211 (99.1%) | 91 (96.8%) |
| 55 to 64 Years | 42 (73.7%) | 93 (71.0%) |
| 65 to 74 Years | 45 (68.2%) | 95 (84.1%) |
| 75 Years and over | 40 (100.0%) | 109 (88.6%) |
| Total | 750 (85.0%) | 866 (87.8%) |
Income Below Poverty Among Married-Couple Families in Dover
The poverty statistics for married-couple families in Dover show that 7.4% or 23 of the total 311 families live below the poverty line. Families with no children have the highest poverty rate of 11.0%, comprising of 18 families. On the other hand, families with 3 or 4 children have the lowest poverty rate of 0.0%, which includes 0 families.
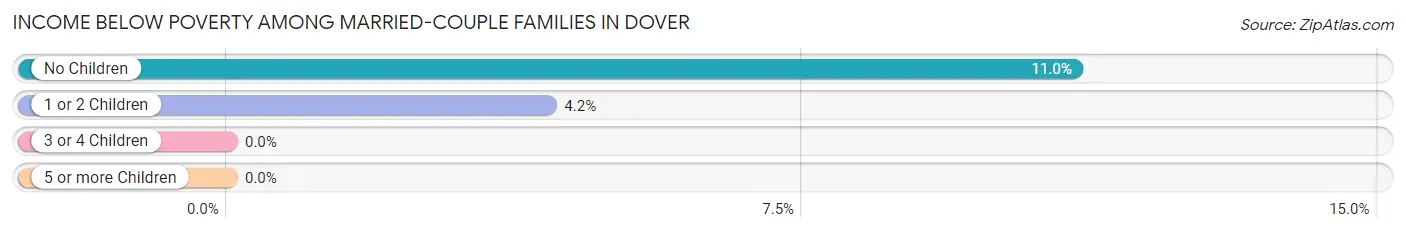
| Children | Above Poverty | Below Poverty |
| No Children | 145 (89.0%) | 18 (11.0%) |
| 1 or 2 Children | 115 (95.8%) | 5 (4.2%) |
| 3 or 4 Children | 28 (100.0%) | 0 (0.0%) |
| 5 or more Children | 0 (0.0%) | 0 (0.0%) |
| Total | 288 (92.6%) | 23 (7.4%) |
Income Below Poverty Among Single-Parent Households in Dover
According to the poverty data in Dover, 26.8% or 11 single-father households and 62.1% or 18 single-mother households are living below the poverty line. Among single-father households, those with no children have the highest poverty rate, with 11 households (30.6%) experiencing poverty. Likewise, among single-mother households, those with 1 or 2 children have the highest poverty rate, with 18 households (100.0%) falling below the poverty line.
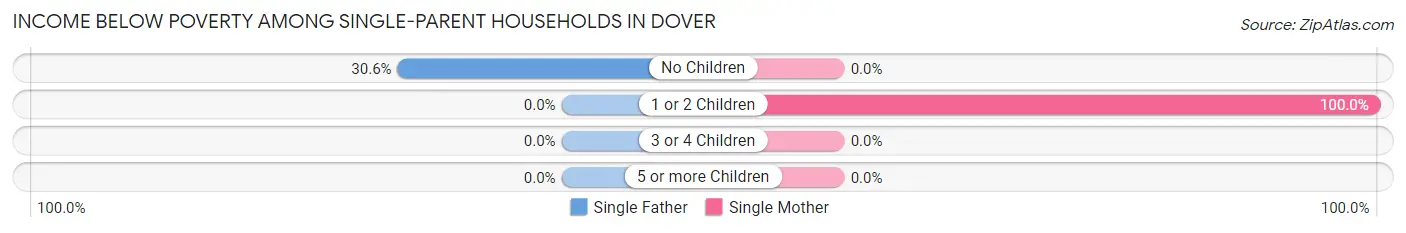
| Children | Single Father | Single Mother |
| No Children | 11 (30.6%) | 0 (0.0%) |
| 1 or 2 Children | 0 (0.0%) | 18 (100.0%) |
| 3 or 4 Children | 0 (0.0%) | 0 (0.0%) |
| 5 or more Children | 0 (0.0%) | 0 (0.0%) |
| Total | 11 (26.8%) | 18 (62.1%) |
Income Below Poverty Among Married-Couple vs Single-Parent Households in Dover
The poverty data for Dover shows that 23 of the married-couple family households (7.4%) and 29 of the single-parent households (41.4%) are living below the poverty level. Within the married-couple family households, those with no children have the highest poverty rate, with 18 households (11.0%) falling below the poverty line. Among the single-parent households, those with 1 or 2 children have the highest poverty rate, with 18 household (78.3%) living below poverty.
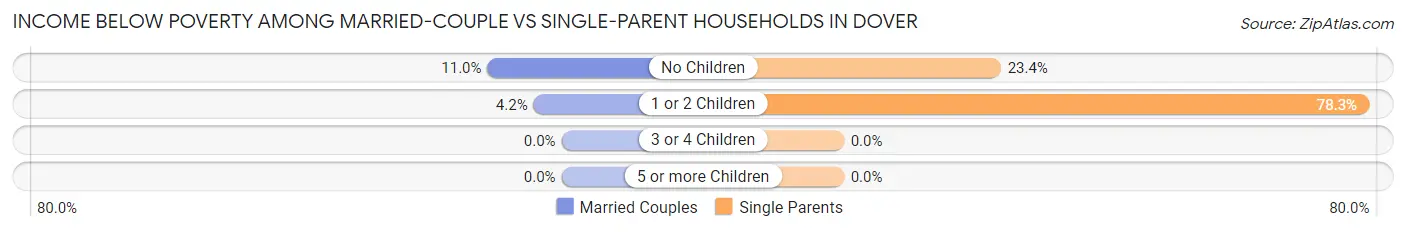
| Children | Married-Couple Families | Single-Parent Households |
| No Children | 18 (11.0%) | 11 (23.4%) |
| 1 or 2 Children | 5 (4.2%) | 18 (78.3%) |
| 3 or 4 Children | 0 (0.0%) | 0 (0.0%) |
| 5 or more Children | 0 (0.0%) | 0 (0.0%) |
| Total | 23 (7.4%) | 29 (41.4%) |
Race in Dover
The most populous races in Dover are White / Caucasian (1,879 | 94.7%), Black / African American (48 | 2.4%), and Two or more Races (47 | 2.4%).
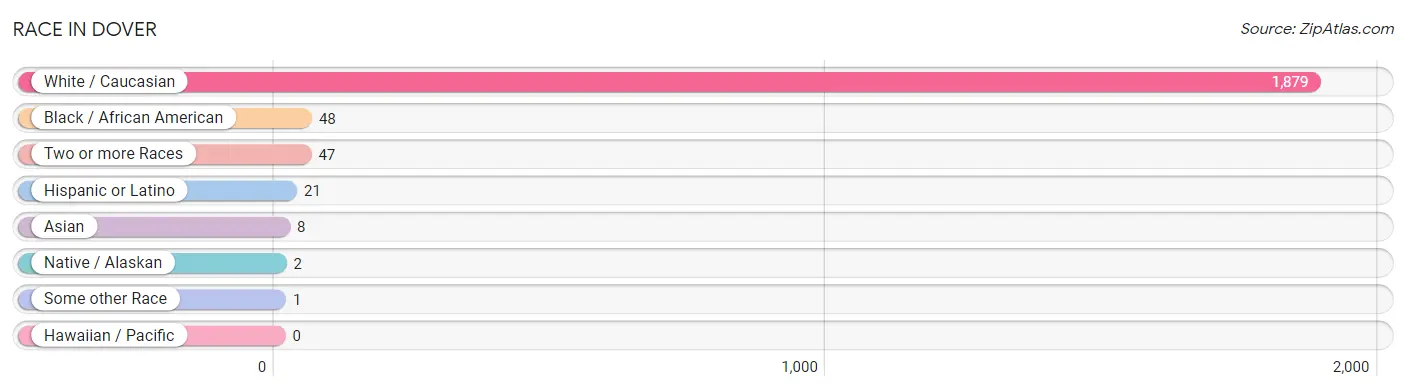
| Race | # Population | % Population |
| Asian | 8 | 0.4% |
| Black / African American | 48 | 2.4% |
| Hawaiian / Pacific | 0 | 0.0% |
| Hispanic or Latino | 21 | 1.1% |
| Native / Alaskan | 2 | 0.1% |
| White / Caucasian | 1,879 | 94.7% |
| Two or more Races | 47 | 2.4% |
| Some other Race | 1 | 0.1% |
| Total | 1,985 | 100.0% |
Ancestry in Dover
The most populous ancestries reported in Dover are English (270 | 13.6%), Irish (258 | 13.0%), American (229 | 11.5%), European (115 | 5.8%), and German (94 | 4.7%), together accounting for 48.7% of all Dover residents.
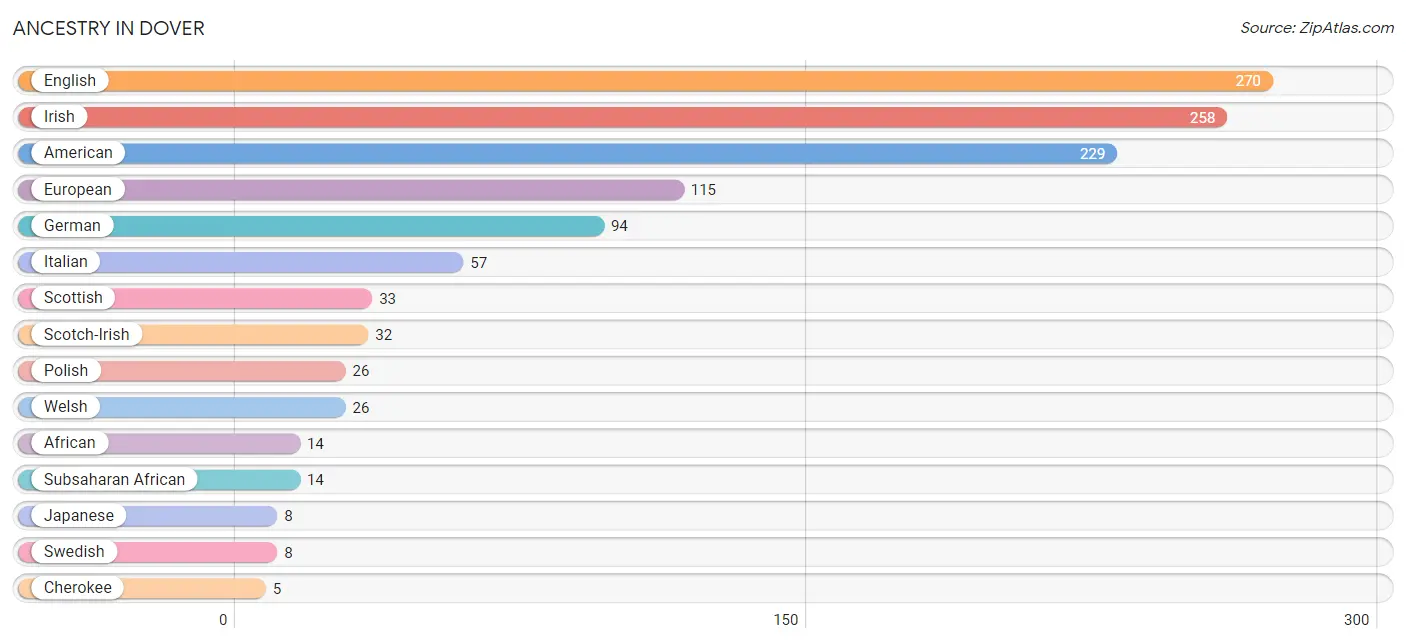
| Ancestry | # Population | % Population |
| African | 14 | 0.7% |
| American | 229 | 11.5% |
| British | 3 | 0.2% |
| Cherokee | 5 | 0.3% |
| Dutch | 3 | 0.2% |
| English | 270 | 13.6% |
| European | 115 | 5.8% |
| German | 94 | 4.7% |
| Irish | 258 | 13.0% |
| Italian | 57 | 2.9% |
| Japanese | 8 | 0.4% |
| Norwegian | 3 | 0.2% |
| Polish | 26 | 1.3% |
| Scotch-Irish | 32 | 1.6% |
| Scottish | 33 | 1.7% |
| Subsaharan African | 14 | 0.7% |
| Swedish | 8 | 0.4% |
| Welsh | 26 | 1.3% | View All 18 Rows |
Immigrants in Dover

| Immigration Origin | # Population | % Population | View All 0 Rows |
Sex and Age in Dover
Sex and Age in Dover
The most populous age groups in Dover are 45 to 49 Years (184 | 19.3%) for men and 20 to 24 Years (121 | 11.7%) for women.
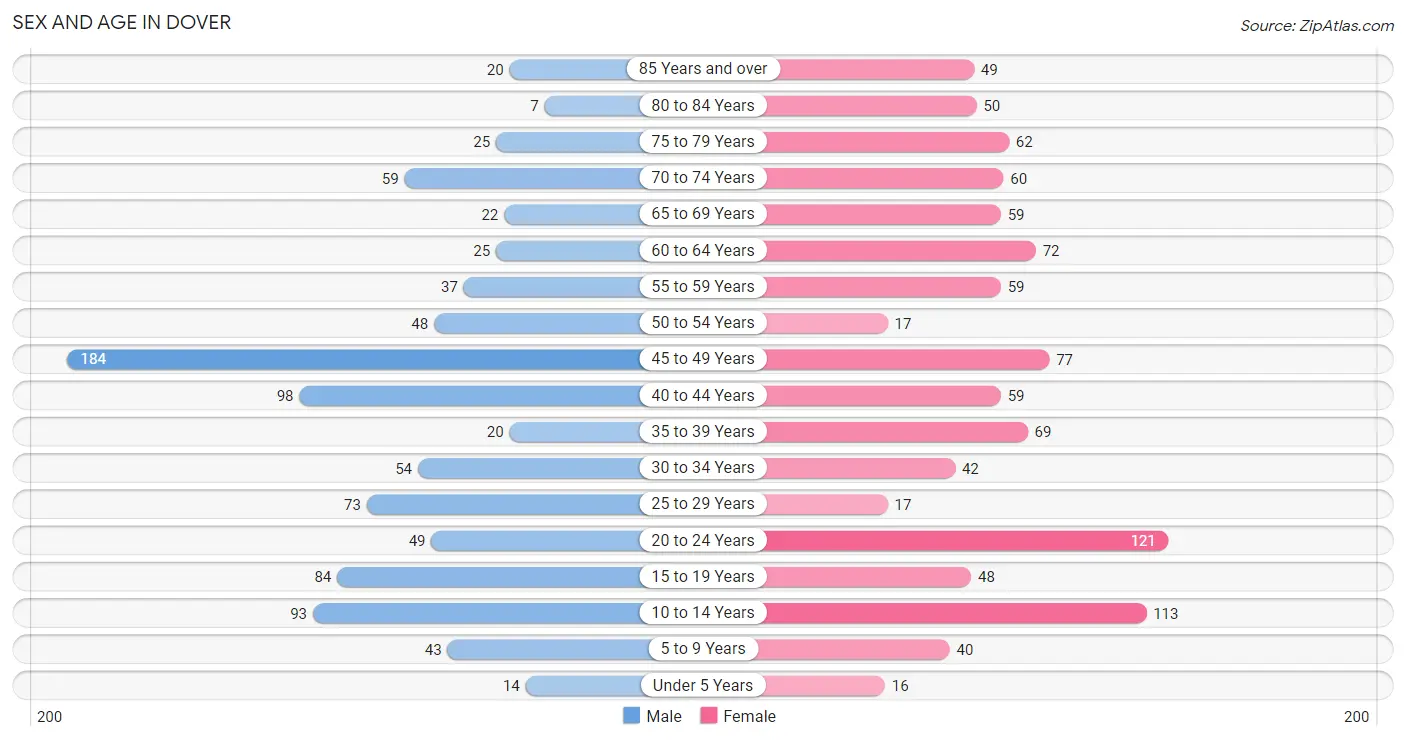
| Age Bracket | Male | Female |
| Under 5 Years | 14 (1.5%) | 16 (1.5%) |
| 5 to 9 Years | 43 (4.5%) | 40 (3.9%) |
| 10 to 14 Years | 93 (9.7%) | 113 (11.0%) |
| 15 to 19 Years | 84 (8.8%) | 48 (4.7%) |
| 20 to 24 Years | 49 (5.1%) | 121 (11.7%) |
| 25 to 29 Years | 73 (7.6%) | 17 (1.7%) |
| 30 to 34 Years | 54 (5.7%) | 42 (4.1%) |
| 35 to 39 Years | 20 (2.1%) | 69 (6.7%) |
| 40 to 44 Years | 98 (10.3%) | 59 (5.7%) |
| 45 to 49 Years | 184 (19.3%) | 77 (7.5%) |
| 50 to 54 Years | 48 (5.0%) | 17 (1.7%) |
| 55 to 59 Years | 37 (3.9%) | 59 (5.7%) |
| 60 to 64 Years | 25 (2.6%) | 72 (7.0%) |
| 65 to 69 Years | 22 (2.3%) | 59 (5.7%) |
| 70 to 74 Years | 59 (6.2%) | 60 (5.8%) |
| 75 to 79 Years | 25 (2.6%) | 62 (6.0%) |
| 80 to 84 Years | 7 (0.7%) | 50 (4.9%) |
| 85 Years and over | 20 (2.1%) | 49 (4.8%) |
| Total | 955 (100.0%) | 1,030 (100.0%) |
Families and Households in Dover
Median Family Size in Dover
The median family size in Dover is 3.92 persons per family, with single male/father families (41 | 10.8%) accounting for the largest median family size of 4.05 persons per family. On the other hand, single female/mother families (29 | 7.6%) represent the smallest median family size with 3.45 persons per family.
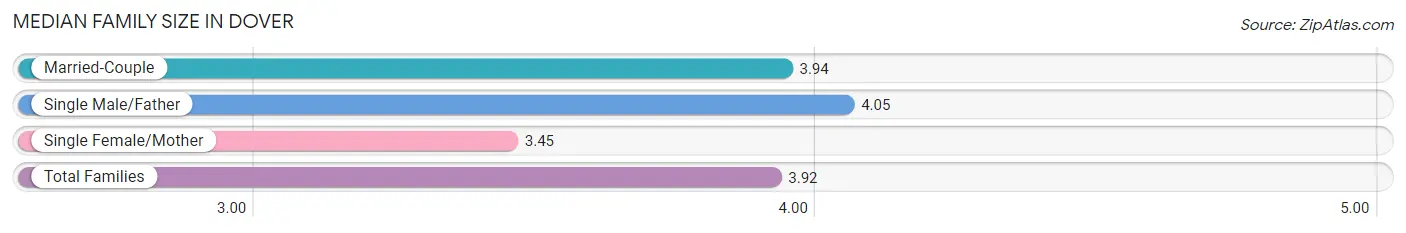
| Family Type | # Families | Family Size |
| Married-Couple | 311 (81.6%) | 3.94 |
| Single Male/Father | 41 (10.8%) | 4.05 |
| Single Female/Mother | 29 (7.6%) | 3.45 |
| Total Families | 381 (100.0%) | 3.92 |
Median Household Size in Dover
The median household size in Dover is 2.65 persons per household, with single male/father households (41 | 5.8%) accounting for the largest median household size of 4.17 persons per household. non-family households (324 | 46.0%) represent the smallest median household size with 1.11 persons per household.
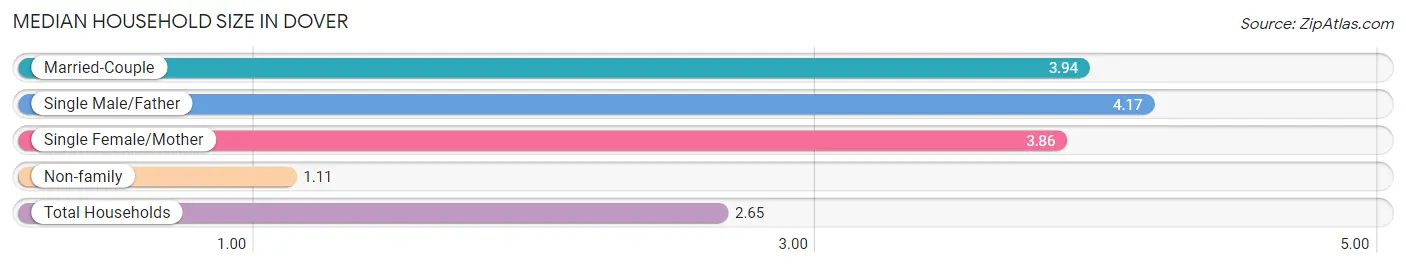
| Household Type | # Households | Household Size |
| Married-Couple | 311 (44.1%) | 3.94 |
| Single Male/Father | 41 (5.8%) | 4.17 |
| Single Female/Mother | 29 (4.1%) | 3.86 |
| Non-family | 324 (46.0%) | 1.11 |
| Total Households | 705 (100.0%) | 2.65 |
Household Size by Marriage Status in Dover
Out of a total of 705 households in Dover, 381 (54.0%) are family households, while 324 (46.0%) are nonfamily households. The most numerous type of family households are 2-person households, comprising 162, and the most common type of nonfamily households are 1-person households, comprising 300.
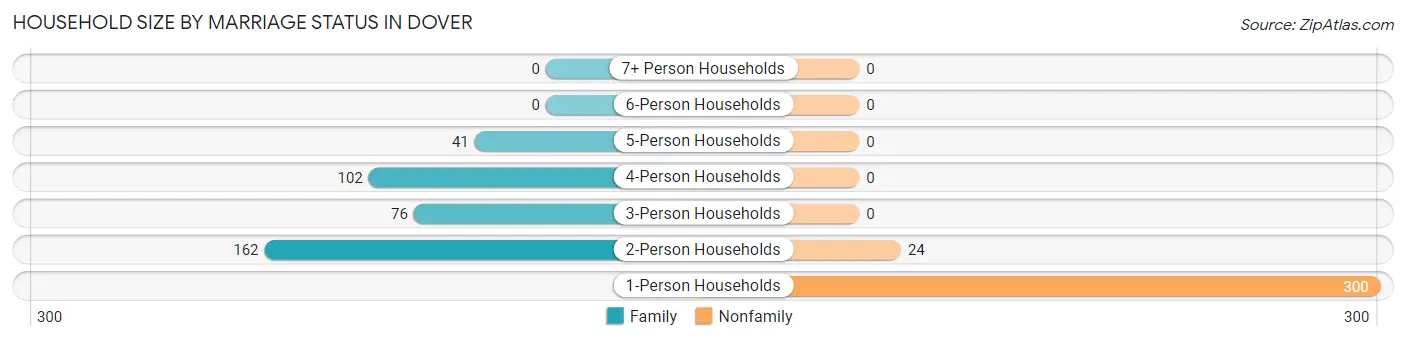
| Household Size | Family Households | Nonfamily Households |
| 1-Person Households | - | 300 (42.5%) |
| 2-Person Households | 162 (23.0%) | 24 (3.4%) |
| 3-Person Households | 76 (10.8%) | 0 (0.0%) |
| 4-Person Households | 102 (14.5%) | 0 (0.0%) |
| 5-Person Households | 41 (5.8%) | 0 (0.0%) |
| 6-Person Households | 0 (0.0%) | 0 (0.0%) |
| 7+ Person Households | 0 (0.0%) | 0 (0.0%) |
| Total | 381 (54.0%) | 324 (46.0%) |
Female Fertility in Dover
Fertility by Age in Dover
Average fertility rate in Dover is 30.0 births per 1,000 women. Women in the age bracket of 20 to 34 years have the highest fertility rate with 44.0 births per 1,000 women. Women in the age bracket of 20 to 34 years acount for 61.5% of all women with births.
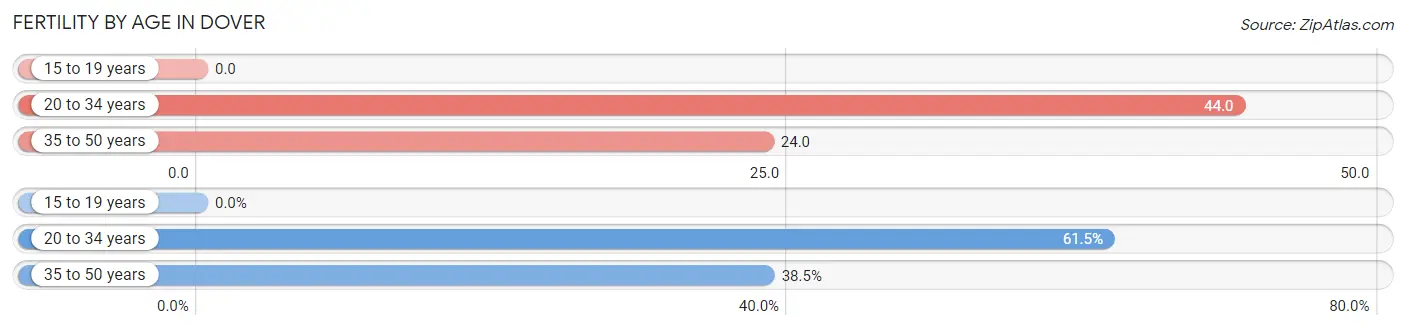
| Age Bracket | Women with Births | Births / 1,000 Women |
| 15 to 19 years | 0 (0.0%) | 0.0 |
| 20 to 34 years | 8 (61.5%) | 44.0 |
| 35 to 50 years | 5 (38.5%) | 24.0 |
| Total | 13 (100.0%) | 30.0 |
Fertility by Age by Marriage Status in Dover
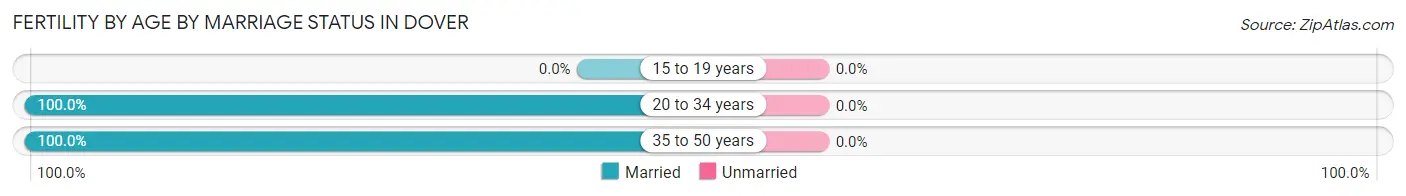
| Age Bracket | Married | Unmarried |
| 15 to 19 years | 0 (0.0%) | 0 (0.0%) |
| 20 to 34 years | 8 (100.0%) | 0 (0.0%) |
| 35 to 50 years | 5 (100.0%) | 0 (0.0%) |
| Total | 13 (100.0%) | 0 (0.0%) |
Fertility by Education in Dover
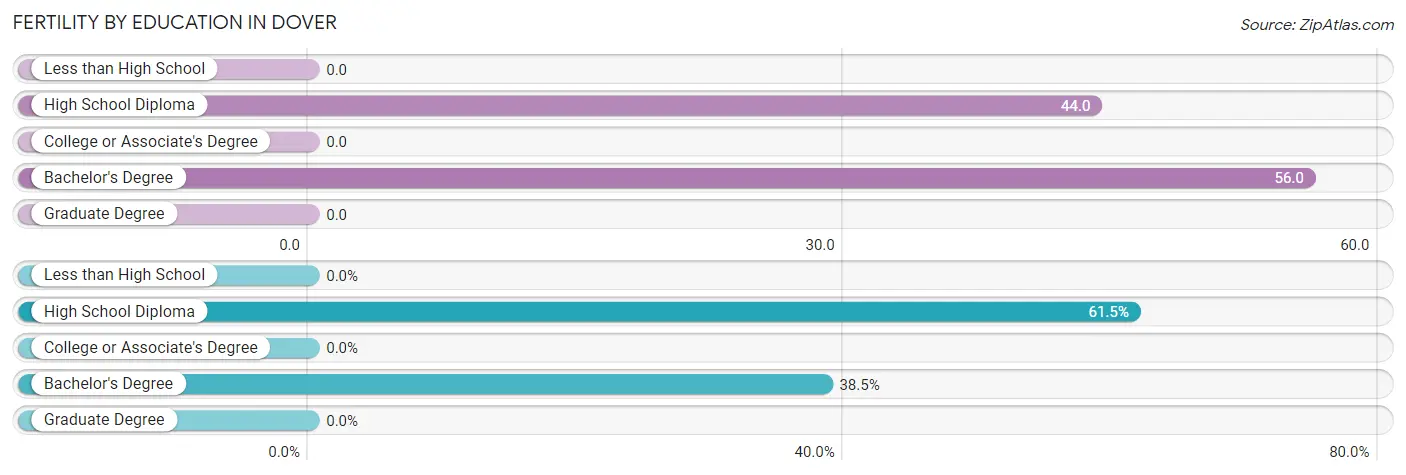
| Educational Attainment | Women with Births | Births / 1,000 Women |
| Less than High School | 0 (0.0%) | 0.0 |
| High School Diploma | 8 (61.5%) | 44.0 |
| College or Associate's Degree | 0 (0.0%) | 0.0 |
| Bachelor's Degree | 5 (38.5%) | 56.0 |
| Graduate Degree | 0 (0.0%) | 0.0 |
| Total | 13 (100.0%) | 30.0 |
Fertility by Education by Marriage Status in Dover
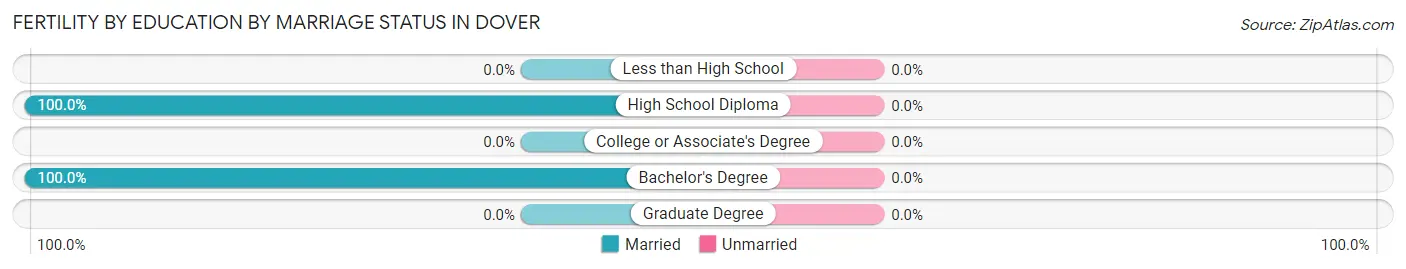
| Educational Attainment | Married | Unmarried |
| Less than High School | 0 (0.0%) | 0 (0.0%) |
| High School Diploma | 8 (100.0%) | 0 (0.0%) |
| College or Associate's Degree | 0 (0.0%) | 0 (0.0%) |
| Bachelor's Degree | 5 (100.0%) | 0 (0.0%) |
| Graduate Degree | 0 (0.0%) | 0 (0.0%) |
| Total | 13 (100.0%) | 0 (0.0%) |
Employment Characteristics in Dover
Employment by Class of Employer in Dover
Among the 797 employed individuals in Dover, private company employees (500 | 62.7%), local government employees (131 | 16.4%), and self-employed (not incorporated) (63 | 7.9%) make up the most common classes of employment.
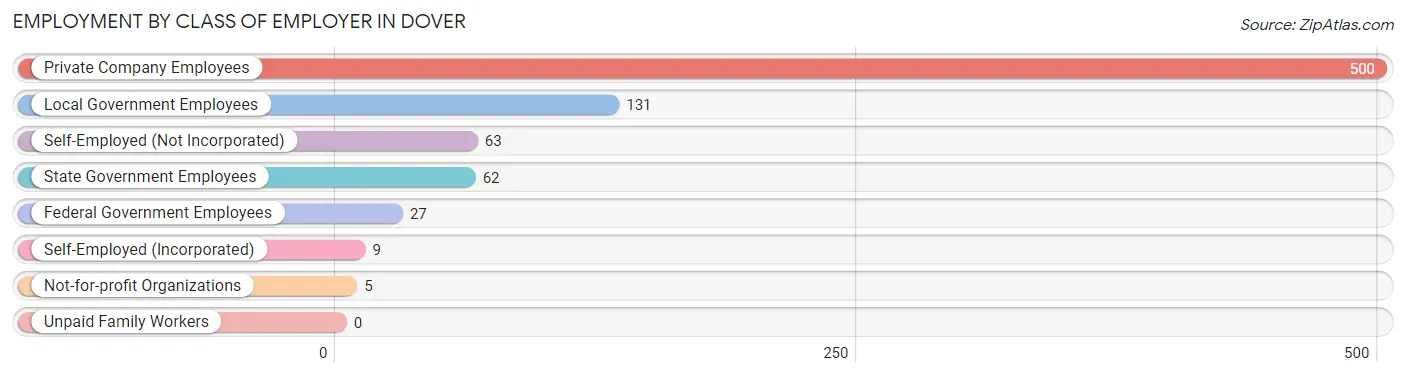
| Employer Class | # Employees | % Employees |
| Private Company Employees | 500 | 62.7% |
| Self-Employed (Incorporated) | 9 | 1.1% |
| Self-Employed (Not Incorporated) | 63 | 7.9% |
| Not-for-profit Organizations | 5 | 0.6% |
| Local Government Employees | 131 | 16.4% |
| State Government Employees | 62 | 7.8% |
| Federal Government Employees | 27 | 3.4% |
| Unpaid Family Workers | 0 | 0.0% |
| Total | 797 | 100.0% |
Employment Status by Age in Dover
According to the labor force statistics for Dover, out of the total population over 16 years of age (1,660), 51.6% or 857 individuals are in the labor force, with 6.2% or 53 of them unemployed. The age group with the highest labor force participation rate is 35 to 44 years, with 87.8% or 216 individuals in the labor force. Within the labor force, the 25 to 29 years age range has the highest percentage of unemployed individuals, with 62.3% or 38 of them being unemployed.
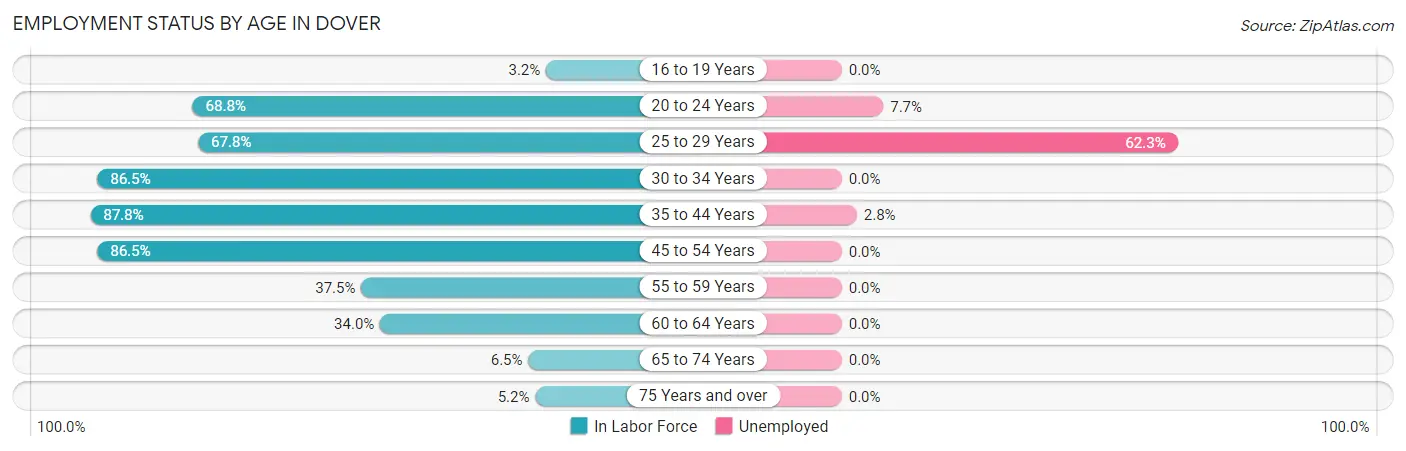
| Age Bracket | In Labor Force | Unemployed |
| 16 to 19 Years | 4 (3.2%) | 0 (0.0%) |
| 20 to 24 Years | 117 (68.8%) | 9 (7.7%) |
| 25 to 29 Years | 61 (67.8%) | 38 (62.3%) |
| 30 to 34 Years | 83 (86.5%) | 0 (0.0%) |
| 35 to 44 Years | 216 (87.8%) | 6 (2.8%) |
| 45 to 54 Years | 282 (86.5%) | 0 (0.0%) |
| 55 to 59 Years | 36 (37.5%) | 0 (0.0%) |
| 60 to 64 Years | 33 (34.0%) | 0 (0.0%) |
| 65 to 74 Years | 13 (6.5%) | 0 (0.0%) |
| 75 Years and over | 11 (5.2%) | 0 (0.0%) |
| Total | 857 (51.6%) | 53 (6.2%) |
Employment Status by Educational Attainment in Dover
According to labor force statistics for Dover, 74.8% of individuals (711) out of the total population between 25 and 64 years of age (951) are in the labor force, with 6.2% or 44 of them being unemployed. The group with the highest labor force participation rate are those with the educational attainment of bachelor's degree or higher, with 85.4% or 164 individuals in the labor force. Within the labor force, individuals with high school diploma education have the highest percentage of unemployment, with 13.0% or 37 of them being unemployed.
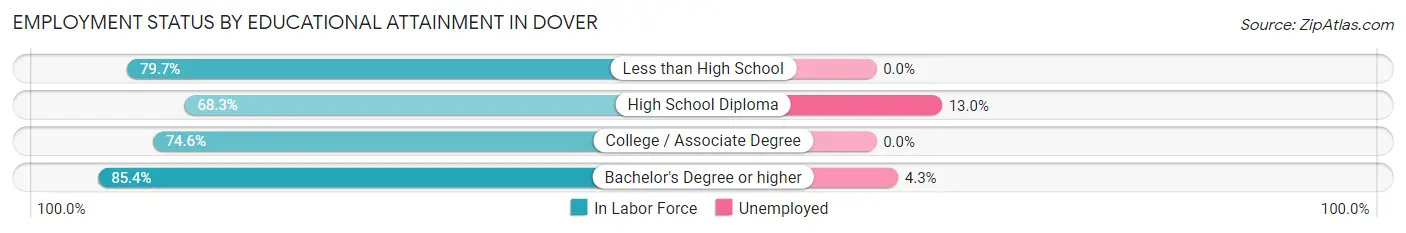
| Educational Attainment | In Labor Force | Unemployed |
| Less than High School | 110 (79.7%) | 0 (0.0%) |
| High School Diploma | 284 (68.3%) | 54 (13.0%) |
| College / Associate Degree | 153 (74.6%) | 0 (0.0%) |
| Bachelor's Degree or higher | 164 (85.4%) | 8 (4.3%) |
| Total | 711 (74.8%) | 59 (6.2%) |
Employment Occupations by Sex in Dover
Management, Business, Science and Arts Occupations
The most common Management, Business, Science and Arts occupations in Dover are Management (140 | 17.4%), Community & Social Service (82 | 10.2%), Education Instruction & Library (82 | 10.2%), Health Diagnosing & Treating (61 | 7.6%), and Health Technologists (43 | 5.3%).
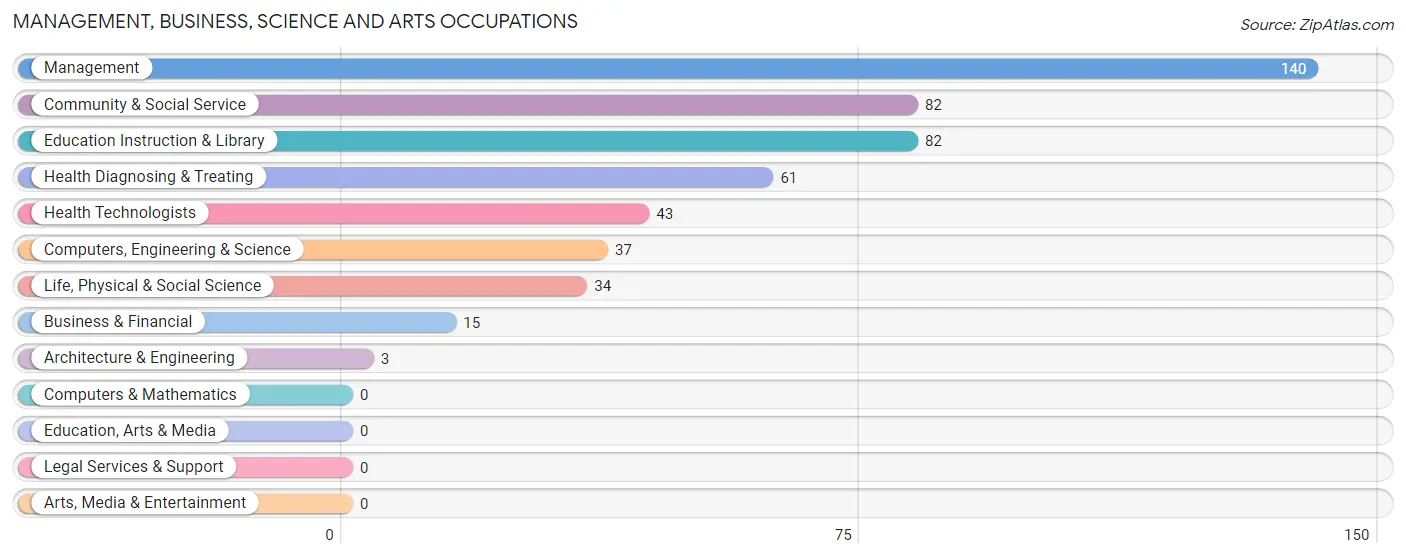
Management, Business, Science and Arts Occupations by Sex
Within the Management, Business, Science and Arts occupations in Dover, the most male-oriented occupations are Architecture & Engineering (100.0%), Management (83.6%), and Business & Financial (53.3%), while the most female-oriented occupations are Community & Social Service (100.0%), Education Instruction & Library (100.0%), and Health Technologists (69.8%).
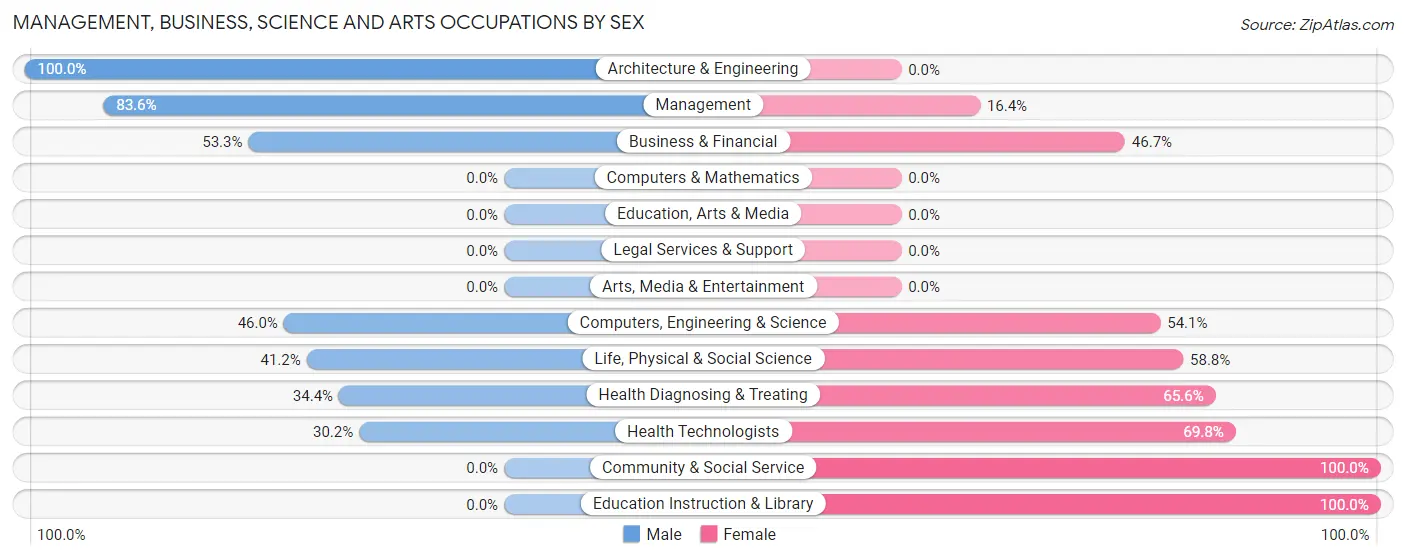
| Occupation | Male | Female |
| Management | 117 (83.6%) | 23 (16.4%) |
| Business & Financial | 8 (53.3%) | 7 (46.7%) |
| Computers, Engineering & Science | 17 (46.0%) | 20 (54.0%) |
| Computers & Mathematics | 0 (0.0%) | 0 (0.0%) |
| Architecture & Engineering | 3 (100.0%) | 0 (0.0%) |
| Life, Physical & Social Science | 14 (41.2%) | 20 (58.8%) |
| Community & Social Service | 0 (0.0%) | 82 (100.0%) |
| Education, Arts & Media | 0 (0.0%) | 0 (0.0%) |
| Legal Services & Support | 0 (0.0%) | 0 (0.0%) |
| Education Instruction & Library | 0 (0.0%) | 82 (100.0%) |
| Arts, Media & Entertainment | 0 (0.0%) | 0 (0.0%) |
| Health Diagnosing & Treating | 21 (34.4%) | 40 (65.6%) |
| Health Technologists | 13 (30.2%) | 30 (69.8%) |
| Total (Category) | 163 (48.7%) | 172 (51.3%) |
| Total (Overall) | 425 (52.9%) | 378 (47.1%) |
Services Occupations
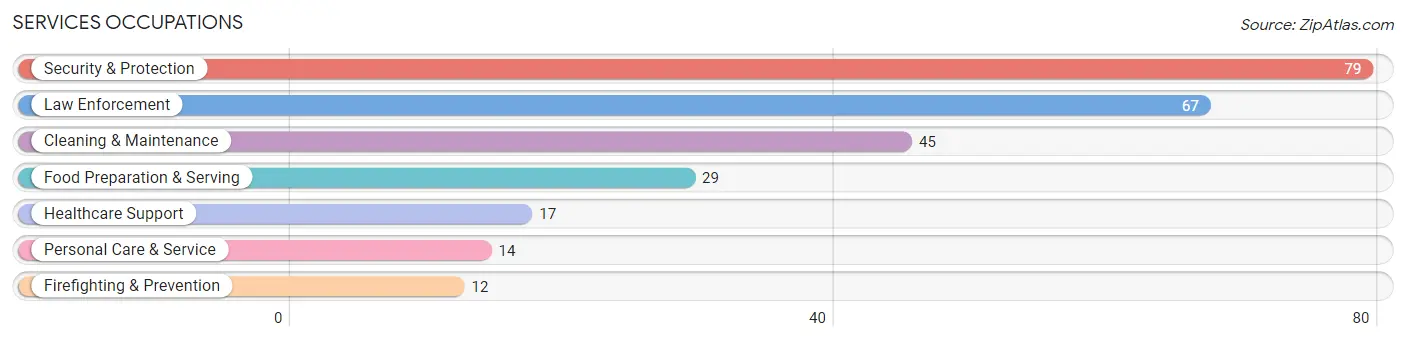
The most common Services occupations in Dover are Security & Protection (79 | 9.8%), Law Enforcement (67 | 8.3%), Cleaning & Maintenance (45 | 5.6%), Food Preparation & Serving (29 | 3.6%), and Healthcare Support (17 | 2.1%).
Services Occupations by Sex
Within the Services occupations in Dover, the most male-oriented occupations are Firefighting & Prevention (100.0%), Security & Protection (94.9%), and Law Enforcement (94.0%), while the most female-oriented occupations are Healthcare Support (100.0%), Food Preparation & Serving (93.1%), and Cleaning & Maintenance (75.6%).
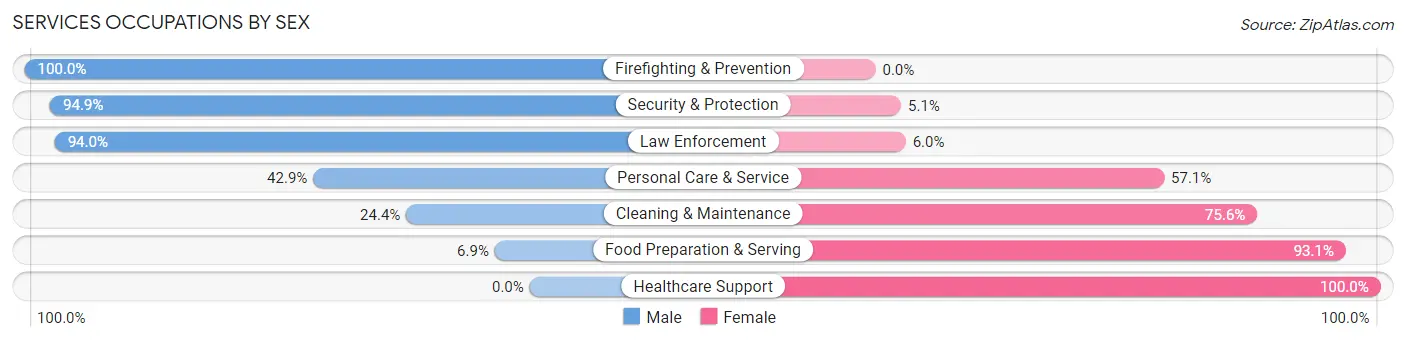
| Occupation | Male | Female |
| Healthcare Support | 0 (0.0%) | 17 (100.0%) |
| Security & Protection | 75 (94.9%) | 4 (5.1%) |
| Firefighting & Prevention | 12 (100.0%) | 0 (0.0%) |
| Law Enforcement | 63 (94.0%) | 4 (6.0%) |
| Food Preparation & Serving | 2 (6.9%) | 27 (93.1%) |
| Cleaning & Maintenance | 11 (24.4%) | 34 (75.6%) |
| Personal Care & Service | 6 (42.9%) | 8 (57.1%) |
| Total (Category) | 94 (51.1%) | 90 (48.9%) |
| Total (Overall) | 425 (52.9%) | 378 (47.1%) |
Sales and Office Occupations
The most common Sales and Office occupations in Dover are Office & Administration (54 | 6.7%), and Sales & Related (51 | 6.4%).

Sales and Office Occupations by Sex
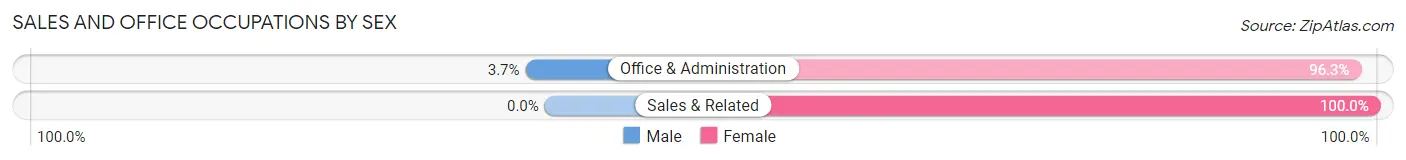
| Occupation | Male | Female |
| Sales & Related | 0 (0.0%) | 51 (100.0%) |
| Office & Administration | 2 (3.7%) | 52 (96.3%) |
| Total (Category) | 2 (1.9%) | 103 (98.1%) |
| Total (Overall) | 425 (52.9%) | 378 (47.1%) |
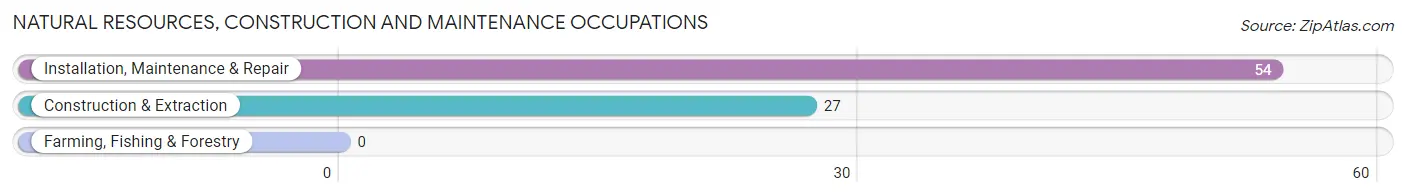
Natural Resources, Construction and Maintenance Occupations
The most common Natural Resources, Construction and Maintenance occupations in Dover are Installation, Maintenance & Repair (54 | 6.7%), and Construction & Extraction (27 | 3.4%).
Natural Resources, Construction and Maintenance Occupations by Sex
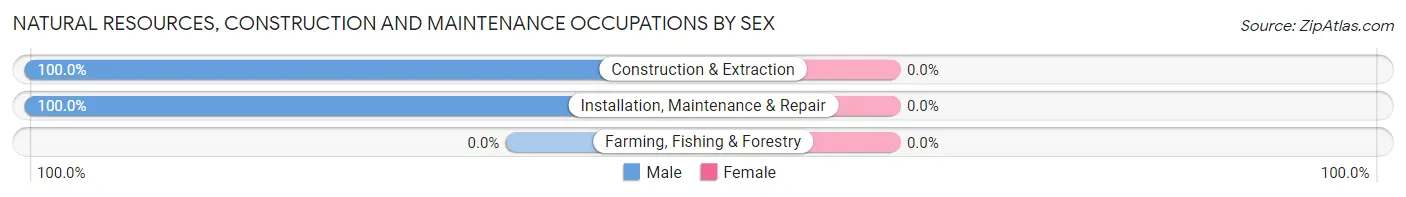
| Occupation | Male | Female |
| Farming, Fishing & Forestry | 0 (0.0%) | 0 (0.0%) |
| Construction & Extraction | 27 (100.0%) | 0 (0.0%) |
| Installation, Maintenance & Repair | 54 (100.0%) | 0 (0.0%) |
| Total (Category) | 81 (100.0%) | 0 (0.0%) |
| Total (Overall) | 425 (52.9%) | 378 (47.1%) |
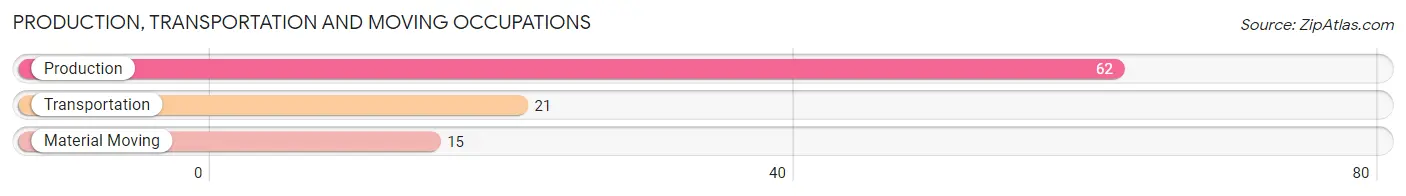
Production, Transportation and Moving Occupations
The most common Production, Transportation and Moving occupations in Dover are Production (62 | 7.7%), Transportation (21 | 2.6%), and Material Moving (15 | 1.9%).
Production, Transportation and Moving Occupations by Sex
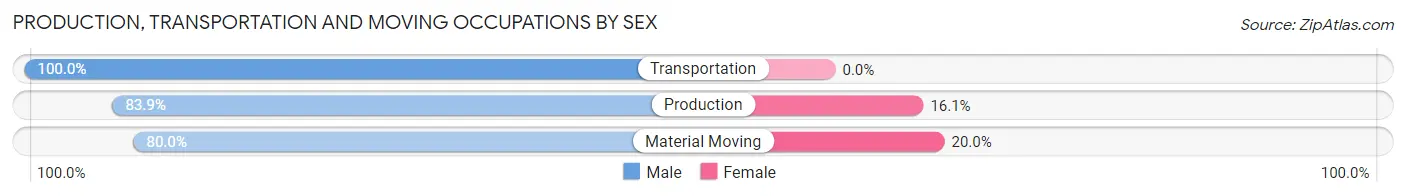
| Occupation | Male | Female |
| Production | 52 (83.9%) | 10 (16.1%) |
| Transportation | 21 (100.0%) | 0 (0.0%) |
| Material Moving | 12 (80.0%) | 3 (20.0%) |
| Total (Category) | 85 (86.7%) | 13 (13.3%) |
| Total (Overall) | 425 (52.9%) | 378 (47.1%) |
Employment Industries by Sex in Dover
Employment Industries in Dover
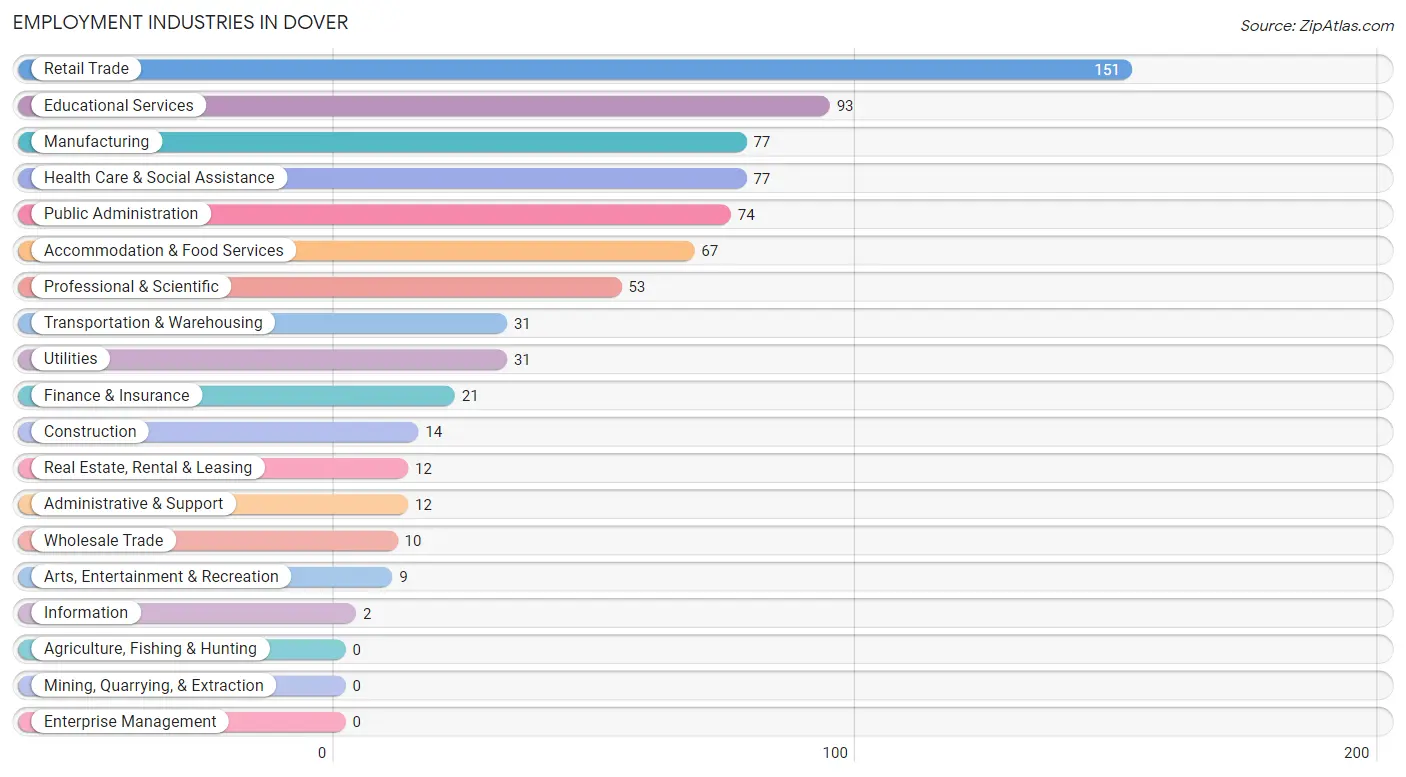
The major employment industries in Dover include Retail Trade (151 | 18.8%), Educational Services (93 | 11.6%), Manufacturing (77 | 9.6%), Health Care & Social Assistance (77 | 9.6%), and Public Administration (74 | 9.2%).
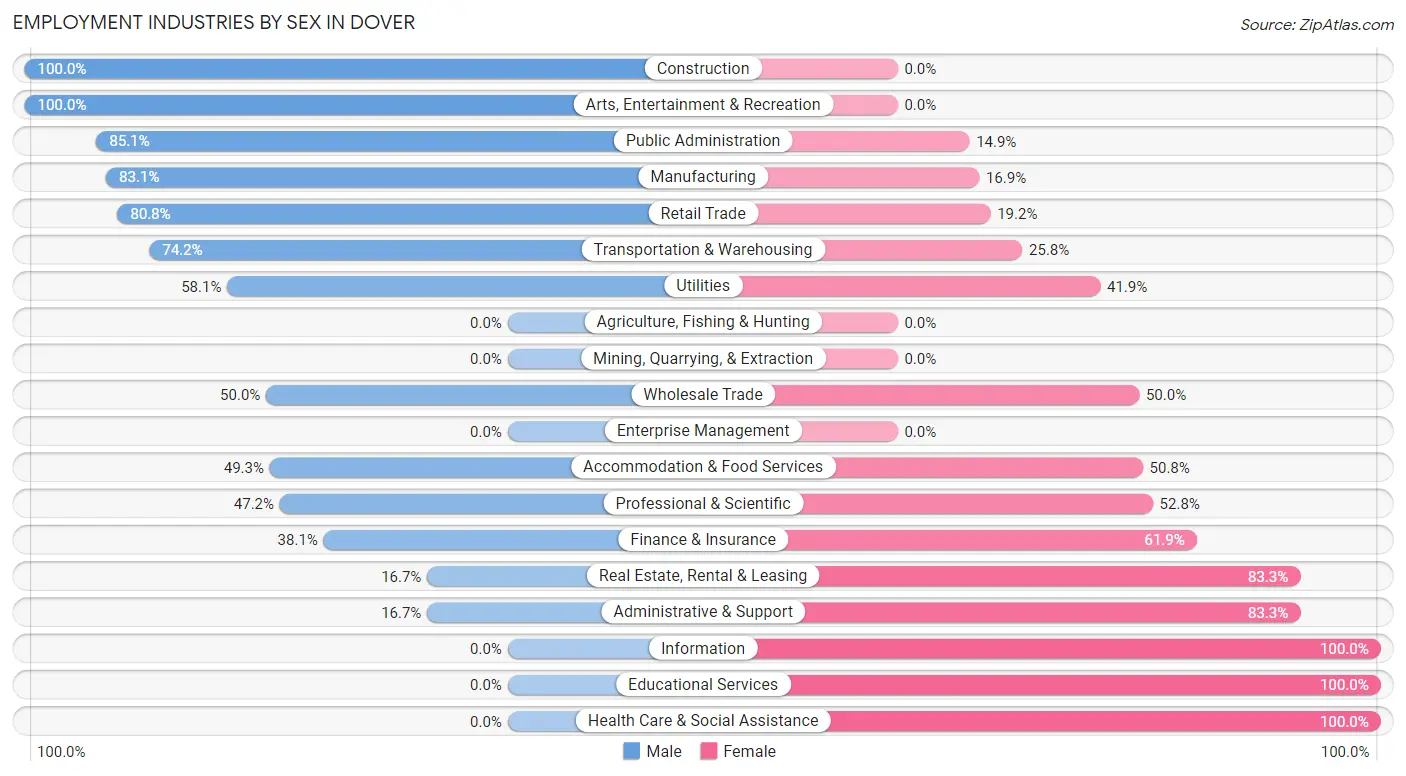
Employment Industries by Sex in Dover
The Dover industries that see more men than women are Construction (100.0%), Arts, Entertainment & Recreation (100.0%), and Public Administration (85.1%), whereas the industries that tend to have a higher number of women are Information (100.0%), Educational Services (100.0%), and Health Care & Social Assistance (100.0%).
| Industry | Male | Female |
| Agriculture, Fishing & Hunting | 0 (0.0%) | 0 (0.0%) |
| Mining, Quarrying, & Extraction | 0 (0.0%) | 0 (0.0%) |
| Construction | 14 (100.0%) | 0 (0.0%) |
| Manufacturing | 64 (83.1%) | 13 (16.9%) |
| Wholesale Trade | 5 (50.0%) | 5 (50.0%) |
| Retail Trade | 122 (80.8%) | 29 (19.2%) |
| Transportation & Warehousing | 23 (74.2%) | 8 (25.8%) |
| Utilities | 18 (58.1%) | 13 (41.9%) |
| Information | 0 (0.0%) | 2 (100.0%) |
| Finance & Insurance | 8 (38.1%) | 13 (61.9%) |
| Real Estate, Rental & Leasing | 2 (16.7%) | 10 (83.3%) |
| Professional & Scientific | 25 (47.2%) | 28 (52.8%) |
| Enterprise Management | 0 (0.0%) | 0 (0.0%) |
| Administrative & Support | 2 (16.7%) | 10 (83.3%) |
| Educational Services | 0 (0.0%) | 93 (100.0%) |
| Health Care & Social Assistance | 0 (0.0%) | 77 (100.0%) |
| Arts, Entertainment & Recreation | 9 (100.0%) | 0 (0.0%) |
| Accommodation & Food Services | 33 (49.2%) | 34 (50.7%) |
| Public Administration | 63 (85.1%) | 11 (14.9%) |
| Total | 425 (52.9%) | 378 (47.1%) |
Education in Dover
School Enrollment in Dover
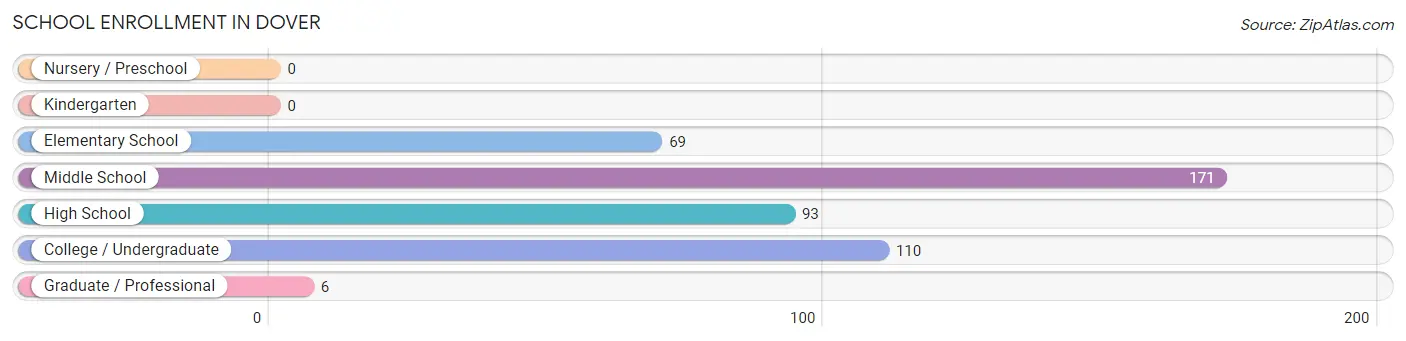
The most common levels of schooling among the 449 students in Dover are middle school (171 | 38.1%), college / undergraduate (110 | 24.5%), and high school (93 | 20.7%).
| School Level | # Students | % Students |
| Nursery / Preschool | 0 | 0.0% |
| Kindergarten | 0 | 0.0% |
| Elementary School | 69 | 15.4% |
| Middle School | 171 | 38.1% |
| High School | 93 | 20.7% |
| College / Undergraduate | 110 | 24.5% |
| Graduate / Professional | 6 | 1.3% |
| Total | 449 | 100.0% |
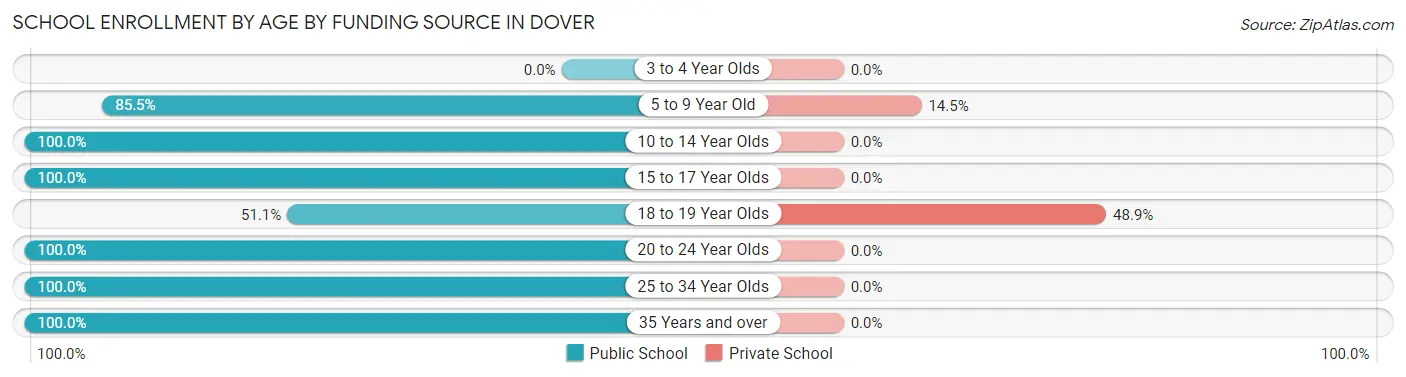
School Enrollment by Age by Funding Source in Dover
Out of a total of 449 students who are enrolled in schools in Dover, 32 (7.1%) attend a private institution, while the remaining 417 (92.9%) are enrolled in public schools. The age group of 18 to 19 year olds has the highest likelihood of being enrolled in private schools, with 22 (48.9% in the age bracket) enrolled. Conversely, the age group of 10 to 14 year olds has the lowest likelihood of being enrolled in a private school, with 183 (100.0% in the age bracket) attending a public institution.
| Age Bracket | Public School | Private School |
| 3 to 4 Year Olds | 0 (0.0%) | 0 (0.0%) |
| 5 to 9 Year Old | 59 (85.5%) | 10 (14.5%) |
| 10 to 14 Year Olds | 183 (100.0%) | 0 (0.0%) |
| 15 to 17 Year Olds | 58 (100.0%) | 0 (0.0%) |
| 18 to 19 Year Olds | 23 (51.1%) | 22 (48.9%) |
| 20 to 24 Year Olds | 57 (100.0%) | 0 (0.0%) |
| 25 to 34 Year Olds | 31 (100.0%) | 0 (0.0%) |
| 35 Years and over | 6 (100.0%) | 0 (0.0%) |
| Total | 417 (92.9%) | 32 (7.1%) |
Educational Attainment by Field of Study in Dover
Education (92 | 28.7%), arts & humanities (49 | 15.3%), bio, nature & agricultural (46 | 14.4%), science & technology (46 | 14.4%), and social sciences (27 | 8.4%) are the most common fields of study among 320 individuals in Dover who have obtained a bachelor's degree or higher.
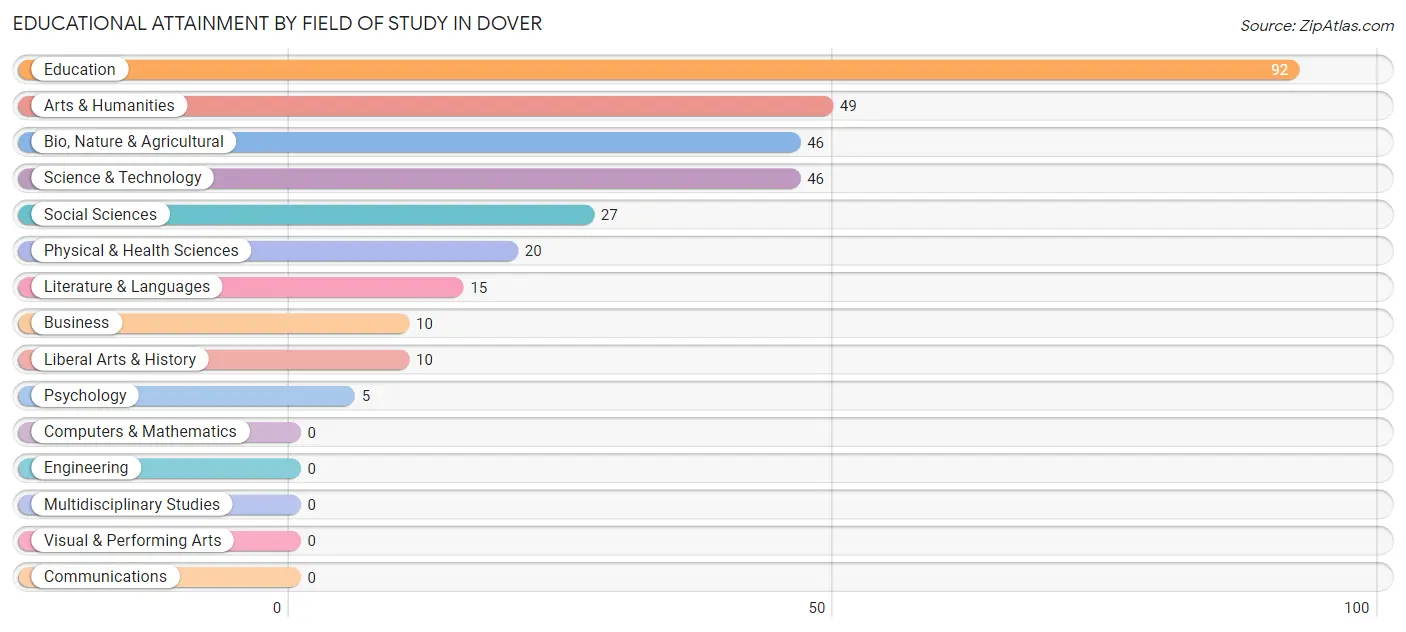
| Field of Study | # Graduates | % Graduates |
| Computers & Mathematics | 0 | 0.0% |
| Bio, Nature & Agricultural | 46 | 14.4% |
| Physical & Health Sciences | 20 | 6.2% |
| Psychology | 5 | 1.6% |
| Social Sciences | 27 | 8.4% |
| Engineering | 0 | 0.0% |
| Multidisciplinary Studies | 0 | 0.0% |
| Science & Technology | 46 | 14.4% |
| Business | 10 | 3.1% |
| Education | 92 | 28.7% |
| Literature & Languages | 15 | 4.7% |
| Liberal Arts & History | 10 | 3.1% |
| Visual & Performing Arts | 0 | 0.0% |
| Communications | 0 | 0.0% |
| Arts & Humanities | 49 | 15.3% |
| Total | 320 | 100.0% |
Transportation & Commute in Dover
Vehicle Availability by Sex in Dover
The most prevalent vehicle ownership categories in Dover are males with 3 vehicles (138, accounting for 32.8%) and females with 3 vehicles (138, making up 36.7%).
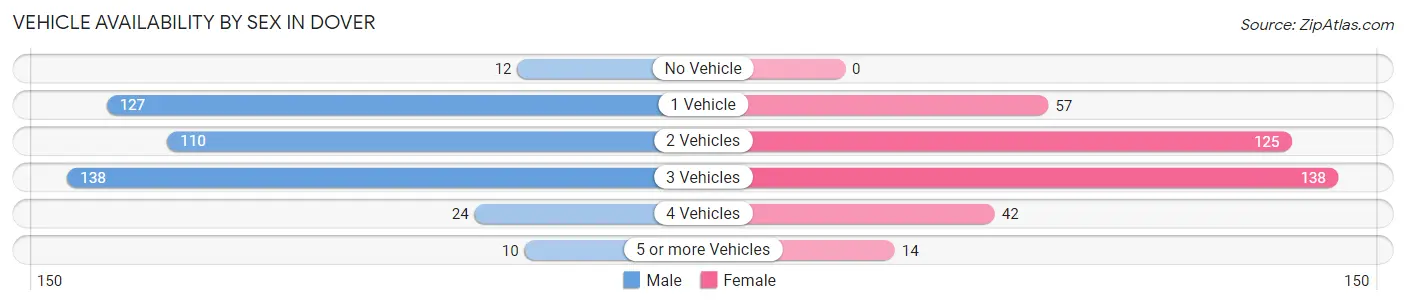
| Vehicles Available | Male | Female |
| No Vehicle | 12 (2.9%) | 0 (0.0%) |
| 1 Vehicle | 127 (30.2%) | 57 (15.2%) |
| 2 Vehicles | 110 (26.1%) | 125 (33.2%) |
| 3 Vehicles | 138 (32.8%) | 138 (36.7%) |
| 4 Vehicles | 24 (5.7%) | 42 (11.2%) |
| 5 or more Vehicles | 10 (2.4%) | 14 (3.7%) |
| Total | 421 (100.0%) | 376 (100.0%) |
Commute Time in Dover
The most frequently occuring commute durations in Dover are 45 to 59 minutes (205 commuters, 27.5%), 5 to 9 minutes (166 commuters, 22.3%), and less than 5 minutes (150 commuters, 20.1%).
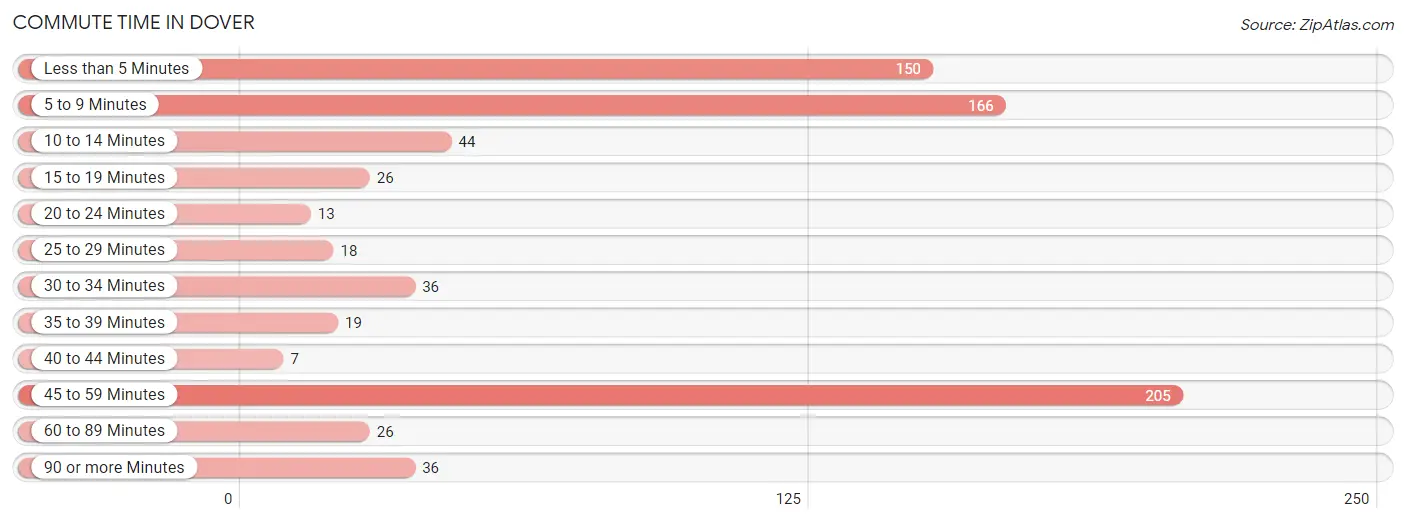
| Commute Time | # Commuters | % Commuters |
| Less than 5 Minutes | 150 | 20.1% |
| 5 to 9 Minutes | 166 | 22.3% |
| 10 to 14 Minutes | 44 | 5.9% |
| 15 to 19 Minutes | 26 | 3.5% |
| 20 to 24 Minutes | 13 | 1.7% |
| 25 to 29 Minutes | 18 | 2.4% |
| 30 to 34 Minutes | 36 | 4.8% |
| 35 to 39 Minutes | 19 | 2.5% |
| 40 to 44 Minutes | 7 | 0.9% |
| 45 to 59 Minutes | 205 | 27.5% |
| 60 to 89 Minutes | 26 | 3.5% |
| 90 or more Minutes | 36 | 4.8% |
Commute Time by Sex in Dover
The most common commute times in Dover are 45 to 59 minutes (170 commuters, 42.4%) for males and less than 5 minutes (118 commuters, 34.2%) for females.
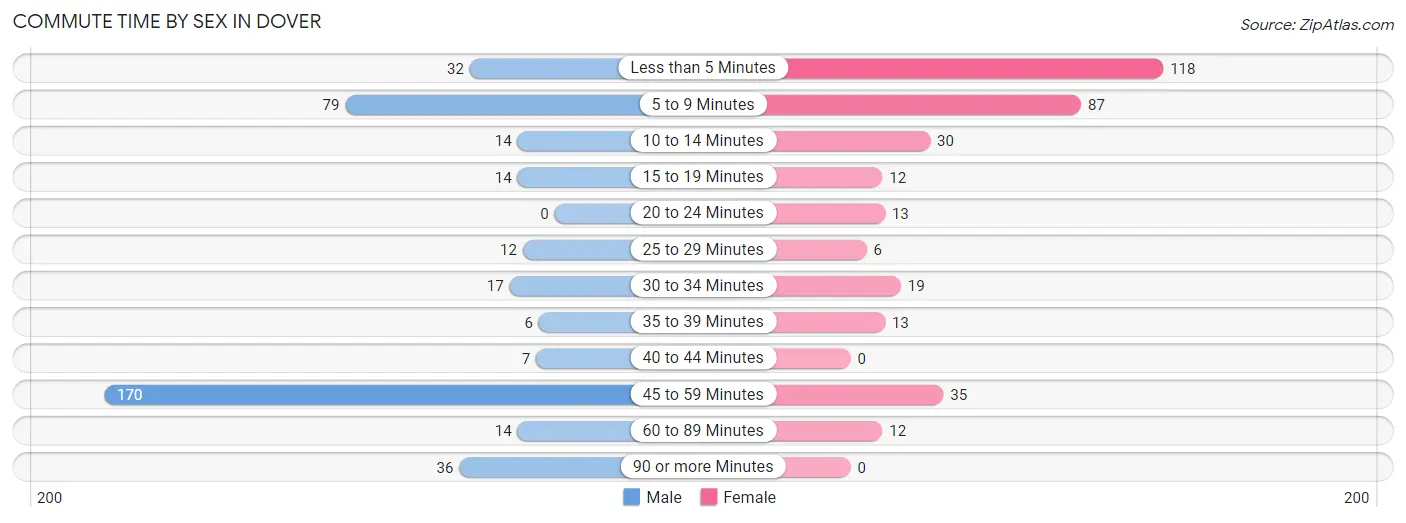
| Commute Time | Male | Female |
| Less than 5 Minutes | 32 (8.0%) | 118 (34.2%) |
| 5 to 9 Minutes | 79 (19.7%) | 87 (25.2%) |
| 10 to 14 Minutes | 14 (3.5%) | 30 (8.7%) |
| 15 to 19 Minutes | 14 (3.5%) | 12 (3.5%) |
| 20 to 24 Minutes | 0 (0.0%) | 13 (3.8%) |
| 25 to 29 Minutes | 12 (3.0%) | 6 (1.7%) |
| 30 to 34 Minutes | 17 (4.2%) | 19 (5.5%) |
| 35 to 39 Minutes | 6 (1.5%) | 13 (3.8%) |
| 40 to 44 Minutes | 7 (1.8%) | 0 (0.0%) |
| 45 to 59 Minutes | 170 (42.4%) | 35 (10.1%) |
| 60 to 89 Minutes | 14 (3.5%) | 12 (3.5%) |
| 90 or more Minutes | 36 (9.0%) | 0 (0.0%) |
Time of Departure to Work by Sex in Dover
The most frequent times of departure to work in Dover are 12:00 AM to 4:59 AM (112, 27.9%) for males and 7:00 AM to 7:29 AM (113, 32.8%) for females.
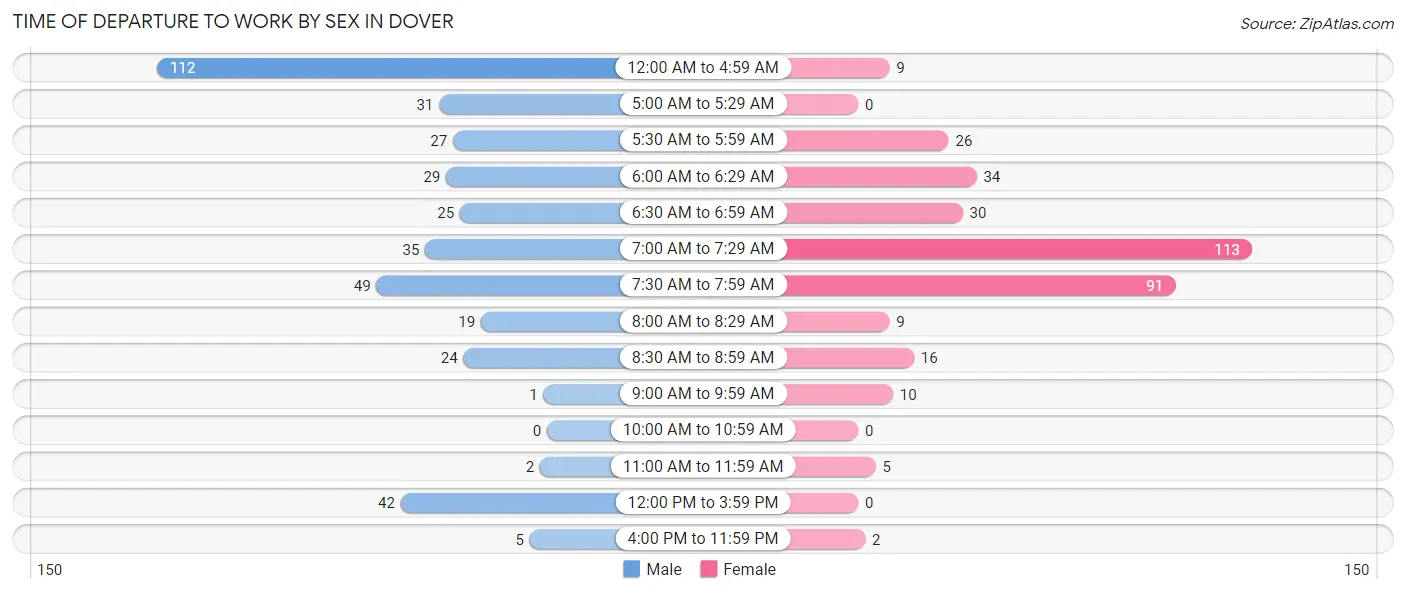
| Time of Departure | Male | Female |
| 12:00 AM to 4:59 AM | 112 (27.9%) | 9 (2.6%) |
| 5:00 AM to 5:29 AM | 31 (7.7%) | 0 (0.0%) |
| 5:30 AM to 5:59 AM | 27 (6.7%) | 26 (7.5%) |
| 6:00 AM to 6:29 AM | 29 (7.2%) | 34 (9.9%) |
| 6:30 AM to 6:59 AM | 25 (6.2%) | 30 (8.7%) |
| 7:00 AM to 7:29 AM | 35 (8.7%) | 113 (32.8%) |
| 7:30 AM to 7:59 AM | 49 (12.2%) | 91 (26.4%) |
| 8:00 AM to 8:29 AM | 19 (4.7%) | 9 (2.6%) |
| 8:30 AM to 8:59 AM | 24 (6.0%) | 16 (4.6%) |
| 9:00 AM to 9:59 AM | 1 (0.3%) | 10 (2.9%) |
| 10:00 AM to 10:59 AM | 0 (0.0%) | 0 (0.0%) |
| 11:00 AM to 11:59 AM | 2 (0.5%) | 5 (1.5%) |
| 12:00 PM to 3:59 PM | 42 (10.5%) | 0 (0.0%) |
| 4:00 PM to 11:59 PM | 5 (1.3%) | 2 (0.6%) |
| Total | 401 (100.0%) | 345 (100.0%) |
Housing Occupancy in Dover
Occupancy by Ownership in Dover
Of the total 705 dwellings in Dover, owner-occupied units account for 460 (65.2%), while renter-occupied units make up 245 (34.7%).
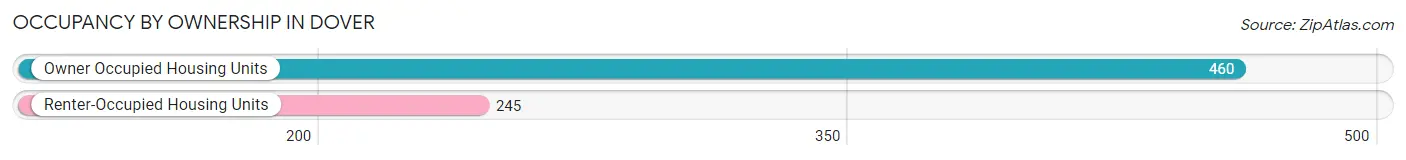
| Occupancy | # Housing Units | % Housing Units |
| Owner Occupied Housing Units | 460 | 65.2% |
| Renter-Occupied Housing Units | 245 | 34.7% |
| Total Occupied Housing Units | 705 | 100.0% |
Occupancy by Household Size in Dover
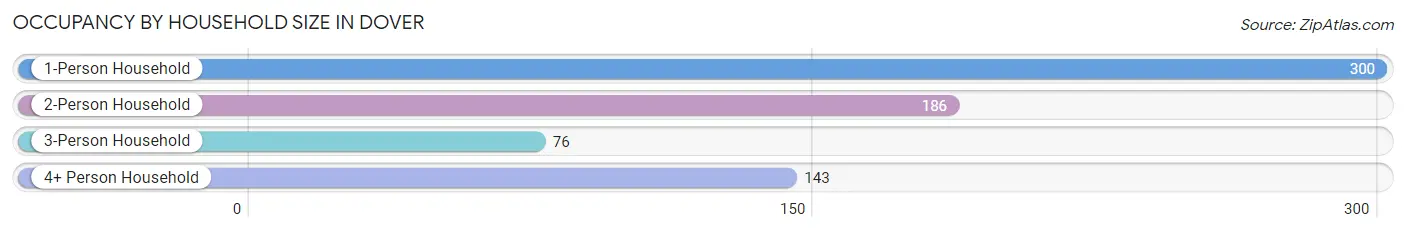
| Household Size | # Housing Units | % Housing Units |
| 1-Person Household | 300 | 42.5% |
| 2-Person Household | 186 | 26.4% |
| 3-Person Household | 76 | 10.8% |
| 4+ Person Household | 143 | 20.3% |
| Total Housing Units | 705 | 100.0% |
Occupancy by Ownership by Household Size in Dover
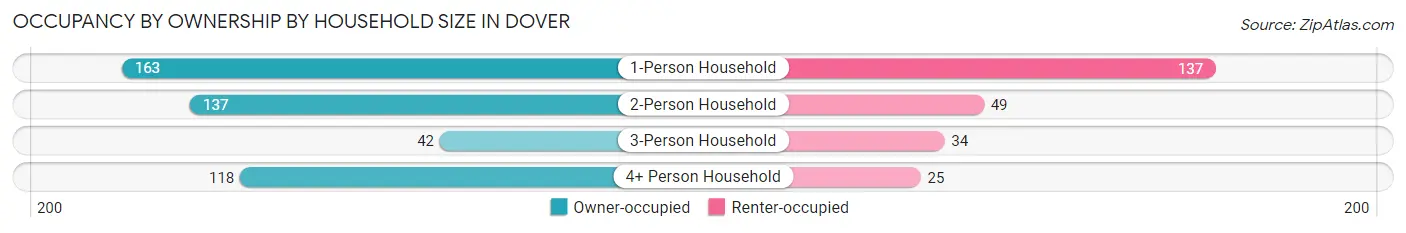
| Household Size | Owner-occupied | Renter-occupied |
| 1-Person Household | 163 (54.3%) | 137 (45.7%) |
| 2-Person Household | 137 (73.7%) | 49 (26.3%) |
| 3-Person Household | 42 (55.3%) | 34 (44.7%) |
| 4+ Person Household | 118 (82.5%) | 25 (17.5%) |
| Total Housing Units | 460 (65.2%) | 245 (34.7%) |
Occupancy by Educational Attainment in Dover
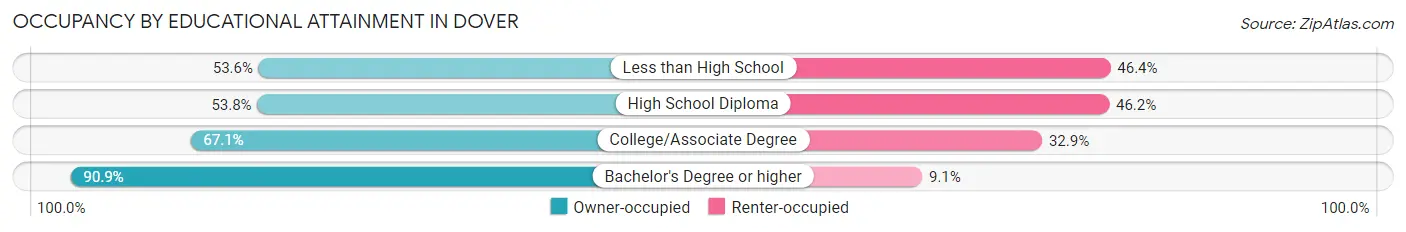
| Household Size | Owner-occupied | Renter-occupied |
| Less than High School | 15 (53.6%) | 13 (46.4%) |
| High School Diploma | 197 (53.8%) | 169 (46.2%) |
| College/Associate Degree | 98 (67.1%) | 48 (32.9%) |
| Bachelor's Degree or higher | 150 (90.9%) | 15 (9.1%) |
Occupancy by Age of Householder in Dover
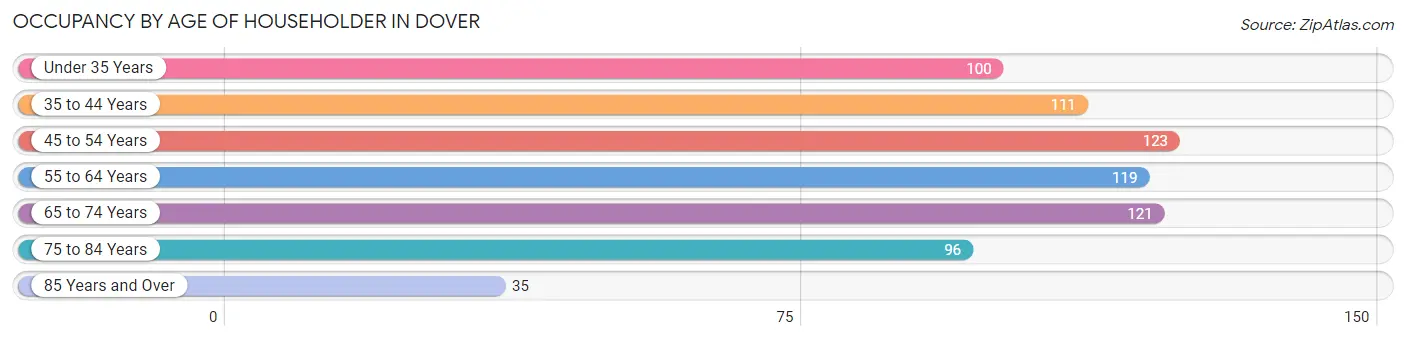
| Age Bracket | # Households | % Households |
| Under 35 Years | 100 | 14.2% |
| 35 to 44 Years | 111 | 15.7% |
| 45 to 54 Years | 123 | 17.4% |
| 55 to 64 Years | 119 | 16.9% |
| 65 to 74 Years | 121 | 17.2% |
| 75 to 84 Years | 96 | 13.6% |
| 85 Years and Over | 35 | 5.0% |
| Total | 705 | 100.0% |
Housing Finances in Dover
Median Income by Occupancy in Dover
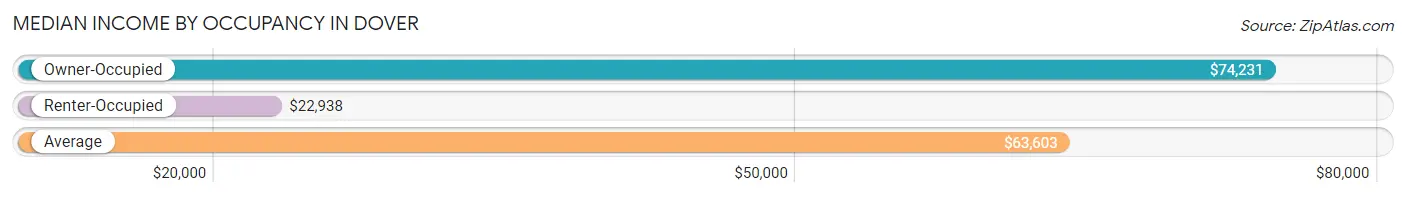
| Occupancy Type | # Households | Median Income |
| Owner-Occupied | 460 (65.2%) | $74,231 |
| Renter-Occupied | 245 (34.7%) | $22,938 |
| Average | 705 (100.0%) | $63,603 |
Occupancy by Householder Income Bracket in Dover
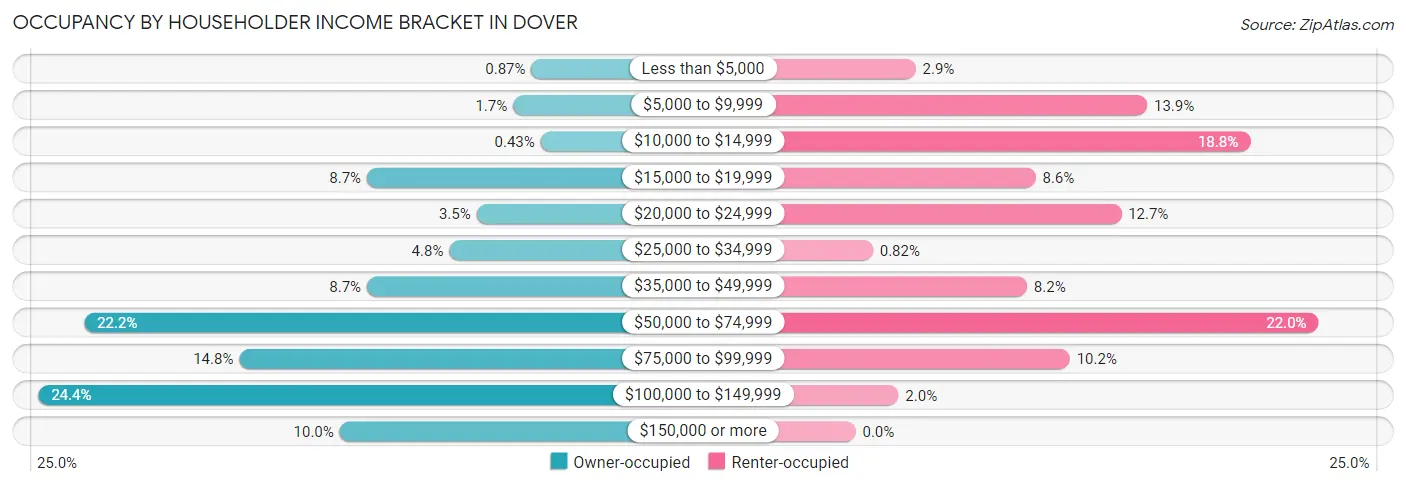
| Income Bracket | Owner-occupied | Renter-occupied |
| Less than $5,000 | 4 (0.9%) | 7 (2.9%) |
| $5,000 to $9,999 | 8 (1.7%) | 34 (13.9%) |
| $10,000 to $14,999 | 2 (0.4%) | 46 (18.8%) |
| $15,000 to $19,999 | 40 (8.7%) | 21 (8.6%) |
| $20,000 to $24,999 | 16 (3.5%) | 31 (12.7%) |
| $25,000 to $34,999 | 22 (4.8%) | 2 (0.8%) |
| $35,000 to $49,999 | 40 (8.7%) | 20 (8.2%) |
| $50,000 to $74,999 | 102 (22.2%) | 54 (22.0%) |
| $75,000 to $99,999 | 68 (14.8%) | 25 (10.2%) |
| $100,000 to $149,999 | 112 (24.3%) | 5 (2.0%) |
| $150,000 or more | 46 (10.0%) | 0 (0.0%) |
| Total | 460 (100.0%) | 245 (100.0%) |
Monthly Housing Cost Tiers in Dover
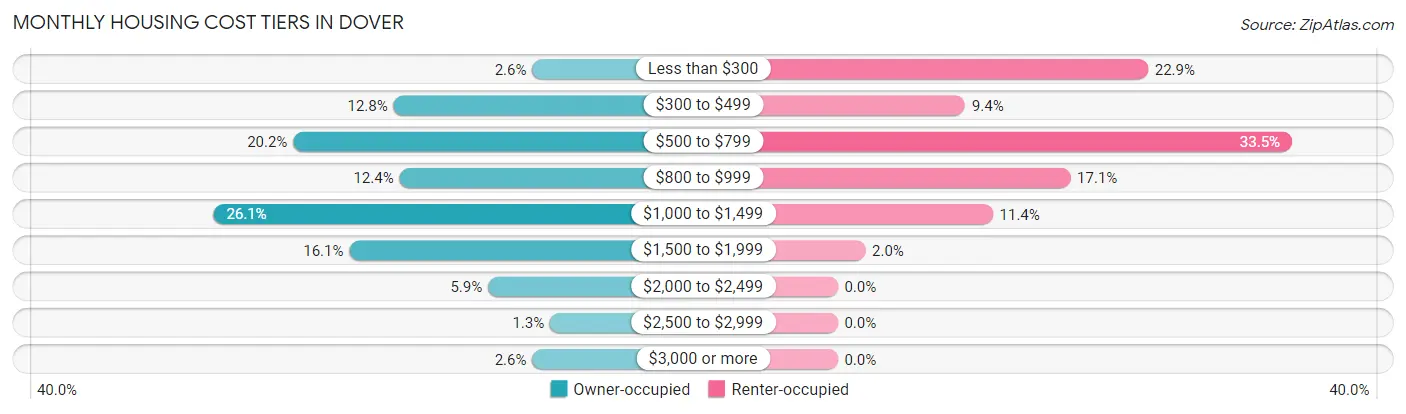
| Monthly Cost | Owner-occupied | Renter-occupied |
| Less than $300 | 12 (2.6%) | 56 (22.9%) |
| $300 to $499 | 59 (12.8%) | 23 (9.4%) |
| $500 to $799 | 93 (20.2%) | 82 (33.5%) |
| $800 to $999 | 57 (12.4%) | 42 (17.1%) |
| $1,000 to $1,499 | 120 (26.1%) | 28 (11.4%) |
| $1,500 to $1,999 | 74 (16.1%) | 5 (2.0%) |
| $2,000 to $2,499 | 27 (5.9%) | 0 (0.0%) |
| $2,500 to $2,999 | 6 (1.3%) | 0 (0.0%) |
| $3,000 or more | 12 (2.6%) | 0 (0.0%) |
| Total | 460 (100.0%) | 245 (100.0%) |
Physical Housing Characteristics in Dover
Housing Structures in Dover
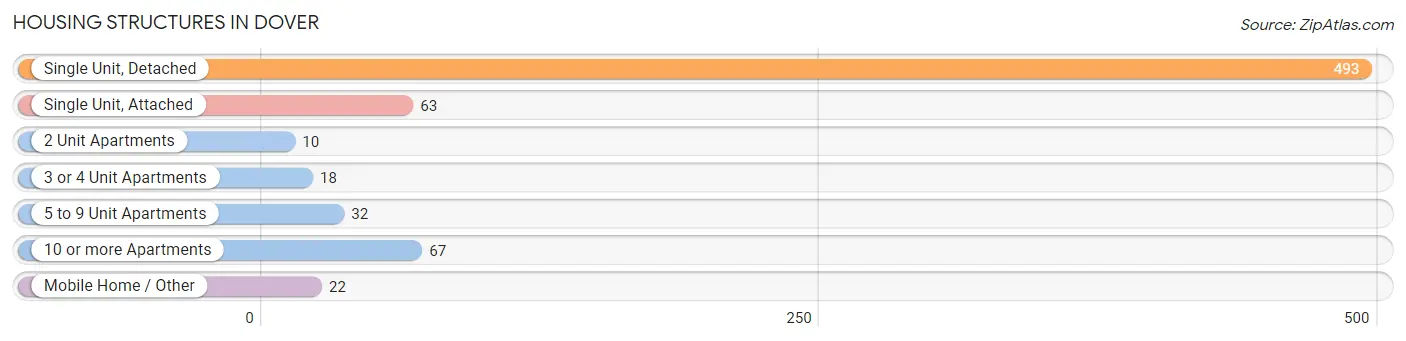
| Structure Type | # Housing Units | % Housing Units |
| Single Unit, Detached | 493 | 69.9% |
| Single Unit, Attached | 63 | 8.9% |
| 2 Unit Apartments | 10 | 1.4% |
| 3 or 4 Unit Apartments | 18 | 2.5% |
| 5 to 9 Unit Apartments | 32 | 4.5% |
| 10 or more Apartments | 67 | 9.5% |
| Mobile Home / Other | 22 | 3.1% |
| Total | 705 | 100.0% |
Housing Structures by Occupancy in Dover
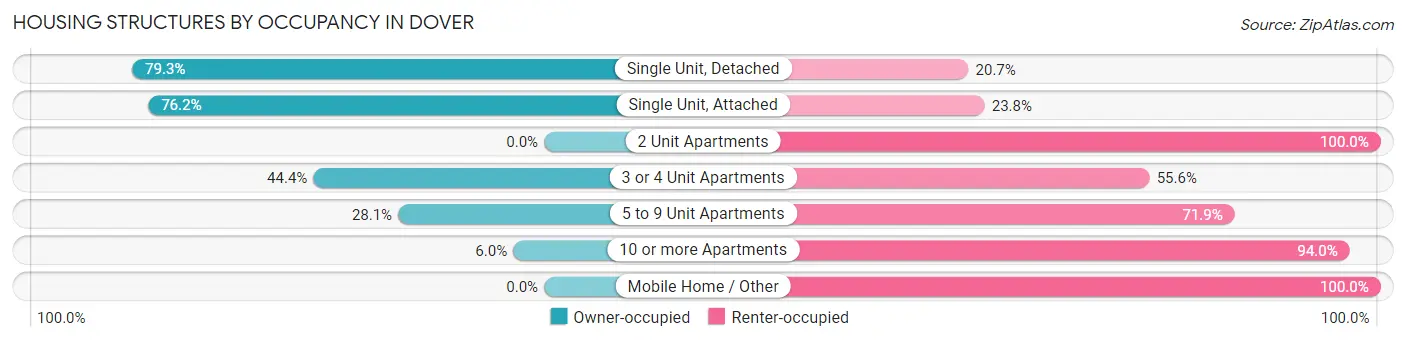
| Structure Type | Owner-occupied | Renter-occupied |
| Single Unit, Detached | 391 (79.3%) | 102 (20.7%) |
| Single Unit, Attached | 48 (76.2%) | 15 (23.8%) |
| 2 Unit Apartments | 0 (0.0%) | 10 (100.0%) |
| 3 or 4 Unit Apartments | 8 (44.4%) | 10 (55.6%) |
| 5 to 9 Unit Apartments | 9 (28.1%) | 23 (71.9%) |
| 10 or more Apartments | 4 (6.0%) | 63 (94.0%) |
| Mobile Home / Other | 0 (0.0%) | 22 (100.0%) |
| Total | 460 (65.2%) | 245 (34.7%) |
Housing Structures by Number of Rooms in Dover
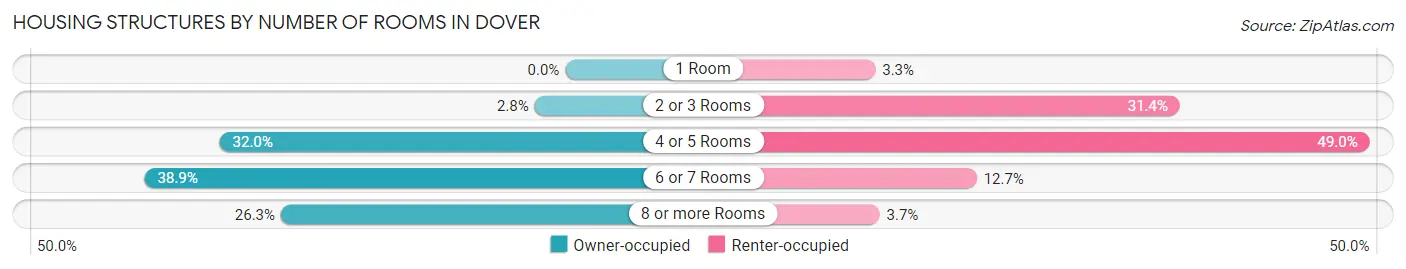
| Number of Rooms | Owner-occupied | Renter-occupied |
| 1 Room | 0 (0.0%) | 8 (3.3%) |
| 2 or 3 Rooms | 13 (2.8%) | 77 (31.4%) |
| 4 or 5 Rooms | 147 (32.0%) | 120 (49.0%) |
| 6 or 7 Rooms | 179 (38.9%) | 31 (12.7%) |
| 8 or more Rooms | 121 (26.3%) | 9 (3.7%) |
| Total | 460 (100.0%) | 245 (100.0%) |
Housing Structure by Heating Type in Dover
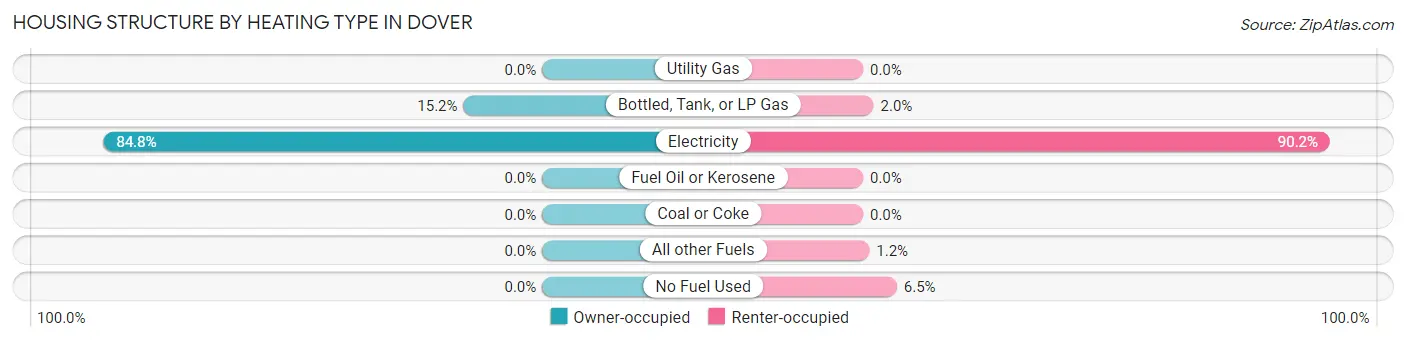
| Heating Type | Owner-occupied | Renter-occupied |
| Utility Gas | 0 (0.0%) | 0 (0.0%) |
| Bottled, Tank, or LP Gas | 70 (15.2%) | 5 (2.0%) |
| Electricity | 390 (84.8%) | 221 (90.2%) |
| Fuel Oil or Kerosene | 0 (0.0%) | 0 (0.0%) |
| Coal or Coke | 0 (0.0%) | 0 (0.0%) |
| All other Fuels | 0 (0.0%) | 3 (1.2%) |
| No Fuel Used | 0 (0.0%) | 16 (6.5%) |
| Total | 460 (100.0%) | 245 (100.0%) |
Household Vehicle Usage in Dover
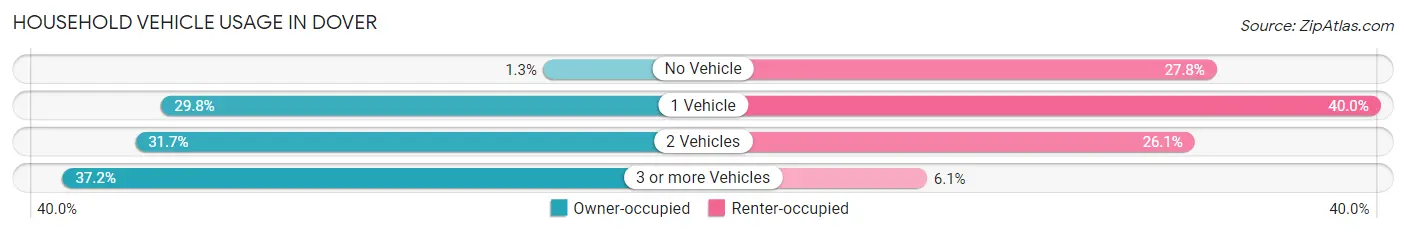
| Vehicles per Household | Owner-occupied | Renter-occupied |
| No Vehicle | 6 (1.3%) | 68 (27.8%) |
| 1 Vehicle | 137 (29.8%) | 98 (40.0%) |
| 2 Vehicles | 146 (31.7%) | 64 (26.1%) |
| 3 or more Vehicles | 171 (37.2%) | 15 (6.1%) |
| Total | 460 (100.0%) | 245 (100.0%) |
Real Estate & Mortgages in Dover
Real Estate and Mortgage Overview in Dover
| Characteristic | Without Mortgage | With Mortgage |
| Housing Units | 143 | 317 |
| Median Property Value | $179,900 | $185,700 |
| Median Household Income | $36,875 | $41 |
| Monthly Housing Costs | $502 | $12 |
| Real Estate Taxes | $1,250 | $4 |
Property Value by Mortgage Status in Dover
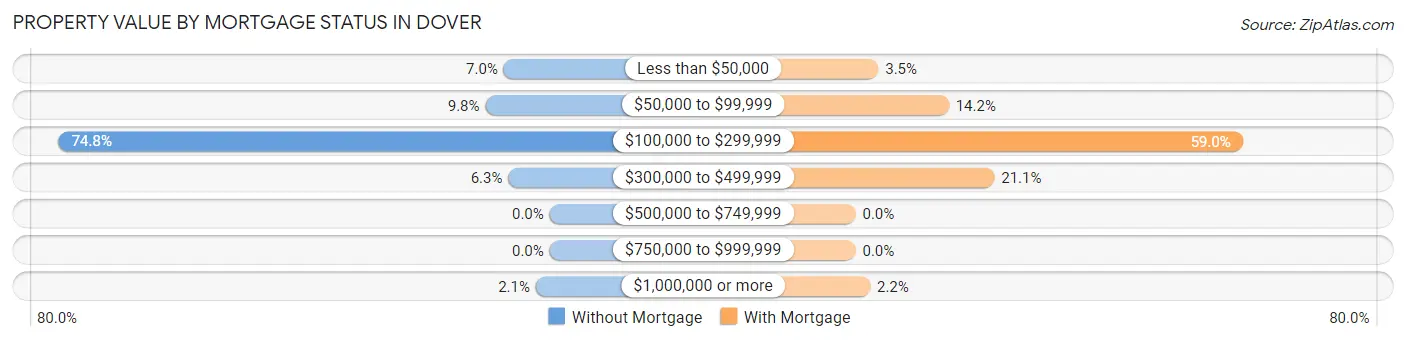
| Property Value | Without Mortgage | With Mortgage |
| Less than $50,000 | 10 (7.0%) | 11 (3.5%) |
| $50,000 to $99,999 | 14 (9.8%) | 45 (14.2%) |
| $100,000 to $299,999 | 107 (74.8%) | 187 (59.0%) |
| $300,000 to $499,999 | 9 (6.3%) | 67 (21.1%) |
| $500,000 to $749,999 | 0 (0.0%) | 0 (0.0%) |
| $750,000 to $999,999 | 0 (0.0%) | 0 (0.0%) |
| $1,000,000 or more | 3 (2.1%) | 7 (2.2%) |
| Total | 143 (100.0%) | 317 (100.0%) |
Household Income by Mortgage Status in Dover
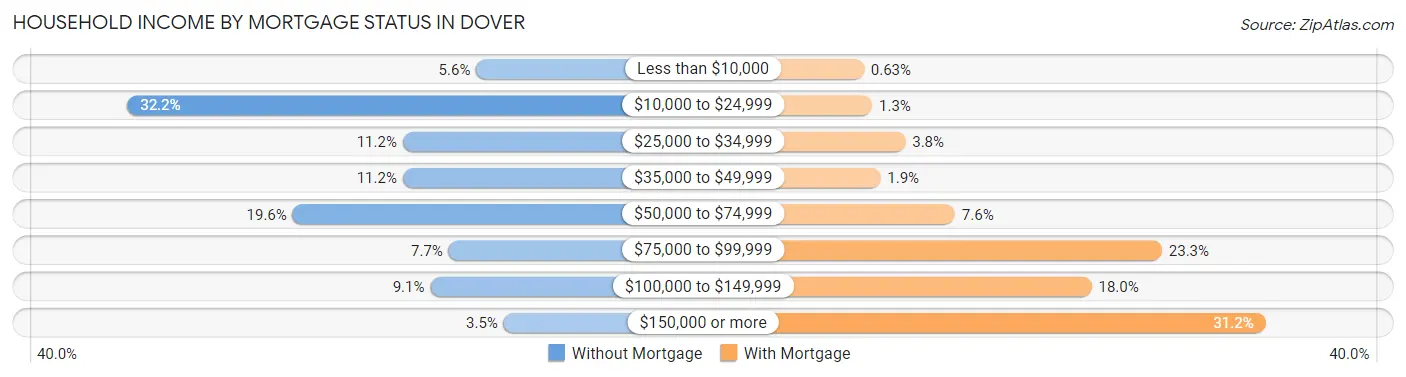
| Household Income | Without Mortgage | With Mortgage |
| Less than $10,000 | 8 (5.6%) | 2 (0.6%) |
| $10,000 to $24,999 | 46 (32.2%) | 4 (1.3%) |
| $25,000 to $34,999 | 16 (11.2%) | 12 (3.8%) |
| $35,000 to $49,999 | 16 (11.2%) | 6 (1.9%) |
| $50,000 to $74,999 | 28 (19.6%) | 24 (7.6%) |
| $75,000 to $99,999 | 11 (7.7%) | 74 (23.3%) |
| $100,000 to $149,999 | 13 (9.1%) | 57 (18.0%) |
| $150,000 or more | 5 (3.5%) | 99 (31.2%) |
| Total | 143 (100.0%) | 317 (100.0%) |
Property Value to Household Income Ratio in Dover
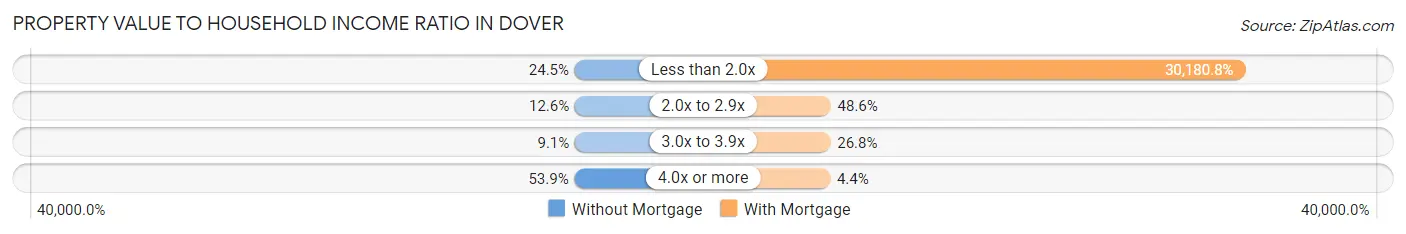
| Value-to-Income Ratio | Without Mortgage | With Mortgage |
| Less than 2.0x | 35 (24.5%) | 95,673 (30,180.8%) |
| 2.0x to 2.9x | 18 (12.6%) | 154 (48.6%) |
| 3.0x to 3.9x | 13 (9.1%) | 85 (26.8%) |
| 4.0x or more | 77 (53.8%) | 14 (4.4%) |
| Total | 143 (100.0%) | 317 (100.0%) |
Real Estate Taxes by Mortgage Status in Dover
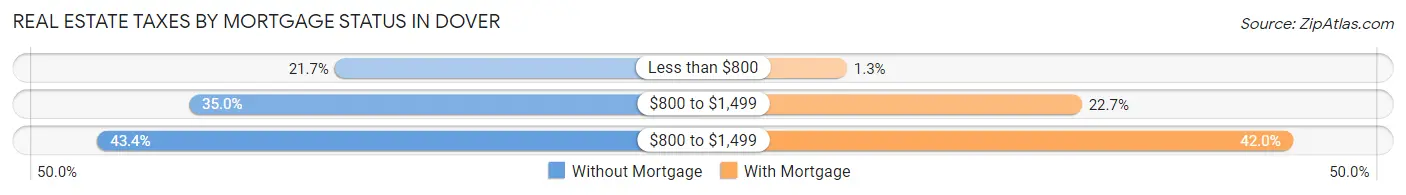
| Property Taxes | Without Mortgage | With Mortgage |
| Less than $800 | 31 (21.7%) | 4 (1.3%) |
| $800 to $1,499 | 50 (35.0%) | 72 (22.7%) |
| $800 to $1,499 | 62 (43.4%) | 133 (42.0%) |
| Total | 143 (100.0%) | 317 (100.0%) |
Health & Disability in Dover
Health Insurance Coverage by Age in Dover
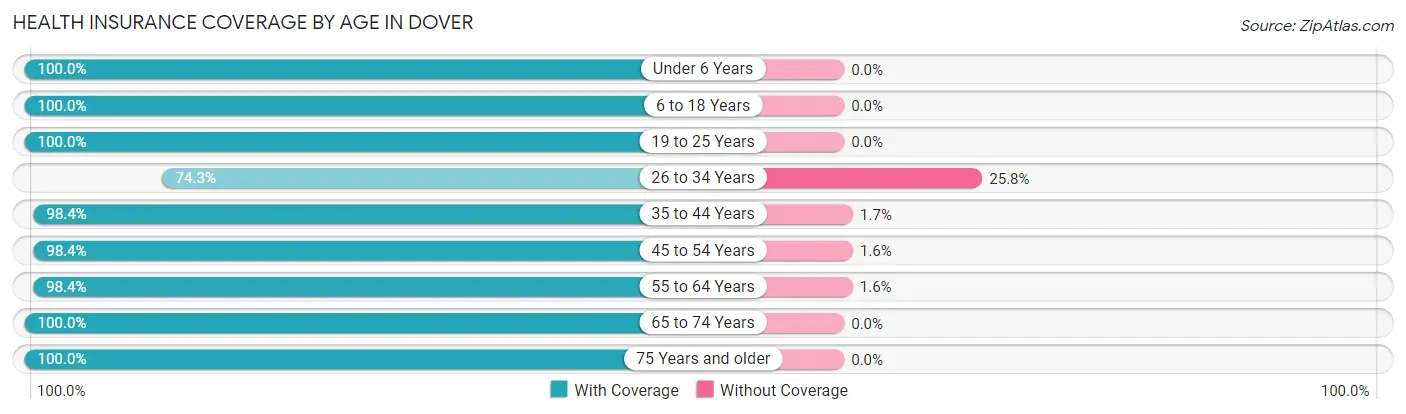
| Age Bracket | With Coverage | Without Coverage |
| Under 6 Years | 44 (100.0%) | 0 (0.0%) |
| 6 to 18 Years | 385 (100.0%) | 0 (0.0%) |
| 19 to 25 Years | 192 (100.0%) | 0 (0.0%) |
| 26 to 34 Years | 124 (74.3%) | 43 (25.8%) |
| 35 to 44 Years | 239 (98.4%) | 4 (1.7%) |
| 45 to 54 Years | 302 (98.4%) | 5 (1.6%) |
| 55 to 64 Years | 185 (98.4%) | 3 (1.6%) |
| 65 to 74 Years | 179 (100.0%) | 0 (0.0%) |
| 75 Years and older | 163 (100.0%) | 0 (0.0%) |
| Total | 1,813 (97.1%) | 55 (2.9%) |
Health Insurance Coverage by Citizenship Status in Dover
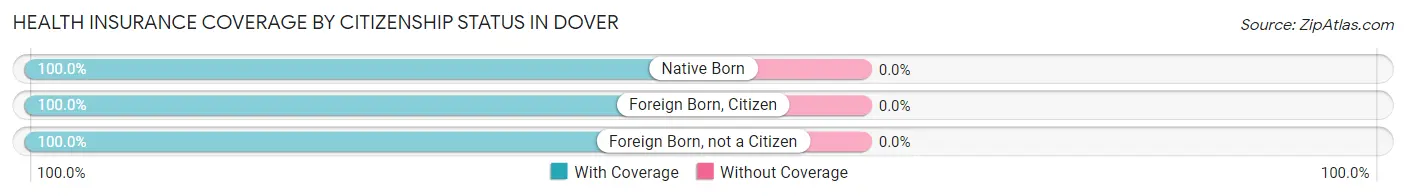
| Citizenship Status | With Coverage | Without Coverage |
| Native Born | 44 (100.0%) | 0 (0.0%) |
| Foreign Born, Citizen | 385 (100.0%) | 0 (0.0%) |
| Foreign Born, not a Citizen | 192 (100.0%) | 0 (0.0%) |
Health Insurance Coverage by Household Income in Dover
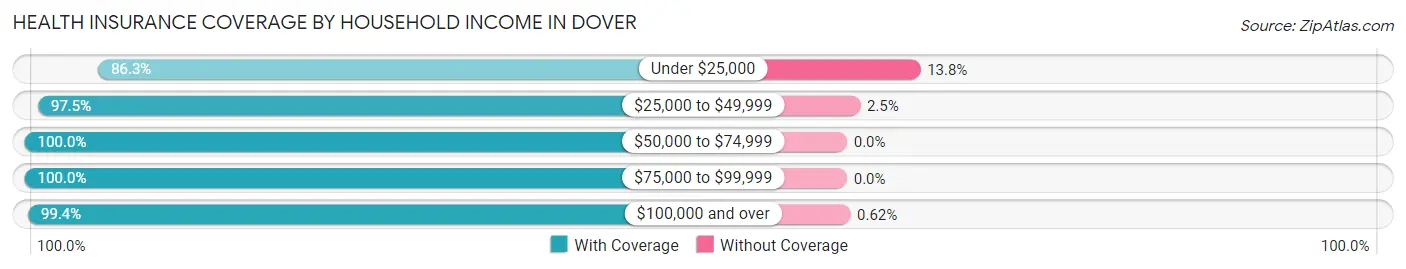
| Household Income | With Coverage | Without Coverage |
| Under $25,000 | 301 (86.3%) | 48 (13.8%) |
| $25,000 to $49,999 | 118 (97.5%) | 3 (2.5%) |
| $50,000 to $74,999 | 362 (100.0%) | 0 (0.0%) |
| $75,000 to $99,999 | 390 (100.0%) | 0 (0.0%) |
| $100,000 and over | 642 (99.4%) | 4 (0.6%) |
Public vs Private Health Insurance Coverage by Age in Dover
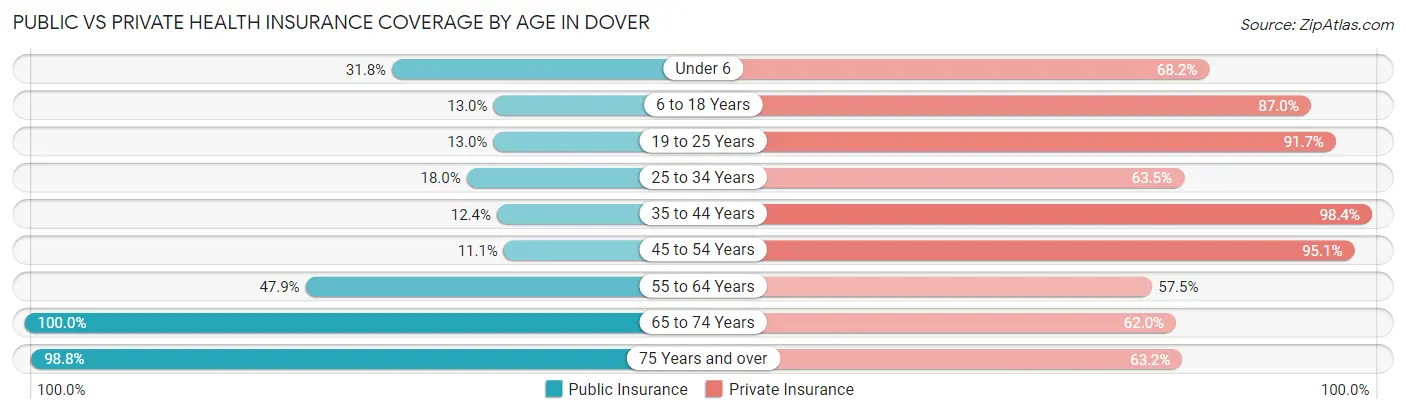
| Age Bracket | Public Insurance | Private Insurance |
| Under 6 | 14 (31.8%) | 30 (68.2%) |
| 6 to 18 Years | 50 (13.0%) | 335 (87.0%) |
| 19 to 25 Years | 25 (13.0%) | 176 (91.7%) |
| 25 to 34 Years | 30 (18.0%) | 106 (63.5%) |
| 35 to 44 Years | 30 (12.3%) | 239 (98.4%) |
| 45 to 54 Years | 34 (11.1%) | 292 (95.1%) |
| 55 to 64 Years | 90 (47.9%) | 108 (57.5%) |
| 65 to 74 Years | 179 (100.0%) | 111 (62.0%) |
| 75 Years and over | 161 (98.8%) | 103 (63.2%) |
| Total | 613 (32.8%) | 1,500 (80.3%) |
Disability Status by Sex by Age in Dover
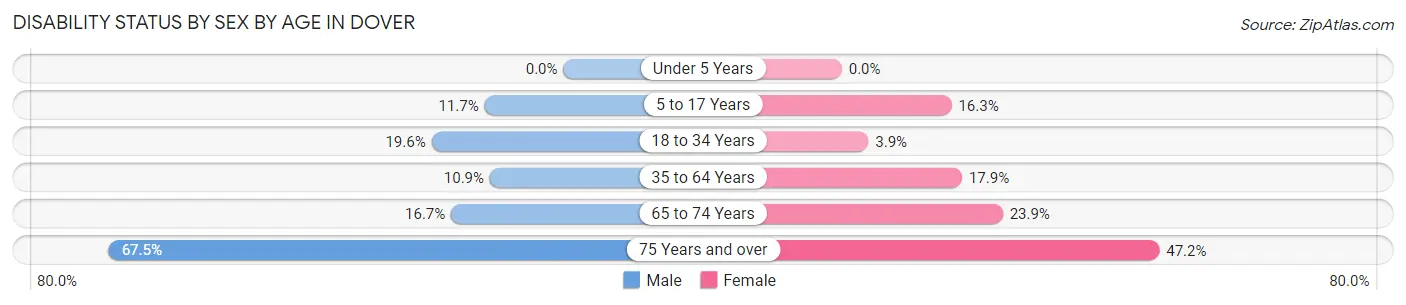
| Age Bracket | Male | Female |
| Under 5 Years | 0 (0.0%) | 0 (0.0%) |
| 5 to 17 Years | 22 (11.7%) | 29 (16.3%) |
| 18 to 34 Years | 37 (19.6%) | 8 (3.9%) |
| 35 to 64 Years | 42 (10.9%) | 63 (17.8%) |
| 65 to 74 Years | 11 (16.7%) | 27 (23.9%) |
| 75 Years and over | 27 (67.5%) | 58 (47.1%) |
Disability Class by Sex by Age in Dover
Disability Class: Hearing Difficulty
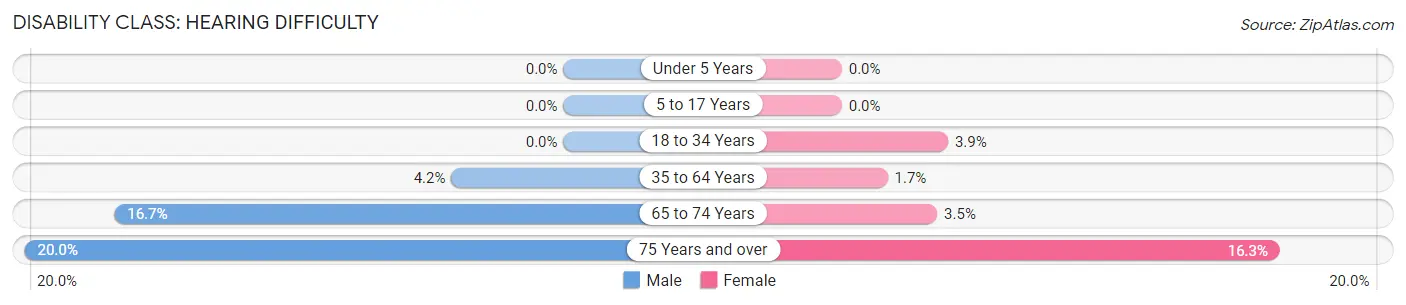
| Age Bracket | Male | Female |
| Under 5 Years | 0 (0.0%) | 0 (0.0%) |
| 5 to 17 Years | 0 (0.0%) | 0 (0.0%) |
| 18 to 34 Years | 0 (0.0%) | 8 (3.9%) |
| 35 to 64 Years | 16 (4.2%) | 6 (1.7%) |
| 65 to 74 Years | 11 (16.7%) | 4 (3.5%) |
| 75 Years and over | 8 (20.0%) | 20 (16.3%) |
Disability Class: Vision Difficulty
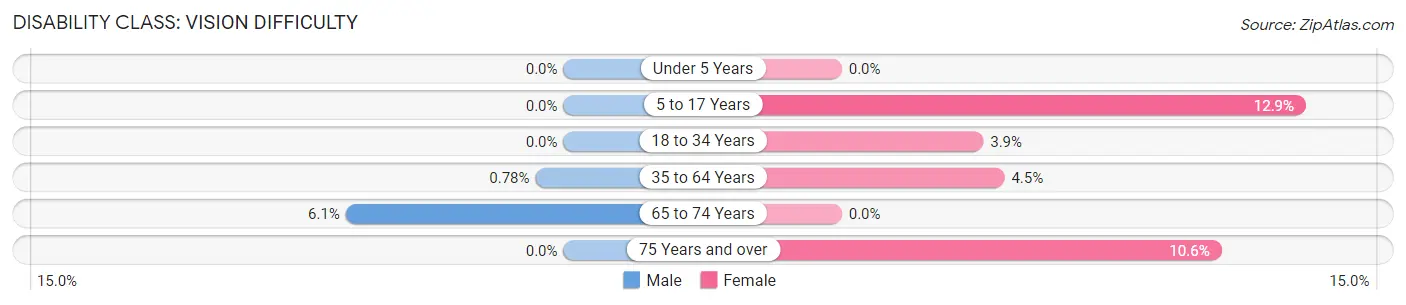
| Age Bracket | Male | Female |
| Under 5 Years | 0 (0.0%) | 0 (0.0%) |
| 5 to 17 Years | 0 (0.0%) | 23 (12.9%) |
| 18 to 34 Years | 0 (0.0%) | 8 (3.9%) |
| 35 to 64 Years | 3 (0.8%) | 16 (4.5%) |
| 65 to 74 Years | 4 (6.1%) | 0 (0.0%) |
| 75 Years and over | 0 (0.0%) | 13 (10.6%) |
Disability Class: Cognitive Difficulty
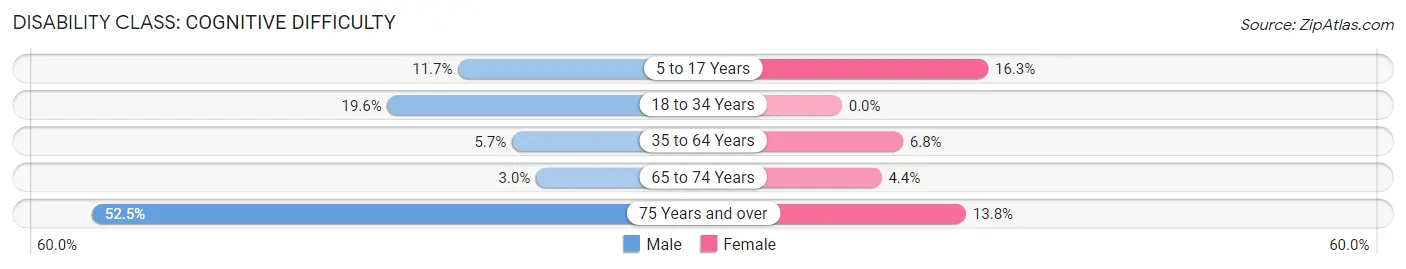
| Age Bracket | Male | Female |
| 5 to 17 Years | 22 (11.7%) | 29 (16.3%) |
| 18 to 34 Years | 37 (19.6%) | 0 (0.0%) |
| 35 to 64 Years | 22 (5.7%) | 24 (6.8%) |
| 65 to 74 Years | 2 (3.0%) | 5 (4.4%) |
| 75 Years and over | 21 (52.5%) | 17 (13.8%) |
Disability Class: Ambulatory Difficulty
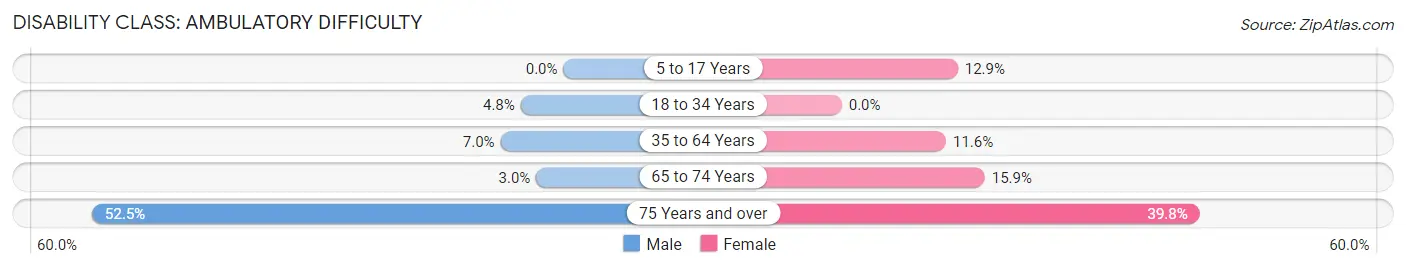
| Age Bracket | Male | Female |
| 5 to 17 Years | 0 (0.0%) | 23 (12.9%) |
| 18 to 34 Years | 9 (4.8%) | 0 (0.0%) |
| 35 to 64 Years | 27 (7.0%) | 41 (11.6%) |
| 65 to 74 Years | 2 (3.0%) | 18 (15.9%) |
| 75 Years and over | 21 (52.5%) | 49 (39.8%) |
Disability Class: Self-Care Difficulty
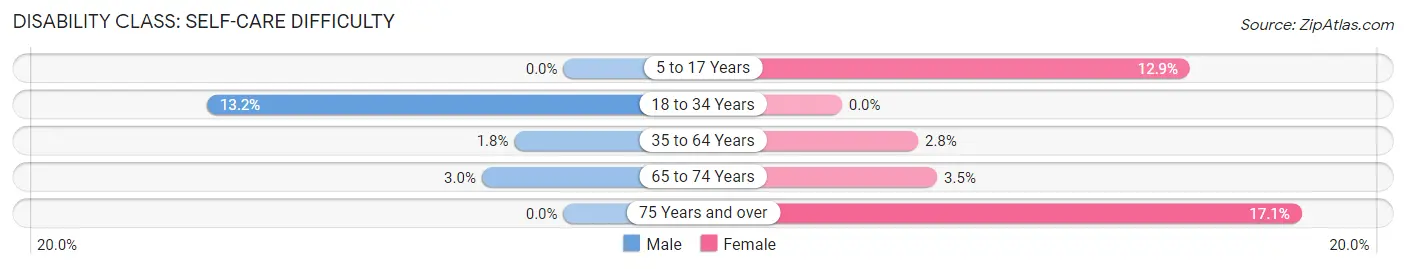
| Age Bracket | Male | Female |
| 5 to 17 Years | 0 (0.0%) | 23 (12.9%) |
| 18 to 34 Years | 25 (13.2%) | 0 (0.0%) |
| 35 to 64 Years | 7 (1.8%) | 10 (2.8%) |
| 65 to 74 Years | 2 (3.0%) | 4 (3.5%) |
| 75 Years and over | 0 (0.0%) | 21 (17.1%) |
Technology Access in Dover
Computing Device Access in Dover
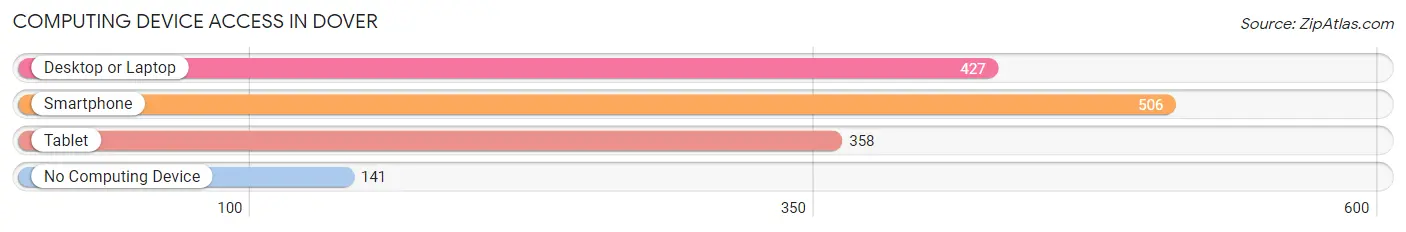
| Device Type | # Households | % Households |
| Desktop or Laptop | 427 | 60.6% |
| Smartphone | 506 | 71.8% |
| Tablet | 358 | 50.8% |
| No Computing Device | 141 | 20.0% |
| Total | 705 | 100.0% |
Internet Access in Dover
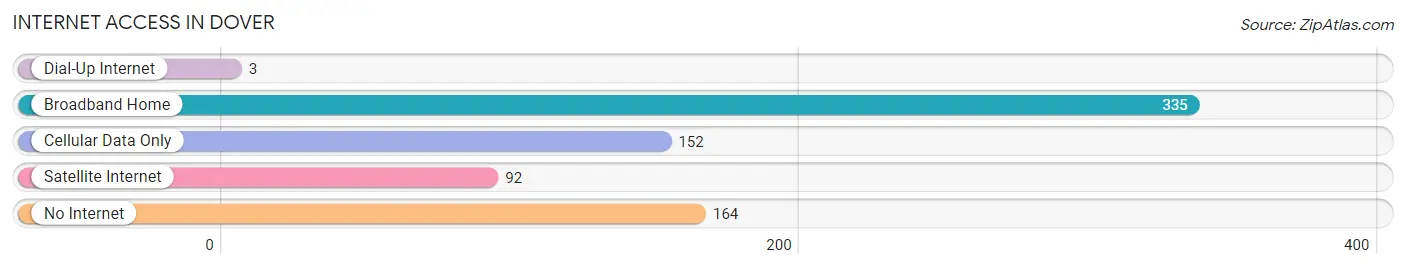
| Internet Type | # Households | % Households |
| Dial-Up Internet | 3 | 0.4% |
| Broadband Home | 335 | 47.5% |
| Cellular Data Only | 152 | 21.6% |
| Satellite Internet | 92 | 13.1% |
| No Internet | 164 | 23.3% |
| Total | 705 | 100.0% |
Dover Summary
Dover is a small town located in Stewart County, Tennessee. It is situated on the banks of the Cumberland River, approximately 40 miles northwest of Nashville. The town has a population of approximately 2,500 people and is the county seat of Stewart County.
History
Dover was founded in 1803 by William Lytle, a Revolutionary War veteran. The town was named after Dover, England, and was originally known as Lytle’s Ferry. The town was incorporated in 1819 and was the first county seat of Stewart County.
During the Civil War, Dover was the site of several battles, including the Battle of Dover in February 1862. The town was occupied by Union forces in March 1862 and remained under Union control until the end of the war.
Geography
Dover is located in the western part of Stewart County, approximately 40 miles northwest of Nashville. The town is situated on the banks of the Cumberland River and is surrounded by rolling hills and farmland. The town is located in the Central Basin of Tennessee, which is characterized by limestone and sandstone formations.
The climate in Dover is humid subtropical, with hot summers and mild winters. The average annual temperature is around 60 degrees Fahrenheit, with an average high of around 80 degrees in the summer and an average low of around 40 degrees in the winter.
Economy
The economy of Dover is largely based on agriculture and manufacturing. The town is home to several large farms, as well as several small businesses. The town is also home to several manufacturing plants, including a paper mill and a furniture factory.
The town is also home to several tourist attractions, including the Stewart County Historical Museum and the Dover Dam. The town is also home to several parks, including the Dover City Park and the Stewart County Park.
Demographics
As of the 2010 census, the population of Dover was 2,500. The racial makeup of the town was 95.2% White, 2.2% African American, 0.4% Native American, 0.4% Asian, 0.2% from other races, and 1.6% from two or more races. Hispanic or Latino of any race were 1.2% of the population.
The median income for a household in Dover was $35,000, and the median income for a family was $41,000. The per capita income for the town was $17,000. About 15.2% of families and 18.2% of the population were below the poverty line, including 25.2% of those under age 18 and 11.2% of those age 65 or over.
Common Questions
What is Per Capita Income in Dover?
Per Capita income in Dover is $27,896.
What is the Median Family Income in Dover?
Median Family Income in Dover is $83,750.
What is the Median Household income in Dover?
Median Household Income in Dover is $63,603.
What is Income or Wage Gap in Dover?
Income or Wage Gap in Dover is 39.4%.
Women in Dover earn 60.6 cents for every dollar earned by a man.
What is Inequality or Gini Index in Dover?
Inequality or Gini Index in Dover is 0.42.
What is the Total Population of Dover?
Total Population of Dover is 1,985.
What is the Total Male Population of Dover?
Total Male Population of Dover is 955.
What is the Total Female Population of Dover?
Total Female Population of Dover is 1,030.
What is the Ratio of Males per 100 Females in Dover?
There are 92.72 Males per 100 Females in Dover.
What is the Ratio of Females per 100 Males in Dover?
There are 107.85 Females per 100 Males in Dover.
What is the Median Population Age in Dover?
Median Population Age in Dover is 43.5 Years.
What is the Average Family Size in Dover
Average Family Size in Dover is 3.9 People.
What is the Average Household Size in Dover
Average Household Size in Dover is 2.6 People.
How Large is the Labor Force in Dover?
There are 857 People in the Labor Forcein in Dover.
What is the Percentage of People in the Labor Force in Dover?
51.6% of People are in the Labor Force in Dover.
What is the Unemployment Rate in Dover?
Unemployment Rate in Dover is 6.2%.