Crump, TN Map & Demographics
Crump Map
Crump Overview
$26,932
PER CAPITA INCOME
$47,917
AVG FAMILY INCOME
$38,846
AVG HOUSEHOLD INCOME
49.2%
WAGE / INCOME GAP [ % ]
50.8¢/ $1
WAGE / INCOME GAP [ $ ]
0.46
INEQUALITY / GINI INDEX
1,946
TOTAL POPULATION
972
MALE POPULATION
974
FEMALE POPULATION
99.79
MALES / 100 FEMALES
100.21
FEMALES / 100 MALES
52.2
MEDIAN AGE
3.1
AVG FAMILY SIZE
2.4
AVG HOUSEHOLD SIZE
813
LABOR FORCE [ PEOPLE ]
50.6%
PERCENT IN LABOR FORCE
0.7%
UNEMPLOYMENT RATE
Crump Zip Codes
Crump Area Codes
Income in Crump
Income Overview in Crump
Per Capita Income in Crump is $26,932, while median incomes of families and households are $47,917 and $38,846 respectively.
| Characteristic | Number | Measure |
| Per Capita Income | 1,946 | $26,932 |
| Median Family Income | 513 | $47,917 |
| Mean Family Income | 513 | $65,260 |
| Median Household Income | 818 | $38,846 |
| Mean Household Income | 818 | $60,804 |
| Income Deficit | 513 | $0 |
| Wage / Income Gap (%) | 1,946 | 49.18% |
| Wage / Income Gap ($) | 1,946 | 50.82¢ per $1 |
| Gini / Inequality Index | 1,946 | 0.46 |
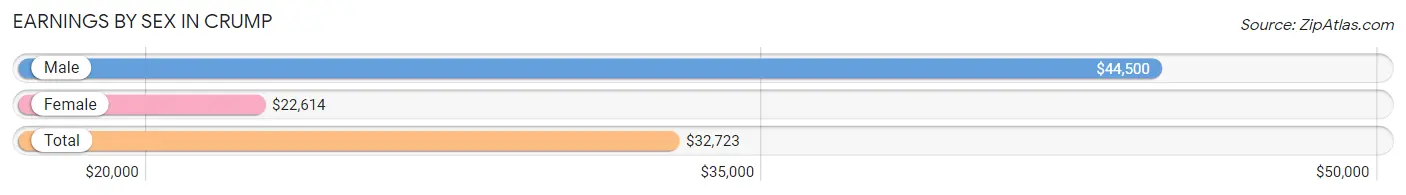
Earnings by Sex in Crump
Average Earnings in Crump are $32,723, $44,500 for men and $22,614 for women, a difference of 49.2%.
| Sex | Number | Average Earnings |
| Male | 412 (48.5%) | $44,500 |
| Female | 437 (51.5%) | $22,614 |
| Total | 849 (100.0%) | $32,723 |
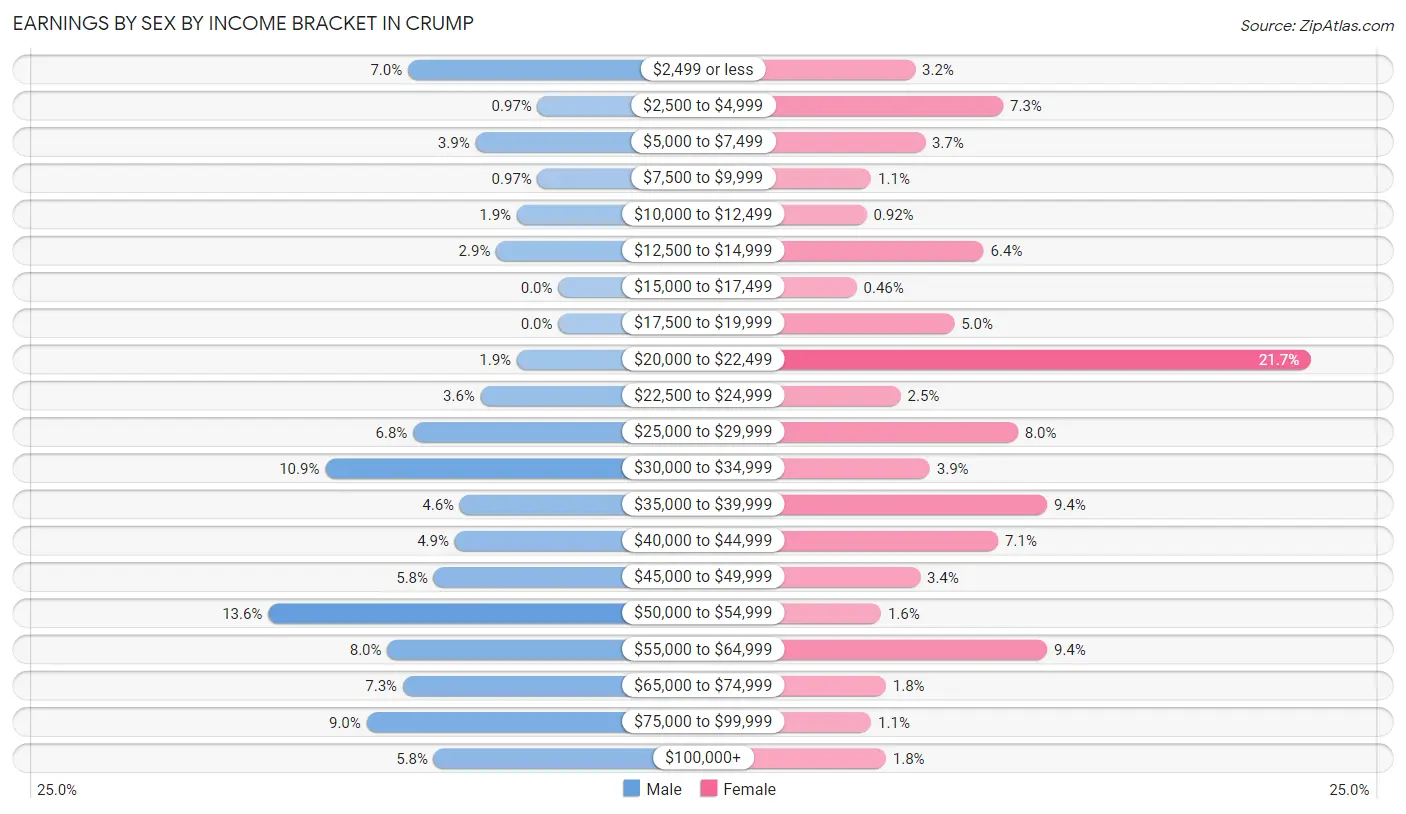
Earnings by Sex by Income Bracket in Crump
The most common earnings brackets in Crump are $50,000 to $54,999 for men (56 | 13.6%) and $20,000 to $22,499 for women (95 | 21.7%).
| Income | Male | Female |
| $2,499 or less | 29 (7.0%) | 14 (3.2%) |
| $2,500 to $4,999 | 4 (1.0%) | 32 (7.3%) |
| $5,000 to $7,499 | 16 (3.9%) | 16 (3.7%) |
| $7,500 to $9,999 | 4 (1.0%) | 5 (1.1%) |
| $10,000 to $12,499 | 8 (1.9%) | 4 (0.9%) |
| $12,500 to $14,999 | 12 (2.9%) | 28 (6.4%) |
| $15,000 to $17,499 | 0 (0.0%) | 2 (0.5%) |
| $17,500 to $19,999 | 0 (0.0%) | 22 (5.0%) |
| $20,000 to $22,499 | 8 (1.9%) | 95 (21.7%) |
| $22,500 to $24,999 | 15 (3.6%) | 11 (2.5%) |
| $25,000 to $29,999 | 28 (6.8%) | 35 (8.0%) |
| $30,000 to $34,999 | 45 (10.9%) | 17 (3.9%) |
| $35,000 to $39,999 | 19 (4.6%) | 41 (9.4%) |
| $40,000 to $44,999 | 20 (4.9%) | 31 (7.1%) |
| $45,000 to $49,999 | 24 (5.8%) | 15 (3.4%) |
| $50,000 to $54,999 | 56 (13.6%) | 7 (1.6%) |
| $55,000 to $64,999 | 33 (8.0%) | 41 (9.4%) |
| $65,000 to $74,999 | 30 (7.3%) | 8 (1.8%) |
| $75,000 to $99,999 | 37 (9.0%) | 5 (1.1%) |
| $100,000+ | 24 (5.8%) | 8 (1.8%) |
| Total | 412 (100.0%) | 437 (100.0%) |
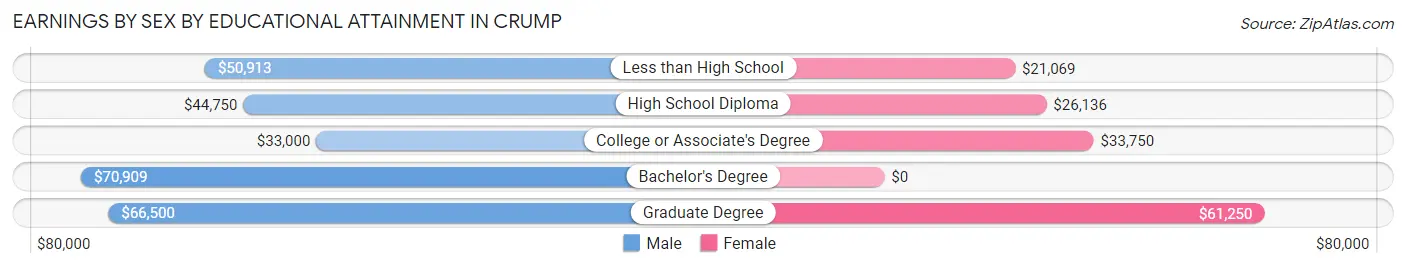
Earnings by Sex by Educational Attainment in Crump
Average earnings in Crump are $47,202 for men and $22,487 for women, a difference of 52.4%. Men with an educational attainment of bachelor's degree enjoy the highest average annual earnings of $70,909, while those with college or associate's degree education earn the least with $33,000. Women with an educational attainment of graduate degree earn the most with the average annual earnings of $61,250, while those with less than high school education have the smallest earnings of $21,069.
| Educational Attainment | Male Income | Female Income |
| Less than High School | $50,913 | $21,069 |
| High School Diploma | $44,750 | $26,136 |
| College or Associate's Degree | $33,000 | $33,750 |
| Bachelor's Degree | $70,909 | $0 |
| Graduate Degree | $66,500 | $61,250 |
| Total | $47,202 | $22,487 |
Family Income in Crump
Family Income Brackets in Crump
According to the Crump family income data, there are 128 families falling into the $25,000 to $34,999 income range, which is the most common income bracket and makes up 24.9% of all families. Conversely, the less than $10,000 income bracket is the least frequent group with only 13 families (2.5%) belonging to this category.
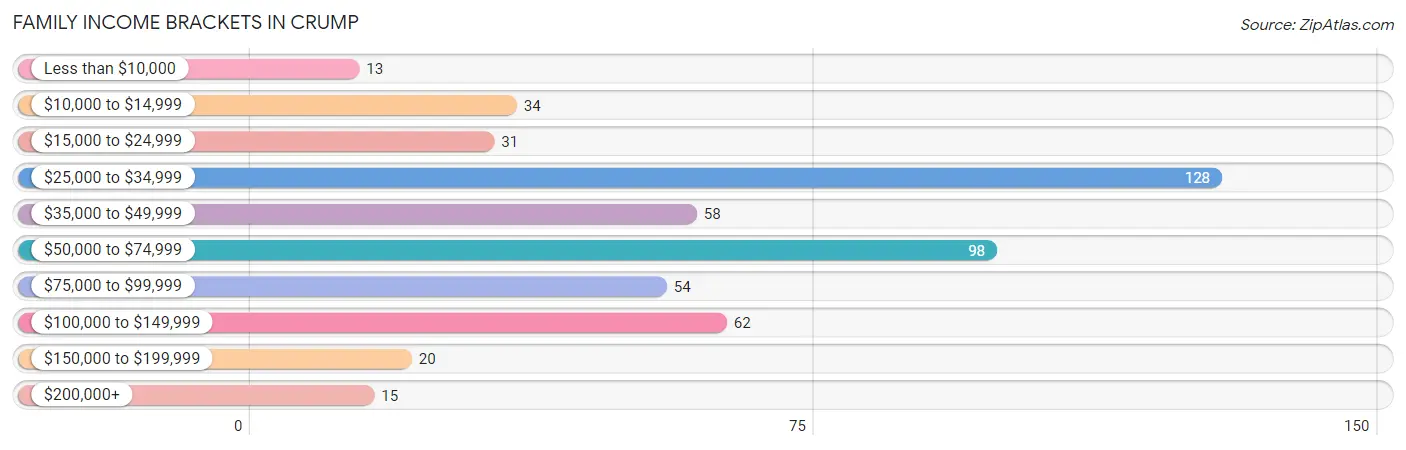
| Income Bracket | # Families | % Families |
| Less than $10,000 | 13 | 2.5% |
| $10,000 to $14,999 | 34 | 6.6% |
| $15,000 to $24,999 | 31 | 6.0% |
| $25,000 to $34,999 | 128 | 25.0% |
| $35,000 to $49,999 | 58 | 11.3% |
| $50,000 to $74,999 | 98 | 19.1% |
| $75,000 to $99,999 | 54 | 10.5% |
| $100,000 to $149,999 | 62 | 12.1% |
| $150,000 to $199,999 | 20 | 3.9% |
| $200,000+ | 15 | 2.9% |
Family Income by Famaliy Size in Crump
4-person families (56 | 10.9%) account for the highest median family income in Crump with $143,958 per family, while 4-person families (56 | 10.9%) have the highest median income of $35,990 per family member.
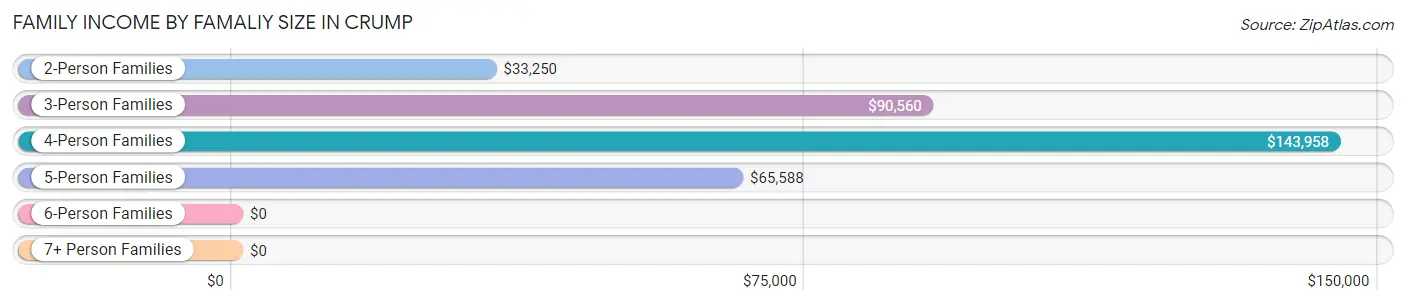
| Income Bracket | # Families | Median Income |
| 2-Person Families | 300 (58.5%) | $33,250 |
| 3-Person Families | 81 (15.8%) | $90,560 |
| 4-Person Families | 56 (10.9%) | $143,958 |
| 5-Person Families | 68 (13.3%) | $65,588 |
| 6-Person Families | 8 (1.6%) | $0 |
| 7+ Person Families | 0 (0.0%) | $0 |
| Total | 513 (100.0%) | $47,917 |
Family Income by Number of Earners in Crump
The median family income in Crump is $47,917, with families comprising 3+ earners (32) having the highest median family income of $143,750, while families with no earners (168) have the lowest median family income of $27,267, accounting for 6.2% and 32.8% of families, respectively.
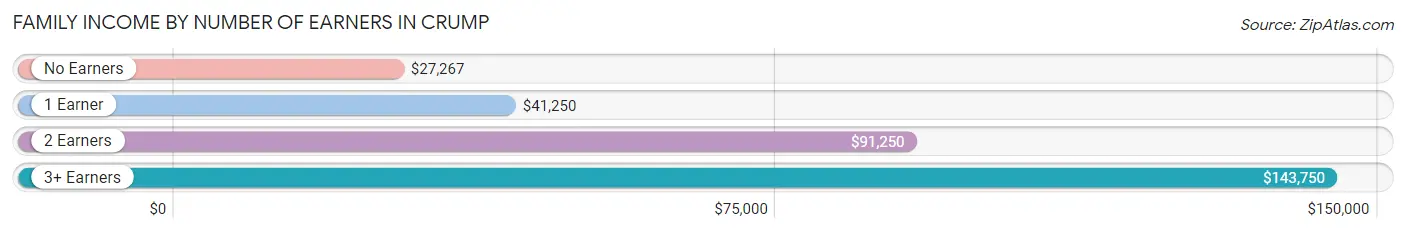
| Number of Earners | # Families | Median Income |
| No Earners | 168 (32.8%) | $27,267 |
| 1 Earner | 190 (37.0%) | $41,250 |
| 2 Earners | 123 (24.0%) | $91,250 |
| 3+ Earners | 32 (6.2%) | $143,750 |
| Total | 513 (100.0%) | $47,917 |
Household Income in Crump
Household Income Brackets in Crump
With 167 households falling in the category, the $25,000 to $34,999 income range is the most frequent in Crump, accounting for 20.4% of all households. In contrast, only 19 households (2.3%) fall into the $200,000+ income bracket, making it the least populous group.
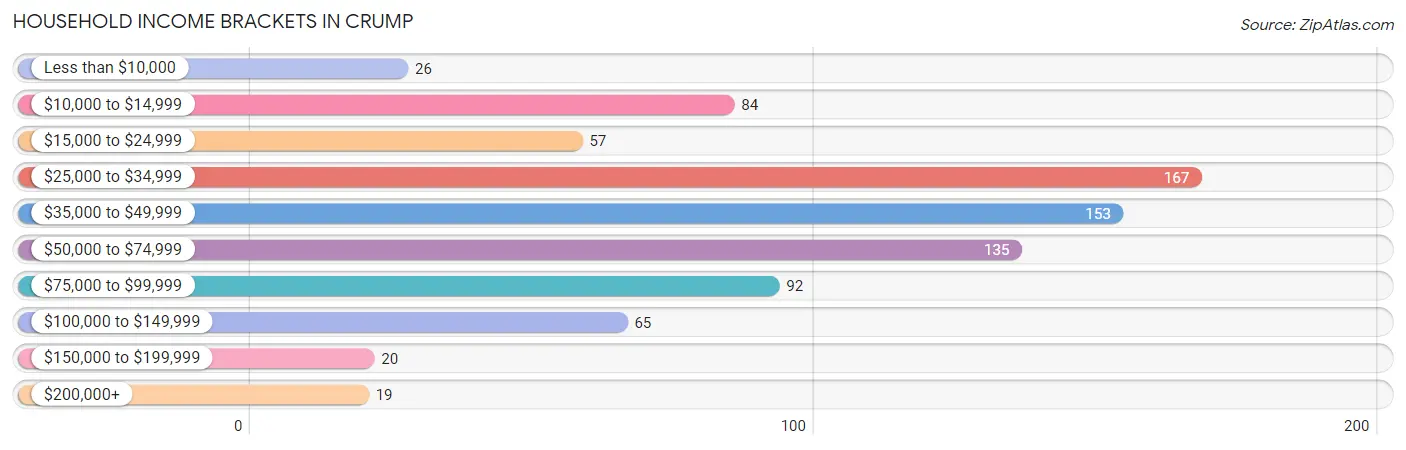
| Income Bracket | # Households | % Households |
| Less than $10,000 | 26 | 3.2% |
| $10,000 to $14,999 | 84 | 10.3% |
| $15,000 to $24,999 | 57 | 7.0% |
| $25,000 to $34,999 | 167 | 20.4% |
| $35,000 to $49,999 | 153 | 18.7% |
| $50,000 to $74,999 | 135 | 16.5% |
| $75,000 to $99,999 | 92 | 11.2% |
| $100,000 to $149,999 | 65 | 7.9% |
| $150,000 to $199,999 | 20 | 2.4% |
| $200,000+ | 19 | 2.3% |
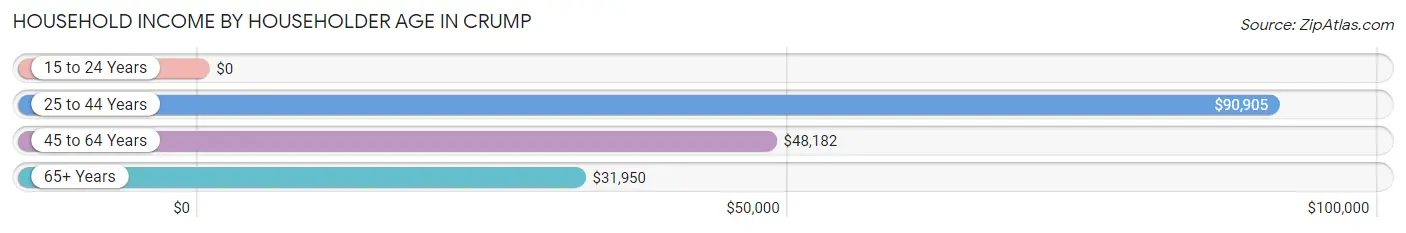
Household Income by Householder Age in Crump
The median household income in Crump is $38,846, with the highest median household income of $90,905 found in the 25 to 44 years age bracket for the primary householder. A total of 141 households (17.2%) fall into this category. Meanwhile, the 15 to 24 years age bracket for the primary householder has the lowest median household income of $0, with 15 households (1.8%) in this group.
| Income Bracket | # Households | Median Income |
| 15 to 24 Years | 15 (1.8%) | $0 |
| 25 to 44 Years | 141 (17.2%) | $90,905 |
| 45 to 64 Years | 334 (40.8%) | $48,182 |
| 65+ Years | 328 (40.1%) | $31,950 |
| Total | 818 (100.0%) | $38,846 |
Poverty in Crump
Income Below Poverty by Sex and Age in Crump
With 16.6% poverty level for males and 22.4% for females among the residents of Crump, 18 to 24 year old males and 15 year old females are the most vulnerable to poverty, with 18 males (36.7%) and 12 females (100.0%) in their respective age groups living below the poverty level.
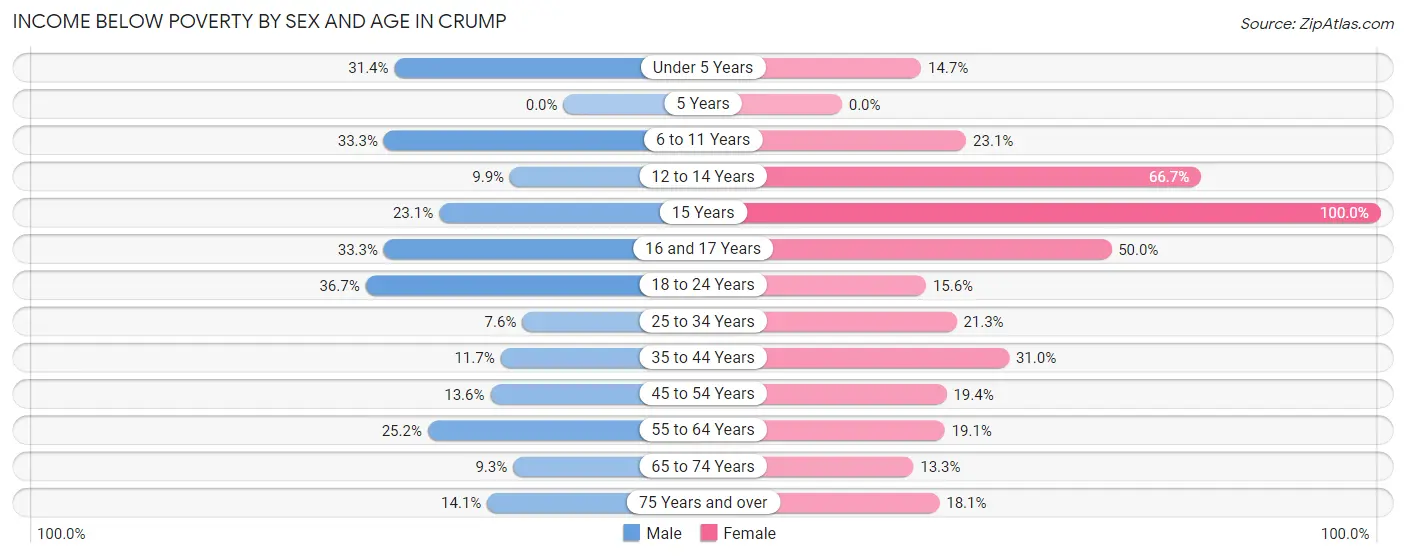
| Age Bracket | Male | Female |
| Under 5 Years | 16 (31.4%) | 5 (14.7%) |
| 5 Years | 0 (0.0%) | 0 (0.0%) |
| 6 to 11 Years | 13 (33.3%) | 9 (23.1%) |
| 12 to 14 Years | 11 (9.9%) | 20 (66.7%) |
| 15 Years | 3 (23.1%) | 12 (100.0%) |
| 16 and 17 Years | 3 (33.3%) | 11 (50.0%) |
| 18 to 24 Years | 18 (36.7%) | 5 (15.6%) |
| 25 to 34 Years | 9 (7.6%) | 30 (21.3%) |
| 35 to 44 Years | 7 (11.7%) | 18 (31.0%) |
| 45 to 54 Years | 16 (13.6%) | 34 (19.4%) |
| 55 to 64 Years | 37 (25.2%) | 38 (19.1%) |
| 65 to 74 Years | 14 (9.3%) | 15 (13.3%) |
| 75 Years and over | 14 (14.1%) | 21 (18.1%) |
| Total | 161 (16.6%) | 218 (22.4%) |
Income Above Poverty by Sex and Age in Crump
According to the poverty statistics in Crump, males aged 5 years and females aged 5 years are the age groups that are most secure financially, with 100.0% of males and 100.0% of females in these age groups living above the poverty line.
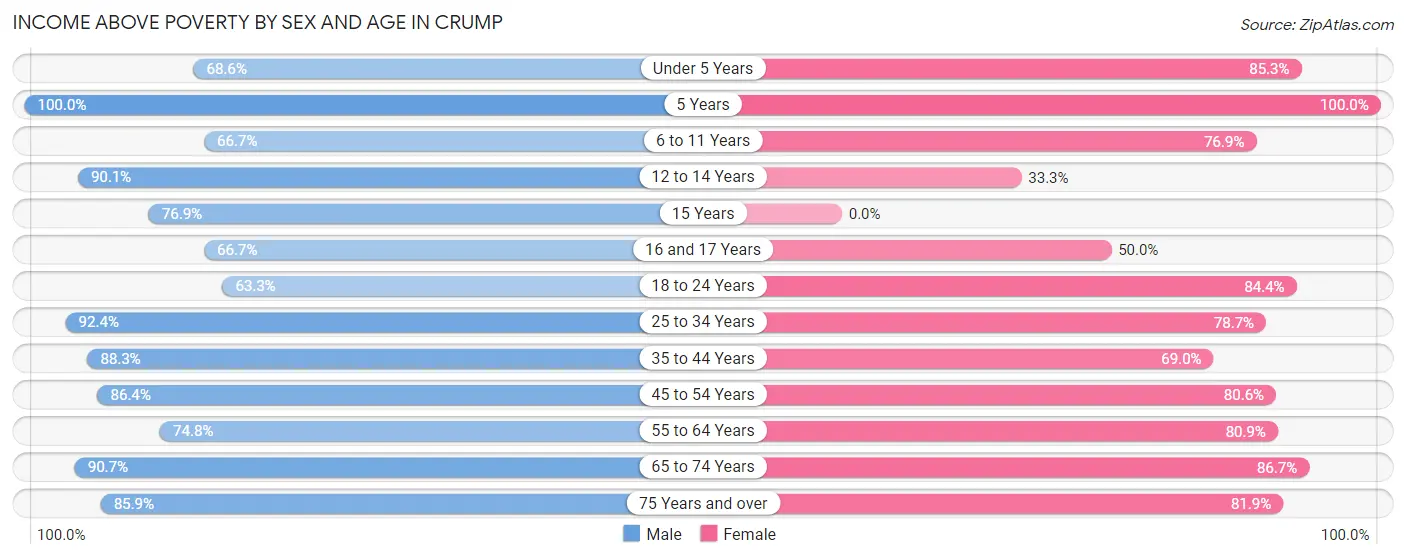
| Age Bracket | Male | Female |
| Under 5 Years | 35 (68.6%) | 29 (85.3%) |
| 5 Years | 4 (100.0%) | 3 (100.0%) |
| 6 to 11 Years | 26 (66.7%) | 30 (76.9%) |
| 12 to 14 Years | 100 (90.1%) | 10 (33.3%) |
| 15 Years | 10 (76.9%) | 0 (0.0%) |
| 16 and 17 Years | 6 (66.7%) | 11 (50.0%) |
| 18 to 24 Years | 31 (63.3%) | 27 (84.4%) |
| 25 to 34 Years | 109 (92.4%) | 111 (78.7%) |
| 35 to 44 Years | 53 (88.3%) | 40 (69.0%) |
| 45 to 54 Years | 102 (86.4%) | 141 (80.6%) |
| 55 to 64 Years | 110 (74.8%) | 161 (80.9%) |
| 65 to 74 Years | 136 (90.7%) | 98 (86.7%) |
| 75 Years and over | 85 (85.9%) | 95 (81.9%) |
| Total | 807 (83.4%) | 756 (77.6%) |
Income Below Poverty Among Married-Couple Families in Crump
The poverty statistics for married-couple families in Crump show that 13.0% or 58 of the total 447 families live below the poverty line. Families with 1 or 2 children have the highest poverty rate of 22.7%, comprising of 25 families. On the other hand, families with 3 or 4 children have the lowest poverty rate of 2.2%, which includes 1 families.
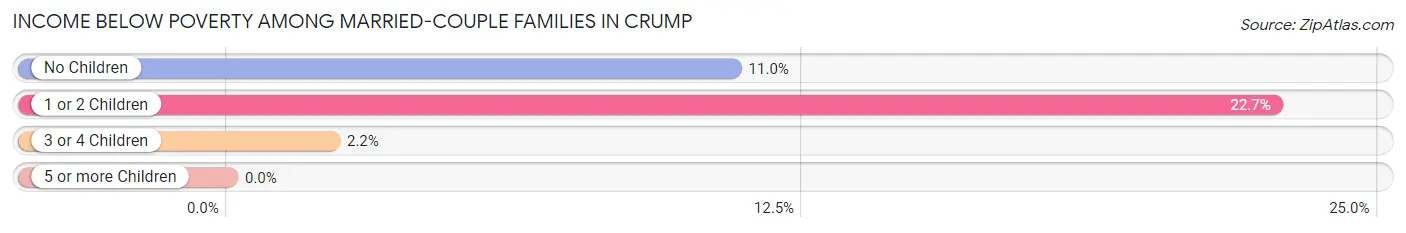
| Children | Above Poverty | Below Poverty |
| No Children | 260 (89.0%) | 32 (11.0%) |
| 1 or 2 Children | 85 (77.3%) | 25 (22.7%) |
| 3 or 4 Children | 44 (97.8%) | 1 (2.2%) |
| 5 or more Children | 0 (0.0%) | 0 (0.0%) |
| Total | 389 (87.0%) | 58 (13.0%) |
Income Below Poverty Among Single-Parent Households in Crump
According to the poverty data in Crump, 26.7% or 4 single-father households and 51.0% or 26 single-mother households are living below the poverty line. Among single-father households, those with 3 or 4 children have the highest poverty rate, with 4 households (66.7%) experiencing poverty. Likewise, among single-mother households, those with 3 or 4 children have the highest poverty rate, with 8 households (100.0%) falling below the poverty line.
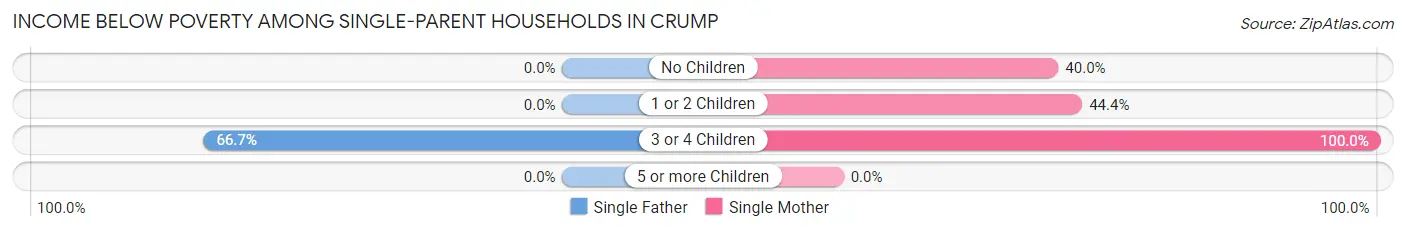
| Children | Single Father | Single Mother |
| No Children | 0 (0.0%) | 10 (40.0%) |
| 1 or 2 Children | 0 (0.0%) | 8 (44.4%) |
| 3 or 4 Children | 4 (66.7%) | 8 (100.0%) |
| 5 or more Children | 0 (0.0%) | 0 (0.0%) |
| Total | 4 (26.7%) | 26 (51.0%) |
Income Below Poverty Among Married-Couple vs Single-Parent Households in Crump
The poverty data for Crump shows that 58 of the married-couple family households (13.0%) and 30 of the single-parent households (45.5%) are living below the poverty level. Within the married-couple family households, those with 1 or 2 children have the highest poverty rate, with 25 households (22.7%) falling below the poverty line. Among the single-parent households, those with 3 or 4 children have the highest poverty rate, with 12 household (85.7%) living below poverty.
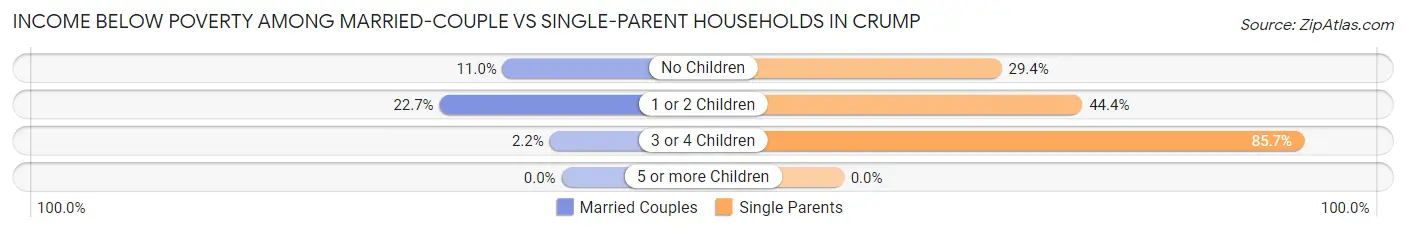
| Children | Married-Couple Families | Single-Parent Households |
| No Children | 32 (11.0%) | 10 (29.4%) |
| 1 or 2 Children | 25 (22.7%) | 8 (44.4%) |
| 3 or 4 Children | 1 (2.2%) | 12 (85.7%) |
| 5 or more Children | 0 (0.0%) | 0 (0.0%) |
| Total | 58 (13.0%) | 30 (45.5%) |
Race in Crump
The most populous races in Crump are White / Caucasian (1,912 | 98.3%), Black / African American (21 | 1.1%), and Hispanic or Latino (13 | 0.7%).
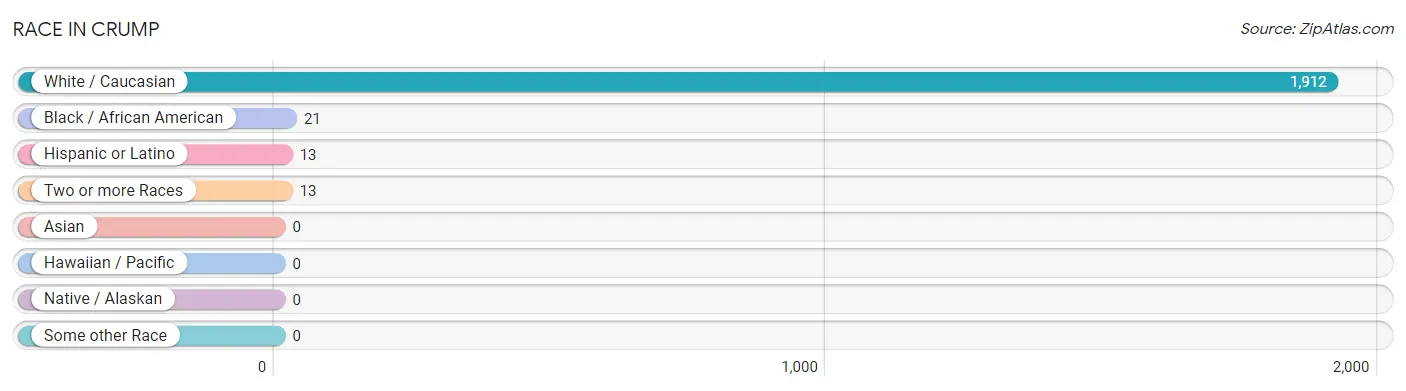
| Race | # Population | % Population |
| Asian | 0 | 0.0% |
| Black / African American | 21 | 1.1% |
| Hawaiian / Pacific | 0 | 0.0% |
| Hispanic or Latino | 13 | 0.7% |
| Native / Alaskan | 0 | 0.0% |
| White / Caucasian | 1,912 | 98.3% |
| Two or more Races | 13 | 0.7% |
| Some other Race | 0 | 0.0% |
| Total | 1,946 | 100.0% |
Ancestry in Crump
The most populous ancestries reported in Crump are American (248 | 12.7%), Irish (210 | 10.8%), English (165 | 8.5%), German (139 | 7.1%), and European (86 | 4.4%), together accounting for 43.6% of all Crump residents.
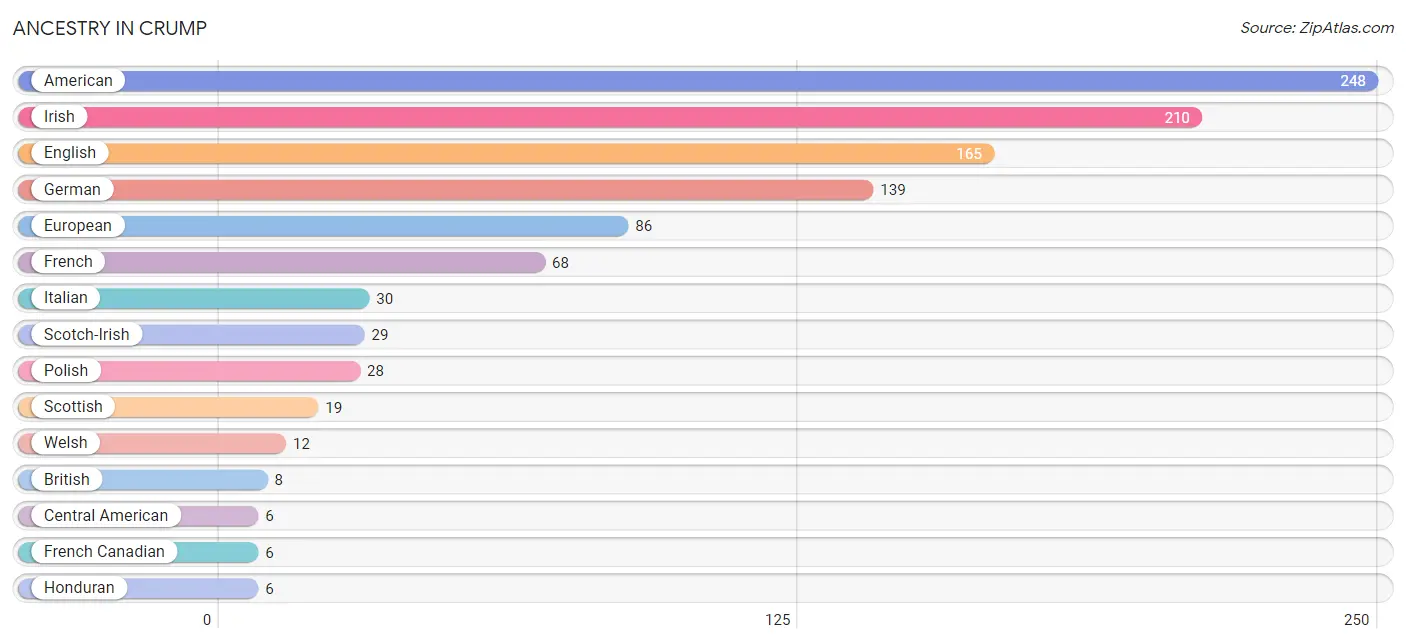
| Ancestry | # Population | % Population |
| American | 248 | 12.7% |
| Arab | 4 | 0.2% |
| British | 8 | 0.4% |
| Celtic | 4 | 0.2% |
| Central American | 6 | 0.3% |
| Dutch | 4 | 0.2% |
| English | 165 | 8.5% |
| European | 86 | 4.4% |
| French | 68 | 3.5% |
| French Canadian | 6 | 0.3% |
| German | 139 | 7.1% |
| Honduran | 6 | 0.3% |
| Irish | 210 | 10.8% |
| Italian | 30 | 1.5% |
| Lebanese | 4 | 0.2% |
| Norwegian | 4 | 0.2% |
| Polish | 28 | 1.4% |
| Romanian | 3 | 0.2% |
| Scotch-Irish | 29 | 1.5% |
| Scottish | 19 | 1.0% |
| Swedish | 4 | 0.2% |
| Welsh | 12 | 0.6% | View All 22 Rows |
Immigrants in Crump
The most numerous immigrant groups reported in Crump came from Europe (3 | 0.2%), Germany (3 | 0.2%), and Western Europe (3 | 0.2%), together accounting for 0.5% of all Crump residents.
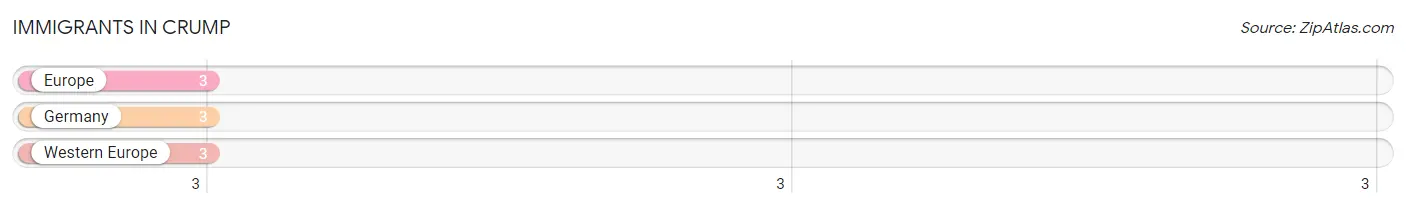
| Immigration Origin | # Population | % Population |
| Europe | 3 | 0.2% |
| Germany | 3 | 0.2% |
| Western Europe | 3 | 0.2% | View All 3 Rows |
Sex and Age in Crump
Sex and Age in Crump
The most populous age groups in Crump are 10 to 14 Years (125 | 12.9%) for men and 50 to 54 Years (122 | 12.5%) for women.
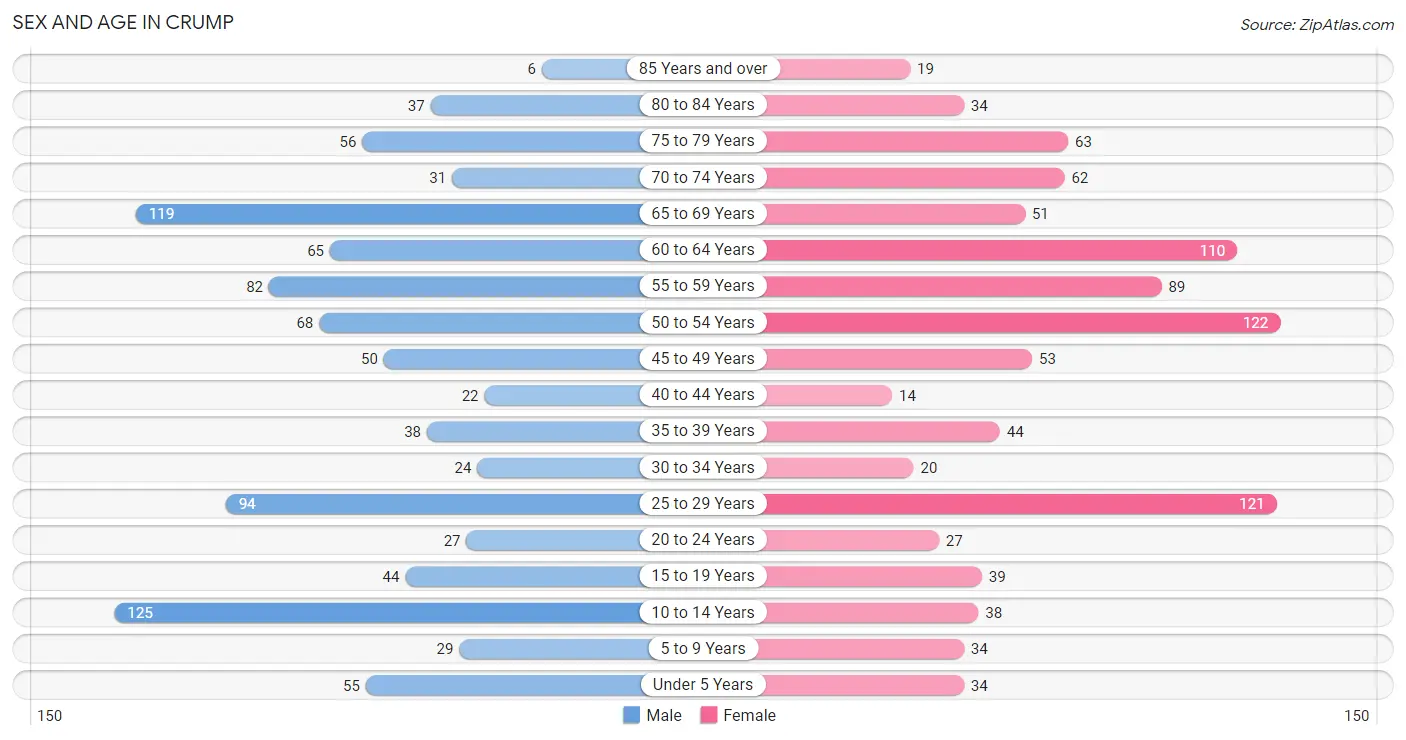
| Age Bracket | Male | Female |
| Under 5 Years | 55 (5.7%) | 34 (3.5%) |
| 5 to 9 Years | 29 (3.0%) | 34 (3.5%) |
| 10 to 14 Years | 125 (12.9%) | 38 (3.9%) |
| 15 to 19 Years | 44 (4.5%) | 39 (4.0%) |
| 20 to 24 Years | 27 (2.8%) | 27 (2.8%) |
| 25 to 29 Years | 94 (9.7%) | 121 (12.4%) |
| 30 to 34 Years | 24 (2.5%) | 20 (2.1%) |
| 35 to 39 Years | 38 (3.9%) | 44 (4.5%) |
| 40 to 44 Years | 22 (2.3%) | 14 (1.4%) |
| 45 to 49 Years | 50 (5.1%) | 53 (5.4%) |
| 50 to 54 Years | 68 (7.0%) | 122 (12.5%) |
| 55 to 59 Years | 82 (8.4%) | 89 (9.1%) |
| 60 to 64 Years | 65 (6.7%) | 110 (11.3%) |
| 65 to 69 Years | 119 (12.2%) | 51 (5.2%) |
| 70 to 74 Years | 31 (3.2%) | 62 (6.4%) |
| 75 to 79 Years | 56 (5.8%) | 63 (6.5%) |
| 80 to 84 Years | 37 (3.8%) | 34 (3.5%) |
| 85 Years and over | 6 (0.6%) | 19 (1.9%) |
| Total | 972 (100.0%) | 974 (100.0%) |
Families and Households in Crump
Median Family Size in Crump
The median family size in Crump is 3.07 persons per family, with single female/mother families (51 | 9.9%) accounting for the largest median family size of 4.53 persons per family. On the other hand, married-couple families (447 | 87.1%) represent the smallest median family size with 2.86 persons per family.
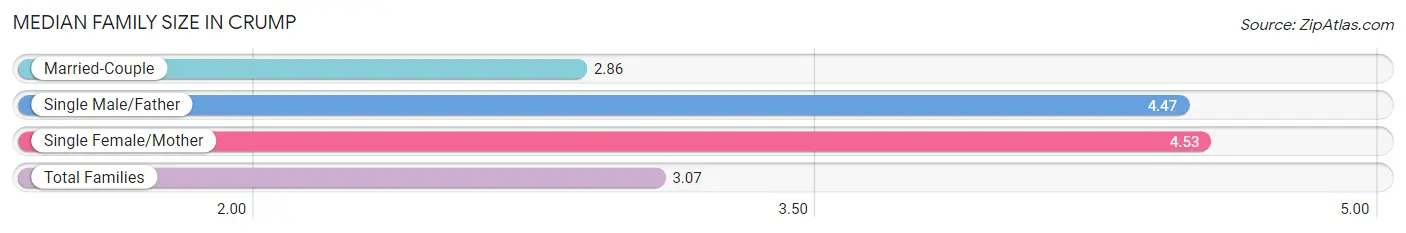
| Family Type | # Families | Family Size |
| Married-Couple | 447 (87.1%) | 2.86 |
| Single Male/Father | 15 (2.9%) | 4.47 |
| Single Female/Mother | 51 (9.9%) | 4.53 |
| Total Families | 513 (100.0%) | 3.07 |
Median Household Size in Crump
The median household size in Crump is 2.38 persons per household, with single male/father households (15 | 1.8%) accounting for the largest median household size of 4.87 persons per household. non-family households (305 | 37.3%) represent the smallest median household size with 1.14 persons per household.
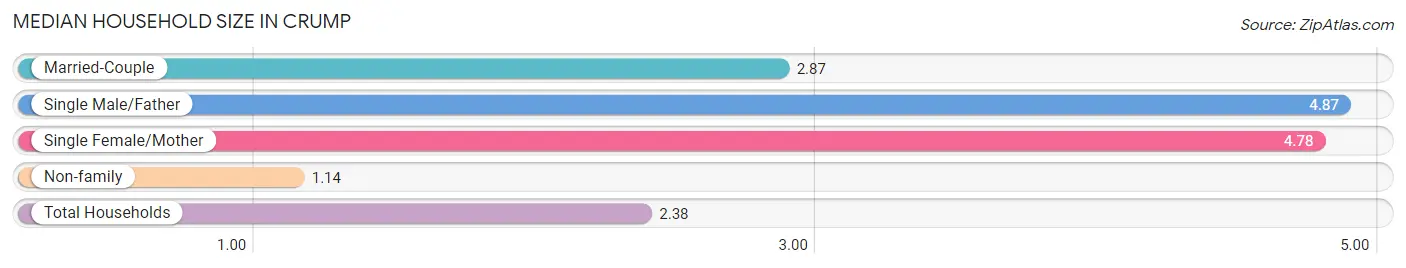
| Household Type | # Households | Household Size |
| Married-Couple | 447 (54.6%) | 2.87 |
| Single Male/Father | 15 (1.8%) | 4.87 |
| Single Female/Mother | 51 (6.2%) | 4.78 |
| Non-family | 305 (37.3%) | 1.14 |
| Total Households | 818 (100.0%) | 2.38 |
Household Size by Marriage Status in Crump
Out of a total of 818 households in Crump, 513 (62.7%) are family households, while 305 (37.3%) are nonfamily households. The most numerous type of family households are 2-person households, comprising 286, and the most common type of nonfamily households are 1-person households, comprising 266.
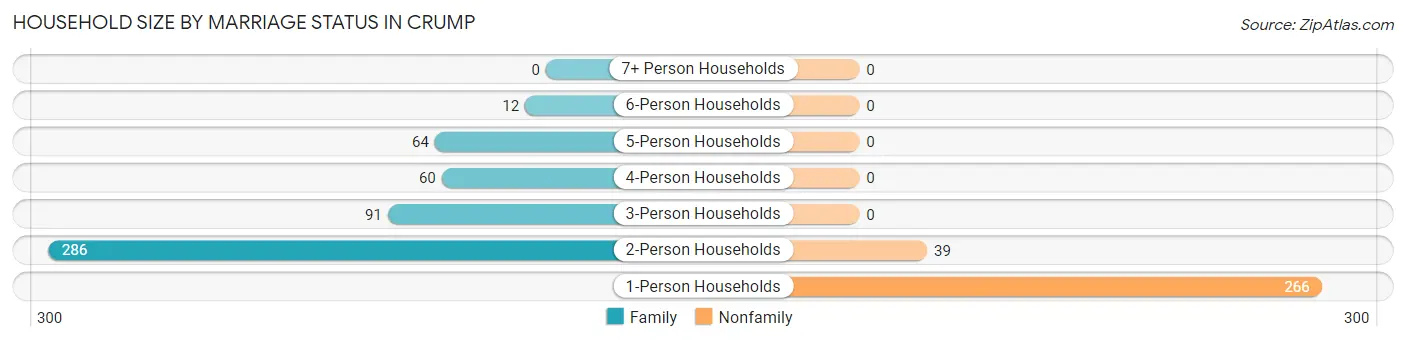
| Household Size | Family Households | Nonfamily Households |
| 1-Person Households | - | 266 (32.5%) |
| 2-Person Households | 286 (35.0%) | 39 (4.8%) |
| 3-Person Households | 91 (11.1%) | 0 (0.0%) |
| 4-Person Households | 60 (7.3%) | 0 (0.0%) |
| 5-Person Households | 64 (7.8%) | 0 (0.0%) |
| 6-Person Households | 12 (1.5%) | 0 (0.0%) |
| 7+ Person Households | 0 (0.0%) | 0 (0.0%) |
| Total | 513 (62.7%) | 305 (37.3%) |
Female Fertility in Crump
Fertility by Age in Crump
Average fertility rate in Crump is 128.0 births per 1,000 women. Women in the age bracket of 20 to 34 years have the highest fertility rate with 226.0 births per 1,000 women. Women in the age bracket of 20 to 34 years acount for 90.5% of all women with births.
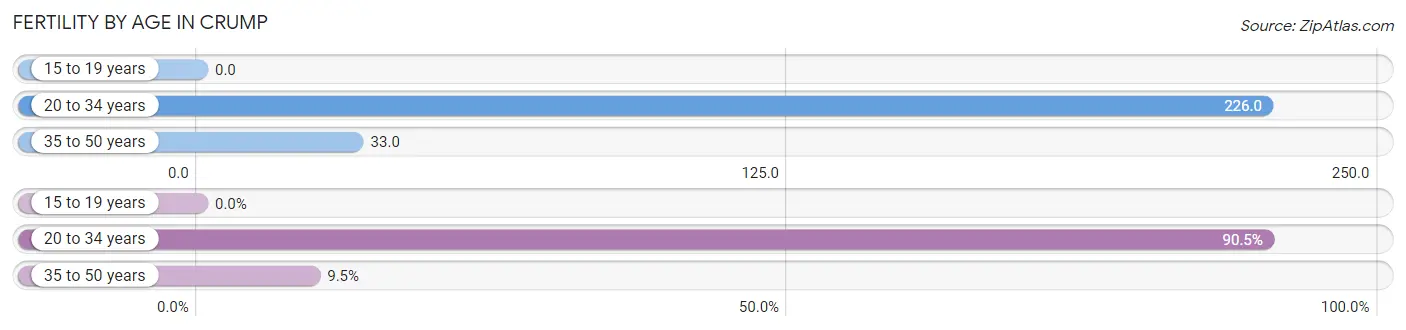
| Age Bracket | Women with Births | Births / 1,000 Women |
| 15 to 19 years | 0 (0.0%) | 0.0 |
| 20 to 34 years | 38 (90.5%) | 226.0 |
| 35 to 50 years | 4 (9.5%) | 33.0 |
| Total | 42 (100.0%) | 128.0 |
Fertility by Age by Marriage Status in Crump
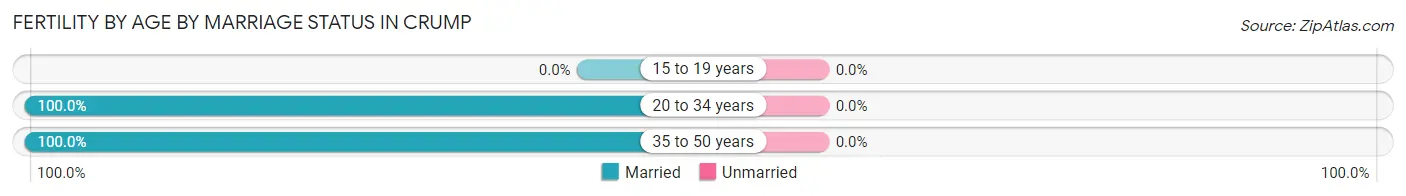
| Age Bracket | Married | Unmarried |
| 15 to 19 years | 0 (0.0%) | 0 (0.0%) |
| 20 to 34 years | 38 (100.0%) | 0 (0.0%) |
| 35 to 50 years | 4 (100.0%) | 0 (0.0%) |
| Total | 42 (100.0%) | 0 (0.0%) |
Fertility by Education in Crump
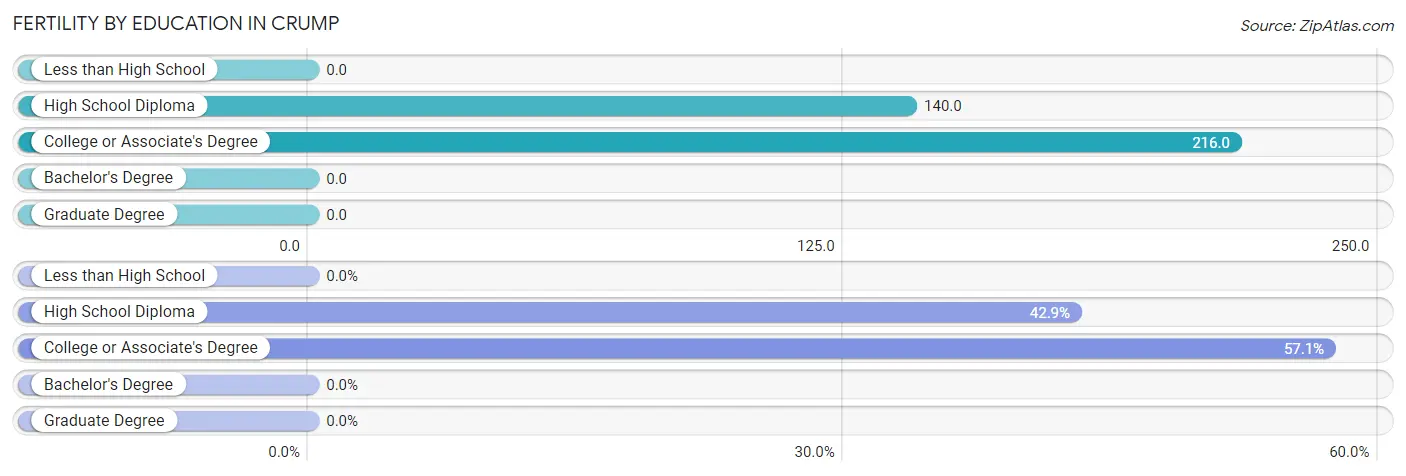
| Educational Attainment | Women with Births | Births / 1,000 Women |
| Less than High School | 0 (0.0%) | 0.0 |
| High School Diploma | 18 (42.9%) | 140.0 |
| College or Associate's Degree | 24 (57.1%) | 216.0 |
| Bachelor's Degree | 0 (0.0%) | 0.0 |
| Graduate Degree | 0 (0.0%) | 0.0 |
| Total | 42 (100.0%) | 128.0 |
Fertility by Education by Marriage Status in Crump
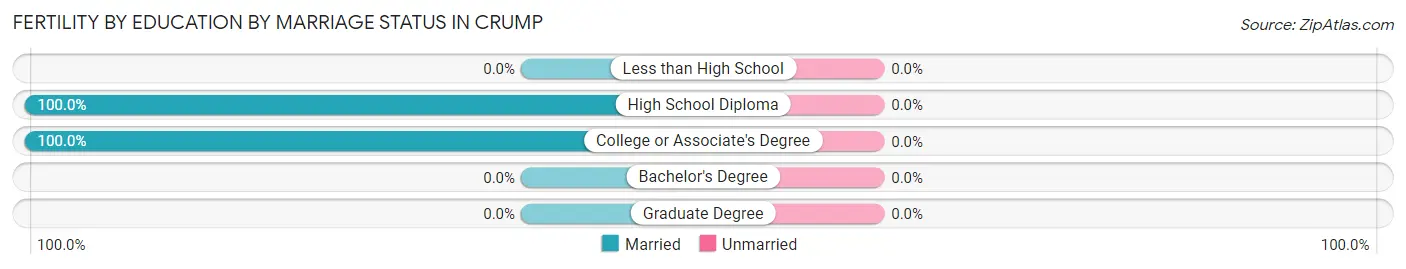
| Educational Attainment | Married | Unmarried |
| Less than High School | 0 (0.0%) | 0 (0.0%) |
| High School Diploma | 18 (100.0%) | 0 (0.0%) |
| College or Associate's Degree | 24 (100.0%) | 0 (0.0%) |
| Bachelor's Degree | 0 (0.0%) | 0 (0.0%) |
| Graduate Degree | 0 (0.0%) | 0 (0.0%) |
| Total | 42 (100.0%) | 0 (0.0%) |
Employment Characteristics in Crump
Employment by Class of Employer in Crump
Among the 792 employed individuals in Crump, private company employees (614 | 77.5%), local government employees (74 | 9.3%), and not-for-profit organizations (42 | 5.3%) make up the most common classes of employment.
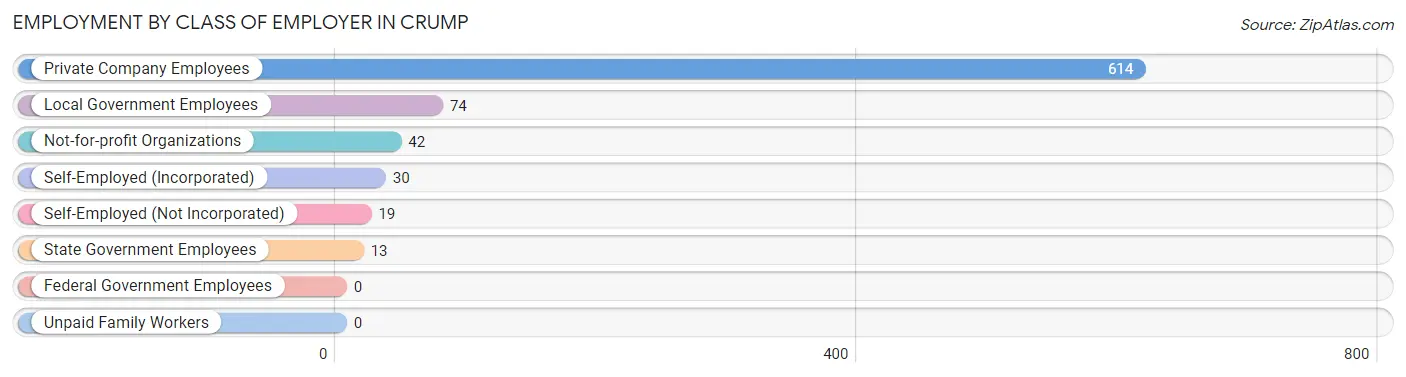
| Employer Class | # Employees | % Employees |
| Private Company Employees | 614 | 77.5% |
| Self-Employed (Incorporated) | 30 | 3.8% |
| Self-Employed (Not Incorporated) | 19 | 2.4% |
| Not-for-profit Organizations | 42 | 5.3% |
| Local Government Employees | 74 | 9.3% |
| State Government Employees | 13 | 1.6% |
| Federal Government Employees | 0 | 0.0% |
| Unpaid Family Workers | 0 | 0.0% |
| Total | 792 | 100.0% |
Employment Status by Age in Crump
According to the labor force statistics for Crump, out of the total population over 16 years of age (1,606), 50.6% or 813 individuals are in the labor force, with 0.7% or 6 of them unemployed. The age group with the highest labor force participation rate is 25 to 29 years, with 84.7% or 182 individuals in the labor force. Within the labor force, the 55 to 59 years age range has the highest percentage of unemployed individuals, with 7.0% or 6 of them being unemployed.
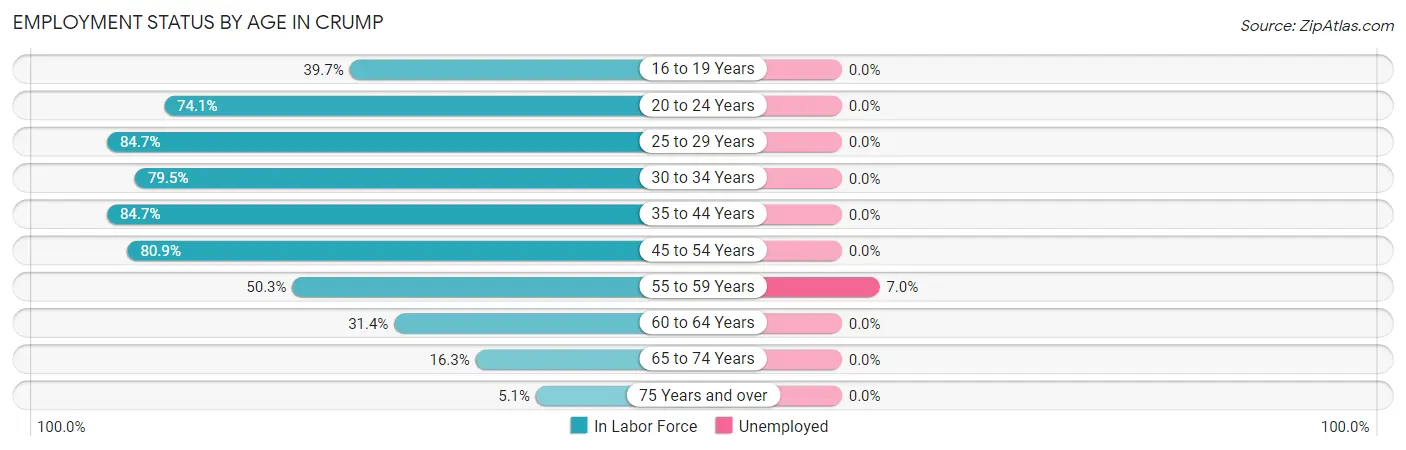
| Age Bracket | In Labor Force | Unemployed |
| 16 to 19 Years | 23 (39.7%) | 0 (0.0%) |
| 20 to 24 Years | 40 (74.1%) | 0 (0.0%) |
| 25 to 29 Years | 182 (84.7%) | 0 (0.0%) |
| 30 to 34 Years | 35 (79.5%) | 0 (0.0%) |
| 35 to 44 Years | 100 (84.7%) | 0 (0.0%) |
| 45 to 54 Years | 237 (80.9%) | 0 (0.0%) |
| 55 to 59 Years | 86 (50.3%) | 6 (7.0%) |
| 60 to 64 Years | 55 (31.4%) | 0 (0.0%) |
| 65 to 74 Years | 43 (16.3%) | 0 (0.0%) |
| 75 Years and over | 11 (5.1%) | 0 (0.0%) |
| Total | 813 (50.6%) | 6 (0.7%) |
Employment Status by Educational Attainment in Crump
According to labor force statistics for Crump, 68.4% of individuals (695) out of the total population between 25 and 64 years of age (1,016) are in the labor force, with 0.9% or 6 of them being unemployed. The group with the highest labor force participation rate are those with the educational attainment of bachelor's degree or higher, with 90.2% or 101 individuals in the labor force. Within the labor force, individuals with high school diploma education have the highest percentage of unemployment, with 2.0% or 6 of them being unemployed.
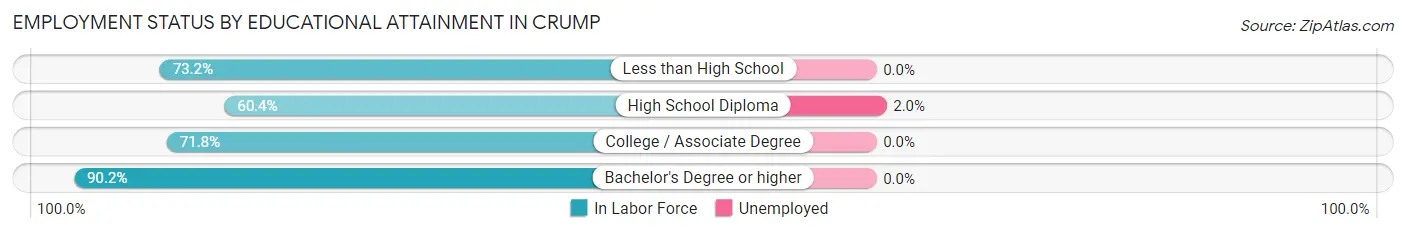
| Educational Attainment | In Labor Force | Unemployed |
| Less than High School | 104 (73.2%) | 0 (0.0%) |
| High School Diploma | 302 (60.4%) | 10 (2.0%) |
| College / Associate Degree | 188 (71.8%) | 0 (0.0%) |
| Bachelor's Degree or higher | 101 (90.2%) | 0 (0.0%) |
| Total | 695 (68.4%) | 9 (0.9%) |
Employment Occupations by Sex in Crump
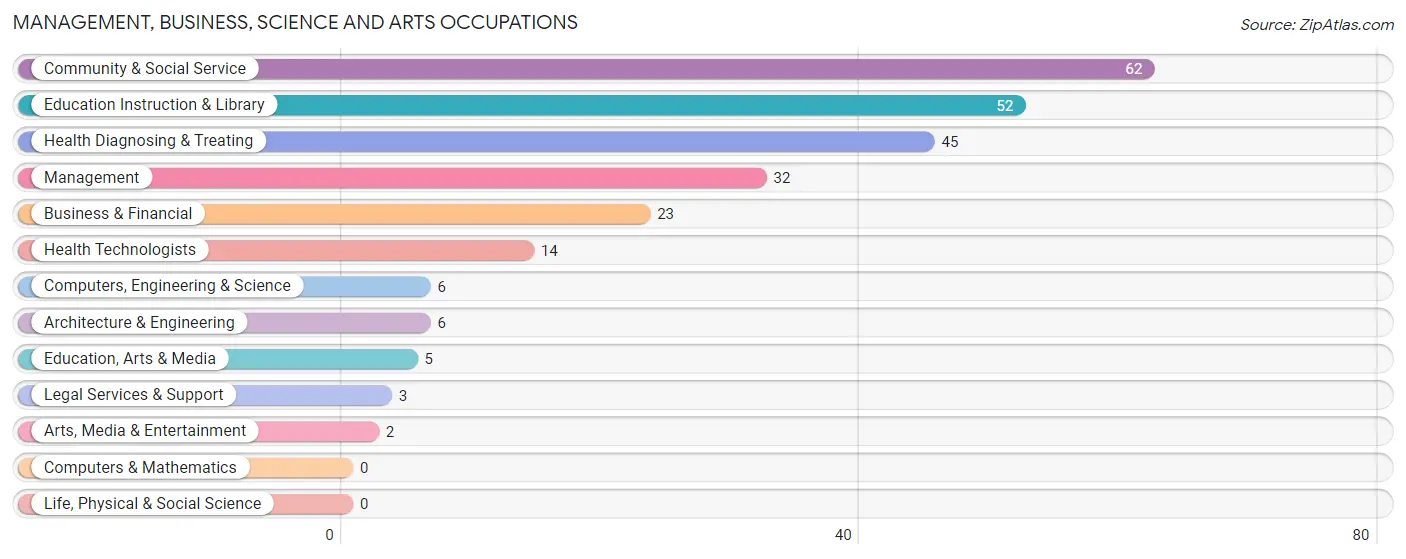
Management, Business, Science and Arts Occupations
The most common Management, Business, Science and Arts occupations in Crump are Community & Social Service (62 | 7.7%), Education Instruction & Library (52 | 6.5%), Health Diagnosing & Treating (45 | 5.6%), Management (32 | 4.0%), and Business & Financial (23 | 2.9%).
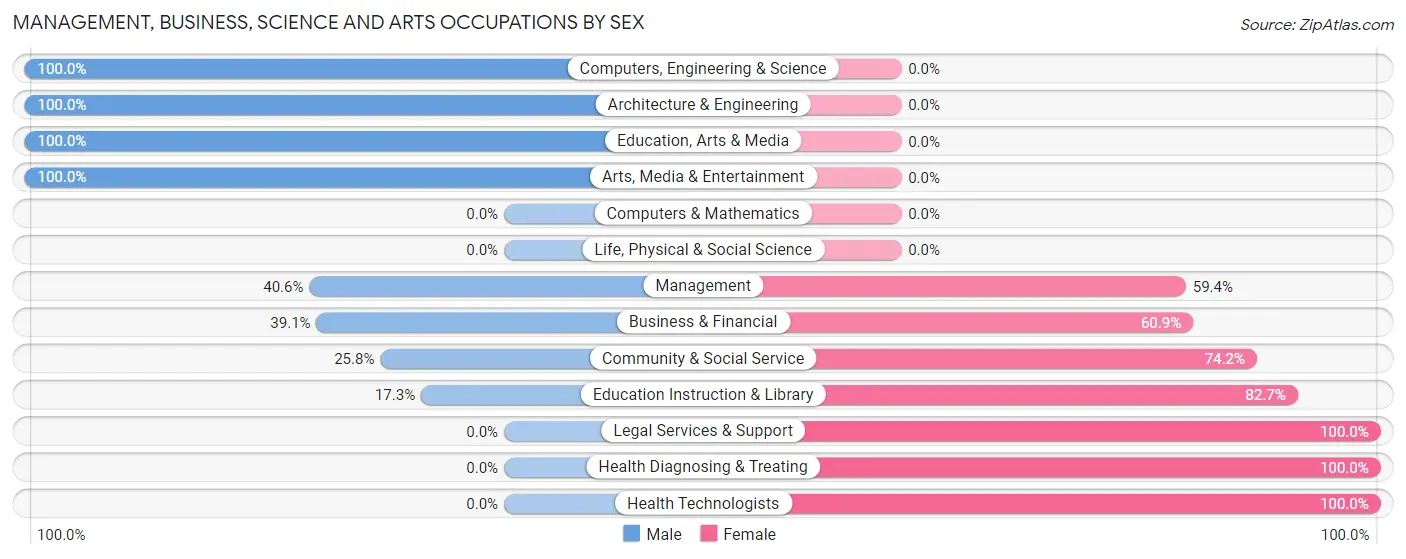
Management, Business, Science and Arts Occupations by Sex
Within the Management, Business, Science and Arts occupations in Crump, the most male-oriented occupations are Computers, Engineering & Science (100.0%), Architecture & Engineering (100.0%), and Education, Arts & Media (100.0%), while the most female-oriented occupations are Legal Services & Support (100.0%), Health Diagnosing & Treating (100.0%), and Health Technologists (100.0%).
| Occupation | Male | Female |
| Management | 13 (40.6%) | 19 (59.4%) |
| Business & Financial | 9 (39.1%) | 14 (60.9%) |
| Computers, Engineering & Science | 6 (100.0%) | 0 (0.0%) |
| Computers & Mathematics | 0 (0.0%) | 0 (0.0%) |
| Architecture & Engineering | 6 (100.0%) | 0 (0.0%) |
| Life, Physical & Social Science | 0 (0.0%) | 0 (0.0%) |
| Community & Social Service | 16 (25.8%) | 46 (74.2%) |
| Education, Arts & Media | 5 (100.0%) | 0 (0.0%) |
| Legal Services & Support | 0 (0.0%) | 3 (100.0%) |
| Education Instruction & Library | 9 (17.3%) | 43 (82.7%) |
| Arts, Media & Entertainment | 2 (100.0%) | 0 (0.0%) |
| Health Diagnosing & Treating | 0 (0.0%) | 45 (100.0%) |
| Health Technologists | 0 (0.0%) | 14 (100.0%) |
| Total (Category) | 44 (26.2%) | 124 (73.8%) |
| Total (Overall) | 396 (49.1%) | 410 (50.9%) |
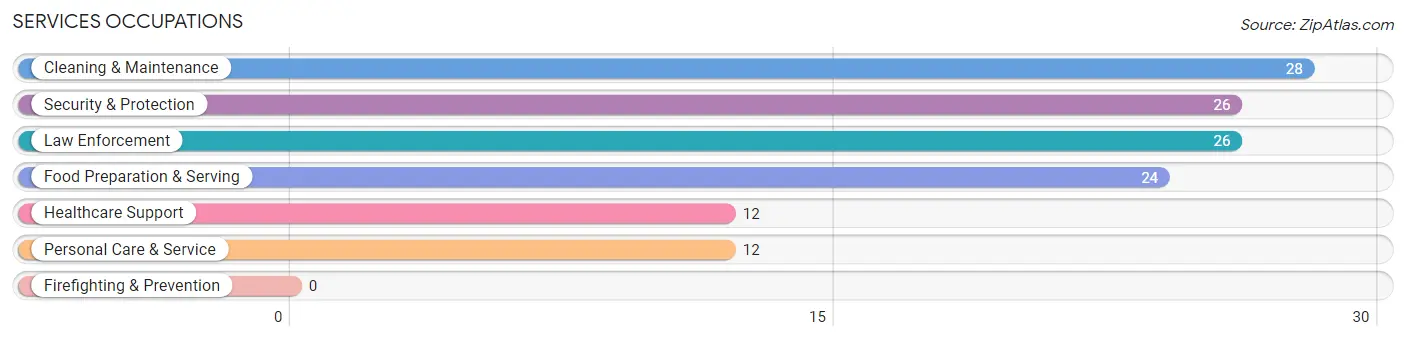
Services Occupations
The most common Services occupations in Crump are Cleaning & Maintenance (28 | 3.5%), Security & Protection (26 | 3.2%), Law Enforcement (26 | 3.2%), Food Preparation & Serving (24 | 3.0%), and Healthcare Support (12 | 1.5%).
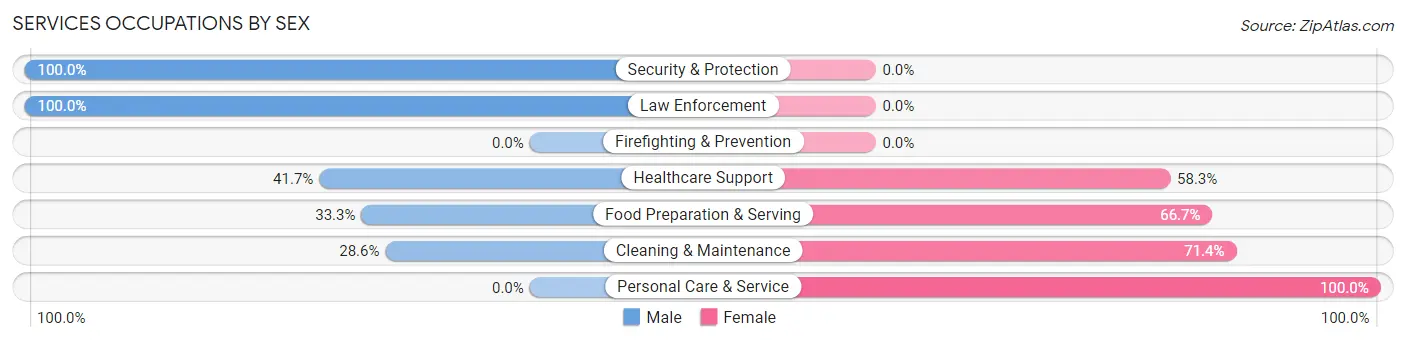
Services Occupations by Sex
Within the Services occupations in Crump, the most male-oriented occupations are Security & Protection (100.0%), Law Enforcement (100.0%), and Healthcare Support (41.7%), while the most female-oriented occupations are Personal Care & Service (100.0%), Cleaning & Maintenance (71.4%), and Food Preparation & Serving (66.7%).
| Occupation | Male | Female |
| Healthcare Support | 5 (41.7%) | 7 (58.3%) |
| Security & Protection | 26 (100.0%) | 0 (0.0%) |
| Firefighting & Prevention | 0 (0.0%) | 0 (0.0%) |
| Law Enforcement | 26 (100.0%) | 0 (0.0%) |
| Food Preparation & Serving | 8 (33.3%) | 16 (66.7%) |
| Cleaning & Maintenance | 8 (28.6%) | 20 (71.4%) |
| Personal Care & Service | 0 (0.0%) | 12 (100.0%) |
| Total (Category) | 47 (46.1%) | 55 (53.9%) |
| Total (Overall) | 396 (49.1%) | 410 (50.9%) |
Sales and Office Occupations
The most common Sales and Office occupations in Crump are Sales & Related (160 | 19.9%), and Office & Administration (80 | 9.9%).
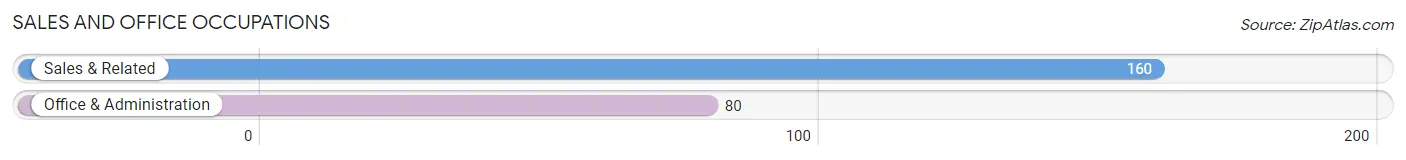
Sales and Office Occupations by Sex
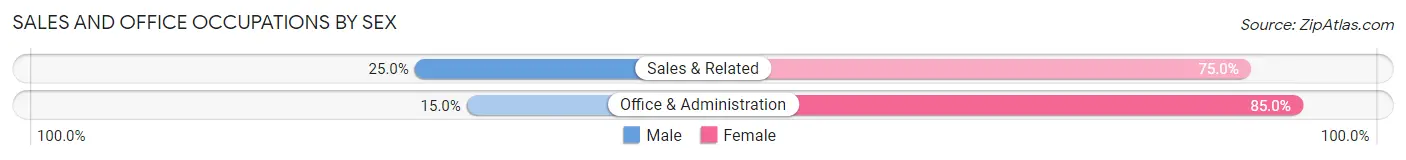
| Occupation | Male | Female |
| Sales & Related | 40 (25.0%) | 120 (75.0%) |
| Office & Administration | 12 (15.0%) | 68 (85.0%) |
| Total (Category) | 52 (21.7%) | 188 (78.3%) |
| Total (Overall) | 396 (49.1%) | 410 (50.9%) |
Natural Resources, Construction and Maintenance Occupations
The most common Natural Resources, Construction and Maintenance occupations in Crump are Construction & Extraction (57 | 7.1%), and Installation, Maintenance & Repair (29 | 3.6%).
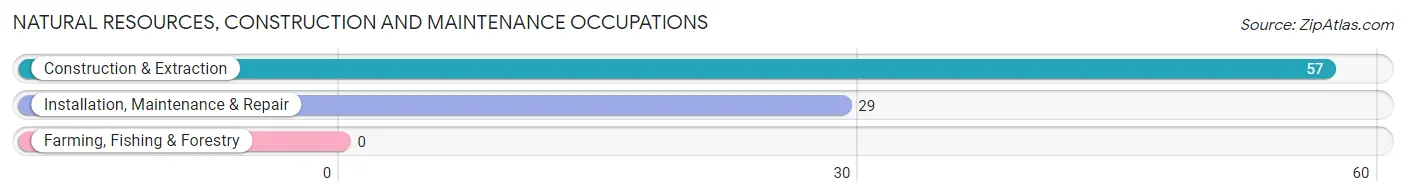
Natural Resources, Construction and Maintenance Occupations by Sex
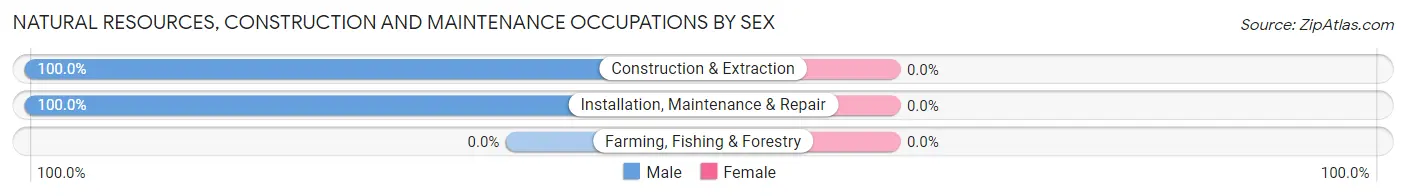
| Occupation | Male | Female |
| Farming, Fishing & Forestry | 0 (0.0%) | 0 (0.0%) |
| Construction & Extraction | 57 (100.0%) | 0 (0.0%) |
| Installation, Maintenance & Repair | 29 (100.0%) | 0 (0.0%) |
| Total (Category) | 86 (100.0%) | 0 (0.0%) |
| Total (Overall) | 396 (49.1%) | 410 (50.9%) |
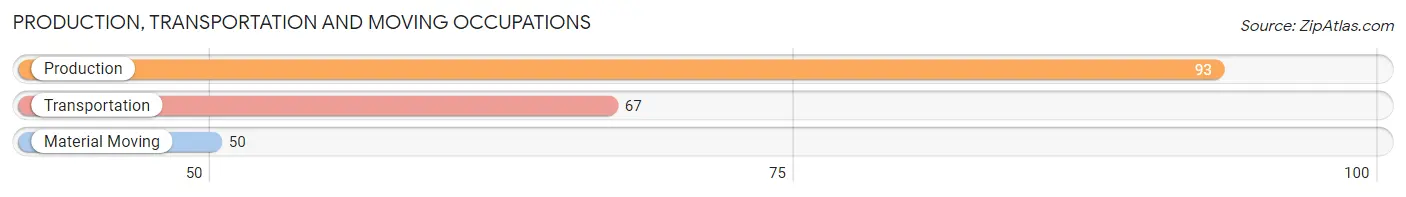
Production, Transportation and Moving Occupations
The most common Production, Transportation and Moving occupations in Crump are Production (93 | 11.5%), Transportation (67 | 8.3%), and Material Moving (50 | 6.2%).
Production, Transportation and Moving Occupations by Sex
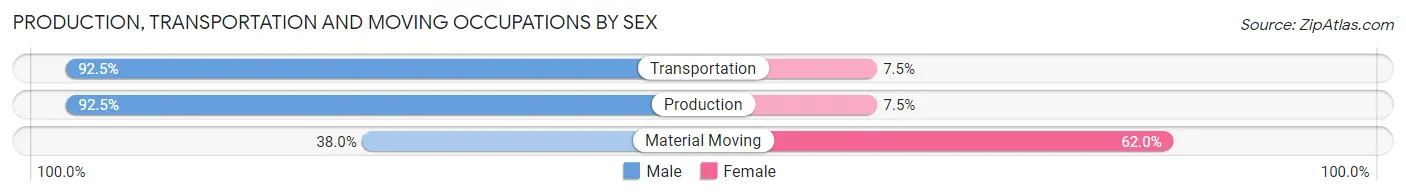
| Occupation | Male | Female |
| Production | 86 (92.5%) | 7 (7.5%) |
| Transportation | 62 (92.5%) | 5 (7.5%) |
| Material Moving | 19 (38.0%) | 31 (62.0%) |
| Total (Category) | 167 (79.5%) | 43 (20.5%) |
| Total (Overall) | 396 (49.1%) | 410 (50.9%) |
Employment Industries by Sex in Crump
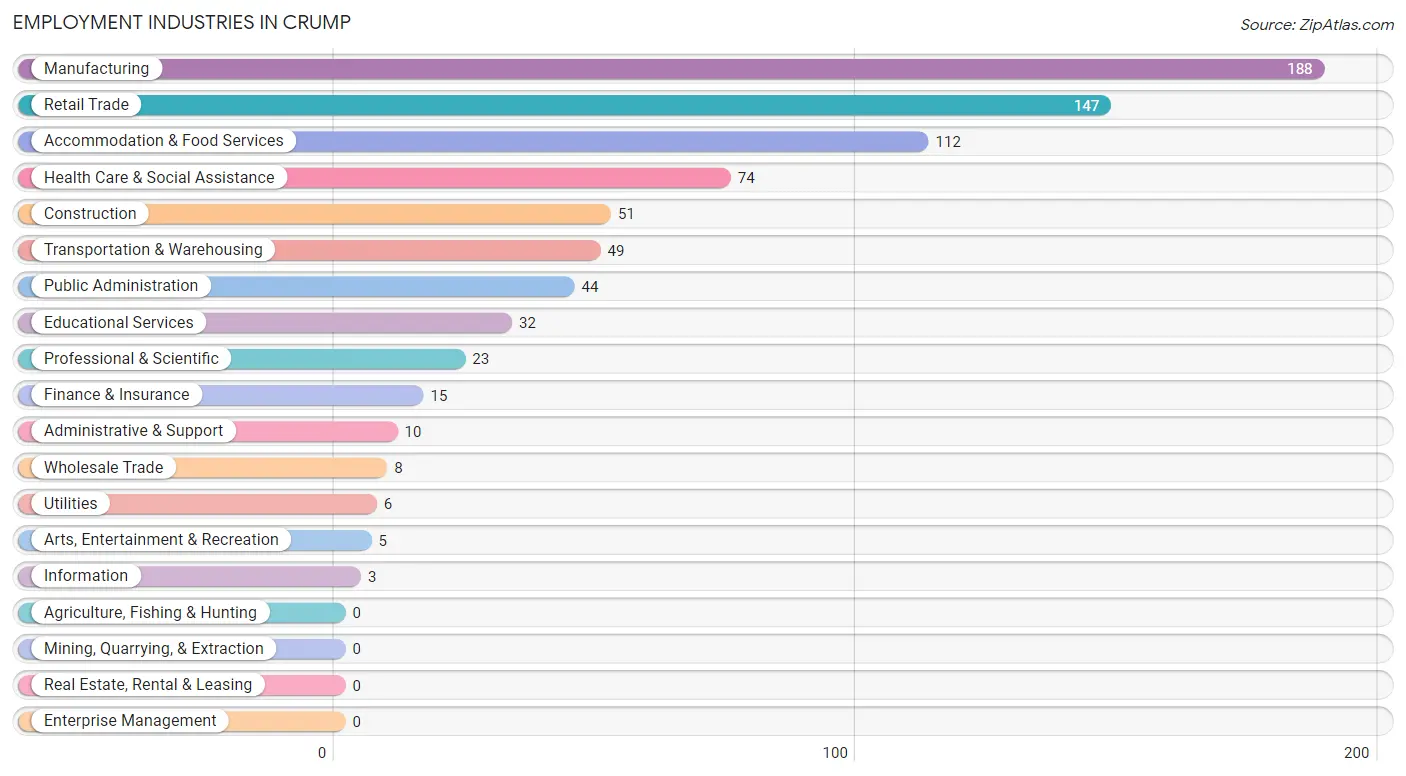
Employment Industries in Crump
The major employment industries in Crump include Manufacturing (188 | 23.3%), Retail Trade (147 | 18.2%), Accommodation & Food Services (112 | 13.9%), Health Care & Social Assistance (74 | 9.2%), and Construction (51 | 6.3%).
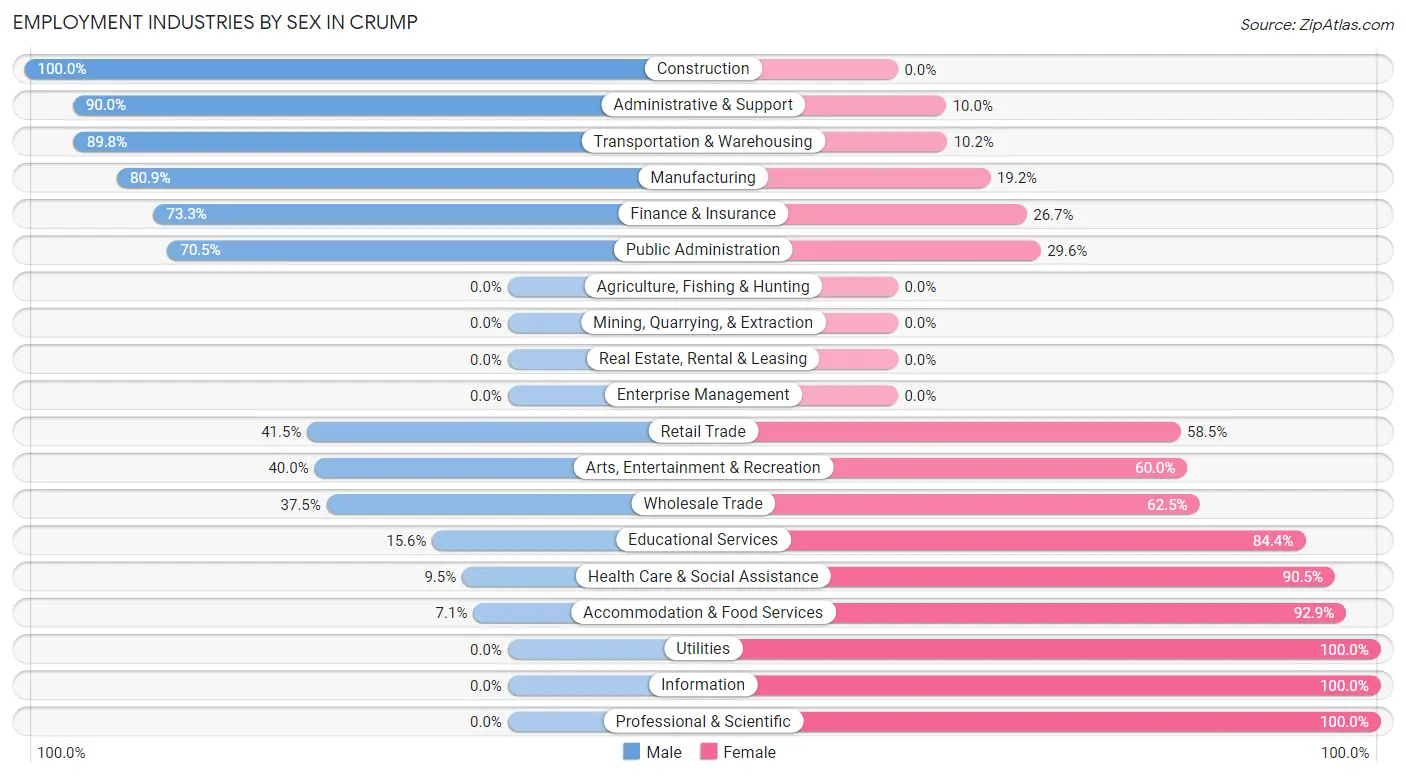
Employment Industries by Sex in Crump
The Crump industries that see more men than women are Construction (100.0%), Administrative & Support (90.0%), and Transportation & Warehousing (89.8%), whereas the industries that tend to have a higher number of women are Utilities (100.0%), Information (100.0%), and Professional & Scientific (100.0%).
| Industry | Male | Female |
| Agriculture, Fishing & Hunting | 0 (0.0%) | 0 (0.0%) |
| Mining, Quarrying, & Extraction | 0 (0.0%) | 0 (0.0%) |
| Construction | 51 (100.0%) | 0 (0.0%) |
| Manufacturing | 152 (80.8%) | 36 (19.2%) |
| Wholesale Trade | 3 (37.5%) | 5 (62.5%) |
| Retail Trade | 61 (41.5%) | 86 (58.5%) |
| Transportation & Warehousing | 44 (89.8%) | 5 (10.2%) |
| Utilities | 0 (0.0%) | 6 (100.0%) |
| Information | 0 (0.0%) | 3 (100.0%) |
| Finance & Insurance | 11 (73.3%) | 4 (26.7%) |
| Real Estate, Rental & Leasing | 0 (0.0%) | 0 (0.0%) |
| Professional & Scientific | 0 (0.0%) | 23 (100.0%) |
| Enterprise Management | 0 (0.0%) | 0 (0.0%) |
| Administrative & Support | 9 (90.0%) | 1 (10.0%) |
| Educational Services | 5 (15.6%) | 27 (84.4%) |
| Health Care & Social Assistance | 7 (9.5%) | 67 (90.5%) |
| Arts, Entertainment & Recreation | 2 (40.0%) | 3 (60.0%) |
| Accommodation & Food Services | 8 (7.1%) | 104 (92.9%) |
| Public Administration | 31 (70.5%) | 13 (29.5%) |
| Total | 396 (49.1%) | 410 (50.9%) |
Education in Crump
School Enrollment in Crump
The most common levels of schooling among the 387 students in Crump are middle school (152 | 39.3%), college / undergraduate (86 | 22.2%), and high school (65 | 16.8%).
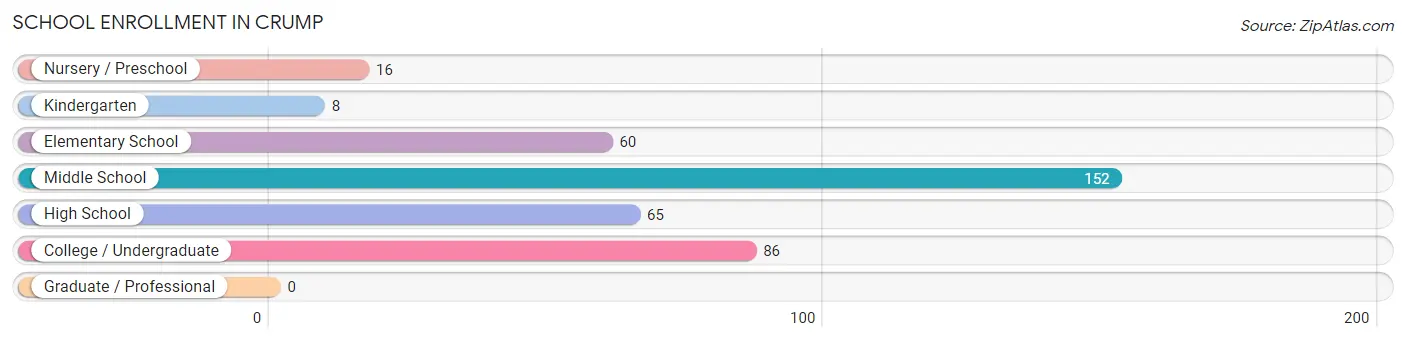
| School Level | # Students | % Students |
| Nursery / Preschool | 16 | 4.1% |
| Kindergarten | 8 | 2.1% |
| Elementary School | 60 | 15.5% |
| Middle School | 152 | 39.3% |
| High School | 65 | 16.8% |
| College / Undergraduate | 86 | 22.2% |
| Graduate / Professional | 0 | 0.0% |
| Total | 387 | 100.0% |
School Enrollment by Age by Funding Source in Crump
Out of a total of 387 students who are enrolled in schools in Crump, 170 (43.9%) attend a private institution, while the remaining 217 (56.1%) are enrolled in public schools. The age group of 3 to 4 year olds has the highest likelihood of being enrolled in private schools, with 7 (77.8% in the age bracket) enrolled. Conversely, the age group of 15 to 17 year olds has the lowest likelihood of being enrolled in a private school, with 56 (100.0% in the age bracket) attending a public institution.
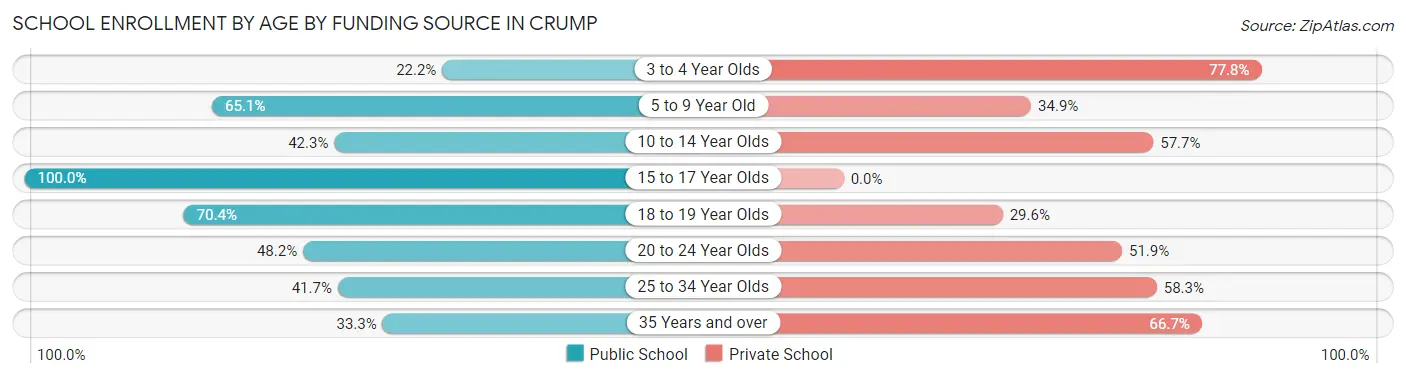
| Age Bracket | Public School | Private School |
| 3 to 4 Year Olds | 2 (22.2%) | 7 (77.8%) |
| 5 to 9 Year Old | 41 (65.1%) | 22 (34.9%) |
| 10 to 14 Year Olds | 69 (42.3%) | 94 (57.7%) |
| 15 to 17 Year Olds | 56 (100.0%) | 0 (0.0%) |
| 18 to 19 Year Olds | 19 (70.4%) | 8 (29.6%) |
| 20 to 24 Year Olds | 13 (48.1%) | 14 (51.8%) |
| 25 to 34 Year Olds | 15 (41.7%) | 21 (58.3%) |
| 35 Years and over | 2 (33.3%) | 4 (66.7%) |
| Total | 217 (56.1%) | 170 (43.9%) |
Educational Attainment by Field of Study in Crump
Education (52 | 31.7%), business (42 | 25.6%), science & technology (20 | 12.2%), communications (11 | 6.7%), and bio, nature & agricultural (9 | 5.5%) are the most common fields of study among 164 individuals in Crump who have obtained a bachelor's degree or higher.
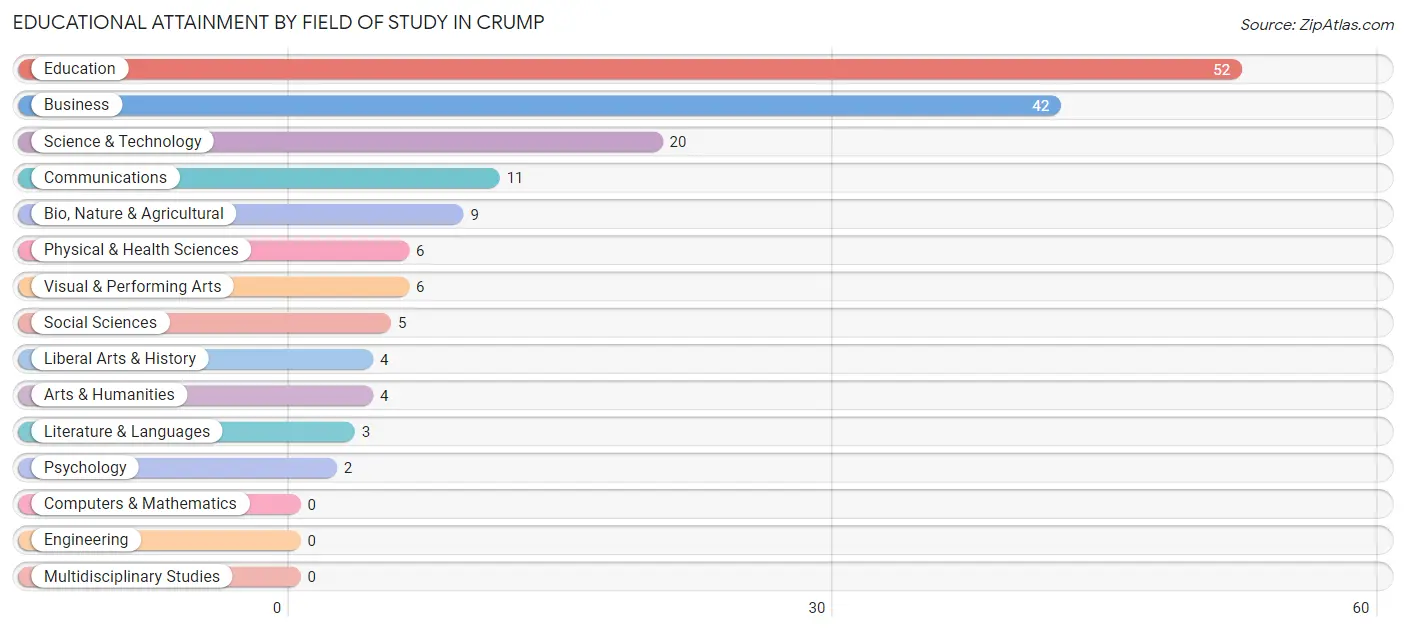
| Field of Study | # Graduates | % Graduates |
| Computers & Mathematics | 0 | 0.0% |
| Bio, Nature & Agricultural | 9 | 5.5% |
| Physical & Health Sciences | 6 | 3.7% |
| Psychology | 2 | 1.2% |
| Social Sciences | 5 | 3.0% |
| Engineering | 0 | 0.0% |
| Multidisciplinary Studies | 0 | 0.0% |
| Science & Technology | 20 | 12.2% |
| Business | 42 | 25.6% |
| Education | 52 | 31.7% |
| Literature & Languages | 3 | 1.8% |
| Liberal Arts & History | 4 | 2.4% |
| Visual & Performing Arts | 6 | 3.7% |
| Communications | 11 | 6.7% |
| Arts & Humanities | 4 | 2.4% |
| Total | 164 | 100.0% |
Transportation & Commute in Crump
Vehicle Availability by Sex in Crump
The most prevalent vehicle ownership categories in Crump are males with 2 vehicles (177, accounting for 44.7%) and females with 2 vehicles (220, making up 44.7%).
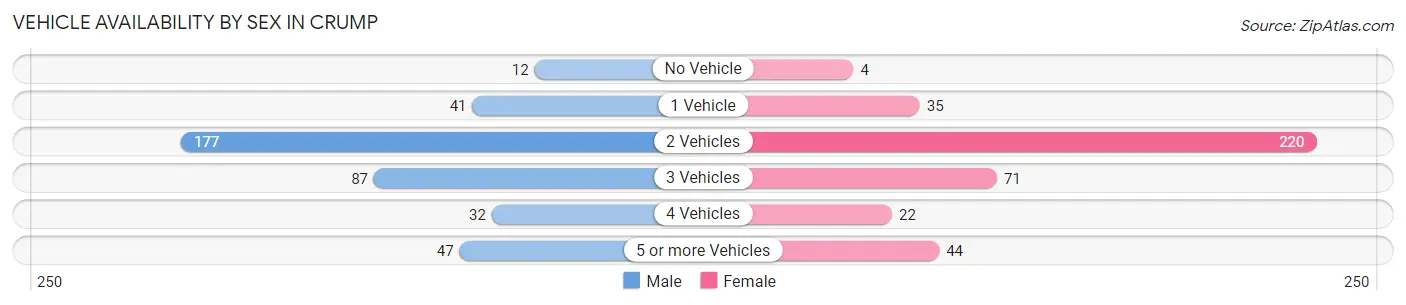
| Vehicles Available | Male | Female |
| No Vehicle | 12 (3.0%) | 4 (1.0%) |
| 1 Vehicle | 41 (10.3%) | 35 (8.8%) |
| 2 Vehicles | 177 (44.7%) | 220 (55.6%) |
| 3 Vehicles | 87 (22.0%) | 71 (17.9%) |
| 4 Vehicles | 32 (8.1%) | 22 (5.6%) |
| 5 or more Vehicles | 47 (11.9%) | 44 (11.1%) |
| Total | 396 (100.0%) | 396 (100.0%) |
Commute Time in Crump
The most frequently occuring commute durations in Crump are 10 to 14 minutes (183 commuters, 23.2%), 15 to 19 minutes (148 commuters, 18.8%), and 30 to 34 minutes (116 commuters, 14.7%).
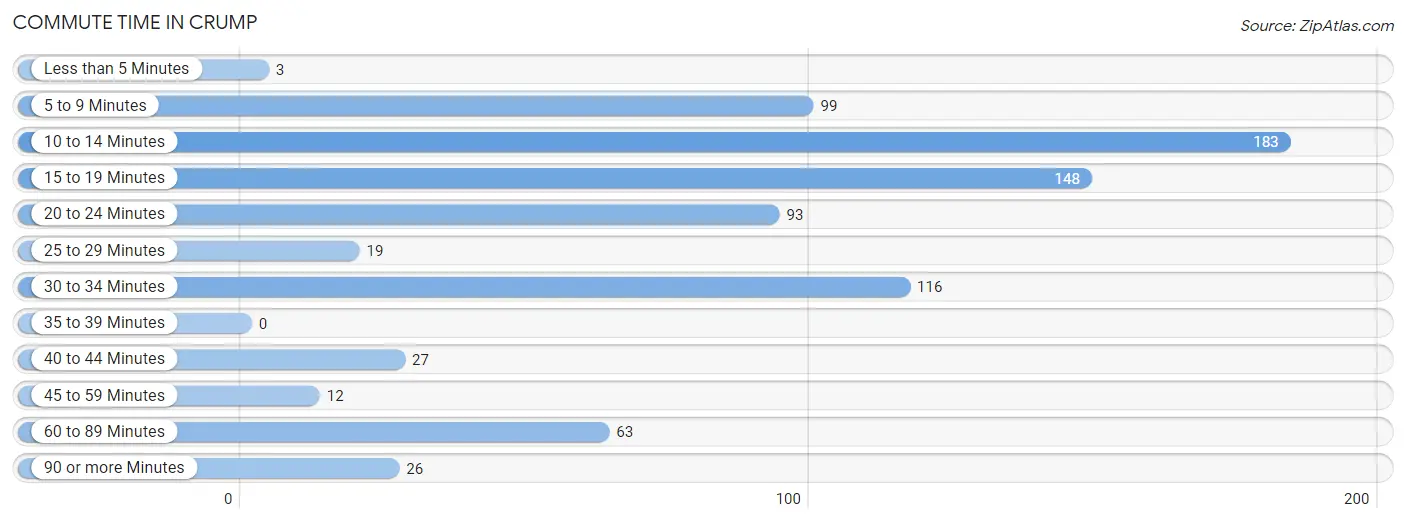
| Commute Time | # Commuters | % Commuters |
| Less than 5 Minutes | 3 | 0.4% |
| 5 to 9 Minutes | 99 | 12.6% |
| 10 to 14 Minutes | 183 | 23.2% |
| 15 to 19 Minutes | 148 | 18.8% |
| 20 to 24 Minutes | 93 | 11.8% |
| 25 to 29 Minutes | 19 | 2.4% |
| 30 to 34 Minutes | 116 | 14.7% |
| 35 to 39 Minutes | 0 | 0.0% |
| 40 to 44 Minutes | 27 | 3.4% |
| 45 to 59 Minutes | 12 | 1.5% |
| 60 to 89 Minutes | 63 | 8.0% |
| 90 or more Minutes | 26 | 3.3% |
Commute Time by Sex in Crump
The most common commute times in Crump are 30 to 34 minutes (72 commuters, 18.3%) for males and 10 to 14 minutes (134 commuters, 33.8%) for females.
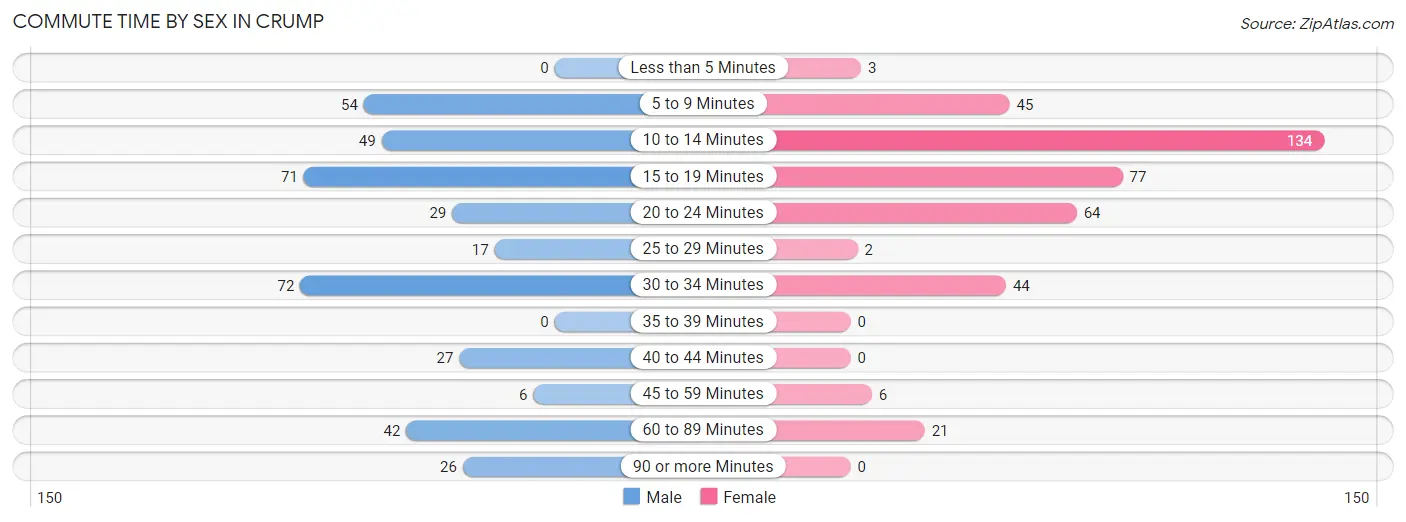
| Commute Time | Male | Female |
| Less than 5 Minutes | 0 (0.0%) | 3 (0.8%) |
| 5 to 9 Minutes | 54 (13.7%) | 45 (11.4%) |
| 10 to 14 Minutes | 49 (12.5%) | 134 (33.8%) |
| 15 to 19 Minutes | 71 (18.1%) | 77 (19.4%) |
| 20 to 24 Minutes | 29 (7.4%) | 64 (16.2%) |
| 25 to 29 Minutes | 17 (4.3%) | 2 (0.5%) |
| 30 to 34 Minutes | 72 (18.3%) | 44 (11.1%) |
| 35 to 39 Minutes | 0 (0.0%) | 0 (0.0%) |
| 40 to 44 Minutes | 27 (6.9%) | 0 (0.0%) |
| 45 to 59 Minutes | 6 (1.5%) | 6 (1.5%) |
| 60 to 89 Minutes | 42 (10.7%) | 21 (5.3%) |
| 90 or more Minutes | 26 (6.6%) | 0 (0.0%) |
Time of Departure to Work by Sex in Crump
The most frequent times of departure to work in Crump are 8:00 AM to 8:29 AM (87, 22.1%) for males and 7:00 AM to 7:29 AM (169, 42.7%) for females.
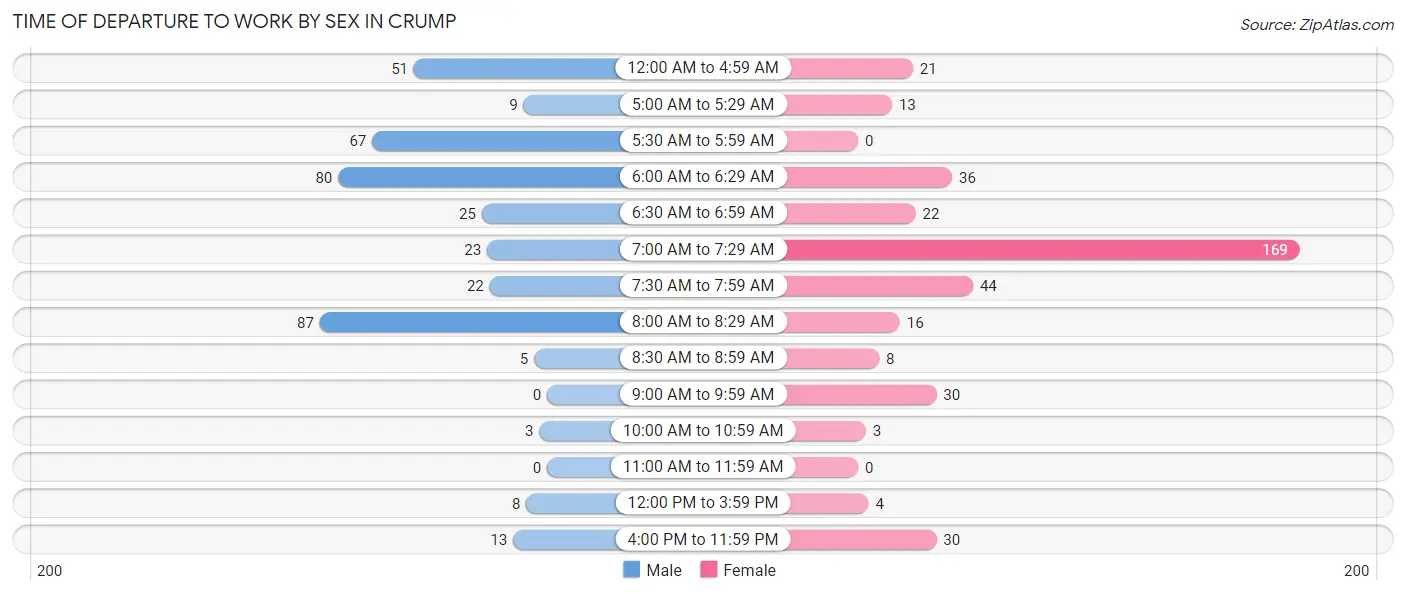
| Time of Departure | Male | Female |
| 12:00 AM to 4:59 AM | 51 (13.0%) | 21 (5.3%) |
| 5:00 AM to 5:29 AM | 9 (2.3%) | 13 (3.3%) |
| 5:30 AM to 5:59 AM | 67 (17.1%) | 0 (0.0%) |
| 6:00 AM to 6:29 AM | 80 (20.4%) | 36 (9.1%) |
| 6:30 AM to 6:59 AM | 25 (6.4%) | 22 (5.6%) |
| 7:00 AM to 7:29 AM | 23 (5.9%) | 169 (42.7%) |
| 7:30 AM to 7:59 AM | 22 (5.6%) | 44 (11.1%) |
| 8:00 AM to 8:29 AM | 87 (22.1%) | 16 (4.0%) |
| 8:30 AM to 8:59 AM | 5 (1.3%) | 8 (2.0%) |
| 9:00 AM to 9:59 AM | 0 (0.0%) | 30 (7.6%) |
| 10:00 AM to 10:59 AM | 3 (0.8%) | 3 (0.8%) |
| 11:00 AM to 11:59 AM | 0 (0.0%) | 0 (0.0%) |
| 12:00 PM to 3:59 PM | 8 (2.0%) | 4 (1.0%) |
| 4:00 PM to 11:59 PM | 13 (3.3%) | 30 (7.6%) |
| Total | 393 (100.0%) | 396 (100.0%) |
Housing Occupancy in Crump
Occupancy by Ownership in Crump
Of the total 818 dwellings in Crump, owner-occupied units account for 722 (88.3%), while renter-occupied units make up 96 (11.7%).
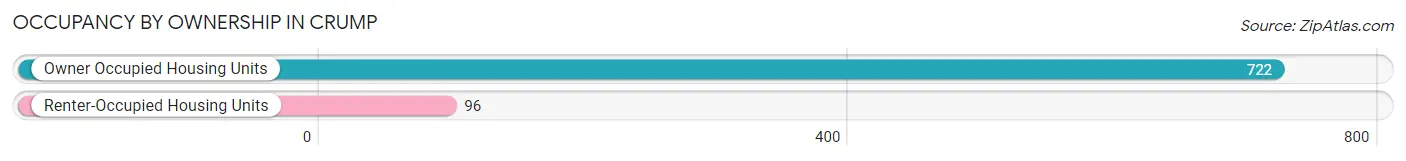
| Occupancy | # Housing Units | % Housing Units |
| Owner Occupied Housing Units | 722 | 88.3% |
| Renter-Occupied Housing Units | 96 | 11.7% |
| Total Occupied Housing Units | 818 | 100.0% |
Occupancy by Household Size in Crump
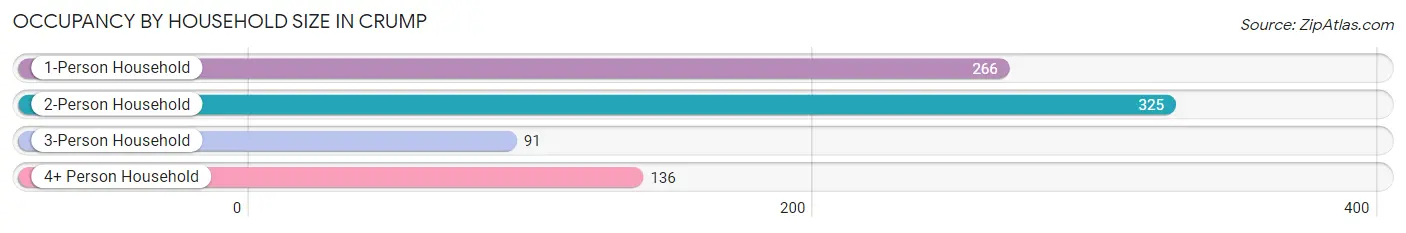
| Household Size | # Housing Units | % Housing Units |
| 1-Person Household | 266 | 32.5% |
| 2-Person Household | 325 | 39.7% |
| 3-Person Household | 91 | 11.1% |
| 4+ Person Household | 136 | 16.6% |
| Total Housing Units | 818 | 100.0% |
Occupancy by Ownership by Household Size in Crump
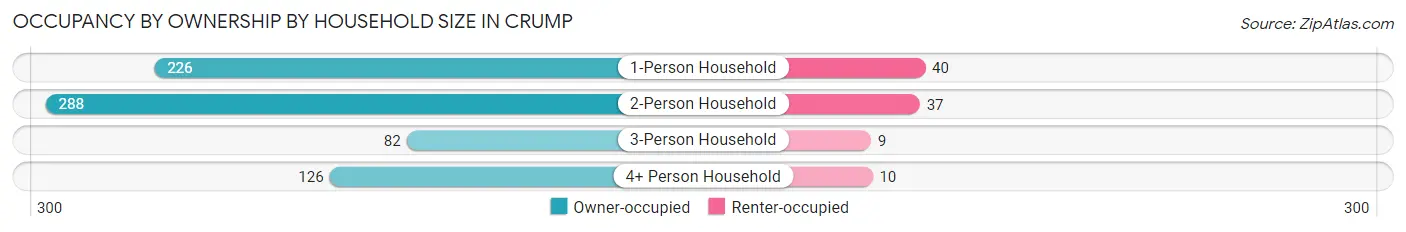
| Household Size | Owner-occupied | Renter-occupied |
| 1-Person Household | 226 (85.0%) | 40 (15.0%) |
| 2-Person Household | 288 (88.6%) | 37 (11.4%) |
| 3-Person Household | 82 (90.1%) | 9 (9.9%) |
| 4+ Person Household | 126 (92.6%) | 10 (7.3%) |
| Total Housing Units | 722 (88.3%) | 96 (11.7%) |
Occupancy by Educational Attainment in Crump
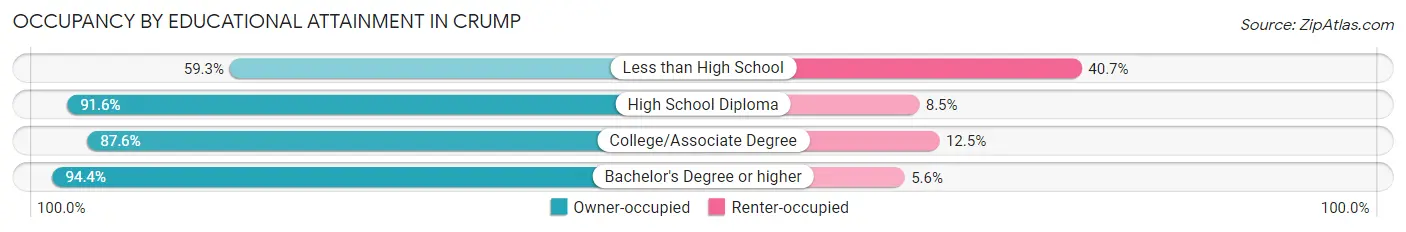
| Household Size | Owner-occupied | Renter-occupied |
| Less than High School | 35 (59.3%) | 24 (40.7%) |
| High School Diploma | 401 (91.5%) | 37 (8.5%) |
| College/Associate Degree | 218 (87.5%) | 31 (12.4%) |
| Bachelor's Degree or higher | 68 (94.4%) | 4 (5.6%) |
Occupancy by Age of Householder in Crump
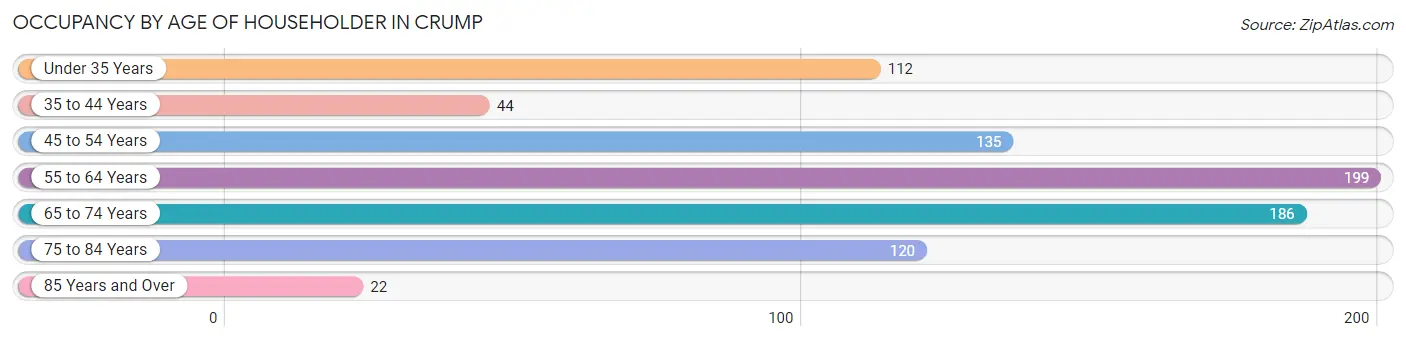
| Age Bracket | # Households | % Households |
| Under 35 Years | 112 | 13.7% |
| 35 to 44 Years | 44 | 5.4% |
| 45 to 54 Years | 135 | 16.5% |
| 55 to 64 Years | 199 | 24.3% |
| 65 to 74 Years | 186 | 22.7% |
| 75 to 84 Years | 120 | 14.7% |
| 85 Years and Over | 22 | 2.7% |
| Total | 818 | 100.0% |
Housing Finances in Crump
Median Income by Occupancy in Crump
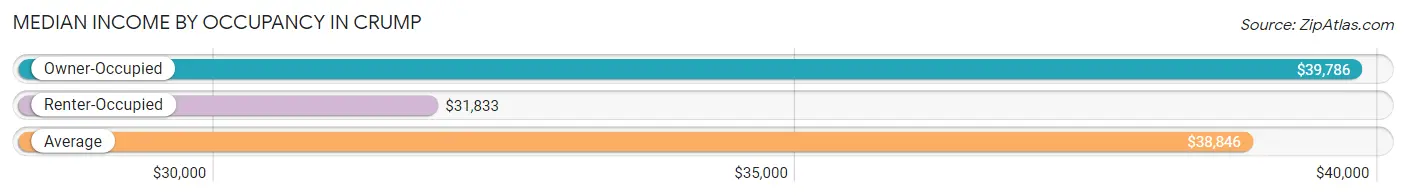
| Occupancy Type | # Households | Median Income |
| Owner-Occupied | 722 (88.3%) | $39,786 |
| Renter-Occupied | 96 (11.7%) | $31,833 |
| Average | 818 (100.0%) | $38,846 |
Occupancy by Householder Income Bracket in Crump
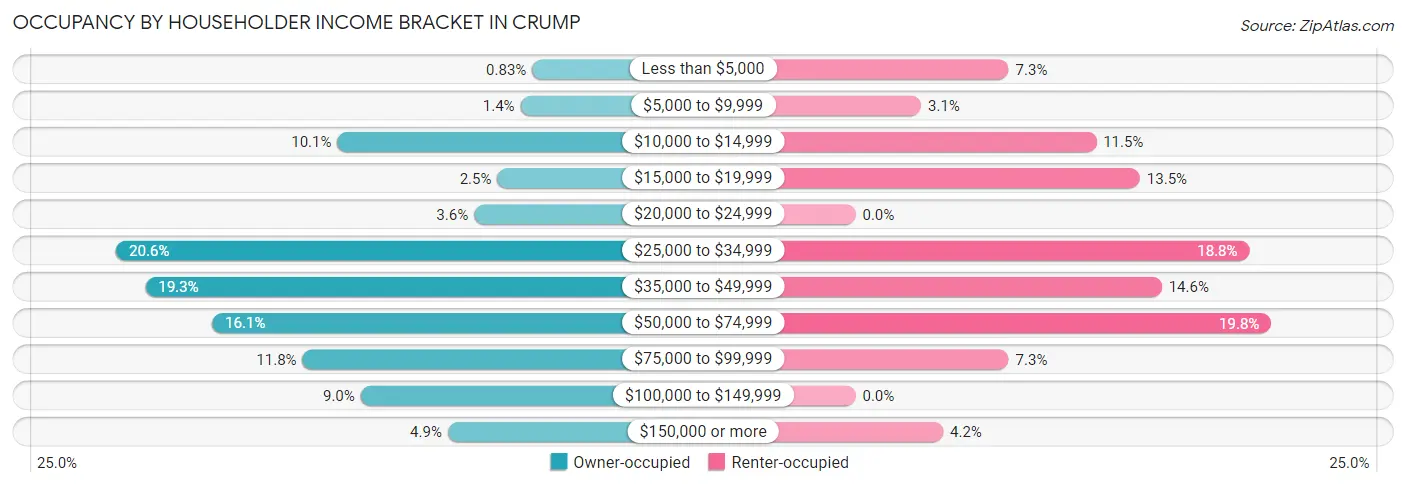
| Income Bracket | Owner-occupied | Renter-occupied |
| Less than $5,000 | 6 (0.8%) | 7 (7.3%) |
| $5,000 to $9,999 | 10 (1.4%) | 3 (3.1%) |
| $10,000 to $14,999 | 73 (10.1%) | 11 (11.5%) |
| $15,000 to $19,999 | 18 (2.5%) | 13 (13.5%) |
| $20,000 to $24,999 | 26 (3.6%) | 0 (0.0%) |
| $25,000 to $34,999 | 149 (20.6%) | 18 (18.8%) |
| $35,000 to $49,999 | 139 (19.3%) | 14 (14.6%) |
| $50,000 to $74,999 | 116 (16.1%) | 19 (19.8%) |
| $75,000 to $99,999 | 85 (11.8%) | 7 (7.3%) |
| $100,000 to $149,999 | 65 (9.0%) | 0 (0.0%) |
| $150,000 or more | 35 (4.9%) | 4 (4.2%) |
| Total | 722 (100.0%) | 96 (100.0%) |
Monthly Housing Cost Tiers in Crump
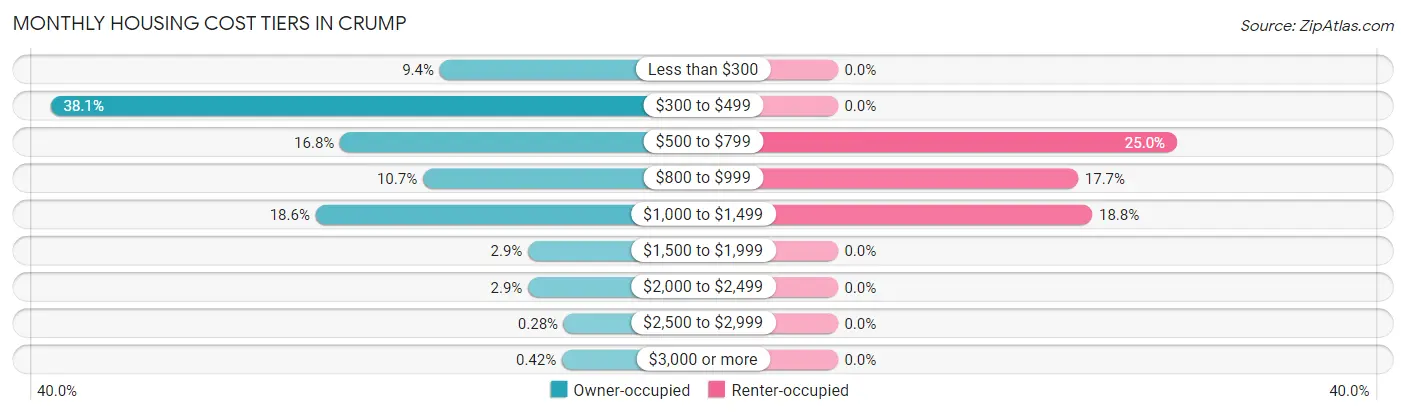
| Monthly Cost | Owner-occupied | Renter-occupied |
| Less than $300 | 68 (9.4%) | 0 (0.0%) |
| $300 to $499 | 275 (38.1%) | 0 (0.0%) |
| $500 to $799 | 121 (16.8%) | 24 (25.0%) |
| $800 to $999 | 77 (10.7%) | 17 (17.7%) |
| $1,000 to $1,499 | 134 (18.6%) | 18 (18.8%) |
| $1,500 to $1,999 | 21 (2.9%) | 0 (0.0%) |
| $2,000 to $2,499 | 21 (2.9%) | 0 (0.0%) |
| $2,500 to $2,999 | 2 (0.3%) | 0 (0.0%) |
| $3,000 or more | 3 (0.4%) | 0 (0.0%) |
| Total | 722 (100.0%) | 96 (100.0%) |
Physical Housing Characteristics in Crump
Housing Structures in Crump
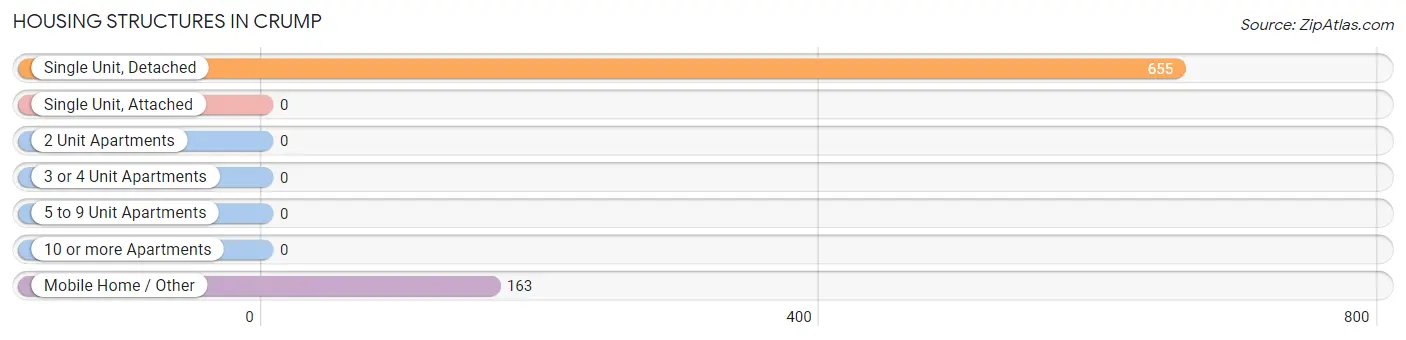
| Structure Type | # Housing Units | % Housing Units |
| Single Unit, Detached | 655 | 80.1% |
| Single Unit, Attached | 0 | 0.0% |
| 2 Unit Apartments | 0 | 0.0% |
| 3 or 4 Unit Apartments | 0 | 0.0% |
| 5 to 9 Unit Apartments | 0 | 0.0% |
| 10 or more Apartments | 0 | 0.0% |
| Mobile Home / Other | 163 | 19.9% |
| Total | 818 | 100.0% |
Housing Structures by Occupancy in Crump
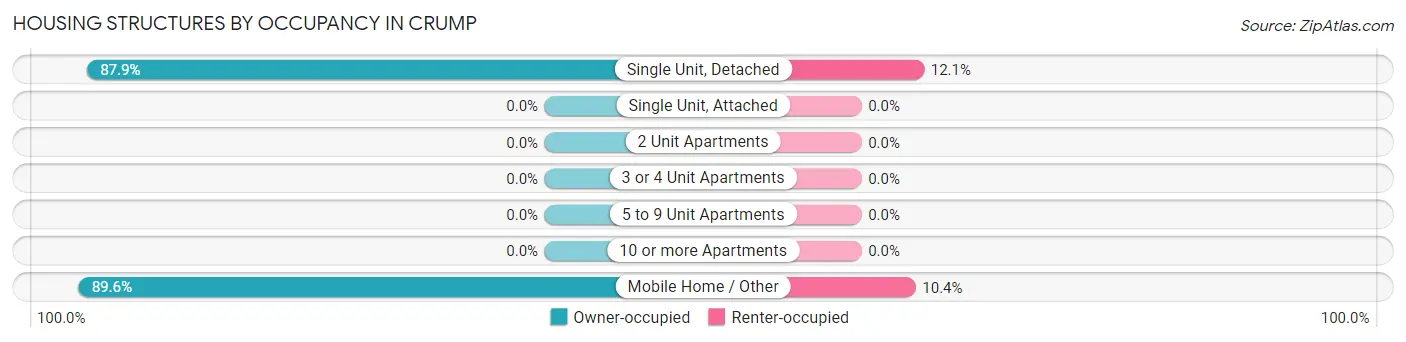
| Structure Type | Owner-occupied | Renter-occupied |
| Single Unit, Detached | 576 (87.9%) | 79 (12.1%) |
| Single Unit, Attached | 0 (0.0%) | 0 (0.0%) |
| 2 Unit Apartments | 0 (0.0%) | 0 (0.0%) |
| 3 or 4 Unit Apartments | 0 (0.0%) | 0 (0.0%) |
| 5 to 9 Unit Apartments | 0 (0.0%) | 0 (0.0%) |
| 10 or more Apartments | 0 (0.0%) | 0 (0.0%) |
| Mobile Home / Other | 146 (89.6%) | 17 (10.4%) |
| Total | 722 (88.3%) | 96 (11.7%) |
Housing Structures by Number of Rooms in Crump
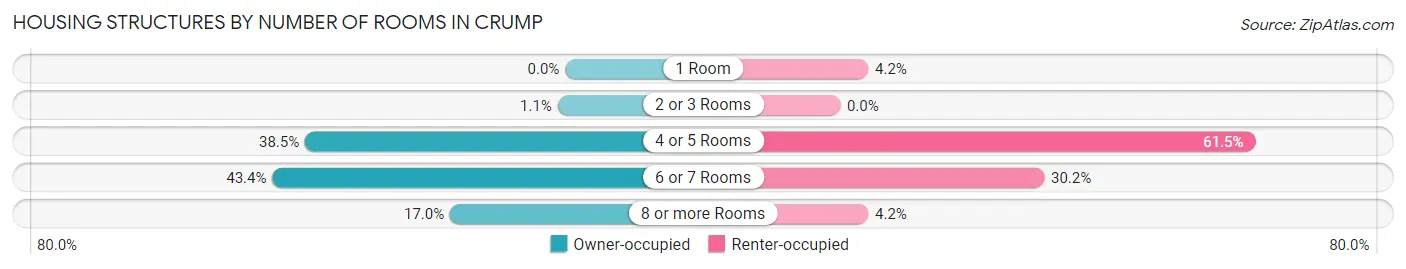
| Number of Rooms | Owner-occupied | Renter-occupied |
| 1 Room | 0 (0.0%) | 4 (4.2%) |
| 2 or 3 Rooms | 8 (1.1%) | 0 (0.0%) |
| 4 or 5 Rooms | 278 (38.5%) | 59 (61.5%) |
| 6 or 7 Rooms | 313 (43.3%) | 29 (30.2%) |
| 8 or more Rooms | 123 (17.0%) | 4 (4.2%) |
| Total | 722 (100.0%) | 96 (100.0%) |
Housing Structure by Heating Type in Crump
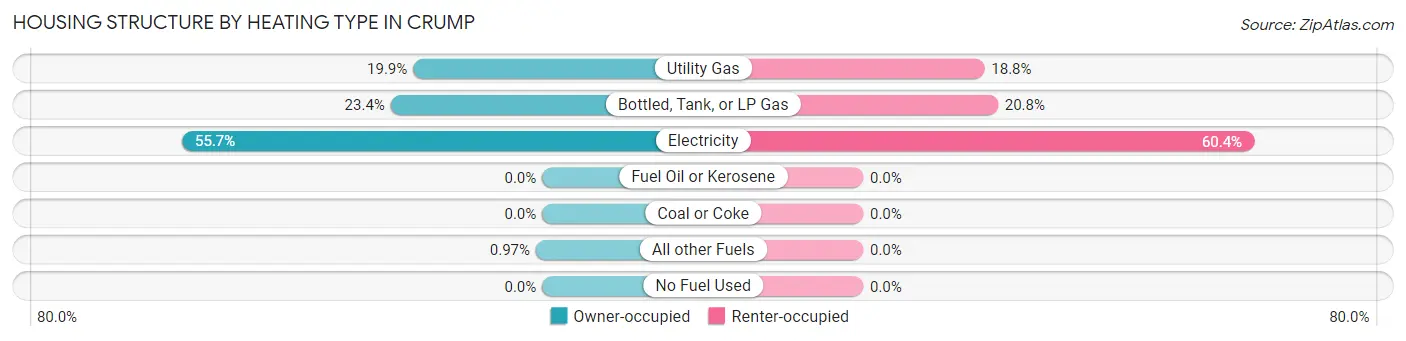
| Heating Type | Owner-occupied | Renter-occupied |
| Utility Gas | 144 (19.9%) | 18 (18.8%) |
| Bottled, Tank, or LP Gas | 169 (23.4%) | 20 (20.8%) |
| Electricity | 402 (55.7%) | 58 (60.4%) |
| Fuel Oil or Kerosene | 0 (0.0%) | 0 (0.0%) |
| Coal or Coke | 0 (0.0%) | 0 (0.0%) |
| All other Fuels | 7 (1.0%) | 0 (0.0%) |
| No Fuel Used | 0 (0.0%) | 0 (0.0%) |
| Total | 722 (100.0%) | 96 (100.0%) |
Household Vehicle Usage in Crump
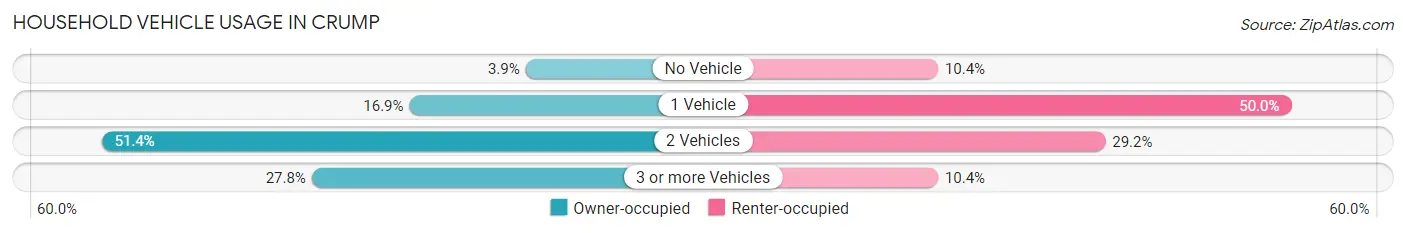
| Vehicles per Household | Owner-occupied | Renter-occupied |
| No Vehicle | 28 (3.9%) | 10 (10.4%) |
| 1 Vehicle | 122 (16.9%) | 48 (50.0%) |
| 2 Vehicles | 371 (51.4%) | 28 (29.2%) |
| 3 or more Vehicles | 201 (27.8%) | 10 (10.4%) |
| Total | 722 (100.0%) | 96 (100.0%) |
Real Estate & Mortgages in Crump
Real Estate and Mortgage Overview in Crump
| Characteristic | Without Mortgage | With Mortgage |
| Housing Units | 429 | 293 |
| Median Property Value | $94,400 | $179,100 |
| Median Household Income | $34,940 | $24 |
| Monthly Housing Costs | $347 | $3 |
| Real Estate Taxes | $418 | $25 |
Property Value by Mortgage Status in Crump
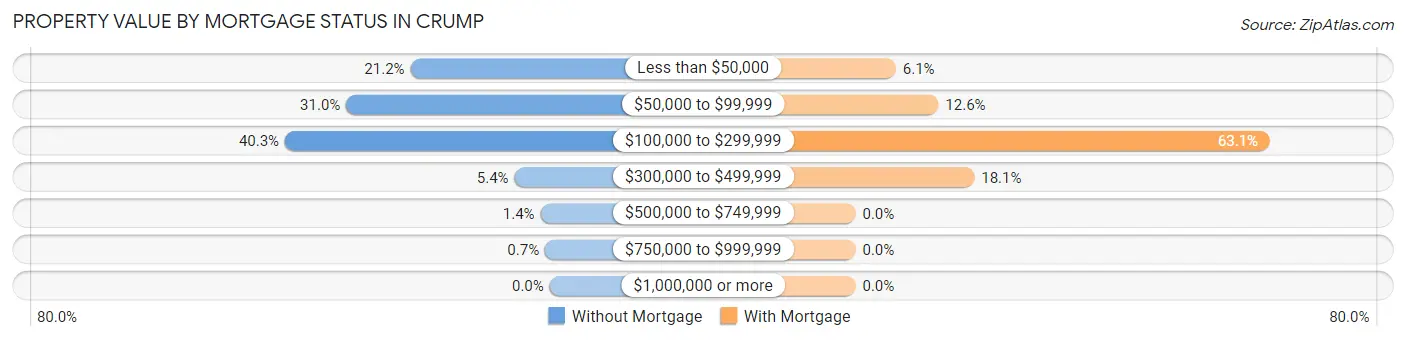
| Property Value | Without Mortgage | With Mortgage |
| Less than $50,000 | 91 (21.2%) | 18 (6.1%) |
| $50,000 to $99,999 | 133 (31.0%) | 37 (12.6%) |
| $100,000 to $299,999 | 173 (40.3%) | 185 (63.1%) |
| $300,000 to $499,999 | 23 (5.4%) | 53 (18.1%) |
| $500,000 to $749,999 | 6 (1.4%) | 0 (0.0%) |
| $750,000 to $999,999 | 3 (0.7%) | 0 (0.0%) |
| $1,000,000 or more | 0 (0.0%) | 0 (0.0%) |
| Total | 429 (100.0%) | 293 (100.0%) |
Household Income by Mortgage Status in Crump
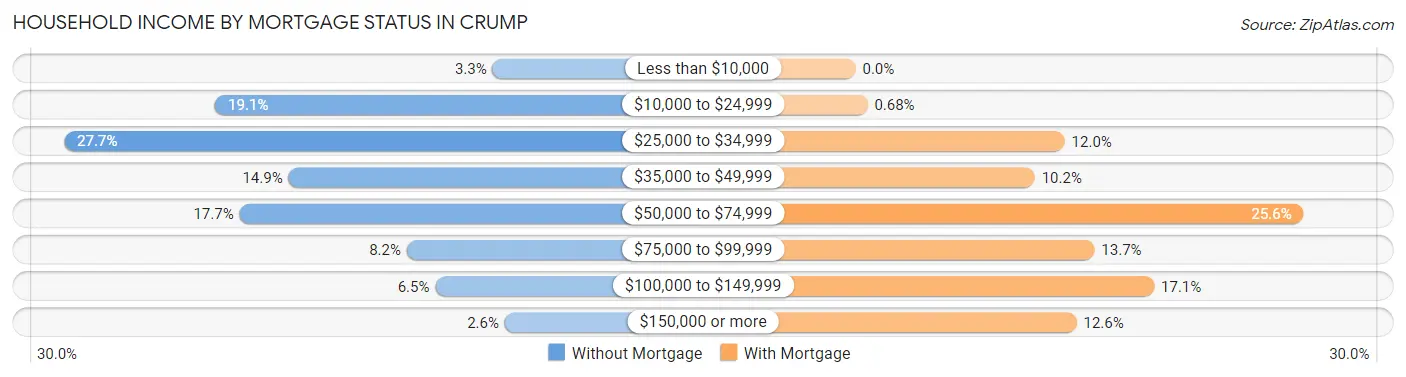
| Household Income | Without Mortgage | With Mortgage |
| Less than $10,000 | 14 (3.3%) | 0 (0.0%) |
| $10,000 to $24,999 | 82 (19.1%) | 2 (0.7%) |
| $25,000 to $34,999 | 119 (27.7%) | 35 (11.9%) |
| $35,000 to $49,999 | 64 (14.9%) | 30 (10.2%) |
| $50,000 to $74,999 | 76 (17.7%) | 75 (25.6%) |
| $75,000 to $99,999 | 35 (8.2%) | 40 (13.7%) |
| $100,000 to $149,999 | 28 (6.5%) | 50 (17.1%) |
| $150,000 or more | 11 (2.6%) | 37 (12.6%) |
| Total | 429 (100.0%) | 293 (100.0%) |
Property Value to Household Income Ratio in Crump
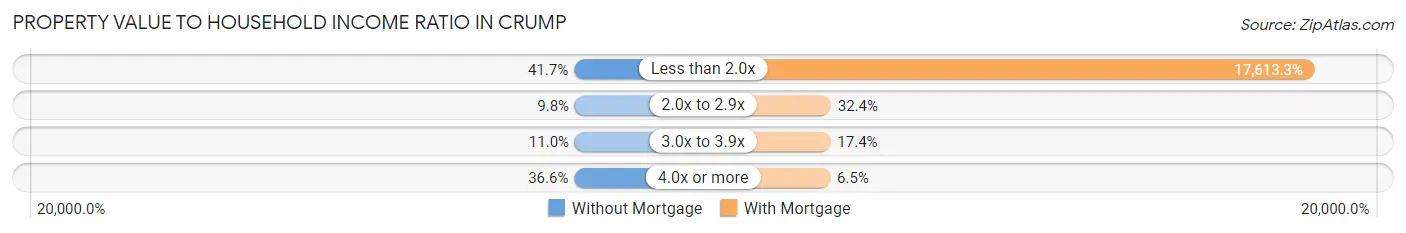
| Value-to-Income Ratio | Without Mortgage | With Mortgage |
| Less than 2.0x | 179 (41.7%) | 51,607 (17,613.3%) |
| 2.0x to 2.9x | 42 (9.8%) | 95 (32.4%) |
| 3.0x to 3.9x | 47 (11.0%) | 51 (17.4%) |
| 4.0x or more | 157 (36.6%) | 19 (6.5%) |
| Total | 429 (100.0%) | 293 (100.0%) |
Real Estate Taxes by Mortgage Status in Crump
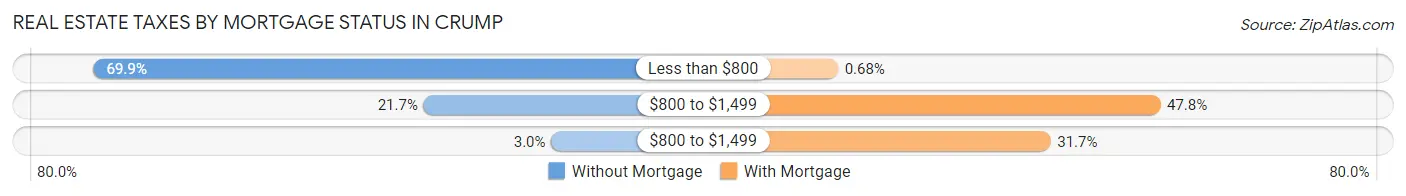
| Property Taxes | Without Mortgage | With Mortgage |
| Less than $800 | 300 (69.9%) | 2 (0.7%) |
| $800 to $1,499 | 93 (21.7%) | 140 (47.8%) |
| $800 to $1,499 | 13 (3.0%) | 93 (31.7%) |
| Total | 429 (100.0%) | 293 (100.0%) |
Health & Disability in Crump
Health Insurance Coverage by Age in Crump
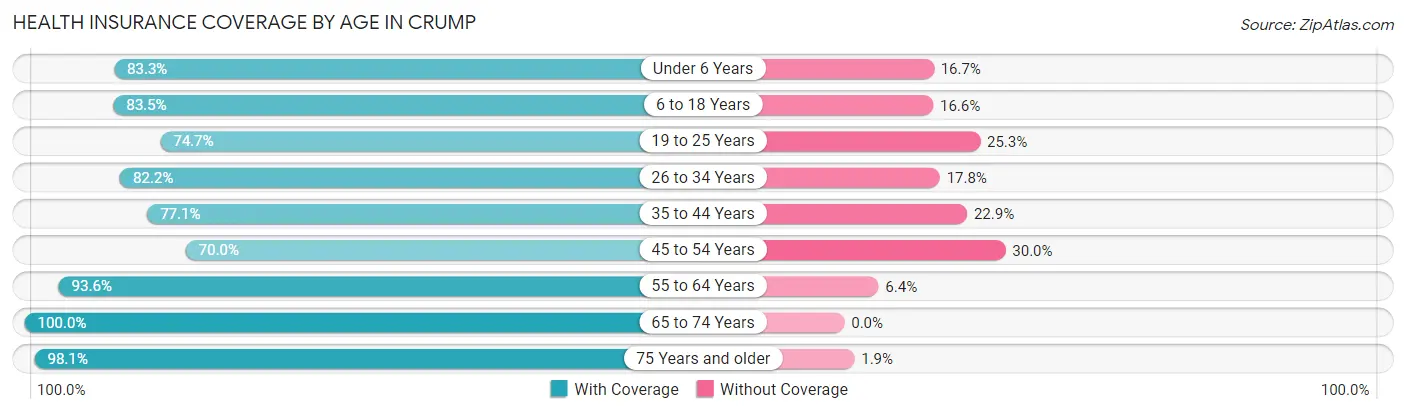
| Age Bracket | With Coverage | Without Coverage |
| Under 6 Years | 80 (83.3%) | 16 (16.7%) |
| 6 to 18 Years | 242 (83.5%) | 48 (16.6%) |
| 19 to 25 Years | 121 (74.7%) | 41 (25.3%) |
| 26 to 34 Years | 134 (82.2%) | 29 (17.8%) |
| 35 to 44 Years | 91 (77.1%) | 27 (22.9%) |
| 45 to 54 Years | 205 (70.0%) | 88 (30.0%) |
| 55 to 64 Years | 324 (93.6%) | 22 (6.4%) |
| 65 to 74 Years | 263 (100.0%) | 0 (0.0%) |
| 75 Years and older | 211 (98.1%) | 4 (1.9%) |
| Total | 1,671 (85.9%) | 275 (14.1%) |
Health Insurance Coverage by Citizenship Status in Crump
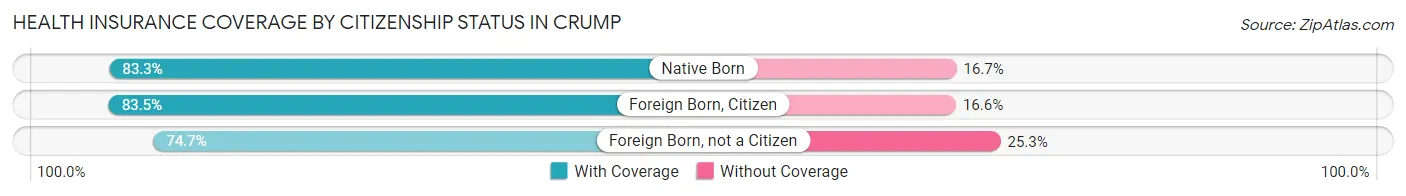
| Citizenship Status | With Coverage | Without Coverage |
| Native Born | 80 (83.3%) | 16 (16.7%) |
| Foreign Born, Citizen | 242 (83.5%) | 48 (16.6%) |
| Foreign Born, not a Citizen | 121 (74.7%) | 41 (25.3%) |
Health Insurance Coverage by Household Income in Crump
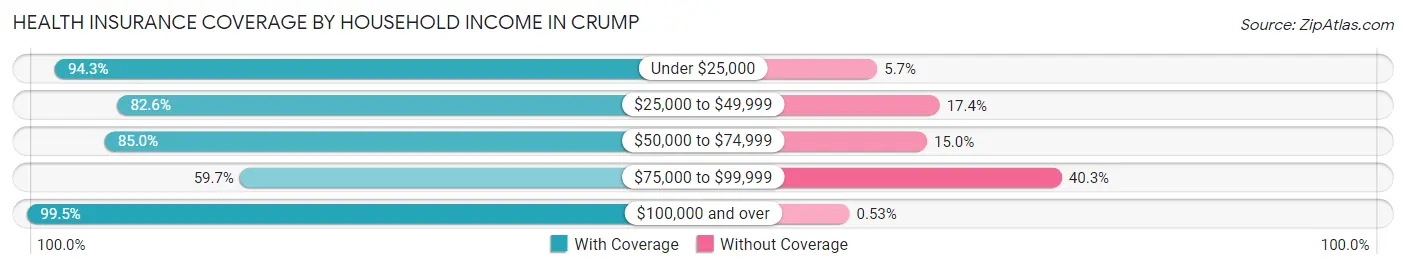
| Household Income | With Coverage | Without Coverage |
| Under $25,000 | 297 (94.3%) | 18 (5.7%) |
| $25,000 to $49,999 | 555 (82.6%) | 117 (17.4%) |
| $50,000 to $74,999 | 322 (85.0%) | 57 (15.0%) |
| $75,000 to $99,999 | 120 (59.7%) | 81 (40.3%) |
| $100,000 and over | 377 (99.5%) | 2 (0.5%) |
Public vs Private Health Insurance Coverage by Age in Crump
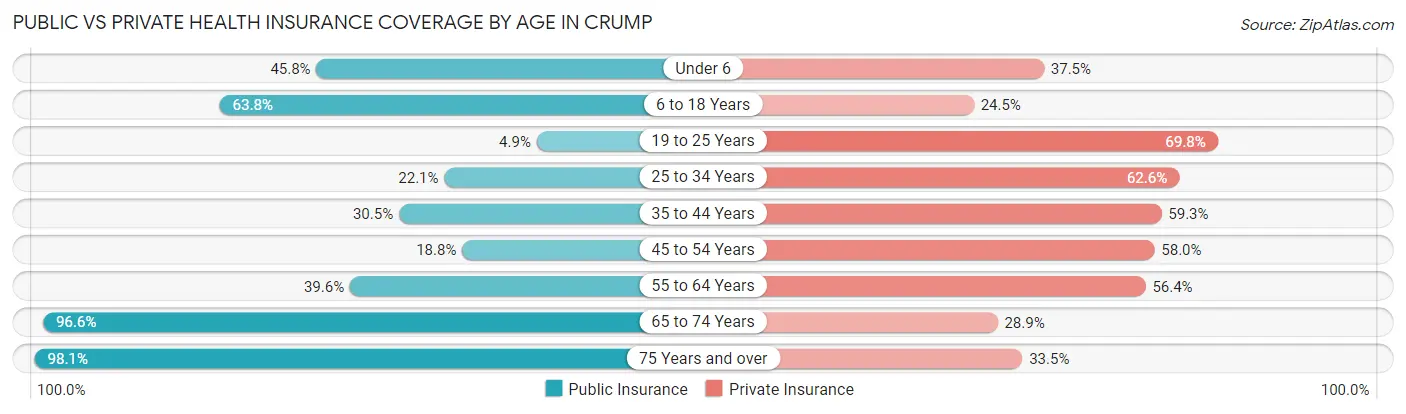
| Age Bracket | Public Insurance | Private Insurance |
| Under 6 | 44 (45.8%) | 36 (37.5%) |
| 6 to 18 Years | 185 (63.8%) | 71 (24.5%) |
| 19 to 25 Years | 8 (4.9%) | 113 (69.8%) |
| 25 to 34 Years | 36 (22.1%) | 102 (62.6%) |
| 35 to 44 Years | 36 (30.5%) | 70 (59.3%) |
| 45 to 54 Years | 55 (18.8%) | 170 (58.0%) |
| 55 to 64 Years | 137 (39.6%) | 195 (56.4%) |
| 65 to 74 Years | 254 (96.6%) | 76 (28.9%) |
| 75 Years and over | 211 (98.1%) | 72 (33.5%) |
| Total | 966 (49.6%) | 905 (46.5%) |
Disability Status by Sex by Age in Crump
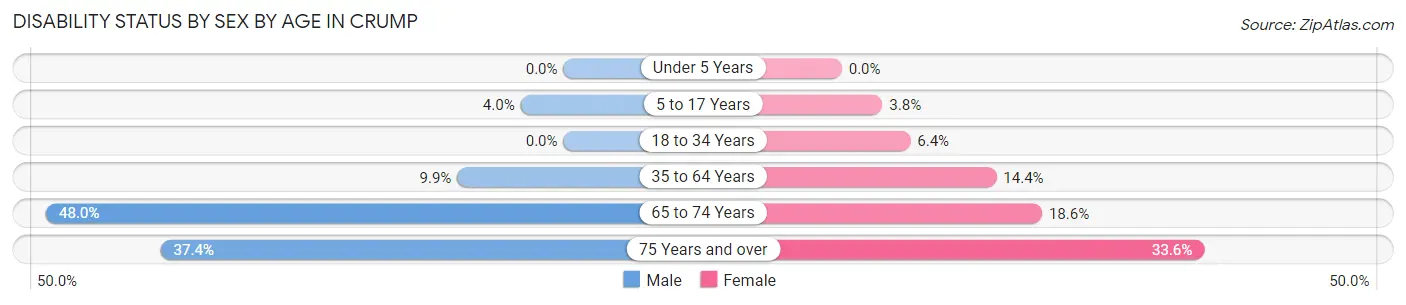
| Age Bracket | Male | Female |
| Under 5 Years | 0 (0.0%) | 0 (0.0%) |
| 5 to 17 Years | 7 (4.0%) | 4 (3.8%) |
| 18 to 34 Years | 0 (0.0%) | 11 (6.4%) |
| 35 to 64 Years | 32 (9.9%) | 62 (14.3%) |
| 65 to 74 Years | 72 (48.0%) | 21 (18.6%) |
| 75 Years and over | 37 (37.4%) | 39 (33.6%) |
Disability Class by Sex by Age in Crump
Disability Class: Hearing Difficulty
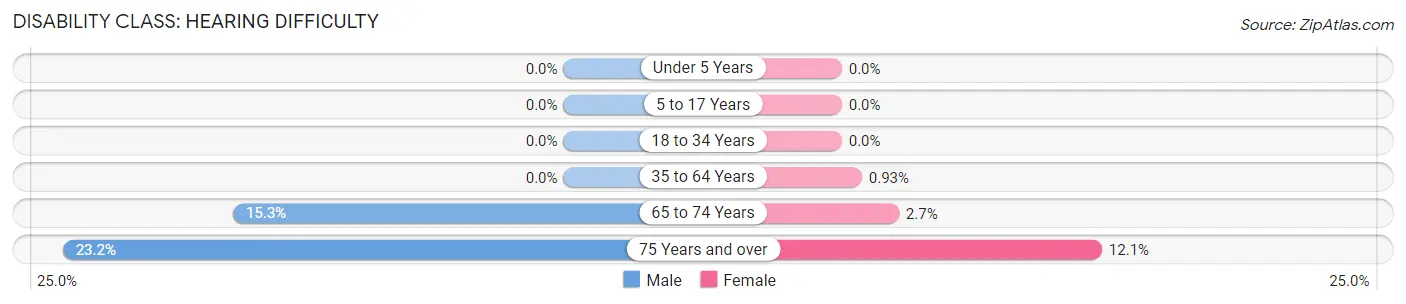
| Age Bracket | Male | Female |
| Under 5 Years | 0 (0.0%) | 0 (0.0%) |
| 5 to 17 Years | 0 (0.0%) | 0 (0.0%) |
| 18 to 34 Years | 0 (0.0%) | 0 (0.0%) |
| 35 to 64 Years | 0 (0.0%) | 4 (0.9%) |
| 65 to 74 Years | 23 (15.3%) | 3 (2.6%) |
| 75 Years and over | 23 (23.2%) | 14 (12.1%) |
Disability Class: Vision Difficulty
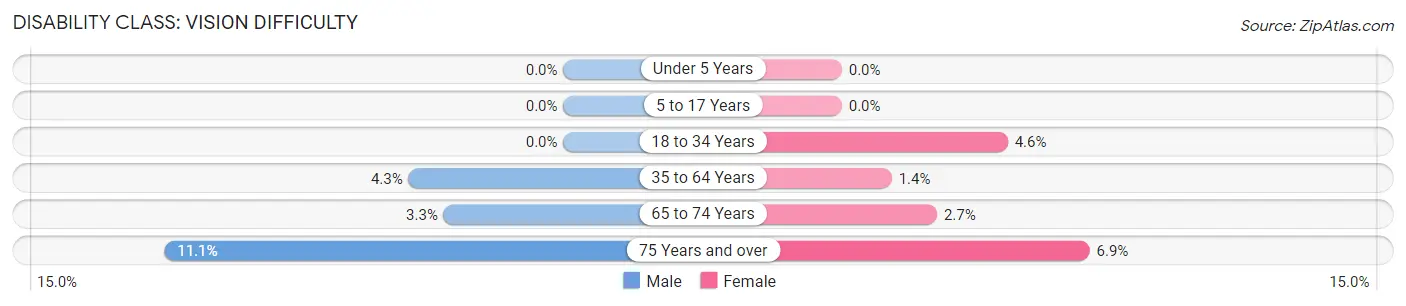
| Age Bracket | Male | Female |
| Under 5 Years | 0 (0.0%) | 0 (0.0%) |
| 5 to 17 Years | 0 (0.0%) | 0 (0.0%) |
| 18 to 34 Years | 0 (0.0%) | 8 (4.6%) |
| 35 to 64 Years | 14 (4.3%) | 6 (1.4%) |
| 65 to 74 Years | 5 (3.3%) | 3 (2.6%) |
| 75 Years and over | 11 (11.1%) | 8 (6.9%) |
Disability Class: Cognitive Difficulty
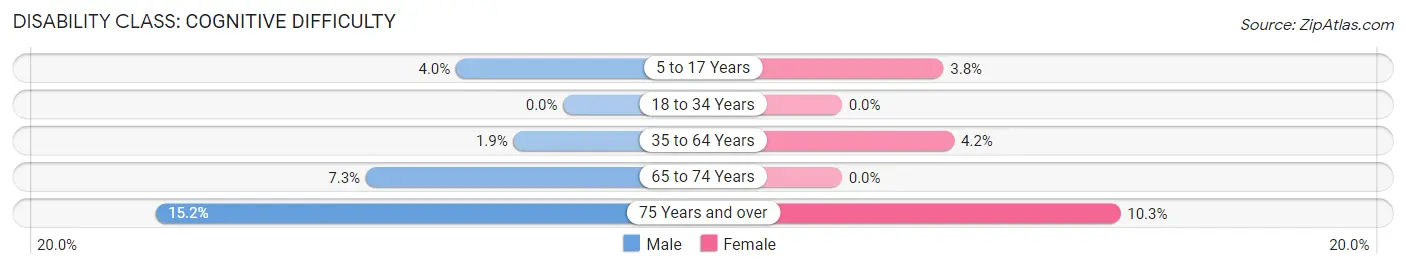
| Age Bracket | Male | Female |
| 5 to 17 Years | 7 (4.0%) | 4 (3.8%) |
| 18 to 34 Years | 0 (0.0%) | 0 (0.0%) |
| 35 to 64 Years | 6 (1.8%) | 18 (4.2%) |
| 65 to 74 Years | 11 (7.3%) | 0 (0.0%) |
| 75 Years and over | 15 (15.1%) | 12 (10.3%) |
Disability Class: Ambulatory Difficulty
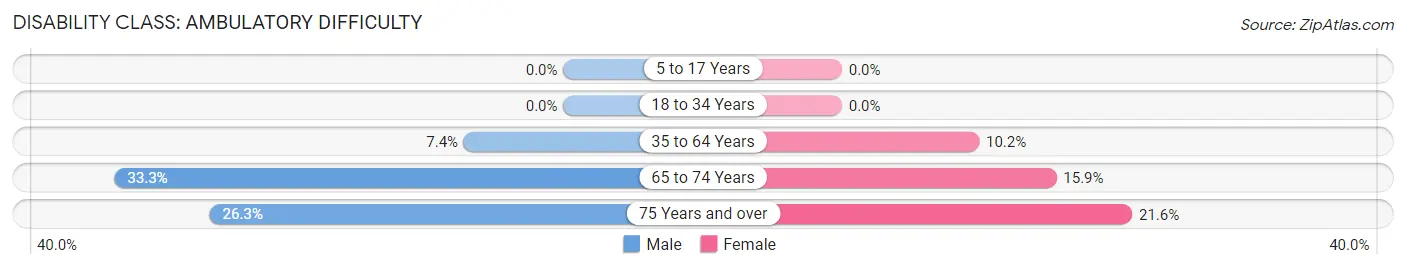
| Age Bracket | Male | Female |
| 5 to 17 Years | 0 (0.0%) | 0 (0.0%) |
| 18 to 34 Years | 0 (0.0%) | 0 (0.0%) |
| 35 to 64 Years | 24 (7.4%) | 44 (10.2%) |
| 65 to 74 Years | 50 (33.3%) | 18 (15.9%) |
| 75 Years and over | 26 (26.3%) | 25 (21.5%) |
Disability Class: Self-Care Difficulty
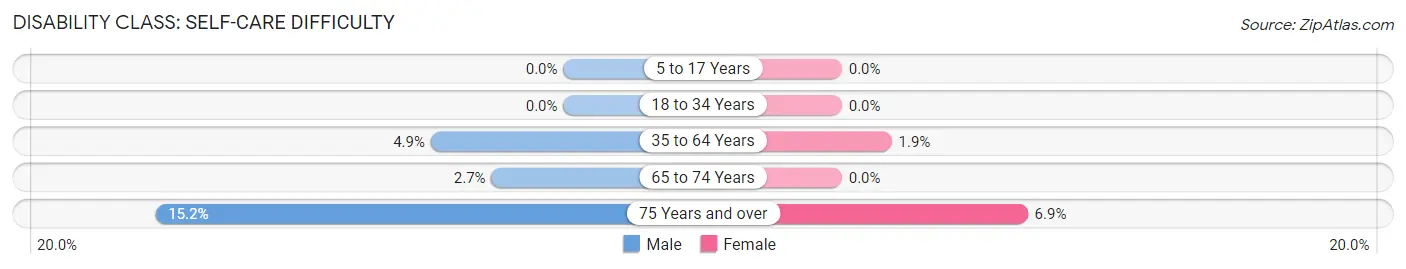
| Age Bracket | Male | Female |
| 5 to 17 Years | 0 (0.0%) | 0 (0.0%) |
| 18 to 34 Years | 0 (0.0%) | 0 (0.0%) |
| 35 to 64 Years | 16 (4.9%) | 8 (1.8%) |
| 65 to 74 Years | 4 (2.7%) | 0 (0.0%) |
| 75 Years and over | 15 (15.1%) | 8 (6.9%) |
Technology Access in Crump
Computing Device Access in Crump
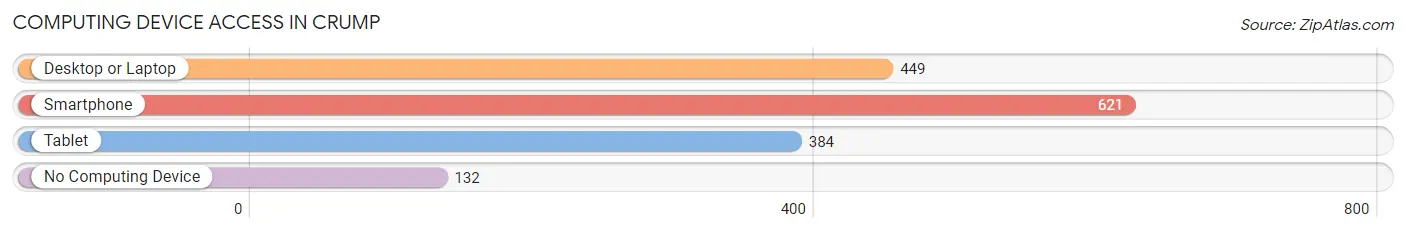
| Device Type | # Households | % Households |
| Desktop or Laptop | 449 | 54.9% |
| Smartphone | 621 | 75.9% |
| Tablet | 384 | 46.9% |
| No Computing Device | 132 | 16.1% |
| Total | 818 | 100.0% |
Internet Access in Crump
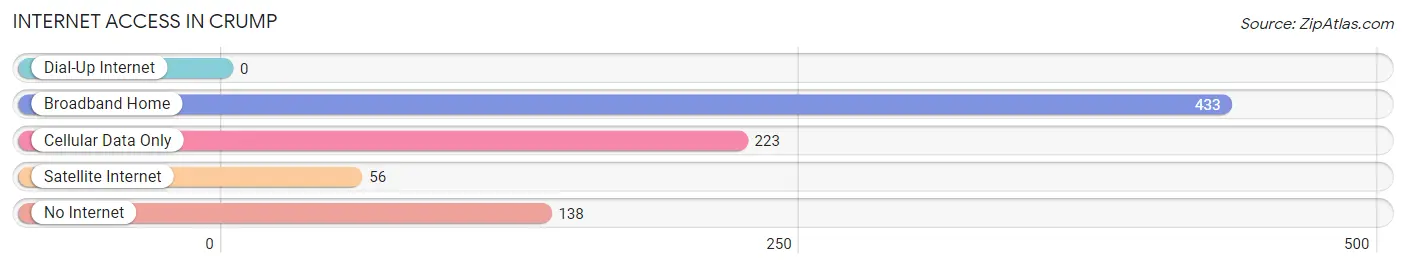
| Internet Type | # Households | % Households |
| Dial-Up Internet | 0 | 0.0% |
| Broadband Home | 433 | 52.9% |
| Cellular Data Only | 223 | 27.3% |
| Satellite Internet | 56 | 6.9% |
| No Internet | 138 | 16.9% |
| Total | 818 | 100.0% |
Crump Summary
Crump is a small town located in Hardin County, Tennessee. It is situated on the banks of the Tennessee River, approximately 30 miles east of Jackson. The town was founded in 1820 and has a population of approximately 1,000 people.
History
Crump was founded in 1820 by William Crump, a Revolutionary War veteran. He purchased the land from the Chickasaw Indians and named the town after himself. The town was originally a trading post and was the first settlement in Hardin County. In 1821, the first post office was established and the town was officially incorporated in 1823.
In the early days, Crump was a thriving agricultural community. Cotton, corn, and tobacco were the main crops grown in the area. The town also had a number of sawmills and gristmills, which provided lumber and grain for the local population.
In the late 19th century, the town began to decline as the railroad bypassed it. The population decreased and the town became a quiet, rural community. In the early 20th century, the town began to experience a resurgence as the Tennessee Valley Authority (TVA) built a dam on the Tennessee River. This provided electricity to the area and helped to spur economic growth.
Geography
Crump is located in Hardin County, Tennessee. It is situated on the banks of the Tennessee River, approximately 30 miles east of Jackson. The town is surrounded by rolling hills and is located in a rural area. The climate is mild and the average temperature is around 70 degrees Fahrenheit.
Economy
Crump’s economy is largely based on agriculture. Cotton, corn, and tobacco are the main crops grown in the area. The town also has a number of sawmills and gristmills, which provide lumber and grain for the local population.
In addition to agriculture, Crump has a number of small businesses. These include a grocery store, a hardware store, a pharmacy, and a few restaurants. The town also has a few small manufacturing plants, which produce a variety of products.
Demographics
As of the 2010 census, Crump had a population of 1,000 people. The racial makeup of the town was 97.2% White, 0.7% African American, 0.3% Native American, 0.2% Asian, and 1.6% from other races. The median household income was $30,000 and the median age was 40 years.
Conclusion
Crump is a small town located in Hardin County, Tennessee. It was founded in 1820 and has a population of approximately 1,000 people. The town’s economy is largely based on agriculture and it also has a number of small businesses. The racial makeup of the town is predominantly White and the median household income is $30,000. Crump is a quiet, rural community that has experienced a resurgence in recent years due to the Tennessee Valley Authority’s dam on the Tennessee River.
Common Questions
What is Per Capita Income in Crump?
Per Capita income in Crump is $26,932.
What is the Median Family Income in Crump?
Median Family Income in Crump is $47,917.
What is the Median Household income in Crump?
Median Household Income in Crump is $38,846.
What is Income or Wage Gap in Crump?
Income or Wage Gap in Crump is 49.2%.
Women in Crump earn 50.8 cents for every dollar earned by a man.
What is Inequality or Gini Index in Crump?
Inequality or Gini Index in Crump is 0.46.
What is the Total Population of Crump?
Total Population of Crump is 1,946.
What is the Total Male Population of Crump?
Total Male Population of Crump is 972.
What is the Total Female Population of Crump?
Total Female Population of Crump is 974.
What is the Ratio of Males per 100 Females in Crump?
There are 99.79 Males per 100 Females in Crump.
What is the Ratio of Females per 100 Males in Crump?
There are 100.21 Females per 100 Males in Crump.
What is the Median Population Age in Crump?
Median Population Age in Crump is 52.2 Years.
What is the Average Family Size in Crump
Average Family Size in Crump is 3.1 People.
What is the Average Household Size in Crump
Average Household Size in Crump is 2.4 People.
How Large is the Labor Force in Crump?
There are 813 People in the Labor Forcein in Crump.
What is the Percentage of People in the Labor Force in Crump?
50.6% of People are in the Labor Force in Crump.
What is the Unemployment Rate in Crump?
Unemployment Rate in Crump is 0.7%.