Cottage Grove, TN Map & Demographics
Cottage Grove Map
Cottage Grove Overview
$19,721
PER CAPITA INCOME
$43,750
AVG FAMILY INCOME
$46,250
AVG HOUSEHOLD INCOME
51.5%
WAGE / INCOME GAP [ % ]
48.5¢/ $1
WAGE / INCOME GAP [ $ ]
0.35
INEQUALITY / GINI INDEX
57
TOTAL POPULATION
27
MALE POPULATION
30
FEMALE POPULATION
90.00
MALES / 100 FEMALES
111.11
FEMALES / 100 MALES
37.3
MEDIAN AGE
3.8
AVG FAMILY SIZE
3.0
AVG HOUSEHOLD SIZE
19
LABOR FORCE [ PEOPLE ]
46.3%
PERCENT IN LABOR FORCE
15.8%
UNEMPLOYMENT RATE
Cottage Grove Zip Codes
Cottage Grove Area Codes
Income in Cottage Grove
Income Overview in Cottage Grove
Per Capita Income in Cottage Grove is $19,721, while median incomes of families and households are $43,750 and $46,250 respectively.
| Characteristic | Number | Measure |
| Per Capita Income | 57 | $19,721 |
| Median Family Income | 10 | $43,750 |
| Mean Family Income | 10 | $53,580 |
| Median Household Income | 19 | $46,250 |
| Mean Household Income | 19 | $54,837 |
| Income Deficit | 10 | $0 |
| Wage / Income Gap (%) | 57 | 51.52% |
| Wage / Income Gap ($) | 57 | 48.48¢ per $1 |
| Gini / Inequality Index | 57 | 0.35 |
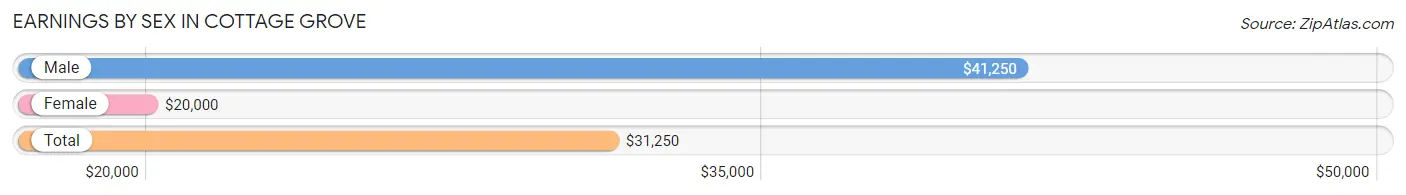
Earnings by Sex in Cottage Grove
Average Earnings in Cottage Grove are $31,250, $41,250 for men and $20,000 for women, a difference of 51.5%.
| Sex | Number | Average Earnings |
| Male | 13 (61.9%) | $41,250 |
| Female | 8 (38.1%) | $20,000 |
| Total | 21 (100.0%) | $31,250 |
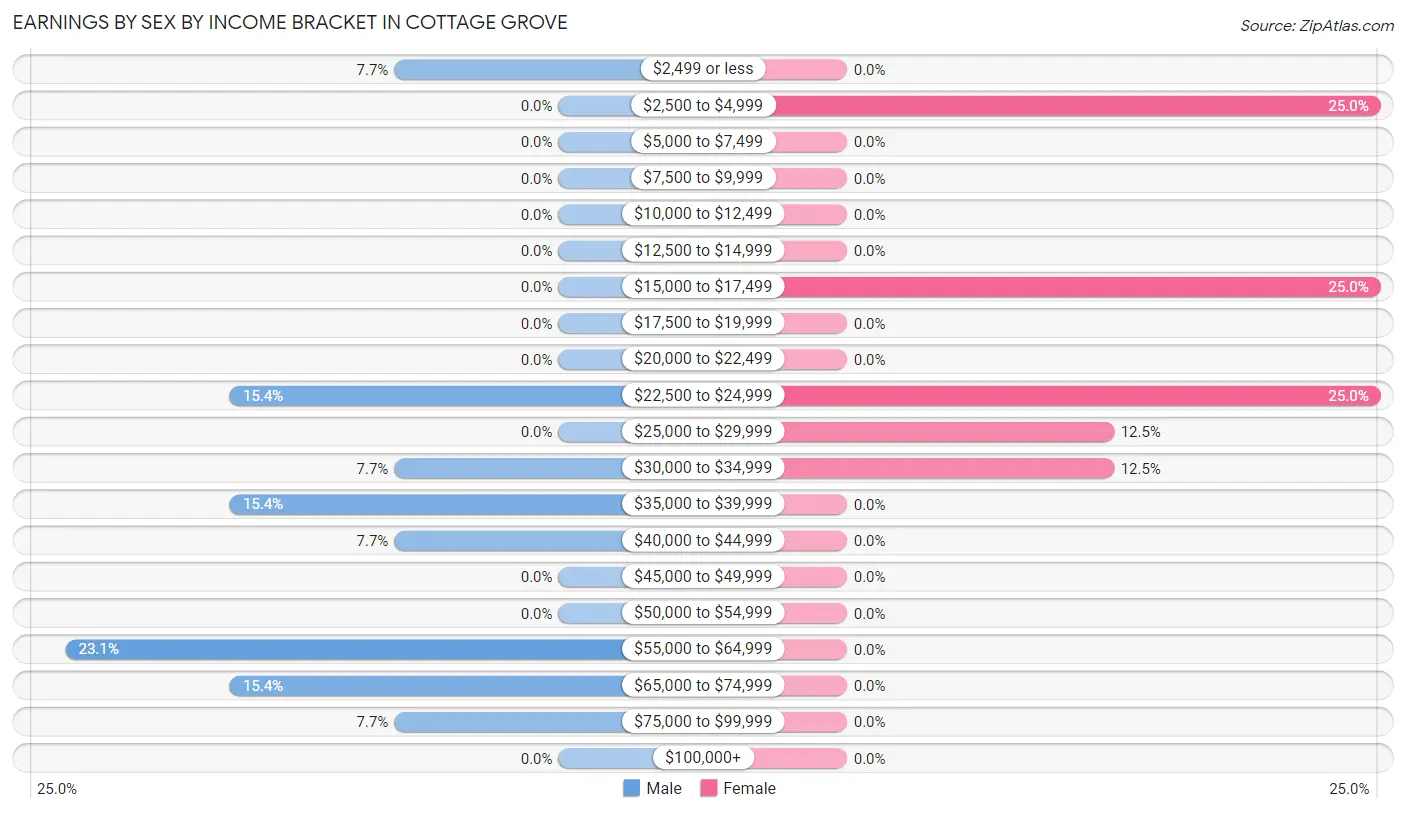
Earnings by Sex by Income Bracket in Cottage Grove
The most common earnings brackets in Cottage Grove are $55,000 to $64,999 for men (3 | 23.1%) and $2,500 to $4,999 for women (2 | 25.0%).
| Income | Male | Female |
| $2,499 or less | 1 (7.7%) | 0 (0.0%) |
| $2,500 to $4,999 | 0 (0.0%) | 2 (25.0%) |
| $5,000 to $7,499 | 0 (0.0%) | 0 (0.0%) |
| $7,500 to $9,999 | 0 (0.0%) | 0 (0.0%) |
| $10,000 to $12,499 | 0 (0.0%) | 0 (0.0%) |
| $12,500 to $14,999 | 0 (0.0%) | 0 (0.0%) |
| $15,000 to $17,499 | 0 (0.0%) | 2 (25.0%) |
| $17,500 to $19,999 | 0 (0.0%) | 0 (0.0%) |
| $20,000 to $22,499 | 0 (0.0%) | 0 (0.0%) |
| $22,500 to $24,999 | 2 (15.4%) | 2 (25.0%) |
| $25,000 to $29,999 | 0 (0.0%) | 1 (12.5%) |
| $30,000 to $34,999 | 1 (7.7%) | 1 (12.5%) |
| $35,000 to $39,999 | 2 (15.4%) | 0 (0.0%) |
| $40,000 to $44,999 | 1 (7.7%) | 0 (0.0%) |
| $45,000 to $49,999 | 0 (0.0%) | 0 (0.0%) |
| $50,000 to $54,999 | 0 (0.0%) | 0 (0.0%) |
| $55,000 to $64,999 | 3 (23.1%) | 0 (0.0%) |
| $65,000 to $74,999 | 2 (15.4%) | 0 (0.0%) |
| $75,000 to $99,999 | 1 (7.7%) | 0 (0.0%) |
| $100,000+ | 0 (0.0%) | 0 (0.0%) |
| Total | 13 (100.0%) | 8 (100.0%) |
Earnings by Sex by Educational Attainment in Cottage Grove
| Educational Attainment | Male Income | Female Income |
| Less than High School | - | - |
| High School Diploma | - | - |
| College or Associate's Degree | - | - |
| Bachelor's Degree | - | - |
| Graduate Degree | - | - |
| Total | $41,250 | $20,000 |
Family Income in Cottage Grove
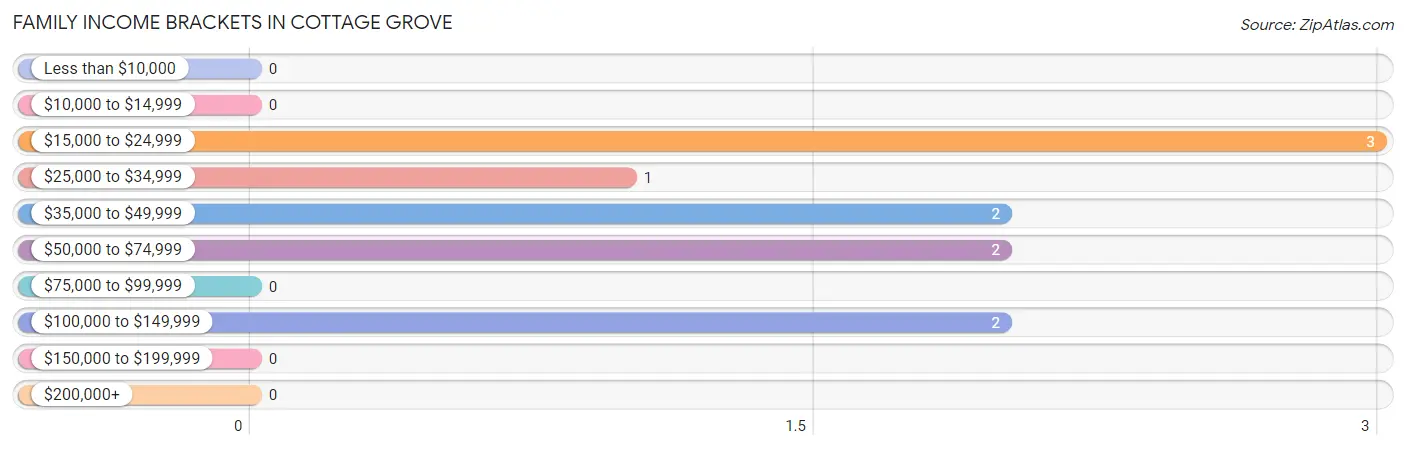
Family Income Brackets in Cottage Grove
According to the Cottage Grove family income data, there are 3 families falling into the $15,000 to $24,999 income range, which is the most common income bracket and makes up 30.0% of all families.
| Income Bracket | # Families | % Families |
| Less than $10,000 | 0 | 0.0% |
| $10,000 to $14,999 | 0 | 0.0% |
| $15,000 to $24,999 | 3 | 30.0% |
| $25,000 to $34,999 | 1 | 10.0% |
| $35,000 to $49,999 | 2 | 20.0% |
| $50,000 to $74,999 | 2 | 20.0% |
| $75,000 to $99,999 | 0 | 0.0% |
| $100,000 to $149,999 | 2 | 20.0% |
| $150,000 to $199,999 | 0 | 0.0% |
| $200,000+ | 0 | 0.0% |
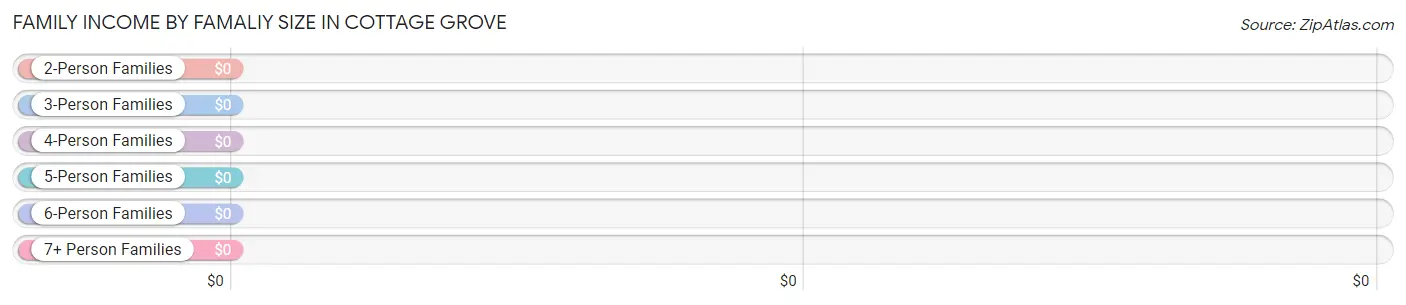
Family Income by Famaliy Size in Cottage Grove
| Income Bracket | # Families | Median Income |
| 2-Person Families | 1 (10.0%) | $0 |
| 3-Person Families | 6 (60.0%) | $0 |
| 4-Person Families | 2 (20.0%) | $0 |
| 5-Person Families | 1 (10.0%) | $0 |
| 6-Person Families | 0 (0.0%) | $0 |
| 7+ Person Families | 0 (0.0%) | $0 |
| Total | 10 (100.0%) | $43,750 |
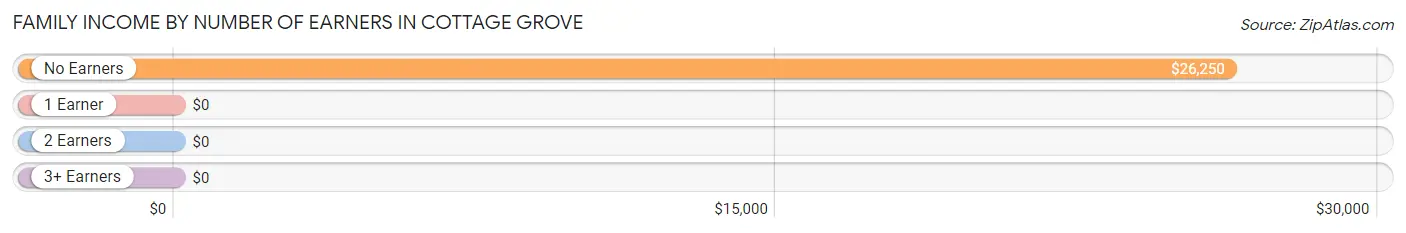
Family Income by Number of Earners in Cottage Grove
| Number of Earners | # Families | Median Income |
| No Earners | 3 (30.0%) | $26,250 |
| 1 Earner | 3 (30.0%) | $0 |
| 2 Earners | 3 (30.0%) | $0 |
| 3+ Earners | 1 (10.0%) | $0 |
| Total | 10 (100.0%) | $43,750 |
Household Income in Cottage Grove
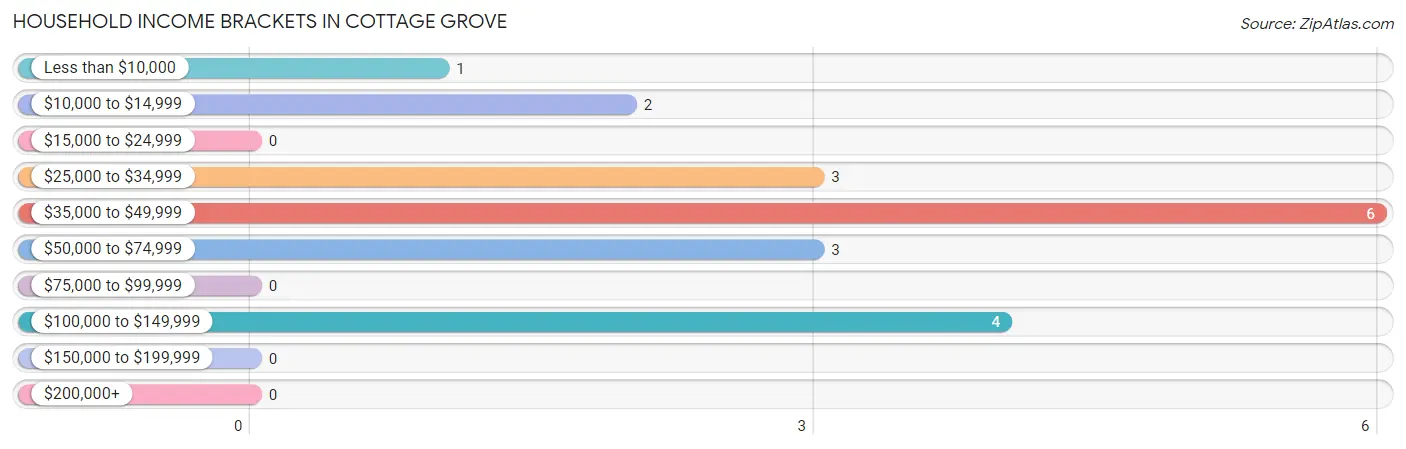
Household Income Brackets in Cottage Grove
With 6 households falling in the category, the $35,000 to $49,999 income range is the most frequent in Cottage Grove, accounting for 31.6% of all households.
| Income Bracket | # Households | % Households |
| Less than $10,000 | 1 | 5.3% |
| $10,000 to $14,999 | 2 | 10.5% |
| $15,000 to $24,999 | 0 | 0.0% |
| $25,000 to $34,999 | 3 | 15.8% |
| $35,000 to $49,999 | 6 | 31.6% |
| $50,000 to $74,999 | 3 | 15.8% |
| $75,000 to $99,999 | 0 | 0.0% |
| $100,000 to $149,999 | 4 | 21.1% |
| $150,000 to $199,999 | 0 | 0.0% |
| $200,000+ | 0 | 0.0% |
Household Income by Householder Age in Cottage Grove
The median household income in Cottage Grove is $46,250, with the highest median household income of $68,750 found in the 45 to 64 years age bracket for the primary householder. A total of 9 households (47.4%) fall into this category.
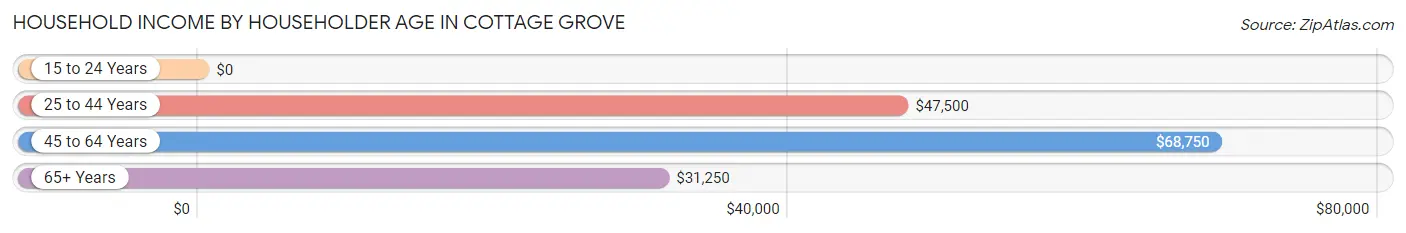
| Income Bracket | # Households | Median Income |
| 15 to 24 Years | 0 (0.0%) | $0 |
| 25 to 44 Years | 6 (31.6%) | $47,500 |
| 45 to 64 Years | 9 (47.4%) | $68,750 |
| 65+ Years | 4 (21.0%) | $31,250 |
| Total | 19 (100.0%) | $46,250 |
Poverty in Cottage Grove
Income Below Poverty by Sex and Age in Cottage Grove
With 22.2% poverty level for males and 25.0% for females among the residents of Cottage Grove, 35 to 44 year old males and under 5 year old females are the most vulnerable to poverty, with 4 males (100.0%) and 1 females (100.0%) in their respective age groups living below the poverty level.
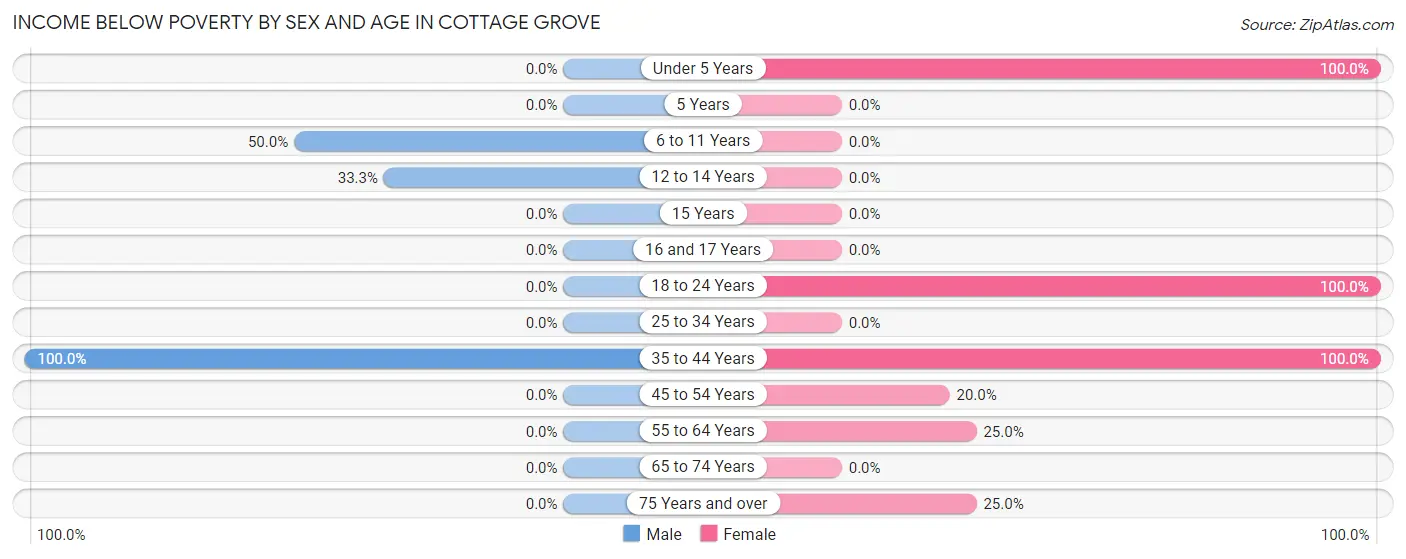
| Age Bracket | Male | Female |
| Under 5 Years | 0 (0.0%) | 1 (100.0%) |
| 5 Years | 0 (0.0%) | 0 (0.0%) |
| 6 to 11 Years | 1 (50.0%) | 0 (0.0%) |
| 12 to 14 Years | 1 (33.3%) | 0 (0.0%) |
| 15 Years | 0 (0.0%) | 0 (0.0%) |
| 16 and 17 Years | 0 (0.0%) | 0 (0.0%) |
| 18 to 24 Years | 0 (0.0%) | 2 (100.0%) |
| 25 to 34 Years | 0 (0.0%) | 0 (0.0%) |
| 35 to 44 Years | 4 (100.0%) | 1 (100.0%) |
| 45 to 54 Years | 0 (0.0%) | 1 (20.0%) |
| 55 to 64 Years | 0 (0.0%) | 1 (25.0%) |
| 65 to 74 Years | 0 (0.0%) | 0 (0.0%) |
| 75 Years and over | 0 (0.0%) | 1 (25.0%) |
| Total | 6 (22.2%) | 7 (25.0%) |
Income Above Poverty by Sex and Age in Cottage Grove
According to the poverty statistics in Cottage Grove, males aged under 5 years and females aged 6 to 11 years are the age groups that are most secure financially, with 100.0% of males and 100.0% of females in these age groups living above the poverty line.
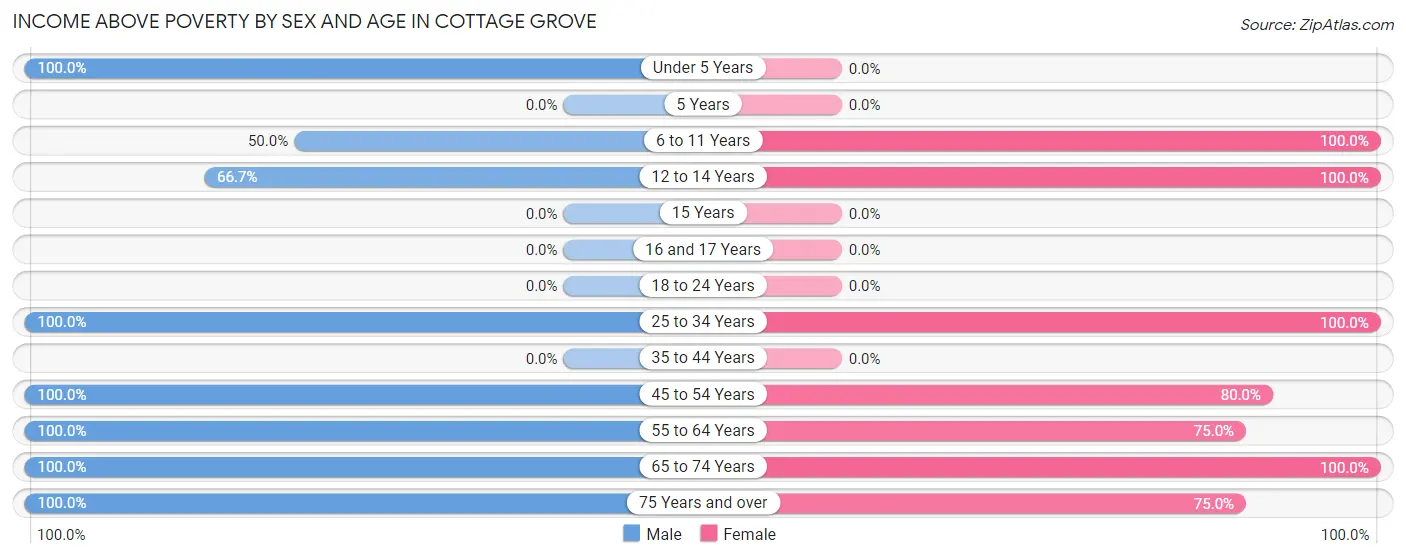
| Age Bracket | Male | Female |
| Under 5 Years | 5 (100.0%) | 0 (0.0%) |
| 5 Years | 0 (0.0%) | 0 (0.0%) |
| 6 to 11 Years | 1 (50.0%) | 1 (100.0%) |
| 12 to 14 Years | 2 (66.7%) | 2 (100.0%) |
| 15 Years | 0 (0.0%) | 0 (0.0%) |
| 16 and 17 Years | 0 (0.0%) | 0 (0.0%) |
| 18 to 24 Years | 0 (0.0%) | 0 (0.0%) |
| 25 to 34 Years | 4 (100.0%) | 6 (100.0%) |
| 35 to 44 Years | 0 (0.0%) | 0 (0.0%) |
| 45 to 54 Years | 4 (100.0%) | 4 (80.0%) |
| 55 to 64 Years | 3 (100.0%) | 3 (75.0%) |
| 65 to 74 Years | 1 (100.0%) | 2 (100.0%) |
| 75 Years and over | 1 (100.0%) | 3 (75.0%) |
| Total | 21 (77.8%) | 21 (75.0%) |
Income Below Poverty Among Married-Couple Families in Cottage Grove
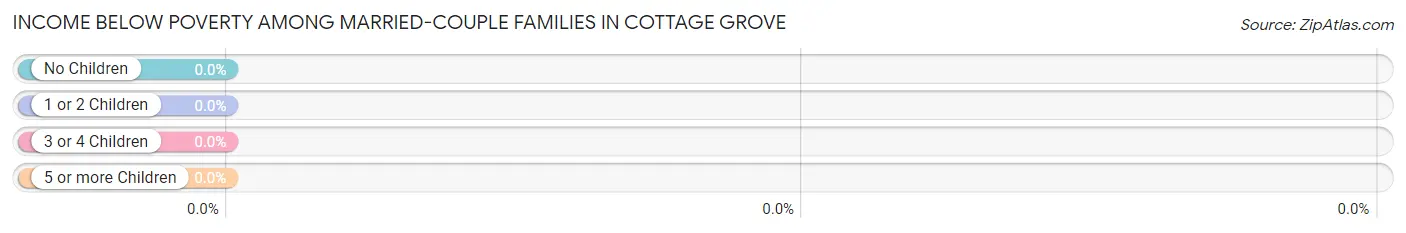
| Children | Above Poverty | Below Poverty |
| No Children | 1 (100.0%) | 0 (0.0%) |
| 1 or 2 Children | 5 (100.0%) | 0 (0.0%) |
| 3 or 4 Children | 0 (0.0%) | 0 (0.0%) |
| 5 or more Children | 0 (0.0%) | 0 (0.0%) |
| Total | 6 (100.0%) | 0 (0.0%) |
Income Below Poverty Among Single-Parent Households in Cottage Grove
According to the poverty data in Cottage Grove, 66.7% or 2 single-father households and 100.0% or 1 single-mother households are living below the poverty line. Among single-father households, those with 1 or 2 children have the highest poverty rate, with 2 households (66.7%) experiencing poverty. Likewise, among single-mother households, those with 1 or 2 children have the highest poverty rate, with 1 households (100.0%) falling below the poverty line.
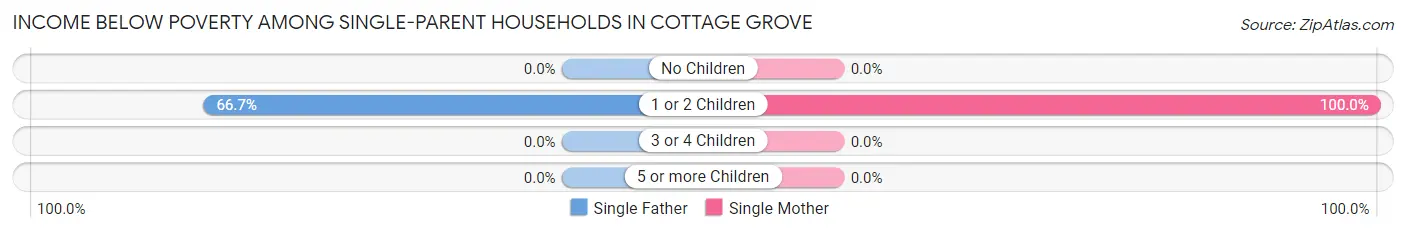
| Children | Single Father | Single Mother |
| No Children | 0 (0.0%) | 0 (0.0%) |
| 1 or 2 Children | 2 (66.7%) | 1 (100.0%) |
| 3 or 4 Children | 0 (0.0%) | 0 (0.0%) |
| 5 or more Children | 0 (0.0%) | 0 (0.0%) |
| Total | 2 (66.7%) | 1 (100.0%) |
Income Below Poverty Among Married-Couple vs Single-Parent Households in Cottage Grove
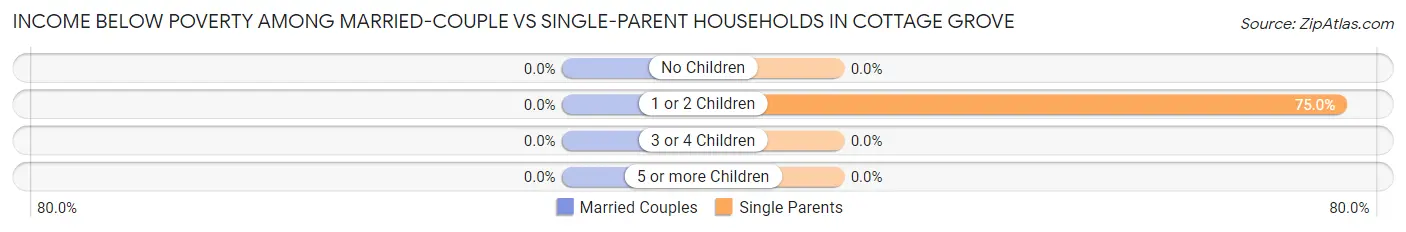
| Children | Married-Couple Families | Single-Parent Households |
| No Children | 0 (0.0%) | 0 (0.0%) |
| 1 or 2 Children | 0 (0.0%) | 3 (75.0%) |
| 3 or 4 Children | 0 (0.0%) | 0 (0.0%) |
| 5 or more Children | 0 (0.0%) | 0 (0.0%) |
| Total | 0 (0.0%) | 3 (75.0%) |
Race in Cottage Grove
The most populous races in Cottage Grove are White / Caucasian (50 | 87.7%), Two or more Races (6 | 10.5%), and Hawaiian / Pacific (1 | 1.8%).
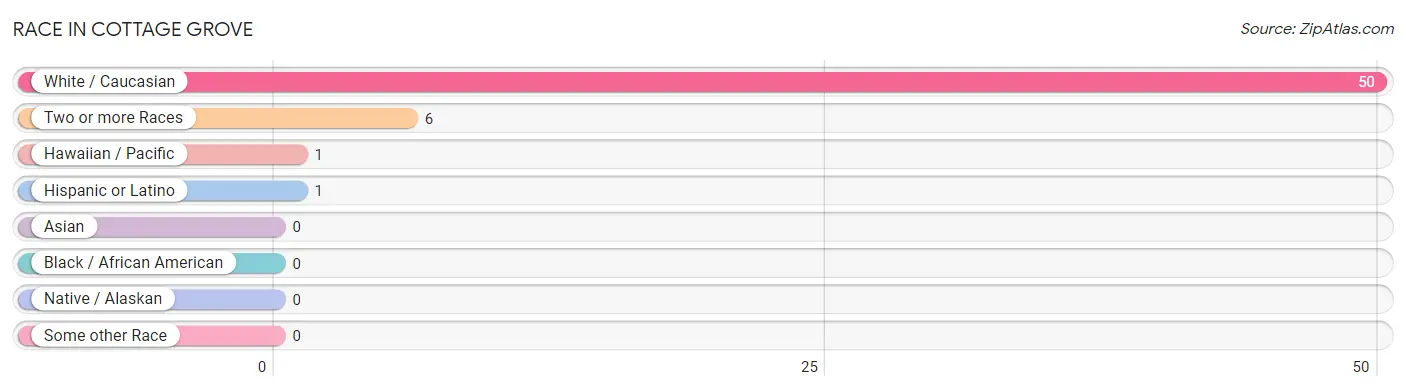
| Race | # Population | % Population |
| Asian | 0 | 0.0% |
| Black / African American | 0 | 0.0% |
| Hawaiian / Pacific | 1 | 1.8% |
| Hispanic or Latino | 1 | 1.8% |
| Native / Alaskan | 0 | 0.0% |
| White / Caucasian | 50 | 87.7% |
| Two or more Races | 6 | 10.5% |
| Some other Race | 0 | 0.0% |
| Total | 57 | 100.0% |
Ancestry in Cottage Grove
The most populous ancestries reported in Cottage Grove are English (13 | 22.8%), Irish (10 | 17.5%), German (9 | 15.8%), American (3 | 5.3%), and British (1 | 1.8%), together accounting for 63.1% of all Cottage Grove residents.
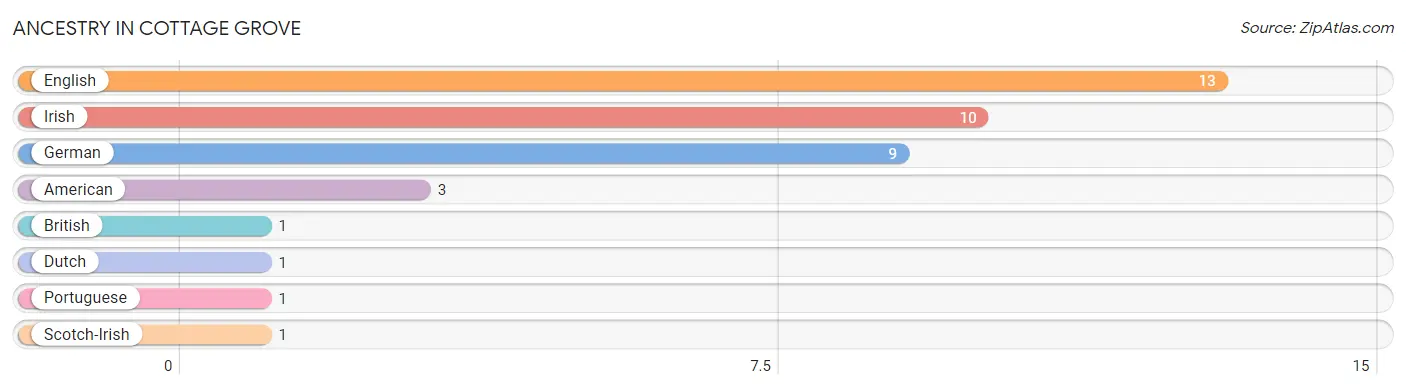
| Ancestry | # Population | % Population |
| American | 3 | 5.3% |
| British | 1 | 1.8% |
| Dutch | 1 | 1.8% |
| English | 13 | 22.8% |
| German | 9 | 15.8% |
| Irish | 10 | 17.5% |
| Portuguese | 1 | 1.8% |
| Scotch-Irish | 1 | 1.8% | View All 8 Rows |
Immigrants in Cottage Grove

| Immigration Origin | # Population | % Population | View All 0 Rows |
Sex and Age in Cottage Grove
Sex and Age in Cottage Grove
The most populous age groups in Cottage Grove are Under 5 Years (5 | 18.5%) for men and 25 to 29 Years (5 | 16.7%) for women.
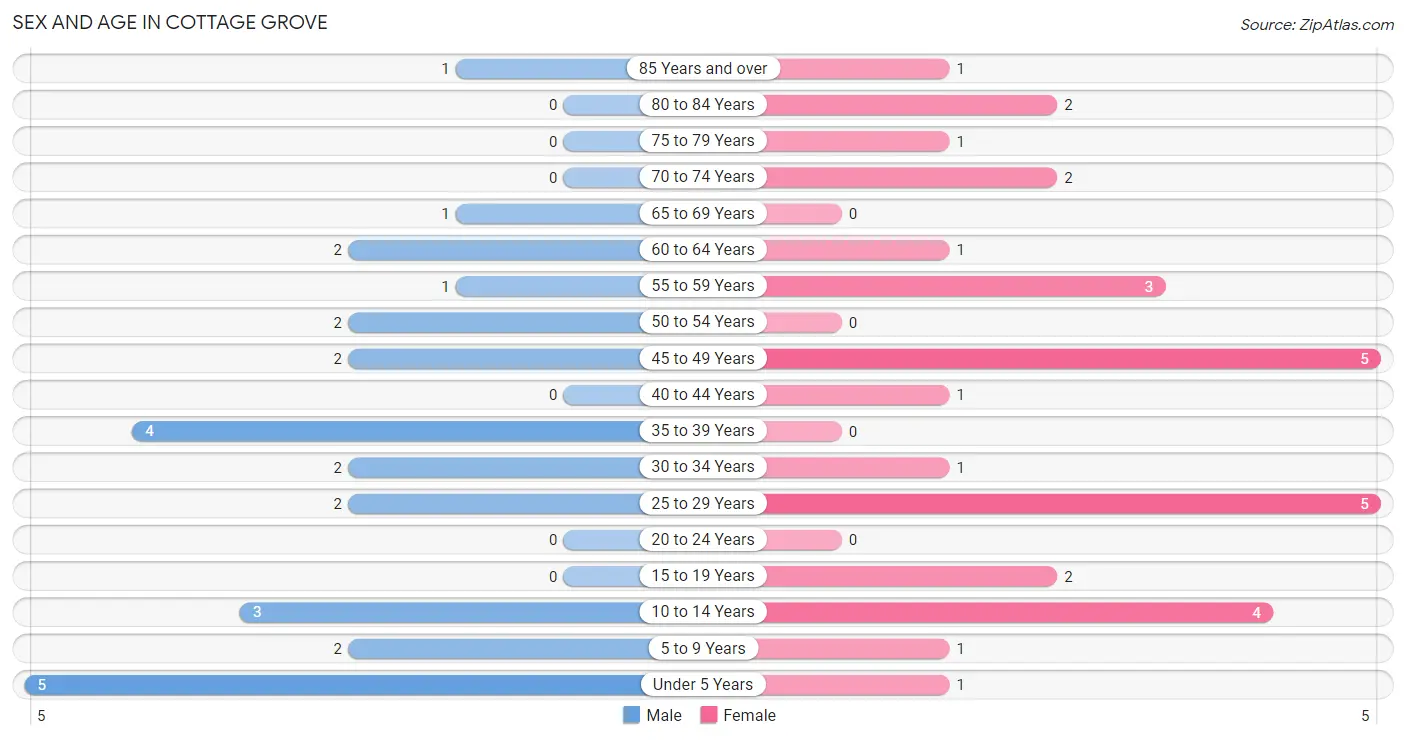
| Age Bracket | Male | Female |
| Under 5 Years | 5 (18.5%) | 1 (3.3%) |
| 5 to 9 Years | 2 (7.4%) | 1 (3.3%) |
| 10 to 14 Years | 3 (11.1%) | 4 (13.3%) |
| 15 to 19 Years | 0 (0.0%) | 2 (6.7%) |
| 20 to 24 Years | 0 (0.0%) | 0 (0.0%) |
| 25 to 29 Years | 2 (7.4%) | 5 (16.7%) |
| 30 to 34 Years | 2 (7.4%) | 1 (3.3%) |
| 35 to 39 Years | 4 (14.8%) | 0 (0.0%) |
| 40 to 44 Years | 0 (0.0%) | 1 (3.3%) |
| 45 to 49 Years | 2 (7.4%) | 5 (16.7%) |
| 50 to 54 Years | 2 (7.4%) | 0 (0.0%) |
| 55 to 59 Years | 1 (3.7%) | 3 (10.0%) |
| 60 to 64 Years | 2 (7.4%) | 1 (3.3%) |
| 65 to 69 Years | 1 (3.7%) | 0 (0.0%) |
| 70 to 74 Years | 0 (0.0%) | 2 (6.7%) |
| 75 to 79 Years | 0 (0.0%) | 1 (3.3%) |
| 80 to 84 Years | 0 (0.0%) | 2 (6.7%) |
| 85 Years and over | 1 (3.7%) | 1 (3.3%) |
| Total | 27 (100.0%) | 30 (100.0%) |
Families and Households in Cottage Grove
Median Family Size in Cottage Grove
The median family size in Cottage Grove is 3.80 persons per family, with single male/father families (3 | 30.0%) accounting for the largest median family size of 4 persons per family. On the other hand, married-couple families (6 | 60.0%) represent the smallest median family size with 3.67 persons per family.
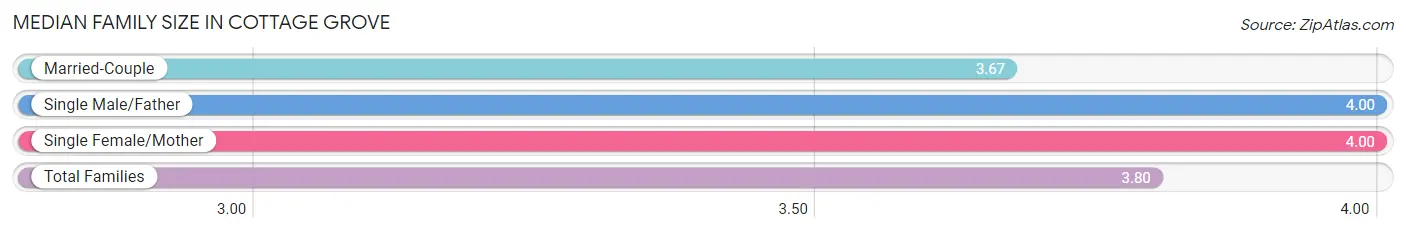
| Family Type | # Families | Family Size |
| Married-Couple | 6 (60.0%) | 3.67 |
| Single Male/Father | 3 (30.0%) | 4.00 |
| Single Female/Mother | 1 (10.0%) | 4.00 |
| Total Families | 10 (100.0%) | 3.80 |
Median Household Size in Cottage Grove
The median household size in Cottage Grove is 3.00 persons per household, with single female/mother households (1 | 5.3%) accounting for the largest median household size of 8 persons per household. non-family households (9 | 47.4%) represent the smallest median household size with 1.33 persons per household.
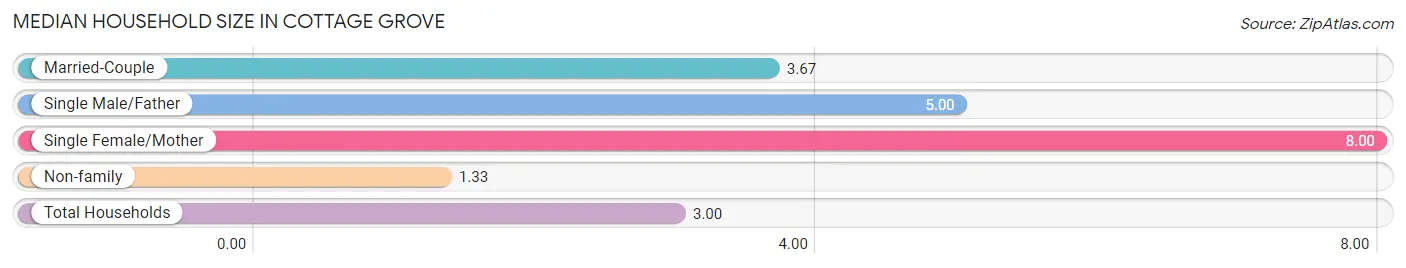
| Household Type | # Households | Household Size |
| Married-Couple | 6 (31.6%) | 3.67 |
| Single Male/Father | 3 (15.8%) | 5.00 |
| Single Female/Mother | 1 (5.3%) | 8.00 |
| Non-family | 9 (47.4%) | 1.33 |
| Total Households | 19 (100.0%) | 3.00 |
Household Size by Marriage Status in Cottage Grove
Out of a total of 19 households in Cottage Grove, 10 (52.6%) are family households, while 9 (47.4%) are nonfamily households. The most numerous type of family households are 4-person households, comprising 4, and the most common type of nonfamily households are 1-person households, comprising 7.
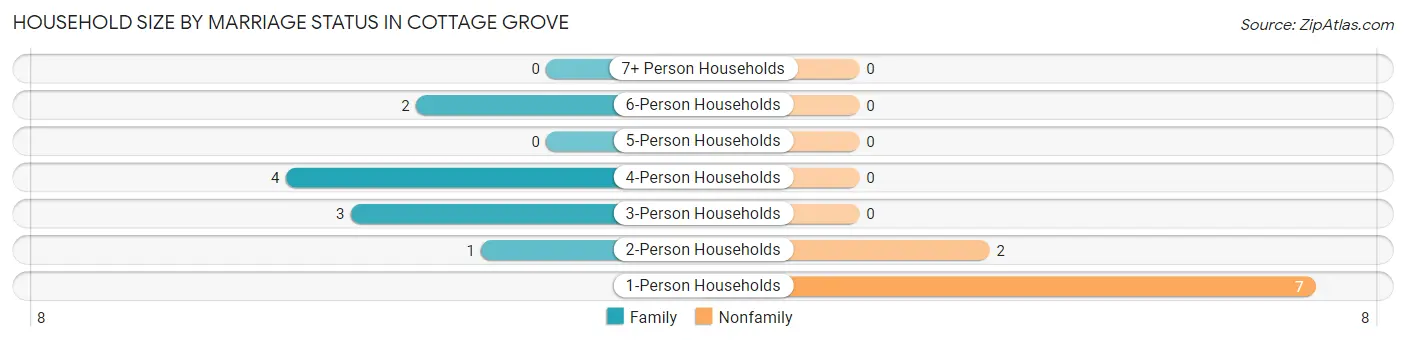
| Household Size | Family Households | Nonfamily Households |
| 1-Person Households | - | 7 (36.8%) |
| 2-Person Households | 1 (5.3%) | 2 (10.5%) |
| 3-Person Households | 3 (15.8%) | 0 (0.0%) |
| 4-Person Households | 4 (21.0%) | 0 (0.0%) |
| 5-Person Households | 0 (0.0%) | 0 (0.0%) |
| 6-Person Households | 2 (10.5%) | 0 (0.0%) |
| 7+ Person Households | 0 (0.0%) | 0 (0.0%) |
| Total | 10 (52.6%) | 9 (47.4%) |
Female Fertility in Cottage Grove
Fertility by Age in Cottage Grove
| Age Bracket | Women with Births | Births / 1,000 Women |
| 15 to 19 years | 0 (0.0%) | 0.0 |
| 20 to 34 years | 0 (0.0%) | 0.0 |
| 35 to 50 years | 0 (0.0%) | 0.0 |
| Total | 0 (0.0%) | 0.0 |
Fertility by Age by Marriage Status in Cottage Grove
| Age Bracket | Married | Unmarried |
| 15 to 19 years | 0 (0.0%) | 0 (0.0%) |
| 20 to 34 years | 0 (0.0%) | 0 (0.0%) |
| 35 to 50 years | 0 (0.0%) | 0 (0.0%) |
| Total | 0 (0.0%) | 0 (0.0%) |
Fertility by Education in Cottage Grove
| Educational Attainment | Women with Births | Births / 1,000 Women |
| Less than High School | 0 (0.0%) | 0.0 |
| High School Diploma | 0 (0.0%) | 0.0 |
| College or Associate's Degree | 0 (0.0%) | 0.0 |
| Bachelor's Degree | 0 (0.0%) | 0.0 |
| Graduate Degree | 0 (0.0%) | 0.0 |
| Total | 0 (0.0%) | 0.0 |
Fertility by Education by Marriage Status in Cottage Grove
| Educational Attainment | Married | Unmarried |
| Less than High School | 0 (0.0%) | 0 (0.0%) |
| High School Diploma | 0 (0.0%) | 0 (0.0%) |
| College or Associate's Degree | 0 (0.0%) | 0 (0.0%) |
| Bachelor's Degree | 0 (0.0%) | 0 (0.0%) |
| Graduate Degree | 0 (0.0%) | 0 (0.0%) |
| Total | 0 (0.0%) | 0 (0.0%) |
Employment Characteristics in Cottage Grove
Employment by Class of Employer in Cottage Grove
Among the 16 employed individuals in Cottage Grove, private company employees (13 | 81.2%), not-for-profit organizations (2 | 12.5%), and local government employees (1 | 6.2%) make up the most common classes of employment.
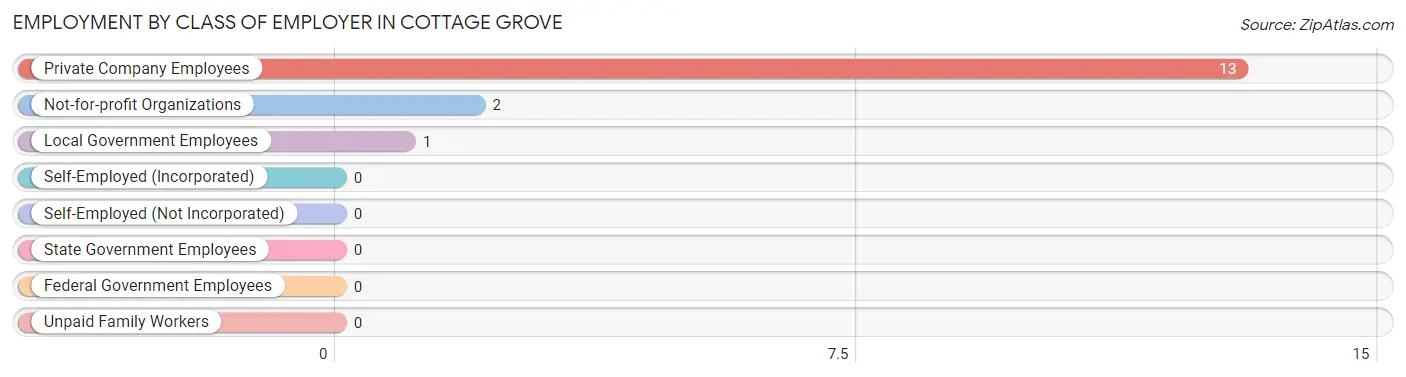
| Employer Class | # Employees | % Employees |
| Private Company Employees | 13 | 81.2% |
| Self-Employed (Incorporated) | 0 | 0.0% |
| Self-Employed (Not Incorporated) | 0 | 0.0% |
| Not-for-profit Organizations | 2 | 12.5% |
| Local Government Employees | 1 | 6.2% |
| State Government Employees | 0 | 0.0% |
| Federal Government Employees | 0 | 0.0% |
| Unpaid Family Workers | 0 | 0.0% |
| Total | 16 | 100.0% |
Employment Status by Age in Cottage Grove
According to the labor force statistics for Cottage Grove, out of the total population over 16 years of age (41), 46.3% or 19 individuals are in the labor force, with 15.8% or 3 of them unemployed. The age group with the highest labor force participation rate is 35 to 44 years, with 100.0% or 5 individuals in the labor force. Within the labor force, the 35 to 44 years age range has the highest percentage of unemployed individuals, with 60.0% or 3 of them being unemployed.
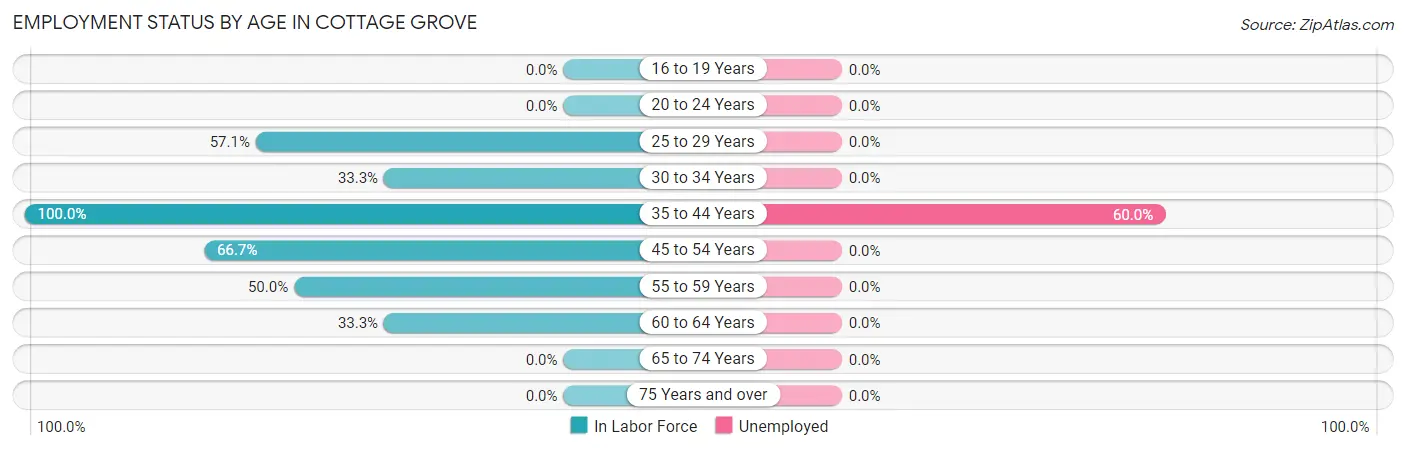
| Age Bracket | In Labor Force | Unemployed |
| 16 to 19 Years | 0 (0.0%) | 0 (0.0%) |
| 20 to 24 Years | 0 (0.0%) | 0 (0.0%) |
| 25 to 29 Years | 4 (57.1%) | 0 (0.0%) |
| 30 to 34 Years | 1 (33.3%) | 0 (0.0%) |
| 35 to 44 Years | 5 (100.0%) | 3 (60.0%) |
| 45 to 54 Years | 6 (66.7%) | 0 (0.0%) |
| 55 to 59 Years | 2 (50.0%) | 0 (0.0%) |
| 60 to 64 Years | 1 (33.3%) | 0 (0.0%) |
| 65 to 74 Years | 0 (0.0%) | 0 (0.0%) |
| 75 Years and over | 0 (0.0%) | 0 (0.0%) |
| Total | 19 (46.3%) | 3 (15.8%) |
Employment Status by Educational Attainment in Cottage Grove
According to labor force statistics for Cottage Grove, 61.3% of individuals (19) out of the total population between 25 and 64 years of age (31) are in the labor force, with 15.8% or 3 of them being unemployed. The group with the highest labor force participation rate are those with the educational attainment of high school diploma, with 88.2% or 15 individuals in the labor force. Within the labor force, individuals with high school diploma education have the highest percentage of unemployment, with 20.0% or 3 of them being unemployed.
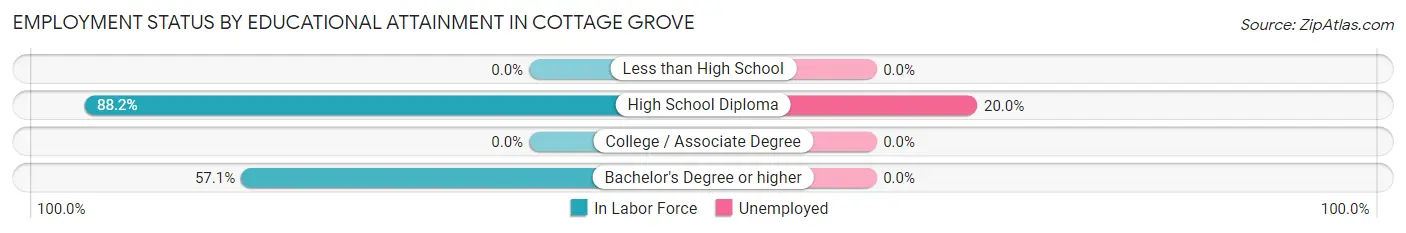
| Educational Attainment | In Labor Force | Unemployed |
| Less than High School | 0 (0.0%) | 0 (0.0%) |
| High School Diploma | 15 (88.2%) | 3 (20.0%) |
| College / Associate Degree | 0 (0.0%) | 0 (0.0%) |
| Bachelor's Degree or higher | 4 (57.1%) | 0 (0.0%) |
| Total | 19 (61.3%) | 5 (15.8%) |
Employment Occupations by Sex in Cottage Grove
Management, Business, Science and Arts Occupations
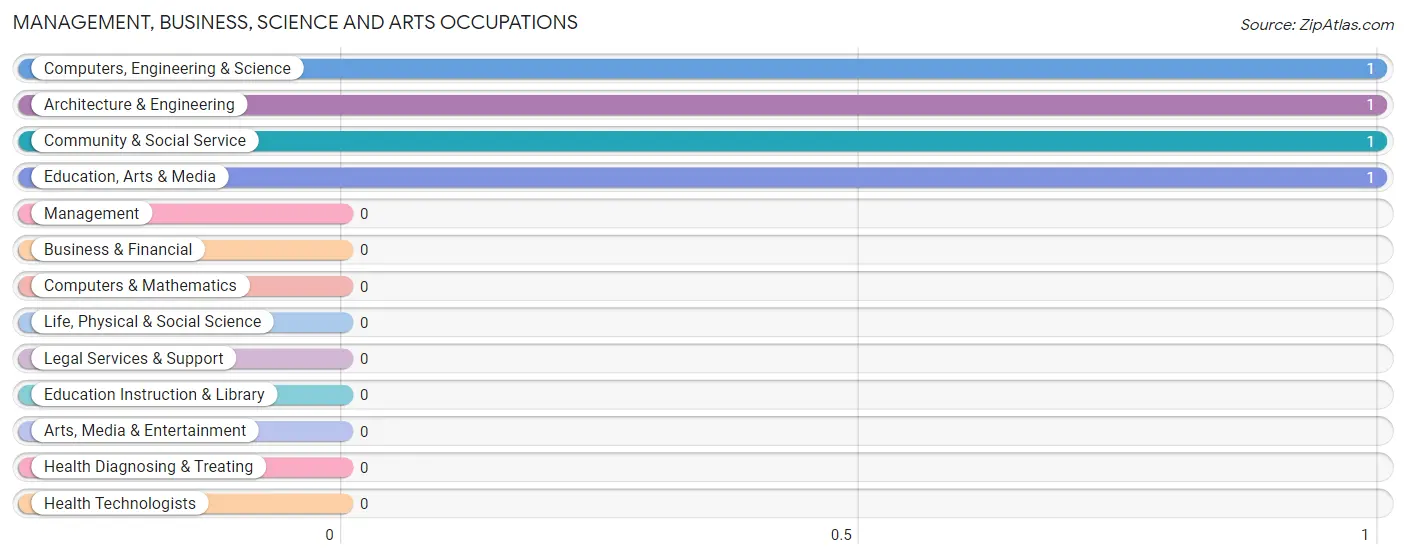
The most common Management, Business, Science and Arts occupations in Cottage Grove are Computers, Engineering & Science (1 | 6.2%), Architecture & Engineering (1 | 6.2%), Community & Social Service (1 | 6.2%), and Education, Arts & Media (1 | 6.2%).
Management, Business, Science and Arts Occupations by Sex
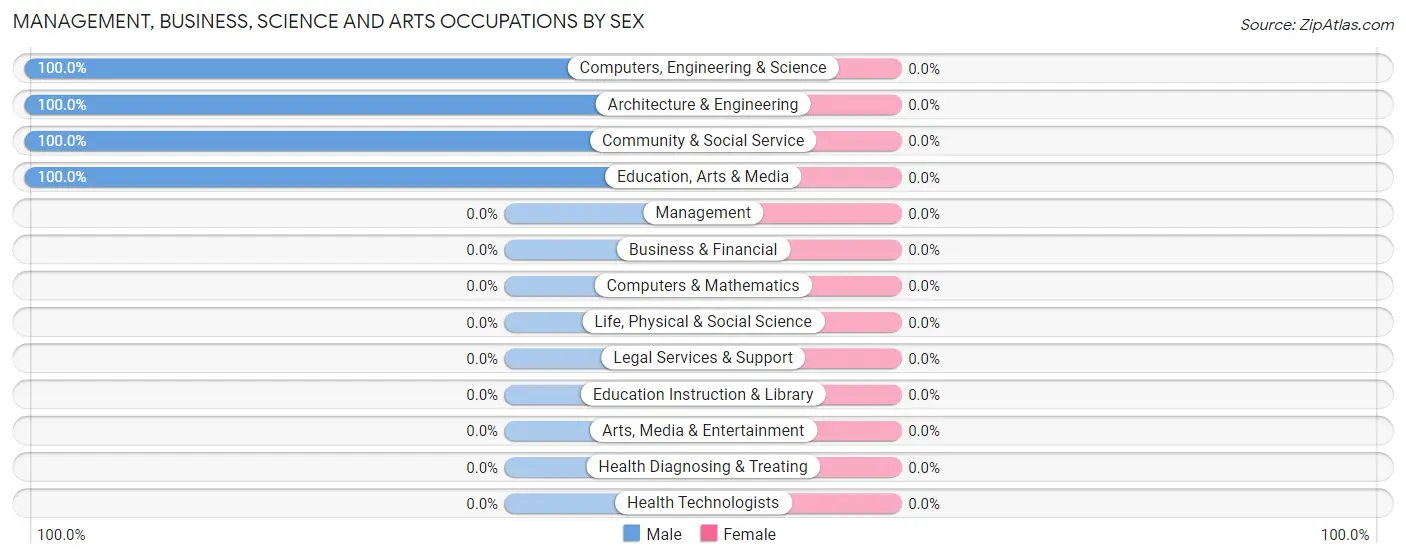
| Occupation | Male | Female |
| Management | 0 (0.0%) | 0 (0.0%) |
| Business & Financial | 0 (0.0%) | 0 (0.0%) |
| Computers, Engineering & Science | 1 (100.0%) | 0 (0.0%) |
| Computers & Mathematics | 0 (0.0%) | 0 (0.0%) |
| Architecture & Engineering | 1 (100.0%) | 0 (0.0%) |
| Life, Physical & Social Science | 0 (0.0%) | 0 (0.0%) |
| Community & Social Service | 1 (100.0%) | 0 (0.0%) |
| Education, Arts & Media | 1 (100.0%) | 0 (0.0%) |
| Legal Services & Support | 0 (0.0%) | 0 (0.0%) |
| Education Instruction & Library | 0 (0.0%) | 0 (0.0%) |
| Arts, Media & Entertainment | 0 (0.0%) | 0 (0.0%) |
| Health Diagnosing & Treating | 0 (0.0%) | 0 (0.0%) |
| Health Technologists | 0 (0.0%) | 0 (0.0%) |
| Total (Category) | 2 (100.0%) | 0 (0.0%) |
| Total (Overall) | 10 (62.5%) | 6 (37.5%) |
Services Occupations
The most common Services occupations in Cottage Grove are , and Healthcare Support (1 | 6.2%).
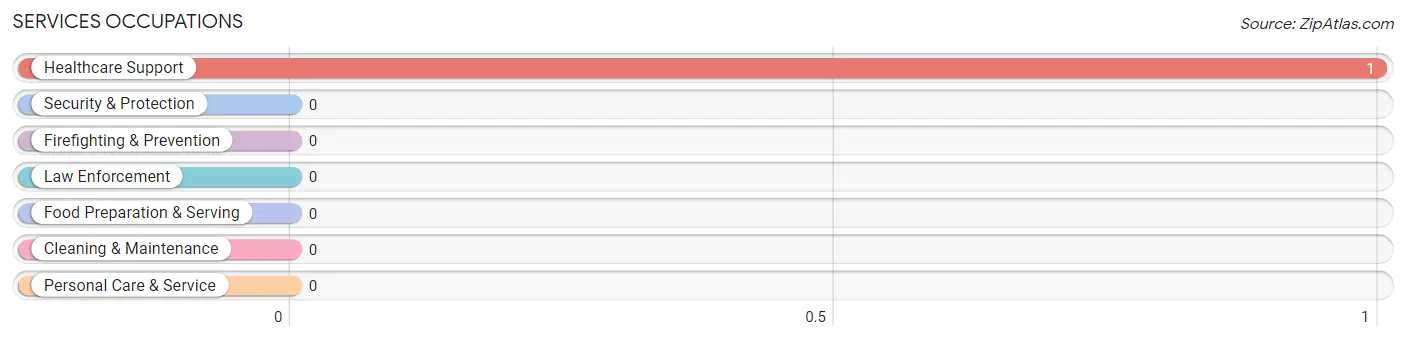
Services Occupations by Sex
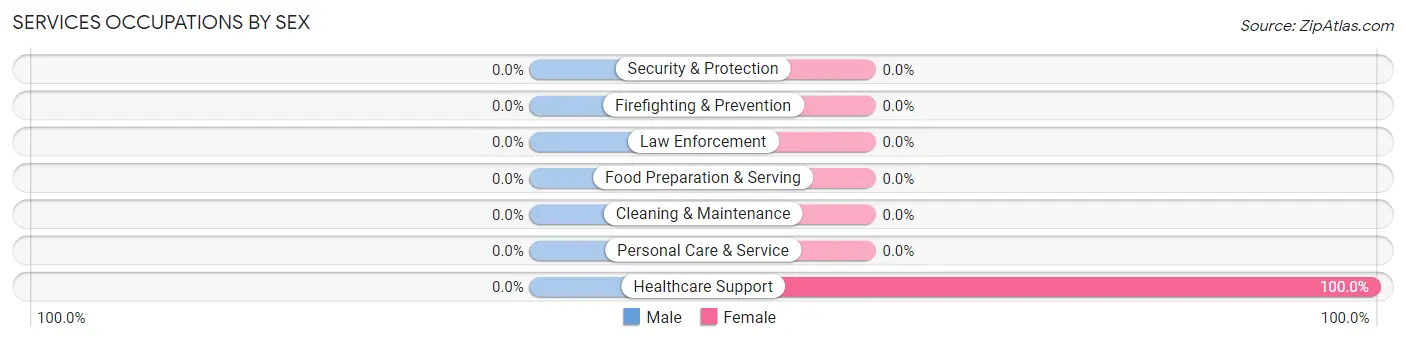
| Occupation | Male | Female |
| Healthcare Support | 0 (0.0%) | 1 (100.0%) |
| Security & Protection | 0 (0.0%) | 0 (0.0%) |
| Firefighting & Prevention | 0 (0.0%) | 0 (0.0%) |
| Law Enforcement | 0 (0.0%) | 0 (0.0%) |
| Food Preparation & Serving | 0 (0.0%) | 0 (0.0%) |
| Cleaning & Maintenance | 0 (0.0%) | 0 (0.0%) |
| Personal Care & Service | 0 (0.0%) | 0 (0.0%) |
| Total (Category) | 0 (0.0%) | 1 (100.0%) |
| Total (Overall) | 10 (62.5%) | 6 (37.5%) |
Sales and Office Occupations
The most common Sales and Office occupations in Cottage Grove are Office & Administration (3 | 18.8%), and Sales & Related (2 | 12.5%).
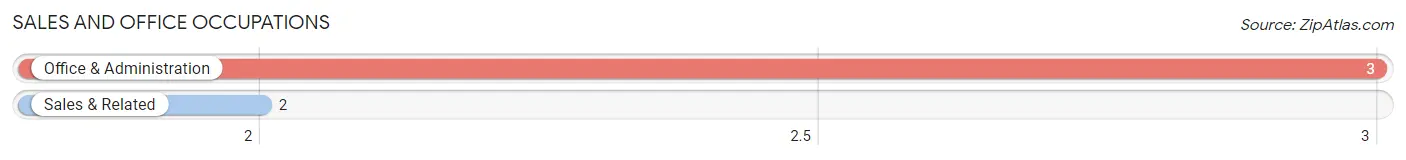
Sales and Office Occupations by Sex
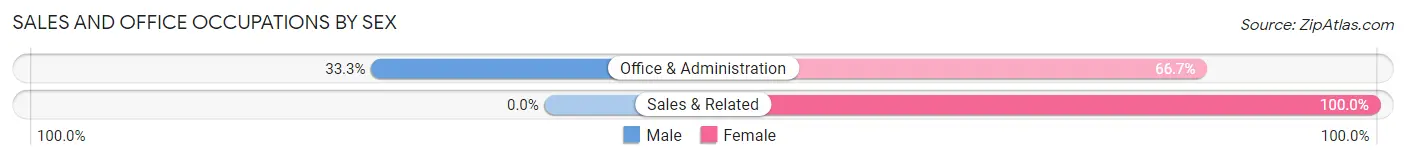
| Occupation | Male | Female |
| Sales & Related | 0 (0.0%) | 2 (100.0%) |
| Office & Administration | 1 (33.3%) | 2 (66.7%) |
| Total (Category) | 1 (20.0%) | 4 (80.0%) |
| Total (Overall) | 10 (62.5%) | 6 (37.5%) |
Natural Resources, Construction and Maintenance Occupations
The most common Natural Resources, Construction and Maintenance occupations in Cottage Grove are , and Installation, Maintenance & Repair (4 | 25.0%).
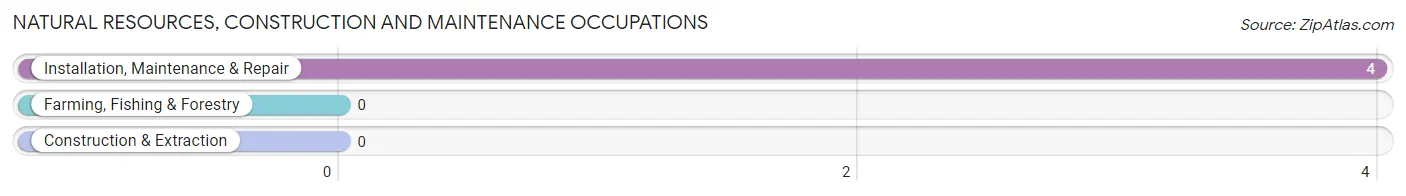
Natural Resources, Construction and Maintenance Occupations by Sex
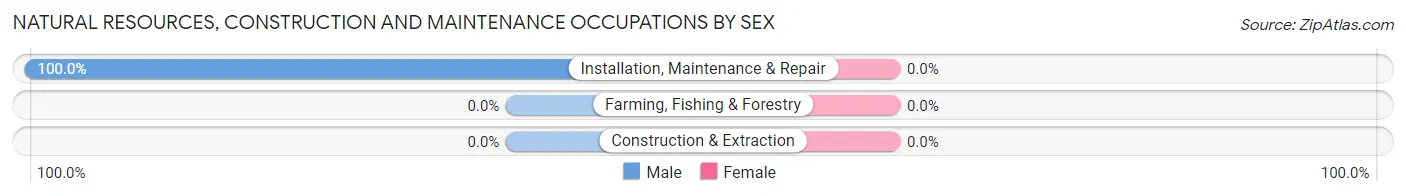
| Occupation | Male | Female |
| Farming, Fishing & Forestry | 0 (0.0%) | 0 (0.0%) |
| Construction & Extraction | 0 (0.0%) | 0 (0.0%) |
| Installation, Maintenance & Repair | 4 (100.0%) | 0 (0.0%) |
| Total (Category) | 4 (100.0%) | 0 (0.0%) |
| Total (Overall) | 10 (62.5%) | 6 (37.5%) |
Production, Transportation and Moving Occupations
The most common Production, Transportation and Moving occupations in Cottage Grove are Production (2 | 12.5%), and Transportation (2 | 12.5%).
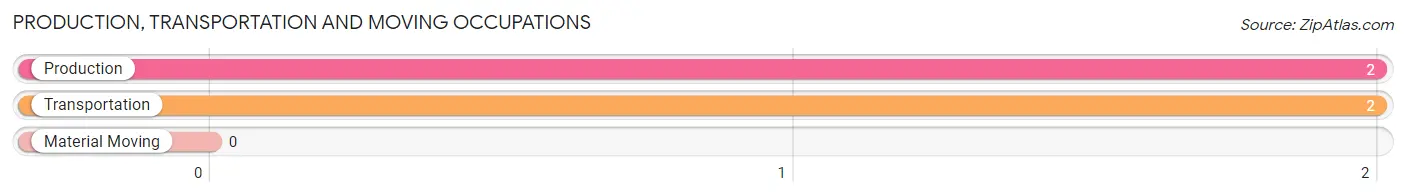
Production, Transportation and Moving Occupations by Sex
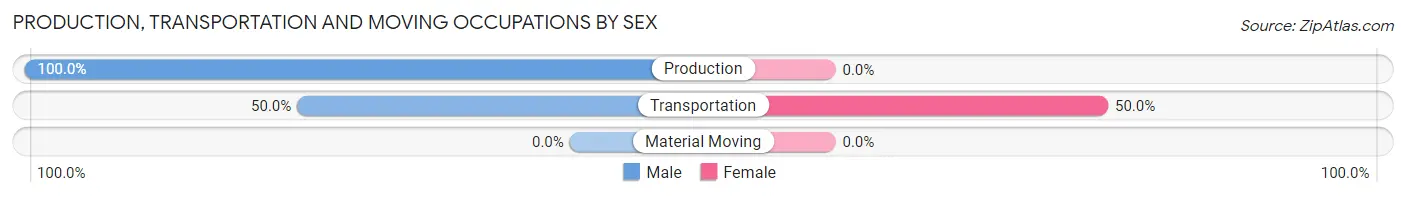
| Occupation | Male | Female |
| Production | 2 (100.0%) | 0 (0.0%) |
| Transportation | 1 (50.0%) | 1 (50.0%) |
| Material Moving | 0 (0.0%) | 0 (0.0%) |
| Total (Category) | 3 (75.0%) | 1 (25.0%) |
| Total (Overall) | 10 (62.5%) | 6 (37.5%) |
Employment Industries by Sex in Cottage Grove
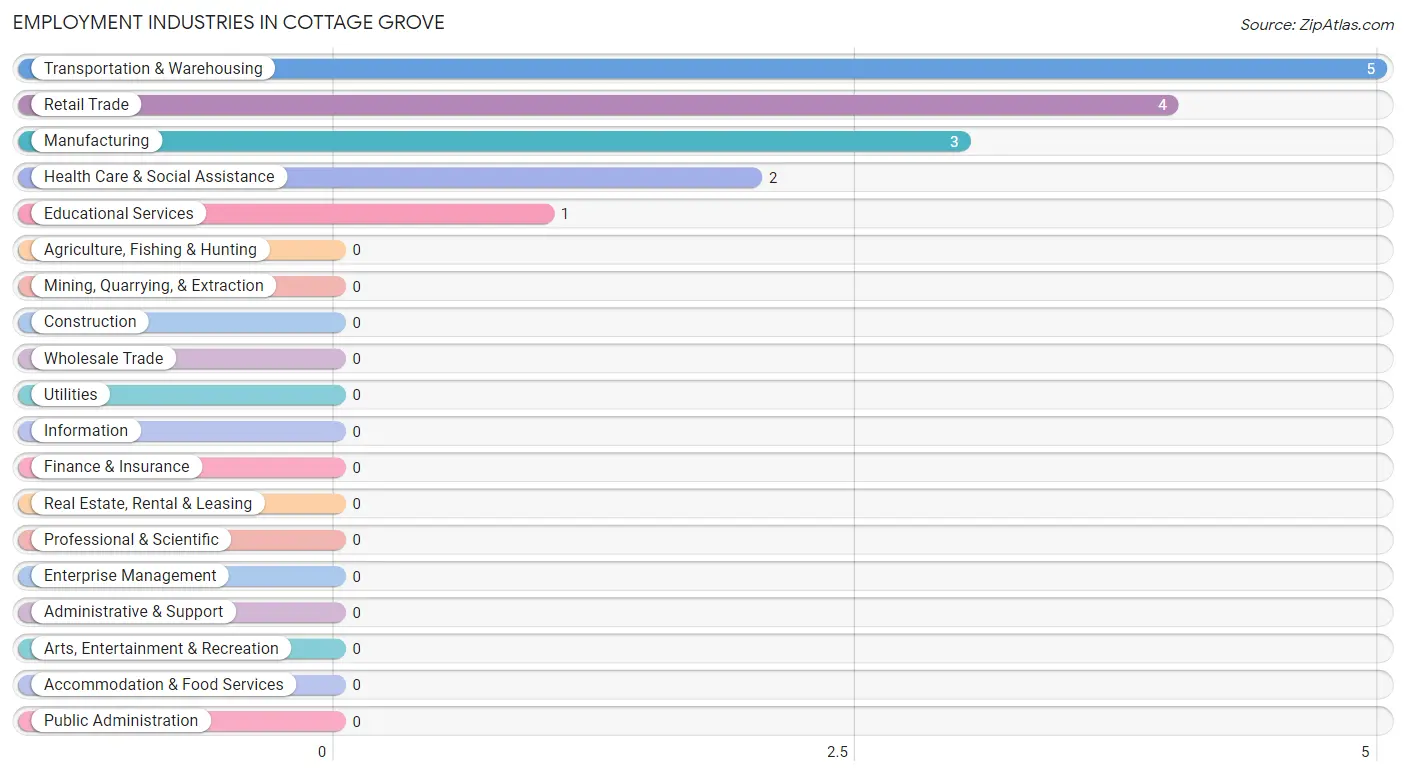
Employment Industries in Cottage Grove
The major employment industries in Cottage Grove include Transportation & Warehousing (5 | 31.2%), Retail Trade (4 | 25.0%), Manufacturing (3 | 18.8%), Health Care & Social Assistance (2 | 12.5%), and Educational Services (1 | 6.2%).
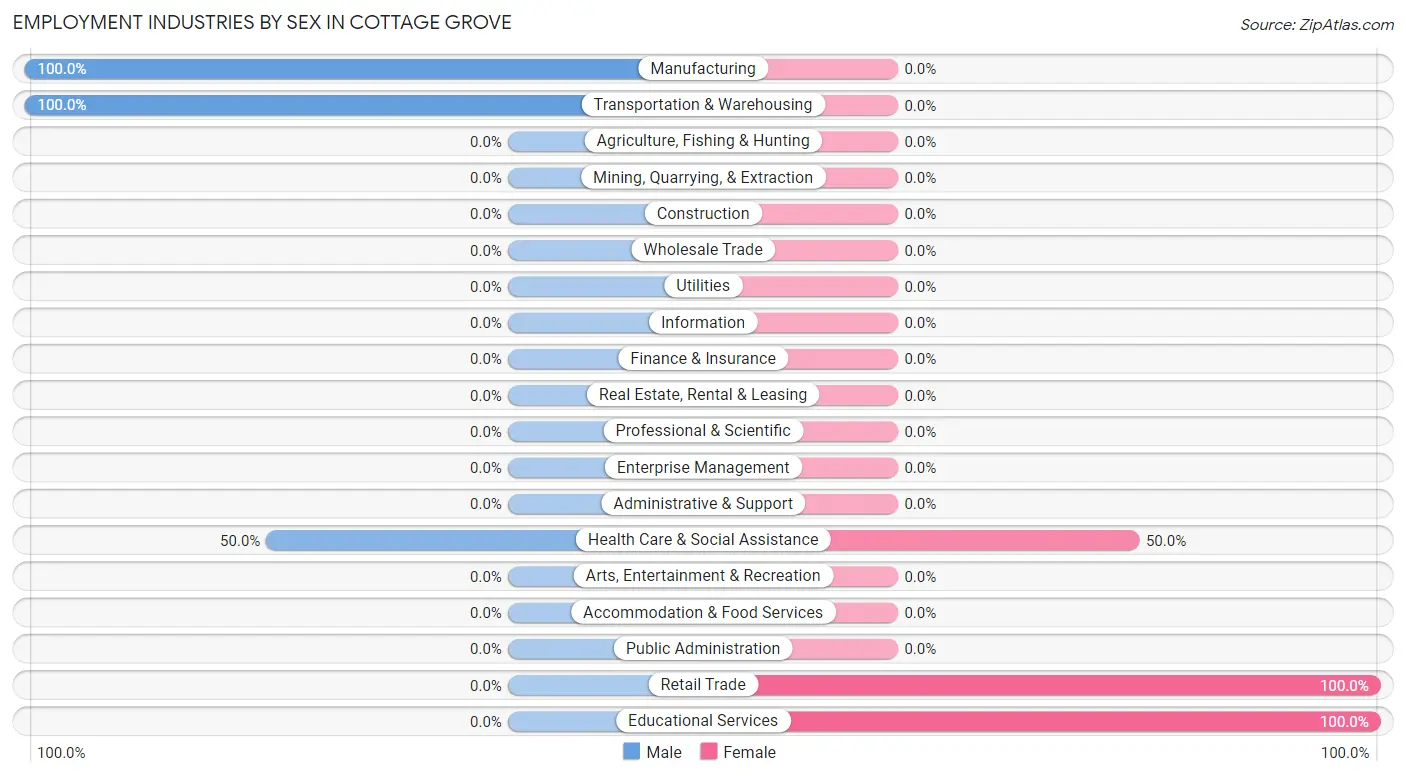
Employment Industries by Sex in Cottage Grove
The Cottage Grove industries that see more men than women are Manufacturing (100.0%), Transportation & Warehousing (100.0%), and Health Care & Social Assistance (50.0%), whereas the industries that tend to have a higher number of women are Retail Trade (100.0%), Educational Services (100.0%), and Health Care & Social Assistance (50.0%).
| Industry | Male | Female |
| Agriculture, Fishing & Hunting | 0 (0.0%) | 0 (0.0%) |
| Mining, Quarrying, & Extraction | 0 (0.0%) | 0 (0.0%) |
| Construction | 0 (0.0%) | 0 (0.0%) |
| Manufacturing | 3 (100.0%) | 0 (0.0%) |
| Wholesale Trade | 0 (0.0%) | 0 (0.0%) |
| Retail Trade | 0 (0.0%) | 4 (100.0%) |
| Transportation & Warehousing | 5 (100.0%) | 0 (0.0%) |
| Utilities | 0 (0.0%) | 0 (0.0%) |
| Information | 0 (0.0%) | 0 (0.0%) |
| Finance & Insurance | 0 (0.0%) | 0 (0.0%) |
| Real Estate, Rental & Leasing | 0 (0.0%) | 0 (0.0%) |
| Professional & Scientific | 0 (0.0%) | 0 (0.0%) |
| Enterprise Management | 0 (0.0%) | 0 (0.0%) |
| Administrative & Support | 0 (0.0%) | 0 (0.0%) |
| Educational Services | 0 (0.0%) | 1 (100.0%) |
| Health Care & Social Assistance | 1 (50.0%) | 1 (50.0%) |
| Arts, Entertainment & Recreation | 0 (0.0%) | 0 (0.0%) |
| Accommodation & Food Services | 0 (0.0%) | 0 (0.0%) |
| Public Administration | 0 (0.0%) | 0 (0.0%) |
| Total | 10 (62.5%) | 6 (37.5%) |
Education in Cottage Grove
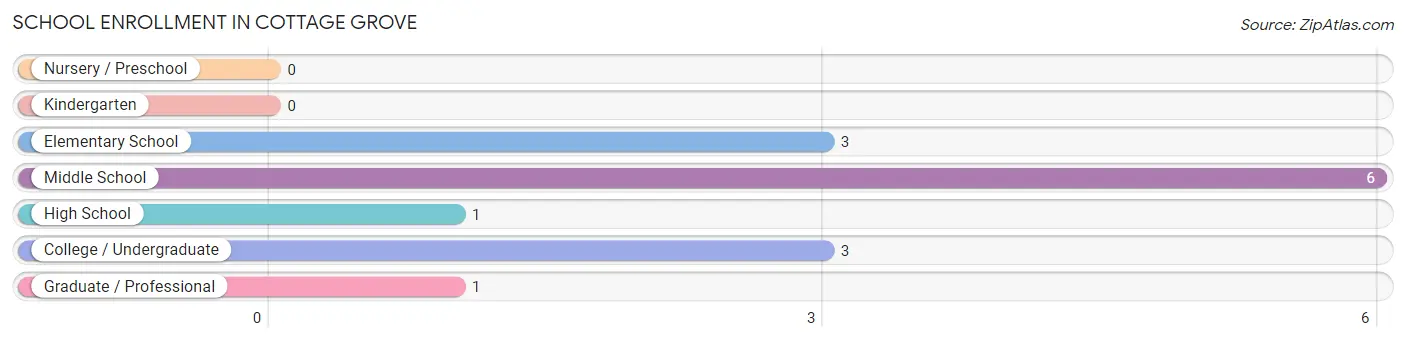
School Enrollment in Cottage Grove
The most common levels of schooling among the 14 students in Cottage Grove are middle school (6 | 42.9%), elementary school (3 | 21.4%), and college / undergraduate (3 | 21.4%).
| School Level | # Students | % Students |
| Nursery / Preschool | 0 | 0.0% |
| Kindergarten | 0 | 0.0% |
| Elementary School | 3 | 21.4% |
| Middle School | 6 | 42.9% |
| High School | 1 | 7.1% |
| College / Undergraduate | 3 | 21.4% |
| Graduate / Professional | 1 | 7.1% |
| Total | 14 | 100.0% |
School Enrollment by Age by Funding Source in Cottage Grove
Out of a total of 14 students who are enrolled in schools in Cottage Grove, 2 (14.3%) attend a private institution, while the remaining 12 (85.7%) are enrolled in public schools. The age group of 25 to 34 year olds has the highest likelihood of being enrolled in private schools, with 1 (50.0% in the age bracket) enrolled. Conversely, the age group of 10 to 14 year olds has the lowest likelihood of being enrolled in a private school, with 7 (100.0% in the age bracket) attending a public institution.
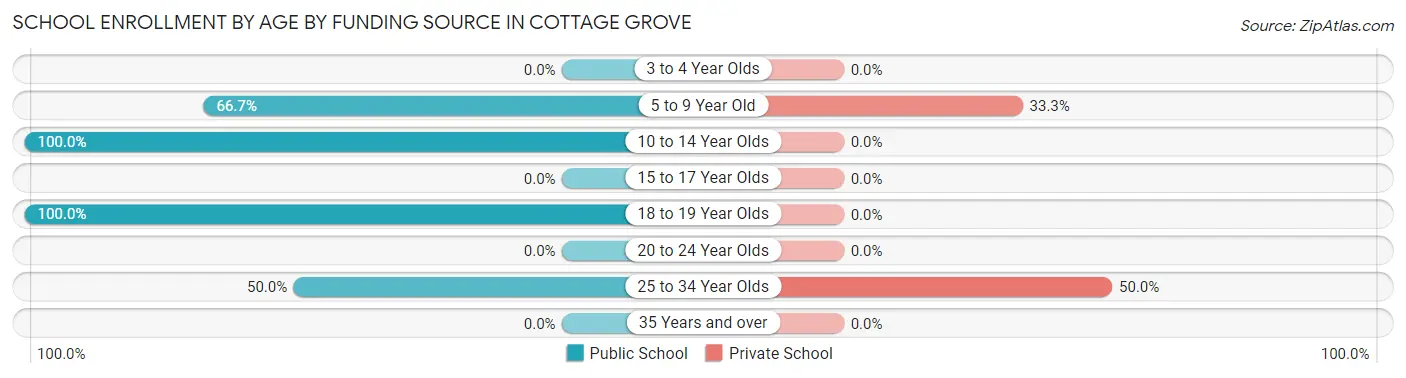
| Age Bracket | Public School | Private School |
| 3 to 4 Year Olds | 0 (0.0%) | 0 (0.0%) |
| 5 to 9 Year Old | 2 (66.7%) | 1 (33.3%) |
| 10 to 14 Year Olds | 7 (100.0%) | 0 (0.0%) |
| 15 to 17 Year Olds | 0 (0.0%) | 0 (0.0%) |
| 18 to 19 Year Olds | 2 (100.0%) | 0 (0.0%) |
| 20 to 24 Year Olds | 0 (0.0%) | 0 (0.0%) |
| 25 to 34 Year Olds | 1 (50.0%) | 1 (50.0%) |
| 35 Years and over | 0 (0.0%) | 0 (0.0%) |
| Total | 12 (85.7%) | 2 (14.3%) |
Educational Attainment by Field of Study in Cottage Grove
Physical & health sciences (2 | 16.7%), psychology (2 | 16.7%), liberal arts & history (2 | 16.7%), visual & performing arts (2 | 16.7%), and engineering (1 | 8.3%) are the most common fields of study among 12 individuals in Cottage Grove who have obtained a bachelor's degree or higher.
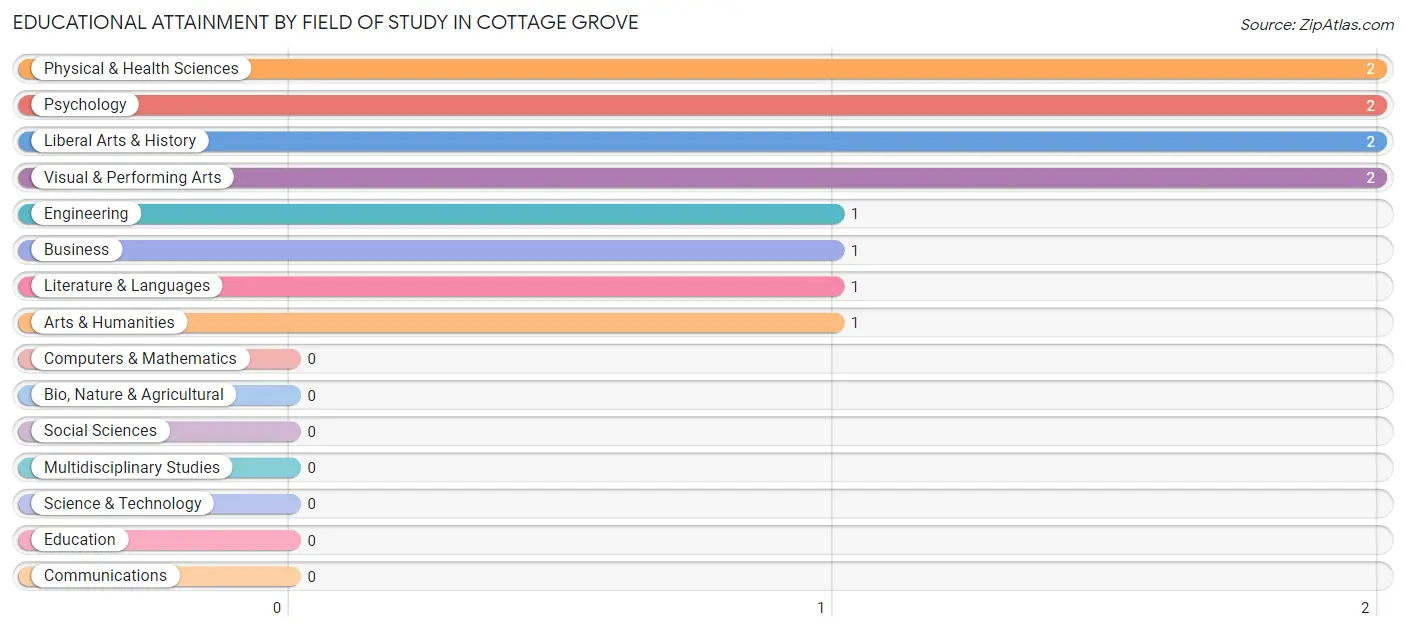
| Field of Study | # Graduates | % Graduates |
| Computers & Mathematics | 0 | 0.0% |
| Bio, Nature & Agricultural | 0 | 0.0% |
| Physical & Health Sciences | 2 | 16.7% |
| Psychology | 2 | 16.7% |
| Social Sciences | 0 | 0.0% |
| Engineering | 1 | 8.3% |
| Multidisciplinary Studies | 0 | 0.0% |
| Science & Technology | 0 | 0.0% |
| Business | 1 | 8.3% |
| Education | 0 | 0.0% |
| Literature & Languages | 1 | 8.3% |
| Liberal Arts & History | 2 | 16.7% |
| Visual & Performing Arts | 2 | 16.7% |
| Communications | 0 | 0.0% |
| Arts & Humanities | 1 | 8.3% |
| Total | 12 | 100.0% |
Transportation & Commute in Cottage Grove
Vehicle Availability by Sex in Cottage Grove
The most prevalent vehicle ownership categories in Cottage Grove are males with 2 vehicles (5, accounting for 50.0%) and females with 2 vehicles (4, making up 83.3%).
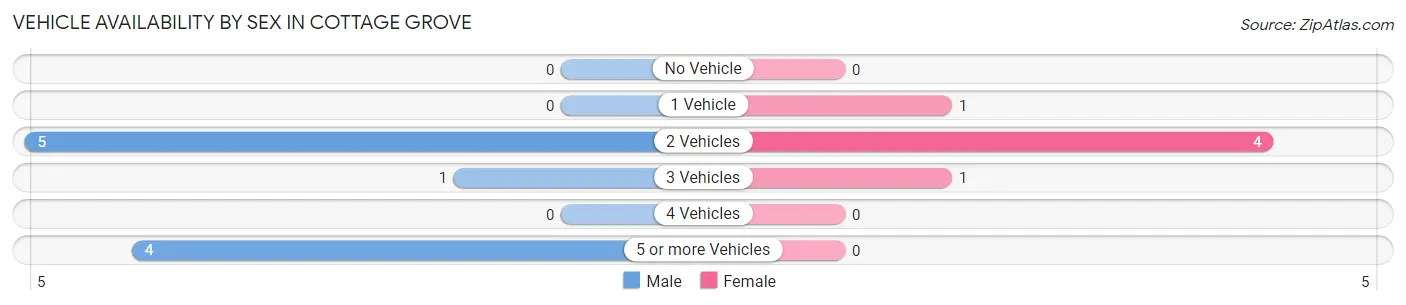
| Vehicles Available | Male | Female |
| No Vehicle | 0 (0.0%) | 0 (0.0%) |
| 1 Vehicle | 0 (0.0%) | 1 (16.7%) |
| 2 Vehicles | 5 (50.0%) | 4 (66.7%) |
| 3 Vehicles | 1 (10.0%) | 1 (16.7%) |
| 4 Vehicles | 0 (0.0%) | 0 (0.0%) |
| 5 or more Vehicles | 4 (40.0%) | 0 (0.0%) |
| Total | 10 (100.0%) | 6 (100.0%) |
Commute Time in Cottage Grove
The most frequently occuring commute durations in Cottage Grove are less than 5 minutes (3 commuters, 18.8%), 20 to 24 minutes (3 commuters, 18.8%), and 30 to 34 minutes (3 commuters, 18.8%).
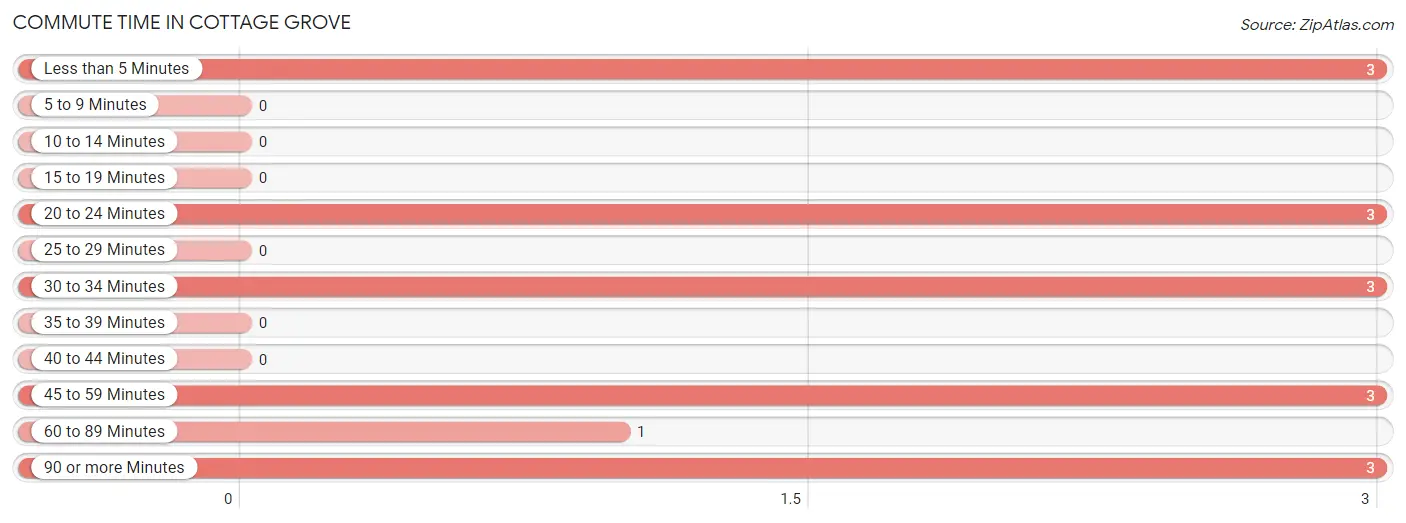
| Commute Time | # Commuters | % Commuters |
| Less than 5 Minutes | 3 | 18.8% |
| 5 to 9 Minutes | 0 | 0.0% |
| 10 to 14 Minutes | 0 | 0.0% |
| 15 to 19 Minutes | 0 | 0.0% |
| 20 to 24 Minutes | 3 | 18.8% |
| 25 to 29 Minutes | 0 | 0.0% |
| 30 to 34 Minutes | 3 | 18.8% |
| 35 to 39 Minutes | 0 | 0.0% |
| 40 to 44 Minutes | 0 | 0.0% |
| 45 to 59 Minutes | 3 | 18.8% |
| 60 to 89 Minutes | 1 | 6.2% |
| 90 or more Minutes | 3 | 18.8% |
Commute Time by Sex in Cottage Grove
The most common commute times in Cottage Grove are 20 to 24 minutes (3 commuters, 30.0%) for males and less than 5 minutes (2 commuters, 33.3%) for females.
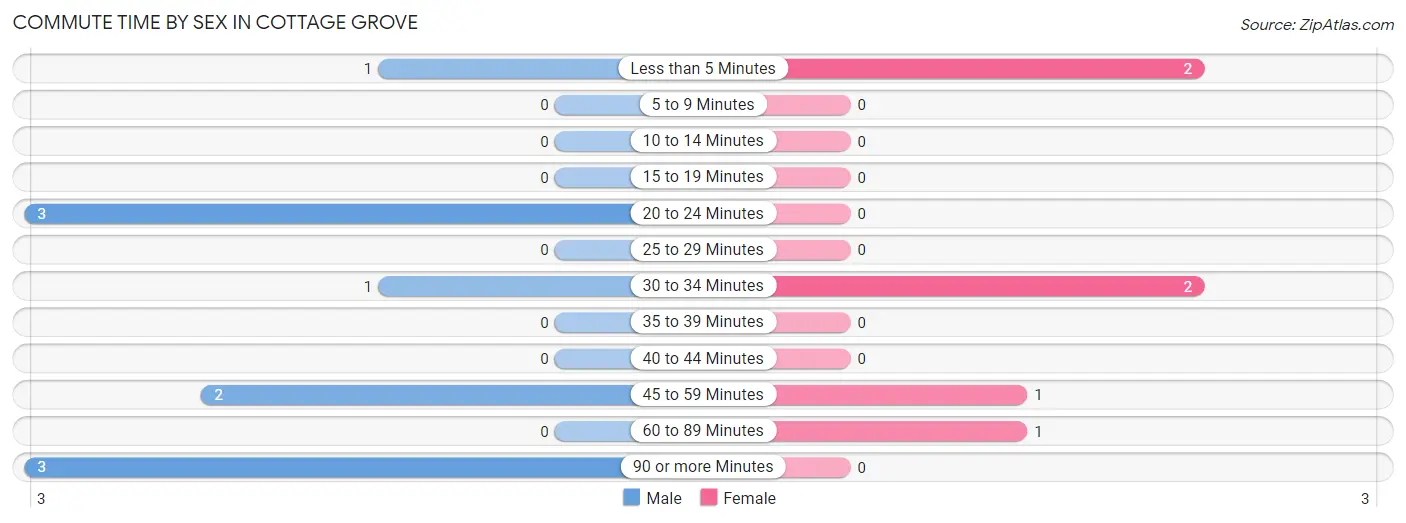
| Commute Time | Male | Female |
| Less than 5 Minutes | 1 (10.0%) | 2 (33.3%) |
| 5 to 9 Minutes | 0 (0.0%) | 0 (0.0%) |
| 10 to 14 Minutes | 0 (0.0%) | 0 (0.0%) |
| 15 to 19 Minutes | 0 (0.0%) | 0 (0.0%) |
| 20 to 24 Minutes | 3 (30.0%) | 0 (0.0%) |
| 25 to 29 Minutes | 0 (0.0%) | 0 (0.0%) |
| 30 to 34 Minutes | 1 (10.0%) | 2 (33.3%) |
| 35 to 39 Minutes | 0 (0.0%) | 0 (0.0%) |
| 40 to 44 Minutes | 0 (0.0%) | 0 (0.0%) |
| 45 to 59 Minutes | 2 (20.0%) | 1 (16.7%) |
| 60 to 89 Minutes | 0 (0.0%) | 1 (16.7%) |
| 90 or more Minutes | 3 (30.0%) | 0 (0.0%) |
Time of Departure to Work by Sex in Cottage Grove
The most frequent times of departure to work in Cottage Grove are 6:30 AM to 6:59 AM (3, 30.0%) for males and 9:00 AM to 9:59 AM (2, 33.3%) for females.
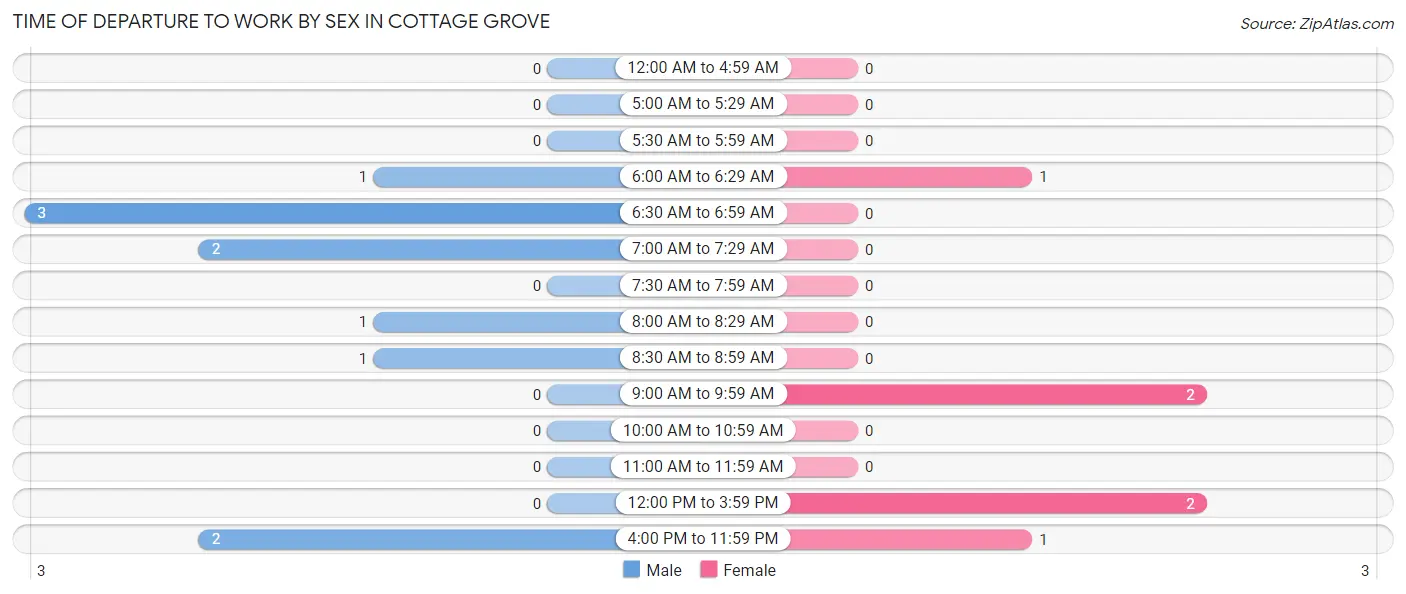
| Time of Departure | Male | Female |
| 12:00 AM to 4:59 AM | 0 (0.0%) | 0 (0.0%) |
| 5:00 AM to 5:29 AM | 0 (0.0%) | 0 (0.0%) |
| 5:30 AM to 5:59 AM | 0 (0.0%) | 0 (0.0%) |
| 6:00 AM to 6:29 AM | 1 (10.0%) | 1 (16.7%) |
| 6:30 AM to 6:59 AM | 3 (30.0%) | 0 (0.0%) |
| 7:00 AM to 7:29 AM | 2 (20.0%) | 0 (0.0%) |
| 7:30 AM to 7:59 AM | 0 (0.0%) | 0 (0.0%) |
| 8:00 AM to 8:29 AM | 1 (10.0%) | 0 (0.0%) |
| 8:30 AM to 8:59 AM | 1 (10.0%) | 0 (0.0%) |
| 9:00 AM to 9:59 AM | 0 (0.0%) | 2 (33.3%) |
| 10:00 AM to 10:59 AM | 0 (0.0%) | 0 (0.0%) |
| 11:00 AM to 11:59 AM | 0 (0.0%) | 0 (0.0%) |
| 12:00 PM to 3:59 PM | 0 (0.0%) | 2 (33.3%) |
| 4:00 PM to 11:59 PM | 2 (20.0%) | 1 (16.7%) |
| Total | 10 (100.0%) | 6 (100.0%) |
Housing Occupancy in Cottage Grove
Occupancy by Ownership in Cottage Grove
Of the total 19 dwellings in Cottage Grove, owner-occupied units account for 16 (84.2%), while renter-occupied units make up 3 (15.8%).
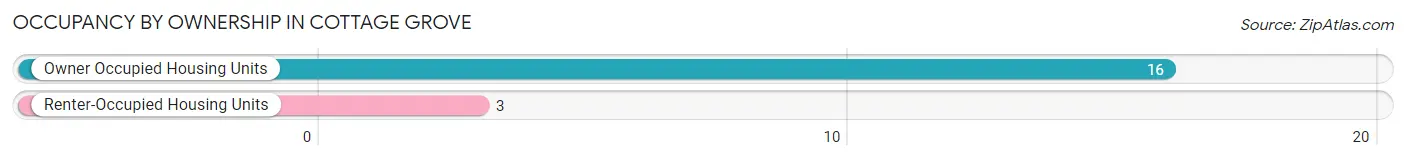
| Occupancy | # Housing Units | % Housing Units |
| Owner Occupied Housing Units | 16 | 84.2% |
| Renter-Occupied Housing Units | 3 | 15.8% |
| Total Occupied Housing Units | 19 | 100.0% |
Occupancy by Household Size in Cottage Grove
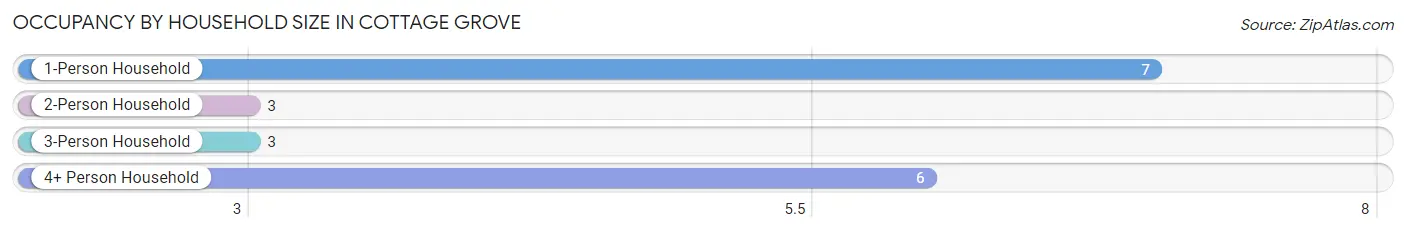
| Household Size | # Housing Units | % Housing Units |
| 1-Person Household | 7 | 36.8% |
| 2-Person Household | 3 | 15.8% |
| 3-Person Household | 3 | 15.8% |
| 4+ Person Household | 6 | 31.6% |
| Total Housing Units | 19 | 100.0% |
Occupancy by Ownership by Household Size in Cottage Grove
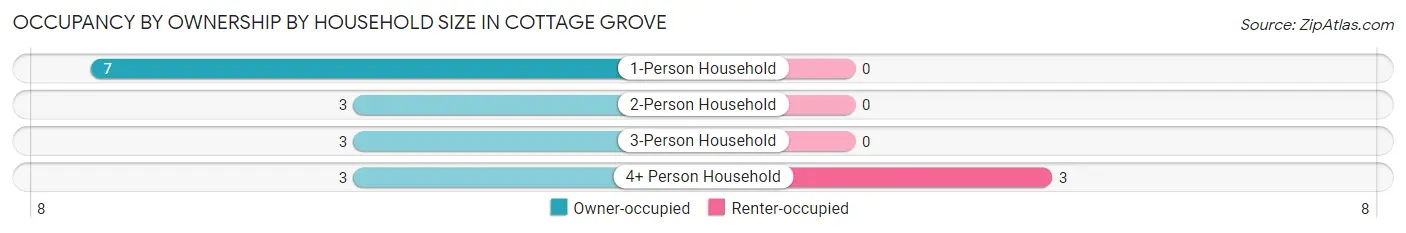
| Household Size | Owner-occupied | Renter-occupied |
| 1-Person Household | 7 (100.0%) | 0 (0.0%) |
| 2-Person Household | 3 (100.0%) | 0 (0.0%) |
| 3-Person Household | 3 (100.0%) | 0 (0.0%) |
| 4+ Person Household | 3 (50.0%) | 3 (50.0%) |
| Total Housing Units | 16 (84.2%) | 3 (15.8%) |
Occupancy by Educational Attainment in Cottage Grove
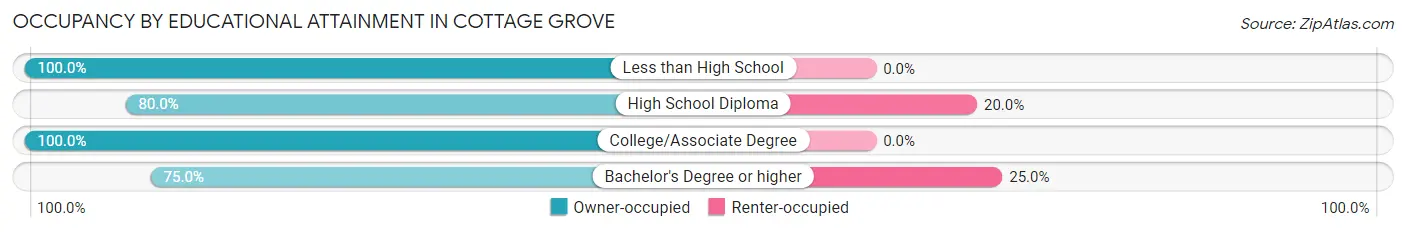
| Household Size | Owner-occupied | Renter-occupied |
| Less than High School | 2 (100.0%) | 0 (0.0%) |
| High School Diploma | 8 (80.0%) | 2 (20.0%) |
| College/Associate Degree | 3 (100.0%) | 0 (0.0%) |
| Bachelor's Degree or higher | 3 (75.0%) | 1 (25.0%) |
Occupancy by Age of Householder in Cottage Grove
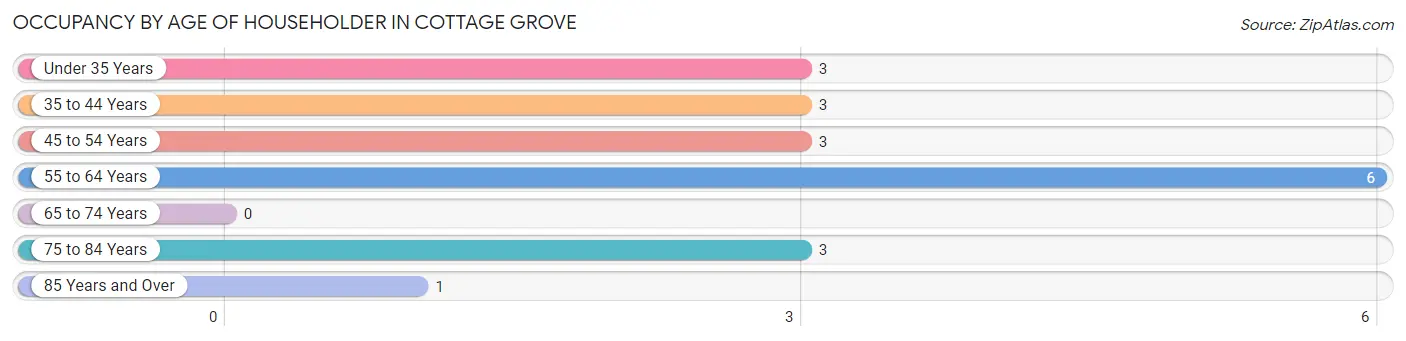
| Age Bracket | # Households | % Households |
| Under 35 Years | 3 | 15.8% |
| 35 to 44 Years | 3 | 15.8% |
| 45 to 54 Years | 3 | 15.8% |
| 55 to 64 Years | 6 | 31.6% |
| 65 to 74 Years | 0 | 0.0% |
| 75 to 84 Years | 3 | 15.8% |
| 85 Years and Over | 1 | 5.3% |
| Total | 19 | 100.0% |
Housing Finances in Cottage Grove
Median Income by Occupancy in Cottage Grove
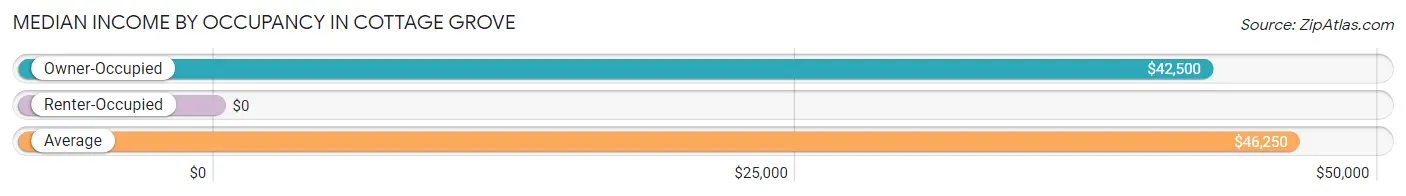
| Occupancy Type | # Households | Median Income |
| Owner-Occupied | 16 (84.2%) | $42,500 |
| Renter-Occupied | 3 (15.8%) | $0 |
| Average | 19 (100.0%) | $46,250 |
Occupancy by Householder Income Bracket in Cottage Grove
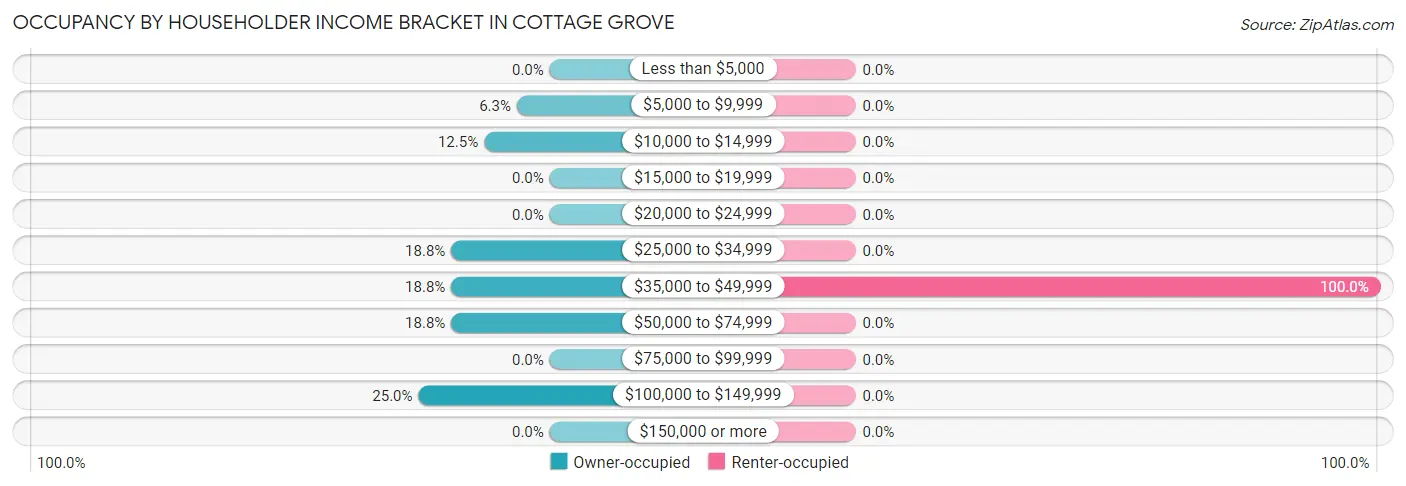
| Income Bracket | Owner-occupied | Renter-occupied |
| Less than $5,000 | 0 (0.0%) | 0 (0.0%) |
| $5,000 to $9,999 | 1 (6.2%) | 0 (0.0%) |
| $10,000 to $14,999 | 2 (12.5%) | 0 (0.0%) |
| $15,000 to $19,999 | 0 (0.0%) | 0 (0.0%) |
| $20,000 to $24,999 | 0 (0.0%) | 0 (0.0%) |
| $25,000 to $34,999 | 3 (18.8%) | 0 (0.0%) |
| $35,000 to $49,999 | 3 (18.8%) | 3 (100.0%) |
| $50,000 to $74,999 | 3 (18.8%) | 0 (0.0%) |
| $75,000 to $99,999 | 0 (0.0%) | 0 (0.0%) |
| $100,000 to $149,999 | 4 (25.0%) | 0 (0.0%) |
| $150,000 or more | 0 (0.0%) | 0 (0.0%) |
| Total | 16 (100.0%) | 3 (100.0%) |
Monthly Housing Cost Tiers in Cottage Grove
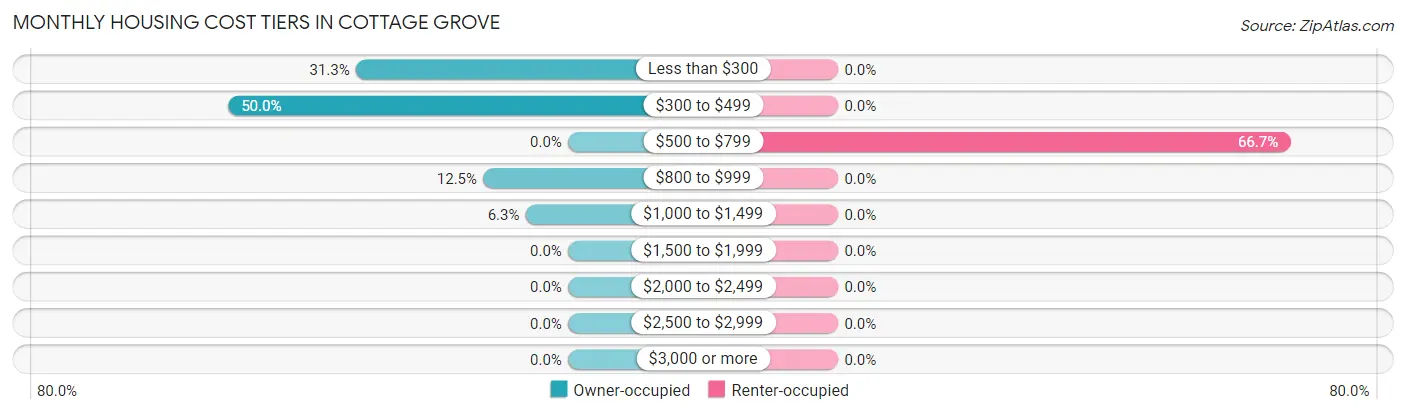
| Monthly Cost | Owner-occupied | Renter-occupied |
| Less than $300 | 5 (31.2%) | 0 (0.0%) |
| $300 to $499 | 8 (50.0%) | 0 (0.0%) |
| $500 to $799 | 0 (0.0%) | 2 (66.7%) |
| $800 to $999 | 2 (12.5%) | 0 (0.0%) |
| $1,000 to $1,499 | 1 (6.2%) | 0 (0.0%) |
| $1,500 to $1,999 | 0 (0.0%) | 0 (0.0%) |
| $2,000 to $2,499 | 0 (0.0%) | 0 (0.0%) |
| $2,500 to $2,999 | 0 (0.0%) | 0 (0.0%) |
| $3,000 or more | 0 (0.0%) | 0 (0.0%) |
| Total | 16 (100.0%) | 3 (100.0%) |
Physical Housing Characteristics in Cottage Grove
Housing Structures in Cottage Grove
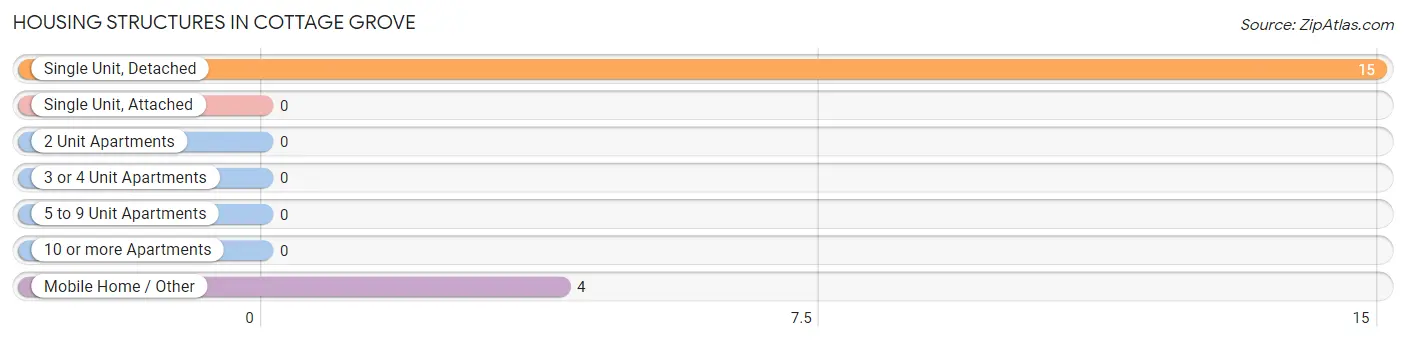
| Structure Type | # Housing Units | % Housing Units |
| Single Unit, Detached | 15 | 78.9% |
| Single Unit, Attached | 0 | 0.0% |
| 2 Unit Apartments | 0 | 0.0% |
| 3 or 4 Unit Apartments | 0 | 0.0% |
| 5 to 9 Unit Apartments | 0 | 0.0% |
| 10 or more Apartments | 0 | 0.0% |
| Mobile Home / Other | 4 | 21.0% |
| Total | 19 | 100.0% |
Housing Structures by Occupancy in Cottage Grove
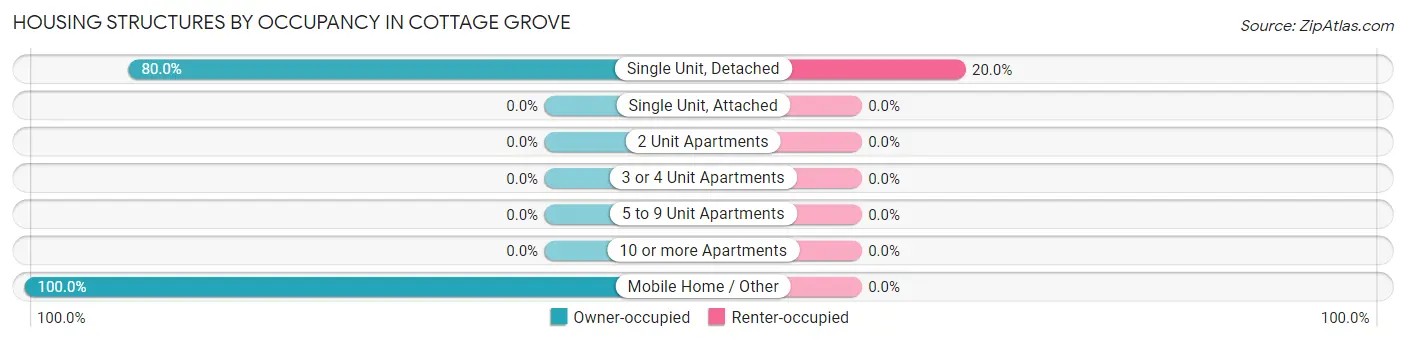
| Structure Type | Owner-occupied | Renter-occupied |
| Single Unit, Detached | 12 (80.0%) | 3 (20.0%) |
| Single Unit, Attached | 0 (0.0%) | 0 (0.0%) |
| 2 Unit Apartments | 0 (0.0%) | 0 (0.0%) |
| 3 or 4 Unit Apartments | 0 (0.0%) | 0 (0.0%) |
| 5 to 9 Unit Apartments | 0 (0.0%) | 0 (0.0%) |
| 10 or more Apartments | 0 (0.0%) | 0 (0.0%) |
| Mobile Home / Other | 4 (100.0%) | 0 (0.0%) |
| Total | 16 (84.2%) | 3 (15.8%) |
Housing Structures by Number of Rooms in Cottage Grove
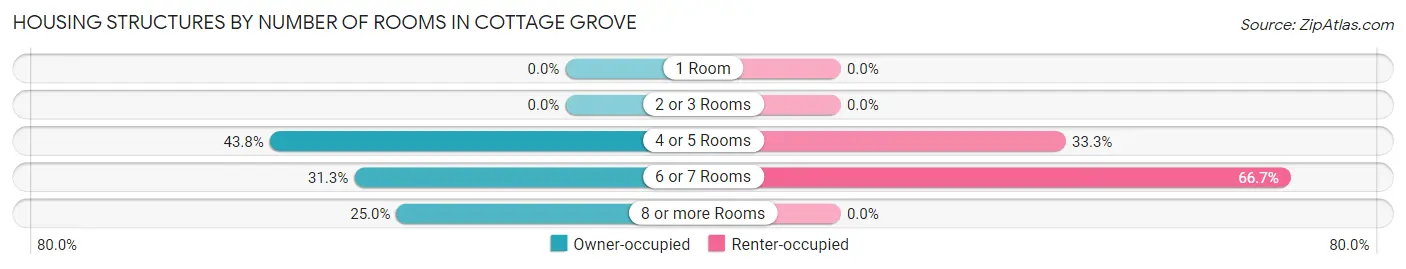
| Number of Rooms | Owner-occupied | Renter-occupied |
| 1 Room | 0 (0.0%) | 0 (0.0%) |
| 2 or 3 Rooms | 0 (0.0%) | 0 (0.0%) |
| 4 or 5 Rooms | 7 (43.8%) | 1 (33.3%) |
| 6 or 7 Rooms | 5 (31.2%) | 2 (66.7%) |
| 8 or more Rooms | 4 (25.0%) | 0 (0.0%) |
| Total | 16 (100.0%) | 3 (100.0%) |
Housing Structure by Heating Type in Cottage Grove
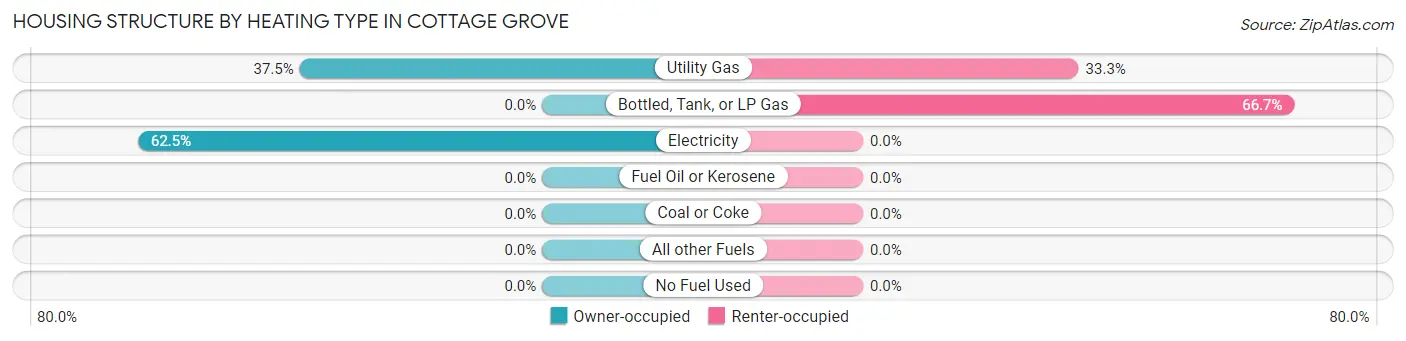
| Heating Type | Owner-occupied | Renter-occupied |
| Utility Gas | 6 (37.5%) | 1 (33.3%) |
| Bottled, Tank, or LP Gas | 0 (0.0%) | 2 (66.7%) |
| Electricity | 10 (62.5%) | 0 (0.0%) |
| Fuel Oil or Kerosene | 0 (0.0%) | 0 (0.0%) |
| Coal or Coke | 0 (0.0%) | 0 (0.0%) |
| All other Fuels | 0 (0.0%) | 0 (0.0%) |
| No Fuel Used | 0 (0.0%) | 0 (0.0%) |
| Total | 16 (100.0%) | 3 (100.0%) |
Household Vehicle Usage in Cottage Grove
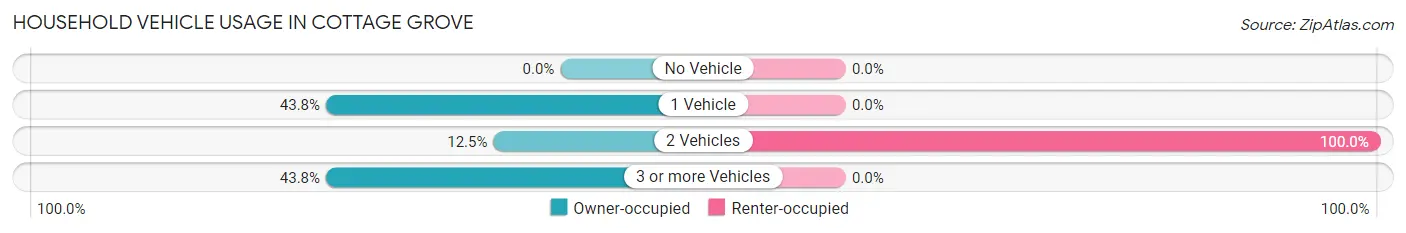
| Vehicles per Household | Owner-occupied | Renter-occupied |
| No Vehicle | 0 (0.0%) | 0 (0.0%) |
| 1 Vehicle | 7 (43.8%) | 0 (0.0%) |
| 2 Vehicles | 2 (12.5%) | 3 (100.0%) |
| 3 or more Vehicles | 7 (43.8%) | 0 (0.0%) |
| Total | 16 (100.0%) | 3 (100.0%) |
Real Estate & Mortgages in Cottage Grove
Real Estate and Mortgage Overview in Cottage Grove
| Characteristic | Without Mortgage | With Mortgage |
| Housing Units | 13 | 3 |
| Median Property Value | - | - |
| Median Household Income | $38,750 | $0 |
| Monthly Housing Costs | $369 | $0 |
| Real Estate Taxes | $217 | $0 |
Property Value by Mortgage Status in Cottage Grove
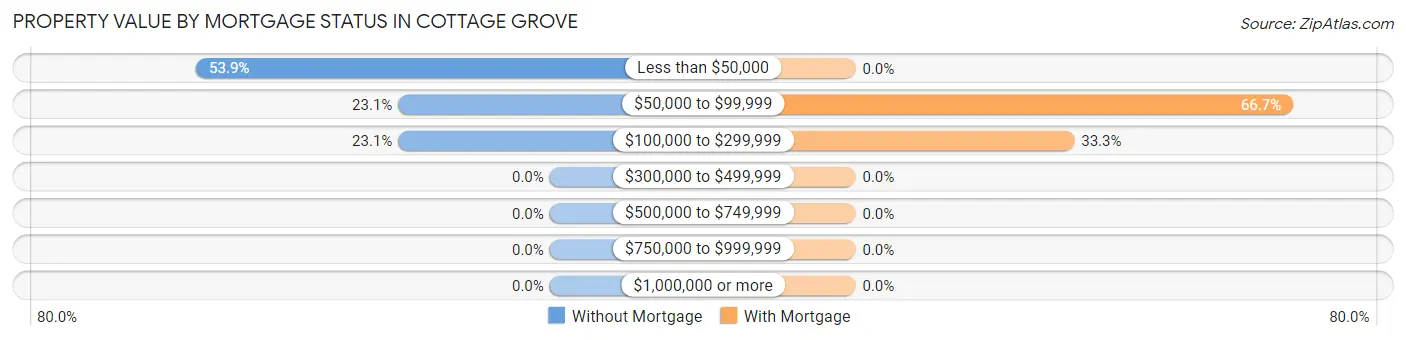
| Property Value | Without Mortgage | With Mortgage |
| Less than $50,000 | 7 (53.8%) | 0 (0.0%) |
| $50,000 to $99,999 | 3 (23.1%) | 2 (66.7%) |
| $100,000 to $299,999 | 3 (23.1%) | 1 (33.3%) |
| $300,000 to $499,999 | 0 (0.0%) | 0 (0.0%) |
| $500,000 to $749,999 | 0 (0.0%) | 0 (0.0%) |
| $750,000 to $999,999 | 0 (0.0%) | 0 (0.0%) |
| $1,000,000 or more | 0 (0.0%) | 0 (0.0%) |
| Total | 13 (100.0%) | 3 (100.0%) |
Household Income by Mortgage Status in Cottage Grove
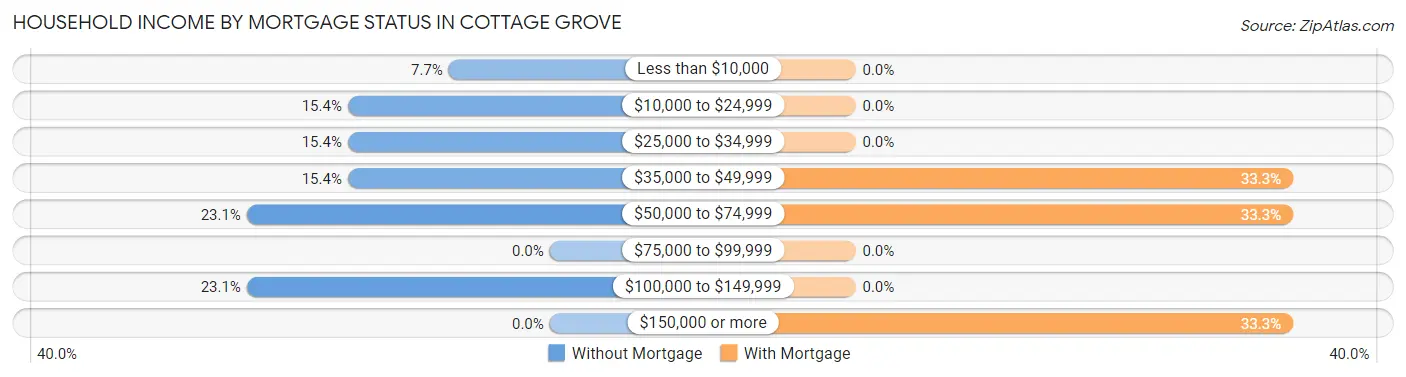
| Household Income | Without Mortgage | With Mortgage |
| Less than $10,000 | 1 (7.7%) | 0 (0.0%) |
| $10,000 to $24,999 | 2 (15.4%) | 0 (0.0%) |
| $25,000 to $34,999 | 2 (15.4%) | 0 (0.0%) |
| $35,000 to $49,999 | 2 (15.4%) | 1 (33.3%) |
| $50,000 to $74,999 | 3 (23.1%) | 1 (33.3%) |
| $75,000 to $99,999 | 0 (0.0%) | 0 (0.0%) |
| $100,000 to $149,999 | 3 (23.1%) | 0 (0.0%) |
| $150,000 or more | 0 (0.0%) | 1 (33.3%) |
| Total | 13 (100.0%) | 3 (100.0%) |
Property Value to Household Income Ratio in Cottage Grove
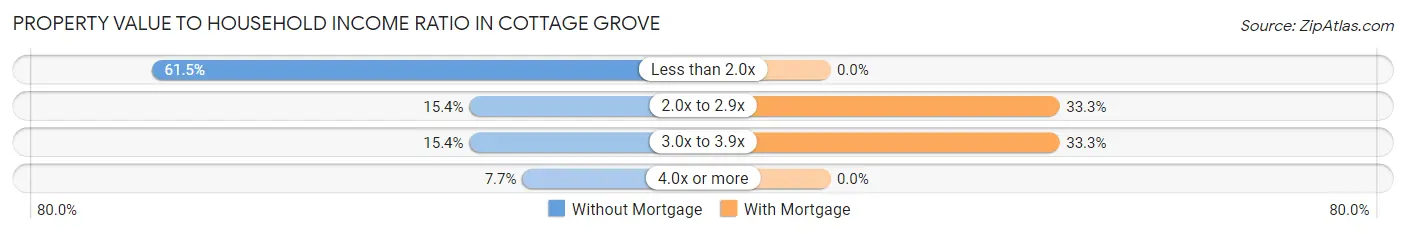
| Value-to-Income Ratio | Without Mortgage | With Mortgage |
| Less than 2.0x | 8 (61.5%) | 0 (0.0%) |
| 2.0x to 2.9x | 2 (15.4%) | 1 (33.3%) |
| 3.0x to 3.9x | 2 (15.4%) | 1 (33.3%) |
| 4.0x or more | 1 (7.7%) | 0 (0.0%) |
| Total | 13 (100.0%) | 3 (100.0%) |
Real Estate Taxes by Mortgage Status in Cottage Grove
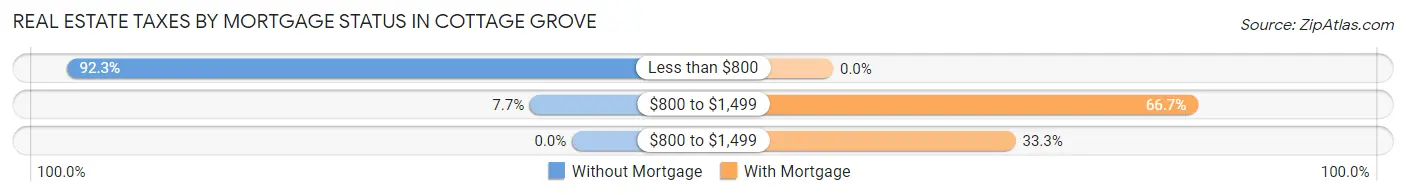
| Property Taxes | Without Mortgage | With Mortgage |
| Less than $800 | 12 (92.3%) | 0 (0.0%) |
| $800 to $1,499 | 1 (7.7%) | 2 (66.7%) |
| $800 to $1,499 | 0 (0.0%) | 1 (33.3%) |
| Total | 13 (100.0%) | 3 (100.0%) |
Health & Disability in Cottage Grove
Health Insurance Coverage by Age in Cottage Grove
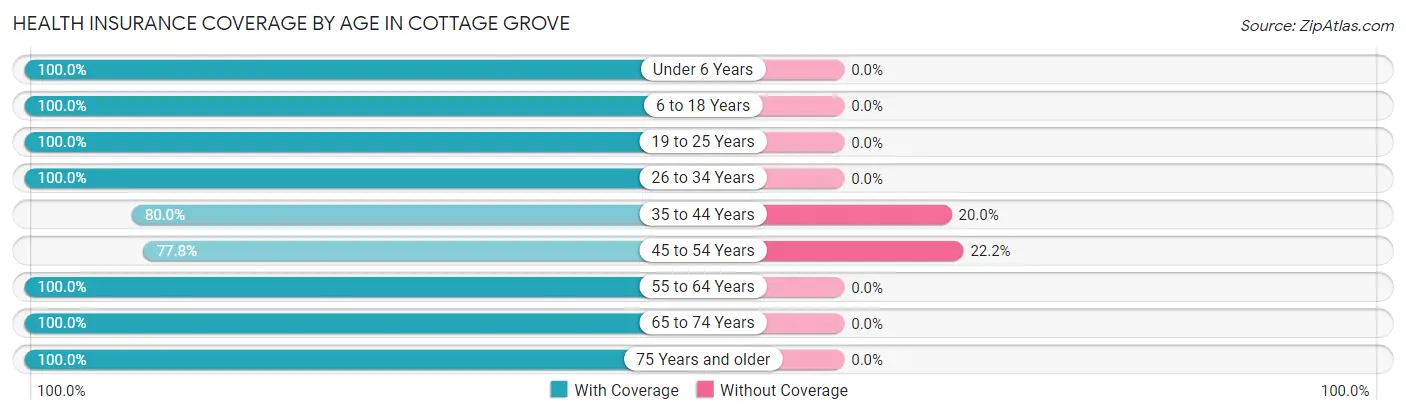
| Age Bracket | With Coverage | Without Coverage |
| Under 6 Years | 6 (100.0%) | 0 (0.0%) |
| 6 to 18 Years | 10 (100.0%) | 0 (0.0%) |
| 19 to 25 Years | 2 (100.0%) | 0 (0.0%) |
| 26 to 34 Years | 10 (100.0%) | 0 (0.0%) |
| 35 to 44 Years | 4 (80.0%) | 1 (20.0%) |
| 45 to 54 Years | 7 (77.8%) | 2 (22.2%) |
| 55 to 64 Years | 7 (100.0%) | 0 (0.0%) |
| 65 to 74 Years | 3 (100.0%) | 0 (0.0%) |
| 75 Years and older | 5 (100.0%) | 0 (0.0%) |
| Total | 54 (94.7%) | 3 (5.3%) |
Health Insurance Coverage by Citizenship Status in Cottage Grove
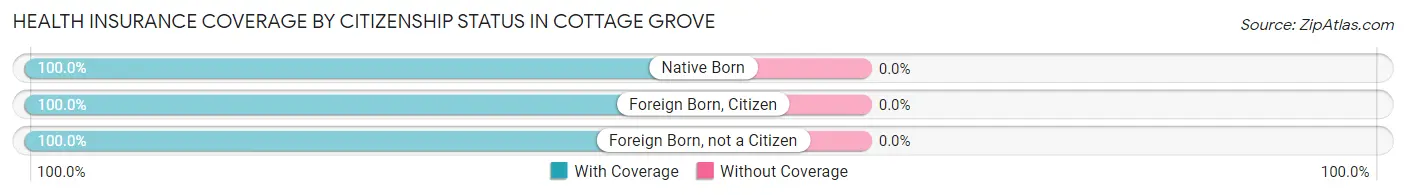
| Citizenship Status | With Coverage | Without Coverage |
| Native Born | 6 (100.0%) | 0 (0.0%) |
| Foreign Born, Citizen | 10 (100.0%) | 0 (0.0%) |
| Foreign Born, not a Citizen | 2 (100.0%) | 0 (0.0%) |
Health Insurance Coverage by Household Income in Cottage Grove
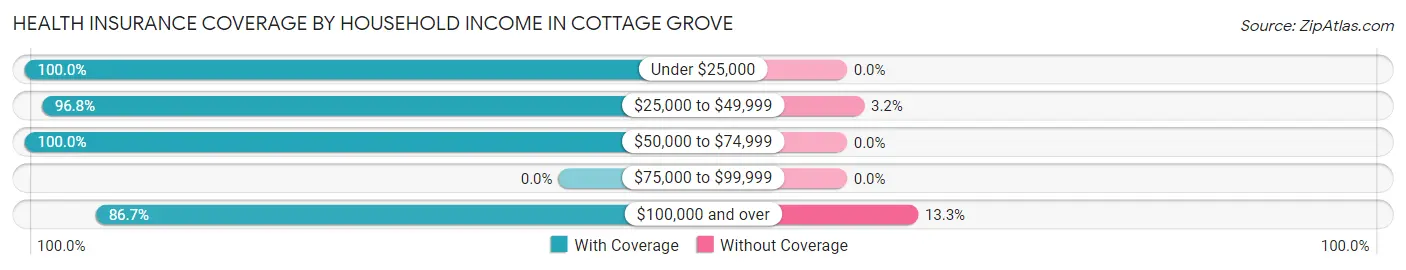
| Household Income | With Coverage | Without Coverage |
| Under $25,000 | 3 (100.0%) | 0 (0.0%) |
| $25,000 to $49,999 | 30 (96.8%) | 1 (3.2%) |
| $50,000 to $74,999 | 8 (100.0%) | 0 (0.0%) |
| $75,000 to $99,999 | 0 (0.0%) | 0 (0.0%) |
| $100,000 and over | 13 (86.7%) | 2 (13.3%) |
Public vs Private Health Insurance Coverage by Age in Cottage Grove
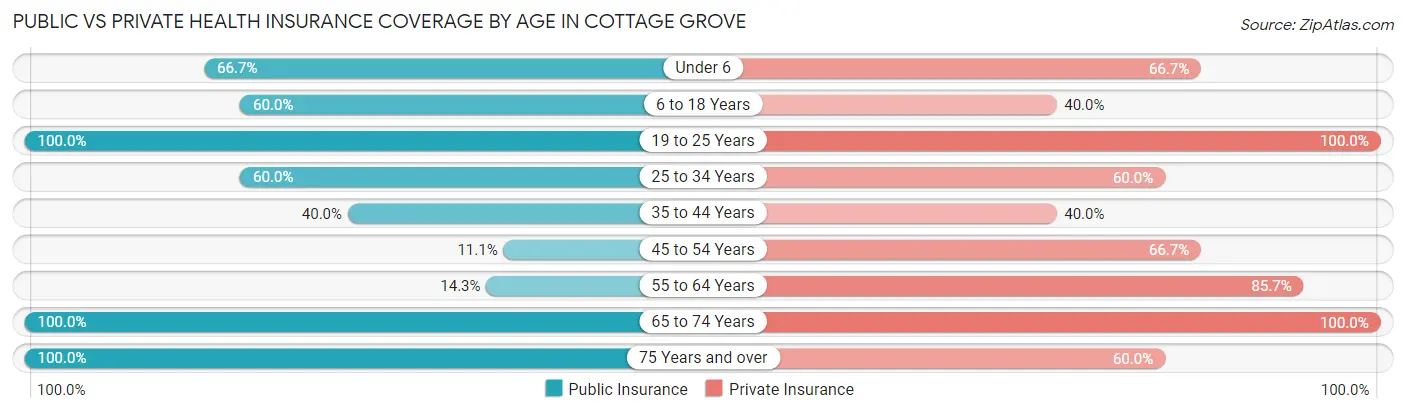
| Age Bracket | Public Insurance | Private Insurance |
| Under 6 | 4 (66.7%) | 4 (66.7%) |
| 6 to 18 Years | 6 (60.0%) | 4 (40.0%) |
| 19 to 25 Years | 2 (100.0%) | 2 (100.0%) |
| 25 to 34 Years | 6 (60.0%) | 6 (60.0%) |
| 35 to 44 Years | 2 (40.0%) | 2 (40.0%) |
| 45 to 54 Years | 1 (11.1%) | 6 (66.7%) |
| 55 to 64 Years | 1 (14.3%) | 6 (85.7%) |
| 65 to 74 Years | 3 (100.0%) | 3 (100.0%) |
| 75 Years and over | 5 (100.0%) | 3 (60.0%) |
| Total | 30 (52.6%) | 36 (63.2%) |
Disability Status by Sex by Age in Cottage Grove
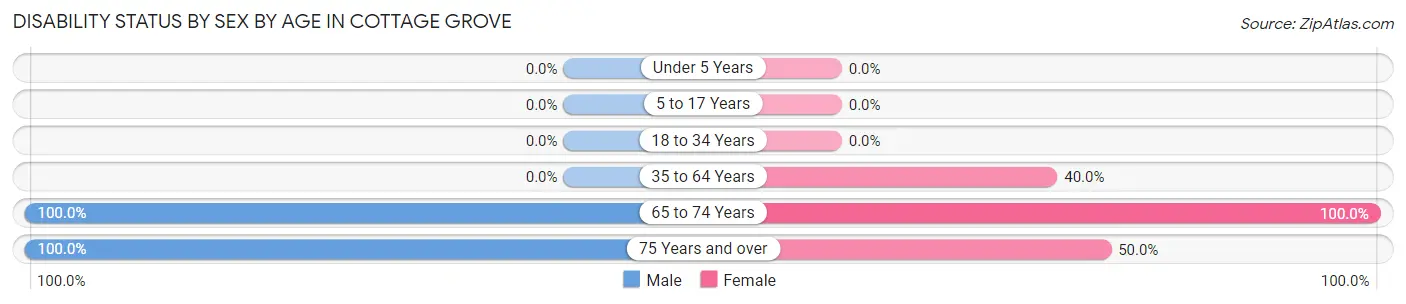
| Age Bracket | Male | Female |
| Under 5 Years | 0 (0.0%) | 0 (0.0%) |
| 5 to 17 Years | 0 (0.0%) | 0 (0.0%) |
| 18 to 34 Years | 0 (0.0%) | 0 (0.0%) |
| 35 to 64 Years | 0 (0.0%) | 4 (40.0%) |
| 65 to 74 Years | 1 (100.0%) | 2 (100.0%) |
| 75 Years and over | 1 (100.0%) | 2 (50.0%) |
Disability Class by Sex by Age in Cottage Grove
Disability Class: Hearing Difficulty
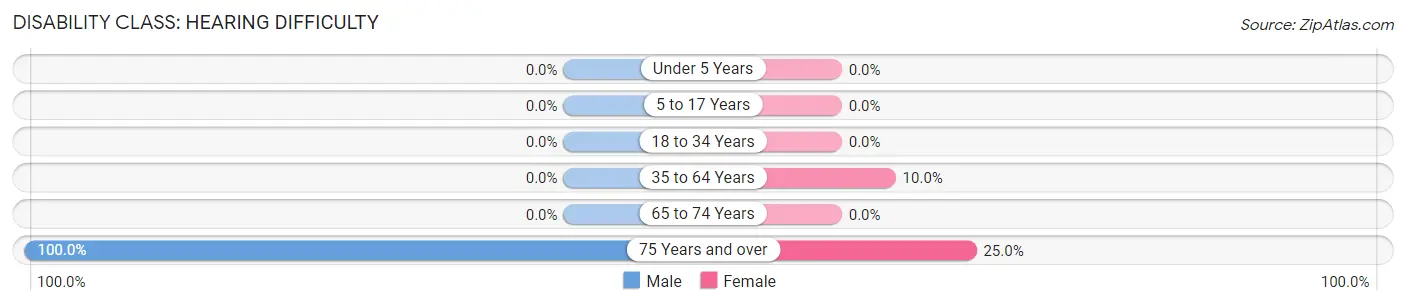
| Age Bracket | Male | Female |
| Under 5 Years | 0 (0.0%) | 0 (0.0%) |
| 5 to 17 Years | 0 (0.0%) | 0 (0.0%) |
| 18 to 34 Years | 0 (0.0%) | 0 (0.0%) |
| 35 to 64 Years | 0 (0.0%) | 1 (10.0%) |
| 65 to 74 Years | 0 (0.0%) | 0 (0.0%) |
| 75 Years and over | 1 (100.0%) | 1 (25.0%) |
Disability Class: Vision Difficulty
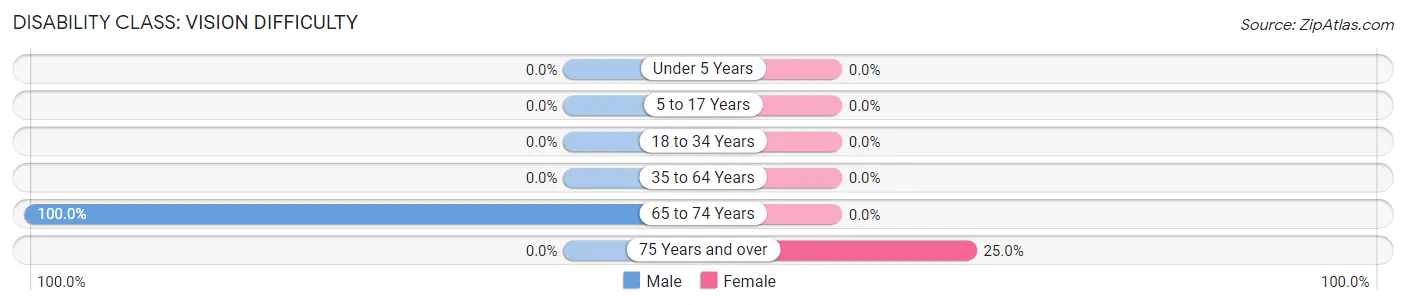
| Age Bracket | Male | Female |
| Under 5 Years | 0 (0.0%) | 0 (0.0%) |
| 5 to 17 Years | 0 (0.0%) | 0 (0.0%) |
| 18 to 34 Years | 0 (0.0%) | 0 (0.0%) |
| 35 to 64 Years | 0 (0.0%) | 0 (0.0%) |
| 65 to 74 Years | 1 (100.0%) | 0 (0.0%) |
| 75 Years and over | 0 (0.0%) | 1 (25.0%) |
Disability Class: Cognitive Difficulty
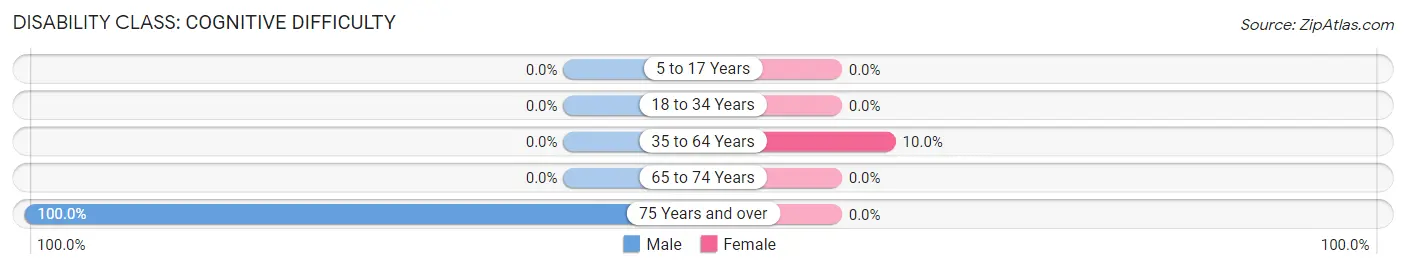
| Age Bracket | Male | Female |
| 5 to 17 Years | 0 (0.0%) | 0 (0.0%) |
| 18 to 34 Years | 0 (0.0%) | 0 (0.0%) |
| 35 to 64 Years | 0 (0.0%) | 1 (10.0%) |
| 65 to 74 Years | 0 (0.0%) | 0 (0.0%) |
| 75 Years and over | 1 (100.0%) | 0 (0.0%) |
Disability Class: Ambulatory Difficulty
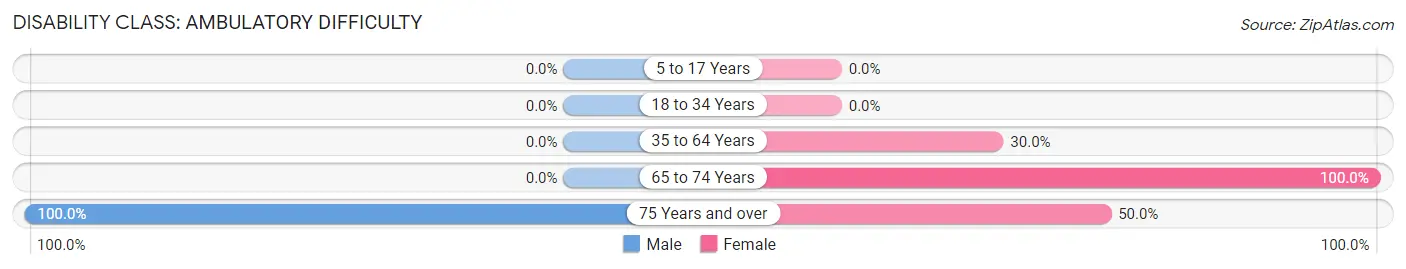
| Age Bracket | Male | Female |
| 5 to 17 Years | 0 (0.0%) | 0 (0.0%) |
| 18 to 34 Years | 0 (0.0%) | 0 (0.0%) |
| 35 to 64 Years | 0 (0.0%) | 3 (30.0%) |
| 65 to 74 Years | 0 (0.0%) | 2 (100.0%) |
| 75 Years and over | 1 (100.0%) | 2 (50.0%) |
Disability Class: Self-Care Difficulty
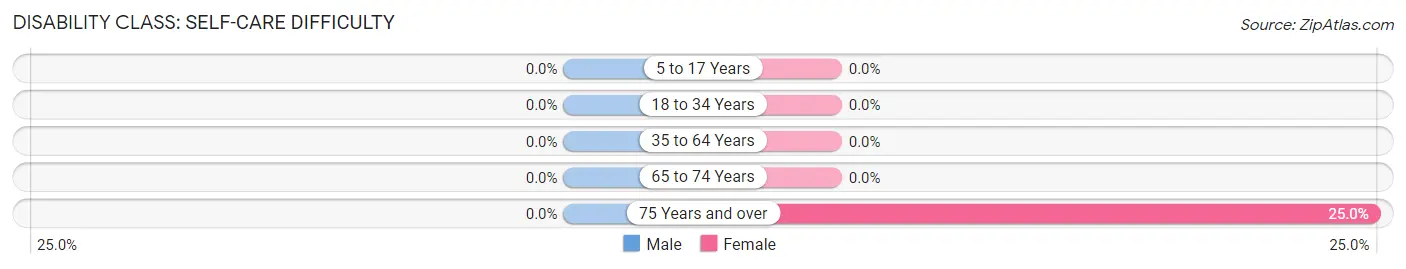
| Age Bracket | Male | Female |
| 5 to 17 Years | 0 (0.0%) | 0 (0.0%) |
| 18 to 34 Years | 0 (0.0%) | 0 (0.0%) |
| 35 to 64 Years | 0 (0.0%) | 0 (0.0%) |
| 65 to 74 Years | 0 (0.0%) | 0 (0.0%) |
| 75 Years and over | 0 (0.0%) | 1 (25.0%) |
Technology Access in Cottage Grove
Computing Device Access in Cottage Grove
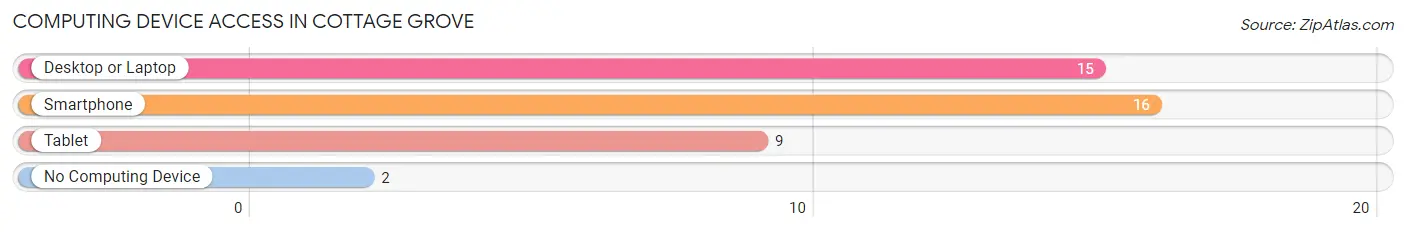
| Device Type | # Households | % Households |
| Desktop or Laptop | 15 | 78.9% |
| Smartphone | 16 | 84.2% |
| Tablet | 9 | 47.4% |
| No Computing Device | 2 | 10.5% |
| Total | 19 | 100.0% |
Internet Access in Cottage Grove
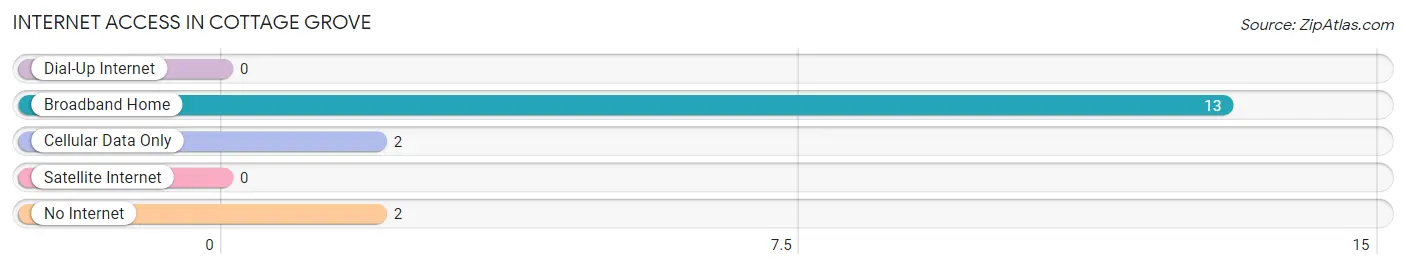
| Internet Type | # Households | % Households |
| Dial-Up Internet | 0 | 0.0% |
| Broadband Home | 13 | 68.4% |
| Cellular Data Only | 2 | 10.5% |
| Satellite Internet | 0 | 0.0% |
| No Internet | 2 | 10.5% |
| Total | 19 | 100.0% |
Cottage Grove Summary
Cottage Grove is a small town located in the state of Tennessee, in the United States. It is situated in the eastern part of the state, in the foothills of the Appalachian Mountains. The town is located in Greene County, and is part of the Knoxville Metropolitan Statistical Area. The population of Cottage Grove was estimated to be 1,845 in 2019.
History
The area that is now Cottage Grove was first settled in the late 1700s by settlers from North Carolina. The town was originally known as “Cottageville”, and was named after the many cottages that were built in the area. The town was officially incorporated in 1845, and the name was changed to Cottage Grove.
The town was a popular stop for travelers on the stagecoach route between Knoxville and Asheville. The town was also a popular destination for wealthy families from the surrounding area, who would come to the town to enjoy its natural beauty and peaceful atmosphere.
In the late 1800s, the town was home to several large industries, including a cotton mill, a sawmill, and a gristmill. These industries provided employment for many of the town’s residents.
Geography
Cottage Grove is located in the eastern part of Tennessee, in the foothills of the Appalachian Mountains. The town is situated in Greene County, and is part of the Knoxville Metropolitan Statistical Area. The town is located at an elevation of 1,072 feet above sea level.
The town is located near the Nolichucky River, which flows through the area. The town is also located near the Cherokee National Forest, which provides a variety of outdoor recreational activities.
Economy
The economy of Cottage Grove is largely based on agriculture and tourism. The town is home to several farms, which produce a variety of crops, including corn, soybeans, and hay. The town is also home to several wineries, which produce a variety of wines.
The town is also a popular tourist destination, due to its proximity to the Great Smoky Mountains National Park. The town is home to several bed and breakfasts, as well as a variety of restaurants and shops.
Demographics
As of the 2019 census, the population of Cottage Grove was estimated to be 1,845. The town has a median age of 44.7 years, and a median household income of $41,944. The town is predominantly white, with a population that is 94.3% white, 2.2% African American, 0.7% Asian, and 0.7% Hispanic or Latino.
Conclusion
Cottage Grove is a small town located in the eastern part of Tennessee, in the foothills of the Appalachian Mountains. The town is home to a variety of industries, including agriculture and tourism, and is a popular tourist destination due to its proximity to the Great Smoky Mountains National Park. The population of Cottage Grove was estimated to be 1,845 in 2019, and the town has a median age of 44.7 years and a median household income of $41,944.
Common Questions
What is Per Capita Income in Cottage Grove?
Per Capita income in Cottage Grove is $19,721.
What is the Median Family Income in Cottage Grove?
Median Family Income in Cottage Grove is $43,750.
What is the Median Household income in Cottage Grove?
Median Household Income in Cottage Grove is $46,250.
What is Income or Wage Gap in Cottage Grove?
Income or Wage Gap in Cottage Grove is 51.5%.
Women in Cottage Grove earn 48.5 cents for every dollar earned by a man.
What is Inequality or Gini Index in Cottage Grove?
Inequality or Gini Index in Cottage Grove is 0.35.
What is the Total Population of Cottage Grove?
Total Population of Cottage Grove is 57.
What is the Total Male Population of Cottage Grove?
Total Male Population of Cottage Grove is 27.
What is the Total Female Population of Cottage Grove?
Total Female Population of Cottage Grove is 30.
What is the Ratio of Males per 100 Females in Cottage Grove?
There are 90.00 Males per 100 Females in Cottage Grove.
What is the Ratio of Females per 100 Males in Cottage Grove?
There are 111.11 Females per 100 Males in Cottage Grove.
What is the Median Population Age in Cottage Grove?
Median Population Age in Cottage Grove is 37.3 Years.
What is the Average Family Size in Cottage Grove
Average Family Size in Cottage Grove is 3.8 People.
What is the Average Household Size in Cottage Grove
Average Household Size in Cottage Grove is 3.0 People.
How Large is the Labor Force in Cottage Grove?
There are 19 People in the Labor Forcein in Cottage Grove.
What is the Percentage of People in the Labor Force in Cottage Grove?
46.3% of People are in the Labor Force in Cottage Grove.
What is the Unemployment Rate in Cottage Grove?
Unemployment Rate in Cottage Grove is 15.8%.