Collinwood, TN Map & Demographics
Collinwood Map
Collinwood Overview
$25,058
PER CAPITA INCOME
$59,423
AVG FAMILY INCOME
$51,190
AVG HOUSEHOLD INCOME
11.7%
WAGE / INCOME GAP [ % ]
88.3¢/ $1
WAGE / INCOME GAP [ $ ]
0.46
INEQUALITY / GINI INDEX
1,224
TOTAL POPULATION
582
MALE POPULATION
642
FEMALE POPULATION
90.65
MALES / 100 FEMALES
110.31
FEMALES / 100 MALES
35.4
MEDIAN AGE
3.4
AVG FAMILY SIZE
2.9
AVG HOUSEHOLD SIZE
594
LABOR FORCE [ PEOPLE ]
63.5%
PERCENT IN LABOR FORCE
5.6%
UNEMPLOYMENT RATE
Collinwood Zip Codes
Collinwood Area Codes
Income in Collinwood
Income Overview in Collinwood
Per Capita Income in Collinwood is $25,058, while median incomes of families and households are $59,423 and $51,190 respectively.
| Characteristic | Number | Measure |
| Per Capita Income | 1,224 | $25,058 |
| Median Family Income | 308 | $59,423 |
| Mean Family Income | 308 | $75,197 |
| Median Household Income | 430 | $51,190 |
| Mean Household Income | 430 | $62,399 |
| Income Deficit | 308 | $0 |
| Wage / Income Gap (%) | 1,224 | 11.73% |
| Wage / Income Gap ($) | 1,224 | 88.27¢ per $1 |
| Gini / Inequality Index | 1,224 | 0.46 |
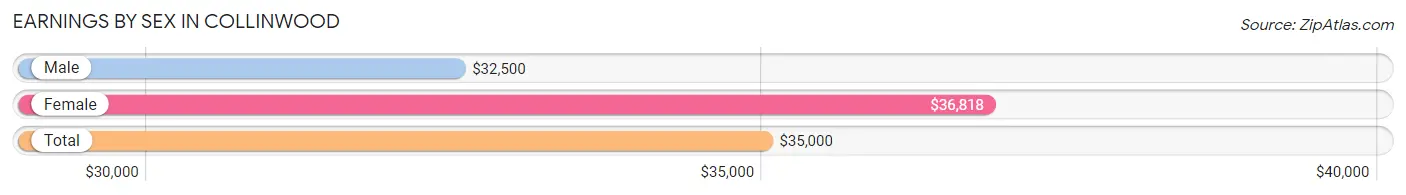
Earnings by Sex in Collinwood
Average Earnings in Collinwood are $35,000, $32,500 for men and $36,818 for women, a difference of 11.7%.
| Sex | Number | Average Earnings |
| Male | 346 (56.9%) | $32,500 |
| Female | 262 (43.1%) | $36,818 |
| Total | 608 (100.0%) | $35,000 |
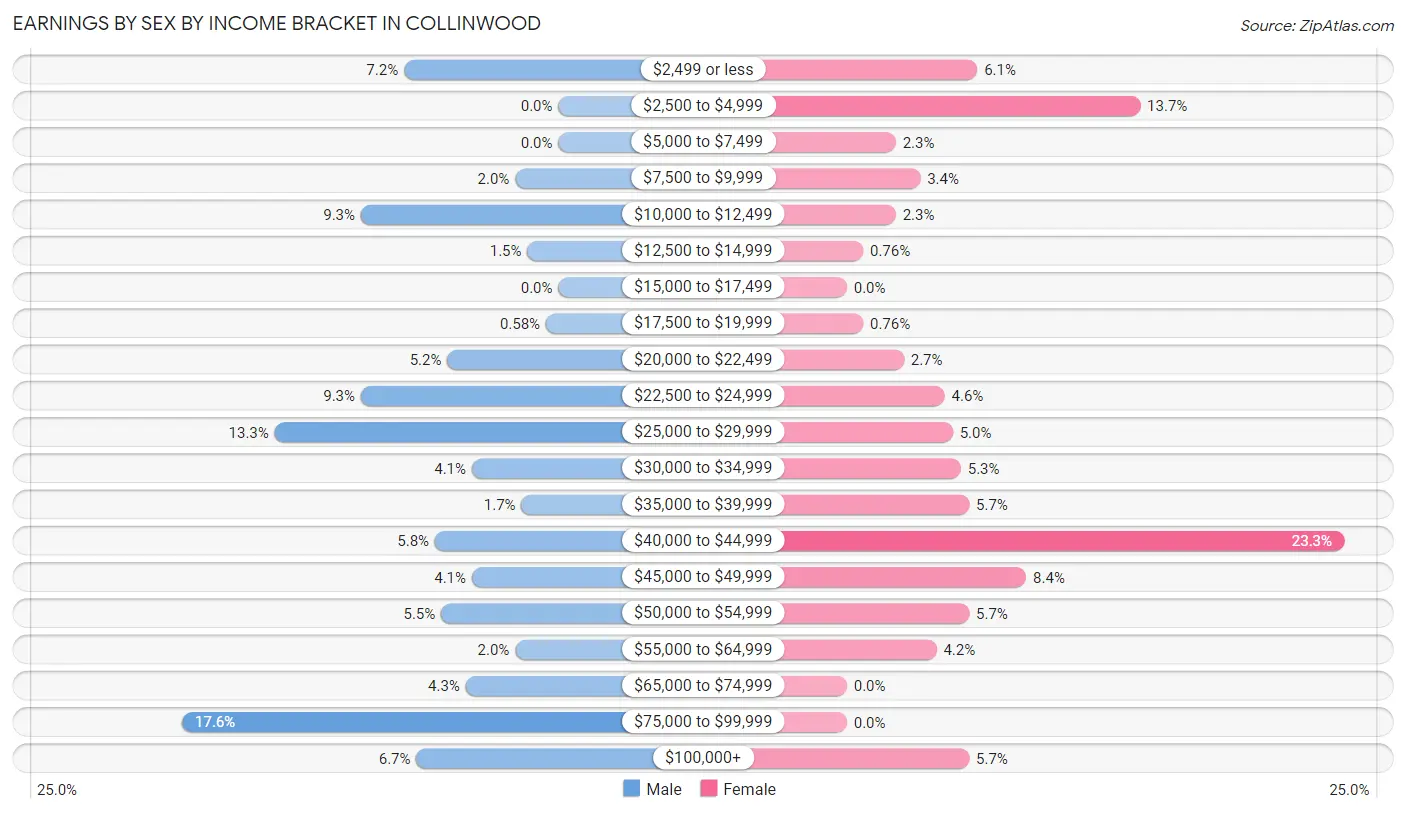
Earnings by Sex by Income Bracket in Collinwood
The most common earnings brackets in Collinwood are $75,000 to $99,999 for men (61 | 17.6%) and $40,000 to $44,999 for women (61 | 23.3%).
| Income | Male | Female |
| $2,499 or less | 25 (7.2%) | 16 (6.1%) |
| $2,500 to $4,999 | 0 (0.0%) | 36 (13.7%) |
| $5,000 to $7,499 | 0 (0.0%) | 6 (2.3%) |
| $7,500 to $9,999 | 7 (2.0%) | 9 (3.4%) |
| $10,000 to $12,499 | 32 (9.2%) | 6 (2.3%) |
| $12,500 to $14,999 | 5 (1.5%) | 2 (0.8%) |
| $15,000 to $17,499 | 0 (0.0%) | 0 (0.0%) |
| $17,500 to $19,999 | 2 (0.6%) | 2 (0.8%) |
| $20,000 to $22,499 | 18 (5.2%) | 7 (2.7%) |
| $22,500 to $24,999 | 32 (9.2%) | 12 (4.6%) |
| $25,000 to $29,999 | 46 (13.3%) | 13 (5.0%) |
| $30,000 to $34,999 | 14 (4.1%) | 14 (5.3%) |
| $35,000 to $39,999 | 6 (1.7%) | 15 (5.7%) |
| $40,000 to $44,999 | 20 (5.8%) | 61 (23.3%) |
| $45,000 to $49,999 | 14 (4.1%) | 22 (8.4%) |
| $50,000 to $54,999 | 19 (5.5%) | 15 (5.7%) |
| $55,000 to $64,999 | 7 (2.0%) | 11 (4.2%) |
| $65,000 to $74,999 | 15 (4.3%) | 0 (0.0%) |
| $75,000 to $99,999 | 61 (17.6%) | 0 (0.0%) |
| $100,000+ | 23 (6.7%) | 15 (5.7%) |
| Total | 346 (100.0%) | 262 (100.0%) |
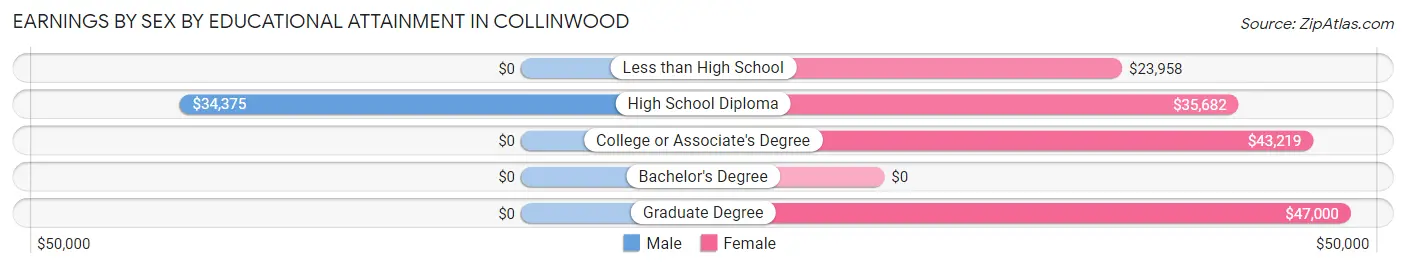
Earnings by Sex by Educational Attainment in Collinwood
Average earnings in Collinwood are $41,833 for men and $41,333 for women, a difference of 1.2%. Men with an educational attainment of high school diploma enjoy the highest average annual earnings of $34,375, while those with high school diploma education earn the least with $34,375. Women with an educational attainment of graduate degree earn the most with the average annual earnings of $47,000, while those with less than high school education have the smallest earnings of $23,958.
| Educational Attainment | Male Income | Female Income |
| Less than High School | - | - |
| High School Diploma | $34,375 | $35,682 |
| College or Associate's Degree | - | - |
| Bachelor's Degree | - | - |
| Graduate Degree | - | - |
| Total | $41,833 | $41,333 |
Family Income in Collinwood
Family Income Brackets in Collinwood
According to the Collinwood family income data, there are 91 families falling into the $50,000 to $74,999 income range, which is the most common income bracket and makes up 29.5% of all families.
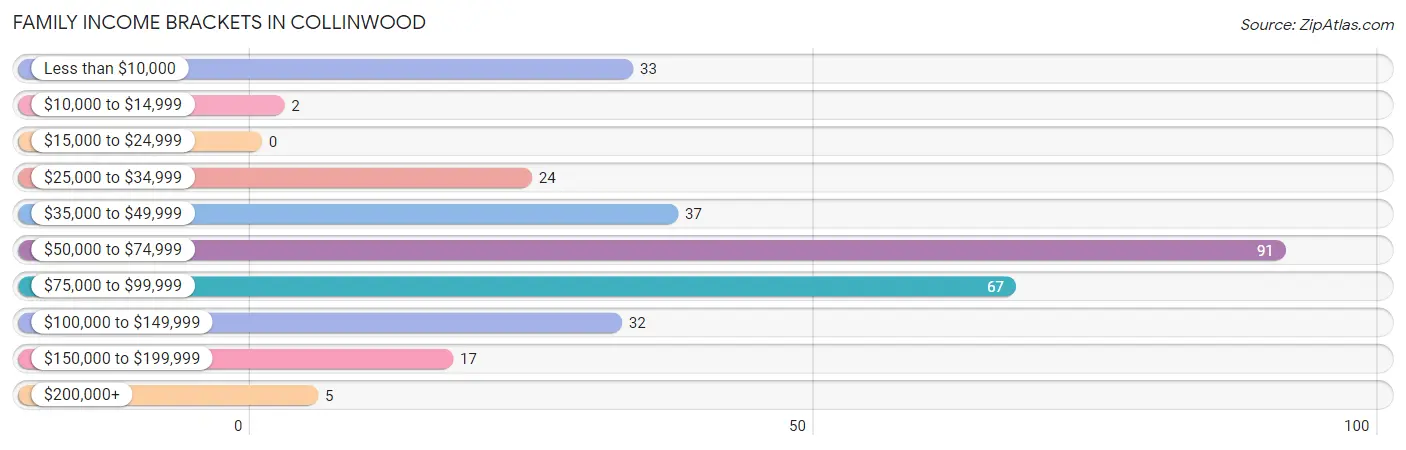
| Income Bracket | # Families | % Families |
| Less than $10,000 | 33 | 10.7% |
| $10,000 to $14,999 | 2 | 0.6% |
| $15,000 to $24,999 | 0 | 0.0% |
| $25,000 to $34,999 | 24 | 7.8% |
| $35,000 to $49,999 | 37 | 12.0% |
| $50,000 to $74,999 | 91 | 29.5% |
| $75,000 to $99,999 | 67 | 21.8% |
| $100,000 to $149,999 | 32 | 10.4% |
| $150,000 to $199,999 | 17 | 5.5% |
| $200,000+ | 5 | 1.6% |
Family Income by Famaliy Size in Collinwood
3-person families (98 | 31.8%) account for the highest median family income in Collinwood with $74,333 per family, while 2-person families (95 | 30.8%) have the highest median income of $25,234 per family member.
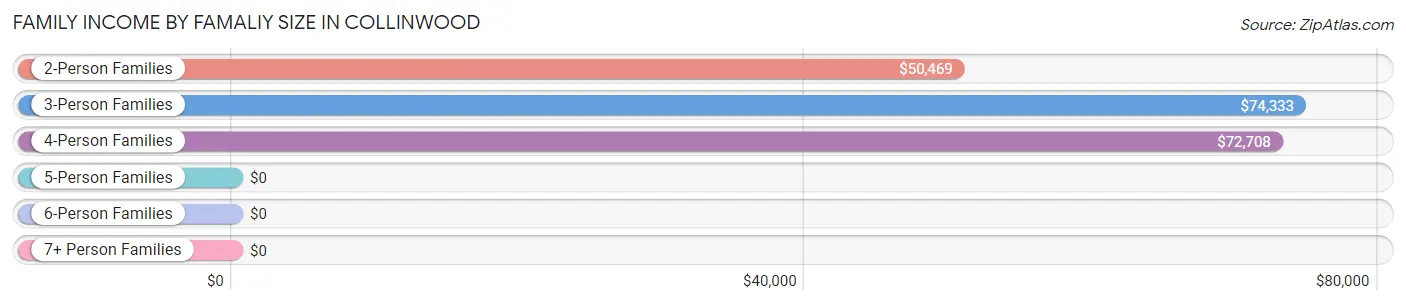
| Income Bracket | # Families | Median Income |
| 2-Person Families | 95 (30.8%) | $50,469 |
| 3-Person Families | 98 (31.8%) | $74,333 |
| 4-Person Families | 51 (16.6%) | $72,708 |
| 5-Person Families | 62 (20.1%) | $0 |
| 6-Person Families | 2 (0.6%) | $0 |
| 7+ Person Families | 0 (0.0%) | $0 |
| Total | 308 (100.0%) | $59,423 |
Family Income by Number of Earners in Collinwood
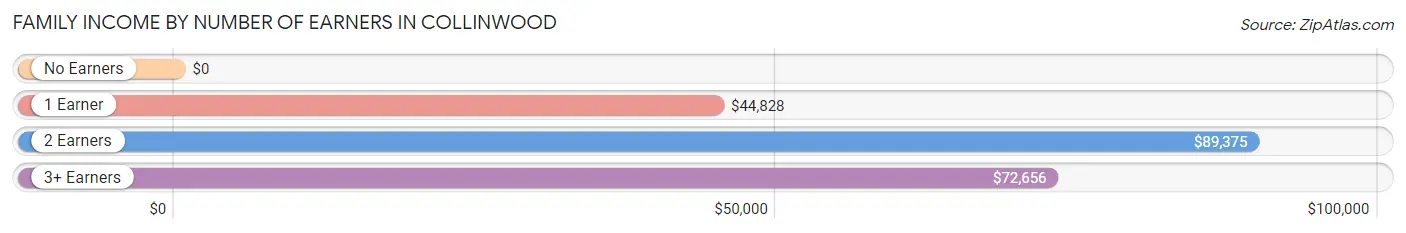
| Number of Earners | # Families | Median Income |
| No Earners | 31 (10.1%) | $0 |
| 1 Earner | 136 (44.2%) | $44,828 |
| 2 Earners | 116 (37.7%) | $89,375 |
| 3+ Earners | 25 (8.1%) | $72,656 |
| Total | 308 (100.0%) | $59,423 |
Household Income in Collinwood
Household Income Brackets in Collinwood
With 89 households falling in the category, the $50,000 to $74,999 income range is the most frequent in Collinwood, accounting for 20.7% of all households. In contrast, only 5 households (1.2%) fall into the $200,000+ income bracket, making it the least populous group.
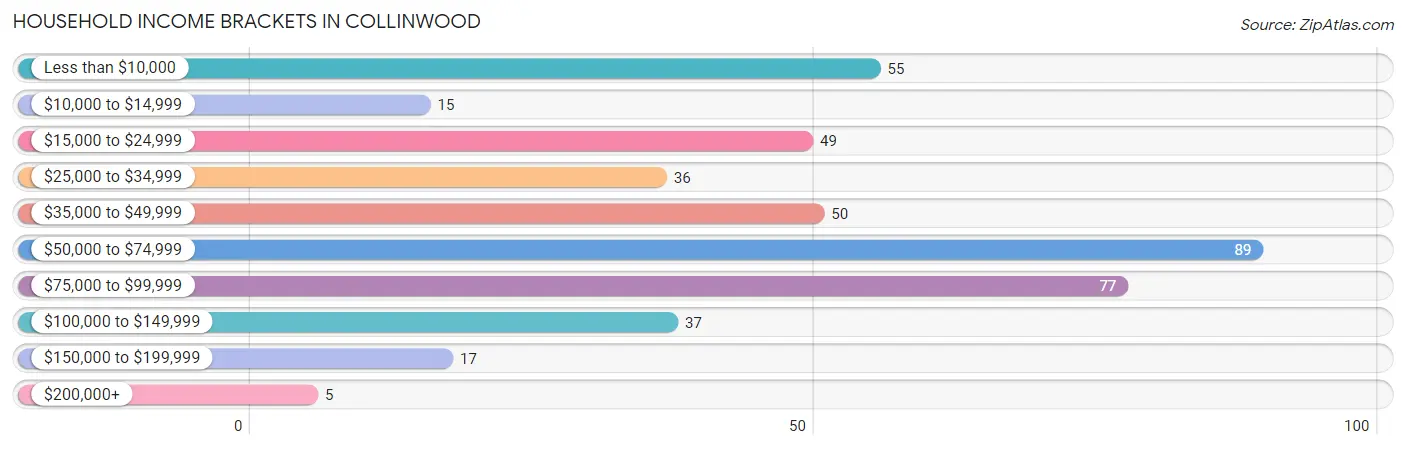
| Income Bracket | # Households | % Households |
| Less than $10,000 | 55 | 12.8% |
| $10,000 to $14,999 | 15 | 3.5% |
| $15,000 to $24,999 | 49 | 11.4% |
| $25,000 to $34,999 | 36 | 8.4% |
| $35,000 to $49,999 | 50 | 11.6% |
| $50,000 to $74,999 | 89 | 20.7% |
| $75,000 to $99,999 | 77 | 17.9% |
| $100,000 to $149,999 | 37 | 8.6% |
| $150,000 to $199,999 | 17 | 4.0% |
| $200,000+ | 5 | 1.2% |
Household Income by Householder Age in Collinwood
The median household income in Collinwood is $51,190, with the highest median household income of $54,750 found in the 25 to 44 years age bracket for the primary householder. A total of 144 households (33.5%) fall into this category. Meanwhile, the 15 to 24 years age bracket for the primary householder has the lowest median household income of $0, with 18 households (4.2%) in this group.
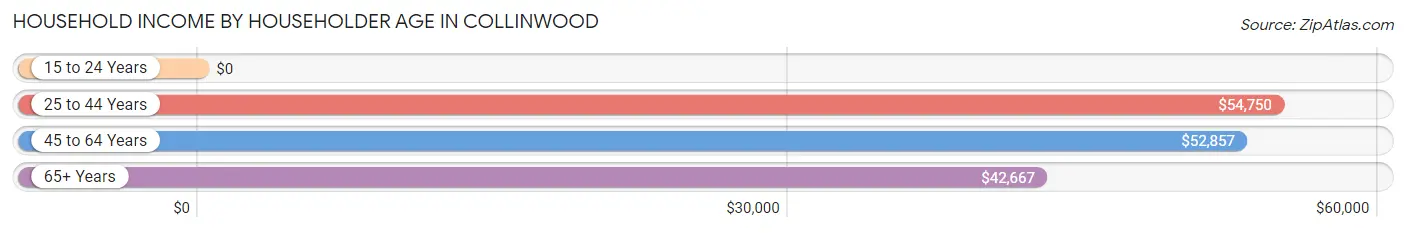
| Income Bracket | # Households | Median Income |
| 15 to 24 Years | 18 (4.2%) | $0 |
| 25 to 44 Years | 144 (33.5%) | $54,750 |
| 45 to 64 Years | 132 (30.7%) | $52,857 |
| 65+ Years | 136 (31.6%) | $42,667 |
| Total | 430 (100.0%) | $51,190 |
Poverty in Collinwood
Income Below Poverty by Sex and Age in Collinwood
With 10.6% poverty level for males and 19.3% for females among the residents of Collinwood, under 5 year old males and 18 to 24 year old females are the most vulnerable to poverty, with 23 males (59.0%) and 28 females (77.8%) in their respective age groups living below the poverty level.
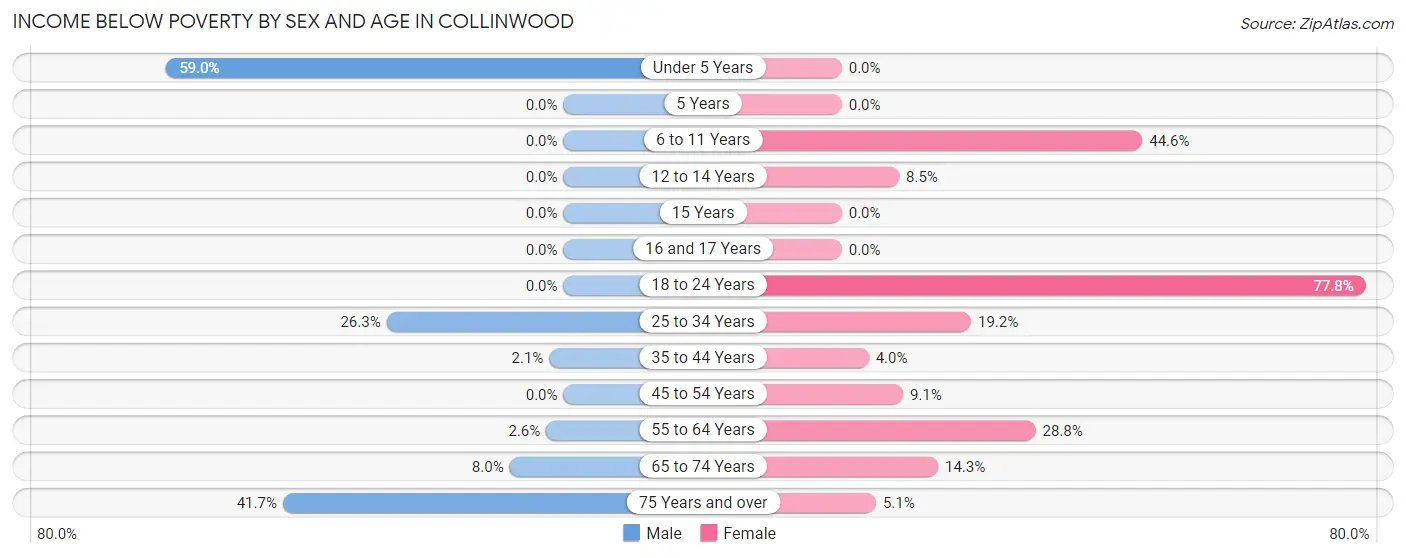
| Age Bracket | Male | Female |
| Under 5 Years | 23 (59.0%) | 0 (0.0%) |
| 5 Years | 0 (0.0%) | 0 (0.0%) |
| 6 to 11 Years | 0 (0.0%) | 29 (44.6%) |
| 12 to 14 Years | 0 (0.0%) | 4 (8.5%) |
| 15 Years | 0 (0.0%) | 0 (0.0%) |
| 16 and 17 Years | 0 (0.0%) | 0 (0.0%) |
| 18 to 24 Years | 0 (0.0%) | 28 (77.8%) |
| 25 to 34 Years | 26 (26.3%) | 19 (19.2%) |
| 35 to 44 Years | 3 (2.1%) | 3 (4.0%) |
| 45 to 54 Years | 0 (0.0%) | 7 (9.1%) |
| 55 to 64 Years | 1 (2.6%) | 21 (28.8%) |
| 65 to 74 Years | 2 (8.0%) | 9 (14.3%) |
| 75 Years and over | 5 (41.7%) | 3 (5.1%) |
| Total | 60 (10.6%) | 123 (19.3%) |
Income Above Poverty by Sex and Age in Collinwood
According to the poverty statistics in Collinwood, males aged 5 years and females aged under 5 years are the age groups that are most secure financially, with 100.0% of males and 100.0% of females in these age groups living above the poverty line.
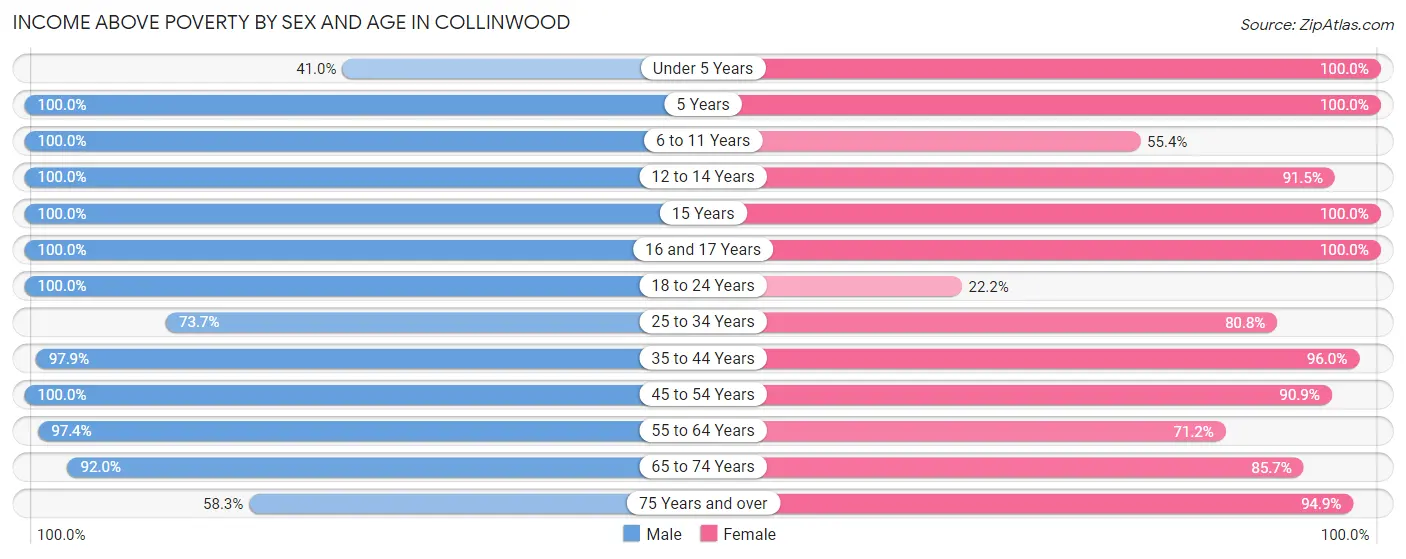
| Age Bracket | Male | Female |
| Under 5 Years | 16 (41.0%) | 5 (100.0%) |
| 5 Years | 10 (100.0%) | 13 (100.0%) |
| 6 to 11 Years | 20 (100.0%) | 36 (55.4%) |
| 12 to 14 Years | 37 (100.0%) | 43 (91.5%) |
| 15 Years | 18 (100.0%) | 15 (100.0%) |
| 16 and 17 Years | 2 (100.0%) | 10 (100.0%) |
| 18 to 24 Years | 70 (100.0%) | 8 (22.2%) |
| 25 to 34 Years | 73 (73.7%) | 80 (80.8%) |
| 35 to 44 Years | 140 (97.9%) | 72 (96.0%) |
| 45 to 54 Years | 53 (100.0%) | 70 (90.9%) |
| 55 to 64 Years | 38 (97.4%) | 52 (71.2%) |
| 65 to 74 Years | 23 (92.0%) | 54 (85.7%) |
| 75 Years and over | 7 (58.3%) | 56 (94.9%) |
| Total | 507 (89.4%) | 514 (80.7%) |
Income Below Poverty Among Married-Couple Families in Collinwood
The poverty statistics for married-couple families in Collinwood show that 5.9% or 11 of the total 187 families live below the poverty line. Families with no children have the highest poverty rate of 10.1%, comprising of 8 families. On the other hand, families with 3 or 4 children have the lowest poverty rate of 0.0%, which includes 0 families.
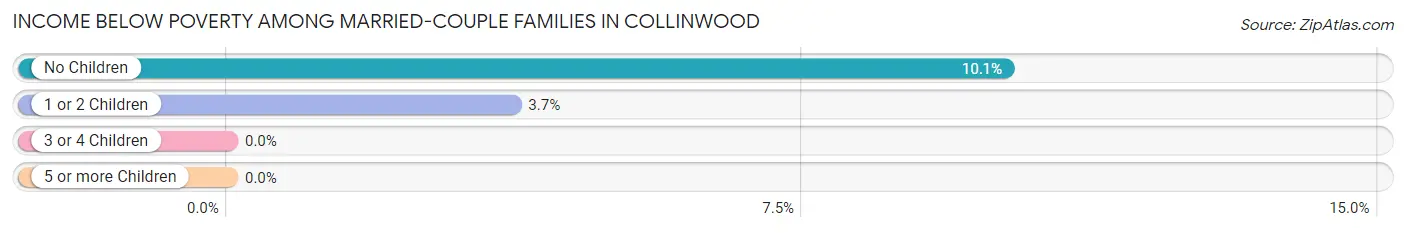
| Children | Above Poverty | Below Poverty |
| No Children | 71 (89.9%) | 8 (10.1%) |
| 1 or 2 Children | 78 (96.3%) | 3 (3.7%) |
| 3 or 4 Children | 27 (100.0%) | 0 (0.0%) |
| 5 or more Children | 0 (0.0%) | 0 (0.0%) |
| Total | 176 (94.1%) | 11 (5.9%) |
Income Below Poverty Among Single-Parent Households in Collinwood
According to the poverty data in Collinwood, 42.9% or 12 single-father households and 25.8% or 24 single-mother households are living below the poverty line. Among single-father households, those with 3 or 4 children have the highest poverty rate, with 12 households (100.0%) experiencing poverty. Likewise, among single-mother households, those with 1 or 2 children have the highest poverty rate, with 24 households (53.3%) falling below the poverty line.
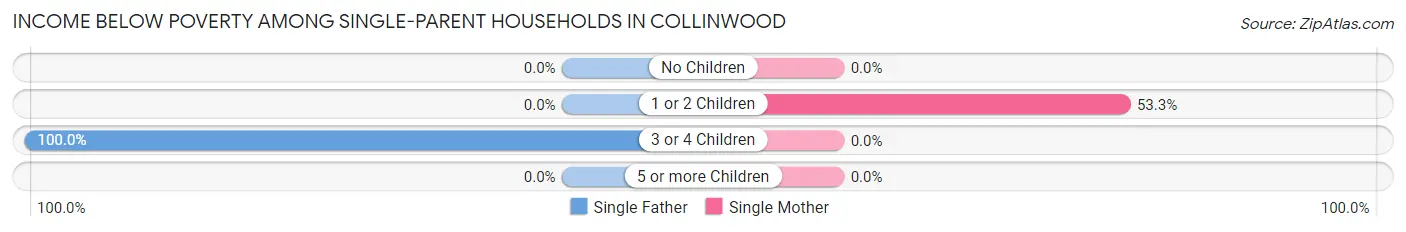
| Children | Single Father | Single Mother |
| No Children | 0 (0.0%) | 0 (0.0%) |
| 1 or 2 Children | 0 (0.0%) | 24 (53.3%) |
| 3 or 4 Children | 12 (100.0%) | 0 (0.0%) |
| 5 or more Children | 0 (0.0%) | 0 (0.0%) |
| Total | 12 (42.9%) | 24 (25.8%) |
Income Below Poverty Among Married-Couple vs Single-Parent Households in Collinwood
The poverty data for Collinwood shows that 11 of the married-couple family households (5.9%) and 36 of the single-parent households (29.7%) are living below the poverty level. Within the married-couple family households, those with no children have the highest poverty rate, with 8 households (10.1%) falling below the poverty line. Among the single-parent households, those with 1 or 2 children have the highest poverty rate, with 24 household (44.4%) living below poverty.
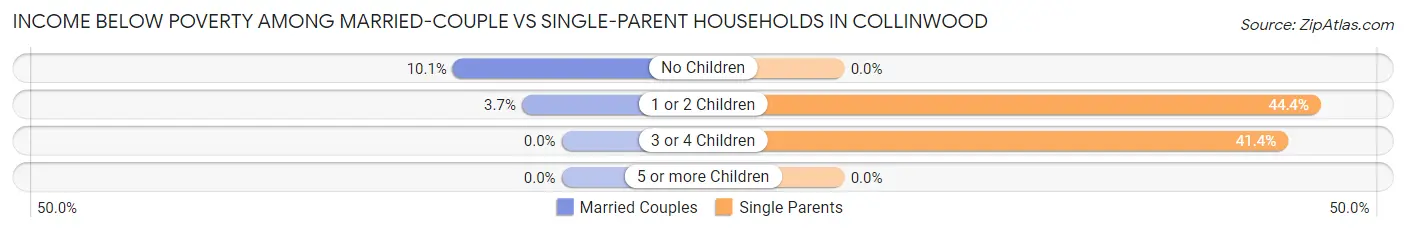
| Children | Married-Couple Families | Single-Parent Households |
| No Children | 8 (10.1%) | 0 (0.0%) |
| 1 or 2 Children | 3 (3.7%) | 24 (44.4%) |
| 3 or 4 Children | 0 (0.0%) | 12 (41.4%) |
| 5 or more Children | 0 (0.0%) | 0 (0.0%) |
| Total | 11 (5.9%) | 36 (29.7%) |
Race in Collinwood
The most populous races in Collinwood are White / Caucasian (1,101 | 89.9%), Hispanic or Latino (116 | 9.5%), and Some other Race (100 | 8.2%).
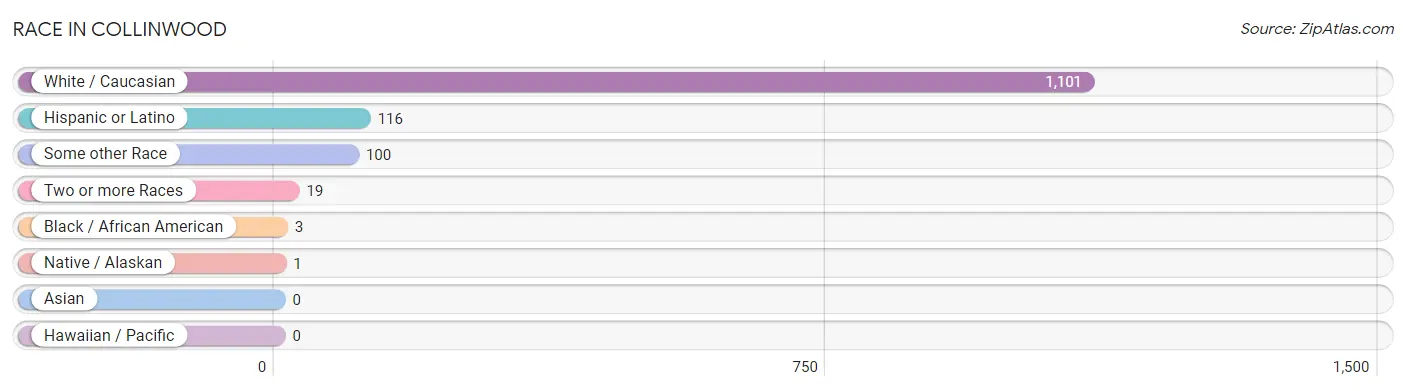
| Race | # Population | % Population |
| Asian | 0 | 0.0% |
| Black / African American | 3 | 0.3% |
| Hawaiian / Pacific | 0 | 0.0% |
| Hispanic or Latino | 116 | 9.5% |
| Native / Alaskan | 1 | 0.1% |
| White / Caucasian | 1,101 | 89.9% |
| Two or more Races | 19 | 1.5% |
| Some other Race | 100 | 8.2% |
| Total | 1,224 | 100.0% |
Ancestry in Collinwood
The most populous ancestries reported in Collinwood are Irish (225 | 18.4%), American (221 | 18.1%), English (158 | 12.9%), German (106 | 8.7%), and Mexican (65 | 5.3%), together accounting for 63.3% of all Collinwood residents.
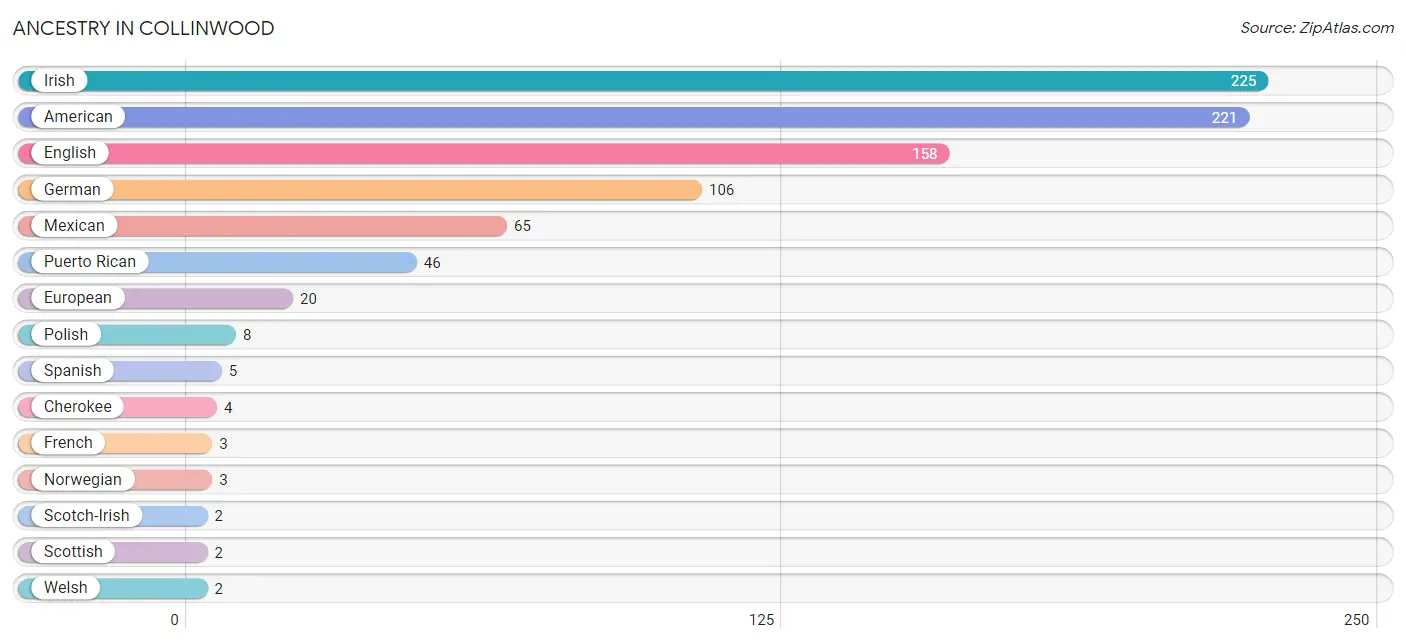
| Ancestry | # Population | % Population |
| American | 221 | 18.1% |
| Cherokee | 4 | 0.3% |
| English | 158 | 12.9% |
| European | 20 | 1.6% |
| French | 3 | 0.3% |
| German | 106 | 8.7% |
| Irish | 225 | 18.4% |
| Mexican | 65 | 5.3% |
| Native Hawaiian | 1 | 0.1% |
| Norwegian | 3 | 0.3% |
| Polish | 8 | 0.6% |
| Puerto Rican | 46 | 3.8% |
| Scotch-Irish | 2 | 0.2% |
| Scottish | 2 | 0.2% |
| Spanish | 5 | 0.4% |
| Welsh | 2 | 0.2% | View All 16 Rows |
Immigrants in Collinwood
The most numerous immigrant groups reported in Collinwood came from Central America (39 | 3.2%), Latin America (39 | 3.2%), and Mexico (39 | 3.2%), together accounting for 9.6% of all Collinwood residents.
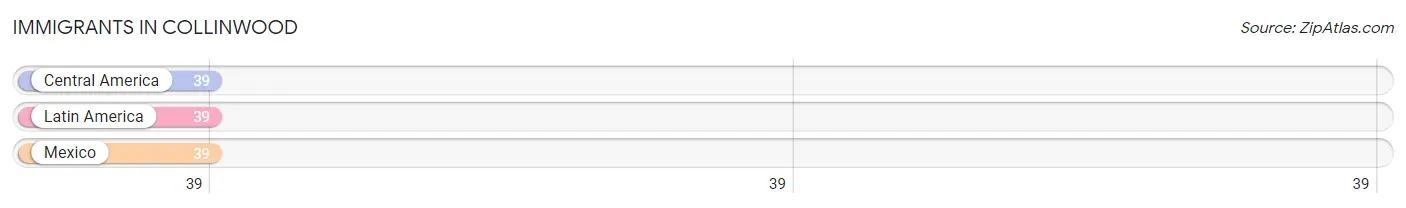
| Immigration Origin | # Population | % Population |
| Central America | 39 | 3.2% |
| Latin America | 39 | 3.2% |
| Mexico | 39 | 3.2% | View All 3 Rows |
Sex and Age in Collinwood
Sex and Age in Collinwood
The most populous age groups in Collinwood are 35 to 39 Years (74 | 12.7%) for men and 10 to 14 Years (82 | 12.8%) for women.
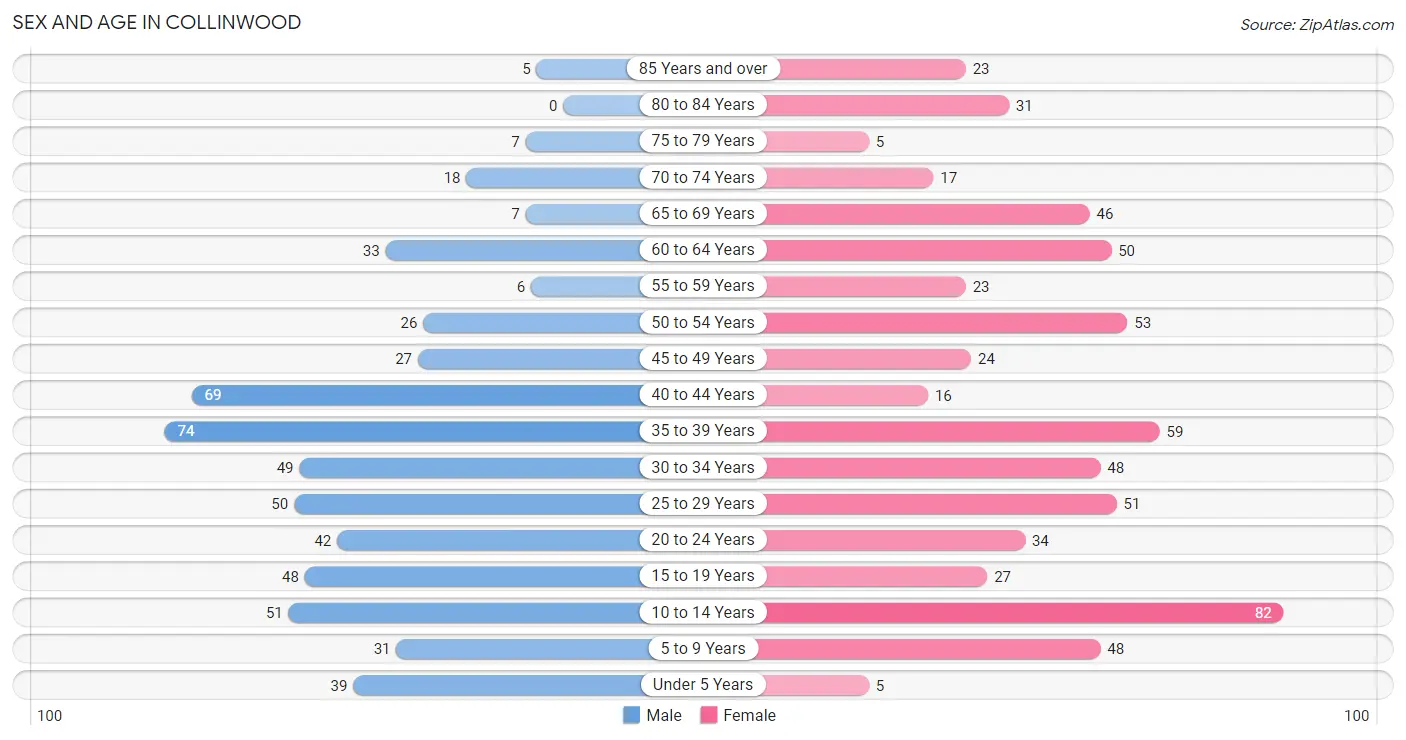
| Age Bracket | Male | Female |
| Under 5 Years | 39 (6.7%) | 5 (0.8%) |
| 5 to 9 Years | 31 (5.3%) | 48 (7.5%) |
| 10 to 14 Years | 51 (8.8%) | 82 (12.8%) |
| 15 to 19 Years | 48 (8.3%) | 27 (4.2%) |
| 20 to 24 Years | 42 (7.2%) | 34 (5.3%) |
| 25 to 29 Years | 50 (8.6%) | 51 (7.9%) |
| 30 to 34 Years | 49 (8.4%) | 48 (7.5%) |
| 35 to 39 Years | 74 (12.7%) | 59 (9.2%) |
| 40 to 44 Years | 69 (11.9%) | 16 (2.5%) |
| 45 to 49 Years | 27 (4.6%) | 24 (3.7%) |
| 50 to 54 Years | 26 (4.5%) | 53 (8.3%) |
| 55 to 59 Years | 6 (1.0%) | 23 (3.6%) |
| 60 to 64 Years | 33 (5.7%) | 50 (7.8%) |
| 65 to 69 Years | 7 (1.2%) | 46 (7.2%) |
| 70 to 74 Years | 18 (3.1%) | 17 (2.6%) |
| 75 to 79 Years | 7 (1.2%) | 5 (0.8%) |
| 80 to 84 Years | 0 (0.0%) | 31 (4.8%) |
| 85 Years and over | 5 (0.9%) | 23 (3.6%) |
| Total | 582 (100.0%) | 642 (100.0%) |
Families and Households in Collinwood
Median Family Size in Collinwood
The median family size in Collinwood is 3.38 persons per family, with married-couple families (187 | 60.7%) accounting for the largest median family size of 3.69 persons per family. On the other hand, single male/father families (28 | 9.1%) represent the smallest median family size with 2.46 persons per family.
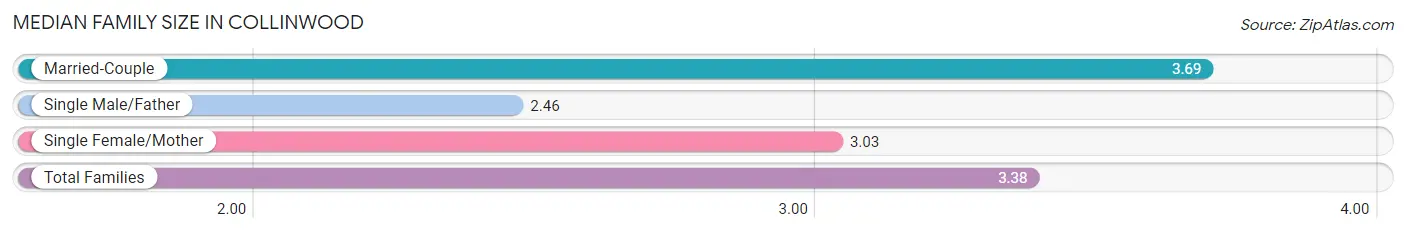
| Family Type | # Families | Family Size |
| Married-Couple | 187 (60.7%) | 3.69 |
| Single Male/Father | 28 (9.1%) | 2.46 |
| Single Female/Mother | 93 (30.2%) | 3.03 |
| Total Families | 308 (100.0%) | 3.38 |
Median Household Size in Collinwood
The median household size in Collinwood is 2.85 persons per household, with married-couple households (187 | 43.5%) accounting for the largest median household size of 3.81 persons per household. non-family households (122 | 28.4%) represent the smallest median household size with 1.14 persons per household.
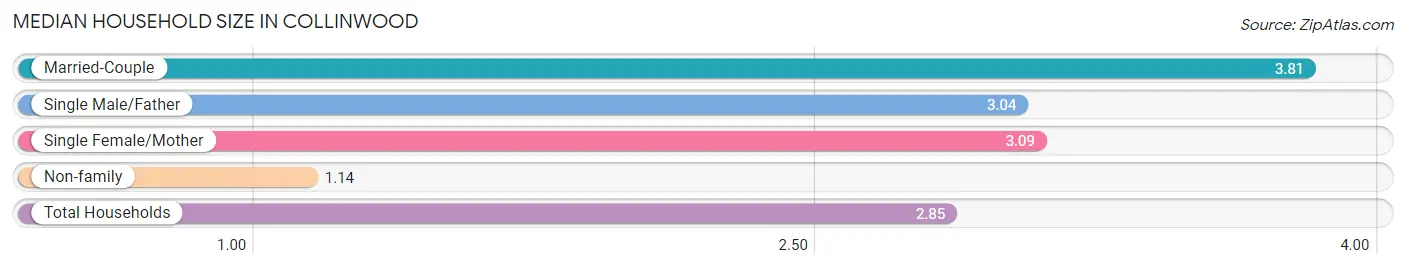
| Household Type | # Households | Household Size |
| Married-Couple | 187 (43.5%) | 3.81 |
| Single Male/Father | 28 (6.5%) | 3.04 |
| Single Female/Mother | 93 (21.6%) | 3.09 |
| Non-family | 122 (28.4%) | 1.14 |
| Total Households | 430 (100.0%) | 2.85 |
Household Size by Marriage Status in Collinwood
Out of a total of 430 households in Collinwood, 308 (71.6%) are family households, while 122 (28.4%) are nonfamily households. The most numerous type of family households are 3-person households, comprising 102, and the most common type of nonfamily households are 1-person households, comprising 115.
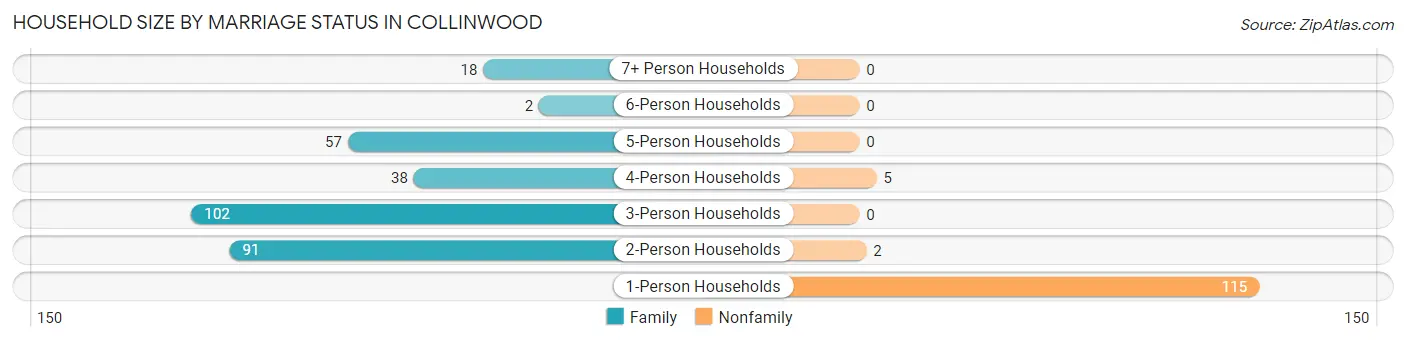
| Household Size | Family Households | Nonfamily Households |
| 1-Person Households | - | 115 (26.7%) |
| 2-Person Households | 91 (21.2%) | 2 (0.5%) |
| 3-Person Households | 102 (23.7%) | 0 (0.0%) |
| 4-Person Households | 38 (8.8%) | 5 (1.2%) |
| 5-Person Households | 57 (13.3%) | 0 (0.0%) |
| 6-Person Households | 2 (0.5%) | 0 (0.0%) |
| 7+ Person Households | 18 (4.2%) | 0 (0.0%) |
| Total | 308 (71.6%) | 122 (28.4%) |
Female Fertility in Collinwood
Fertility by Age in Collinwood
Average fertility rate in Collinwood is 35.0 births per 1,000 women. Women in the age bracket of 20 to 34 years have the highest fertility rate with 68.0 births per 1,000 women. Women in the age bracket of 20 to 34 years acount for 100.0% of all women with births.
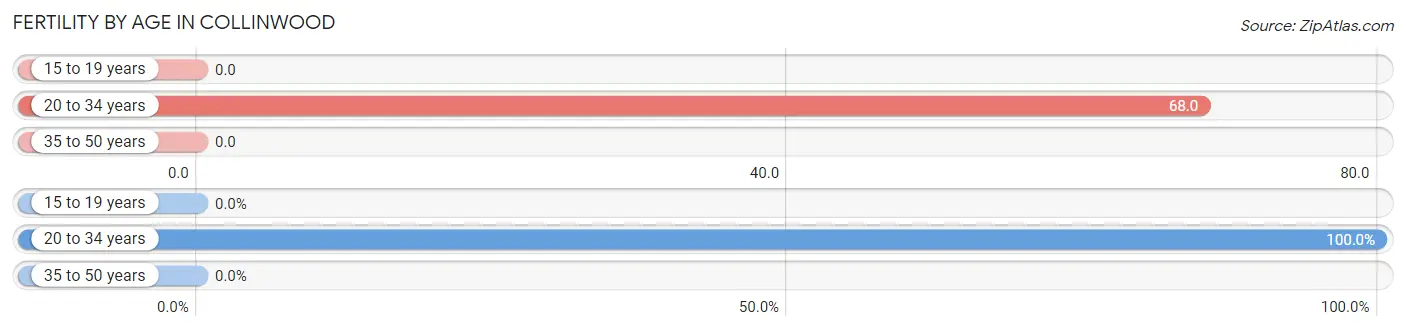
| Age Bracket | Women with Births | Births / 1,000 Women |
| 15 to 19 years | 0 (0.0%) | 0.0 |
| 20 to 34 years | 9 (100.0%) | 68.0 |
| 35 to 50 years | 0 (0.0%) | 0.0 |
| Total | 9 (100.0%) | 35.0 |
Fertility by Age by Marriage Status in Collinwood
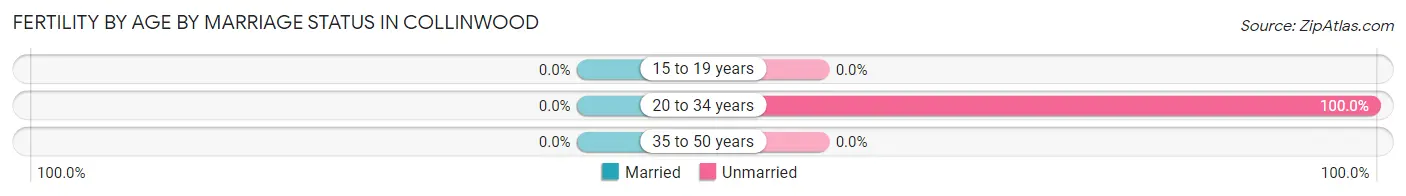
| Age Bracket | Married | Unmarried |
| 15 to 19 years | 0 (0.0%) | 0 (0.0%) |
| 20 to 34 years | 0 (0.0%) | 9 (100.0%) |
| 35 to 50 years | 0 (0.0%) | 0 (0.0%) |
| Total | 0 (0.0%) | 9 (100.0%) |
Fertility by Education in Collinwood
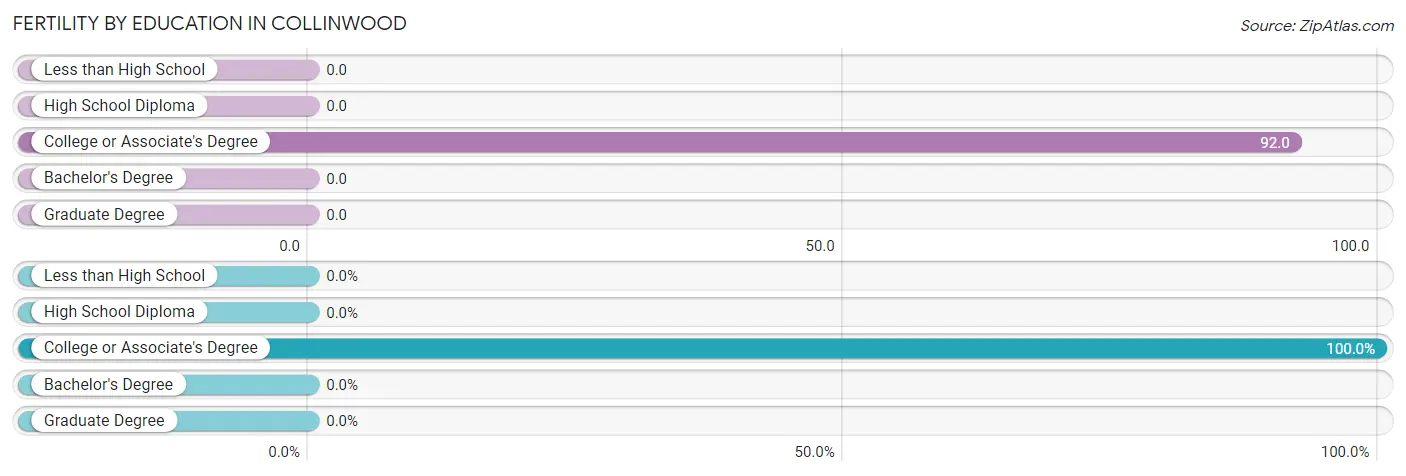
| Educational Attainment | Women with Births | Births / 1,000 Women |
| Less than High School | 0 (0.0%) | 0.0 |
| High School Diploma | 0 (0.0%) | 0.0 |
| College or Associate's Degree | 9 (100.0%) | 92.0 |
| Bachelor's Degree | 0 (0.0%) | 0.0 |
| Graduate Degree | 0 (0.0%) | 0.0 |
| Total | 9 (100.0%) | 35.0 |
Fertility by Education by Marriage Status in Collinwood
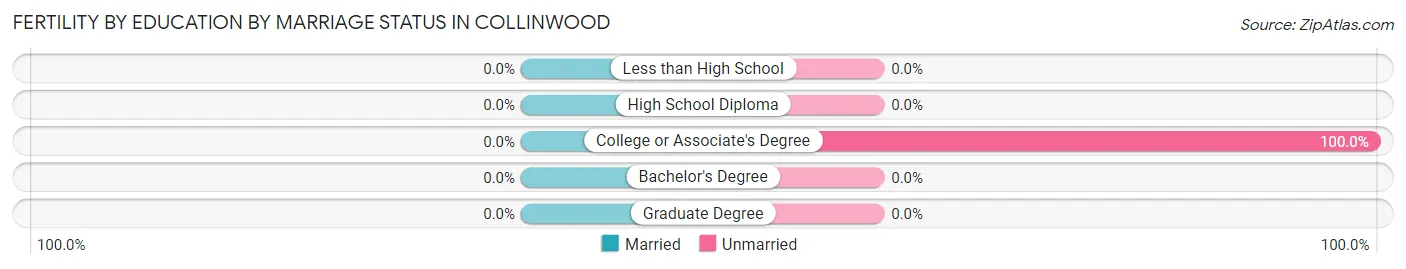
| Educational Attainment | Married | Unmarried |
| Less than High School | 0 (0.0%) | 0 (0.0%) |
| High School Diploma | 0 (0.0%) | 0 (0.0%) |
| College or Associate's Degree | 0 (0.0%) | 9 (100.0%) |
| Bachelor's Degree | 0 (0.0%) | 0 (0.0%) |
| Graduate Degree | 0 (0.0%) | 0 (0.0%) |
| Total | 0 (0.0%) | 9 (100.0%) |
Employment Characteristics in Collinwood
Employment by Class of Employer in Collinwood
Among the 557 employed individuals in Collinwood, private company employees (405 | 72.7%), local government employees (45 | 8.1%), and self-employed (not incorporated) (38 | 6.8%) make up the most common classes of employment.
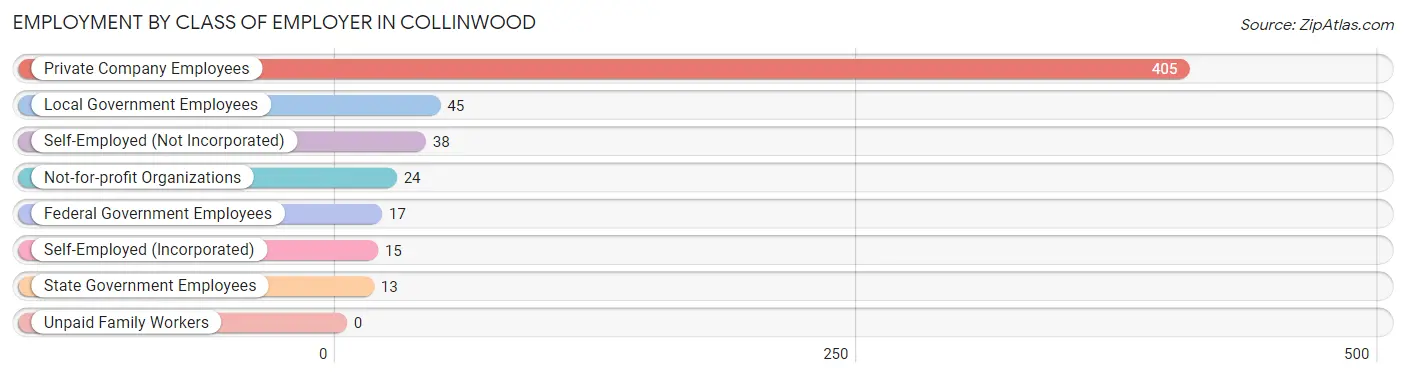
| Employer Class | # Employees | % Employees |
| Private Company Employees | 405 | 72.7% |
| Self-Employed (Incorporated) | 15 | 2.7% |
| Self-Employed (Not Incorporated) | 38 | 6.8% |
| Not-for-profit Organizations | 24 | 4.3% |
| Local Government Employees | 45 | 8.1% |
| State Government Employees | 13 | 2.3% |
| Federal Government Employees | 17 | 3.0% |
| Unpaid Family Workers | 0 | 0.0% |
| Total | 557 | 100.0% |
Employment Status by Age in Collinwood
According to the labor force statistics for Collinwood, out of the total population over 16 years of age (935), 63.5% or 594 individuals are in the labor force, with 5.6% or 33 of them unemployed. The age group with the highest labor force participation rate is 25 to 29 years, with 91.1% or 92 individuals in the labor force. Within the labor force, the 25 to 29 years age range has the highest percentage of unemployed individuals, with 19.6% or 18 of them being unemployed.
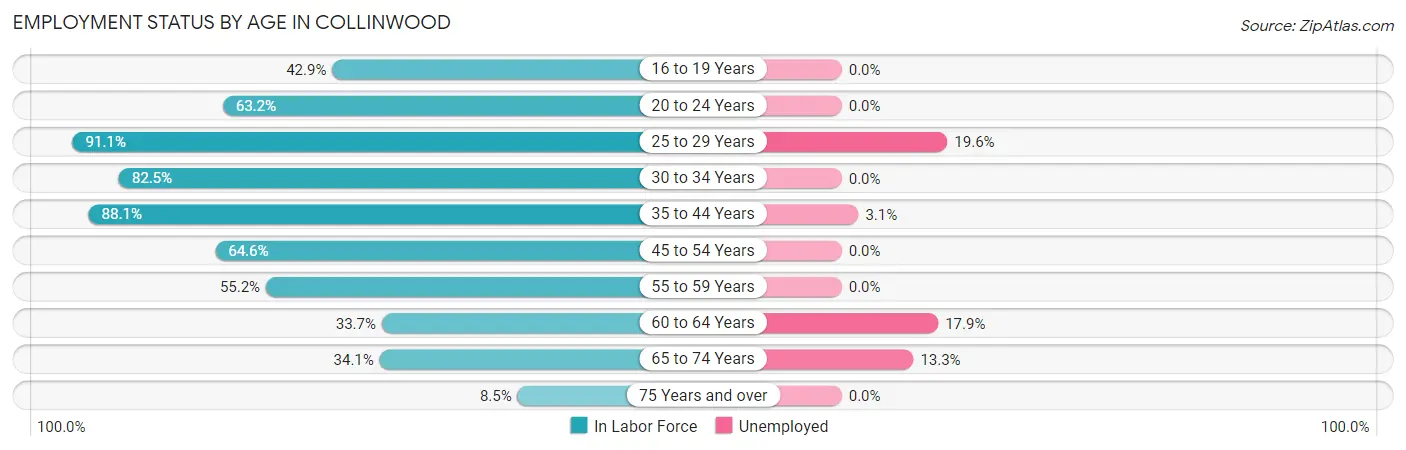
| Age Bracket | In Labor Force | Unemployed |
| 16 to 19 Years | 18 (42.9%) | 0 (0.0%) |
| 20 to 24 Years | 48 (63.2%) | 0 (0.0%) |
| 25 to 29 Years | 92 (91.1%) | 18 (19.6%) |
| 30 to 34 Years | 80 (82.5%) | 0 (0.0%) |
| 35 to 44 Years | 192 (88.1%) | 6 (3.1%) |
| 45 to 54 Years | 84 (64.6%) | 0 (0.0%) |
| 55 to 59 Years | 16 (55.2%) | 0 (0.0%) |
| 60 to 64 Years | 28 (33.7%) | 5 (17.9%) |
| 65 to 74 Years | 30 (34.1%) | 4 (13.3%) |
| 75 Years and over | 6 (8.5%) | 0 (0.0%) |
| Total | 594 (63.5%) | 33 (5.6%) |
Employment Status by Educational Attainment in Collinwood
According to labor force statistics for Collinwood, 74.8% of individuals (492) out of the total population between 25 and 64 years of age (658) are in the labor force, with 5.9% or 29 of them being unemployed. The group with the highest labor force participation rate are those with the educational attainment of bachelor's degree or higher, with 88.9% or 48 individuals in the labor force. Within the labor force, individuals with high school diploma education have the highest percentage of unemployment, with 16.1% or 29 of them being unemployed.
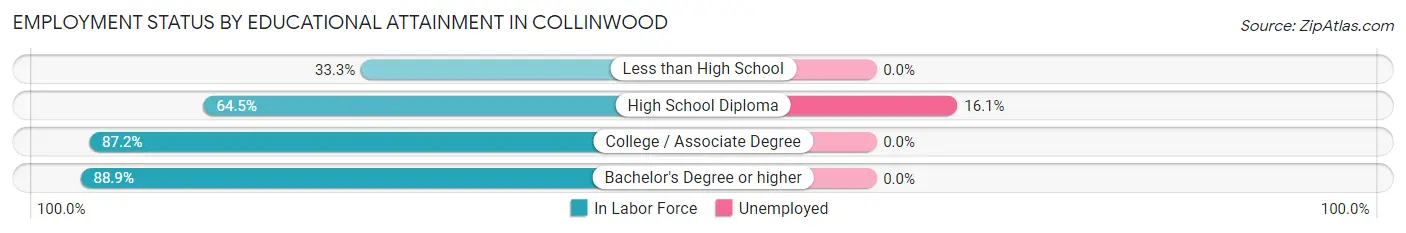
| Educational Attainment | In Labor Force | Unemployed |
| Less than High School | 12 (33.3%) | 0 (0.0%) |
| High School Diploma | 180 (64.5%) | 45 (16.1%) |
| College / Associate Degree | 252 (87.2%) | 0 (0.0%) |
| Bachelor's Degree or higher | 48 (88.9%) | 0 (0.0%) |
| Total | 492 (74.8%) | 39 (5.9%) |
Employment Occupations by Sex in Collinwood
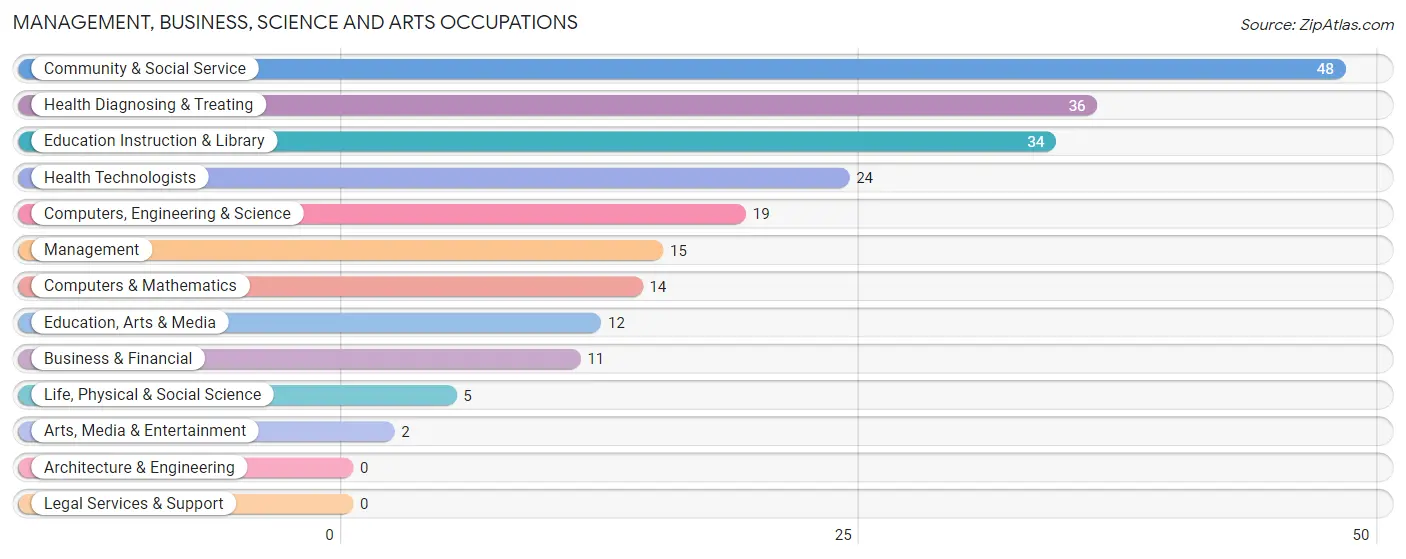
Management, Business, Science and Arts Occupations
The most common Management, Business, Science and Arts occupations in Collinwood are Community & Social Service (48 | 8.6%), Health Diagnosing & Treating (36 | 6.4%), Education Instruction & Library (34 | 6.1%), Health Technologists (24 | 4.3%), and Computers, Engineering & Science (19 | 3.4%).
Management, Business, Science and Arts Occupations by Sex
Within the Management, Business, Science and Arts occupations in Collinwood, the most male-oriented occupations are Business & Financial (100.0%), Life, Physical & Social Science (100.0%), and Computers, Engineering & Science (73.7%), while the most female-oriented occupations are Arts, Media & Entertainment (100.0%), Health Diagnosing & Treating (100.0%), and Health Technologists (100.0%).
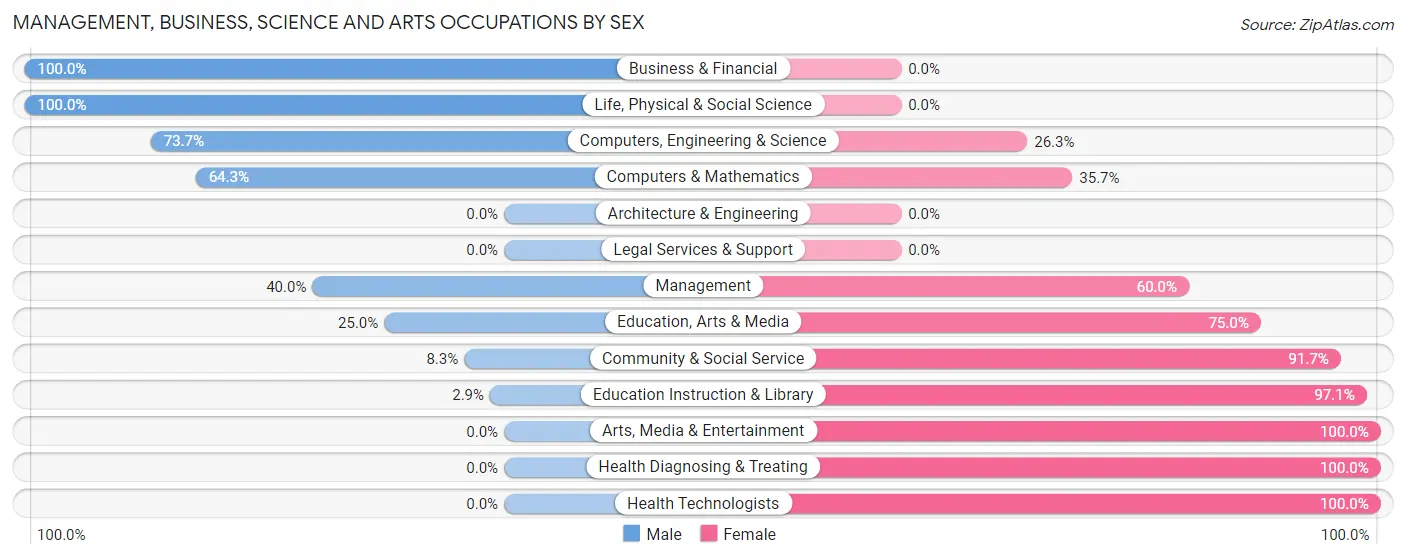
| Occupation | Male | Female |
| Management | 6 (40.0%) | 9 (60.0%) |
| Business & Financial | 11 (100.0%) | 0 (0.0%) |
| Computers, Engineering & Science | 14 (73.7%) | 5 (26.3%) |
| Computers & Mathematics | 9 (64.3%) | 5 (35.7%) |
| Architecture & Engineering | 0 (0.0%) | 0 (0.0%) |
| Life, Physical & Social Science | 5 (100.0%) | 0 (0.0%) |
| Community & Social Service | 4 (8.3%) | 44 (91.7%) |
| Education, Arts & Media | 3 (25.0%) | 9 (75.0%) |
| Legal Services & Support | 0 (0.0%) | 0 (0.0%) |
| Education Instruction & Library | 1 (2.9%) | 33 (97.1%) |
| Arts, Media & Entertainment | 0 (0.0%) | 2 (100.0%) |
| Health Diagnosing & Treating | 0 (0.0%) | 36 (100.0%) |
| Health Technologists | 0 (0.0%) | 24 (100.0%) |
| Total (Category) | 35 (27.1%) | 94 (72.9%) |
| Total (Overall) | 327 (58.3%) | 234 (41.7%) |
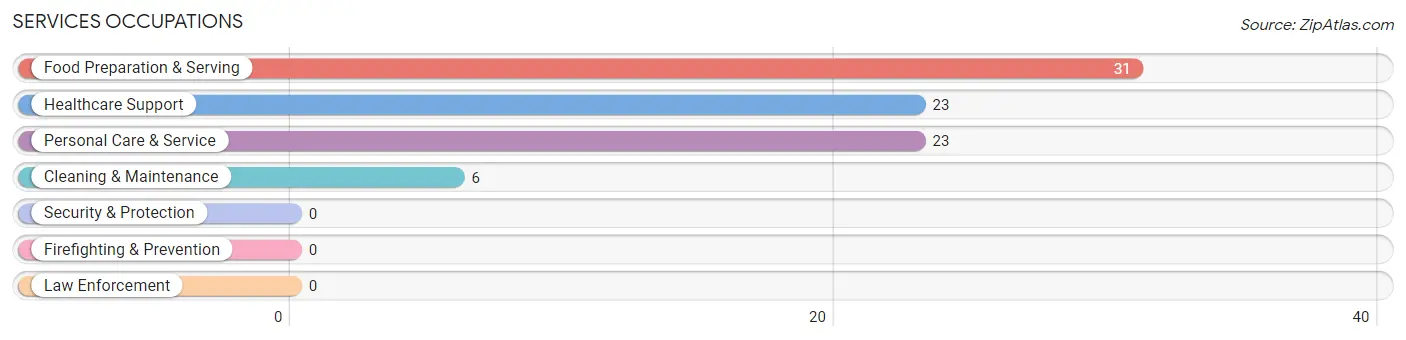
Services Occupations
The most common Services occupations in Collinwood are Food Preparation & Serving (31 | 5.5%), Healthcare Support (23 | 4.1%), Personal Care & Service (23 | 4.1%), and Cleaning & Maintenance (6 | 1.1%).
Services Occupations by Sex
Within the Services occupations in Collinwood, the most male-oriented occupations are Personal Care & Service (56.5%), Cleaning & Maintenance (50.0%), and Food Preparation & Serving (32.3%), while the most female-oriented occupations are Healthcare Support (100.0%), Food Preparation & Serving (67.7%), and Cleaning & Maintenance (50.0%).
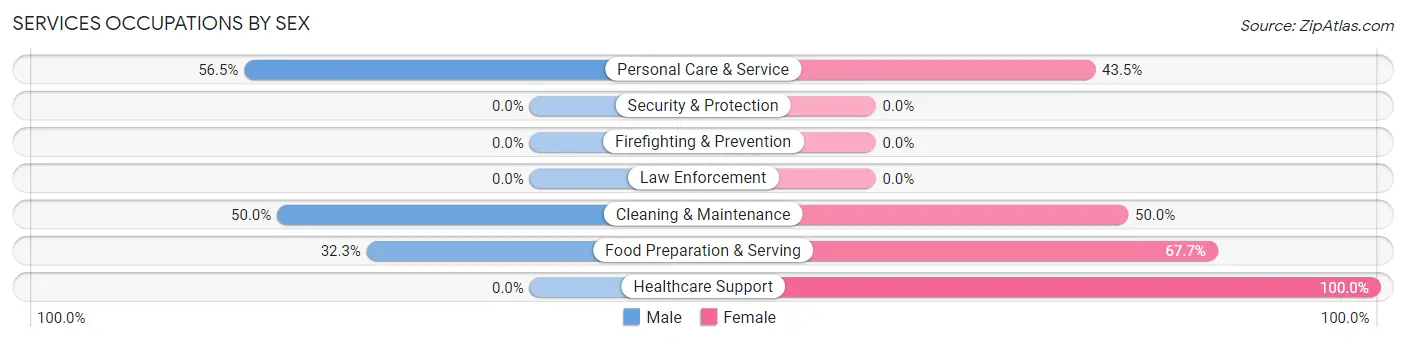
| Occupation | Male | Female |
| Healthcare Support | 0 (0.0%) | 23 (100.0%) |
| Security & Protection | 0 (0.0%) | 0 (0.0%) |
| Firefighting & Prevention | 0 (0.0%) | 0 (0.0%) |
| Law Enforcement | 0 (0.0%) | 0 (0.0%) |
| Food Preparation & Serving | 10 (32.3%) | 21 (67.7%) |
| Cleaning & Maintenance | 3 (50.0%) | 3 (50.0%) |
| Personal Care & Service | 13 (56.5%) | 10 (43.5%) |
| Total (Category) | 26 (31.3%) | 57 (68.7%) |
| Total (Overall) | 327 (58.3%) | 234 (41.7%) |
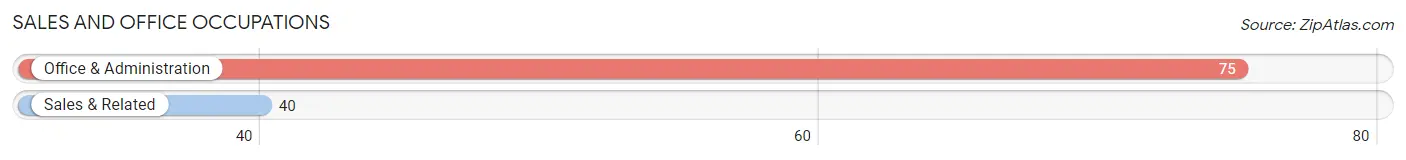
Sales and Office Occupations
The most common Sales and Office occupations in Collinwood are Office & Administration (75 | 13.4%), and Sales & Related (40 | 7.1%).
Sales and Office Occupations by Sex

| Occupation | Male | Female |
| Sales & Related | 38 (95.0%) | 2 (5.0%) |
| Office & Administration | 40 (53.3%) | 35 (46.7%) |
| Total (Category) | 78 (67.8%) | 37 (32.2%) |
| Total (Overall) | 327 (58.3%) | 234 (41.7%) |
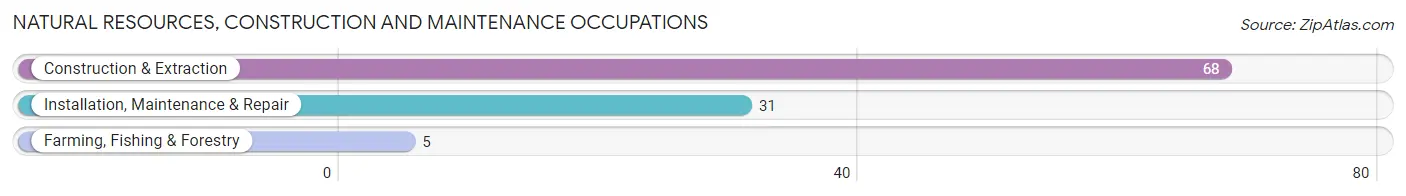
Natural Resources, Construction and Maintenance Occupations
The most common Natural Resources, Construction and Maintenance occupations in Collinwood are Construction & Extraction (68 | 12.1%), Installation, Maintenance & Repair (31 | 5.5%), and Farming, Fishing & Forestry (5 | 0.9%).
Natural Resources, Construction and Maintenance Occupations by Sex
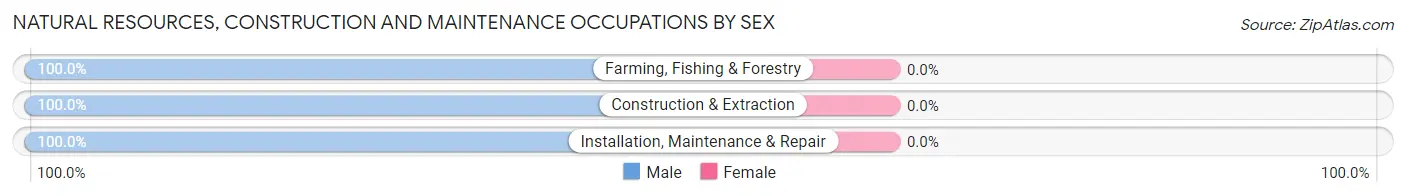
| Occupation | Male | Female |
| Farming, Fishing & Forestry | 5 (100.0%) | 0 (0.0%) |
| Construction & Extraction | 68 (100.0%) | 0 (0.0%) |
| Installation, Maintenance & Repair | 31 (100.0%) | 0 (0.0%) |
| Total (Category) | 104 (100.0%) | 0 (0.0%) |
| Total (Overall) | 327 (58.3%) | 234 (41.7%) |
Production, Transportation and Moving Occupations
The most common Production, Transportation and Moving occupations in Collinwood are Production (73 | 13.0%), Material Moving (55 | 9.8%), and Transportation (2 | 0.4%).
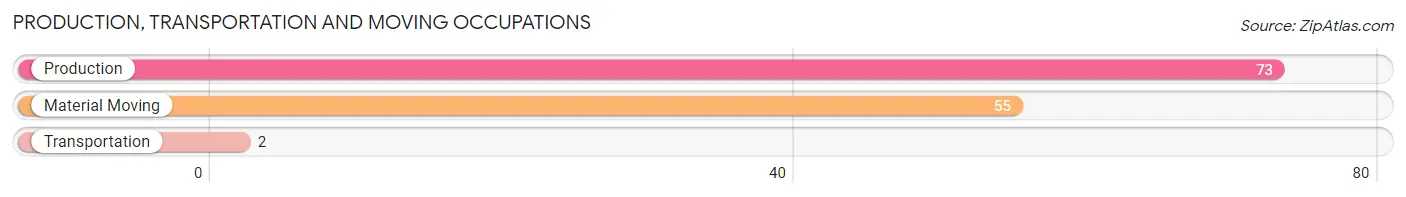
Production, Transportation and Moving Occupations by Sex
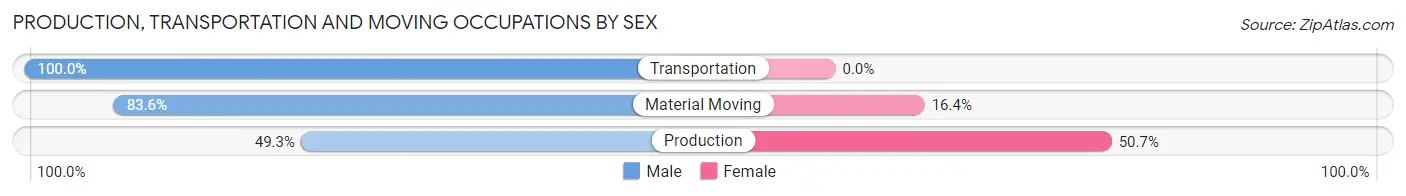
| Occupation | Male | Female |
| Production | 36 (49.3%) | 37 (50.7%) |
| Transportation | 2 (100.0%) | 0 (0.0%) |
| Material Moving | 46 (83.6%) | 9 (16.4%) |
| Total (Category) | 84 (64.6%) | 46 (35.4%) |
| Total (Overall) | 327 (58.3%) | 234 (41.7%) |
Employment Industries by Sex in Collinwood
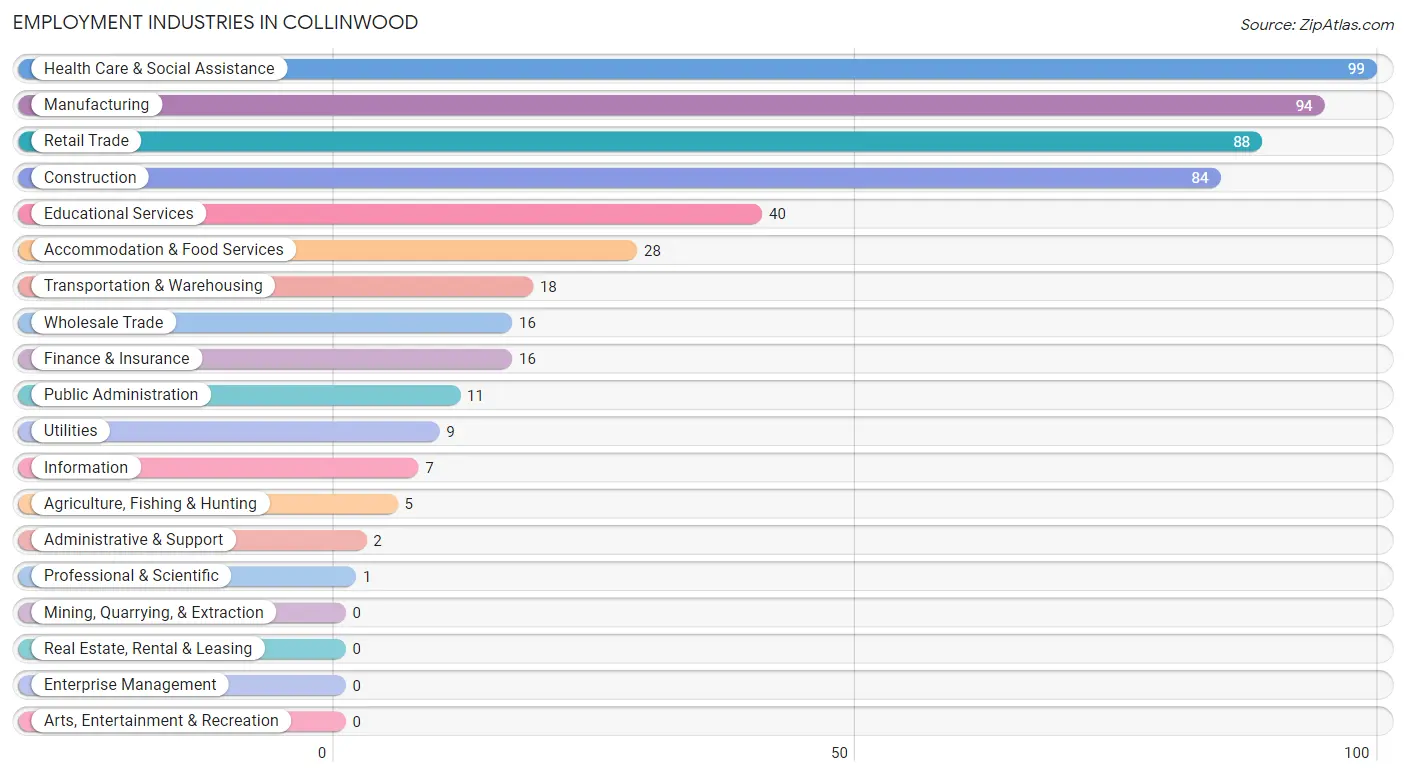
Employment Industries in Collinwood
The major employment industries in Collinwood include Health Care & Social Assistance (99 | 17.6%), Manufacturing (94 | 16.8%), Retail Trade (88 | 15.7%), Construction (84 | 15.0%), and Educational Services (40 | 7.1%).
Employment Industries by Sex in Collinwood
The Collinwood industries that see more men than women are Agriculture, Fishing & Hunting (100.0%), Construction (100.0%), and Wholesale Trade (100.0%), whereas the industries that tend to have a higher number of women are Information (100.0%), Administrative & Support (100.0%), and Educational Services (100.0%).
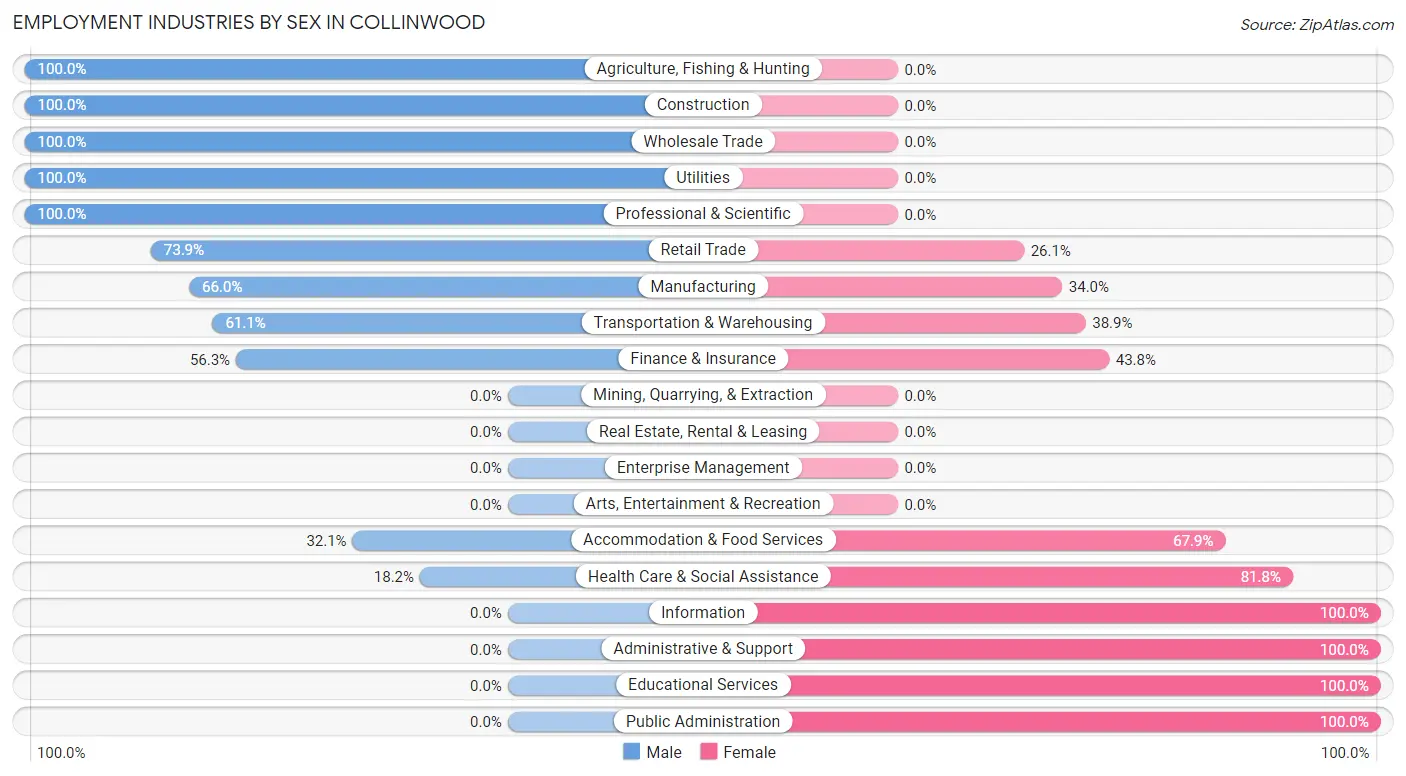
| Industry | Male | Female |
| Agriculture, Fishing & Hunting | 5 (100.0%) | 0 (0.0%) |
| Mining, Quarrying, & Extraction | 0 (0.0%) | 0 (0.0%) |
| Construction | 84 (100.0%) | 0 (0.0%) |
| Manufacturing | 62 (66.0%) | 32 (34.0%) |
| Wholesale Trade | 16 (100.0%) | 0 (0.0%) |
| Retail Trade | 65 (73.9%) | 23 (26.1%) |
| Transportation & Warehousing | 11 (61.1%) | 7 (38.9%) |
| Utilities | 9 (100.0%) | 0 (0.0%) |
| Information | 0 (0.0%) | 7 (100.0%) |
| Finance & Insurance | 9 (56.2%) | 7 (43.8%) |
| Real Estate, Rental & Leasing | 0 (0.0%) | 0 (0.0%) |
| Professional & Scientific | 1 (100.0%) | 0 (0.0%) |
| Enterprise Management | 0 (0.0%) | 0 (0.0%) |
| Administrative & Support | 0 (0.0%) | 2 (100.0%) |
| Educational Services | 0 (0.0%) | 40 (100.0%) |
| Health Care & Social Assistance | 18 (18.2%) | 81 (81.8%) |
| Arts, Entertainment & Recreation | 0 (0.0%) | 0 (0.0%) |
| Accommodation & Food Services | 9 (32.1%) | 19 (67.9%) |
| Public Administration | 0 (0.0%) | 11 (100.0%) |
| Total | 327 (58.3%) | 234 (41.7%) |
Education in Collinwood
School Enrollment in Collinwood
The most common levels of schooling among the 335 students in Collinwood are middle school (124 | 37.0%), college / undergraduate (61 | 18.2%), and high school (52 | 15.5%).
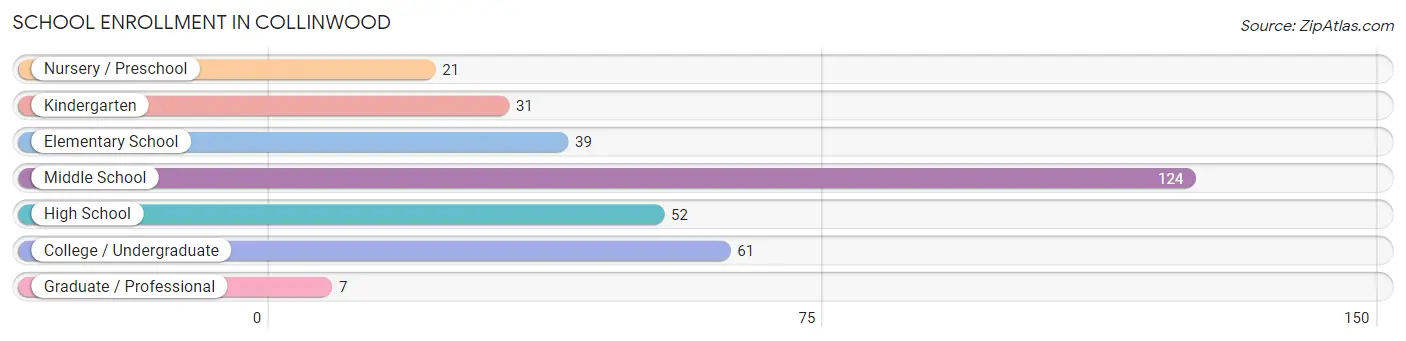
| School Level | # Students | % Students |
| Nursery / Preschool | 21 | 6.3% |
| Kindergarten | 31 | 9.2% |
| Elementary School | 39 | 11.6% |
| Middle School | 124 | 37.0% |
| High School | 52 | 15.5% |
| College / Undergraduate | 61 | 18.2% |
| Graduate / Professional | 7 | 2.1% |
| Total | 335 | 100.0% |
School Enrollment by Age by Funding Source in Collinwood
Out of a total of 335 students who are enrolled in schools in Collinwood, 29 (8.7%) attend a private institution, while the remaining 306 (91.3%) are enrolled in public schools. The age group of 18 to 19 year olds has the highest likelihood of being enrolled in private schools, with 9 (60.0% in the age bracket) enrolled. Conversely, the age group of 3 to 4 year olds has the lowest likelihood of being enrolled in a private school, with 8 (100.0% in the age bracket) attending a public institution.
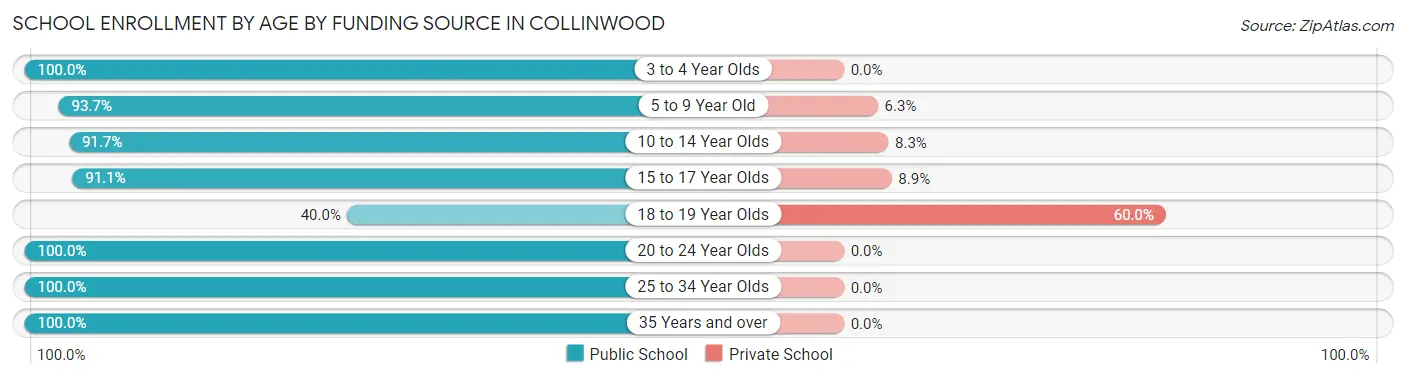
| Age Bracket | Public School | Private School |
| 3 to 4 Year Olds | 8 (100.0%) | 0 (0.0%) |
| 5 to 9 Year Old | 74 (93.7%) | 5 (6.3%) |
| 10 to 14 Year Olds | 122 (91.7%) | 11 (8.3%) |
| 15 to 17 Year Olds | 41 (91.1%) | 4 (8.9%) |
| 18 to 19 Year Olds | 6 (40.0%) | 9 (60.0%) |
| 20 to 24 Year Olds | 6 (100.0%) | 0 (0.0%) |
| 25 to 34 Year Olds | 42 (100.0%) | 0 (0.0%) |
| 35 Years and over | 7 (100.0%) | 0 (0.0%) |
| Total | 306 (91.3%) | 29 (8.7%) |
Educational Attainment by Field of Study in Collinwood
Business (28 | 35.4%), education (22 | 27.9%), science & technology (20 | 25.3%), liberal arts & history (6 | 7.6%), and literature & languages (2 | 2.5%) are the most common fields of study among 79 individuals in Collinwood who have obtained a bachelor's degree or higher.
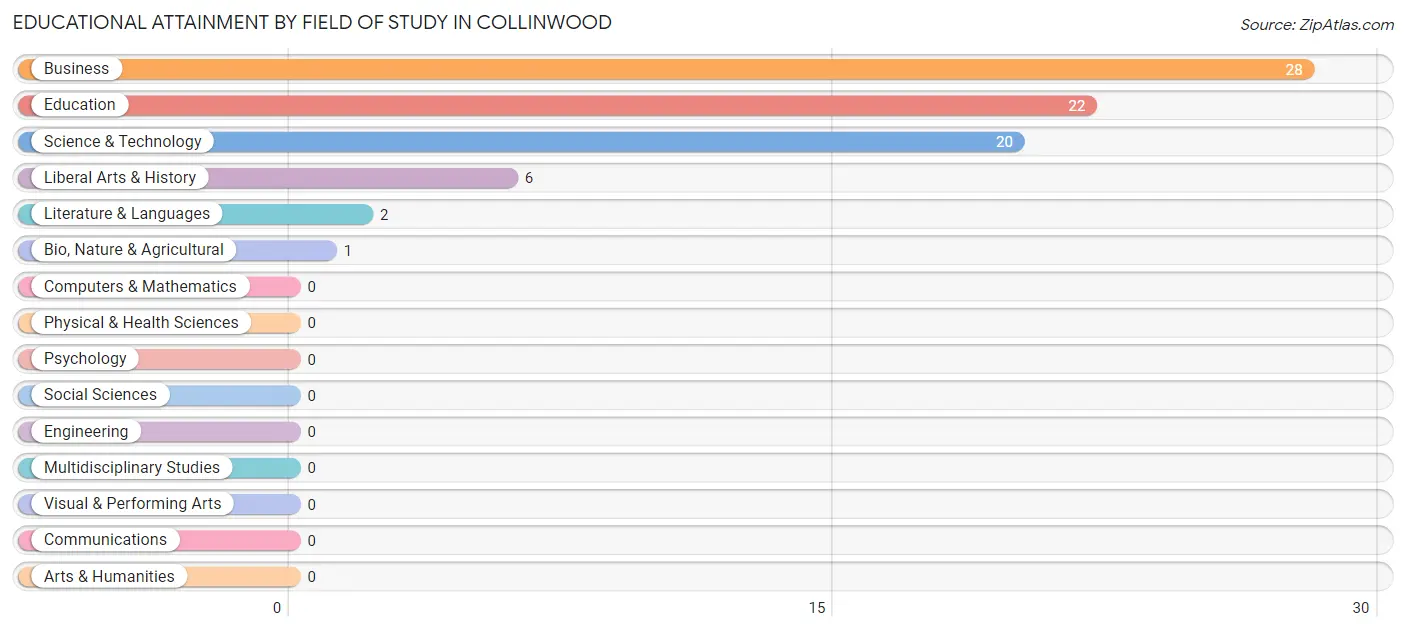
| Field of Study | # Graduates | % Graduates |
| Computers & Mathematics | 0 | 0.0% |
| Bio, Nature & Agricultural | 1 | 1.3% |
| Physical & Health Sciences | 0 | 0.0% |
| Psychology | 0 | 0.0% |
| Social Sciences | 0 | 0.0% |
| Engineering | 0 | 0.0% |
| Multidisciplinary Studies | 0 | 0.0% |
| Science & Technology | 20 | 25.3% |
| Business | 28 | 35.4% |
| Education | 22 | 27.9% |
| Literature & Languages | 2 | 2.5% |
| Liberal Arts & History | 6 | 7.6% |
| Visual & Performing Arts | 0 | 0.0% |
| Communications | 0 | 0.0% |
| Arts & Humanities | 0 | 0.0% |
| Total | 79 | 100.0% |
Transportation & Commute in Collinwood
Vehicle Availability by Sex in Collinwood
The most prevalent vehicle ownership categories in Collinwood are males with 3 vehicles (178, accounting for 54.6%) and females with 3 vehicles (55, making up 77.1%).
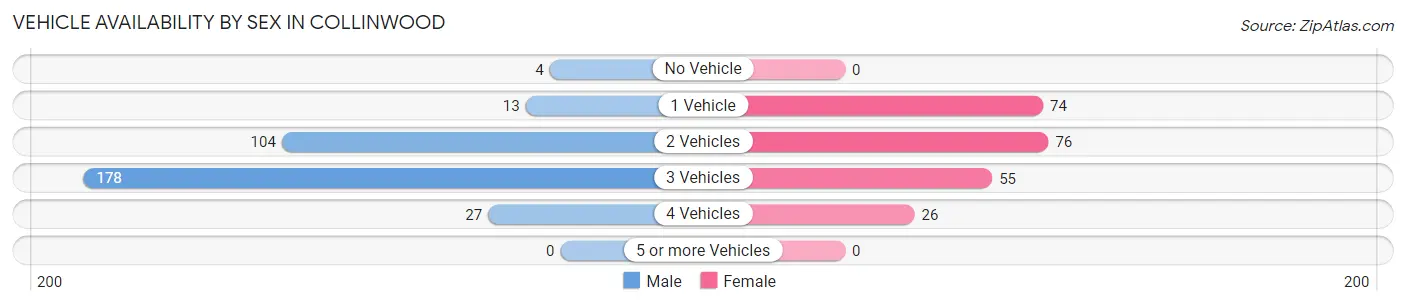
| Vehicles Available | Male | Female |
| No Vehicle | 4 (1.2%) | 0 (0.0%) |
| 1 Vehicle | 13 (4.0%) | 74 (32.0%) |
| 2 Vehicles | 104 (31.9%) | 76 (32.9%) |
| 3 Vehicles | 178 (54.6%) | 55 (23.8%) |
| 4 Vehicles | 27 (8.3%) | 26 (11.3%) |
| 5 or more Vehicles | 0 (0.0%) | 0 (0.0%) |
| Total | 326 (100.0%) | 231 (100.0%) |
Commute Time in Collinwood
The most frequently occuring commute durations in Collinwood are 5 to 9 minutes (120 commuters, 21.7%), 60 to 89 minutes (93 commuters, 16.9%), and less than 5 minutes (82 commuters, 14.9%).
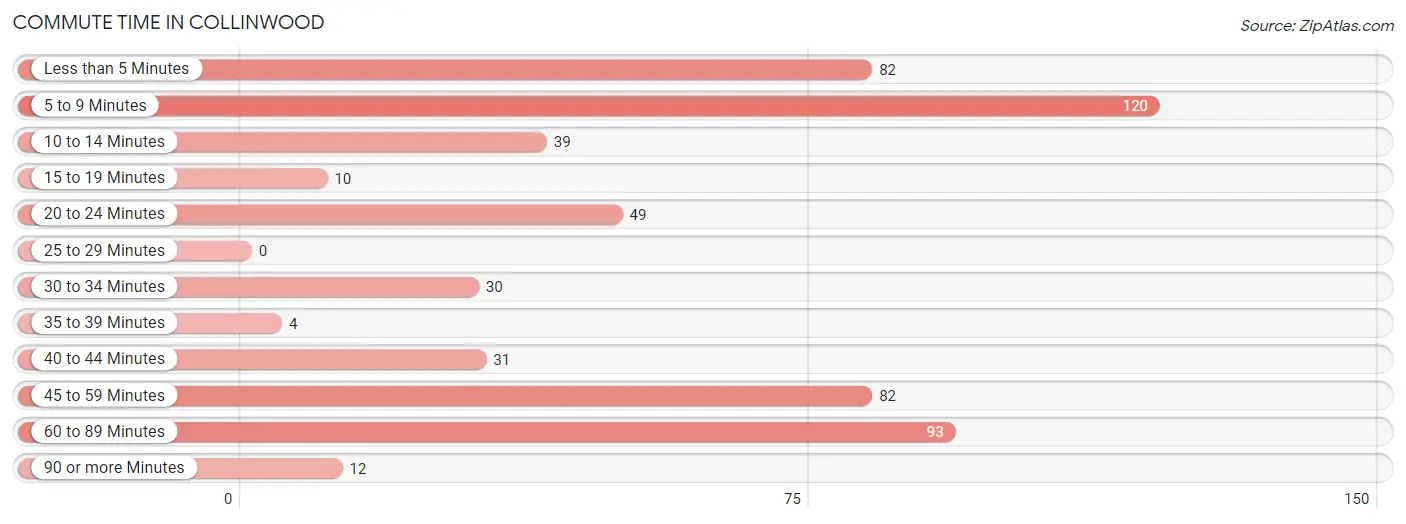
| Commute Time | # Commuters | % Commuters |
| Less than 5 Minutes | 82 | 14.9% |
| 5 to 9 Minutes | 120 | 21.7% |
| 10 to 14 Minutes | 39 | 7.1% |
| 15 to 19 Minutes | 10 | 1.8% |
| 20 to 24 Minutes | 49 | 8.9% |
| 25 to 29 Minutes | 0 | 0.0% |
| 30 to 34 Minutes | 30 | 5.4% |
| 35 to 39 Minutes | 4 | 0.7% |
| 40 to 44 Minutes | 31 | 5.6% |
| 45 to 59 Minutes | 82 | 14.9% |
| 60 to 89 Minutes | 93 | 16.9% |
| 90 or more Minutes | 12 | 2.2% |
Commute Time by Sex in Collinwood
The most common commute times in Collinwood are 5 to 9 minutes (90 commuters, 27.6%) for males and 60 to 89 minutes (39 commuters, 17.3%) for females.
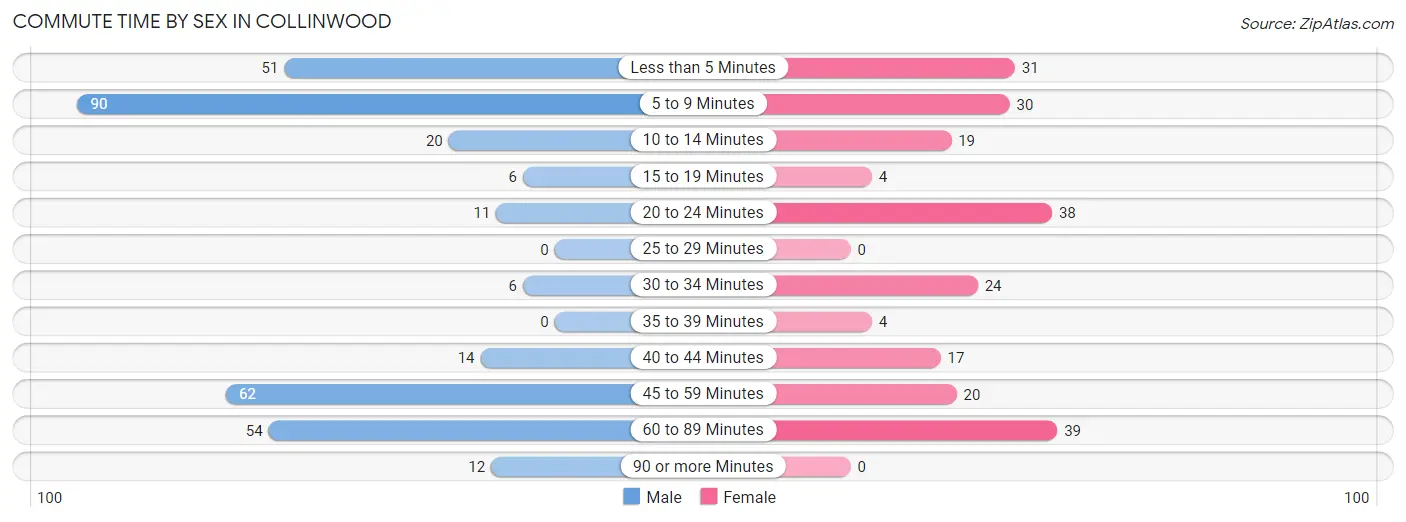
| Commute Time | Male | Female |
| Less than 5 Minutes | 51 (15.6%) | 31 (13.7%) |
| 5 to 9 Minutes | 90 (27.6%) | 30 (13.3%) |
| 10 to 14 Minutes | 20 (6.1%) | 19 (8.4%) |
| 15 to 19 Minutes | 6 (1.8%) | 4 (1.8%) |
| 20 to 24 Minutes | 11 (3.4%) | 38 (16.8%) |
| 25 to 29 Minutes | 0 (0.0%) | 0 (0.0%) |
| 30 to 34 Minutes | 6 (1.8%) | 24 (10.6%) |
| 35 to 39 Minutes | 0 (0.0%) | 4 (1.8%) |
| 40 to 44 Minutes | 14 (4.3%) | 17 (7.5%) |
| 45 to 59 Minutes | 62 (19.0%) | 20 (8.8%) |
| 60 to 89 Minutes | 54 (16.6%) | 39 (17.3%) |
| 90 or more Minutes | 12 (3.7%) | 0 (0.0%) |
Time of Departure to Work by Sex in Collinwood
The most frequent times of departure to work in Collinwood are 6:00 AM to 6:29 AM (94, 28.8%) for males and 7:00 AM to 7:29 AM (49, 21.7%) for females.
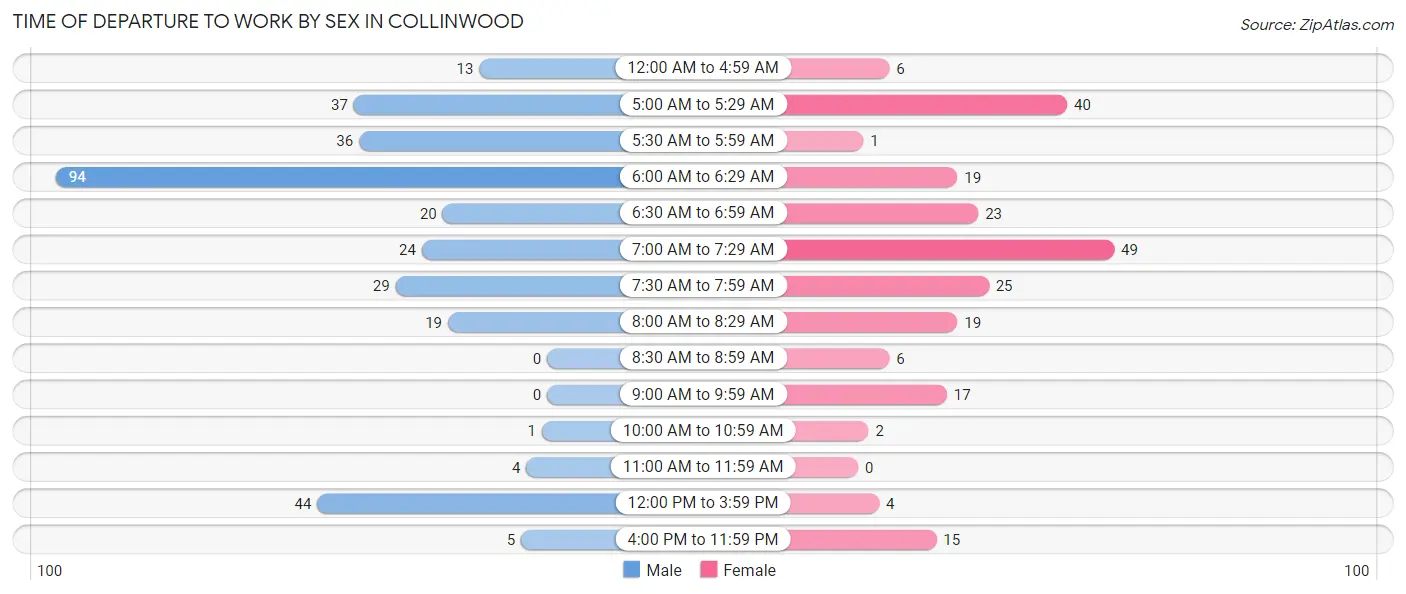
| Time of Departure | Male | Female |
| 12:00 AM to 4:59 AM | 13 (4.0%) | 6 (2.6%) |
| 5:00 AM to 5:29 AM | 37 (11.4%) | 40 (17.7%) |
| 5:30 AM to 5:59 AM | 36 (11.0%) | 1 (0.4%) |
| 6:00 AM to 6:29 AM | 94 (28.8%) | 19 (8.4%) |
| 6:30 AM to 6:59 AM | 20 (6.1%) | 23 (10.2%) |
| 7:00 AM to 7:29 AM | 24 (7.4%) | 49 (21.7%) |
| 7:30 AM to 7:59 AM | 29 (8.9%) | 25 (11.1%) |
| 8:00 AM to 8:29 AM | 19 (5.8%) | 19 (8.4%) |
| 8:30 AM to 8:59 AM | 0 (0.0%) | 6 (2.6%) |
| 9:00 AM to 9:59 AM | 0 (0.0%) | 17 (7.5%) |
| 10:00 AM to 10:59 AM | 1 (0.3%) | 2 (0.9%) |
| 11:00 AM to 11:59 AM | 4 (1.2%) | 0 (0.0%) |
| 12:00 PM to 3:59 PM | 44 (13.5%) | 4 (1.8%) |
| 4:00 PM to 11:59 PM | 5 (1.5%) | 15 (6.6%) |
| Total | 326 (100.0%) | 226 (100.0%) |
Housing Occupancy in Collinwood
Occupancy by Ownership in Collinwood
Of the total 430 dwellings in Collinwood, owner-occupied units account for 319 (74.2%), while renter-occupied units make up 111 (25.8%).
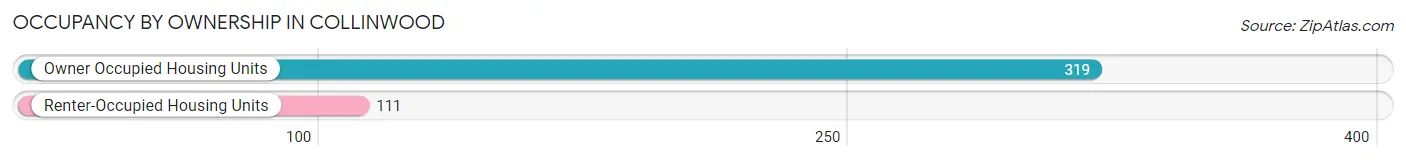
| Occupancy | # Housing Units | % Housing Units |
| Owner Occupied Housing Units | 319 | 74.2% |
| Renter-Occupied Housing Units | 111 | 25.8% |
| Total Occupied Housing Units | 430 | 100.0% |
Occupancy by Household Size in Collinwood
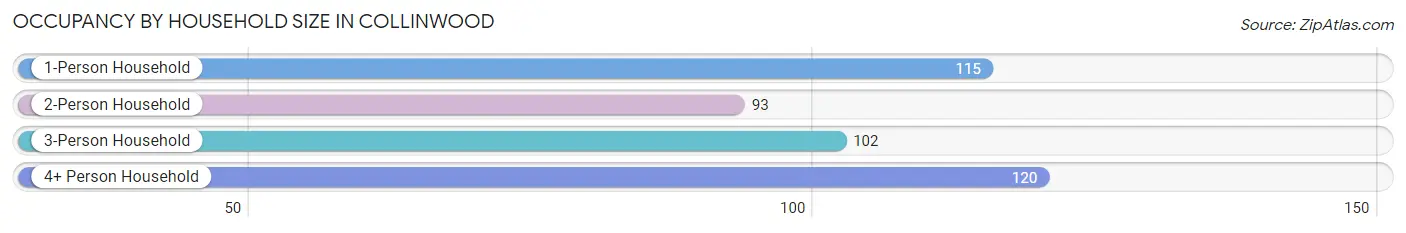
| Household Size | # Housing Units | % Housing Units |
| 1-Person Household | 115 | 26.7% |
| 2-Person Household | 93 | 21.6% |
| 3-Person Household | 102 | 23.7% |
| 4+ Person Household | 120 | 27.9% |
| Total Housing Units | 430 | 100.0% |
Occupancy by Ownership by Household Size in Collinwood
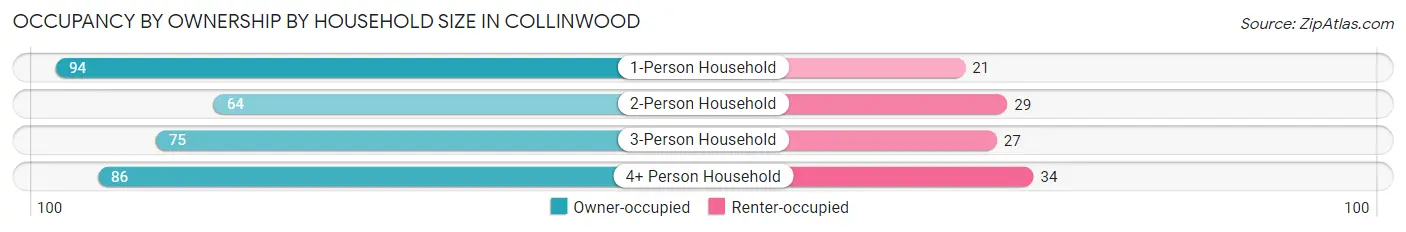
| Household Size | Owner-occupied | Renter-occupied |
| 1-Person Household | 94 (81.7%) | 21 (18.3%) |
| 2-Person Household | 64 (68.8%) | 29 (31.2%) |
| 3-Person Household | 75 (73.5%) | 27 (26.5%) |
| 4+ Person Household | 86 (71.7%) | 34 (28.3%) |
| Total Housing Units | 319 (74.2%) | 111 (25.8%) |
Occupancy by Educational Attainment in Collinwood
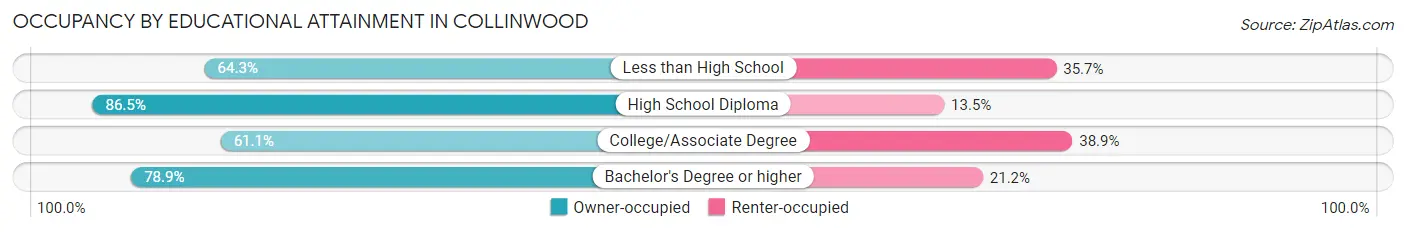
| Household Size | Owner-occupied | Renter-occupied |
| Less than High School | 36 (64.3%) | 20 (35.7%) |
| High School Diploma | 154 (86.5%) | 24 (13.5%) |
| College/Associate Degree | 88 (61.1%) | 56 (38.9%) |
| Bachelor's Degree or higher | 41 (78.8%) | 11 (21.1%) |
Occupancy by Age of Householder in Collinwood
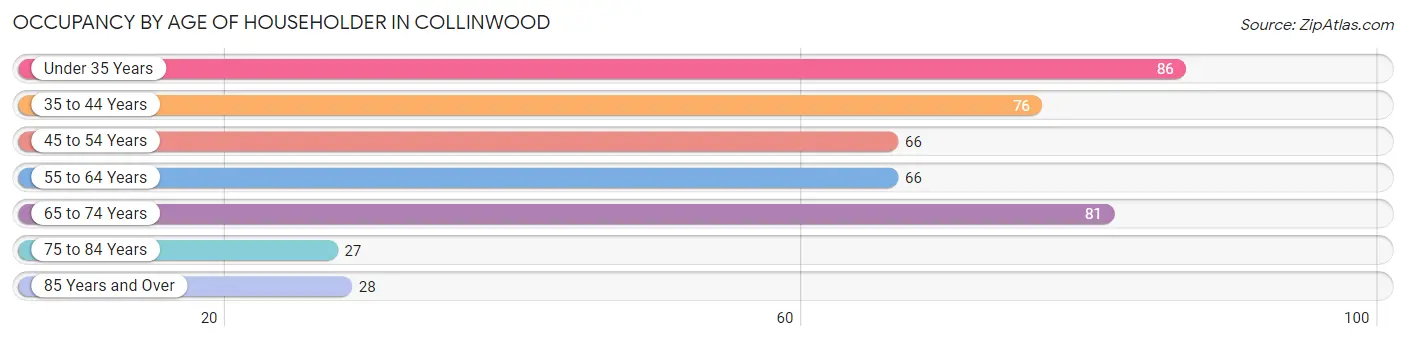
| Age Bracket | # Households | % Households |
| Under 35 Years | 86 | 20.0% |
| 35 to 44 Years | 76 | 17.7% |
| 45 to 54 Years | 66 | 15.3% |
| 55 to 64 Years | 66 | 15.3% |
| 65 to 74 Years | 81 | 18.8% |
| 75 to 84 Years | 27 | 6.3% |
| 85 Years and Over | 28 | 6.5% |
| Total | 430 | 100.0% |
Housing Finances in Collinwood
Median Income by Occupancy in Collinwood
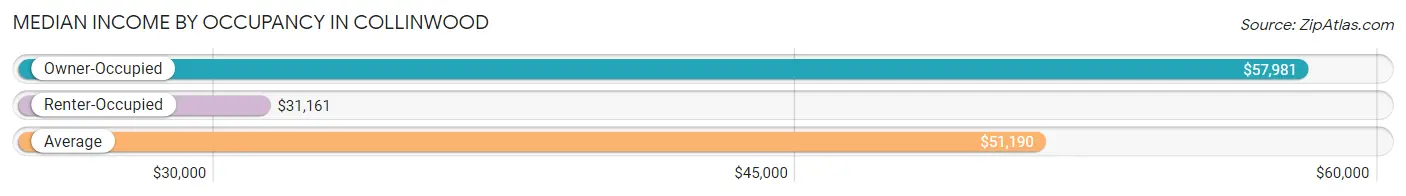
| Occupancy Type | # Households | Median Income |
| Owner-Occupied | 319 (74.2%) | $57,981 |
| Renter-Occupied | 111 (25.8%) | $31,161 |
| Average | 430 (100.0%) | $51,190 |
Occupancy by Householder Income Bracket in Collinwood
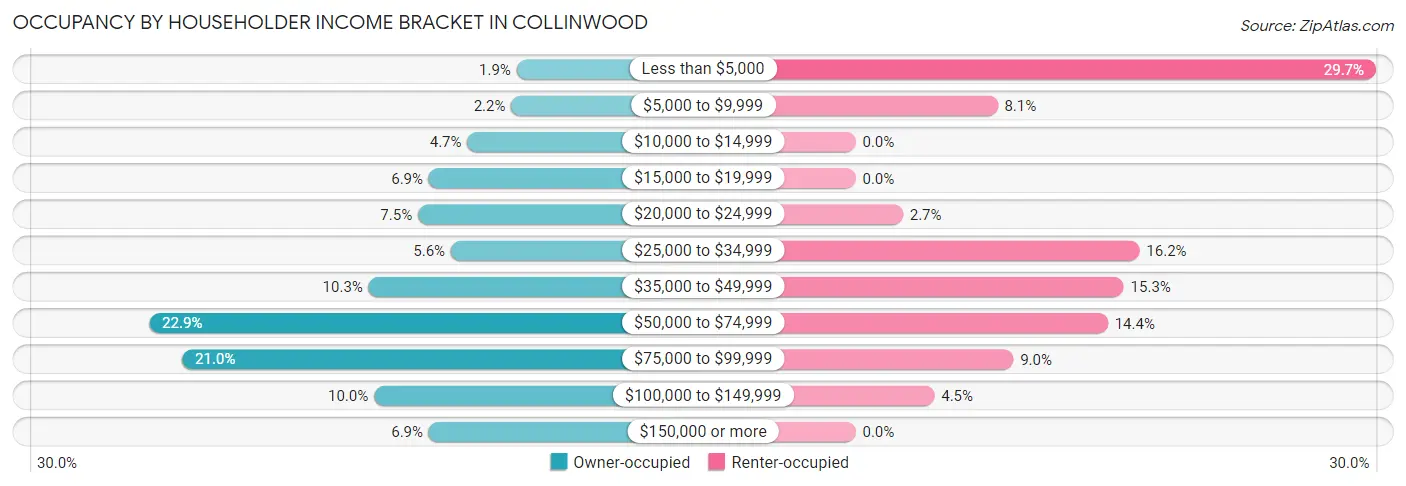
| Income Bracket | Owner-occupied | Renter-occupied |
| Less than $5,000 | 6 (1.9%) | 33 (29.7%) |
| $5,000 to $9,999 | 7 (2.2%) | 9 (8.1%) |
| $10,000 to $14,999 | 15 (4.7%) | 0 (0.0%) |
| $15,000 to $19,999 | 22 (6.9%) | 0 (0.0%) |
| $20,000 to $24,999 | 24 (7.5%) | 3 (2.7%) |
| $25,000 to $34,999 | 18 (5.6%) | 18 (16.2%) |
| $35,000 to $49,999 | 33 (10.3%) | 17 (15.3%) |
| $50,000 to $74,999 | 73 (22.9%) | 16 (14.4%) |
| $75,000 to $99,999 | 67 (21.0%) | 10 (9.0%) |
| $100,000 to $149,999 | 32 (10.0%) | 5 (4.5%) |
| $150,000 or more | 22 (6.9%) | 0 (0.0%) |
| Total | 319 (100.0%) | 111 (100.0%) |
Monthly Housing Cost Tiers in Collinwood
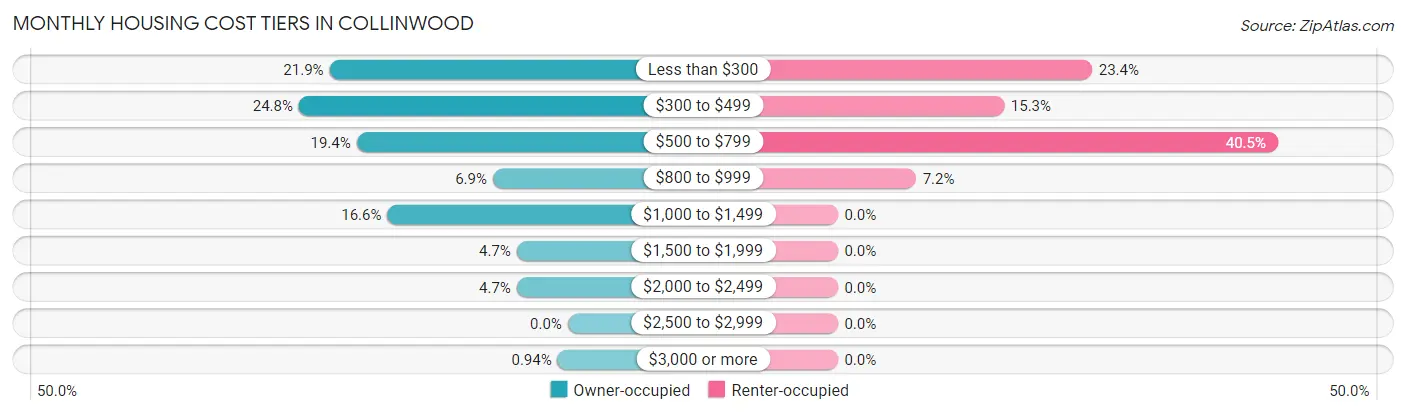
| Monthly Cost | Owner-occupied | Renter-occupied |
| Less than $300 | 70 (21.9%) | 26 (23.4%) |
| $300 to $499 | 79 (24.8%) | 17 (15.3%) |
| $500 to $799 | 62 (19.4%) | 45 (40.5%) |
| $800 to $999 | 22 (6.9%) | 8 (7.2%) |
| $1,000 to $1,499 | 53 (16.6%) | 0 (0.0%) |
| $1,500 to $1,999 | 15 (4.7%) | 0 (0.0%) |
| $2,000 to $2,499 | 15 (4.7%) | 0 (0.0%) |
| $2,500 to $2,999 | 0 (0.0%) | 0 (0.0%) |
| $3,000 or more | 3 (0.9%) | 0 (0.0%) |
| Total | 319 (100.0%) | 111 (100.0%) |
Physical Housing Characteristics in Collinwood
Housing Structures in Collinwood
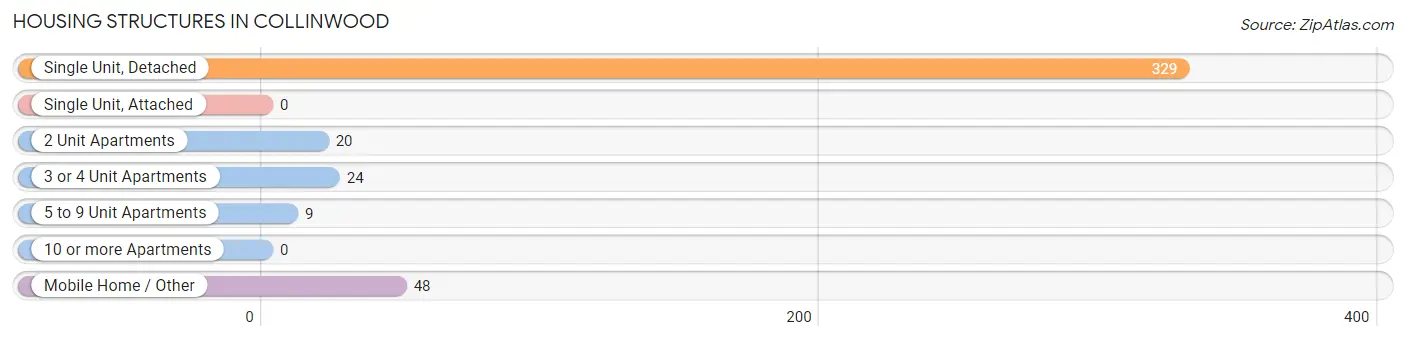
| Structure Type | # Housing Units | % Housing Units |
| Single Unit, Detached | 329 | 76.5% |
| Single Unit, Attached | 0 | 0.0% |
| 2 Unit Apartments | 20 | 4.6% |
| 3 or 4 Unit Apartments | 24 | 5.6% |
| 5 to 9 Unit Apartments | 9 | 2.1% |
| 10 or more Apartments | 0 | 0.0% |
| Mobile Home / Other | 48 | 11.2% |
| Total | 430 | 100.0% |
Housing Structures by Occupancy in Collinwood
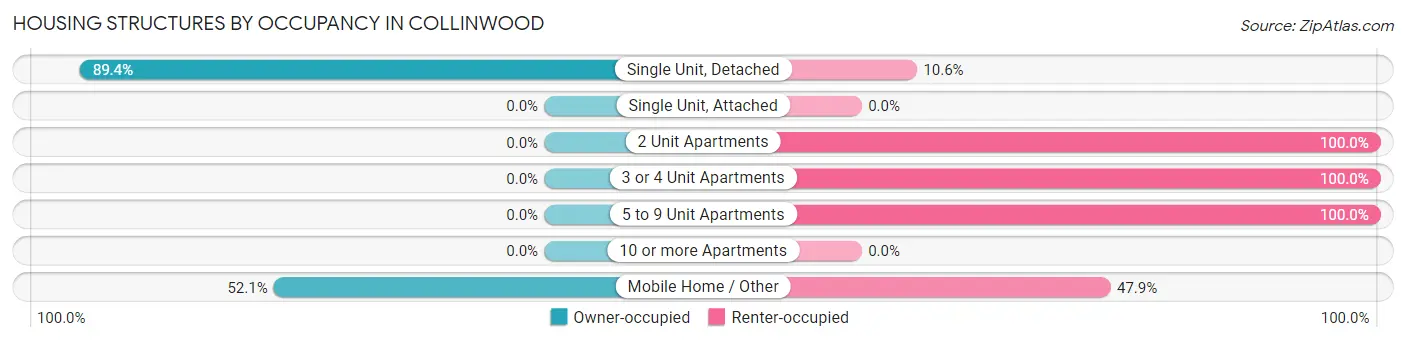
| Structure Type | Owner-occupied | Renter-occupied |
| Single Unit, Detached | 294 (89.4%) | 35 (10.6%) |
| Single Unit, Attached | 0 (0.0%) | 0 (0.0%) |
| 2 Unit Apartments | 0 (0.0%) | 20 (100.0%) |
| 3 or 4 Unit Apartments | 0 (0.0%) | 24 (100.0%) |
| 5 to 9 Unit Apartments | 0 (0.0%) | 9 (100.0%) |
| 10 or more Apartments | 0 (0.0%) | 0 (0.0%) |
| Mobile Home / Other | 25 (52.1%) | 23 (47.9%) |
| Total | 319 (74.2%) | 111 (25.8%) |
Housing Structures by Number of Rooms in Collinwood
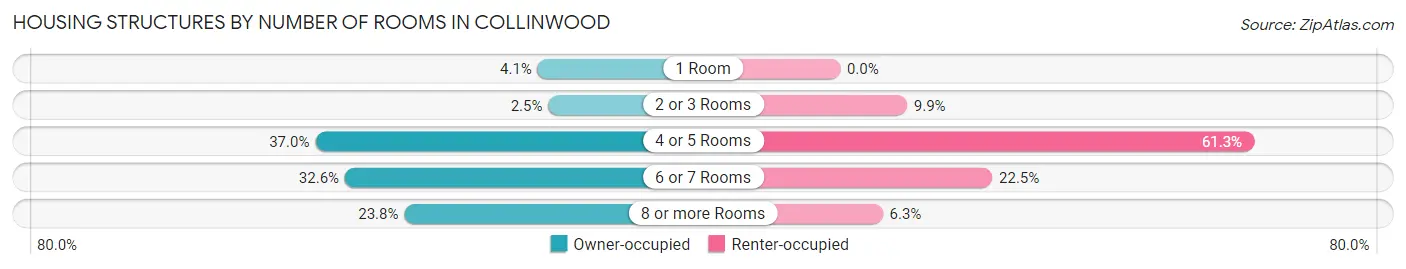
| Number of Rooms | Owner-occupied | Renter-occupied |
| 1 Room | 13 (4.1%) | 0 (0.0%) |
| 2 or 3 Rooms | 8 (2.5%) | 11 (9.9%) |
| 4 or 5 Rooms | 118 (37.0%) | 68 (61.3%) |
| 6 or 7 Rooms | 104 (32.6%) | 25 (22.5%) |
| 8 or more Rooms | 76 (23.8%) | 7 (6.3%) |
| Total | 319 (100.0%) | 111 (100.0%) |
Housing Structure by Heating Type in Collinwood
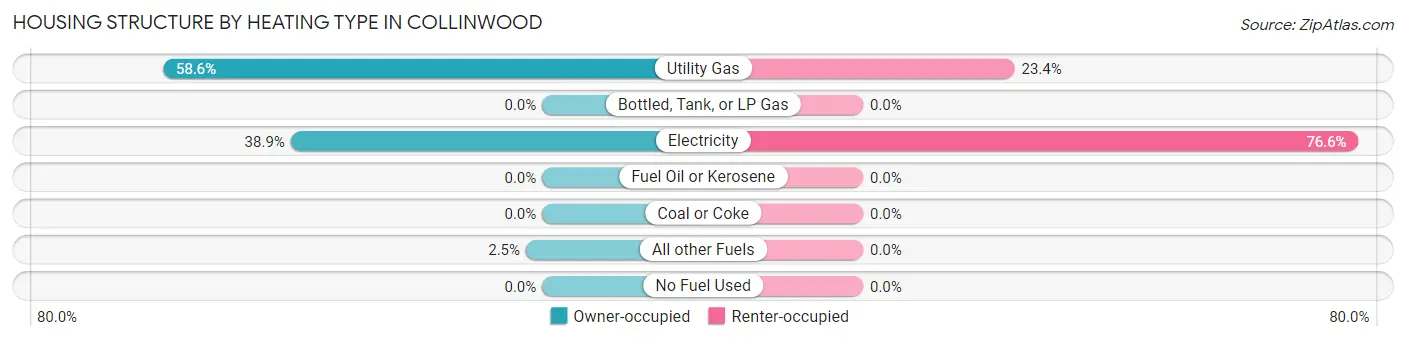
| Heating Type | Owner-occupied | Renter-occupied |
| Utility Gas | 187 (58.6%) | 26 (23.4%) |
| Bottled, Tank, or LP Gas | 0 (0.0%) | 0 (0.0%) |
| Electricity | 124 (38.9%) | 85 (76.6%) |
| Fuel Oil or Kerosene | 0 (0.0%) | 0 (0.0%) |
| Coal or Coke | 0 (0.0%) | 0 (0.0%) |
| All other Fuels | 8 (2.5%) | 0 (0.0%) |
| No Fuel Used | 0 (0.0%) | 0 (0.0%) |
| Total | 319 (100.0%) | 111 (100.0%) |
Household Vehicle Usage in Collinwood
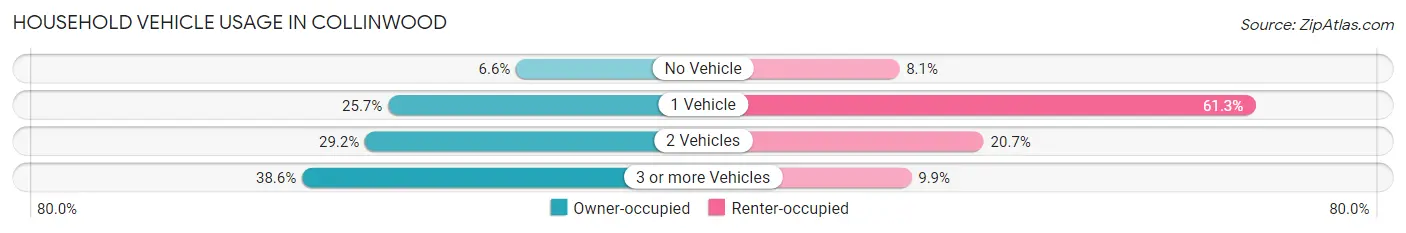
| Vehicles per Household | Owner-occupied | Renter-occupied |
| No Vehicle | 21 (6.6%) | 9 (8.1%) |
| 1 Vehicle | 82 (25.7%) | 68 (61.3%) |
| 2 Vehicles | 93 (29.1%) | 23 (20.7%) |
| 3 or more Vehicles | 123 (38.6%) | 11 (9.9%) |
| Total | 319 (100.0%) | 111 (100.0%) |
Real Estate & Mortgages in Collinwood
Real Estate and Mortgage Overview in Collinwood
| Characteristic | Without Mortgage | With Mortgage |
| Housing Units | 161 | 158 |
| Median Property Value | $80,200 | $111,300 |
| Median Household Income | $46,563 | $13 |
| Monthly Housing Costs | $319 | $3 |
| Real Estate Taxes | $545 | $8 |
Property Value by Mortgage Status in Collinwood
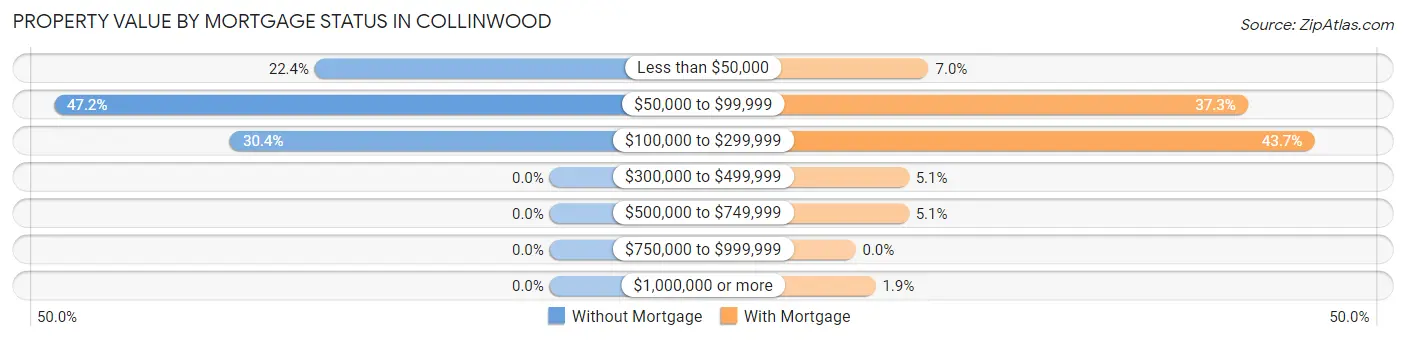
| Property Value | Without Mortgage | With Mortgage |
| Less than $50,000 | 36 (22.4%) | 11 (7.0%) |
| $50,000 to $99,999 | 76 (47.2%) | 59 (37.3%) |
| $100,000 to $299,999 | 49 (30.4%) | 69 (43.7%) |
| $300,000 to $499,999 | 0 (0.0%) | 8 (5.1%) |
| $500,000 to $749,999 | 0 (0.0%) | 8 (5.1%) |
| $750,000 to $999,999 | 0 (0.0%) | 0 (0.0%) |
| $1,000,000 or more | 0 (0.0%) | 3 (1.9%) |
| Total | 161 (100.0%) | 158 (100.0%) |
Household Income by Mortgage Status in Collinwood
| Household Income | Without Mortgage | With Mortgage |
| Less than $10,000 | 8 (5.0%) | 0 (0.0%) |
| $10,000 to $24,999 | 40 (24.8%) | 5 (3.2%) |
| $25,000 to $34,999 | 6 (3.7%) | 21 (13.3%) |
| $35,000 to $49,999 | 28 (17.4%) | 12 (7.6%) |
| $50,000 to $74,999 | 35 (21.7%) | 5 (3.2%) |
| $75,000 to $99,999 | 31 (19.3%) | 38 (24.0%) |
| $100,000 to $149,999 | 4 (2.5%) | 36 (22.8%) |
| $150,000 or more | 9 (5.6%) | 28 (17.7%) |
| Total | 161 (100.0%) | 158 (100.0%) |
Property Value to Household Income Ratio in Collinwood
| Value-to-Income Ratio | Without Mortgage | With Mortgage |
| Less than 2.0x | 81 (50.3%) | 74,643 (47,242.4%) |
| 2.0x to 2.9x | 25 (15.5%) | 69 (43.7%) |
| 3.0x to 3.9x | 20 (12.4%) | 46 (29.1%) |
| 4.0x or more | 35 (21.7%) | 3 (1.9%) |
| Total | 161 (100.0%) | 158 (100.0%) |
Real Estate Taxes by Mortgage Status in Collinwood
| Property Taxes | Without Mortgage | With Mortgage |
| Less than $800 | 139 (86.3%) | 0 (0.0%) |
| $800 to $1,499 | 22 (13.7%) | 71 (44.9%) |
| $800 to $1,499 | 0 (0.0%) | 59 (37.3%) |
| Total | 161 (100.0%) | 158 (100.0%) |
Health & Disability in Collinwood
Health Insurance Coverage by Age in Collinwood
| Age Bracket | With Coverage | Without Coverage |
| Under 6 Years | 62 (92.5%) | 5 (7.5%) |
| 6 to 18 Years | 222 (90.6%) | 23 (9.4%) |
| 19 to 25 Years | 74 (75.5%) | 24 (24.5%) |
| 26 to 34 Years | 94 (48.2%) | 101 (51.8%) |
| 35 to 44 Years | 173 (79.4%) | 45 (20.6%) |
| 45 to 54 Years | 107 (82.3%) | 23 (17.7%) |
| 55 to 64 Years | 91 (81.2%) | 21 (18.8%) |
| 65 to 74 Years | 88 (100.0%) | 0 (0.0%) |
| 75 Years and older | 71 (100.0%) | 0 (0.0%) |
| Total | 982 (80.2%) | 242 (19.8%) |
Health Insurance Coverage by Citizenship Status in Collinwood
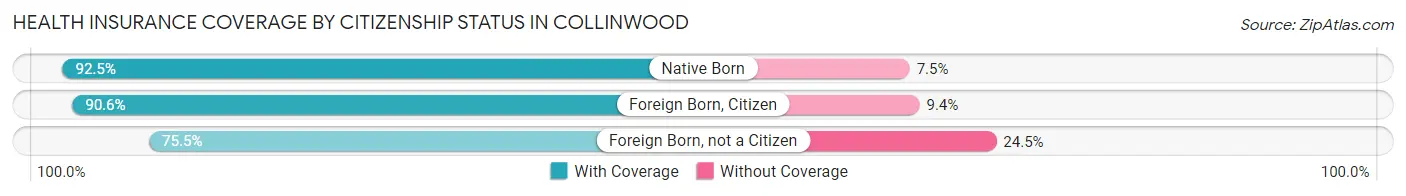
| Citizenship Status | With Coverage | Without Coverage |
| Native Born | 62 (92.5%) | 5 (7.5%) |
| Foreign Born, Citizen | 222 (90.6%) | 23 (9.4%) |
| Foreign Born, not a Citizen | 74 (75.5%) | 24 (24.5%) |
Health Insurance Coverage by Household Income in Collinwood
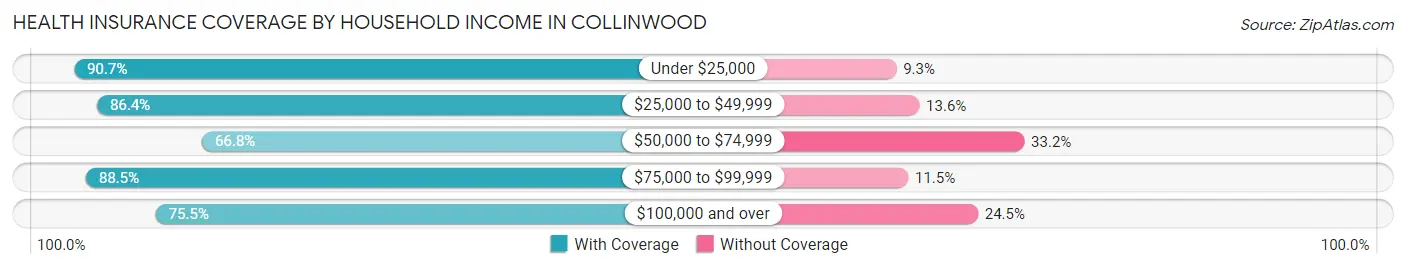
| Household Income | With Coverage | Without Coverage |
| Under $25,000 | 147 (90.7%) | 15 (9.3%) |
| $25,000 to $49,999 | 204 (86.4%) | 32 (13.6%) |
| $50,000 to $74,999 | 221 (66.8%) | 110 (33.2%) |
| $75,000 to $99,999 | 247 (88.5%) | 32 (11.5%) |
| $100,000 and over | 163 (75.5%) | 53 (24.5%) |
Public vs Private Health Insurance Coverage by Age in Collinwood
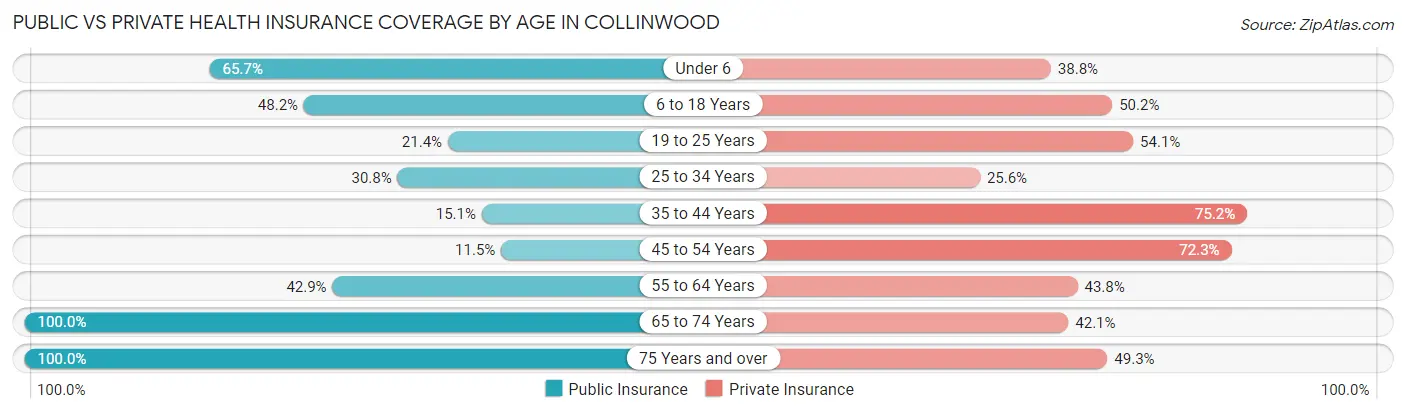
| Age Bracket | Public Insurance | Private Insurance |
| Under 6 | 44 (65.7%) | 26 (38.8%) |
| 6 to 18 Years | 118 (48.2%) | 123 (50.2%) |
| 19 to 25 Years | 21 (21.4%) | 53 (54.1%) |
| 25 to 34 Years | 60 (30.8%) | 50 (25.6%) |
| 35 to 44 Years | 33 (15.1%) | 164 (75.2%) |
| 45 to 54 Years | 15 (11.5%) | 94 (72.3%) |
| 55 to 64 Years | 48 (42.9%) | 49 (43.8%) |
| 65 to 74 Years | 88 (100.0%) | 37 (42.0%) |
| 75 Years and over | 71 (100.0%) | 35 (49.3%) |
| Total | 498 (40.7%) | 631 (51.5%) |
Disability Status by Sex by Age in Collinwood
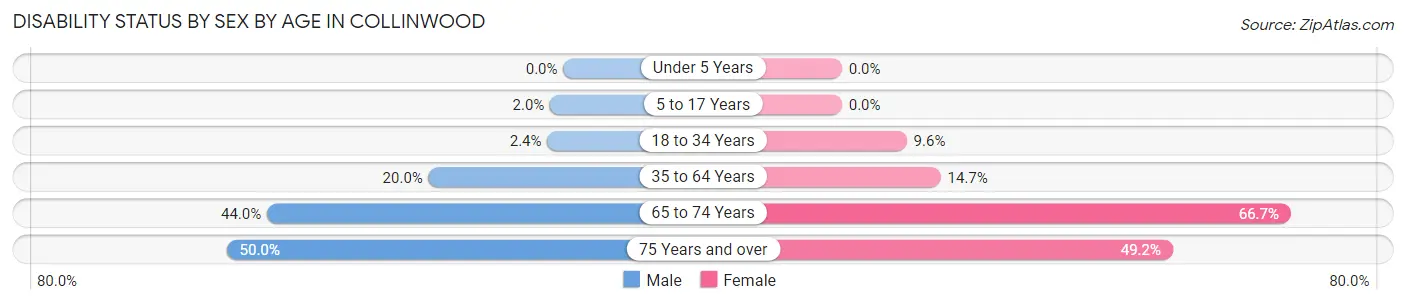
| Age Bracket | Male | Female |
| Under 5 Years | 0 (0.0%) | 0 (0.0%) |
| 5 to 17 Years | 2 (2.0%) | 0 (0.0%) |
| 18 to 34 Years | 4 (2.4%) | 13 (9.6%) |
| 35 to 64 Years | 47 (20.0%) | 33 (14.7%) |
| 65 to 74 Years | 11 (44.0%) | 42 (66.7%) |
| 75 Years and over | 6 (50.0%) | 29 (49.1%) |
Disability Class by Sex by Age in Collinwood
Disability Class: Hearing Difficulty
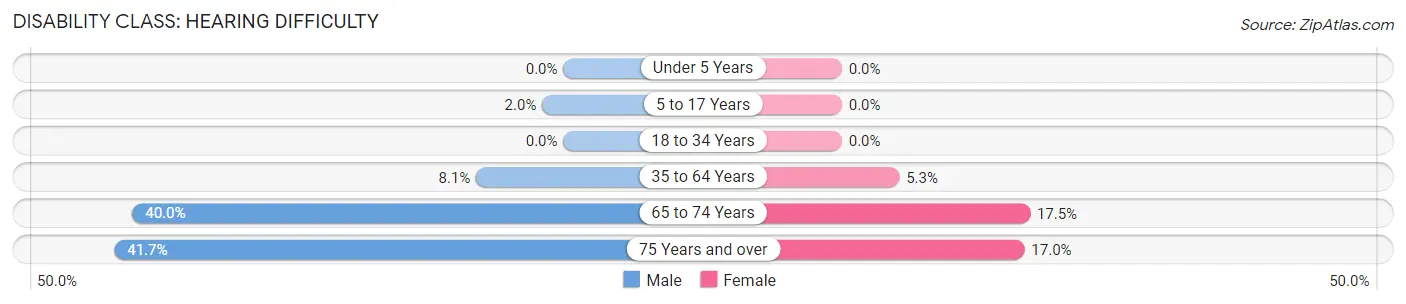
| Age Bracket | Male | Female |
| Under 5 Years | 0 (0.0%) | 0 (0.0%) |
| 5 to 17 Years | 2 (2.0%) | 0 (0.0%) |
| 18 to 34 Years | 0 (0.0%) | 0 (0.0%) |
| 35 to 64 Years | 19 (8.1%) | 12 (5.3%) |
| 65 to 74 Years | 10 (40.0%) | 11 (17.5%) |
| 75 Years and over | 5 (41.7%) | 10 (17.0%) |
Disability Class: Vision Difficulty
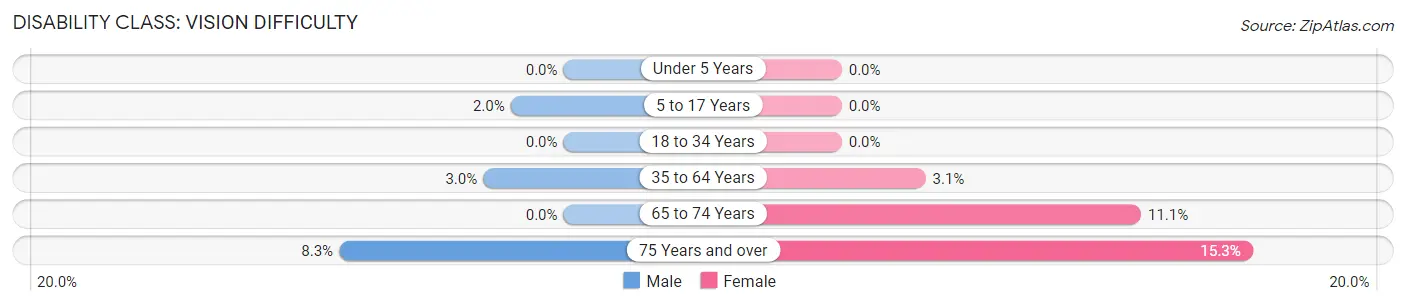
| Age Bracket | Male | Female |
| Under 5 Years | 0 (0.0%) | 0 (0.0%) |
| 5 to 17 Years | 2 (2.0%) | 0 (0.0%) |
| 18 to 34 Years | 0 (0.0%) | 0 (0.0%) |
| 35 to 64 Years | 7 (3.0%) | 7 (3.1%) |
| 65 to 74 Years | 0 (0.0%) | 7 (11.1%) |
| 75 Years and over | 1 (8.3%) | 9 (15.2%) |
Disability Class: Cognitive Difficulty
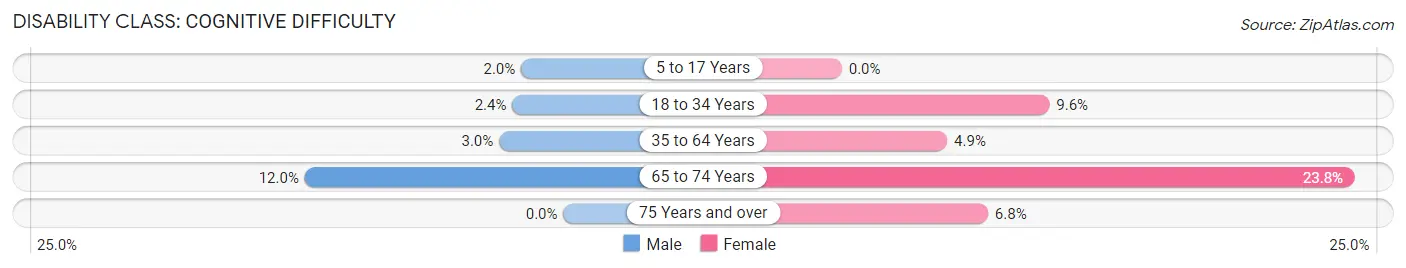
| Age Bracket | Male | Female |
| 5 to 17 Years | 2 (2.0%) | 0 (0.0%) |
| 18 to 34 Years | 4 (2.4%) | 13 (9.6%) |
| 35 to 64 Years | 7 (3.0%) | 11 (4.9%) |
| 65 to 74 Years | 3 (12.0%) | 15 (23.8%) |
| 75 Years and over | 0 (0.0%) | 4 (6.8%) |
Disability Class: Ambulatory Difficulty
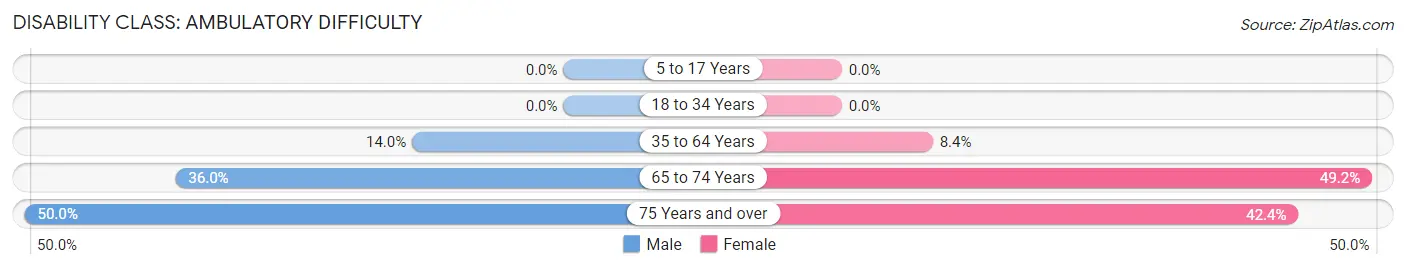
| Age Bracket | Male | Female |
| 5 to 17 Years | 0 (0.0%) | 0 (0.0%) |
| 18 to 34 Years | 0 (0.0%) | 0 (0.0%) |
| 35 to 64 Years | 33 (14.0%) | 19 (8.4%) |
| 65 to 74 Years | 9 (36.0%) | 31 (49.2%) |
| 75 Years and over | 6 (50.0%) | 25 (42.4%) |
Disability Class: Self-Care Difficulty
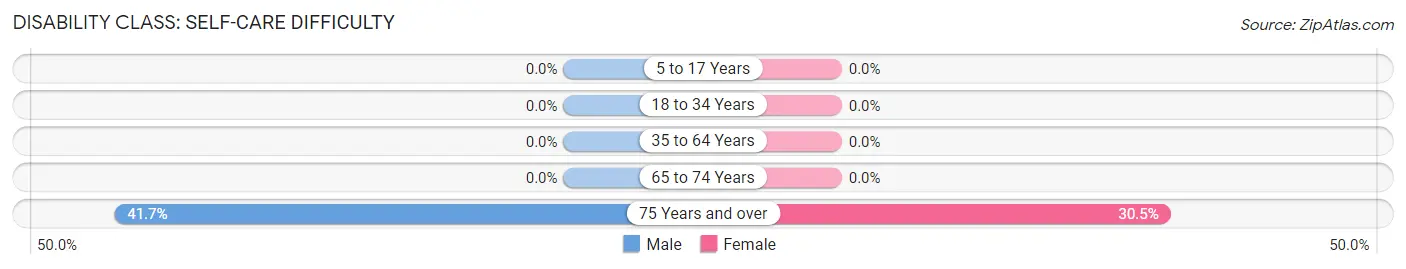
| Age Bracket | Male | Female |
| 5 to 17 Years | 0 (0.0%) | 0 (0.0%) |
| 18 to 34 Years | 0 (0.0%) | 0 (0.0%) |
| 35 to 64 Years | 0 (0.0%) | 0 (0.0%) |
| 65 to 74 Years | 0 (0.0%) | 0 (0.0%) |
| 75 Years and over | 5 (41.7%) | 18 (30.5%) |
Technology Access in Collinwood
Computing Device Access in Collinwood
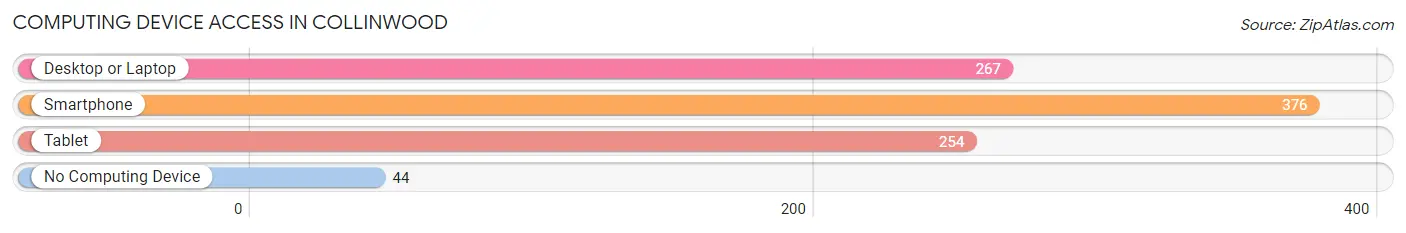
| Device Type | # Households | % Households |
| Desktop or Laptop | 267 | 62.1% |
| Smartphone | 376 | 87.4% |
| Tablet | 254 | 59.1% |
| No Computing Device | 44 | 10.2% |
| Total | 430 | 100.0% |
Internet Access in Collinwood
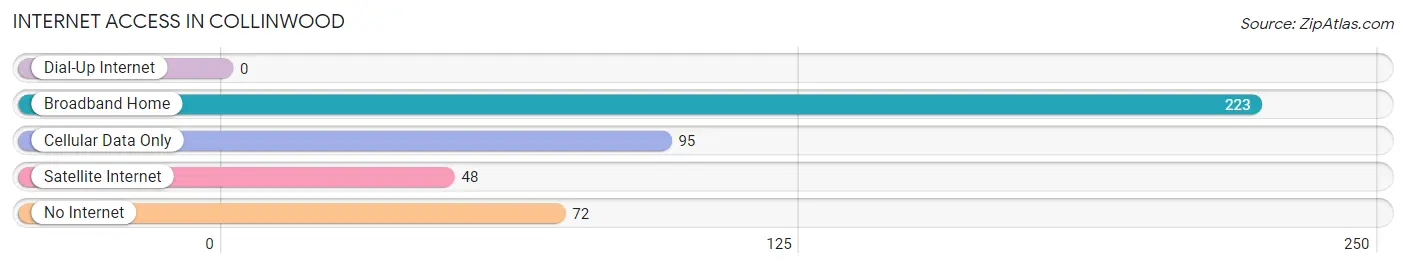
| Internet Type | # Households | % Households |
| Dial-Up Internet | 0 | 0.0% |
| Broadband Home | 223 | 51.9% |
| Cellular Data Only | 95 | 22.1% |
| Satellite Internet | 48 | 11.2% |
| No Internet | 72 | 16.7% |
| Total | 430 | 100.0% |
Collinwood Summary
Collinwood is a small town located in Wayne County, Tennessee. It is situated in the southwestern part of the state, approximately halfway between Nashville and Memphis. The town has a population of 1,845 people, according to the 2010 census.
History
Collinwood was founded in 1845 by William Collin, a former slave who had purchased his freedom. He named the town after himself and it quickly became a thriving community. The town was incorporated in 1876 and was home to a variety of businesses, including a cotton gin, a grist mill, and a sawmill.
In the late 19th century, Collinwood was a major stop on the Nashville and Chattanooga Railroad. This allowed the town to become a major shipping center for the surrounding area. The railroad also brought new people to the town, including many African Americans who were looking for work.
Geography
Collinwood is located in the southwestern part of Tennessee, approximately halfway between Nashville and Memphis. The town is situated in the foothills of the Appalachian Mountains and is surrounded by rolling hills and forests. The town is located on the banks of the Elk River, which flows through the town and provides a source of recreation for the locals.
Economy
Collinwood’s economy is largely based on agriculture and manufacturing. The town is home to several large farms, which produce a variety of crops, including corn, soybeans, and cotton. The town is also home to several manufacturing plants, which produce a variety of products, including furniture, clothing, and automotive parts.
Demographics
According to the 2010 census, Collinwood has a population of 1,845 people. The town is predominantly white, with a population that is approximately 90% white and 10% African American. The median household income is $30,000, and the median age is 38.
Conclusion
Collinwood is a small town located in Wayne County, Tennessee. It was founded in 1845 by William Collin and has since become a thriving community. The town is situated in the foothills of the Appalachian Mountains and is surrounded by rolling hills and forests. The town’s economy is largely based on agriculture and manufacturing, and the population is predominantly white. Collinwood is a great place to live and work, and it is a great example of a small town in Tennessee.
Common Questions
What is Per Capita Income in Collinwood?
Per Capita income in Collinwood is $25,058.
What is the Median Family Income in Collinwood?
Median Family Income in Collinwood is $59,423.
What is the Median Household income in Collinwood?
Median Household Income in Collinwood is $51,190.
What is Income or Wage Gap in Collinwood?
Income or Wage Gap in Collinwood is 11.7%.
Women in Collinwood earn 88.3 cents for every dollar earned by a man.
What is Inequality or Gini Index in Collinwood?
Inequality or Gini Index in Collinwood is 0.46.
What is the Total Population of Collinwood?
Total Population of Collinwood is 1,224.
What is the Total Male Population of Collinwood?
Total Male Population of Collinwood is 582.
What is the Total Female Population of Collinwood?
Total Female Population of Collinwood is 642.
What is the Ratio of Males per 100 Females in Collinwood?
There are 90.65 Males per 100 Females in Collinwood.
What is the Ratio of Females per 100 Males in Collinwood?
There are 110.31 Females per 100 Males in Collinwood.
What is the Median Population Age in Collinwood?
Median Population Age in Collinwood is 35.4 Years.
What is the Average Family Size in Collinwood
Average Family Size in Collinwood is 3.4 People.
What is the Average Household Size in Collinwood
Average Household Size in Collinwood is 2.9 People.
How Large is the Labor Force in Collinwood?
There are 594 People in the Labor Forcein in Collinwood.
What is the Percentage of People in the Labor Force in Collinwood?
63.5% of People are in the Labor Force in Collinwood.
What is the Unemployment Rate in Collinwood?
Unemployment Rate in Collinwood is 5.6%.