Coalmont, TN Map & Demographics
Coalmont Map
Coalmont Overview
$21,823
PER CAPITA INCOME
$59,500
AVG FAMILY INCOME
$55,323
AVG HOUSEHOLD INCOME
32.9%
WAGE / INCOME GAP [ % ]
67.1¢/ $1
WAGE / INCOME GAP [ $ ]
$11,043
FAMILY INCOME DEFICIT
0.37
INEQUALITY / GINI INDEX
921
TOTAL POPULATION
431
MALE POPULATION
490
FEMALE POPULATION
87.96
MALES / 100 FEMALES
113.69
FEMALES / 100 MALES
47.4
MEDIAN AGE
3.6
AVG FAMILY SIZE
2.9
AVG HOUSEHOLD SIZE
336
LABOR FORCE [ PEOPLE ]
44.2%
PERCENT IN LABOR FORCE
4.8%
UNEMPLOYMENT RATE
Coalmont Zip Codes
Coalmont Area Codes
Income in Coalmont
Income Overview in Coalmont
Per Capita Income in Coalmont is $21,823, while median incomes of families and households are $59,500 and $55,323 respectively.
| Characteristic | Number | Measure |
| Per Capita Income | 921 | $21,823 |
| Median Family Income | 216 | $59,500 |
| Mean Family Income | 216 | $68,071 |
| Median Household Income | 314 | $55,323 |
| Mean Household Income | 314 | $58,981 |
| Income Deficit | 216 | $11,043 |
| Wage / Income Gap (%) | 921 | 32.87% |
| Wage / Income Gap ($) | 921 | 67.13¢ per $1 |
| Gini / Inequality Index | 921 | 0.37 |
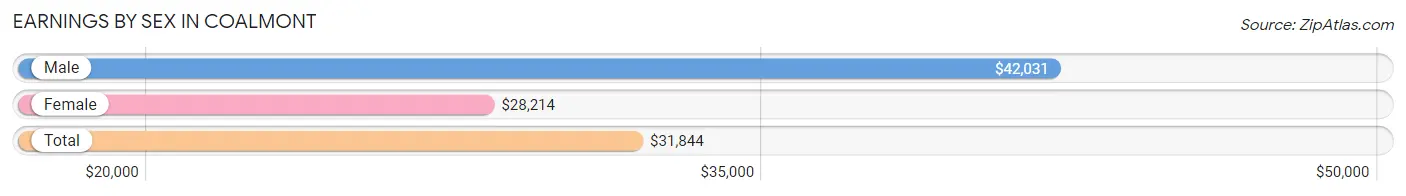
Earnings by Sex in Coalmont
Average Earnings in Coalmont are $31,844, $42,031 for men and $28,214 for women, a difference of 32.9%.
| Sex | Number | Average Earnings |
| Male | 155 (46.6%) | $42,031 |
| Female | 178 (53.4%) | $28,214 |
| Total | 333 (100.0%) | $31,844 |
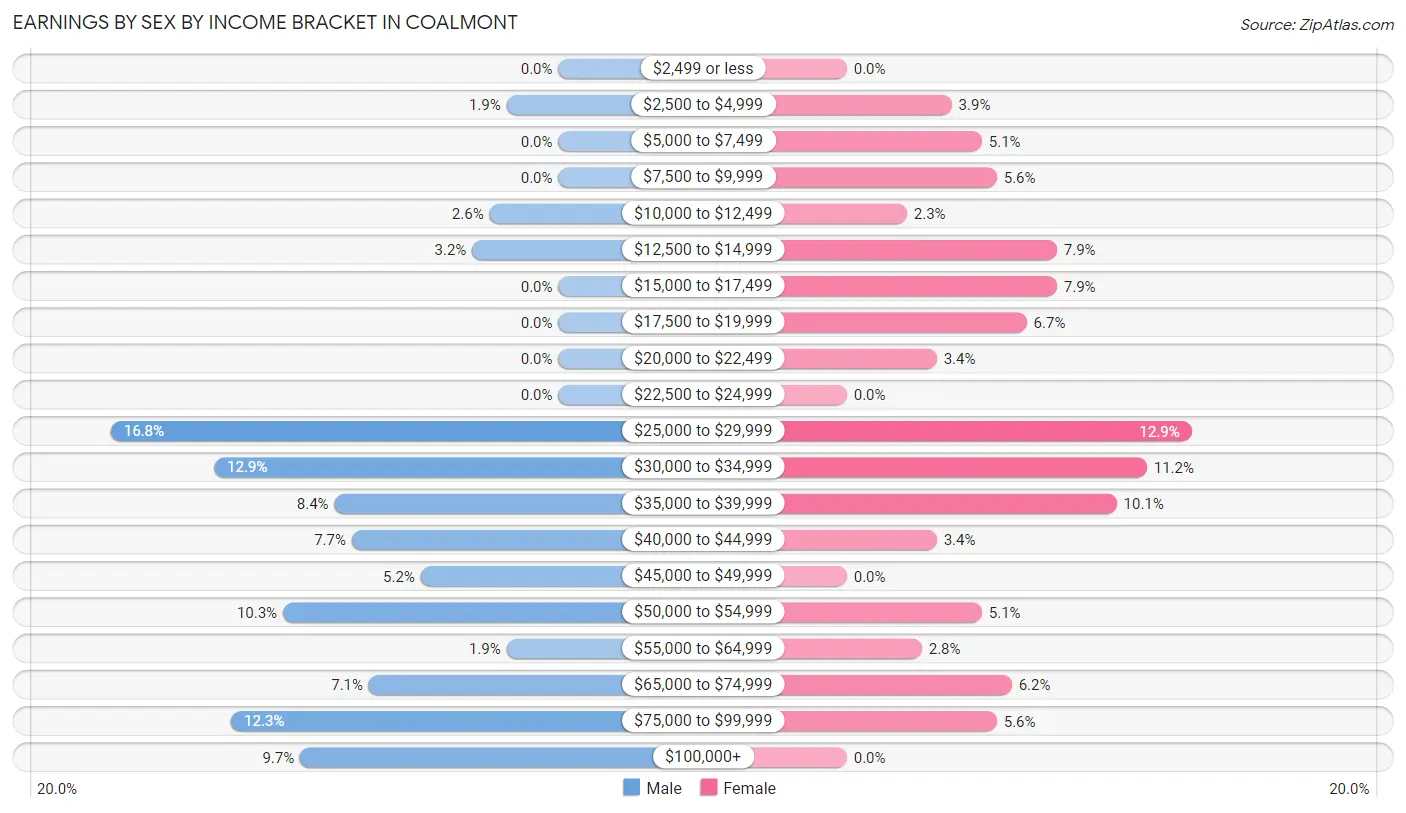
Earnings by Sex by Income Bracket in Coalmont
The most common earnings brackets in Coalmont are $25,000 to $29,999 for men (26 | 16.8%) and $25,000 to $29,999 for women (23 | 12.9%).
| Income | Male | Female |
| $2,499 or less | 0 (0.0%) | 0 (0.0%) |
| $2,500 to $4,999 | 3 (1.9%) | 7 (3.9%) |
| $5,000 to $7,499 | 0 (0.0%) | 9 (5.1%) |
| $7,500 to $9,999 | 0 (0.0%) | 10 (5.6%) |
| $10,000 to $12,499 | 4 (2.6%) | 4 (2.2%) |
| $12,500 to $14,999 | 5 (3.2%) | 14 (7.9%) |
| $15,000 to $17,499 | 0 (0.0%) | 14 (7.9%) |
| $17,500 to $19,999 | 0 (0.0%) | 12 (6.7%) |
| $20,000 to $22,499 | 0 (0.0%) | 6 (3.4%) |
| $22,500 to $24,999 | 0 (0.0%) | 0 (0.0%) |
| $25,000 to $29,999 | 26 (16.8%) | 23 (12.9%) |
| $30,000 to $34,999 | 20 (12.9%) | 20 (11.2%) |
| $35,000 to $39,999 | 13 (8.4%) | 18 (10.1%) |
| $40,000 to $44,999 | 12 (7.7%) | 6 (3.4%) |
| $45,000 to $49,999 | 8 (5.2%) | 0 (0.0%) |
| $50,000 to $54,999 | 16 (10.3%) | 9 (5.1%) |
| $55,000 to $64,999 | 3 (1.9%) | 5 (2.8%) |
| $65,000 to $74,999 | 11 (7.1%) | 11 (6.2%) |
| $75,000 to $99,999 | 19 (12.3%) | 10 (5.6%) |
| $100,000+ | 15 (9.7%) | 0 (0.0%) |
| Total | 155 (100.0%) | 178 (100.0%) |
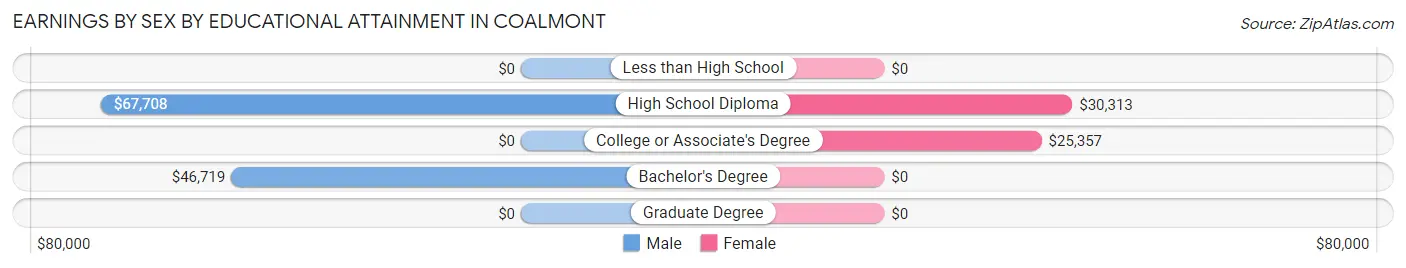
Earnings by Sex by Educational Attainment in Coalmont
Average earnings in Coalmont are $44,688 for men and $29,554 for women, a difference of 33.9%. Men with an educational attainment of high school diploma enjoy the highest average annual earnings of $67,708, while those with bachelor's degree education earn the least with $46,719. Women with an educational attainment of high school diploma earn the most with the average annual earnings of $30,313, while those with college or associate's degree education have the smallest earnings of $25,357.
| Educational Attainment | Male Income | Female Income |
| Less than High School | - | - |
| High School Diploma | $67,708 | $30,313 |
| College or Associate's Degree | - | - |
| Bachelor's Degree | $46,719 | $0 |
| Graduate Degree | - | - |
| Total | $44,688 | $29,554 |
Family Income in Coalmont
Family Income Brackets in Coalmont
According to the Coalmont family income data, there are 56 families falling into the $50,000 to $74,999 income range, which is the most common income bracket and makes up 25.9% of all families. Conversely, the $200,000+ income bracket is the least frequent group with only 1 families (0.5%) belonging to this category.
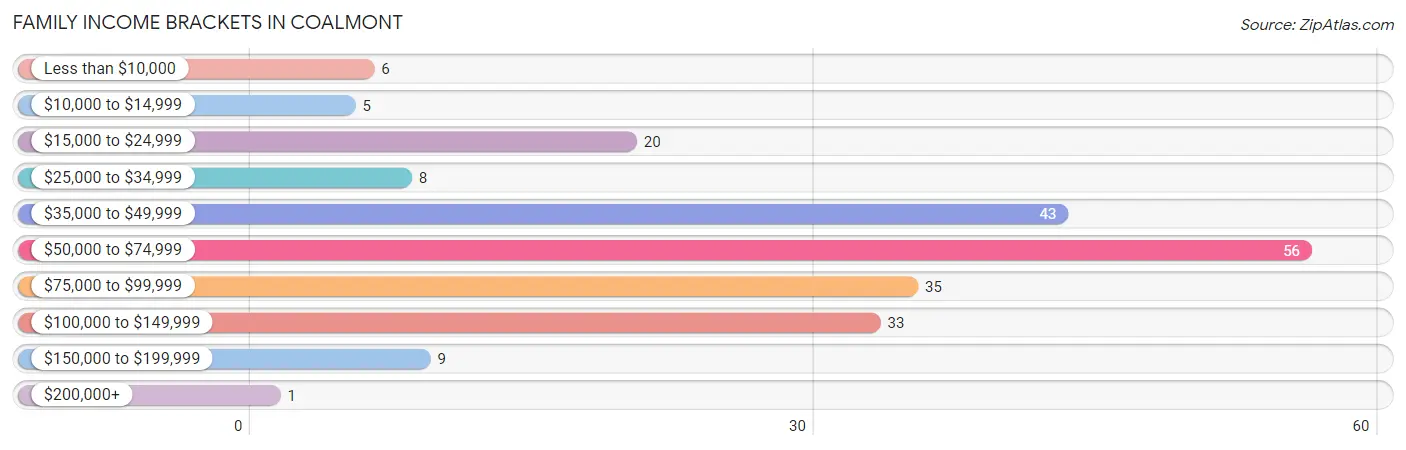
| Income Bracket | # Families | % Families |
| Less than $10,000 | 6 | 2.8% |
| $10,000 to $14,999 | 5 | 2.3% |
| $15,000 to $24,999 | 20 | 9.3% |
| $25,000 to $34,999 | 8 | 3.7% |
| $35,000 to $49,999 | 43 | 19.9% |
| $50,000 to $74,999 | 56 | 25.9% |
| $75,000 to $99,999 | 35 | 16.2% |
| $100,000 to $149,999 | 33 | 15.3% |
| $150,000 to $199,999 | 9 | 4.2% |
| $200,000+ | 1 | 0.5% |
Family Income by Famaliy Size in Coalmont
4-person families (34 | 15.7%) account for the highest median family income in Coalmont with $92,813 per family, while 2-person families (126 | 58.3%) have the highest median income of $28,224 per family member.
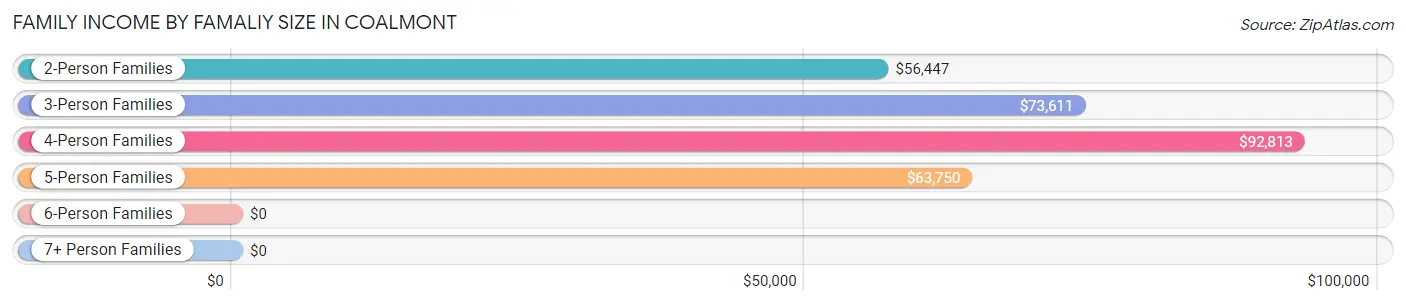
| Income Bracket | # Families | Median Income |
| 2-Person Families | 126 (58.3%) | $56,447 |
| 3-Person Families | 36 (16.7%) | $73,611 |
| 4-Person Families | 34 (15.7%) | $92,813 |
| 5-Person Families | 6 (2.8%) | $63,750 |
| 6-Person Families | 12 (5.6%) | $0 |
| 7+ Person Families | 2 (0.9%) | $0 |
| Total | 216 (100.0%) | $59,500 |
Family Income by Number of Earners in Coalmont
The median family income in Coalmont is $59,500, with families comprising 3+ earners (5) having the highest median family income of $123,125, while families with no earners (71) have the lowest median family income of $40,417, accounting for 2.3% and 32.9% of families, respectively.
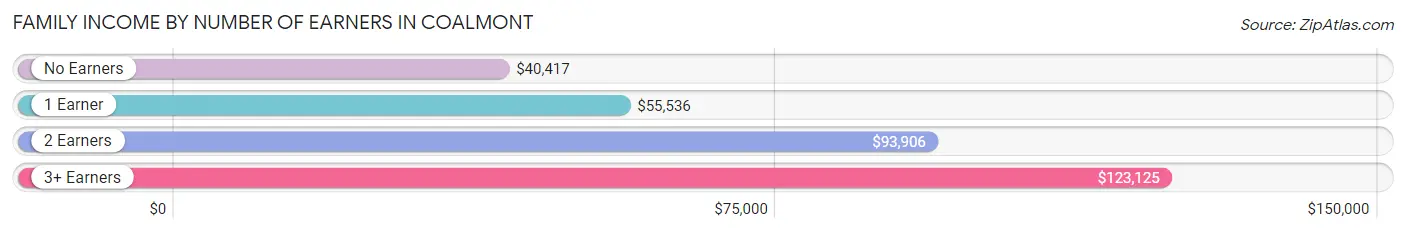
| Number of Earners | # Families | Median Income |
| No Earners | 71 (32.9%) | $40,417 |
| 1 Earner | 69 (31.9%) | $55,536 |
| 2 Earners | 71 (32.9%) | $93,906 |
| 3+ Earners | 5 (2.3%) | $123,125 |
| Total | 216 (100.0%) | $59,500 |
Household Income in Coalmont
Household Income Brackets in Coalmont
With 88 households falling in the category, the $50,000 to $74,999 income range is the most frequent in Coalmont, accounting for 28.0% of all households. In contrast, only 1 households (0.3%) fall into the $200,000+ income bracket, making it the least populous group.
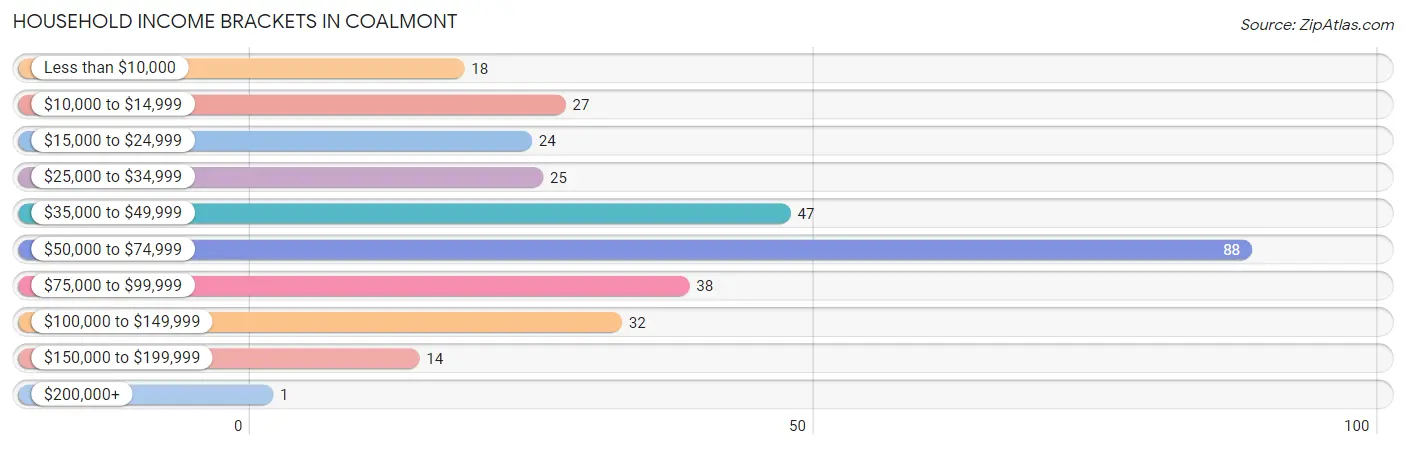
| Income Bracket | # Households | % Households |
| Less than $10,000 | 18 | 5.7% |
| $10,000 to $14,999 | 27 | 8.6% |
| $15,000 to $24,999 | 24 | 7.6% |
| $25,000 to $34,999 | 25 | 8.0% |
| $35,000 to $49,999 | 47 | 15.0% |
| $50,000 to $74,999 | 88 | 28.0% |
| $75,000 to $99,999 | 38 | 12.1% |
| $100,000 to $149,999 | 32 | 10.2% |
| $150,000 to $199,999 | 14 | 4.5% |
| $200,000+ | 1 | 0.3% |
Household Income by Householder Age in Coalmont
The median household income in Coalmont is $55,323, with the highest median household income of $93,438 found in the 25 to 44 years age bracket for the primary householder. A total of 48 households (15.3%) fall into this category. Meanwhile, the 15 to 24 years age bracket for the primary householder has the lowest median household income of $0, with 12 households (3.8%) in this group.
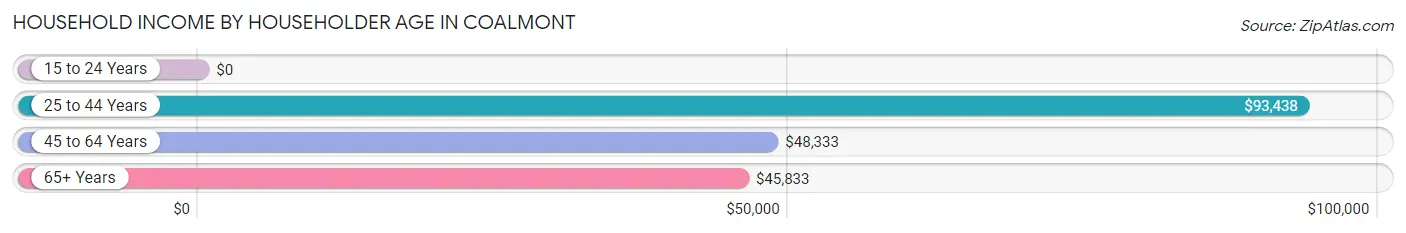
| Income Bracket | # Households | Median Income |
| 15 to 24 Years | 12 (3.8%) | $0 |
| 25 to 44 Years | 48 (15.3%) | $93,438 |
| 45 to 64 Years | 132 (42.0%) | $48,333 |
| 65+ Years | 122 (38.9%) | $45,833 |
| Total | 314 (100.0%) | $55,323 |
Poverty in Coalmont
Income Below Poverty by Sex and Age in Coalmont
With 18.6% poverty level for males and 23.1% for females among the residents of Coalmont, 12 to 14 year old males and 12 to 14 year old females are the most vulnerable to poverty, with 13 males (56.5%) and 26 females (66.7%) in their respective age groups living below the poverty level.
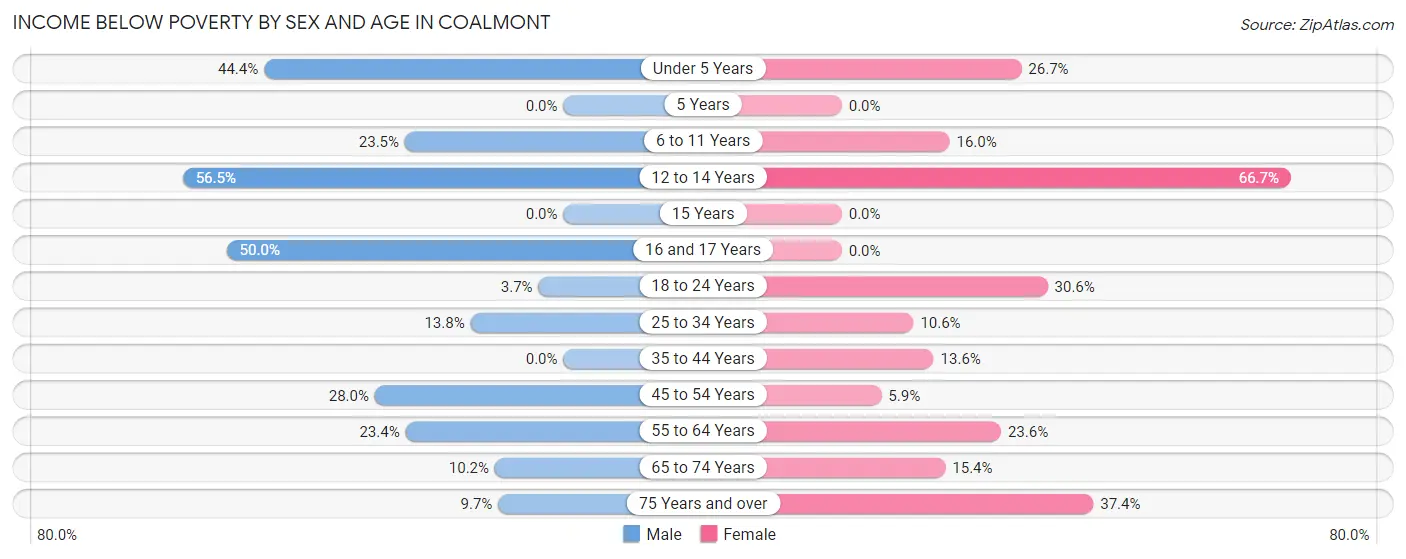
| Age Bracket | Male | Female |
| Under 5 Years | 8 (44.4%) | 4 (26.7%) |
| 5 Years | 0 (0.0%) | 0 (0.0%) |
| 6 to 11 Years | 8 (23.5%) | 4 (16.0%) |
| 12 to 14 Years | 13 (56.5%) | 26 (66.7%) |
| 15 Years | 0 (0.0%) | 0 (0.0%) |
| 16 and 17 Years | 3 (50.0%) | 0 (0.0%) |
| 18 to 24 Years | 2 (3.7%) | 11 (30.6%) |
| 25 to 34 Years | 8 (13.8%) | 5 (10.6%) |
| 35 to 44 Years | 0 (0.0%) | 6 (13.6%) |
| 45 to 54 Years | 14 (28.0%) | 5 (5.9%) |
| 55 to 64 Years | 15 (23.4%) | 13 (23.6%) |
| 65 to 74 Years | 6 (10.2%) | 8 (15.4%) |
| 75 Years and over | 3 (9.7%) | 31 (37.3%) |
| Total | 80 (18.6%) | 113 (23.1%) |
Income Above Poverty by Sex and Age in Coalmont
According to the poverty statistics in Coalmont, males aged 15 years and females aged 15 years are the age groups that are most secure financially, with 100.0% of males and 100.0% of females in these age groups living above the poverty line.
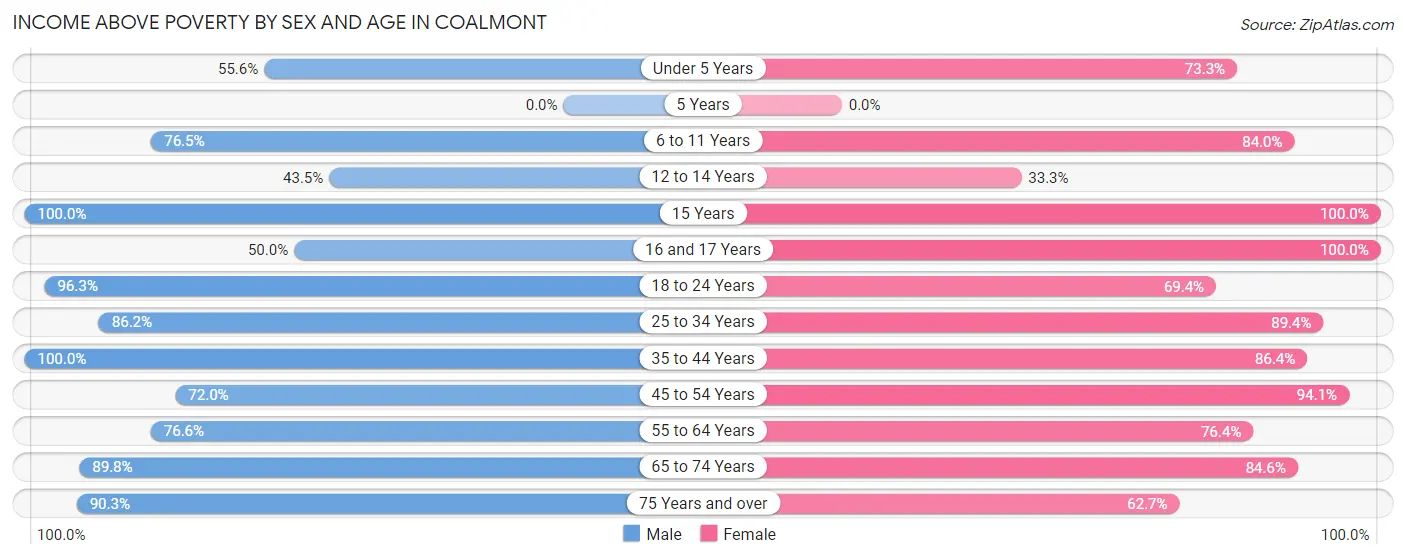
| Age Bracket | Male | Female |
| Under 5 Years | 10 (55.6%) | 11 (73.3%) |
| 5 Years | 0 (0.0%) | 0 (0.0%) |
| 6 to 11 Years | 26 (76.5%) | 21 (84.0%) |
| 12 to 14 Years | 10 (43.5%) | 13 (33.3%) |
| 15 Years | 2 (100.0%) | 5 (100.0%) |
| 16 and 17 Years | 3 (50.0%) | 4 (100.0%) |
| 18 to 24 Years | 52 (96.3%) | 25 (69.4%) |
| 25 to 34 Years | 50 (86.2%) | 42 (89.4%) |
| 35 to 44 Years | 32 (100.0%) | 38 (86.4%) |
| 45 to 54 Years | 36 (72.0%) | 80 (94.1%) |
| 55 to 64 Years | 49 (76.6%) | 42 (76.4%) |
| 65 to 74 Years | 53 (89.8%) | 44 (84.6%) |
| 75 Years and over | 28 (90.3%) | 52 (62.6%) |
| Total | 351 (81.4%) | 377 (76.9%) |
Income Below Poverty Among Married-Couple Families in Coalmont
The poverty statistics for married-couple families in Coalmont show that 10.8% or 19 of the total 176 families live below the poverty line. Families with 1 or 2 children have the highest poverty rate of 22.5%, comprising of 9 families. On the other hand, families with 3 or 4 children have the lowest poverty rate of 0.0%, which includes 0 families.
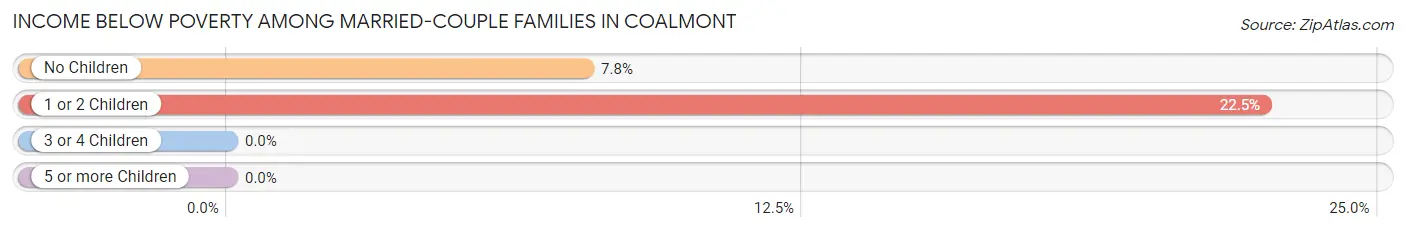
| Children | Above Poverty | Below Poverty |
| No Children | 119 (92.2%) | 10 (7.7%) |
| 1 or 2 Children | 31 (77.5%) | 9 (22.5%) |
| 3 or 4 Children | 7 (100.0%) | 0 (0.0%) |
| 5 or more Children | 0 (0.0%) | 0 (0.0%) |
| Total | 157 (89.2%) | 19 (10.8%) |
Income Below Poverty Among Single-Parent Households in Coalmont
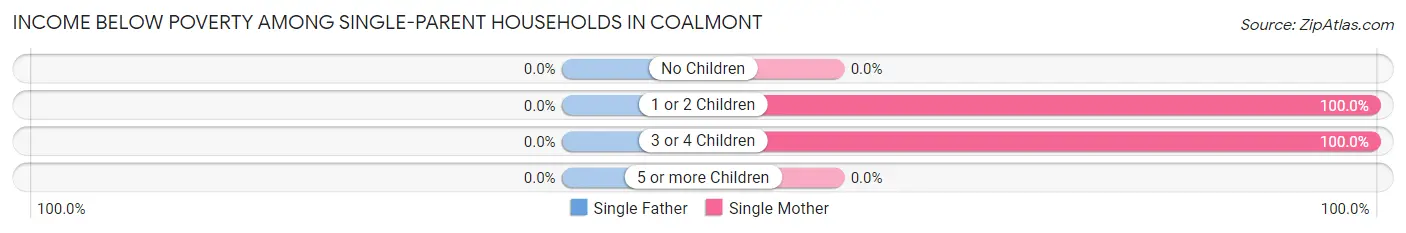
| Children | Single Father | Single Mother |
| No Children | 0 (0.0%) | 0 (0.0%) |
| 1 or 2 Children | 0 (0.0%) | 2 (100.0%) |
| 3 or 4 Children | 0 (0.0%) | 2 (100.0%) |
| 5 or more Children | 0 (0.0%) | 0 (0.0%) |
| Total | 0 (0.0%) | 4 (14.3%) |
Income Below Poverty Among Married-Couple vs Single-Parent Households in Coalmont
The poverty data for Coalmont shows that 19 of the married-couple family households (10.8%) and 4 of the single-parent households (10.0%) are living below the poverty level. Within the married-couple family households, those with 1 or 2 children have the highest poverty rate, with 9 households (22.5%) falling below the poverty line. Among the single-parent households, those with 1 or 2 children have the highest poverty rate, with 2 household (100.0%) living below poverty.
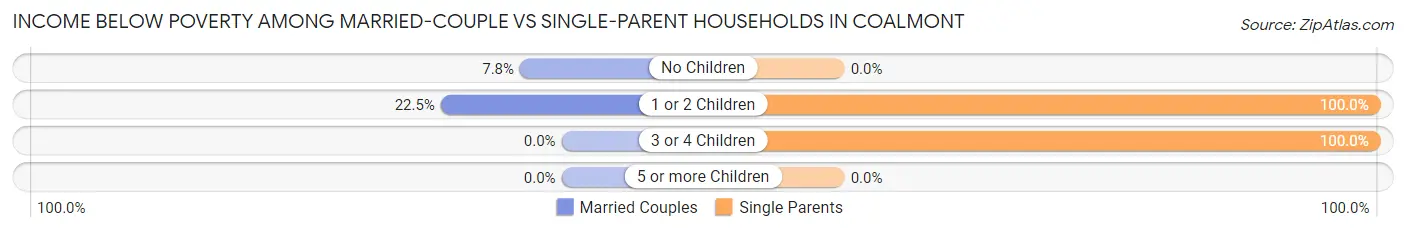
| Children | Married-Couple Families | Single-Parent Households |
| No Children | 10 (7.7%) | 0 (0.0%) |
| 1 or 2 Children | 9 (22.5%) | 2 (100.0%) |
| 3 or 4 Children | 0 (0.0%) | 2 (100.0%) |
| 5 or more Children | 0 (0.0%) | 0 (0.0%) |
| Total | 19 (10.8%) | 4 (10.0%) |
Race in Coalmont
The most populous races in Coalmont are White / Caucasian (893 | 97.0%), Two or more Races (25 | 2.7%), and Native / Alaskan (3 | 0.3%).
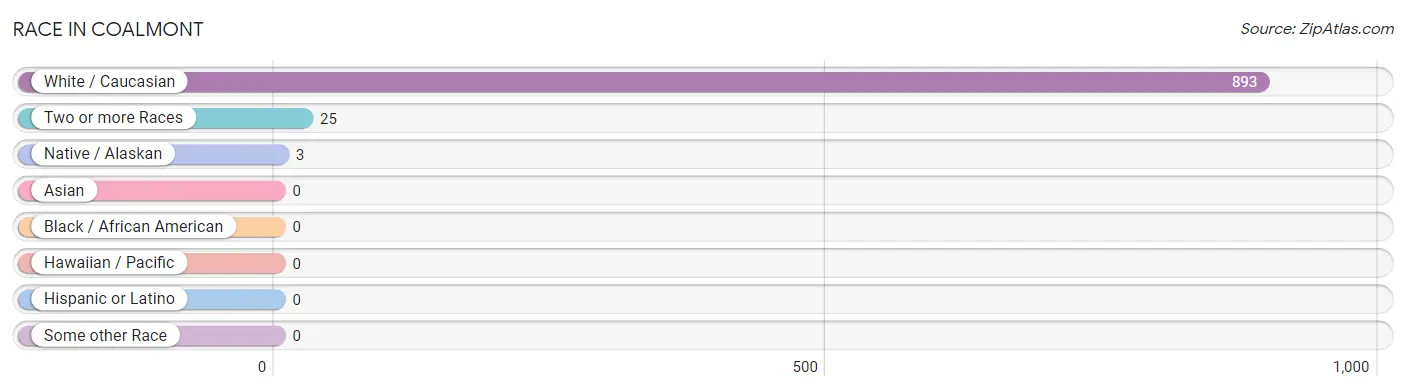
| Race | # Population | % Population |
| Asian | 0 | 0.0% |
| Black / African American | 0 | 0.0% |
| Hawaiian / Pacific | 0 | 0.0% |
| Hispanic or Latino | 0 | 0.0% |
| Native / Alaskan | 3 | 0.3% |
| White / Caucasian | 893 | 97.0% |
| Two or more Races | 25 | 2.7% |
| Some other Race | 0 | 0.0% |
| Total | 921 | 100.0% |
Ancestry in Coalmont
The most populous ancestries reported in Coalmont are American (216 | 23.4%), English (117 | 12.7%), German (101 | 11.0%), Irish (101 | 11.0%), and Dutch (31 | 3.4%), together accounting for 61.5% of all Coalmont residents.
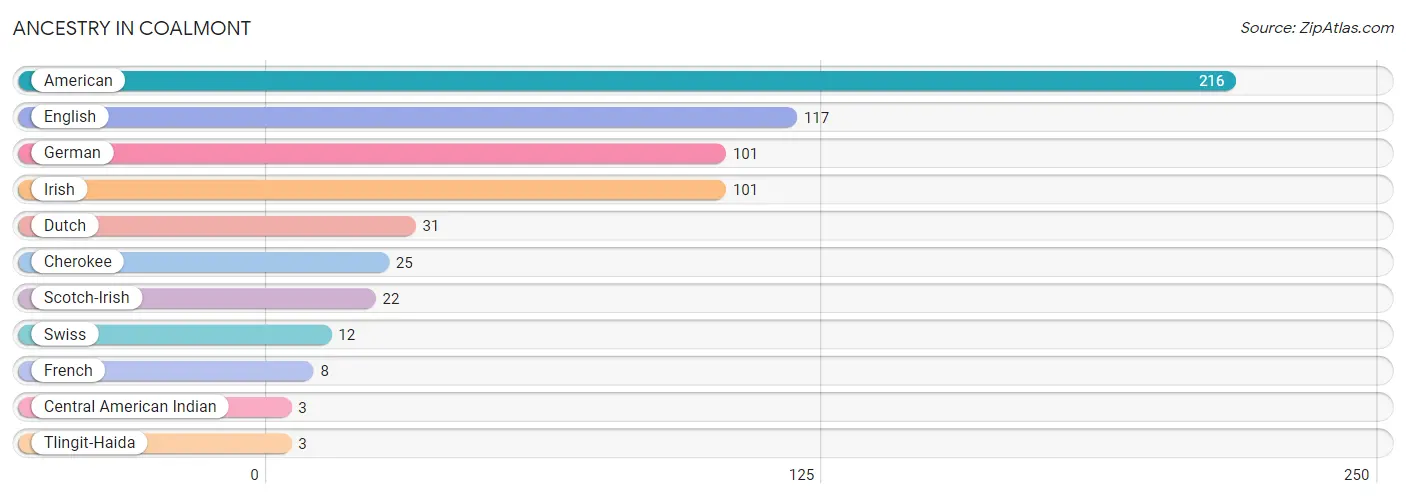
| Ancestry | # Population | % Population |
| American | 216 | 23.4% |
| Central American Indian | 3 | 0.3% |
| Cherokee | 25 | 2.7% |
| Dutch | 31 | 3.4% |
| English | 117 | 12.7% |
| French | 8 | 0.9% |
| German | 101 | 11.0% |
| Irish | 101 | 11.0% |
| Scotch-Irish | 22 | 2.4% |
| Swiss | 12 | 1.3% |
| Tlingit-Haida | 3 | 0.3% | View All 11 Rows |
Immigrants in Coalmont
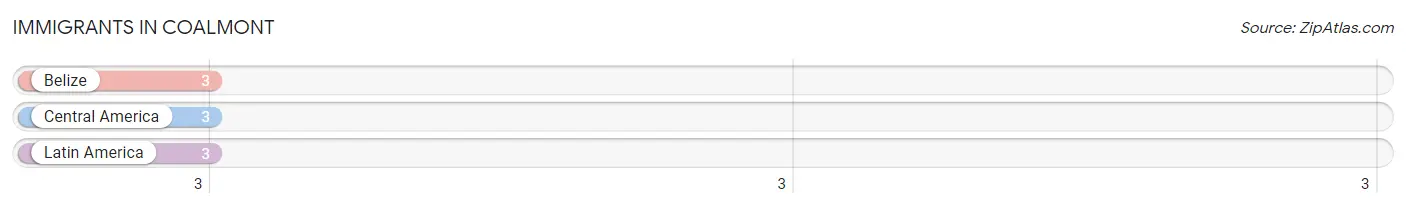
The most numerous immigrant groups reported in Coalmont came from Belize (3 | 0.3%), Central America (3 | 0.3%), and Latin America (3 | 0.3%), together accounting for 1.0% of all Coalmont residents.
| Immigration Origin | # Population | % Population |
| Belize | 3 | 0.3% |
| Central America | 3 | 0.3% |
| Latin America | 3 | 0.3% | View All 3 Rows |
Sex and Age in Coalmont
Sex and Age in Coalmont
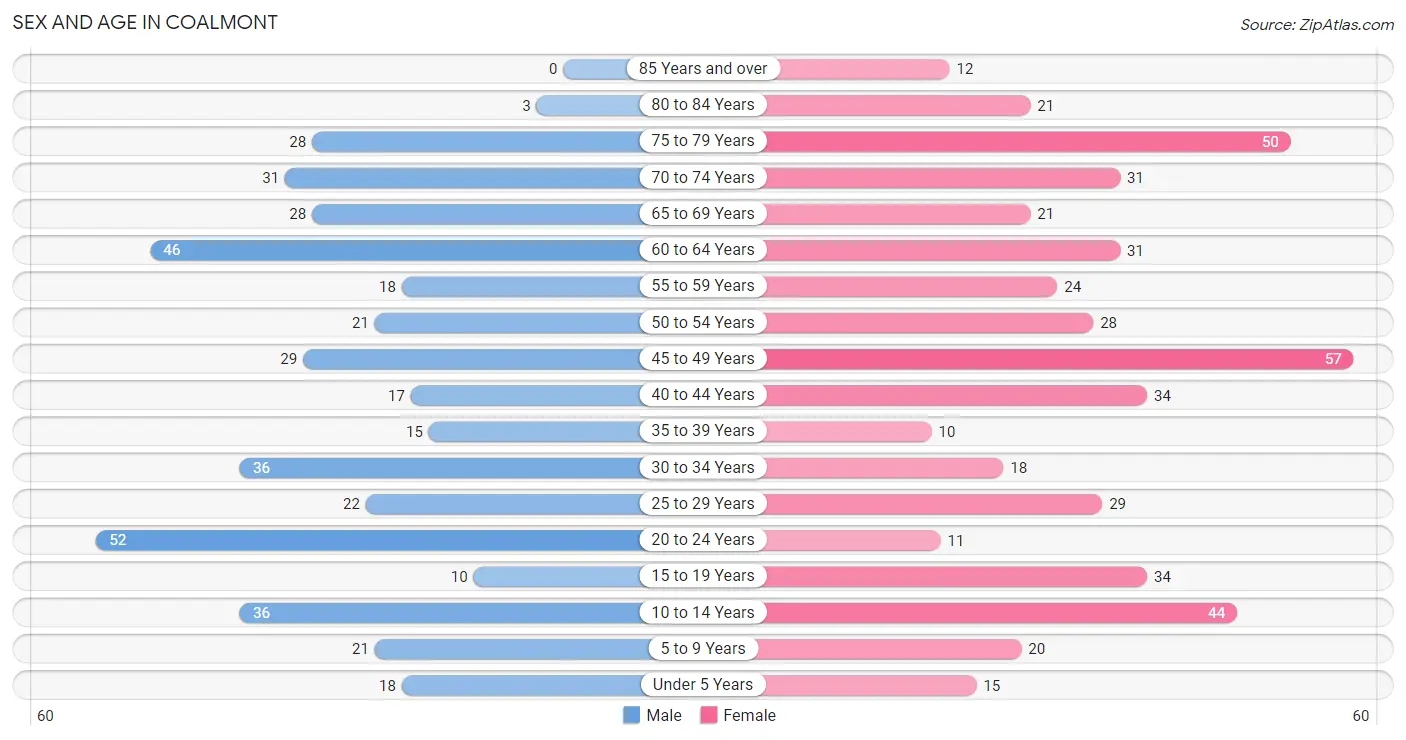
The most populous age groups in Coalmont are 20 to 24 Years (52 | 12.1%) for men and 45 to 49 Years (57 | 11.6%) for women.
| Age Bracket | Male | Female |
| Under 5 Years | 18 (4.2%) | 15 (3.1%) |
| 5 to 9 Years | 21 (4.9%) | 20 (4.1%) |
| 10 to 14 Years | 36 (8.4%) | 44 (9.0%) |
| 15 to 19 Years | 10 (2.3%) | 34 (6.9%) |
| 20 to 24 Years | 52 (12.1%) | 11 (2.2%) |
| 25 to 29 Years | 22 (5.1%) | 29 (5.9%) |
| 30 to 34 Years | 36 (8.4%) | 18 (3.7%) |
| 35 to 39 Years | 15 (3.5%) | 10 (2.0%) |
| 40 to 44 Years | 17 (3.9%) | 34 (6.9%) |
| 45 to 49 Years | 29 (6.7%) | 57 (11.6%) |
| 50 to 54 Years | 21 (4.9%) | 28 (5.7%) |
| 55 to 59 Years | 18 (4.2%) | 24 (4.9%) |
| 60 to 64 Years | 46 (10.7%) | 31 (6.3%) |
| 65 to 69 Years | 28 (6.5%) | 21 (4.3%) |
| 70 to 74 Years | 31 (7.2%) | 31 (6.3%) |
| 75 to 79 Years | 28 (6.5%) | 50 (10.2%) |
| 80 to 84 Years | 3 (0.7%) | 21 (4.3%) |
| 85 Years and over | 0 (0.0%) | 12 (2.5%) |
| Total | 431 (100.0%) | 490 (100.0%) |
Families and Households in Coalmont
Median Family Size in Coalmont
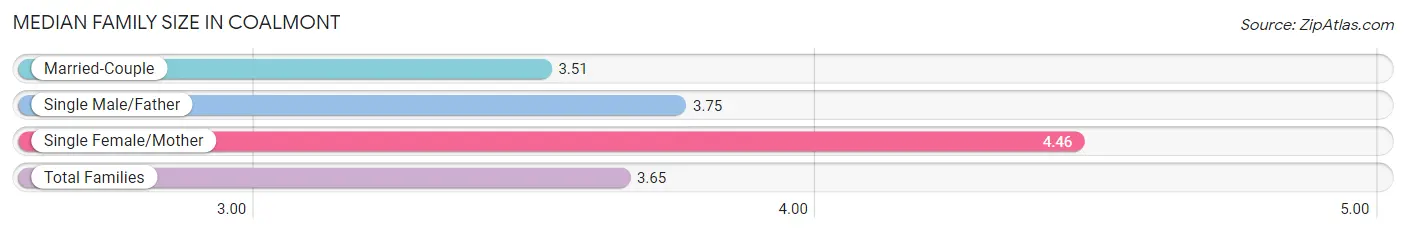
The median family size in Coalmont is 3.65 persons per family, with single female/mother families (28 | 13.0%) accounting for the largest median family size of 4.46 persons per family. On the other hand, married-couple families (176 | 81.5%) represent the smallest median family size with 3.51 persons per family.
| Family Type | # Families | Family Size |
| Married-Couple | 176 (81.5%) | 3.51 |
| Single Male/Father | 12 (5.6%) | 3.75 |
| Single Female/Mother | 28 (13.0%) | 4.46 |
| Total Families | 216 (100.0%) | 3.65 |
Median Household Size in Coalmont
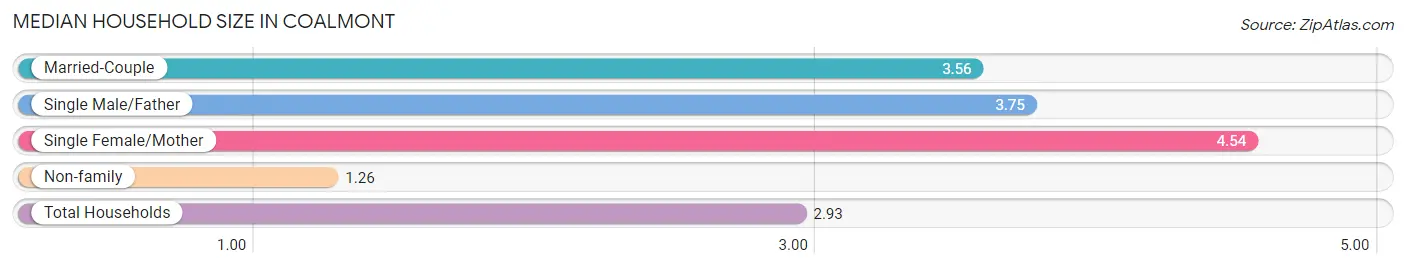
The median household size in Coalmont is 2.93 persons per household, with single female/mother households (28 | 8.9%) accounting for the largest median household size of 4.54 persons per household. non-family households (98 | 31.2%) represent the smallest median household size with 1.26 persons per household.
| Household Type | # Households | Household Size |
| Married-Couple | 176 (56.0%) | 3.56 |
| Single Male/Father | 12 (3.8%) | 3.75 |
| Single Female/Mother | 28 (8.9%) | 4.54 |
| Non-family | 98 (31.2%) | 1.26 |
| Total Households | 314 (100.0%) | 2.93 |
Household Size by Marriage Status in Coalmont
Out of a total of 314 households in Coalmont, 216 (68.8%) are family households, while 98 (31.2%) are nonfamily households. The most numerous type of family households are 2-person households, comprising 126, and the most common type of nonfamily households are 1-person households, comprising 74.
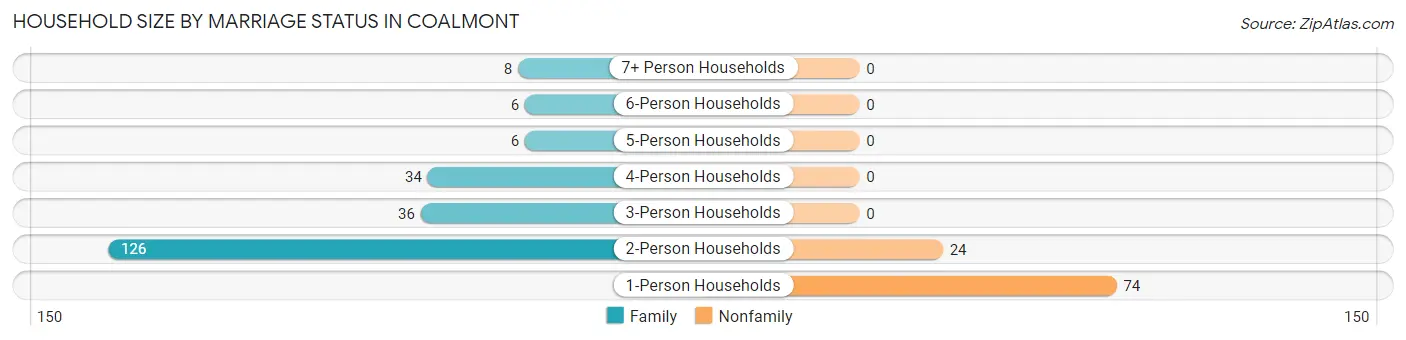
| Household Size | Family Households | Nonfamily Households |
| 1-Person Households | - | 74 (23.6%) |
| 2-Person Households | 126 (40.1%) | 24 (7.6%) |
| 3-Person Households | 36 (11.5%) | 0 (0.0%) |
| 4-Person Households | 34 (10.8%) | 0 (0.0%) |
| 5-Person Households | 6 (1.9%) | 0 (0.0%) |
| 6-Person Households | 6 (1.9%) | 0 (0.0%) |
| 7+ Person Households | 8 (2.5%) | 0 (0.0%) |
| Total | 216 (68.8%) | 98 (31.2%) |
Female Fertility in Coalmont
Fertility by Age in Coalmont
Average fertility rate in Coalmont is 26.0 births per 1,000 women. Women in the age bracket of 20 to 34 years have the highest fertility rate with 86.0 births per 1,000 women. Women in the age bracket of 20 to 34 years acount for 100.0% of all women with births.
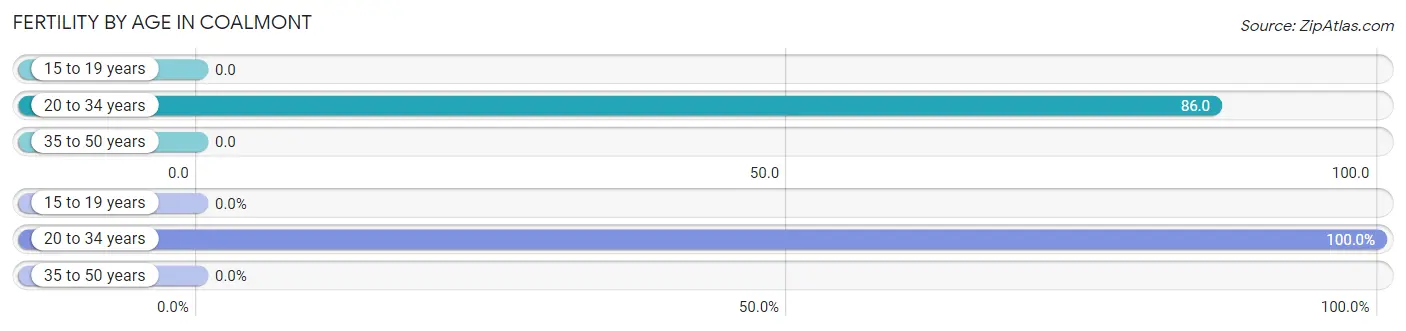
| Age Bracket | Women with Births | Births / 1,000 Women |
| 15 to 19 years | 0 (0.0%) | 0.0 |
| 20 to 34 years | 5 (100.0%) | 86.0 |
| 35 to 50 years | 0 (0.0%) | 0.0 |
| Total | 5 (100.0%) | 26.0 |
Fertility by Age by Marriage Status in Coalmont
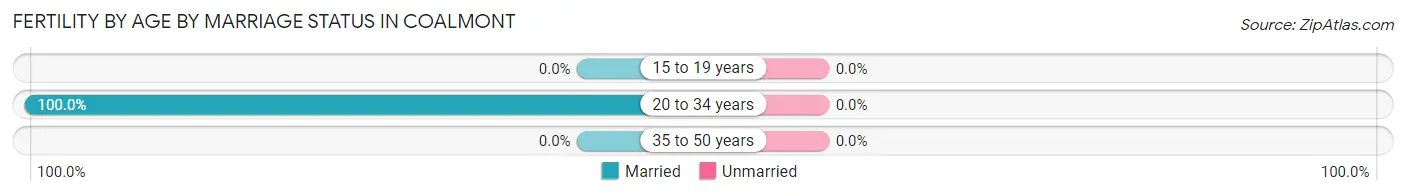
| Age Bracket | Married | Unmarried |
| 15 to 19 years | 0 (0.0%) | 0 (0.0%) |
| 20 to 34 years | 5 (100.0%) | 0 (0.0%) |
| 35 to 50 years | 0 (0.0%) | 0 (0.0%) |
| Total | 5 (100.0%) | 0 (0.0%) |
Fertility by Education in Coalmont
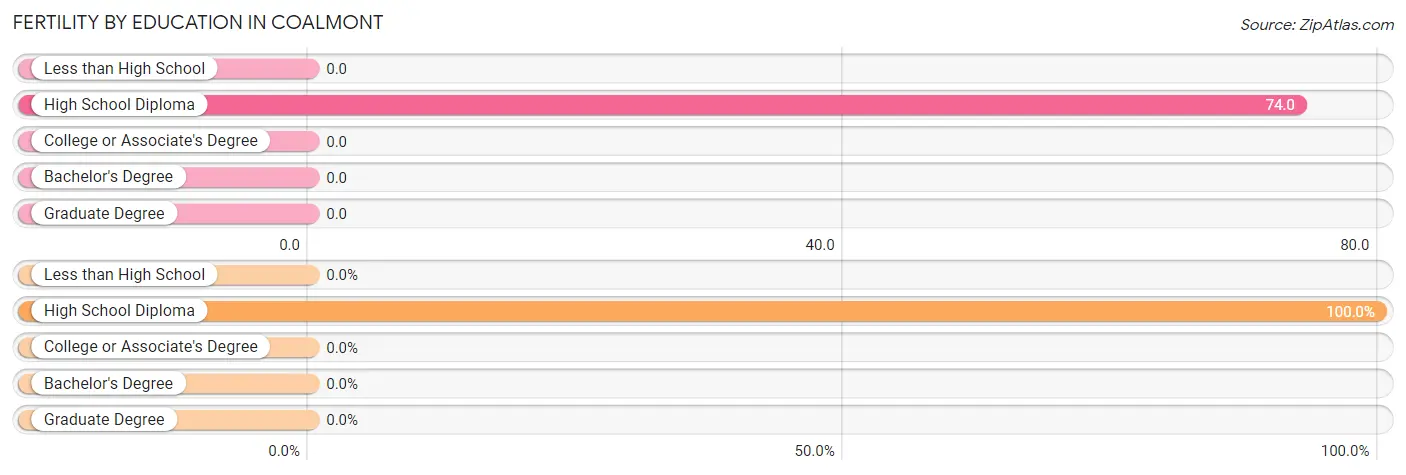
| Educational Attainment | Women with Births | Births / 1,000 Women |
| Less than High School | 0 (0.0%) | 0.0 |
| High School Diploma | 5 (100.0%) | 74.0 |
| College or Associate's Degree | 0 (0.0%) | 0.0 |
| Bachelor's Degree | 0 (0.0%) | 0.0 |
| Graduate Degree | 0 (0.0%) | 0.0 |
| Total | 5 (100.0%) | 26.0 |
Fertility by Education by Marriage Status in Coalmont
| Educational Attainment | Married | Unmarried |
| Less than High School | 0 (0.0%) | 0 (0.0%) |
| High School Diploma | 5 (100.0%) | 0 (0.0%) |
| College or Associate's Degree | 0 (0.0%) | 0 (0.0%) |
| Bachelor's Degree | 0 (0.0%) | 0 (0.0%) |
| Graduate Degree | 0 (0.0%) | 0 (0.0%) |
| Total | 5 (100.0%) | 0 (0.0%) |
Employment Characteristics in Coalmont
Employment by Class of Employer in Coalmont
Among the 302 employed individuals in Coalmont, private company employees (200 | 66.2%), local government employees (50 | 16.6%), and self-employed (not incorporated) (17 | 5.6%) make up the most common classes of employment.
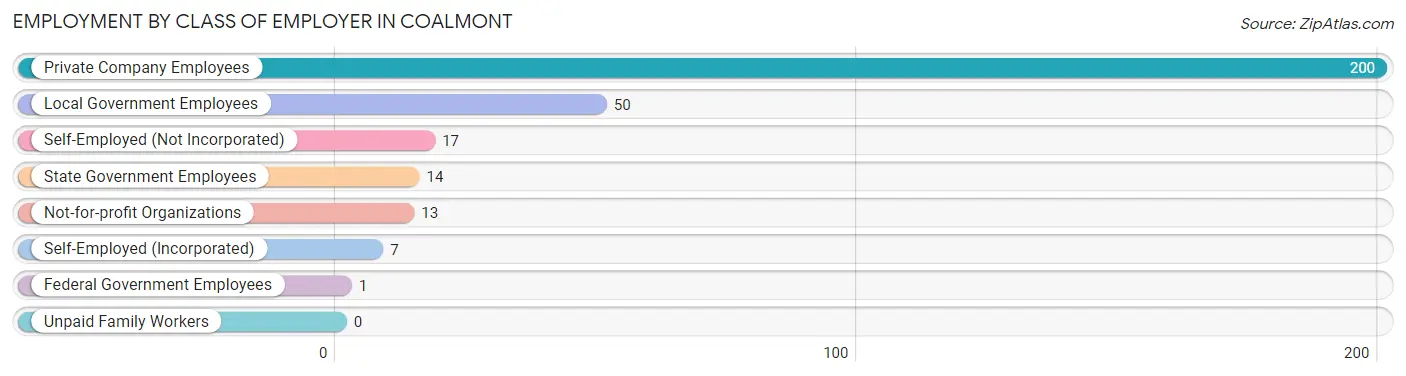
| Employer Class | # Employees | % Employees |
| Private Company Employees | 200 | 66.2% |
| Self-Employed (Incorporated) | 7 | 2.3% |
| Self-Employed (Not Incorporated) | 17 | 5.6% |
| Not-for-profit Organizations | 13 | 4.3% |
| Local Government Employees | 50 | 16.6% |
| State Government Employees | 14 | 4.6% |
| Federal Government Employees | 1 | 0.3% |
| Unpaid Family Workers | 0 | 0.0% |
| Total | 302 | 100.0% |
Employment Status by Age in Coalmont
According to the labor force statistics for Coalmont, out of the total population over 16 years of age (760), 44.2% or 336 individuals are in the labor force, with 4.8% or 16 of them unemployed. The age group with the highest labor force participation rate is 25 to 29 years, with 90.2% or 46 individuals in the labor force. Within the labor force, the 45 to 54 years age range has the highest percentage of unemployed individuals, with 12.4% or 11 of them being unemployed.
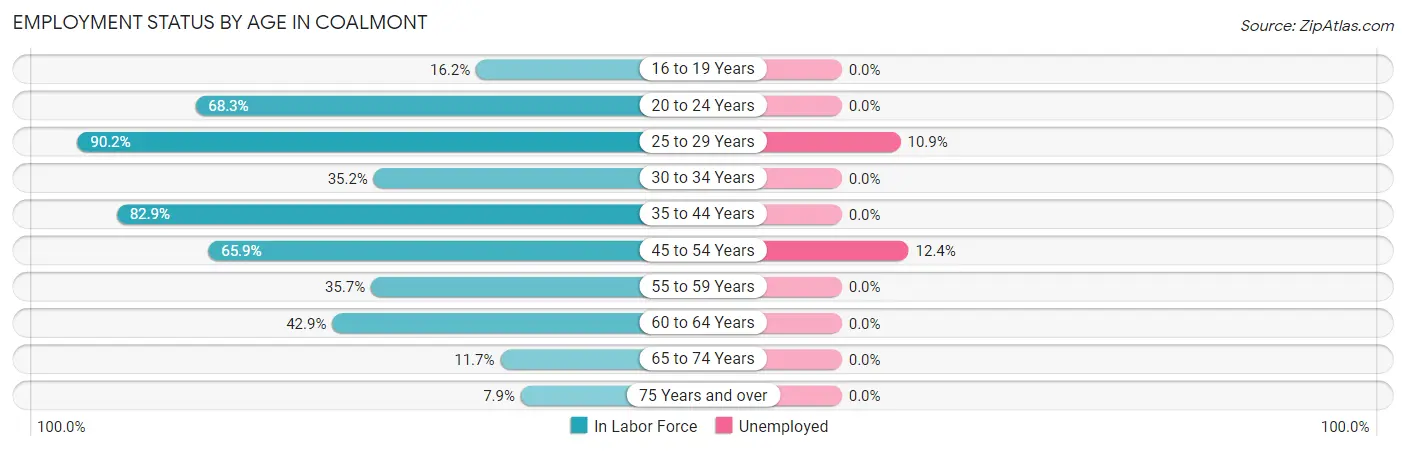
| Age Bracket | In Labor Force | Unemployed |
| 16 to 19 Years | 6 (16.2%) | 0 (0.0%) |
| 20 to 24 Years | 43 (68.3%) | 0 (0.0%) |
| 25 to 29 Years | 46 (90.2%) | 5 (10.9%) |
| 30 to 34 Years | 19 (35.2%) | 0 (0.0%) |
| 35 to 44 Years | 63 (82.9%) | 0 (0.0%) |
| 45 to 54 Years | 89 (65.9%) | 11 (12.4%) |
| 55 to 59 Years | 15 (35.7%) | 0 (0.0%) |
| 60 to 64 Years | 33 (42.9%) | 0 (0.0%) |
| 65 to 74 Years | 13 (11.7%) | 0 (0.0%) |
| 75 Years and over | 9 (7.9%) | 0 (0.0%) |
| Total | 336 (44.2%) | 16 (4.8%) |
Employment Status by Educational Attainment in Coalmont
According to labor force statistics for Coalmont, 60.9% of individuals (265) out of the total population between 25 and 64 years of age (435) are in the labor force, with 6.0% or 16 of them being unemployed. The group with the highest labor force participation rate are those with the educational attainment of college / associate degree, with 78.2% or 79 individuals in the labor force. Within the labor force, individuals with high school diploma education have the highest percentage of unemployment, with 10.3% or 13 of them being unemployed.
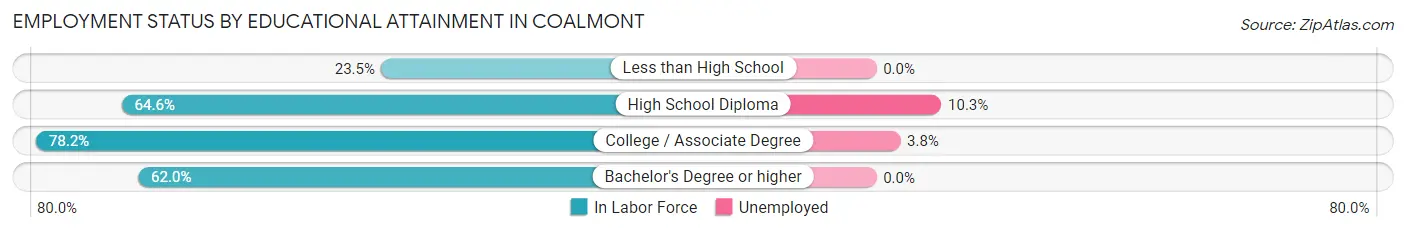
| Educational Attainment | In Labor Force | Unemployed |
| Less than High School | 16 (23.5%) | 0 (0.0%) |
| High School Diploma | 126 (64.6%) | 20 (10.3%) |
| College / Associate Degree | 79 (78.2%) | 4 (3.8%) |
| Bachelor's Degree or higher | 44 (62.0%) | 0 (0.0%) |
| Total | 265 (60.9%) | 26 (6.0%) |
Employment Occupations by Sex in Coalmont
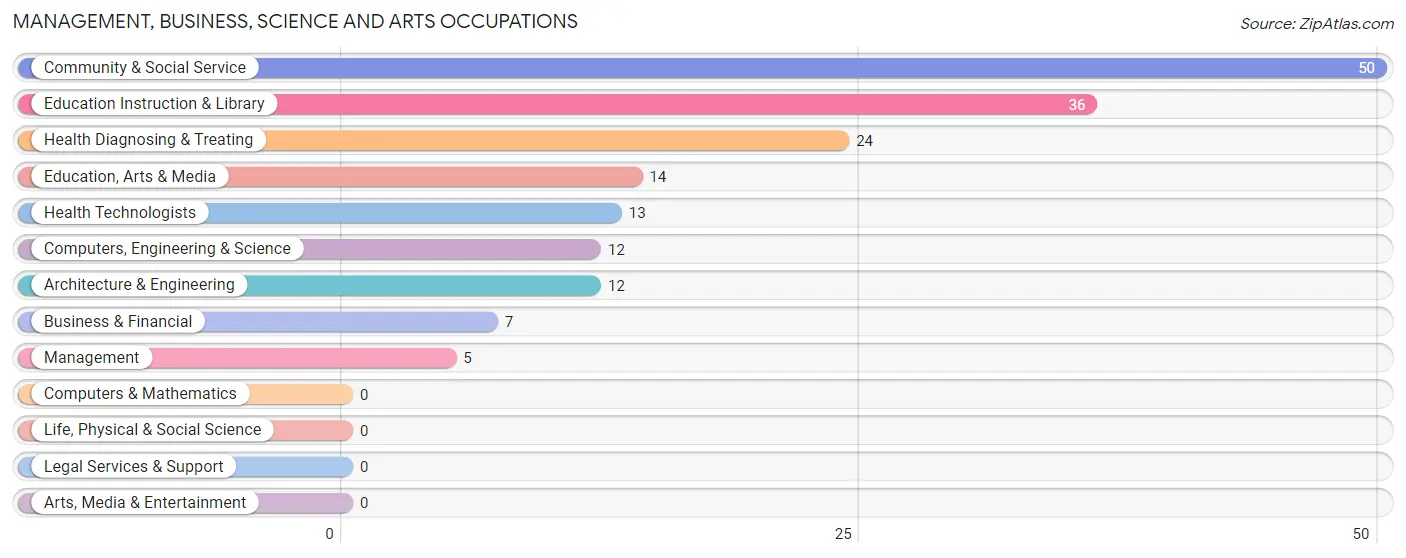
Management, Business, Science and Arts Occupations
The most common Management, Business, Science and Arts occupations in Coalmont are Community & Social Service (50 | 15.6%), Education Instruction & Library (36 | 11.3%), Health Diagnosing & Treating (24 | 7.5%), Education, Arts & Media (14 | 4.4%), and Health Technologists (13 | 4.1%).
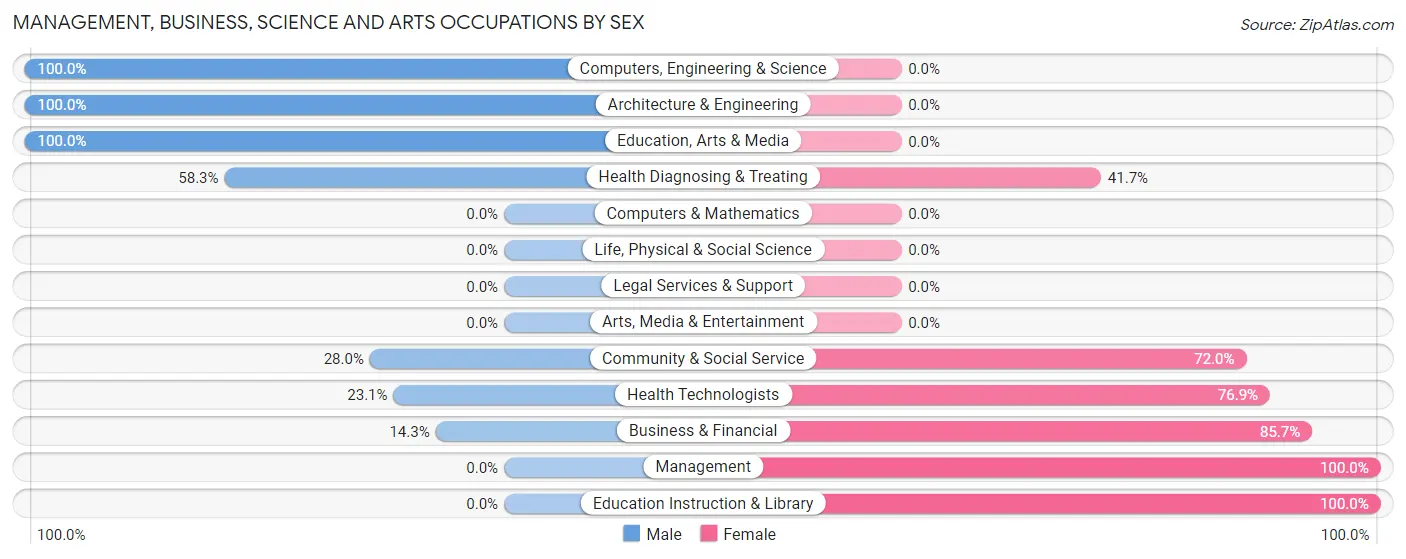
Management, Business, Science and Arts Occupations by Sex
Within the Management, Business, Science and Arts occupations in Coalmont, the most male-oriented occupations are Computers, Engineering & Science (100.0%), Architecture & Engineering (100.0%), and Education, Arts & Media (100.0%), while the most female-oriented occupations are Management (100.0%), Education Instruction & Library (100.0%), and Business & Financial (85.7%).
| Occupation | Male | Female |
| Management | 0 (0.0%) | 5 (100.0%) |
| Business & Financial | 1 (14.3%) | 6 (85.7%) |
| Computers, Engineering & Science | 12 (100.0%) | 0 (0.0%) |
| Computers & Mathematics | 0 (0.0%) | 0 (0.0%) |
| Architecture & Engineering | 12 (100.0%) | 0 (0.0%) |
| Life, Physical & Social Science | 0 (0.0%) | 0 (0.0%) |
| Community & Social Service | 14 (28.0%) | 36 (72.0%) |
| Education, Arts & Media | 14 (100.0%) | 0 (0.0%) |
| Legal Services & Support | 0 (0.0%) | 0 (0.0%) |
| Education Instruction & Library | 0 (0.0%) | 36 (100.0%) |
| Arts, Media & Entertainment | 0 (0.0%) | 0 (0.0%) |
| Health Diagnosing & Treating | 14 (58.3%) | 10 (41.7%) |
| Health Technologists | 3 (23.1%) | 10 (76.9%) |
| Total (Category) | 41 (41.8%) | 57 (58.2%) |
| Total (Overall) | 155 (48.4%) | 165 (51.6%) |
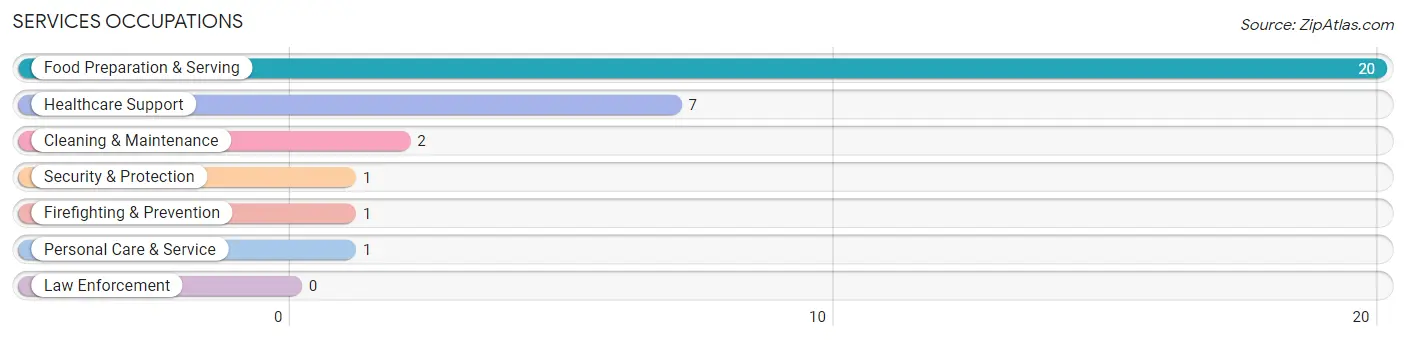
Services Occupations
The most common Services occupations in Coalmont are Food Preparation & Serving (20 | 6.2%), Healthcare Support (7 | 2.2%), Cleaning & Maintenance (2 | 0.6%), Security & Protection (1 | 0.3%), and Firefighting & Prevention (1 | 0.3%).
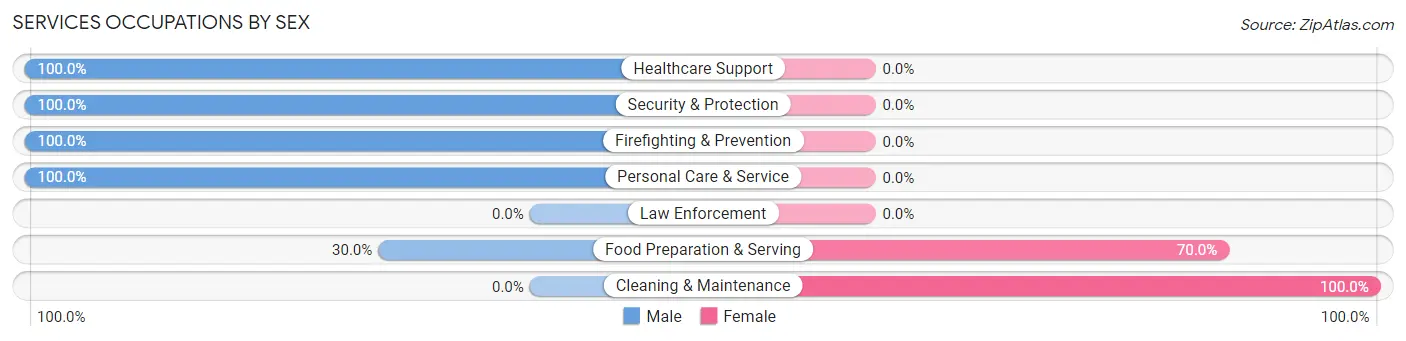
Services Occupations by Sex
Within the Services occupations in Coalmont, the most male-oriented occupations are Healthcare Support (100.0%), Security & Protection (100.0%), and Firefighting & Prevention (100.0%), while the most female-oriented occupations are Cleaning & Maintenance (100.0%), and Food Preparation & Serving (70.0%).
| Occupation | Male | Female |
| Healthcare Support | 7 (100.0%) | 0 (0.0%) |
| Security & Protection | 1 (100.0%) | 0 (0.0%) |
| Firefighting & Prevention | 1 (100.0%) | 0 (0.0%) |
| Law Enforcement | 0 (0.0%) | 0 (0.0%) |
| Food Preparation & Serving | 6 (30.0%) | 14 (70.0%) |
| Cleaning & Maintenance | 0 (0.0%) | 2 (100.0%) |
| Personal Care & Service | 1 (100.0%) | 0 (0.0%) |
| Total (Category) | 15 (48.4%) | 16 (51.6%) |
| Total (Overall) | 155 (48.4%) | 165 (51.6%) |
Sales and Office Occupations
The most common Sales and Office occupations in Coalmont are Office & Administration (31 | 9.7%), and Sales & Related (13 | 4.1%).
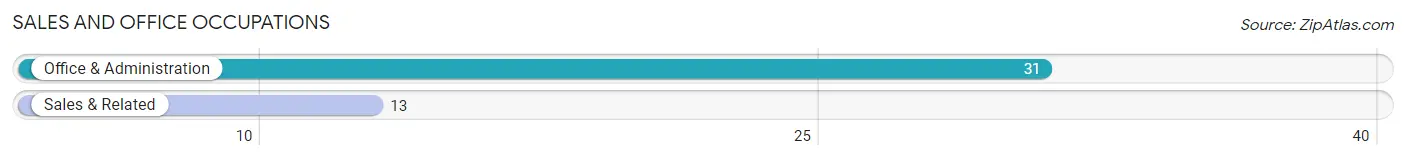
Sales and Office Occupations by Sex
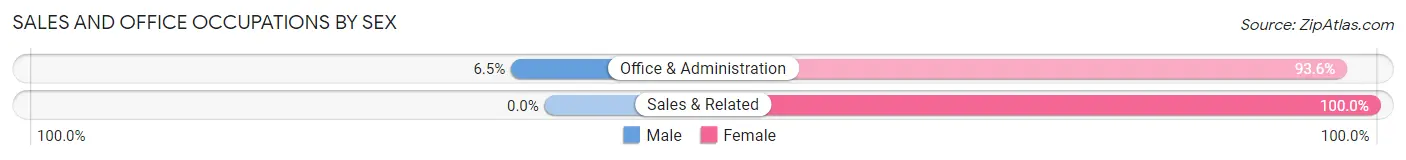
| Occupation | Male | Female |
| Sales & Related | 0 (0.0%) | 13 (100.0%) |
| Office & Administration | 2 (6.5%) | 29 (93.5%) |
| Total (Category) | 2 (4.5%) | 42 (95.5%) |
| Total (Overall) | 155 (48.4%) | 165 (51.6%) |
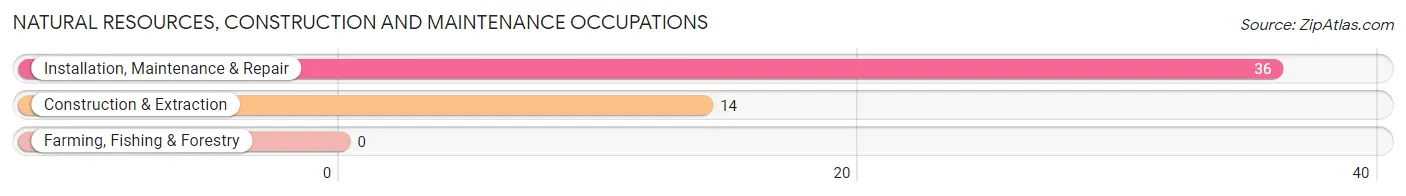
Natural Resources, Construction and Maintenance Occupations
The most common Natural Resources, Construction and Maintenance occupations in Coalmont are Installation, Maintenance & Repair (36 | 11.3%), and Construction & Extraction (14 | 4.4%).
Natural Resources, Construction and Maintenance Occupations by Sex
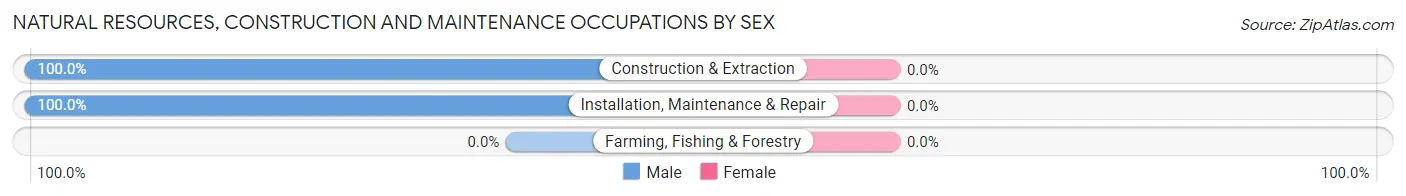
| Occupation | Male | Female |
| Farming, Fishing & Forestry | 0 (0.0%) | 0 (0.0%) |
| Construction & Extraction | 14 (100.0%) | 0 (0.0%) |
| Installation, Maintenance & Repair | 36 (100.0%) | 0 (0.0%) |
| Total (Category) | 50 (100.0%) | 0 (0.0%) |
| Total (Overall) | 155 (48.4%) | 165 (51.6%) |
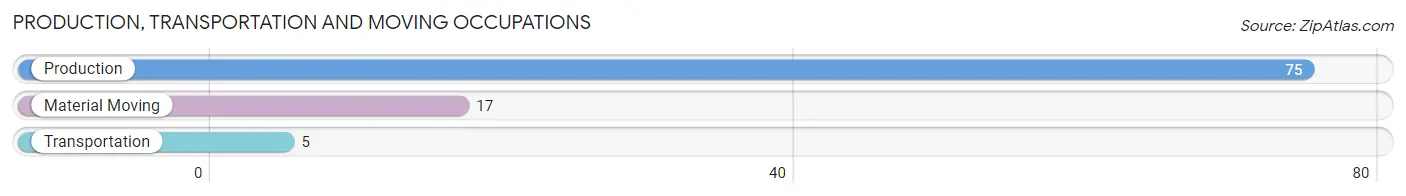
Production, Transportation and Moving Occupations
The most common Production, Transportation and Moving occupations in Coalmont are Production (75 | 23.4%), Material Moving (17 | 5.3%), and Transportation (5 | 1.6%).
Production, Transportation and Moving Occupations by Sex
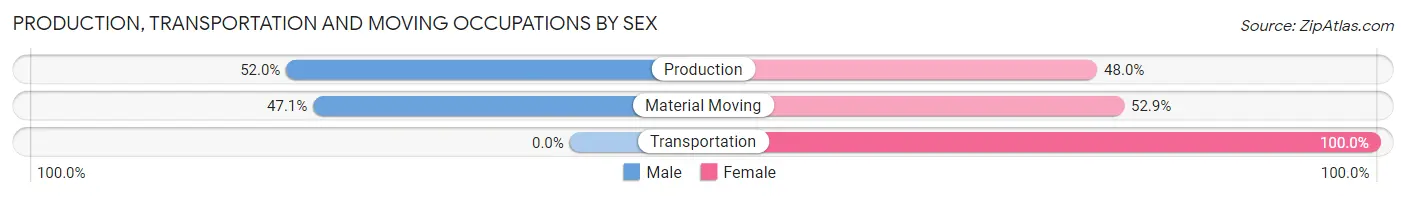
| Occupation | Male | Female |
| Production | 39 (52.0%) | 36 (48.0%) |
| Transportation | 0 (0.0%) | 5 (100.0%) |
| Material Moving | 8 (47.1%) | 9 (52.9%) |
| Total (Category) | 47 (48.4%) | 50 (51.5%) |
| Total (Overall) | 155 (48.4%) | 165 (51.6%) |
Employment Industries by Sex in Coalmont
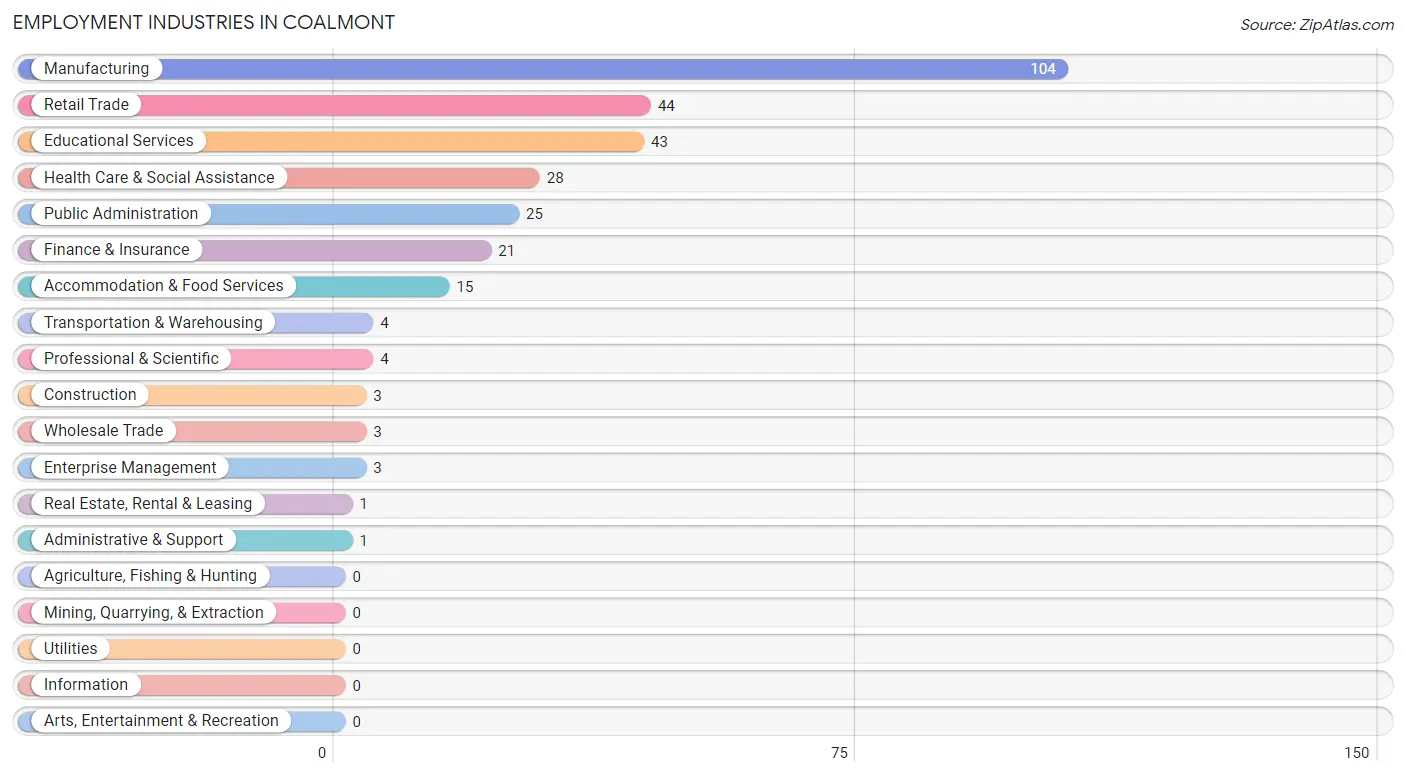
Employment Industries in Coalmont
The major employment industries in Coalmont include Manufacturing (104 | 32.5%), Retail Trade (44 | 13.8%), Educational Services (43 | 13.4%), Health Care & Social Assistance (28 | 8.7%), and Public Administration (25 | 7.8%).
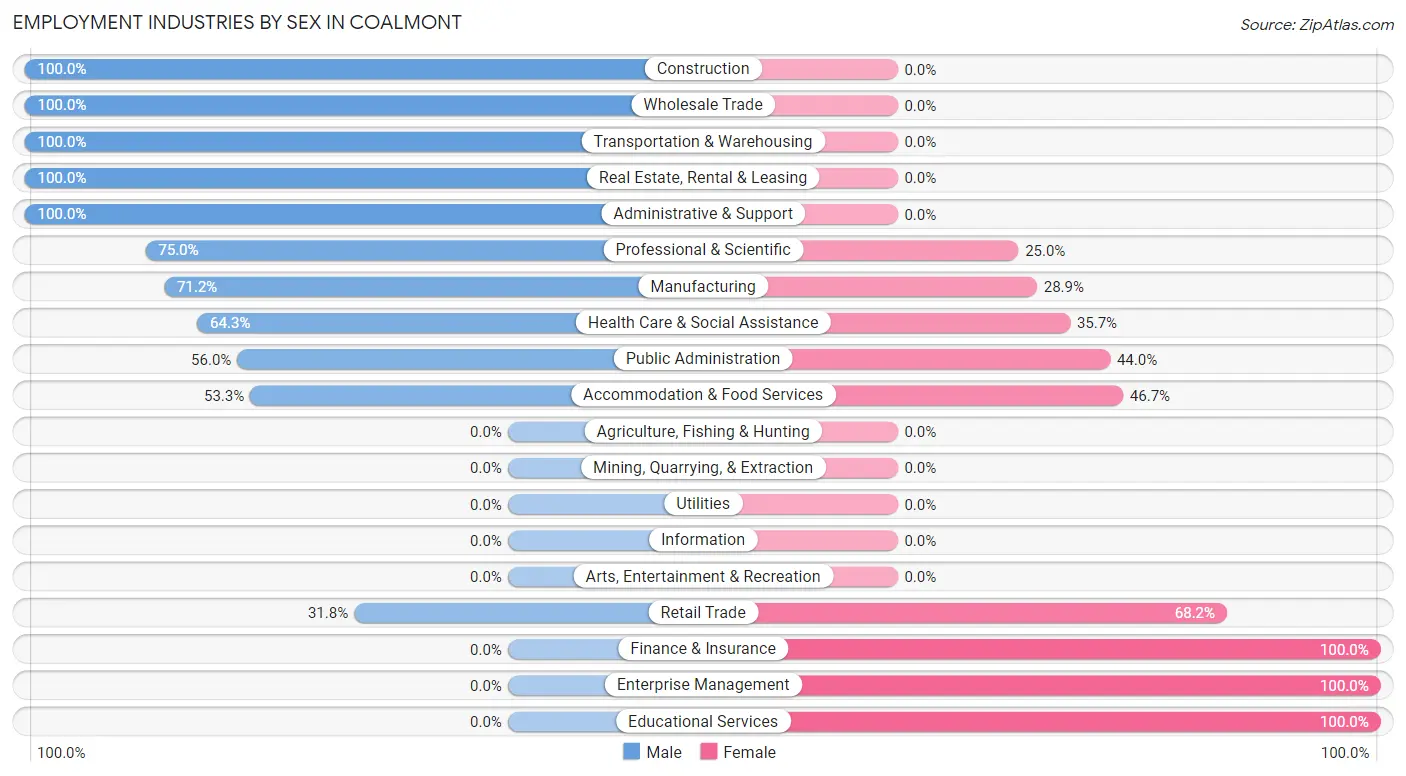
Employment Industries by Sex in Coalmont
The Coalmont industries that see more men than women are Construction (100.0%), Wholesale Trade (100.0%), and Transportation & Warehousing (100.0%), whereas the industries that tend to have a higher number of women are Finance & Insurance (100.0%), Enterprise Management (100.0%), and Educational Services (100.0%).
| Industry | Male | Female |
| Agriculture, Fishing & Hunting | 0 (0.0%) | 0 (0.0%) |
| Mining, Quarrying, & Extraction | 0 (0.0%) | 0 (0.0%) |
| Construction | 3 (100.0%) | 0 (0.0%) |
| Manufacturing | 74 (71.2%) | 30 (28.8%) |
| Wholesale Trade | 3 (100.0%) | 0 (0.0%) |
| Retail Trade | 14 (31.8%) | 30 (68.2%) |
| Transportation & Warehousing | 4 (100.0%) | 0 (0.0%) |
| Utilities | 0 (0.0%) | 0 (0.0%) |
| Information | 0 (0.0%) | 0 (0.0%) |
| Finance & Insurance | 0 (0.0%) | 21 (100.0%) |
| Real Estate, Rental & Leasing | 1 (100.0%) | 0 (0.0%) |
| Professional & Scientific | 3 (75.0%) | 1 (25.0%) |
| Enterprise Management | 0 (0.0%) | 3 (100.0%) |
| Administrative & Support | 1 (100.0%) | 0 (0.0%) |
| Educational Services | 0 (0.0%) | 43 (100.0%) |
| Health Care & Social Assistance | 18 (64.3%) | 10 (35.7%) |
| Arts, Entertainment & Recreation | 0 (0.0%) | 0 (0.0%) |
| Accommodation & Food Services | 8 (53.3%) | 7 (46.7%) |
| Public Administration | 14 (56.0%) | 11 (44.0%) |
| Total | 155 (48.4%) | 165 (51.6%) |
Education in Coalmont
School Enrollment in Coalmont
The most common levels of schooling among the 190 students in Coalmont are middle school (69 | 36.3%), high school (38 | 20.0%), and elementary school (37 | 19.5%).
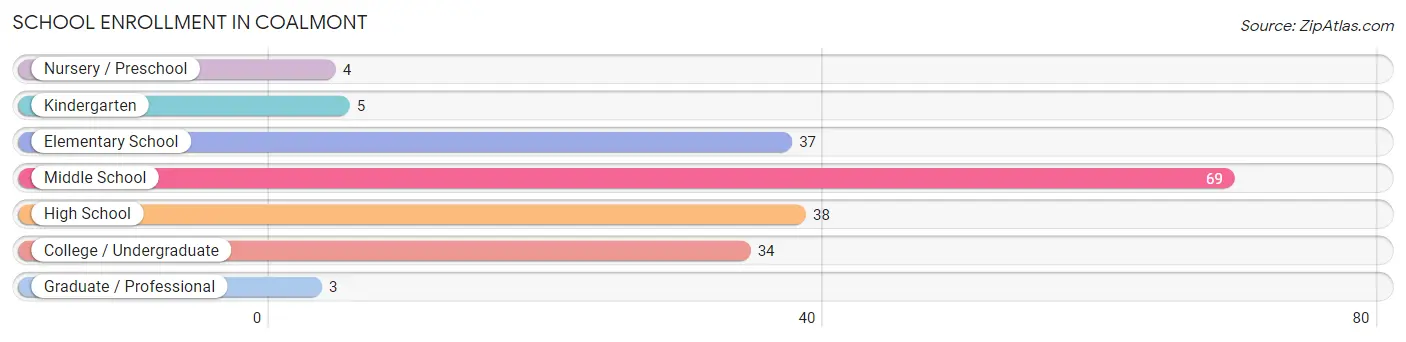
| School Level | # Students | % Students |
| Nursery / Preschool | 4 | 2.1% |
| Kindergarten | 5 | 2.6% |
| Elementary School | 37 | 19.5% |
| Middle School | 69 | 36.3% |
| High School | 38 | 20.0% |
| College / Undergraduate | 34 | 17.9% |
| Graduate / Professional | 3 | 1.6% |
| Total | 190 | 100.0% |
School Enrollment by Age by Funding Source in Coalmont
Out of a total of 190 students who are enrolled in schools in Coalmont, 58 (30.5%) attend a private institution, while the remaining 132 (69.5%) are enrolled in public schools. The age group of 10 to 14 year olds has the highest likelihood of being enrolled in private schools, with 47 (58.8% in the age bracket) enrolled. Conversely, the age group of 3 to 4 year olds has the lowest likelihood of being enrolled in a private school, with 4 (100.0% in the age bracket) attending a public institution.
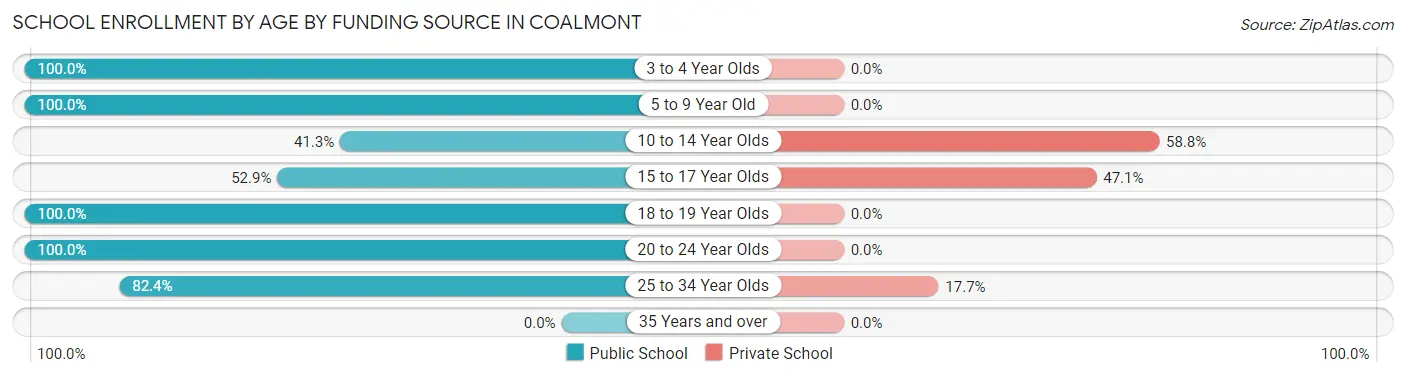
| Age Bracket | Public School | Private School |
| 3 to 4 Year Olds | 4 (100.0%) | 0 (0.0%) |
| 5 to 9 Year Old | 41 (100.0%) | 0 (0.0%) |
| 10 to 14 Year Olds | 33 (41.2%) | 47 (58.8%) |
| 15 to 17 Year Olds | 9 (52.9%) | 8 (47.1%) |
| 18 to 19 Year Olds | 25 (100.0%) | 0 (0.0%) |
| 20 to 24 Year Olds | 6 (100.0%) | 0 (0.0%) |
| 25 to 34 Year Olds | 14 (82.4%) | 3 (17.6%) |
| 35 Years and over | 0 (0.0%) | 0 (0.0%) |
| Total | 132 (69.5%) | 58 (30.5%) |
Educational Attainment by Field of Study in Coalmont
Psychology (25 | 26.0%), arts & humanities (17 | 17.7%), science & technology (16 | 16.7%), education (12 | 12.5%), and communications (10 | 10.4%) are the most common fields of study among 96 individuals in Coalmont who have obtained a bachelor's degree or higher.
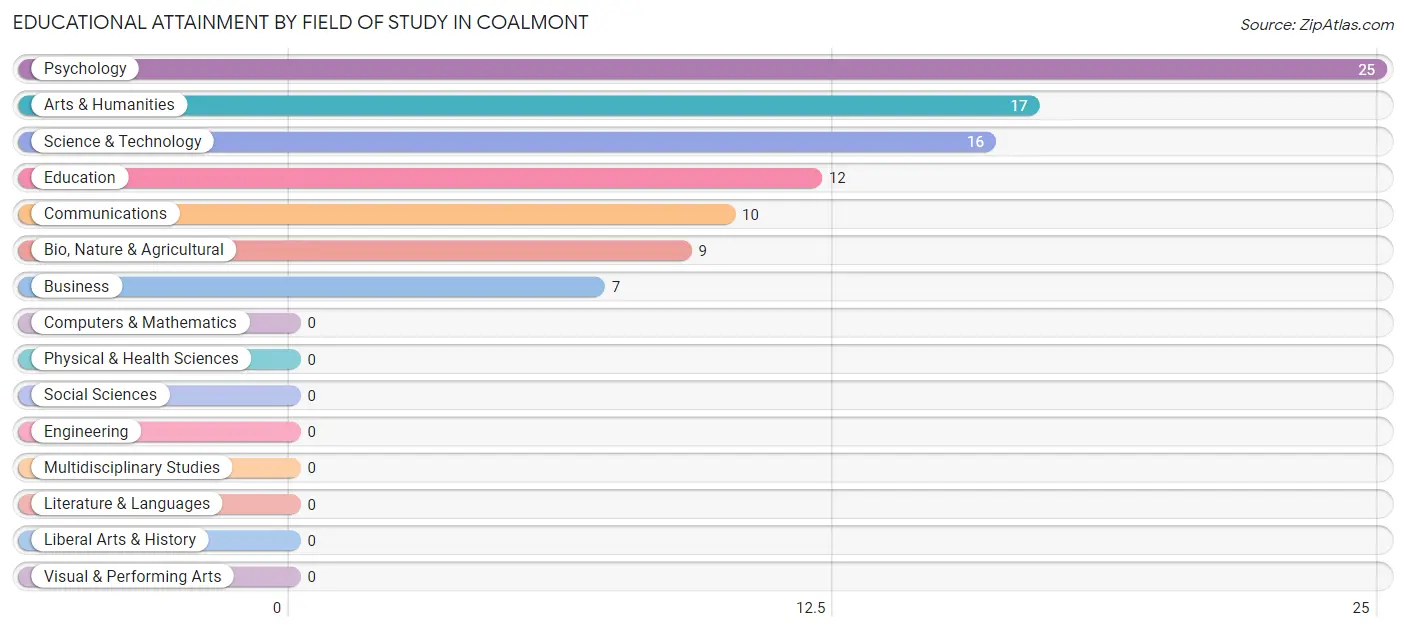
| Field of Study | # Graduates | % Graduates |
| Computers & Mathematics | 0 | 0.0% |
| Bio, Nature & Agricultural | 9 | 9.4% |
| Physical & Health Sciences | 0 | 0.0% |
| Psychology | 25 | 26.0% |
| Social Sciences | 0 | 0.0% |
| Engineering | 0 | 0.0% |
| Multidisciplinary Studies | 0 | 0.0% |
| Science & Technology | 16 | 16.7% |
| Business | 7 | 7.3% |
| Education | 12 | 12.5% |
| Literature & Languages | 0 | 0.0% |
| Liberal Arts & History | 0 | 0.0% |
| Visual & Performing Arts | 0 | 0.0% |
| Communications | 10 | 10.4% |
| Arts & Humanities | 17 | 17.7% |
| Total | 96 | 100.0% |
Transportation & Commute in Coalmont
Vehicle Availability by Sex in Coalmont
The most prevalent vehicle ownership categories in Coalmont are males with 2 vehicles (49, accounting for 32.7%) and females with 2 vehicles (38, making up 32.2%).
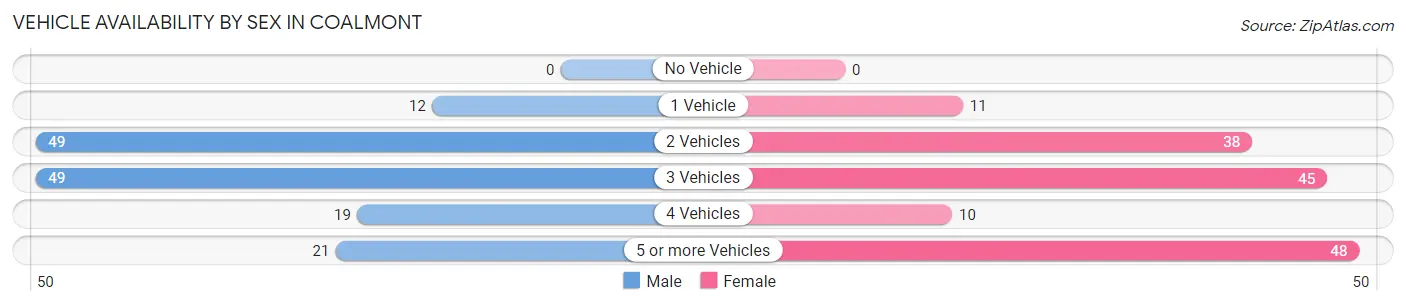
| Vehicles Available | Male | Female |
| No Vehicle | 0 (0.0%) | 0 (0.0%) |
| 1 Vehicle | 12 (8.0%) | 11 (7.2%) |
| 2 Vehicles | 49 (32.7%) | 38 (25.0%) |
| 3 Vehicles | 49 (32.7%) | 45 (29.6%) |
| 4 Vehicles | 19 (12.7%) | 10 (6.6%) |
| 5 or more Vehicles | 21 (14.0%) | 48 (31.6%) |
| Total | 150 (100.0%) | 152 (100.0%) |
Commute Time in Coalmont
The most frequently occuring commute durations in Coalmont are 10 to 14 minutes (42 commuters, 14.9%), 35 to 39 minutes (42 commuters, 14.9%), and 15 to 19 minutes (35 commuters, 12.4%).
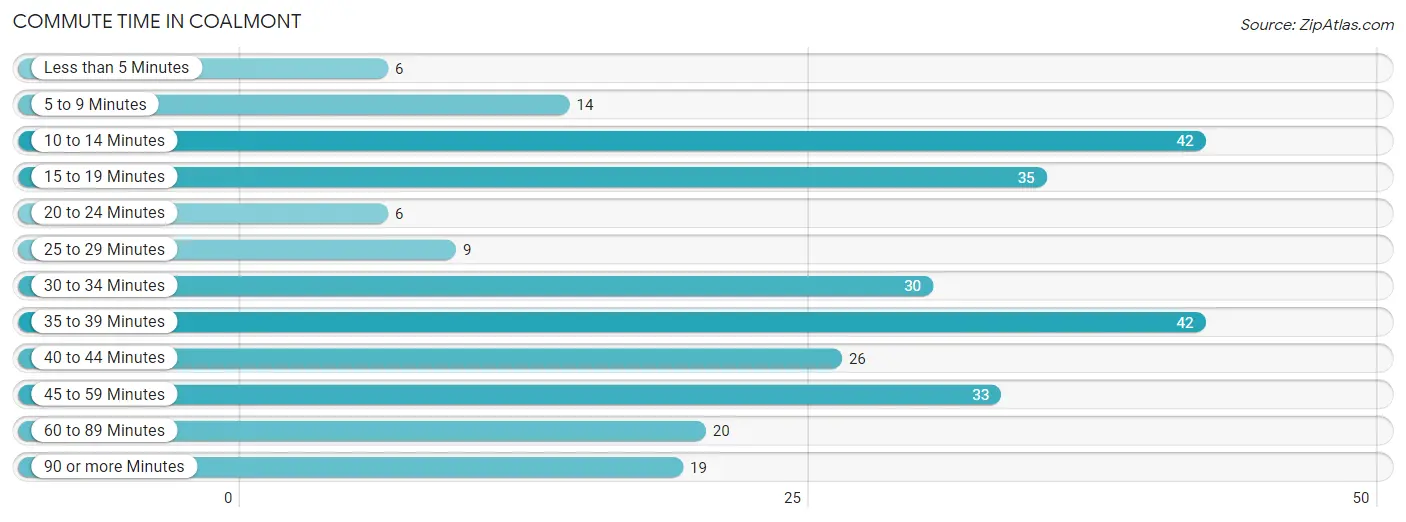
| Commute Time | # Commuters | % Commuters |
| Less than 5 Minutes | 6 | 2.1% |
| 5 to 9 Minutes | 14 | 5.0% |
| 10 to 14 Minutes | 42 | 14.9% |
| 15 to 19 Minutes | 35 | 12.4% |
| 20 to 24 Minutes | 6 | 2.1% |
| 25 to 29 Minutes | 9 | 3.2% |
| 30 to 34 Minutes | 30 | 10.6% |
| 35 to 39 Minutes | 42 | 14.9% |
| 40 to 44 Minutes | 26 | 9.2% |
| 45 to 59 Minutes | 33 | 11.7% |
| 60 to 89 Minutes | 20 | 7.1% |
| 90 or more Minutes | 19 | 6.7% |
Commute Time by Sex in Coalmont
The most common commute times in Coalmont are 35 to 39 minutes (29 commuters, 20.4%) for males and 10 to 14 minutes (32 commuters, 22.9%) for females.
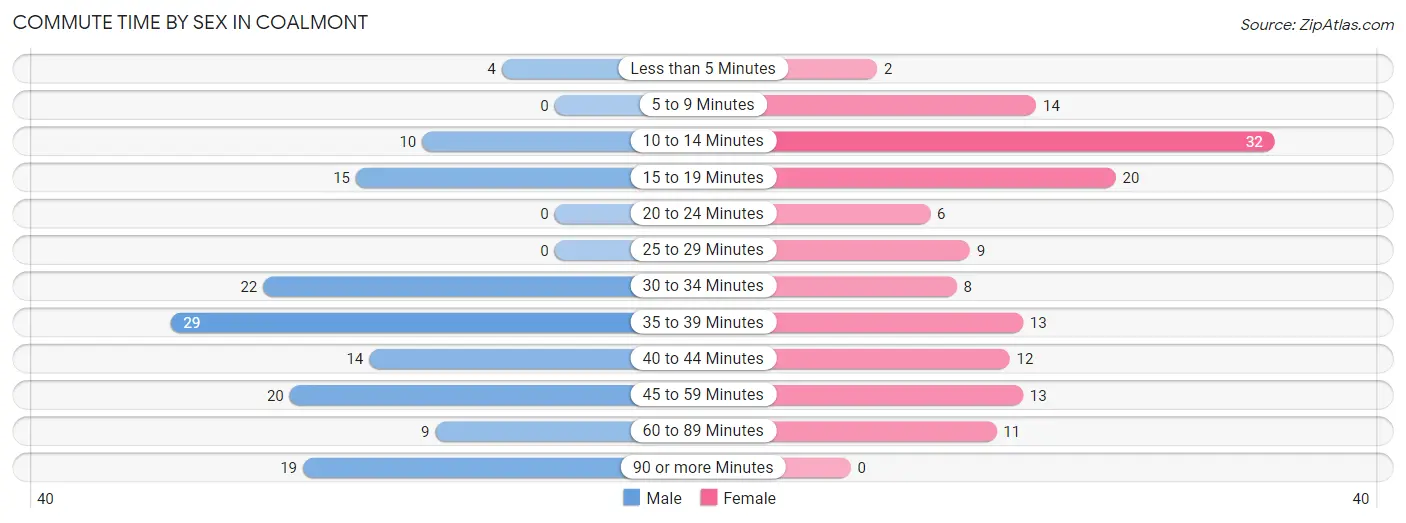
| Commute Time | Male | Female |
| Less than 5 Minutes | 4 (2.8%) | 2 (1.4%) |
| 5 to 9 Minutes | 0 (0.0%) | 14 (10.0%) |
| 10 to 14 Minutes | 10 (7.0%) | 32 (22.9%) |
| 15 to 19 Minutes | 15 (10.6%) | 20 (14.3%) |
| 20 to 24 Minutes | 0 (0.0%) | 6 (4.3%) |
| 25 to 29 Minutes | 0 (0.0%) | 9 (6.4%) |
| 30 to 34 Minutes | 22 (15.5%) | 8 (5.7%) |
| 35 to 39 Minutes | 29 (20.4%) | 13 (9.3%) |
| 40 to 44 Minutes | 14 (9.9%) | 12 (8.6%) |
| 45 to 59 Minutes | 20 (14.1%) | 13 (9.3%) |
| 60 to 89 Minutes | 9 (6.3%) | 11 (7.9%) |
| 90 or more Minutes | 19 (13.4%) | 0 (0.0%) |
Time of Departure to Work by Sex in Coalmont
The most frequent times of departure to work in Coalmont are 12:00 PM to 3:59 PM (38, 26.8%) for males and 12:00 AM to 4:59 AM (19, 13.6%) for females.
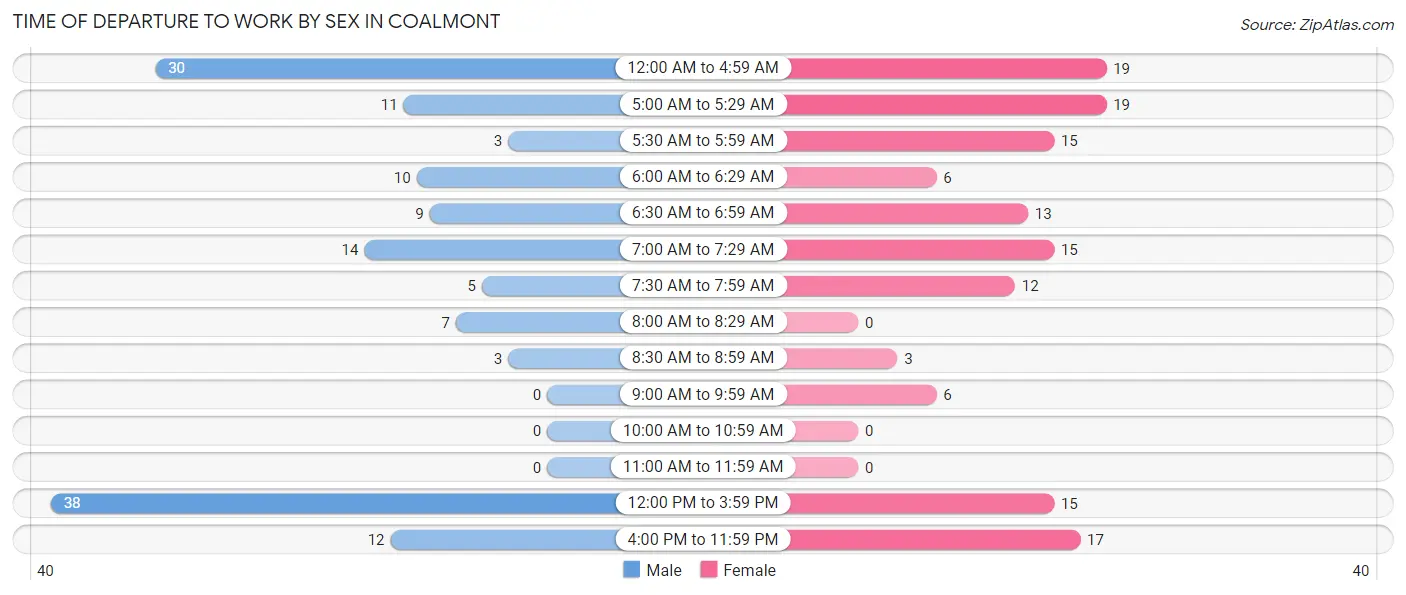
| Time of Departure | Male | Female |
| 12:00 AM to 4:59 AM | 30 (21.1%) | 19 (13.6%) |
| 5:00 AM to 5:29 AM | 11 (7.7%) | 19 (13.6%) |
| 5:30 AM to 5:59 AM | 3 (2.1%) | 15 (10.7%) |
| 6:00 AM to 6:29 AM | 10 (7.0%) | 6 (4.3%) |
| 6:30 AM to 6:59 AM | 9 (6.3%) | 13 (9.3%) |
| 7:00 AM to 7:29 AM | 14 (9.9%) | 15 (10.7%) |
| 7:30 AM to 7:59 AM | 5 (3.5%) | 12 (8.6%) |
| 8:00 AM to 8:29 AM | 7 (4.9%) | 0 (0.0%) |
| 8:30 AM to 8:59 AM | 3 (2.1%) | 3 (2.1%) |
| 9:00 AM to 9:59 AM | 0 (0.0%) | 6 (4.3%) |
| 10:00 AM to 10:59 AM | 0 (0.0%) | 0 (0.0%) |
| 11:00 AM to 11:59 AM | 0 (0.0%) | 0 (0.0%) |
| 12:00 PM to 3:59 PM | 38 (26.8%) | 15 (10.7%) |
| 4:00 PM to 11:59 PM | 12 (8.5%) | 17 (12.1%) |
| Total | 142 (100.0%) | 140 (100.0%) |
Housing Occupancy in Coalmont
Occupancy by Ownership in Coalmont
Of the total 314 dwellings in Coalmont, owner-occupied units account for 265 (84.4%), while renter-occupied units make up 49 (15.6%).
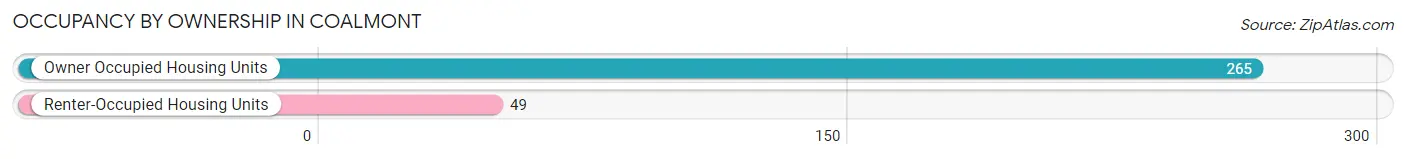
| Occupancy | # Housing Units | % Housing Units |
| Owner Occupied Housing Units | 265 | 84.4% |
| Renter-Occupied Housing Units | 49 | 15.6% |
| Total Occupied Housing Units | 314 | 100.0% |
Occupancy by Household Size in Coalmont
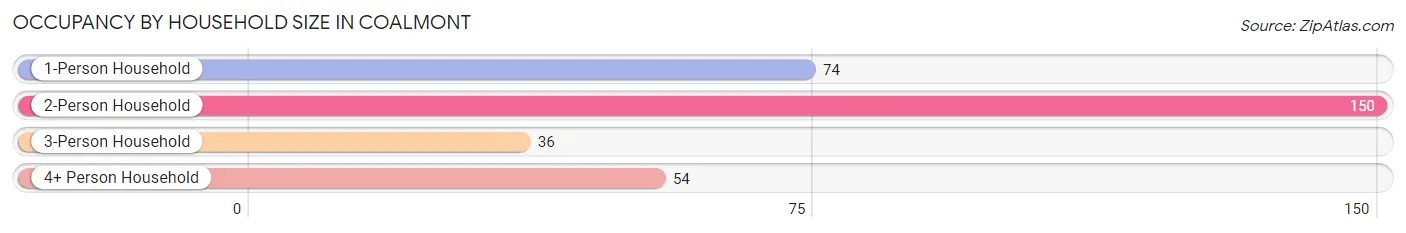
| Household Size | # Housing Units | % Housing Units |
| 1-Person Household | 74 | 23.6% |
| 2-Person Household | 150 | 47.8% |
| 3-Person Household | 36 | 11.5% |
| 4+ Person Household | 54 | 17.2% |
| Total Housing Units | 314 | 100.0% |
Occupancy by Ownership by Household Size in Coalmont
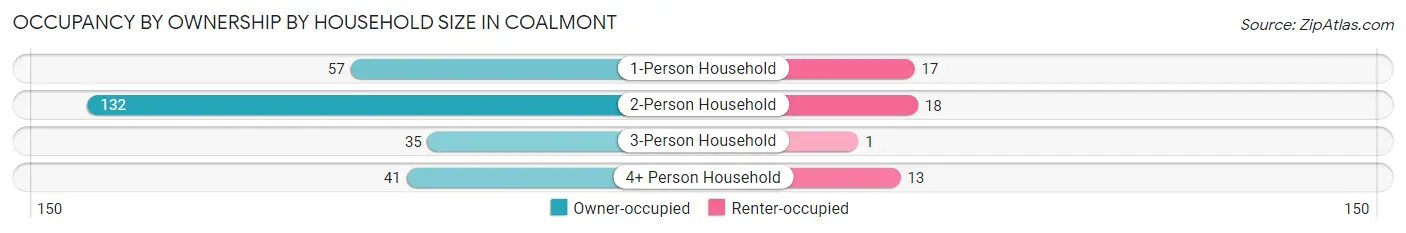
| Household Size | Owner-occupied | Renter-occupied |
| 1-Person Household | 57 (77.0%) | 17 (23.0%) |
| 2-Person Household | 132 (88.0%) | 18 (12.0%) |
| 3-Person Household | 35 (97.2%) | 1 (2.8%) |
| 4+ Person Household | 41 (75.9%) | 13 (24.1%) |
| Total Housing Units | 265 (84.4%) | 49 (15.6%) |
Occupancy by Educational Attainment in Coalmont
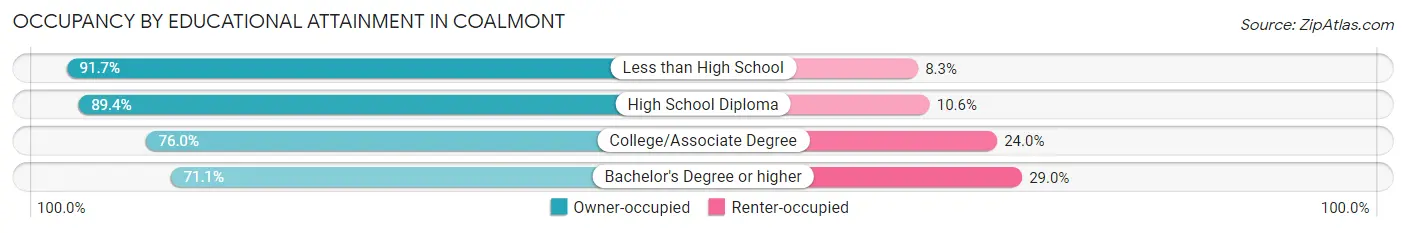
| Household Size | Owner-occupied | Renter-occupied |
| Less than High School | 55 (91.7%) | 5 (8.3%) |
| High School Diploma | 126 (89.4%) | 15 (10.6%) |
| College/Associate Degree | 57 (76.0%) | 18 (24.0%) |
| Bachelor's Degree or higher | 27 (71.1%) | 11 (28.9%) |
Occupancy by Age of Householder in Coalmont
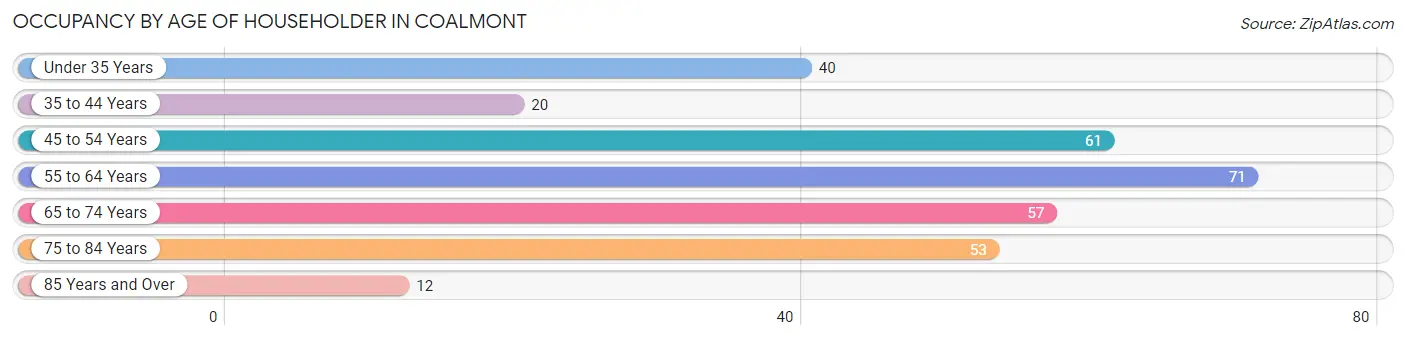
| Age Bracket | # Households | % Households |
| Under 35 Years | 40 | 12.7% |
| 35 to 44 Years | 20 | 6.4% |
| 45 to 54 Years | 61 | 19.4% |
| 55 to 64 Years | 71 | 22.6% |
| 65 to 74 Years | 57 | 18.1% |
| 75 to 84 Years | 53 | 16.9% |
| 85 Years and Over | 12 | 3.8% |
| Total | 314 | 100.0% |
Housing Finances in Coalmont
Median Income by Occupancy in Coalmont
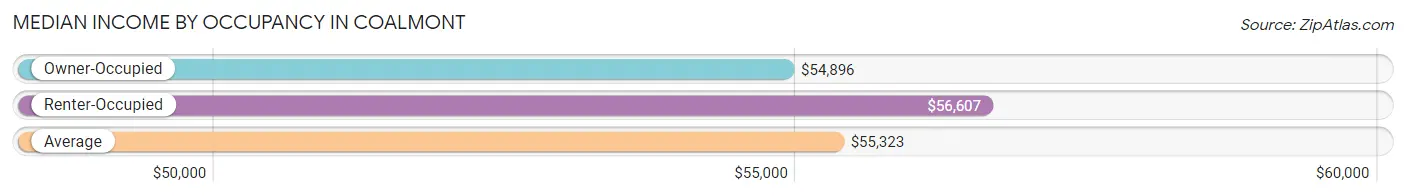
| Occupancy Type | # Households | Median Income |
| Owner-Occupied | 265 (84.4%) | $54,896 |
| Renter-Occupied | 49 (15.6%) | $56,607 |
| Average | 314 (100.0%) | $55,323 |
Occupancy by Householder Income Bracket in Coalmont
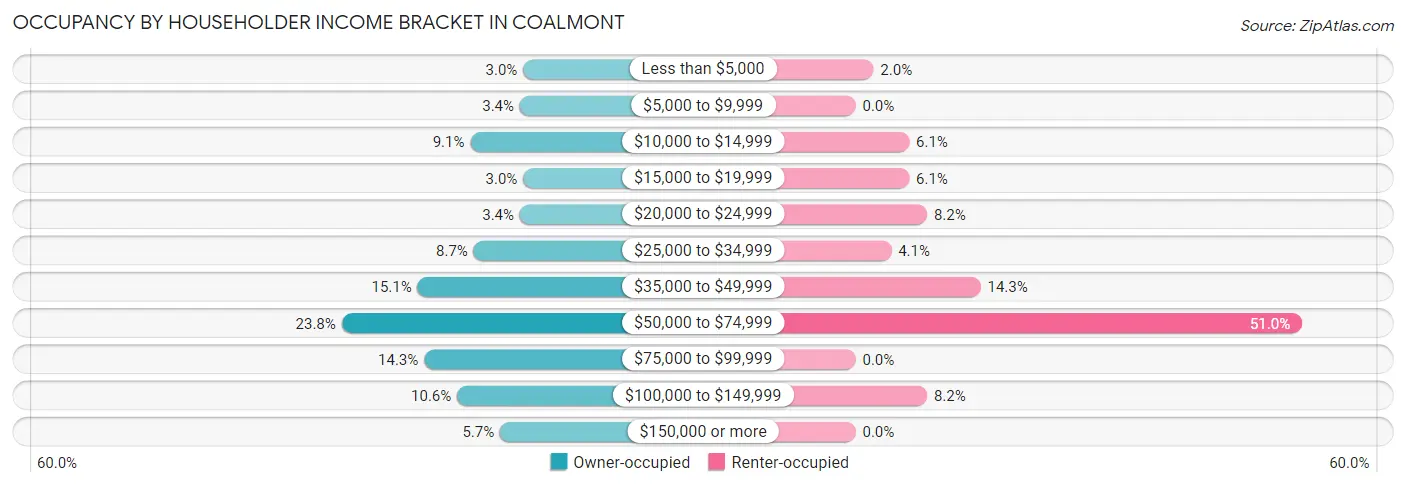
| Income Bracket | Owner-occupied | Renter-occupied |
| Less than $5,000 | 8 (3.0%) | 1 (2.0%) |
| $5,000 to $9,999 | 9 (3.4%) | 0 (0.0%) |
| $10,000 to $14,999 | 24 (9.1%) | 3 (6.1%) |
| $15,000 to $19,999 | 8 (3.0%) | 3 (6.1%) |
| $20,000 to $24,999 | 9 (3.4%) | 4 (8.2%) |
| $25,000 to $34,999 | 23 (8.7%) | 2 (4.1%) |
| $35,000 to $49,999 | 40 (15.1%) | 7 (14.3%) |
| $50,000 to $74,999 | 63 (23.8%) | 25 (51.0%) |
| $75,000 to $99,999 | 38 (14.3%) | 0 (0.0%) |
| $100,000 to $149,999 | 28 (10.6%) | 4 (8.2%) |
| $150,000 or more | 15 (5.7%) | 0 (0.0%) |
| Total | 265 (100.0%) | 49 (100.0%) |
Monthly Housing Cost Tiers in Coalmont
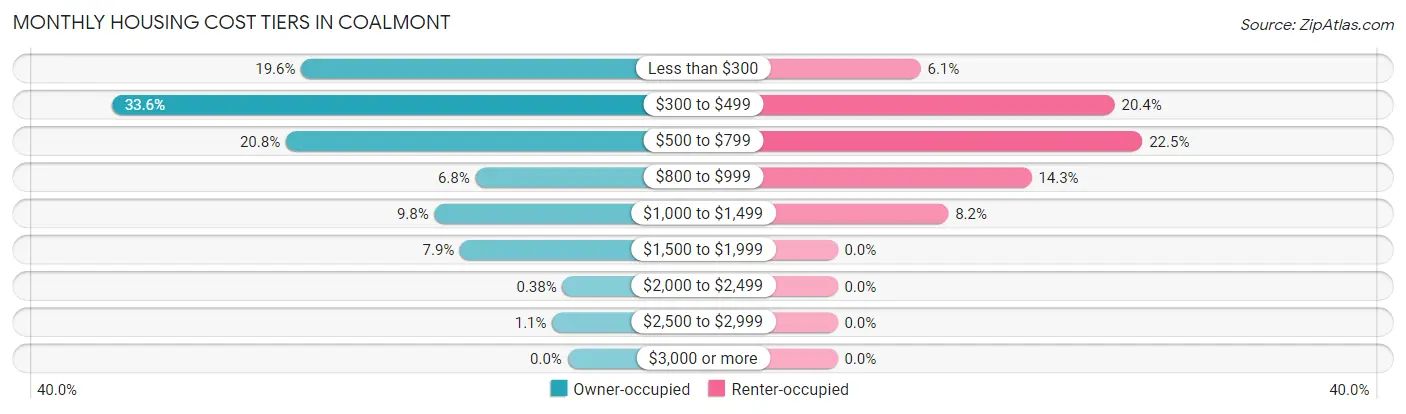
| Monthly Cost | Owner-occupied | Renter-occupied |
| Less than $300 | 52 (19.6%) | 3 (6.1%) |
| $300 to $499 | 89 (33.6%) | 10 (20.4%) |
| $500 to $799 | 55 (20.7%) | 11 (22.5%) |
| $800 to $999 | 18 (6.8%) | 7 (14.3%) |
| $1,000 to $1,499 | 26 (9.8%) | 4 (8.2%) |
| $1,500 to $1,999 | 21 (7.9%) | 0 (0.0%) |
| $2,000 to $2,499 | 1 (0.4%) | 0 (0.0%) |
| $2,500 to $2,999 | 3 (1.1%) | 0 (0.0%) |
| $3,000 or more | 0 (0.0%) | 0 (0.0%) |
| Total | 265 (100.0%) | 49 (100.0%) |
Physical Housing Characteristics in Coalmont
Housing Structures in Coalmont
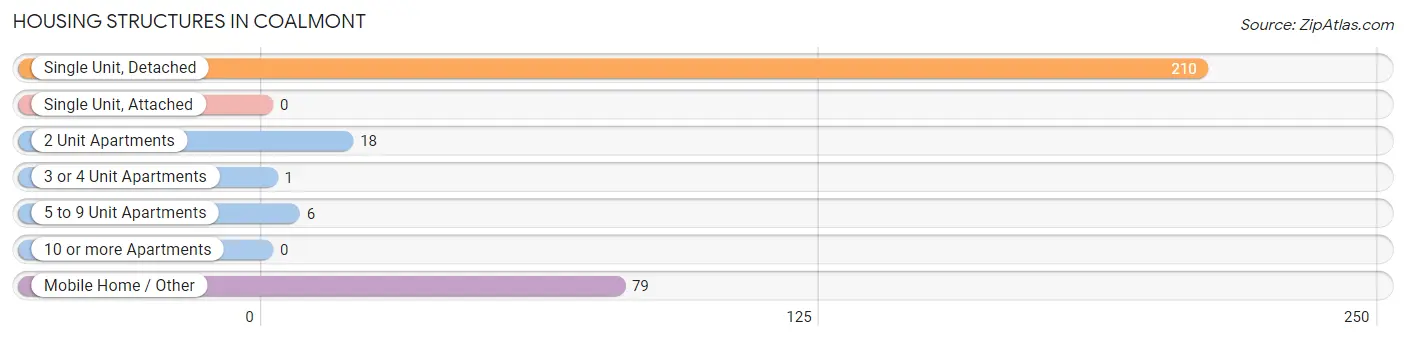
| Structure Type | # Housing Units | % Housing Units |
| Single Unit, Detached | 210 | 66.9% |
| Single Unit, Attached | 0 | 0.0% |
| 2 Unit Apartments | 18 | 5.7% |
| 3 or 4 Unit Apartments | 1 | 0.3% |
| 5 to 9 Unit Apartments | 6 | 1.9% |
| 10 or more Apartments | 0 | 0.0% |
| Mobile Home / Other | 79 | 25.2% |
| Total | 314 | 100.0% |
Housing Structures by Occupancy in Coalmont
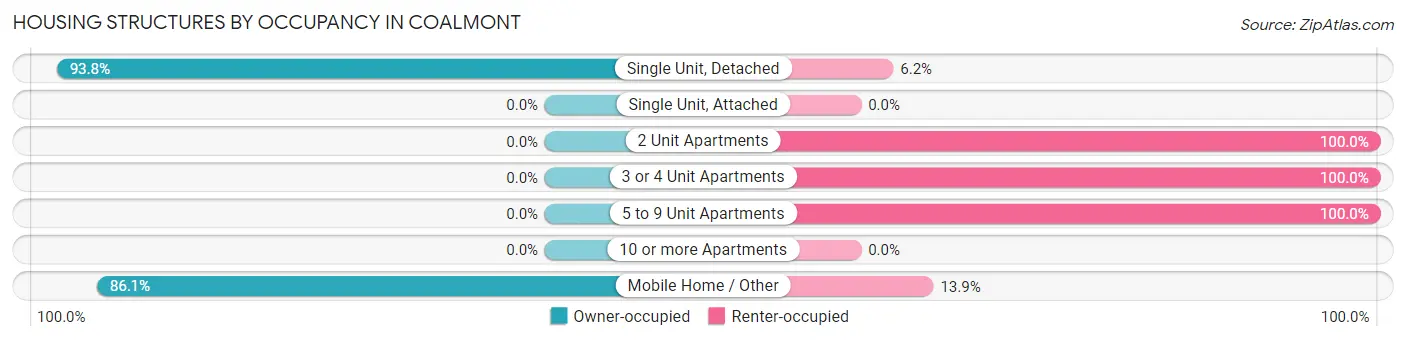
| Structure Type | Owner-occupied | Renter-occupied |
| Single Unit, Detached | 197 (93.8%) | 13 (6.2%) |
| Single Unit, Attached | 0 (0.0%) | 0 (0.0%) |
| 2 Unit Apartments | 0 (0.0%) | 18 (100.0%) |
| 3 or 4 Unit Apartments | 0 (0.0%) | 1 (100.0%) |
| 5 to 9 Unit Apartments | 0 (0.0%) | 6 (100.0%) |
| 10 or more Apartments | 0 (0.0%) | 0 (0.0%) |
| Mobile Home / Other | 68 (86.1%) | 11 (13.9%) |
| Total | 265 (84.4%) | 49 (15.6%) |
Housing Structures by Number of Rooms in Coalmont
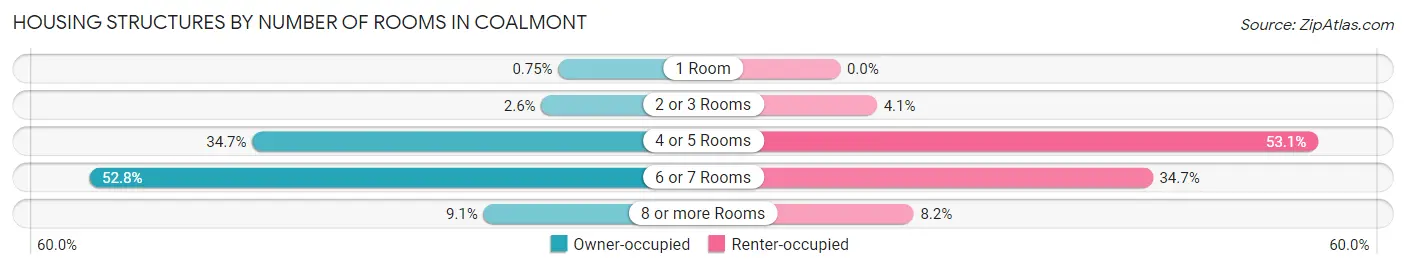
| Number of Rooms | Owner-occupied | Renter-occupied |
| 1 Room | 2 (0.7%) | 0 (0.0%) |
| 2 or 3 Rooms | 7 (2.6%) | 2 (4.1%) |
| 4 or 5 Rooms | 92 (34.7%) | 26 (53.1%) |
| 6 or 7 Rooms | 140 (52.8%) | 17 (34.7%) |
| 8 or more Rooms | 24 (9.1%) | 4 (8.2%) |
| Total | 265 (100.0%) | 49 (100.0%) |
Housing Structure by Heating Type in Coalmont
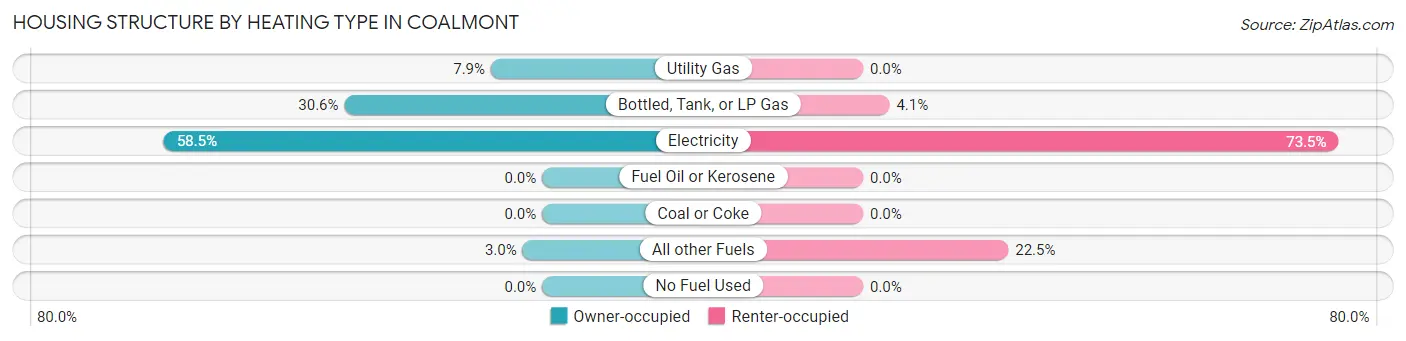
| Heating Type | Owner-occupied | Renter-occupied |
| Utility Gas | 21 (7.9%) | 0 (0.0%) |
| Bottled, Tank, or LP Gas | 81 (30.6%) | 2 (4.1%) |
| Electricity | 155 (58.5%) | 36 (73.5%) |
| Fuel Oil or Kerosene | 0 (0.0%) | 0 (0.0%) |
| Coal or Coke | 0 (0.0%) | 0 (0.0%) |
| All other Fuels | 8 (3.0%) | 11 (22.5%) |
| No Fuel Used | 0 (0.0%) | 0 (0.0%) |
| Total | 265 (100.0%) | 49 (100.0%) |
Household Vehicle Usage in Coalmont
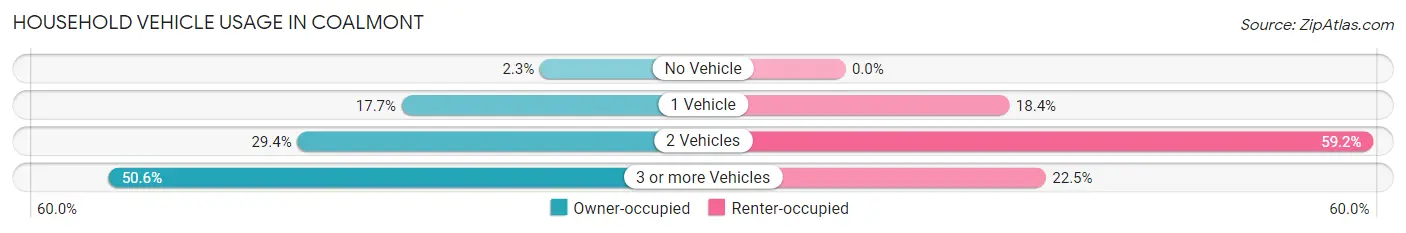
| Vehicles per Household | Owner-occupied | Renter-occupied |
| No Vehicle | 6 (2.3%) | 0 (0.0%) |
| 1 Vehicle | 47 (17.7%) | 9 (18.4%) |
| 2 Vehicles | 78 (29.4%) | 29 (59.2%) |
| 3 or more Vehicles | 134 (50.6%) | 11 (22.5%) |
| Total | 265 (100.0%) | 49 (100.0%) |
Real Estate & Mortgages in Coalmont
Real Estate and Mortgage Overview in Coalmont
| Characteristic | Without Mortgage | With Mortgage |
| Housing Units | 185 | 80 |
| Median Property Value | $97,900 | $156,300 |
| Median Household Income | $47,917 | $10 |
| Monthly Housing Costs | $390 | $0 |
| Real Estate Taxes | $560 | $3 |
Property Value by Mortgage Status in Coalmont
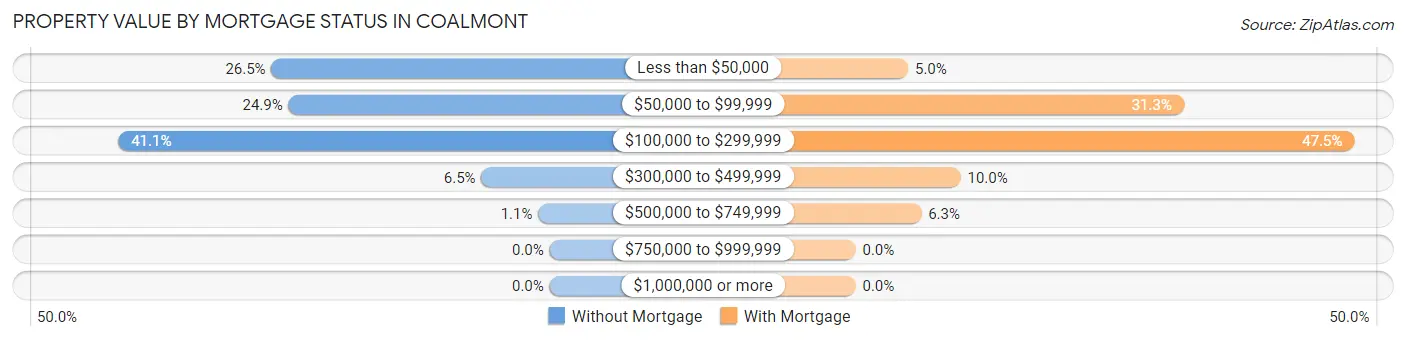
| Property Value | Without Mortgage | With Mortgage |
| Less than $50,000 | 49 (26.5%) | 4 (5.0%) |
| $50,000 to $99,999 | 46 (24.9%) | 25 (31.2%) |
| $100,000 to $299,999 | 76 (41.1%) | 38 (47.5%) |
| $300,000 to $499,999 | 12 (6.5%) | 8 (10.0%) |
| $500,000 to $749,999 | 2 (1.1%) | 5 (6.2%) |
| $750,000 to $999,999 | 0 (0.0%) | 0 (0.0%) |
| $1,000,000 or more | 0 (0.0%) | 0 (0.0%) |
| Total | 185 (100.0%) | 80 (100.0%) |
Household Income by Mortgage Status in Coalmont
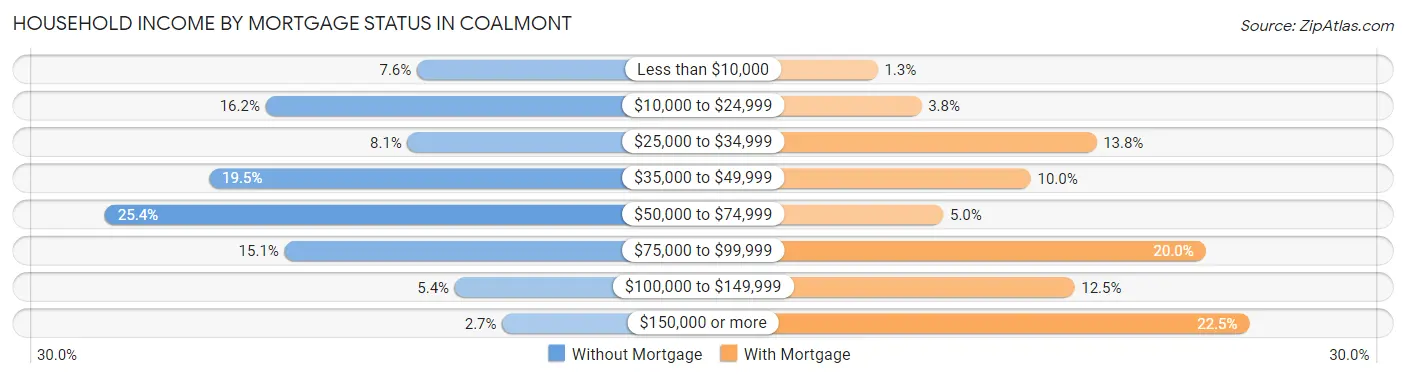
| Household Income | Without Mortgage | With Mortgage |
| Less than $10,000 | 14 (7.6%) | 1 (1.3%) |
| $10,000 to $24,999 | 30 (16.2%) | 3 (3.7%) |
| $25,000 to $34,999 | 15 (8.1%) | 11 (13.8%) |
| $35,000 to $49,999 | 36 (19.5%) | 8 (10.0%) |
| $50,000 to $74,999 | 47 (25.4%) | 4 (5.0%) |
| $75,000 to $99,999 | 28 (15.1%) | 16 (20.0%) |
| $100,000 to $149,999 | 10 (5.4%) | 10 (12.5%) |
| $150,000 or more | 5 (2.7%) | 18 (22.5%) |
| Total | 185 (100.0%) | 80 (100.0%) |
Property Value to Household Income Ratio in Coalmont
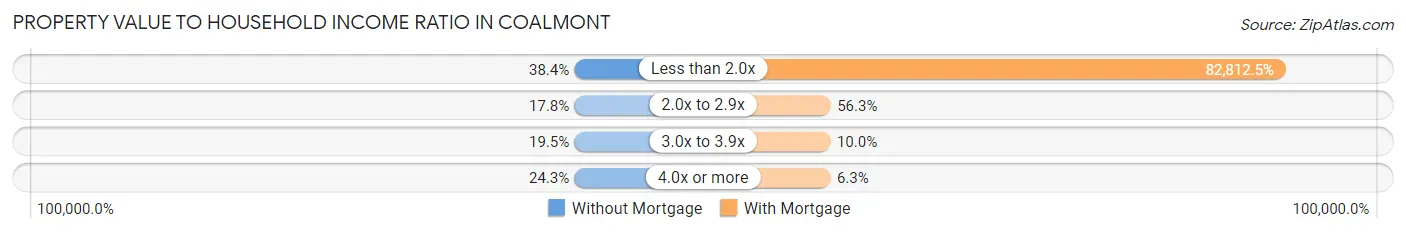
| Value-to-Income Ratio | Without Mortgage | With Mortgage |
| Less than 2.0x | 71 (38.4%) | 66,250 (82,812.5%) |
| 2.0x to 2.9x | 33 (17.8%) | 45 (56.2%) |
| 3.0x to 3.9x | 36 (19.5%) | 8 (10.0%) |
| 4.0x or more | 45 (24.3%) | 5 (6.2%) |
| Total | 185 (100.0%) | 80 (100.0%) |
Real Estate Taxes by Mortgage Status in Coalmont
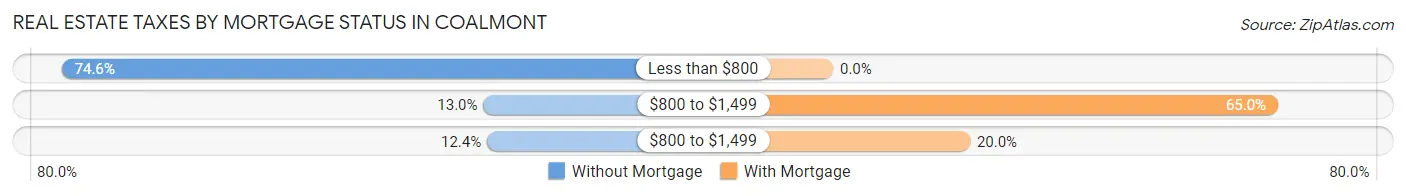
| Property Taxes | Without Mortgage | With Mortgage |
| Less than $800 | 138 (74.6%) | 0 (0.0%) |
| $800 to $1,499 | 24 (13.0%) | 52 (65.0%) |
| $800 to $1,499 | 23 (12.4%) | 16 (20.0%) |
| Total | 185 (100.0%) | 80 (100.0%) |
Health & Disability in Coalmont
Health Insurance Coverage by Age in Coalmont
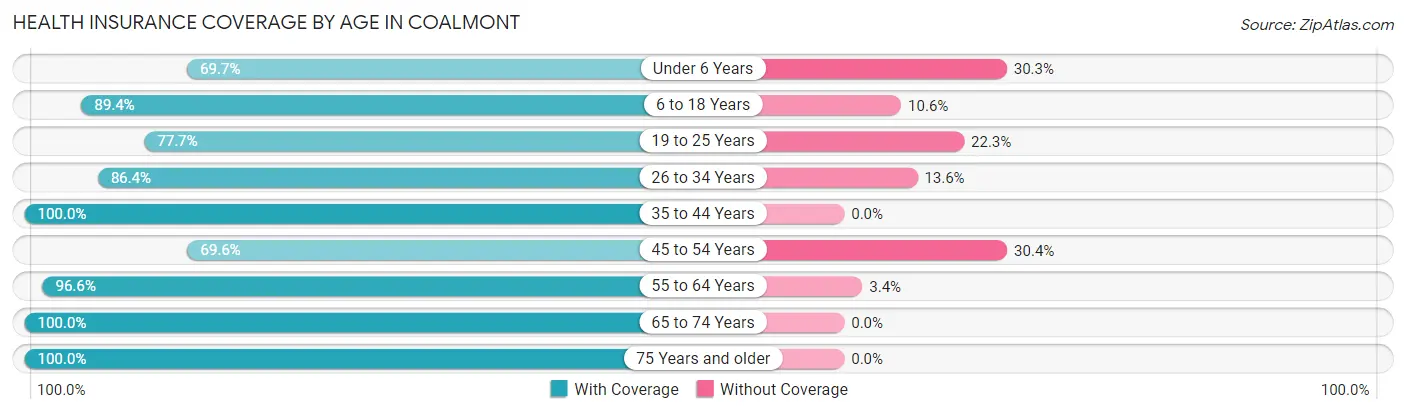
| Age Bracket | With Coverage | Without Coverage |
| Under 6 Years | 23 (69.7%) | 10 (30.3%) |
| 6 to 18 Years | 135 (89.4%) | 16 (10.6%) |
| 19 to 25 Years | 73 (77.7%) | 21 (22.3%) |
| 26 to 34 Years | 76 (86.4%) | 12 (13.6%) |
| 35 to 44 Years | 76 (100.0%) | 0 (0.0%) |
| 45 to 54 Years | 94 (69.6%) | 41 (30.4%) |
| 55 to 64 Years | 115 (96.6%) | 4 (3.4%) |
| 65 to 74 Years | 111 (100.0%) | 0 (0.0%) |
| 75 Years and older | 114 (100.0%) | 0 (0.0%) |
| Total | 817 (88.7%) | 104 (11.3%) |
Health Insurance Coverage by Citizenship Status in Coalmont
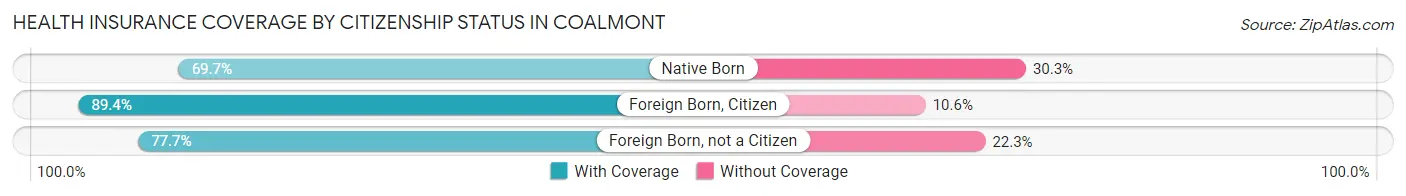
| Citizenship Status | With Coverage | Without Coverage |
| Native Born | 23 (69.7%) | 10 (30.3%) |
| Foreign Born, Citizen | 135 (89.4%) | 16 (10.6%) |
| Foreign Born, not a Citizen | 73 (77.7%) | 21 (22.3%) |
Health Insurance Coverage by Household Income in Coalmont
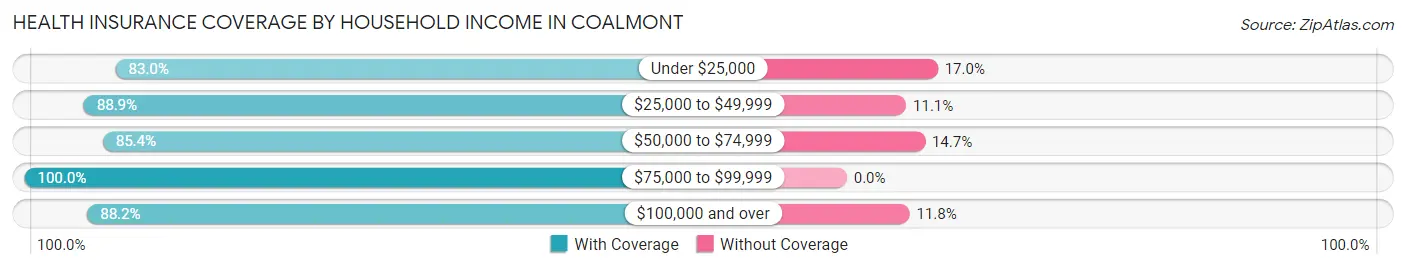
| Household Income | With Coverage | Without Coverage |
| Under $25,000 | 112 (83.0%) | 23 (17.0%) |
| $25,000 to $49,999 | 224 (88.9%) | 28 (11.1%) |
| $50,000 to $74,999 | 169 (85.4%) | 29 (14.6%) |
| $75,000 to $99,999 | 132 (100.0%) | 0 (0.0%) |
| $100,000 and over | 180 (88.2%) | 24 (11.8%) |
Public vs Private Health Insurance Coverage by Age in Coalmont
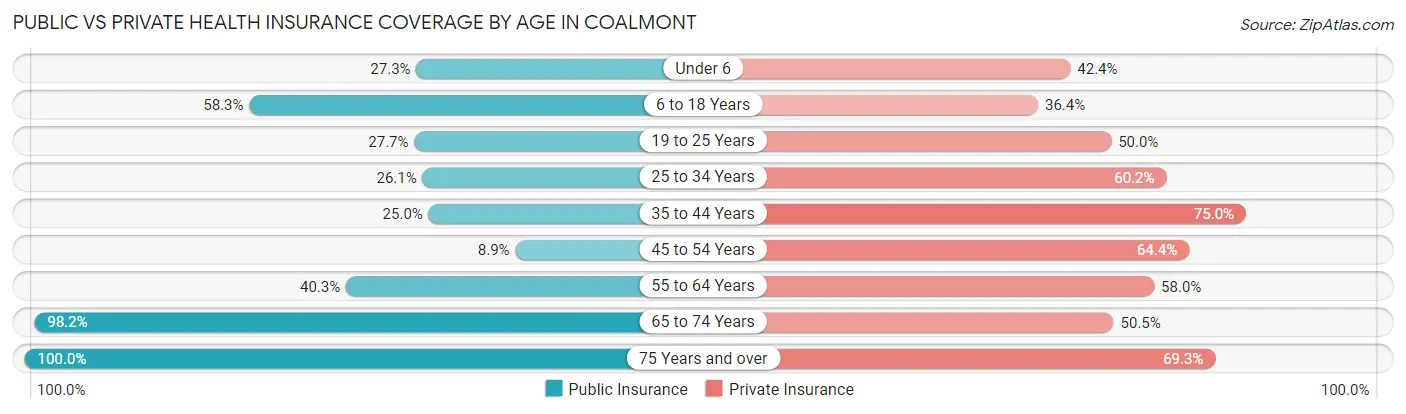
| Age Bracket | Public Insurance | Private Insurance |
| Under 6 | 9 (27.3%) | 14 (42.4%) |
| 6 to 18 Years | 88 (58.3%) | 55 (36.4%) |
| 19 to 25 Years | 26 (27.7%) | 47 (50.0%) |
| 25 to 34 Years | 23 (26.1%) | 53 (60.2%) |
| 35 to 44 Years | 19 (25.0%) | 57 (75.0%) |
| 45 to 54 Years | 12 (8.9%) | 87 (64.4%) |
| 55 to 64 Years | 48 (40.3%) | 69 (58.0%) |
| 65 to 74 Years | 109 (98.2%) | 56 (50.4%) |
| 75 Years and over | 114 (100.0%) | 79 (69.3%) |
| Total | 448 (48.6%) | 517 (56.1%) |
Disability Status by Sex by Age in Coalmont
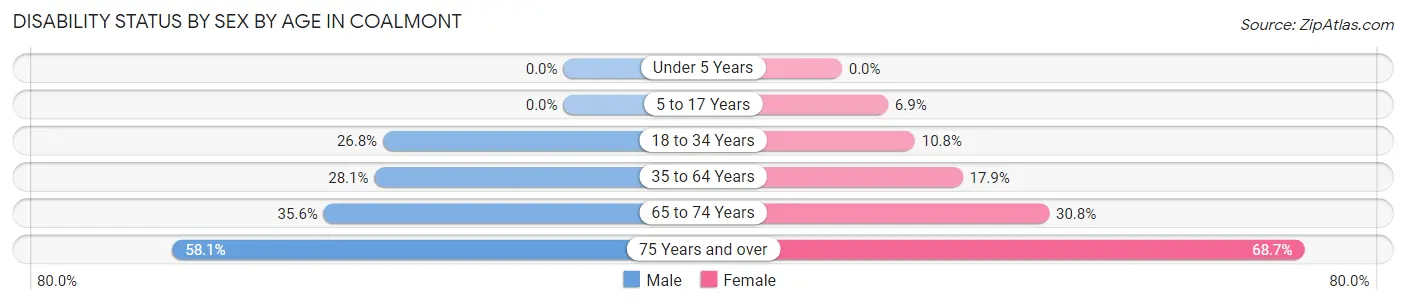
| Age Bracket | Male | Female |
| Under 5 Years | 0 (0.0%) | 0 (0.0%) |
| 5 to 17 Years | 0 (0.0%) | 5 (6.9%) |
| 18 to 34 Years | 30 (26.8%) | 9 (10.8%) |
| 35 to 64 Years | 41 (28.1%) | 33 (17.9%) |
| 65 to 74 Years | 21 (35.6%) | 16 (30.8%) |
| 75 Years and over | 18 (58.1%) | 57 (68.7%) |
Disability Class by Sex by Age in Coalmont
Disability Class: Hearing Difficulty
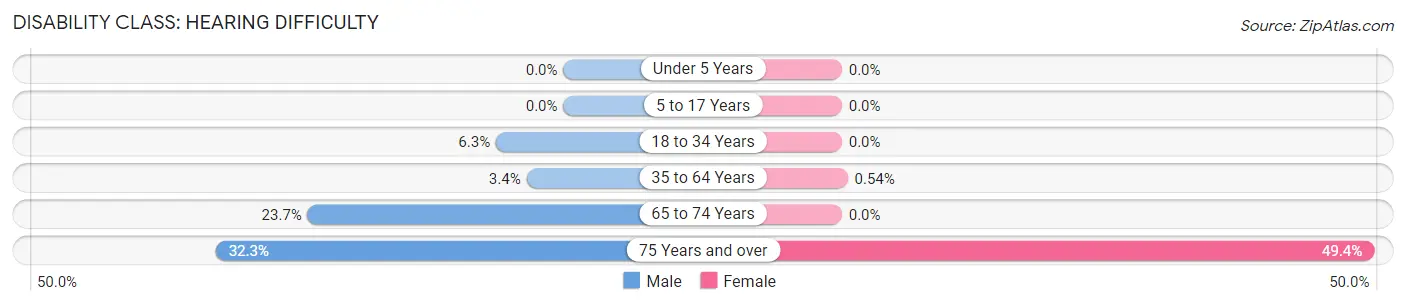
| Age Bracket | Male | Female |
| Under 5 Years | 0 (0.0%) | 0 (0.0%) |
| 5 to 17 Years | 0 (0.0%) | 0 (0.0%) |
| 18 to 34 Years | 7 (6.2%) | 0 (0.0%) |
| 35 to 64 Years | 5 (3.4%) | 1 (0.5%) |
| 65 to 74 Years | 14 (23.7%) | 0 (0.0%) |
| 75 Years and over | 10 (32.3%) | 41 (49.4%) |
Disability Class: Vision Difficulty
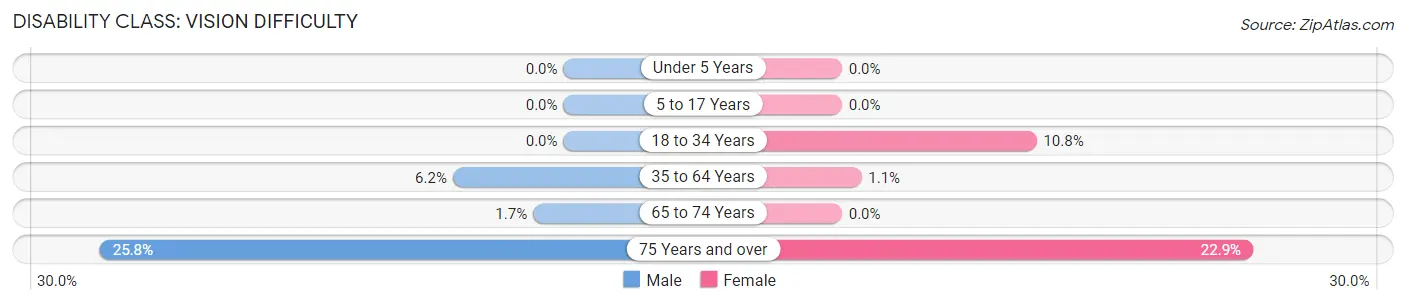
| Age Bracket | Male | Female |
| Under 5 Years | 0 (0.0%) | 0 (0.0%) |
| 5 to 17 Years | 0 (0.0%) | 0 (0.0%) |
| 18 to 34 Years | 0 (0.0%) | 9 (10.8%) |
| 35 to 64 Years | 9 (6.2%) | 2 (1.1%) |
| 65 to 74 Years | 1 (1.7%) | 0 (0.0%) |
| 75 Years and over | 8 (25.8%) | 19 (22.9%) |
Disability Class: Cognitive Difficulty
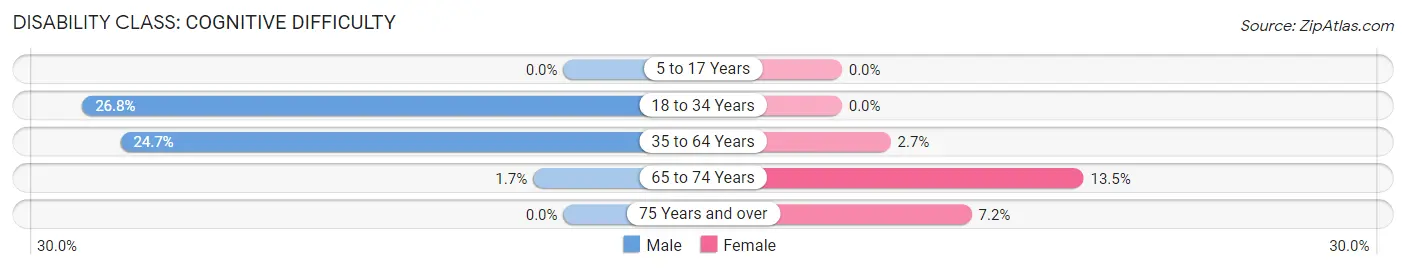
| Age Bracket | Male | Female |
| 5 to 17 Years | 0 (0.0%) | 0 (0.0%) |
| 18 to 34 Years | 30 (26.8%) | 0 (0.0%) |
| 35 to 64 Years | 36 (24.7%) | 5 (2.7%) |
| 65 to 74 Years | 1 (1.7%) | 7 (13.5%) |
| 75 Years and over | 0 (0.0%) | 6 (7.2%) |
Disability Class: Ambulatory Difficulty
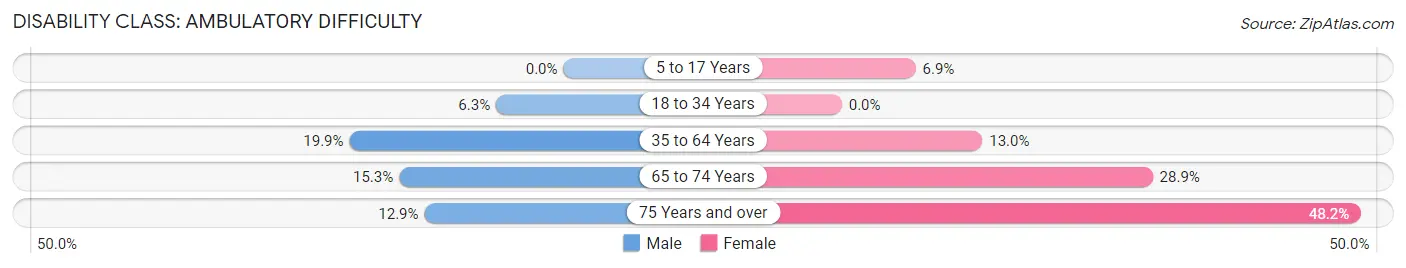
| Age Bracket | Male | Female |
| 5 to 17 Years | 0 (0.0%) | 5 (6.9%) |
| 18 to 34 Years | 7 (6.2%) | 0 (0.0%) |
| 35 to 64 Years | 29 (19.9%) | 24 (13.0%) |
| 65 to 74 Years | 9 (15.2%) | 15 (28.8%) |
| 75 Years and over | 4 (12.9%) | 40 (48.2%) |
Disability Class: Self-Care Difficulty
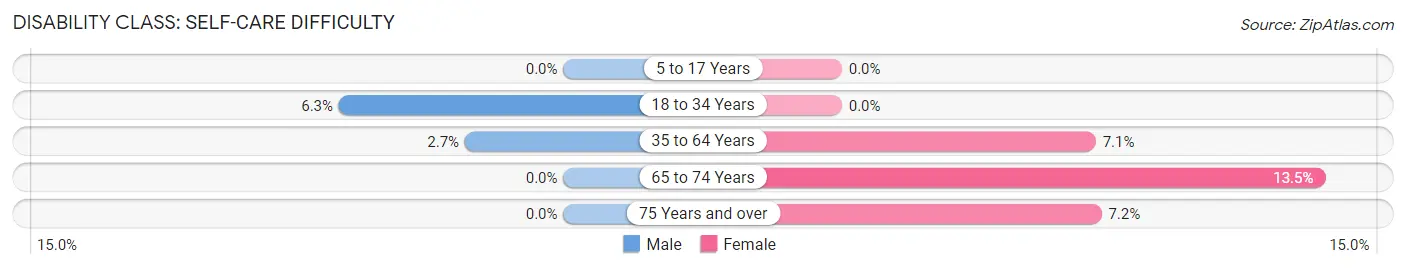
| Age Bracket | Male | Female |
| 5 to 17 Years | 0 (0.0%) | 0 (0.0%) |
| 18 to 34 Years | 7 (6.2%) | 0 (0.0%) |
| 35 to 64 Years | 4 (2.7%) | 13 (7.1%) |
| 65 to 74 Years | 0 (0.0%) | 7 (13.5%) |
| 75 Years and over | 0 (0.0%) | 6 (7.2%) |
Technology Access in Coalmont
Computing Device Access in Coalmont
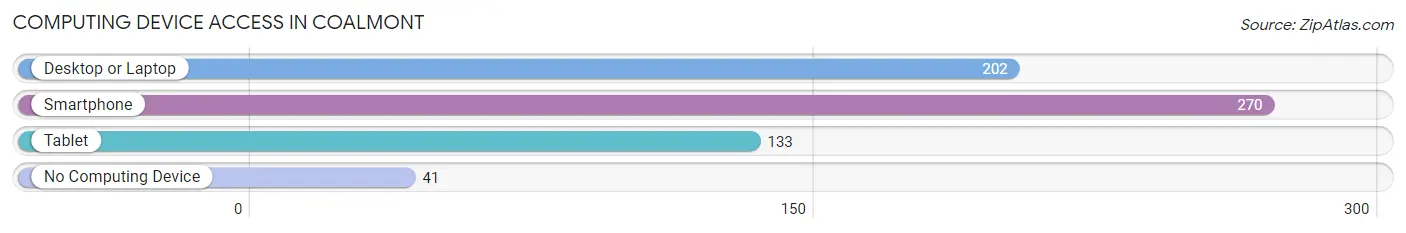
| Device Type | # Households | % Households |
| Desktop or Laptop | 202 | 64.3% |
| Smartphone | 270 | 86.0% |
| Tablet | 133 | 42.4% |
| No Computing Device | 41 | 13.1% |
| Total | 314 | 100.0% |
Internet Access in Coalmont
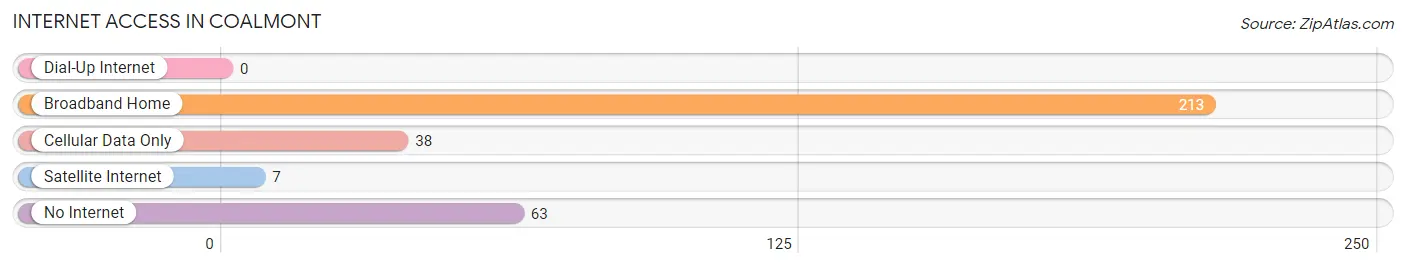
| Internet Type | # Households | % Households |
| Dial-Up Internet | 0 | 0.0% |
| Broadband Home | 213 | 67.8% |
| Cellular Data Only | 38 | 12.1% |
| Satellite Internet | 7 | 2.2% |
| No Internet | 63 | 20.1% |
| Total | 314 | 100.0% |
Coalmont Summary
Coalmont is a small town located in Grundy County, Tennessee. It is situated in the foothills of the Cumberland Plateau, approximately 50 miles southeast of Nashville. The town was founded in the late 19th century and has a population of approximately 500 people.
Geography
Coalmont is located in the foothills of the Cumberland Plateau, approximately 50 miles southeast of Nashville. The town is situated in a valley surrounded by hills and mountains. The town is located on the banks of the Elk River, which flows through the town and provides a source of recreation for the locals. The town is also located near the Sequatchie Valley, which is known for its scenic beauty and outdoor activities.
The climate in Coalmont is temperate, with hot summers and mild winters. The average temperature in the summer is around 80 degrees Fahrenheit, while the average temperature in the winter is around 40 degrees Fahrenheit. The town receives an average of 45 inches of rain per year.
Economy
The economy of Coalmont is largely based on agriculture and tourism. The town is home to several farms, which produce a variety of crops, including corn, soybeans, and hay. The town also has a number of small businesses, including restaurants, stores, and a gas station.
Tourism is an important part of the local economy. The town is home to several attractions, including the Coalmont Museum, which houses artifacts from the town’s history, and the Coalmont Country Club, which offers golfing and other recreational activities. The town also hosts several festivals throughout the year, including the Coalmont Music Festival and the Coalmont Fall Festival.
Demographics
As of the 2010 census, the population of Coalmont was 498 people. The racial makeup of the town was 97.2% White, 0.6% African American, 0.2% Native American, 0.2% Asian, 0.2% from other races, and 1.8% from two or more races. The median household income was $30,000, and the median age was 44.
The town is home to a number of churches, including the Coalmont United Methodist Church, the Coalmont Baptist Church, and the Coalmont Church of Christ. The town also has a public library, a post office, and a fire department.
Conclusion
Coalmont is a small town located in Grundy County, Tennessee. It is situated in the foothills of the Cumberland Plateau, approximately 50 miles southeast of Nashville. The town was founded in the late 19th century and has a population of approximately 500 people. The economy of Coalmont is largely based on agriculture and tourism, and the town is home to several attractions, including the Coalmont Museum and the Coalmont Country Club. The racial makeup of the town is 97.2% White, 0.6% African American, 0.2% Native American, 0.2% Asian, 0.2% from other races, and 1.8% from two or more races. The median household income was $30,000, and the median age was 44. Coalmont is a charming town with a rich history and a vibrant economy.
Common Questions
What is Per Capita Income in Coalmont?
Per Capita income in Coalmont is $21,823.
What is the Median Family Income in Coalmont?
Median Family Income in Coalmont is $59,500.
What is the Median Household income in Coalmont?
Median Household Income in Coalmont is $55,323.
What is Income or Wage Gap in Coalmont?
Income or Wage Gap in Coalmont is 32.9%.
Women in Coalmont earn 67.1 cents for every dollar earned by a man.
What is Family Income Deficit in Coalmont?
Family Income Deficit in Coalmont is $11,043.
Families that are below poverty line in Coalmont earn $11,043 less on average than the poverty threshold level.
What is Inequality or Gini Index in Coalmont?
Inequality or Gini Index in Coalmont is 0.37.
What is the Total Population of Coalmont?
Total Population of Coalmont is 921.
What is the Total Male Population of Coalmont?
Total Male Population of Coalmont is 431.
What is the Total Female Population of Coalmont?
Total Female Population of Coalmont is 490.
What is the Ratio of Males per 100 Females in Coalmont?
There are 87.96 Males per 100 Females in Coalmont.
What is the Ratio of Females per 100 Males in Coalmont?
There are 113.69 Females per 100 Males in Coalmont.
What is the Median Population Age in Coalmont?
Median Population Age in Coalmont is 47.4 Years.
What is the Average Family Size in Coalmont
Average Family Size in Coalmont is 3.6 People.
What is the Average Household Size in Coalmont
Average Household Size in Coalmont is 2.9 People.
How Large is the Labor Force in Coalmont?
There are 336 People in the Labor Forcein in Coalmont.
What is the Percentage of People in the Labor Force in Coalmont?
44.2% of People are in the Labor Force in Coalmont.
What is the Unemployment Rate in Coalmont?
Unemployment Rate in Coalmont is 4.8%.