Clarkrange, TN Map & Demographics
Clarkrange Map
Clarkrange Overview
$23,946
PER CAPITA INCOME
$46,438
AVG FAMILY INCOME
$48,538
AVG HOUSEHOLD INCOME
0.24
INEQUALITY / GINI INDEX
664
TOTAL POPULATION
476
MALE POPULATION
188
FEMALE POPULATION
253.19
MALES / 100 FEMALES
39.50
FEMALES / 100 MALES
38.6
MEDIAN AGE
3.0
AVG FAMILY SIZE
2.3
AVG HOUSEHOLD SIZE
271
LABOR FORCE [ PEOPLE ]
50.5%
PERCENT IN LABOR FORCE
Clarkrange Zip Codes
Clarkrange Area Codes
Income in Clarkrange
Income Overview in Clarkrange
Per Capita Income in Clarkrange is $23,946, while median incomes of families and households are $46,438 and $48,538 respectively.
| Characteristic | Number | Measure |
| Per Capita Income | 664 | $23,946 |
| Median Family Income | 162 | $46,438 |
| Mean Family Income | 162 | $45,741 |
| Median Household Income | 294 | $48,538 |
| Mean Household Income | 294 | $50,065 |
| Income Deficit | 162 | $0 |
| Wage / Income Gap (%) | 664 | 0.00% |
| Wage / Income Gap ($) | 664 | 100.00¢ per $1 |
| Gini / Inequality Index | 664 | 0.24 |
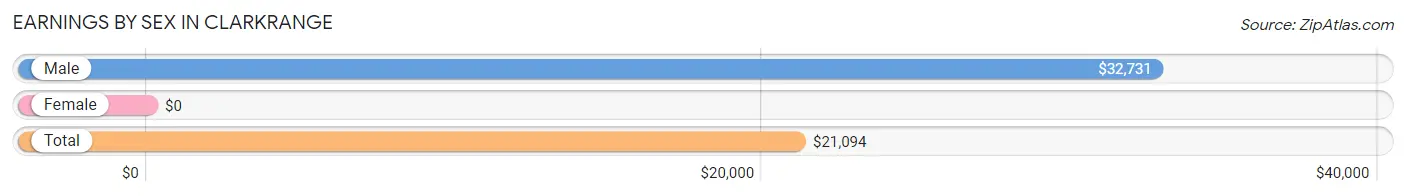
Earnings by Sex in Clarkrange
| Sex | Number | Average Earnings |
| Male | 203 (74.9%) | $32,731 |
| Female | 68 (25.1%) | $0 |
| Total | 271 (100.0%) | $21,094 |
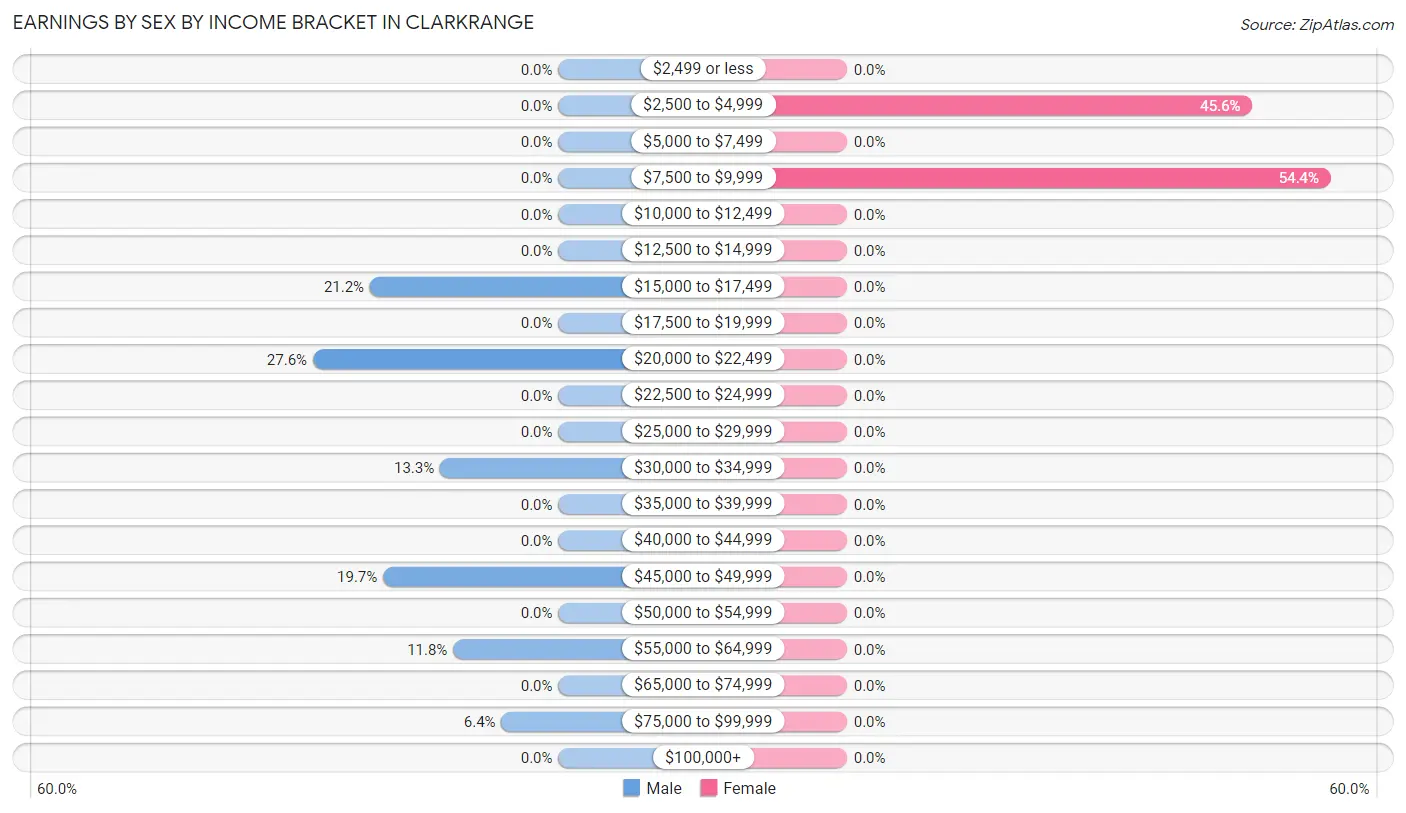
Earnings by Sex by Income Bracket in Clarkrange
The most common earnings brackets in Clarkrange are $20,000 to $22,499 for men (56 | 27.6%) and $7,500 to $9,999 for women (37 | 54.4%).
| Income | Male | Female |
| $2,499 or less | 0 (0.0%) | 0 (0.0%) |
| $2,500 to $4,999 | 0 (0.0%) | 31 (45.6%) |
| $5,000 to $7,499 | 0 (0.0%) | 0 (0.0%) |
| $7,500 to $9,999 | 0 (0.0%) | 37 (54.4%) |
| $10,000 to $12,499 | 0 (0.0%) | 0 (0.0%) |
| $12,500 to $14,999 | 0 (0.0%) | 0 (0.0%) |
| $15,000 to $17,499 | 43 (21.2%) | 0 (0.0%) |
| $17,500 to $19,999 | 0 (0.0%) | 0 (0.0%) |
| $20,000 to $22,499 | 56 (27.6%) | 0 (0.0%) |
| $22,500 to $24,999 | 0 (0.0%) | 0 (0.0%) |
| $25,000 to $29,999 | 0 (0.0%) | 0 (0.0%) |
| $30,000 to $34,999 | 27 (13.3%) | 0 (0.0%) |
| $35,000 to $39,999 | 0 (0.0%) | 0 (0.0%) |
| $40,000 to $44,999 | 0 (0.0%) | 0 (0.0%) |
| $45,000 to $49,999 | 40 (19.7%) | 0 (0.0%) |
| $50,000 to $54,999 | 0 (0.0%) | 0 (0.0%) |
| $55,000 to $64,999 | 24 (11.8%) | 0 (0.0%) |
| $65,000 to $74,999 | 0 (0.0%) | 0 (0.0%) |
| $75,000 to $99,999 | 13 (6.4%) | 0 (0.0%) |
| $100,000+ | 0 (0.0%) | 0 (0.0%) |
| Total | 203 (100.0%) | 68 (100.0%) |
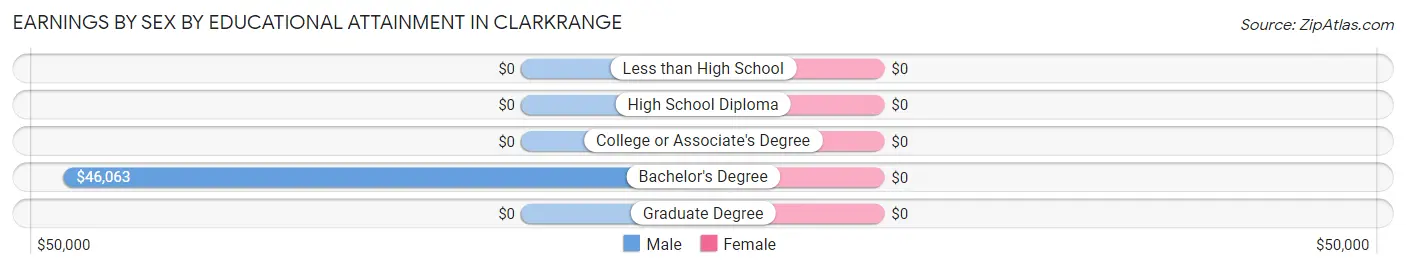
Earnings by Sex by Educational Attainment in Clarkrange
| Educational Attainment | Male Income | Female Income |
| Less than High School | - | - |
| High School Diploma | - | - |
| College or Associate's Degree | - | - |
| Bachelor's Degree | $46,063 | $0 |
| Graduate Degree | - | - |
| Total | $45,219 | $0 |
Family Income in Clarkrange
Family Income Brackets in Clarkrange
According to the Clarkrange family income data, there are 40 families falling into the $35,000 to $49,999 income range, which is the most common income bracket and makes up 24.7% of all families.
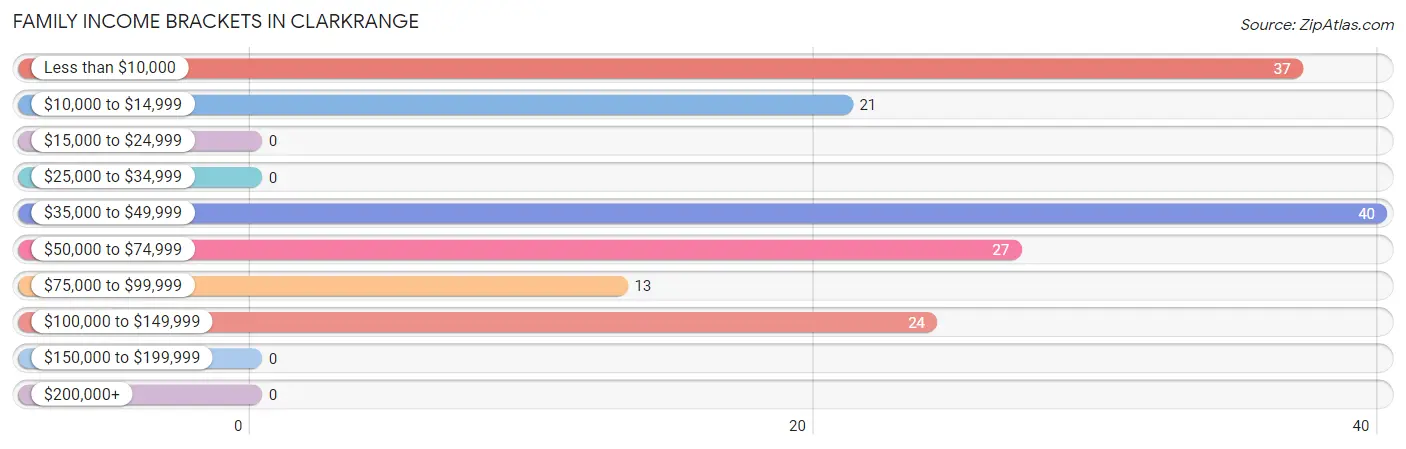
| Income Bracket | # Families | % Families |
| Less than $10,000 | 37 | 22.8% |
| $10,000 to $14,999 | 21 | 13.0% |
| $15,000 to $24,999 | 0 | 0.0% |
| $25,000 to $34,999 | 0 | 0.0% |
| $35,000 to $49,999 | 40 | 24.7% |
| $50,000 to $74,999 | 27 | 16.7% |
| $75,000 to $99,999 | 13 | 8.0% |
| $100,000 to $149,999 | 24 | 14.8% |
| $150,000 to $199,999 | 0 | 0.0% |
| $200,000+ | 0 | 0.0% |
Family Income by Famaliy Size in Clarkrange
| Income Bracket | # Families | Median Income |
| 2-Person Families | 61 (37.7%) | $0 |
| 3-Person Families | 88 (54.3%) | $0 |
| 4-Person Families | 0 (0.0%) | $0 |
| 5-Person Families | 13 (8.0%) | $0 |
| 6-Person Families | 0 (0.0%) | $0 |
| 7+ Person Families | 0 (0.0%) | $0 |
| Total | 162 (100.0%) | $46,438 |
Family Income by Number of Earners in Clarkrange
| Number of Earners | # Families | Median Income |
| No Earners | 21 (13.0%) | $0 |
| 1 Earner | 90 (55.6%) | $0 |
| 2 Earners | 24 (14.8%) | $0 |
| 3+ Earners | 27 (16.7%) | $0 |
| Total | 162 (100.0%) | $46,438 |
Household Income in Clarkrange
Household Income Brackets in Clarkrange
With 158 households falling in the category, the $35,000 to $49,999 income range is the most frequent in Clarkrange, accounting for 53.7% of all households.
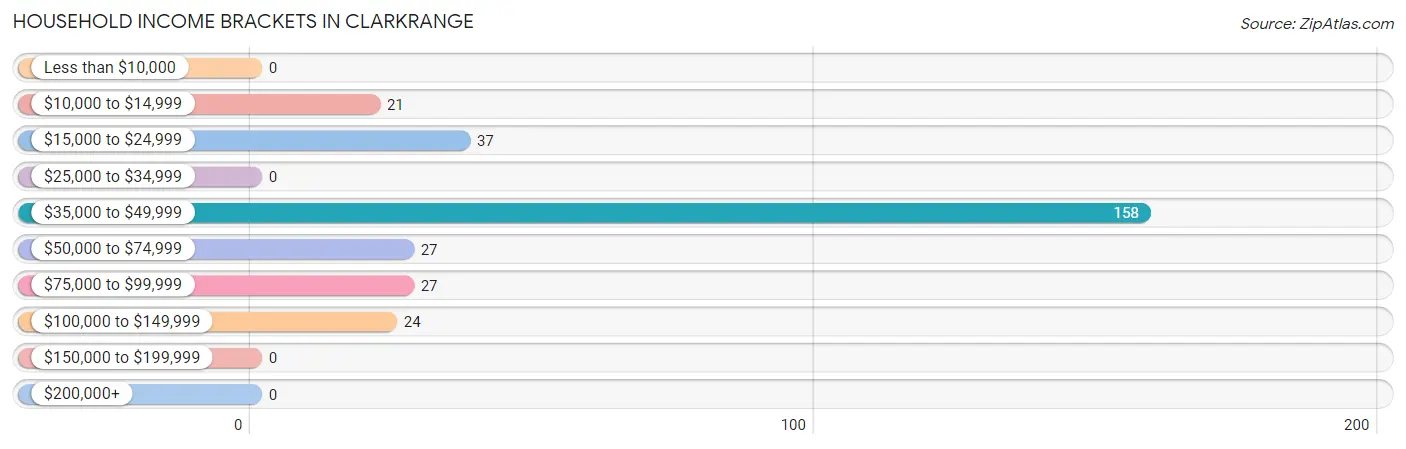
| Income Bracket | # Households | % Households |
| Less than $10,000 | 0 | 0.0% |
| $10,000 to $14,999 | 21 | 7.1% |
| $15,000 to $24,999 | 37 | 12.6% |
| $25,000 to $34,999 | 0 | 0.0% |
| $35,000 to $49,999 | 158 | 53.7% |
| $50,000 to $74,999 | 27 | 9.2% |
| $75,000 to $99,999 | 27 | 9.2% |
| $100,000 to $149,999 | 24 | 8.2% |
| $150,000 to $199,999 | 0 | 0.0% |
| $200,000+ | 0 | 0.0% |
Household Income by Householder Age in Clarkrange
The median household income in Clarkrange is $48,538, with the highest median household income of $83,462 found in the 45 to 64 years age bracket for the primary householder. A total of 64 households (21.8%) fall into this category.
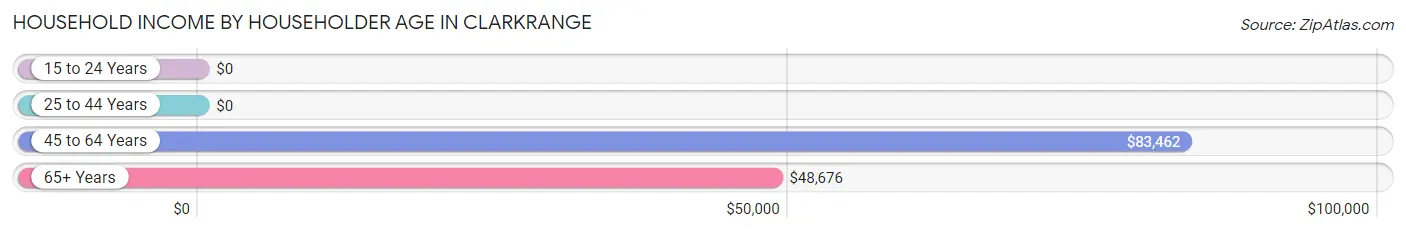
| Income Bracket | # Households | Median Income |
| 15 to 24 Years | 0 (0.0%) | $0 |
| 25 to 44 Years | 77 (26.2%) | $0 |
| 45 to 64 Years | 64 (21.8%) | $83,462 |
| 65+ Years | 153 (52.0%) | $48,676 |
| Total | 294 (100.0%) | $48,538 |
Poverty in Clarkrange
Income Below Poverty by Sex and Age in Clarkrange
With 27.7% poverty level for males and 33.5% for females among the residents of Clarkrange, 6 to 11 year old males and 25 to 34 year old females are the most vulnerable to poverty, with 66 males (88.0%) and 37 females (100.0%) in their respective age groups living below the poverty level.
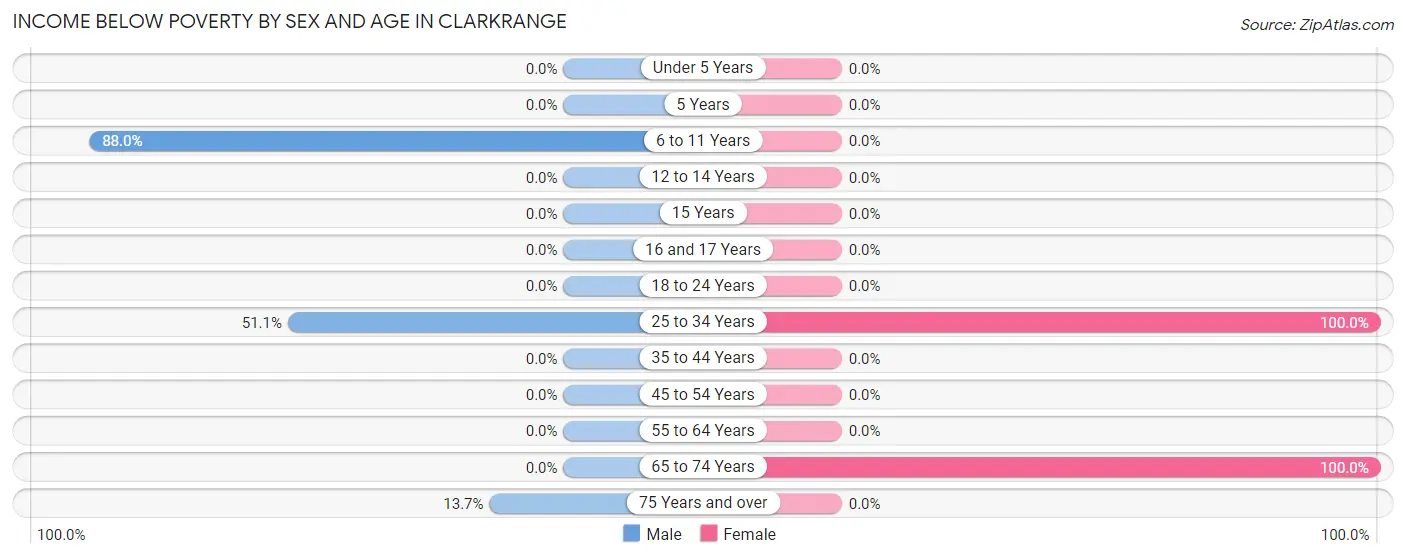
| Age Bracket | Male | Female |
| Under 5 Years | 0 (0.0%) | 0 (0.0%) |
| 5 Years | 0 (0.0%) | 0 (0.0%) |
| 6 to 11 Years | 66 (88.0%) | 0 (0.0%) |
| 12 to 14 Years | 0 (0.0%) | 0 (0.0%) |
| 15 Years | 0 (0.0%) | 0 (0.0%) |
| 16 and 17 Years | 0 (0.0%) | 0 (0.0%) |
| 18 to 24 Years | 0 (0.0%) | 0 (0.0%) |
| 25 to 34 Years | 45 (51.1%) | 37 (100.0%) |
| 35 to 44 Years | 0 (0.0%) | 0 (0.0%) |
| 45 to 54 Years | 0 (0.0%) | 0 (0.0%) |
| 55 to 64 Years | 0 (0.0%) | 0 (0.0%) |
| 65 to 74 Years | 0 (0.0%) | 26 (100.0%) |
| 75 Years and over | 21 (13.7%) | 0 (0.0%) |
| Total | 132 (27.7%) | 63 (33.5%) |
Income Above Poverty by Sex and Age in Clarkrange
According to the poverty statistics in Clarkrange, males aged 18 to 24 years and females aged under 5 years are the age groups that are most secure financially, with 100.0% of males and 100.0% of females in these age groups living above the poverty line.
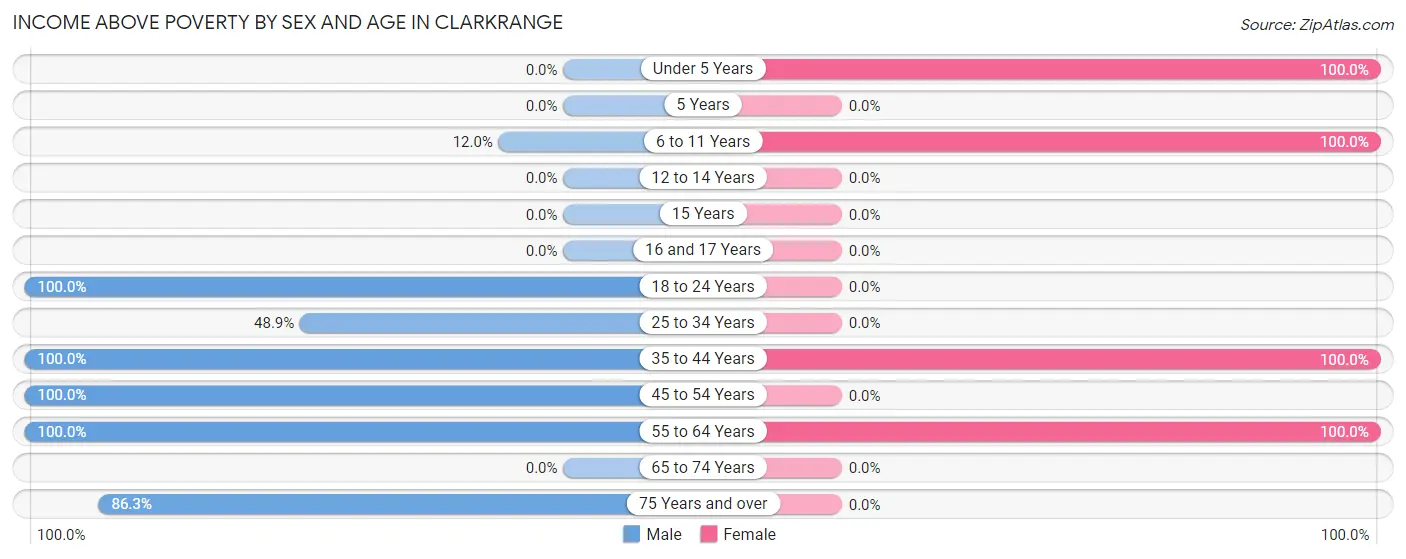
| Age Bracket | Male | Female |
| Under 5 Years | 0 (0.0%) | 19 (100.0%) |
| 5 Years | 0 (0.0%) | 0 (0.0%) |
| 6 to 11 Years | 9 (12.0%) | 33 (100.0%) |
| 12 to 14 Years | 0 (0.0%) | 0 (0.0%) |
| 15 Years | 0 (0.0%) | 0 (0.0%) |
| 16 and 17 Years | 0 (0.0%) | 0 (0.0%) |
| 18 to 24 Years | 56 (100.0%) | 0 (0.0%) |
| 25 to 34 Years | 43 (48.9%) | 0 (0.0%) |
| 35 to 44 Years | 40 (100.0%) | 14 (100.0%) |
| 45 to 54 Years | 13 (100.0%) | 0 (0.0%) |
| 55 to 64 Years | 51 (100.0%) | 59 (100.0%) |
| 65 to 74 Years | 0 (0.0%) | 0 (0.0%) |
| 75 Years and over | 132 (86.3%) | 0 (0.0%) |
| Total | 344 (72.3%) | 125 (66.5%) |
Income Below Poverty Among Married-Couple Families in Clarkrange
The poverty statistics for married-couple families in Clarkrange show that 24.7% or 21 of the total 85 families live below the poverty line. Families with no children have the highest poverty rate of 29.2%, comprising of 21 families. On the other hand, families with 3 or 4 children have the lowest poverty rate of 0.0%, which includes 0 families.
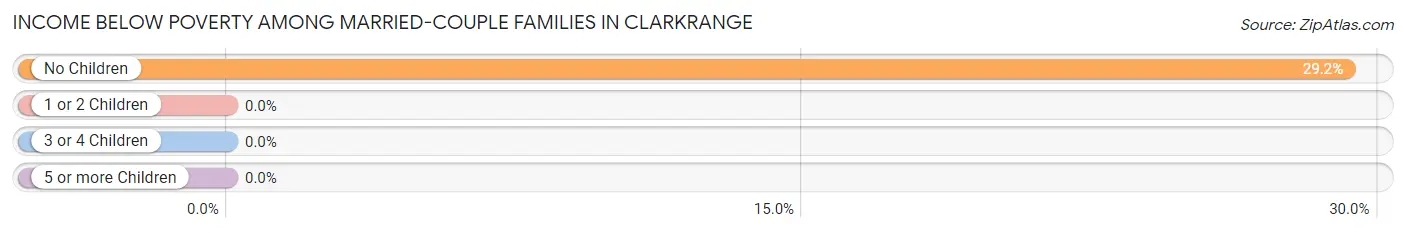
| Children | Above Poverty | Below Poverty |
| No Children | 51 (70.8%) | 21 (29.2%) |
| 1 or 2 Children | 0 (0.0%) | 0 (0.0%) |
| 3 or 4 Children | 13 (100.0%) | 0 (0.0%) |
| 5 or more Children | 0 (0.0%) | 0 (0.0%) |
| Total | 64 (75.3%) | 21 (24.7%) |
Income Below Poverty Among Single-Parent Households in Clarkrange
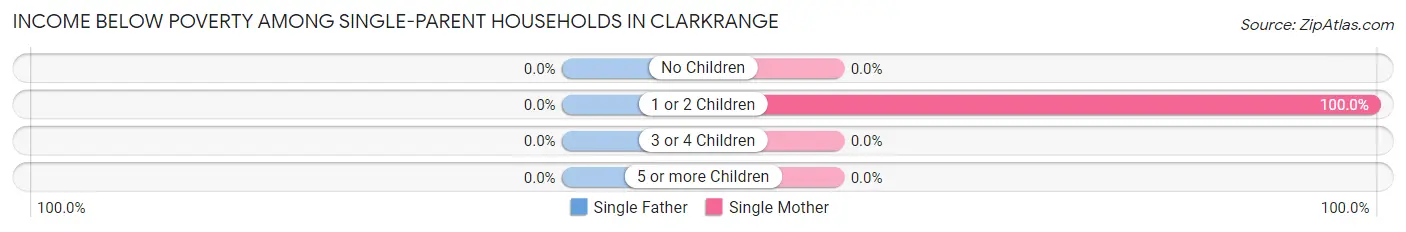
| Children | Single Father | Single Mother |
| No Children | 0 (0.0%) | 0 (0.0%) |
| 1 or 2 Children | 0 (0.0%) | 37 (100.0%) |
| 3 or 4 Children | 0 (0.0%) | 0 (0.0%) |
| 5 or more Children | 0 (0.0%) | 0 (0.0%) |
| Total | 0 (0.0%) | 37 (100.0%) |
Income Below Poverty Among Married-Couple vs Single-Parent Households in Clarkrange
The poverty data for Clarkrange shows that 21 of the married-couple family households (24.7%) and 37 of the single-parent households (48.0%) are living below the poverty level. Within the married-couple family households, those with no children have the highest poverty rate, with 21 households (29.2%) falling below the poverty line. Among the single-parent households, those with 1 or 2 children have the highest poverty rate, with 37 household (48.0%) living below poverty.
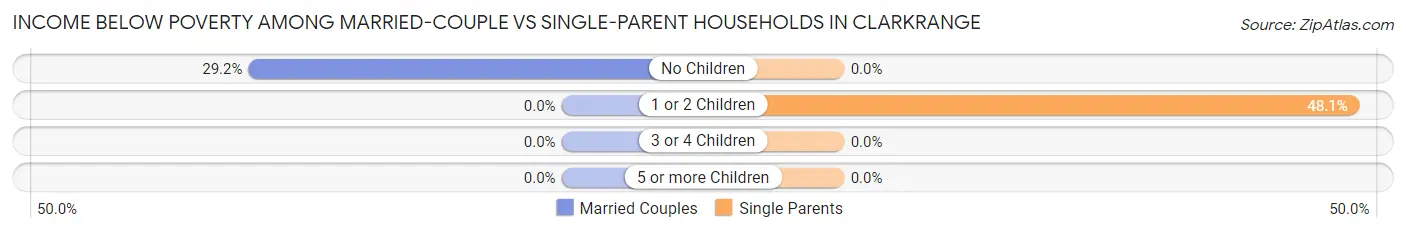
| Children | Married-Couple Families | Single-Parent Households |
| No Children | 21 (29.2%) | 0 (0.0%) |
| 1 or 2 Children | 0 (0.0%) | 37 (48.0%) |
| 3 or 4 Children | 0 (0.0%) | 0 (0.0%) |
| 5 or more Children | 0 (0.0%) | 0 (0.0%) |
| Total | 21 (24.7%) | 37 (48.0%) |
Race in Clarkrange
The most populous races in Clarkrange are , and White / Caucasian (664 | 100.0%).
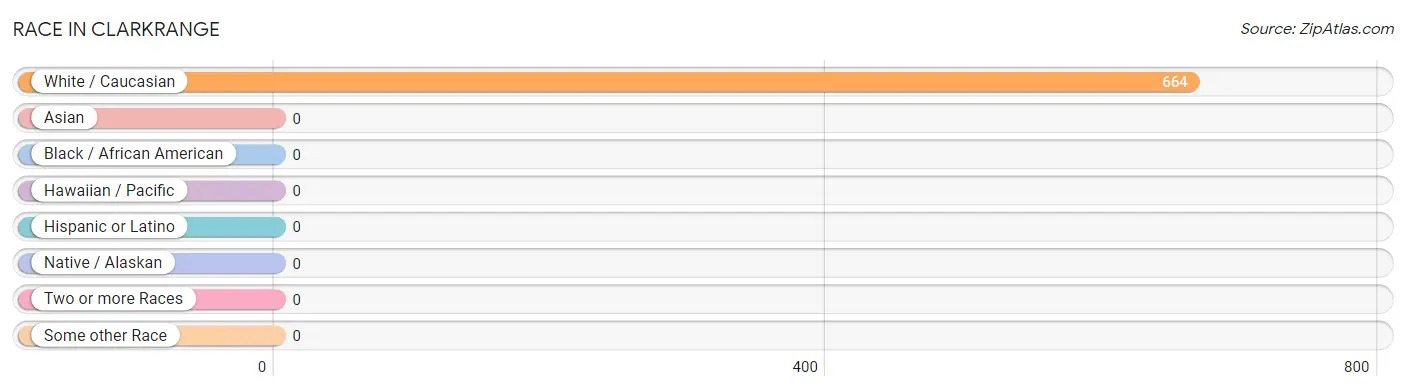
| Race | # Population | % Population |
| Asian | 0 | 0.0% |
| Black / African American | 0 | 0.0% |
| Hawaiian / Pacific | 0 | 0.0% |
| Hispanic or Latino | 0 | 0.0% |
| Native / Alaskan | 0 | 0.0% |
| White / Caucasian | 664 | 100.0% |
| Two or more Races | 0 | 0.0% |
| Some other Race | 0 | 0.0% |
| Total | 664 | 100.0% |
Ancestry in Clarkrange
The most populous ancestries reported in Clarkrange are English (368 | 55.4%), Scotch-Irish (118 | 17.8%), and German (38 | 5.7%), together accounting for 78.9% of all Clarkrange residents.
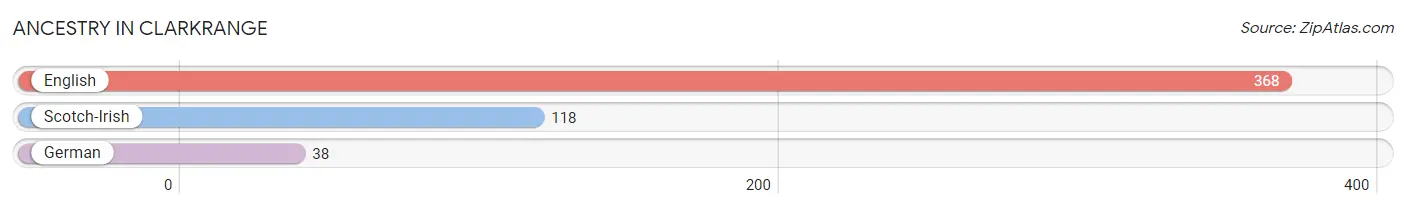
| Ancestry | # Population | % Population |
| English | 368 | 55.4% |
| German | 38 | 5.7% |
| Scotch-Irish | 118 | 17.8% | View All 3 Rows |
Immigrants in Clarkrange

| Immigration Origin | # Population | % Population | View All 0 Rows |
Sex and Age in Clarkrange
Sex and Age in Clarkrange
The most populous age groups in Clarkrange are 85 Years and over (118 | 24.8%) for men and 25 to 29 Years (37 | 19.7%) for women.
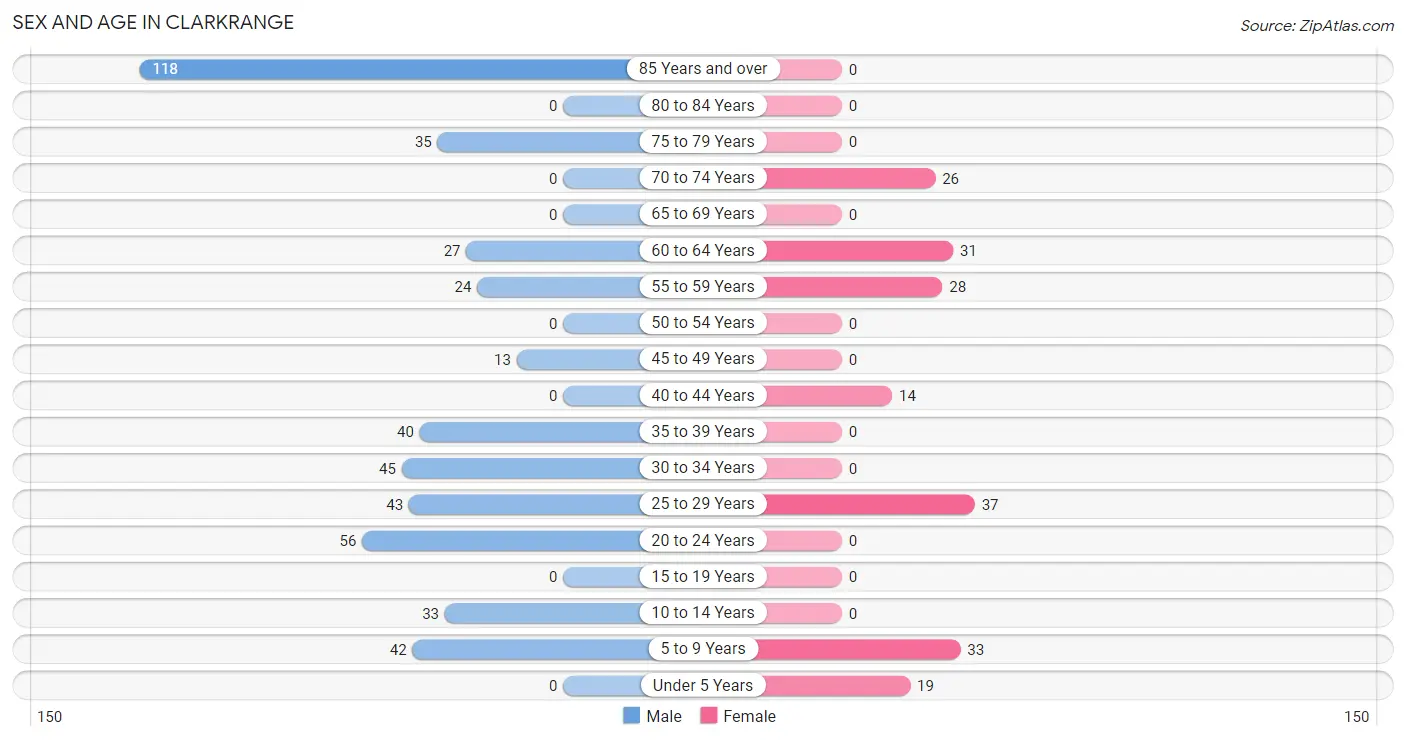
| Age Bracket | Male | Female |
| Under 5 Years | 0 (0.0%) | 19 (10.1%) |
| 5 to 9 Years | 42 (8.8%) | 33 (17.5%) |
| 10 to 14 Years | 33 (6.9%) | 0 (0.0%) |
| 15 to 19 Years | 0 (0.0%) | 0 (0.0%) |
| 20 to 24 Years | 56 (11.8%) | 0 (0.0%) |
| 25 to 29 Years | 43 (9.0%) | 37 (19.7%) |
| 30 to 34 Years | 45 (9.5%) | 0 (0.0%) |
| 35 to 39 Years | 40 (8.4%) | 0 (0.0%) |
| 40 to 44 Years | 0 (0.0%) | 14 (7.4%) |
| 45 to 49 Years | 13 (2.7%) | 0 (0.0%) |
| 50 to 54 Years | 0 (0.0%) | 0 (0.0%) |
| 55 to 59 Years | 24 (5.0%) | 28 (14.9%) |
| 60 to 64 Years | 27 (5.7%) | 31 (16.5%) |
| 65 to 69 Years | 0 (0.0%) | 0 (0.0%) |
| 70 to 74 Years | 0 (0.0%) | 26 (13.8%) |
| 75 to 79 Years | 35 (7.3%) | 0 (0.0%) |
| 80 to 84 Years | 0 (0.0%) | 0 (0.0%) |
| 85 Years and over | 118 (24.8%) | 0 (0.0%) |
| Total | 476 (100.0%) | 188 (100.0%) |
Families and Households in Clarkrange
Median Family Size in Clarkrange
The median family size in Clarkrange is 3.01 persons per family, with married-couple families (85 | 52.5%) accounting for the largest median family size of 3.78 persons per family. On the other hand, single male/father families (40 | 24.7%) represent the smallest median family size with 1.58 persons per family.
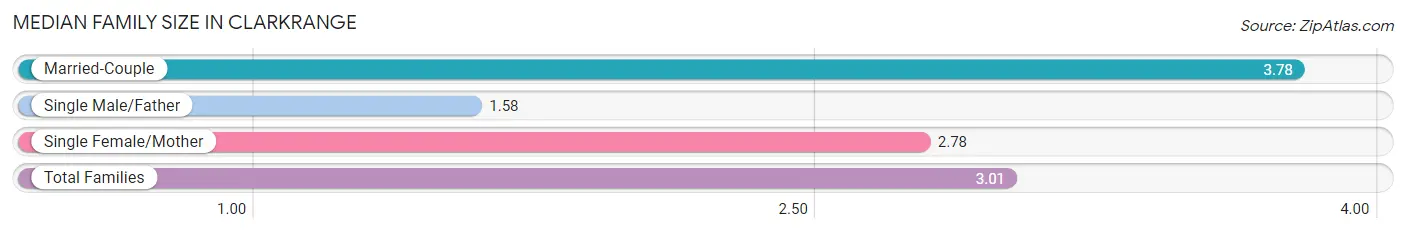
| Family Type | # Families | Family Size |
| Married-Couple | 85 (52.5%) | 3.78 |
| Single Male/Father | 40 (24.7%) | 1.58 |
| Single Female/Mother | 37 (22.8%) | 2.78 |
| Total Families | 162 (100.0%) | 3.01 |
Median Household Size in Clarkrange
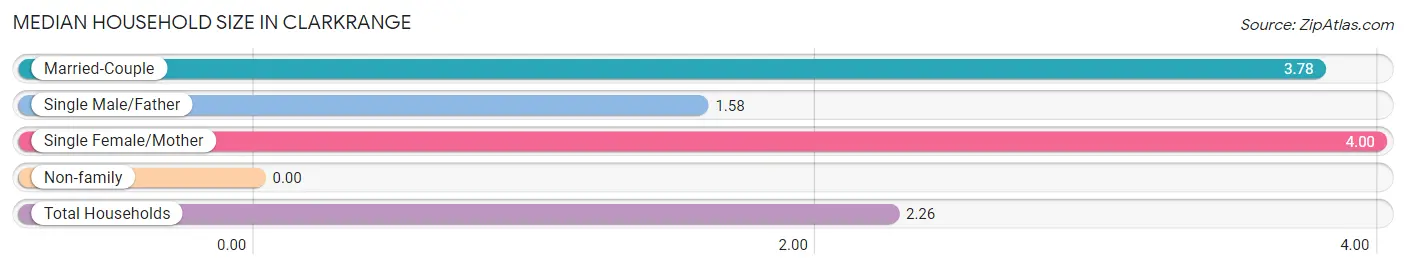
| Household Type | # Households | Household Size |
| Married-Couple | 85 (28.9%) | 3.78 |
| Single Male/Father | 40 (13.6%) | 1.58 |
| Single Female/Mother | 37 (12.6%) | 4.00 |
| Non-family | 132 (44.9%) | - |
| Total Households | 294 (100.0%) | 2.26 |
Household Size by Marriage Status in Clarkrange
Out of a total of 294 households in Clarkrange, 162 (55.1%) are family households, while 132 (44.9%) are nonfamily households. The most numerous type of family households are 2-person households, comprising 61, and the most common type of nonfamily households are 1-person households, comprising 132.
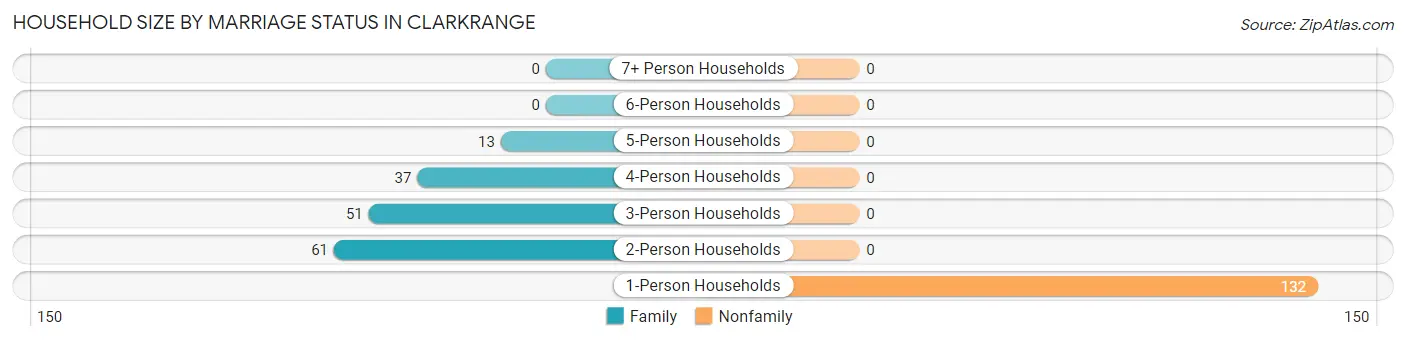
| Household Size | Family Households | Nonfamily Households |
| 1-Person Households | - | 132 (44.9%) |
| 2-Person Households | 61 (20.7%) | 0 (0.0%) |
| 3-Person Households | 51 (17.3%) | 0 (0.0%) |
| 4-Person Households | 37 (12.6%) | 0 (0.0%) |
| 5-Person Households | 13 (4.4%) | 0 (0.0%) |
| 6-Person Households | 0 (0.0%) | 0 (0.0%) |
| 7+ Person Households | 0 (0.0%) | 0 (0.0%) |
| Total | 162 (55.1%) | 132 (44.9%) |
Female Fertility in Clarkrange
Fertility by Age in Clarkrange
| Age Bracket | Women with Births | Births / 1,000 Women |
| 15 to 19 years | 0 (0.0%) | 0.0 |
| 20 to 34 years | 0 (0.0%) | 0.0 |
| 35 to 50 years | 0 (0.0%) | 0.0 |
| Total | 0 (0.0%) | 0.0 |
Fertility by Age by Marriage Status in Clarkrange
| Age Bracket | Married | Unmarried |
| 15 to 19 years | 0 (0.0%) | 0 (0.0%) |
| 20 to 34 years | 0 (0.0%) | 0 (0.0%) |
| 35 to 50 years | 0 (0.0%) | 0 (0.0%) |
| Total | 0 (0.0%) | 0 (0.0%) |
Fertility by Education in Clarkrange
| Educational Attainment | Women with Births | Births / 1,000 Women |
| Less than High School | 0 (0.0%) | 0.0 |
| High School Diploma | 0 (0.0%) | 0.0 |
| College or Associate's Degree | 0 (0.0%) | 0.0 |
| Bachelor's Degree | 0 (0.0%) | 0.0 |
| Graduate Degree | 0 (0.0%) | 0.0 |
| Total | 0 (0.0%) | 0.0 |
Fertility by Education by Marriage Status in Clarkrange
| Educational Attainment | Married | Unmarried |
| Less than High School | 0 (0.0%) | 0 (0.0%) |
| High School Diploma | 0 (0.0%) | 0 (0.0%) |
| College or Associate's Degree | 0 (0.0%) | 0 (0.0%) |
| Bachelor's Degree | 0 (0.0%) | 0 (0.0%) |
| Graduate Degree | 0 (0.0%) | 0 (0.0%) |
| Total | 0 (0.0%) | 0 (0.0%) |
Employment Characteristics in Clarkrange
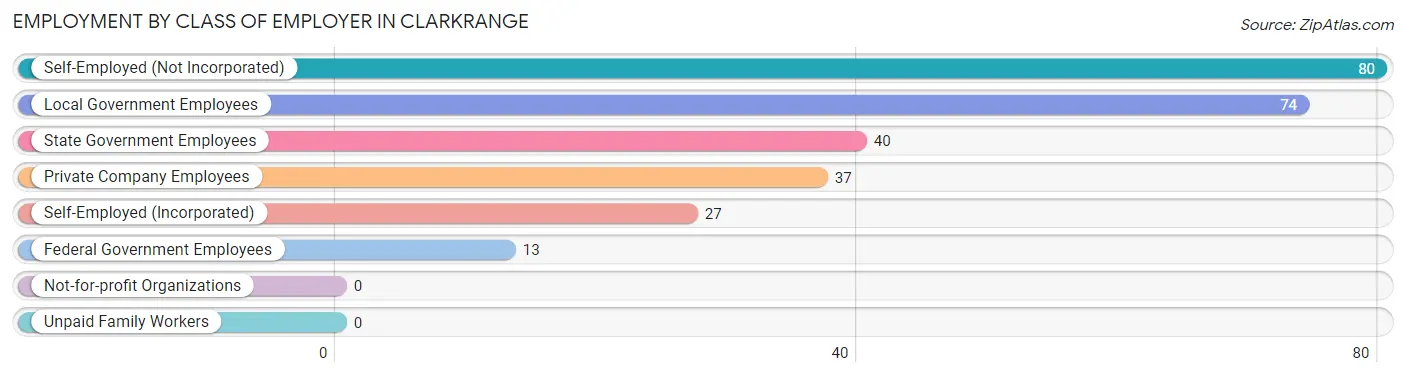
Employment by Class of Employer in Clarkrange
Among the 271 employed individuals in Clarkrange, self-employed (not incorporated) (80 | 29.5%), local government employees (74 | 27.3%), and state government employees (40 | 14.8%) make up the most common classes of employment.
| Employer Class | # Employees | % Employees |
| Private Company Employees | 37 | 13.7% |
| Self-Employed (Incorporated) | 27 | 10.0% |
| Self-Employed (Not Incorporated) | 80 | 29.5% |
| Not-for-profit Organizations | 0 | 0.0% |
| Local Government Employees | 74 | 27.3% |
| State Government Employees | 40 | 14.8% |
| Federal Government Employees | 13 | 4.8% |
| Unpaid Family Workers | 0 | 0.0% |
| Total | 271 | 100.0% |
Employment Status by Age in Clarkrange
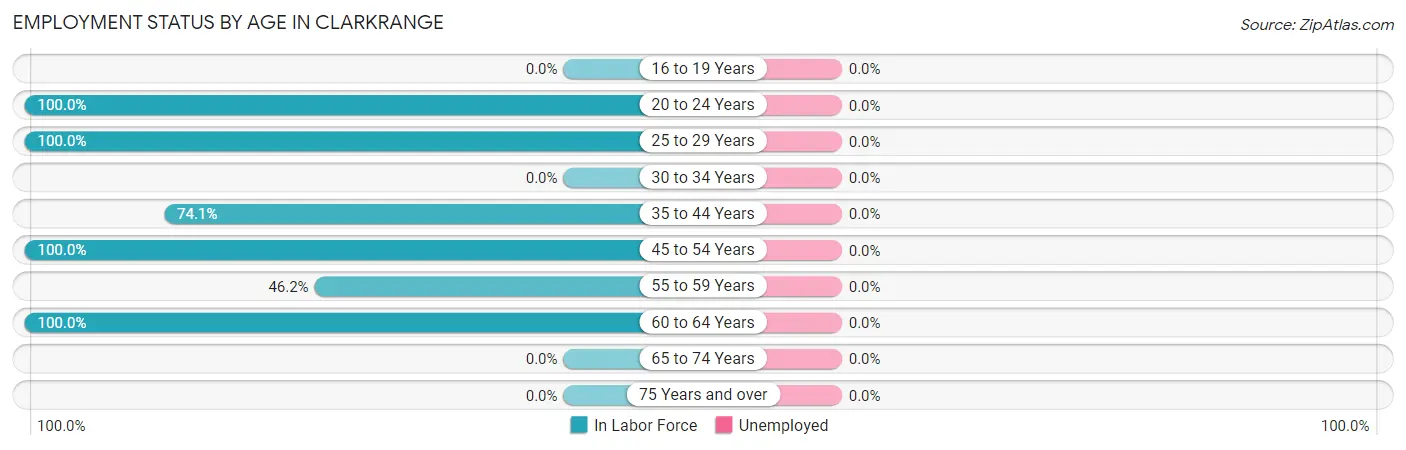
| Age Bracket | In Labor Force | Unemployed |
| 16 to 19 Years | 0 (0.0%) | 0 (0.0%) |
| 20 to 24 Years | 56 (100.0%) | 0 (0.0%) |
| 25 to 29 Years | 80 (100.0%) | 0 (0.0%) |
| 30 to 34 Years | 0 (0.0%) | 0 (0.0%) |
| 35 to 44 Years | 40 (74.1%) | 0 (0.0%) |
| 45 to 54 Years | 13 (100.0%) | 0 (0.0%) |
| 55 to 59 Years | 24 (46.2%) | 0 (0.0%) |
| 60 to 64 Years | 58 (100.0%) | 0 (0.0%) |
| 65 to 74 Years | 0 (0.0%) | 0 (0.0%) |
| 75 Years and over | 0 (0.0%) | 0 (0.0%) |
| Total | 271 (50.5%) | 0 (0.0%) |
Employment Status by Educational Attainment in Clarkrange
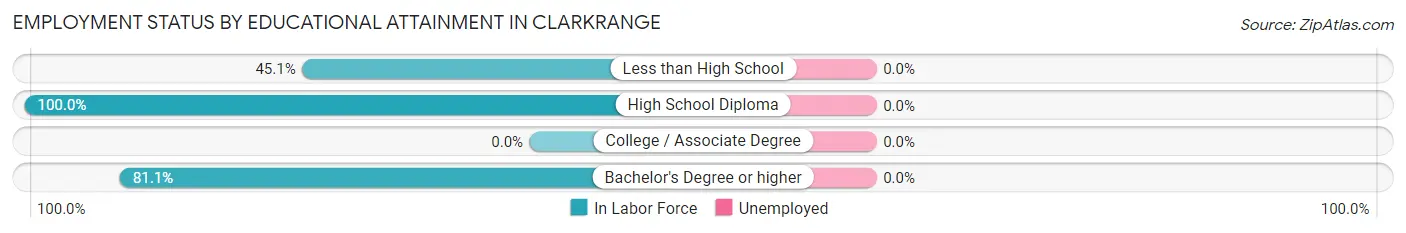
| Educational Attainment | In Labor Force | Unemployed |
| Less than High School | 37 (45.1%) | 0 (0.0%) |
| High School Diploma | 58 (100.0%) | 0 (0.0%) |
| College / Associate Degree | 0 (0.0%) | 0 (0.0%) |
| Bachelor's Degree or higher | 120 (81.1%) | 0 (0.0%) |
| Total | 215 (71.2%) | 0 (0.0%) |
Employment Occupations by Sex in Clarkrange
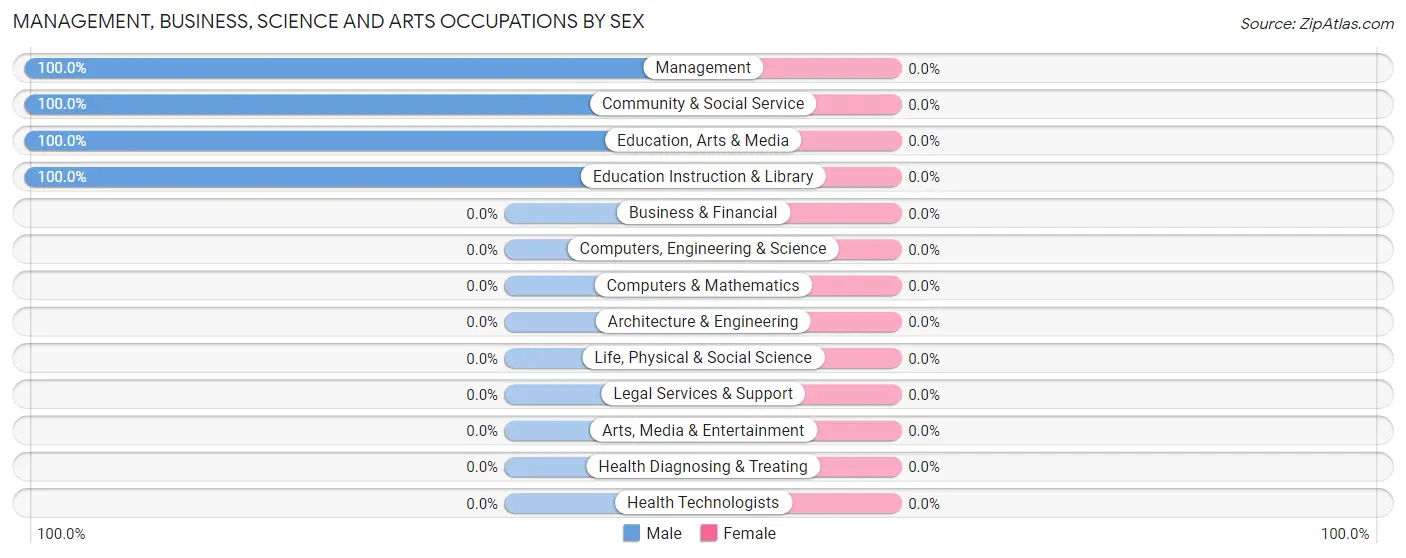
Management, Business, Science and Arts Occupations
The most common Management, Business, Science and Arts occupations in Clarkrange are Management (107 | 39.5%), Community & Social Service (83 | 30.6%), Education Instruction & Library (43 | 15.9%), and Education, Arts & Media (40 | 14.8%).
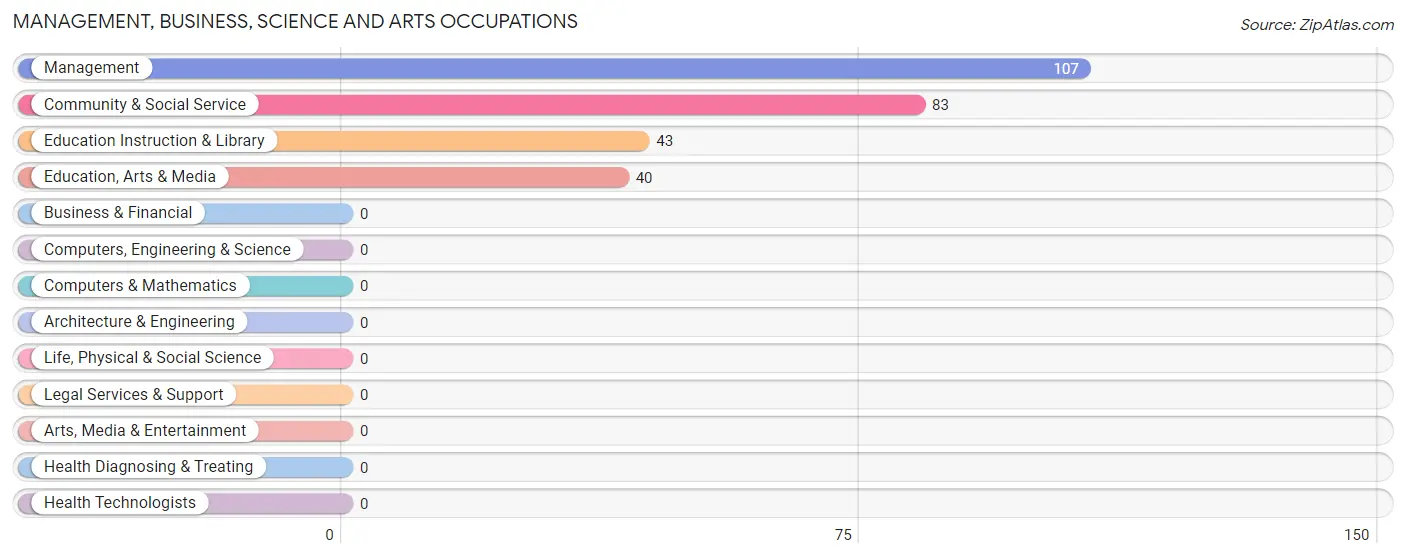
Management, Business, Science and Arts Occupations by Sex
| Occupation | Male | Female |
| Management | 107 (100.0%) | 0 (0.0%) |
| Business & Financial | 0 (0.0%) | 0 (0.0%) |
| Computers, Engineering & Science | 0 (0.0%) | 0 (0.0%) |
| Computers & Mathematics | 0 (0.0%) | 0 (0.0%) |
| Architecture & Engineering | 0 (0.0%) | 0 (0.0%) |
| Life, Physical & Social Science | 0 (0.0%) | 0 (0.0%) |
| Community & Social Service | 83 (100.0%) | 0 (0.0%) |
| Education, Arts & Media | 40 (100.0%) | 0 (0.0%) |
| Legal Services & Support | 0 (0.0%) | 0 (0.0%) |
| Education Instruction & Library | 43 (100.0%) | 0 (0.0%) |
| Arts, Media & Entertainment | 0 (0.0%) | 0 (0.0%) |
| Health Diagnosing & Treating | 0 (0.0%) | 0 (0.0%) |
| Health Technologists | 0 (0.0%) | 0 (0.0%) |
| Total (Category) | 190 (100.0%) | 0 (0.0%) |
| Total (Overall) | 203 (74.9%) | 68 (25.1%) |
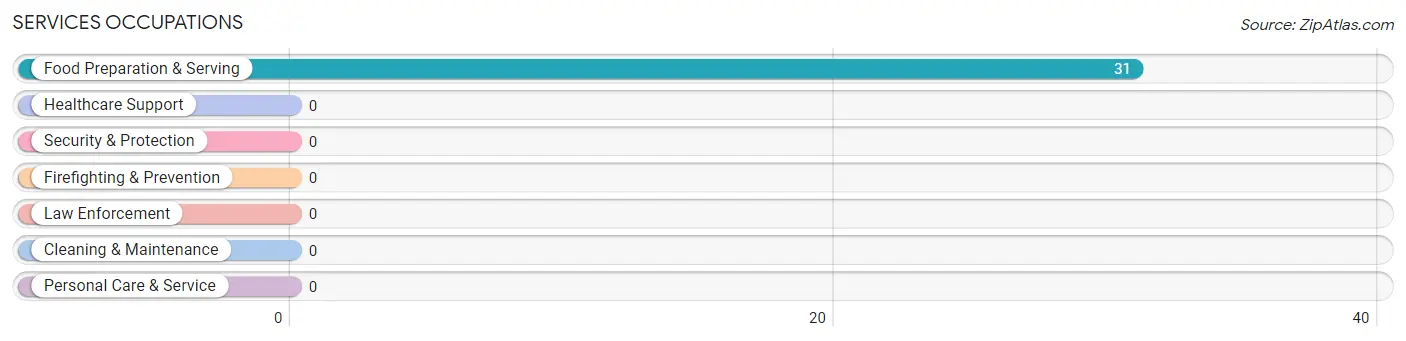
Services Occupations
The most common Services occupations in Clarkrange are , and Food Preparation & Serving (31 | 11.4%).
Services Occupations by Sex
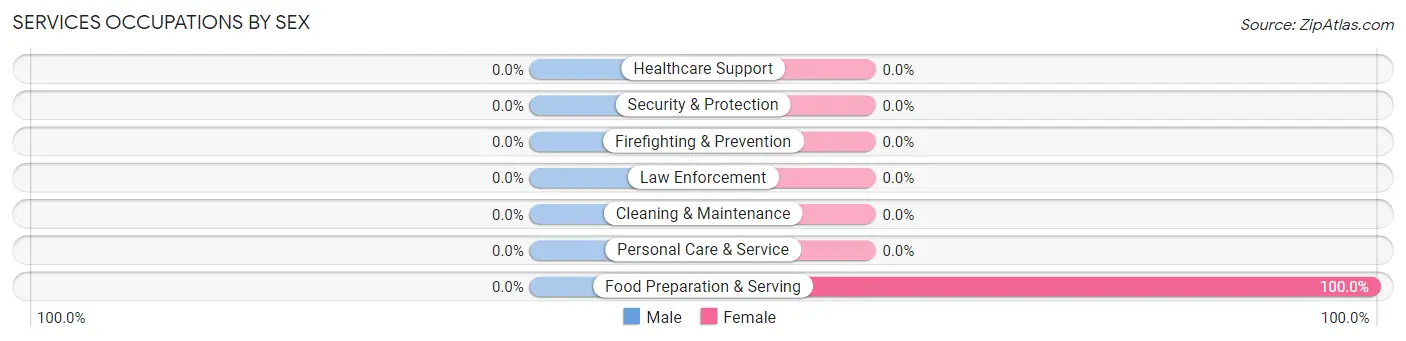
| Occupation | Male | Female |
| Healthcare Support | 0 (0.0%) | 0 (0.0%) |
| Security & Protection | 0 (0.0%) | 0 (0.0%) |
| Firefighting & Prevention | 0 (0.0%) | 0 (0.0%) |
| Law Enforcement | 0 (0.0%) | 0 (0.0%) |
| Food Preparation & Serving | 0 (0.0%) | 31 (100.0%) |
| Cleaning & Maintenance | 0 (0.0%) | 0 (0.0%) |
| Personal Care & Service | 0 (0.0%) | 0 (0.0%) |
| Total (Category) | 0 (0.0%) | 31 (100.0%) |
| Total (Overall) | 203 (74.9%) | 68 (25.1%) |
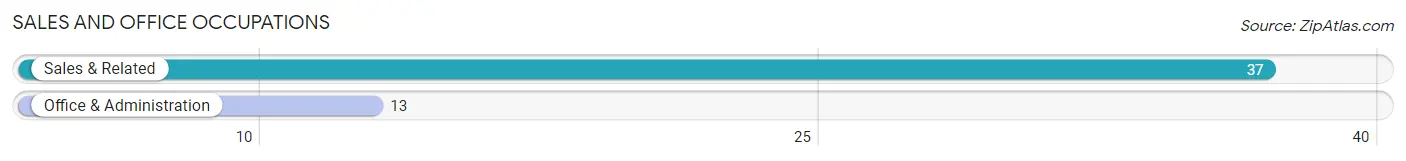
Sales and Office Occupations
The most common Sales and Office occupations in Clarkrange are Sales & Related (37 | 13.7%), and Office & Administration (13 | 4.8%).
Sales and Office Occupations by Sex

| Occupation | Male | Female |
| Sales & Related | 0 (0.0%) | 37 (100.0%) |
| Office & Administration | 13 (100.0%) | 0 (0.0%) |
| Total (Category) | 13 (26.0%) | 37 (74.0%) |
| Total (Overall) | 203 (74.9%) | 68 (25.1%) |
Natural Resources, Construction and Maintenance Occupations
Natural Resources, Construction and Maintenance Occupations by Sex
| Occupation | Male | Female |
| Farming, Fishing & Forestry | 0 (0.0%) | 0 (0.0%) |
| Construction & Extraction | 0 (0.0%) | 0 (0.0%) |
| Installation, Maintenance & Repair | 0 (0.0%) | 0 (0.0%) |
| Total (Category) | 0 (0.0%) | 0 (0.0%) |
| Total (Overall) | 203 (74.9%) | 68 (25.1%) |
Production, Transportation and Moving Occupations
Production, Transportation and Moving Occupations by Sex
| Occupation | Male | Female |
| Production | 0 (0.0%) | 0 (0.0%) |
| Transportation | 0 (0.0%) | 0 (0.0%) |
| Material Moving | 0 (0.0%) | 0 (0.0%) |
| Total (Category) | 0 (0.0%) | 0 (0.0%) |
| Total (Overall) | 203 (74.9%) | 68 (25.1%) |
Employment Industries by Sex in Clarkrange
Employment Industries in Clarkrange
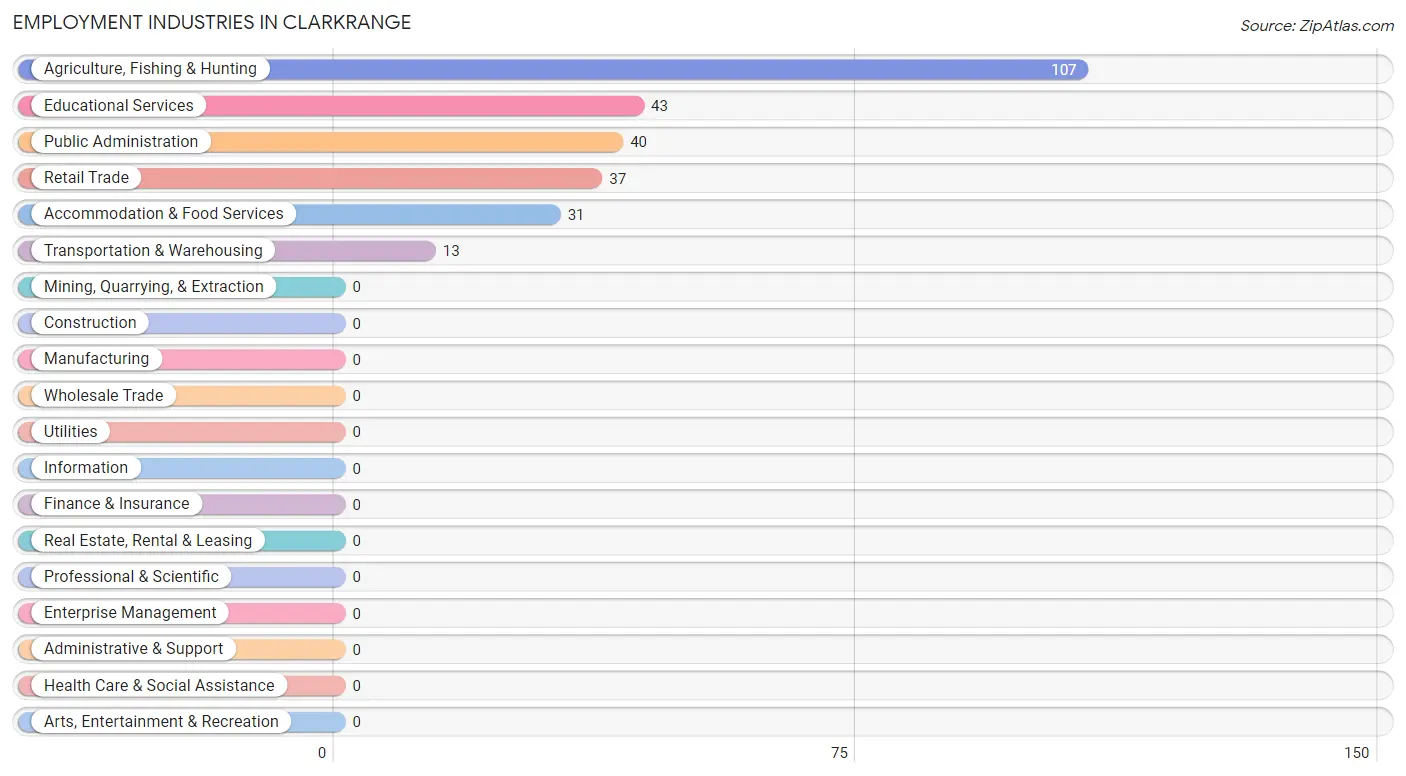
The major employment industries in Clarkrange include Agriculture, Fishing & Hunting (107 | 39.5%), Educational Services (43 | 15.9%), Public Administration (40 | 14.8%), Retail Trade (37 | 13.7%), and Accommodation & Food Services (31 | 11.4%).
Employment Industries by Sex in Clarkrange
The Clarkrange industries that see more men than women are Agriculture, Fishing & Hunting (100.0%), Transportation & Warehousing (100.0%), and Educational Services (100.0%), whereas the industries that tend to have a higher number of women are Retail Trade (100.0%), and Accommodation & Food Services (100.0%).
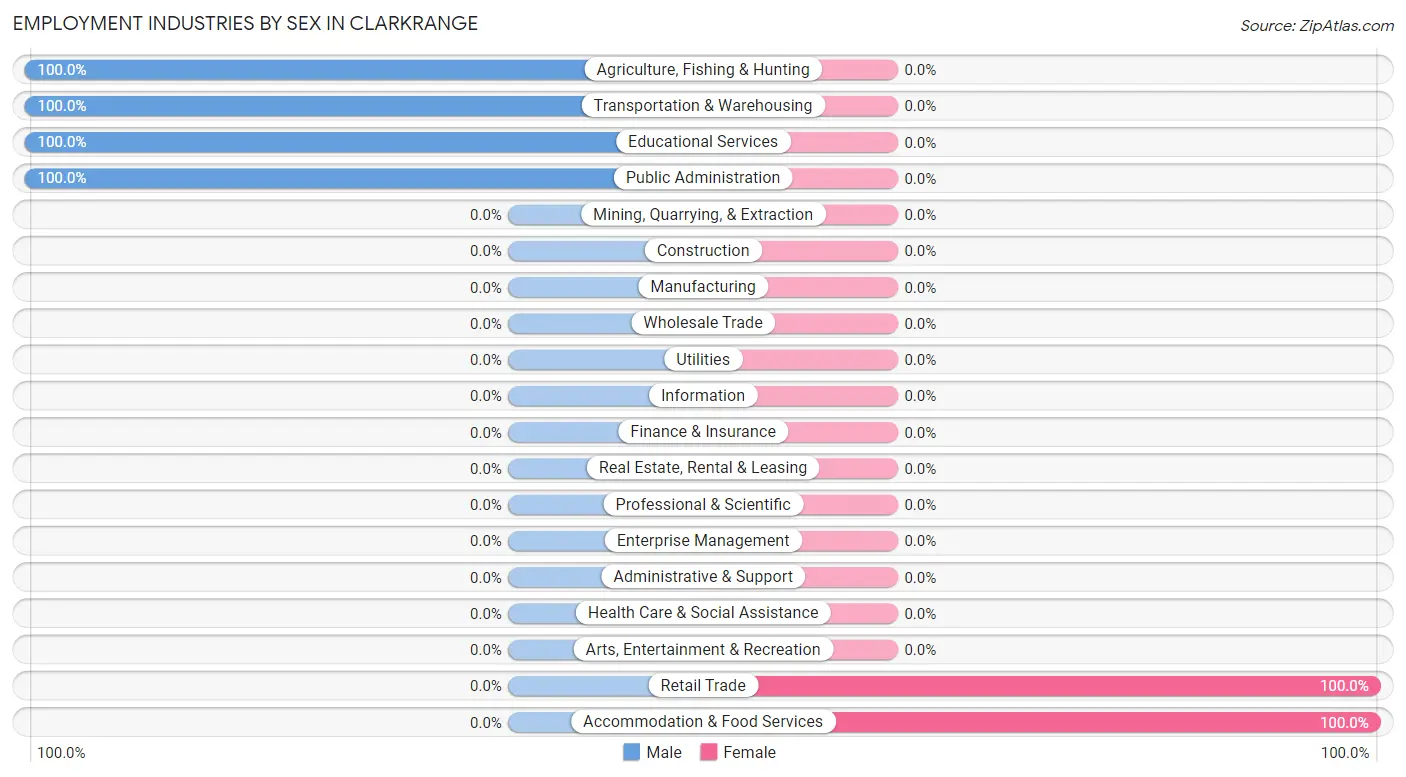
| Industry | Male | Female |
| Agriculture, Fishing & Hunting | 107 (100.0%) | 0 (0.0%) |
| Mining, Quarrying, & Extraction | 0 (0.0%) | 0 (0.0%) |
| Construction | 0 (0.0%) | 0 (0.0%) |
| Manufacturing | 0 (0.0%) | 0 (0.0%) |
| Wholesale Trade | 0 (0.0%) | 0 (0.0%) |
| Retail Trade | 0 (0.0%) | 37 (100.0%) |
| Transportation & Warehousing | 13 (100.0%) | 0 (0.0%) |
| Utilities | 0 (0.0%) | 0 (0.0%) |
| Information | 0 (0.0%) | 0 (0.0%) |
| Finance & Insurance | 0 (0.0%) | 0 (0.0%) |
| Real Estate, Rental & Leasing | 0 (0.0%) | 0 (0.0%) |
| Professional & Scientific | 0 (0.0%) | 0 (0.0%) |
| Enterprise Management | 0 (0.0%) | 0 (0.0%) |
| Administrative & Support | 0 (0.0%) | 0 (0.0%) |
| Educational Services | 43 (100.0%) | 0 (0.0%) |
| Health Care & Social Assistance | 0 (0.0%) | 0 (0.0%) |
| Arts, Entertainment & Recreation | 0 (0.0%) | 0 (0.0%) |
| Accommodation & Food Services | 0 (0.0%) | 31 (100.0%) |
| Public Administration | 40 (100.0%) | 0 (0.0%) |
| Total | 203 (74.9%) | 68 (25.1%) |
Education in Clarkrange
School Enrollment in Clarkrange
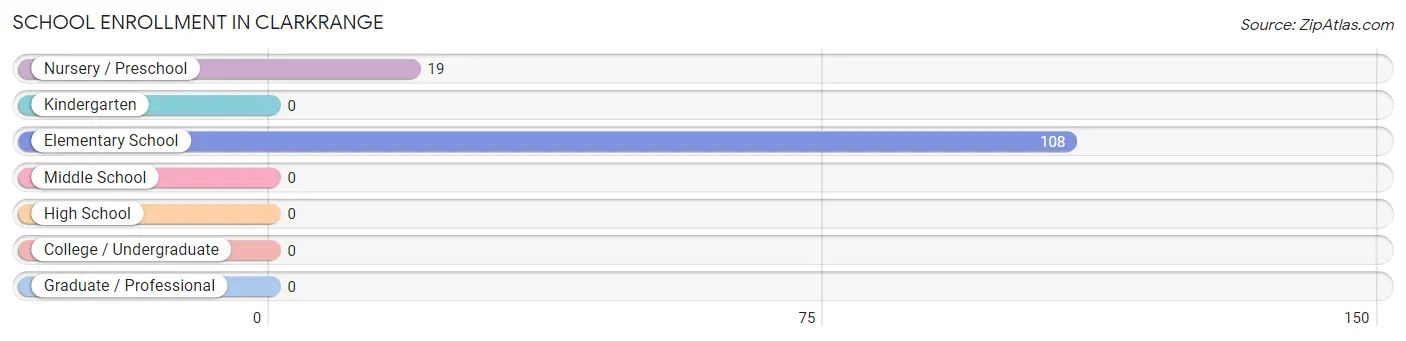
The most common levels of schooling among the 127 students in Clarkrange are elementary school (108 | 85.0%), and nursery / preschool (19 | 15.0%).
| School Level | # Students | % Students |
| Nursery / Preschool | 19 | 15.0% |
| Kindergarten | 0 | 0.0% |
| Elementary School | 108 | 85.0% |
| Middle School | 0 | 0.0% |
| High School | 0 | 0.0% |
| College / Undergraduate | 0 | 0.0% |
| Graduate / Professional | 0 | 0.0% |
| Total | 127 | 100.0% |
School Enrollment by Age by Funding Source in Clarkrange
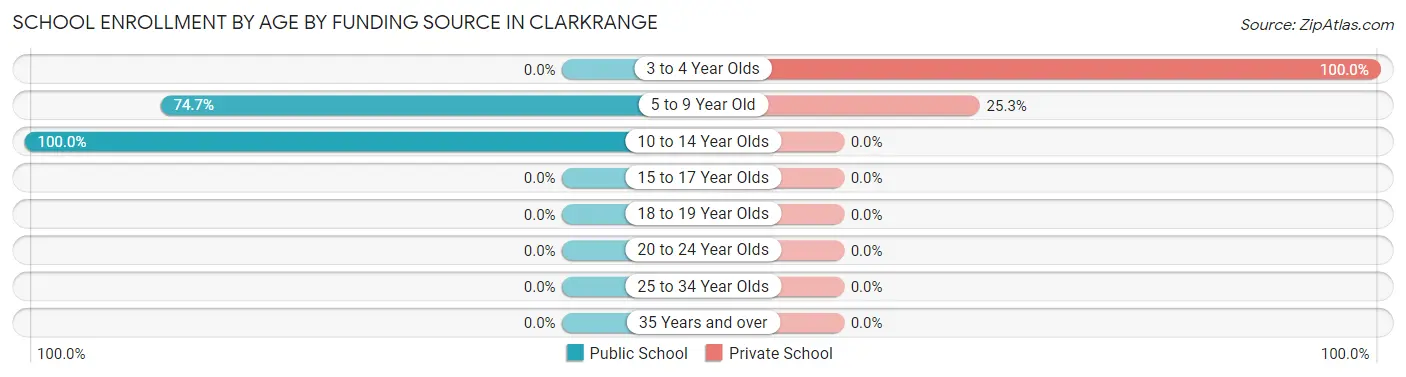
Out of a total of 127 students who are enrolled in schools in Clarkrange, 38 (29.9%) attend a private institution, while the remaining 89 (70.1%) are enrolled in public schools. The age group of 3 to 4 year olds has the highest likelihood of being enrolled in private schools, with 19 (100.0% in the age bracket) enrolled. Conversely, the age group of 10 to 14 year olds has the lowest likelihood of being enrolled in a private school, with 33 (100.0% in the age bracket) attending a public institution.
| Age Bracket | Public School | Private School |
| 3 to 4 Year Olds | 0 (0.0%) | 19 (100.0%) |
| 5 to 9 Year Old | 56 (74.7%) | 19 (25.3%) |
| 10 to 14 Year Olds | 33 (100.0%) | 0 (0.0%) |
| 15 to 17 Year Olds | 0 (0.0%) | 0 (0.0%) |
| 18 to 19 Year Olds | 0 (0.0%) | 0 (0.0%) |
| 20 to 24 Year Olds | 0 (0.0%) | 0 (0.0%) |
| 25 to 34 Year Olds | 0 (0.0%) | 0 (0.0%) |
| 35 Years and over | 0 (0.0%) | 0 (0.0%) |
| Total | 89 (70.1%) | 38 (29.9%) |
Educational Attainment by Field of Study in Clarkrange
Business (189 | 61.2%), education (56 | 18.1%), social sciences (40 | 12.9%), and bio, nature & agricultural (24 | 7.8%) are the most common fields of study among 309 individuals in Clarkrange who have obtained a bachelor's degree or higher.
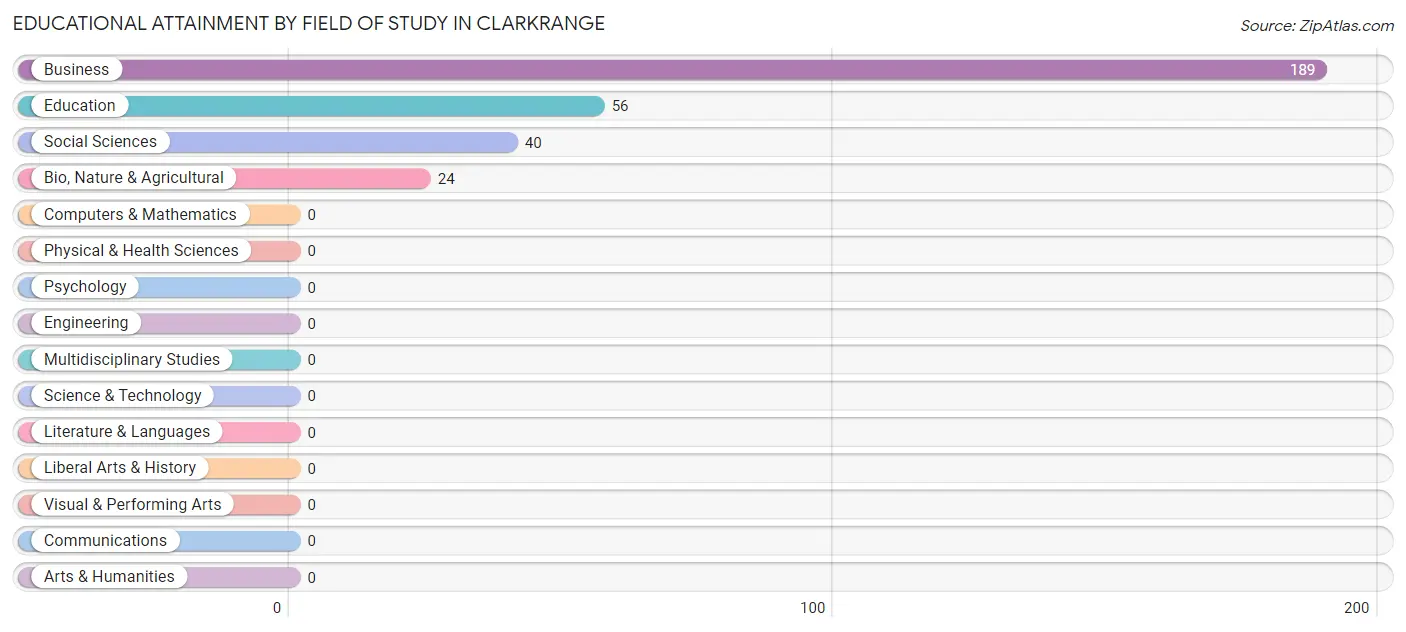
| Field of Study | # Graduates | % Graduates |
| Computers & Mathematics | 0 | 0.0% |
| Bio, Nature & Agricultural | 24 | 7.8% |
| Physical & Health Sciences | 0 | 0.0% |
| Psychology | 0 | 0.0% |
| Social Sciences | 40 | 12.9% |
| Engineering | 0 | 0.0% |
| Multidisciplinary Studies | 0 | 0.0% |
| Science & Technology | 0 | 0.0% |
| Business | 189 | 61.2% |
| Education | 56 | 18.1% |
| Literature & Languages | 0 | 0.0% |
| Liberal Arts & History | 0 | 0.0% |
| Visual & Performing Arts | 0 | 0.0% |
| Communications | 0 | 0.0% |
| Arts & Humanities | 0 | 0.0% |
| Total | 309 | 100.0% |
Transportation & Commute in Clarkrange
Vehicle Availability by Sex in Clarkrange
The most prevalent vehicle ownership categories in Clarkrange are males with 5 or more vehicles (80, accounting for 39.4%) and females with 5 or more vehicles (0, making up 117.7%).
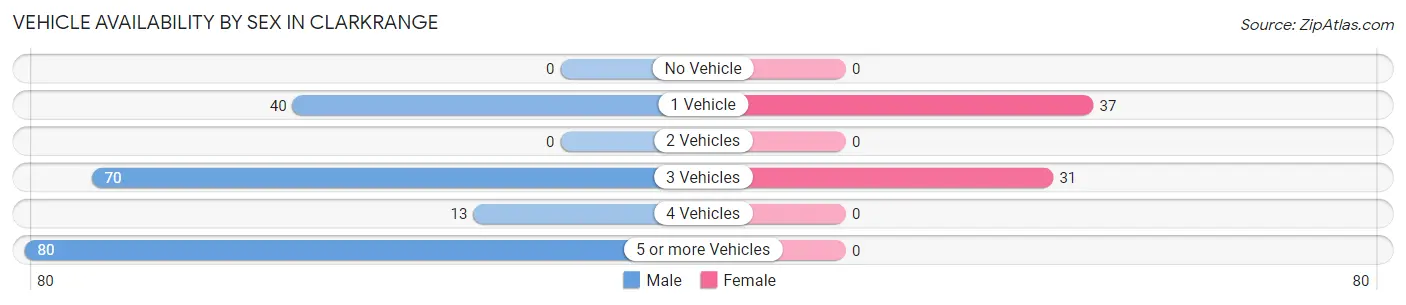
| Vehicles Available | Male | Female |
| No Vehicle | 0 (0.0%) | 0 (0.0%) |
| 1 Vehicle | 40 (19.7%) | 37 (54.4%) |
| 2 Vehicles | 0 (0.0%) | 0 (0.0%) |
| 3 Vehicles | 70 (34.5%) | 31 (45.6%) |
| 4 Vehicles | 13 (6.4%) | 0 (0.0%) |
| 5 or more Vehicles | 80 (39.4%) | 0 (0.0%) |
| Total | 203 (100.0%) | 68 (100.0%) |
Commute Time in Clarkrange
The most frequently occuring commute durations in Clarkrange are less than 5 minutes (117 commuters, 43.2%), 60 to 89 minutes (58 commuters, 21.4%), and 35 to 39 minutes (43 commuters, 15.9%).
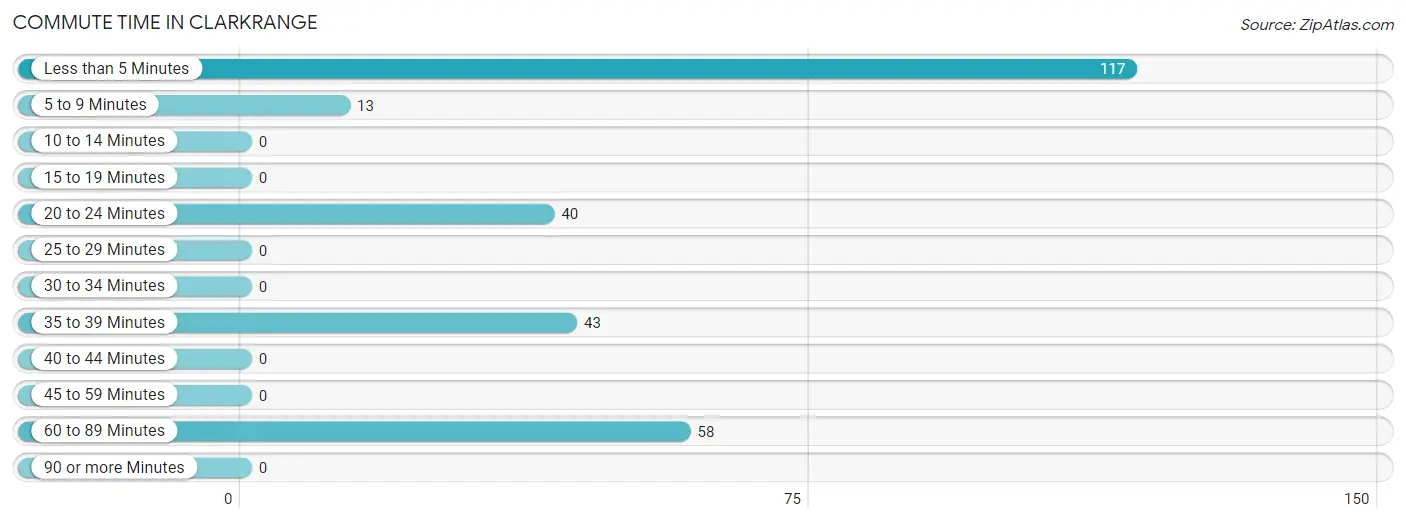
| Commute Time | # Commuters | % Commuters |
| Less than 5 Minutes | 117 | 43.2% |
| 5 to 9 Minutes | 13 | 4.8% |
| 10 to 14 Minutes | 0 | 0.0% |
| 15 to 19 Minutes | 0 | 0.0% |
| 20 to 24 Minutes | 40 | 14.8% |
| 25 to 29 Minutes | 0 | 0.0% |
| 30 to 34 Minutes | 0 | 0.0% |
| 35 to 39 Minutes | 43 | 15.9% |
| 40 to 44 Minutes | 0 | 0.0% |
| 45 to 59 Minutes | 0 | 0.0% |
| 60 to 89 Minutes | 58 | 21.4% |
| 90 or more Minutes | 0 | 0.0% |
Commute Time by Sex in Clarkrange
The most common commute times in Clarkrange are less than 5 minutes (80 commuters, 39.4%) for males and less than 5 minutes (37 commuters, 54.4%) for females.
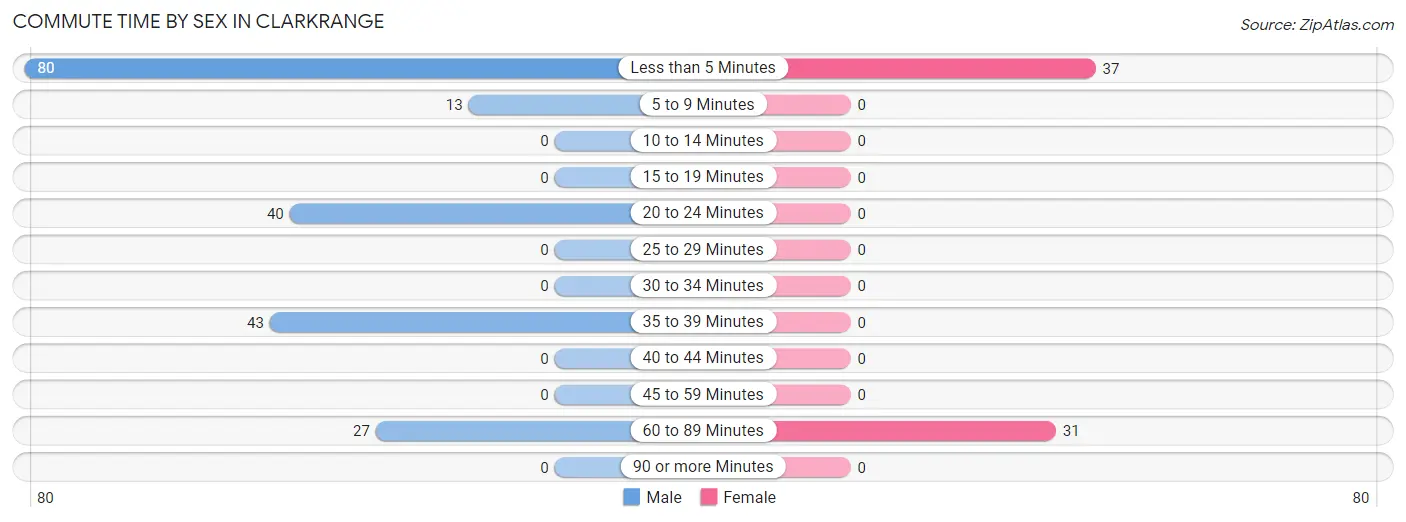
| Commute Time | Male | Female |
| Less than 5 Minutes | 80 (39.4%) | 37 (54.4%) |
| 5 to 9 Minutes | 13 (6.4%) | 0 (0.0%) |
| 10 to 14 Minutes | 0 (0.0%) | 0 (0.0%) |
| 15 to 19 Minutes | 0 (0.0%) | 0 (0.0%) |
| 20 to 24 Minutes | 40 (19.7%) | 0 (0.0%) |
| 25 to 29 Minutes | 0 (0.0%) | 0 (0.0%) |
| 30 to 34 Minutes | 0 (0.0%) | 0 (0.0%) |
| 35 to 39 Minutes | 43 (21.2%) | 0 (0.0%) |
| 40 to 44 Minutes | 0 (0.0%) | 0 (0.0%) |
| 45 to 59 Minutes | 0 (0.0%) | 0 (0.0%) |
| 60 to 89 Minutes | 27 (13.3%) | 31 (45.6%) |
| 90 or more Minutes | 0 (0.0%) | 0 (0.0%) |
Time of Departure to Work by Sex in Clarkrange
The most frequent times of departure to work in Clarkrange are 4:00 PM to 11:59 PM (56, 27.6%) for males and 9:00 AM to 9:59 AM (37, 54.4%) for females.
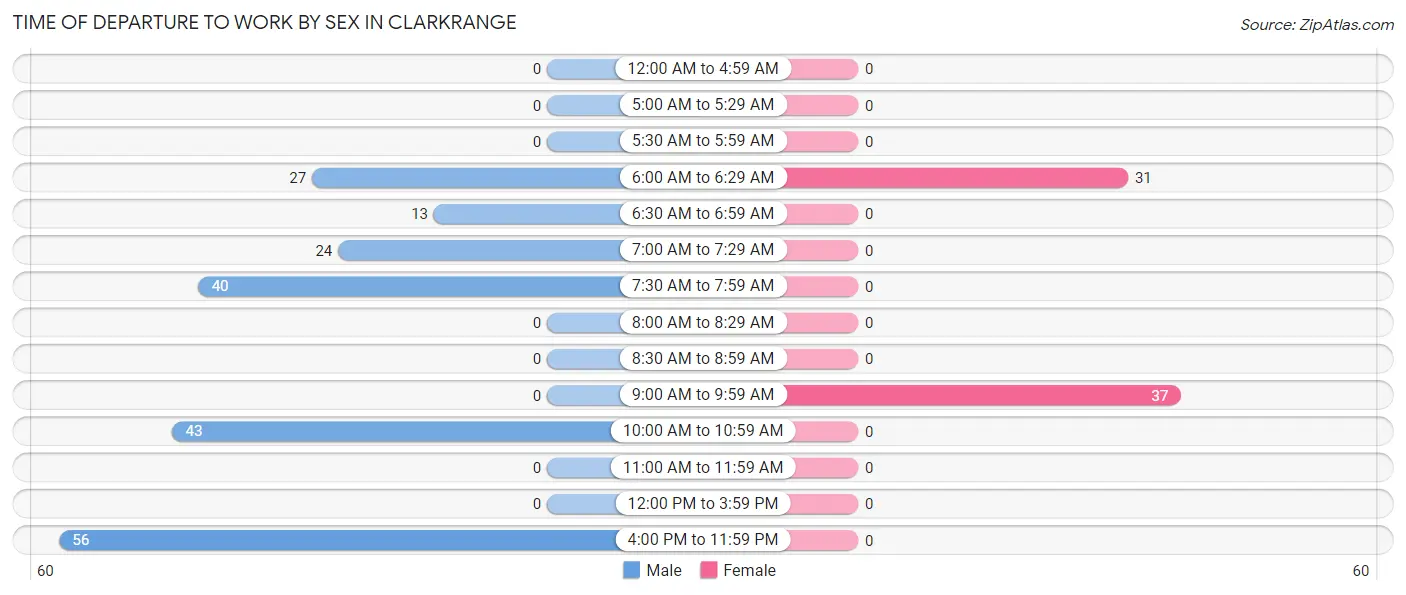
| Time of Departure | Male | Female |
| 12:00 AM to 4:59 AM | 0 (0.0%) | 0 (0.0%) |
| 5:00 AM to 5:29 AM | 0 (0.0%) | 0 (0.0%) |
| 5:30 AM to 5:59 AM | 0 (0.0%) | 0 (0.0%) |
| 6:00 AM to 6:29 AM | 27 (13.3%) | 31 (45.6%) |
| 6:30 AM to 6:59 AM | 13 (6.4%) | 0 (0.0%) |
| 7:00 AM to 7:29 AM | 24 (11.8%) | 0 (0.0%) |
| 7:30 AM to 7:59 AM | 40 (19.7%) | 0 (0.0%) |
| 8:00 AM to 8:29 AM | 0 (0.0%) | 0 (0.0%) |
| 8:30 AM to 8:59 AM | 0 (0.0%) | 0 (0.0%) |
| 9:00 AM to 9:59 AM | 0 (0.0%) | 37 (54.4%) |
| 10:00 AM to 10:59 AM | 43 (21.2%) | 0 (0.0%) |
| 11:00 AM to 11:59 AM | 0 (0.0%) | 0 (0.0%) |
| 12:00 PM to 3:59 PM | 0 (0.0%) | 0 (0.0%) |
| 4:00 PM to 11:59 PM | 56 (27.6%) | 0 (0.0%) |
| Total | 203 (100.0%) | 68 (100.0%) |
Housing Occupancy in Clarkrange
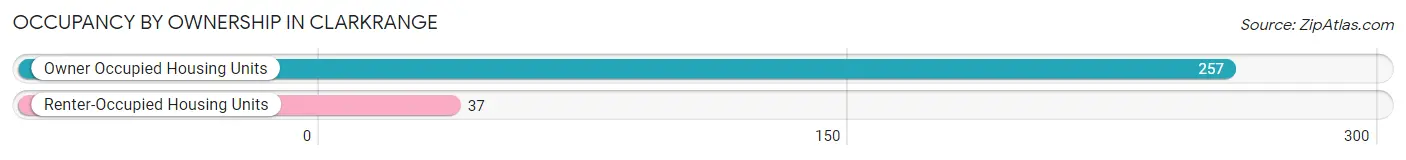
Occupancy by Ownership in Clarkrange
Of the total 294 dwellings in Clarkrange, owner-occupied units account for 257 (87.4%), while renter-occupied units make up 37 (12.6%).
| Occupancy | # Housing Units | % Housing Units |
| Owner Occupied Housing Units | 257 | 87.4% |
| Renter-Occupied Housing Units | 37 | 12.6% |
| Total Occupied Housing Units | 294 | 100.0% |
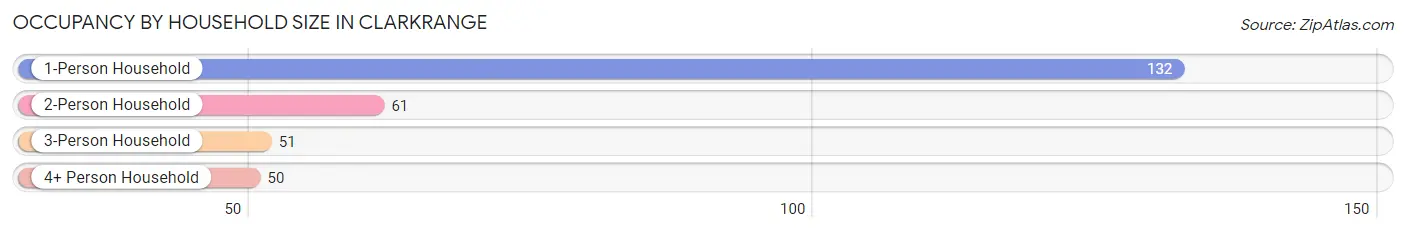
Occupancy by Household Size in Clarkrange
| Household Size | # Housing Units | % Housing Units |
| 1-Person Household | 132 | 44.9% |
| 2-Person Household | 61 | 20.7% |
| 3-Person Household | 51 | 17.3% |
| 4+ Person Household | 50 | 17.0% |
| Total Housing Units | 294 | 100.0% |
Occupancy by Ownership by Household Size in Clarkrange
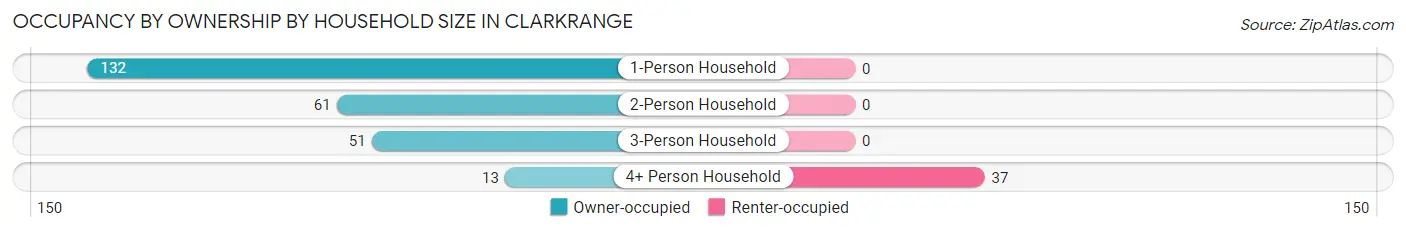
| Household Size | Owner-occupied | Renter-occupied |
| 1-Person Household | 132 (100.0%) | 0 (0.0%) |
| 2-Person Household | 61 (100.0%) | 0 (0.0%) |
| 3-Person Household | 51 (100.0%) | 0 (0.0%) |
| 4+ Person Household | 13 (26.0%) | 37 (74.0%) |
| Total Housing Units | 257 (87.4%) | 37 (12.6%) |
Occupancy by Educational Attainment in Clarkrange
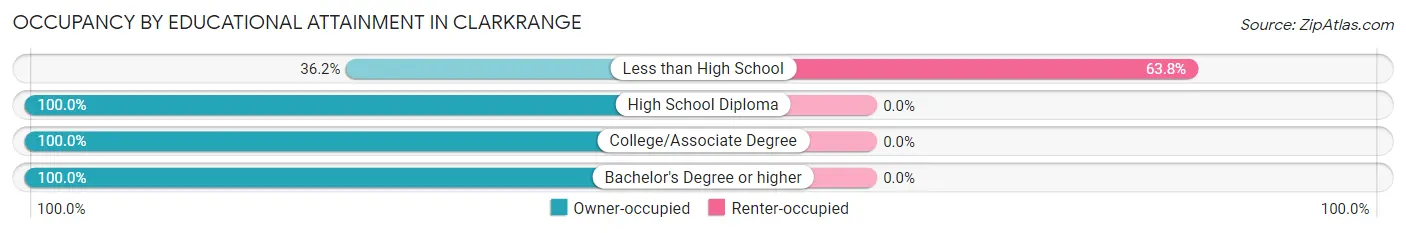
| Household Size | Owner-occupied | Renter-occupied |
| Less than High School | 21 (36.2%) | 37 (63.8%) |
| High School Diploma | 27 (100.0%) | 0 (0.0%) |
| College/Associate Degree | 14 (100.0%) | 0 (0.0%) |
| Bachelor's Degree or higher | 195 (100.0%) | 0 (0.0%) |
Occupancy by Age of Householder in Clarkrange
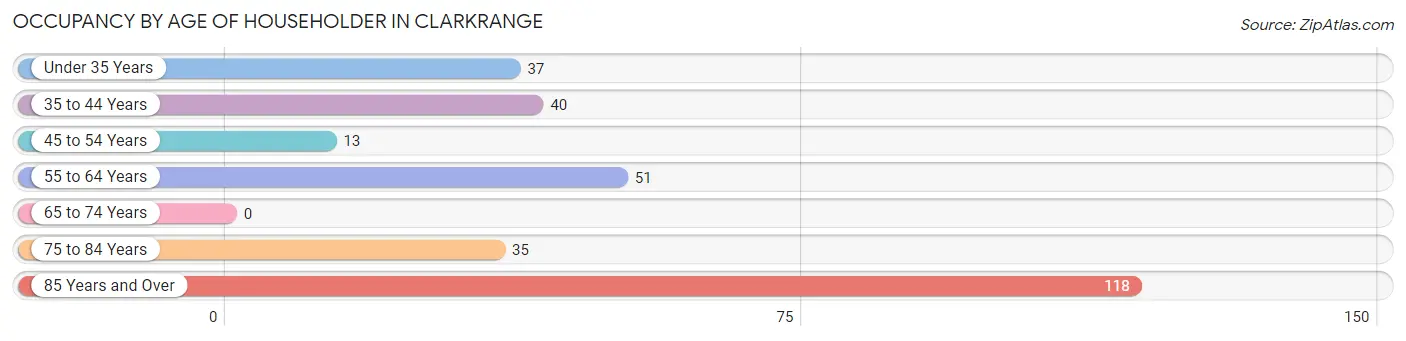
| Age Bracket | # Households | % Households |
| Under 35 Years | 37 | 12.6% |
| 35 to 44 Years | 40 | 13.6% |
| 45 to 54 Years | 13 | 4.4% |
| 55 to 64 Years | 51 | 17.3% |
| 65 to 74 Years | 0 | 0.0% |
| 75 to 84 Years | 35 | 11.9% |
| 85 Years and Over | 118 | 40.1% |
| Total | 294 | 100.0% |
Housing Finances in Clarkrange
Median Income by Occupancy in Clarkrange
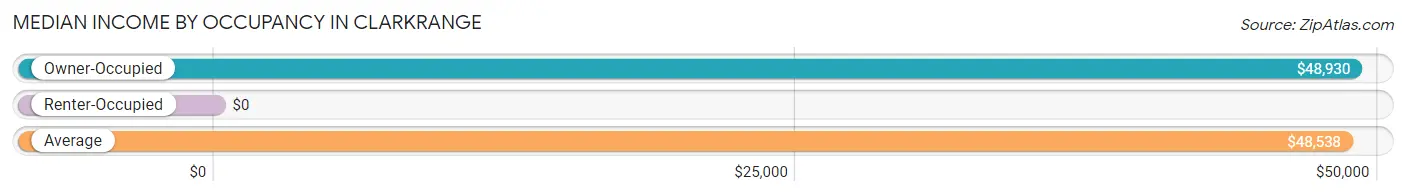
| Occupancy Type | # Households | Median Income |
| Owner-Occupied | 257 (87.4%) | $48,930 |
| Renter-Occupied | 37 (12.6%) | $0 |
| Average | 294 (100.0%) | $48,538 |
Occupancy by Householder Income Bracket in Clarkrange
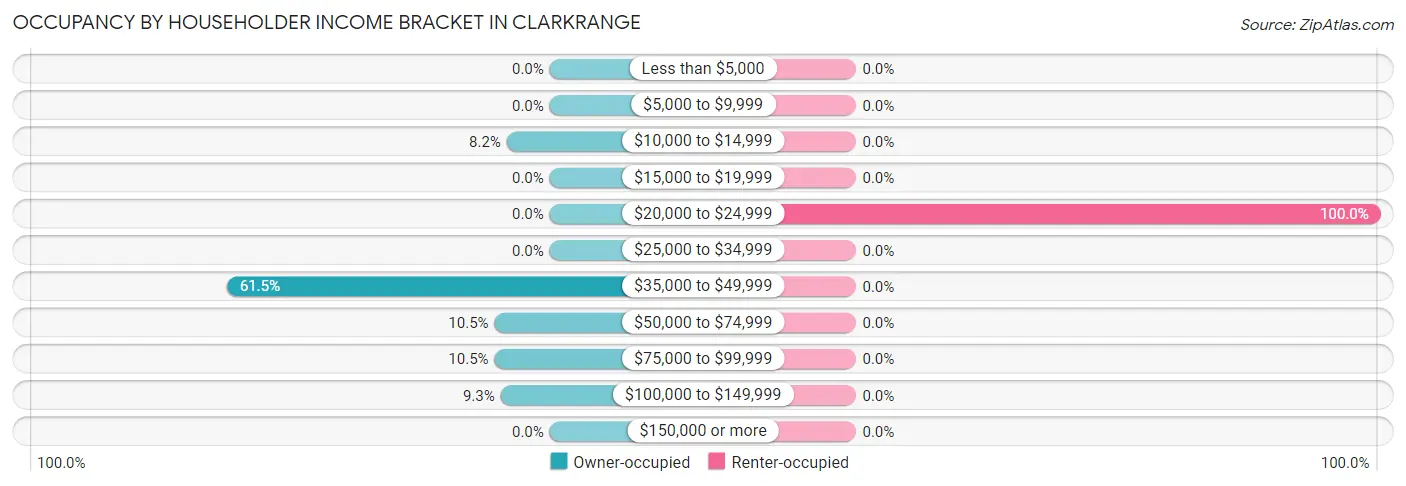
| Income Bracket | Owner-occupied | Renter-occupied |
| Less than $5,000 | 0 (0.0%) | 0 (0.0%) |
| $5,000 to $9,999 | 0 (0.0%) | 0 (0.0%) |
| $10,000 to $14,999 | 21 (8.2%) | 0 (0.0%) |
| $15,000 to $19,999 | 0 (0.0%) | 0 (0.0%) |
| $20,000 to $24,999 | 0 (0.0%) | 37 (100.0%) |
| $25,000 to $34,999 | 0 (0.0%) | 0 (0.0%) |
| $35,000 to $49,999 | 158 (61.5%) | 0 (0.0%) |
| $50,000 to $74,999 | 27 (10.5%) | 0 (0.0%) |
| $75,000 to $99,999 | 27 (10.5%) | 0 (0.0%) |
| $100,000 to $149,999 | 24 (9.3%) | 0 (0.0%) |
| $150,000 or more | 0 (0.0%) | 0 (0.0%) |
| Total | 257 (100.0%) | 37 (100.0%) |
Monthly Housing Cost Tiers in Clarkrange
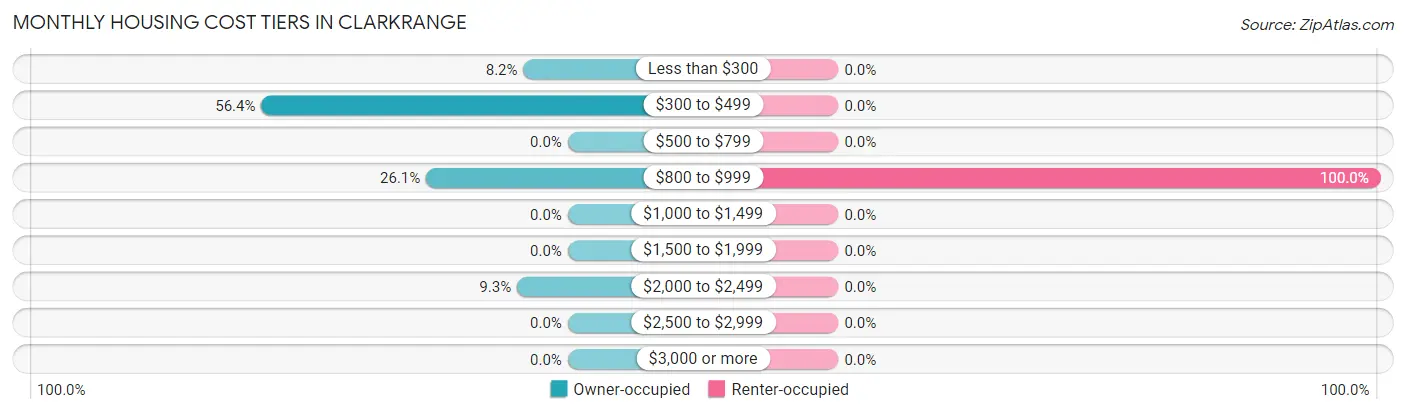
| Monthly Cost | Owner-occupied | Renter-occupied |
| Less than $300 | 21 (8.2%) | 0 (0.0%) |
| $300 to $499 | 145 (56.4%) | 0 (0.0%) |
| $500 to $799 | 0 (0.0%) | 0 (0.0%) |
| $800 to $999 | 67 (26.1%) | 37 (100.0%) |
| $1,000 to $1,499 | 0 (0.0%) | 0 (0.0%) |
| $1,500 to $1,999 | 0 (0.0%) | 0 (0.0%) |
| $2,000 to $2,499 | 24 (9.3%) | 0 (0.0%) |
| $2,500 to $2,999 | 0 (0.0%) | 0 (0.0%) |
| $3,000 or more | 0 (0.0%) | 0 (0.0%) |
| Total | 257 (100.0%) | 37 (100.0%) |
Physical Housing Characteristics in Clarkrange
Housing Structures in Clarkrange
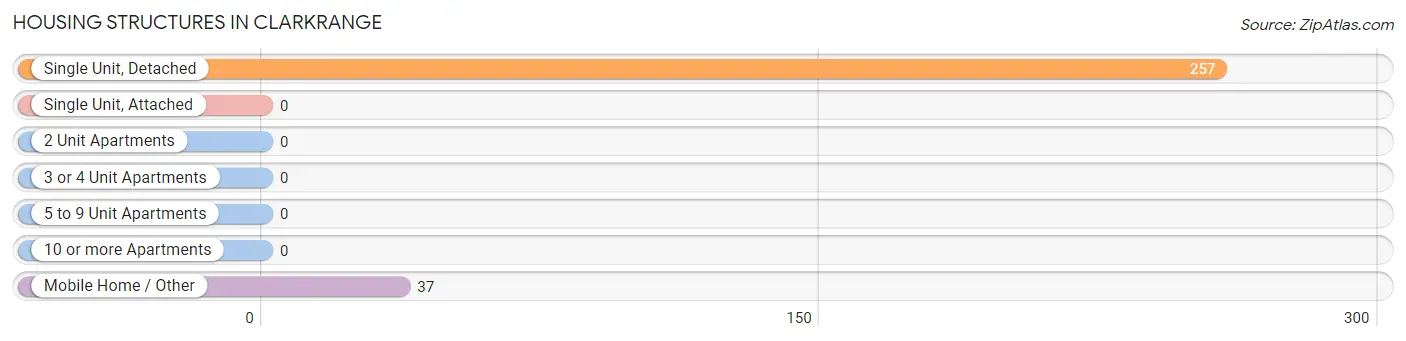
| Structure Type | # Housing Units | % Housing Units |
| Single Unit, Detached | 257 | 87.4% |
| Single Unit, Attached | 0 | 0.0% |
| 2 Unit Apartments | 0 | 0.0% |
| 3 or 4 Unit Apartments | 0 | 0.0% |
| 5 to 9 Unit Apartments | 0 | 0.0% |
| 10 or more Apartments | 0 | 0.0% |
| Mobile Home / Other | 37 | 12.6% |
| Total | 294 | 100.0% |
Housing Structures by Occupancy in Clarkrange
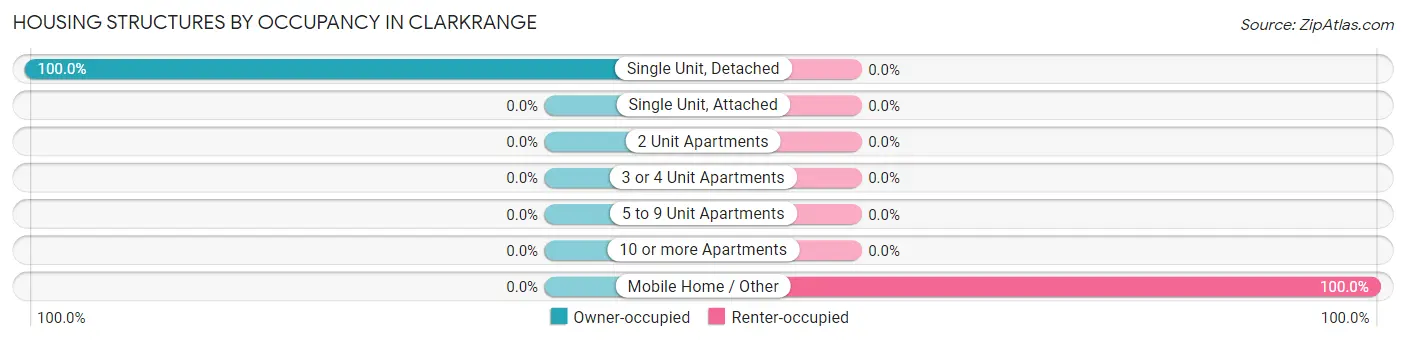
| Structure Type | Owner-occupied | Renter-occupied |
| Single Unit, Detached | 257 (100.0%) | 0 (0.0%) |
| Single Unit, Attached | 0 (0.0%) | 0 (0.0%) |
| 2 Unit Apartments | 0 (0.0%) | 0 (0.0%) |
| 3 or 4 Unit Apartments | 0 (0.0%) | 0 (0.0%) |
| 5 to 9 Unit Apartments | 0 (0.0%) | 0 (0.0%) |
| 10 or more Apartments | 0 (0.0%) | 0 (0.0%) |
| Mobile Home / Other | 0 (0.0%) | 37 (100.0%) |
| Total | 257 (87.4%) | 37 (12.6%) |
Housing Structures by Number of Rooms in Clarkrange
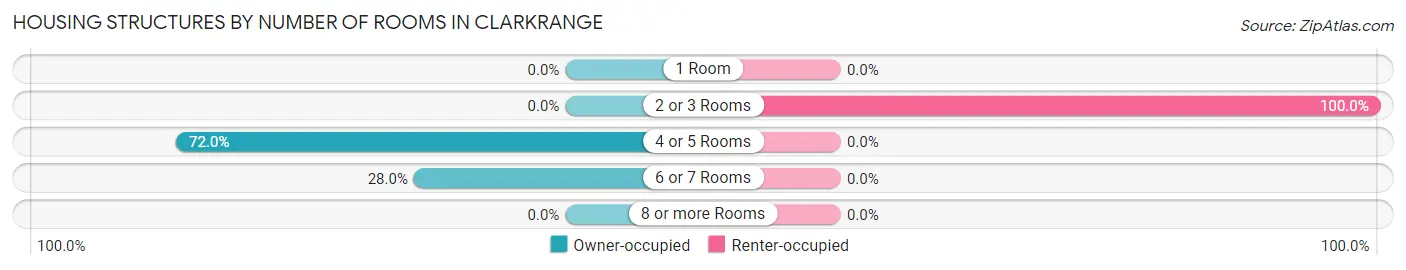
| Number of Rooms | Owner-occupied | Renter-occupied |
| 1 Room | 0 (0.0%) | 0 (0.0%) |
| 2 or 3 Rooms | 0 (0.0%) | 37 (100.0%) |
| 4 or 5 Rooms | 185 (72.0%) | 0 (0.0%) |
| 6 or 7 Rooms | 72 (28.0%) | 0 (0.0%) |
| 8 or more Rooms | 0 (0.0%) | 0 (0.0%) |
| Total | 257 (100.0%) | 37 (100.0%) |
Housing Structure by Heating Type in Clarkrange
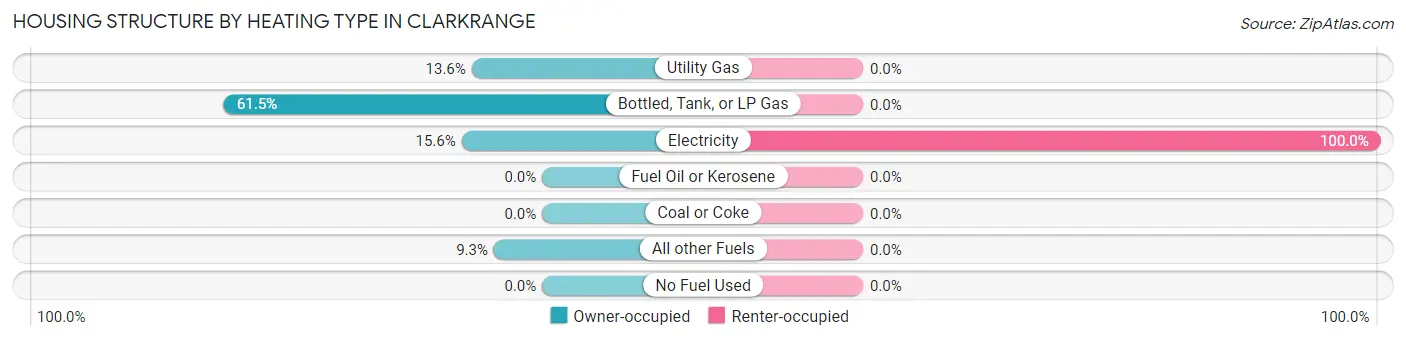
| Heating Type | Owner-occupied | Renter-occupied |
| Utility Gas | 35 (13.6%) | 0 (0.0%) |
| Bottled, Tank, or LP Gas | 158 (61.5%) | 0 (0.0%) |
| Electricity | 40 (15.6%) | 37 (100.0%) |
| Fuel Oil or Kerosene | 0 (0.0%) | 0 (0.0%) |
| Coal or Coke | 0 (0.0%) | 0 (0.0%) |
| All other Fuels | 24 (9.3%) | 0 (0.0%) |
| No Fuel Used | 0 (0.0%) | 0 (0.0%) |
| Total | 257 (100.0%) | 37 (100.0%) |
Household Vehicle Usage in Clarkrange
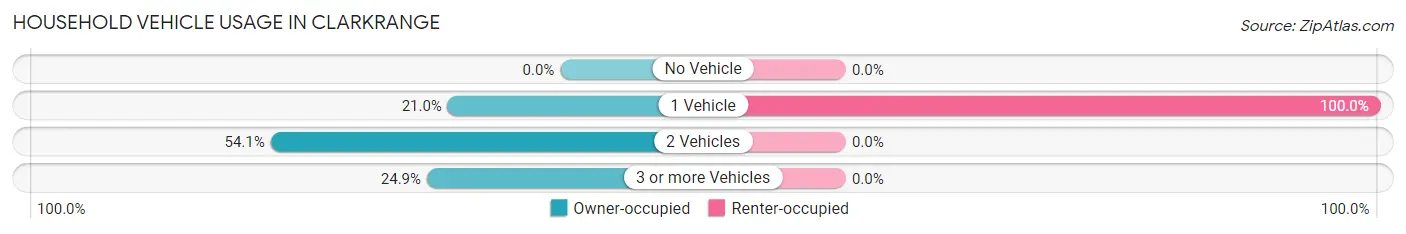
| Vehicles per Household | Owner-occupied | Renter-occupied |
| No Vehicle | 0 (0.0%) | 0 (0.0%) |
| 1 Vehicle | 54 (21.0%) | 37 (100.0%) |
| 2 Vehicles | 139 (54.1%) | 0 (0.0%) |
| 3 or more Vehicles | 64 (24.9%) | 0 (0.0%) |
| Total | 257 (100.0%) | 37 (100.0%) |
Real Estate & Mortgages in Clarkrange
Real Estate and Mortgage Overview in Clarkrange
| Characteristic | Without Mortgage | With Mortgage |
| Housing Units | 166 | 91 |
| Median Property Value | $329,700 | $0 |
| Median Household Income | $48,814 | $0 |
| Monthly Housing Costs | $326 | $0 |
| Real Estate Taxes | $519 | $0 |
Property Value by Mortgage Status in Clarkrange
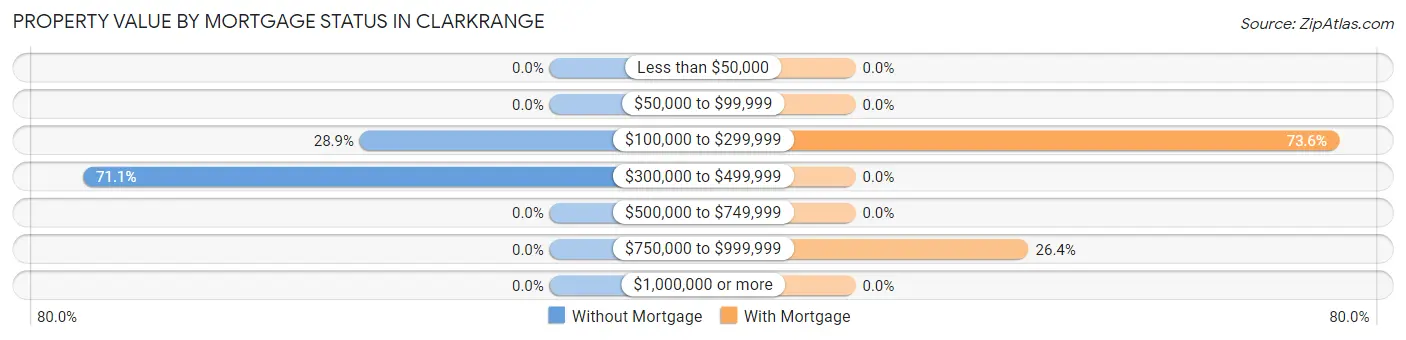
| Property Value | Without Mortgage | With Mortgage |
| Less than $50,000 | 0 (0.0%) | 0 (0.0%) |
| $50,000 to $99,999 | 0 (0.0%) | 0 (0.0%) |
| $100,000 to $299,999 | 48 (28.9%) | 67 (73.6%) |
| $300,000 to $499,999 | 118 (71.1%) | 0 (0.0%) |
| $500,000 to $749,999 | 0 (0.0%) | 0 (0.0%) |
| $750,000 to $999,999 | 0 (0.0%) | 24 (26.4%) |
| $1,000,000 or more | 0 (0.0%) | 0 (0.0%) |
| Total | 166 (100.0%) | 91 (100.0%) |
Household Income by Mortgage Status in Clarkrange
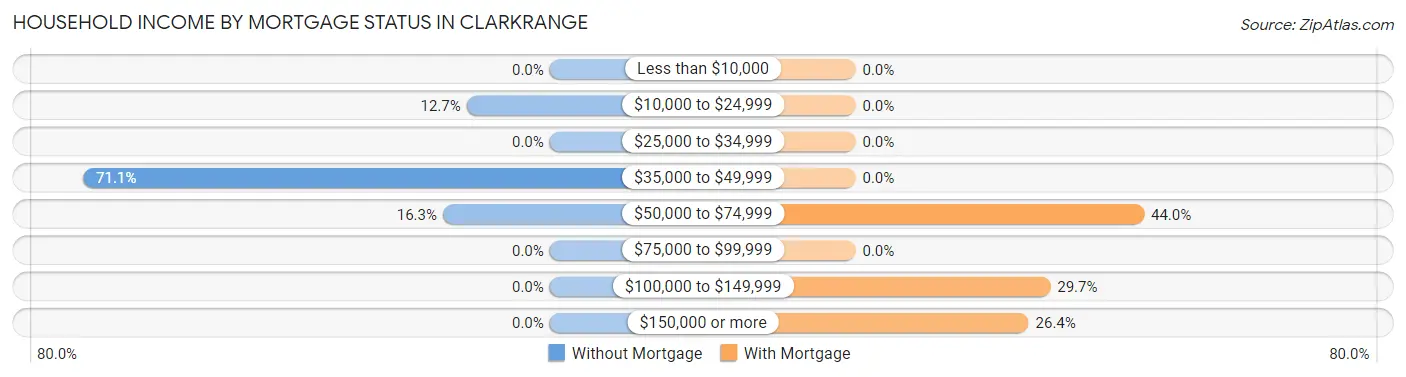
| Household Income | Without Mortgage | With Mortgage |
| Less than $10,000 | 0 (0.0%) | 0 (0.0%) |
| $10,000 to $24,999 | 21 (12.7%) | 0 (0.0%) |
| $25,000 to $34,999 | 0 (0.0%) | 0 (0.0%) |
| $35,000 to $49,999 | 118 (71.1%) | 0 (0.0%) |
| $50,000 to $74,999 | 27 (16.3%) | 40 (44.0%) |
| $75,000 to $99,999 | 0 (0.0%) | 0 (0.0%) |
| $100,000 to $149,999 | 0 (0.0%) | 27 (29.7%) |
| $150,000 or more | 0 (0.0%) | 24 (26.4%) |
| Total | 166 (100.0%) | 91 (100.0%) |
Property Value to Household Income Ratio in Clarkrange
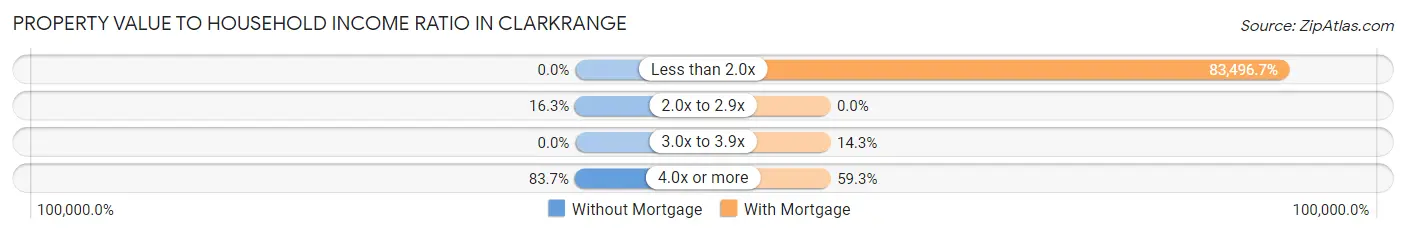
| Value-to-Income Ratio | Without Mortgage | With Mortgage |
| Less than 2.0x | 0 (0.0%) | 75,982 (83,496.7%) |
| 2.0x to 2.9x | 27 (16.3%) | 0 (0.0%) |
| 3.0x to 3.9x | 0 (0.0%) | 13 (14.3%) |
| 4.0x or more | 139 (83.7%) | 54 (59.3%) |
| Total | 166 (100.0%) | 91 (100.0%) |
Real Estate Taxes by Mortgage Status in Clarkrange
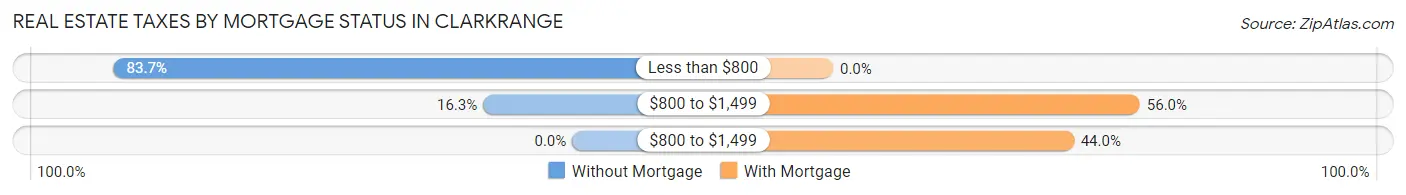
| Property Taxes | Without Mortgage | With Mortgage |
| Less than $800 | 139 (83.7%) | 0 (0.0%) |
| $800 to $1,499 | 27 (16.3%) | 51 (56.0%) |
| $800 to $1,499 | 0 (0.0%) | 40 (44.0%) |
| Total | 166 (100.0%) | 91 (100.0%) |
Health & Disability in Clarkrange
Health Insurance Coverage by Age in Clarkrange
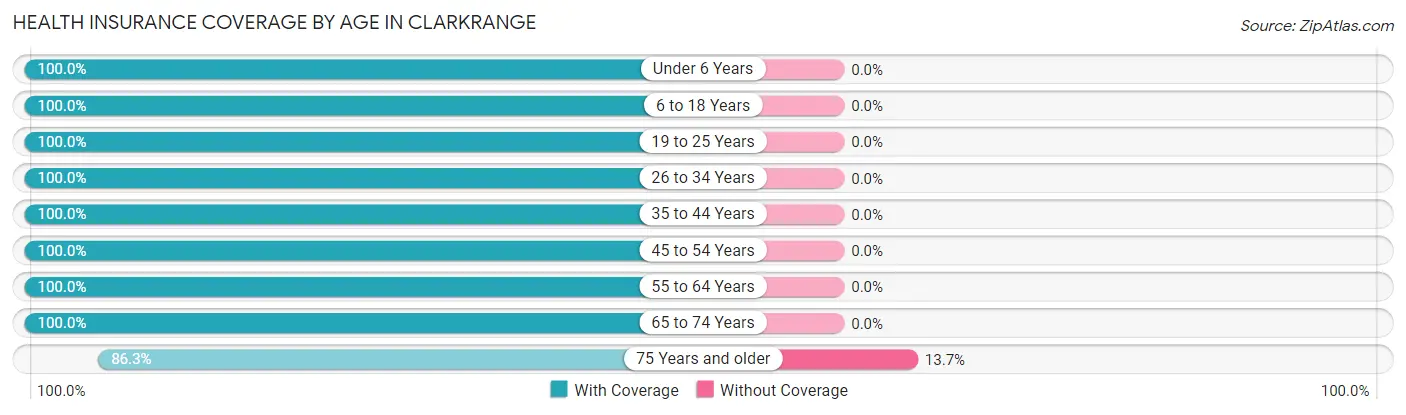
| Age Bracket | With Coverage | Without Coverage |
| Under 6 Years | 19 (100.0%) | 0 (0.0%) |
| 6 to 18 Years | 108 (100.0%) | 0 (0.0%) |
| 19 to 25 Years | 99 (100.0%) | 0 (0.0%) |
| 26 to 34 Years | 82 (100.0%) | 0 (0.0%) |
| 35 to 44 Years | 54 (100.0%) | 0 (0.0%) |
| 45 to 54 Years | 13 (100.0%) | 0 (0.0%) |
| 55 to 64 Years | 110 (100.0%) | 0 (0.0%) |
| 65 to 74 Years | 26 (100.0%) | 0 (0.0%) |
| 75 Years and older | 132 (86.3%) | 21 (13.7%) |
| Total | 643 (96.8%) | 21 (3.2%) |
Health Insurance Coverage by Citizenship Status in Clarkrange
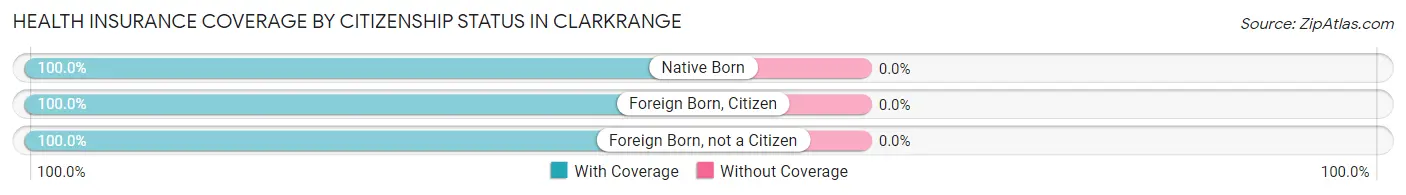
| Citizenship Status | With Coverage | Without Coverage |
| Native Born | 19 (100.0%) | 0 (0.0%) |
| Foreign Born, Citizen | 108 (100.0%) | 0 (0.0%) |
| Foreign Born, not a Citizen | 99 (100.0%) | 0 (0.0%) |
Health Insurance Coverage by Household Income in Clarkrange
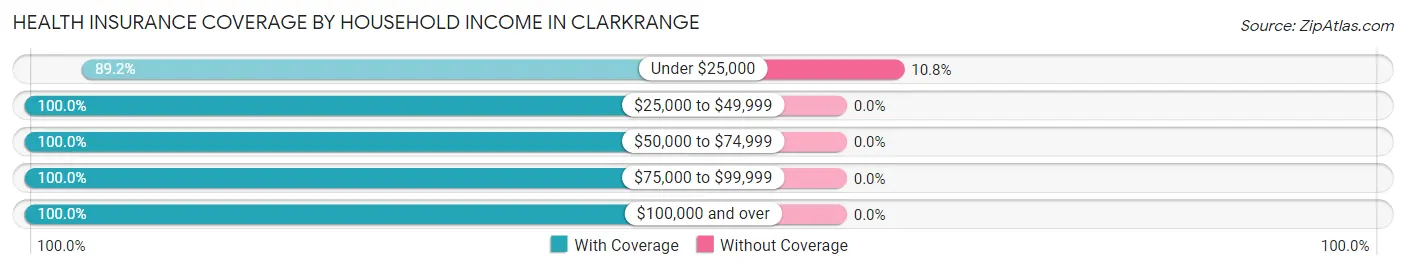
| Household Income | With Coverage | Without Coverage |
| Under $25,000 | 174 (89.2%) | 21 (10.8%) |
| $25,000 to $49,999 | 181 (100.0%) | 0 (0.0%) |
| $50,000 to $74,999 | 101 (100.0%) | 0 (0.0%) |
| $75,000 to $99,999 | 79 (100.0%) | 0 (0.0%) |
| $100,000 and over | 108 (100.0%) | 0 (0.0%) |
Public vs Private Health Insurance Coverage by Age in Clarkrange
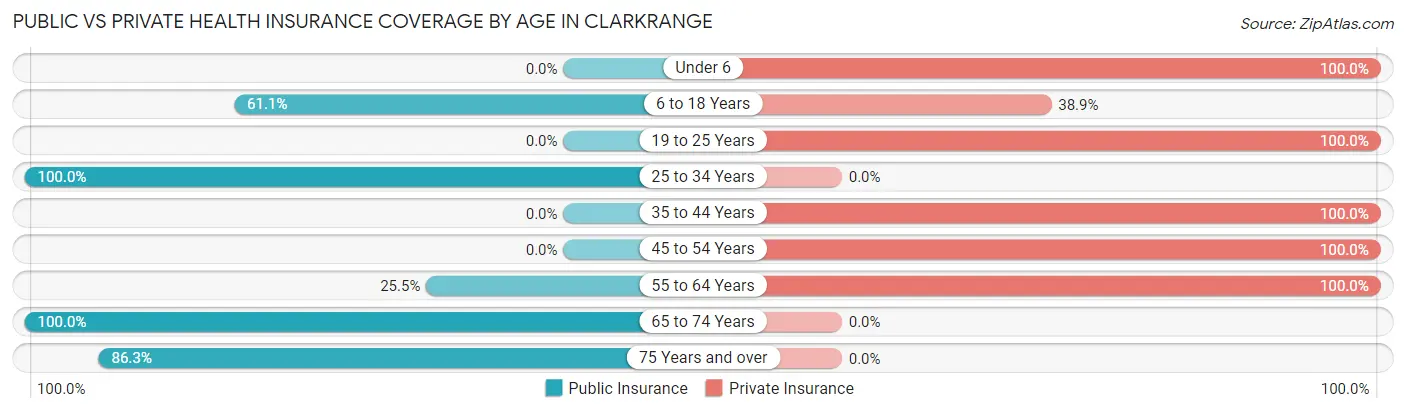
| Age Bracket | Public Insurance | Private Insurance |
| Under 6 | 0 (0.0%) | 19 (100.0%) |
| 6 to 18 Years | 66 (61.1%) | 42 (38.9%) |
| 19 to 25 Years | 0 (0.0%) | 99 (100.0%) |
| 25 to 34 Years | 82 (100.0%) | 0 (0.0%) |
| 35 to 44 Years | 0 (0.0%) | 54 (100.0%) |
| 45 to 54 Years | 0 (0.0%) | 13 (100.0%) |
| 55 to 64 Years | 28 (25.5%) | 110 (100.0%) |
| 65 to 74 Years | 26 (100.0%) | 0 (0.0%) |
| 75 Years and over | 132 (86.3%) | 0 (0.0%) |
| Total | 334 (50.3%) | 337 (50.7%) |
Disability Status by Sex by Age in Clarkrange
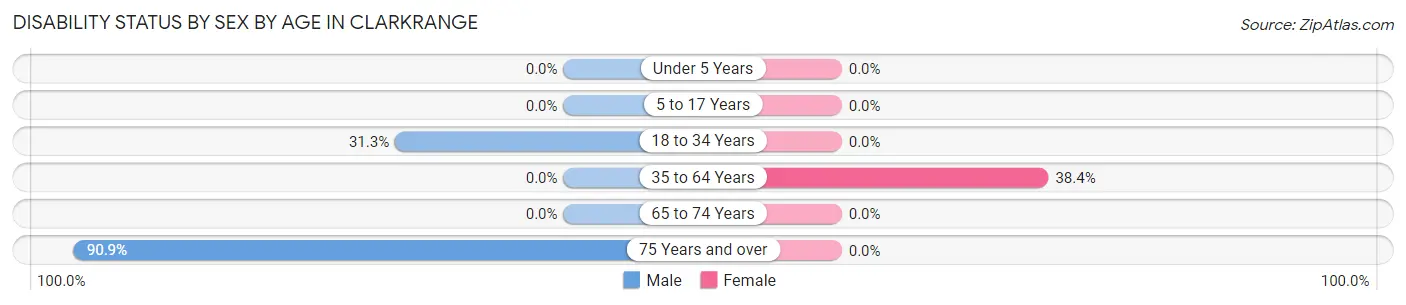
| Age Bracket | Male | Female |
| Under 5 Years | 0 (0.0%) | 0 (0.0%) |
| 5 to 17 Years | 0 (0.0%) | 0 (0.0%) |
| 18 to 34 Years | 45 (31.2%) | 0 (0.0%) |
| 35 to 64 Years | 0 (0.0%) | 28 (38.4%) |
| 65 to 74 Years | 0 (0.0%) | 0 (0.0%) |
| 75 Years and over | 139 (90.8%) | 0 (0.0%) |
Disability Class by Sex by Age in Clarkrange
Disability Class: Hearing Difficulty
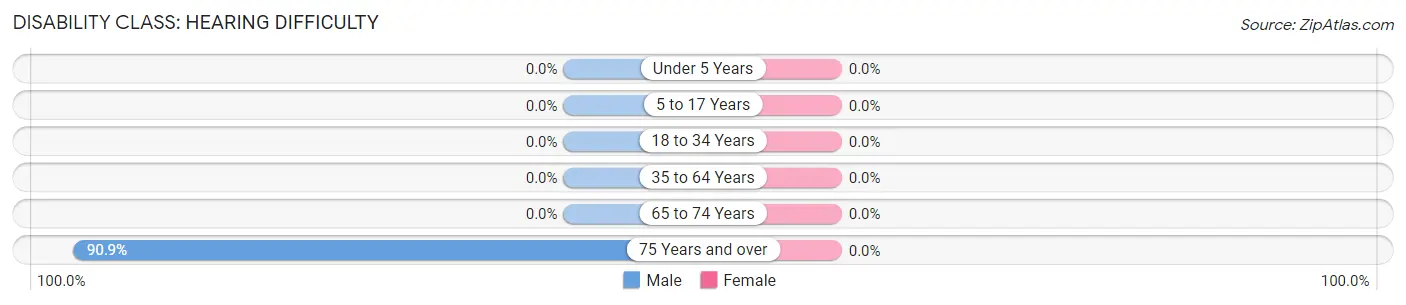
| Age Bracket | Male | Female |
| Under 5 Years | 0 (0.0%) | 0 (0.0%) |
| 5 to 17 Years | 0 (0.0%) | 0 (0.0%) |
| 18 to 34 Years | 0 (0.0%) | 0 (0.0%) |
| 35 to 64 Years | 0 (0.0%) | 0 (0.0%) |
| 65 to 74 Years | 0 (0.0%) | 0 (0.0%) |
| 75 Years and over | 139 (90.8%) | 0 (0.0%) |
Disability Class: Vision Difficulty
| Age Bracket | Male | Female |
| Under 5 Years | 0 (0.0%) | 0 (0.0%) |
| 5 to 17 Years | 0 (0.0%) | 0 (0.0%) |
| 18 to 34 Years | 0 (0.0%) | 0 (0.0%) |
| 35 to 64 Years | 0 (0.0%) | 0 (0.0%) |
| 65 to 74 Years | 0 (0.0%) | 0 (0.0%) |
| 75 Years and over | 0 (0.0%) | 0 (0.0%) |
Disability Class: Cognitive Difficulty
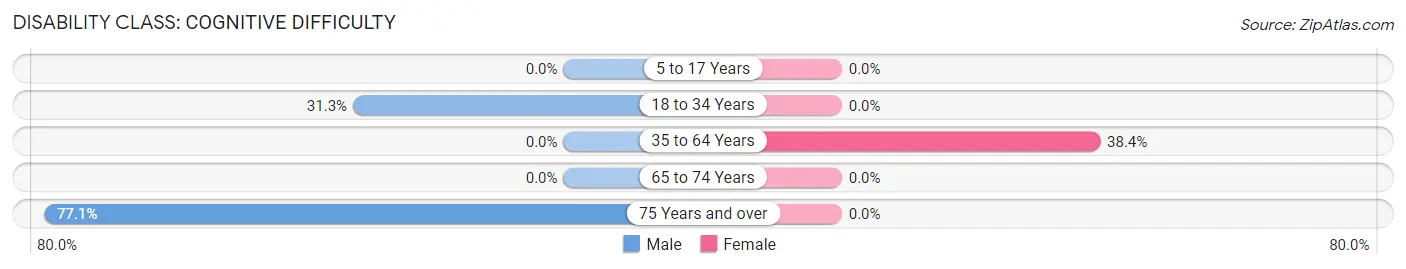
| Age Bracket | Male | Female |
| 5 to 17 Years | 0 (0.0%) | 0 (0.0%) |
| 18 to 34 Years | 45 (31.2%) | 0 (0.0%) |
| 35 to 64 Years | 0 (0.0%) | 28 (38.4%) |
| 65 to 74 Years | 0 (0.0%) | 0 (0.0%) |
| 75 Years and over | 118 (77.1%) | 0 (0.0%) |
Disability Class: Ambulatory Difficulty
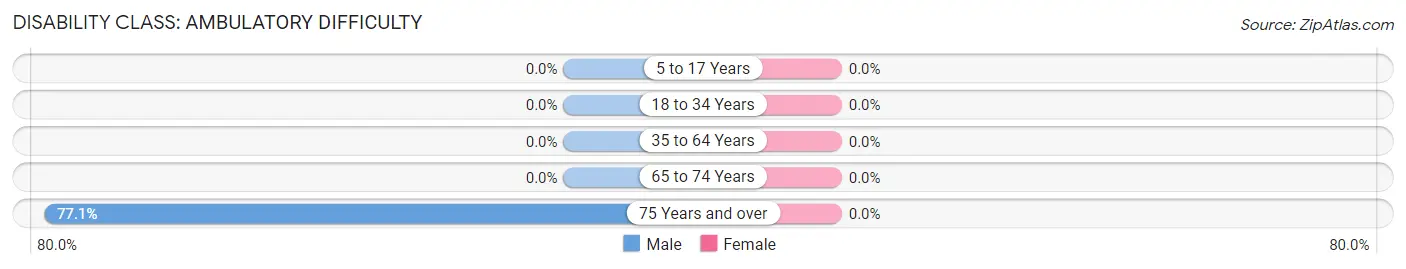
| Age Bracket | Male | Female |
| 5 to 17 Years | 0 (0.0%) | 0 (0.0%) |
| 18 to 34 Years | 0 (0.0%) | 0 (0.0%) |
| 35 to 64 Years | 0 (0.0%) | 0 (0.0%) |
| 65 to 74 Years | 0 (0.0%) | 0 (0.0%) |
| 75 Years and over | 118 (77.1%) | 0 (0.0%) |
Disability Class: Self-Care Difficulty

| Age Bracket | Male | Female |
| 5 to 17 Years | 0 (0.0%) | 0 (0.0%) |
| 18 to 34 Years | 0 (0.0%) | 0 (0.0%) |
| 35 to 64 Years | 0 (0.0%) | 0 (0.0%) |
| 65 to 74 Years | 0 (0.0%) | 0 (0.0%) |
| 75 Years and over | 118 (77.1%) | 0 (0.0%) |
Technology Access in Clarkrange
Computing Device Access in Clarkrange
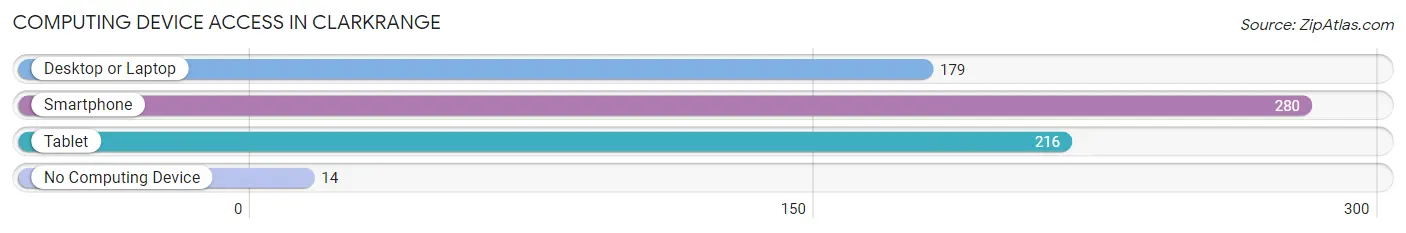
| Device Type | # Households | % Households |
| Desktop or Laptop | 179 | 60.9% |
| Smartphone | 280 | 95.2% |
| Tablet | 216 | 73.5% |
| No Computing Device | 14 | 4.8% |
| Total | 294 | 100.0% |
Internet Access in Clarkrange
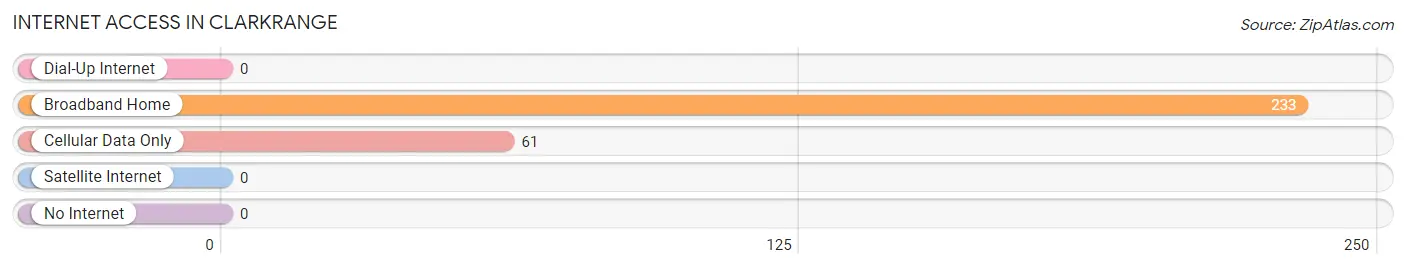
| Internet Type | # Households | % Households |
| Dial-Up Internet | 0 | 0.0% |
| Broadband Home | 233 | 79.2% |
| Cellular Data Only | 61 | 20.7% |
| Satellite Internet | 0 | 0.0% |
| No Internet | 0 | 0.0% |
| Total | 294 | 100.0% |
Clarkrange Summary
History
The area now known as Clarkrange, Tennessee was first settled in the early 1800s by a group of settlers from North Carolina. The area was originally known as “Clark’s Range” after the first settler, William Clark. The area was primarily used for farming and timber production. In 1845, the town was officially incorporated and the name was changed to Clarkrange.
The town grew slowly over the next few decades, but the population began to increase in the late 1800s with the arrival of the railroad. The railroad allowed for the transportation of goods and people to and from the area, which helped to spur economic growth. The town also benefited from the timber industry, which was booming in the area at the time.
In the early 1900s, the town began to experience a period of growth and prosperity. The population increased and new businesses began to open. The town also saw the construction of a new school and a post office.
In the mid-1900s, the town experienced a period of decline. The timber industry began to decline and the railroad stopped running through the town. The population began to decrease and many businesses closed.
In the late 1900s, the town began to experience a period of revitalization. The population began to increase and new businesses began to open. The town also saw the construction of a new library and a community center.
Geography
Clarkrange is located in Fentress County, Tennessee. The town is situated in the Cumberland Plateau region of the state. The town is located at the intersection of State Route 62 and State Route 127. The town is surrounded by rolling hills and forests. The town is located approximately 50 miles from Knoxville and approximately 100 miles from Nashville.
The climate in Clarkrange is generally mild, with temperatures ranging from the mid-30s in the winter to the mid-80s in the summer. The town receives an average of 45 inches of rain per year.
Economy
The economy of Clarkrange is primarily based on agriculture and tourism. The town is home to several farms, which produce a variety of crops, including corn, soybeans, and hay. The town is also home to several tourist attractions, including the Fentress County Museum and the Clarkrange Historical Society.
The town is also home to several small businesses, including restaurants, retail stores, and service providers. The town is also home to a branch of the Fentress County Bank.
Demographics
As of the 2010 census, the population of Clarkrange was 1,093. The population is primarily white (97.2%) and the median age is 44. The median household income is $31,250 and the median home value is $90,000. The town has a poverty rate of 22.3%.
Conclusion
Clarkrange, Tennessee is a small town located in Fentress County. The town has a rich history and has experienced periods of growth and decline over the years. The economy of the town is primarily based on agriculture and tourism. The population of the town is primarily white and the median age is 44. The median household income is $31,250 and the median home value is $90,000. The town has a poverty rate of 22.3%.
Common Questions
What is Per Capita Income in Clarkrange?
Per Capita income in Clarkrange is $23,946.
What is the Median Family Income in Clarkrange?
Median Family Income in Clarkrange is $46,438.
What is the Median Household income in Clarkrange?
Median Household Income in Clarkrange is $48,538.
What is Inequality or Gini Index in Clarkrange?
Inequality or Gini Index in Clarkrange is 0.24.
What is the Total Population of Clarkrange?
Total Population of Clarkrange is 664.
What is the Total Male Population of Clarkrange?
Total Male Population of Clarkrange is 476.
What is the Total Female Population of Clarkrange?
Total Female Population of Clarkrange is 188.
What is the Ratio of Males per 100 Females in Clarkrange?
There are 253.19 Males per 100 Females in Clarkrange.
What is the Ratio of Females per 100 Males in Clarkrange?
There are 39.50 Females per 100 Males in Clarkrange.
What is the Median Population Age in Clarkrange?
Median Population Age in Clarkrange is 38.6 Years.
What is the Average Family Size in Clarkrange
Average Family Size in Clarkrange is 3.0 People.
What is the Average Household Size in Clarkrange
Average Household Size in Clarkrange is 2.3 People.
How Large is the Labor Force in Clarkrange?
There are 271 People in the Labor Forcein in Clarkrange.
What is the Percentage of People in the Labor Force in Clarkrange?
50.5% of People are in the Labor Force in Clarkrange.