Church Hill, TN Map & Demographics
Church Hill Map
Church Hill Overview
$32,532
PER CAPITA INCOME
$85,453
AVG FAMILY INCOME
$65,518
AVG HOUSEHOLD INCOME
43.5%
WAGE / INCOME GAP [ % ]
56.5¢/ $1
WAGE / INCOME GAP [ $ ]
0.40
INEQUALITY / GINI INDEX
7,016
TOTAL POPULATION
3,335
MALE POPULATION
3,681
FEMALE POPULATION
90.60
MALES / 100 FEMALES
110.37
FEMALES / 100 MALES
47.6
MEDIAN AGE
2.8
AVG FAMILY SIZE
2.4
AVG HOUSEHOLD SIZE
3,179
LABOR FORCE [ PEOPLE ]
54.9%
PERCENT IN LABOR FORCE
13.3%
UNEMPLOYMENT RATE
Church Hill Zip Codes
Church Hill Area Codes
Income in Church Hill
Income Overview in Church Hill
Per Capita Income in Church Hill is $32,532, while median incomes of families and households are $85,453 and $65,518 respectively.
| Characteristic | Number | Measure |
| Per Capita Income | 7,016 | $32,532 |
| Median Family Income | 2,165 | $85,453 |
| Mean Family Income | 2,165 | $95,411 |
| Median Household Income | 2,866 | $65,518 |
| Mean Household Income | 2,866 | $81,650 |
| Income Deficit | 2,165 | $0 |
| Wage / Income Gap (%) | 7,016 | 43.49% |
| Wage / Income Gap ($) | 7,016 | 56.51¢ per $1 |
| Gini / Inequality Index | 7,016 | 0.40 |
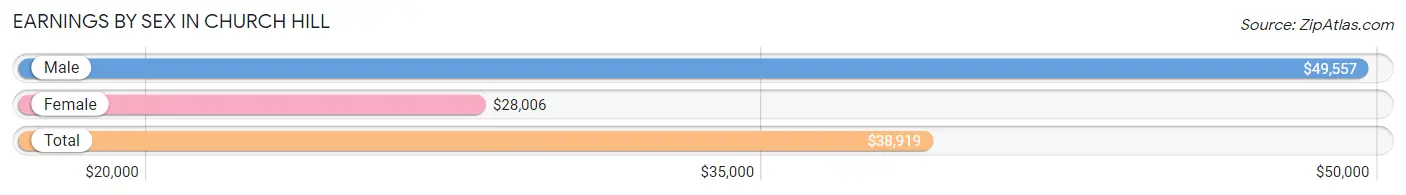
Earnings by Sex in Church Hill
Average Earnings in Church Hill are $38,919, $49,557 for men and $28,006 for women, a difference of 43.5%.
| Sex | Number | Average Earnings |
| Male | 1,661 (49.2%) | $49,557 |
| Female | 1,714 (50.8%) | $28,006 |
| Total | 3,375 (100.0%) | $38,919 |
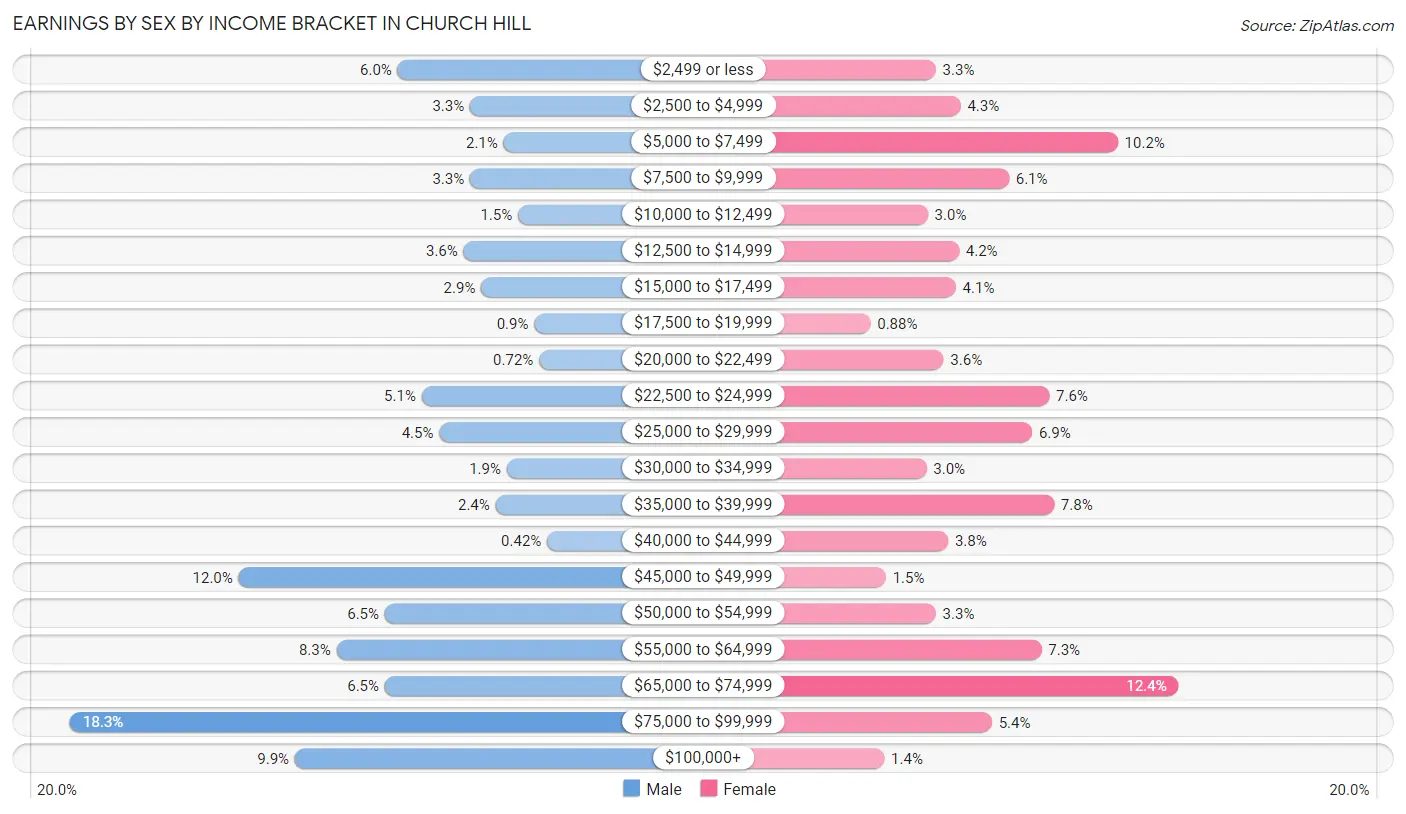
Earnings by Sex by Income Bracket in Church Hill
The most common earnings brackets in Church Hill are $75,000 to $99,999 for men (304 | 18.3%) and $65,000 to $74,999 for women (213 | 12.4%).
| Income | Male | Female |
| $2,499 or less | 100 (6.0%) | 57 (3.3%) |
| $2,500 to $4,999 | 55 (3.3%) | 73 (4.3%) |
| $5,000 to $7,499 | 34 (2.1%) | 174 (10.2%) |
| $7,500 to $9,999 | 55 (3.3%) | 104 (6.1%) |
| $10,000 to $12,499 | 25 (1.5%) | 52 (3.0%) |
| $12,500 to $14,999 | 59 (3.5%) | 72 (4.2%) |
| $15,000 to $17,499 | 48 (2.9%) | 70 (4.1%) |
| $17,500 to $19,999 | 15 (0.9%) | 15 (0.9%) |
| $20,000 to $22,499 | 12 (0.7%) | 62 (3.6%) |
| $22,500 to $24,999 | 85 (5.1%) | 130 (7.6%) |
| $25,000 to $29,999 | 74 (4.5%) | 119 (6.9%) |
| $30,000 to $34,999 | 32 (1.9%) | 51 (3.0%) |
| $35,000 to $39,999 | 39 (2.4%) | 133 (7.8%) |
| $40,000 to $44,999 | 7 (0.4%) | 65 (3.8%) |
| $45,000 to $49,999 | 199 (12.0%) | 25 (1.5%) |
| $50,000 to $54,999 | 108 (6.5%) | 57 (3.3%) |
| $55,000 to $64,999 | 138 (8.3%) | 125 (7.3%) |
| $65,000 to $74,999 | 108 (6.5%) | 213 (12.4%) |
| $75,000 to $99,999 | 304 (18.3%) | 93 (5.4%) |
| $100,000+ | 164 (9.9%) | 24 (1.4%) |
| Total | 1,661 (100.0%) | 1,714 (100.0%) |
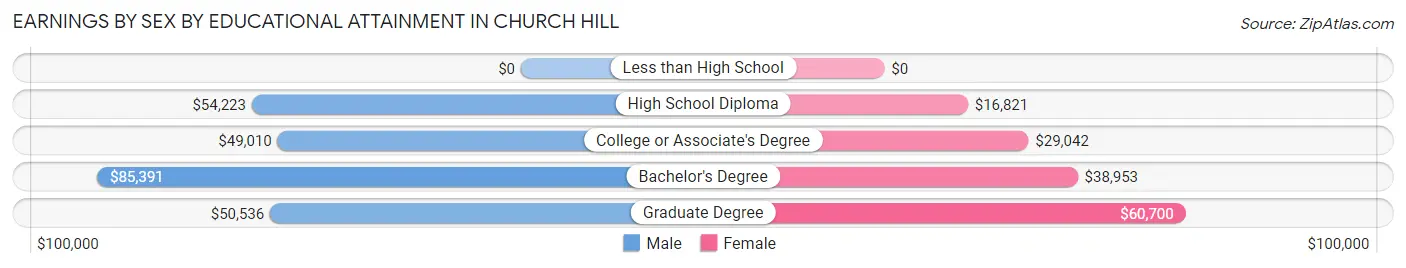
Earnings by Sex by Educational Attainment in Church Hill
Average earnings in Church Hill are $54,756 for men and $31,300 for women, a difference of 42.8%. Men with an educational attainment of bachelor's degree enjoy the highest average annual earnings of $85,391, while those with college or associate's degree education earn the least with $49,010. Women with an educational attainment of graduate degree earn the most with the average annual earnings of $60,700, while those with high school diploma education have the smallest earnings of $16,821.
| Educational Attainment | Male Income | Female Income |
| Less than High School | - | - |
| High School Diploma | $54,223 | $16,821 |
| College or Associate's Degree | $49,010 | $29,042 |
| Bachelor's Degree | $85,391 | $38,953 |
| Graduate Degree | $50,536 | $60,700 |
| Total | $54,756 | $31,300 |
Family Income in Church Hill
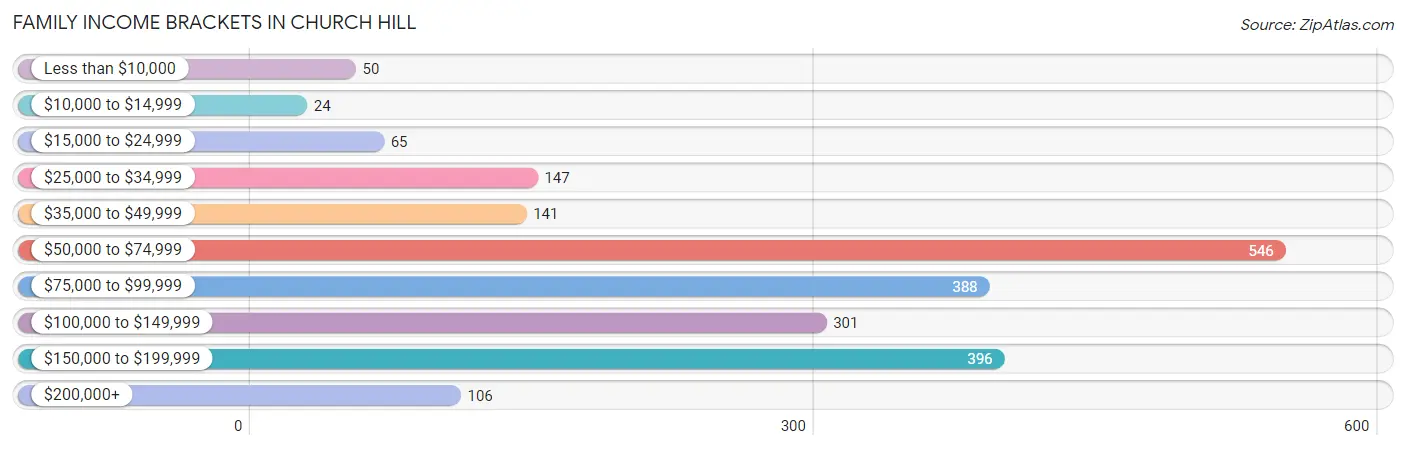
Family Income Brackets in Church Hill
According to the Church Hill family income data, there are 546 families falling into the $50,000 to $74,999 income range, which is the most common income bracket and makes up 25.2% of all families. Conversely, the $10,000 to $14,999 income bracket is the least frequent group with only 24 families (1.1%) belonging to this category.
| Income Bracket | # Families | % Families |
| Less than $10,000 | 50 | 2.3% |
| $10,000 to $14,999 | 24 | 1.1% |
| $15,000 to $24,999 | 65 | 3.0% |
| $25,000 to $34,999 | 147 | 6.8% |
| $35,000 to $49,999 | 141 | 6.5% |
| $50,000 to $74,999 | 546 | 25.2% |
| $75,000 to $99,999 | 388 | 17.9% |
| $100,000 to $149,999 | 301 | 13.9% |
| $150,000 to $199,999 | 396 | 18.3% |
| $200,000+ | 106 | 4.9% |
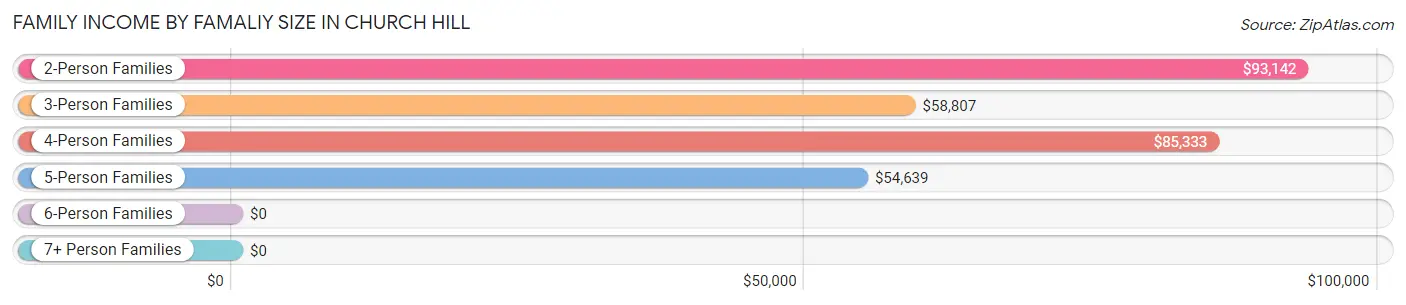
Family Income by Famaliy Size in Church Hill
2-person families (1,319 | 60.9%) account for the highest median family income in Church Hill with $93,142 per family, while 2-person families (1,319 | 60.9%) have the highest median income of $46,571 per family member.
| Income Bracket | # Families | Median Income |
| 2-Person Families | 1,319 (60.9%) | $93,142 |
| 3-Person Families | 381 (17.6%) | $58,807 |
| 4-Person Families | 300 (13.9%) | $85,333 |
| 5-Person Families | 163 (7.5%) | $54,639 |
| 6-Person Families | 2 (0.1%) | $0 |
| 7+ Person Families | 0 (0.0%) | $0 |
| Total | 2,165 (100.0%) | $85,453 |
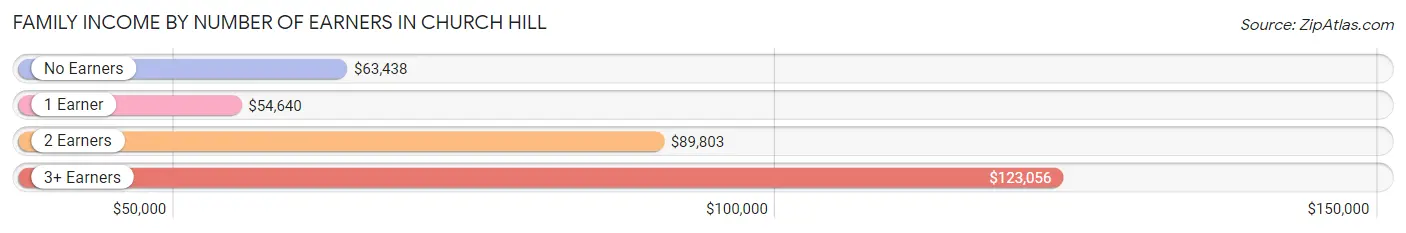
Family Income by Number of Earners in Church Hill
The median family income in Church Hill is $85,453, with families comprising 3+ earners (140) having the highest median family income of $123,056, while families with 1 earner (566) have the lowest median family income of $54,640, accounting for 6.5% and 26.1% of families, respectively.
| Number of Earners | # Families | Median Income |
| No Earners | 492 (22.7%) | $63,438 |
| 1 Earner | 566 (26.1%) | $54,640 |
| 2 Earners | 967 (44.7%) | $89,803 |
| 3+ Earners | 140 (6.5%) | $123,056 |
| Total | 2,165 (100.0%) | $85,453 |
Household Income in Church Hill
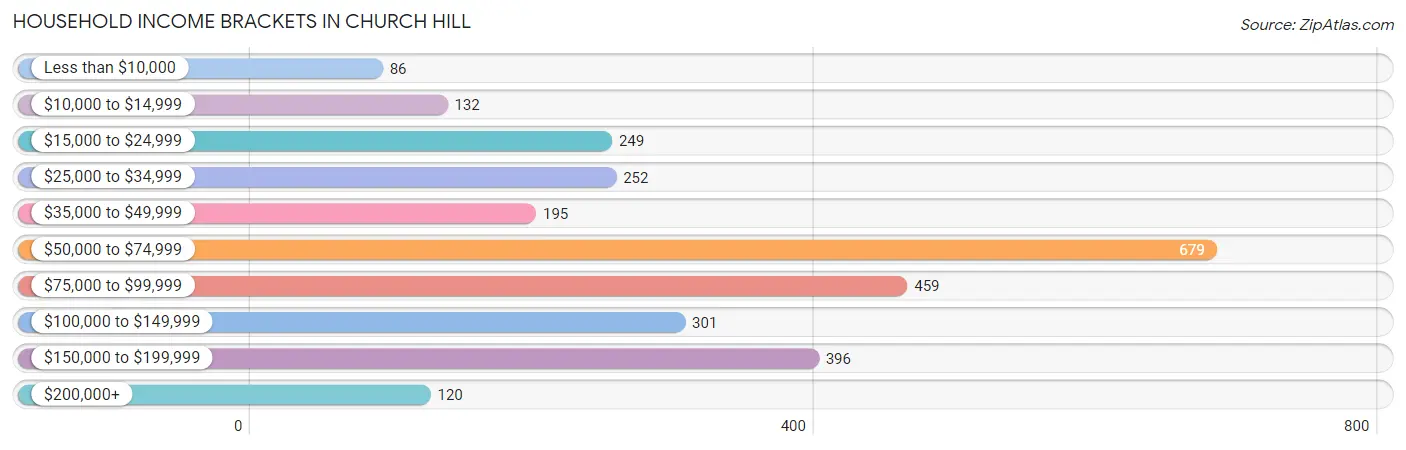
Household Income Brackets in Church Hill
With 679 households falling in the category, the $50,000 to $74,999 income range is the most frequent in Church Hill, accounting for 23.7% of all households. In contrast, only 86 households (3.0%) fall into the less than $10,000 income bracket, making it the least populous group.
| Income Bracket | # Households | % Households |
| Less than $10,000 | 86 | 3.0% |
| $10,000 to $14,999 | 132 | 4.6% |
| $15,000 to $24,999 | 249 | 8.7% |
| $25,000 to $34,999 | 252 | 8.8% |
| $35,000 to $49,999 | 195 | 6.8% |
| $50,000 to $74,999 | 679 | 23.7% |
| $75,000 to $99,999 | 459 | 16.0% |
| $100,000 to $149,999 | 301 | 10.5% |
| $150,000 to $199,999 | 396 | 13.8% |
| $200,000+ | 120 | 4.2% |
Household Income by Householder Age in Church Hill
The median household income in Church Hill is $65,518, with the highest median household income of $93,581 found in the 45 to 64 years age bracket for the primary householder. A total of 1,106 households (38.6%) fall into this category. Meanwhile, the 15 to 24 years age bracket for the primary householder has the lowest median household income of $0, with 42 households (1.5%) in this group.
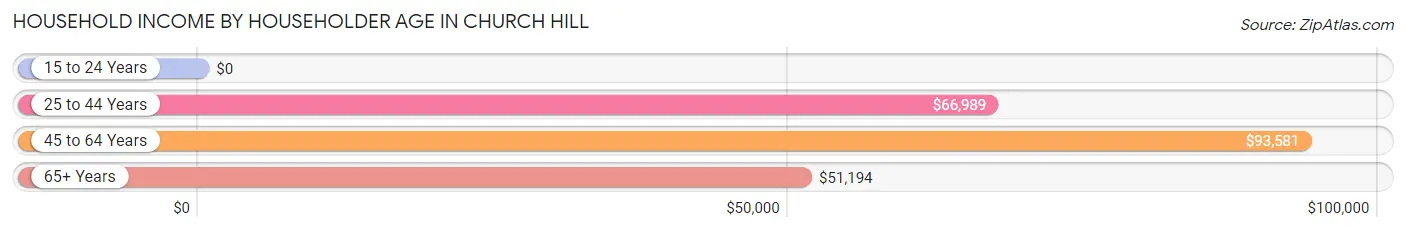
| Income Bracket | # Households | Median Income |
| 15 to 24 Years | 42 (1.5%) | $0 |
| 25 to 44 Years | 631 (22.0%) | $66,989 |
| 45 to 64 Years | 1,106 (38.6%) | $93,581 |
| 65+ Years | 1,087 (37.9%) | $51,194 |
| Total | 2,866 (100.0%) | $65,518 |
Poverty in Church Hill
Income Below Poverty by Sex and Age in Church Hill
With 6.9% poverty level for males and 9.6% for females among the residents of Church Hill, 35 to 44 year old males and 18 to 24 year old females are the most vulnerable to poverty, with 48 males (20.8%) and 77 females (30.7%) in their respective age groups living below the poverty level.
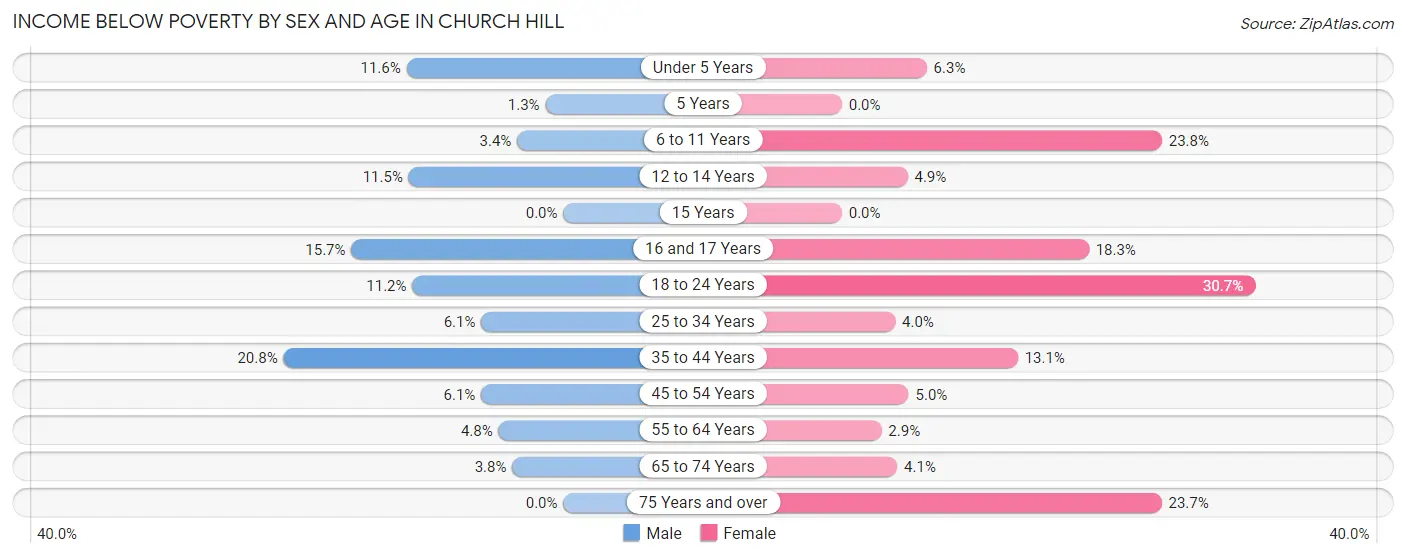
| Age Bracket | Male | Female |
| Under 5 Years | 17 (11.6%) | 15 (6.3%) |
| 5 Years | 2 (1.3%) | 0 (0.0%) |
| 6 to 11 Years | 7 (3.4%) | 24 (23.8%) |
| 12 to 14 Years | 14 (11.5%) | 2 (4.9%) |
| 15 Years | 0 (0.0%) | 0 (0.0%) |
| 16 and 17 Years | 17 (15.7%) | 11 (18.3%) |
| 18 to 24 Years | 24 (11.2%) | 77 (30.7%) |
| 25 to 34 Years | 33 (6.1%) | 18 (4.0%) |
| 35 to 44 Years | 48 (20.8%) | 29 (13.1%) |
| 45 to 54 Years | 23 (6.1%) | 35 (5.0%) |
| 55 to 64 Years | 21 (4.8%) | 12 (2.9%) |
| 65 to 74 Years | 21 (3.8%) | 20 (4.1%) |
| 75 Years and over | 0 (0.0%) | 104 (23.7%) |
| Total | 227 (6.9%) | 347 (9.6%) |
Income Above Poverty by Sex and Age in Church Hill
According to the poverty statistics in Church Hill, males aged 15 years and females aged 5 years are the age groups that are most secure financially, with 100.0% of males and 100.0% of females in these age groups living above the poverty line.
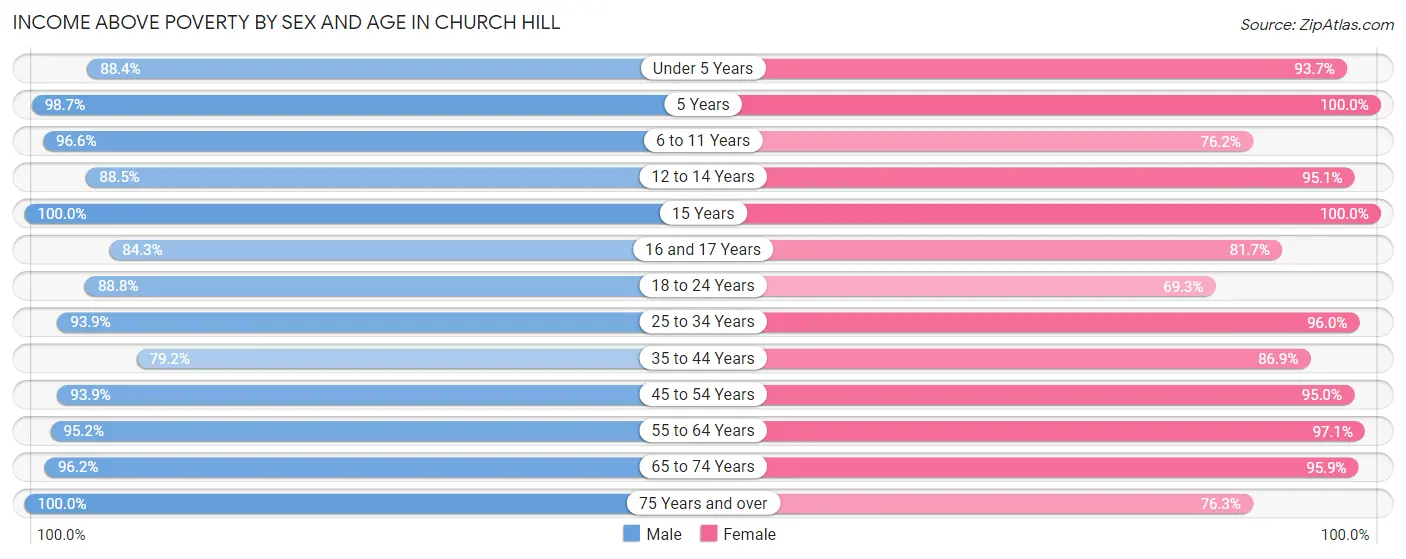
| Age Bracket | Male | Female |
| Under 5 Years | 129 (88.4%) | 223 (93.7%) |
| 5 Years | 148 (98.7%) | 193 (100.0%) |
| 6 to 11 Years | 197 (96.6%) | 77 (76.2%) |
| 12 to 14 Years | 108 (88.5%) | 39 (95.1%) |
| 15 Years | 11 (100.0%) | 20 (100.0%) |
| 16 and 17 Years | 91 (84.3%) | 49 (81.7%) |
| 18 to 24 Years | 190 (88.8%) | 174 (69.3%) |
| 25 to 34 Years | 509 (93.9%) | 437 (96.0%) |
| 35 to 44 Years | 183 (79.2%) | 193 (86.9%) |
| 45 to 54 Years | 354 (93.9%) | 671 (95.0%) |
| 55 to 64 Years | 416 (95.2%) | 396 (97.1%) |
| 65 to 74 Years | 533 (96.2%) | 467 (95.9%) |
| 75 Years and over | 180 (100.0%) | 334 (76.3%) |
| Total | 3,049 (93.1%) | 3,273 (90.4%) |
Income Below Poverty Among Married-Couple Families in Church Hill
The poverty statistics for married-couple families in Church Hill show that 1.1% or 19 of the total 1,745 families live below the poverty line. Families with 1 or 2 children have the highest poverty rate of 1.7%, comprising of 7 families. On the other hand, families with 3 or 4 children have the lowest poverty rate of 0.0%, which includes 0 families.
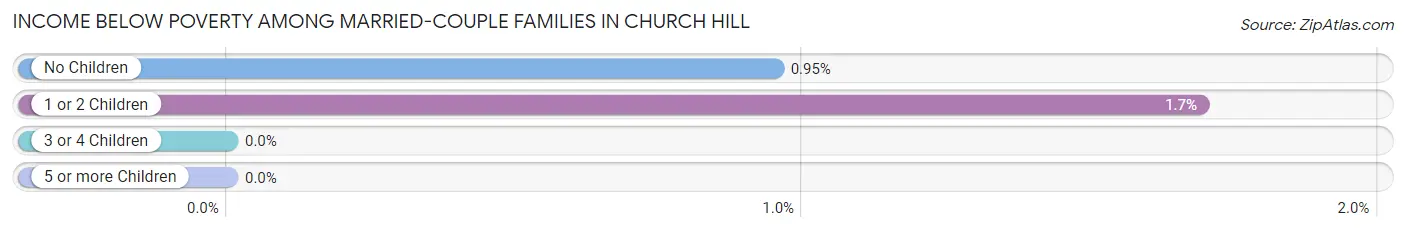
| Children | Above Poverty | Below Poverty |
| No Children | 1,248 (99.1%) | 12 (0.9%) |
| 1 or 2 Children | 407 (98.3%) | 7 (1.7%) |
| 3 or 4 Children | 71 (100.0%) | 0 (0.0%) |
| 5 or more Children | 0 (0.0%) | 0 (0.0%) |
| Total | 1,726 (98.9%) | 19 (1.1%) |
Income Below Poverty Among Single-Parent Households in Church Hill
According to the poverty data in Church Hill, 29.4% or 42 single-father households and 15.2% or 42 single-mother households are living below the poverty line. Among single-father households, those with 1 or 2 children have the highest poverty rate, with 33 households (73.3%) experiencing poverty. Likewise, among single-mother households, those with 5 or more children have the highest poverty rate, with 2 households (100.0%) falling below the poverty line.
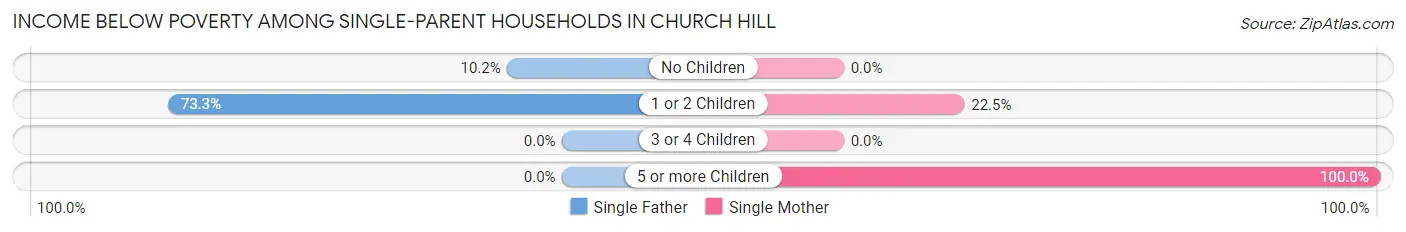
| Children | Single Father | Single Mother |
| No Children | 9 (10.2%) | 0 (0.0%) |
| 1 or 2 Children | 33 (73.3%) | 40 (22.5%) |
| 3 or 4 Children | 0 (0.0%) | 0 (0.0%) |
| 5 or more Children | 0 (0.0%) | 2 (100.0%) |
| Total | 42 (29.4%) | 42 (15.2%) |
Income Below Poverty Among Married-Couple vs Single-Parent Households in Church Hill
The poverty data for Church Hill shows that 19 of the married-couple family households (1.1%) and 84 of the single-parent households (20.0%) are living below the poverty level. Within the married-couple family households, those with 1 or 2 children have the highest poverty rate, with 7 households (1.7%) falling below the poverty line. Among the single-parent households, those with 5 or more children have the highest poverty rate, with 2 household (100.0%) living below poverty.
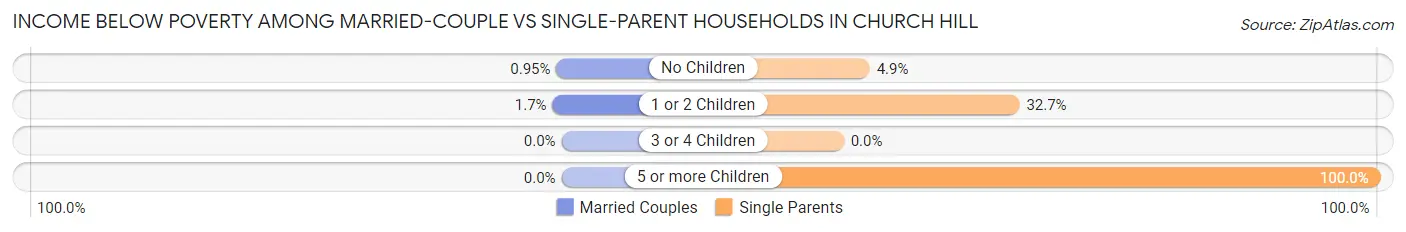
| Children | Married-Couple Families | Single-Parent Households |
| No Children | 12 (0.9%) | 9 (4.9%) |
| 1 or 2 Children | 7 (1.7%) | 73 (32.7%) |
| 3 or 4 Children | 0 (0.0%) | 0 (0.0%) |
| 5 or more Children | 0 (0.0%) | 2 (100.0%) |
| Total | 19 (1.1%) | 84 (20.0%) |
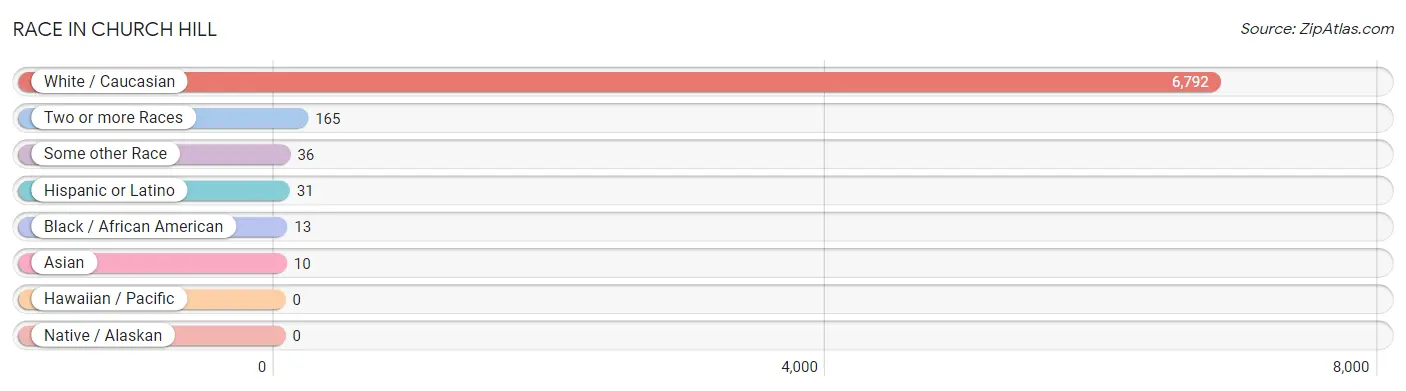
Race in Church Hill
The most populous races in Church Hill are White / Caucasian (6,792 | 96.8%), Two or more Races (165 | 2.4%), and Some other Race (36 | 0.5%).
| Race | # Population | % Population |
| Asian | 10 | 0.1% |
| Black / African American | 13 | 0.2% |
| Hawaiian / Pacific | 0 | 0.0% |
| Hispanic or Latino | 31 | 0.4% |
| Native / Alaskan | 0 | 0.0% |
| White / Caucasian | 6,792 | 96.8% |
| Two or more Races | 165 | 2.4% |
| Some other Race | 36 | 0.5% |
| Total | 7,016 | 100.0% |
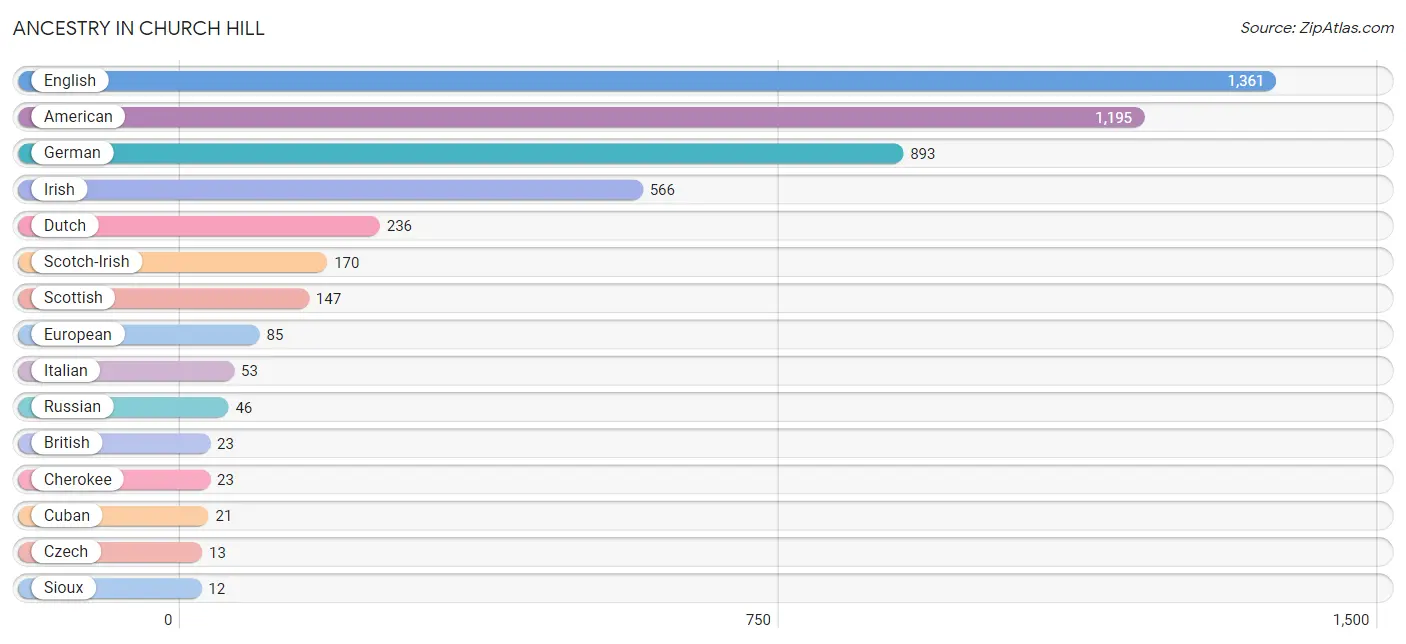
Ancestry in Church Hill
The most populous ancestries reported in Church Hill are English (1,361 | 19.4%), American (1,195 | 17.0%), German (893 | 12.7%), Irish (566 | 8.1%), and Dutch (236 | 3.4%), together accounting for 60.6% of all Church Hill residents.
| Ancestry | # Population | % Population |
| American | 1,195 | 17.0% |
| British | 23 | 0.3% |
| Cherokee | 23 | 0.3% |
| Cuban | 21 | 0.3% |
| Czech | 13 | 0.2% |
| Dutch | 236 | 3.4% |
| English | 1,361 | 19.4% |
| European | 85 | 1.2% |
| French | 6 | 0.1% |
| German | 893 | 12.7% |
| Irish | 566 | 8.1% |
| Italian | 53 | 0.8% |
| Mexican | 10 | 0.1% |
| Navajo | 4 | 0.1% |
| Pakistani | 10 | 0.1% |
| Polish | 10 | 0.1% |
| Russian | 46 | 0.7% |
| Scotch-Irish | 170 | 2.4% |
| Scottish | 147 | 2.1% |
| Sioux | 12 | 0.2% | View All 20 Rows |
Immigrants in Church Hill
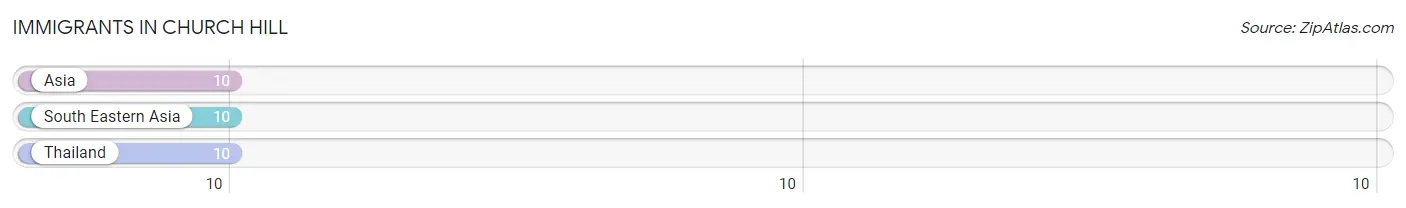
The most numerous immigrant groups reported in Church Hill came from Asia (10 | 0.1%), South Eastern Asia (10 | 0.1%), and Thailand (10 | 0.1%), together accounting for 0.4% of all Church Hill residents.
| Immigration Origin | # Population | % Population |
| Asia | 10 | 0.1% |
| South Eastern Asia | 10 | 0.1% |
| Thailand | 10 | 0.1% | View All 3 Rows |
Sex and Age in Church Hill
Sex and Age in Church Hill
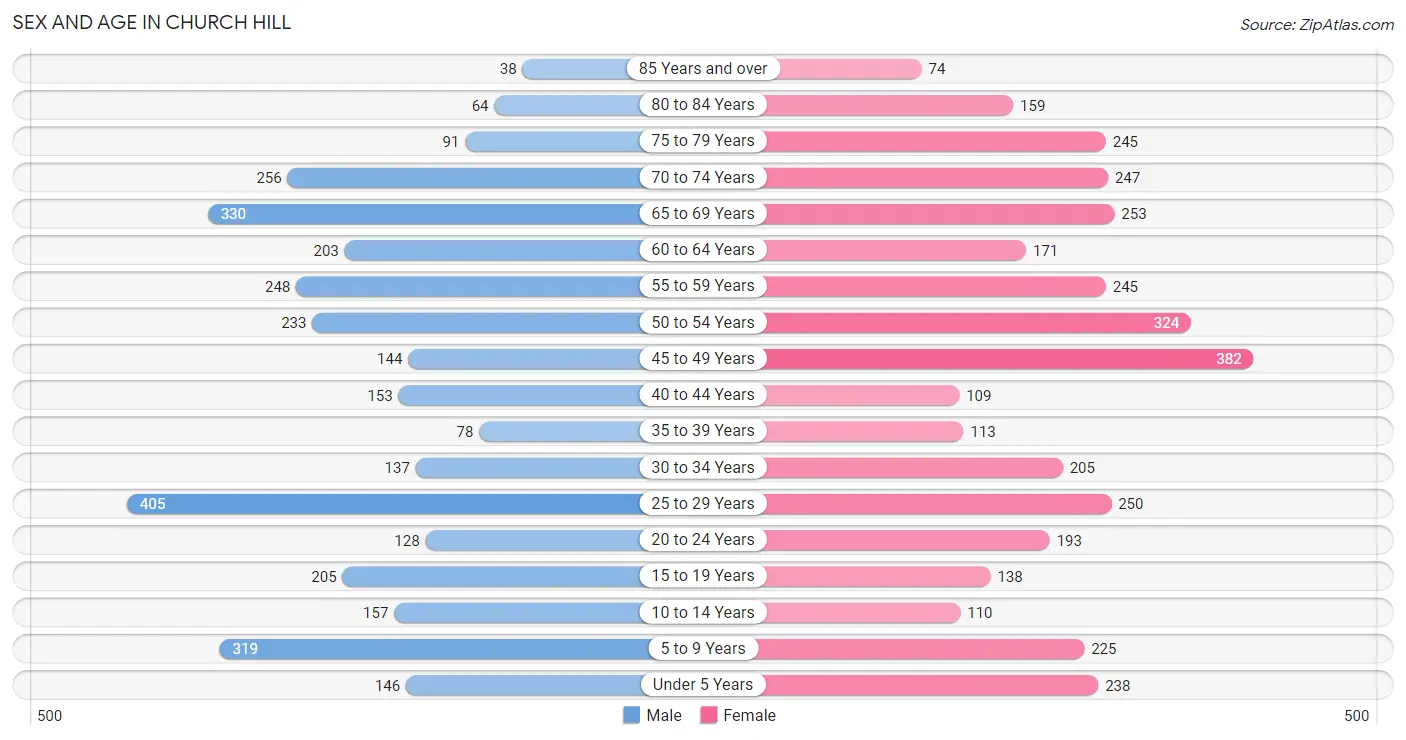
The most populous age groups in Church Hill are 25 to 29 Years (405 | 12.1%) for men and 45 to 49 Years (382 | 10.4%) for women.
| Age Bracket | Male | Female |
| Under 5 Years | 146 (4.4%) | 238 (6.5%) |
| 5 to 9 Years | 319 (9.6%) | 225 (6.1%) |
| 10 to 14 Years | 157 (4.7%) | 110 (3.0%) |
| 15 to 19 Years | 205 (6.1%) | 138 (3.7%) |
| 20 to 24 Years | 128 (3.8%) | 193 (5.2%) |
| 25 to 29 Years | 405 (12.1%) | 250 (6.8%) |
| 30 to 34 Years | 137 (4.1%) | 205 (5.6%) |
| 35 to 39 Years | 78 (2.3%) | 113 (3.1%) |
| 40 to 44 Years | 153 (4.6%) | 109 (3.0%) |
| 45 to 49 Years | 144 (4.3%) | 382 (10.4%) |
| 50 to 54 Years | 233 (7.0%) | 324 (8.8%) |
| 55 to 59 Years | 248 (7.4%) | 245 (6.7%) |
| 60 to 64 Years | 203 (6.1%) | 171 (4.6%) |
| 65 to 69 Years | 330 (9.9%) | 253 (6.9%) |
| 70 to 74 Years | 256 (7.7%) | 247 (6.7%) |
| 75 to 79 Years | 91 (2.7%) | 245 (6.7%) |
| 80 to 84 Years | 64 (1.9%) | 159 (4.3%) |
| 85 Years and over | 38 (1.1%) | 74 (2.0%) |
| Total | 3,335 (100.0%) | 3,681 (100.0%) |
Families and Households in Church Hill
Median Family Size in Church Hill
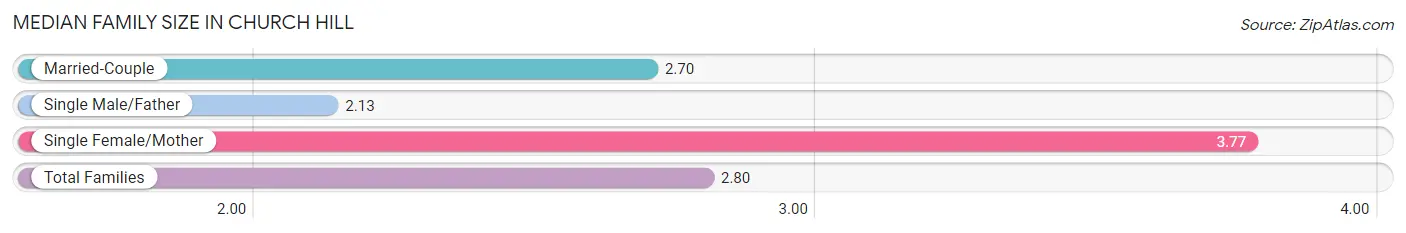
The median family size in Church Hill is 2.80 persons per family, with single female/mother families (277 | 12.8%) accounting for the largest median family size of 3.77 persons per family. On the other hand, single male/father families (143 | 6.6%) represent the smallest median family size with 2.13 persons per family.
| Family Type | # Families | Family Size |
| Married-Couple | 1,745 (80.6%) | 2.70 |
| Single Male/Father | 143 (6.6%) | 2.13 |
| Single Female/Mother | 277 (12.8%) | 3.77 |
| Total Families | 2,165 (100.0%) | 2.80 |
Median Household Size in Church Hill
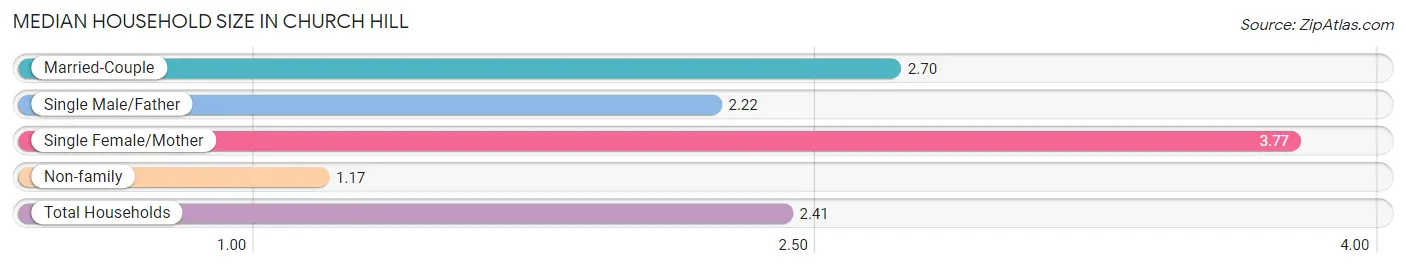
The median household size in Church Hill is 2.41 persons per household, with single female/mother households (277 | 9.7%) accounting for the largest median household size of 3.77 persons per household. non-family households (701 | 24.5%) represent the smallest median household size with 1.17 persons per household.
| Household Type | # Households | Household Size |
| Married-Couple | 1,745 (60.9%) | 2.70 |
| Single Male/Father | 143 (5.0%) | 2.22 |
| Single Female/Mother | 277 (9.7%) | 3.77 |
| Non-family | 701 (24.5%) | 1.17 |
| Total Households | 2,866 (100.0%) | 2.41 |
Household Size by Marriage Status in Church Hill
Out of a total of 2,866 households in Church Hill, 2,165 (75.5%) are family households, while 701 (24.5%) are nonfamily households. The most numerous type of family households are 2-person households, comprising 1,319, and the most common type of nonfamily households are 1-person households, comprising 633.
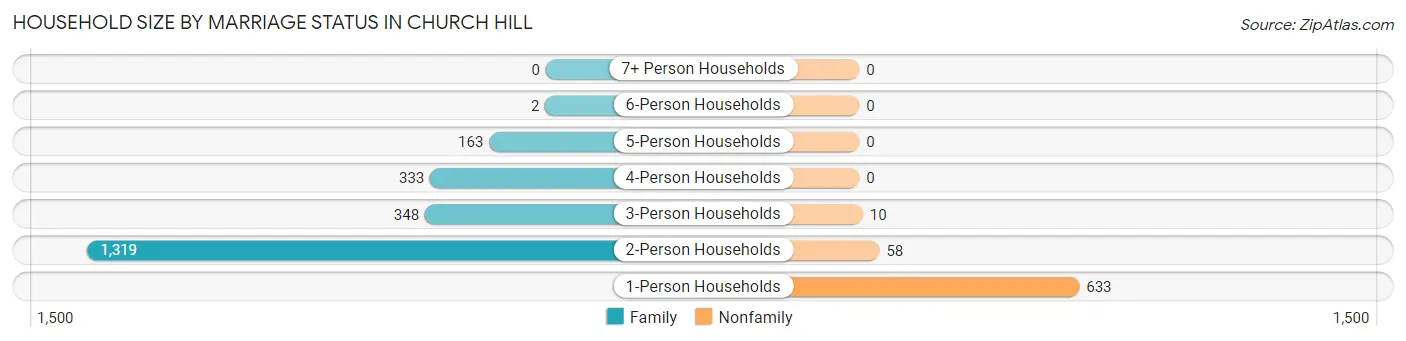
| Household Size | Family Households | Nonfamily Households |
| 1-Person Households | - | 633 (22.1%) |
| 2-Person Households | 1,319 (46.0%) | 58 (2.0%) |
| 3-Person Households | 348 (12.1%) | 10 (0.4%) |
| 4-Person Households | 333 (11.6%) | 0 (0.0%) |
| 5-Person Households | 163 (5.7%) | 0 (0.0%) |
| 6-Person Households | 2 (0.1%) | 0 (0.0%) |
| 7+ Person Households | 0 (0.0%) | 0 (0.0%) |
| Total | 2,165 (75.5%) | 701 (24.5%) |
Female Fertility in Church Hill
Fertility by Age in Church Hill
Average fertility rate in Church Hill is 78.0 births per 1,000 women. Women in the age bracket of 20 to 34 years have the highest fertility rate with 184.0 births per 1,000 women. Women in the age bracket of 20 to 34 years acount for 100.0% of all women with births.
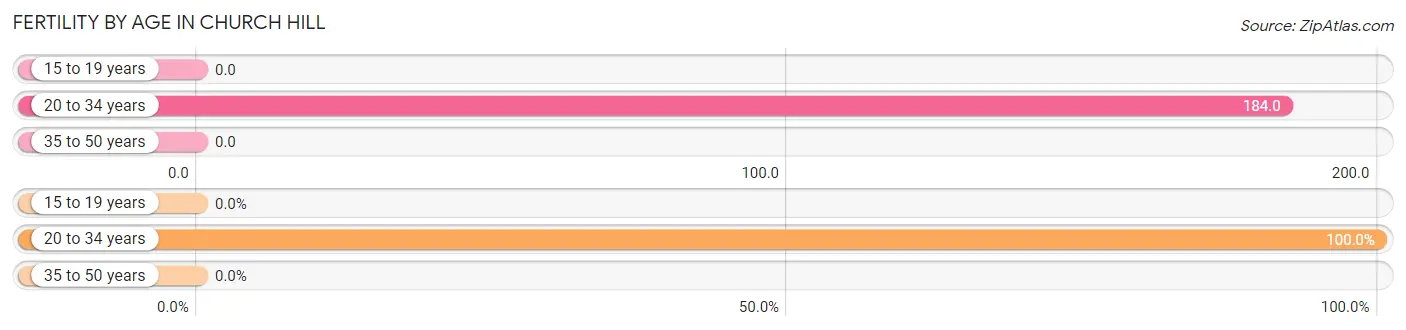
| Age Bracket | Women with Births | Births / 1,000 Women |
| 15 to 19 years | 0 (0.0%) | 0.0 |
| 20 to 34 years | 119 (100.0%) | 184.0 |
| 35 to 50 years | 0 (0.0%) | 0.0 |
| Total | 119 (100.0%) | 78.0 |
Fertility by Age by Marriage Status in Church Hill
85.7% of women with births (119) in Church Hill are married. The highest percentage of unmarried women with births falls into 20 to 34 years age bracket with 14.3% of them unmarried at the time of birth, while the lowest percentage of unmarried women with births belong to 20 to 34 years age bracket with 14.3% of them unmarried.
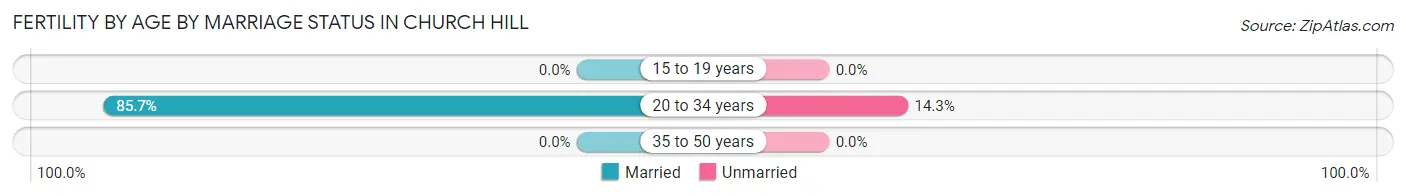
| Age Bracket | Married | Unmarried |
| 15 to 19 years | 0 (0.0%) | 0 (0.0%) |
| 20 to 34 years | 102 (85.7%) | 17 (14.3%) |
| 35 to 50 years | 0 (0.0%) | 0 (0.0%) |
| Total | 102 (85.7%) | 17 (14.3%) |
Fertility by Education in Church Hill
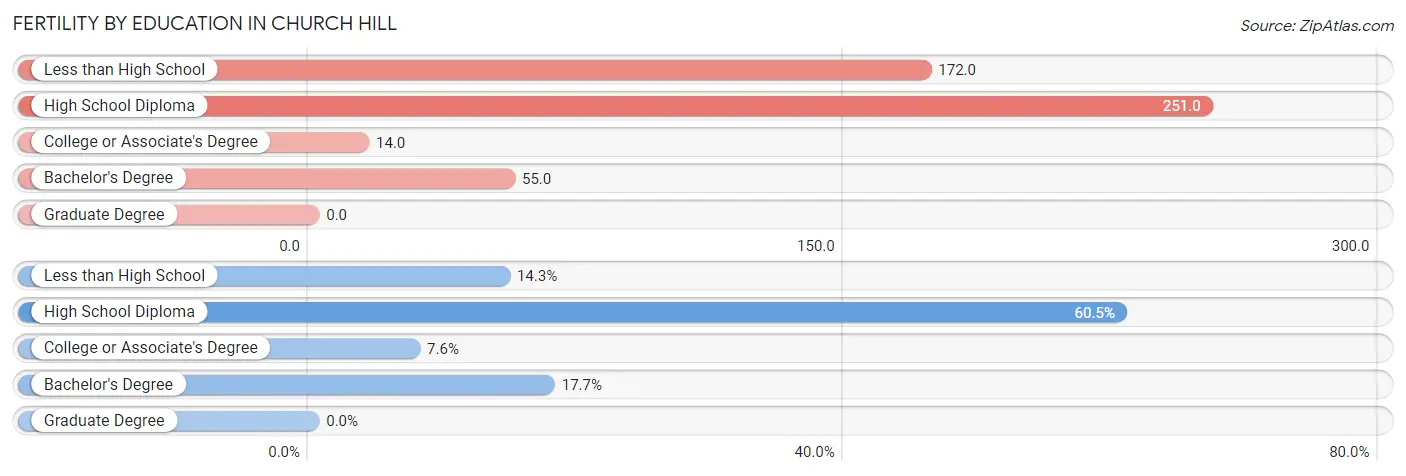
| Educational Attainment | Women with Births | Births / 1,000 Women |
| Less than High School | 17 (14.3%) | 172.0 |
| High School Diploma | 72 (60.5%) | 251.0 |
| College or Associate's Degree | 9 (7.6%) | 14.0 |
| Bachelor's Degree | 21 (17.6%) | 55.0 |
| Graduate Degree | 0 (0.0%) | 0.0 |
| Total | 119 (100.0%) | 78.0 |
Fertility by Education by Marriage Status in Church Hill
14.3% of women with births in Church Hill are unmarried. Women with the educational attainment of high school diploma are most likely to be married with 100.0% of them married at childbirth, while women with the educational attainment of less than high school are least likely to be married with 100.0% of them unmarried at childbirth.
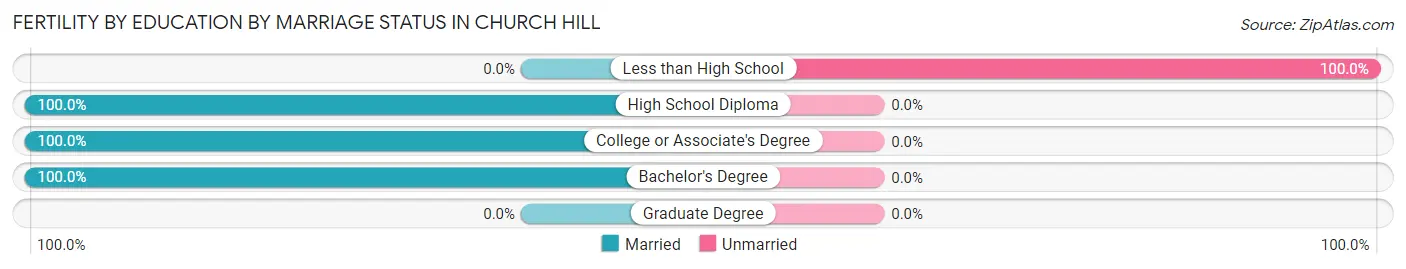
| Educational Attainment | Married | Unmarried |
| Less than High School | 0 (0.0%) | 17 (100.0%) |
| High School Diploma | 72 (100.0%) | 0 (0.0%) |
| College or Associate's Degree | 9 (100.0%) | 0 (0.0%) |
| Bachelor's Degree | 21 (100.0%) | 0 (0.0%) |
| Graduate Degree | 0 (0.0%) | 0 (0.0%) |
| Total | 102 (85.7%) | 17 (14.3%) |
Employment Characteristics in Church Hill
Employment by Class of Employer in Church Hill
Among the 2,699 employed individuals in Church Hill, private company employees (1,689 | 62.6%), not-for-profit organizations (305 | 11.3%), and local government employees (290 | 10.7%) make up the most common classes of employment.
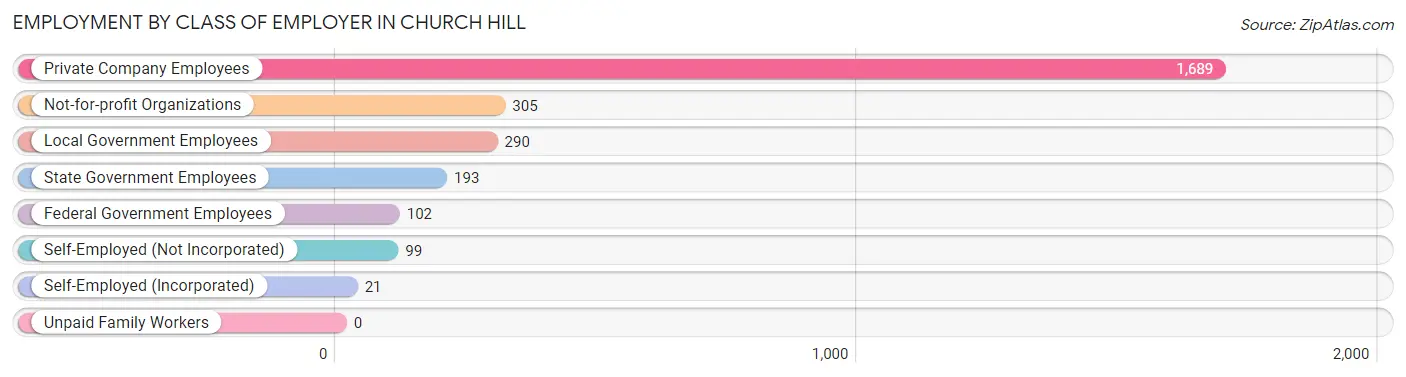
| Employer Class | # Employees | % Employees |
| Private Company Employees | 1,689 | 62.6% |
| Self-Employed (Incorporated) | 21 | 0.8% |
| Self-Employed (Not Incorporated) | 99 | 3.7% |
| Not-for-profit Organizations | 305 | 11.3% |
| Local Government Employees | 290 | 10.7% |
| State Government Employees | 193 | 7.1% |
| Federal Government Employees | 102 | 3.8% |
| Unpaid Family Workers | 0 | 0.0% |
| Total | 2,699 | 100.0% |
Employment Status by Age in Church Hill
According to the labor force statistics for Church Hill, out of the total population over 16 years of age (5,790), 54.9% or 3,179 individuals are in the labor force, with 13.3% or 423 of them unemployed. The age group with the highest labor force participation rate is 25 to 29 years, with 95.4% or 625 individuals in the labor force. Within the labor force, the 35 to 44 years age range has the highest percentage of unemployed individuals, with 31.1% or 124 of them being unemployed.
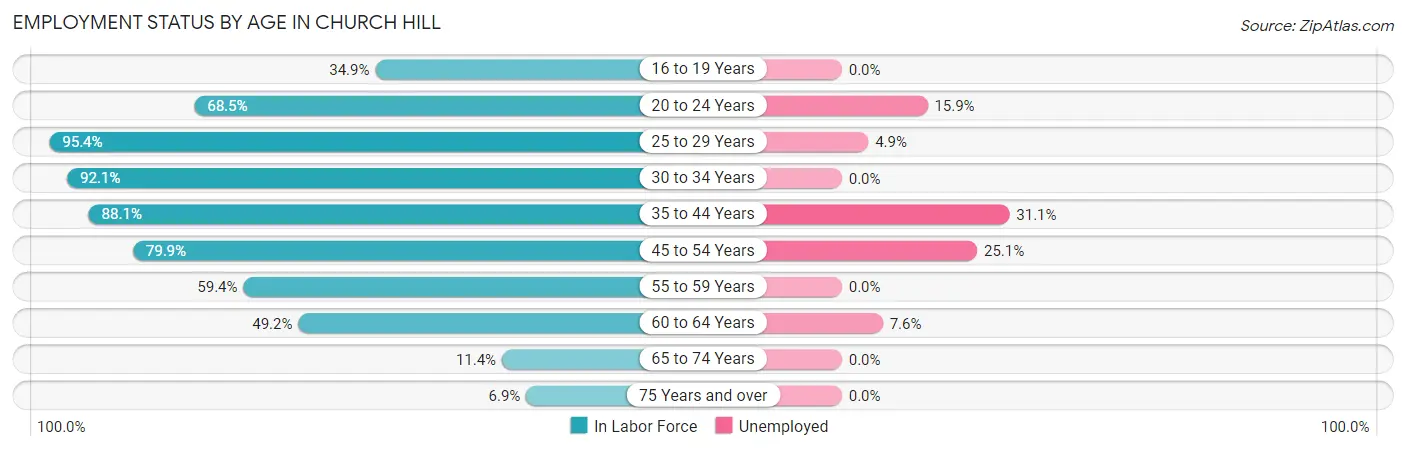
| Age Bracket | In Labor Force | Unemployed |
| 16 to 19 Years | 109 (34.9%) | 0 (0.0%) |
| 20 to 24 Years | 220 (68.5%) | 35 (15.9%) |
| 25 to 29 Years | 625 (95.4%) | 31 (4.9%) |
| 30 to 34 Years | 315 (92.1%) | 0 (0.0%) |
| 35 to 44 Years | 399 (88.1%) | 124 (31.1%) |
| 45 to 54 Years | 865 (79.9%) | 217 (25.1%) |
| 55 to 59 Years | 293 (59.4%) | 0 (0.0%) |
| 60 to 64 Years | 184 (49.2%) | 14 (7.6%) |
| 65 to 74 Years | 124 (11.4%) | 0 (0.0%) |
| 75 Years and over | 46 (6.9%) | 0 (0.0%) |
| Total | 3,179 (54.9%) | 423 (13.3%) |
Employment Status by Educational Attainment in Church Hill
According to labor force statistics for Church Hill, 78.9% of individuals (2,683) out of the total population between 25 and 64 years of age (3,400) are in the labor force, with 14.5% or 389 of them being unemployed. The group with the highest labor force participation rate are those with the educational attainment of bachelor's degree or higher, with 86.9% or 691 individuals in the labor force. Within the labor force, individuals with less than high school education have the highest percentage of unemployment, with 27.3% or 15 of them being unemployed.
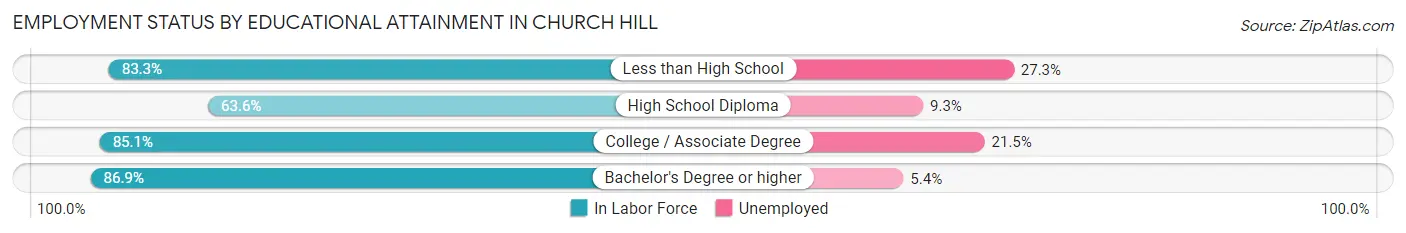
| Educational Attainment | In Labor Force | Unemployed |
| Less than High School | 55 (83.3%) | 18 (27.3%) |
| High School Diploma | 667 (63.6%) | 98 (9.3%) |
| College / Associate Degree | 1,268 (85.1%) | 320 (21.5%) |
| Bachelor's Degree or higher | 691 (86.9%) | 43 (5.4%) |
| Total | 2,683 (78.9%) | 493 (14.5%) |
Employment Occupations by Sex in Church Hill
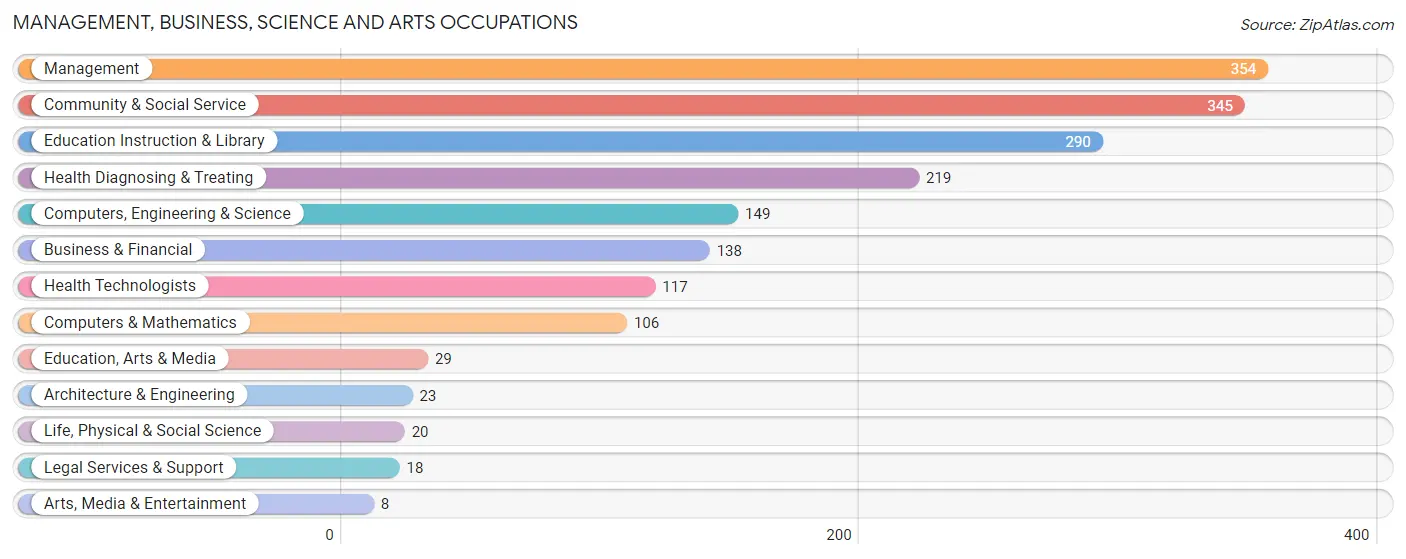
Management, Business, Science and Arts Occupations
The most common Management, Business, Science and Arts occupations in Church Hill are Management (354 | 13.0%), Community & Social Service (345 | 12.7%), Education Instruction & Library (290 | 10.6%), Health Diagnosing & Treating (219 | 8.0%), and Computers, Engineering & Science (149 | 5.5%).
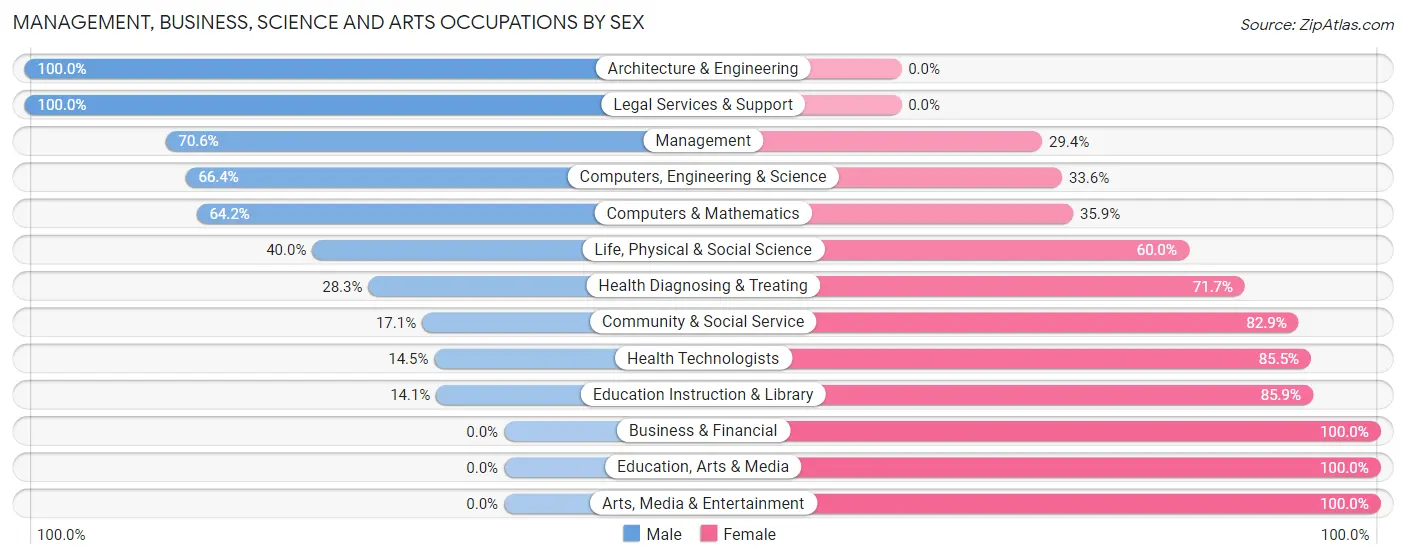
Management, Business, Science and Arts Occupations by Sex
Within the Management, Business, Science and Arts occupations in Church Hill, the most male-oriented occupations are Architecture & Engineering (100.0%), Legal Services & Support (100.0%), and Management (70.6%), while the most female-oriented occupations are Business & Financial (100.0%), Education, Arts & Media (100.0%), and Arts, Media & Entertainment (100.0%).
| Occupation | Male | Female |
| Management | 250 (70.6%) | 104 (29.4%) |
| Business & Financial | 0 (0.0%) | 138 (100.0%) |
| Computers, Engineering & Science | 99 (66.4%) | 50 (33.6%) |
| Computers & Mathematics | 68 (64.1%) | 38 (35.8%) |
| Architecture & Engineering | 23 (100.0%) | 0 (0.0%) |
| Life, Physical & Social Science | 8 (40.0%) | 12 (60.0%) |
| Community & Social Service | 59 (17.1%) | 286 (82.9%) |
| Education, Arts & Media | 0 (0.0%) | 29 (100.0%) |
| Legal Services & Support | 18 (100.0%) | 0 (0.0%) |
| Education Instruction & Library | 41 (14.1%) | 249 (85.9%) |
| Arts, Media & Entertainment | 0 (0.0%) | 8 (100.0%) |
| Health Diagnosing & Treating | 62 (28.3%) | 157 (71.7%) |
| Health Technologists | 17 (14.5%) | 100 (85.5%) |
| Total (Category) | 470 (39.0%) | 735 (61.0%) |
| Total (Overall) | 1,387 (50.8%) | 1,341 (49.2%) |
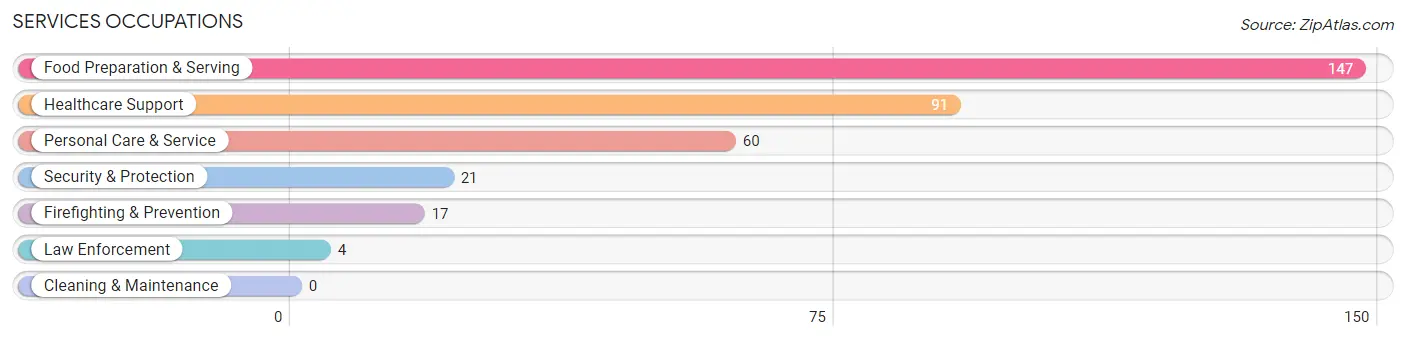
Services Occupations
The most common Services occupations in Church Hill are Food Preparation & Serving (147 | 5.4%), Healthcare Support (91 | 3.3%), Personal Care & Service (60 | 2.2%), Security & Protection (21 | 0.8%), and Firefighting & Prevention (17 | 0.6%).
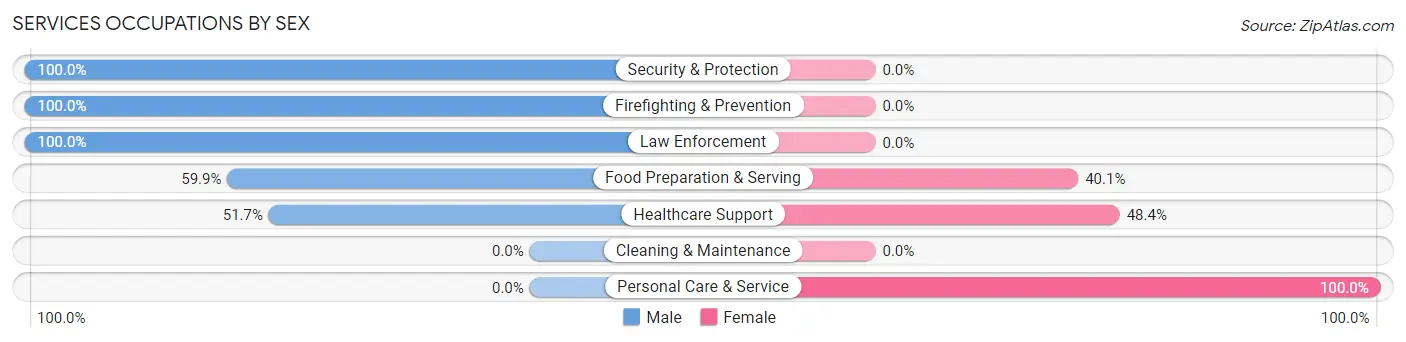
Services Occupations by Sex
Within the Services occupations in Church Hill, the most male-oriented occupations are Security & Protection (100.0%), Firefighting & Prevention (100.0%), and Law Enforcement (100.0%), while the most female-oriented occupations are Personal Care & Service (100.0%), Healthcare Support (48.3%), and Food Preparation & Serving (40.1%).
| Occupation | Male | Female |
| Healthcare Support | 47 (51.6%) | 44 (48.3%) |
| Security & Protection | 21 (100.0%) | 0 (0.0%) |
| Firefighting & Prevention | 17 (100.0%) | 0 (0.0%) |
| Law Enforcement | 4 (100.0%) | 0 (0.0%) |
| Food Preparation & Serving | 88 (59.9%) | 59 (40.1%) |
| Cleaning & Maintenance | 0 (0.0%) | 0 (0.0%) |
| Personal Care & Service | 0 (0.0%) | 60 (100.0%) |
| Total (Category) | 156 (48.9%) | 163 (51.1%) |
| Total (Overall) | 1,387 (50.8%) | 1,341 (49.2%) |
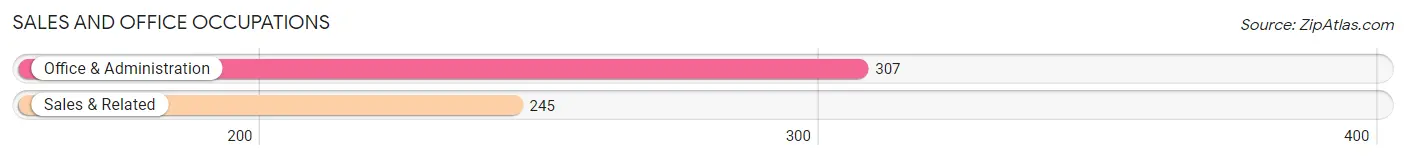
Sales and Office Occupations
The most common Sales and Office occupations in Church Hill are Office & Administration (307 | 11.3%), and Sales & Related (245 | 9.0%).
Sales and Office Occupations by Sex
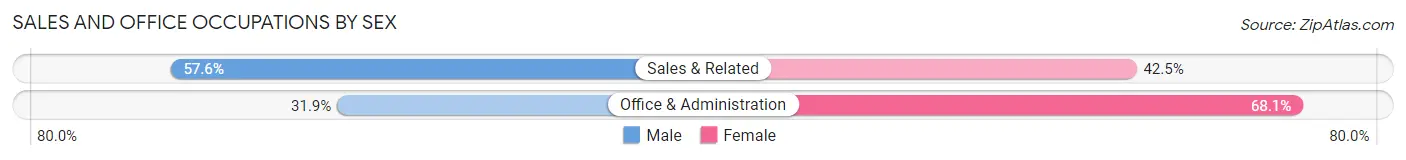
| Occupation | Male | Female |
| Sales & Related | 141 (57.6%) | 104 (42.4%) |
| Office & Administration | 98 (31.9%) | 209 (68.1%) |
| Total (Category) | 239 (43.3%) | 313 (56.7%) |
| Total (Overall) | 1,387 (50.8%) | 1,341 (49.2%) |
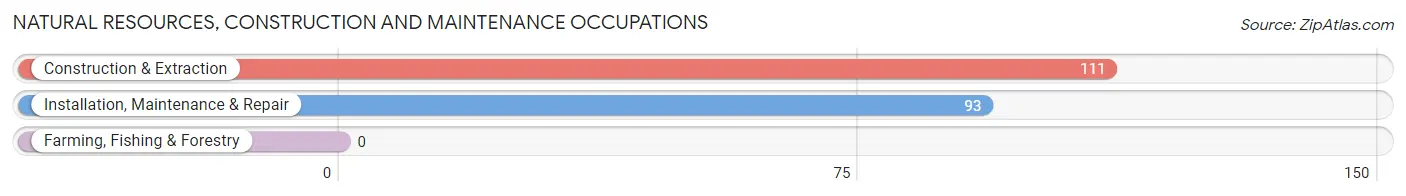
Natural Resources, Construction and Maintenance Occupations
The most common Natural Resources, Construction and Maintenance occupations in Church Hill are Construction & Extraction (111 | 4.1%), and Installation, Maintenance & Repair (93 | 3.4%).
Natural Resources, Construction and Maintenance Occupations by Sex
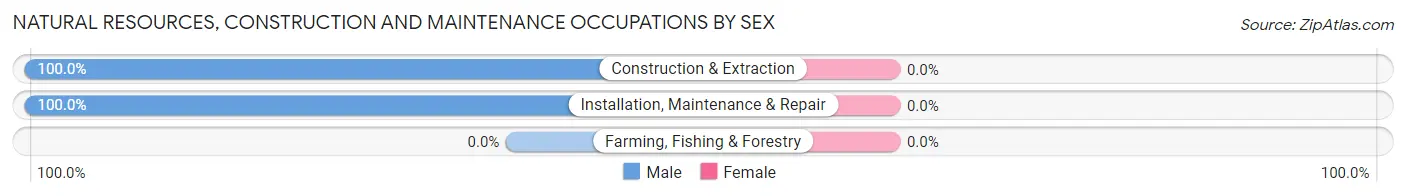
| Occupation | Male | Female |
| Farming, Fishing & Forestry | 0 (0.0%) | 0 (0.0%) |
| Construction & Extraction | 111 (100.0%) | 0 (0.0%) |
| Installation, Maintenance & Repair | 93 (100.0%) | 0 (0.0%) |
| Total (Category) | 204 (100.0%) | 0 (0.0%) |
| Total (Overall) | 1,387 (50.8%) | 1,341 (49.2%) |
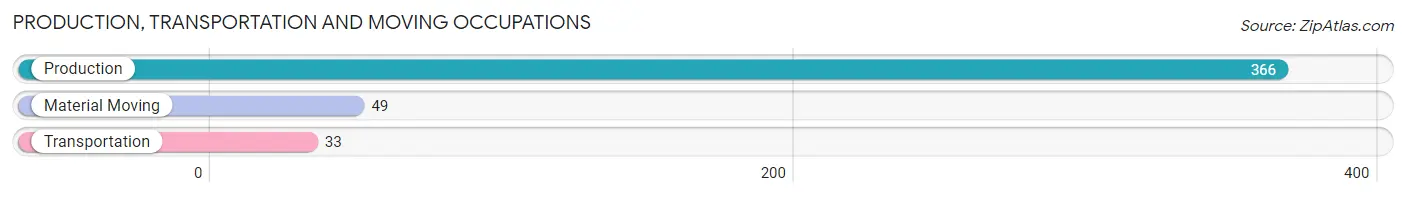
Production, Transportation and Moving Occupations
The most common Production, Transportation and Moving occupations in Church Hill are Production (366 | 13.4%), Material Moving (49 | 1.8%), and Transportation (33 | 1.2%).
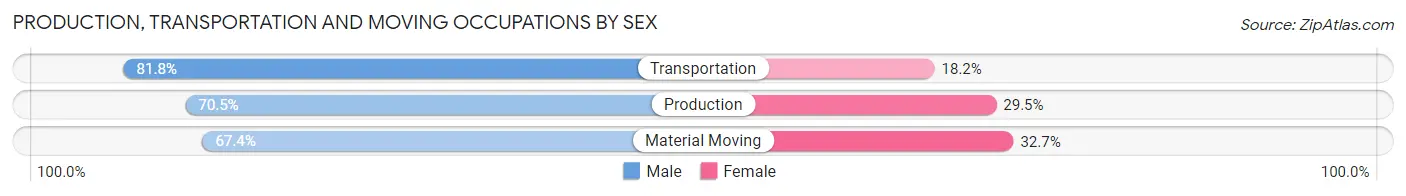
Production, Transportation and Moving Occupations by Sex
| Occupation | Male | Female |
| Production | 258 (70.5%) | 108 (29.5%) |
| Transportation | 27 (81.8%) | 6 (18.2%) |
| Material Moving | 33 (67.3%) | 16 (32.7%) |
| Total (Category) | 318 (71.0%) | 130 (29.0%) |
| Total (Overall) | 1,387 (50.8%) | 1,341 (49.2%) |
Employment Industries by Sex in Church Hill
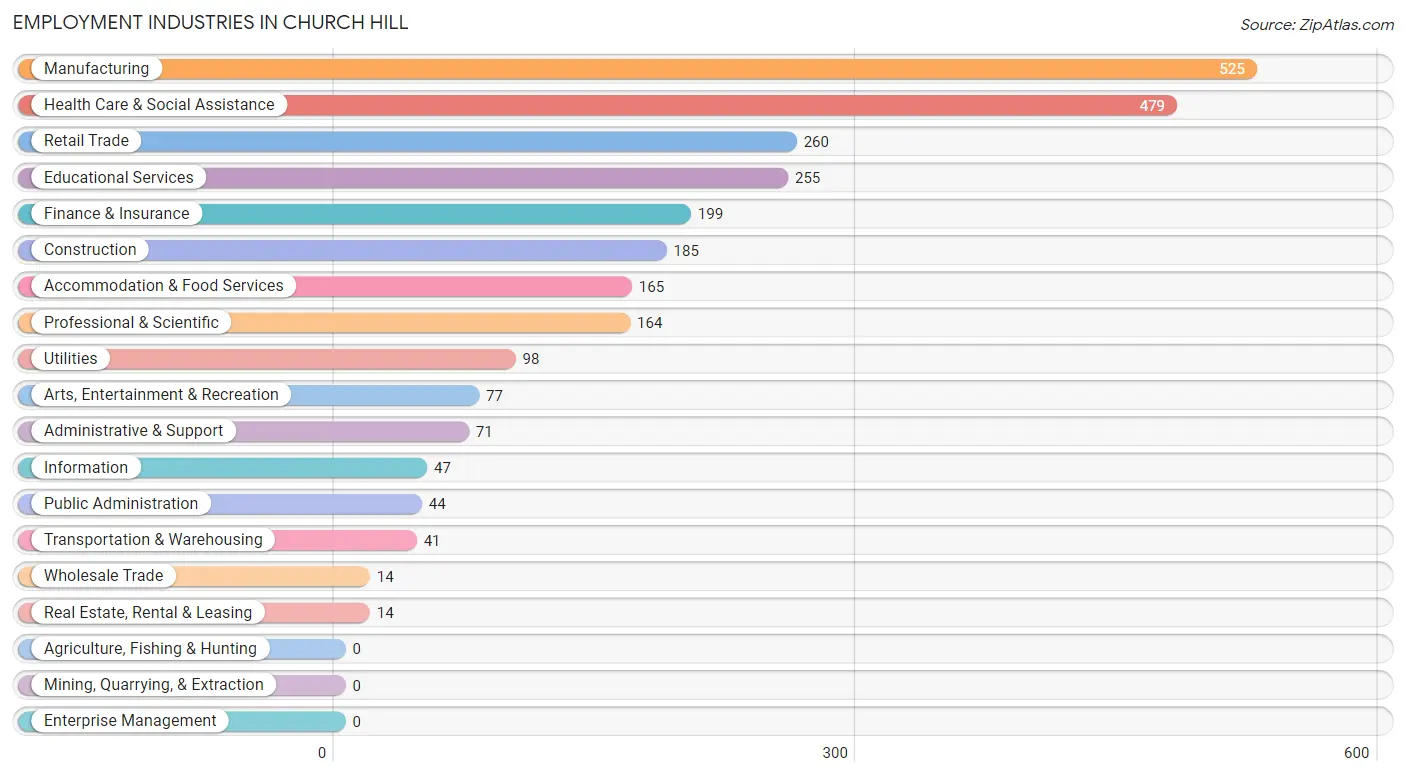
Employment Industries in Church Hill
The major employment industries in Church Hill include Manufacturing (525 | 19.2%), Health Care & Social Assistance (479 | 17.6%), Retail Trade (260 | 9.5%), Educational Services (255 | 9.3%), and Finance & Insurance (199 | 7.3%).
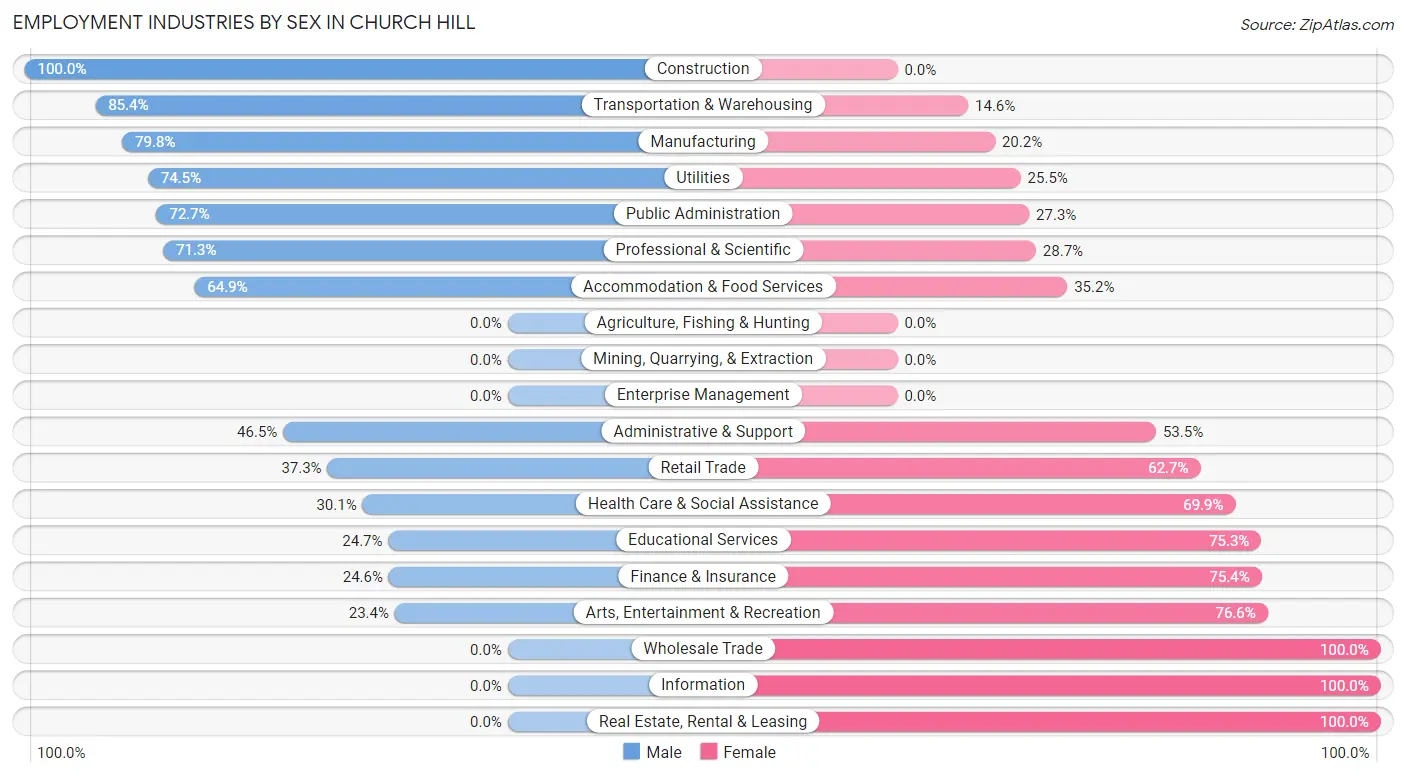
Employment Industries by Sex in Church Hill
The Church Hill industries that see more men than women are Construction (100.0%), Transportation & Warehousing (85.4%), and Manufacturing (79.8%), whereas the industries that tend to have a higher number of women are Wholesale Trade (100.0%), Information (100.0%), and Real Estate, Rental & Leasing (100.0%).
| Industry | Male | Female |
| Agriculture, Fishing & Hunting | 0 (0.0%) | 0 (0.0%) |
| Mining, Quarrying, & Extraction | 0 (0.0%) | 0 (0.0%) |
| Construction | 185 (100.0%) | 0 (0.0%) |
| Manufacturing | 419 (79.8%) | 106 (20.2%) |
| Wholesale Trade | 0 (0.0%) | 14 (100.0%) |
| Retail Trade | 97 (37.3%) | 163 (62.7%) |
| Transportation & Warehousing | 35 (85.4%) | 6 (14.6%) |
| Utilities | 73 (74.5%) | 25 (25.5%) |
| Information | 0 (0.0%) | 47 (100.0%) |
| Finance & Insurance | 49 (24.6%) | 150 (75.4%) |
| Real Estate, Rental & Leasing | 0 (0.0%) | 14 (100.0%) |
| Professional & Scientific | 117 (71.3%) | 47 (28.7%) |
| Enterprise Management | 0 (0.0%) | 0 (0.0%) |
| Administrative & Support | 33 (46.5%) | 38 (53.5%) |
| Educational Services | 63 (24.7%) | 192 (75.3%) |
| Health Care & Social Assistance | 144 (30.1%) | 335 (69.9%) |
| Arts, Entertainment & Recreation | 18 (23.4%) | 59 (76.6%) |
| Accommodation & Food Services | 107 (64.8%) | 58 (35.1%) |
| Public Administration | 32 (72.7%) | 12 (27.3%) |
| Total | 1,387 (50.8%) | 1,341 (49.2%) |
Education in Church Hill
School Enrollment in Church Hill
The most common levels of schooling among the 1,277 students in Church Hill are high school (246 | 19.3%), elementary school (225 | 17.6%), and college / undergraduate (201 | 15.7%).
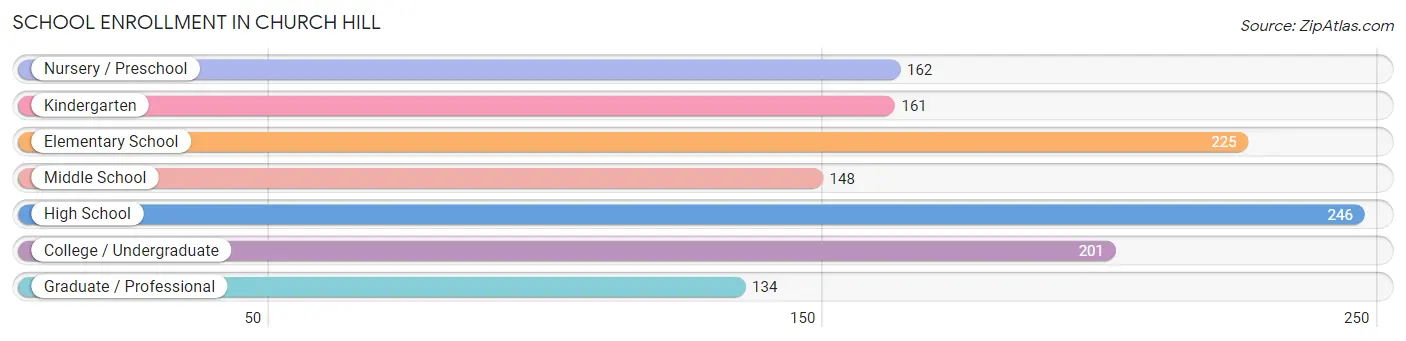
| School Level | # Students | % Students |
| Nursery / Preschool | 162 | 12.7% |
| Kindergarten | 161 | 12.6% |
| Elementary School | 225 | 17.6% |
| Middle School | 148 | 11.6% |
| High School | 246 | 19.3% |
| College / Undergraduate | 201 | 15.7% |
| Graduate / Professional | 134 | 10.5% |
| Total | 1,277 | 100.0% |
School Enrollment by Age by Funding Source in Church Hill
Out of a total of 1,277 students who are enrolled in schools in Church Hill, 244 (19.1%) attend a private institution, while the remaining 1,033 (80.9%) are enrolled in public schools. The age group of 20 to 24 year olds has the highest likelihood of being enrolled in private schools, with 29 (39.2% in the age bracket) enrolled. Conversely, the age group of 3 to 4 year olds has the lowest likelihood of being enrolled in a private school, with 10 (100.0% in the age bracket) attending a public institution.
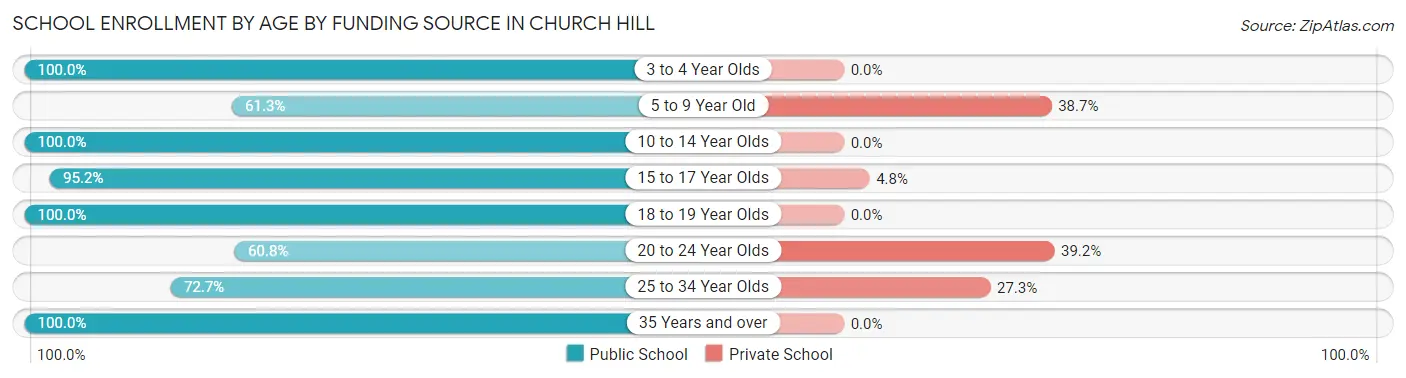
| Age Bracket | Public School | Private School |
| 3 to 4 Year Olds | 10 (100.0%) | 0 (0.0%) |
| 5 to 9 Year Old | 303 (61.3%) | 191 (38.7%) |
| 10 to 14 Year Olds | 249 (100.0%) | 0 (0.0%) |
| 15 to 17 Year Olds | 180 (95.2%) | 9 (4.8%) |
| 18 to 19 Year Olds | 96 (100.0%) | 0 (0.0%) |
| 20 to 24 Year Olds | 45 (60.8%) | 29 (39.2%) |
| 25 to 34 Year Olds | 40 (72.7%) | 15 (27.3%) |
| 35 Years and over | 110 (100.0%) | 0 (0.0%) |
| Total | 1,033 (80.9%) | 244 (19.1%) |
Educational Attainment by Field of Study in Church Hill
Education (497 | 42.3%), business (199 | 16.9%), science & technology (190 | 16.2%), social sciences (50 | 4.3%), and arts & humanities (47 | 4.0%) are the most common fields of study among 1,176 individuals in Church Hill who have obtained a bachelor's degree or higher.
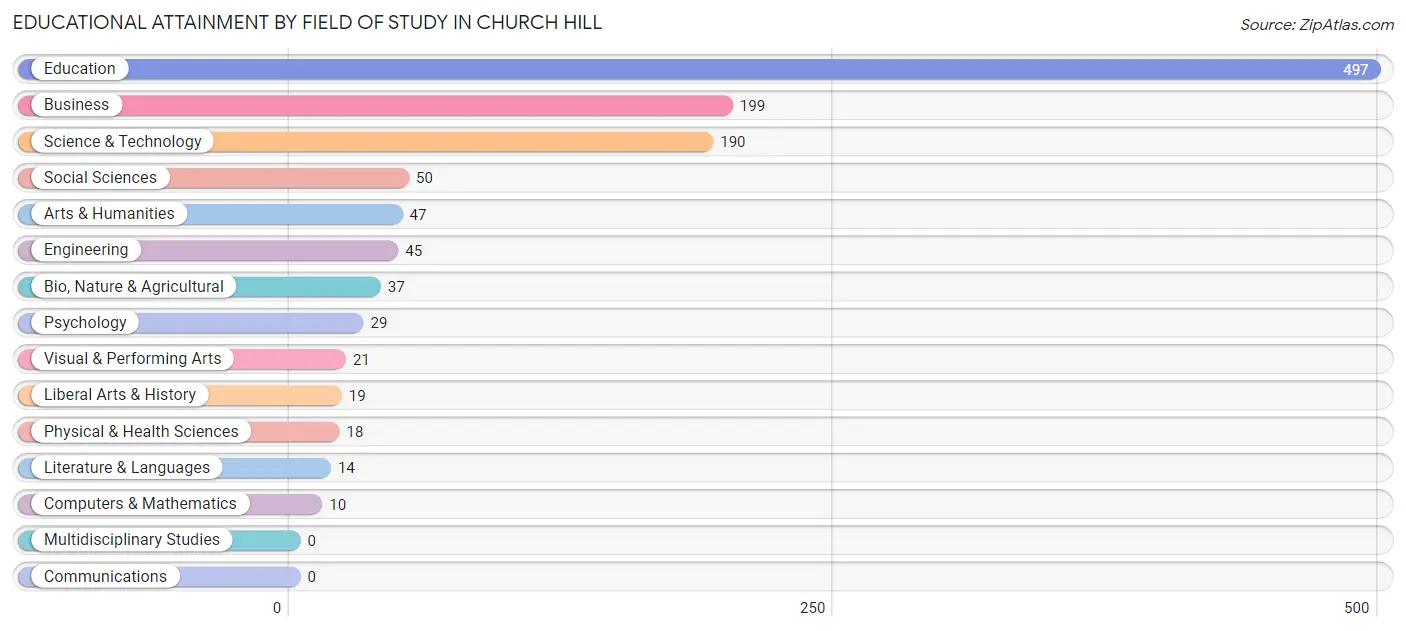
| Field of Study | # Graduates | % Graduates |
| Computers & Mathematics | 10 | 0.9% |
| Bio, Nature & Agricultural | 37 | 3.2% |
| Physical & Health Sciences | 18 | 1.5% |
| Psychology | 29 | 2.5% |
| Social Sciences | 50 | 4.3% |
| Engineering | 45 | 3.8% |
| Multidisciplinary Studies | 0 | 0.0% |
| Science & Technology | 190 | 16.2% |
| Business | 199 | 16.9% |
| Education | 497 | 42.3% |
| Literature & Languages | 14 | 1.2% |
| Liberal Arts & History | 19 | 1.6% |
| Visual & Performing Arts | 21 | 1.8% |
| Communications | 0 | 0.0% |
| Arts & Humanities | 47 | 4.0% |
| Total | 1,176 | 100.0% |
Transportation & Commute in Church Hill
Vehicle Availability by Sex in Church Hill
The most prevalent vehicle ownership categories in Church Hill are males with 2 vehicles (789, accounting for 56.8%) and females with 2 vehicles (706, making up 60.3%).
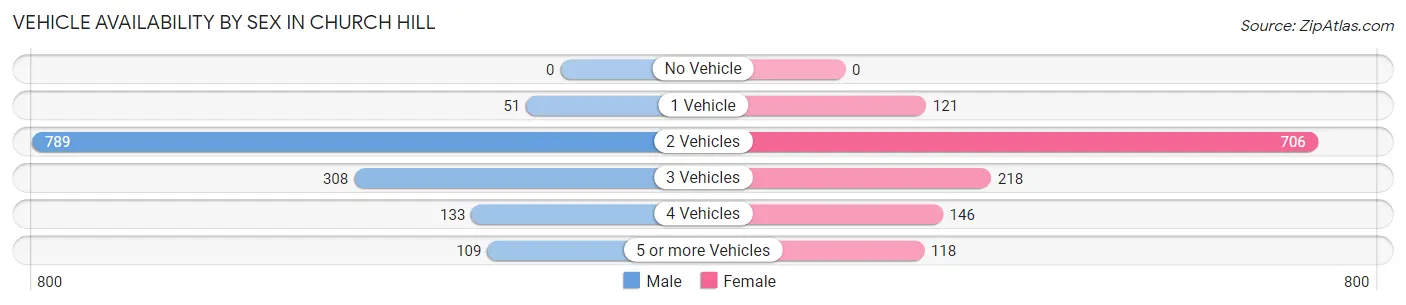
| Vehicles Available | Male | Female |
| No Vehicle | 0 (0.0%) | 0 (0.0%) |
| 1 Vehicle | 51 (3.7%) | 121 (9.2%) |
| 2 Vehicles | 789 (56.8%) | 706 (53.9%) |
| 3 Vehicles | 308 (22.2%) | 218 (16.7%) |
| 4 Vehicles | 133 (9.6%) | 146 (11.2%) |
| 5 or more Vehicles | 109 (7.8%) | 118 (9.0%) |
| Total | 1,390 (100.0%) | 1,309 (100.0%) |
Commute Time in Church Hill
The most frequently occuring commute durations in Church Hill are 20 to 24 minutes (649 commuters, 26.1%), 15 to 19 minutes (318 commuters, 12.8%), and 45 to 59 minutes (270 commuters, 10.8%).
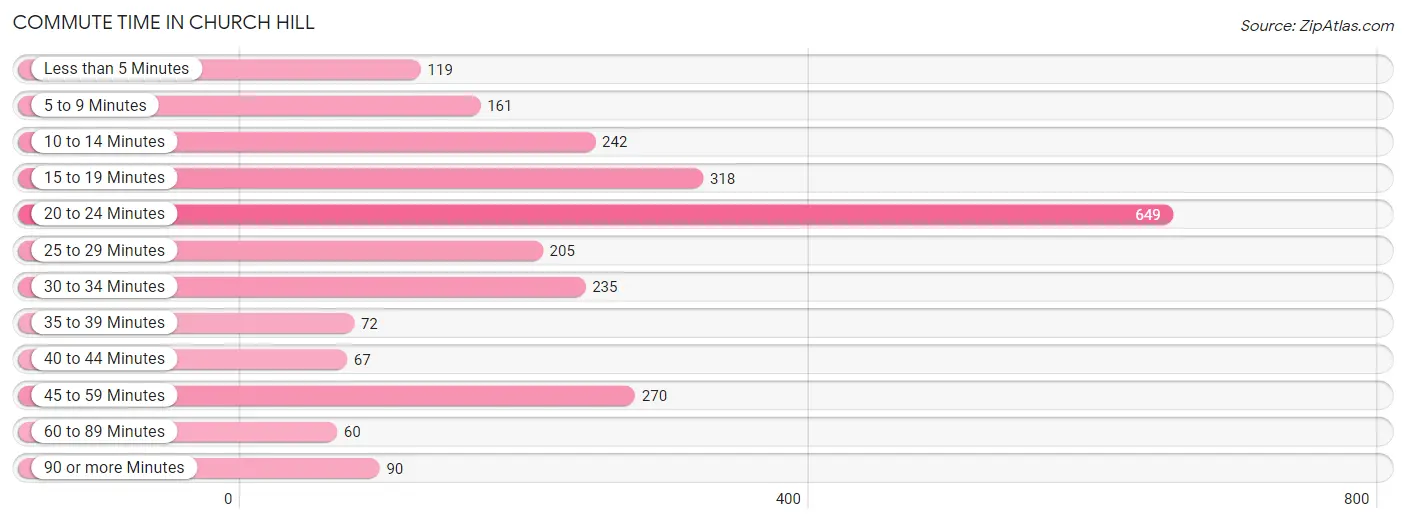
| Commute Time | # Commuters | % Commuters |
| Less than 5 Minutes | 119 | 4.8% |
| 5 to 9 Minutes | 161 | 6.5% |
| 10 to 14 Minutes | 242 | 9.7% |
| 15 to 19 Minutes | 318 | 12.8% |
| 20 to 24 Minutes | 649 | 26.1% |
| 25 to 29 Minutes | 205 | 8.2% |
| 30 to 34 Minutes | 235 | 9.5% |
| 35 to 39 Minutes | 72 | 2.9% |
| 40 to 44 Minutes | 67 | 2.7% |
| 45 to 59 Minutes | 270 | 10.8% |
| 60 to 89 Minutes | 60 | 2.4% |
| 90 or more Minutes | 90 | 3.6% |
Commute Time by Sex in Church Hill
The most common commute times in Church Hill are 20 to 24 minutes (318 commuters, 24.5%) for males and 20 to 24 minutes (331 commuters, 27.8%) for females.
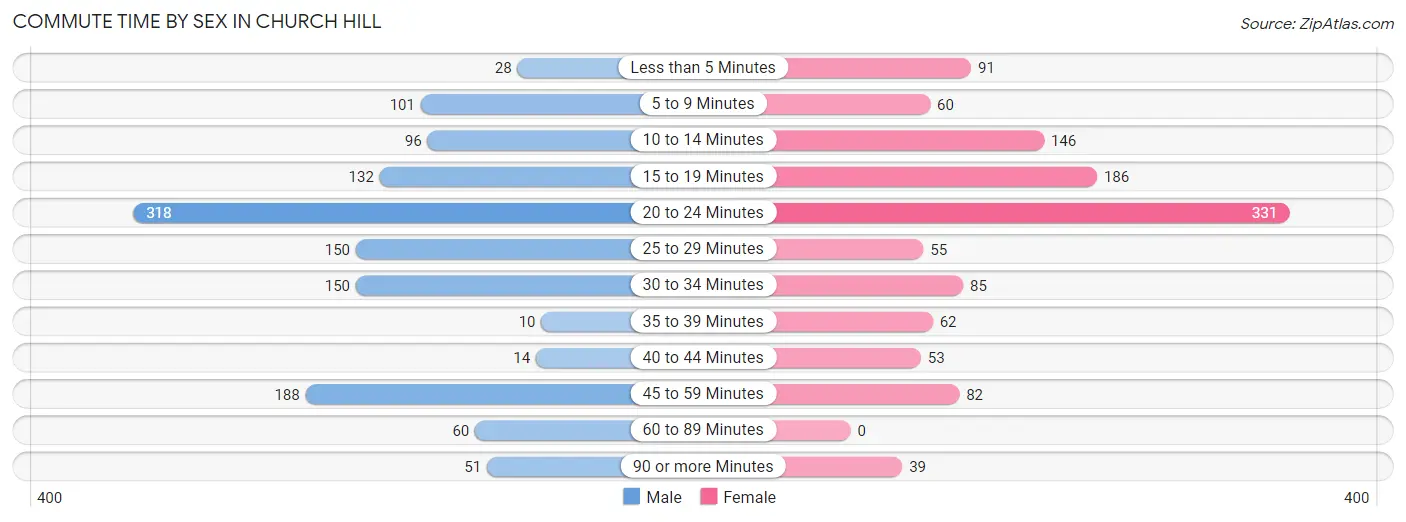
| Commute Time | Male | Female |
| Less than 5 Minutes | 28 (2.2%) | 91 (7.6%) |
| 5 to 9 Minutes | 101 (7.8%) | 60 (5.0%) |
| 10 to 14 Minutes | 96 (7.4%) | 146 (12.3%) |
| 15 to 19 Minutes | 132 (10.2%) | 186 (15.6%) |
| 20 to 24 Minutes | 318 (24.5%) | 331 (27.8%) |
| 25 to 29 Minutes | 150 (11.6%) | 55 (4.6%) |
| 30 to 34 Minutes | 150 (11.6%) | 85 (7.1%) |
| 35 to 39 Minutes | 10 (0.8%) | 62 (5.2%) |
| 40 to 44 Minutes | 14 (1.1%) | 53 (4.4%) |
| 45 to 59 Minutes | 188 (14.5%) | 82 (6.9%) |
| 60 to 89 Minutes | 60 (4.6%) | 0 (0.0%) |
| 90 or more Minutes | 51 (3.9%) | 39 (3.3%) |
Time of Departure to Work by Sex in Church Hill
The most frequent times of departure to work in Church Hill are 6:00 AM to 6:29 AM (326, 25.1%) for males and 7:30 AM to 7:59 AM (287, 24.1%) for females.
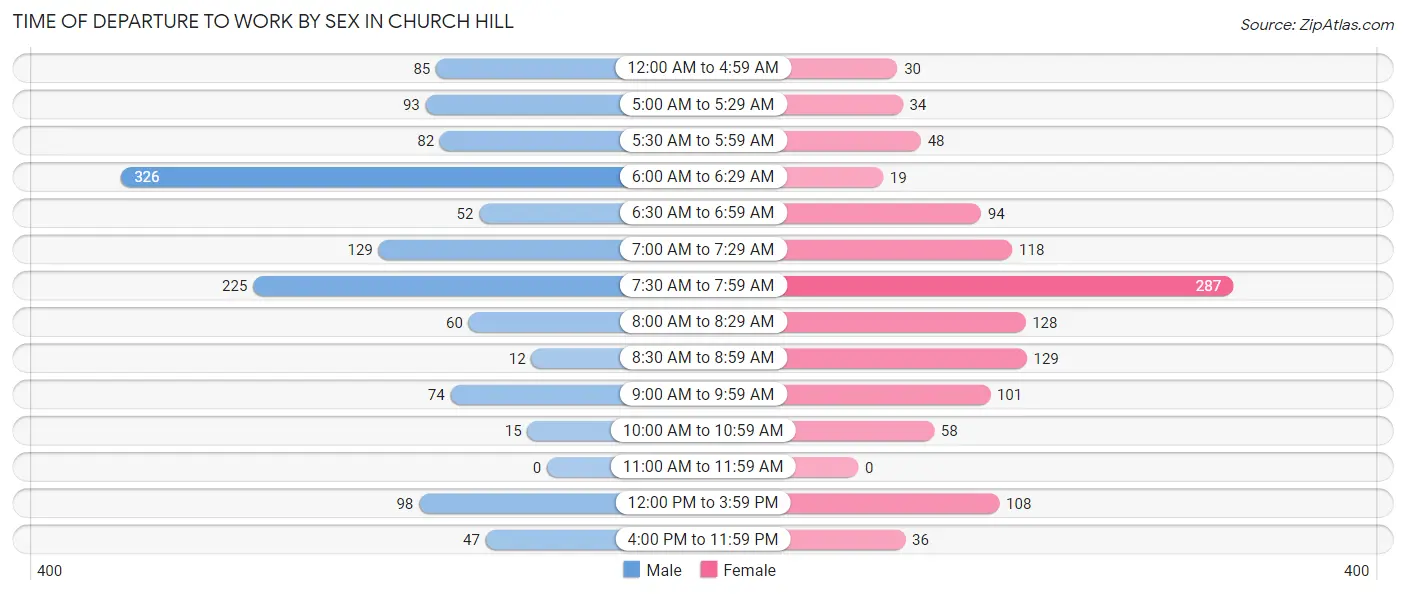
| Time of Departure | Male | Female |
| 12:00 AM to 4:59 AM | 85 (6.6%) | 30 (2.5%) |
| 5:00 AM to 5:29 AM | 93 (7.2%) | 34 (2.9%) |
| 5:30 AM to 5:59 AM | 82 (6.3%) | 48 (4.0%) |
| 6:00 AM to 6:29 AM | 326 (25.1%) | 19 (1.6%) |
| 6:30 AM to 6:59 AM | 52 (4.0%) | 94 (7.9%) |
| 7:00 AM to 7:29 AM | 129 (9.9%) | 118 (9.9%) |
| 7:30 AM to 7:59 AM | 225 (17.3%) | 287 (24.1%) |
| 8:00 AM to 8:29 AM | 60 (4.6%) | 128 (10.8%) |
| 8:30 AM to 8:59 AM | 12 (0.9%) | 129 (10.8%) |
| 9:00 AM to 9:59 AM | 74 (5.7%) | 101 (8.5%) |
| 10:00 AM to 10:59 AM | 15 (1.2%) | 58 (4.9%) |
| 11:00 AM to 11:59 AM | 0 (0.0%) | 0 (0.0%) |
| 12:00 PM to 3:59 PM | 98 (7.5%) | 108 (9.1%) |
| 4:00 PM to 11:59 PM | 47 (3.6%) | 36 (3.0%) |
| Total | 1,298 (100.0%) | 1,190 (100.0%) |
Housing Occupancy in Church Hill
Occupancy by Ownership in Church Hill
Of the total 2,866 dwellings in Church Hill, owner-occupied units account for 2,410 (84.1%), while renter-occupied units make up 456 (15.9%).
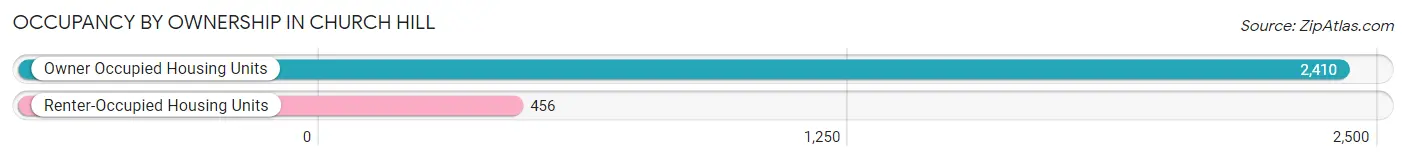
| Occupancy | # Housing Units | % Housing Units |
| Owner Occupied Housing Units | 2,410 | 84.1% |
| Renter-Occupied Housing Units | 456 | 15.9% |
| Total Occupied Housing Units | 2,866 | 100.0% |
Occupancy by Household Size in Church Hill
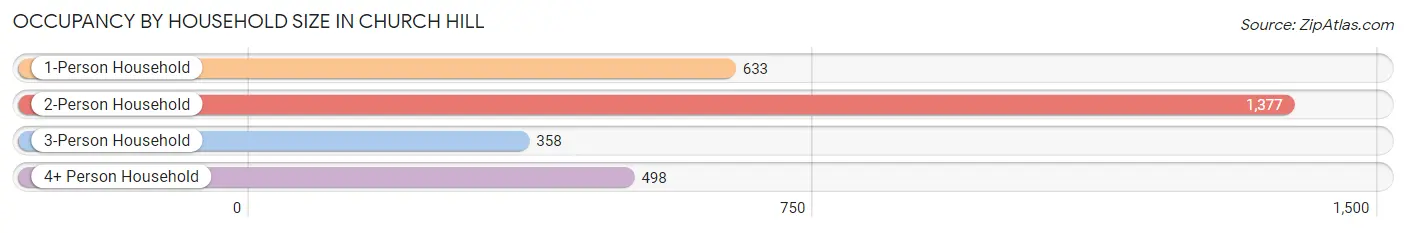
| Household Size | # Housing Units | % Housing Units |
| 1-Person Household | 633 | 22.1% |
| 2-Person Household | 1,377 | 48.0% |
| 3-Person Household | 358 | 12.5% |
| 4+ Person Household | 498 | 17.4% |
| Total Housing Units | 2,866 | 100.0% |
Occupancy by Ownership by Household Size in Church Hill
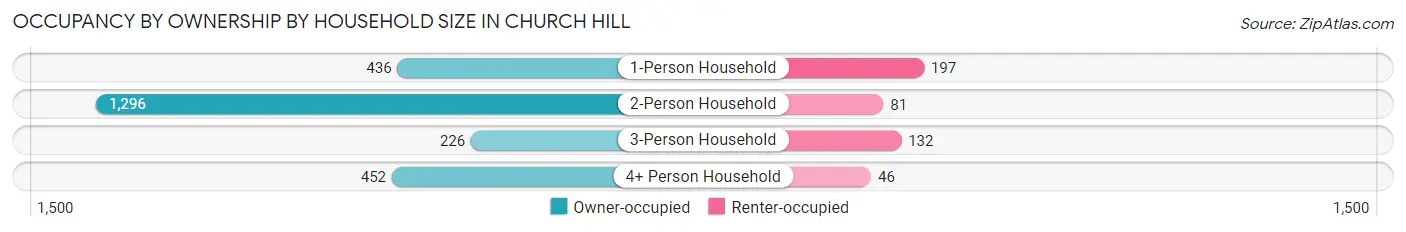
| Household Size | Owner-occupied | Renter-occupied |
| 1-Person Household | 436 (68.9%) | 197 (31.1%) |
| 2-Person Household | 1,296 (94.1%) | 81 (5.9%) |
| 3-Person Household | 226 (63.1%) | 132 (36.9%) |
| 4+ Person Household | 452 (90.8%) | 46 (9.2%) |
| Total Housing Units | 2,410 (84.1%) | 456 (15.9%) |
Occupancy by Educational Attainment in Church Hill
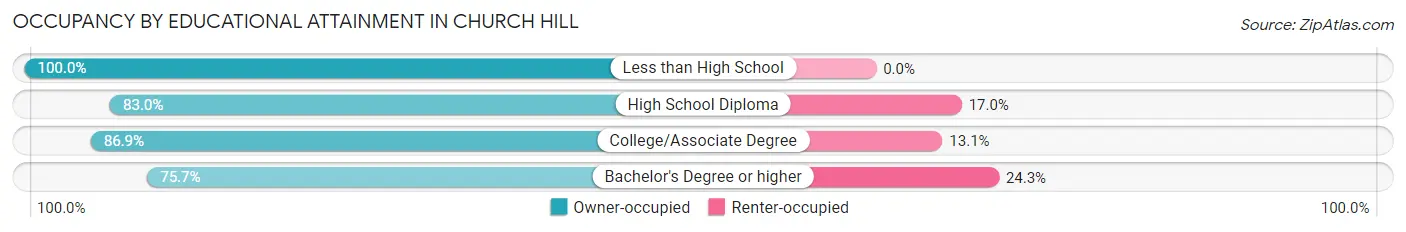
| Household Size | Owner-occupied | Renter-occupied |
| Less than High School | 191 (100.0%) | 0 (0.0%) |
| High School Diploma | 715 (83.0%) | 146 (17.0%) |
| College/Associate Degree | 1,019 (86.9%) | 154 (13.1%) |
| Bachelor's Degree or higher | 485 (75.7%) | 156 (24.3%) |
Occupancy by Age of Householder in Church Hill
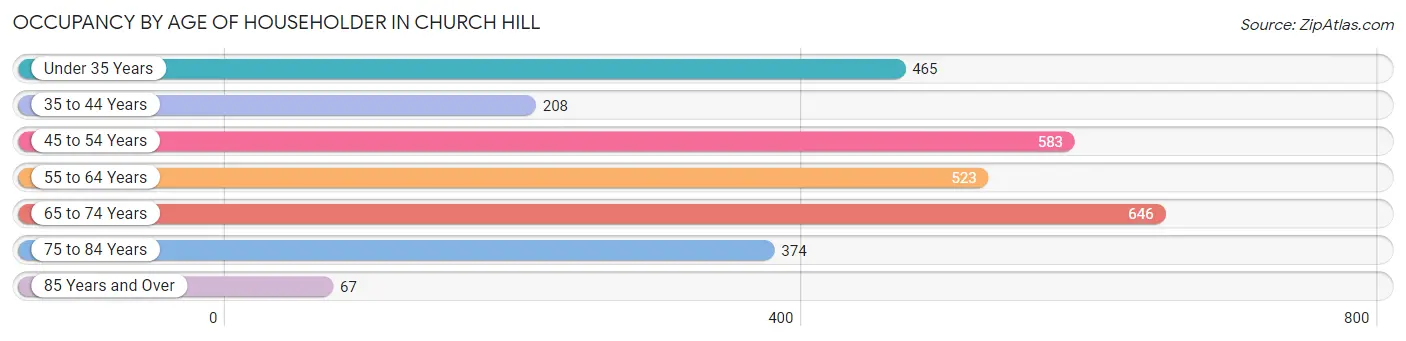
| Age Bracket | # Households | % Households |
| Under 35 Years | 465 | 16.2% |
| 35 to 44 Years | 208 | 7.3% |
| 45 to 54 Years | 583 | 20.3% |
| 55 to 64 Years | 523 | 18.2% |
| 65 to 74 Years | 646 | 22.5% |
| 75 to 84 Years | 374 | 13.1% |
| 85 Years and Over | 67 | 2.3% |
| Total | 2,866 | 100.0% |
Housing Finances in Church Hill
Median Income by Occupancy in Church Hill
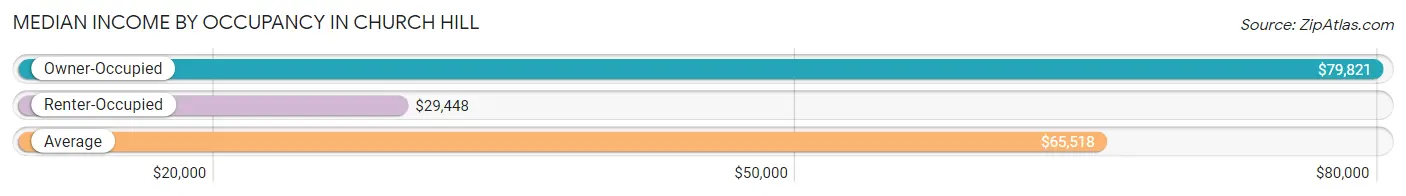
| Occupancy Type | # Households | Median Income |
| Owner-Occupied | 2,410 (84.1%) | $79,821 |
| Renter-Occupied | 456 (15.9%) | $29,448 |
| Average | 2,866 (100.0%) | $65,518 |
Occupancy by Householder Income Bracket in Church Hill
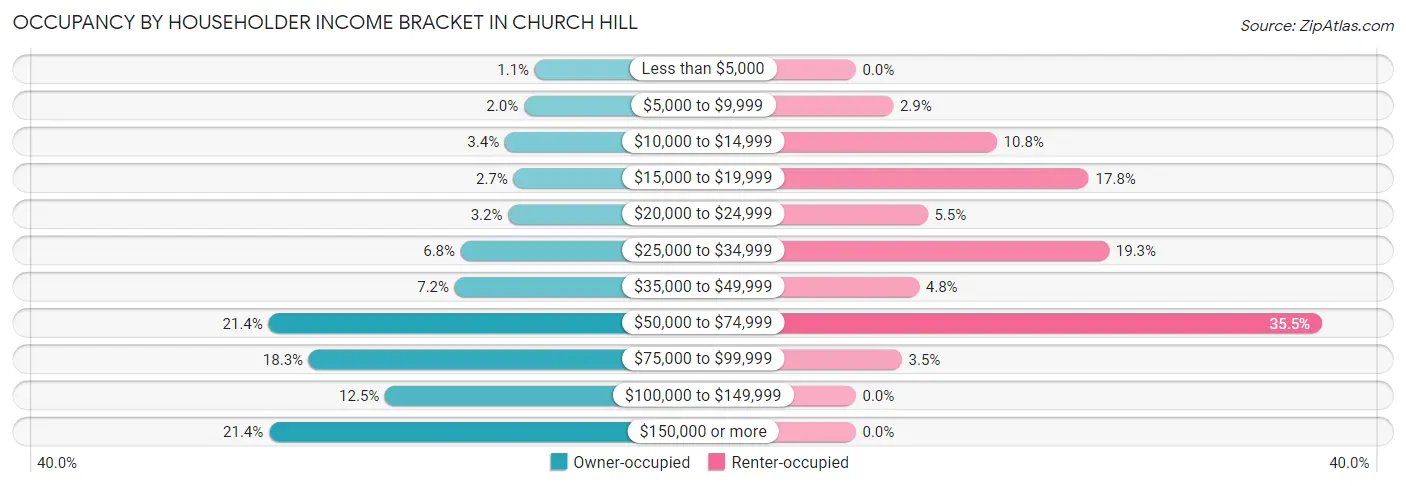
| Income Bracket | Owner-occupied | Renter-occupied |
| Less than $5,000 | 27 (1.1%) | 0 (0.0%) |
| $5,000 to $9,999 | 47 (1.9%) | 13 (2.9%) |
| $10,000 to $14,999 | 82 (3.4%) | 49 (10.7%) |
| $15,000 to $19,999 | 66 (2.7%) | 81 (17.8%) |
| $20,000 to $24,999 | 76 (3.2%) | 25 (5.5%) |
| $25,000 to $34,999 | 163 (6.8%) | 88 (19.3%) |
| $35,000 to $49,999 | 174 (7.2%) | 22 (4.8%) |
| $50,000 to $74,999 | 516 (21.4%) | 162 (35.5%) |
| $75,000 to $99,999 | 442 (18.3%) | 16 (3.5%) |
| $100,000 to $149,999 | 302 (12.5%) | 0 (0.0%) |
| $150,000 or more | 515 (21.4%) | 0 (0.0%) |
| Total | 2,410 (100.0%) | 456 (100.0%) |
Monthly Housing Cost Tiers in Church Hill
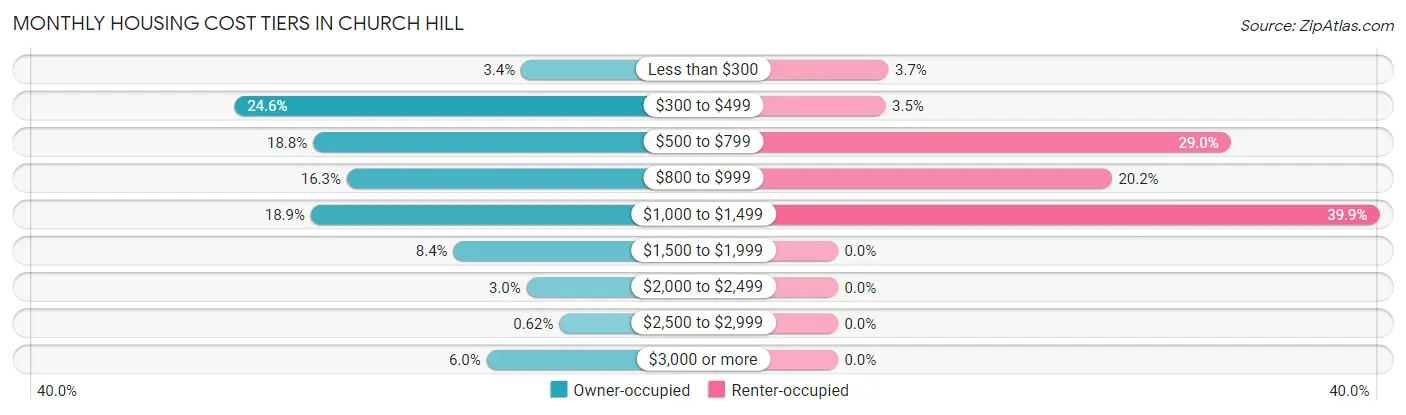
| Monthly Cost | Owner-occupied | Renter-occupied |
| Less than $300 | 83 (3.4%) | 17 (3.7%) |
| $300 to $499 | 592 (24.6%) | 16 (3.5%) |
| $500 to $799 | 452 (18.8%) | 132 (28.9%) |
| $800 to $999 | 392 (16.3%) | 92 (20.2%) |
| $1,000 to $1,499 | 456 (18.9%) | 182 (39.9%) |
| $1,500 to $1,999 | 203 (8.4%) | 0 (0.0%) |
| $2,000 to $2,499 | 73 (3.0%) | 0 (0.0%) |
| $2,500 to $2,999 | 15 (0.6%) | 0 (0.0%) |
| $3,000 or more | 144 (6.0%) | 0 (0.0%) |
| Total | 2,410 (100.0%) | 456 (100.0%) |
Physical Housing Characteristics in Church Hill
Housing Structures in Church Hill
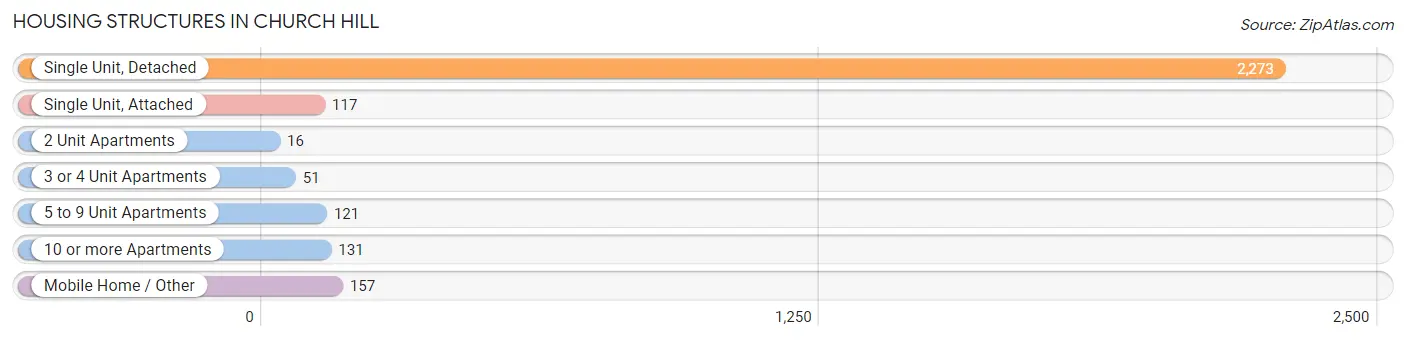
| Structure Type | # Housing Units | % Housing Units |
| Single Unit, Detached | 2,273 | 79.3% |
| Single Unit, Attached | 117 | 4.1% |
| 2 Unit Apartments | 16 | 0.6% |
| 3 or 4 Unit Apartments | 51 | 1.8% |
| 5 to 9 Unit Apartments | 121 | 4.2% |
| 10 or more Apartments | 131 | 4.6% |
| Mobile Home / Other | 157 | 5.5% |
| Total | 2,866 | 100.0% |
Housing Structures by Occupancy in Church Hill
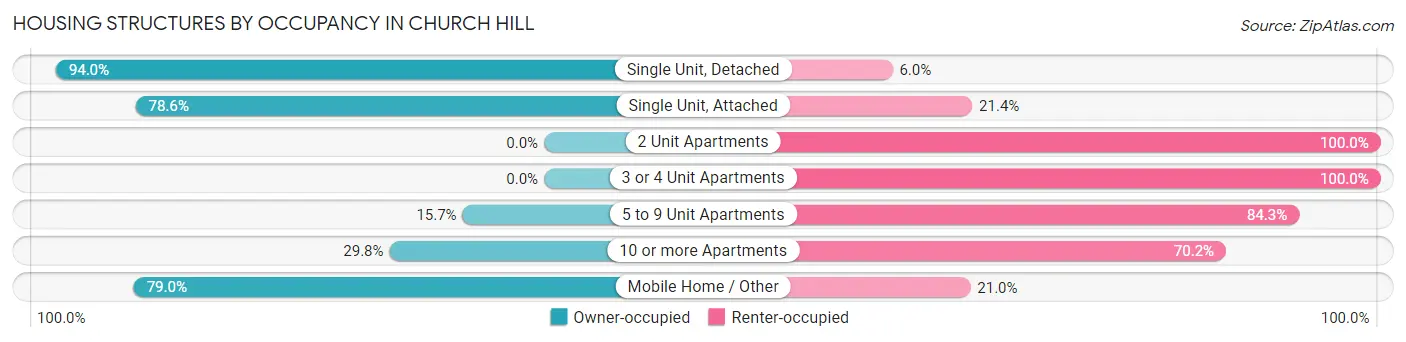
| Structure Type | Owner-occupied | Renter-occupied |
| Single Unit, Detached | 2,136 (94.0%) | 137 (6.0%) |
| Single Unit, Attached | 92 (78.6%) | 25 (21.4%) |
| 2 Unit Apartments | 0 (0.0%) | 16 (100.0%) |
| 3 or 4 Unit Apartments | 0 (0.0%) | 51 (100.0%) |
| 5 to 9 Unit Apartments | 19 (15.7%) | 102 (84.3%) |
| 10 or more Apartments | 39 (29.8%) | 92 (70.2%) |
| Mobile Home / Other | 124 (79.0%) | 33 (21.0%) |
| Total | 2,410 (84.1%) | 456 (15.9%) |
Housing Structures by Number of Rooms in Church Hill
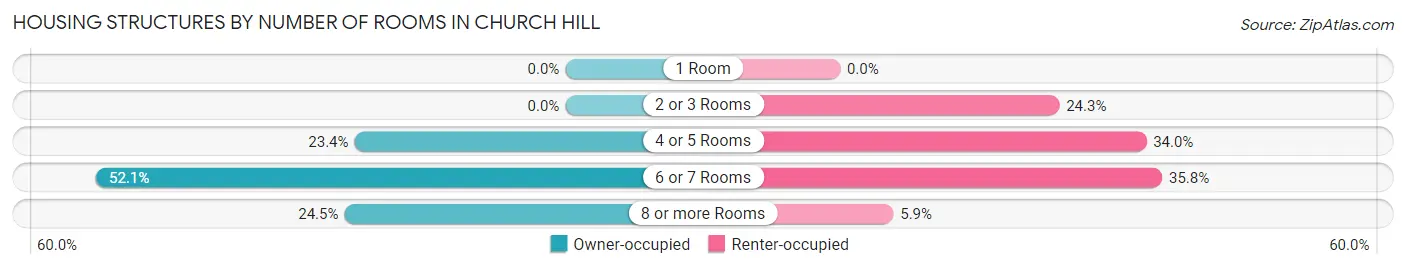
| Number of Rooms | Owner-occupied | Renter-occupied |
| 1 Room | 0 (0.0%) | 0 (0.0%) |
| 2 or 3 Rooms | 0 (0.0%) | 111 (24.3%) |
| 4 or 5 Rooms | 564 (23.4%) | 155 (34.0%) |
| 6 or 7 Rooms | 1,255 (52.1%) | 163 (35.7%) |
| 8 or more Rooms | 591 (24.5%) | 27 (5.9%) |
| Total | 2,410 (100.0%) | 456 (100.0%) |
Housing Structure by Heating Type in Church Hill
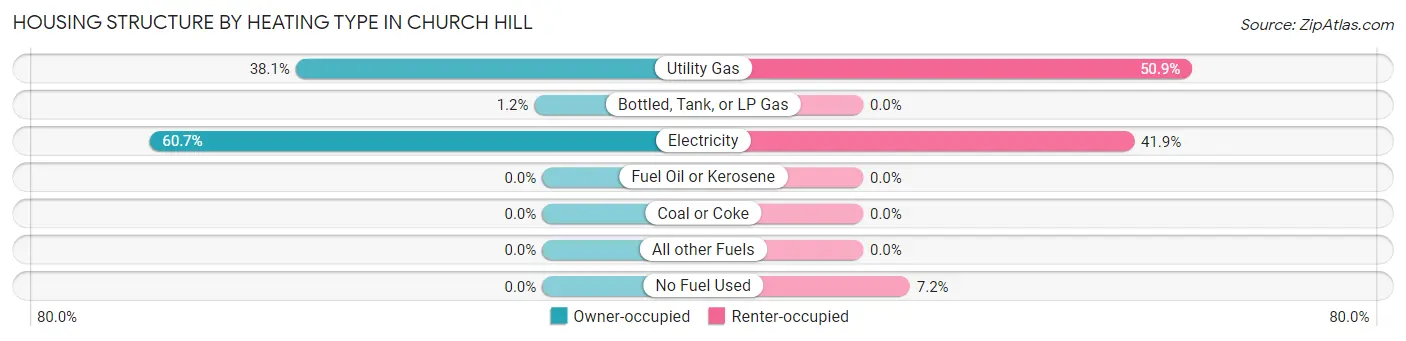
| Heating Type | Owner-occupied | Renter-occupied |
| Utility Gas | 918 (38.1%) | 232 (50.9%) |
| Bottled, Tank, or LP Gas | 29 (1.2%) | 0 (0.0%) |
| Electricity | 1,463 (60.7%) | 191 (41.9%) |
| Fuel Oil or Kerosene | 0 (0.0%) | 0 (0.0%) |
| Coal or Coke | 0 (0.0%) | 0 (0.0%) |
| All other Fuels | 0 (0.0%) | 0 (0.0%) |
| No Fuel Used | 0 (0.0%) | 33 (7.2%) |
| Total | 2,410 (100.0%) | 456 (100.0%) |
Household Vehicle Usage in Church Hill
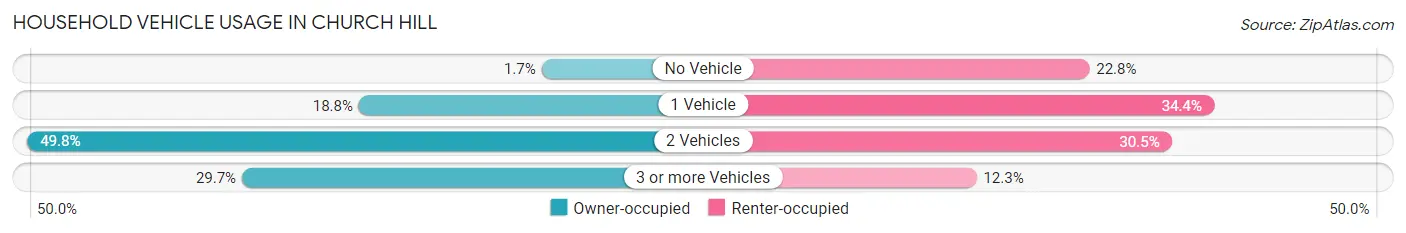
| Vehicles per Household | Owner-occupied | Renter-occupied |
| No Vehicle | 42 (1.7%) | 104 (22.8%) |
| 1 Vehicle | 453 (18.8%) | 157 (34.4%) |
| 2 Vehicles | 1,199 (49.7%) | 139 (30.5%) |
| 3 or more Vehicles | 716 (29.7%) | 56 (12.3%) |
| Total | 2,410 (100.0%) | 456 (100.0%) |
Real Estate & Mortgages in Church Hill
Real Estate and Mortgage Overview in Church Hill
| Characteristic | Without Mortgage | With Mortgage |
| Housing Units | 981 | 1,429 |
| Median Property Value | $170,600 | $202,900 |
| Median Household Income | $52,775 | $460 |
| Monthly Housing Costs | $435 | $144 |
| Real Estate Taxes | $1,315 | $45 |
Property Value by Mortgage Status in Church Hill
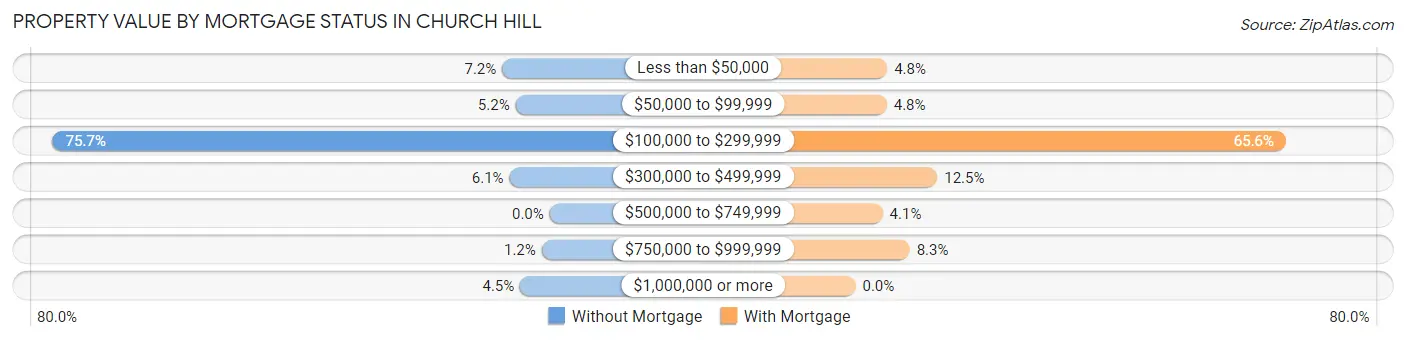
| Property Value | Without Mortgage | With Mortgage |
| Less than $50,000 | 71 (7.2%) | 69 (4.8%) |
| $50,000 to $99,999 | 51 (5.2%) | 68 (4.8%) |
| $100,000 to $299,999 | 743 (75.7%) | 937 (65.6%) |
| $300,000 to $499,999 | 60 (6.1%) | 178 (12.5%) |
| $500,000 to $749,999 | 0 (0.0%) | 59 (4.1%) |
| $750,000 to $999,999 | 12 (1.2%) | 118 (8.3%) |
| $1,000,000 or more | 44 (4.5%) | 0 (0.0%) |
| Total | 981 (100.0%) | 1,429 (100.0%) |
Household Income by Mortgage Status in Church Hill
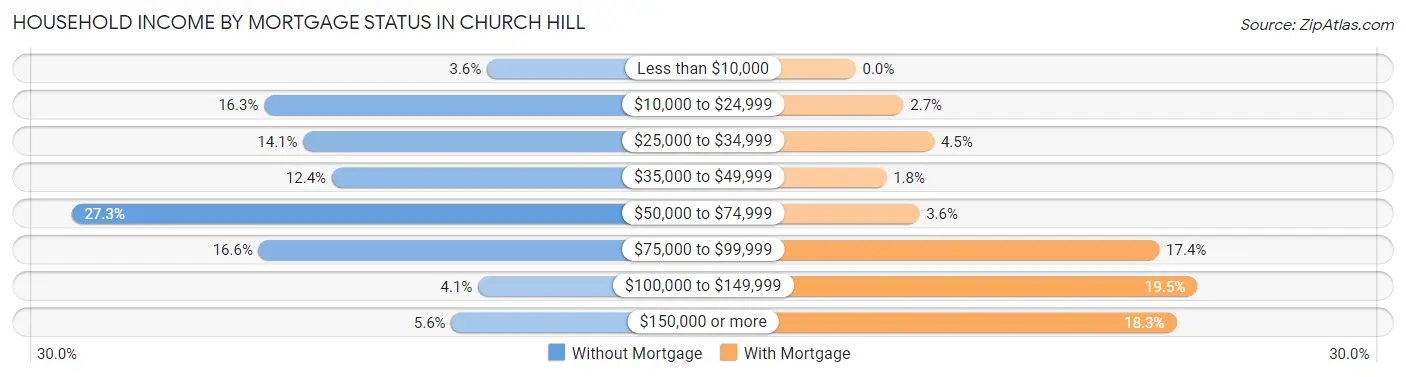
| Household Income | Without Mortgage | With Mortgage |
| Less than $10,000 | 35 (3.6%) | 0 (0.0%) |
| $10,000 to $24,999 | 160 (16.3%) | 39 (2.7%) |
| $25,000 to $34,999 | 138 (14.1%) | 64 (4.5%) |
| $35,000 to $49,999 | 122 (12.4%) | 25 (1.8%) |
| $50,000 to $74,999 | 268 (27.3%) | 52 (3.6%) |
| $75,000 to $99,999 | 163 (16.6%) | 248 (17.3%) |
| $100,000 to $149,999 | 40 (4.1%) | 279 (19.5%) |
| $150,000 or more | 55 (5.6%) | 262 (18.3%) |
| Total | 981 (100.0%) | 1,429 (100.0%) |
Property Value to Household Income Ratio in Church Hill
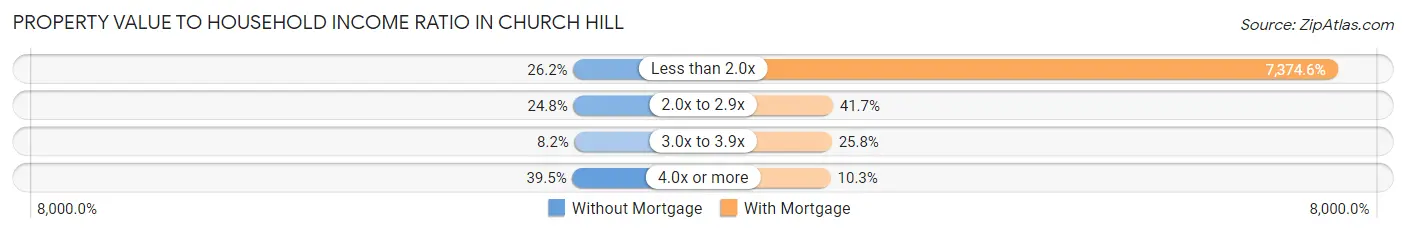
| Value-to-Income Ratio | Without Mortgage | With Mortgage |
| Less than 2.0x | 257 (26.2%) | 105,383 (7,374.6%) |
| 2.0x to 2.9x | 243 (24.8%) | 596 (41.7%) |
| 3.0x to 3.9x | 80 (8.2%) | 369 (25.8%) |
| 4.0x or more | 387 (39.5%) | 147 (10.3%) |
| Total | 981 (100.0%) | 1,429 (100.0%) |
Real Estate Taxes by Mortgage Status in Church Hill
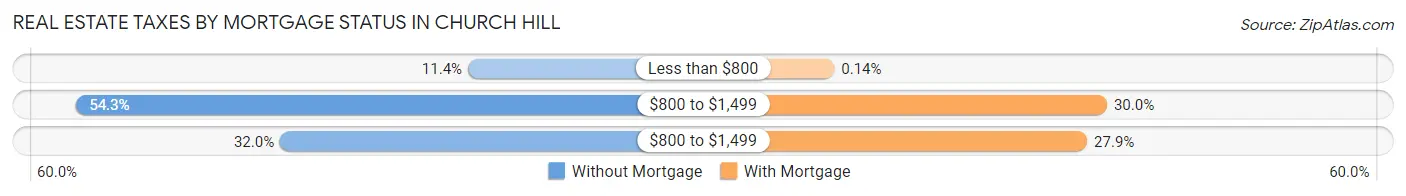
| Property Taxes | Without Mortgage | With Mortgage |
| Less than $800 | 112 (11.4%) | 2 (0.1%) |
| $800 to $1,499 | 533 (54.3%) | 429 (30.0%) |
| $800 to $1,499 | 314 (32.0%) | 398 (27.9%) |
| Total | 981 (100.0%) | 1,429 (100.0%) |
Health & Disability in Church Hill
Health Insurance Coverage by Age in Church Hill
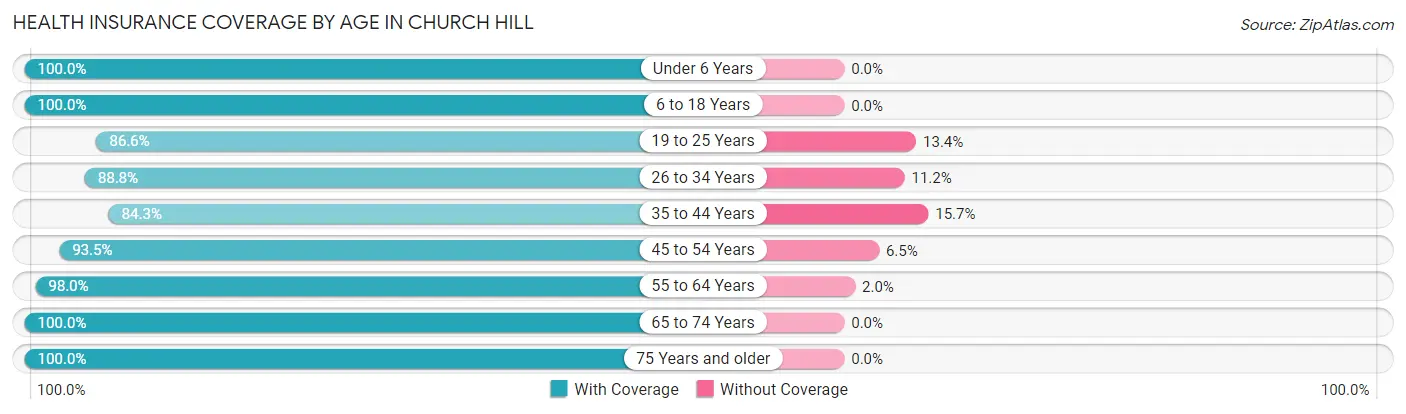
| Age Bracket | With Coverage | Without Coverage |
| Under 6 Years | 727 (100.0%) | 0 (0.0%) |
| 6 to 18 Years | 667 (100.0%) | 0 (0.0%) |
| 19 to 25 Years | 498 (86.6%) | 77 (13.4%) |
| 26 to 34 Years | 758 (88.8%) | 96 (11.2%) |
| 35 to 44 Years | 382 (84.3%) | 71 (15.7%) |
| 45 to 54 Years | 1,013 (93.5%) | 70 (6.5%) |
| 55 to 64 Years | 828 (98.0%) | 17 (2.0%) |
| 65 to 74 Years | 1,041 (100.0%) | 0 (0.0%) |
| 75 Years and older | 618 (100.0%) | 0 (0.0%) |
| Total | 6,532 (95.2%) | 331 (4.8%) |
Health Insurance Coverage by Citizenship Status in Church Hill
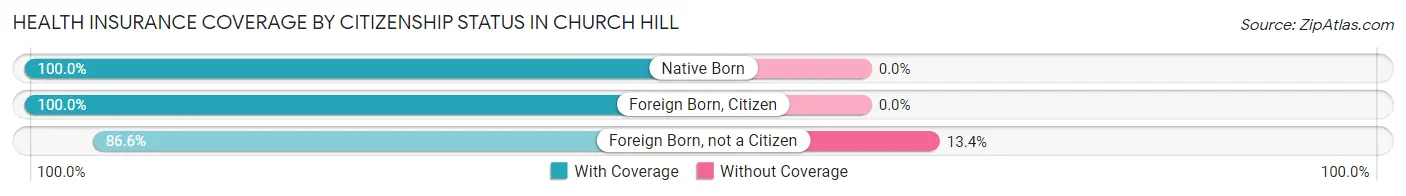
| Citizenship Status | With Coverage | Without Coverage |
| Native Born | 727 (100.0%) | 0 (0.0%) |
| Foreign Born, Citizen | 667 (100.0%) | 0 (0.0%) |
| Foreign Born, not a Citizen | 498 (86.6%) | 77 (13.4%) |
Health Insurance Coverage by Household Income in Church Hill
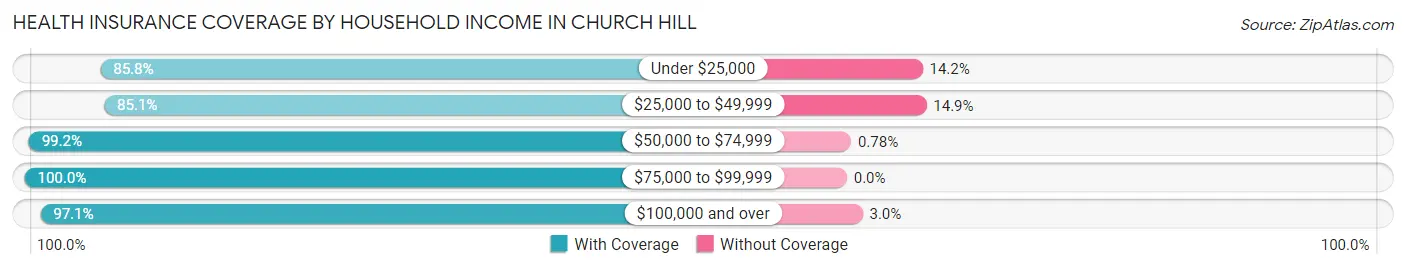
| Household Income | With Coverage | Without Coverage |
| Under $25,000 | 623 (85.8%) | 103 (14.2%) |
| $25,000 to $49,999 | 913 (85.1%) | 160 (14.9%) |
| $50,000 to $74,999 | 1,781 (99.2%) | 14 (0.8%) |
| $75,000 to $99,999 | 1,437 (100.0%) | 0 (0.0%) |
| $100,000 and over | 1,778 (97.1%) | 54 (2.9%) |
Public vs Private Health Insurance Coverage by Age in Church Hill
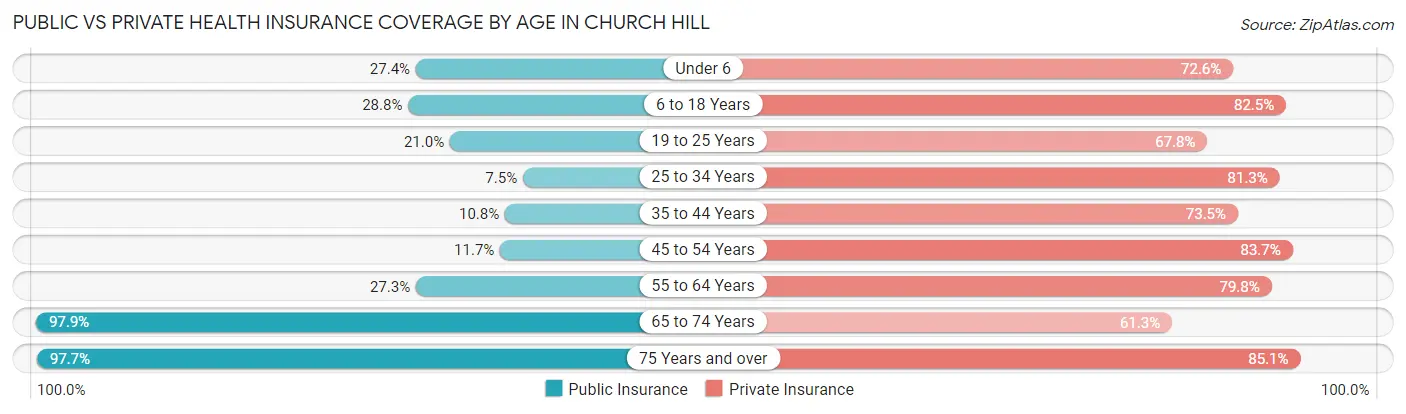
| Age Bracket | Public Insurance | Private Insurance |
| Under 6 | 199 (27.4%) | 528 (72.6%) |
| 6 to 18 Years | 192 (28.8%) | 550 (82.5%) |
| 19 to 25 Years | 121 (21.0%) | 390 (67.8%) |
| 25 to 34 Years | 64 (7.5%) | 694 (81.3%) |
| 35 to 44 Years | 49 (10.8%) | 333 (73.5%) |
| 45 to 54 Years | 127 (11.7%) | 906 (83.7%) |
| 55 to 64 Years | 231 (27.3%) | 674 (79.8%) |
| 65 to 74 Years | 1,019 (97.9%) | 638 (61.3%) |
| 75 Years and over | 604 (97.7%) | 526 (85.1%) |
| Total | 2,606 (38.0%) | 5,239 (76.3%) |
Disability Status by Sex by Age in Church Hill
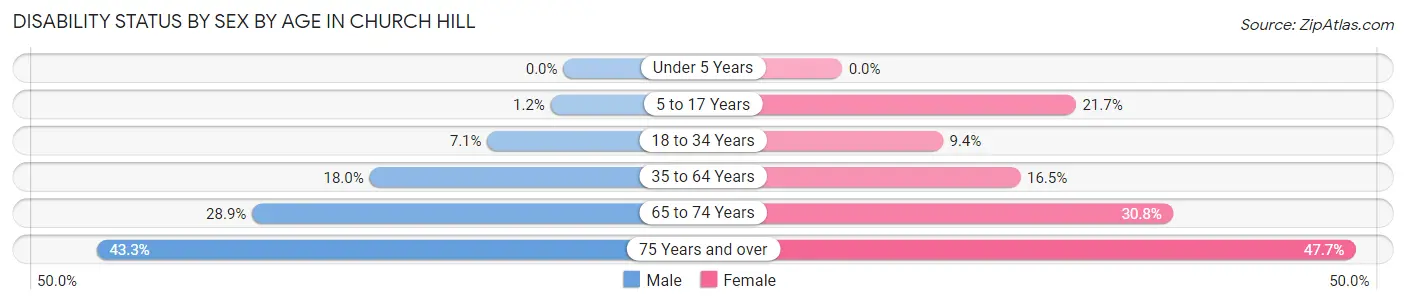
| Age Bracket | Male | Female |
| Under 5 Years | 0 (0.0%) | 0 (0.0%) |
| 5 to 17 Years | 7 (1.2%) | 90 (21.7%) |
| 18 to 34 Years | 51 (7.0%) | 66 (9.3%) |
| 35 to 64 Years | 188 (18.0%) | 221 (16.5%) |
| 65 to 74 Years | 160 (28.9%) | 150 (30.8%) |
| 75 Years and over | 78 (43.3%) | 209 (47.7%) |
Disability Class by Sex by Age in Church Hill
Disability Class: Hearing Difficulty
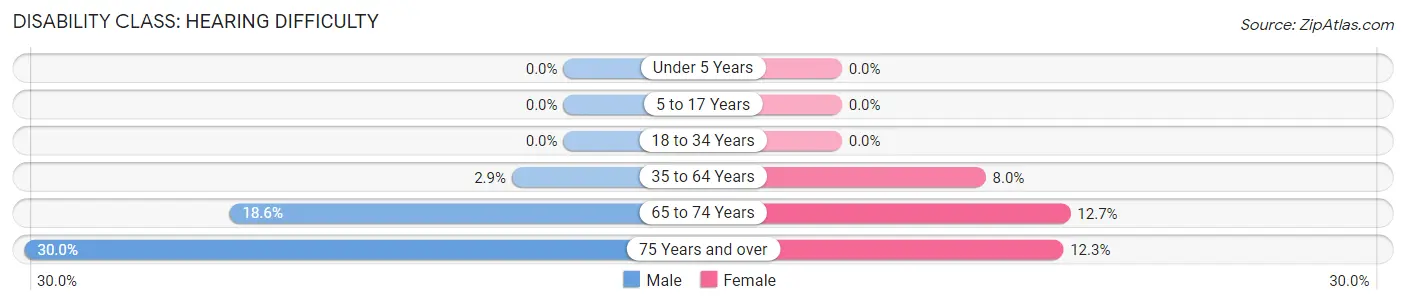
| Age Bracket | Male | Female |
| Under 5 Years | 0 (0.0%) | 0 (0.0%) |
| 5 to 17 Years | 0 (0.0%) | 0 (0.0%) |
| 18 to 34 Years | 0 (0.0%) | 0 (0.0%) |
| 35 to 64 Years | 30 (2.9%) | 107 (8.0%) |
| 65 to 74 Years | 103 (18.6%) | 62 (12.7%) |
| 75 Years and over | 54 (30.0%) | 54 (12.3%) |
Disability Class: Vision Difficulty
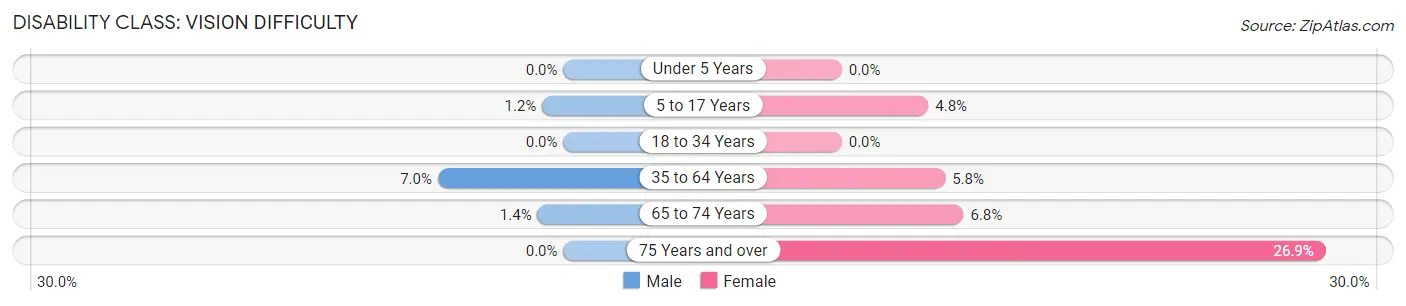
| Age Bracket | Male | Female |
| Under 5 Years | 0 (0.0%) | 0 (0.0%) |
| 5 to 17 Years | 7 (1.2%) | 20 (4.8%) |
| 18 to 34 Years | 0 (0.0%) | 0 (0.0%) |
| 35 to 64 Years | 73 (7.0%) | 77 (5.8%) |
| 65 to 74 Years | 8 (1.4%) | 33 (6.8%) |
| 75 Years and over | 0 (0.0%) | 118 (26.9%) |
Disability Class: Cognitive Difficulty
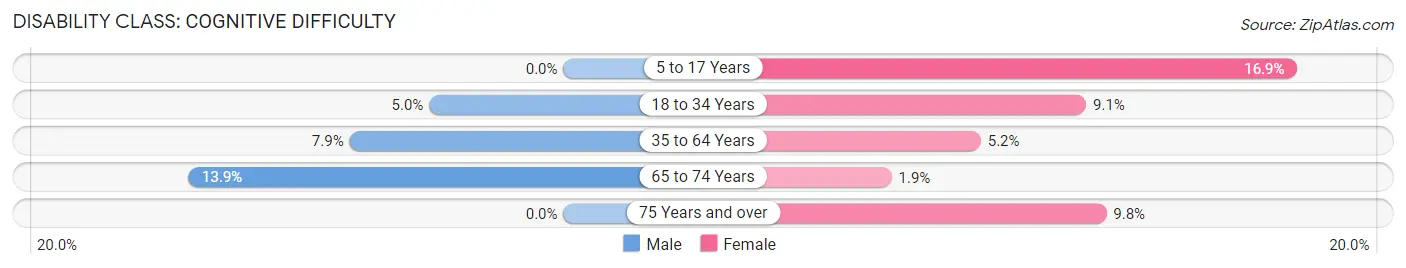
| Age Bracket | Male | Female |
| 5 to 17 Years | 0 (0.0%) | 70 (16.9%) |
| 18 to 34 Years | 36 (5.0%) | 64 (9.1%) |
| 35 to 64 Years | 83 (7.9%) | 69 (5.2%) |
| 65 to 74 Years | 77 (13.9%) | 9 (1.8%) |
| 75 Years and over | 0 (0.0%) | 43 (9.8%) |
Disability Class: Ambulatory Difficulty
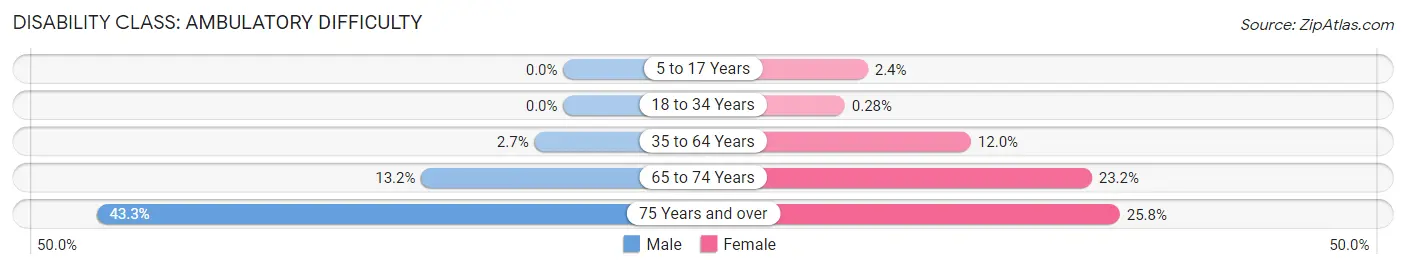
| Age Bracket | Male | Female |
| 5 to 17 Years | 0 (0.0%) | 10 (2.4%) |
| 18 to 34 Years | 0 (0.0%) | 2 (0.3%) |
| 35 to 64 Years | 28 (2.7%) | 160 (12.0%) |
| 65 to 74 Years | 73 (13.2%) | 113 (23.2%) |
| 75 Years and over | 78 (43.3%) | 113 (25.8%) |
Disability Class: Self-Care Difficulty
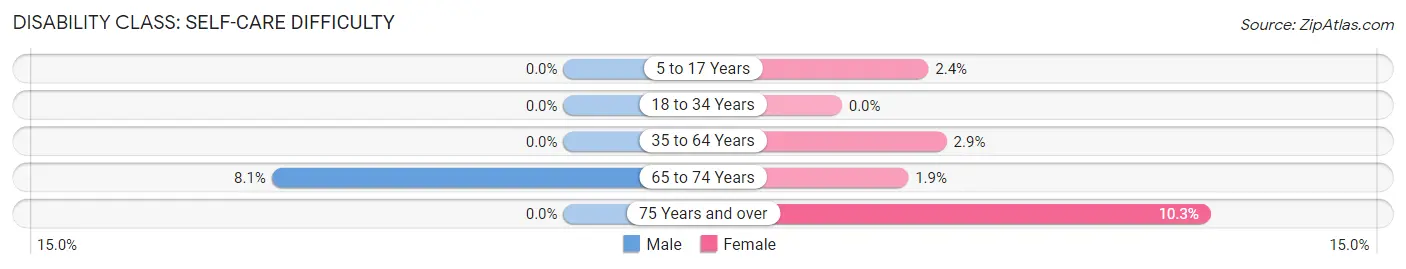
| Age Bracket | Male | Female |
| 5 to 17 Years | 0 (0.0%) | 10 (2.4%) |
| 18 to 34 Years | 0 (0.0%) | 0 (0.0%) |
| 35 to 64 Years | 0 (0.0%) | 39 (2.9%) |
| 65 to 74 Years | 45 (8.1%) | 9 (1.8%) |
| 75 Years and over | 0 (0.0%) | 45 (10.3%) |
Technology Access in Church Hill
Computing Device Access in Church Hill
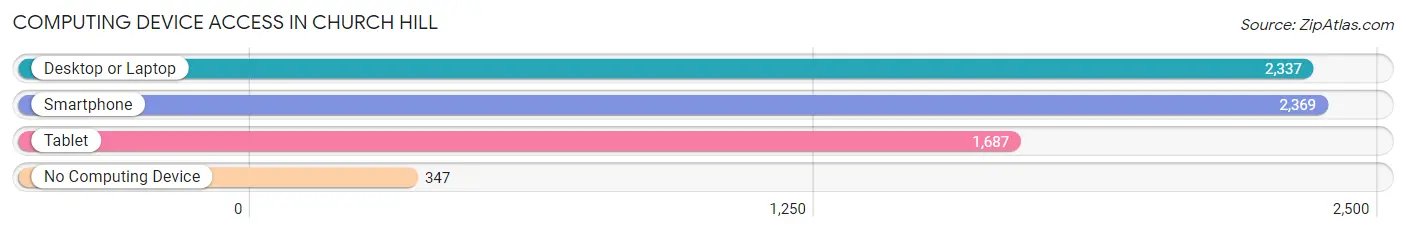
| Device Type | # Households | % Households |
| Desktop or Laptop | 2,337 | 81.5% |
| Smartphone | 2,369 | 82.7% |
| Tablet | 1,687 | 58.9% |
| No Computing Device | 347 | 12.1% |
| Total | 2,866 | 100.0% |
Internet Access in Church Hill
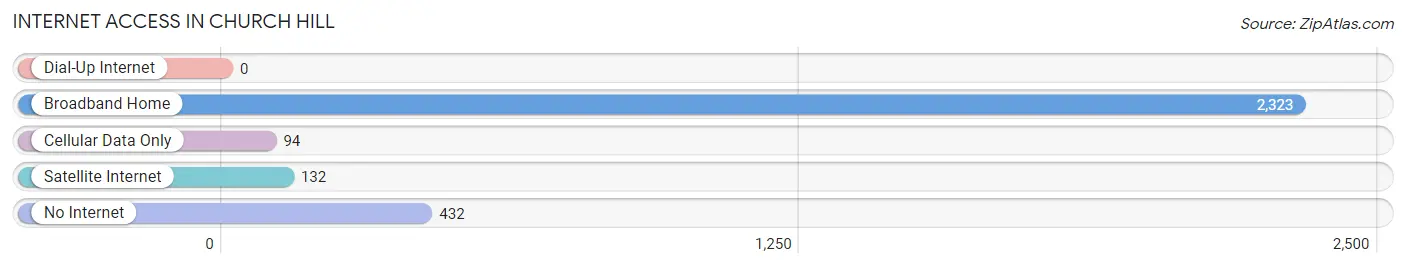
| Internet Type | # Households | % Households |
| Dial-Up Internet | 0 | 0.0% |
| Broadband Home | 2,323 | 81.0% |
| Cellular Data Only | 94 | 3.3% |
| Satellite Internet | 132 | 4.6% |
| No Internet | 432 | 15.1% |
| Total | 2,866 | 100.0% |
Church Hill Summary
Hill, Tennessee is a small town located in Hawkins County, in the northeastern part of the state. It is situated on the banks of the Holston River, and is part of the Kingsport-Bristol-Bristol metropolitan area. The town has a population of approximately 2,000 people, and is known for its historic buildings and quaint atmosphere.
History
The area that is now Church Hill was first settled in the late 1700s by a group of settlers from North Carolina. The town was originally known as “Mountain View”, and was later renamed “Church Hill” in 1819. The town was named after the nearby Church Hill Presbyterian Church, which was built in 1817.
The town was an important stop on the stagecoach route between Knoxville and Abingdon, Virginia. During the Civil War, Church Hill was the site of several skirmishes between Union and Confederate forces. After the war, the town experienced a period of growth and prosperity, and many of the town’s historic buildings were constructed during this time.
Geography
Church Hill is located in Hawkins County, in the northeastern part of the state. It is situated on the banks of the Holston River, and is part of the Kingsport-Bristol-Bristol metropolitan area. The town has a total area of 2.2 square miles, all of which is land. The town is located at an elevation of 1,068 feet above sea level.
The climate in Church Hill is humid subtropical, with hot, humid summers and mild winters. The average annual temperature is around 57 degrees Fahrenheit, and the average annual precipitation is around 45 inches.
Economy
The economy of Church Hill is largely based on agriculture and tourism. The town is home to several farms, and the surrounding area is known for its production of tobacco, corn, and hay. The town is also home to several small businesses, including restaurants, shops, and other services.
Tourism is an important part of the local economy, and the town is home to several historic sites, including the Church Hill Presbyterian Church, the Church Hill Inn, and the Church Hill Museum. The town also hosts several annual festivals and events, including the Church Hill Festival and the Church Hill Christmas Parade.
Demographics
As of the 2010 census, the population of Church Hill was 2,000 people. The racial makeup of the town was 97.2% White, 0.7% African American, 0.3% Native American, 0.2% Asian, 0.1% Pacific Islander, 0.5% from other races, and 1.1% from two or more races. Hispanic or Latino of any race were 1.2% of the population.
The median income for a household in Church Hill was $30,000, and the median income for a family was $35,000. The per capita income for the town was $15,000. About 15.2% of the population was below the poverty line.
Church Hill is a small town with a rich history and a unique atmosphere. The town is home to several historic sites, and the local economy is largely based on agriculture and tourism. The town has a population of approximately 2,000 people, and is known for its quaint atmosphere and friendly people.
Common Questions
What is Per Capita Income in Church Hill?
Per Capita income in Church Hill is $32,532.
What is the Median Family Income in Church Hill?
Median Family Income in Church Hill is $85,453.
What is the Median Household income in Church Hill?
Median Household Income in Church Hill is $65,518.
What is Income or Wage Gap in Church Hill?
Income or Wage Gap in Church Hill is 43.5%.
Women in Church Hill earn 56.5 cents for every dollar earned by a man.
What is Inequality or Gini Index in Church Hill?
Inequality or Gini Index in Church Hill is 0.40.
What is the Total Population of Church Hill?
Total Population of Church Hill is 7,016.
What is the Total Male Population of Church Hill?
Total Male Population of Church Hill is 3,335.
What is the Total Female Population of Church Hill?
Total Female Population of Church Hill is 3,681.
What is the Ratio of Males per 100 Females in Church Hill?
There are 90.60 Males per 100 Females in Church Hill.
What is the Ratio of Females per 100 Males in Church Hill?
There are 110.37 Females per 100 Males in Church Hill.
What is the Median Population Age in Church Hill?
Median Population Age in Church Hill is 47.6 Years.
What is the Average Family Size in Church Hill
Average Family Size in Church Hill is 2.8 People.
What is the Average Household Size in Church Hill
Average Household Size in Church Hill is 2.4 People.
How Large is the Labor Force in Church Hill?
There are 3,179 People in the Labor Forcein in Church Hill.
What is the Percentage of People in the Labor Force in Church Hill?
54.9% of People are in the Labor Force in Church Hill.
What is the Unemployment Rate in Church Hill?
Unemployment Rate in Church Hill is 13.3%.