Charlotte, TN Map & Demographics
Charlotte Map
Charlotte Overview
$26,636
PER CAPITA INCOME
$69,931
AVG FAMILY INCOME
$57,188
AVG HOUSEHOLD INCOME
25.6%
WAGE / INCOME GAP [ % ]
74.4¢/ $1
WAGE / INCOME GAP [ $ ]
$9,655
FAMILY INCOME DEFICIT
0.46
INEQUALITY / GINI INDEX
1,997
TOTAL POPULATION
1,077
MALE POPULATION
920
FEMALE POPULATION
117.07
MALES / 100 FEMALES
85.42
FEMALES / 100 MALES
36.8
MEDIAN AGE
3.8
AVG FAMILY SIZE
3.0
AVG HOUSEHOLD SIZE
711
LABOR FORCE [ PEOPLE ]
46.2%
PERCENT IN LABOR FORCE
5.1%
UNEMPLOYMENT RATE
Charlotte Zip Codes
Charlotte Area Codes
Income in Charlotte
Income Overview in Charlotte
Per Capita Income in Charlotte is $26,636, while median incomes of families and households are $69,931 and $57,188 respectively.
| Characteristic | Number | Measure |
| Per Capita Income | 1,997 | $26,636 |
| Median Family Income | 384 | $69,931 |
| Mean Family Income | 384 | $101,549 |
| Median Household Income | 580 | $57,188 |
| Mean Household Income | 580 | $83,795 |
| Income Deficit | 384 | $9,655 |
| Wage / Income Gap (%) | 1,997 | 25.61% |
| Wage / Income Gap ($) | 1,997 | 74.39¢ per $1 |
| Gini / Inequality Index | 1,997 | 0.46 |
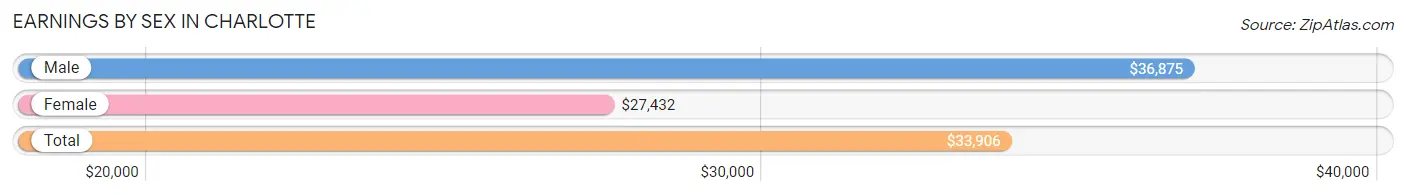
Earnings by Sex in Charlotte
Average Earnings in Charlotte are $33,906, $36,875 for men and $27,432 for women, a difference of 25.6%.
| Sex | Number | Average Earnings |
| Male | 504 (61.3%) | $36,875 |
| Female | 318 (38.7%) | $27,432 |
| Total | 822 (100.0%) | $33,906 |
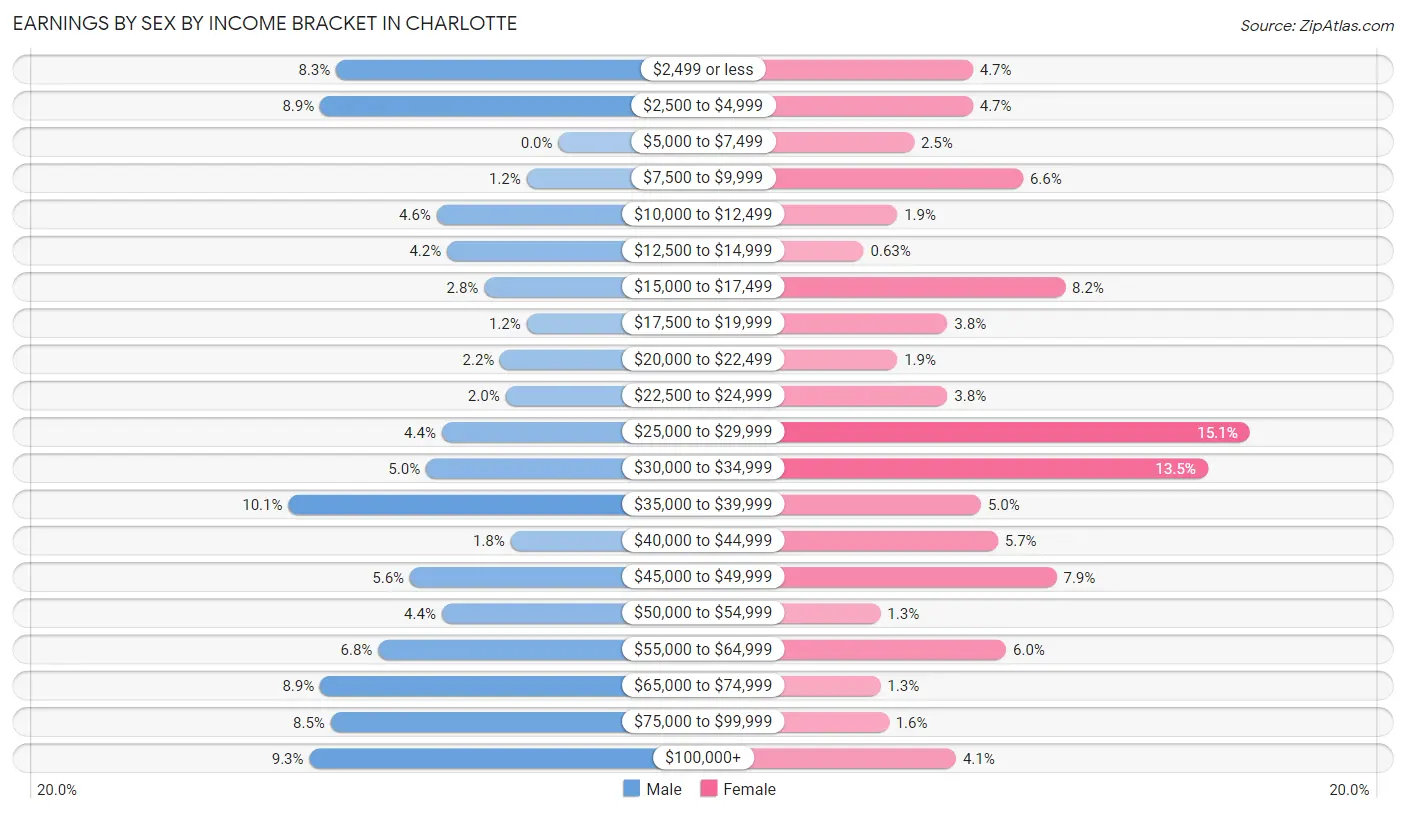
Earnings by Sex by Income Bracket in Charlotte
The most common earnings brackets in Charlotte are $35,000 to $39,999 for men (51 | 10.1%) and $25,000 to $29,999 for women (48 | 15.1%).
| Income | Male | Female |
| $2,499 or less | 42 (8.3%) | 15 (4.7%) |
| $2,500 to $4,999 | 45 (8.9%) | 15 (4.7%) |
| $5,000 to $7,499 | 0 (0.0%) | 8 (2.5%) |
| $7,500 to $9,999 | 6 (1.2%) | 21 (6.6%) |
| $10,000 to $12,499 | 23 (4.6%) | 6 (1.9%) |
| $12,500 to $14,999 | 21 (4.2%) | 2 (0.6%) |
| $15,000 to $17,499 | 14 (2.8%) | 26 (8.2%) |
| $17,500 to $19,999 | 6 (1.2%) | 12 (3.8%) |
| $20,000 to $22,499 | 11 (2.2%) | 6 (1.9%) |
| $22,500 to $24,999 | 10 (2.0%) | 12 (3.8%) |
| $25,000 to $29,999 | 22 (4.4%) | 48 (15.1%) |
| $30,000 to $34,999 | 25 (5.0%) | 43 (13.5%) |
| $35,000 to $39,999 | 51 (10.1%) | 16 (5.0%) |
| $40,000 to $44,999 | 9 (1.8%) | 18 (5.7%) |
| $45,000 to $49,999 | 28 (5.6%) | 25 (7.9%) |
| $50,000 to $54,999 | 22 (4.4%) | 4 (1.3%) |
| $55,000 to $64,999 | 34 (6.8%) | 19 (6.0%) |
| $65,000 to $74,999 | 45 (8.9%) | 4 (1.3%) |
| $75,000 to $99,999 | 43 (8.5%) | 5 (1.6%) |
| $100,000+ | 47 (9.3%) | 13 (4.1%) |
| Total | 504 (100.0%) | 318 (100.0%) |
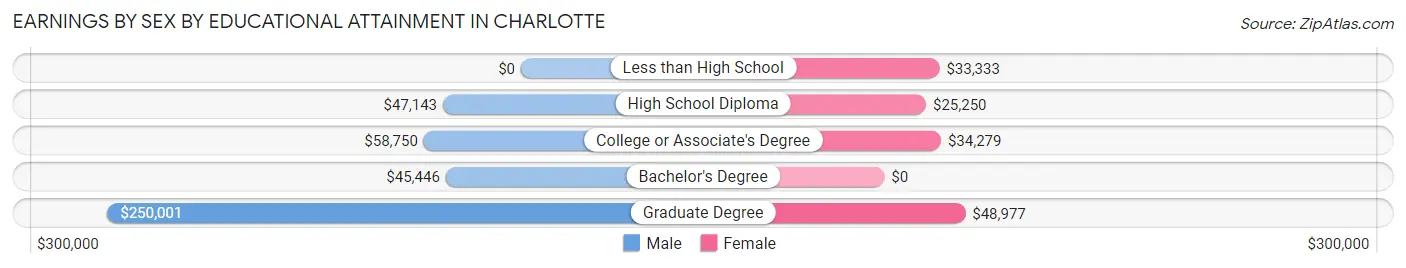
Earnings by Sex by Educational Attainment in Charlotte
Average earnings in Charlotte are $47,857 for men and $32,878 for women, a difference of 31.3%. Men with an educational attainment of graduate degree enjoy the highest average annual earnings of $250,001, while those with bachelor's degree education earn the least with $45,446. Women with an educational attainment of graduate degree earn the most with the average annual earnings of $48,977, while those with high school diploma education have the smallest earnings of $25,250.
| Educational Attainment | Male Income | Female Income |
| Less than High School | - | - |
| High School Diploma | $47,143 | $25,250 |
| College or Associate's Degree | $58,750 | $34,279 |
| Bachelor's Degree | $45,446 | $0 |
| Graduate Degree | $250,001 | $48,977 |
| Total | $47,857 | $32,878 |
Family Income in Charlotte
Family Income Brackets in Charlotte
According to the Charlotte family income data, there are 91 families falling into the $35,000 to $49,999 income range, which is the most common income bracket and makes up 23.7% of all families.
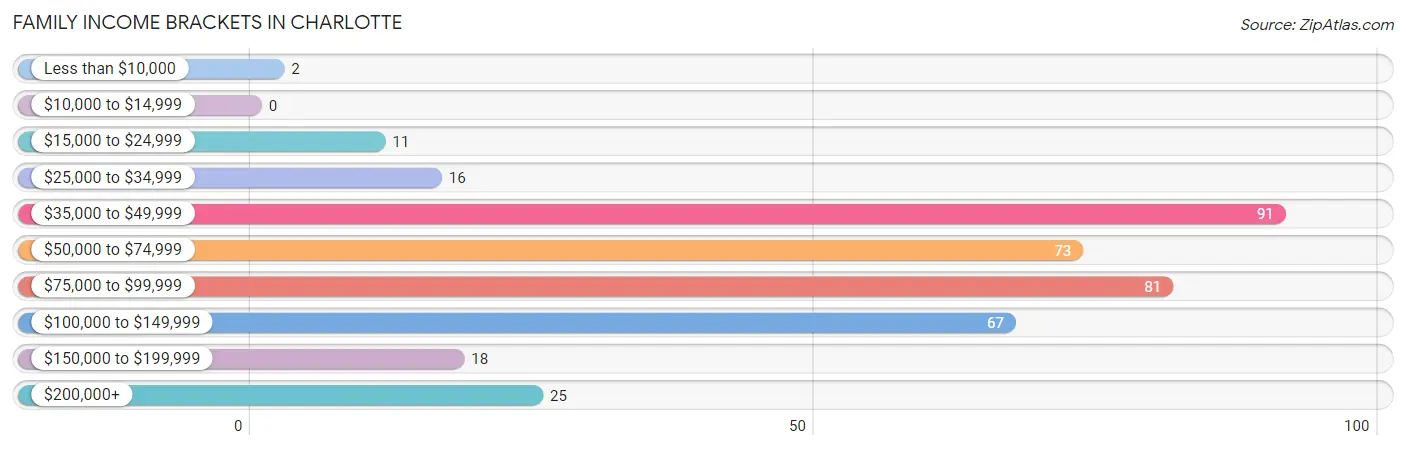
| Income Bracket | # Families | % Families |
| Less than $10,000 | 2 | 0.5% |
| $10,000 to $14,999 | 0 | 0.0% |
| $15,000 to $24,999 | 11 | 2.9% |
| $25,000 to $34,999 | 16 | 4.2% |
| $35,000 to $49,999 | 91 | 23.7% |
| $50,000 to $74,999 | 73 | 19.0% |
| $75,000 to $99,999 | 81 | 21.1% |
| $100,000 to $149,999 | 67 | 17.4% |
| $150,000 to $199,999 | 18 | 4.7% |
| $200,000+ | 25 | 6.5% |
Family Income by Famaliy Size in Charlotte
4-person families (78 | 20.3%) account for the highest median family income in Charlotte with $85,455 per family, while 2-person families (184 | 47.9%) have the highest median income of $30,625 per family member.
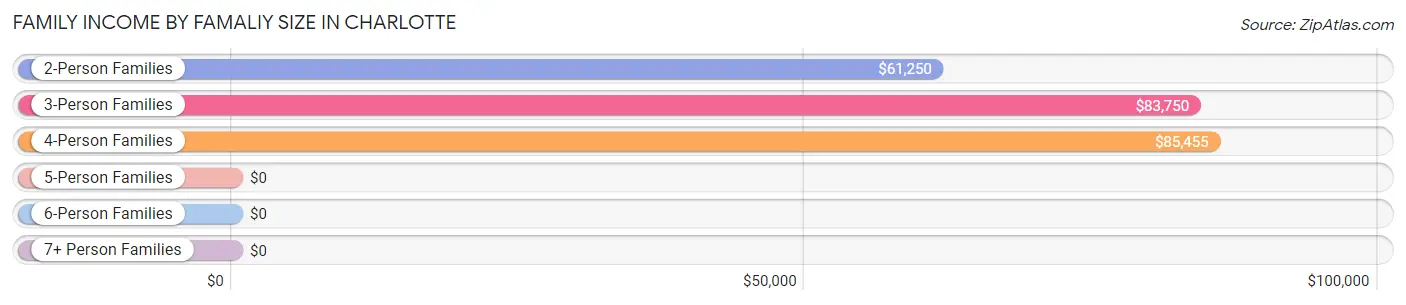
| Income Bracket | # Families | Median Income |
| 2-Person Families | 184 (47.9%) | $61,250 |
| 3-Person Families | 55 (14.3%) | $83,750 |
| 4-Person Families | 78 (20.3%) | $85,455 |
| 5-Person Families | 36 (9.4%) | $0 |
| 6-Person Families | 16 (4.2%) | $0 |
| 7+ Person Families | 15 (3.9%) | $0 |
| Total | 384 (100.0%) | $69,931 |
Family Income by Number of Earners in Charlotte
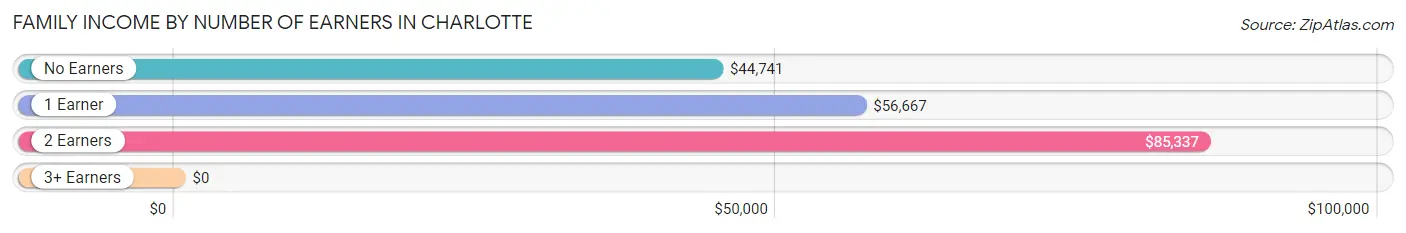
| Number of Earners | # Families | Median Income |
| No Earners | 94 (24.5%) | $44,741 |
| 1 Earner | 118 (30.7%) | $56,667 |
| 2 Earners | 127 (33.1%) | $85,337 |
| 3+ Earners | 45 (11.7%) | $0 |
| Total | 384 (100.0%) | $69,931 |
Household Income in Charlotte
Household Income Brackets in Charlotte
With 150 households falling in the category, the $35,000 to $49,999 income range is the most frequent in Charlotte, accounting for 25.9% of all households. In contrast, only 14 households (2.4%) fall into the $10,000 to $14,999 income bracket, making it the least populous group.
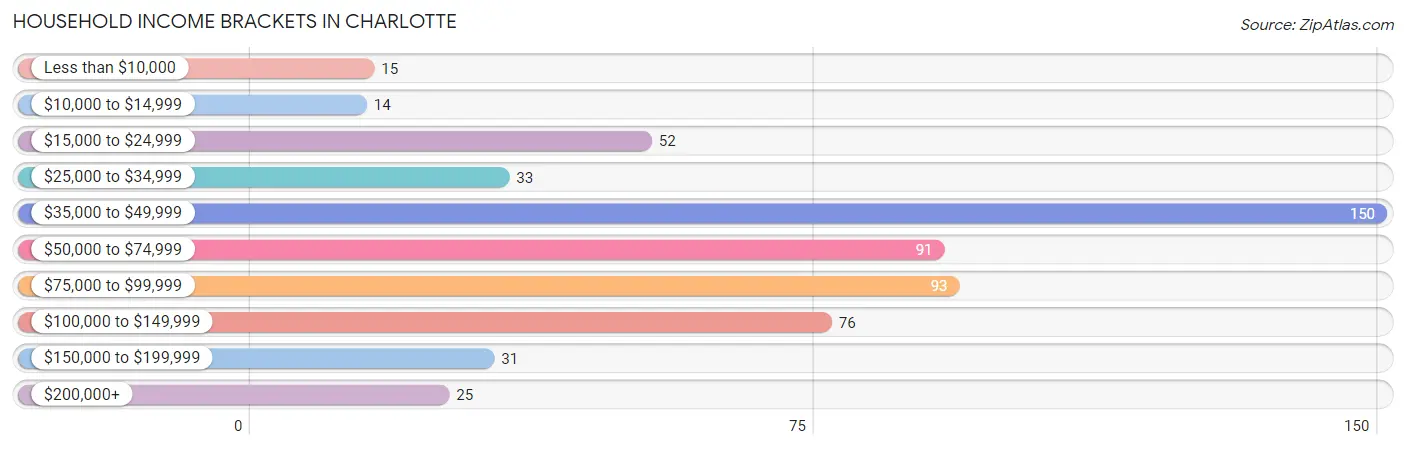
| Income Bracket | # Households | % Households |
| Less than $10,000 | 15 | 2.6% |
| $10,000 to $14,999 | 14 | 2.4% |
| $15,000 to $24,999 | 52 | 9.0% |
| $25,000 to $34,999 | 33 | 5.7% |
| $35,000 to $49,999 | 150 | 25.9% |
| $50,000 to $74,999 | 91 | 15.7% |
| $75,000 to $99,999 | 93 | 16.0% |
| $100,000 to $149,999 | 76 | 13.1% |
| $150,000 to $199,999 | 31 | 5.3% |
| $200,000+ | 25 | 4.3% |
Household Income by Householder Age in Charlotte
The median household income in Charlotte is $57,188, with the highest median household income of $68,000 found in the 45 to 64 years age bracket for the primary householder. A total of 186 households (32.1%) fall into this category. Meanwhile, the 15 to 24 years age bracket for the primary householder has the lowest median household income of $0, with 12 households (2.1%) in this group.
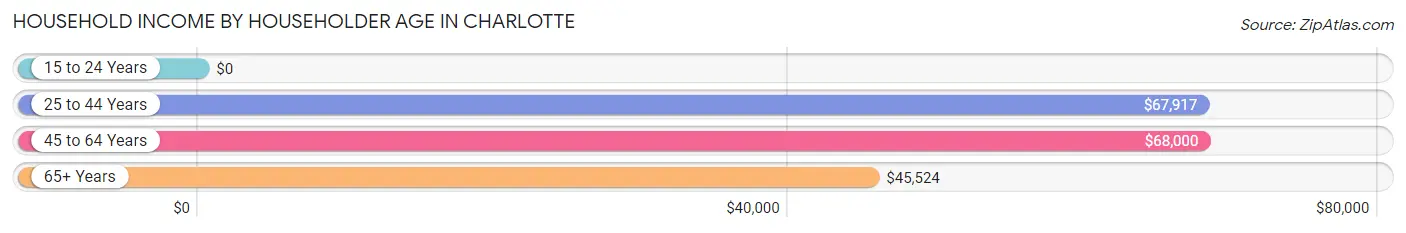
| Income Bracket | # Households | Median Income |
| 15 to 24 Years | 12 (2.1%) | $0 |
| 25 to 44 Years | 207 (35.7%) | $67,917 |
| 45 to 64 Years | 186 (32.1%) | $68,000 |
| 65+ Years | 175 (30.2%) | $45,524 |
| Total | 580 (100.0%) | $57,188 |
Poverty in Charlotte
Income Below Poverty by Sex and Age in Charlotte
With 5.9% poverty level for males and 12.9% for females among the residents of Charlotte, 15 year old males and 6 to 11 year old females are the most vulnerable to poverty, with 8 males (100.0%) and 16 females (45.7%) in their respective age groups living below the poverty level.
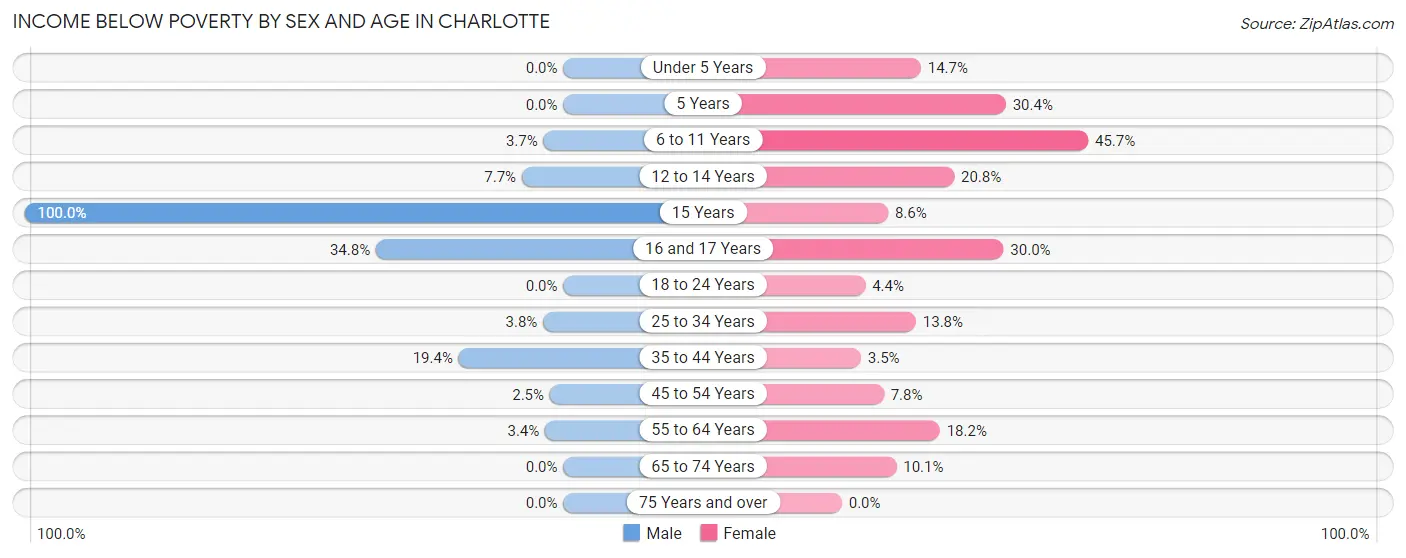
| Age Bracket | Male | Female |
| Under 5 Years | 0 (0.0%) | 17 (14.7%) |
| 5 Years | 0 (0.0%) | 7 (30.4%) |
| 6 to 11 Years | 4 (3.7%) | 16 (45.7%) |
| 12 to 14 Years | 2 (7.7%) | 5 (20.8%) |
| 15 Years | 8 (100.0%) | 3 (8.6%) |
| 16 and 17 Years | 8 (34.8%) | 6 (30.0%) |
| 18 to 24 Years | 0 (0.0%) | 2 (4.3%) |
| 25 to 34 Years | 3 (3.7%) | 11 (13.8%) |
| 35 to 44 Years | 20 (19.4%) | 4 (3.5%) |
| 45 to 54 Years | 2 (2.5%) | 7 (7.8%) |
| 55 to 64 Years | 5 (3.4%) | 20 (18.2%) |
| 65 to 74 Years | 0 (0.0%) | 9 (10.1%) |
| 75 Years and over | 0 (0.0%) | 0 (0.0%) |
| Total | 52 (5.9%) | 107 (12.9%) |
Income Above Poverty by Sex and Age in Charlotte
According to the poverty statistics in Charlotte, males aged under 5 years and females aged 75 years and over are the age groups that are most secure financially, with 100.0% of males and 100.0% of females in these age groups living above the poverty line.
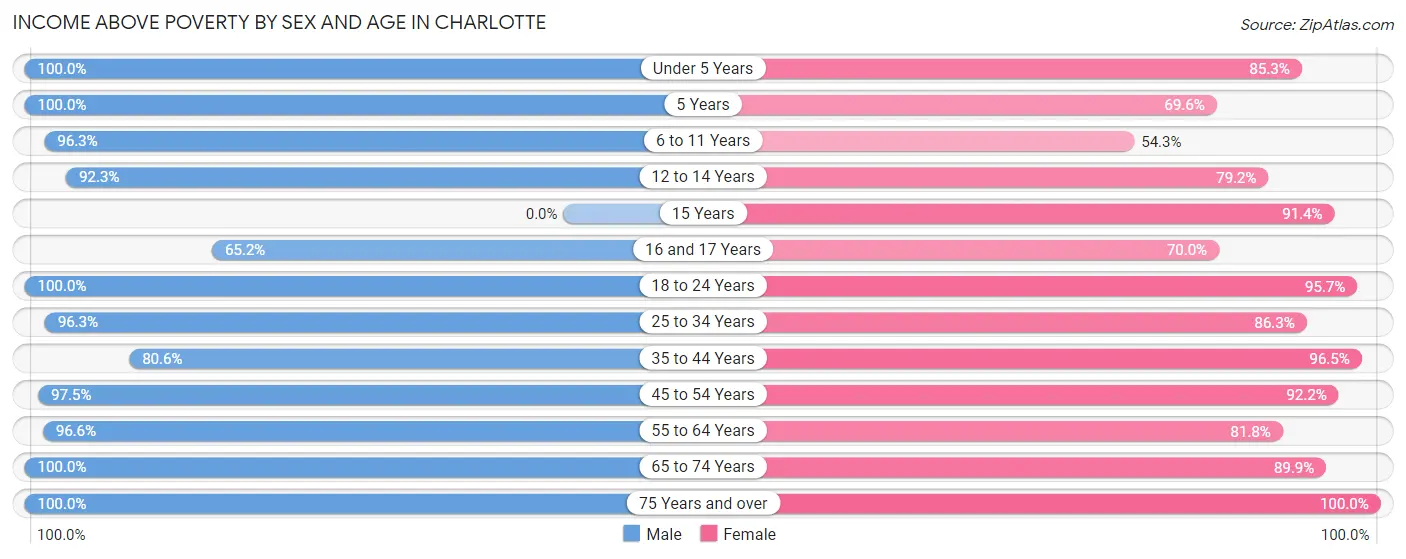
| Age Bracket | Male | Female |
| Under 5 Years | 41 (100.0%) | 99 (85.3%) |
| 5 Years | 22 (100.0%) | 16 (69.6%) |
| 6 to 11 Years | 105 (96.3%) | 19 (54.3%) |
| 12 to 14 Years | 24 (92.3%) | 19 (79.2%) |
| 15 Years | 0 (0.0%) | 32 (91.4%) |
| 16 and 17 Years | 15 (65.2%) | 14 (70.0%) |
| 18 to 24 Years | 106 (100.0%) | 44 (95.7%) |
| 25 to 34 Years | 77 (96.3%) | 69 (86.3%) |
| 35 to 44 Years | 83 (80.6%) | 109 (96.5%) |
| 45 to 54 Years | 78 (97.5%) | 83 (92.2%) |
| 55 to 64 Years | 143 (96.6%) | 90 (81.8%) |
| 65 to 74 Years | 118 (100.0%) | 80 (89.9%) |
| 75 Years and over | 25 (100.0%) | 50 (100.0%) |
| Total | 837 (94.2%) | 724 (87.1%) |
Income Below Poverty Among Married-Couple Families in Charlotte
The poverty statistics for married-couple families in Charlotte show that 1.9% or 6 of the total 315 families live below the poverty line. Families with 3 or 4 children have the highest poverty rate of 11.1%, comprising of 2 families. On the other hand, families with no children have the lowest poverty rate of 0.0%, which includes 0 families.
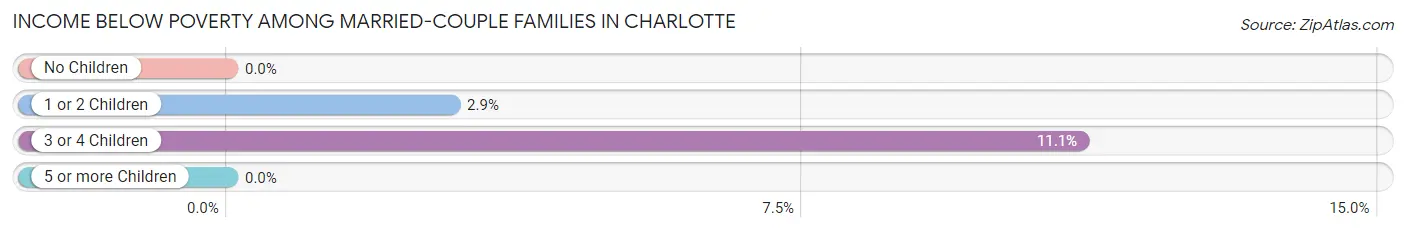
| Children | Above Poverty | Below Poverty |
| No Children | 159 (100.0%) | 0 (0.0%) |
| 1 or 2 Children | 134 (97.1%) | 4 (2.9%) |
| 3 or 4 Children | 16 (88.9%) | 2 (11.1%) |
| 5 or more Children | 0 (0.0%) | 0 (0.0%) |
| Total | 309 (98.1%) | 6 (1.9%) |
Income Below Poverty Among Single-Parent Households in Charlotte
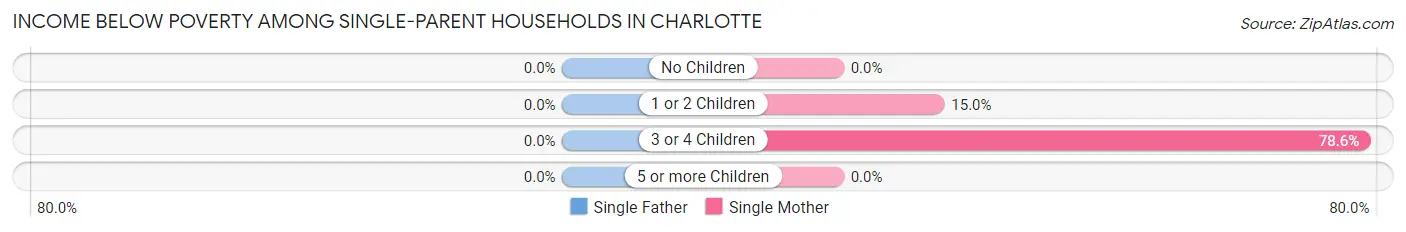
| Children | Single Father | Single Mother |
| No Children | 0 (0.0%) | 0 (0.0%) |
| 1 or 2 Children | 0 (0.0%) | 3 (15.0%) |
| 3 or 4 Children | 0 (0.0%) | 11 (78.6%) |
| 5 or more Children | 0 (0.0%) | 0 (0.0%) |
| Total | 0 (0.0%) | 14 (27.5%) |
Income Below Poverty Among Married-Couple vs Single-Parent Households in Charlotte
The poverty data for Charlotte shows that 6 of the married-couple family households (1.9%) and 14 of the single-parent households (20.3%) are living below the poverty level. Within the married-couple family households, those with 3 or 4 children have the highest poverty rate, with 2 households (11.1%) falling below the poverty line. Among the single-parent households, those with 3 or 4 children have the highest poverty rate, with 11 household (78.6%) living below poverty.
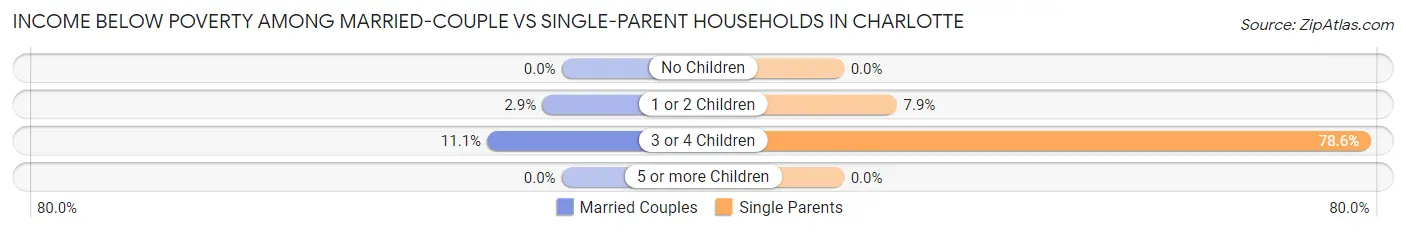
| Children | Married-Couple Families | Single-Parent Households |
| No Children | 0 (0.0%) | 0 (0.0%) |
| 1 or 2 Children | 4 (2.9%) | 3 (7.9%) |
| 3 or 4 Children | 2 (11.1%) | 11 (78.6%) |
| 5 or more Children | 0 (0.0%) | 0 (0.0%) |
| Total | 6 (1.9%) | 14 (20.3%) |
Race in Charlotte
The most populous races in Charlotte are White / Caucasian (1,749 | 87.6%), Two or more Races (108 | 5.4%), and Black / African American (102 | 5.1%).
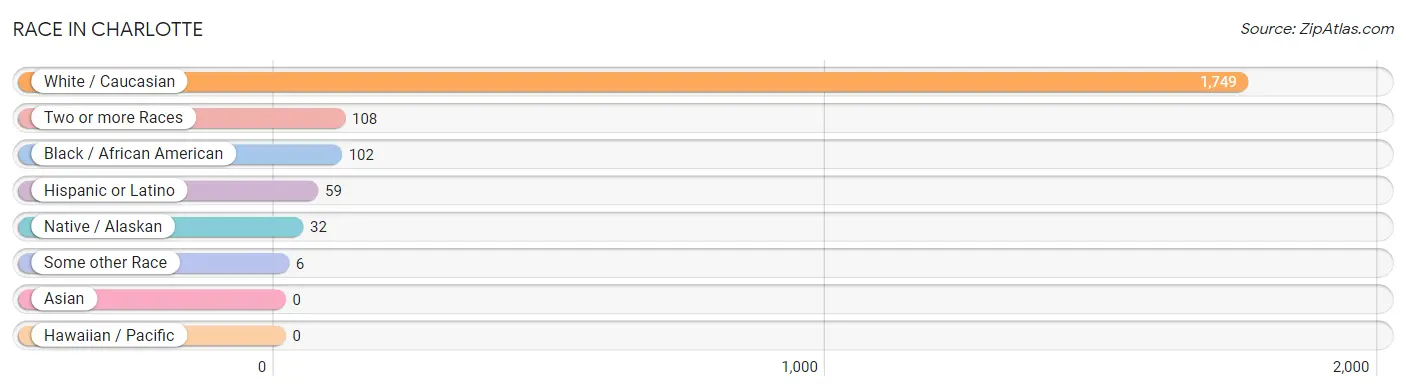
| Race | # Population | % Population |
| Asian | 0 | 0.0% |
| Black / African American | 102 | 5.1% |
| Hawaiian / Pacific | 0 | 0.0% |
| Hispanic or Latino | 59 | 2.9% |
| Native / Alaskan | 32 | 1.6% |
| White / Caucasian | 1,749 | 87.6% |
| Two or more Races | 108 | 5.4% |
| Some other Race | 6 | 0.3% |
| Total | 1,997 | 100.0% |
Ancestry in Charlotte
The most populous ancestries reported in Charlotte are American (455 | 22.8%), English (302 | 15.1%), German (111 | 5.6%), Irish (91 | 4.6%), and European (64 | 3.2%), together accounting for 51.2% of all Charlotte residents.
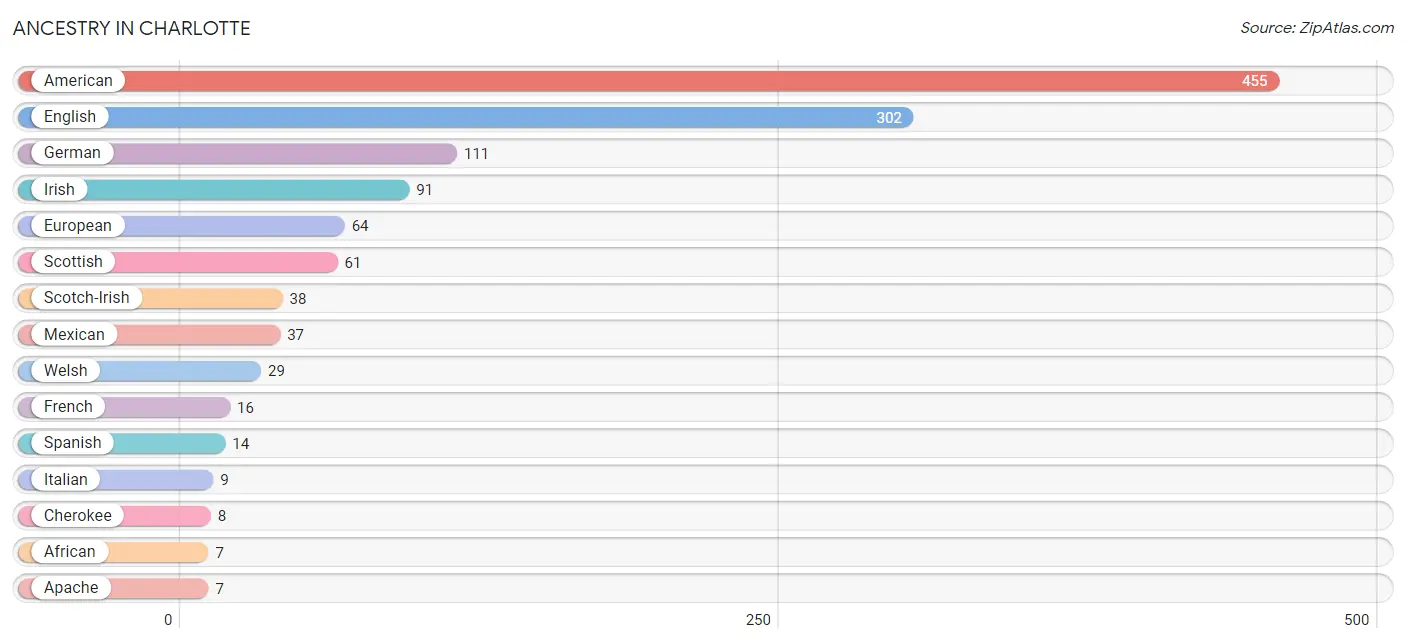
| Ancestry | # Population | % Population |
| African | 7 | 0.4% |
| American | 455 | 22.8% |
| Apache | 7 | 0.4% |
| British | 4 | 0.2% |
| Cherokee | 8 | 0.4% |
| Czech | 4 | 0.2% |
| Dutch | 4 | 0.2% |
| English | 302 | 15.1% |
| European | 64 | 3.2% |
| French | 16 | 0.8% |
| German | 111 | 5.6% |
| Irish | 91 | 4.6% |
| Italian | 9 | 0.4% |
| Korean | 6 | 0.3% |
| Mexican | 37 | 1.8% |
| Norwegian | 5 | 0.3% |
| Polish | 6 | 0.3% |
| Scotch-Irish | 38 | 1.9% |
| Scottish | 61 | 3.0% |
| Spanish | 14 | 0.7% |
| Subsaharan African | 7 | 0.4% |
| Swedish | 4 | 0.2% |
| Welsh | 29 | 1.5% | View All 23 Rows |
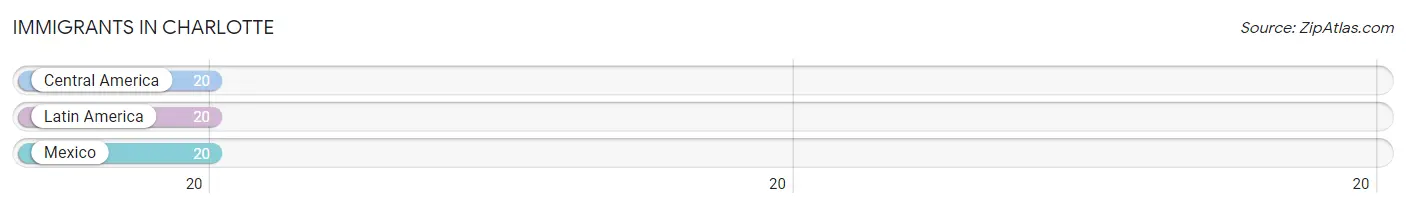
Immigrants in Charlotte
The most numerous immigrant groups reported in Charlotte came from Central America (20 | 1.0%), Latin America (20 | 1.0%), and Mexico (20 | 1.0%), together accounting for 3.0% of all Charlotte residents.
| Immigration Origin | # Population | % Population |
| Central America | 20 | 1.0% |
| Latin America | 20 | 1.0% |
| Mexico | 20 | 1.0% | View All 3 Rows |
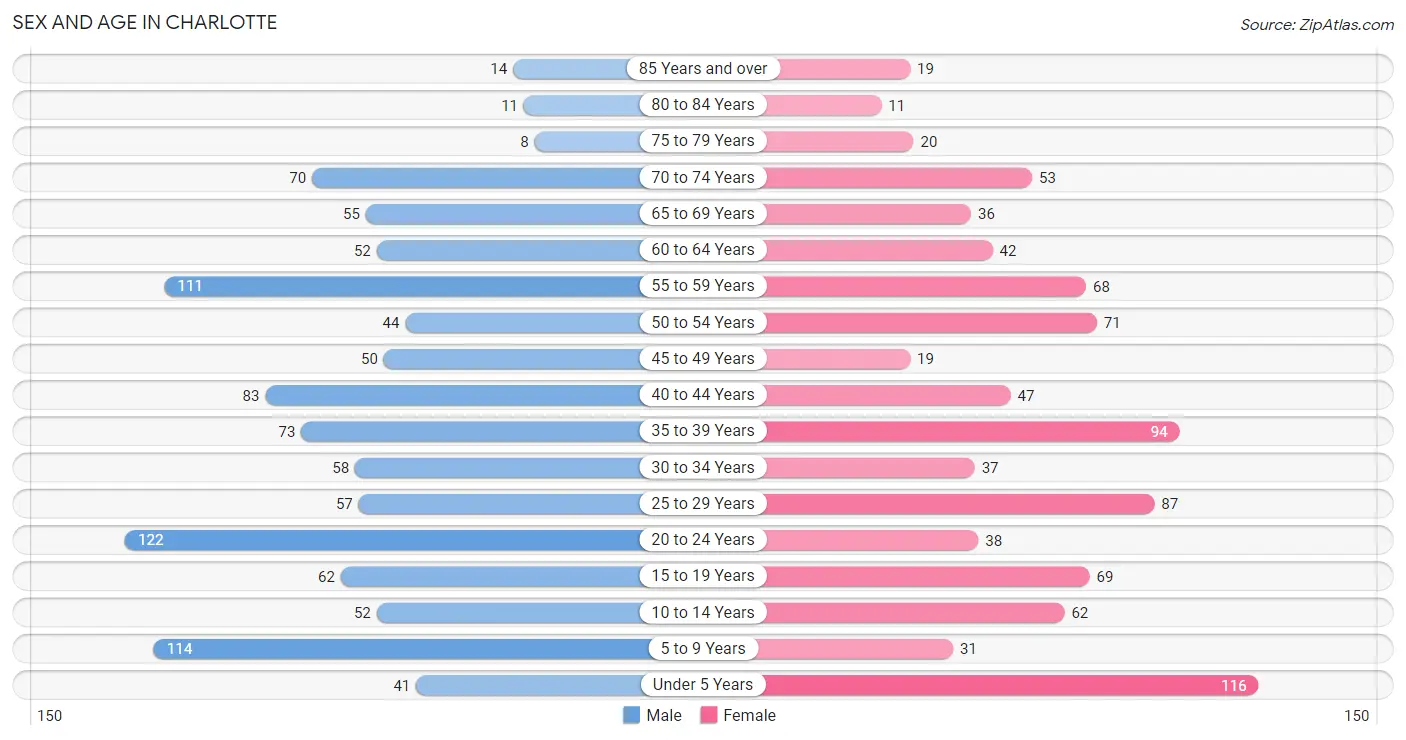
Sex and Age in Charlotte
Sex and Age in Charlotte
The most populous age groups in Charlotte are 20 to 24 Years (122 | 11.3%) for men and Under 5 Years (116 | 12.6%) for women.
| Age Bracket | Male | Female |
| Under 5 Years | 41 (3.8%) | 116 (12.6%) |
| 5 to 9 Years | 114 (10.6%) | 31 (3.4%) |
| 10 to 14 Years | 52 (4.8%) | 62 (6.7%) |
| 15 to 19 Years | 62 (5.8%) | 69 (7.5%) |
| 20 to 24 Years | 122 (11.3%) | 38 (4.1%) |
| 25 to 29 Years | 57 (5.3%) | 87 (9.5%) |
| 30 to 34 Years | 58 (5.4%) | 37 (4.0%) |
| 35 to 39 Years | 73 (6.8%) | 94 (10.2%) |
| 40 to 44 Years | 83 (7.7%) | 47 (5.1%) |
| 45 to 49 Years | 50 (4.6%) | 19 (2.1%) |
| 50 to 54 Years | 44 (4.1%) | 71 (7.7%) |
| 55 to 59 Years | 111 (10.3%) | 68 (7.4%) |
| 60 to 64 Years | 52 (4.8%) | 42 (4.6%) |
| 65 to 69 Years | 55 (5.1%) | 36 (3.9%) |
| 70 to 74 Years | 70 (6.5%) | 53 (5.8%) |
| 75 to 79 Years | 8 (0.7%) | 20 (2.2%) |
| 80 to 84 Years | 11 (1.0%) | 11 (1.2%) |
| 85 Years and over | 14 (1.3%) | 19 (2.1%) |
| Total | 1,077 (100.0%) | 920 (100.0%) |
Families and Households in Charlotte
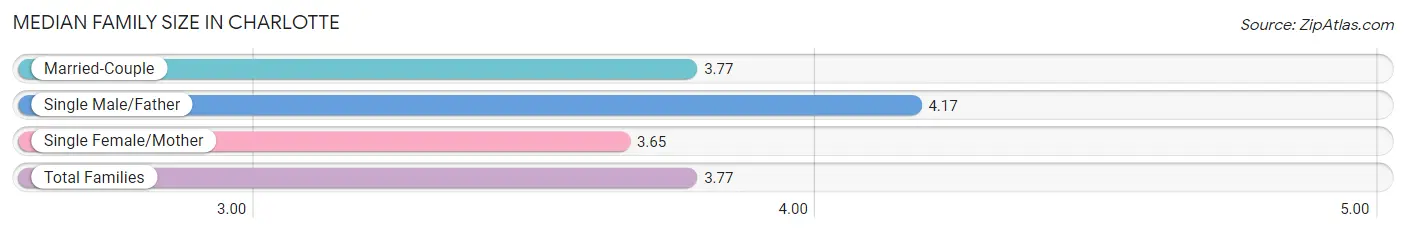
Median Family Size in Charlotte
The median family size in Charlotte is 3.77 persons per family, with single male/father families (18 | 4.7%) accounting for the largest median family size of 4.17 persons per family. On the other hand, single female/mother families (51 | 13.3%) represent the smallest median family size with 3.65 persons per family.
| Family Type | # Families | Family Size |
| Married-Couple | 315 (82.0%) | 3.77 |
| Single Male/Father | 18 (4.7%) | 4.17 |
| Single Female/Mother | 51 (13.3%) | 3.65 |
| Total Families | 384 (100.0%) | 3.77 |
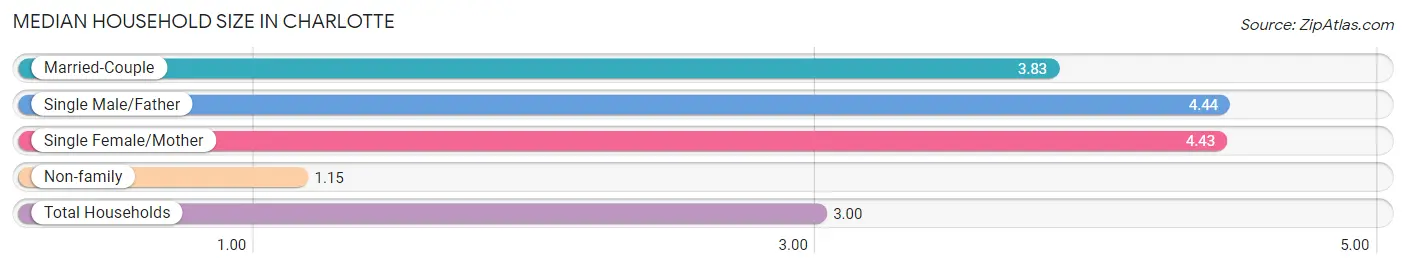
Median Household Size in Charlotte
The median household size in Charlotte is 3.00 persons per household, with single male/father households (18 | 3.1%) accounting for the largest median household size of 4.44 persons per household. non-family households (196 | 33.8%) represent the smallest median household size with 1.15 persons per household.
| Household Type | # Households | Household Size |
| Married-Couple | 315 (54.3%) | 3.83 |
| Single Male/Father | 18 (3.1%) | 4.44 |
| Single Female/Mother | 51 (8.8%) | 4.43 |
| Non-family | 196 (33.8%) | 1.15 |
| Total Households | 580 (100.0%) | 3.00 |
Household Size by Marriage Status in Charlotte
Out of a total of 580 households in Charlotte, 384 (66.2%) are family households, while 196 (33.8%) are nonfamily households. The most numerous type of family households are 2-person households, comprising 176, and the most common type of nonfamily households are 1-person households, comprising 166.
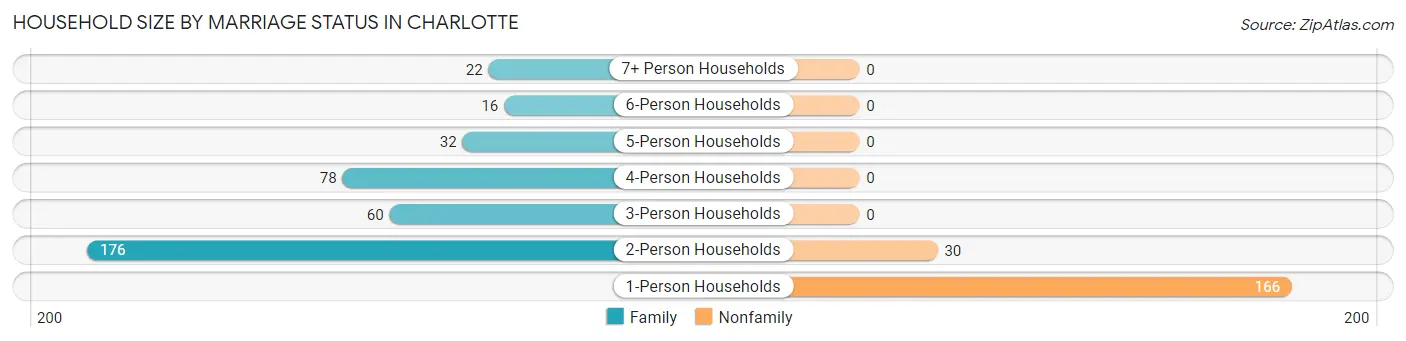
| Household Size | Family Households | Nonfamily Households |
| 1-Person Households | - | 166 (28.6%) |
| 2-Person Households | 176 (30.3%) | 30 (5.2%) |
| 3-Person Households | 60 (10.3%) | 0 (0.0%) |
| 4-Person Households | 78 (13.5%) | 0 (0.0%) |
| 5-Person Households | 32 (5.5%) | 0 (0.0%) |
| 6-Person Households | 16 (2.8%) | 0 (0.0%) |
| 7+ Person Households | 22 (3.8%) | 0 (0.0%) |
| Total | 384 (66.2%) | 196 (33.8%) |
Female Fertility in Charlotte
Fertility by Age in Charlotte
Average fertility rate in Charlotte is 71.0 births per 1,000 women. Women in the age bracket of 35 to 50 years have the highest fertility rate with 105.0 births per 1,000 women. Women in the age bracket of 35 to 50 years acount for 60.7% of all women with births.
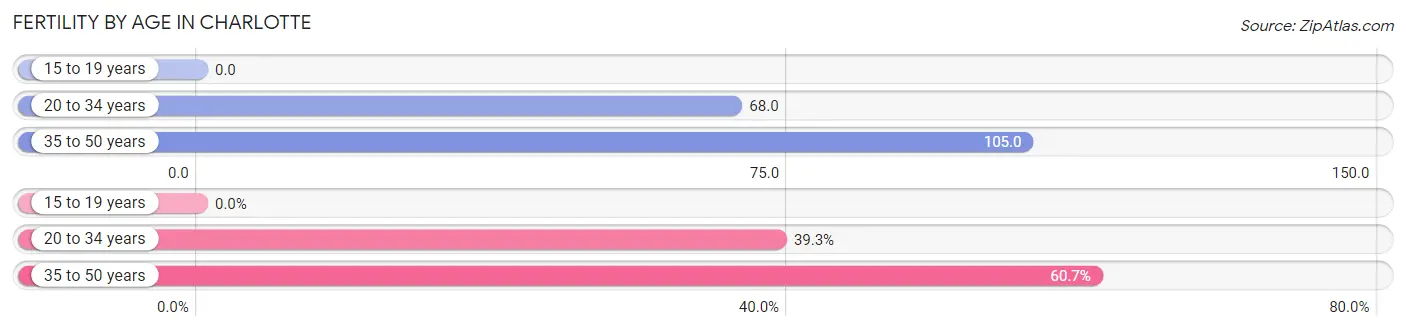
| Age Bracket | Women with Births | Births / 1,000 Women |
| 15 to 19 years | 0 (0.0%) | 0.0 |
| 20 to 34 years | 11 (39.3%) | 68.0 |
| 35 to 50 years | 17 (60.7%) | 105.0 |
| Total | 28 (100.0%) | 71.0 |
Fertility by Age by Marriage Status in Charlotte
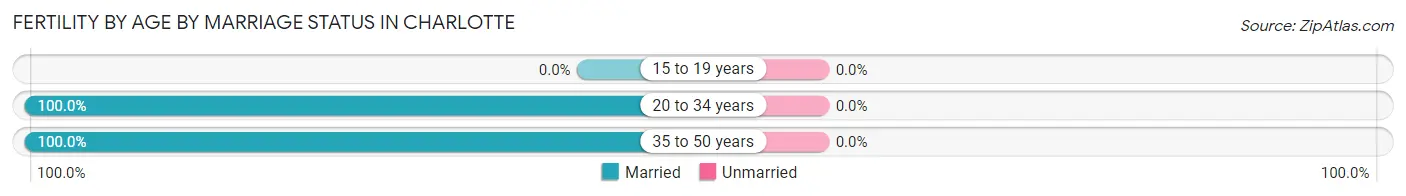
| Age Bracket | Married | Unmarried |
| 15 to 19 years | 0 (0.0%) | 0 (0.0%) |
| 20 to 34 years | 11 (100.0%) | 0 (0.0%) |
| 35 to 50 years | 17 (100.0%) | 0 (0.0%) |
| Total | 28 (100.0%) | 0 (0.0%) |
Fertility by Education in Charlotte
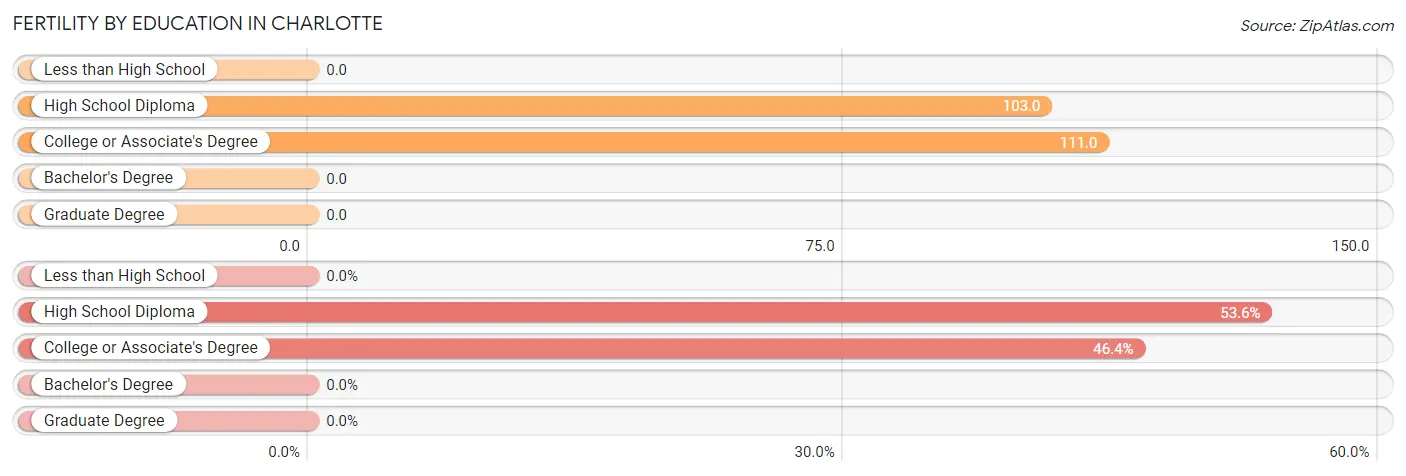
| Educational Attainment | Women with Births | Births / 1,000 Women |
| Less than High School | 0 (0.0%) | 0.0 |
| High School Diploma | 15 (53.6%) | 103.0 |
| College or Associate's Degree | 13 (46.4%) | 111.0 |
| Bachelor's Degree | 0 (0.0%) | 0.0 |
| Graduate Degree | 0 (0.0%) | 0.0 |
| Total | 28 (100.0%) | 71.0 |
Fertility by Education by Marriage Status in Charlotte
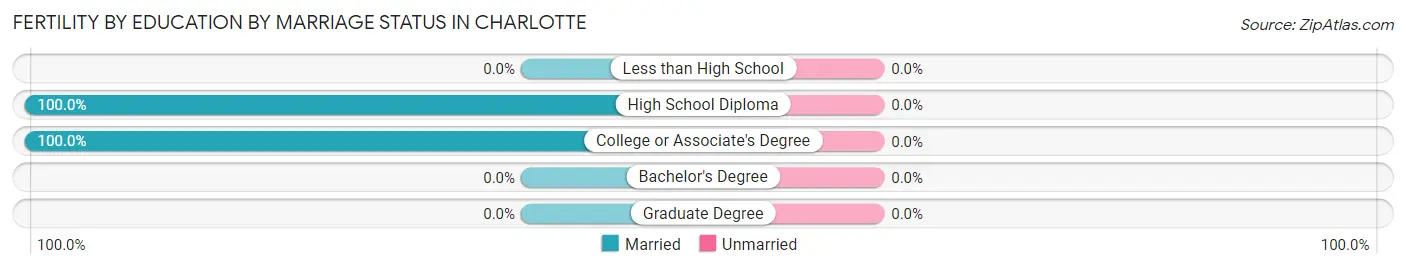
| Educational Attainment | Married | Unmarried |
| Less than High School | 0 (0.0%) | 0 (0.0%) |
| High School Diploma | 15 (100.0%) | 0 (0.0%) |
| College or Associate's Degree | 13 (100.0%) | 0 (0.0%) |
| Bachelor's Degree | 0 (0.0%) | 0 (0.0%) |
| Graduate Degree | 0 (0.0%) | 0 (0.0%) |
| Total | 28 (100.0%) | 0 (0.0%) |
Employment Characteristics in Charlotte
Employment by Class of Employer in Charlotte
Among the 660 employed individuals in Charlotte, private company employees (522 | 79.1%), self-employed (incorporated) (40 | 6.1%), and not-for-profit organizations (35 | 5.3%) make up the most common classes of employment.
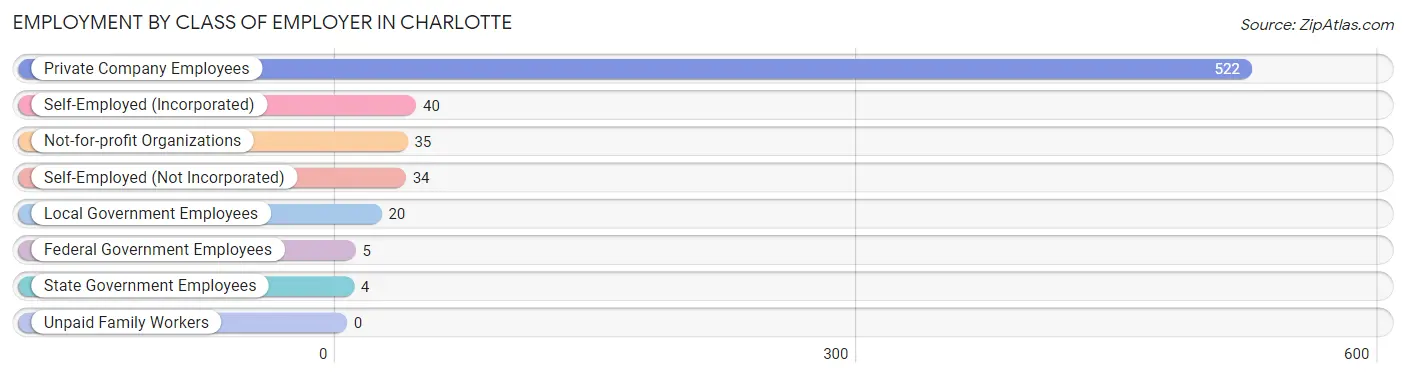
| Employer Class | # Employees | % Employees |
| Private Company Employees | 522 | 79.1% |
| Self-Employed (Incorporated) | 40 | 6.1% |
| Self-Employed (Not Incorporated) | 34 | 5.1% |
| Not-for-profit Organizations | 35 | 5.3% |
| Local Government Employees | 20 | 3.0% |
| State Government Employees | 4 | 0.6% |
| Federal Government Employees | 5 | 0.8% |
| Unpaid Family Workers | 0 | 0.0% |
| Total | 660 | 100.0% |
Employment Status by Age in Charlotte
According to the labor force statistics for Charlotte, out of the total population over 16 years of age (1,538), 46.2% or 711 individuals are in the labor force, with 5.1% or 36 of them unemployed. The age group with the highest labor force participation rate is 45 to 54 years, with 73.4% or 135 individuals in the labor force. Within the labor force, the 45 to 54 years age range has the highest percentage of unemployed individuals, with 14.8% or 20 of them being unemployed.
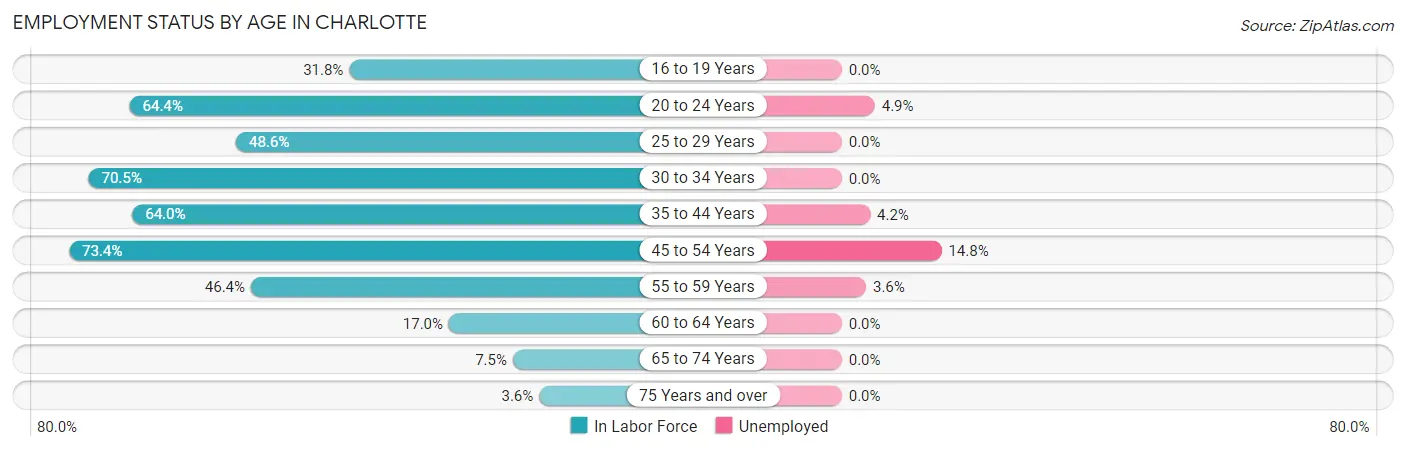
| Age Bracket | In Labor Force | Unemployed |
| 16 to 19 Years | 28 (31.8%) | 0 (0.0%) |
| 20 to 24 Years | 103 (64.4%) | 5 (4.9%) |
| 25 to 29 Years | 70 (48.6%) | 0 (0.0%) |
| 30 to 34 Years | 67 (70.5%) | 0 (0.0%) |
| 35 to 44 Years | 190 (64.0%) | 8 (4.2%) |
| 45 to 54 Years | 135 (73.4%) | 20 (14.8%) |
| 55 to 59 Years | 83 (46.4%) | 3 (3.6%) |
| 60 to 64 Years | 16 (17.0%) | 0 (0.0%) |
| 65 to 74 Years | 16 (7.5%) | 0 (0.0%) |
| 75 Years and over | 3 (3.6%) | 0 (0.0%) |
| Total | 711 (46.2%) | 36 (5.1%) |
Employment Status by Educational Attainment in Charlotte
According to labor force statistics for Charlotte, 56.5% of individuals (561) out of the total population between 25 and 64 years of age (993) are in the labor force, with 5.5% or 31 of them being unemployed. The group with the highest labor force participation rate are those with the educational attainment of bachelor's degree or higher, with 67.4% or 93 individuals in the labor force. Within the labor force, individuals with high school diploma education have the highest percentage of unemployment, with 9.7% or 20 of them being unemployed.
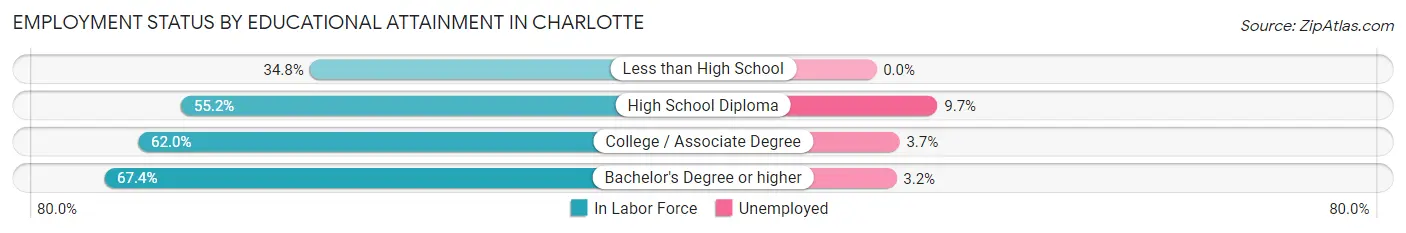
| Educational Attainment | In Labor Force | Unemployed |
| Less than High School | 47 (34.8%) | 0 (0.0%) |
| High School Diploma | 206 (55.2%) | 36 (9.7%) |
| College / Associate Degree | 215 (62.0%) | 13 (3.7%) |
| Bachelor's Degree or higher | 93 (67.4%) | 4 (3.2%) |
| Total | 561 (56.5%) | 55 (5.5%) |
Employment Occupations by Sex in Charlotte
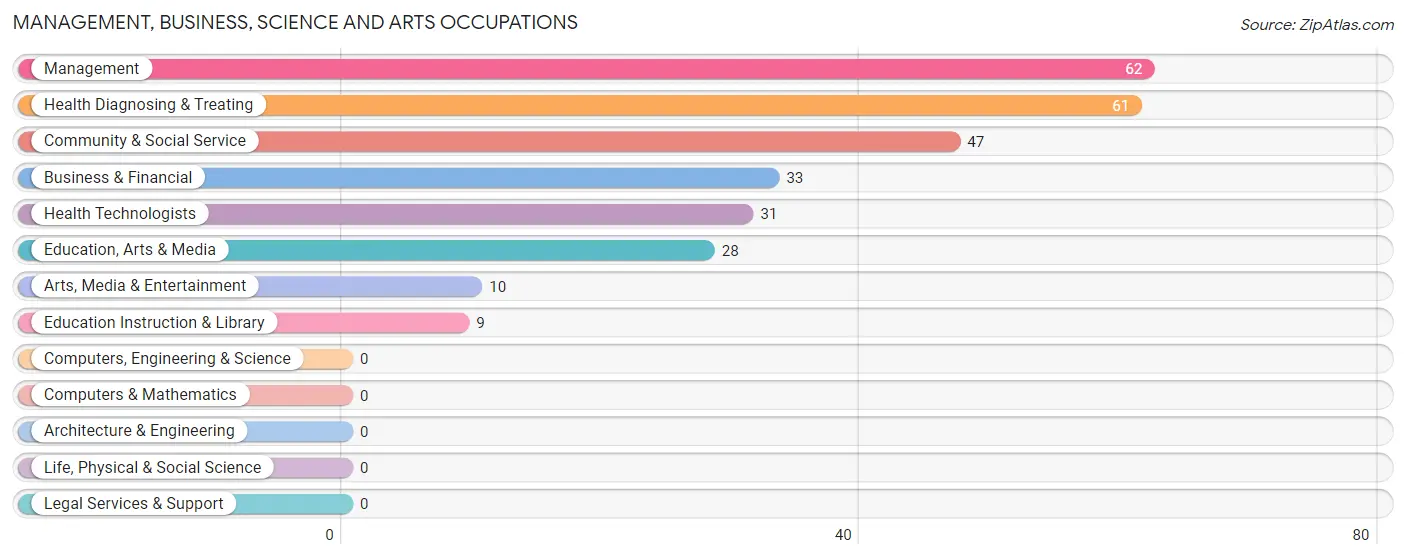
Management, Business, Science and Arts Occupations
The most common Management, Business, Science and Arts occupations in Charlotte are Management (62 | 9.2%), Health Diagnosing & Treating (61 | 9.0%), Community & Social Service (47 | 7.0%), Business & Financial (33 | 4.9%), and Health Technologists (31 | 4.6%).
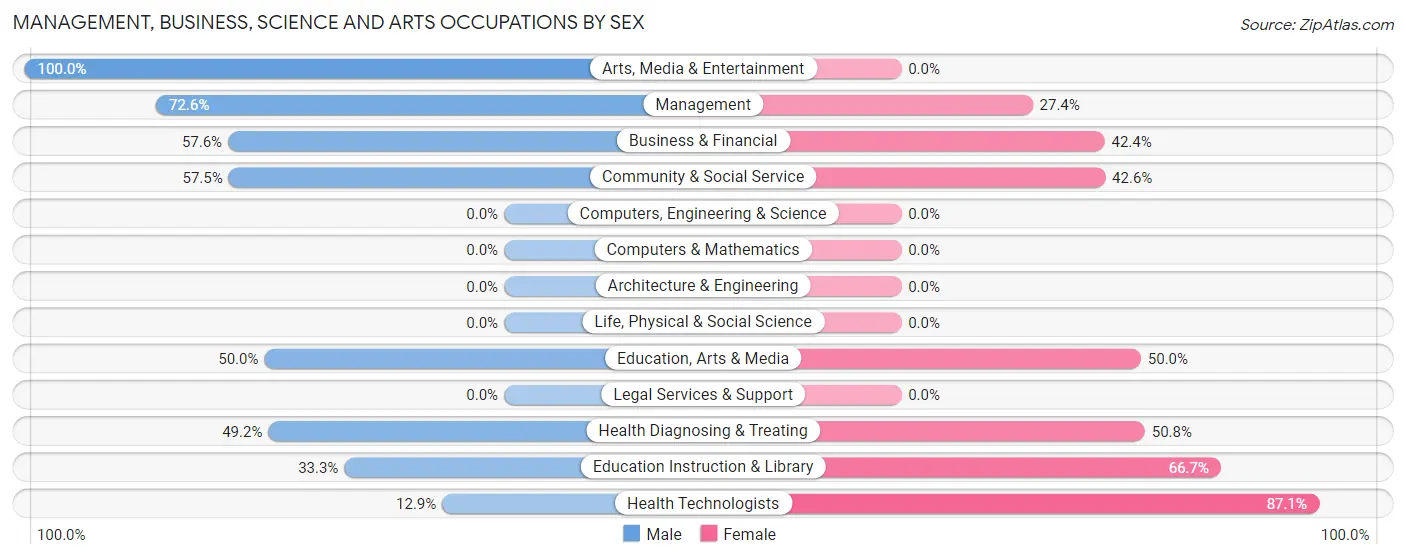
Management, Business, Science and Arts Occupations by Sex
Within the Management, Business, Science and Arts occupations in Charlotte, the most male-oriented occupations are Arts, Media & Entertainment (100.0%), Management (72.6%), and Business & Financial (57.6%), while the most female-oriented occupations are Health Technologists (87.1%), Education Instruction & Library (66.7%), and Health Diagnosing & Treating (50.8%).
| Occupation | Male | Female |
| Management | 45 (72.6%) | 17 (27.4%) |
| Business & Financial | 19 (57.6%) | 14 (42.4%) |
| Computers, Engineering & Science | 0 (0.0%) | 0 (0.0%) |
| Computers & Mathematics | 0 (0.0%) | 0 (0.0%) |
| Architecture & Engineering | 0 (0.0%) | 0 (0.0%) |
| Life, Physical & Social Science | 0 (0.0%) | 0 (0.0%) |
| Community & Social Service | 27 (57.5%) | 20 (42.5%) |
| Education, Arts & Media | 14 (50.0%) | 14 (50.0%) |
| Legal Services & Support | 0 (0.0%) | 0 (0.0%) |
| Education Instruction & Library | 3 (33.3%) | 6 (66.7%) |
| Arts, Media & Entertainment | 10 (100.0%) | 0 (0.0%) |
| Health Diagnosing & Treating | 30 (49.2%) | 31 (50.8%) |
| Health Technologists | 4 (12.9%) | 27 (87.1%) |
| Total (Category) | 121 (59.6%) | 82 (40.4%) |
| Total (Overall) | 408 (60.4%) | 267 (39.6%) |
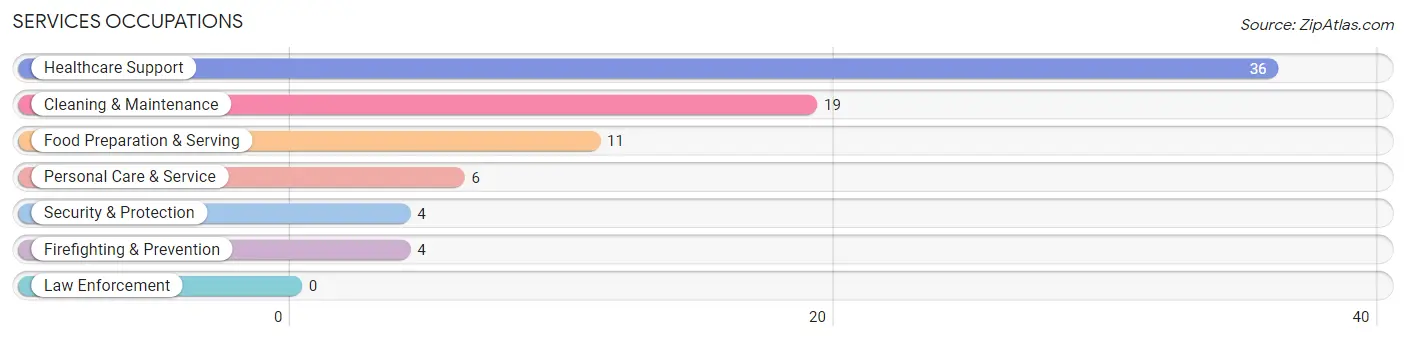
Services Occupations
The most common Services occupations in Charlotte are Healthcare Support (36 | 5.3%), Cleaning & Maintenance (19 | 2.8%), Food Preparation & Serving (11 | 1.6%), Personal Care & Service (6 | 0.9%), and Security & Protection (4 | 0.6%).
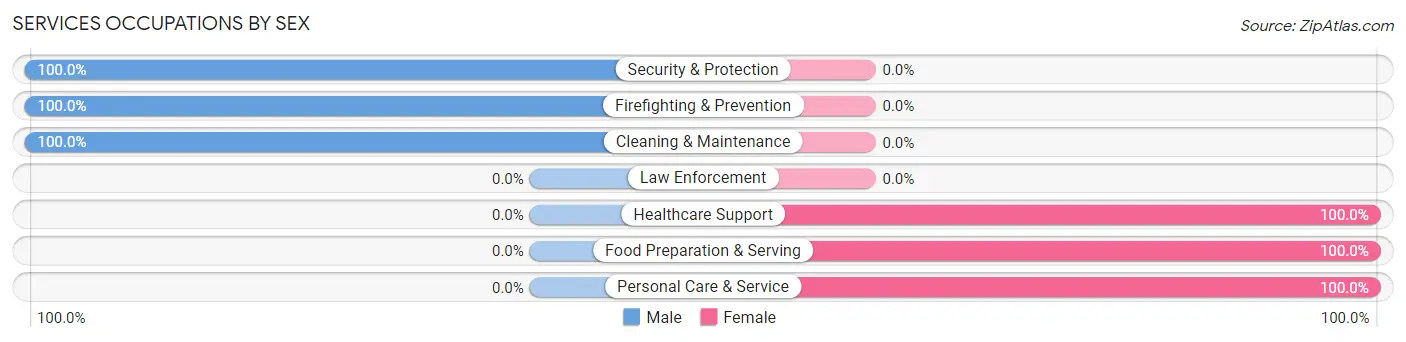
Services Occupations by Sex
Within the Services occupations in Charlotte, the most male-oriented occupations are Security & Protection (100.0%), Firefighting & Prevention (100.0%), and Cleaning & Maintenance (100.0%), while the most female-oriented occupations are Healthcare Support (100.0%), Food Preparation & Serving (100.0%), and Personal Care & Service (100.0%).
| Occupation | Male | Female |
| Healthcare Support | 0 (0.0%) | 36 (100.0%) |
| Security & Protection | 4 (100.0%) | 0 (0.0%) |
| Firefighting & Prevention | 4 (100.0%) | 0 (0.0%) |
| Law Enforcement | 0 (0.0%) | 0 (0.0%) |
| Food Preparation & Serving | 0 (0.0%) | 11 (100.0%) |
| Cleaning & Maintenance | 19 (100.0%) | 0 (0.0%) |
| Personal Care & Service | 0 (0.0%) | 6 (100.0%) |
| Total (Category) | 23 (30.3%) | 53 (69.7%) |
| Total (Overall) | 408 (60.4%) | 267 (39.6%) |
Sales and Office Occupations
The most common Sales and Office occupations in Charlotte are Office & Administration (119 | 17.6%), and Sales & Related (27 | 4.0%).

Sales and Office Occupations by Sex

| Occupation | Male | Female |
| Sales & Related | 15 (55.6%) | 12 (44.4%) |
| Office & Administration | 20 (16.8%) | 99 (83.2%) |
| Total (Category) | 35 (24.0%) | 111 (76.0%) |
| Total (Overall) | 408 (60.4%) | 267 (39.6%) |
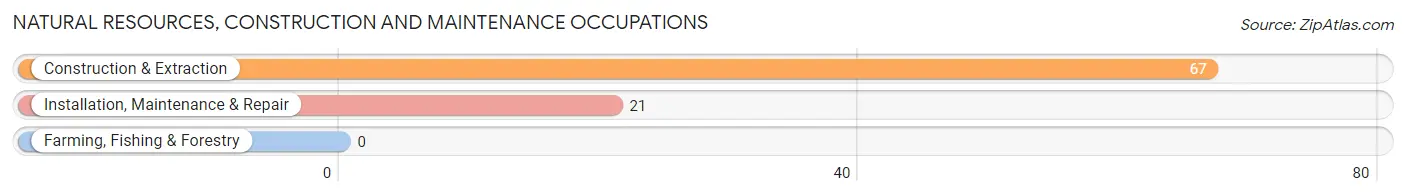
Natural Resources, Construction and Maintenance Occupations
The most common Natural Resources, Construction and Maintenance occupations in Charlotte are Construction & Extraction (67 | 9.9%), and Installation, Maintenance & Repair (21 | 3.1%).
Natural Resources, Construction and Maintenance Occupations by Sex
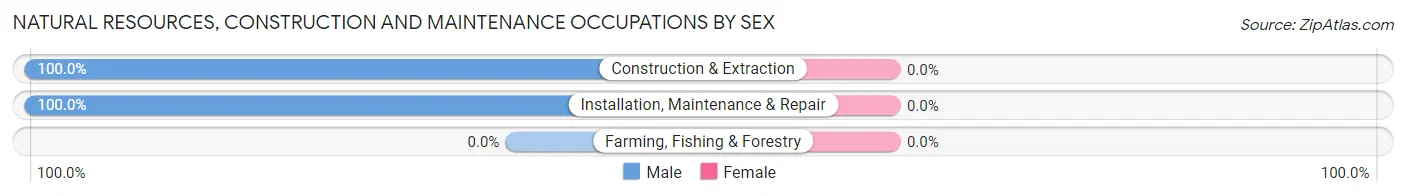
| Occupation | Male | Female |
| Farming, Fishing & Forestry | 0 (0.0%) | 0 (0.0%) |
| Construction & Extraction | 67 (100.0%) | 0 (0.0%) |
| Installation, Maintenance & Repair | 21 (100.0%) | 0 (0.0%) |
| Total (Category) | 88 (100.0%) | 0 (0.0%) |
| Total (Overall) | 408 (60.4%) | 267 (39.6%) |
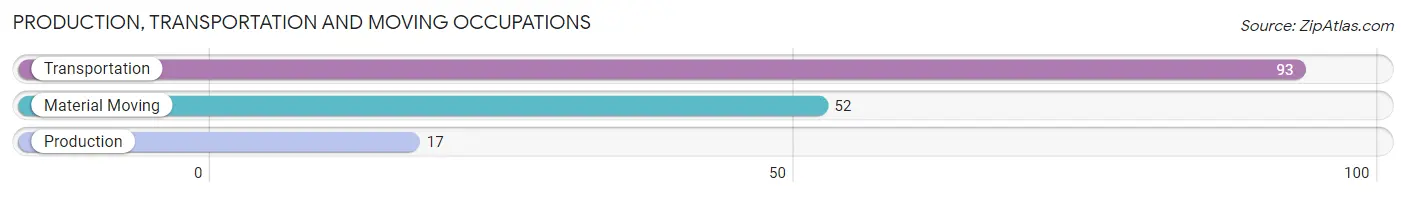
Production, Transportation and Moving Occupations
The most common Production, Transportation and Moving occupations in Charlotte are Transportation (93 | 13.8%), Material Moving (52 | 7.7%), and Production (17 | 2.5%).
Production, Transportation and Moving Occupations by Sex
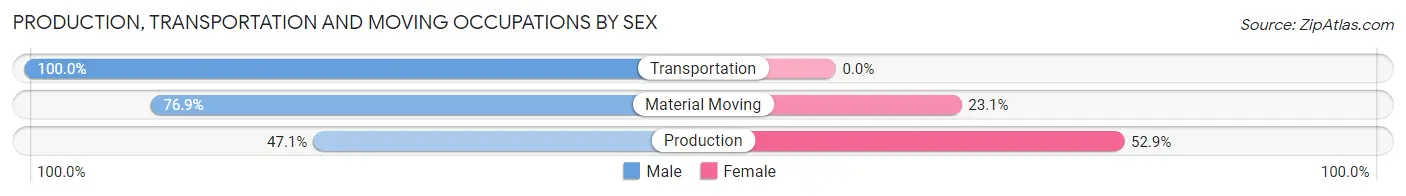
| Occupation | Male | Female |
| Production | 8 (47.1%) | 9 (52.9%) |
| Transportation | 93 (100.0%) | 0 (0.0%) |
| Material Moving | 40 (76.9%) | 12 (23.1%) |
| Total (Category) | 141 (87.0%) | 21 (13.0%) |
| Total (Overall) | 408 (60.4%) | 267 (39.6%) |
Employment Industries by Sex in Charlotte
Employment Industries in Charlotte
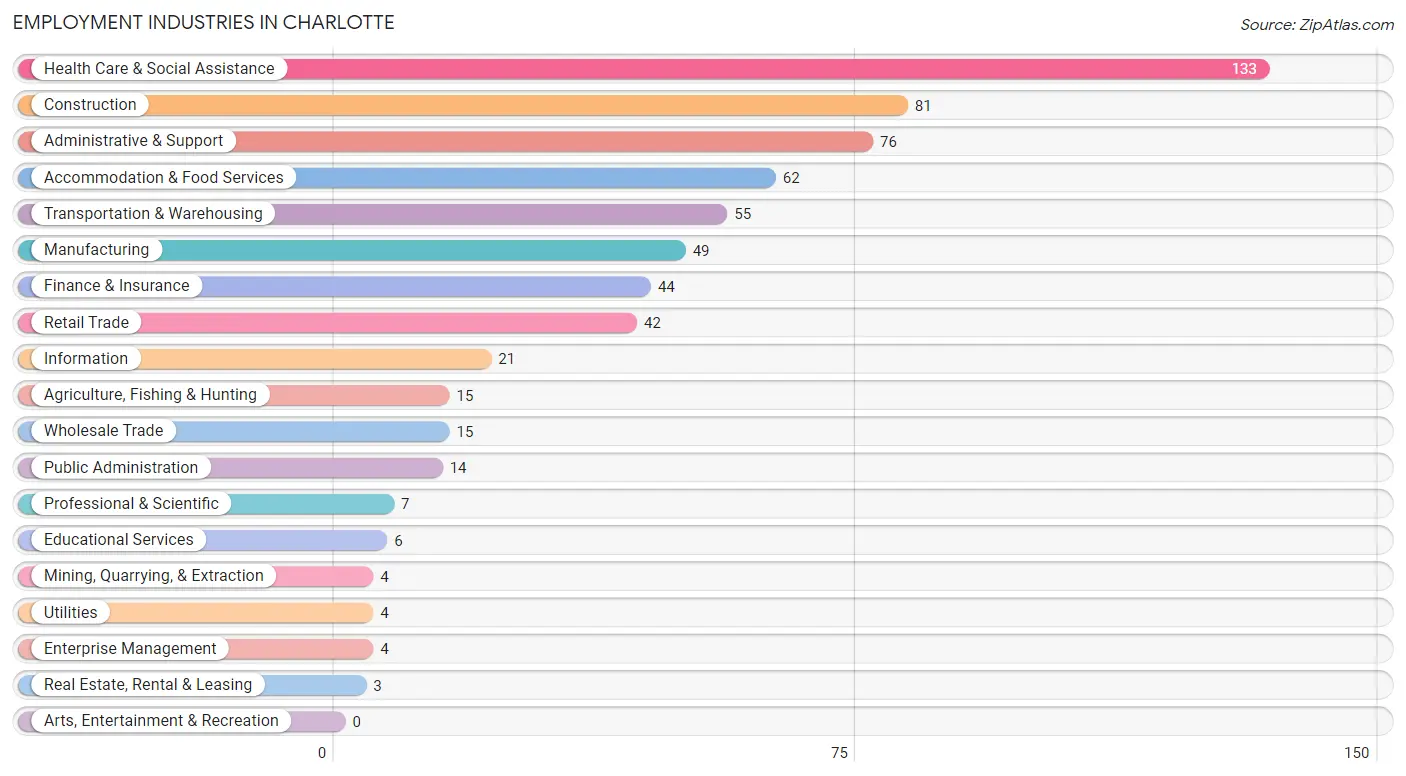
The major employment industries in Charlotte include Health Care & Social Assistance (133 | 19.7%), Construction (81 | 12.0%), Administrative & Support (76 | 11.3%), Accommodation & Food Services (62 | 9.2%), and Transportation & Warehousing (55 | 8.2%).
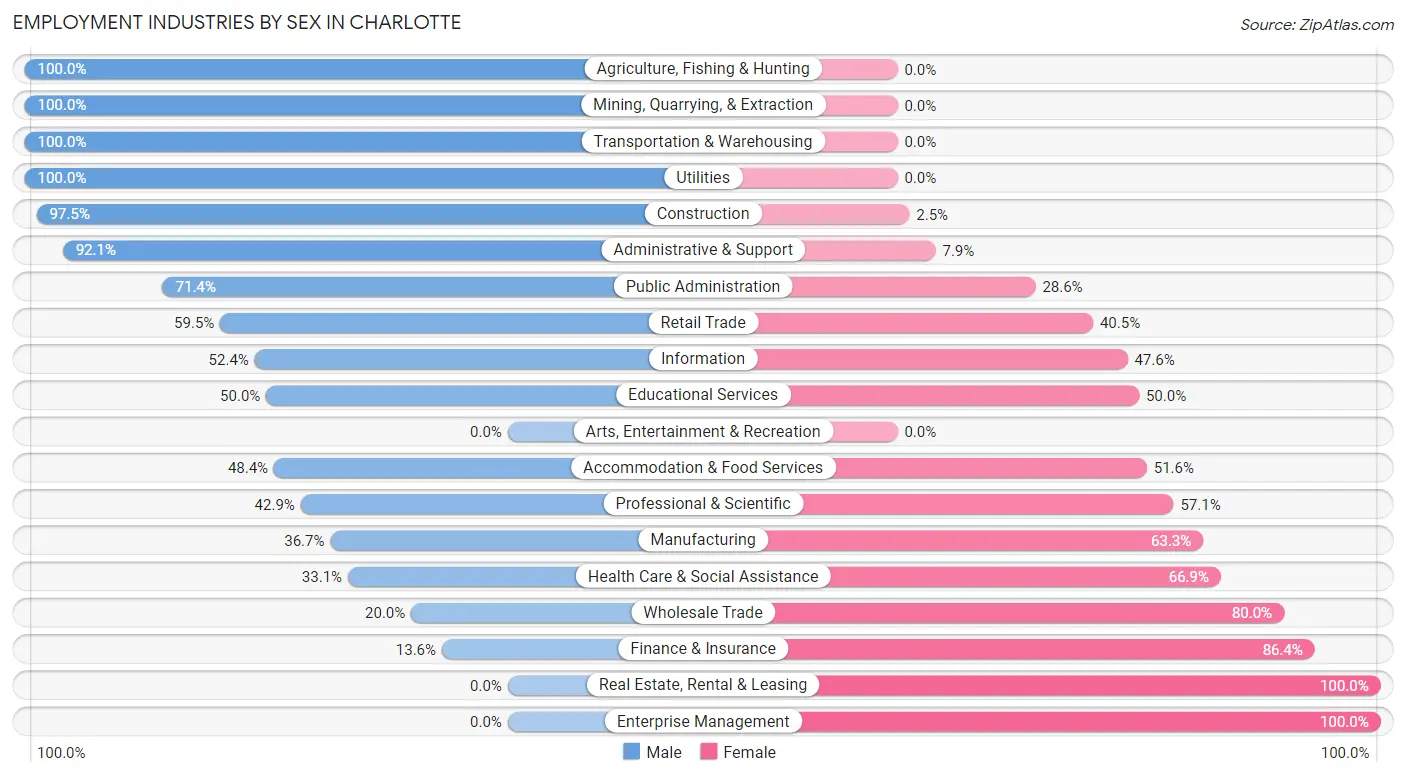
Employment Industries by Sex in Charlotte
The Charlotte industries that see more men than women are Agriculture, Fishing & Hunting (100.0%), Mining, Quarrying, & Extraction (100.0%), and Transportation & Warehousing (100.0%), whereas the industries that tend to have a higher number of women are Real Estate, Rental & Leasing (100.0%), Enterprise Management (100.0%), and Finance & Insurance (86.4%).
| Industry | Male | Female |
| Agriculture, Fishing & Hunting | 15 (100.0%) | 0 (0.0%) |
| Mining, Quarrying, & Extraction | 4 (100.0%) | 0 (0.0%) |
| Construction | 79 (97.5%) | 2 (2.5%) |
| Manufacturing | 18 (36.7%) | 31 (63.3%) |
| Wholesale Trade | 3 (20.0%) | 12 (80.0%) |
| Retail Trade | 25 (59.5%) | 17 (40.5%) |
| Transportation & Warehousing | 55 (100.0%) | 0 (0.0%) |
| Utilities | 4 (100.0%) | 0 (0.0%) |
| Information | 11 (52.4%) | 10 (47.6%) |
| Finance & Insurance | 6 (13.6%) | 38 (86.4%) |
| Real Estate, Rental & Leasing | 0 (0.0%) | 3 (100.0%) |
| Professional & Scientific | 3 (42.9%) | 4 (57.1%) |
| Enterprise Management | 0 (0.0%) | 4 (100.0%) |
| Administrative & Support | 70 (92.1%) | 6 (7.9%) |
| Educational Services | 3 (50.0%) | 3 (50.0%) |
| Health Care & Social Assistance | 44 (33.1%) | 89 (66.9%) |
| Arts, Entertainment & Recreation | 0 (0.0%) | 0 (0.0%) |
| Accommodation & Food Services | 30 (48.4%) | 32 (51.6%) |
| Public Administration | 10 (71.4%) | 4 (28.6%) |
| Total | 408 (60.4%) | 267 (39.6%) |
Education in Charlotte
School Enrollment in Charlotte
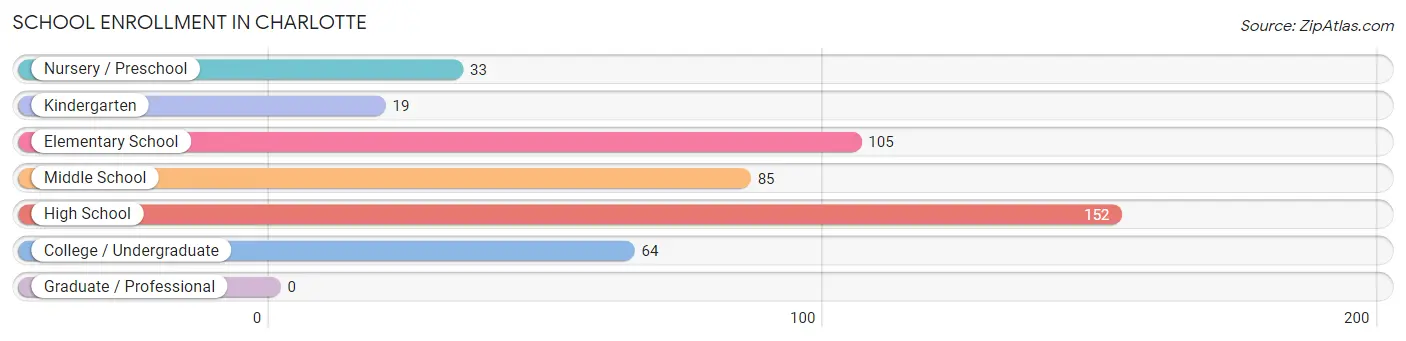
The most common levels of schooling among the 458 students in Charlotte are high school (152 | 33.2%), elementary school (105 | 22.9%), and middle school (85 | 18.6%).
| School Level | # Students | % Students |
| Nursery / Preschool | 33 | 7.2% |
| Kindergarten | 19 | 4.2% |
| Elementary School | 105 | 22.9% |
| Middle School | 85 | 18.6% |
| High School | 152 | 33.2% |
| College / Undergraduate | 64 | 14.0% |
| Graduate / Professional | 0 | 0.0% |
| Total | 458 | 100.0% |
School Enrollment by Age by Funding Source in Charlotte
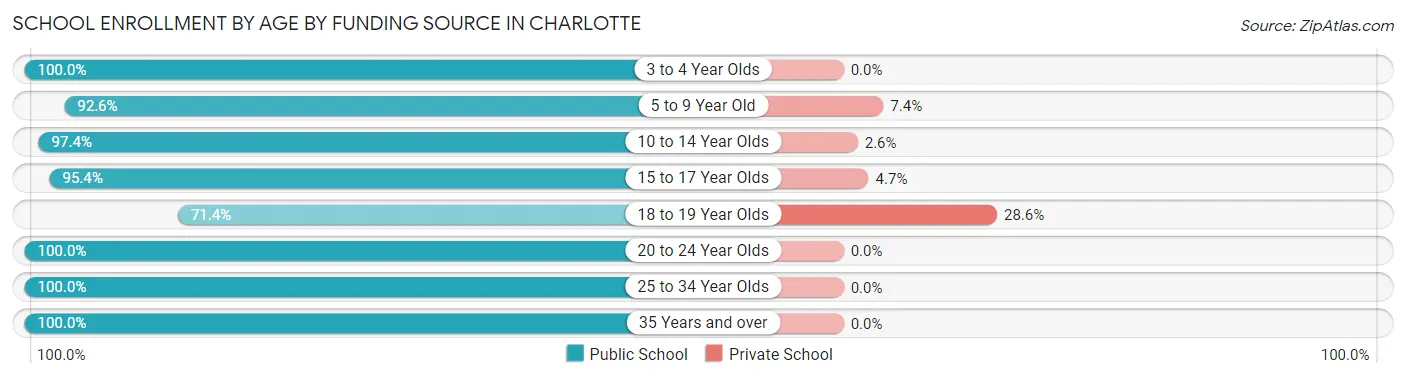
Out of a total of 458 students who are enrolled in schools in Charlotte, 27 (5.9%) attend a private institution, while the remaining 431 (94.1%) are enrolled in public schools. The age group of 18 to 19 year olds has the highest likelihood of being enrolled in private schools, with 10 (28.6% in the age bracket) enrolled. Conversely, the age group of 3 to 4 year olds has the lowest likelihood of being enrolled in a private school, with 17 (100.0% in the age bracket) attending a public institution.
| Age Bracket | Public School | Private School |
| 3 to 4 Year Olds | 17 (100.0%) | 0 (0.0%) |
| 5 to 9 Year Old | 125 (92.6%) | 10 (7.4%) |
| 10 to 14 Year Olds | 111 (97.4%) | 3 (2.6%) |
| 15 to 17 Year Olds | 82 (95.4%) | 4 (4.6%) |
| 18 to 19 Year Olds | 25 (71.4%) | 10 (28.6%) |
| 20 to 24 Year Olds | 54 (100.0%) | 0 (0.0%) |
| 25 to 34 Year Olds | 14 (100.0%) | 0 (0.0%) |
| 35 Years and over | 3 (100.0%) | 0 (0.0%) |
| Total | 431 (94.1%) | 27 (5.9%) |
Educational Attainment by Field of Study in Charlotte
Business (51 | 29.3%), science & technology (41 | 23.6%), literature & languages (24 | 13.8%), bio, nature & agricultural (21 | 12.1%), and education (9 | 5.2%) are the most common fields of study among 174 individuals in Charlotte who have obtained a bachelor's degree or higher.
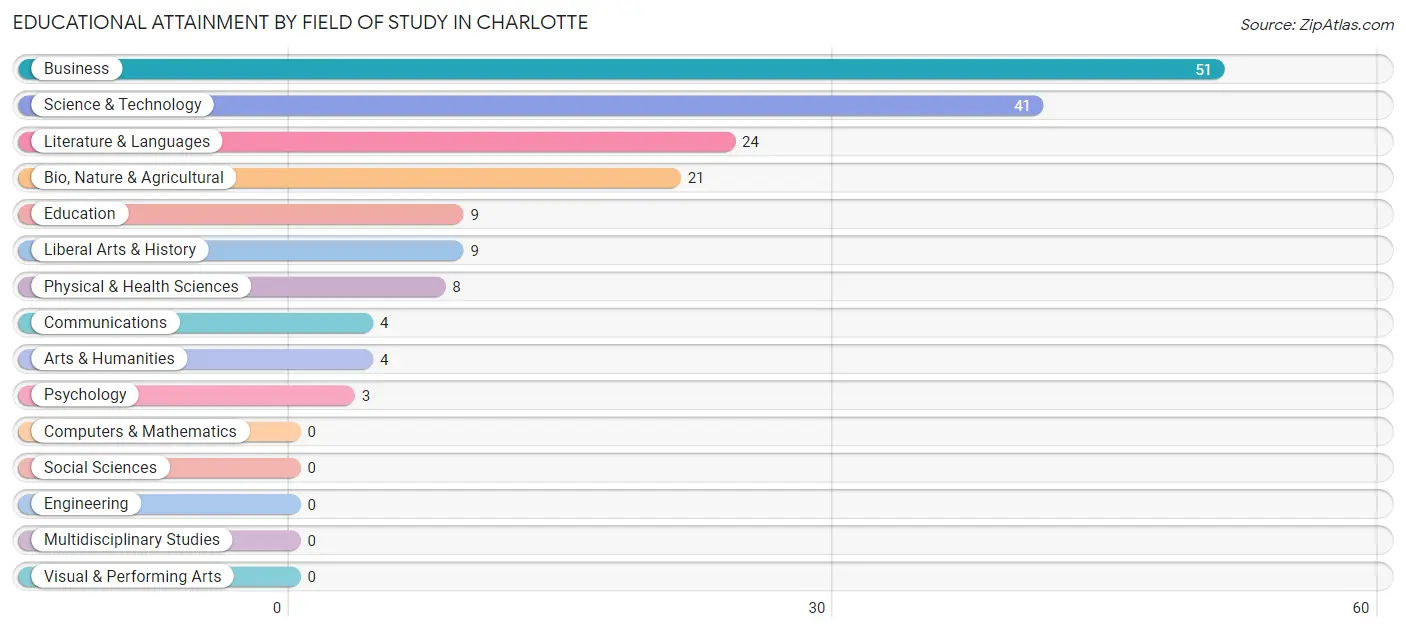
| Field of Study | # Graduates | % Graduates |
| Computers & Mathematics | 0 | 0.0% |
| Bio, Nature & Agricultural | 21 | 12.1% |
| Physical & Health Sciences | 8 | 4.6% |
| Psychology | 3 | 1.7% |
| Social Sciences | 0 | 0.0% |
| Engineering | 0 | 0.0% |
| Multidisciplinary Studies | 0 | 0.0% |
| Science & Technology | 41 | 23.6% |
| Business | 51 | 29.3% |
| Education | 9 | 5.2% |
| Literature & Languages | 24 | 13.8% |
| Liberal Arts & History | 9 | 5.2% |
| Visual & Performing Arts | 0 | 0.0% |
| Communications | 4 | 2.3% |
| Arts & Humanities | 4 | 2.3% |
| Total | 174 | 100.0% |
Transportation & Commute in Charlotte
Vehicle Availability by Sex in Charlotte
The most prevalent vehicle ownership categories in Charlotte are males with 2 vehicles (130, accounting for 32.0%) and females with 2 vehicles (75, making up 51.2%).
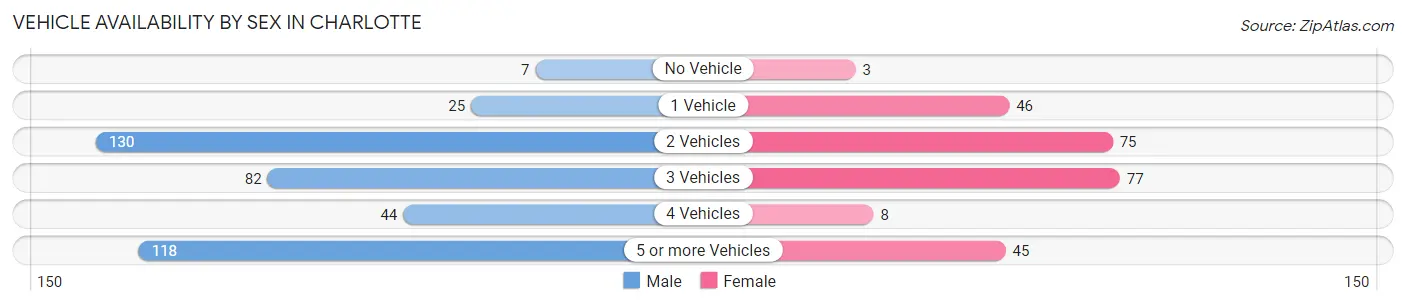
| Vehicles Available | Male | Female |
| No Vehicle | 7 (1.7%) | 3 (1.2%) |
| 1 Vehicle | 25 (6.2%) | 46 (18.1%) |
| 2 Vehicles | 130 (32.0%) | 75 (29.5%) |
| 3 Vehicles | 82 (20.2%) | 77 (30.3%) |
| 4 Vehicles | 44 (10.8%) | 8 (3.2%) |
| 5 or more Vehicles | 118 (29.1%) | 45 (17.7%) |
| Total | 406 (100.0%) | 254 (100.0%) |
Commute Time in Charlotte
The most frequently occuring commute durations in Charlotte are 20 to 24 minutes (135 commuters, 22.1%), 60 to 89 minutes (133 commuters, 21.7%), and 15 to 19 minutes (97 commuters, 15.9%).
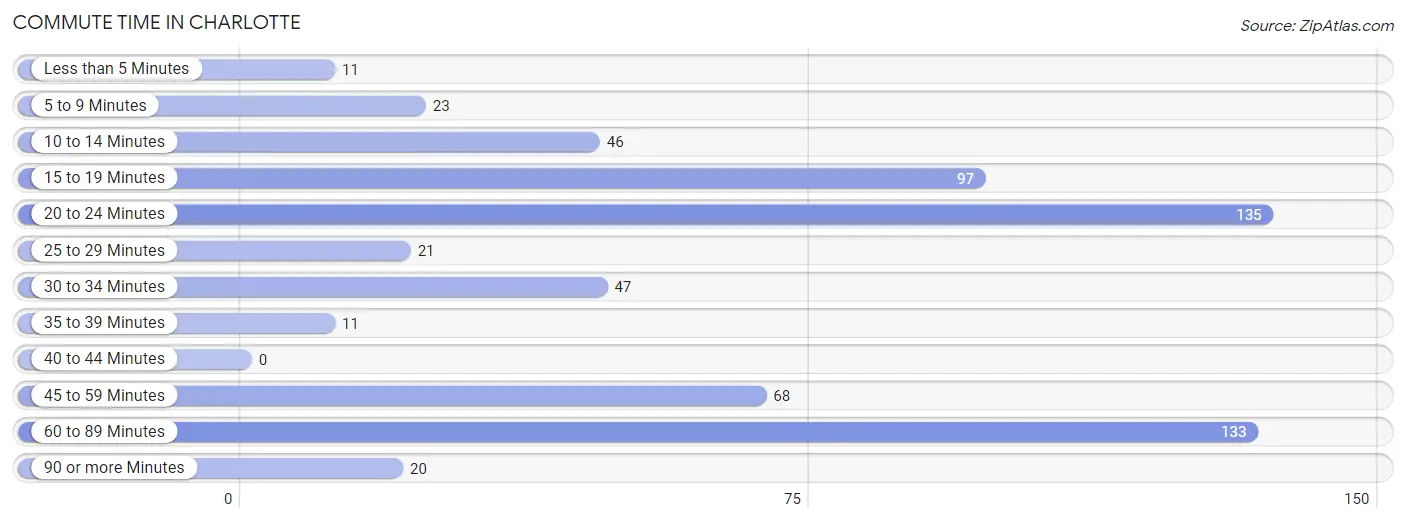
| Commute Time | # Commuters | % Commuters |
| Less than 5 Minutes | 11 | 1.8% |
| 5 to 9 Minutes | 23 | 3.8% |
| 10 to 14 Minutes | 46 | 7.5% |
| 15 to 19 Minutes | 97 | 15.9% |
| 20 to 24 Minutes | 135 | 22.1% |
| 25 to 29 Minutes | 21 | 3.4% |
| 30 to 34 Minutes | 47 | 7.7% |
| 35 to 39 Minutes | 11 | 1.8% |
| 40 to 44 Minutes | 0 | 0.0% |
| 45 to 59 Minutes | 68 | 11.1% |
| 60 to 89 Minutes | 133 | 21.7% |
| 90 or more Minutes | 20 | 3.3% |
Commute Time by Sex in Charlotte
The most common commute times in Charlotte are 20 to 24 minutes (98 commuters, 25.8%) for males and 60 to 89 minutes (80 commuters, 34.5%) for females.
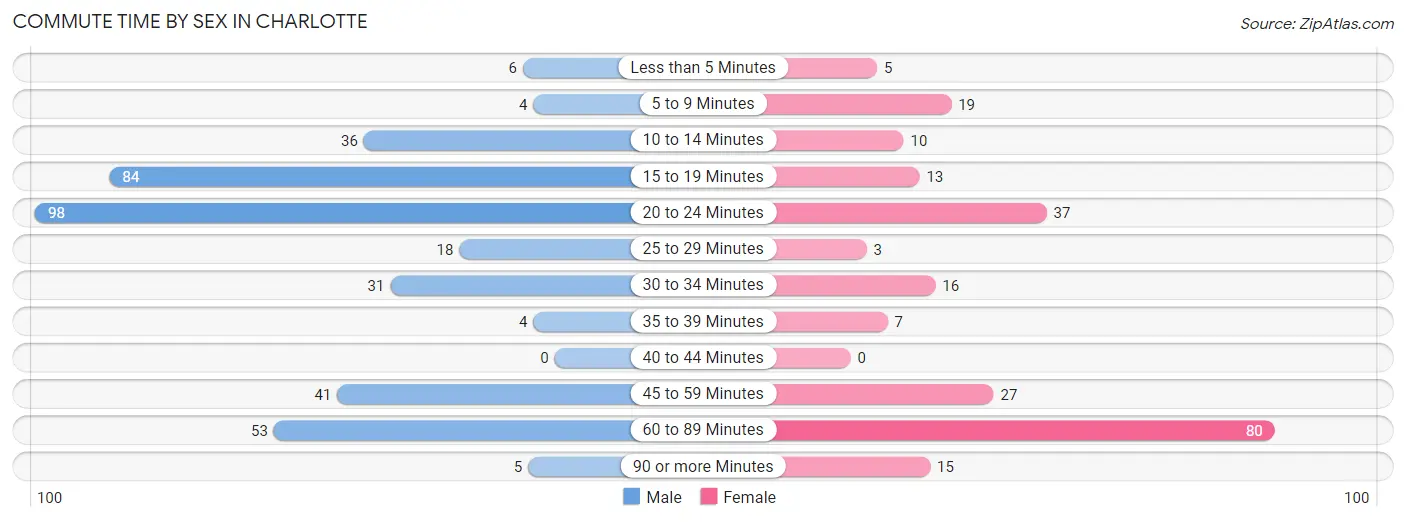
| Commute Time | Male | Female |
| Less than 5 Minutes | 6 (1.6%) | 5 (2.2%) |
| 5 to 9 Minutes | 4 (1.1%) | 19 (8.2%) |
| 10 to 14 Minutes | 36 (9.5%) | 10 (4.3%) |
| 15 to 19 Minutes | 84 (22.1%) | 13 (5.6%) |
| 20 to 24 Minutes | 98 (25.8%) | 37 (16.0%) |
| 25 to 29 Minutes | 18 (4.7%) | 3 (1.3%) |
| 30 to 34 Minutes | 31 (8.2%) | 16 (6.9%) |
| 35 to 39 Minutes | 4 (1.1%) | 7 (3.0%) |
| 40 to 44 Minutes | 0 (0.0%) | 0 (0.0%) |
| 45 to 59 Minutes | 41 (10.8%) | 27 (11.6%) |
| 60 to 89 Minutes | 53 (14.0%) | 80 (34.5%) |
| 90 or more Minutes | 5 (1.3%) | 15 (6.5%) |
Time of Departure to Work by Sex in Charlotte
The most frequent times of departure to work in Charlotte are 6:00 AM to 6:29 AM (72, 19.0%) for males and 6:00 AM to 6:29 AM (63, 27.2%) for females.
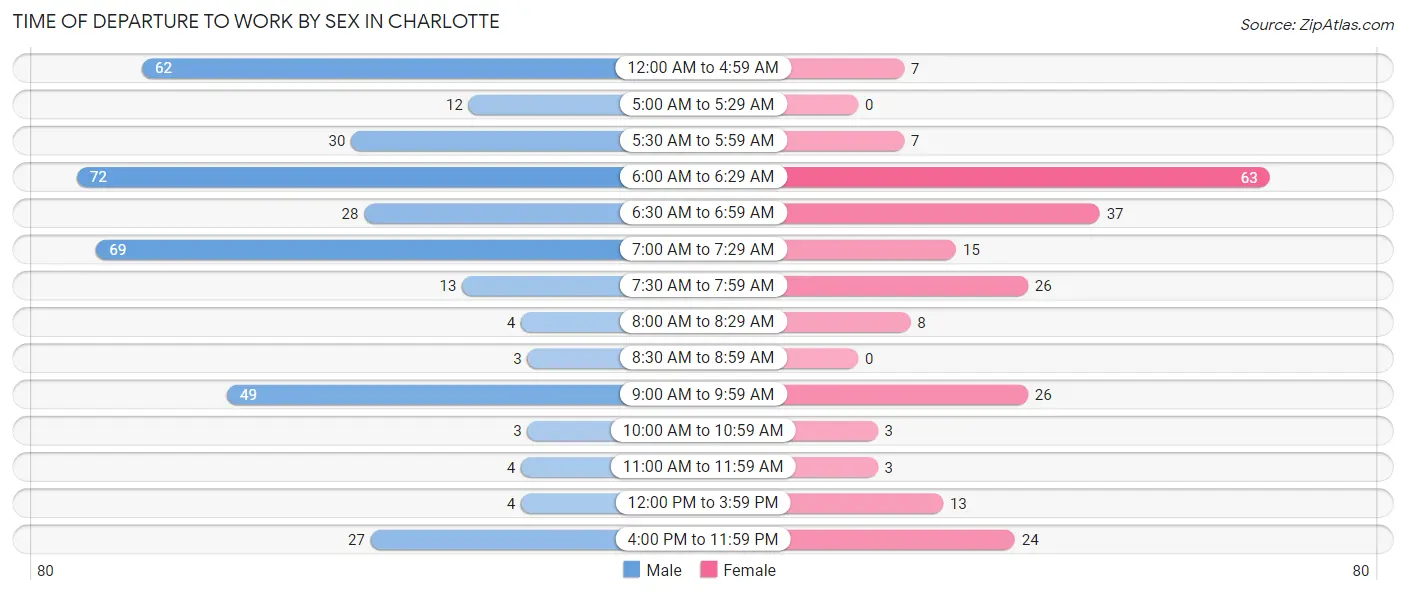
| Time of Departure | Male | Female |
| 12:00 AM to 4:59 AM | 62 (16.3%) | 7 (3.0%) |
| 5:00 AM to 5:29 AM | 12 (3.2%) | 0 (0.0%) |
| 5:30 AM to 5:59 AM | 30 (7.9%) | 7 (3.0%) |
| 6:00 AM to 6:29 AM | 72 (19.0%) | 63 (27.2%) |
| 6:30 AM to 6:59 AM | 28 (7.4%) | 37 (16.0%) |
| 7:00 AM to 7:29 AM | 69 (18.2%) | 15 (6.5%) |
| 7:30 AM to 7:59 AM | 13 (3.4%) | 26 (11.2%) |
| 8:00 AM to 8:29 AM | 4 (1.1%) | 8 (3.5%) |
| 8:30 AM to 8:59 AM | 3 (0.8%) | 0 (0.0%) |
| 9:00 AM to 9:59 AM | 49 (12.9%) | 26 (11.2%) |
| 10:00 AM to 10:59 AM | 3 (0.8%) | 3 (1.3%) |
| 11:00 AM to 11:59 AM | 4 (1.1%) | 3 (1.3%) |
| 12:00 PM to 3:59 PM | 4 (1.1%) | 13 (5.6%) |
| 4:00 PM to 11:59 PM | 27 (7.1%) | 24 (10.3%) |
| Total | 380 (100.0%) | 232 (100.0%) |
Housing Occupancy in Charlotte
Occupancy by Ownership in Charlotte
Of the total 580 dwellings in Charlotte, owner-occupied units account for 473 (81.6%), while renter-occupied units make up 107 (18.4%).
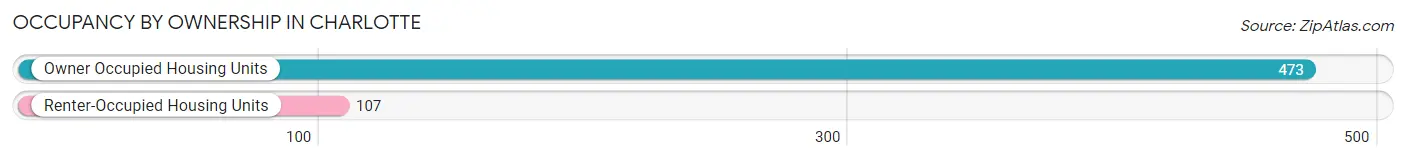
| Occupancy | # Housing Units | % Housing Units |
| Owner Occupied Housing Units | 473 | 81.6% |
| Renter-Occupied Housing Units | 107 | 18.4% |
| Total Occupied Housing Units | 580 | 100.0% |
Occupancy by Household Size in Charlotte
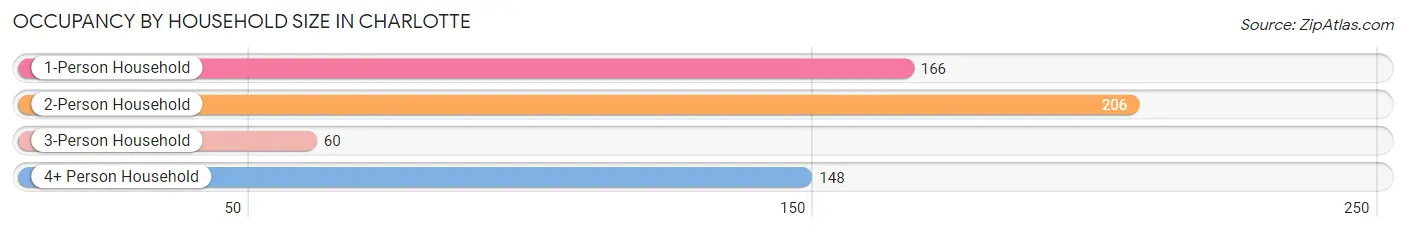
| Household Size | # Housing Units | % Housing Units |
| 1-Person Household | 166 | 28.6% |
| 2-Person Household | 206 | 35.5% |
| 3-Person Household | 60 | 10.3% |
| 4+ Person Household | 148 | 25.5% |
| Total Housing Units | 580 | 100.0% |
Occupancy by Ownership by Household Size in Charlotte
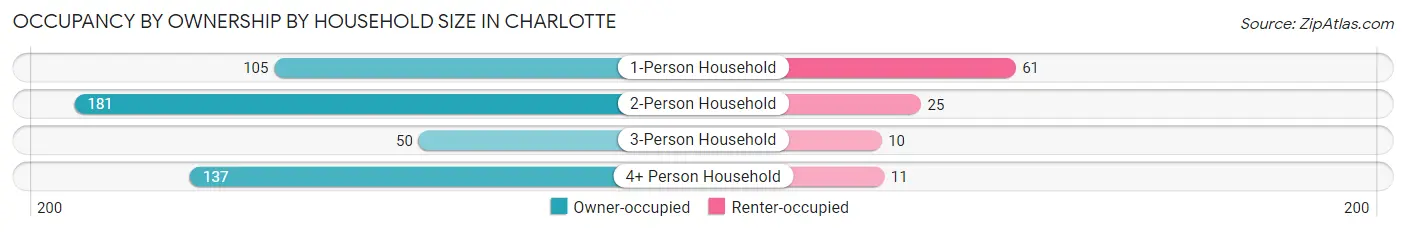
| Household Size | Owner-occupied | Renter-occupied |
| 1-Person Household | 105 (63.2%) | 61 (36.7%) |
| 2-Person Household | 181 (87.9%) | 25 (12.1%) |
| 3-Person Household | 50 (83.3%) | 10 (16.7%) |
| 4+ Person Household | 137 (92.6%) | 11 (7.4%) |
| Total Housing Units | 473 (81.6%) | 107 (18.4%) |
Occupancy by Educational Attainment in Charlotte
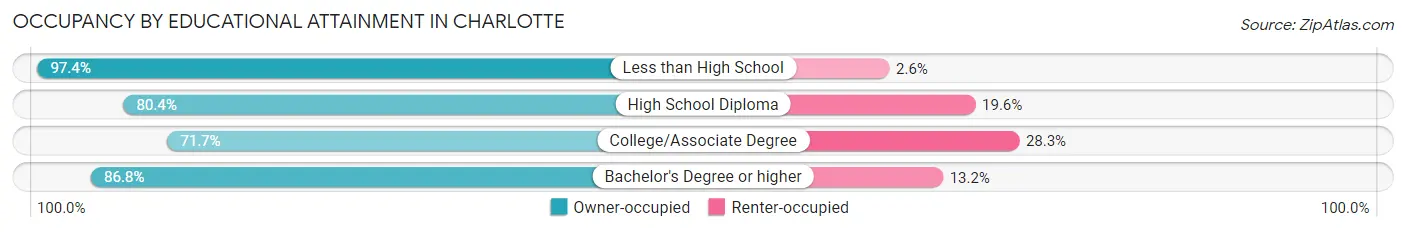
| Household Size | Owner-occupied | Renter-occupied |
| Less than High School | 114 (97.4%) | 3 (2.6%) |
| High School Diploma | 123 (80.4%) | 30 (19.6%) |
| College/Associate Degree | 157 (71.7%) | 62 (28.3%) |
| Bachelor's Degree or higher | 79 (86.8%) | 12 (13.2%) |
Occupancy by Age of Householder in Charlotte
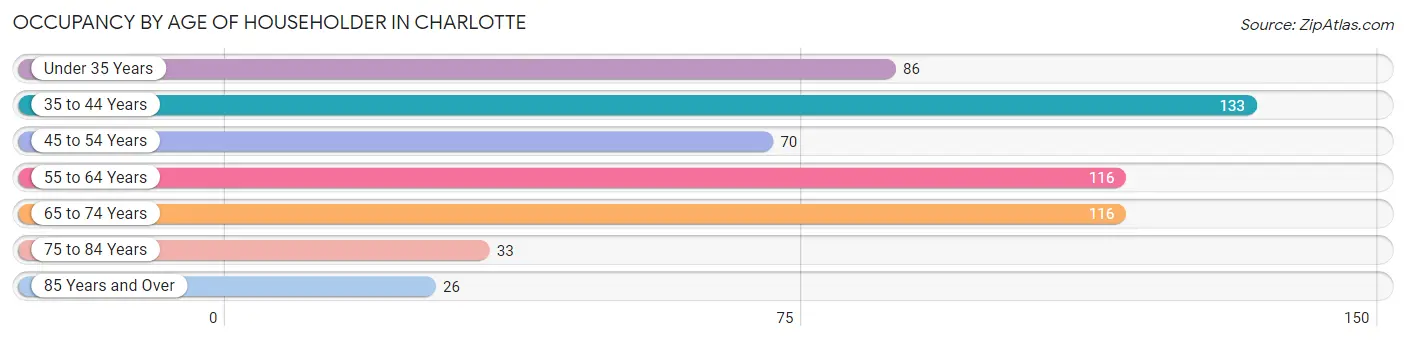
| Age Bracket | # Households | % Households |
| Under 35 Years | 86 | 14.8% |
| 35 to 44 Years | 133 | 22.9% |
| 45 to 54 Years | 70 | 12.1% |
| 55 to 64 Years | 116 | 20.0% |
| 65 to 74 Years | 116 | 20.0% |
| 75 to 84 Years | 33 | 5.7% |
| 85 Years and Over | 26 | 4.5% |
| Total | 580 | 100.0% |
Housing Finances in Charlotte
Median Income by Occupancy in Charlotte
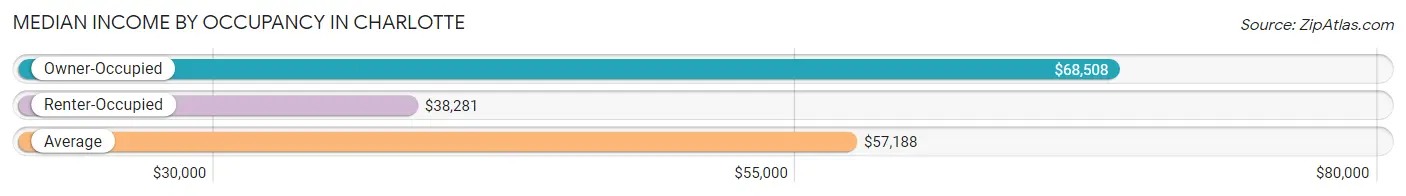
| Occupancy Type | # Households | Median Income |
| Owner-Occupied | 473 (81.6%) | $68,508 |
| Renter-Occupied | 107 (18.4%) | $38,281 |
| Average | 580 (100.0%) | $57,188 |
Occupancy by Householder Income Bracket in Charlotte
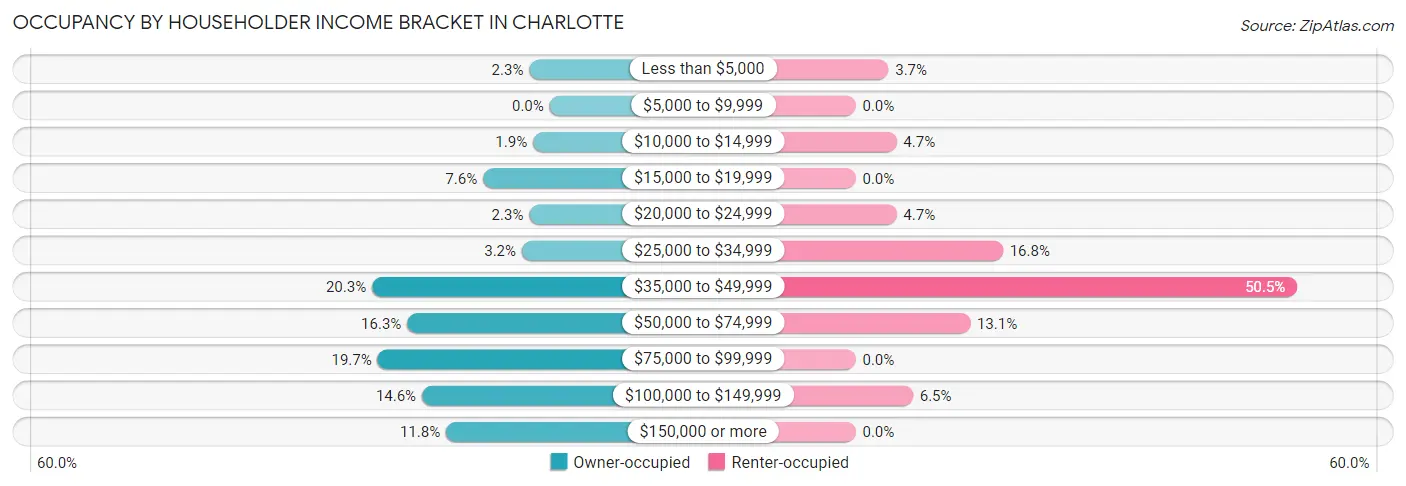
| Income Bracket | Owner-occupied | Renter-occupied |
| Less than $5,000 | 11 (2.3%) | 4 (3.7%) |
| $5,000 to $9,999 | 0 (0.0%) | 0 (0.0%) |
| $10,000 to $14,999 | 9 (1.9%) | 5 (4.7%) |
| $15,000 to $19,999 | 36 (7.6%) | 0 (0.0%) |
| $20,000 to $24,999 | 11 (2.3%) | 5 (4.7%) |
| $25,000 to $34,999 | 15 (3.2%) | 18 (16.8%) |
| $35,000 to $49,999 | 96 (20.3%) | 54 (50.5%) |
| $50,000 to $74,999 | 77 (16.3%) | 14 (13.1%) |
| $75,000 to $99,999 | 93 (19.7%) | 0 (0.0%) |
| $100,000 to $149,999 | 69 (14.6%) | 7 (6.5%) |
| $150,000 or more | 56 (11.8%) | 0 (0.0%) |
| Total | 473 (100.0%) | 107 (100.0%) |
Monthly Housing Cost Tiers in Charlotte
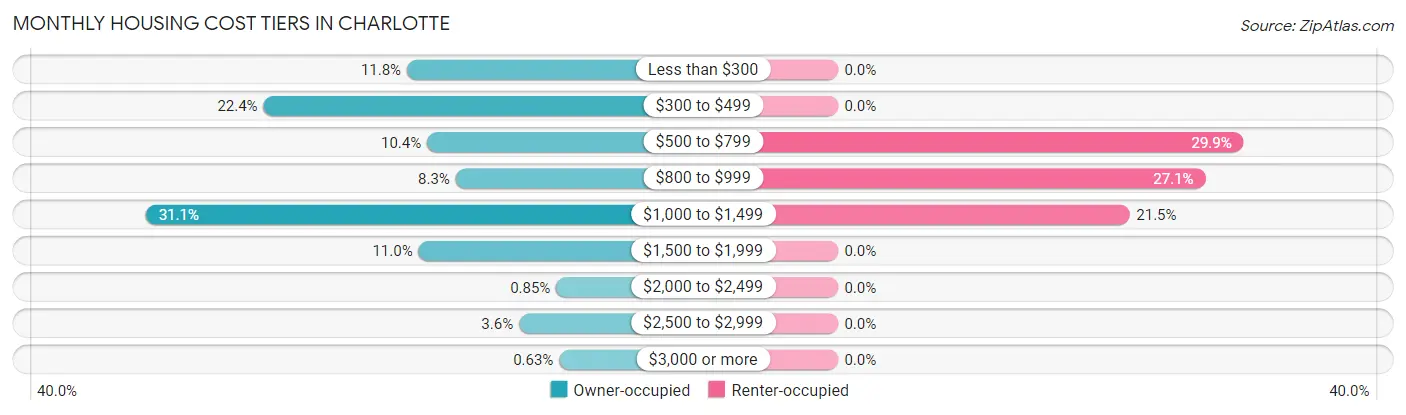
| Monthly Cost | Owner-occupied | Renter-occupied |
| Less than $300 | 56 (11.8%) | 0 (0.0%) |
| $300 to $499 | 106 (22.4%) | 0 (0.0%) |
| $500 to $799 | 49 (10.4%) | 32 (29.9%) |
| $800 to $999 | 39 (8.3%) | 29 (27.1%) |
| $1,000 to $1,499 | 147 (31.1%) | 23 (21.5%) |
| $1,500 to $1,999 | 52 (11.0%) | 0 (0.0%) |
| $2,000 to $2,499 | 4 (0.9%) | 0 (0.0%) |
| $2,500 to $2,999 | 17 (3.6%) | 0 (0.0%) |
| $3,000 or more | 3 (0.6%) | 0 (0.0%) |
| Total | 473 (100.0%) | 107 (100.0%) |
Physical Housing Characteristics in Charlotte
Housing Structures in Charlotte
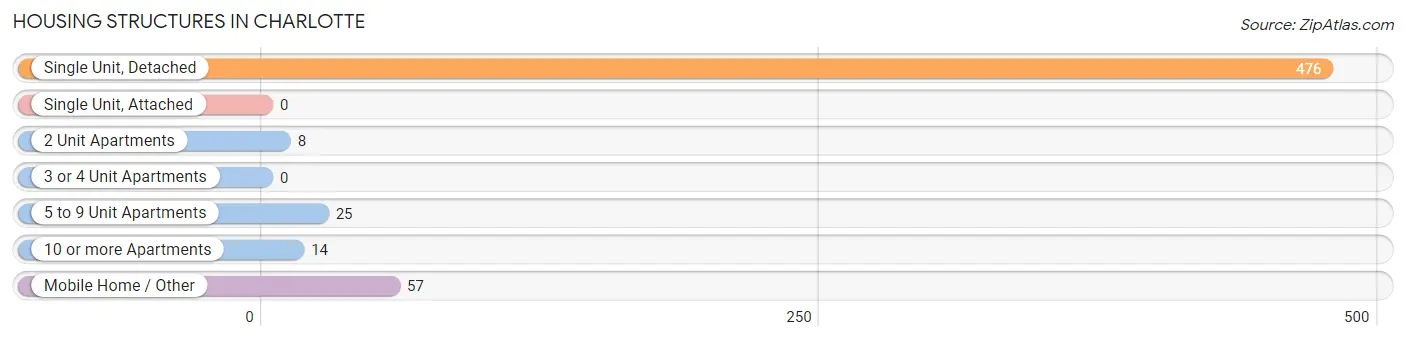
| Structure Type | # Housing Units | % Housing Units |
| Single Unit, Detached | 476 | 82.1% |
| Single Unit, Attached | 0 | 0.0% |
| 2 Unit Apartments | 8 | 1.4% |
| 3 or 4 Unit Apartments | 0 | 0.0% |
| 5 to 9 Unit Apartments | 25 | 4.3% |
| 10 or more Apartments | 14 | 2.4% |
| Mobile Home / Other | 57 | 9.8% |
| Total | 580 | 100.0% |
Housing Structures by Occupancy in Charlotte
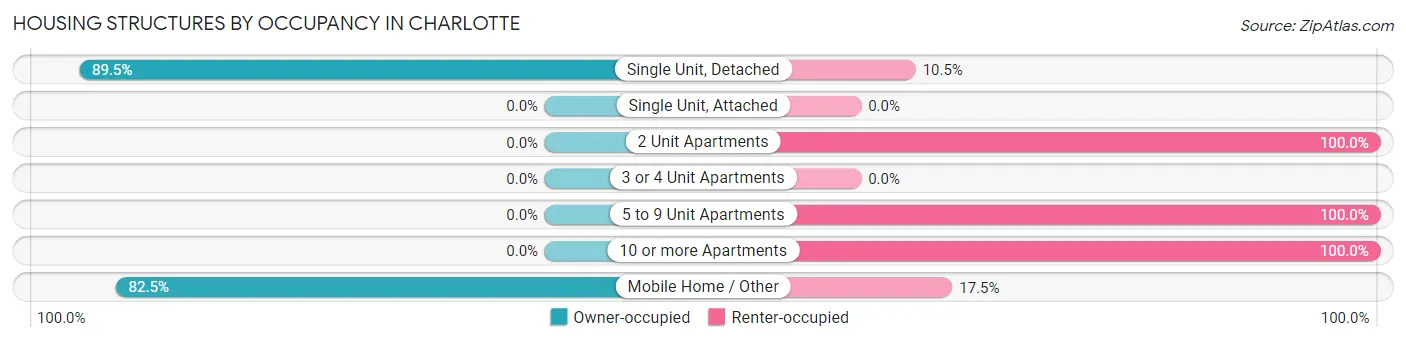
| Structure Type | Owner-occupied | Renter-occupied |
| Single Unit, Detached | 426 (89.5%) | 50 (10.5%) |
| Single Unit, Attached | 0 (0.0%) | 0 (0.0%) |
| 2 Unit Apartments | 0 (0.0%) | 8 (100.0%) |
| 3 or 4 Unit Apartments | 0 (0.0%) | 0 (0.0%) |
| 5 to 9 Unit Apartments | 0 (0.0%) | 25 (100.0%) |
| 10 or more Apartments | 0 (0.0%) | 14 (100.0%) |
| Mobile Home / Other | 47 (82.5%) | 10 (17.5%) |
| Total | 473 (81.6%) | 107 (18.4%) |
Housing Structures by Number of Rooms in Charlotte
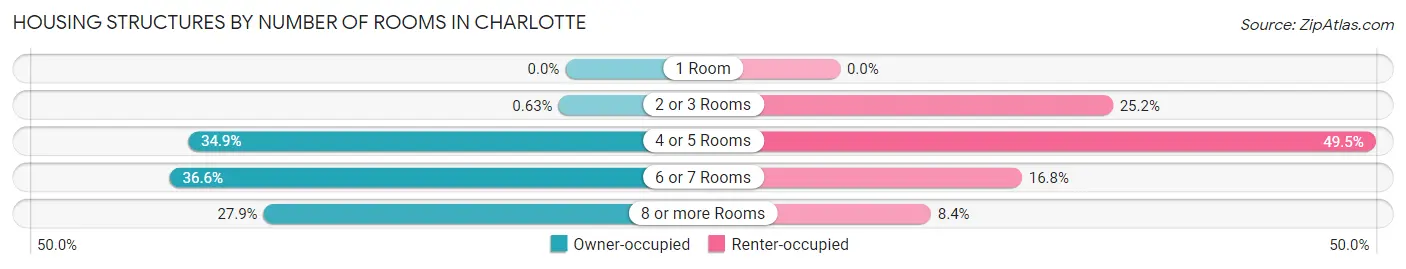
| Number of Rooms | Owner-occupied | Renter-occupied |
| 1 Room | 0 (0.0%) | 0 (0.0%) |
| 2 or 3 Rooms | 3 (0.6%) | 27 (25.2%) |
| 4 or 5 Rooms | 165 (34.9%) | 53 (49.5%) |
| 6 or 7 Rooms | 173 (36.6%) | 18 (16.8%) |
| 8 or more Rooms | 132 (27.9%) | 9 (8.4%) |
| Total | 473 (100.0%) | 107 (100.0%) |
Housing Structure by Heating Type in Charlotte
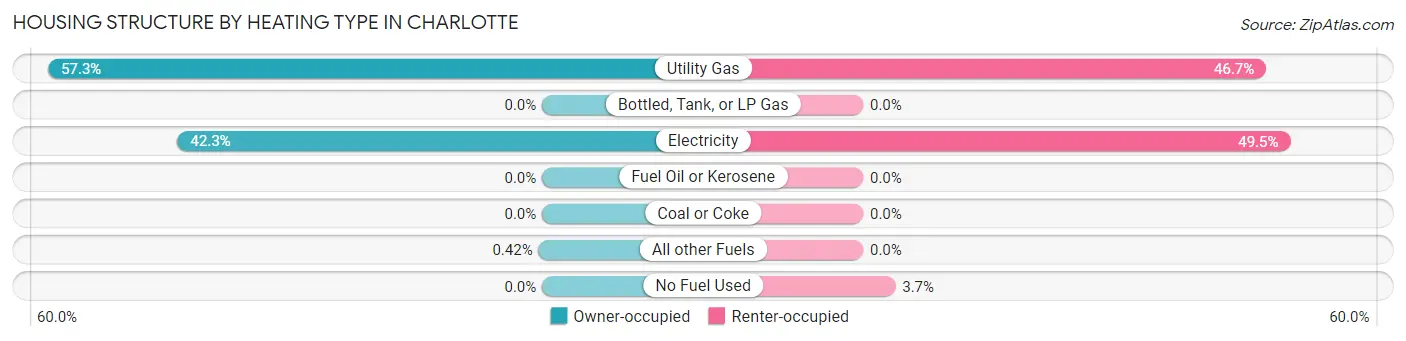
| Heating Type | Owner-occupied | Renter-occupied |
| Utility Gas | 271 (57.3%) | 50 (46.7%) |
| Bottled, Tank, or LP Gas | 0 (0.0%) | 0 (0.0%) |
| Electricity | 200 (42.3%) | 53 (49.5%) |
| Fuel Oil or Kerosene | 0 (0.0%) | 0 (0.0%) |
| Coal or Coke | 0 (0.0%) | 0 (0.0%) |
| All other Fuels | 2 (0.4%) | 0 (0.0%) |
| No Fuel Used | 0 (0.0%) | 4 (3.7%) |
| Total | 473 (100.0%) | 107 (100.0%) |
Household Vehicle Usage in Charlotte
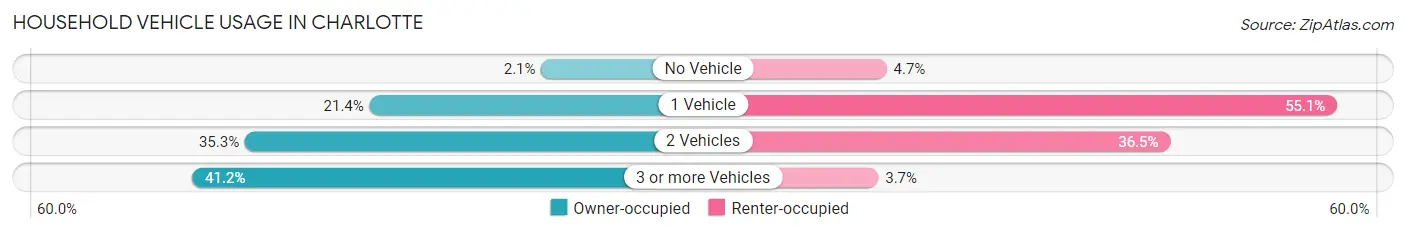
| Vehicles per Household | Owner-occupied | Renter-occupied |
| No Vehicle | 10 (2.1%) | 5 (4.7%) |
| 1 Vehicle | 101 (21.3%) | 59 (55.1%) |
| 2 Vehicles | 167 (35.3%) | 39 (36.4%) |
| 3 or more Vehicles | 195 (41.2%) | 4 (3.7%) |
| Total | 473 (100.0%) | 107 (100.0%) |
Real Estate & Mortgages in Charlotte
Real Estate and Mortgage Overview in Charlotte
| Characteristic | Without Mortgage | With Mortgage |
| Housing Units | 197 | 276 |
| Median Property Value | $176,000 | $202,800 |
| Median Household Income | $55,156 | $39 |
| Monthly Housing Costs | $428 | $3 |
| Real Estate Taxes | $1,075 | $5 |
Property Value by Mortgage Status in Charlotte
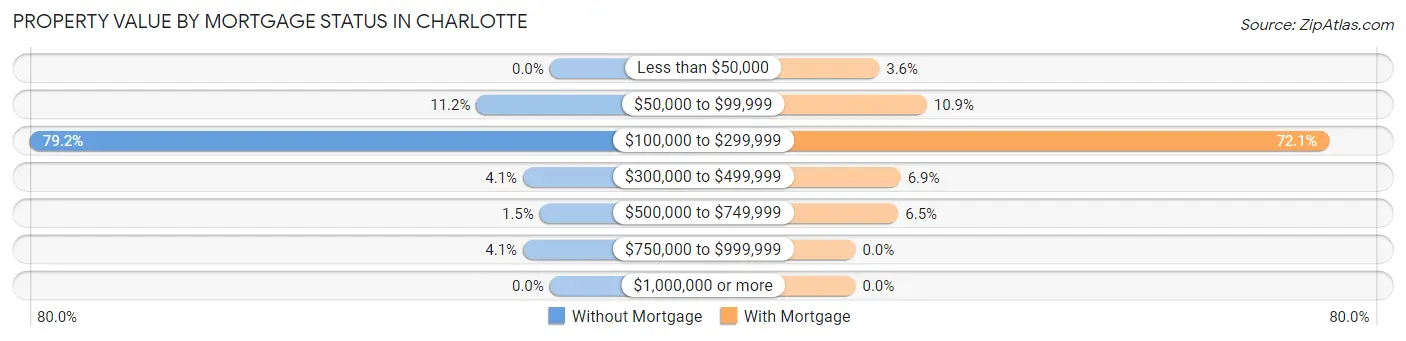
| Property Value | Without Mortgage | With Mortgage |
| Less than $50,000 | 0 (0.0%) | 10 (3.6%) |
| $50,000 to $99,999 | 22 (11.2%) | 30 (10.9%) |
| $100,000 to $299,999 | 156 (79.2%) | 199 (72.1%) |
| $300,000 to $499,999 | 8 (4.1%) | 19 (6.9%) |
| $500,000 to $749,999 | 3 (1.5%) | 18 (6.5%) |
| $750,000 to $999,999 | 8 (4.1%) | 0 (0.0%) |
| $1,000,000 or more | 0 (0.0%) | 0 (0.0%) |
| Total | 197 (100.0%) | 276 (100.0%) |
Household Income by Mortgage Status in Charlotte
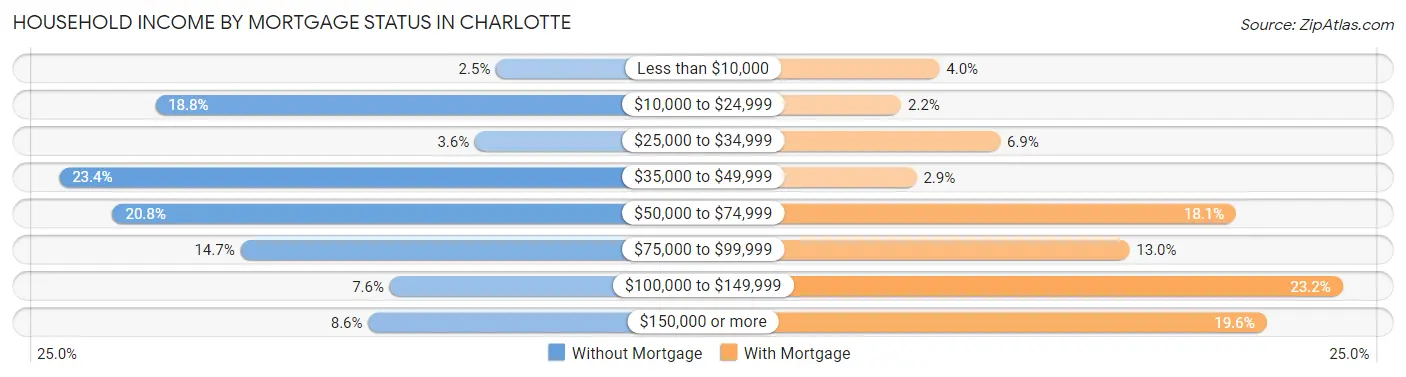
| Household Income | Without Mortgage | With Mortgage |
| Less than $10,000 | 5 (2.5%) | 11 (4.0%) |
| $10,000 to $24,999 | 37 (18.8%) | 6 (2.2%) |
| $25,000 to $34,999 | 7 (3.5%) | 19 (6.9%) |
| $35,000 to $49,999 | 46 (23.4%) | 8 (2.9%) |
| $50,000 to $74,999 | 41 (20.8%) | 50 (18.1%) |
| $75,000 to $99,999 | 29 (14.7%) | 36 (13.0%) |
| $100,000 to $149,999 | 15 (7.6%) | 64 (23.2%) |
| $150,000 or more | 17 (8.6%) | 54 (19.6%) |
| Total | 197 (100.0%) | 276 (100.0%) |
Property Value to Household Income Ratio in Charlotte
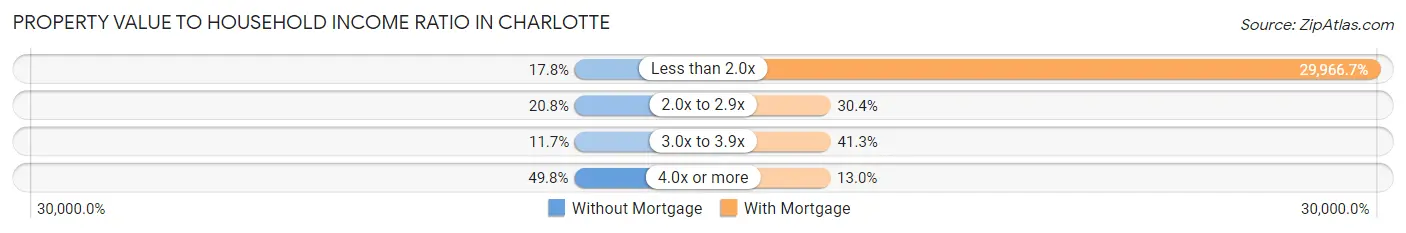
| Value-to-Income Ratio | Without Mortgage | With Mortgage |
| Less than 2.0x | 35 (17.8%) | 82,708 (29,966.7%) |
| 2.0x to 2.9x | 41 (20.8%) | 84 (30.4%) |
| 3.0x to 3.9x | 23 (11.7%) | 114 (41.3%) |
| 4.0x or more | 98 (49.7%) | 36 (13.0%) |
| Total | 197 (100.0%) | 276 (100.0%) |
Real Estate Taxes by Mortgage Status in Charlotte
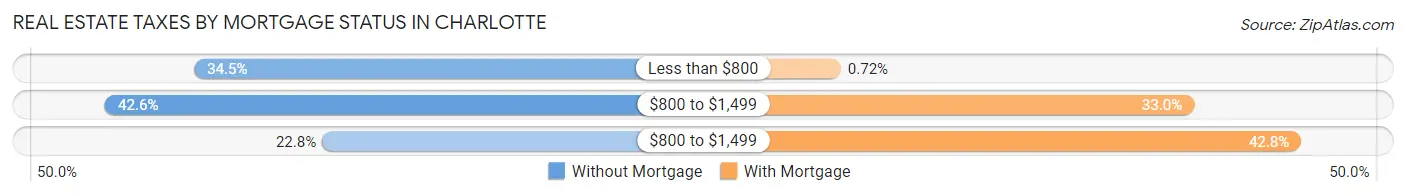
| Property Taxes | Without Mortgage | With Mortgage |
| Less than $800 | 68 (34.5%) | 2 (0.7%) |
| $800 to $1,499 | 84 (42.6%) | 91 (33.0%) |
| $800 to $1,499 | 45 (22.8%) | 118 (42.7%) |
| Total | 197 (100.0%) | 276 (100.0%) |
Health & Disability in Charlotte
Health Insurance Coverage by Age in Charlotte
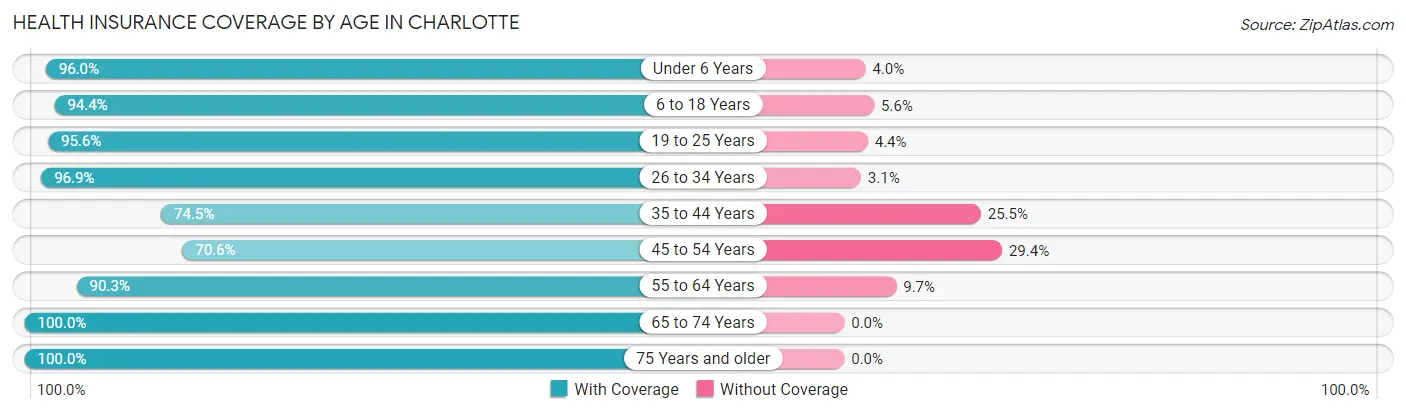
| Age Bracket | With Coverage | Without Coverage |
| Under 6 Years | 194 (96.0%) | 8 (4.0%) |
| 6 to 18 Years | 305 (94.4%) | 18 (5.6%) |
| 19 to 25 Years | 153 (95.6%) | 7 (4.4%) |
| 26 to 34 Years | 125 (96.9%) | 4 (3.1%) |
| 35 to 44 Years | 161 (74.5%) | 55 (25.5%) |
| 45 to 54 Years | 120 (70.6%) | 50 (29.4%) |
| 55 to 64 Years | 233 (90.3%) | 25 (9.7%) |
| 65 to 74 Years | 207 (100.0%) | 0 (0.0%) |
| 75 Years and older | 75 (100.0%) | 0 (0.0%) |
| Total | 1,573 (90.4%) | 167 (9.6%) |
Health Insurance Coverage by Citizenship Status in Charlotte
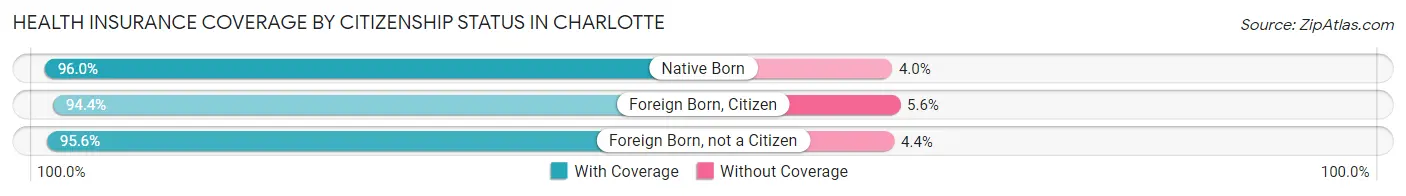
| Citizenship Status | With Coverage | Without Coverage |
| Native Born | 194 (96.0%) | 8 (4.0%) |
| Foreign Born, Citizen | 305 (94.4%) | 18 (5.6%) |
| Foreign Born, not a Citizen | 153 (95.6%) | 7 (4.4%) |
Health Insurance Coverage by Household Income in Charlotte
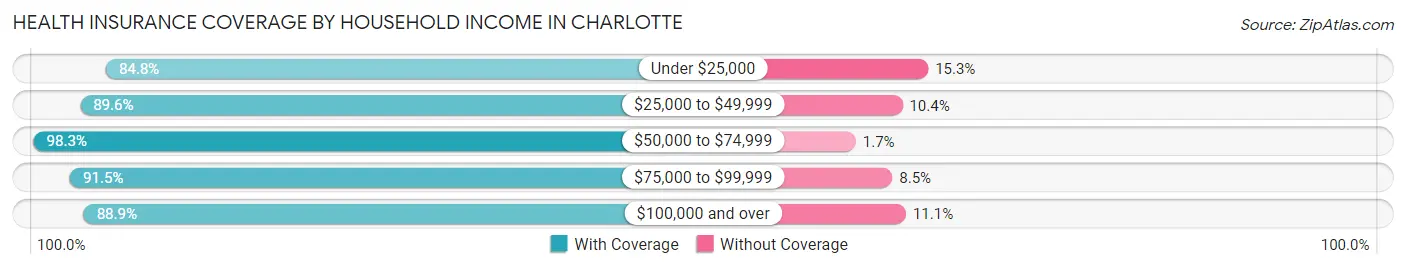
| Household Income | With Coverage | Without Coverage |
| Under $25,000 | 150 (84.8%) | 27 (15.2%) |
| $25,000 to $49,999 | 395 (89.6%) | 46 (10.4%) |
| $50,000 to $74,999 | 231 (98.3%) | 4 (1.7%) |
| $75,000 to $99,999 | 300 (91.5%) | 28 (8.5%) |
| $100,000 and over | 497 (88.9%) | 62 (11.1%) |
Public vs Private Health Insurance Coverage by Age in Charlotte
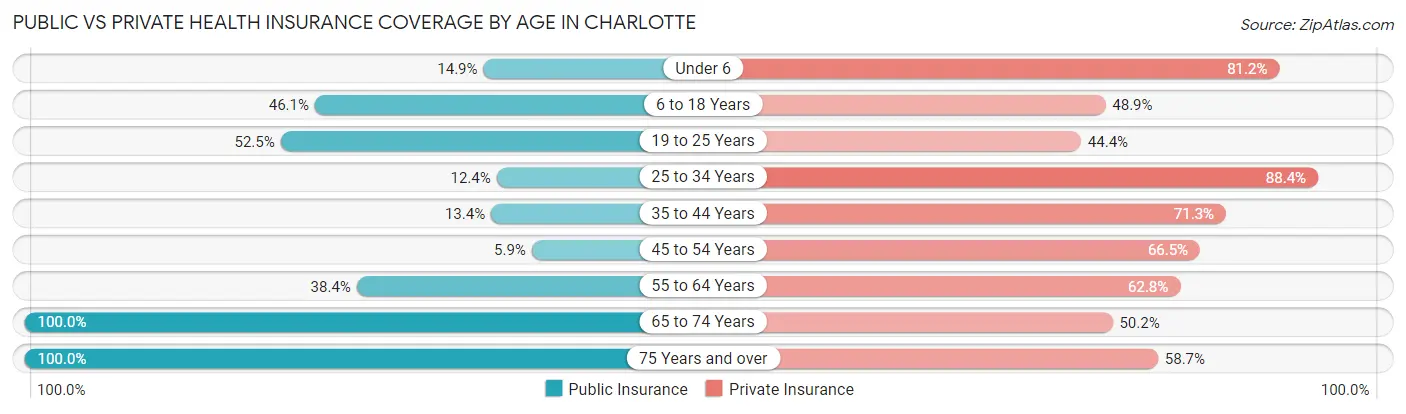
| Age Bracket | Public Insurance | Private Insurance |
| Under 6 | 30 (14.8%) | 164 (81.2%) |
| 6 to 18 Years | 149 (46.1%) | 158 (48.9%) |
| 19 to 25 Years | 84 (52.5%) | 71 (44.4%) |
| 25 to 34 Years | 16 (12.4%) | 114 (88.4%) |
| 35 to 44 Years | 29 (13.4%) | 154 (71.3%) |
| 45 to 54 Years | 10 (5.9%) | 113 (66.5%) |
| 55 to 64 Years | 99 (38.4%) | 162 (62.8%) |
| 65 to 74 Years | 207 (100.0%) | 104 (50.2%) |
| 75 Years and over | 75 (100.0%) | 44 (58.7%) |
| Total | 699 (40.2%) | 1,084 (62.3%) |
Disability Status by Sex by Age in Charlotte
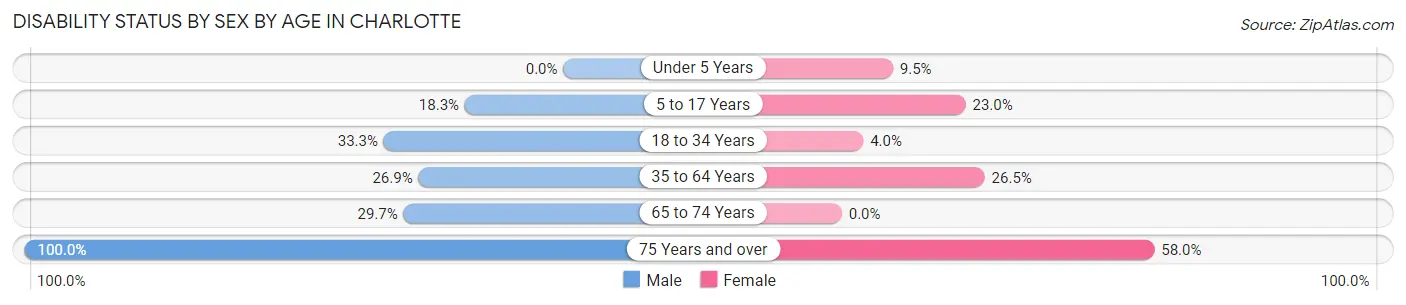
| Age Bracket | Male | Female |
| Under 5 Years | 0 (0.0%) | 11 (9.5%) |
| 5 to 17 Years | 36 (18.3%) | 34 (23.0%) |
| 18 to 34 Years | 62 (33.3%) | 5 (4.0%) |
| 35 to 64 Years | 89 (26.9%) | 83 (26.5%) |
| 65 to 74 Years | 35 (29.7%) | 0 (0.0%) |
| 75 Years and over | 25 (100.0%) | 29 (58.0%) |
Disability Class by Sex by Age in Charlotte
Disability Class: Hearing Difficulty
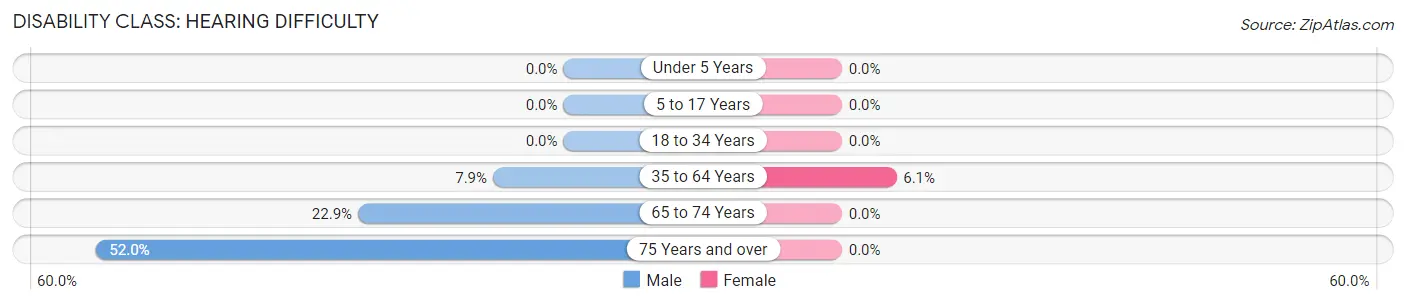
| Age Bracket | Male | Female |
| Under 5 Years | 0 (0.0%) | 0 (0.0%) |
| 5 to 17 Years | 0 (0.0%) | 0 (0.0%) |
| 18 to 34 Years | 0 (0.0%) | 0 (0.0%) |
| 35 to 64 Years | 26 (7.9%) | 19 (6.1%) |
| 65 to 74 Years | 27 (22.9%) | 0 (0.0%) |
| 75 Years and over | 13 (52.0%) | 0 (0.0%) |
Disability Class: Vision Difficulty
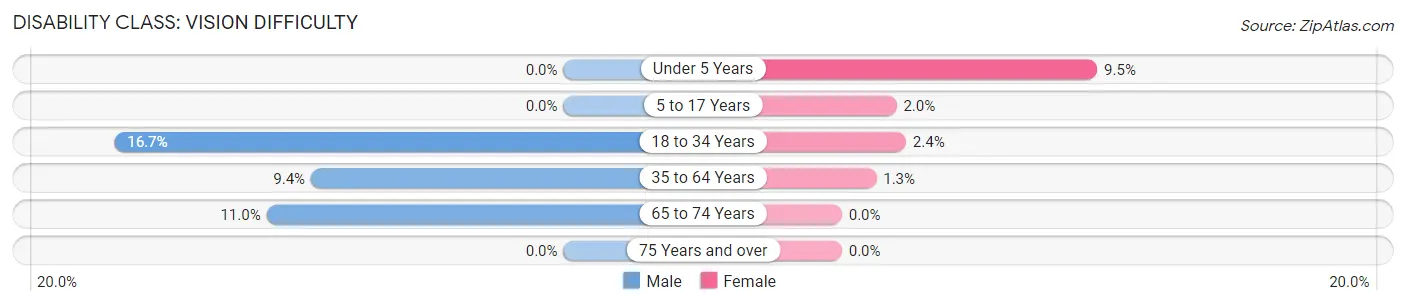
| Age Bracket | Male | Female |
| Under 5 Years | 0 (0.0%) | 11 (9.5%) |
| 5 to 17 Years | 0 (0.0%) | 3 (2.0%) |
| 18 to 34 Years | 31 (16.7%) | 3 (2.4%) |
| 35 to 64 Years | 31 (9.4%) | 4 (1.3%) |
| 65 to 74 Years | 13 (11.0%) | 0 (0.0%) |
| 75 Years and over | 0 (0.0%) | 0 (0.0%) |
Disability Class: Cognitive Difficulty
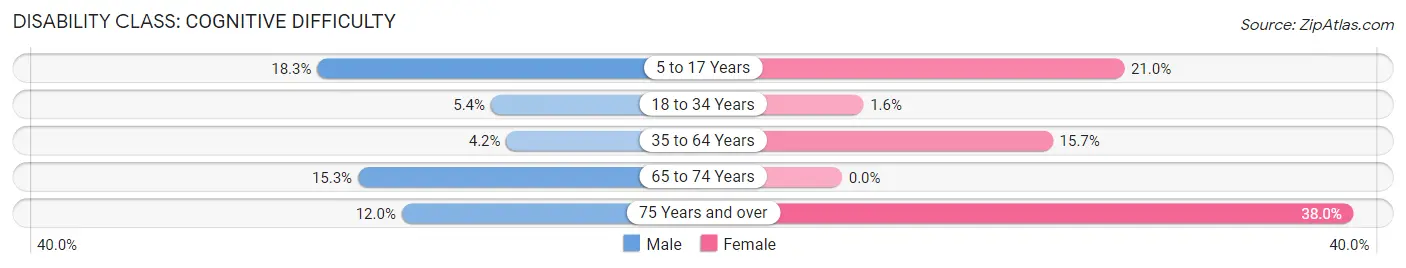
| Age Bracket | Male | Female |
| 5 to 17 Years | 36 (18.3%) | 31 (20.9%) |
| 18 to 34 Years | 10 (5.4%) | 2 (1.6%) |
| 35 to 64 Years | 14 (4.2%) | 49 (15.7%) |
| 65 to 74 Years | 18 (15.2%) | 0 (0.0%) |
| 75 Years and over | 3 (12.0%) | 19 (38.0%) |
Disability Class: Ambulatory Difficulty
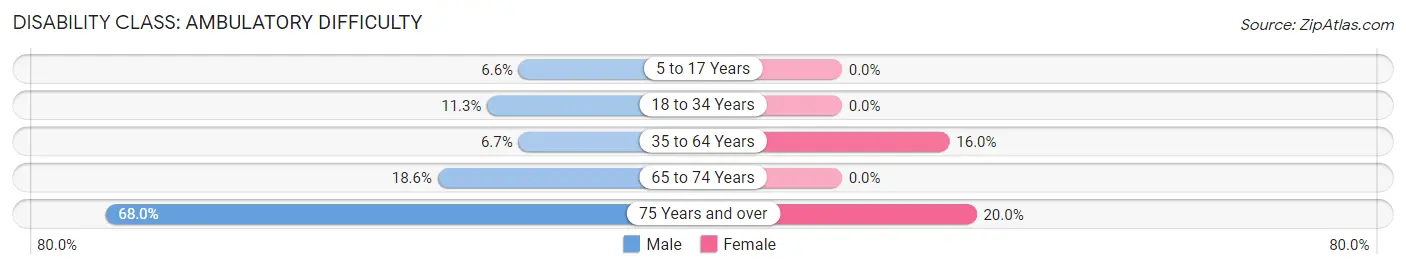
| Age Bracket | Male | Female |
| 5 to 17 Years | 13 (6.6%) | 0 (0.0%) |
| 18 to 34 Years | 21 (11.3%) | 0 (0.0%) |
| 35 to 64 Years | 22 (6.7%) | 50 (16.0%) |
| 65 to 74 Years | 22 (18.6%) | 0 (0.0%) |
| 75 Years and over | 17 (68.0%) | 10 (20.0%) |
Disability Class: Self-Care Difficulty
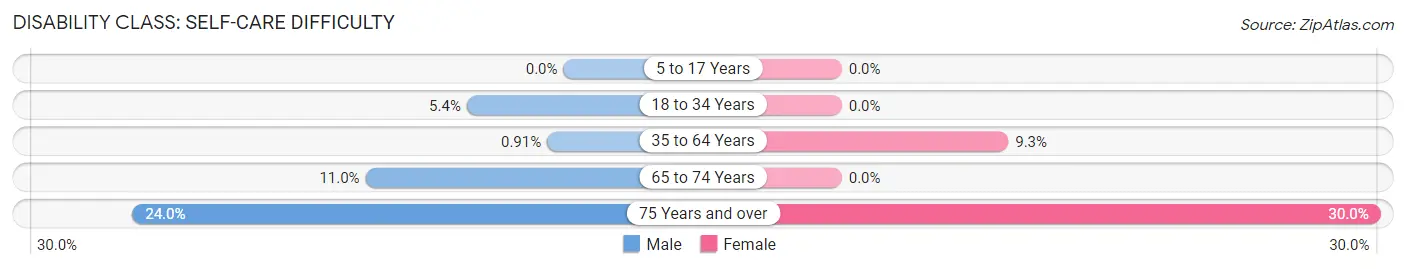
| Age Bracket | Male | Female |
| 5 to 17 Years | 0 (0.0%) | 0 (0.0%) |
| 18 to 34 Years | 10 (5.4%) | 0 (0.0%) |
| 35 to 64 Years | 3 (0.9%) | 29 (9.3%) |
| 65 to 74 Years | 13 (11.0%) | 0 (0.0%) |
| 75 Years and over | 6 (24.0%) | 15 (30.0%) |
Technology Access in Charlotte
Computing Device Access in Charlotte
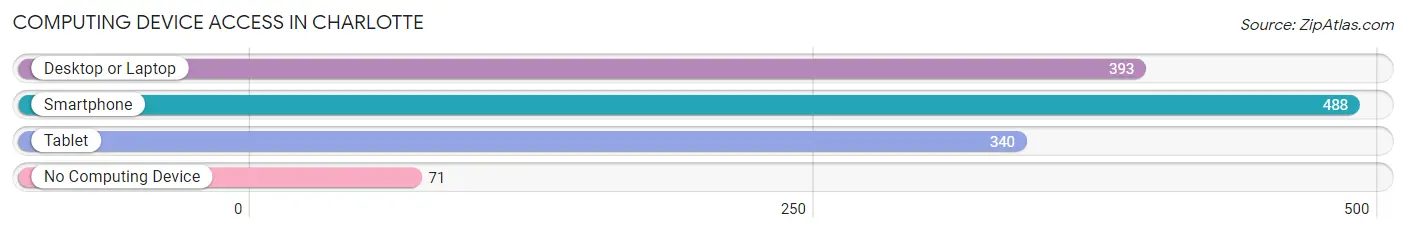
| Device Type | # Households | % Households |
| Desktop or Laptop | 393 | 67.8% |
| Smartphone | 488 | 84.1% |
| Tablet | 340 | 58.6% |
| No Computing Device | 71 | 12.2% |
| Total | 580 | 100.0% |
Internet Access in Charlotte
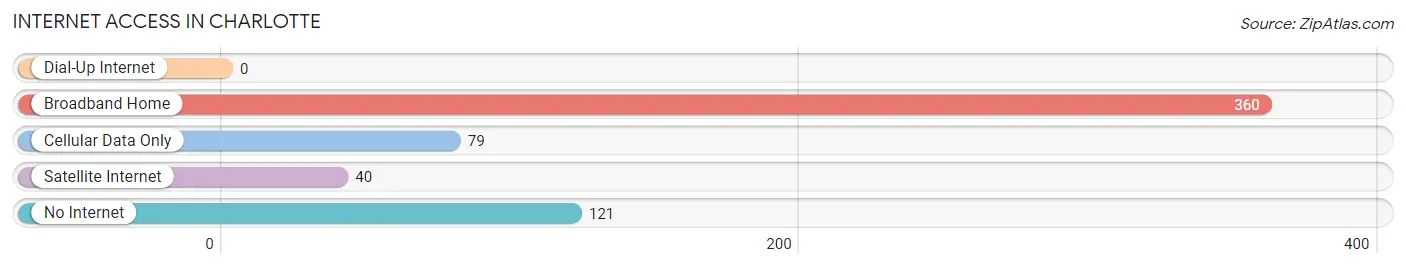
| Internet Type | # Households | % Households |
| Dial-Up Internet | 0 | 0.0% |
| Broadband Home | 360 | 62.1% |
| Cellular Data Only | 79 | 13.6% |
| Satellite Internet | 40 | 6.9% |
| No Internet | 121 | 20.9% |
| Total | 580 | 100.0% |
Charlotte Summary
Charlotte, Tennessee is a small town located in Dickson County, Tennessee. It is situated on the banks of the Cumberland River, approximately 40 miles west of Nashville. The town has a population of approximately 1,500 people and is the county seat of Dickson County.
History
Charlotte was founded in 1809 by William and Mary Charlotte, who were among the first settlers in the area. The town was named after the couple and was originally known as Charlotteville. The town was incorporated in 1817 and was the first county seat of Dickson County.
In the early 19th century, Charlotte was a thriving river port and was the site of several important battles during the Civil War. The town was also the site of the first public school in Dickson County, which was established in 1845.
Geography
Charlotte is located in the central part of Dickson County, approximately 40 miles west of Nashville. The town is situated on the banks of the Cumberland River and is surrounded by rolling hills and farmland. The town is located in the Central Basin of Tennessee, which is characterized by limestone and sandstone formations.
The climate in Charlotte is humid subtropical, with hot summers and mild winters. The average annual temperature is around 60 degrees Fahrenheit, with an average high of around 80 degrees in the summer and an average low of around 40 degrees in the winter.
Economy
Charlotte’s economy is largely based on agriculture and manufacturing. The town is home to several large farms, which produce a variety of crops, including corn, soybeans, wheat, and hay. The town is also home to several manufacturing companies, which produce a variety of products, including furniture, clothing, and automotive parts.
The town is also home to several small businesses, including restaurants, retail stores, and service providers. The town is also home to a number of tourist attractions, including the Dickson County Museum, the Charlotte Historic District, and the Charlotte Country Music Hall of Fame.
Demographics
As of the 2010 census, Charlotte had a population of 1,500 people. The racial makeup of the town was 95.3% White, 1.7% African American, 0.3% Native American, 0.7% Asian, 0.3% from other races, and 1.7% from two or more races. Hispanic or Latino of any race were 1.3% of the population.
The median income for a household in Charlotte was $37,500, and the median income for a family was $45,000. The per capita income for the town was $19,000. About 11.7% of families and 14.3% of the population were below the poverty line, including 18.3% of those under age 18 and 8.3% of those age 65 or over.
Charlotte is a small town with a rich history and a vibrant economy. The town is home to a variety of businesses, farms, and tourist attractions, and is a great place to live and work. The town is also home to a diverse population, with a variety of racial and ethnic backgrounds. Charlotte is a great place to call home.
Common Questions
What is Per Capita Income in Charlotte?
Per Capita income in Charlotte is $26,636.
What is the Median Family Income in Charlotte?
Median Family Income in Charlotte is $69,931.
What is the Median Household income in Charlotte?
Median Household Income in Charlotte is $57,188.
What is Income or Wage Gap in Charlotte?
Income or Wage Gap in Charlotte is 25.6%.
Women in Charlotte earn 74.4 cents for every dollar earned by a man.
What is Family Income Deficit in Charlotte?
Family Income Deficit in Charlotte is $9,655.
Families that are below poverty line in Charlotte earn $9,655 less on average than the poverty threshold level.
What is Inequality or Gini Index in Charlotte?
Inequality or Gini Index in Charlotte is 0.46.
What is the Total Population of Charlotte?
Total Population of Charlotte is 1,997.
What is the Total Male Population of Charlotte?
Total Male Population of Charlotte is 1,077.
What is the Total Female Population of Charlotte?
Total Female Population of Charlotte is 920.
What is the Ratio of Males per 100 Females in Charlotte?
There are 117.07 Males per 100 Females in Charlotte.
What is the Ratio of Females per 100 Males in Charlotte?
There are 85.42 Females per 100 Males in Charlotte.
What is the Median Population Age in Charlotte?
Median Population Age in Charlotte is 36.8 Years.
What is the Average Family Size in Charlotte
Average Family Size in Charlotte is 3.8 People.
What is the Average Household Size in Charlotte
Average Household Size in Charlotte is 3.0 People.
How Large is the Labor Force in Charlotte?
There are 711 People in the Labor Forcein in Charlotte.
What is the Percentage of People in the Labor Force in Charlotte?
46.2% of People are in the Labor Force in Charlotte.
What is the Unemployment Rate in Charlotte?
Unemployment Rate in Charlotte is 5.1%.