Chapel Hill, TN Map & Demographics
Chapel Hill Map
Chapel Hill Overview
$36,718
PER CAPITA INCOME
$85,817
AVG FAMILY INCOME
$79,583
AVG HOUSEHOLD INCOME
42.9%
WAGE / INCOME GAP [ % ]
57.1¢/ $1
WAGE / INCOME GAP [ $ ]
0.35
INEQUALITY / GINI INDEX
1,626
TOTAL POPULATION
811
MALE POPULATION
815
FEMALE POPULATION
99.51
MALES / 100 FEMALES
100.49
FEMALES / 100 MALES
44.4
MEDIAN AGE
2.9
AVG FAMILY SIZE
2.4
AVG HOUSEHOLD SIZE
907
LABOR FORCE [ PEOPLE ]
64.4%
PERCENT IN LABOR FORCE
3.7%
UNEMPLOYMENT RATE
Chapel Hill Zip Codes
Chapel Hill Area Codes
Income in Chapel Hill
Income Overview in Chapel Hill
Per Capita Income in Chapel Hill is $36,718, while median incomes of families and households are $85,817 and $79,583 respectively.
| Characteristic | Number | Measure |
| Per Capita Income | 1,626 | $36,718 |
| Median Family Income | 467 | $85,817 |
| Mean Family Income | 467 | $95,380 |
| Median Household Income | 692 | $79,583 |
| Mean Household Income | 692 | $84,473 |
| Income Deficit | 467 | $0 |
| Wage / Income Gap (%) | 1,626 | 42.85% |
| Wage / Income Gap ($) | 1,626 | 57.15¢ per $1 |
| Gini / Inequality Index | 1,626 | 0.35 |
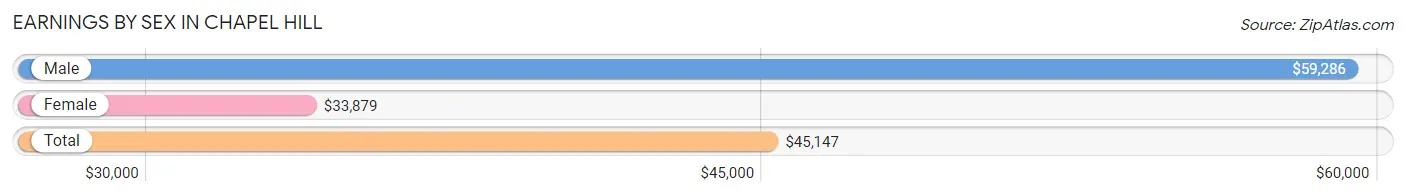
Earnings by Sex in Chapel Hill
Average Earnings in Chapel Hill are $45,147, $59,286 for men and $33,879 for women, a difference of 42.8%.
| Sex | Number | Average Earnings |
| Male | 530 (57.4%) | $59,286 |
| Female | 394 (42.6%) | $33,879 |
| Total | 924 (100.0%) | $45,147 |
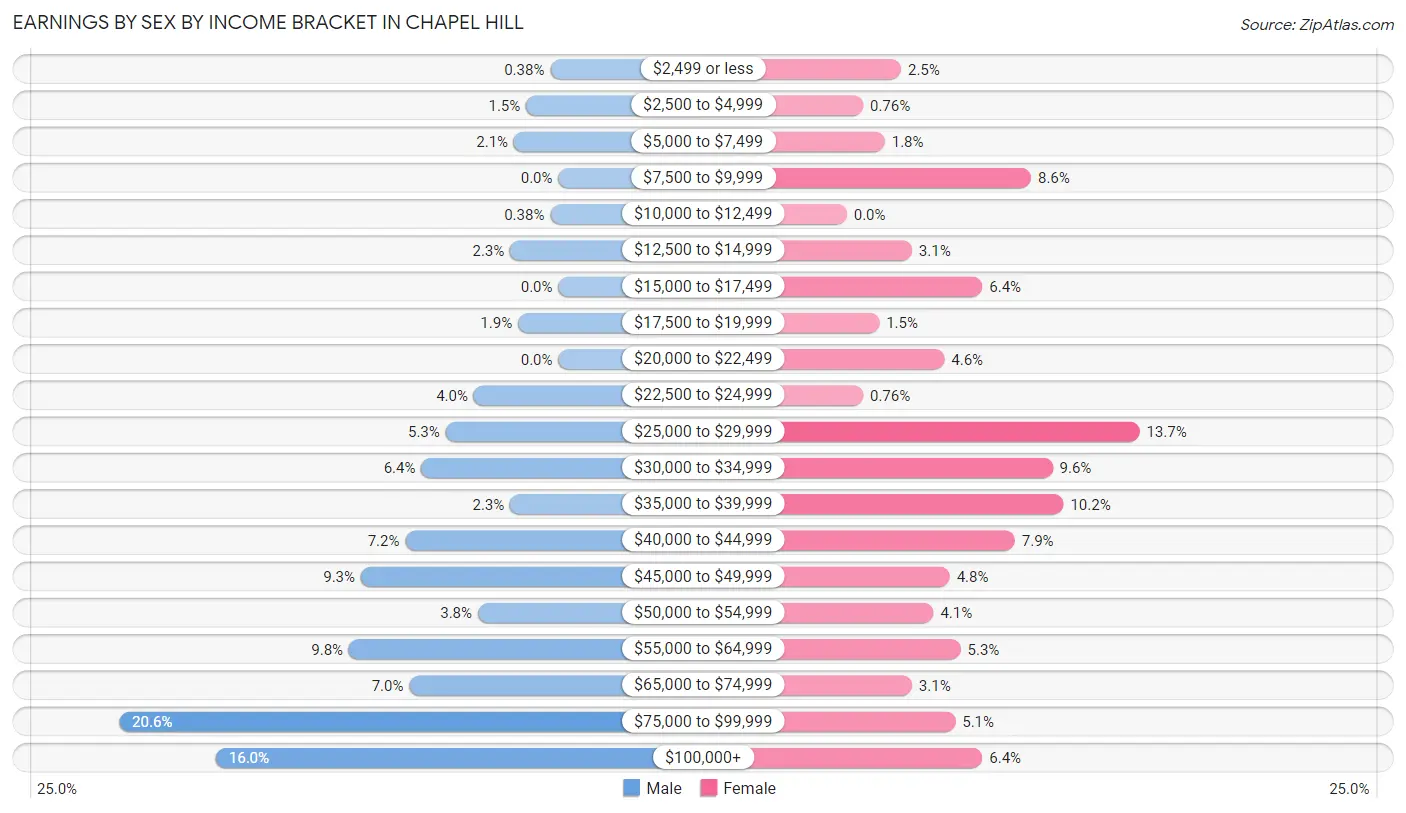
Earnings by Sex by Income Bracket in Chapel Hill
The most common earnings brackets in Chapel Hill are $75,000 to $99,999 for men (109 | 20.6%) and $25,000 to $29,999 for women (54 | 13.7%).
| Income | Male | Female |
| $2,499 or less | 2 (0.4%) | 10 (2.5%) |
| $2,500 to $4,999 | 8 (1.5%) | 3 (0.8%) |
| $5,000 to $7,499 | 11 (2.1%) | 7 (1.8%) |
| $7,500 to $9,999 | 0 (0.0%) | 34 (8.6%) |
| $10,000 to $12,499 | 2 (0.4%) | 0 (0.0%) |
| $12,500 to $14,999 | 12 (2.3%) | 12 (3.0%) |
| $15,000 to $17,499 | 0 (0.0%) | 25 (6.4%) |
| $17,500 to $19,999 | 10 (1.9%) | 6 (1.5%) |
| $20,000 to $22,499 | 0 (0.0%) | 18 (4.6%) |
| $22,500 to $24,999 | 21 (4.0%) | 3 (0.8%) |
| $25,000 to $29,999 | 28 (5.3%) | 54 (13.7%) |
| $30,000 to $34,999 | 34 (6.4%) | 38 (9.6%) |
| $35,000 to $39,999 | 12 (2.3%) | 40 (10.2%) |
| $40,000 to $44,999 | 38 (7.2%) | 31 (7.9%) |
| $45,000 to $49,999 | 49 (9.2%) | 19 (4.8%) |
| $50,000 to $54,999 | 20 (3.8%) | 16 (4.1%) |
| $55,000 to $64,999 | 52 (9.8%) | 21 (5.3%) |
| $65,000 to $74,999 | 37 (7.0%) | 12 (3.0%) |
| $75,000 to $99,999 | 109 (20.6%) | 20 (5.1%) |
| $100,000+ | 85 (16.0%) | 25 (6.4%) |
| Total | 530 (100.0%) | 394 (100.0%) |
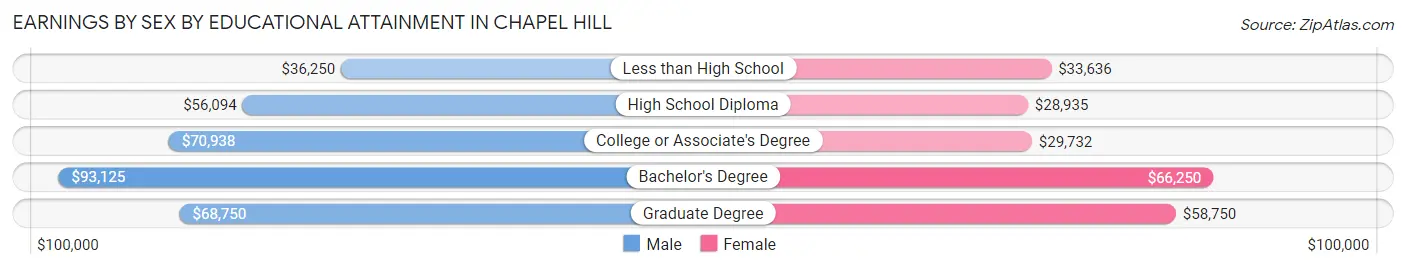
Earnings by Sex by Educational Attainment in Chapel Hill
Average earnings in Chapel Hill are $64,408 for men and $34,567 for women, a difference of 46.3%. Men with an educational attainment of bachelor's degree enjoy the highest average annual earnings of $93,125, while those with less than high school education earn the least with $36,250. Women with an educational attainment of bachelor's degree earn the most with the average annual earnings of $66,250, while those with high school diploma education have the smallest earnings of $28,935.
| Educational Attainment | Male Income | Female Income |
| Less than High School | $36,250 | $33,636 |
| High School Diploma | $56,094 | $28,935 |
| College or Associate's Degree | $70,938 | $29,732 |
| Bachelor's Degree | $93,125 | $66,250 |
| Graduate Degree | $68,750 | $58,750 |
| Total | $64,408 | $34,567 |
Family Income in Chapel Hill
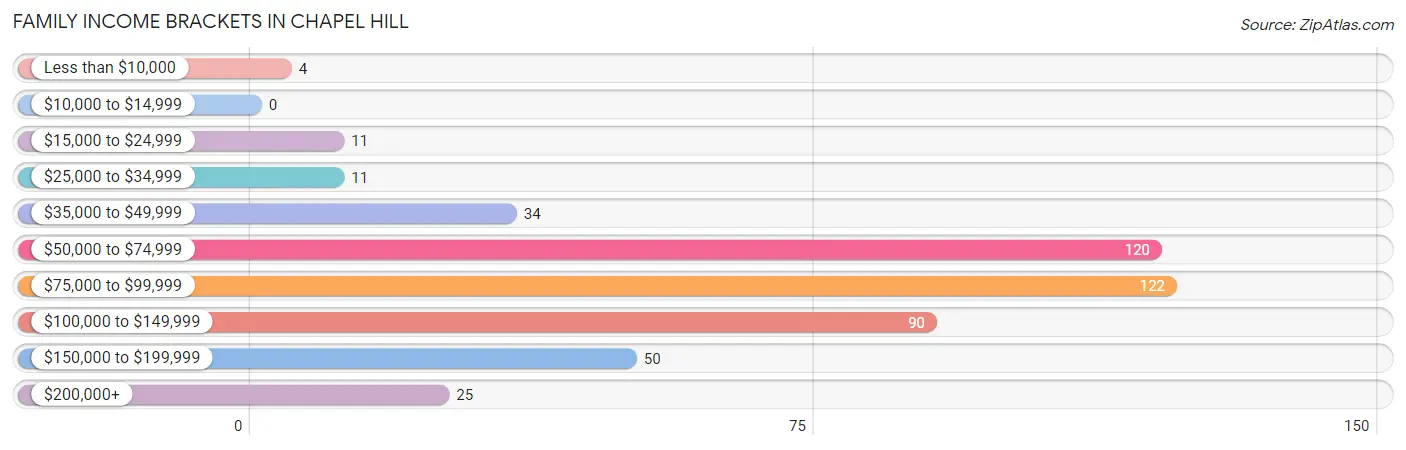
Family Income Brackets in Chapel Hill
According to the Chapel Hill family income data, there are 122 families falling into the $75,000 to $99,999 income range, which is the most common income bracket and makes up 26.1% of all families.
| Income Bracket | # Families | % Families |
| Less than $10,000 | 4 | 0.9% |
| $10,000 to $14,999 | 0 | 0.0% |
| $15,000 to $24,999 | 11 | 2.4% |
| $25,000 to $34,999 | 11 | 2.4% |
| $35,000 to $49,999 | 34 | 7.3% |
| $50,000 to $74,999 | 120 | 25.7% |
| $75,000 to $99,999 | 122 | 26.1% |
| $100,000 to $149,999 | 90 | 19.3% |
| $150,000 to $199,999 | 50 | 10.7% |
| $200,000+ | 25 | 5.4% |
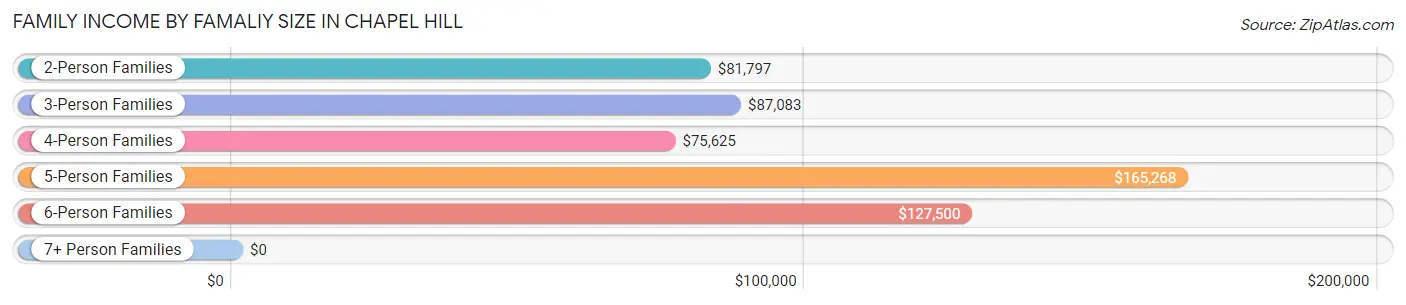
Family Income by Famaliy Size in Chapel Hill
5-person families (33 | 7.1%) account for the highest median family income in Chapel Hill with $165,268 per family, while 2-person families (263 | 56.3%) have the highest median income of $40,898 per family member.
| Income Bracket | # Families | Median Income |
| 2-Person Families | 263 (56.3%) | $81,797 |
| 3-Person Families | 78 (16.7%) | $87,083 |
| 4-Person Families | 85 (18.2%) | $75,625 |
| 5-Person Families | 33 (7.1%) | $165,268 |
| 6-Person Families | 8 (1.7%) | $127,500 |
| 7+ Person Families | 0 (0.0%) | $0 |
| Total | 467 (100.0%) | $85,817 |
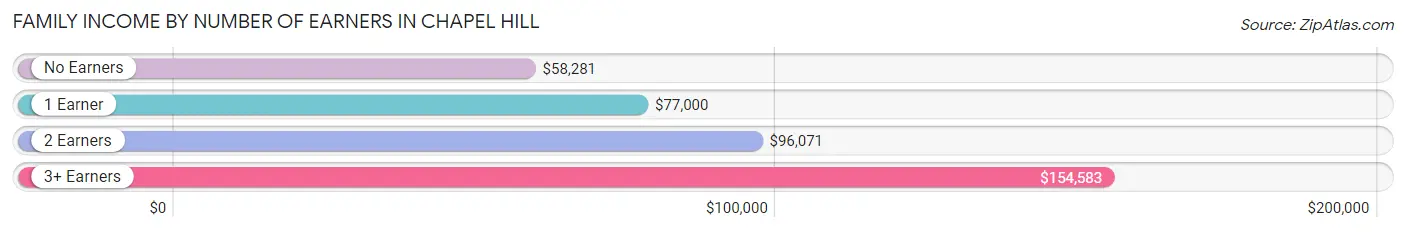
Family Income by Number of Earners in Chapel Hill
The median family income in Chapel Hill is $85,817, with families comprising 3+ earners (46) having the highest median family income of $154,583, while families with no earners (45) have the lowest median family income of $58,281, accounting for 9.9% and 9.6% of families, respectively.
| Number of Earners | # Families | Median Income |
| No Earners | 45 (9.6%) | $58,281 |
| 1 Earner | 156 (33.4%) | $77,000 |
| 2 Earners | 220 (47.1%) | $96,071 |
| 3+ Earners | 46 (9.9%) | $154,583 |
| Total | 467 (100.0%) | $85,817 |
Household Income in Chapel Hill
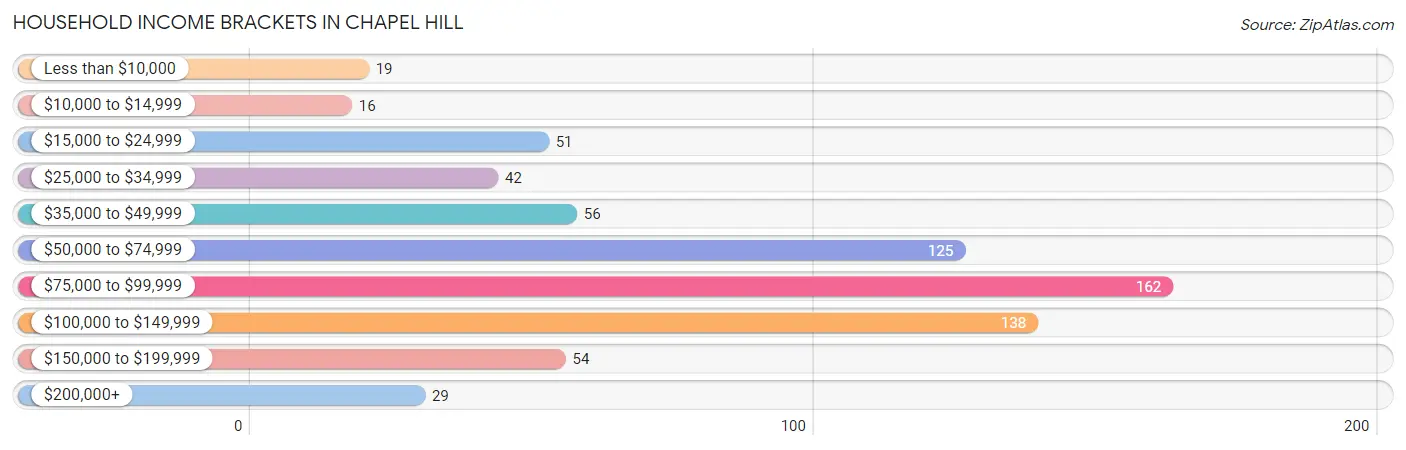
Household Income Brackets in Chapel Hill
With 162 households falling in the category, the $75,000 to $99,999 income range is the most frequent in Chapel Hill, accounting for 23.4% of all households. In contrast, only 16 households (2.3%) fall into the $10,000 to $14,999 income bracket, making it the least populous group.
| Income Bracket | # Households | % Households |
| Less than $10,000 | 19 | 2.7% |
| $10,000 to $14,999 | 16 | 2.3% |
| $15,000 to $24,999 | 51 | 7.4% |
| $25,000 to $34,999 | 42 | 6.1% |
| $35,000 to $49,999 | 56 | 8.1% |
| $50,000 to $74,999 | 125 | 18.1% |
| $75,000 to $99,999 | 162 | 23.4% |
| $100,000 to $149,999 | 138 | 19.9% |
| $150,000 to $199,999 | 54 | 7.8% |
| $200,000+ | 29 | 4.2% |
Household Income by Householder Age in Chapel Hill
The median household income in Chapel Hill is $79,583, with the highest median household income of $86,250 found in the 45 to 64 years age bracket for the primary householder. A total of 330 households (47.7%) fall into this category. Meanwhile, the 65+ years age bracket for the primary householder has the lowest median household income of $41,071, with 160 households (23.1%) in this group.
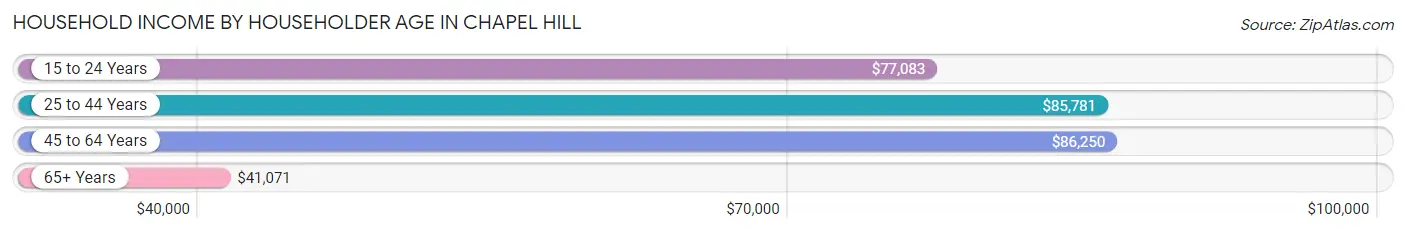
| Income Bracket | # Households | Median Income |
| 15 to 24 Years | 28 (4.1%) | $77,083 |
| 25 to 44 Years | 174 (25.1%) | $85,781 |
| 45 to 64 Years | 330 (47.7%) | $86,250 |
| 65+ Years | 160 (23.1%) | $41,071 |
| Total | 692 (100.0%) | $79,583 |
Poverty in Chapel Hill
Income Below Poverty by Sex and Age in Chapel Hill
With 1.5% poverty level for males and 6.6% for females among the residents of Chapel Hill, 16 and 17 year old males and 15 year old females are the most vulnerable to poverty, with 4 males (33.3%) and 3 females (100.0%) in their respective age groups living below the poverty level.
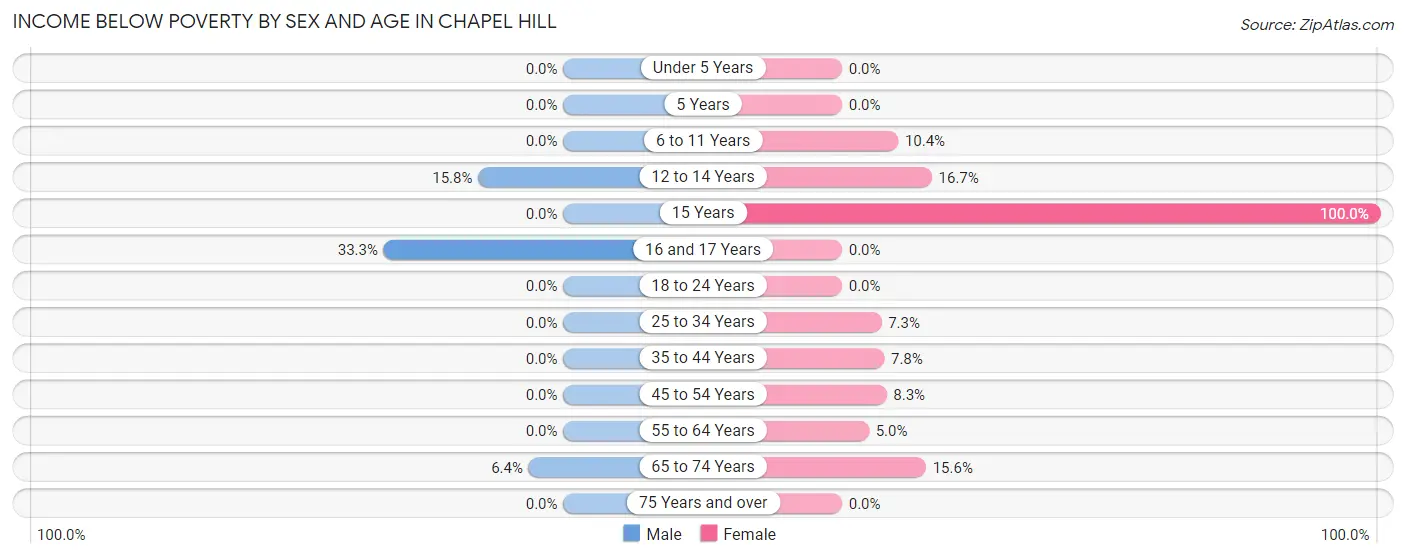
| Age Bracket | Male | Female |
| Under 5 Years | 0 (0.0%) | 0 (0.0%) |
| 5 Years | 0 (0.0%) | 0 (0.0%) |
| 6 to 11 Years | 0 (0.0%) | 5 (10.4%) |
| 12 to 14 Years | 3 (15.8%) | 2 (16.7%) |
| 15 Years | 0 (0.0%) | 3 (100.0%) |
| 16 and 17 Years | 4 (33.3%) | 0 (0.0%) |
| 18 to 24 Years | 0 (0.0%) | 0 (0.0%) |
| 25 to 34 Years | 0 (0.0%) | 6 (7.3%) |
| 35 to 44 Years | 0 (0.0%) | 8 (7.8%) |
| 45 to 54 Years | 0 (0.0%) | 11 (8.3%) |
| 55 to 64 Years | 0 (0.0%) | 7 (5.0%) |
| 65 to 74 Years | 5 (6.4%) | 12 (15.6%) |
| 75 Years and over | 0 (0.0%) | 0 (0.0%) |
| Total | 12 (1.5%) | 54 (6.6%) |
Income Above Poverty by Sex and Age in Chapel Hill
According to the poverty statistics in Chapel Hill, males aged under 5 years and females aged under 5 years are the age groups that are most secure financially, with 100.0% of males and 100.0% of females in these age groups living above the poverty line.
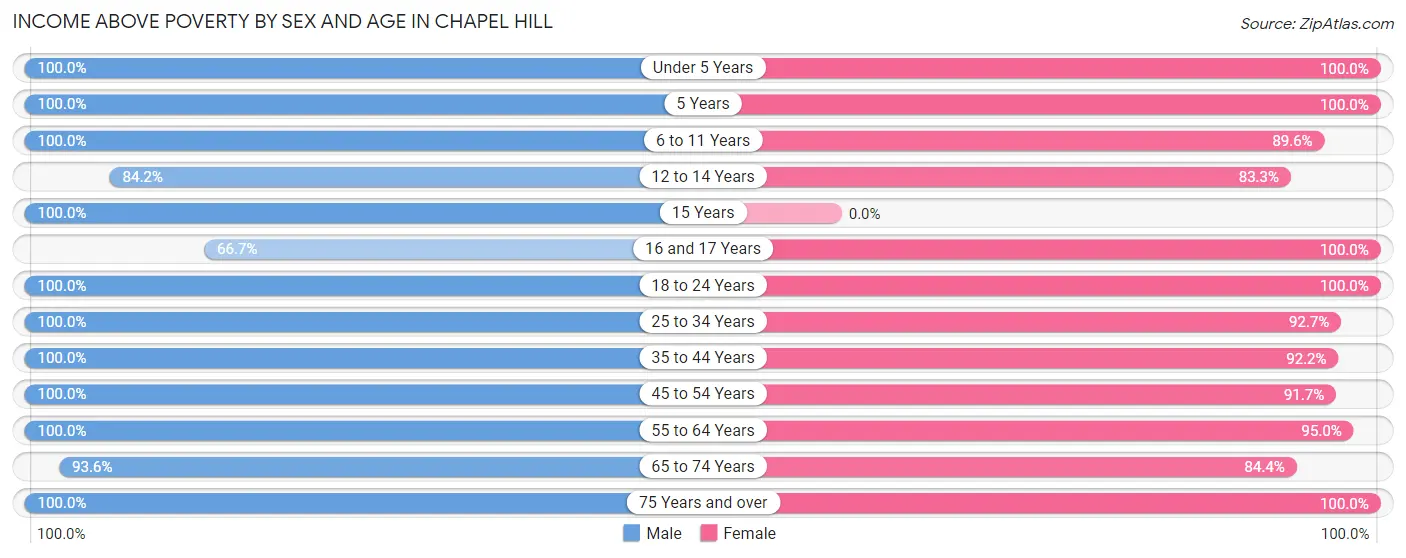
| Age Bracket | Male | Female |
| Under 5 Years | 33 (100.0%) | 47 (100.0%) |
| 5 Years | 4 (100.0%) | 18 (100.0%) |
| 6 to 11 Years | 21 (100.0%) | 43 (89.6%) |
| 12 to 14 Years | 16 (84.2%) | 10 (83.3%) |
| 15 Years | 10 (100.0%) | 0 (0.0%) |
| 16 and 17 Years | 8 (66.7%) | 13 (100.0%) |
| 18 to 24 Years | 94 (100.0%) | 63 (100.0%) |
| 25 to 34 Years | 100 (100.0%) | 76 (92.7%) |
| 35 to 44 Years | 144 (100.0%) | 94 (92.2%) |
| 45 to 54 Years | 171 (100.0%) | 122 (91.7%) |
| 55 to 64 Years | 90 (100.0%) | 133 (95.0%) |
| 65 to 74 Years | 73 (93.6%) | 65 (84.4%) |
| 75 Years and over | 35 (100.0%) | 75 (100.0%) |
| Total | 799 (98.5%) | 759 (93.4%) |
Income Below Poverty Among Married-Couple Families in Chapel Hill
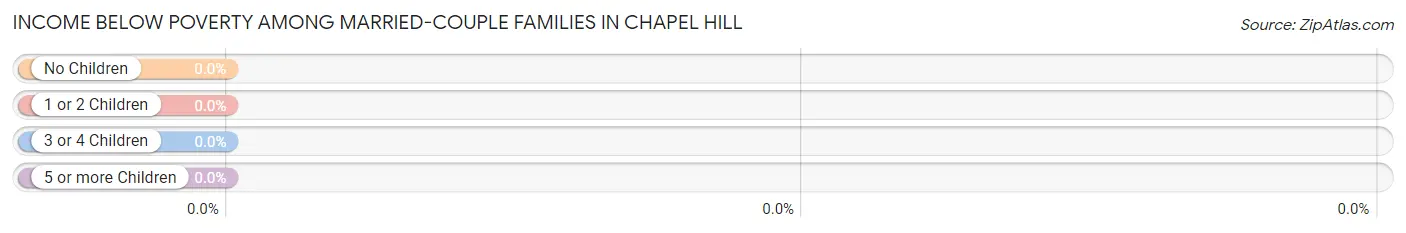
| Children | Above Poverty | Below Poverty |
| No Children | 237 (100.0%) | 0 (0.0%) |
| 1 or 2 Children | 118 (100.0%) | 0 (0.0%) |
| 3 or 4 Children | 7 (100.0%) | 0 (0.0%) |
| 5 or more Children | 0 (0.0%) | 0 (0.0%) |
| Total | 362 (100.0%) | 0 (0.0%) |
Income Below Poverty Among Single-Parent Households in Chapel Hill
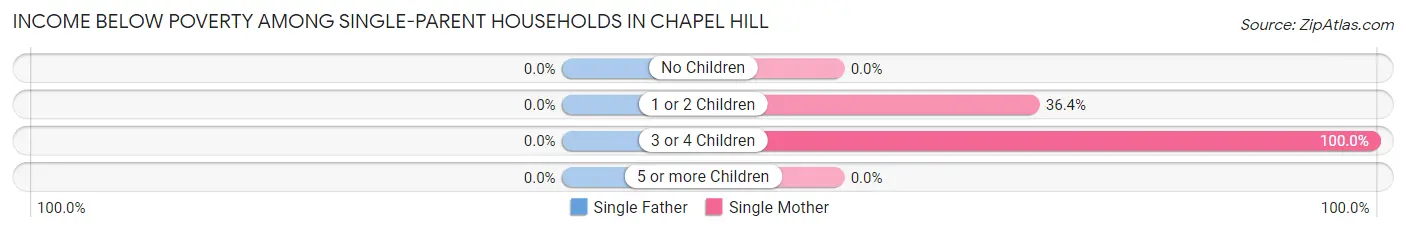
| Children | Single Father | Single Mother |
| No Children | 0 (0.0%) | 0 (0.0%) |
| 1 or 2 Children | 0 (0.0%) | 4 (36.4%) |
| 3 or 4 Children | 0 (0.0%) | 4 (100.0%) |
| 5 or more Children | 0 (0.0%) | 0 (0.0%) |
| Total | 0 (0.0%) | 8 (11.9%) |
Income Below Poverty Among Married-Couple vs Single-Parent Households in Chapel Hill
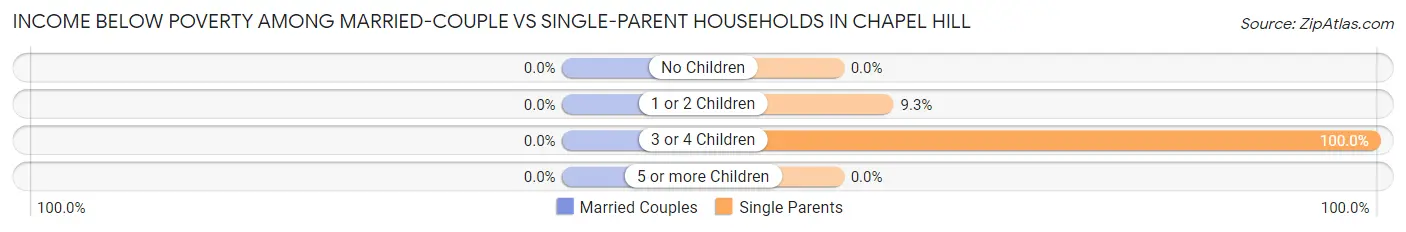
| Children | Married-Couple Families | Single-Parent Households |
| No Children | 0 (0.0%) | 0 (0.0%) |
| 1 or 2 Children | 0 (0.0%) | 4 (9.3%) |
| 3 or 4 Children | 0 (0.0%) | 4 (100.0%) |
| 5 or more Children | 0 (0.0%) | 0 (0.0%) |
| Total | 0 (0.0%) | 8 (7.6%) |
Race in Chapel Hill
The most populous races in Chapel Hill are White / Caucasian (1,464 | 90.0%), Two or more Races (82 | 5.0%), and Black / African American (60 | 3.7%).
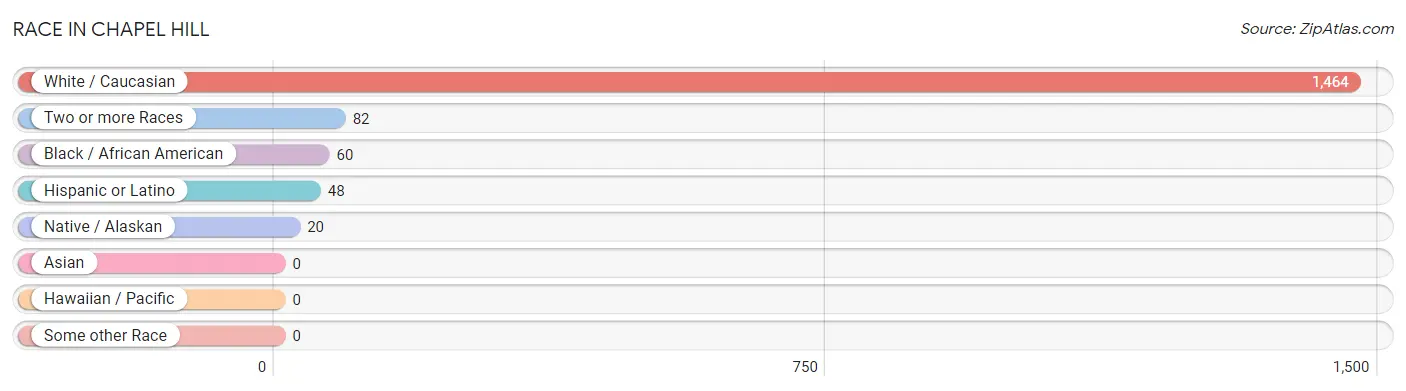
| Race | # Population | % Population |
| Asian | 0 | 0.0% |
| Black / African American | 60 | 3.7% |
| Hawaiian / Pacific | 0 | 0.0% |
| Hispanic or Latino | 48 | 2.9% |
| Native / Alaskan | 20 | 1.2% |
| White / Caucasian | 1,464 | 90.0% |
| Two or more Races | 82 | 5.0% |
| Some other Race | 0 | 0.0% |
| Total | 1,626 | 100.0% |
Ancestry in Chapel Hill
The most populous ancestries reported in Chapel Hill are American (519 | 31.9%), English (224 | 13.8%), Irish (151 | 9.3%), German (129 | 7.9%), and Scotch-Irish (45 | 2.8%), together accounting for 65.7% of all Chapel Hill residents.
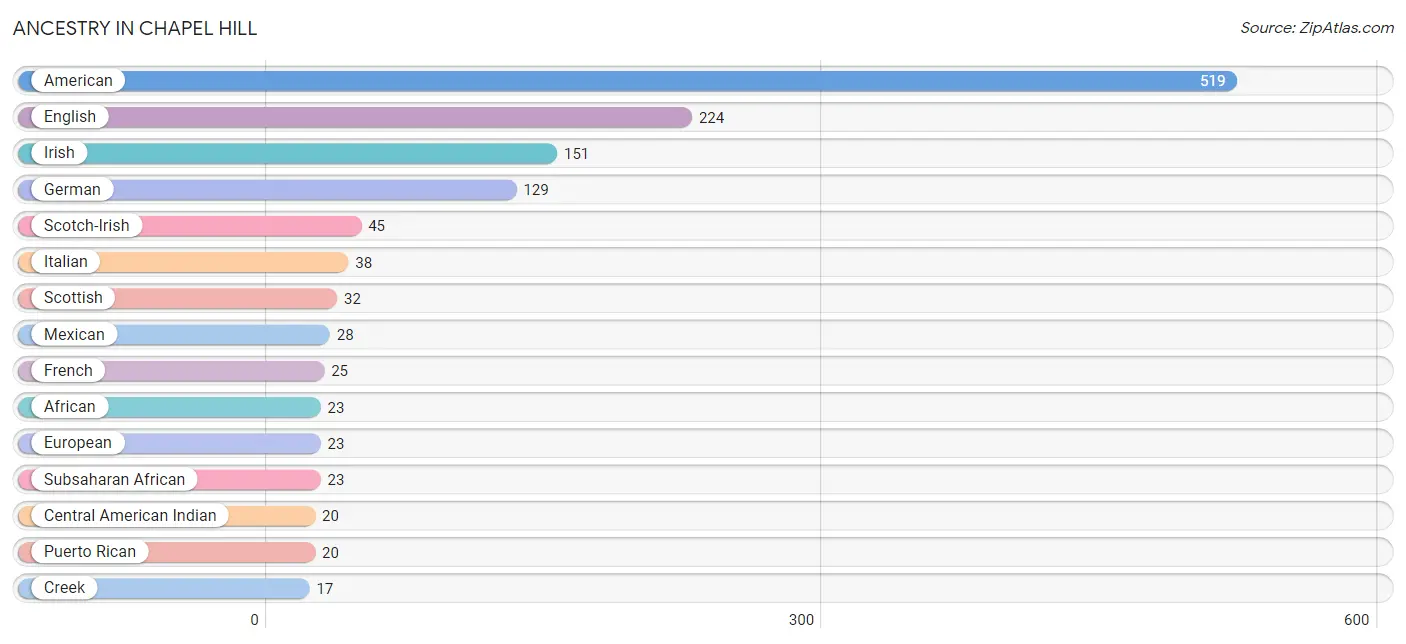
| Ancestry | # Population | % Population |
| African | 23 | 1.4% |
| American | 519 | 31.9% |
| Belgian | 3 | 0.2% |
| Canadian | 8 | 0.5% |
| Central American Indian | 20 | 1.2% |
| Cherokee | 4 | 0.3% |
| Choctaw | 3 | 0.2% |
| Creek | 17 | 1.1% |
| Danish | 5 | 0.3% |
| Dutch | 9 | 0.5% |
| Eastern European | 5 | 0.3% |
| English | 224 | 13.8% |
| European | 23 | 1.4% |
| French | 25 | 1.5% |
| German | 129 | 7.9% |
| Greek | 7 | 0.4% |
| Irish | 151 | 9.3% |
| Italian | 38 | 2.3% |
| Korean | 7 | 0.4% |
| Lithuanian | 3 | 0.2% |
| Mexican | 28 | 1.7% |
| Polish | 6 | 0.4% |
| Portuguese | 11 | 0.7% |
| Puerto Rican | 20 | 1.2% |
| Russian | 3 | 0.2% |
| Scandinavian | 5 | 0.3% |
| Scotch-Irish | 45 | 2.8% |
| Scottish | 32 | 2.0% |
| Subsaharan African | 23 | 1.4% |
| Swedish | 13 | 0.8% |
| Welsh | 3 | 0.2% | View All 31 Rows |
Immigrants in Chapel Hill
The most numerous immigrant groups reported in Chapel Hill came from , and Canada (5 | 0.3%), together accounting for 0.3% of all Chapel Hill residents.

| Immigration Origin | # Population | % Population |
| Canada | 5 | 0.3% | View All 1 Rows |
Sex and Age in Chapel Hill
Sex and Age in Chapel Hill
The most populous age groups in Chapel Hill are 40 to 44 Years (113 | 13.9%) for men and 60 to 64 Years (85 | 10.4%) for women.
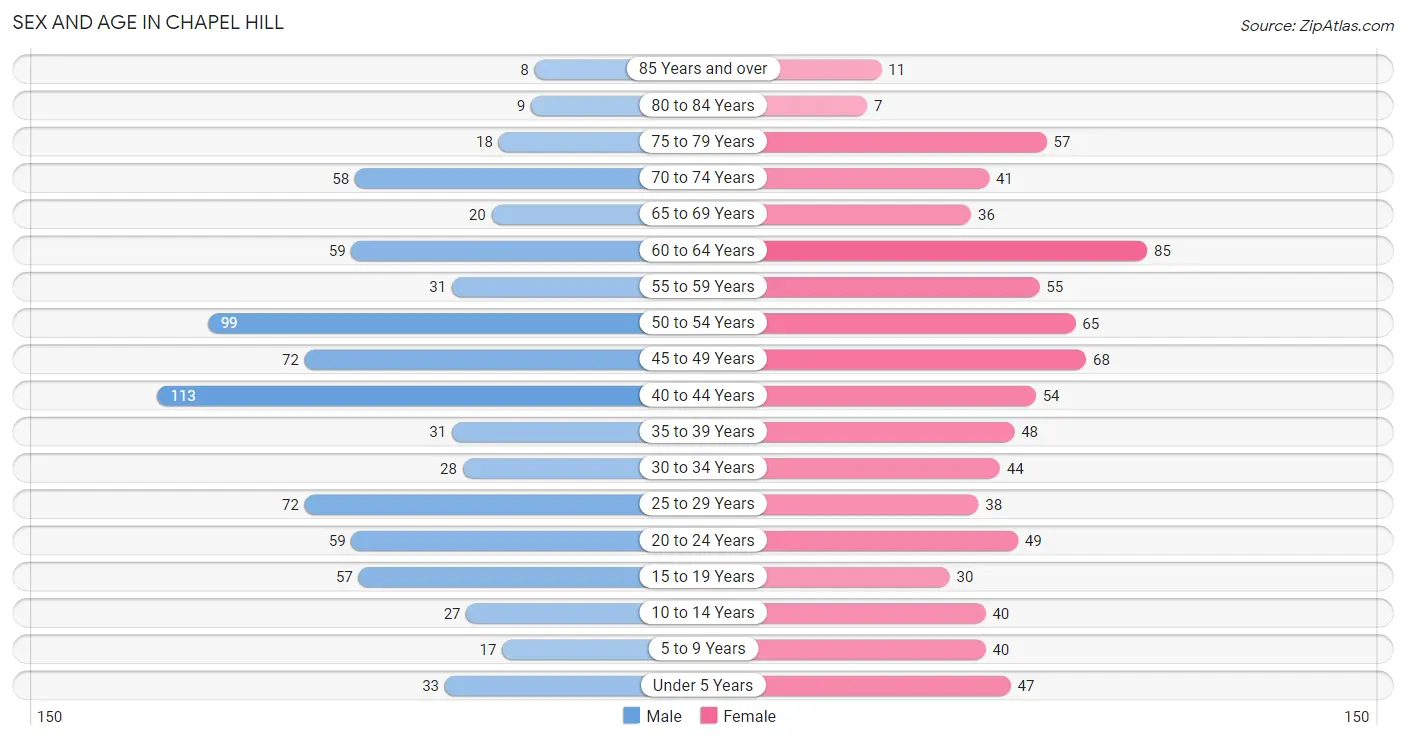
| Age Bracket | Male | Female |
| Under 5 Years | 33 (4.1%) | 47 (5.8%) |
| 5 to 9 Years | 17 (2.1%) | 40 (4.9%) |
| 10 to 14 Years | 27 (3.3%) | 40 (4.9%) |
| 15 to 19 Years | 57 (7.0%) | 30 (3.7%) |
| 20 to 24 Years | 59 (7.3%) | 49 (6.0%) |
| 25 to 29 Years | 72 (8.9%) | 38 (4.7%) |
| 30 to 34 Years | 28 (3.5%) | 44 (5.4%) |
| 35 to 39 Years | 31 (3.8%) | 48 (5.9%) |
| 40 to 44 Years | 113 (13.9%) | 54 (6.6%) |
| 45 to 49 Years | 72 (8.9%) | 68 (8.3%) |
| 50 to 54 Years | 99 (12.2%) | 65 (8.0%) |
| 55 to 59 Years | 31 (3.8%) | 55 (6.8%) |
| 60 to 64 Years | 59 (7.3%) | 85 (10.4%) |
| 65 to 69 Years | 20 (2.5%) | 36 (4.4%) |
| 70 to 74 Years | 58 (7.1%) | 41 (5.0%) |
| 75 to 79 Years | 18 (2.2%) | 57 (7.0%) |
| 80 to 84 Years | 9 (1.1%) | 7 (0.9%) |
| 85 Years and over | 8 (1.0%) | 11 (1.3%) |
| Total | 811 (100.0%) | 815 (100.0%) |
Families and Households in Chapel Hill
Median Family Size in Chapel Hill
The median family size in Chapel Hill is 2.88 persons per family, with married-couple families (362 | 77.5%) accounting for the largest median family size of 2.96 persons per family. On the other hand, single female/mother families (67 | 14.3%) represent the smallest median family size with 2.60 persons per family.
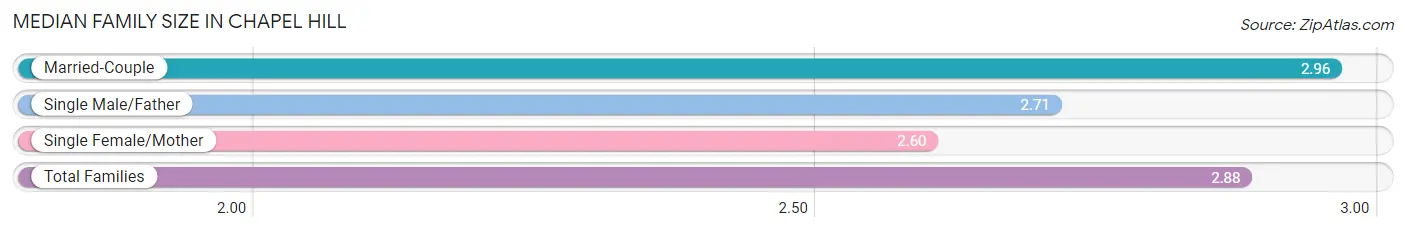
| Family Type | # Families | Family Size |
| Married-Couple | 362 (77.5%) | 2.96 |
| Single Male/Father | 38 (8.1%) | 2.71 |
| Single Female/Mother | 67 (14.3%) | 2.60 |
| Total Families | 467 (100.0%) | 2.88 |
Median Household Size in Chapel Hill
The median household size in Chapel Hill is 2.35 persons per household, with single male/father households (38 | 5.5%) accounting for the largest median household size of 3.08 persons per household. non-family households (225 | 32.5%) represent the smallest median household size with 1.15 persons per household.
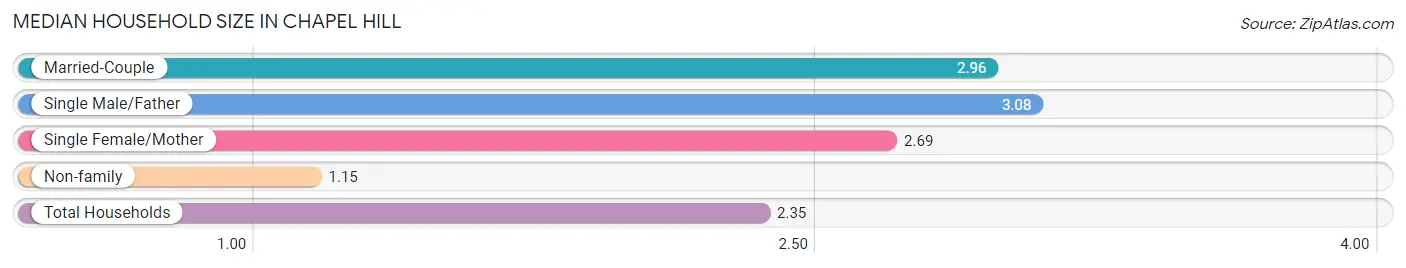
| Household Type | # Households | Household Size |
| Married-Couple | 362 (52.3%) | 2.96 |
| Single Male/Father | 38 (5.5%) | 3.08 |
| Single Female/Mother | 67 (9.7%) | 2.69 |
| Non-family | 225 (32.5%) | 1.15 |
| Total Households | 692 (100.0%) | 2.35 |
Household Size by Marriage Status in Chapel Hill
Out of a total of 692 households in Chapel Hill, 467 (67.5%) are family households, while 225 (32.5%) are nonfamily households. The most numerous type of family households are 2-person households, comprising 257, and the most common type of nonfamily households are 1-person households, comprising 206.
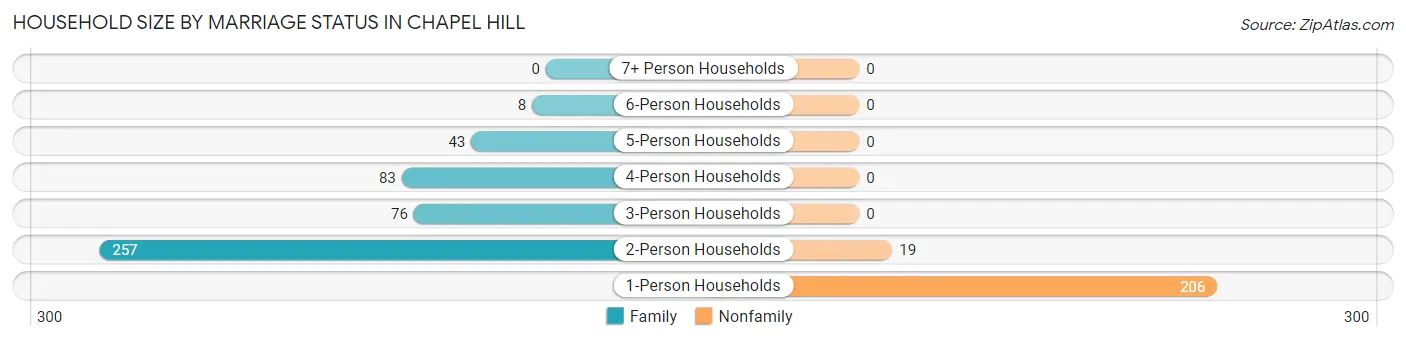
| Household Size | Family Households | Nonfamily Households |
| 1-Person Households | - | 206 (29.8%) |
| 2-Person Households | 257 (37.1%) | 19 (2.8%) |
| 3-Person Households | 76 (11.0%) | 0 (0.0%) |
| 4-Person Households | 83 (12.0%) | 0 (0.0%) |
| 5-Person Households | 43 (6.2%) | 0 (0.0%) |
| 6-Person Households | 8 (1.2%) | 0 (0.0%) |
| 7+ Person Households | 0 (0.0%) | 0 (0.0%) |
| Total | 467 (67.5%) | 225 (32.5%) |
Female Fertility in Chapel Hill
Fertility by Age in Chapel Hill
Average fertility rate in Chapel Hill is 60.0 births per 1,000 women. Women in the age bracket of 20 to 34 years have the highest fertility rate with 160.0 births per 1,000 women. Women in the age bracket of 20 to 34 years acount for 100.0% of all women with births.
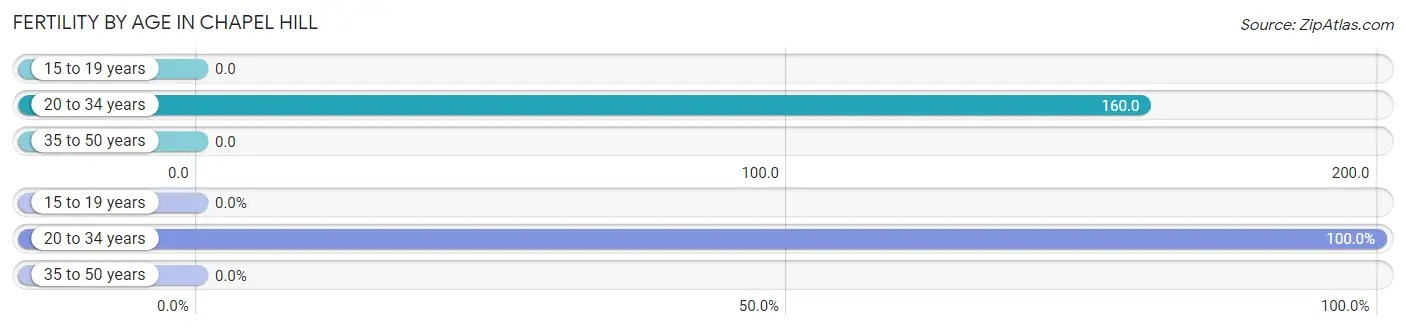
| Age Bracket | Women with Births | Births / 1,000 Women |
| 15 to 19 years | 0 (0.0%) | 0.0 |
| 20 to 34 years | 21 (100.0%) | 160.0 |
| 35 to 50 years | 0 (0.0%) | 0.0 |
| Total | 21 (100.0%) | 60.0 |
Fertility by Age by Marriage Status in Chapel Hill
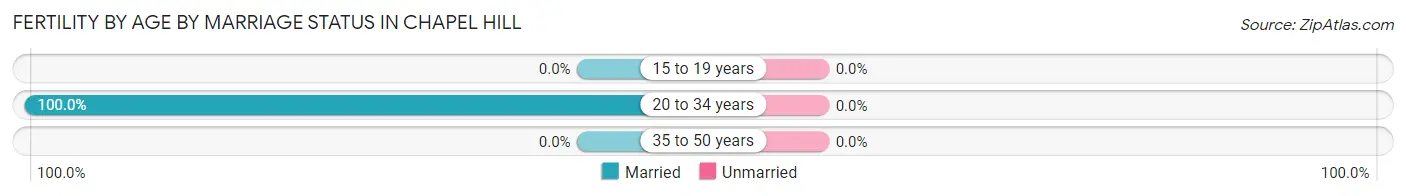
| Age Bracket | Married | Unmarried |
| 15 to 19 years | 0 (0.0%) | 0 (0.0%) |
| 20 to 34 years | 21 (100.0%) | 0 (0.0%) |
| 35 to 50 years | 0 (0.0%) | 0 (0.0%) |
| Total | 21 (100.0%) | 0 (0.0%) |
Fertility by Education in Chapel Hill
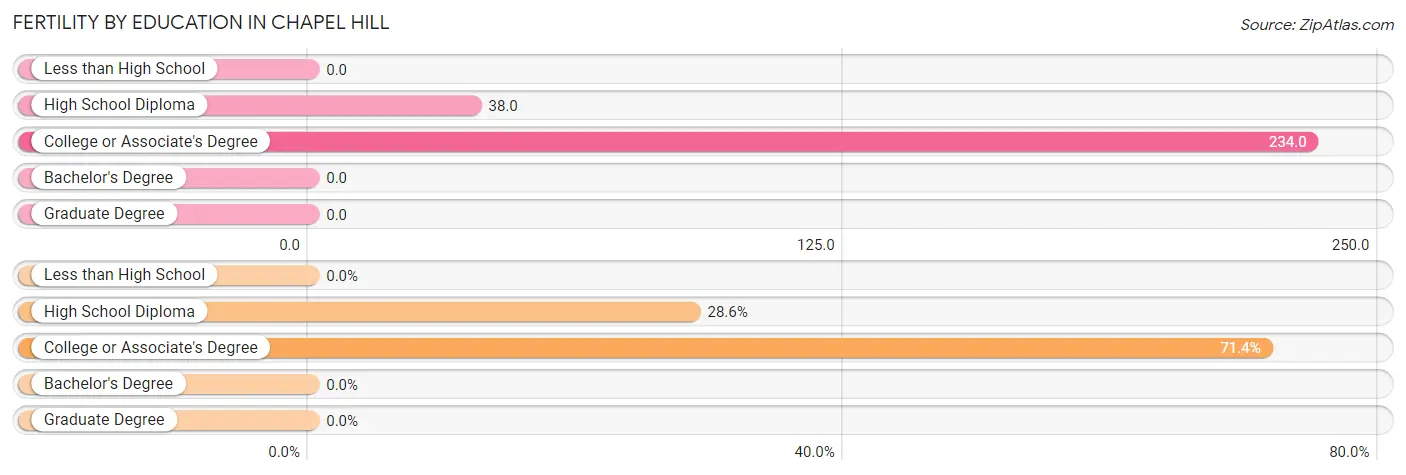
| Educational Attainment | Women with Births | Births / 1,000 Women |
| Less than High School | 0 (0.0%) | 0.0 |
| High School Diploma | 6 (28.6%) | 38.0 |
| College or Associate's Degree | 15 (71.4%) | 234.0 |
| Bachelor's Degree | 0 (0.0%) | 0.0 |
| Graduate Degree | 0 (0.0%) | 0.0 |
| Total | 21 (100.0%) | 60.0 |
Fertility by Education by Marriage Status in Chapel Hill
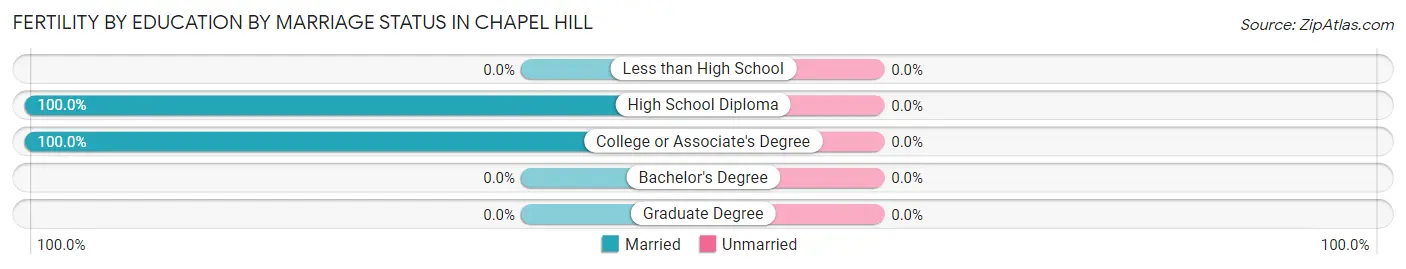
| Educational Attainment | Married | Unmarried |
| Less than High School | 0 (0.0%) | 0 (0.0%) |
| High School Diploma | 6 (100.0%) | 0 (0.0%) |
| College or Associate's Degree | 15 (100.0%) | 0 (0.0%) |
| Bachelor's Degree | 0 (0.0%) | 0 (0.0%) |
| Graduate Degree | 0 (0.0%) | 0 (0.0%) |
| Total | 21 (100.0%) | 0 (0.0%) |
Employment Characteristics in Chapel Hill
Employment by Class of Employer in Chapel Hill
Among the 850 employed individuals in Chapel Hill, private company employees (653 | 76.8%), local government employees (75 | 8.8%), and self-employed (incorporated) (32 | 3.8%) make up the most common classes of employment.
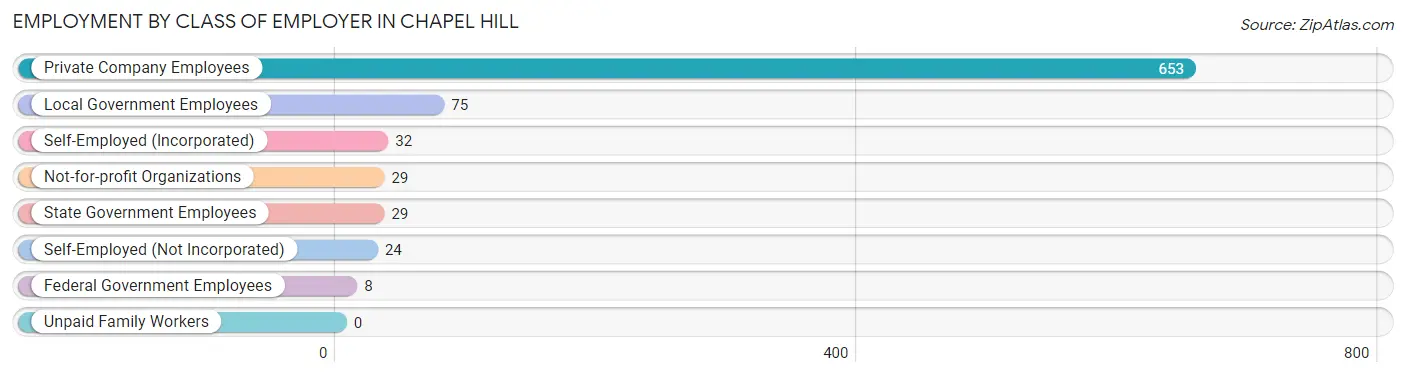
| Employer Class | # Employees | % Employees |
| Private Company Employees | 653 | 76.8% |
| Self-Employed (Incorporated) | 32 | 3.8% |
| Self-Employed (Not Incorporated) | 24 | 2.8% |
| Not-for-profit Organizations | 29 | 3.4% |
| Local Government Employees | 75 | 8.8% |
| State Government Employees | 29 | 3.4% |
| Federal Government Employees | 8 | 0.9% |
| Unpaid Family Workers | 0 | 0.0% |
| Total | 850 | 100.0% |
Employment Status by Age in Chapel Hill
According to the labor force statistics for Chapel Hill, out of the total population over 16 years of age (1,409), 64.4% or 907 individuals are in the labor force, with 3.7% or 34 of them unemployed. The age group with the highest labor force participation rate is 55 to 59 years, with 88.4% or 76 individuals in the labor force. Within the labor force, the 60 to 64 years age range has the highest percentage of unemployed individuals, with 17.2% or 20 of them being unemployed.
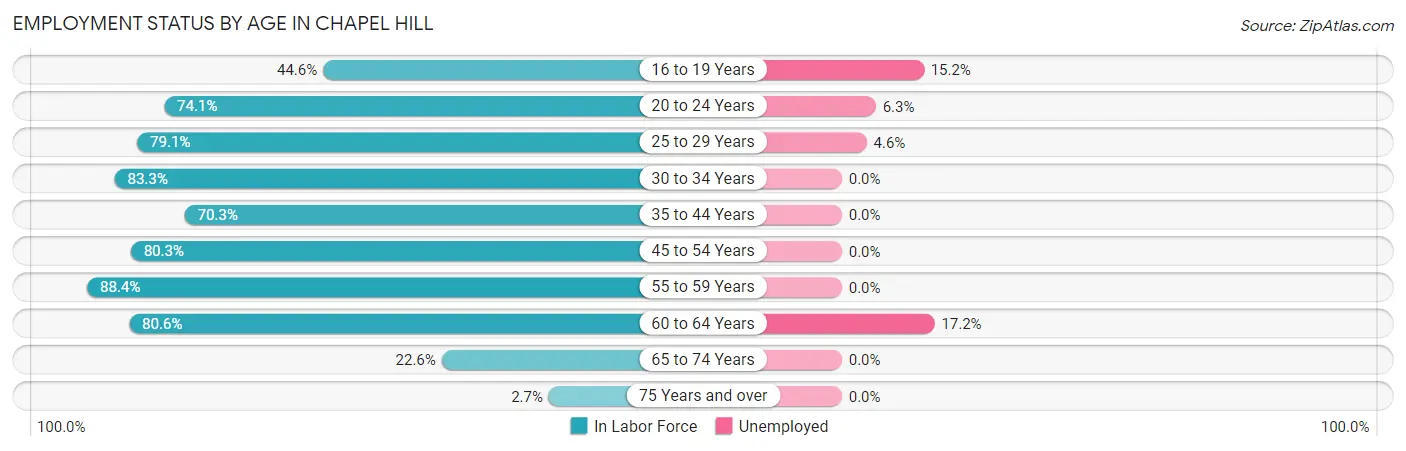
| Age Bracket | In Labor Force | Unemployed |
| 16 to 19 Years | 33 (44.6%) | 5 (15.2%) |
| 20 to 24 Years | 80 (74.1%) | 5 (6.3%) |
| 25 to 29 Years | 87 (79.1%) | 4 (4.6%) |
| 30 to 34 Years | 60 (83.3%) | 0 (0.0%) |
| 35 to 44 Years | 173 (70.3%) | 0 (0.0%) |
| 45 to 54 Years | 244 (80.3%) | 0 (0.0%) |
| 55 to 59 Years | 76 (88.4%) | 0 (0.0%) |
| 60 to 64 Years | 116 (80.6%) | 20 (17.2%) |
| 65 to 74 Years | 35 (22.6%) | 0 (0.0%) |
| 75 Years and over | 3 (2.7%) | 0 (0.0%) |
| Total | 907 (64.4%) | 34 (3.7%) |
Employment Status by Educational Attainment in Chapel Hill
According to labor force statistics for Chapel Hill, 78.6% of individuals (756) out of the total population between 25 and 64 years of age (962) are in the labor force, with 3.2% or 24 of them being unemployed. The group with the highest labor force participation rate are those with the educational attainment of college / associate degree, with 81.7% or 219 individuals in the labor force. Within the labor force, individuals with high school diploma education have the highest percentage of unemployment, with 6.3% or 24 of them being unemployed.
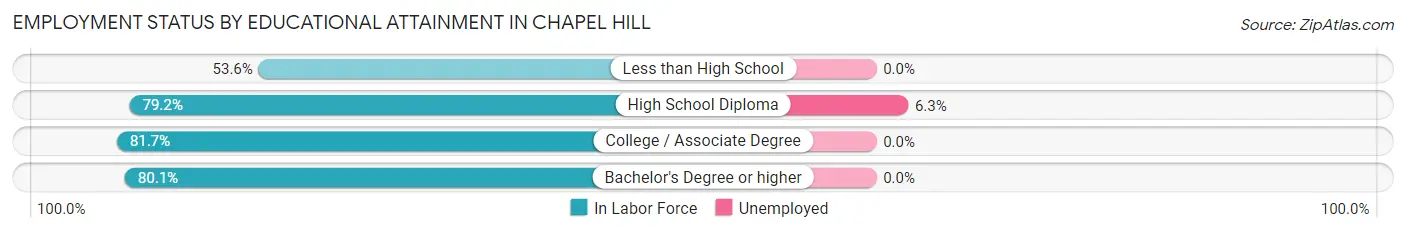
| Educational Attainment | In Labor Force | Unemployed |
| Less than High School | 30 (53.6%) | 0 (0.0%) |
| High School Diploma | 378 (79.2%) | 30 (6.3%) |
| College / Associate Degree | 219 (81.7%) | 0 (0.0%) |
| Bachelor's Degree or higher | 129 (80.1%) | 0 (0.0%) |
| Total | 756 (78.6%) | 31 (3.2%) |
Employment Occupations by Sex in Chapel Hill
Management, Business, Science and Arts Occupations
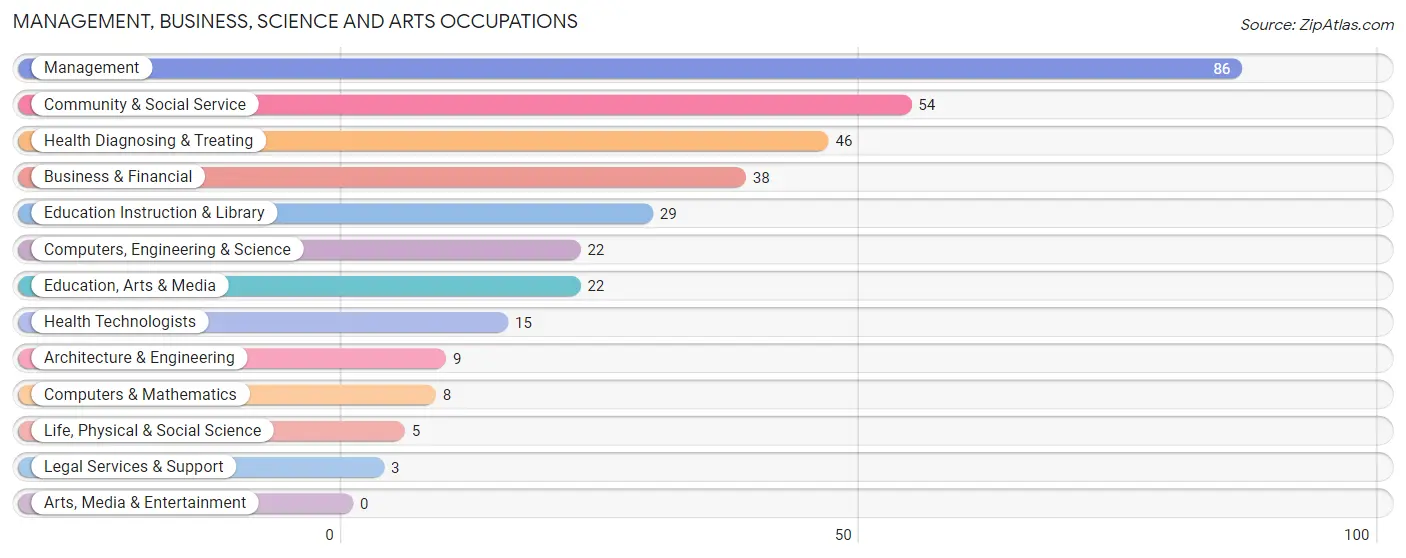
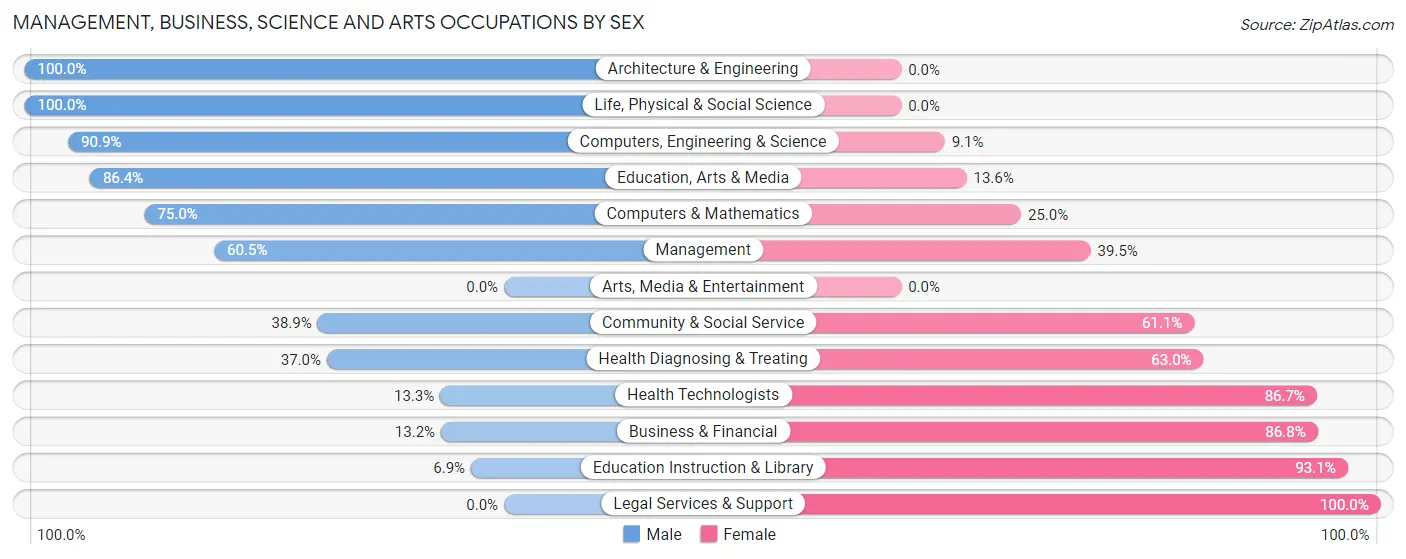
The most common Management, Business, Science and Arts occupations in Chapel Hill are Management (86 | 9.9%), Community & Social Service (54 | 6.2%), Health Diagnosing & Treating (46 | 5.3%), Business & Financial (38 | 4.3%), and Education Instruction & Library (29 | 3.3%).
Management, Business, Science and Arts Occupations by Sex
Within the Management, Business, Science and Arts occupations in Chapel Hill, the most male-oriented occupations are Architecture & Engineering (100.0%), Life, Physical & Social Science (100.0%), and Computers, Engineering & Science (90.9%), while the most female-oriented occupations are Legal Services & Support (100.0%), Education Instruction & Library (93.1%), and Business & Financial (86.8%).
| Occupation | Male | Female |
| Management | 52 (60.5%) | 34 (39.5%) |
| Business & Financial | 5 (13.2%) | 33 (86.8%) |
| Computers, Engineering & Science | 20 (90.9%) | 2 (9.1%) |
| Computers & Mathematics | 6 (75.0%) | 2 (25.0%) |
| Architecture & Engineering | 9 (100.0%) | 0 (0.0%) |
| Life, Physical & Social Science | 5 (100.0%) | 0 (0.0%) |
| Community & Social Service | 21 (38.9%) | 33 (61.1%) |
| Education, Arts & Media | 19 (86.4%) | 3 (13.6%) |
| Legal Services & Support | 0 (0.0%) | 3 (100.0%) |
| Education Instruction & Library | 2 (6.9%) | 27 (93.1%) |
| Arts, Media & Entertainment | 0 (0.0%) | 0 (0.0%) |
| Health Diagnosing & Treating | 17 (37.0%) | 29 (63.0%) |
| Health Technologists | 2 (13.3%) | 13 (86.7%) |
| Total (Category) | 115 (46.8%) | 131 (53.2%) |
| Total (Overall) | 522 (59.8%) | 351 (40.2%) |
Services Occupations
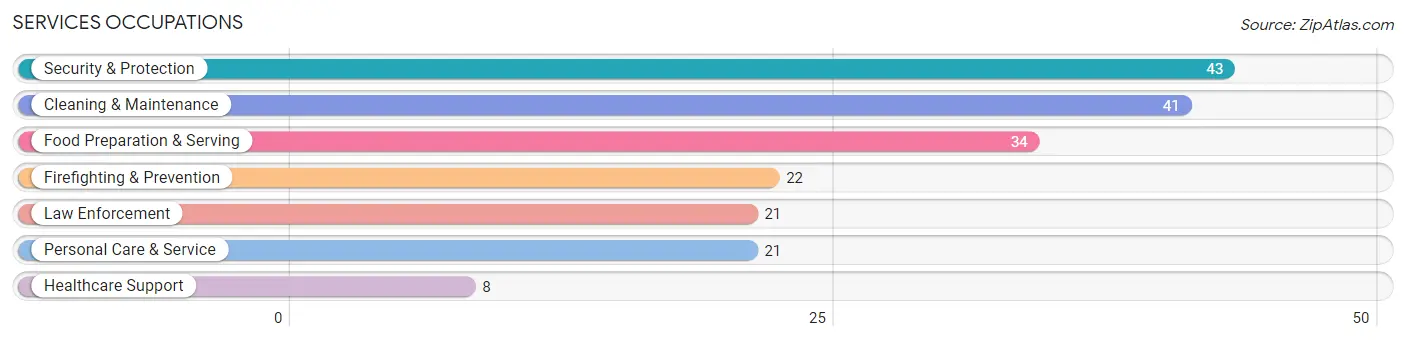
The most common Services occupations in Chapel Hill are Security & Protection (43 | 4.9%), Cleaning & Maintenance (41 | 4.7%), Food Preparation & Serving (34 | 3.9%), Firefighting & Prevention (22 | 2.5%), and Law Enforcement (21 | 2.4%).
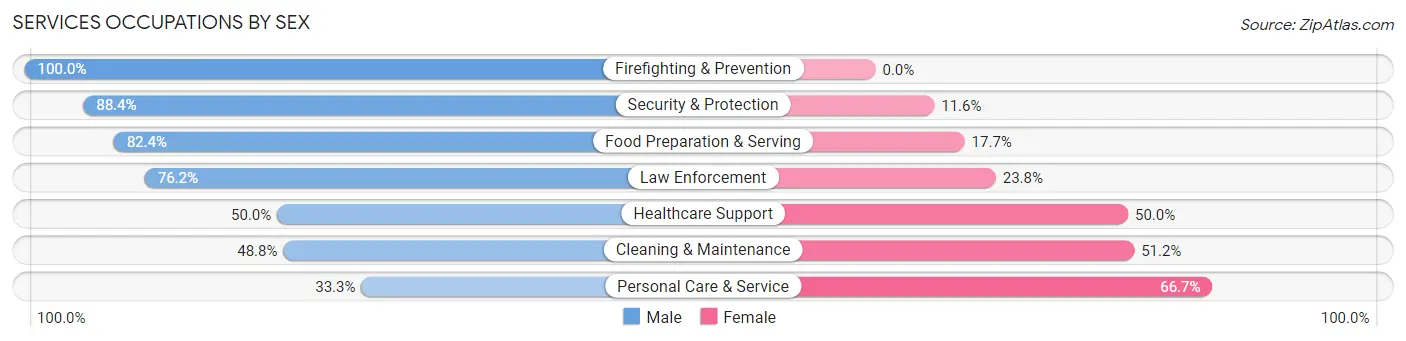
Services Occupations by Sex
Within the Services occupations in Chapel Hill, the most male-oriented occupations are Firefighting & Prevention (100.0%), Security & Protection (88.4%), and Food Preparation & Serving (82.4%), while the most female-oriented occupations are Personal Care & Service (66.7%), Cleaning & Maintenance (51.2%), and Healthcare Support (50.0%).
| Occupation | Male | Female |
| Healthcare Support | 4 (50.0%) | 4 (50.0%) |
| Security & Protection | 38 (88.4%) | 5 (11.6%) |
| Firefighting & Prevention | 22 (100.0%) | 0 (0.0%) |
| Law Enforcement | 16 (76.2%) | 5 (23.8%) |
| Food Preparation & Serving | 28 (82.4%) | 6 (17.6%) |
| Cleaning & Maintenance | 20 (48.8%) | 21 (51.2%) |
| Personal Care & Service | 7 (33.3%) | 14 (66.7%) |
| Total (Category) | 97 (66.0%) | 50 (34.0%) |
| Total (Overall) | 522 (59.8%) | 351 (40.2%) |
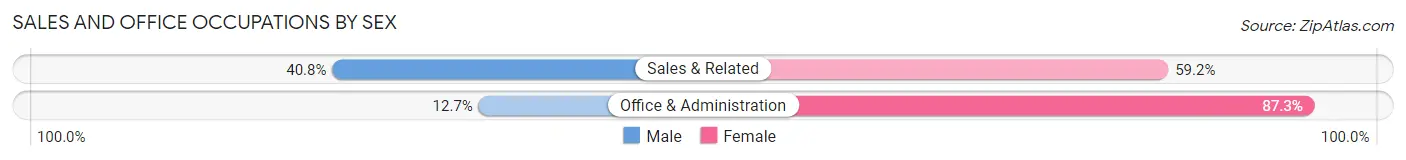
Sales and Office Occupations
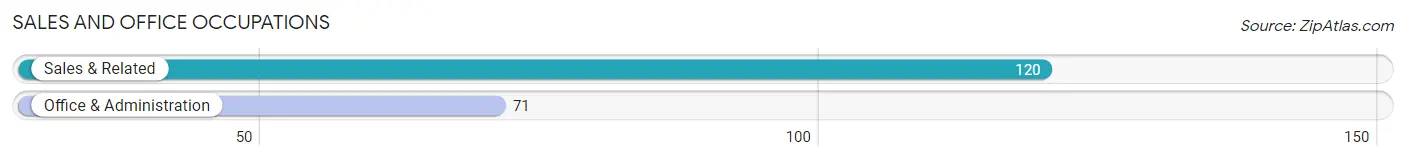
The most common Sales and Office occupations in Chapel Hill are Sales & Related (120 | 13.8%), and Office & Administration (71 | 8.1%).
Sales and Office Occupations by Sex
| Occupation | Male | Female |
| Sales & Related | 49 (40.8%) | 71 (59.2%) |
| Office & Administration | 9 (12.7%) | 62 (87.3%) |
| Total (Category) | 58 (30.4%) | 133 (69.6%) |
| Total (Overall) | 522 (59.8%) | 351 (40.2%) |
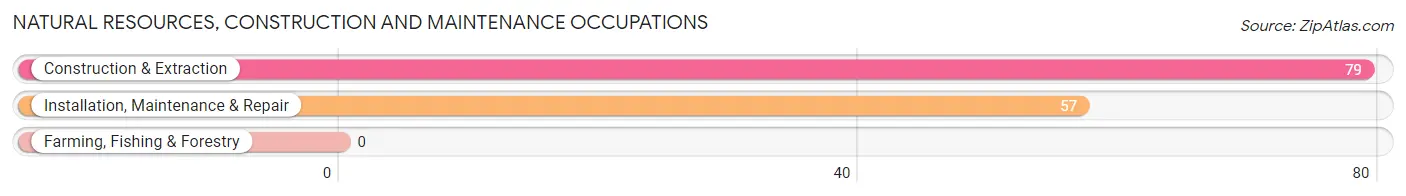
Natural Resources, Construction and Maintenance Occupations
The most common Natural Resources, Construction and Maintenance occupations in Chapel Hill are Construction & Extraction (79 | 9.0%), and Installation, Maintenance & Repair (57 | 6.5%).
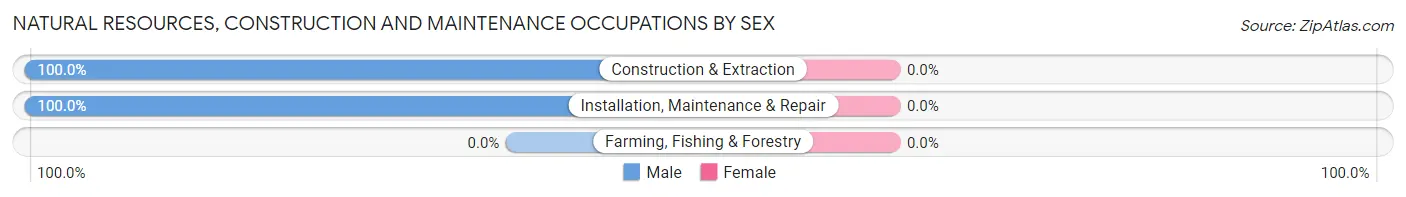
Natural Resources, Construction and Maintenance Occupations by Sex
| Occupation | Male | Female |
| Farming, Fishing & Forestry | 0 (0.0%) | 0 (0.0%) |
| Construction & Extraction | 79 (100.0%) | 0 (0.0%) |
| Installation, Maintenance & Repair | 57 (100.0%) | 0 (0.0%) |
| Total (Category) | 136 (100.0%) | 0 (0.0%) |
| Total (Overall) | 522 (59.8%) | 351 (40.2%) |
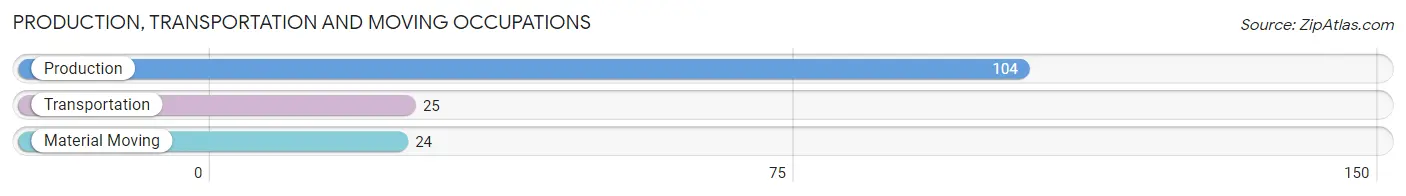
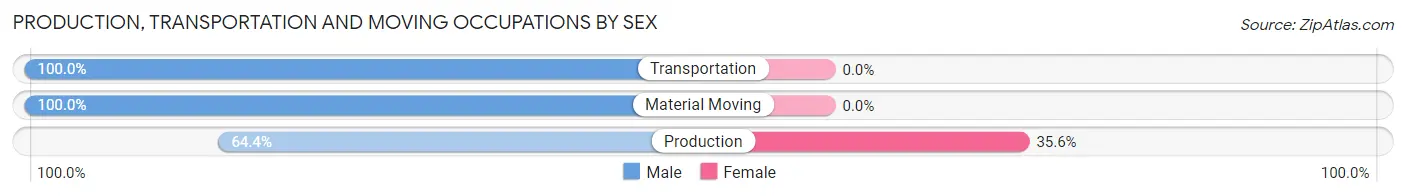
Production, Transportation and Moving Occupations
The most common Production, Transportation and Moving occupations in Chapel Hill are Production (104 | 11.9%), Transportation (25 | 2.9%), and Material Moving (24 | 2.8%).
Production, Transportation and Moving Occupations by Sex
| Occupation | Male | Female |
| Production | 67 (64.4%) | 37 (35.6%) |
| Transportation | 25 (100.0%) | 0 (0.0%) |
| Material Moving | 24 (100.0%) | 0 (0.0%) |
| Total (Category) | 116 (75.8%) | 37 (24.2%) |
| Total (Overall) | 522 (59.8%) | 351 (40.2%) |
Employment Industries by Sex in Chapel Hill
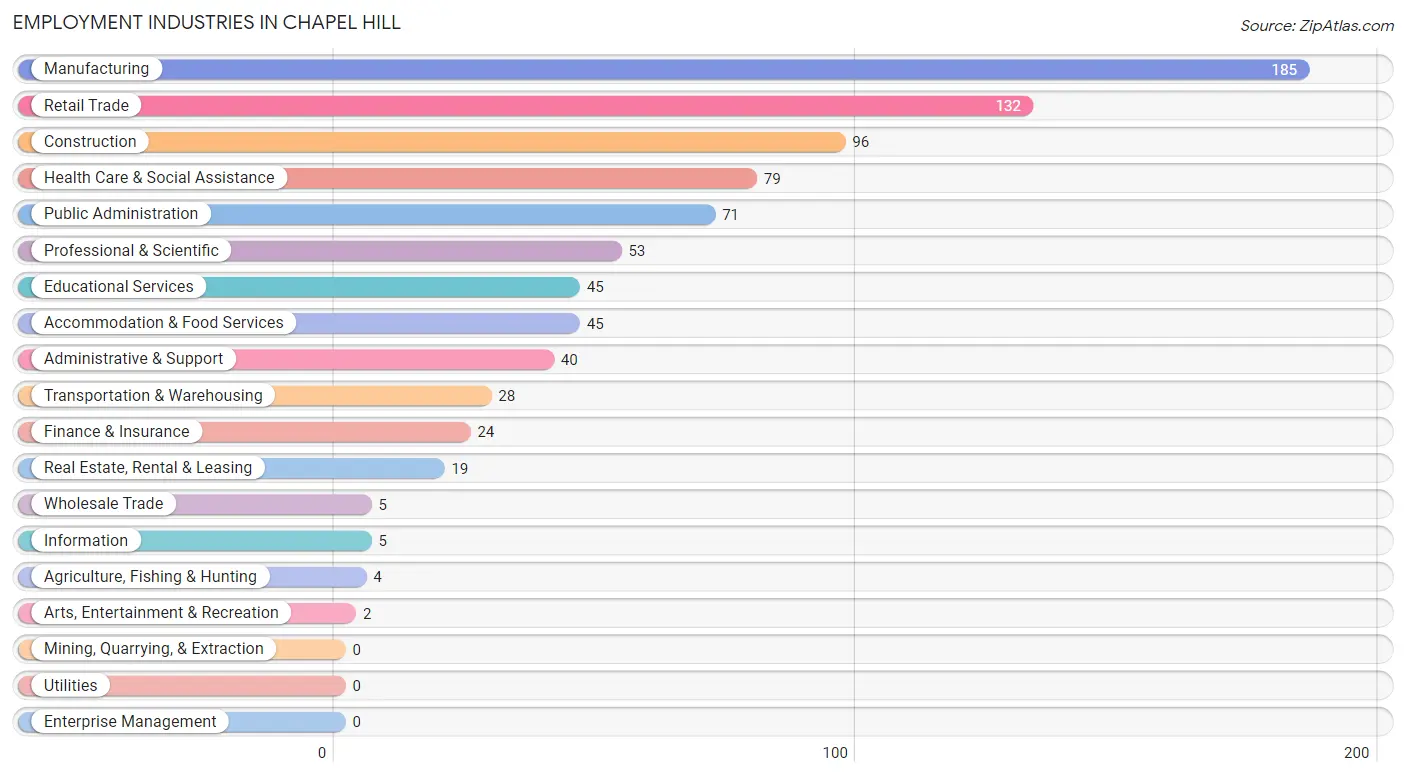
Employment Industries in Chapel Hill
The major employment industries in Chapel Hill include Manufacturing (185 | 21.2%), Retail Trade (132 | 15.1%), Construction (96 | 11.0%), Health Care & Social Assistance (79 | 9.0%), and Public Administration (71 | 8.1%).
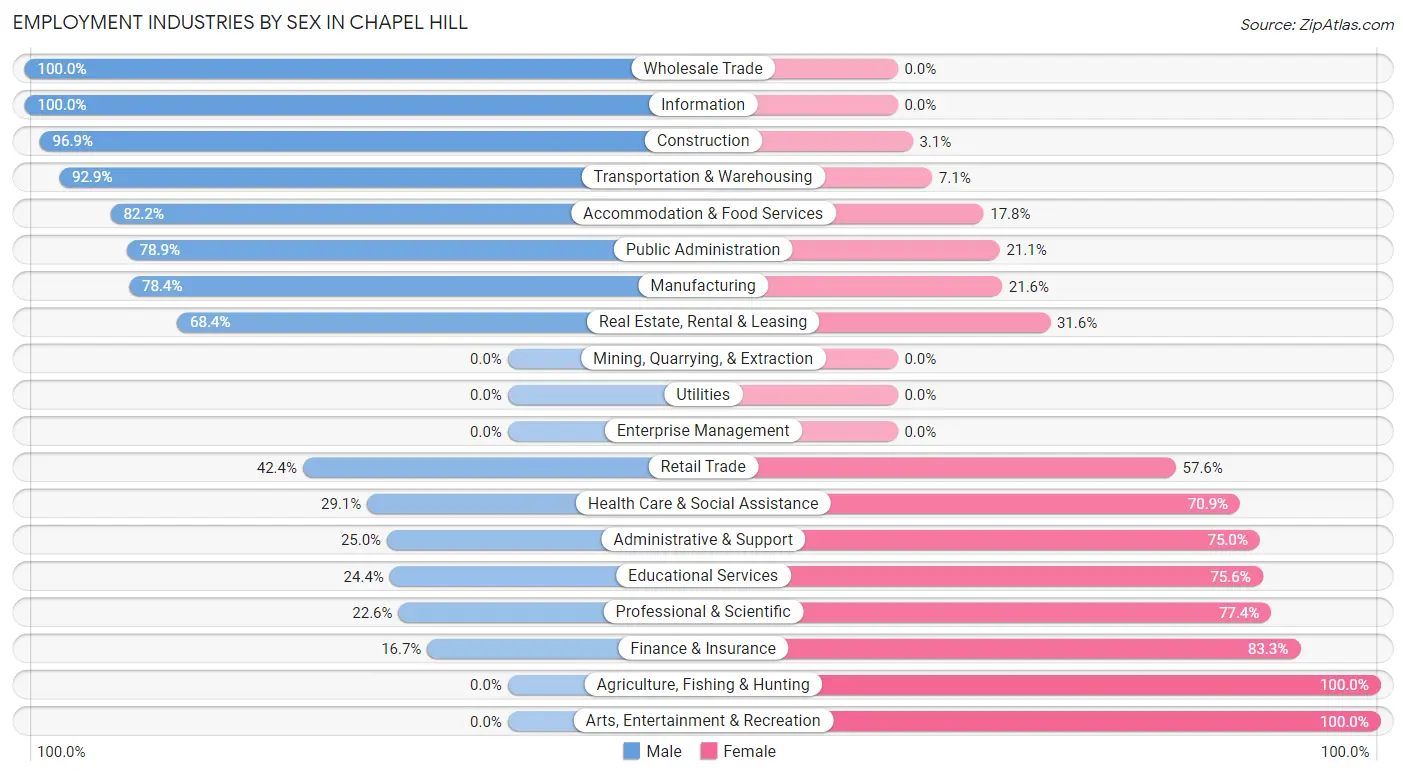
Employment Industries by Sex in Chapel Hill
The Chapel Hill industries that see more men than women are Wholesale Trade (100.0%), Information (100.0%), and Construction (96.9%), whereas the industries that tend to have a higher number of women are Agriculture, Fishing & Hunting (100.0%), Arts, Entertainment & Recreation (100.0%), and Finance & Insurance (83.3%).
| Industry | Male | Female |
| Agriculture, Fishing & Hunting | 0 (0.0%) | 4 (100.0%) |
| Mining, Quarrying, & Extraction | 0 (0.0%) | 0 (0.0%) |
| Construction | 93 (96.9%) | 3 (3.1%) |
| Manufacturing | 145 (78.4%) | 40 (21.6%) |
| Wholesale Trade | 5 (100.0%) | 0 (0.0%) |
| Retail Trade | 56 (42.4%) | 76 (57.6%) |
| Transportation & Warehousing | 26 (92.9%) | 2 (7.1%) |
| Utilities | 0 (0.0%) | 0 (0.0%) |
| Information | 5 (100.0%) | 0 (0.0%) |
| Finance & Insurance | 4 (16.7%) | 20 (83.3%) |
| Real Estate, Rental & Leasing | 13 (68.4%) | 6 (31.6%) |
| Professional & Scientific | 12 (22.6%) | 41 (77.4%) |
| Enterprise Management | 0 (0.0%) | 0 (0.0%) |
| Administrative & Support | 10 (25.0%) | 30 (75.0%) |
| Educational Services | 11 (24.4%) | 34 (75.6%) |
| Health Care & Social Assistance | 23 (29.1%) | 56 (70.9%) |
| Arts, Entertainment & Recreation | 0 (0.0%) | 2 (100.0%) |
| Accommodation & Food Services | 37 (82.2%) | 8 (17.8%) |
| Public Administration | 56 (78.9%) | 15 (21.1%) |
| Total | 522 (59.8%) | 351 (40.2%) |
Education in Chapel Hill
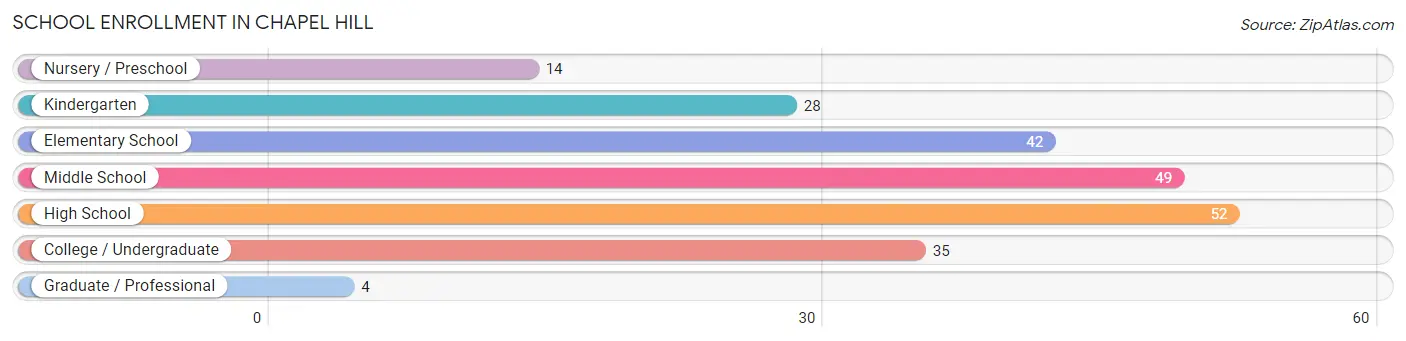
School Enrollment in Chapel Hill
The most common levels of schooling among the 224 students in Chapel Hill are high school (52 | 23.2%), middle school (49 | 21.9%), and elementary school (42 | 18.8%).
| School Level | # Students | % Students |
| Nursery / Preschool | 14 | 6.2% |
| Kindergarten | 28 | 12.5% |
| Elementary School | 42 | 18.8% |
| Middle School | 49 | 21.9% |
| High School | 52 | 23.2% |
| College / Undergraduate | 35 | 15.6% |
| Graduate / Professional | 4 | 1.8% |
| Total | 224 | 100.0% |
School Enrollment by Age by Funding Source in Chapel Hill
Out of a total of 224 students who are enrolled in schools in Chapel Hill, 28 (12.5%) attend a private institution, while the remaining 196 (87.5%) are enrolled in public schools. The age group of 3 to 4 year olds has the highest likelihood of being enrolled in private schools, with 11 (50.0% in the age bracket) enrolled. Conversely, the age group of 10 to 14 year olds has the lowest likelihood of being enrolled in a private school, with 64 (100.0% in the age bracket) attending a public institution.
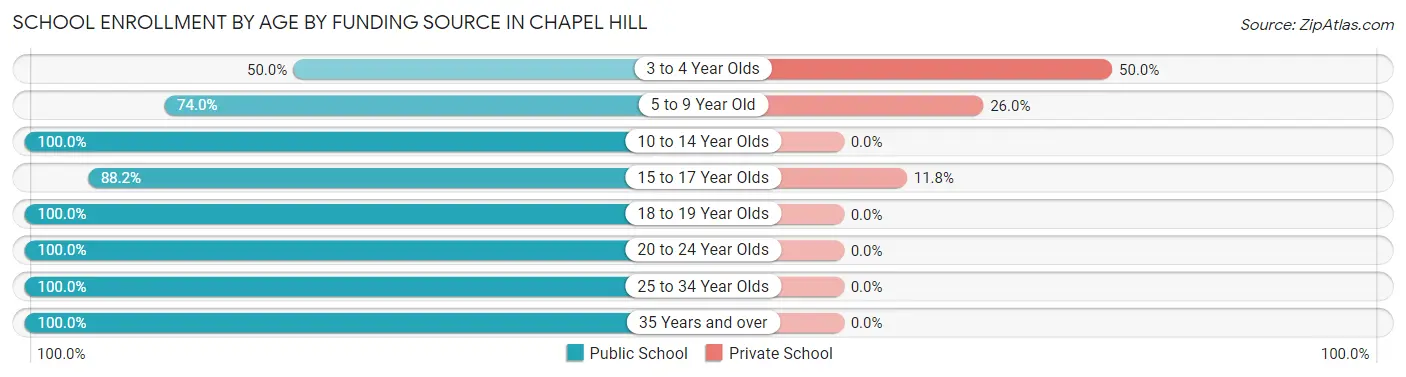
| Age Bracket | Public School | Private School |
| 3 to 4 Year Olds | 11 (50.0%) | 11 (50.0%) |
| 5 to 9 Year Old | 37 (74.0%) | 13 (26.0%) |
| 10 to 14 Year Olds | 64 (100.0%) | 0 (0.0%) |
| 15 to 17 Year Olds | 30 (88.2%) | 4 (11.8%) |
| 18 to 19 Year Olds | 27 (100.0%) | 0 (0.0%) |
| 20 to 24 Year Olds | 15 (100.0%) | 0 (0.0%) |
| 25 to 34 Year Olds | 3 (100.0%) | 0 (0.0%) |
| 35 Years and over | 9 (100.0%) | 0 (0.0%) |
| Total | 196 (87.5%) | 28 (12.5%) |
Educational Attainment by Field of Study in Chapel Hill
Business (56 | 26.4%), education (40 | 18.9%), science & technology (31 | 14.6%), literature & languages (22 | 10.4%), and bio, nature & agricultural (19 | 9.0%) are the most common fields of study among 212 individuals in Chapel Hill who have obtained a bachelor's degree or higher.
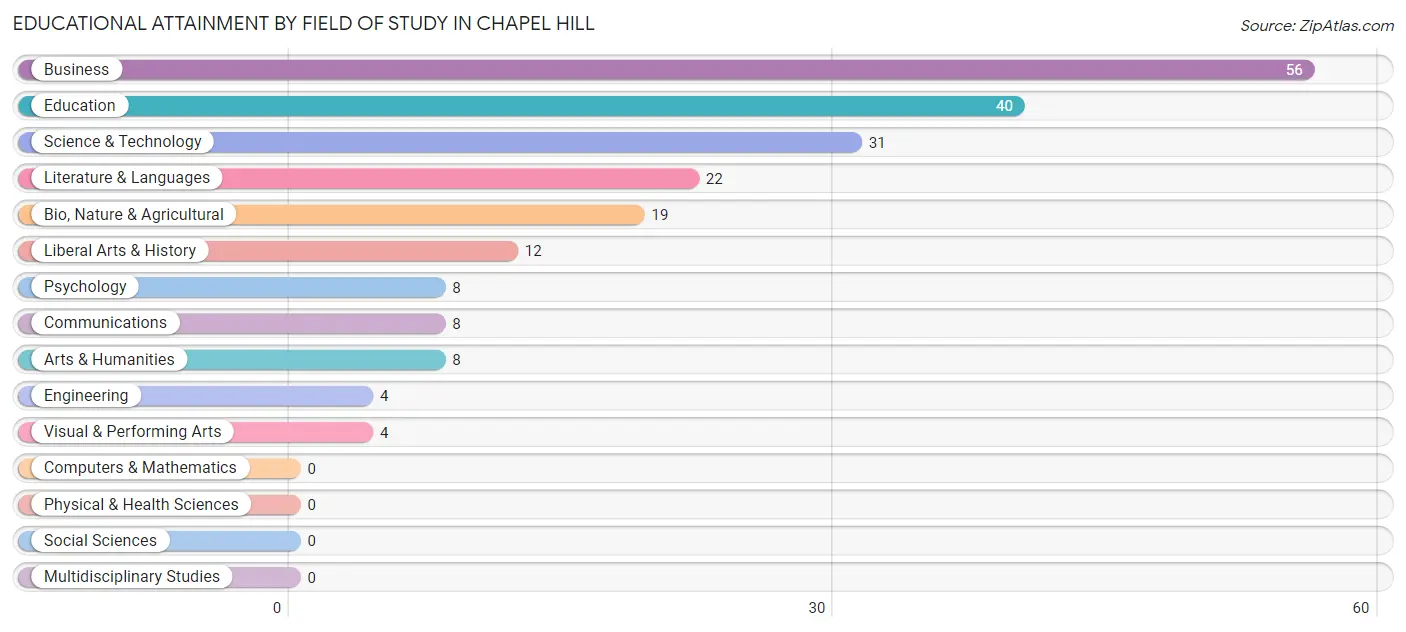
| Field of Study | # Graduates | % Graduates |
| Computers & Mathematics | 0 | 0.0% |
| Bio, Nature & Agricultural | 19 | 9.0% |
| Physical & Health Sciences | 0 | 0.0% |
| Psychology | 8 | 3.8% |
| Social Sciences | 0 | 0.0% |
| Engineering | 4 | 1.9% |
| Multidisciplinary Studies | 0 | 0.0% |
| Science & Technology | 31 | 14.6% |
| Business | 56 | 26.4% |
| Education | 40 | 18.9% |
| Literature & Languages | 22 | 10.4% |
| Liberal Arts & History | 12 | 5.7% |
| Visual & Performing Arts | 4 | 1.9% |
| Communications | 8 | 3.8% |
| Arts & Humanities | 8 | 3.8% |
| Total | 212 | 100.0% |
Transportation & Commute in Chapel Hill
Vehicle Availability by Sex in Chapel Hill
The most prevalent vehicle ownership categories in Chapel Hill are males with 2 vehicles (216, accounting for 42.9%) and females with 2 vehicles (115, making up 62.3%).
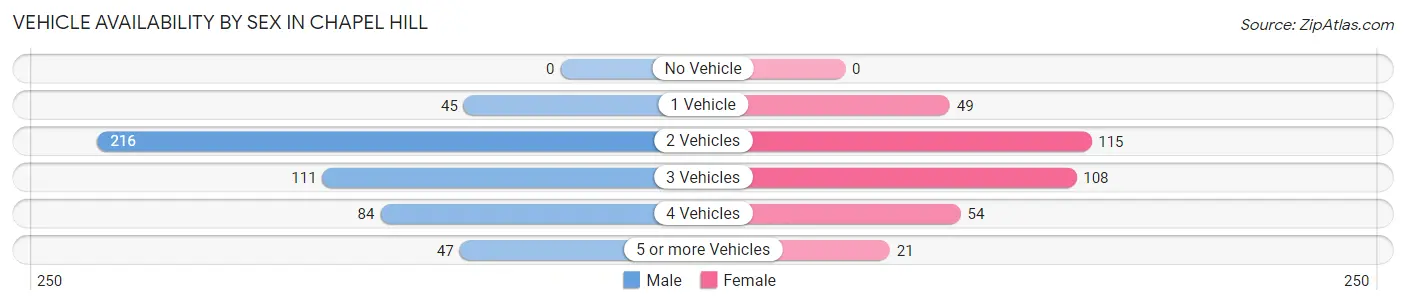
| Vehicles Available | Male | Female |
| No Vehicle | 0 (0.0%) | 0 (0.0%) |
| 1 Vehicle | 45 (8.9%) | 49 (14.1%) |
| 2 Vehicles | 216 (42.9%) | 115 (33.1%) |
| 3 Vehicles | 111 (22.1%) | 108 (31.1%) |
| 4 Vehicles | 84 (16.7%) | 54 (15.6%) |
| 5 or more Vehicles | 47 (9.3%) | 21 (6.0%) |
| Total | 503 (100.0%) | 347 (100.0%) |
Commute Time in Chapel Hill
The most frequently occuring commute durations in Chapel Hill are 45 to 59 minutes (178 commuters, 21.7%), 30 to 34 minutes (138 commuters, 16.8%), and 40 to 44 minutes (123 commuters, 15.0%).
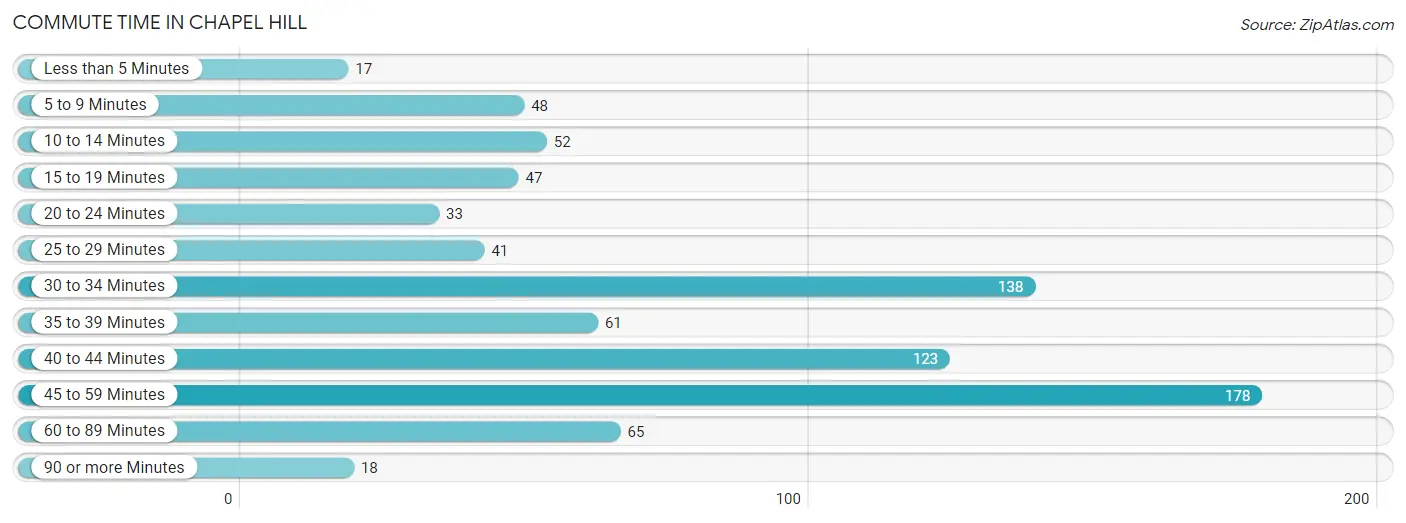
| Commute Time | # Commuters | % Commuters |
| Less than 5 Minutes | 17 | 2.1% |
| 5 to 9 Minutes | 48 | 5.9% |
| 10 to 14 Minutes | 52 | 6.3% |
| 15 to 19 Minutes | 47 | 5.7% |
| 20 to 24 Minutes | 33 | 4.0% |
| 25 to 29 Minutes | 41 | 5.0% |
| 30 to 34 Minutes | 138 | 16.8% |
| 35 to 39 Minutes | 61 | 7.4% |
| 40 to 44 Minutes | 123 | 15.0% |
| 45 to 59 Minutes | 178 | 21.7% |
| 60 to 89 Minutes | 65 | 7.9% |
| 90 or more Minutes | 18 | 2.2% |
Commute Time by Sex in Chapel Hill
The most common commute times in Chapel Hill are 45 to 59 minutes (113 commuters, 22.6%) for males and 45 to 59 minutes (65 commuters, 20.3%) for females.
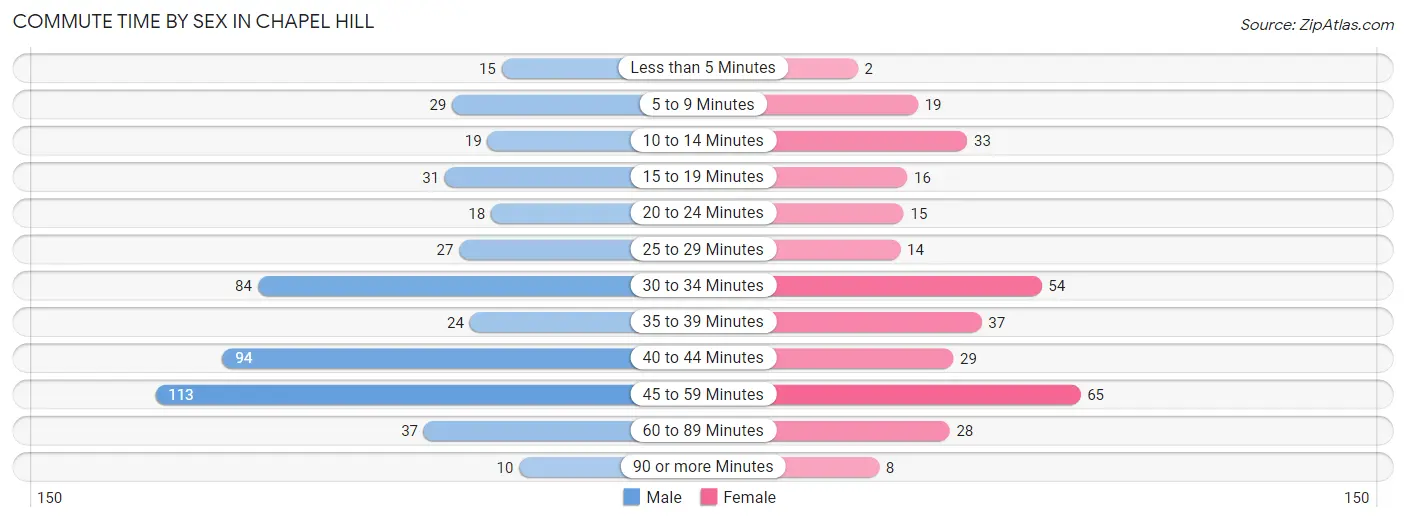
| Commute Time | Male | Female |
| Less than 5 Minutes | 15 (3.0%) | 2 (0.6%) |
| 5 to 9 Minutes | 29 (5.8%) | 19 (5.9%) |
| 10 to 14 Minutes | 19 (3.8%) | 33 (10.3%) |
| 15 to 19 Minutes | 31 (6.2%) | 16 (5.0%) |
| 20 to 24 Minutes | 18 (3.6%) | 15 (4.7%) |
| 25 to 29 Minutes | 27 (5.4%) | 14 (4.4%) |
| 30 to 34 Minutes | 84 (16.8%) | 54 (16.9%) |
| 35 to 39 Minutes | 24 (4.8%) | 37 (11.6%) |
| 40 to 44 Minutes | 94 (18.8%) | 29 (9.1%) |
| 45 to 59 Minutes | 113 (22.6%) | 65 (20.3%) |
| 60 to 89 Minutes | 37 (7.4%) | 28 (8.7%) |
| 90 or more Minutes | 10 (2.0%) | 8 (2.5%) |
Time of Departure to Work by Sex in Chapel Hill
The most frequent times of departure to work in Chapel Hill are 6:00 AM to 6:29 AM (110, 22.0%) for males and 6:30 AM to 6:59 AM (58, 18.1%) for females.
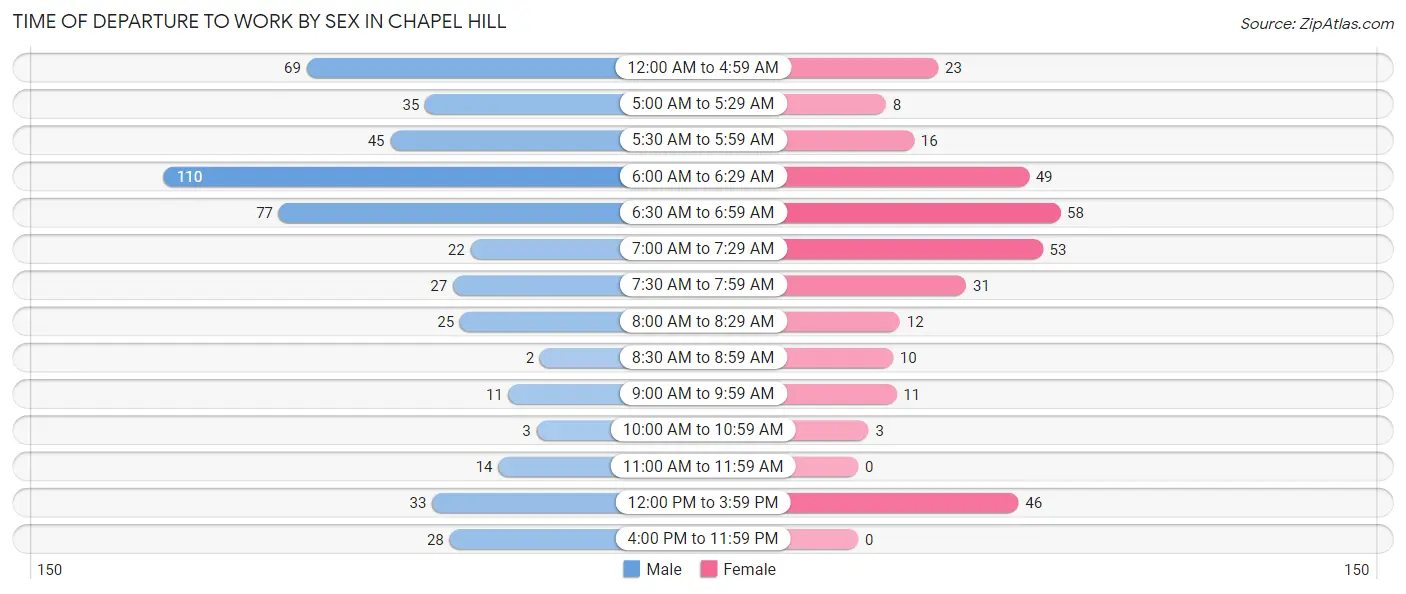
| Time of Departure | Male | Female |
| 12:00 AM to 4:59 AM | 69 (13.8%) | 23 (7.2%) |
| 5:00 AM to 5:29 AM | 35 (7.0%) | 8 (2.5%) |
| 5:30 AM to 5:59 AM | 45 (9.0%) | 16 (5.0%) |
| 6:00 AM to 6:29 AM | 110 (22.0%) | 49 (15.3%) |
| 6:30 AM to 6:59 AM | 77 (15.4%) | 58 (18.1%) |
| 7:00 AM to 7:29 AM | 22 (4.4%) | 53 (16.6%) |
| 7:30 AM to 7:59 AM | 27 (5.4%) | 31 (9.7%) |
| 8:00 AM to 8:29 AM | 25 (5.0%) | 12 (3.7%) |
| 8:30 AM to 8:59 AM | 2 (0.4%) | 10 (3.1%) |
| 9:00 AM to 9:59 AM | 11 (2.2%) | 11 (3.4%) |
| 10:00 AM to 10:59 AM | 3 (0.6%) | 3 (0.9%) |
| 11:00 AM to 11:59 AM | 14 (2.8%) | 0 (0.0%) |
| 12:00 PM to 3:59 PM | 33 (6.6%) | 46 (14.4%) |
| 4:00 PM to 11:59 PM | 28 (5.6%) | 0 (0.0%) |
| Total | 501 (100.0%) | 320 (100.0%) |
Housing Occupancy in Chapel Hill
Occupancy by Ownership in Chapel Hill
Of the total 692 dwellings in Chapel Hill, owner-occupied units account for 583 (84.3%), while renter-occupied units make up 109 (15.8%).
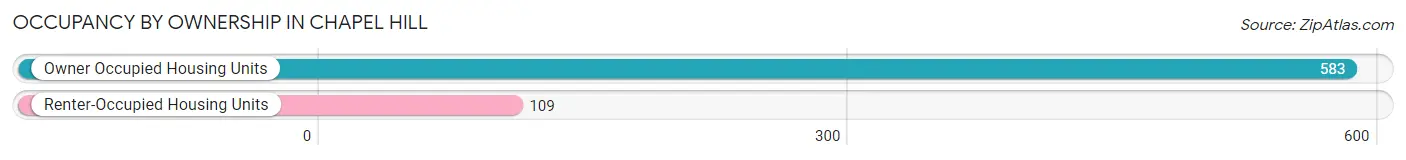
| Occupancy | # Housing Units | % Housing Units |
| Owner Occupied Housing Units | 583 | 84.3% |
| Renter-Occupied Housing Units | 109 | 15.8% |
| Total Occupied Housing Units | 692 | 100.0% |
Occupancy by Household Size in Chapel Hill
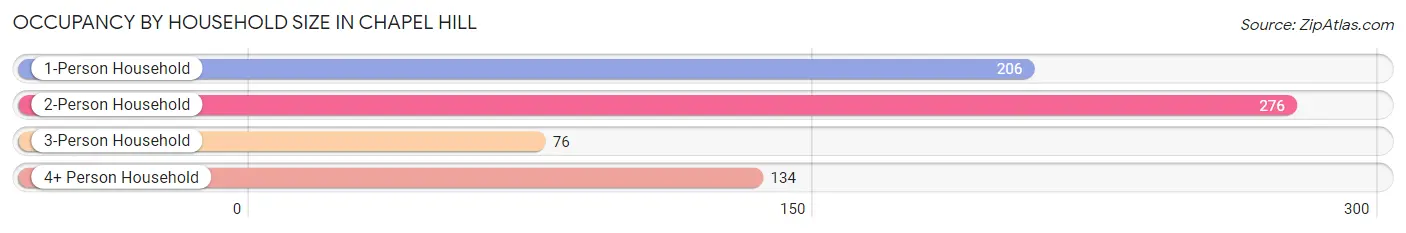
| Household Size | # Housing Units | % Housing Units |
| 1-Person Household | 206 | 29.8% |
| 2-Person Household | 276 | 39.9% |
| 3-Person Household | 76 | 11.0% |
| 4+ Person Household | 134 | 19.4% |
| Total Housing Units | 692 | 100.0% |
Occupancy by Ownership by Household Size in Chapel Hill
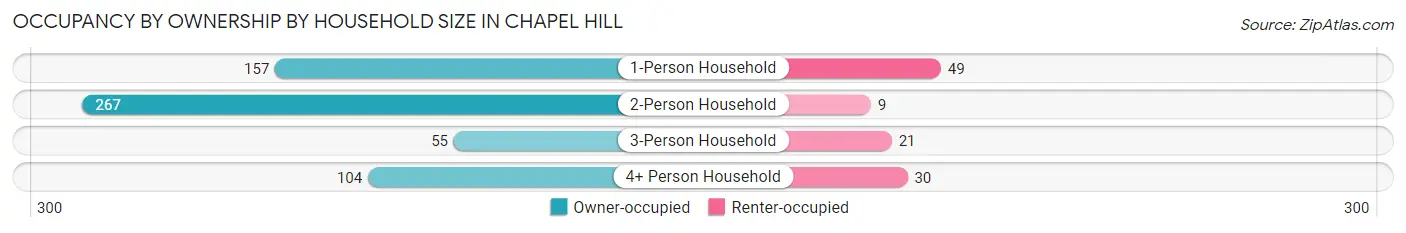
| Household Size | Owner-occupied | Renter-occupied |
| 1-Person Household | 157 (76.2%) | 49 (23.8%) |
| 2-Person Household | 267 (96.7%) | 9 (3.3%) |
| 3-Person Household | 55 (72.4%) | 21 (27.6%) |
| 4+ Person Household | 104 (77.6%) | 30 (22.4%) |
| Total Housing Units | 583 (84.3%) | 109 (15.8%) |
Occupancy by Educational Attainment in Chapel Hill
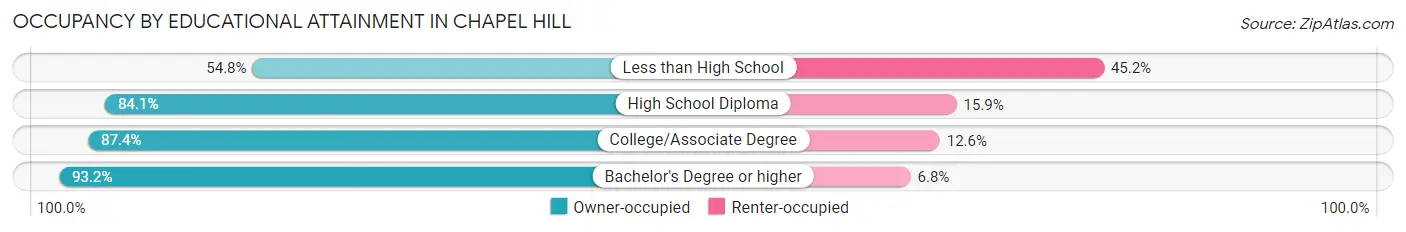
| Household Size | Owner-occupied | Renter-occupied |
| Less than High School | 34 (54.8%) | 28 (45.2%) |
| High School Diploma | 232 (84.1%) | 44 (15.9%) |
| College/Associate Degree | 194 (87.4%) | 28 (12.6%) |
| Bachelor's Degree or higher | 123 (93.2%) | 9 (6.8%) |
Occupancy by Age of Householder in Chapel Hill
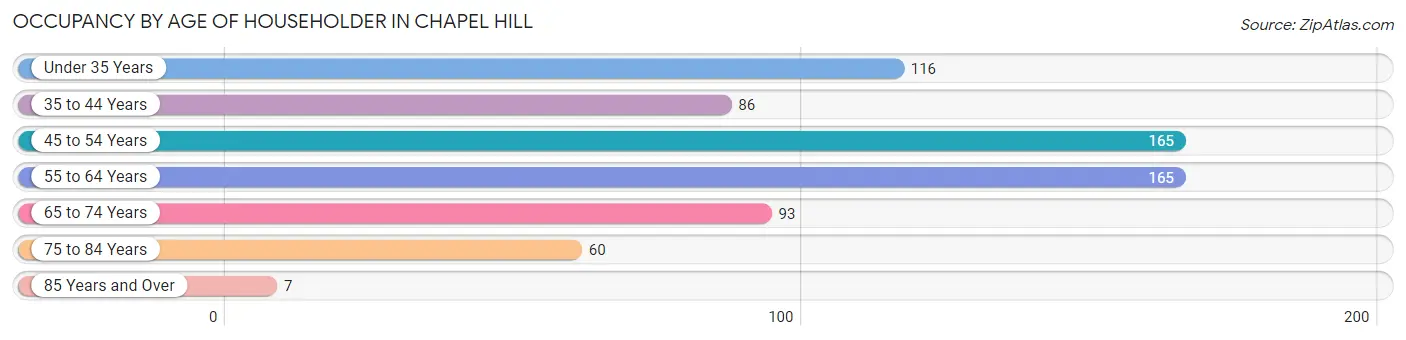
| Age Bracket | # Households | % Households |
| Under 35 Years | 116 | 16.8% |
| 35 to 44 Years | 86 | 12.4% |
| 45 to 54 Years | 165 | 23.8% |
| 55 to 64 Years | 165 | 23.8% |
| 65 to 74 Years | 93 | 13.4% |
| 75 to 84 Years | 60 | 8.7% |
| 85 Years and Over | 7 | 1.0% |
| Total | 692 | 100.0% |
Housing Finances in Chapel Hill
Median Income by Occupancy in Chapel Hill
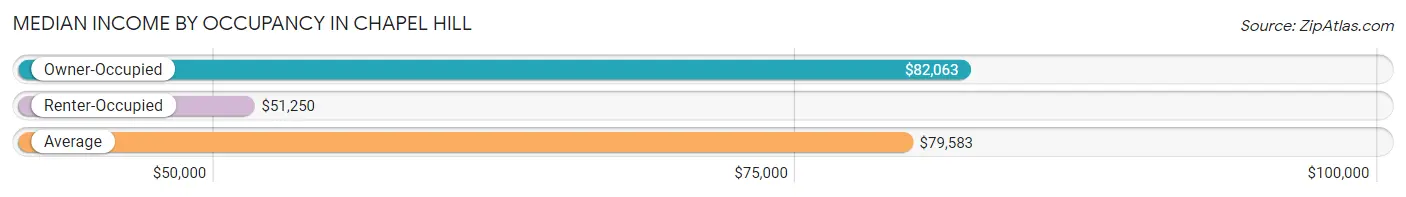
| Occupancy Type | # Households | Median Income |
| Owner-Occupied | 583 (84.3%) | $82,063 |
| Renter-Occupied | 109 (15.8%) | $51,250 |
| Average | 692 (100.0%) | $79,583 |
Occupancy by Householder Income Bracket in Chapel Hill
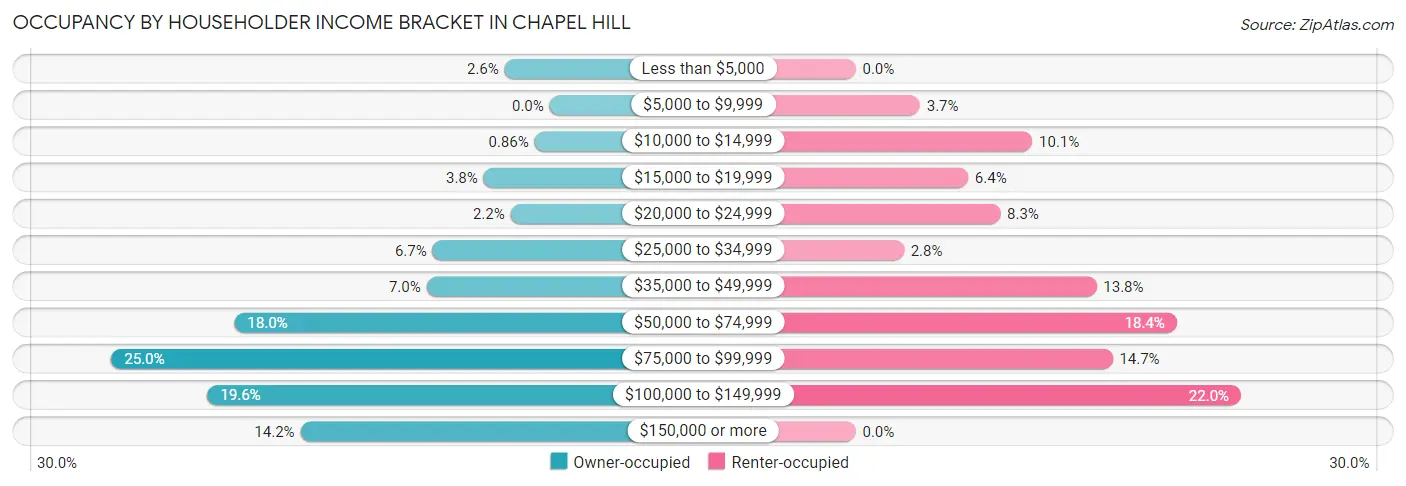
| Income Bracket | Owner-occupied | Renter-occupied |
| Less than $5,000 | 15 (2.6%) | 0 (0.0%) |
| $5,000 to $9,999 | 0 (0.0%) | 4 (3.7%) |
| $10,000 to $14,999 | 5 (0.9%) | 11 (10.1%) |
| $15,000 to $19,999 | 22 (3.8%) | 7 (6.4%) |
| $20,000 to $24,999 | 13 (2.2%) | 9 (8.3%) |
| $25,000 to $34,999 | 39 (6.7%) | 3 (2.8%) |
| $35,000 to $49,999 | 41 (7.0%) | 15 (13.8%) |
| $50,000 to $74,999 | 105 (18.0%) | 20 (18.3%) |
| $75,000 to $99,999 | 146 (25.0%) | 16 (14.7%) |
| $100,000 to $149,999 | 114 (19.6%) | 24 (22.0%) |
| $150,000 or more | 83 (14.2%) | 0 (0.0%) |
| Total | 583 (100.0%) | 109 (100.0%) |
Monthly Housing Cost Tiers in Chapel Hill
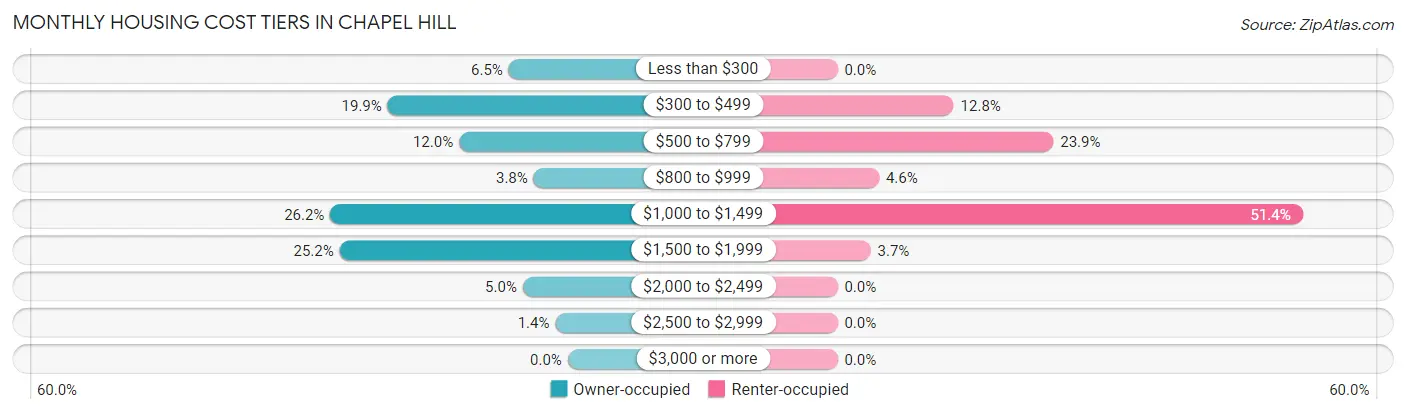
| Monthly Cost | Owner-occupied | Renter-occupied |
| Less than $300 | 38 (6.5%) | 0 (0.0%) |
| $300 to $499 | 116 (19.9%) | 14 (12.8%) |
| $500 to $799 | 70 (12.0%) | 26 (23.8%) |
| $800 to $999 | 22 (3.8%) | 5 (4.6%) |
| $1,000 to $1,499 | 153 (26.2%) | 56 (51.4%) |
| $1,500 to $1,999 | 147 (25.2%) | 4 (3.7%) |
| $2,000 to $2,499 | 29 (5.0%) | 0 (0.0%) |
| $2,500 to $2,999 | 8 (1.4%) | 0 (0.0%) |
| $3,000 or more | 0 (0.0%) | 0 (0.0%) |
| Total | 583 (100.0%) | 109 (100.0%) |
Physical Housing Characteristics in Chapel Hill
Housing Structures in Chapel Hill
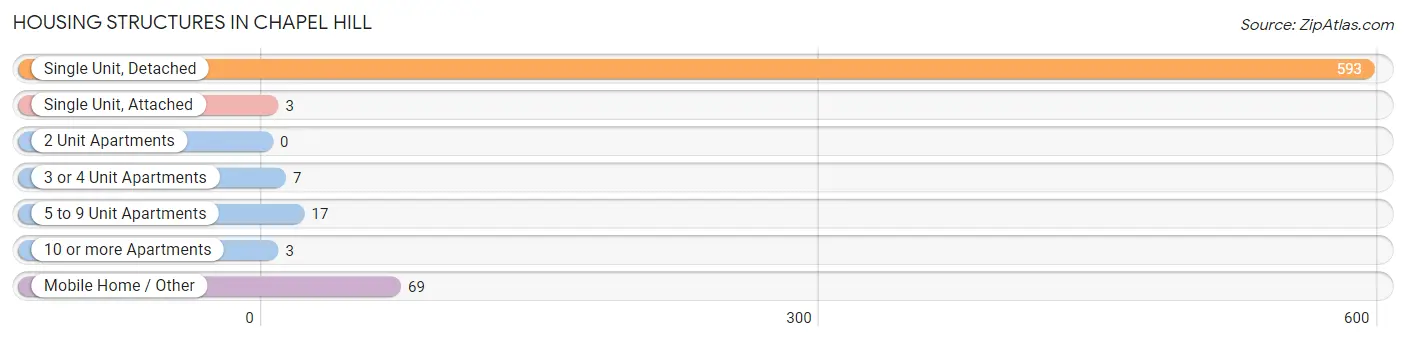
| Structure Type | # Housing Units | % Housing Units |
| Single Unit, Detached | 593 | 85.7% |
| Single Unit, Attached | 3 | 0.4% |
| 2 Unit Apartments | 0 | 0.0% |
| 3 or 4 Unit Apartments | 7 | 1.0% |
| 5 to 9 Unit Apartments | 17 | 2.5% |
| 10 or more Apartments | 3 | 0.4% |
| Mobile Home / Other | 69 | 10.0% |
| Total | 692 | 100.0% |
Housing Structures by Occupancy in Chapel Hill
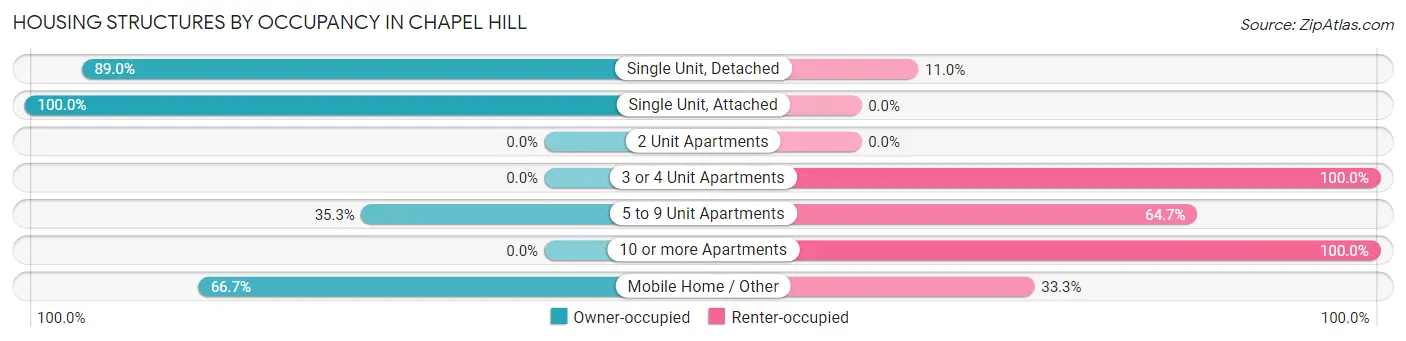
| Structure Type | Owner-occupied | Renter-occupied |
| Single Unit, Detached | 528 (89.0%) | 65 (11.0%) |
| Single Unit, Attached | 3 (100.0%) | 0 (0.0%) |
| 2 Unit Apartments | 0 (0.0%) | 0 (0.0%) |
| 3 or 4 Unit Apartments | 0 (0.0%) | 7 (100.0%) |
| 5 to 9 Unit Apartments | 6 (35.3%) | 11 (64.7%) |
| 10 or more Apartments | 0 (0.0%) | 3 (100.0%) |
| Mobile Home / Other | 46 (66.7%) | 23 (33.3%) |
| Total | 583 (84.3%) | 109 (15.8%) |
Housing Structures by Number of Rooms in Chapel Hill
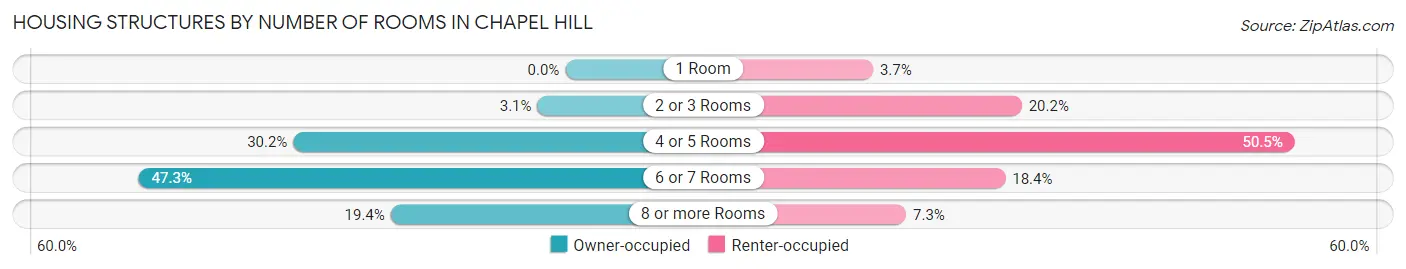
| Number of Rooms | Owner-occupied | Renter-occupied |
| 1 Room | 0 (0.0%) | 4 (3.7%) |
| 2 or 3 Rooms | 18 (3.1%) | 22 (20.2%) |
| 4 or 5 Rooms | 176 (30.2%) | 55 (50.5%) |
| 6 or 7 Rooms | 276 (47.3%) | 20 (18.3%) |
| 8 or more Rooms | 113 (19.4%) | 8 (7.3%) |
| Total | 583 (100.0%) | 109 (100.0%) |
Housing Structure by Heating Type in Chapel Hill
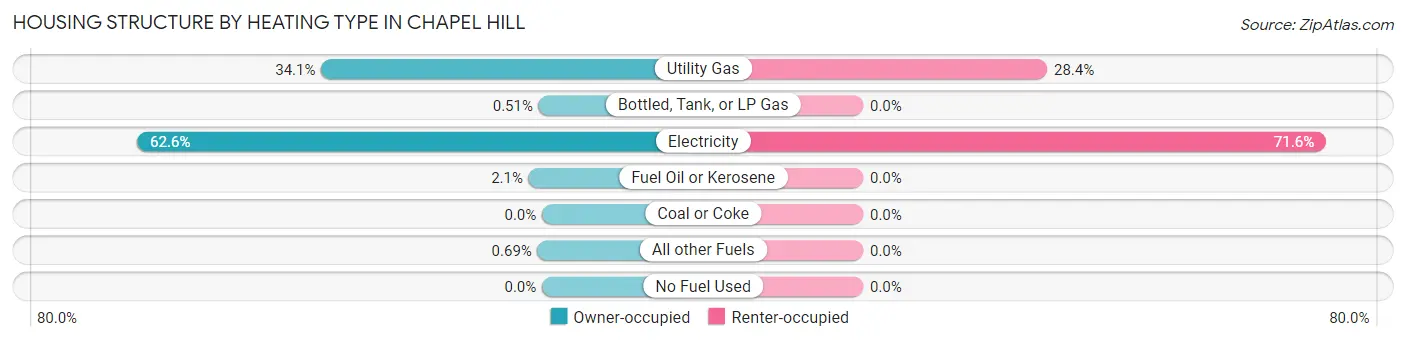
| Heating Type | Owner-occupied | Renter-occupied |
| Utility Gas | 199 (34.1%) | 31 (28.4%) |
| Bottled, Tank, or LP Gas | 3 (0.5%) | 0 (0.0%) |
| Electricity | 365 (62.6%) | 78 (71.6%) |
| Fuel Oil or Kerosene | 12 (2.1%) | 0 (0.0%) |
| Coal or Coke | 0 (0.0%) | 0 (0.0%) |
| All other Fuels | 4 (0.7%) | 0 (0.0%) |
| No Fuel Used | 0 (0.0%) | 0 (0.0%) |
| Total | 583 (100.0%) | 109 (100.0%) |
Household Vehicle Usage in Chapel Hill
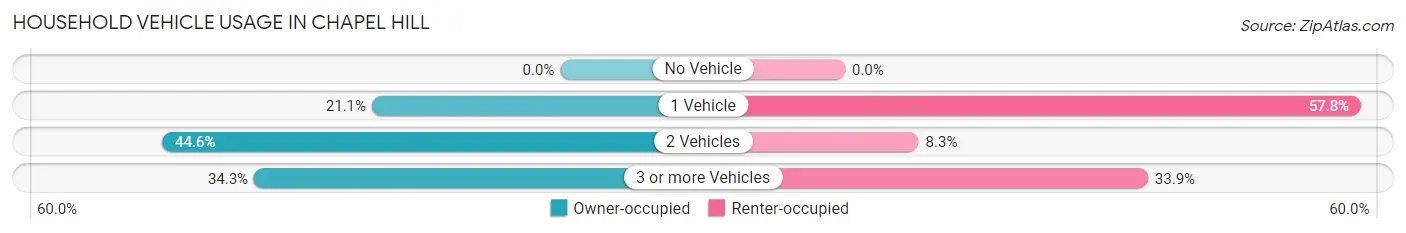
| Vehicles per Household | Owner-occupied | Renter-occupied |
| No Vehicle | 0 (0.0%) | 0 (0.0%) |
| 1 Vehicle | 123 (21.1%) | 63 (57.8%) |
| 2 Vehicles | 260 (44.6%) | 9 (8.3%) |
| 3 or more Vehicles | 200 (34.3%) | 37 (33.9%) |
| Total | 583 (100.0%) | 109 (100.0%) |
Real Estate & Mortgages in Chapel Hill
Real Estate and Mortgage Overview in Chapel Hill
| Characteristic | Without Mortgage | With Mortgage |
| Housing Units | 204 | 379 |
| Median Property Value | $243,100 | $239,300 |
| Median Household Income | $54,071 | $66 |
| Monthly Housing Costs | $442 | $0 |
| Real Estate Taxes | $1,531 | $0 |
Property Value by Mortgage Status in Chapel Hill
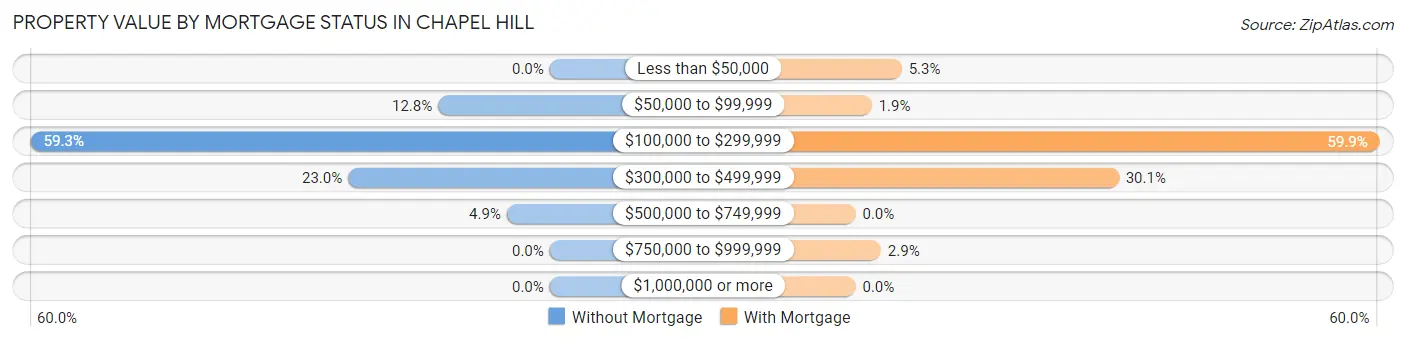
| Property Value | Without Mortgage | With Mortgage |
| Less than $50,000 | 0 (0.0%) | 20 (5.3%) |
| $50,000 to $99,999 | 26 (12.8%) | 7 (1.8%) |
| $100,000 to $299,999 | 121 (59.3%) | 227 (59.9%) |
| $300,000 to $499,999 | 47 (23.0%) | 114 (30.1%) |
| $500,000 to $749,999 | 10 (4.9%) | 0 (0.0%) |
| $750,000 to $999,999 | 0 (0.0%) | 11 (2.9%) |
| $1,000,000 or more | 0 (0.0%) | 0 (0.0%) |
| Total | 204 (100.0%) | 379 (100.0%) |
Household Income by Mortgage Status in Chapel Hill
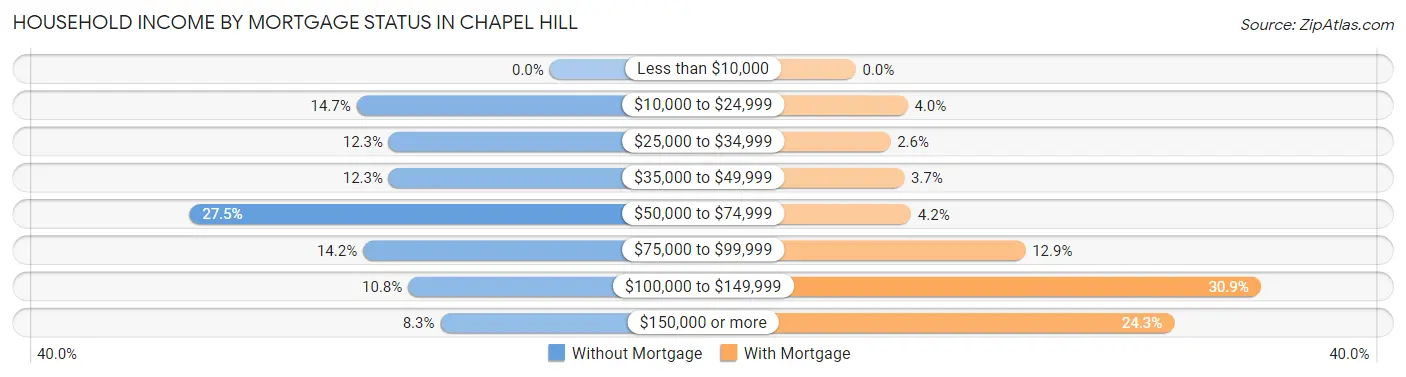
| Household Income | Without Mortgage | With Mortgage |
| Less than $10,000 | 0 (0.0%) | 0 (0.0%) |
| $10,000 to $24,999 | 30 (14.7%) | 15 (4.0%) |
| $25,000 to $34,999 | 25 (12.2%) | 10 (2.6%) |
| $35,000 to $49,999 | 25 (12.2%) | 14 (3.7%) |
| $50,000 to $74,999 | 56 (27.5%) | 16 (4.2%) |
| $75,000 to $99,999 | 29 (14.2%) | 49 (12.9%) |
| $100,000 to $149,999 | 22 (10.8%) | 117 (30.9%) |
| $150,000 or more | 17 (8.3%) | 92 (24.3%) |
| Total | 204 (100.0%) | 379 (100.0%) |
Property Value to Household Income Ratio in Chapel Hill
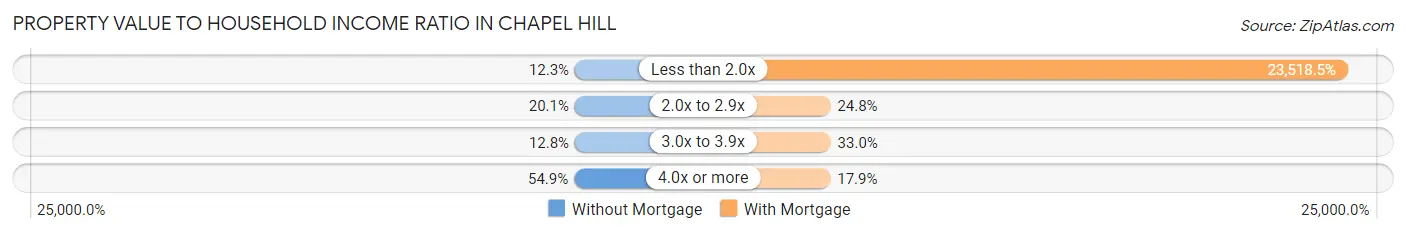
| Value-to-Income Ratio | Without Mortgage | With Mortgage |
| Less than 2.0x | 25 (12.2%) | 89,135 (23,518.5%) |
| 2.0x to 2.9x | 41 (20.1%) | 94 (24.8%) |
| 3.0x to 3.9x | 26 (12.8%) | 125 (33.0%) |
| 4.0x or more | 112 (54.9%) | 68 (17.9%) |
| Total | 204 (100.0%) | 379 (100.0%) |
Real Estate Taxes by Mortgage Status in Chapel Hill
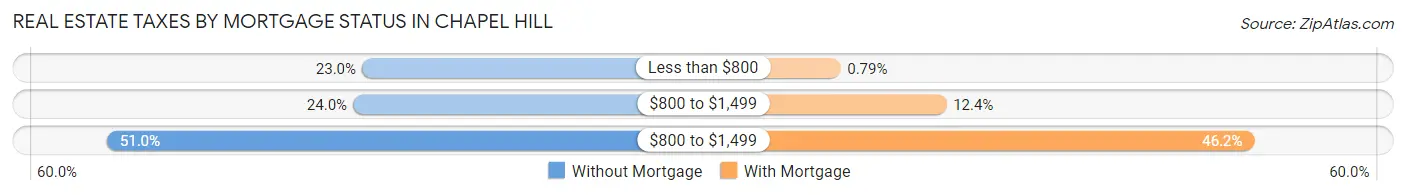
| Property Taxes | Without Mortgage | With Mortgage |
| Less than $800 | 47 (23.0%) | 3 (0.8%) |
| $800 to $1,499 | 49 (24.0%) | 47 (12.4%) |
| $800 to $1,499 | 104 (51.0%) | 175 (46.2%) |
| Total | 204 (100.0%) | 379 (100.0%) |
Health & Disability in Chapel Hill
Health Insurance Coverage by Age in Chapel Hill
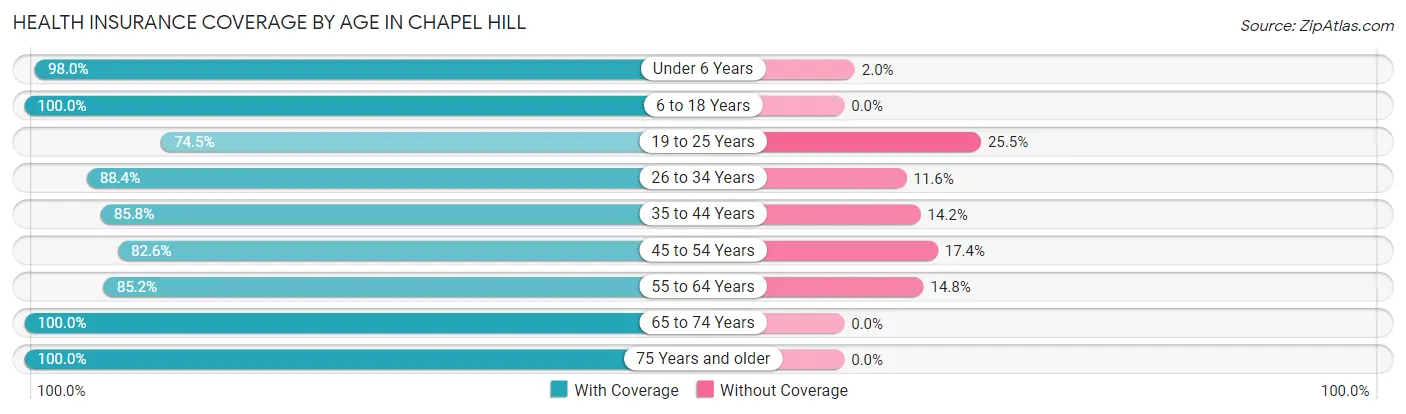
| Age Bracket | With Coverage | Without Coverage |
| Under 6 Years | 100 (98.0%) | 2 (2.0%) |
| 6 to 18 Years | 171 (100.0%) | 0 (0.0%) |
| 19 to 25 Years | 114 (74.5%) | 39 (25.5%) |
| 26 to 34 Years | 137 (88.4%) | 18 (11.6%) |
| 35 to 44 Years | 211 (85.8%) | 35 (14.2%) |
| 45 to 54 Years | 251 (82.6%) | 53 (17.4%) |
| 55 to 64 Years | 196 (85.2%) | 34 (14.8%) |
| 65 to 74 Years | 155 (100.0%) | 0 (0.0%) |
| 75 Years and older | 110 (100.0%) | 0 (0.0%) |
| Total | 1,445 (88.9%) | 181 (11.1%) |
Health Insurance Coverage by Citizenship Status in Chapel Hill
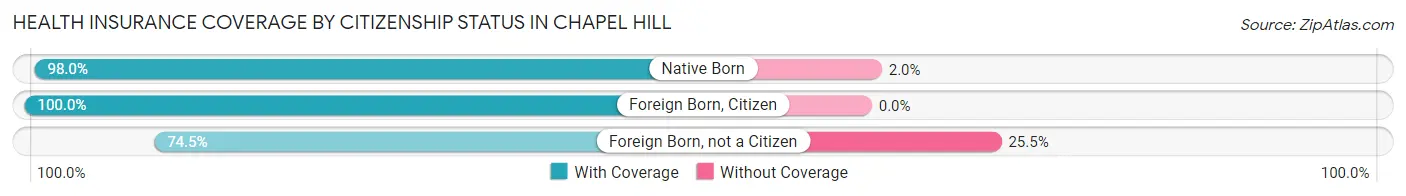
| Citizenship Status | With Coverage | Without Coverage |
| Native Born | 100 (98.0%) | 2 (2.0%) |
| Foreign Born, Citizen | 171 (100.0%) | 0 (0.0%) |
| Foreign Born, not a Citizen | 114 (74.5%) | 39 (25.5%) |
Health Insurance Coverage by Household Income in Chapel Hill
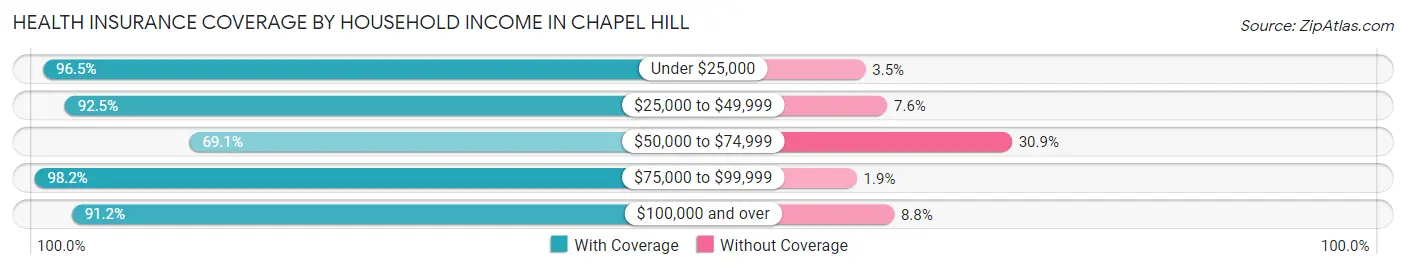
| Household Income | With Coverage | Without Coverage |
| Under $25,000 | 111 (96.5%) | 4 (3.5%) |
| $25,000 to $49,999 | 147 (92.4%) | 12 (7.5%) |
| $50,000 to $74,999 | 237 (69.1%) | 106 (30.9%) |
| $75,000 to $99,999 | 424 (98.2%) | 8 (1.8%) |
| $100,000 and over | 526 (91.2%) | 51 (8.8%) |
Public vs Private Health Insurance Coverage by Age in Chapel Hill
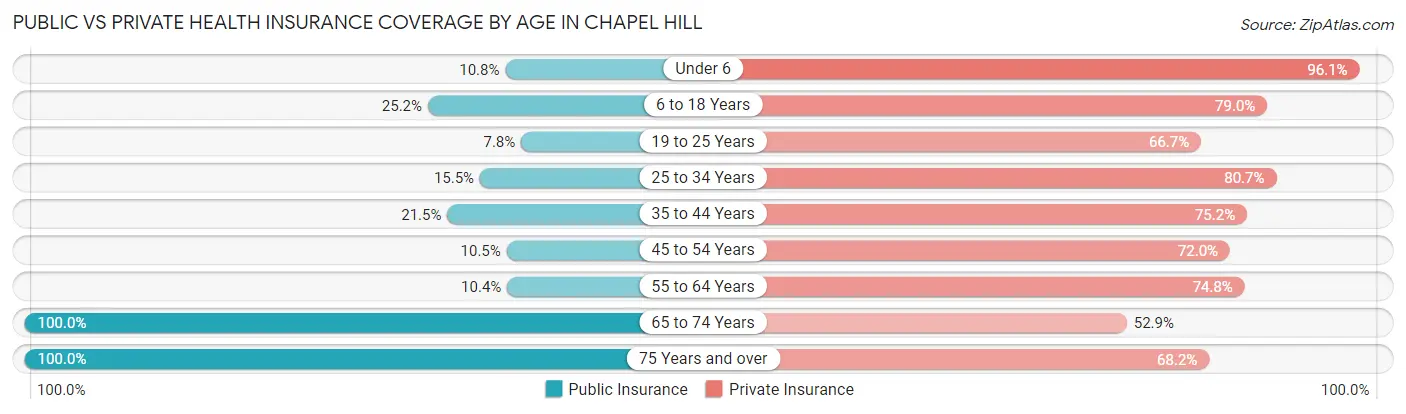
| Age Bracket | Public Insurance | Private Insurance |
| Under 6 | 11 (10.8%) | 98 (96.1%) |
| 6 to 18 Years | 43 (25.2%) | 135 (78.9%) |
| 19 to 25 Years | 12 (7.8%) | 102 (66.7%) |
| 25 to 34 Years | 24 (15.5%) | 125 (80.6%) |
| 35 to 44 Years | 53 (21.5%) | 185 (75.2%) |
| 45 to 54 Years | 32 (10.5%) | 219 (72.0%) |
| 55 to 64 Years | 24 (10.4%) | 172 (74.8%) |
| 65 to 74 Years | 155 (100.0%) | 82 (52.9%) |
| 75 Years and over | 110 (100.0%) | 75 (68.2%) |
| Total | 464 (28.5%) | 1,193 (73.4%) |
Disability Status by Sex by Age in Chapel Hill
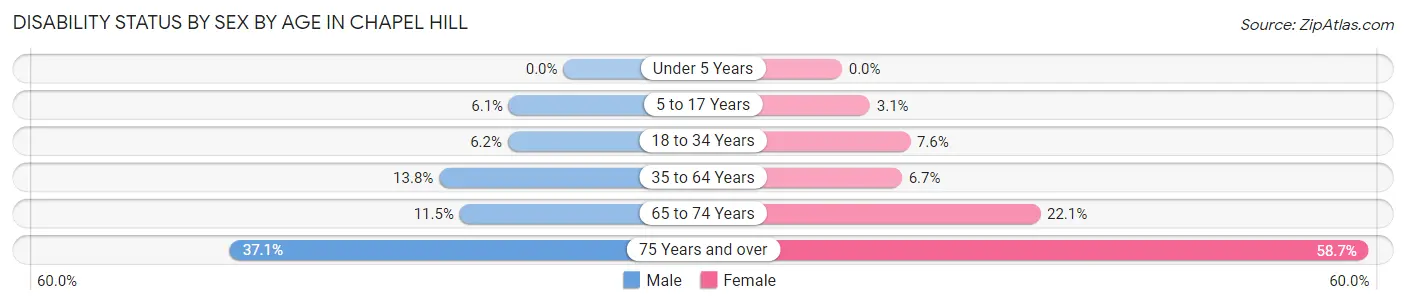
| Age Bracket | Male | Female |
| Under 5 Years | 0 (0.0%) | 0 (0.0%) |
| 5 to 17 Years | 4 (6.1%) | 3 (3.1%) |
| 18 to 34 Years | 12 (6.2%) | 11 (7.6%) |
| 35 to 64 Years | 56 (13.8%) | 25 (6.7%) |
| 65 to 74 Years | 9 (11.5%) | 17 (22.1%) |
| 75 Years and over | 13 (37.1%) | 44 (58.7%) |
Disability Class by Sex by Age in Chapel Hill
Disability Class: Hearing Difficulty
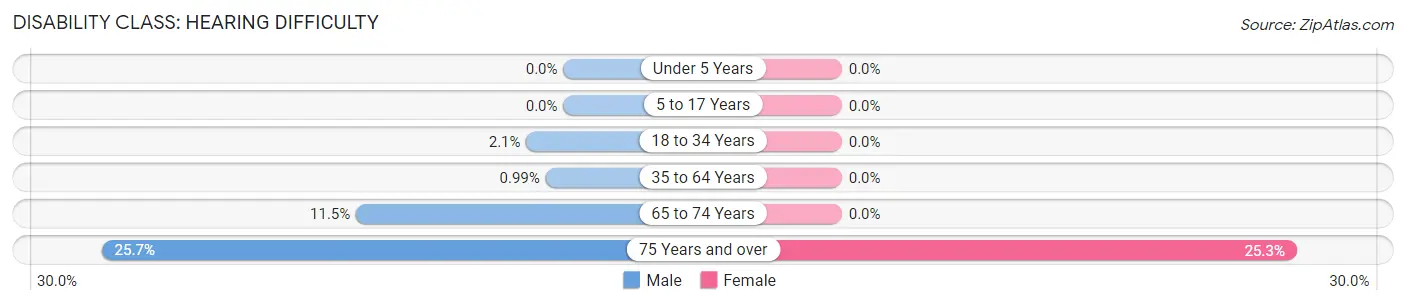
| Age Bracket | Male | Female |
| Under 5 Years | 0 (0.0%) | 0 (0.0%) |
| 5 to 17 Years | 0 (0.0%) | 0 (0.0%) |
| 18 to 34 Years | 4 (2.1%) | 0 (0.0%) |
| 35 to 64 Years | 4 (1.0%) | 0 (0.0%) |
| 65 to 74 Years | 9 (11.5%) | 0 (0.0%) |
| 75 Years and over | 9 (25.7%) | 19 (25.3%) |
Disability Class: Vision Difficulty
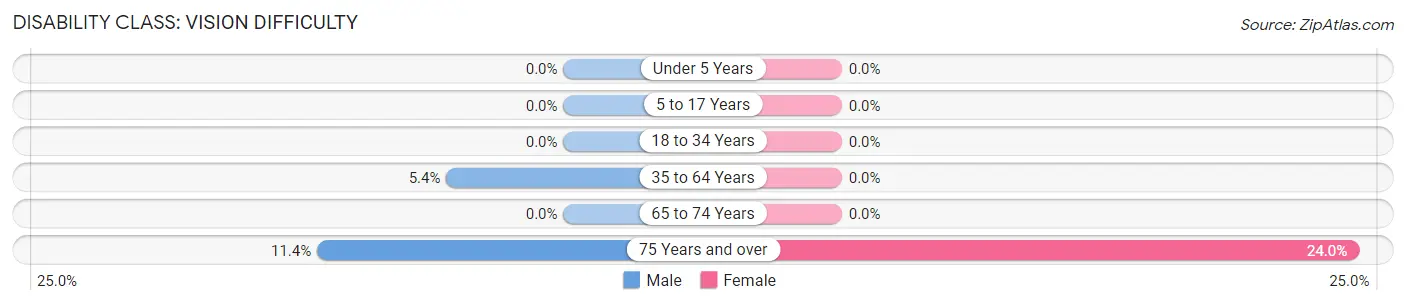
| Age Bracket | Male | Female |
| Under 5 Years | 0 (0.0%) | 0 (0.0%) |
| 5 to 17 Years | 0 (0.0%) | 0 (0.0%) |
| 18 to 34 Years | 0 (0.0%) | 0 (0.0%) |
| 35 to 64 Years | 22 (5.4%) | 0 (0.0%) |
| 65 to 74 Years | 0 (0.0%) | 0 (0.0%) |
| 75 Years and over | 4 (11.4%) | 18 (24.0%) |
Disability Class: Cognitive Difficulty
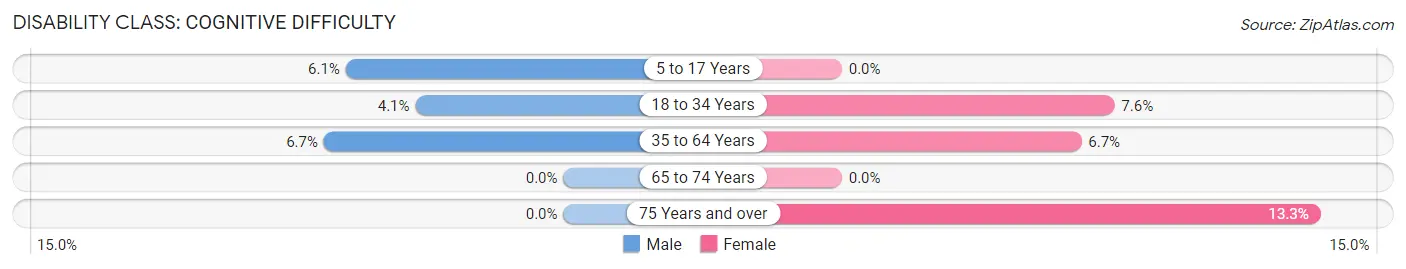
| Age Bracket | Male | Female |
| 5 to 17 Years | 4 (6.1%) | 0 (0.0%) |
| 18 to 34 Years | 8 (4.1%) | 11 (7.6%) |
| 35 to 64 Years | 27 (6.7%) | 25 (6.7%) |
| 65 to 74 Years | 0 (0.0%) | 0 (0.0%) |
| 75 Years and over | 0 (0.0%) | 10 (13.3%) |
Disability Class: Ambulatory Difficulty
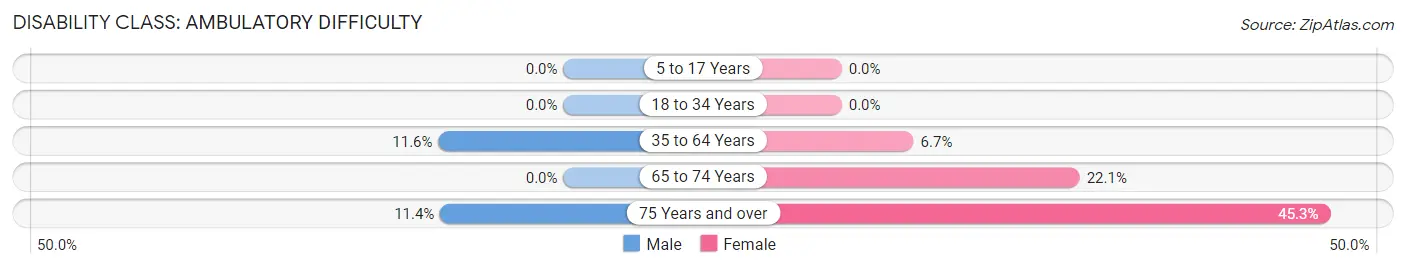
| Age Bracket | Male | Female |
| 5 to 17 Years | 0 (0.0%) | 0 (0.0%) |
| 18 to 34 Years | 0 (0.0%) | 0 (0.0%) |
| 35 to 64 Years | 47 (11.6%) | 25 (6.7%) |
| 65 to 74 Years | 0 (0.0%) | 17 (22.1%) |
| 75 Years and over | 4 (11.4%) | 34 (45.3%) |
Disability Class: Self-Care Difficulty
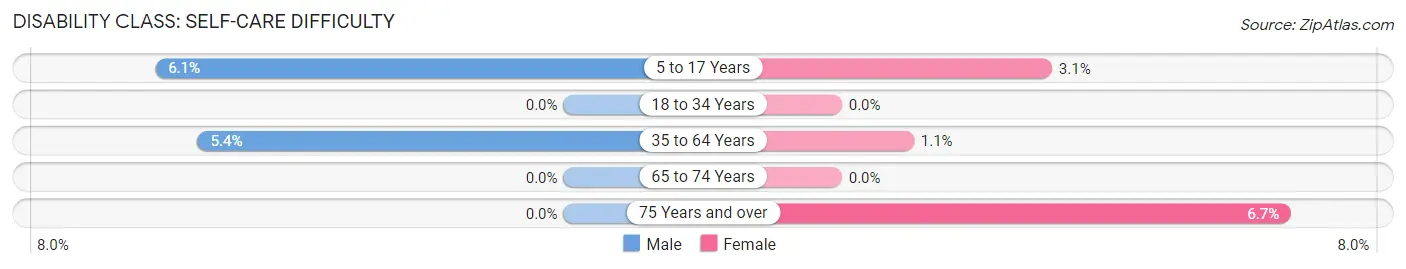
| Age Bracket | Male | Female |
| 5 to 17 Years | 4 (6.1%) | 3 (3.1%) |
| 18 to 34 Years | 0 (0.0%) | 0 (0.0%) |
| 35 to 64 Years | 22 (5.4%) | 4 (1.1%) |
| 65 to 74 Years | 0 (0.0%) | 0 (0.0%) |
| 75 Years and over | 0 (0.0%) | 5 (6.7%) |
Technology Access in Chapel Hill
Computing Device Access in Chapel Hill
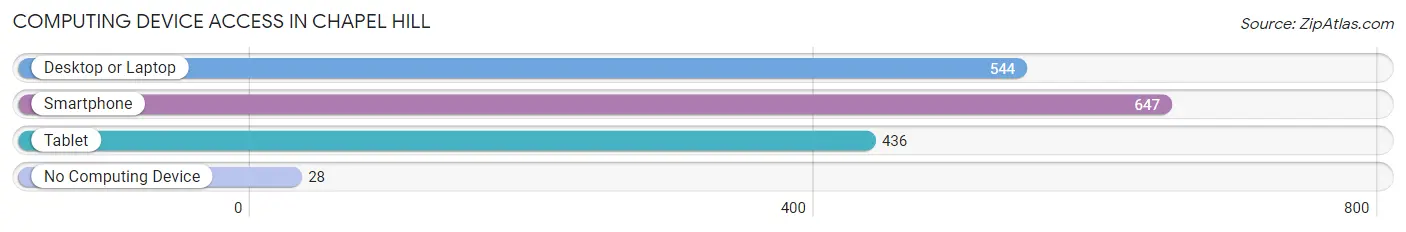
| Device Type | # Households | % Households |
| Desktop or Laptop | 544 | 78.6% |
| Smartphone | 647 | 93.5% |
| Tablet | 436 | 63.0% |
| No Computing Device | 28 | 4.1% |
| Total | 692 | 100.0% |
Internet Access in Chapel Hill
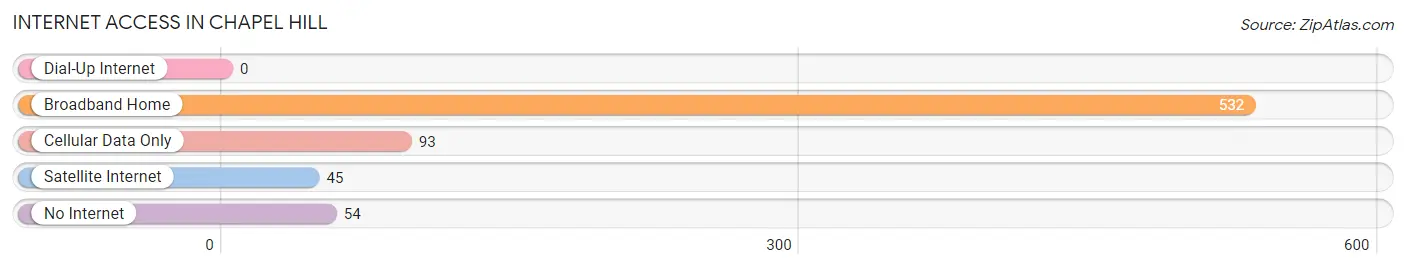
| Internet Type | # Households | % Households |
| Dial-Up Internet | 0 | 0.0% |
| Broadband Home | 532 | 76.9% |
| Cellular Data Only | 93 | 13.4% |
| Satellite Internet | 45 | 6.5% |
| No Internet | 54 | 7.8% |
| Total | 692 | 100.0% |
Chapel Hill Summary
Chapel Hill, Tennessee is a small town located in Marshall County, Tennessee. It is situated in the foothills of the Cumberland Plateau, approximately 30 miles south of Nashville. The town was founded in 1836 and is named after the local Methodist church, which was built in 1837. The population of Chapel Hill was 2,845 as of the 2010 census.
Geography
Chapel Hill is located at 35°37'25"N 86°30'45"W. It is situated in the foothills of the Cumberland Plateau, approximately 30 miles south of Nashville. The town is located in the Duck River watershed, which is the largest watershed in Tennessee. The Duck River is the longest river in the state and is a major tributary of the Tennessee River. The town is also located near the Natchez Trace Parkway, a scenic byway that runs through the state.
The terrain of Chapel Hill is mostly rolling hills and valleys, with some flat areas. The town is located in a temperate climate, with mild winters and hot, humid summers. The average annual temperature is around 60°F.
Economy
The economy of Chapel Hill is largely based on agriculture and manufacturing. The town is home to several large farms, which produce a variety of crops, including corn, soybeans, wheat, and hay. The town is also home to several manufacturing companies, including a furniture factory, a plastics factory, and a paper mill.
The town is also home to several small businesses, including restaurants, retail stores, and service providers. The town is also home to several churches, a library, and a post office.
Demographics
As of the 2010 census, the population of Chapel Hill was 2,845. The racial makeup of the town was 95.3% White, 1.7% African American, 0.3% Native American, 0.2% Asian, 0.1% Pacific Islander, 0.7% from other races, and 1.9% from two or more races. Hispanic or Latino of any race were 2.2% of the population.
The median income for a household in Chapel Hill was $37,917, and the median income for a family was $45,938. The per capita income for the town was $18,945. About 11.2% of families and 14.2% of the population were below the poverty line, including 19.2% of those under age 18 and 8.3% of those age 65 or over.
Conclusion
Chapel Hill, Tennessee is a small town located in Marshall County, Tennessee. It is situated in the foothills of the Cumberland Plateau, approximately 30 miles south of Nashville. The town was founded in 1836 and is named after the local Methodist church, which was built in 1837. The population of Chapel Hill was 2,845 as of the 2010 census. The economy of Chapel Hill is largely based on agriculture and manufacturing, and the town is home to several small businesses, churches, a library, and a post office. The racial makeup of the town was 95.3% White, 1.7% African American, 0.3% Native American, 0.2% Asian, 0.1% Pacific Islander, 0.7% from other races, and 1.9% from two or more races. The median income for a household in Chapel Hill was $37,917, and the median income for a family was $45,938. The per capita income for the town was $18,945. About 11.2% of families and 14.2% of the population were below the poverty line.
Common Questions
What is Per Capita Income in Chapel Hill?
Per Capita income in Chapel Hill is $36,718.
What is the Median Family Income in Chapel Hill?
Median Family Income in Chapel Hill is $85,817.
What is the Median Household income in Chapel Hill?
Median Household Income in Chapel Hill is $79,583.
What is Income or Wage Gap in Chapel Hill?
Income or Wage Gap in Chapel Hill is 42.9%.
Women in Chapel Hill earn 57.1 cents for every dollar earned by a man.
What is Inequality or Gini Index in Chapel Hill?
Inequality or Gini Index in Chapel Hill is 0.35.
What is the Total Population of Chapel Hill?
Total Population of Chapel Hill is 1,626.
What is the Total Male Population of Chapel Hill?
Total Male Population of Chapel Hill is 811.
What is the Total Female Population of Chapel Hill?
Total Female Population of Chapel Hill is 815.
What is the Ratio of Males per 100 Females in Chapel Hill?
There are 99.51 Males per 100 Females in Chapel Hill.
What is the Ratio of Females per 100 Males in Chapel Hill?
There are 100.49 Females per 100 Males in Chapel Hill.
What is the Median Population Age in Chapel Hill?
Median Population Age in Chapel Hill is 44.4 Years.
What is the Average Family Size in Chapel Hill
Average Family Size in Chapel Hill is 2.9 People.
What is the Average Household Size in Chapel Hill
Average Household Size in Chapel Hill is 2.4 People.
How Large is the Labor Force in Chapel Hill?
There are 907 People in the Labor Forcein in Chapel Hill.
What is the Percentage of People in the Labor Force in Chapel Hill?
64.4% of People are in the Labor Force in Chapel Hill.
What is the Unemployment Rate in Chapel Hill?
Unemployment Rate in Chapel Hill is 3.7%.