Cedar Hill, TN Map & Demographics
Cedar Hill Map
Cedar Hill Overview
$22,111
PER CAPITA INCOME
$56,429
AVG FAMILY INCOME
$55,179
AVG HOUSEHOLD INCOME
5.3%
WAGE / INCOME GAP [ % ]
94.7¢/ $1
WAGE / INCOME GAP [ $ ]
0.44
INEQUALITY / GINI INDEX
357
TOTAL POPULATION
172
MALE POPULATION
185
FEMALE POPULATION
92.97
MALES / 100 FEMALES
107.56
FEMALES / 100 MALES
25.0
MEDIAN AGE
3.5
AVG FAMILY SIZE
2.8
AVG HOUSEHOLD SIZE
207
LABOR FORCE [ PEOPLE ]
73.4%
PERCENT IN LABOR FORCE
6.8%
UNEMPLOYMENT RATE
Cedar Hill Zip Codes
Income in Cedar Hill
Income Overview in Cedar Hill
Per Capita Income in Cedar Hill is $22,111, while median incomes of families and households are $56,429 and $55,179 respectively.
| Characteristic | Number | Measure |
| Per Capita Income | 357 | $22,111 |
| Median Family Income | 84 | $56,429 |
| Mean Family Income | 84 | $74,282 |
| Median Household Income | 127 | $55,179 |
| Mean Household Income | 127 | $62,426 |
| Income Deficit | 84 | $0 |
| Wage / Income Gap (%) | 357 | 5.27% |
| Wage / Income Gap ($) | 357 | 94.73¢ per $1 |
| Gini / Inequality Index | 357 | 0.44 |
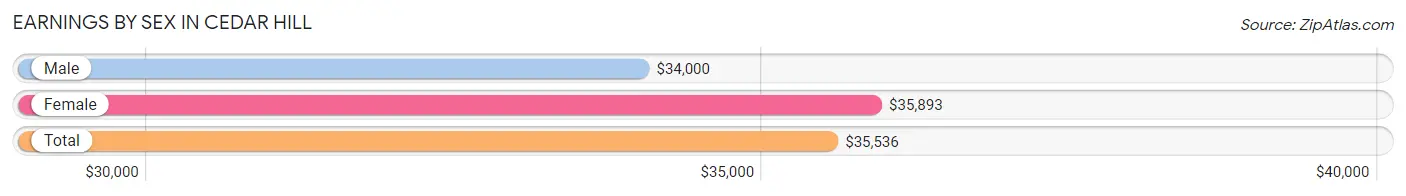
Earnings by Sex in Cedar Hill
Average Earnings in Cedar Hill are $35,536, $34,000 for men and $35,893 for women, a difference of 5.3%.
| Sex | Number | Average Earnings |
| Male | 96 (45.3%) | $34,000 |
| Female | 116 (54.7%) | $35,893 |
| Total | 212 (100.0%) | $35,536 |
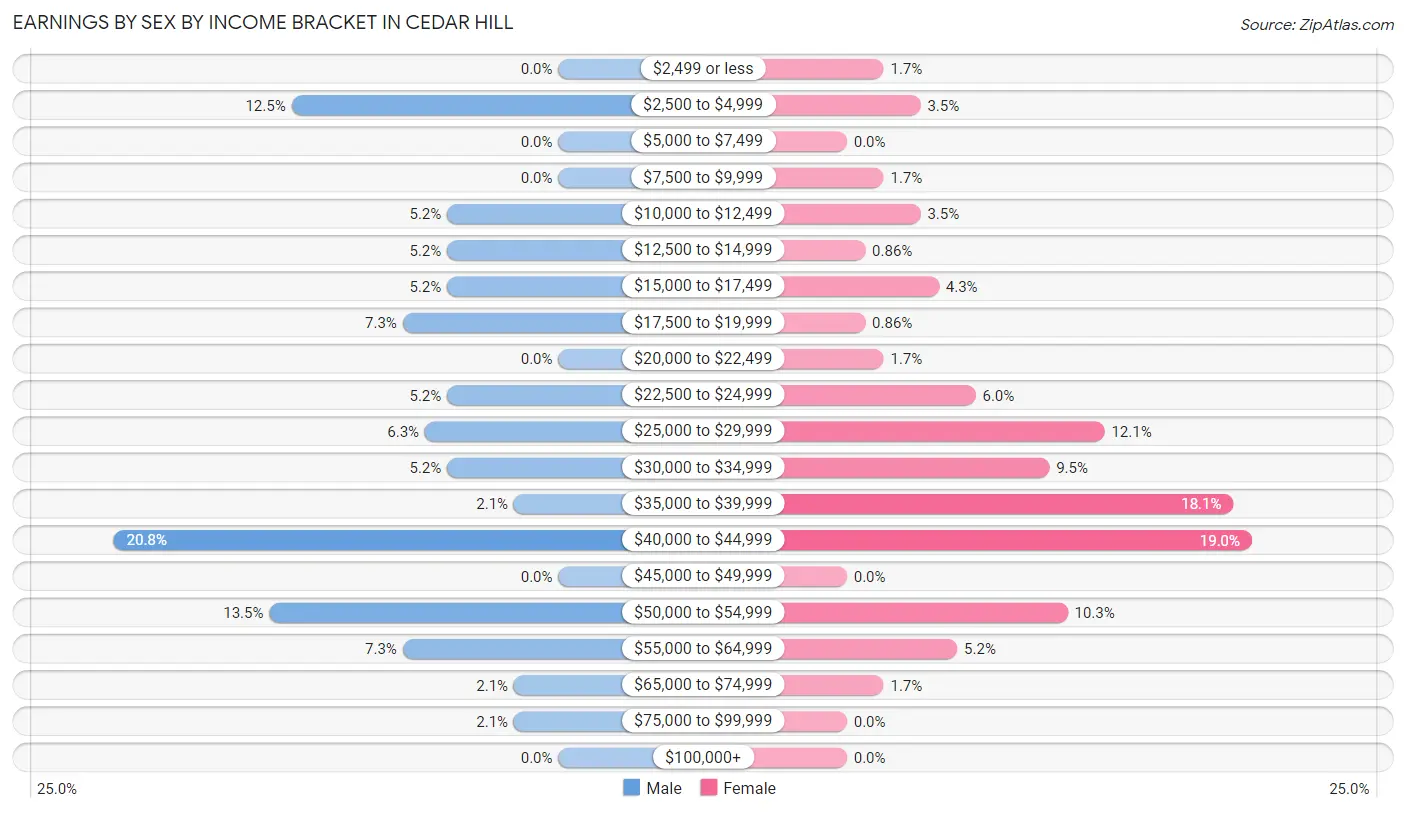
Earnings by Sex by Income Bracket in Cedar Hill
The most common earnings brackets in Cedar Hill are $40,000 to $44,999 for men (20 | 20.8%) and $40,000 to $44,999 for women (22 | 19.0%).
| Income | Male | Female |
| $2,499 or less | 0 (0.0%) | 2 (1.7%) |
| $2,500 to $4,999 | 12 (12.5%) | 4 (3.5%) |
| $5,000 to $7,499 | 0 (0.0%) | 0 (0.0%) |
| $7,500 to $9,999 | 0 (0.0%) | 2 (1.7%) |
| $10,000 to $12,499 | 5 (5.2%) | 4 (3.5%) |
| $12,500 to $14,999 | 5 (5.2%) | 1 (0.9%) |
| $15,000 to $17,499 | 5 (5.2%) | 5 (4.3%) |
| $17,500 to $19,999 | 7 (7.3%) | 1 (0.9%) |
| $20,000 to $22,499 | 0 (0.0%) | 2 (1.7%) |
| $22,500 to $24,999 | 5 (5.2%) | 7 (6.0%) |
| $25,000 to $29,999 | 6 (6.2%) | 14 (12.1%) |
| $30,000 to $34,999 | 5 (5.2%) | 11 (9.5%) |
| $35,000 to $39,999 | 2 (2.1%) | 21 (18.1%) |
| $40,000 to $44,999 | 20 (20.8%) | 22 (19.0%) |
| $45,000 to $49,999 | 0 (0.0%) | 0 (0.0%) |
| $50,000 to $54,999 | 13 (13.5%) | 12 (10.3%) |
| $55,000 to $64,999 | 7 (7.3%) | 6 (5.2%) |
| $65,000 to $74,999 | 2 (2.1%) | 2 (1.7%) |
| $75,000 to $99,999 | 2 (2.1%) | 0 (0.0%) |
| $100,000+ | 0 (0.0%) | 0 (0.0%) |
| Total | 96 (100.0%) | 116 (100.0%) |
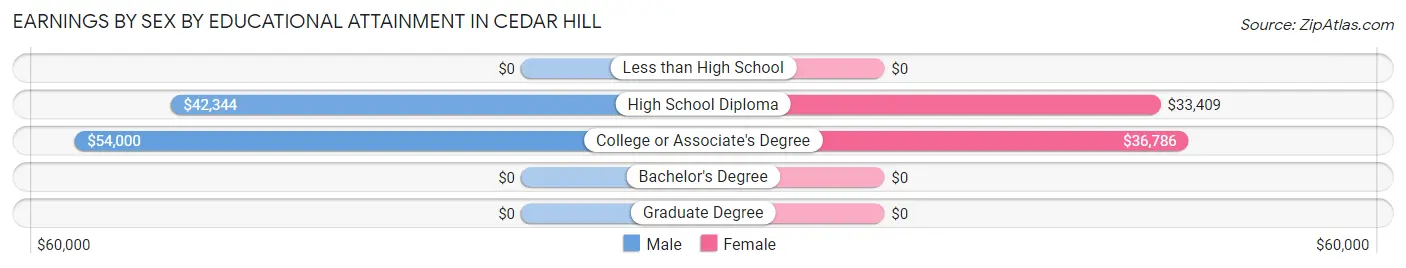
Earnings by Sex by Educational Attainment in Cedar Hill
Average earnings in Cedar Hill are $41,719 for men and $35,714 for women, a difference of 14.4%. Men with an educational attainment of college or associate's degree enjoy the highest average annual earnings of $54,000, while those with high school diploma education earn the least with $42,344. Women with an educational attainment of college or associate's degree earn the most with the average annual earnings of $36,786, while those with high school diploma education have the smallest earnings of $33,409.
| Educational Attainment | Male Income | Female Income |
| Less than High School | - | - |
| High School Diploma | $42,344 | $33,409 |
| College or Associate's Degree | $54,000 | $36,786 |
| Bachelor's Degree | - | - |
| Graduate Degree | - | - |
| Total | $41,719 | $35,714 |
Family Income in Cedar Hill
Family Income Brackets in Cedar Hill
According to the Cedar Hill family income data, there are 25 families falling into the $50,000 to $74,999 income range, which is the most common income bracket and makes up 29.8% of all families.
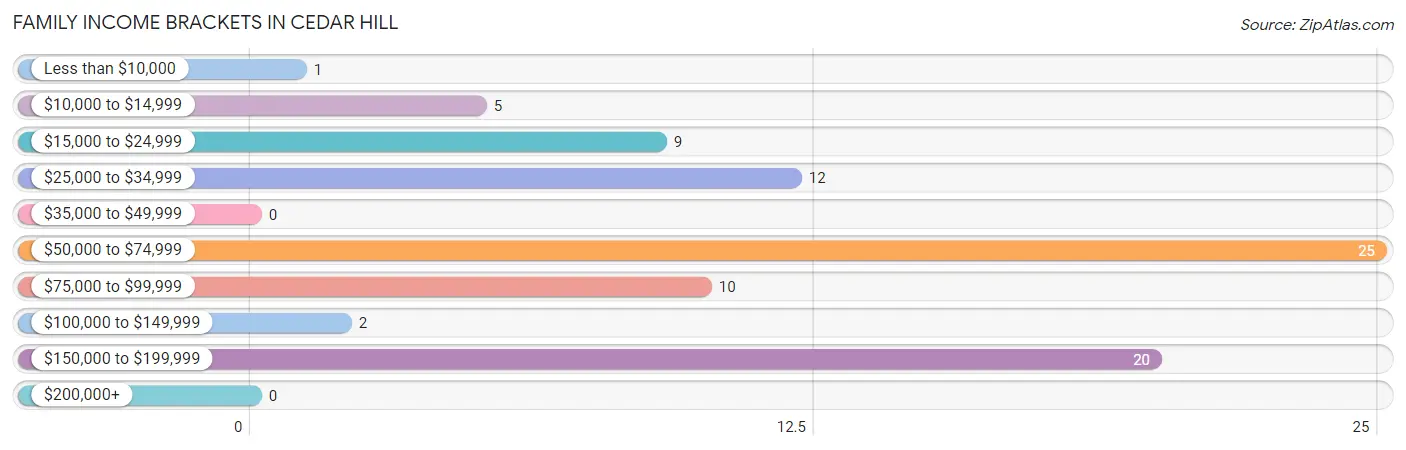
| Income Bracket | # Families | % Families |
| Less than $10,000 | 1 | 1.2% |
| $10,000 to $14,999 | 5 | 6.0% |
| $15,000 to $24,999 | 9 | 10.7% |
| $25,000 to $34,999 | 12 | 14.3% |
| $35,000 to $49,999 | 0 | 0.0% |
| $50,000 to $74,999 | 25 | 29.8% |
| $75,000 to $99,999 | 10 | 11.9% |
| $100,000 to $149,999 | 2 | 2.4% |
| $150,000 to $199,999 | 20 | 23.8% |
| $200,000+ | 0 | 0.0% |
Family Income by Famaliy Size in Cedar Hill
4-person families (17 | 20.2%) account for the highest median family income in Cedar Hill with $155,982 per family, while 4-person families (17 | 20.2%) have the highest median income of $38,996 per family member.
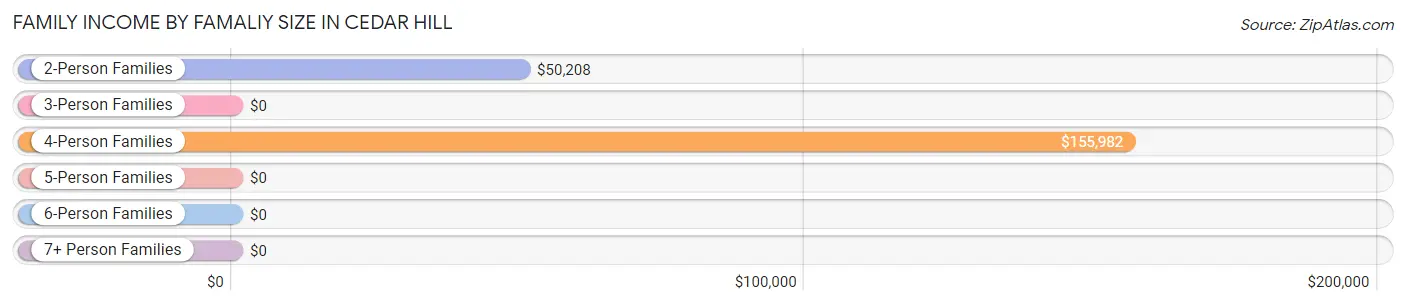
| Income Bracket | # Families | Median Income |
| 2-Person Families | 43 (51.2%) | $50,208 |
| 3-Person Families | 15 (17.9%) | $0 |
| 4-Person Families | 17 (20.2%) | $155,982 |
| 5-Person Families | 7 (8.3%) | $0 |
| 6-Person Families | 0 (0.0%) | $0 |
| 7+ Person Families | 2 (2.4%) | $0 |
| Total | 84 (100.0%) | $56,429 |
Family Income by Number of Earners in Cedar Hill
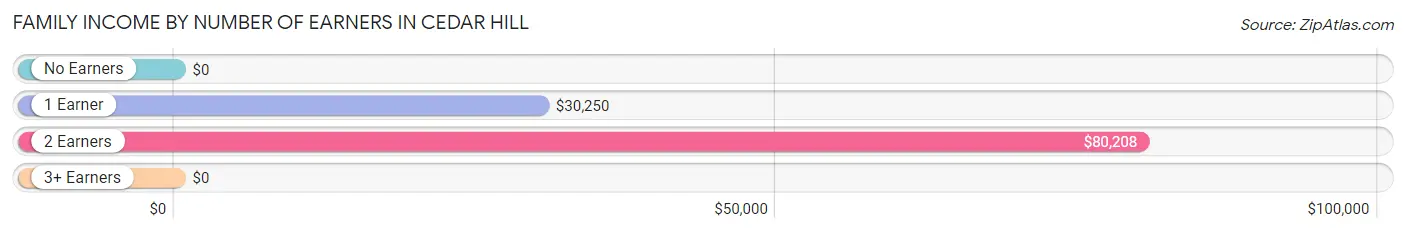
| Number of Earners | # Families | Median Income |
| No Earners | 4 (4.8%) | $0 |
| 1 Earner | 37 (44.1%) | $30,250 |
| 2 Earners | 23 (27.4%) | $80,208 |
| 3+ Earners | 20 (23.8%) | $0 |
| Total | 84 (100.0%) | $56,429 |
Household Income in Cedar Hill
Household Income Brackets in Cedar Hill
With 26 households falling in the category, the $75,000 to $99,999 income range is the most frequent in Cedar Hill, accounting for 20.5% of all households.
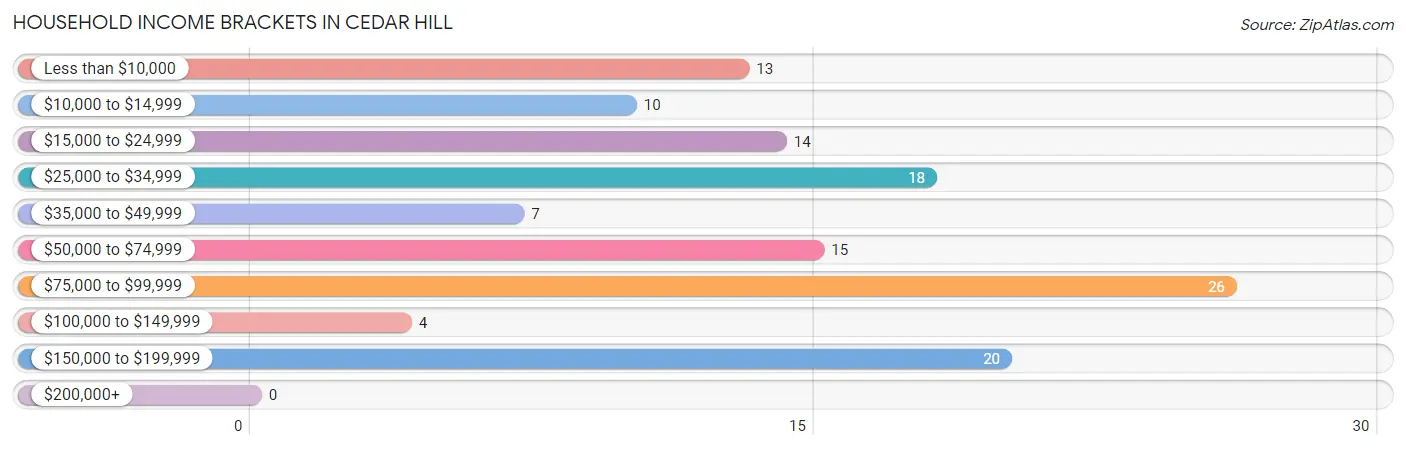
| Income Bracket | # Households | % Households |
| Less than $10,000 | 13 | 10.2% |
| $10,000 to $14,999 | 10 | 7.9% |
| $15,000 to $24,999 | 14 | 11.0% |
| $25,000 to $34,999 | 18 | 14.2% |
| $35,000 to $49,999 | 7 | 5.5% |
| $50,000 to $74,999 | 15 | 11.8% |
| $75,000 to $99,999 | 26 | 20.5% |
| $100,000 to $149,999 | 4 | 3.1% |
| $150,000 to $199,999 | 20 | 15.7% |
| $200,000+ | 0 | 0.0% |
Household Income by Householder Age in Cedar Hill
The median household income in Cedar Hill is $55,179, with the highest median household income of $83,750 found in the 25 to 44 years age bracket for the primary householder. A total of 59 households (46.5%) fall into this category. Meanwhile, the 45 to 64 years age bracket for the primary householder has the lowest median household income of $0, with 38 households (29.9%) in this group.
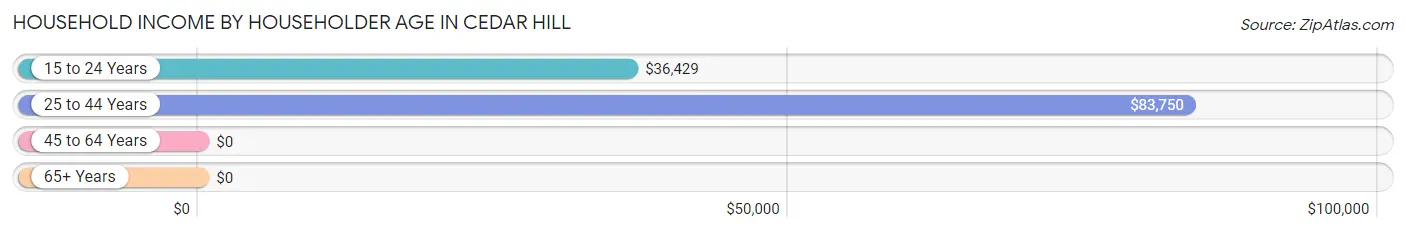
| Income Bracket | # Households | Median Income |
| 15 to 24 Years | 12 (9.5%) | $36,429 |
| 25 to 44 Years | 59 (46.5%) | $83,750 |
| 45 to 64 Years | 38 (29.9%) | $0 |
| 65+ Years | 18 (14.2%) | $0 |
| Total | 127 (100.0%) | $55,179 |
Poverty in Cedar Hill
Income Below Poverty by Sex and Age in Cedar Hill
With 19.2% poverty level for males and 8.6% for females among the residents of Cedar Hill, 35 to 44 year old males and 55 to 64 year old females are the most vulnerable to poverty, with 12 males (50.0%) and 5 females (71.4%) in their respective age groups living below the poverty level.
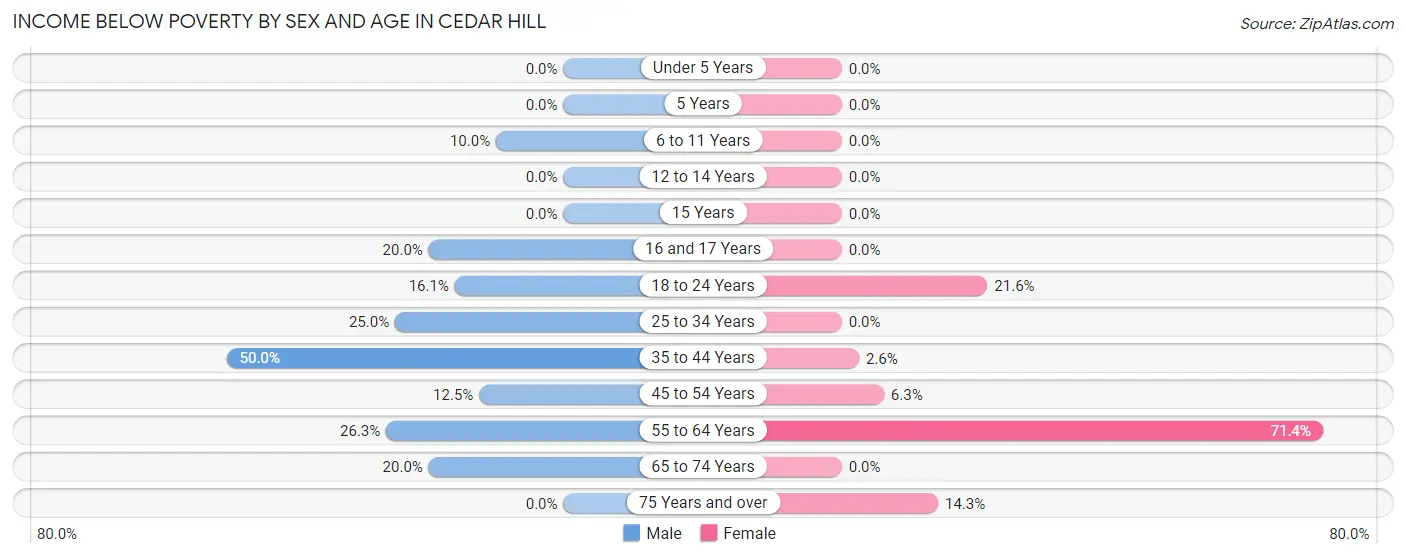
| Age Bracket | Male | Female |
| Under 5 Years | 0 (0.0%) | 0 (0.0%) |
| 5 Years | 0 (0.0%) | 0 (0.0%) |
| 6 to 11 Years | 1 (10.0%) | 0 (0.0%) |
| 12 to 14 Years | 0 (0.0%) | 0 (0.0%) |
| 15 Years | 0 (0.0%) | 0 (0.0%) |
| 16 and 17 Years | 1 (20.0%) | 0 (0.0%) |
| 18 to 24 Years | 5 (16.1%) | 8 (21.6%) |
| 25 to 34 Years | 5 (25.0%) | 0 (0.0%) |
| 35 to 44 Years | 12 (50.0%) | 1 (2.6%) |
| 45 to 54 Years | 2 (12.5%) | 1 (6.2%) |
| 55 to 64 Years | 5 (26.3%) | 5 (71.4%) |
| 65 to 74 Years | 2 (20.0%) | 0 (0.0%) |
| 75 Years and over | 0 (0.0%) | 1 (14.3%) |
| Total | 33 (19.2%) | 16 (8.6%) |
Income Above Poverty by Sex and Age in Cedar Hill
According to the poverty statistics in Cedar Hill, males aged under 5 years and females aged under 5 years are the age groups that are most secure financially, with 100.0% of males and 100.0% of females in these age groups living above the poverty line.
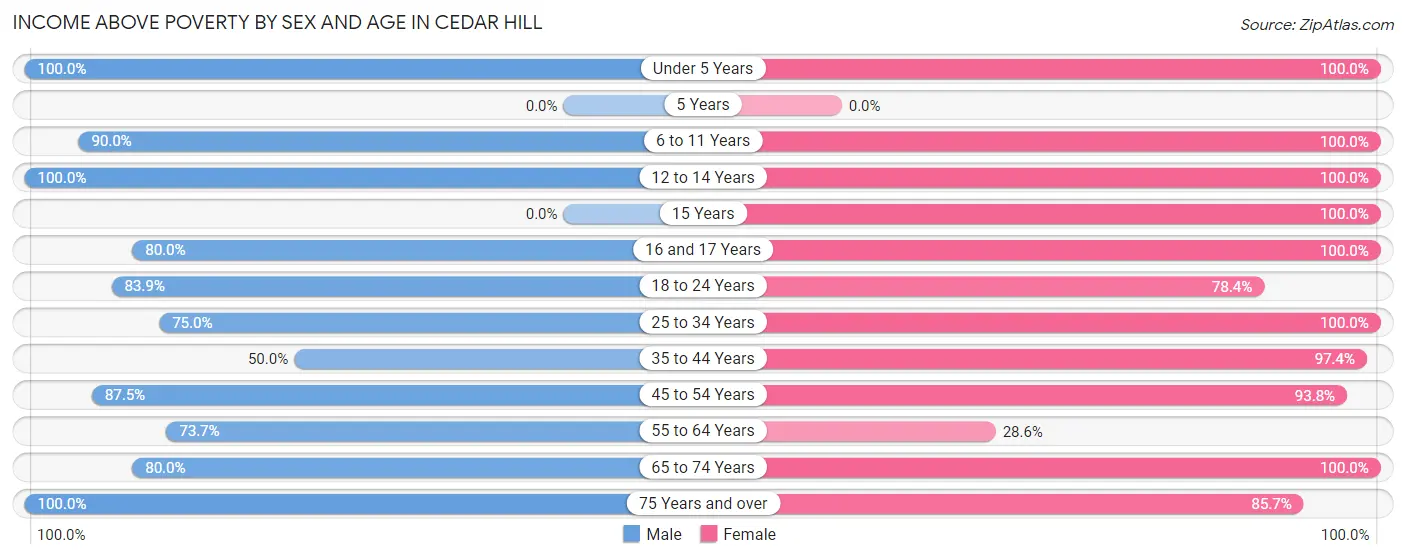
| Age Bracket | Male | Female |
| Under 5 Years | 34 (100.0%) | 6 (100.0%) |
| 5 Years | 0 (0.0%) | 0 (0.0%) |
| 6 to 11 Years | 9 (90.0%) | 11 (100.0%) |
| 12 to 14 Years | 1 (100.0%) | 8 (100.0%) |
| 15 Years | 0 (0.0%) | 5 (100.0%) |
| 16 and 17 Years | 4 (80.0%) | 31 (100.0%) |
| 18 to 24 Years | 26 (83.9%) | 29 (78.4%) |
| 25 to 34 Years | 15 (75.0%) | 4 (100.0%) |
| 35 to 44 Years | 12 (50.0%) | 38 (97.4%) |
| 45 to 54 Years | 14 (87.5%) | 15 (93.8%) |
| 55 to 64 Years | 14 (73.7%) | 2 (28.6%) |
| 65 to 74 Years | 8 (80.0%) | 14 (100.0%) |
| 75 Years and over | 2 (100.0%) | 6 (85.7%) |
| Total | 139 (80.8%) | 169 (91.3%) |
Income Below Poverty Among Married-Couple Families in Cedar Hill
The poverty statistics for married-couple families in Cedar Hill show that 3.5% or 1 of the total 29 families live below the poverty line. Families with 1 or 2 children have the highest poverty rate of 10.0%, comprising of 1 families. On the other hand, families with no children have the lowest poverty rate of 0.0%, which includes 0 families.
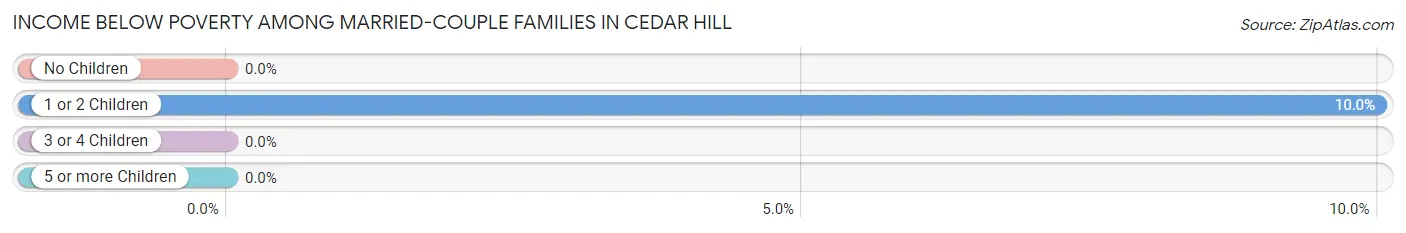
| Children | Above Poverty | Below Poverty |
| No Children | 17 (100.0%) | 0 (0.0%) |
| 1 or 2 Children | 9 (90.0%) | 1 (10.0%) |
| 3 or 4 Children | 0 (0.0%) | 0 (0.0%) |
| 5 or more Children | 2 (100.0%) | 0 (0.0%) |
| Total | 28 (96.6%) | 1 (3.5%) |
Income Below Poverty Among Single-Parent Households in Cedar Hill
According to the poverty data in Cedar Hill, 36.8% or 7 single-father households and 13.9% or 5 single-mother households are living below the poverty line. Among single-father households, those with no children have the highest poverty rate, with 7 households (58.3%) experiencing poverty. Likewise, among single-mother households, those with no children have the highest poverty rate, with 5 households (25.0%) falling below the poverty line.
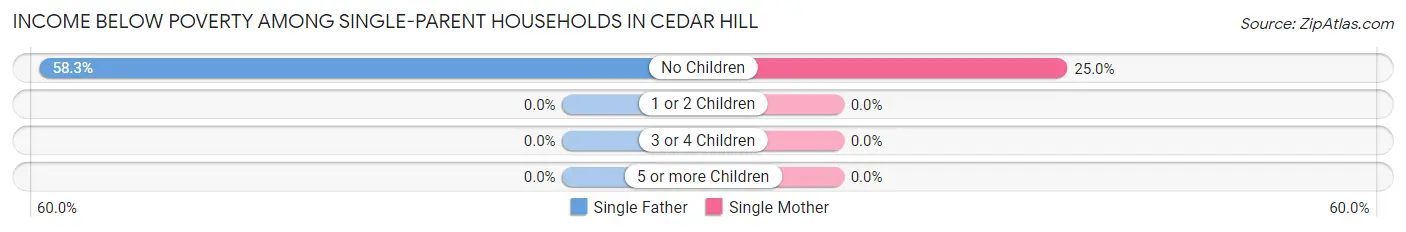
| Children | Single Father | Single Mother |
| No Children | 7 (58.3%) | 5 (25.0%) |
| 1 or 2 Children | 0 (0.0%) | 0 (0.0%) |
| 3 or 4 Children | 0 (0.0%) | 0 (0.0%) |
| 5 or more Children | 0 (0.0%) | 0 (0.0%) |
| Total | 7 (36.8%) | 5 (13.9%) |
Income Below Poverty Among Married-Couple vs Single-Parent Households in Cedar Hill
The poverty data for Cedar Hill shows that 1 of the married-couple family households (3.5%) and 12 of the single-parent households (21.8%) are living below the poverty level. Within the married-couple family households, those with 1 or 2 children have the highest poverty rate, with 1 households (10.0%) falling below the poverty line. Among the single-parent households, those with no children have the highest poverty rate, with 12 household (37.5%) living below poverty.
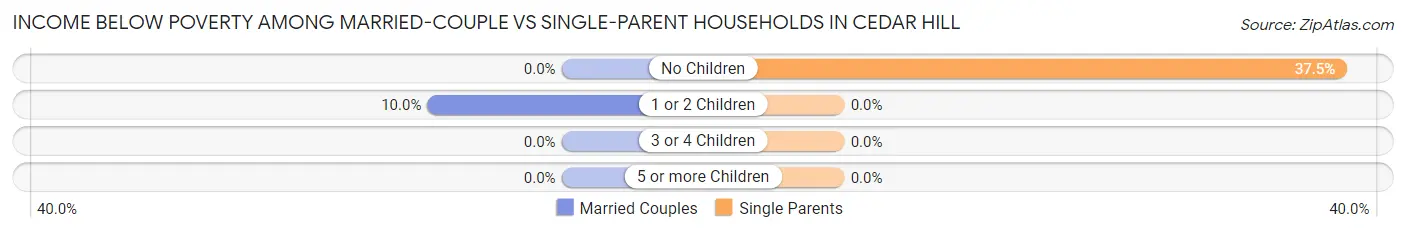
| Children | Married-Couple Families | Single-Parent Households |
| No Children | 0 (0.0%) | 12 (37.5%) |
| 1 or 2 Children | 1 (10.0%) | 0 (0.0%) |
| 3 or 4 Children | 0 (0.0%) | 0 (0.0%) |
| 5 or more Children | 0 (0.0%) | 0 (0.0%) |
| Total | 1 (3.5%) | 12 (21.8%) |
Race in Cedar Hill
The most populous races in Cedar Hill are White / Caucasian (283 | 79.3%), Two or more Races (59 | 16.5%), and Hispanic or Latino (53 | 14.8%).
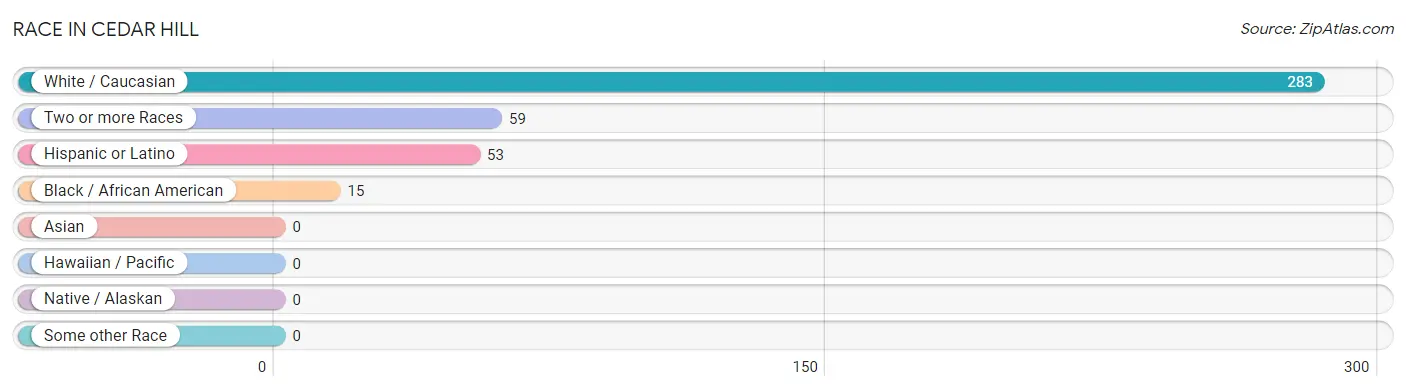
| Race | # Population | % Population |
| Asian | 0 | 0.0% |
| Black / African American | 15 | 4.2% |
| Hawaiian / Pacific | 0 | 0.0% |
| Hispanic or Latino | 53 | 14.8% |
| Native / Alaskan | 0 | 0.0% |
| White / Caucasian | 283 | 79.3% |
| Two or more Races | 59 | 16.5% |
| Some other Race | 0 | 0.0% |
| Total | 357 | 100.0% |
Ancestry in Cedar Hill
The most populous ancestries reported in Cedar Hill are German (91 | 25.5%), American (88 | 24.6%), Spaniard (48 | 13.5%), Irish (42 | 11.8%), and European (14 | 3.9%), together accounting for 79.3% of all Cedar Hill residents.
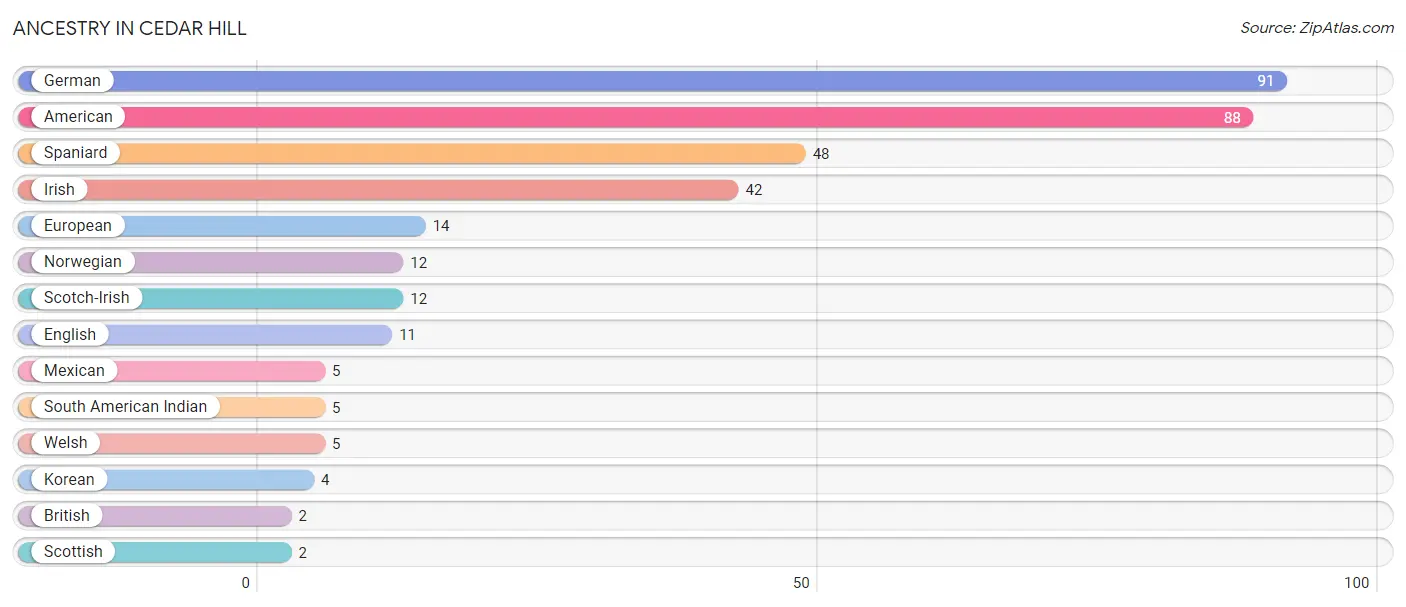
| Ancestry | # Population | % Population |
| American | 88 | 24.6% |
| British | 2 | 0.6% |
| English | 11 | 3.1% |
| European | 14 | 3.9% |
| German | 91 | 25.5% |
| Irish | 42 | 11.8% |
| Korean | 4 | 1.1% |
| Mexican | 5 | 1.4% |
| Norwegian | 12 | 3.4% |
| Scotch-Irish | 12 | 3.4% |
| Scottish | 2 | 0.6% |
| South American Indian | 5 | 1.4% |
| Spaniard | 48 | 13.5% |
| Welsh | 5 | 1.4% | View All 14 Rows |
Immigrants in Cedar Hill

| Immigration Origin | # Population | % Population | View All 0 Rows |
Sex and Age in Cedar Hill
Sex and Age in Cedar Hill
The most populous age groups in Cedar Hill are Under 5 Years (34 | 19.8%) for men and 15 to 19 Years (42 | 22.7%) for women.
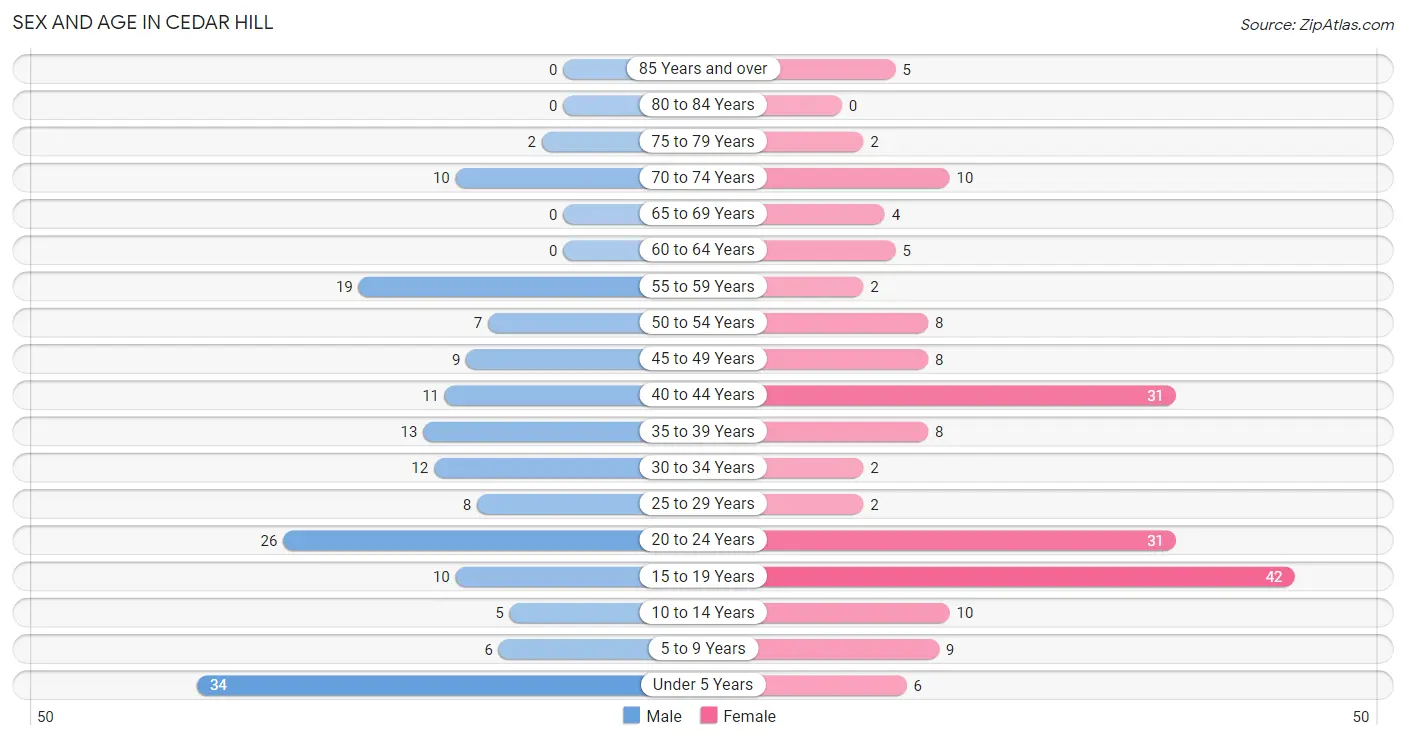
| Age Bracket | Male | Female |
| Under 5 Years | 34 (19.8%) | 6 (3.2%) |
| 5 to 9 Years | 6 (3.5%) | 9 (4.9%) |
| 10 to 14 Years | 5 (2.9%) | 10 (5.4%) |
| 15 to 19 Years | 10 (5.8%) | 42 (22.7%) |
| 20 to 24 Years | 26 (15.1%) | 31 (16.8%) |
| 25 to 29 Years | 8 (4.6%) | 2 (1.1%) |
| 30 to 34 Years | 12 (7.0%) | 2 (1.1%) |
| 35 to 39 Years | 13 (7.6%) | 8 (4.3%) |
| 40 to 44 Years | 11 (6.4%) | 31 (16.8%) |
| 45 to 49 Years | 9 (5.2%) | 8 (4.3%) |
| 50 to 54 Years | 7 (4.1%) | 8 (4.3%) |
| 55 to 59 Years | 19 (11.1%) | 2 (1.1%) |
| 60 to 64 Years | 0 (0.0%) | 5 (2.7%) |
| 65 to 69 Years | 0 (0.0%) | 4 (2.2%) |
| 70 to 74 Years | 10 (5.8%) | 10 (5.4%) |
| 75 to 79 Years | 2 (1.2%) | 2 (1.1%) |
| 80 to 84 Years | 0 (0.0%) | 0 (0.0%) |
| 85 Years and over | 0 (0.0%) | 5 (2.7%) |
| Total | 172 (100.0%) | 185 (100.0%) |
Families and Households in Cedar Hill
Median Family Size in Cedar Hill
The median family size in Cedar Hill is 3.46 persons per family, with married-couple families (29 | 34.5%) accounting for the largest median family size of 4.93 persons per family. On the other hand, single male/father families (19 | 22.6%) represent the smallest median family size with 2.26 persons per family.
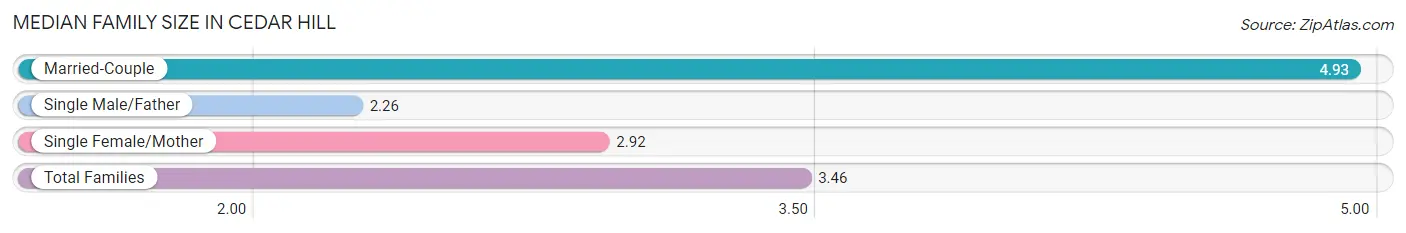
| Family Type | # Families | Family Size |
| Married-Couple | 29 (34.5%) | 4.93 |
| Single Male/Father | 19 (22.6%) | 2.26 |
| Single Female/Mother | 36 (42.9%) | 2.92 |
| Total Families | 84 (100.0%) | 3.46 |
Median Household Size in Cedar Hill
The median household size in Cedar Hill is 2.81 persons per household, with married-couple households (29 | 22.8%) accounting for the largest median household size of 4.93 persons per household. non-family households (43 | 33.9%) represent the smallest median household size with 1.26 persons per household.
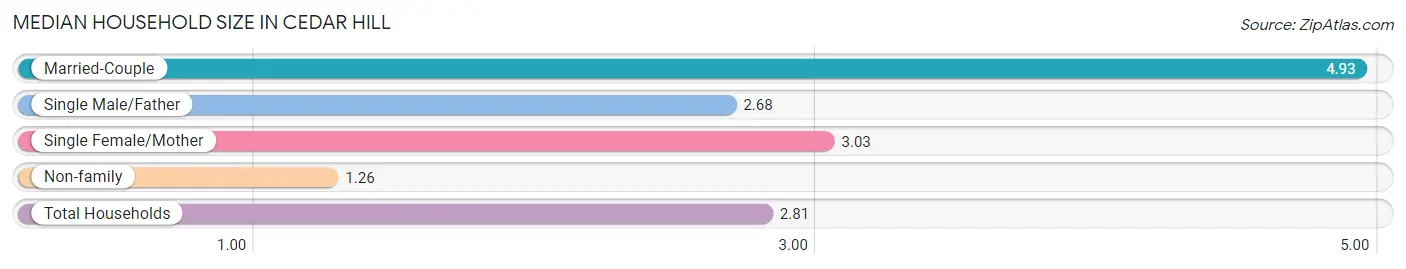
| Household Type | # Households | Household Size |
| Married-Couple | 29 (22.8%) | 4.93 |
| Single Male/Father | 19 (15.0%) | 2.68 |
| Single Female/Mother | 36 (28.3%) | 3.03 |
| Non-family | 43 (33.9%) | 1.26 |
| Total Households | 127 (100.0%) | 2.81 |
Household Size by Marriage Status in Cedar Hill
Out of a total of 127 households in Cedar Hill, 84 (66.1%) are family households, while 43 (33.9%) are nonfamily households. The most numerous type of family households are 2-person households, comprising 33, and the most common type of nonfamily households are 1-person households, comprising 30.
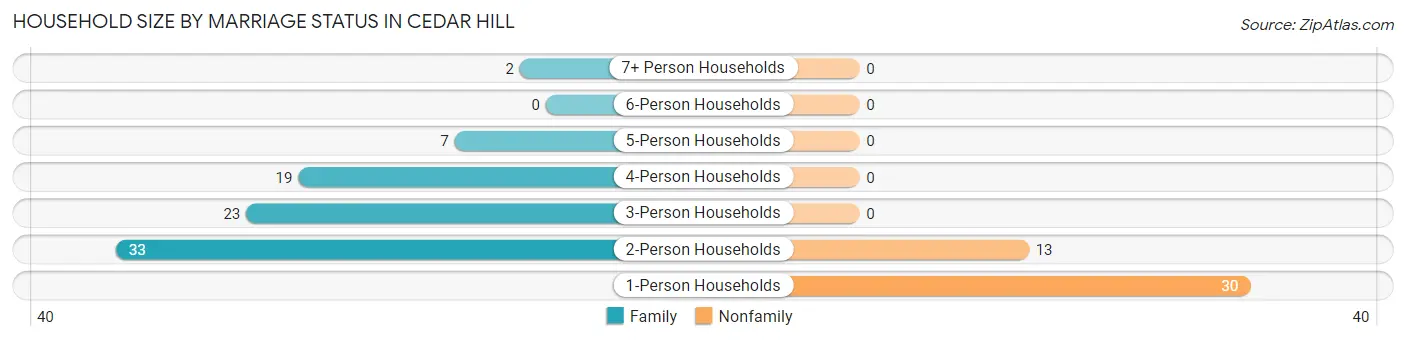
| Household Size | Family Households | Nonfamily Households |
| 1-Person Households | - | 30 (23.6%) |
| 2-Person Households | 33 (26.0%) | 13 (10.2%) |
| 3-Person Households | 23 (18.1%) | 0 (0.0%) |
| 4-Person Households | 19 (15.0%) | 0 (0.0%) |
| 5-Person Households | 7 (5.5%) | 0 (0.0%) |
| 6-Person Households | 0 (0.0%) | 0 (0.0%) |
| 7+ Person Households | 2 (1.6%) | 0 (0.0%) |
| Total | 84 (66.1%) | 43 (33.9%) |
Female Fertility in Cedar Hill
Fertility by Age in Cedar Hill
Average fertility rate in Cedar Hill is 113.0 births per 1,000 women. Women in the age bracket of 20 to 34 years have the highest fertility rate with 257.0 births per 1,000 women. Women in the age bracket of 20 to 34 years acount for 64.3% of all women with births.
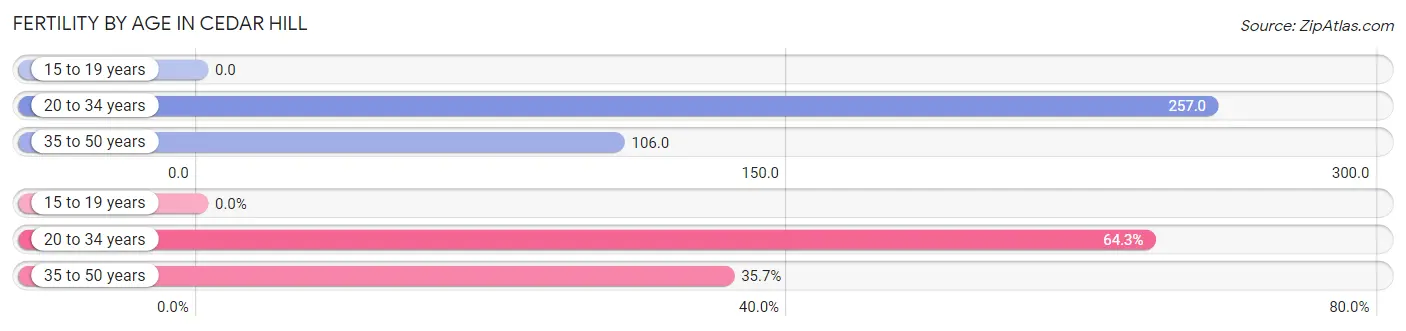
| Age Bracket | Women with Births | Births / 1,000 Women |
| 15 to 19 years | 0 (0.0%) | 0.0 |
| 20 to 34 years | 9 (64.3%) | 257.0 |
| 35 to 50 years | 5 (35.7%) | 106.0 |
| Total | 14 (100.0%) | 113.0 |
Fertility by Age by Marriage Status in Cedar Hill
14.3% of women with births (14) in Cedar Hill are married. The highest percentage of unmarried women with births falls into 35 to 50 years age bracket with 100.0% of them unmarried at the time of birth, while the lowest percentage of unmarried women with births belong to 20 to 34 years age bracket with 77.8% of them unmarried.
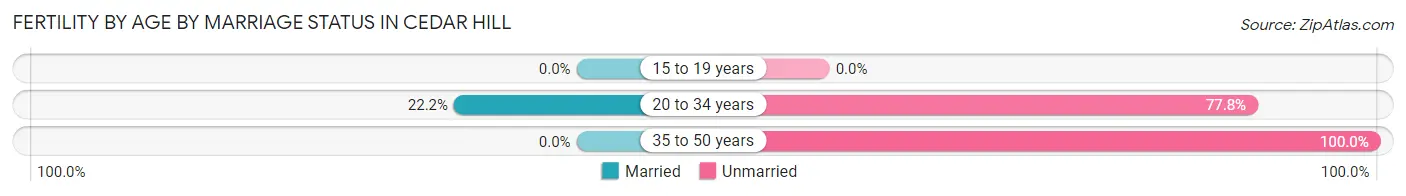
| Age Bracket | Married | Unmarried |
| 15 to 19 years | 0 (0.0%) | 0 (0.0%) |
| 20 to 34 years | 2 (22.2%) | 7 (77.8%) |
| 35 to 50 years | 0 (0.0%) | 5 (100.0%) |
| Total | 2 (14.3%) | 12 (85.7%) |
Fertility by Education in Cedar Hill
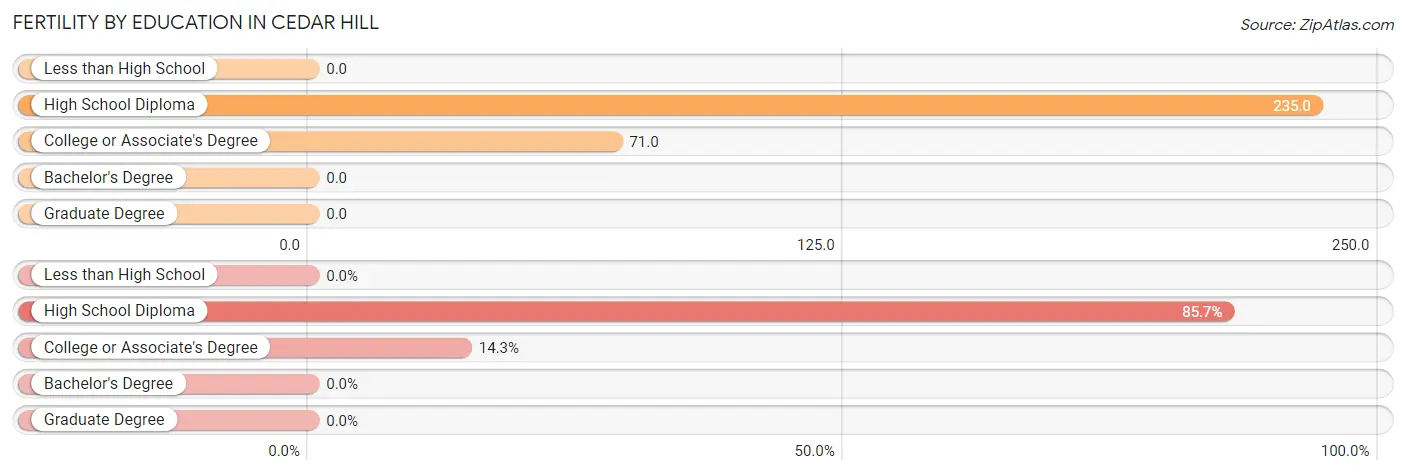
| Educational Attainment | Women with Births | Births / 1,000 Women |
| Less than High School | 0 (0.0%) | 0.0 |
| High School Diploma | 12 (85.7%) | 235.0 |
| College or Associate's Degree | 2 (14.3%) | 71.0 |
| Bachelor's Degree | 0 (0.0%) | 0.0 |
| Graduate Degree | 0 (0.0%) | 0.0 |
| Total | 14 (100.0%) | 113.0 |
Fertility by Education by Marriage Status in Cedar Hill
85.7% of women with births in Cedar Hill are unmarried. Women with the educational attainment of college or associate's degree are most likely to be married with 100.0% of them married at childbirth, while women with the educational attainment of high school diploma are least likely to be married with 100.0% of them unmarried at childbirth.
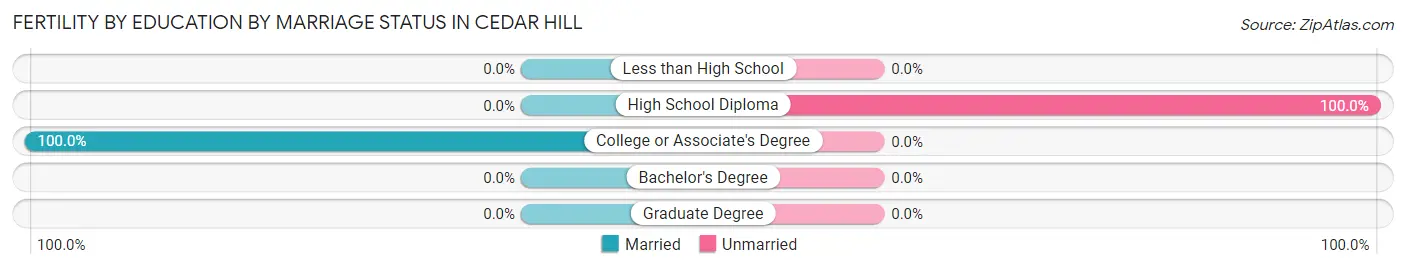
| Educational Attainment | Married | Unmarried |
| Less than High School | 0 (0.0%) | 0 (0.0%) |
| High School Diploma | 0 (0.0%) | 12 (100.0%) |
| College or Associate's Degree | 2 (100.0%) | 0 (0.0%) |
| Bachelor's Degree | 0 (0.0%) | 0 (0.0%) |
| Graduate Degree | 0 (0.0%) | 0 (0.0%) |
| Total | 2 (14.3%) | 12 (85.7%) |
Employment Characteristics in Cedar Hill
Employment by Class of Employer in Cedar Hill
Among the 187 employed individuals in Cedar Hill, private company employees (155 | 82.9%), local government employees (18 | 9.6%), and not-for-profit organizations (6 | 3.2%) make up the most common classes of employment.
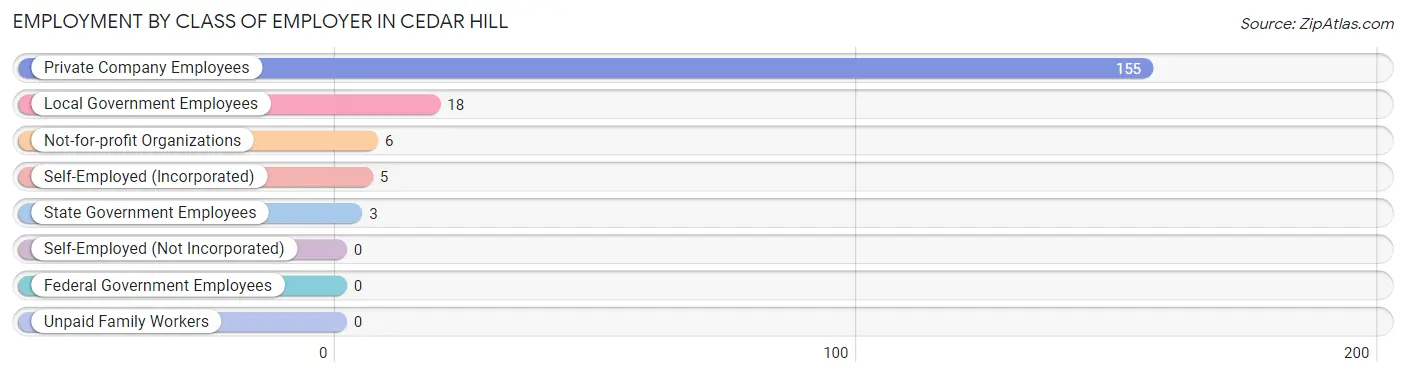
| Employer Class | # Employees | % Employees |
| Private Company Employees | 155 | 82.9% |
| Self-Employed (Incorporated) | 5 | 2.7% |
| Self-Employed (Not Incorporated) | 0 | 0.0% |
| Not-for-profit Organizations | 6 | 3.2% |
| Local Government Employees | 18 | 9.6% |
| State Government Employees | 3 | 1.6% |
| Federal Government Employees | 0 | 0.0% |
| Unpaid Family Workers | 0 | 0.0% |
| Total | 187 | 100.0% |
Employment Status by Age in Cedar Hill
According to the labor force statistics for Cedar Hill, out of the total population over 16 years of age (282), 73.4% or 207 individuals are in the labor force, with 6.8% or 14 of them unemployed. The age group with the highest labor force participation rate is 25 to 29 years, with 100.0% or 10 individuals in the labor force. Within the labor force, the 45 to 54 years age range has the highest percentage of unemployed individuals, with 17.2% or 5 of them being unemployed.
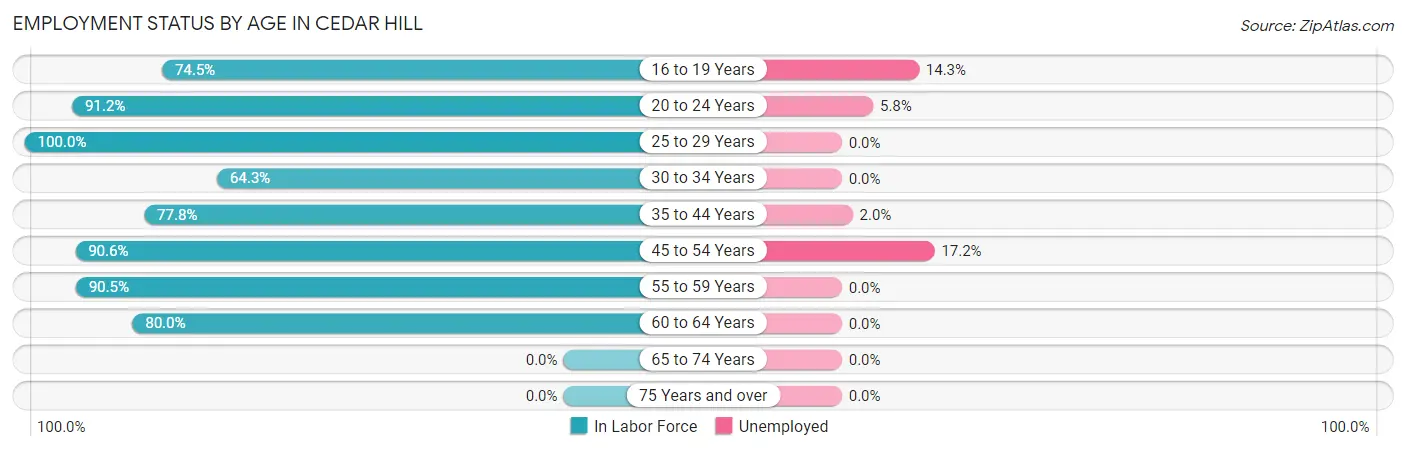
| Age Bracket | In Labor Force | Unemployed |
| 16 to 19 Years | 35 (74.5%) | 5 (14.3%) |
| 20 to 24 Years | 52 (91.2%) | 3 (5.8%) |
| 25 to 29 Years | 10 (100.0%) | 0 (0.0%) |
| 30 to 34 Years | 9 (64.3%) | 0 (0.0%) |
| 35 to 44 Years | 49 (77.8%) | 1 (2.0%) |
| 45 to 54 Years | 29 (90.6%) | 5 (17.2%) |
| 55 to 59 Years | 19 (90.5%) | 0 (0.0%) |
| 60 to 64 Years | 4 (80.0%) | 0 (0.0%) |
| 65 to 74 Years | 0 (0.0%) | 0 (0.0%) |
| 75 Years and over | 0 (0.0%) | 0 (0.0%) |
| Total | 207 (73.4%) | 14 (6.8%) |
Employment Status by Educational Attainment in Cedar Hill
According to labor force statistics for Cedar Hill, 82.8% of individuals (120) out of the total population between 25 and 64 years of age (145) are in the labor force, with 5.0% or 6 of them being unemployed. The group with the highest labor force participation rate are those with the educational attainment of college / associate degree, with 100.0% or 36 individuals in the labor force. Within the labor force, individuals with high school diploma education have the highest percentage of unemployment, with 10.7% or 6 of them being unemployed.
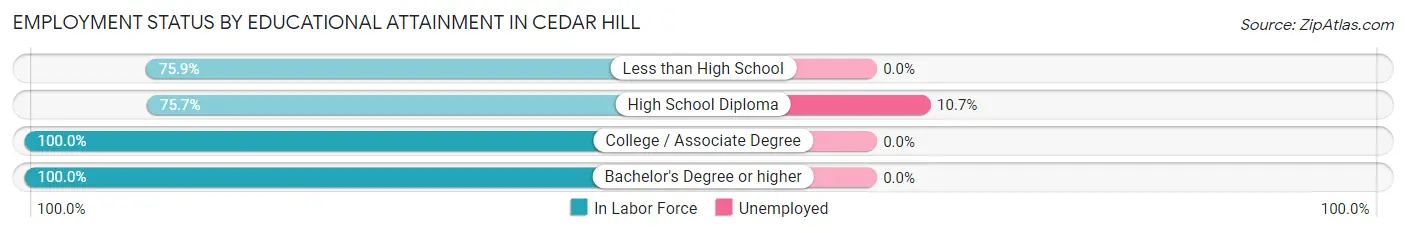
| Educational Attainment | In Labor Force | Unemployed |
| Less than High School | 22 (75.9%) | 0 (0.0%) |
| High School Diploma | 56 (75.7%) | 8 (10.7%) |
| College / Associate Degree | 36 (100.0%) | 0 (0.0%) |
| Bachelor's Degree or higher | 6 (100.0%) | 0 (0.0%) |
| Total | 120 (82.8%) | 7 (5.0%) |
Employment Occupations by Sex in Cedar Hill
Management, Business, Science and Arts Occupations
The most common Management, Business, Science and Arts occupations in Cedar Hill are Management (17 | 8.8%), Community & Social Service (8 | 4.2%), Education Instruction & Library (6 | 3.1%), Health Diagnosing & Treating (5 | 2.6%), and Business & Financial (2 | 1.0%).
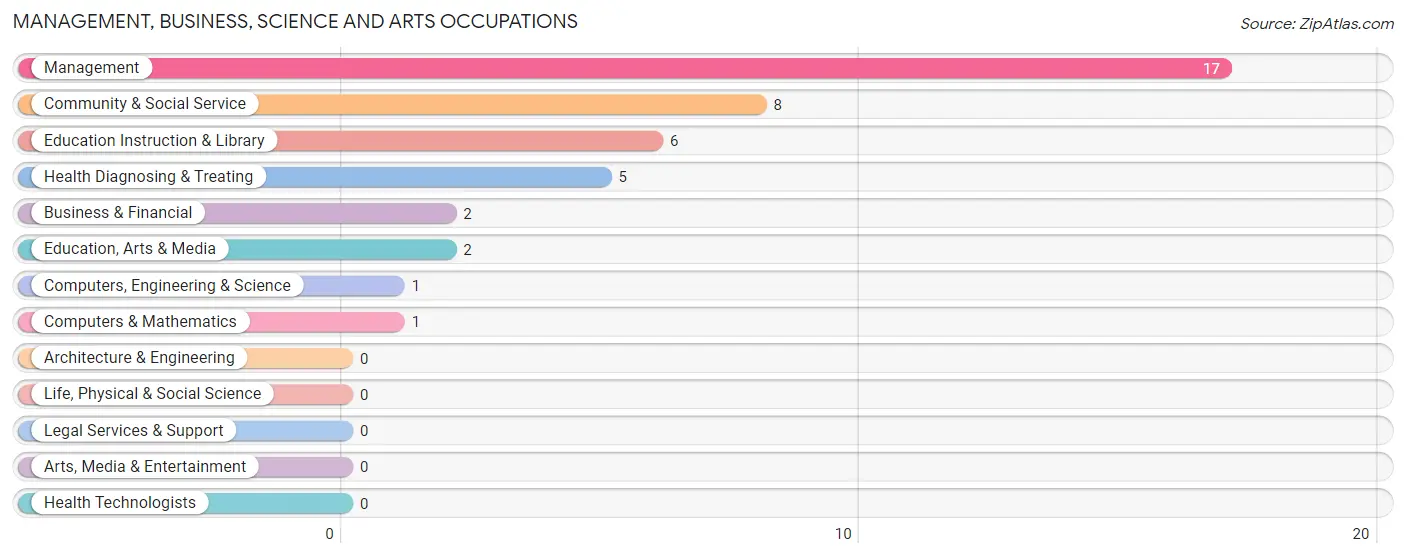
Management, Business, Science and Arts Occupations by Sex
Within the Management, Business, Science and Arts occupations in Cedar Hill, the most male-oriented occupations are Computers, Engineering & Science (100.0%), Computers & Mathematics (100.0%), and Education, Arts & Media (100.0%), while the most female-oriented occupations are Business & Financial (100.0%), Education Instruction & Library (100.0%), and Health Diagnosing & Treating (100.0%).

| Occupation | Male | Female |
| Management | 7 (41.2%) | 10 (58.8%) |
| Business & Financial | 0 (0.0%) | 2 (100.0%) |
| Computers, Engineering & Science | 1 (100.0%) | 0 (0.0%) |
| Computers & Mathematics | 1 (100.0%) | 0 (0.0%) |
| Architecture & Engineering | 0 (0.0%) | 0 (0.0%) |
| Life, Physical & Social Science | 0 (0.0%) | 0 (0.0%) |
| Community & Social Service | 2 (25.0%) | 6 (75.0%) |
| Education, Arts & Media | 2 (100.0%) | 0 (0.0%) |
| Legal Services & Support | 0 (0.0%) | 0 (0.0%) |
| Education Instruction & Library | 0 (0.0%) | 6 (100.0%) |
| Arts, Media & Entertainment | 0 (0.0%) | 0 (0.0%) |
| Health Diagnosing & Treating | 0 (0.0%) | 5 (100.0%) |
| Health Technologists | 0 (0.0%) | 0 (0.0%) |
| Total (Category) | 10 (30.3%) | 23 (69.7%) |
| Total (Overall) | 86 (44.6%) | 107 (55.4%) |
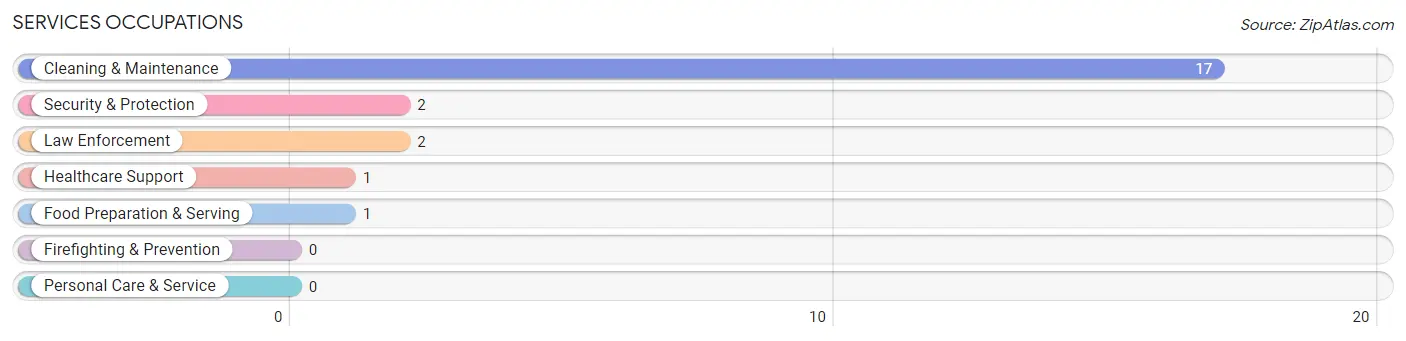
Services Occupations
The most common Services occupations in Cedar Hill are Cleaning & Maintenance (17 | 8.8%), Security & Protection (2 | 1.0%), Law Enforcement (2 | 1.0%), Healthcare Support (1 | 0.5%), and Food Preparation & Serving (1 | 0.5%).
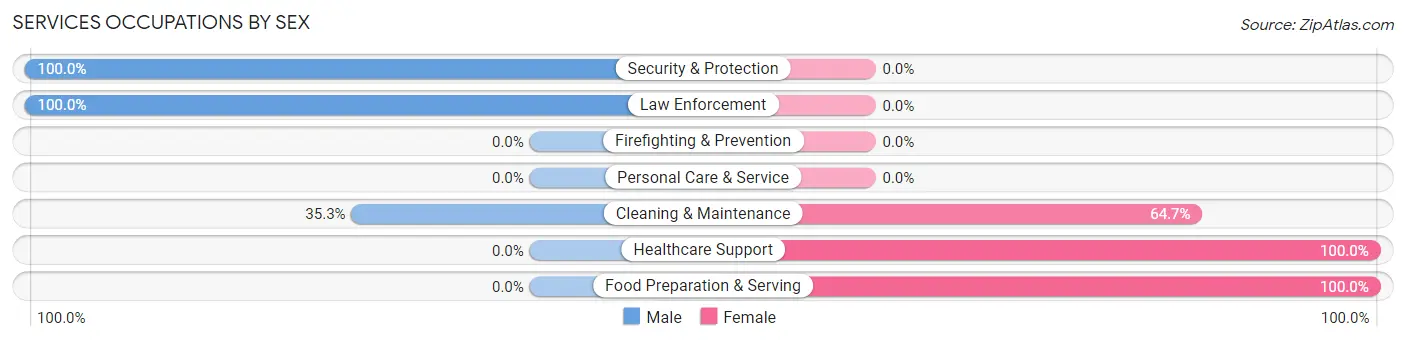
Services Occupations by Sex
Within the Services occupations in Cedar Hill, the most male-oriented occupations are Security & Protection (100.0%), Law Enforcement (100.0%), and Cleaning & Maintenance (35.3%), while the most female-oriented occupations are Healthcare Support (100.0%), Food Preparation & Serving (100.0%), and Cleaning & Maintenance (64.7%).
| Occupation | Male | Female |
| Healthcare Support | 0 (0.0%) | 1 (100.0%) |
| Security & Protection | 2 (100.0%) | 0 (0.0%) |
| Firefighting & Prevention | 0 (0.0%) | 0 (0.0%) |
| Law Enforcement | 2 (100.0%) | 0 (0.0%) |
| Food Preparation & Serving | 0 (0.0%) | 1 (100.0%) |
| Cleaning & Maintenance | 6 (35.3%) | 11 (64.7%) |
| Personal Care & Service | 0 (0.0%) | 0 (0.0%) |
| Total (Category) | 8 (38.1%) | 13 (61.9%) |
| Total (Overall) | 86 (44.6%) | 107 (55.4%) |
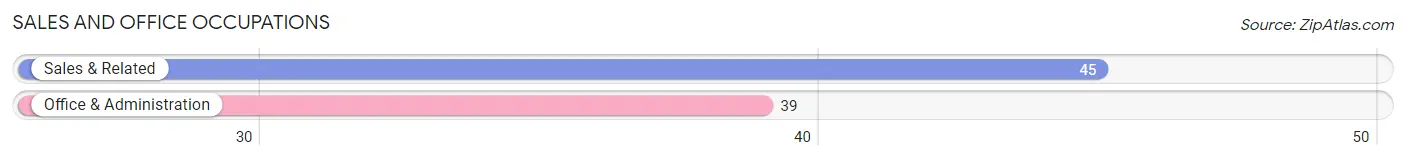
Sales and Office Occupations
The most common Sales and Office occupations in Cedar Hill are Sales & Related (45 | 23.3%), and Office & Administration (39 | 20.2%).
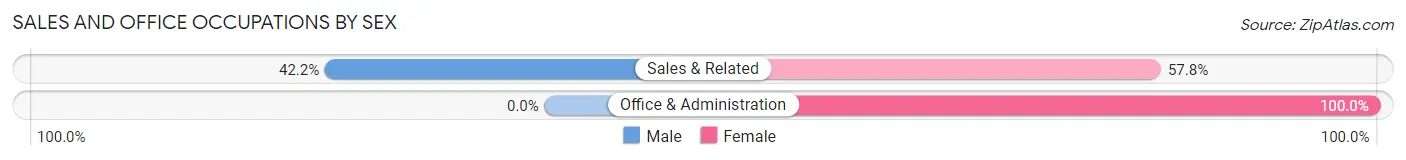
Sales and Office Occupations by Sex
| Occupation | Male | Female |
| Sales & Related | 19 (42.2%) | 26 (57.8%) |
| Office & Administration | 0 (0.0%) | 39 (100.0%) |
| Total (Category) | 19 (22.6%) | 65 (77.4%) |
| Total (Overall) | 86 (44.6%) | 107 (55.4%) |
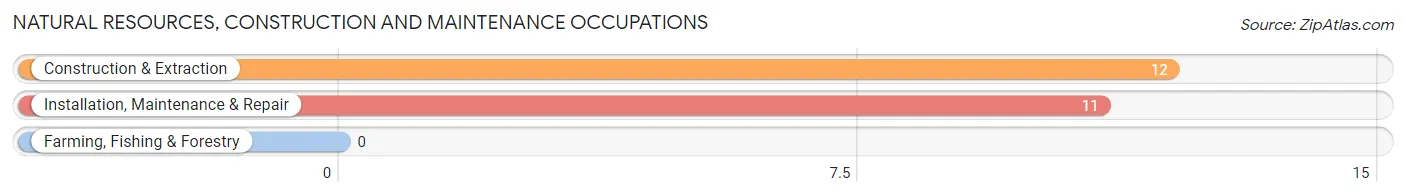
Natural Resources, Construction and Maintenance Occupations
The most common Natural Resources, Construction and Maintenance occupations in Cedar Hill are Construction & Extraction (12 | 6.2%), and Installation, Maintenance & Repair (11 | 5.7%).
Natural Resources, Construction and Maintenance Occupations by Sex
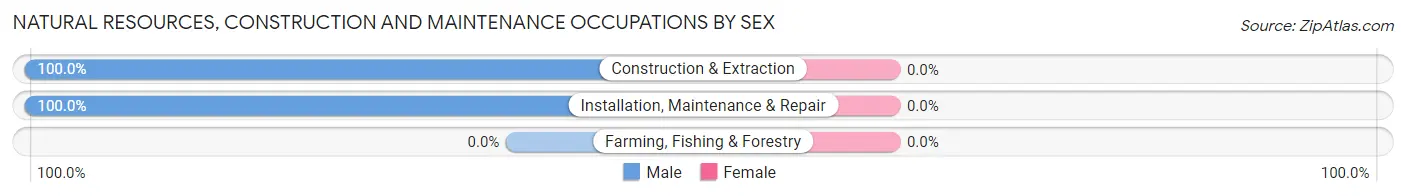
| Occupation | Male | Female |
| Farming, Fishing & Forestry | 0 (0.0%) | 0 (0.0%) |
| Construction & Extraction | 12 (100.0%) | 0 (0.0%) |
| Installation, Maintenance & Repair | 11 (100.0%) | 0 (0.0%) |
| Total (Category) | 23 (100.0%) | 0 (0.0%) |
| Total (Overall) | 86 (44.6%) | 107 (55.4%) |
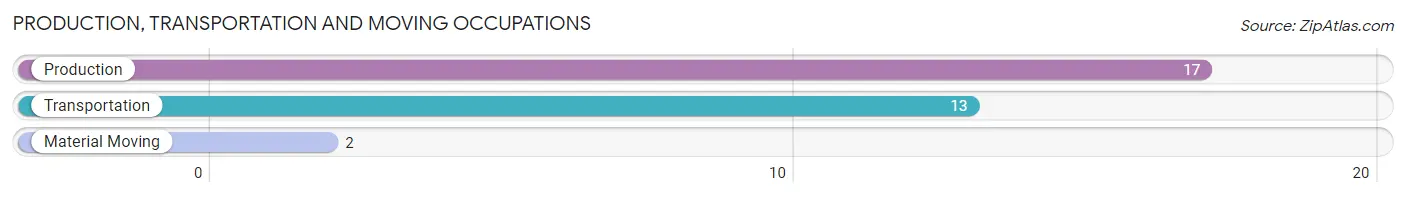
Production, Transportation and Moving Occupations
The most common Production, Transportation and Moving occupations in Cedar Hill are Production (17 | 8.8%), Transportation (13 | 6.7%), and Material Moving (2 | 1.0%).
Production, Transportation and Moving Occupations by Sex
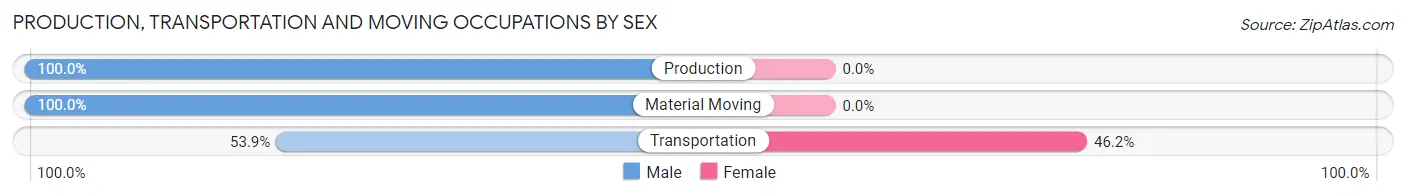
| Occupation | Male | Female |
| Production | 17 (100.0%) | 0 (0.0%) |
| Transportation | 7 (53.8%) | 6 (46.2%) |
| Material Moving | 2 (100.0%) | 0 (0.0%) |
| Total (Category) | 26 (81.2%) | 6 (18.8%) |
| Total (Overall) | 86 (44.6%) | 107 (55.4%) |
Employment Industries by Sex in Cedar Hill
Employment Industries in Cedar Hill
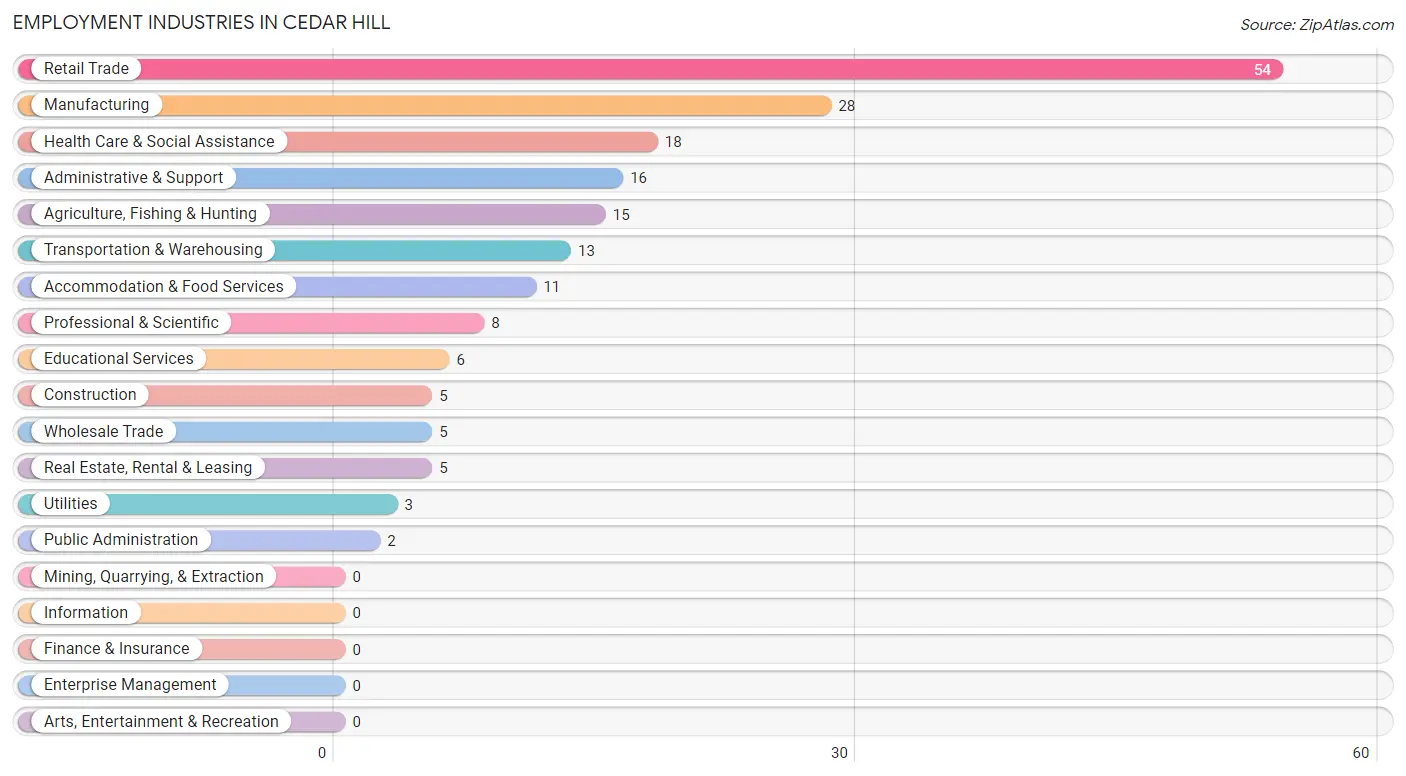
The major employment industries in Cedar Hill include Retail Trade (54 | 28.0%), Manufacturing (28 | 14.5%), Health Care & Social Assistance (18 | 9.3%), Administrative & Support (16 | 8.3%), and Agriculture, Fishing & Hunting (15 | 7.8%).
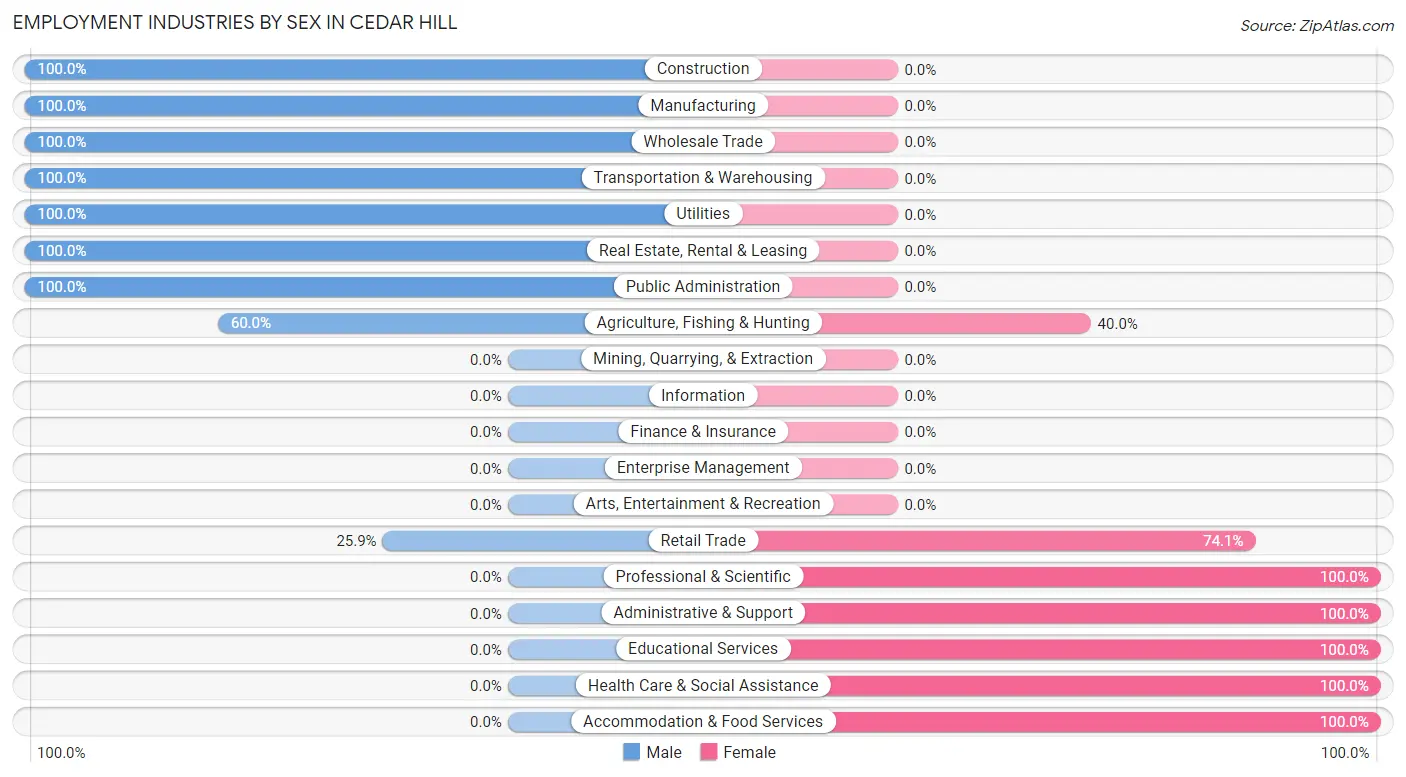
Employment Industries by Sex in Cedar Hill
The Cedar Hill industries that see more men than women are Construction (100.0%), Manufacturing (100.0%), and Wholesale Trade (100.0%), whereas the industries that tend to have a higher number of women are Professional & Scientific (100.0%), Administrative & Support (100.0%), and Educational Services (100.0%).
| Industry | Male | Female |
| Agriculture, Fishing & Hunting | 9 (60.0%) | 6 (40.0%) |
| Mining, Quarrying, & Extraction | 0 (0.0%) | 0 (0.0%) |
| Construction | 5 (100.0%) | 0 (0.0%) |
| Manufacturing | 28 (100.0%) | 0 (0.0%) |
| Wholesale Trade | 5 (100.0%) | 0 (0.0%) |
| Retail Trade | 14 (25.9%) | 40 (74.1%) |
| Transportation & Warehousing | 13 (100.0%) | 0 (0.0%) |
| Utilities | 3 (100.0%) | 0 (0.0%) |
| Information | 0 (0.0%) | 0 (0.0%) |
| Finance & Insurance | 0 (0.0%) | 0 (0.0%) |
| Real Estate, Rental & Leasing | 5 (100.0%) | 0 (0.0%) |
| Professional & Scientific | 0 (0.0%) | 8 (100.0%) |
| Enterprise Management | 0 (0.0%) | 0 (0.0%) |
| Administrative & Support | 0 (0.0%) | 16 (100.0%) |
| Educational Services | 0 (0.0%) | 6 (100.0%) |
| Health Care & Social Assistance | 0 (0.0%) | 18 (100.0%) |
| Arts, Entertainment & Recreation | 0 (0.0%) | 0 (0.0%) |
| Accommodation & Food Services | 0 (0.0%) | 11 (100.0%) |
| Public Administration | 2 (100.0%) | 0 (0.0%) |
| Total | 86 (44.6%) | 107 (55.4%) |
Education in Cedar Hill
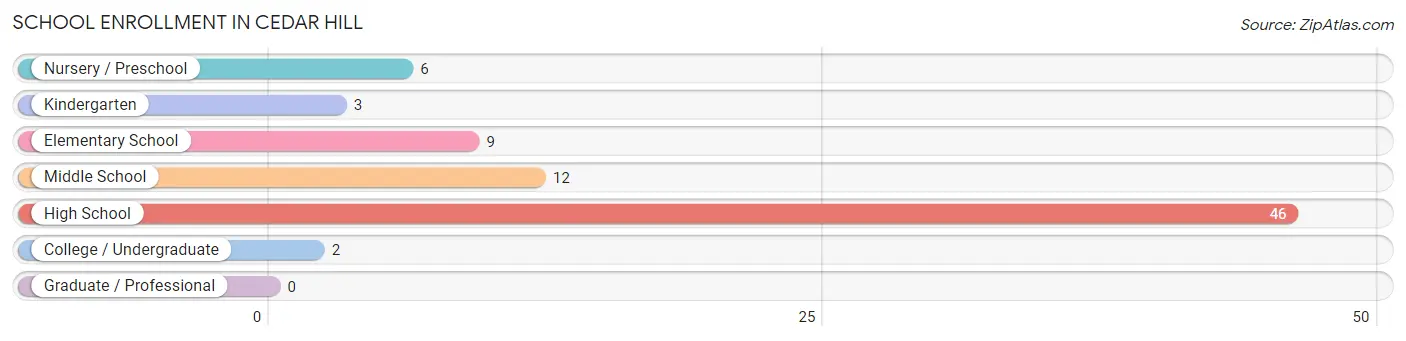
School Enrollment in Cedar Hill
The most common levels of schooling among the 78 students in Cedar Hill are high school (46 | 59.0%), middle school (12 | 15.4%), and elementary school (9 | 11.5%).
| School Level | # Students | % Students |
| Nursery / Preschool | 6 | 7.7% |
| Kindergarten | 3 | 3.8% |
| Elementary School | 9 | 11.5% |
| Middle School | 12 | 15.4% |
| High School | 46 | 59.0% |
| College / Undergraduate | 2 | 2.6% |
| Graduate / Professional | 0 | 0.0% |
| Total | 78 | 100.0% |
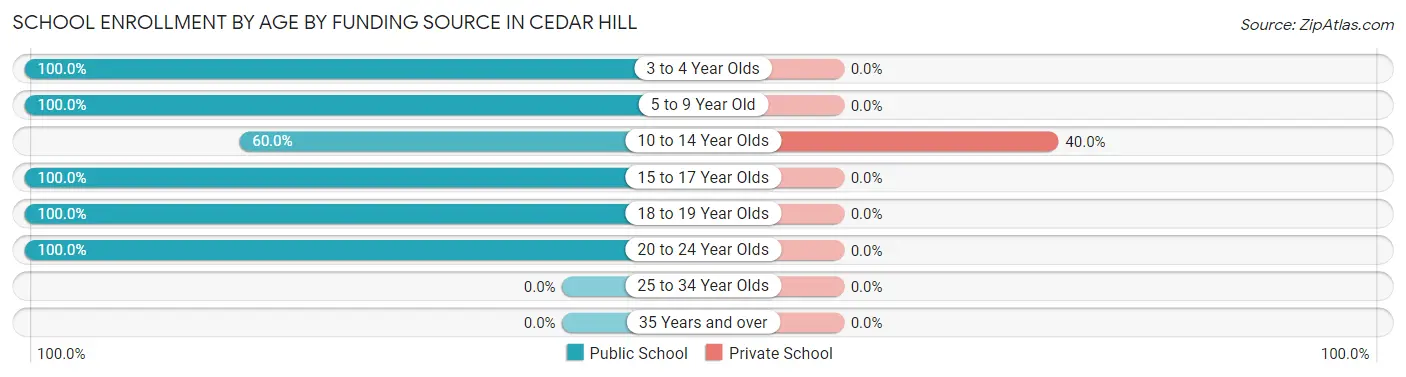
School Enrollment by Age by Funding Source in Cedar Hill
Out of a total of 78 students who are enrolled in schools in Cedar Hill, 6 (7.7%) attend a private institution, while the remaining 72 (92.3%) are enrolled in public schools. The age group of 10 to 14 year olds has the highest likelihood of being enrolled in private schools, with 6 (40.0% in the age bracket) enrolled. Conversely, the age group of 3 to 4 year olds has the lowest likelihood of being enrolled in a private school, with 6 (100.0% in the age bracket) attending a public institution.
| Age Bracket | Public School | Private School |
| 3 to 4 Year Olds | 6 (100.0%) | 0 (0.0%) |
| 5 to 9 Year Old | 9 (100.0%) | 0 (0.0%) |
| 10 to 14 Year Olds | 9 (60.0%) | 6 (40.0%) |
| 15 to 17 Year Olds | 41 (100.0%) | 0 (0.0%) |
| 18 to 19 Year Olds | 5 (100.0%) | 0 (0.0%) |
| 20 to 24 Year Olds | 2 (100.0%) | 0 (0.0%) |
| 25 to 34 Year Olds | 0 (0.0%) | 0 (0.0%) |
| 35 Years and over | 0 (0.0%) | 0 (0.0%) |
| Total | 72 (92.3%) | 6 (7.7%) |
Educational Attainment by Field of Study in Cedar Hill
Liberal arts & history (4 | 50.0%), social sciences (2 | 25.0%), and education (2 | 25.0%) are the most common fields of study among 8 individuals in Cedar Hill who have obtained a bachelor's degree or higher.
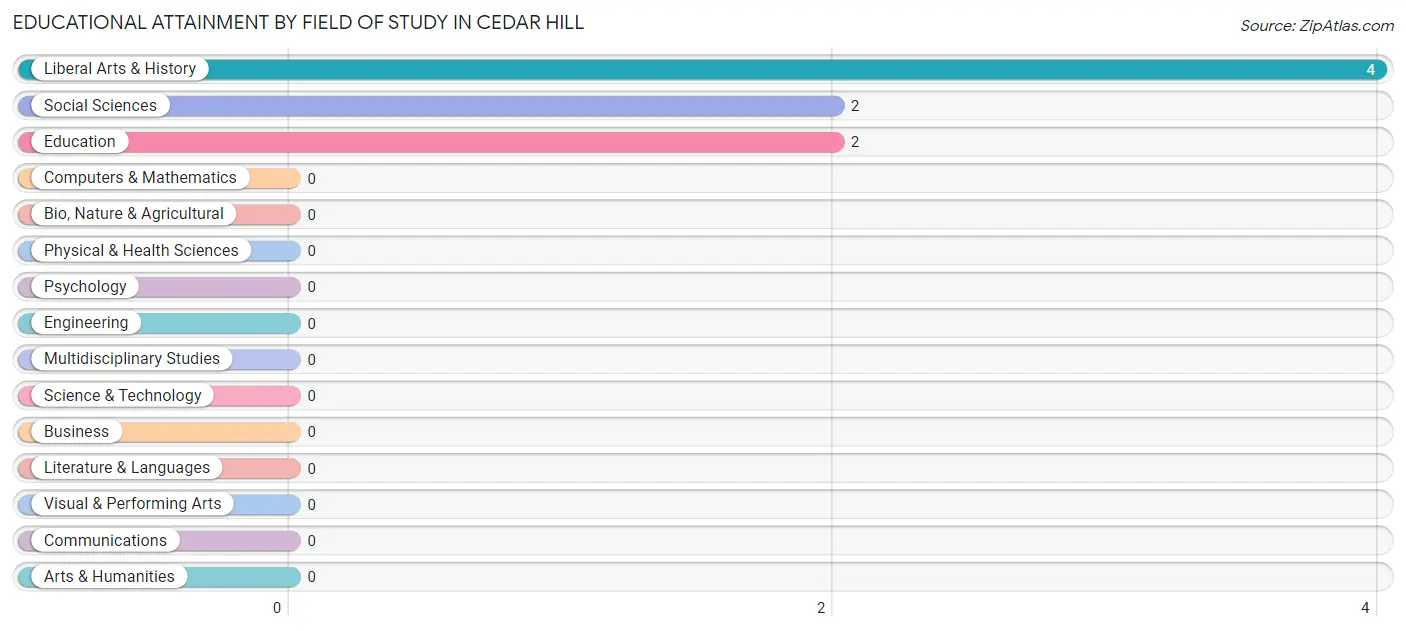
| Field of Study | # Graduates | % Graduates |
| Computers & Mathematics | 0 | 0.0% |
| Bio, Nature & Agricultural | 0 | 0.0% |
| Physical & Health Sciences | 0 | 0.0% |
| Psychology | 0 | 0.0% |
| Social Sciences | 2 | 25.0% |
| Engineering | 0 | 0.0% |
| Multidisciplinary Studies | 0 | 0.0% |
| Science & Technology | 0 | 0.0% |
| Business | 0 | 0.0% |
| Education | 2 | 25.0% |
| Literature & Languages | 0 | 0.0% |
| Liberal Arts & History | 4 | 50.0% |
| Visual & Performing Arts | 0 | 0.0% |
| Communications | 0 | 0.0% |
| Arts & Humanities | 0 | 0.0% |
| Total | 8 | 100.0% |
Transportation & Commute in Cedar Hill
Vehicle Availability by Sex in Cedar Hill
The most prevalent vehicle ownership categories in Cedar Hill are males with 1 vehicle (28, accounting for 35.0%) and females with 1 vehicle (13, making up 26.2%).
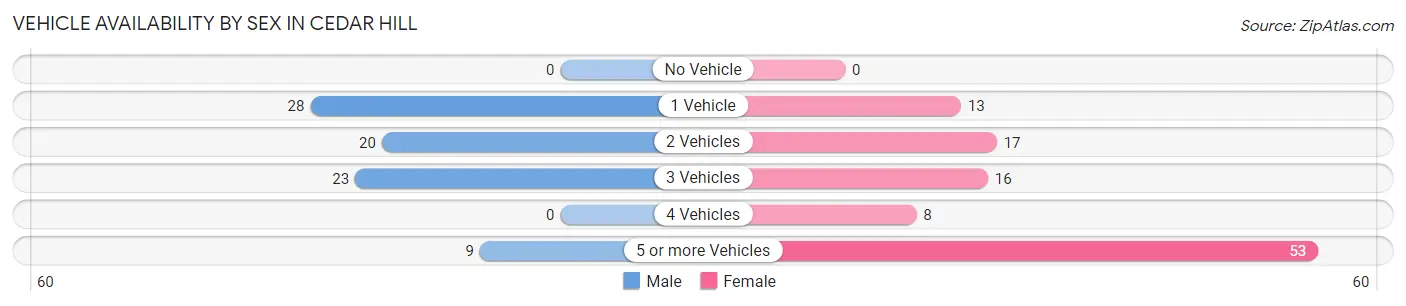
| Vehicles Available | Male | Female |
| No Vehicle | 0 (0.0%) | 0 (0.0%) |
| 1 Vehicle | 28 (35.0%) | 13 (12.1%) |
| 2 Vehicles | 20 (25.0%) | 17 (15.9%) |
| 3 Vehicles | 23 (28.7%) | 16 (14.9%) |
| 4 Vehicles | 0 (0.0%) | 8 (7.5%) |
| 5 or more Vehicles | 9 (11.3%) | 53 (49.5%) |
| Total | 80 (100.0%) | 107 (100.0%) |
Commute Time in Cedar Hill
The most frequently occuring commute durations in Cedar Hill are 15 to 19 minutes (43 commuters, 24.7%), 5 to 9 minutes (25 commuters, 14.4%), and 20 to 24 minutes (23 commuters, 13.2%).
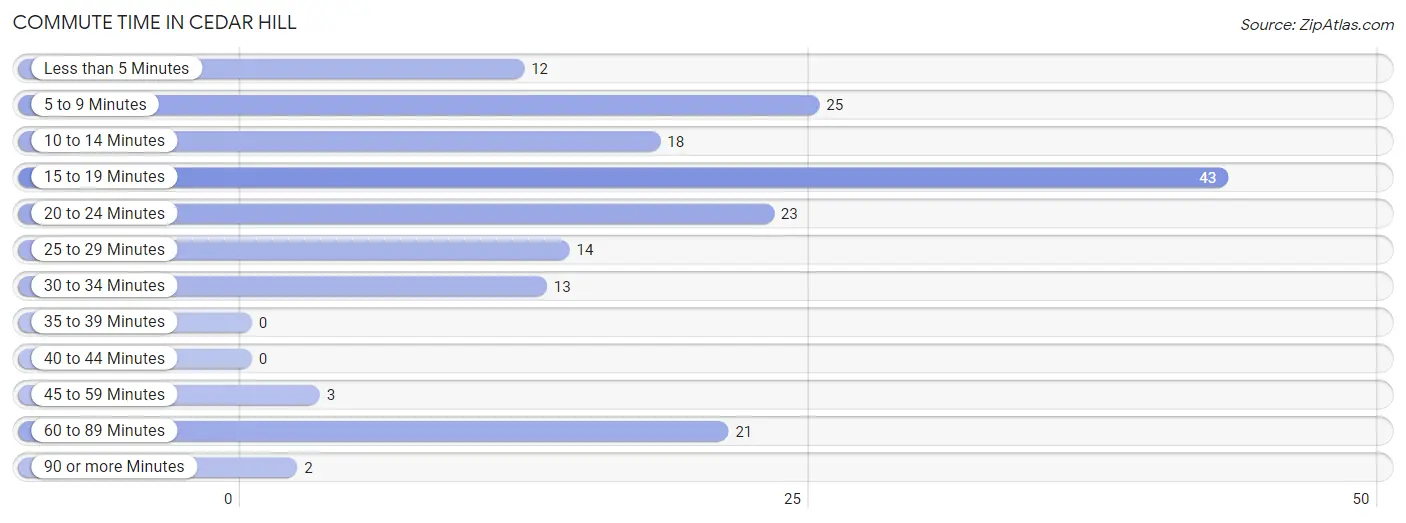
| Commute Time | # Commuters | % Commuters |
| Less than 5 Minutes | 12 | 6.9% |
| 5 to 9 Minutes | 25 | 14.4% |
| 10 to 14 Minutes | 18 | 10.3% |
| 15 to 19 Minutes | 43 | 24.7% |
| 20 to 24 Minutes | 23 | 13.2% |
| 25 to 29 Minutes | 14 | 8.1% |
| 30 to 34 Minutes | 13 | 7.5% |
| 35 to 39 Minutes | 0 | 0.0% |
| 40 to 44 Minutes | 0 | 0.0% |
| 45 to 59 Minutes | 3 | 1.7% |
| 60 to 89 Minutes | 21 | 12.1% |
| 90 or more Minutes | 2 | 1.1% |
Commute Time by Sex in Cedar Hill
The most common commute times in Cedar Hill are 20 to 24 minutes (14 commuters, 17.5%) for males and 15 to 19 minutes (34 commuters, 36.2%) for females.
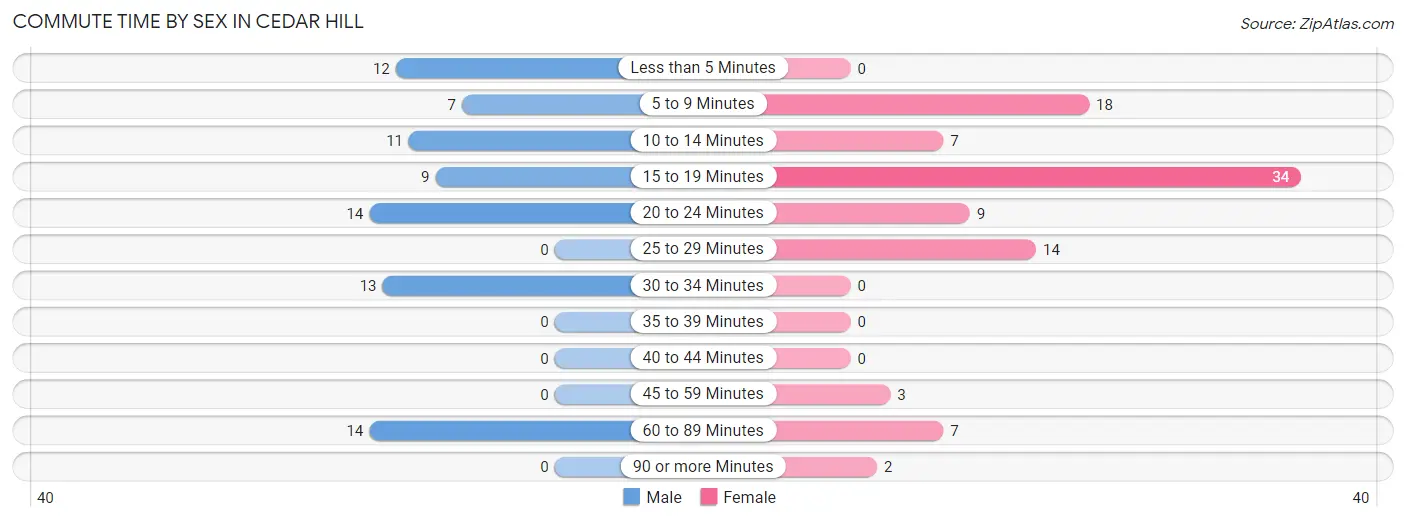
| Commute Time | Male | Female |
| Less than 5 Minutes | 12 (15.0%) | 0 (0.0%) |
| 5 to 9 Minutes | 7 (8.7%) | 18 (19.2%) |
| 10 to 14 Minutes | 11 (13.8%) | 7 (7.4%) |
| 15 to 19 Minutes | 9 (11.3%) | 34 (36.2%) |
| 20 to 24 Minutes | 14 (17.5%) | 9 (9.6%) |
| 25 to 29 Minutes | 0 (0.0%) | 14 (14.9%) |
| 30 to 34 Minutes | 13 (16.3%) | 0 (0.0%) |
| 35 to 39 Minutes | 0 (0.0%) | 0 (0.0%) |
| 40 to 44 Minutes | 0 (0.0%) | 0 (0.0%) |
| 45 to 59 Minutes | 0 (0.0%) | 3 (3.2%) |
| 60 to 89 Minutes | 14 (17.5%) | 7 (7.4%) |
| 90 or more Minutes | 0 (0.0%) | 2 (2.1%) |
Time of Departure to Work by Sex in Cedar Hill
The most frequent times of departure to work in Cedar Hill are 7:00 AM to 7:29 AM (21, 26.3%) for males and 6:00 AM to 6:29 AM (34, 36.2%) for females.
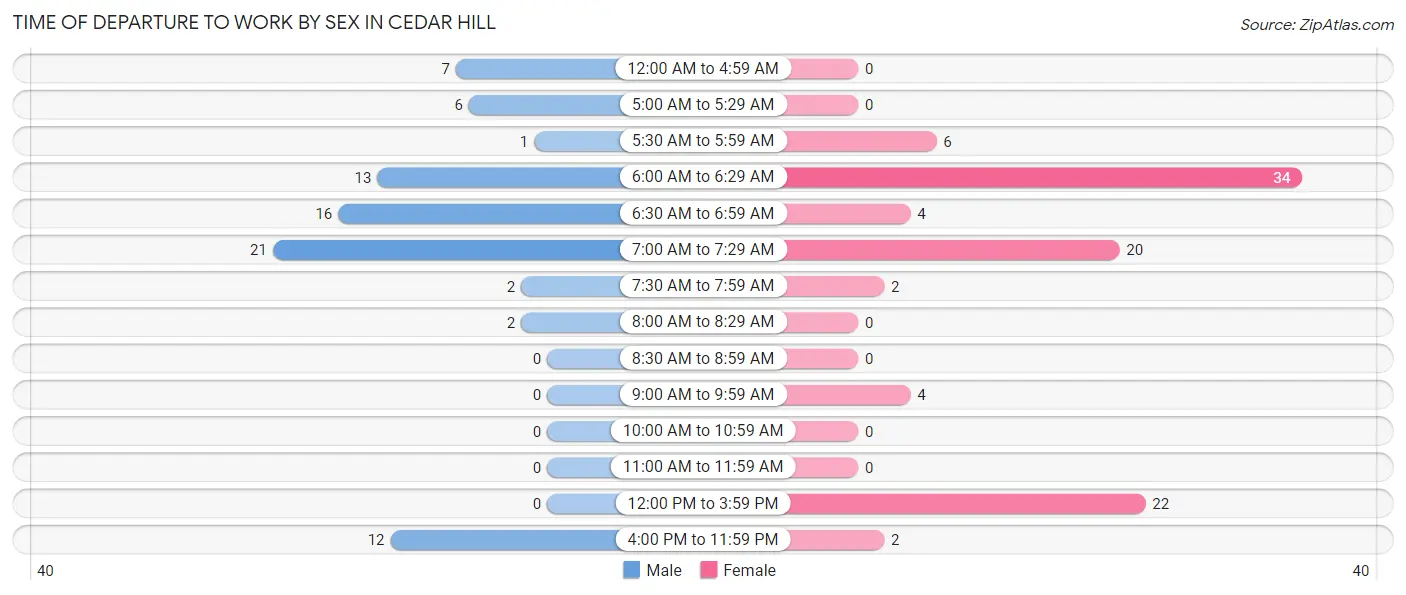
| Time of Departure | Male | Female |
| 12:00 AM to 4:59 AM | 7 (8.7%) | 0 (0.0%) |
| 5:00 AM to 5:29 AM | 6 (7.5%) | 0 (0.0%) |
| 5:30 AM to 5:59 AM | 1 (1.3%) | 6 (6.4%) |
| 6:00 AM to 6:29 AM | 13 (16.3%) | 34 (36.2%) |
| 6:30 AM to 6:59 AM | 16 (20.0%) | 4 (4.3%) |
| 7:00 AM to 7:29 AM | 21 (26.3%) | 20 (21.3%) |
| 7:30 AM to 7:59 AM | 2 (2.5%) | 2 (2.1%) |
| 8:00 AM to 8:29 AM | 2 (2.5%) | 0 (0.0%) |
| 8:30 AM to 8:59 AM | 0 (0.0%) | 0 (0.0%) |
| 9:00 AM to 9:59 AM | 0 (0.0%) | 4 (4.3%) |
| 10:00 AM to 10:59 AM | 0 (0.0%) | 0 (0.0%) |
| 11:00 AM to 11:59 AM | 0 (0.0%) | 0 (0.0%) |
| 12:00 PM to 3:59 PM | 0 (0.0%) | 22 (23.4%) |
| 4:00 PM to 11:59 PM | 12 (15.0%) | 2 (2.1%) |
| Total | 80 (100.0%) | 94 (100.0%) |
Housing Occupancy in Cedar Hill
Occupancy by Ownership in Cedar Hill
Of the total 127 dwellings in Cedar Hill, owner-occupied units account for 90 (70.9%), while renter-occupied units make up 37 (29.1%).
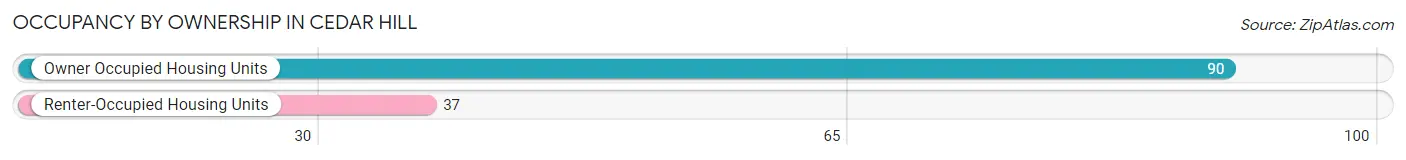
| Occupancy | # Housing Units | % Housing Units |
| Owner Occupied Housing Units | 90 | 70.9% |
| Renter-Occupied Housing Units | 37 | 29.1% |
| Total Occupied Housing Units | 127 | 100.0% |
Occupancy by Household Size in Cedar Hill
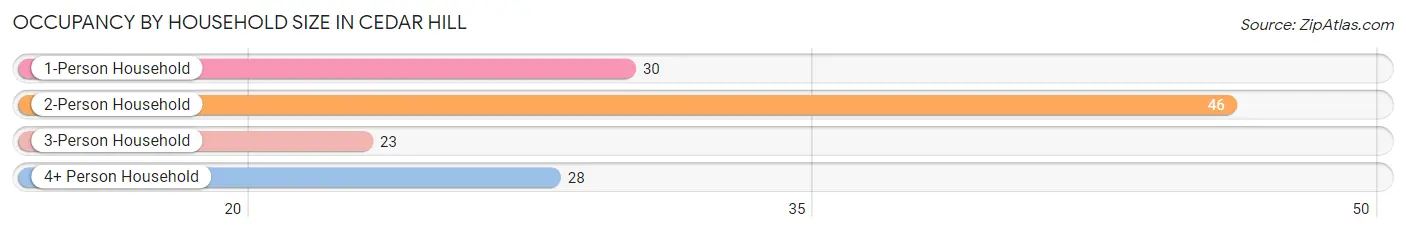
| Household Size | # Housing Units | % Housing Units |
| 1-Person Household | 30 | 23.6% |
| 2-Person Household | 46 | 36.2% |
| 3-Person Household | 23 | 18.1% |
| 4+ Person Household | 28 | 22.1% |
| Total Housing Units | 127 | 100.0% |
Occupancy by Ownership by Household Size in Cedar Hill
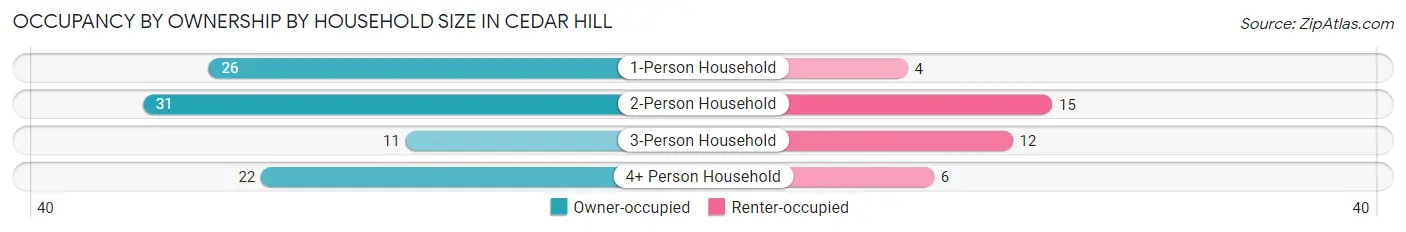
| Household Size | Owner-occupied | Renter-occupied |
| 1-Person Household | 26 (86.7%) | 4 (13.3%) |
| 2-Person Household | 31 (67.4%) | 15 (32.6%) |
| 3-Person Household | 11 (47.8%) | 12 (52.2%) |
| 4+ Person Household | 22 (78.6%) | 6 (21.4%) |
| Total Housing Units | 90 (70.9%) | 37 (29.1%) |
Occupancy by Educational Attainment in Cedar Hill
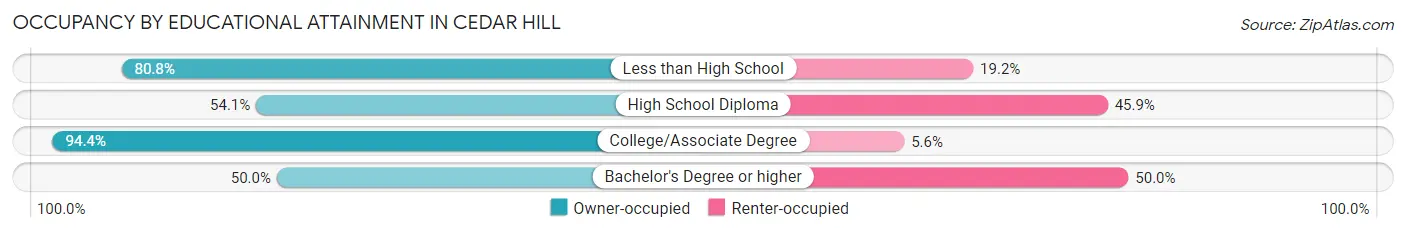
| Household Size | Owner-occupied | Renter-occupied |
| Less than High School | 21 (80.8%) | 5 (19.2%) |
| High School Diploma | 33 (54.1%) | 28 (45.9%) |
| College/Associate Degree | 34 (94.4%) | 2 (5.6%) |
| Bachelor's Degree or higher | 2 (50.0%) | 2 (50.0%) |
Occupancy by Age of Householder in Cedar Hill
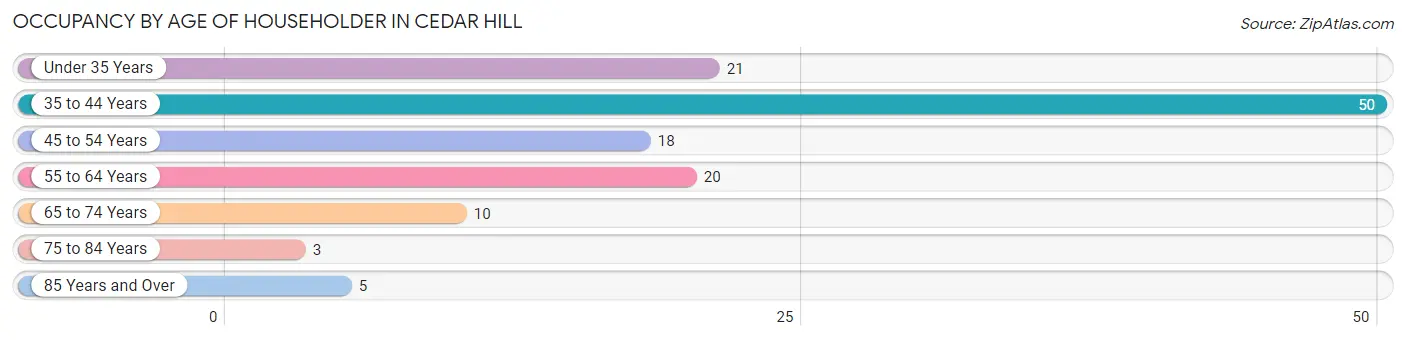
| Age Bracket | # Households | % Households |
| Under 35 Years | 21 | 16.5% |
| 35 to 44 Years | 50 | 39.4% |
| 45 to 54 Years | 18 | 14.2% |
| 55 to 64 Years | 20 | 15.8% |
| 65 to 74 Years | 10 | 7.9% |
| 75 to 84 Years | 3 | 2.4% |
| 85 Years and Over | 5 | 3.9% |
| Total | 127 | 100.0% |
Housing Finances in Cedar Hill
Median Income by Occupancy in Cedar Hill
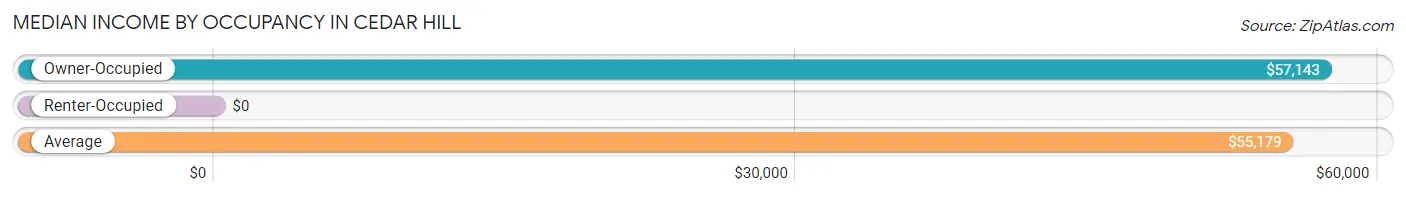
| Occupancy Type | # Households | Median Income |
| Owner-Occupied | 90 (70.9%) | $57,143 |
| Renter-Occupied | 37 (29.1%) | $0 |
| Average | 127 (100.0%) | $55,179 |
Occupancy by Householder Income Bracket in Cedar Hill
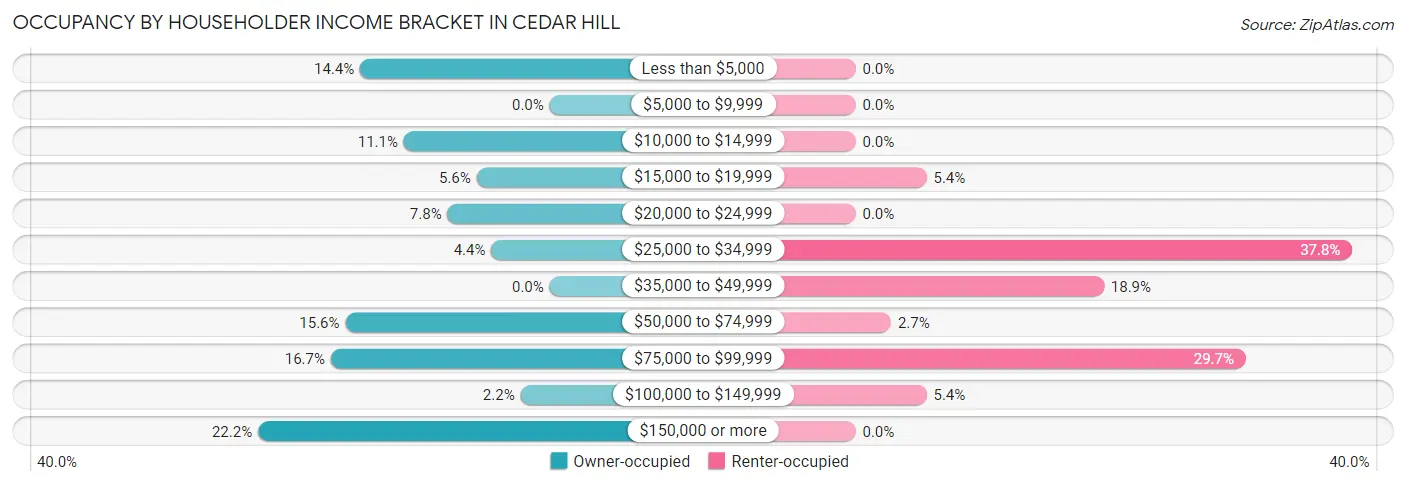
| Income Bracket | Owner-occupied | Renter-occupied |
| Less than $5,000 | 13 (14.4%) | 0 (0.0%) |
| $5,000 to $9,999 | 0 (0.0%) | 0 (0.0%) |
| $10,000 to $14,999 | 10 (11.1%) | 0 (0.0%) |
| $15,000 to $19,999 | 5 (5.6%) | 2 (5.4%) |
| $20,000 to $24,999 | 7 (7.8%) | 0 (0.0%) |
| $25,000 to $34,999 | 4 (4.4%) | 14 (37.8%) |
| $35,000 to $49,999 | 0 (0.0%) | 7 (18.9%) |
| $50,000 to $74,999 | 14 (15.6%) | 1 (2.7%) |
| $75,000 to $99,999 | 15 (16.7%) | 11 (29.7%) |
| $100,000 to $149,999 | 2 (2.2%) | 2 (5.4%) |
| $150,000 or more | 20 (22.2%) | 0 (0.0%) |
| Total | 90 (100.0%) | 37 (100.0%) |
Monthly Housing Cost Tiers in Cedar Hill
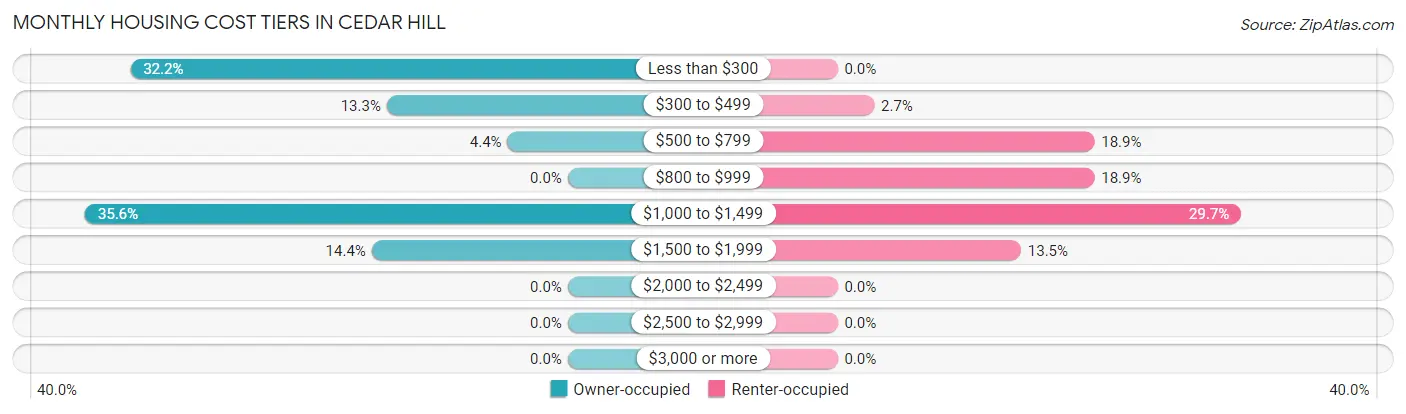
| Monthly Cost | Owner-occupied | Renter-occupied |
| Less than $300 | 29 (32.2%) | 0 (0.0%) |
| $300 to $499 | 12 (13.3%) | 1 (2.7%) |
| $500 to $799 | 4 (4.4%) | 7 (18.9%) |
| $800 to $999 | 0 (0.0%) | 7 (18.9%) |
| $1,000 to $1,499 | 32 (35.6%) | 11 (29.7%) |
| $1,500 to $1,999 | 13 (14.4%) | 5 (13.5%) |
| $2,000 to $2,499 | 0 (0.0%) | 0 (0.0%) |
| $2,500 to $2,999 | 0 (0.0%) | 0 (0.0%) |
| $3,000 or more | 0 (0.0%) | 0 (0.0%) |
| Total | 90 (100.0%) | 37 (100.0%) |
Physical Housing Characteristics in Cedar Hill
Housing Structures in Cedar Hill
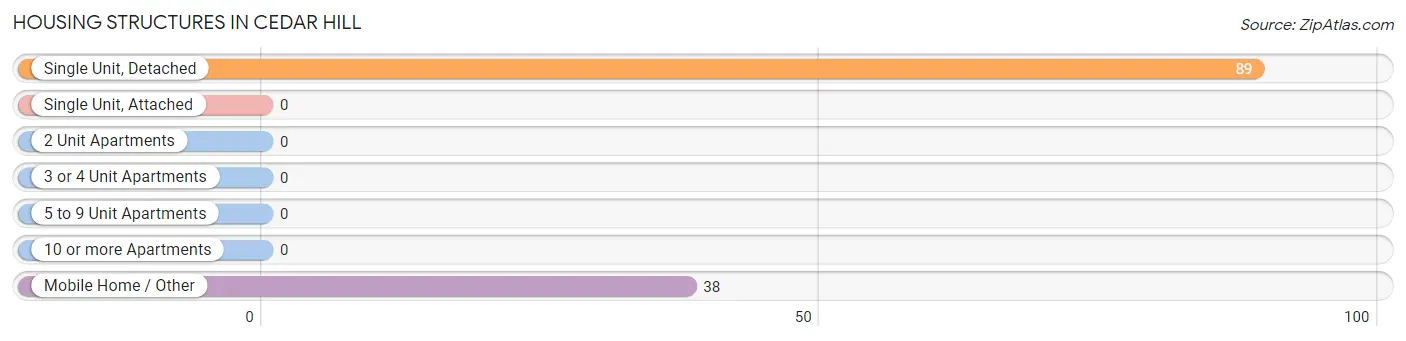
| Structure Type | # Housing Units | % Housing Units |
| Single Unit, Detached | 89 | 70.1% |
| Single Unit, Attached | 0 | 0.0% |
| 2 Unit Apartments | 0 | 0.0% |
| 3 or 4 Unit Apartments | 0 | 0.0% |
| 5 to 9 Unit Apartments | 0 | 0.0% |
| 10 or more Apartments | 0 | 0.0% |
| Mobile Home / Other | 38 | 29.9% |
| Total | 127 | 100.0% |
Housing Structures by Occupancy in Cedar Hill
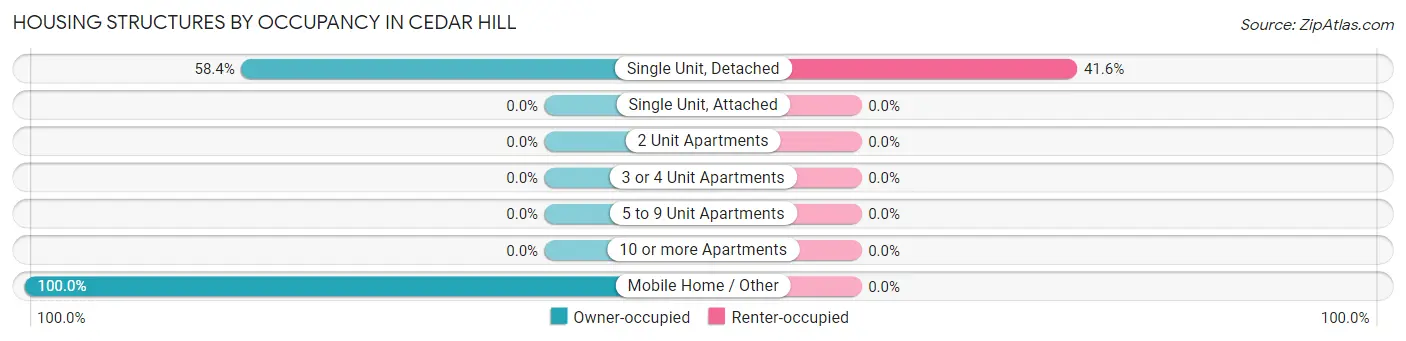
| Structure Type | Owner-occupied | Renter-occupied |
| Single Unit, Detached | 52 (58.4%) | 37 (41.6%) |
| Single Unit, Attached | 0 (0.0%) | 0 (0.0%) |
| 2 Unit Apartments | 0 (0.0%) | 0 (0.0%) |
| 3 or 4 Unit Apartments | 0 (0.0%) | 0 (0.0%) |
| 5 to 9 Unit Apartments | 0 (0.0%) | 0 (0.0%) |
| 10 or more Apartments | 0 (0.0%) | 0 (0.0%) |
| Mobile Home / Other | 38 (100.0%) | 0 (0.0%) |
| Total | 90 (70.9%) | 37 (29.1%) |
Housing Structures by Number of Rooms in Cedar Hill
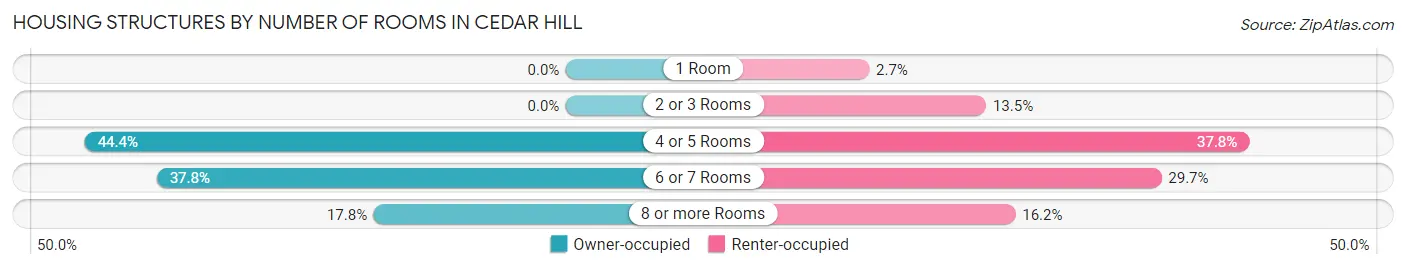
| Number of Rooms | Owner-occupied | Renter-occupied |
| 1 Room | 0 (0.0%) | 1 (2.7%) |
| 2 or 3 Rooms | 0 (0.0%) | 5 (13.5%) |
| 4 or 5 Rooms | 40 (44.4%) | 14 (37.8%) |
| 6 or 7 Rooms | 34 (37.8%) | 11 (29.7%) |
| 8 or more Rooms | 16 (17.8%) | 6 (16.2%) |
| Total | 90 (100.0%) | 37 (100.0%) |
Housing Structure by Heating Type in Cedar Hill
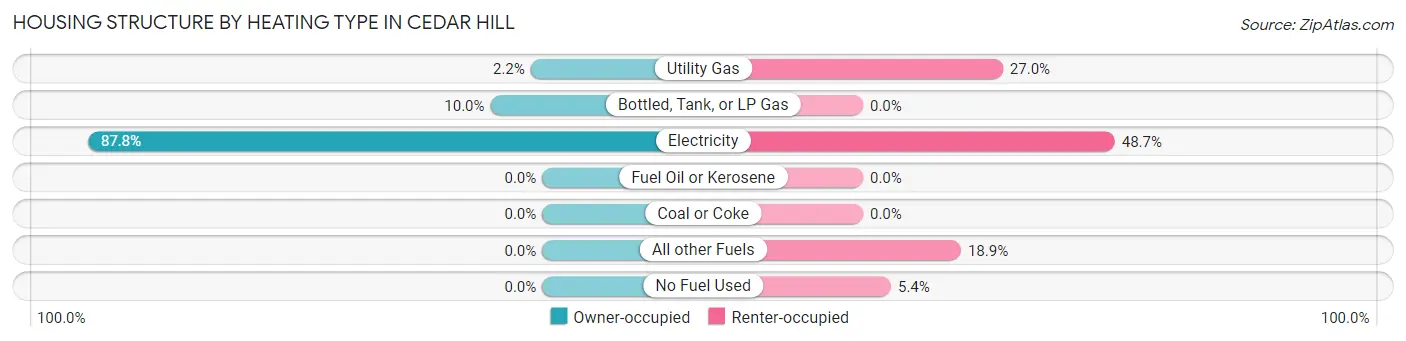
| Heating Type | Owner-occupied | Renter-occupied |
| Utility Gas | 2 (2.2%) | 10 (27.0%) |
| Bottled, Tank, or LP Gas | 9 (10.0%) | 0 (0.0%) |
| Electricity | 79 (87.8%) | 18 (48.6%) |
| Fuel Oil or Kerosene | 0 (0.0%) | 0 (0.0%) |
| Coal or Coke | 0 (0.0%) | 0 (0.0%) |
| All other Fuels | 0 (0.0%) | 7 (18.9%) |
| No Fuel Used | 0 (0.0%) | 2 (5.4%) |
| Total | 90 (100.0%) | 37 (100.0%) |
Household Vehicle Usage in Cedar Hill
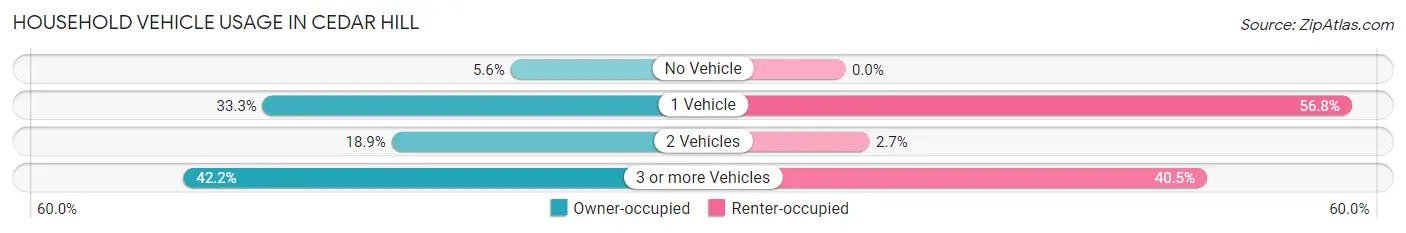
| Vehicles per Household | Owner-occupied | Renter-occupied |
| No Vehicle | 5 (5.6%) | 0 (0.0%) |
| 1 Vehicle | 30 (33.3%) | 21 (56.8%) |
| 2 Vehicles | 17 (18.9%) | 1 (2.7%) |
| 3 or more Vehicles | 38 (42.2%) | 15 (40.5%) |
| Total | 90 (100.0%) | 37 (100.0%) |
Real Estate & Mortgages in Cedar Hill
Real Estate and Mortgage Overview in Cedar Hill
| Characteristic | Without Mortgage | With Mortgage |
| Housing Units | 44 | 46 |
| Median Property Value | $93,100 | $255,000 |
| Median Household Income | $16,250 | $20 |
| Monthly Housing Costs | $238 | $0 |
| Real Estate Taxes | $473 | $0 |
Property Value by Mortgage Status in Cedar Hill
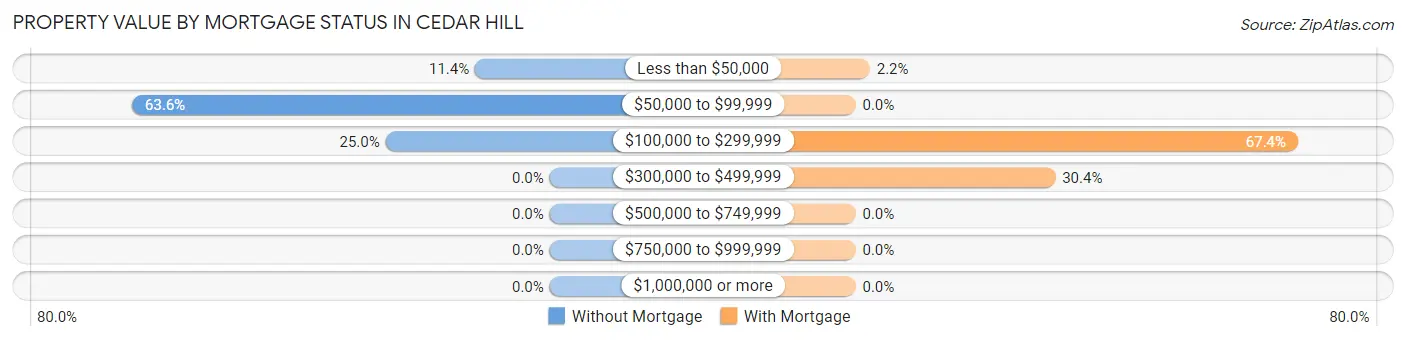
| Property Value | Without Mortgage | With Mortgage |
| Less than $50,000 | 5 (11.4%) | 1 (2.2%) |
| $50,000 to $99,999 | 28 (63.6%) | 0 (0.0%) |
| $100,000 to $299,999 | 11 (25.0%) | 31 (67.4%) |
| $300,000 to $499,999 | 0 (0.0%) | 14 (30.4%) |
| $500,000 to $749,999 | 0 (0.0%) | 0 (0.0%) |
| $750,000 to $999,999 | 0 (0.0%) | 0 (0.0%) |
| $1,000,000 or more | 0 (0.0%) | 0 (0.0%) |
| Total | 44 (100.0%) | 46 (100.0%) |
Household Income by Mortgage Status in Cedar Hill
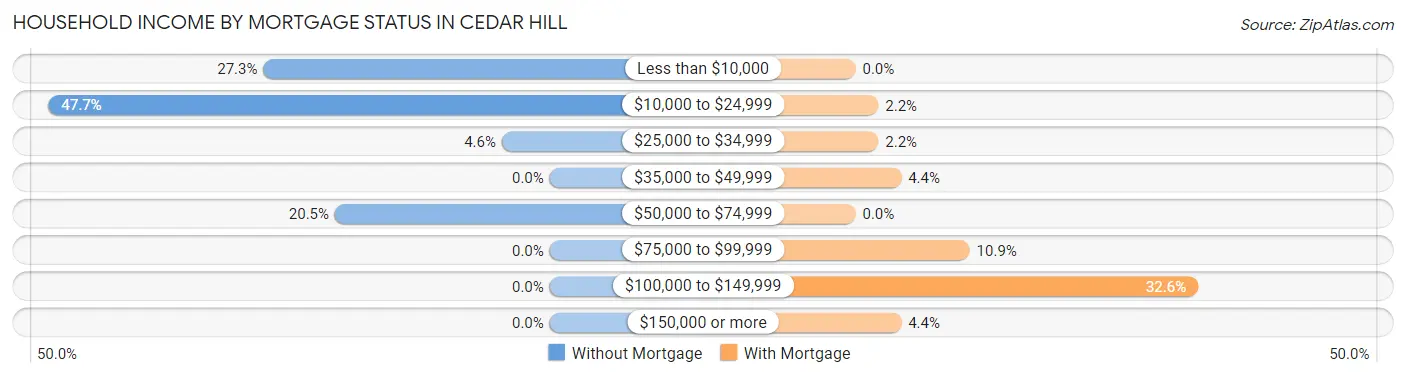
| Household Income | Without Mortgage | With Mortgage |
| Less than $10,000 | 12 (27.3%) | 0 (0.0%) |
| $10,000 to $24,999 | 21 (47.7%) | 1 (2.2%) |
| $25,000 to $34,999 | 2 (4.5%) | 1 (2.2%) |
| $35,000 to $49,999 | 0 (0.0%) | 2 (4.3%) |
| $50,000 to $74,999 | 9 (20.4%) | 0 (0.0%) |
| $75,000 to $99,999 | 0 (0.0%) | 5 (10.9%) |
| $100,000 to $149,999 | 0 (0.0%) | 15 (32.6%) |
| $150,000 or more | 0 (0.0%) | 2 (4.3%) |
| Total | 44 (100.0%) | 46 (100.0%) |
Property Value to Household Income Ratio in Cedar Hill
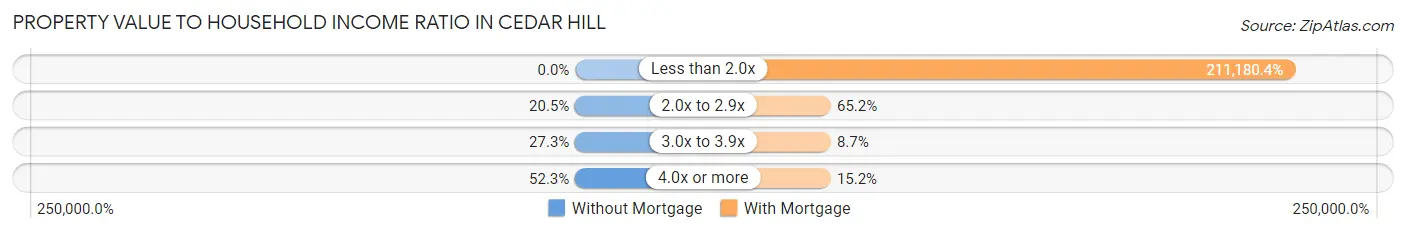
| Value-to-Income Ratio | Without Mortgage | With Mortgage |
| Less than 2.0x | 0 (0.0%) | 97,143 (211,180.4%) |
| 2.0x to 2.9x | 9 (20.4%) | 30 (65.2%) |
| 3.0x to 3.9x | 12 (27.3%) | 4 (8.7%) |
| 4.0x or more | 23 (52.3%) | 7 (15.2%) |
| Total | 44 (100.0%) | 46 (100.0%) |
Real Estate Taxes by Mortgage Status in Cedar Hill
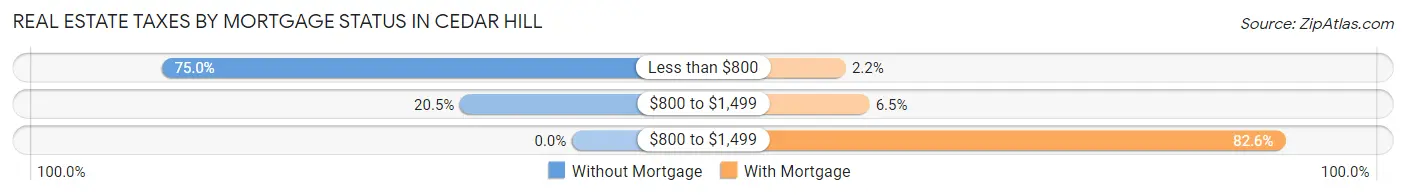
| Property Taxes | Without Mortgage | With Mortgage |
| Less than $800 | 33 (75.0%) | 1 (2.2%) |
| $800 to $1,499 | 9 (20.4%) | 3 (6.5%) |
| $800 to $1,499 | 0 (0.0%) | 38 (82.6%) |
| Total | 44 (100.0%) | 46 (100.0%) |
Health & Disability in Cedar Hill
Health Insurance Coverage by Age in Cedar Hill
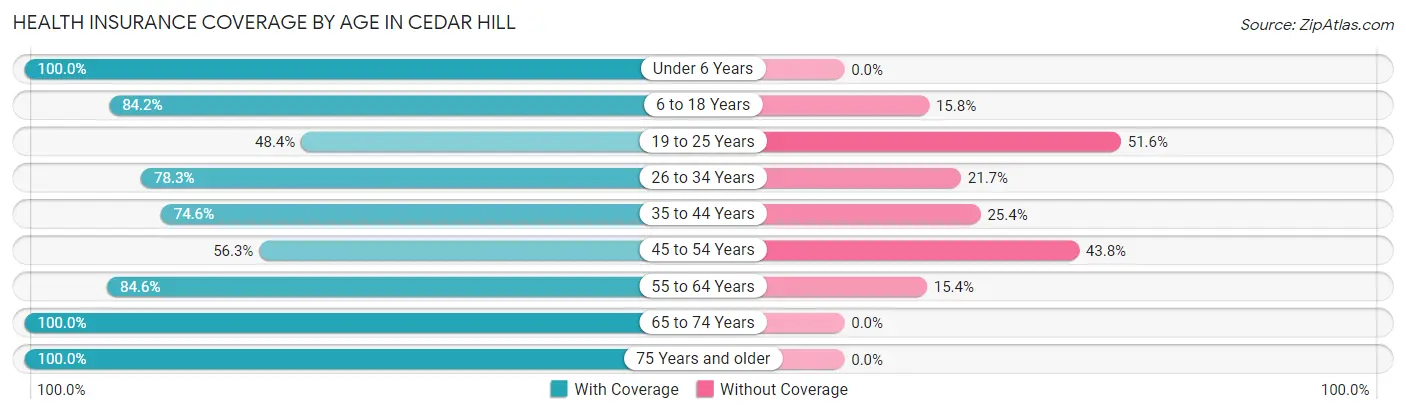
| Age Bracket | With Coverage | Without Coverage |
| Under 6 Years | 40 (100.0%) | 0 (0.0%) |
| 6 to 18 Years | 64 (84.2%) | 12 (15.8%) |
| 19 to 25 Years | 31 (48.4%) | 33 (51.6%) |
| 26 to 34 Years | 18 (78.3%) | 5 (21.7%) |
| 35 to 44 Years | 47 (74.6%) | 16 (25.4%) |
| 45 to 54 Years | 18 (56.2%) | 14 (43.8%) |
| 55 to 64 Years | 22 (84.6%) | 4 (15.4%) |
| 65 to 74 Years | 24 (100.0%) | 0 (0.0%) |
| 75 Years and older | 9 (100.0%) | 0 (0.0%) |
| Total | 273 (76.5%) | 84 (23.5%) |
Health Insurance Coverage by Citizenship Status in Cedar Hill
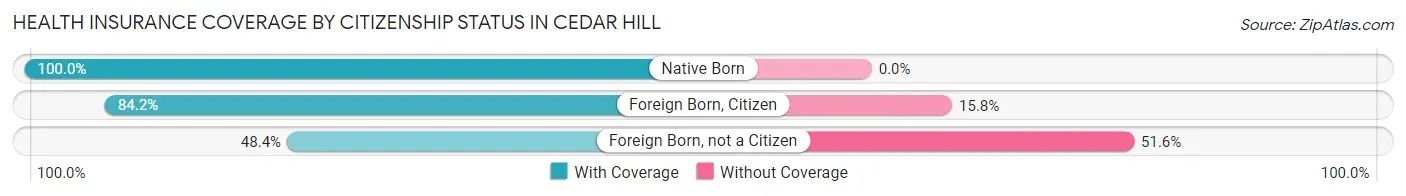
| Citizenship Status | With Coverage | Without Coverage |
| Native Born | 40 (100.0%) | 0 (0.0%) |
| Foreign Born, Citizen | 64 (84.2%) | 12 (15.8%) |
| Foreign Born, not a Citizen | 31 (48.4%) | 33 (51.6%) |
Health Insurance Coverage by Household Income in Cedar Hill
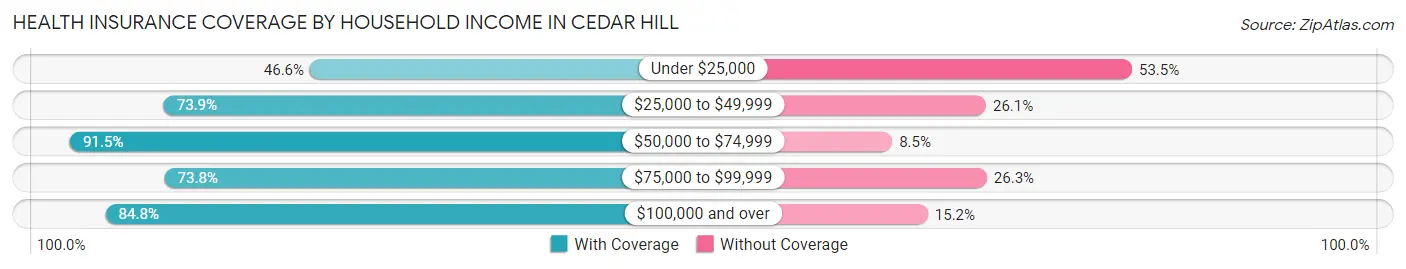
| Household Income | With Coverage | Without Coverage |
| Under $25,000 | 27 (46.6%) | 31 (53.4%) |
| $25,000 to $49,999 | 34 (73.9%) | 12 (26.1%) |
| $50,000 to $74,999 | 86 (91.5%) | 8 (8.5%) |
| $75,000 to $99,999 | 59 (73.8%) | 21 (26.3%) |
| $100,000 and over | 67 (84.8%) | 12 (15.2%) |
Public vs Private Health Insurance Coverage by Age in Cedar Hill
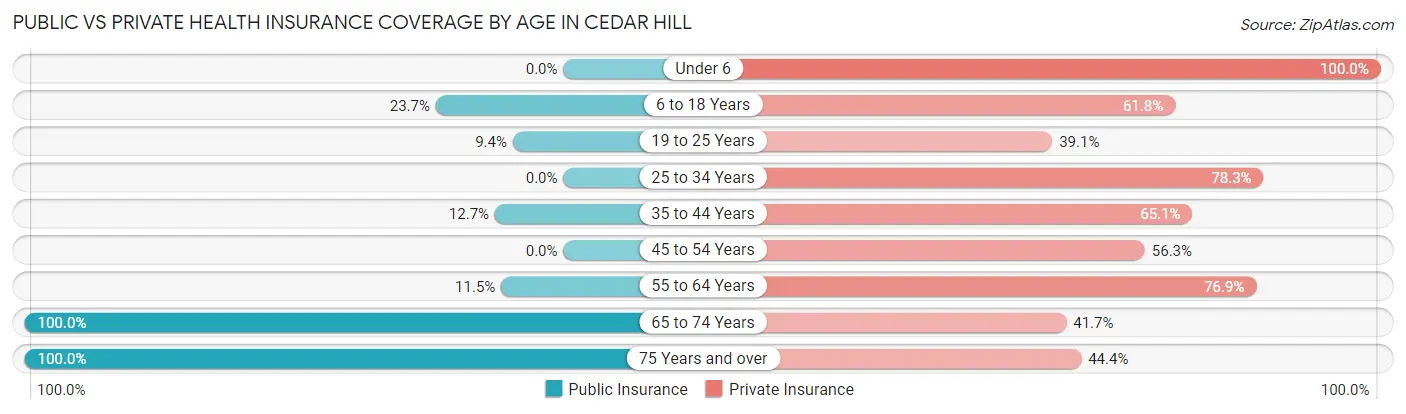
| Age Bracket | Public Insurance | Private Insurance |
| Under 6 | 0 (0.0%) | 40 (100.0%) |
| 6 to 18 Years | 18 (23.7%) | 47 (61.8%) |
| 19 to 25 Years | 6 (9.4%) | 25 (39.1%) |
| 25 to 34 Years | 0 (0.0%) | 18 (78.3%) |
| 35 to 44 Years | 8 (12.7%) | 41 (65.1%) |
| 45 to 54 Years | 0 (0.0%) | 18 (56.2%) |
| 55 to 64 Years | 3 (11.5%) | 20 (76.9%) |
| 65 to 74 Years | 24 (100.0%) | 10 (41.7%) |
| 75 Years and over | 9 (100.0%) | 4 (44.4%) |
| Total | 68 (19.1%) | 223 (62.5%) |
Disability Status by Sex by Age in Cedar Hill
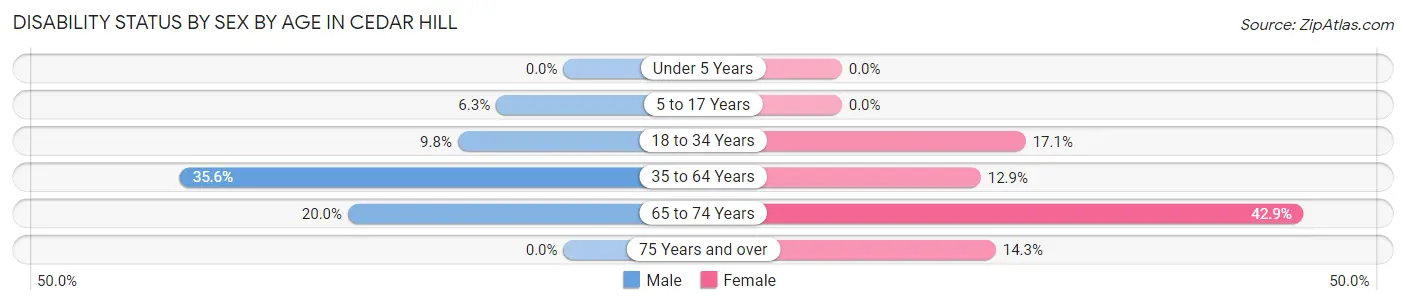
| Age Bracket | Male | Female |
| Under 5 Years | 0 (0.0%) | 0 (0.0%) |
| 5 to 17 Years | 1 (6.2%) | 0 (0.0%) |
| 18 to 34 Years | 5 (9.8%) | 7 (17.1%) |
| 35 to 64 Years | 21 (35.6%) | 8 (12.9%) |
| 65 to 74 Years | 2 (20.0%) | 6 (42.9%) |
| 75 Years and over | 0 (0.0%) | 1 (14.3%) |
Disability Class by Sex by Age in Cedar Hill
Disability Class: Hearing Difficulty
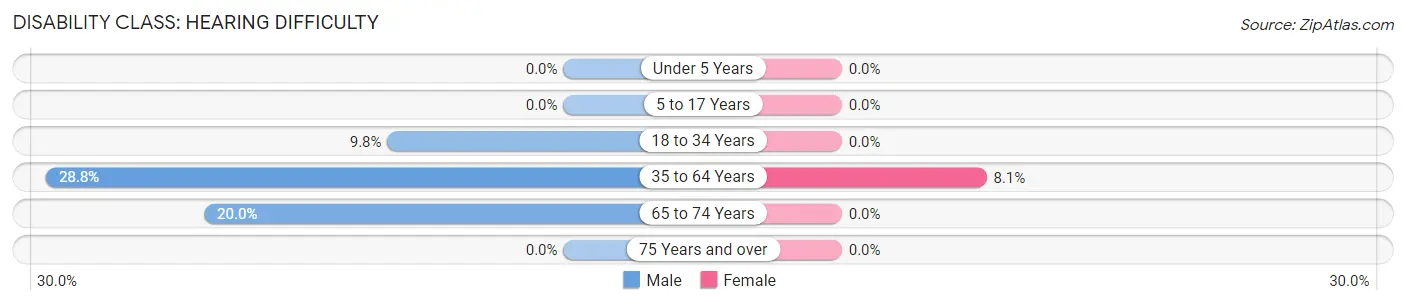
| Age Bracket | Male | Female |
| Under 5 Years | 0 (0.0%) | 0 (0.0%) |
| 5 to 17 Years | 0 (0.0%) | 0 (0.0%) |
| 18 to 34 Years | 5 (9.8%) | 0 (0.0%) |
| 35 to 64 Years | 17 (28.8%) | 5 (8.1%) |
| 65 to 74 Years | 2 (20.0%) | 0 (0.0%) |
| 75 Years and over | 0 (0.0%) | 0 (0.0%) |
Disability Class: Vision Difficulty
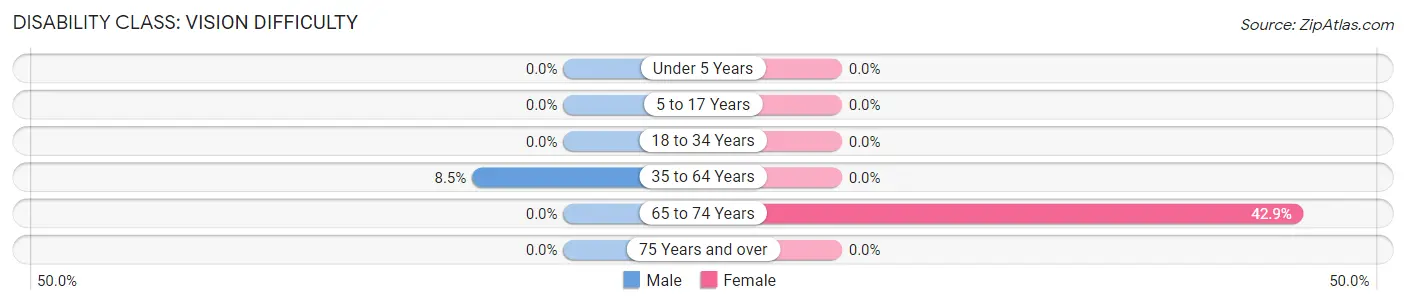
| Age Bracket | Male | Female |
| Under 5 Years | 0 (0.0%) | 0 (0.0%) |
| 5 to 17 Years | 0 (0.0%) | 0 (0.0%) |
| 18 to 34 Years | 0 (0.0%) | 0 (0.0%) |
| 35 to 64 Years | 5 (8.5%) | 0 (0.0%) |
| 65 to 74 Years | 0 (0.0%) | 6 (42.9%) |
| 75 Years and over | 0 (0.0%) | 0 (0.0%) |
Disability Class: Cognitive Difficulty
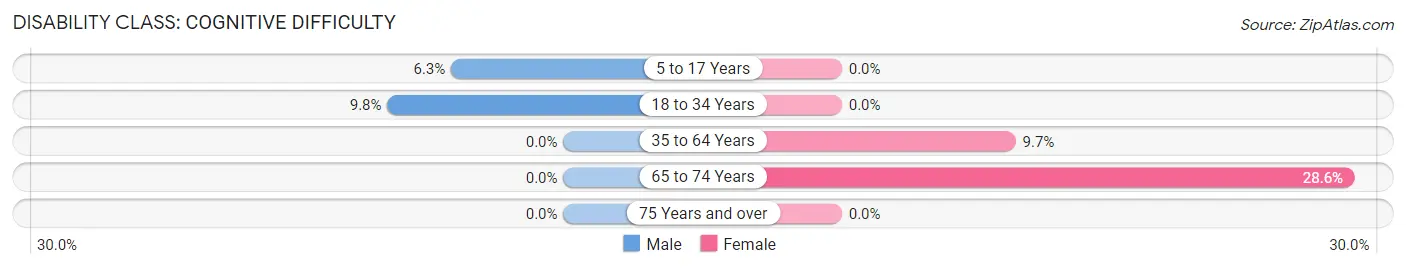
| Age Bracket | Male | Female |
| 5 to 17 Years | 1 (6.2%) | 0 (0.0%) |
| 18 to 34 Years | 5 (9.8%) | 0 (0.0%) |
| 35 to 64 Years | 0 (0.0%) | 6 (9.7%) |
| 65 to 74 Years | 0 (0.0%) | 4 (28.6%) |
| 75 Years and over | 0 (0.0%) | 0 (0.0%) |
Disability Class: Ambulatory Difficulty
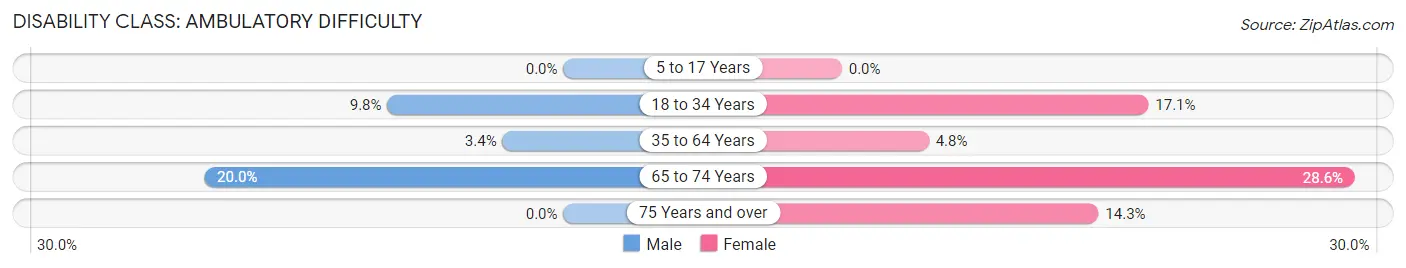
| Age Bracket | Male | Female |
| 5 to 17 Years | 0 (0.0%) | 0 (0.0%) |
| 18 to 34 Years | 5 (9.8%) | 7 (17.1%) |
| 35 to 64 Years | 2 (3.4%) | 3 (4.8%) |
| 65 to 74 Years | 2 (20.0%) | 4 (28.6%) |
| 75 Years and over | 0 (0.0%) | 1 (14.3%) |
Disability Class: Self-Care Difficulty
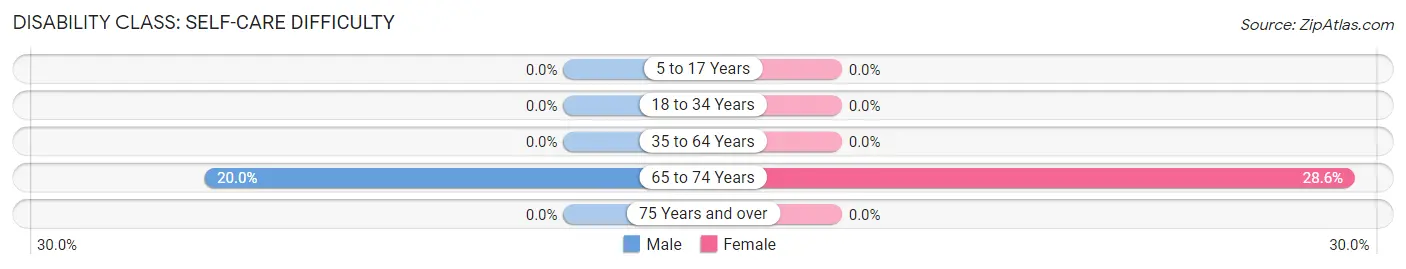
| Age Bracket | Male | Female |
| 5 to 17 Years | 0 (0.0%) | 0 (0.0%) |
| 18 to 34 Years | 0 (0.0%) | 0 (0.0%) |
| 35 to 64 Years | 0 (0.0%) | 0 (0.0%) |
| 65 to 74 Years | 2 (20.0%) | 4 (28.6%) |
| 75 Years and over | 0 (0.0%) | 0 (0.0%) |
Technology Access in Cedar Hill
Computing Device Access in Cedar Hill
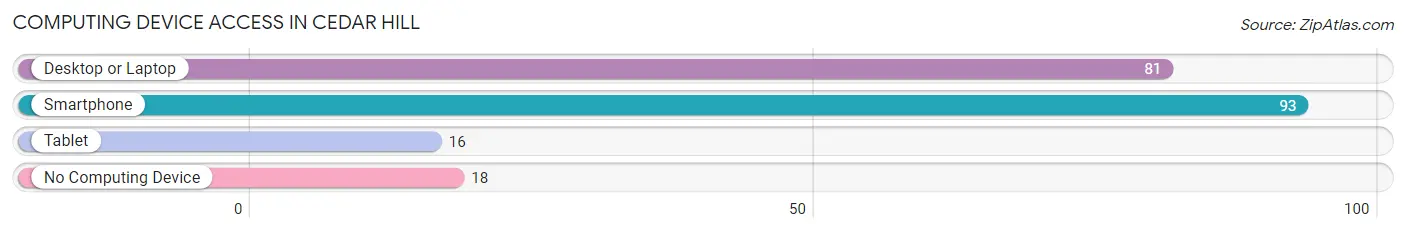
| Device Type | # Households | % Households |
| Desktop or Laptop | 81 | 63.8% |
| Smartphone | 93 | 73.2% |
| Tablet | 16 | 12.6% |
| No Computing Device | 18 | 14.2% |
| Total | 127 | 100.0% |
Internet Access in Cedar Hill
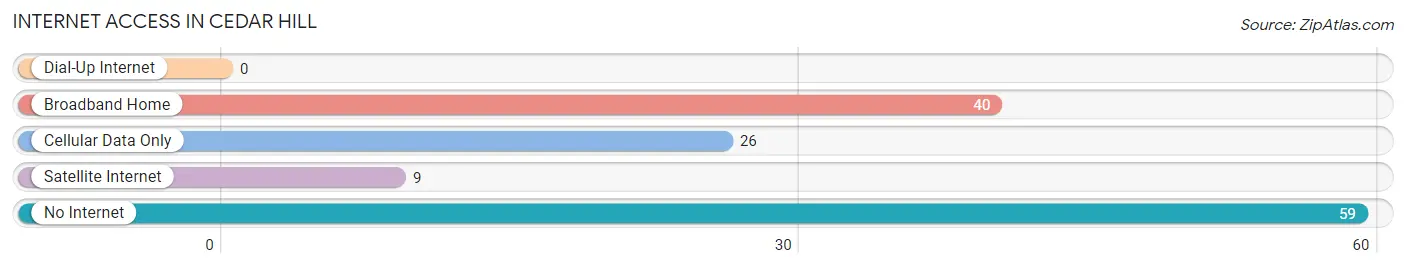
| Internet Type | # Households | % Households |
| Dial-Up Internet | 0 | 0.0% |
| Broadband Home | 40 | 31.5% |
| Cellular Data Only | 26 | 20.5% |
| Satellite Internet | 9 | 7.1% |
| No Internet | 59 | 46.5% |
| Total | 127 | 100.0% |
Cedar Hill Summary
Cedar Hill is a small town located in Robertson County, Tennessee. It is situated about 25 miles north of Nashville and is part of the Nashville metropolitan area. The town has a population of approximately 1,500 people and is known for its rural charm and small-town atmosphere.
History
Cedar Hill was founded in 1820 by a group of settlers from North Carolina. The town was originally known as Cedar Hill Crossroads, and the name was changed to Cedar Hill in 1836. The town was named after the cedar trees that grew in the area.
The town was an important stop on the stagecoach route between Nashville and Clarksville. In the late 1800s, the town was a popular destination for tourists who wanted to escape the hustle and bustle of the city.
In the early 1900s, Cedar Hill was a thriving agricultural community. The town was home to several cotton gins, a grist mill, and a sawmill. The town also had a hotel, a bank, and several stores.
Geography
Cedar Hill is located in Robertson County, Tennessee. The town is situated on the banks of the Red River, which flows through the area. The town is surrounded by rolling hills and is located in a rural area.
The climate in Cedar Hill is mild and humid. The average temperature in the summer is around 80 degrees Fahrenheit, and the average temperature in the winter is around 40 degrees Fahrenheit.
Economy
Cedar Hill is a small town with a limited economy. The town is home to several small businesses, including a grocery store, a hardware store, and a few restaurants. The town also has a few small manufacturing companies.
The town is also home to a few farms, which produce corn, soybeans, and hay. The town is also home to a few wineries, which produce wine from locally grown grapes.
Demographics
As of the 2010 census, the population of Cedar Hill was 1,500 people. The town is predominantly white, with about 95% of the population being white. The town also has a small African American population, with about 4% of the population being African American.
The median household income in Cedar Hill is $41,000, and the median home value is $125,000. The town has a low unemployment rate, with only about 4% of the population being unemployed.
Conclusion
Cedar Hill is a small town located in Robertson County, Tennessee. The town has a population of approximately 1,500 people and is known for its rural charm and small-town atmosphere. The town is home to several small businesses, farms, and wineries. The town is predominantly white, with about 95% of the population being white. The median household income in Cedar Hill is $41,000, and the median home value is $125,000. The town has a low unemployment rate, with only about 4% of the population being unemployed.
Common Questions
What is Per Capita Income in Cedar Hill?
Per Capita income in Cedar Hill is $22,111.
What is the Median Family Income in Cedar Hill?
Median Family Income in Cedar Hill is $56,429.
What is the Median Household income in Cedar Hill?
Median Household Income in Cedar Hill is $55,179.
What is Income or Wage Gap in Cedar Hill?
Income or Wage Gap in Cedar Hill is 5.3%.
Women in Cedar Hill earn 94.7 cents for every dollar earned by a man.
What is Inequality or Gini Index in Cedar Hill?
Inequality or Gini Index in Cedar Hill is 0.44.
What is the Total Population of Cedar Hill?
Total Population of Cedar Hill is 357.
What is the Total Male Population of Cedar Hill?
Total Male Population of Cedar Hill is 172.
What is the Total Female Population of Cedar Hill?
Total Female Population of Cedar Hill is 185.
What is the Ratio of Males per 100 Females in Cedar Hill?
There are 92.97 Males per 100 Females in Cedar Hill.
What is the Ratio of Females per 100 Males in Cedar Hill?
There are 107.56 Females per 100 Males in Cedar Hill.
What is the Median Population Age in Cedar Hill?
Median Population Age in Cedar Hill is 25.0 Years.
What is the Average Family Size in Cedar Hill
Average Family Size in Cedar Hill is 3.5 People.
What is the Average Household Size in Cedar Hill
Average Household Size in Cedar Hill is 2.8 People.
How Large is the Labor Force in Cedar Hill?
There are 207 People in the Labor Forcein in Cedar Hill.
What is the Percentage of People in the Labor Force in Cedar Hill?
73.4% of People are in the Labor Force in Cedar Hill.
What is the Unemployment Rate in Cedar Hill?
Unemployment Rate in Cedar Hill is 6.8%.