Caryville, TN Map & Demographics
Caryville Map
Caryville Overview
$32,844
PER CAPITA INCOME
$66,087
AVG FAMILY INCOME
$54,257
AVG HOUSEHOLD INCOME
26.5%
WAGE / INCOME GAP [ % ]
73.5¢/ $1
WAGE / INCOME GAP [ $ ]
0.50
INEQUALITY / GINI INDEX
2,181
TOTAL POPULATION
1,120
MALE POPULATION
1,061
FEMALE POPULATION
105.56
MALES / 100 FEMALES
94.73
FEMALES / 100 MALES
46.0
MEDIAN AGE
2.7
AVG FAMILY SIZE
2.3
AVG HOUSEHOLD SIZE
999
LABOR FORCE [ PEOPLE ]
57.5%
PERCENT IN LABOR FORCE
10.7%
UNEMPLOYMENT RATE
Caryville Zip Codes
Caryville Area Codes
Income in Caryville
Income Overview in Caryville
Per Capita Income in Caryville is $32,844, while median incomes of families and households are $66,087 and $54,257 respectively.
| Characteristic | Number | Measure |
| Per Capita Income | 2,181 | $32,844 |
| Median Family Income | 640 | $66,087 |
| Mean Family Income | 640 | $90,186 |
| Median Household Income | 928 | $54,257 |
| Mean Household Income | 928 | $73,798 |
| Income Deficit | 640 | $0 |
| Wage / Income Gap (%) | 2,181 | 26.52% |
| Wage / Income Gap ($) | 2,181 | 73.48¢ per $1 |
| Gini / Inequality Index | 2,181 | 0.50 |
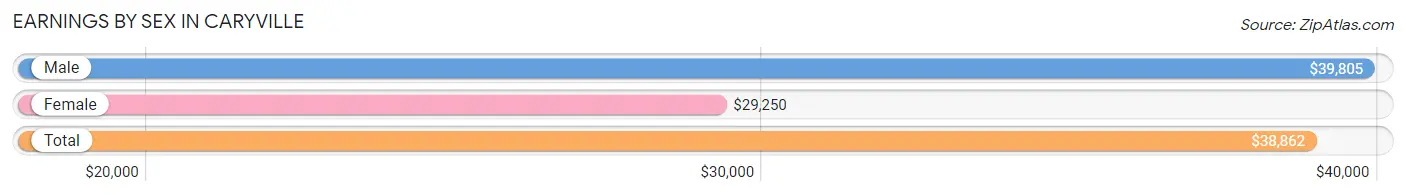
Earnings by Sex in Caryville
Average Earnings in Caryville are $38,862, $39,805 for men and $29,250 for women, a difference of 26.5%.
| Sex | Number | Average Earnings |
| Male | 570 (56.8%) | $39,805 |
| Female | 433 (43.2%) | $29,250 |
| Total | 1,003 (100.0%) | $38,862 |
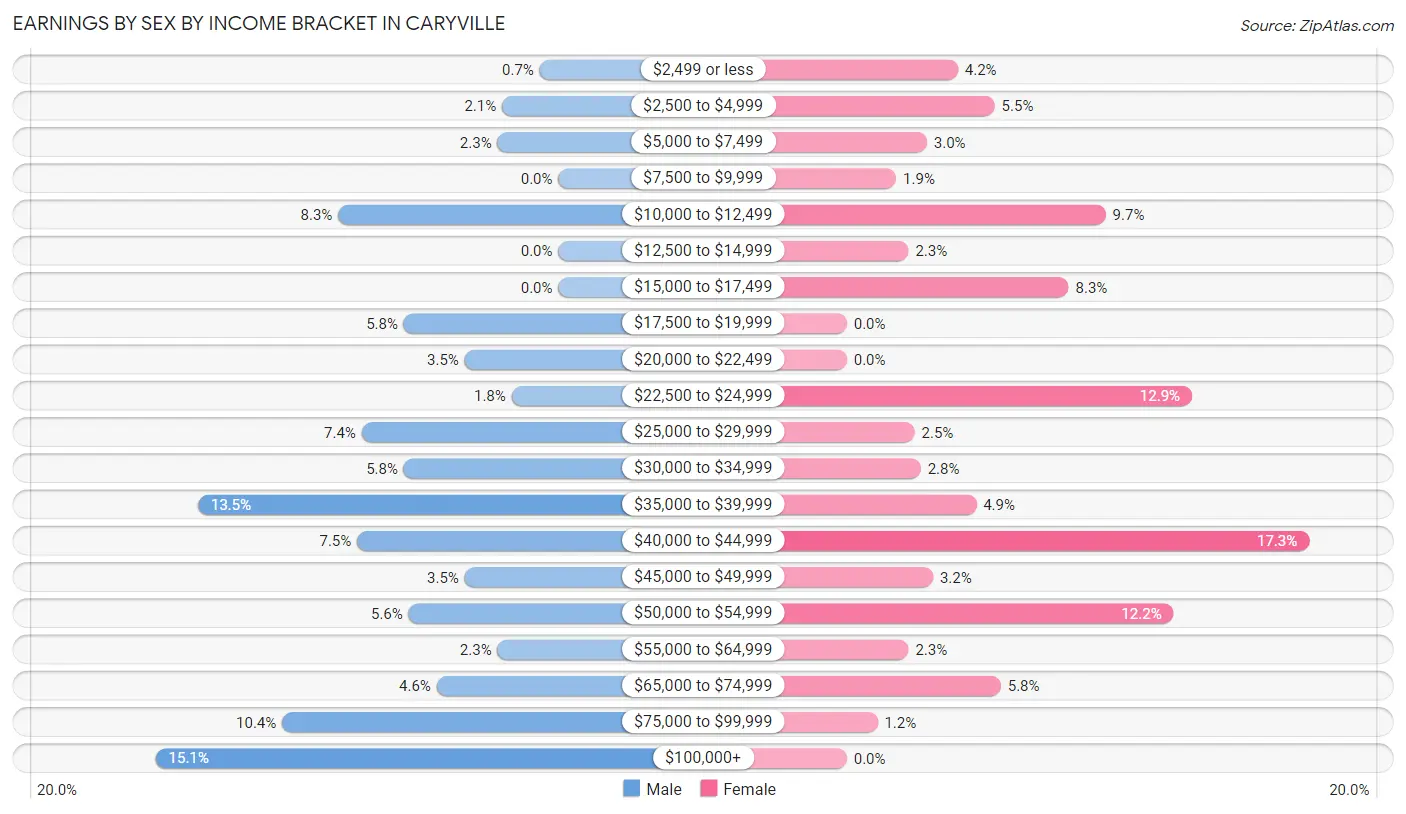
Earnings by Sex by Income Bracket in Caryville
The most common earnings brackets in Caryville are $100,000+ for men (86 | 15.1%) and $40,000 to $44,999 for women (75 | 17.3%).
| Income | Male | Female |
| $2,499 or less | 4 (0.7%) | 18 (4.2%) |
| $2,500 to $4,999 | 12 (2.1%) | 24 (5.5%) |
| $5,000 to $7,499 | 13 (2.3%) | 13 (3.0%) |
| $7,500 to $9,999 | 0 (0.0%) | 8 (1.8%) |
| $10,000 to $12,499 | 47 (8.3%) | 42 (9.7%) |
| $12,500 to $14,999 | 0 (0.0%) | 10 (2.3%) |
| $15,000 to $17,499 | 0 (0.0%) | 36 (8.3%) |
| $17,500 to $19,999 | 33 (5.8%) | 0 (0.0%) |
| $20,000 to $22,499 | 20 (3.5%) | 0 (0.0%) |
| $22,500 to $24,999 | 10 (1.8%) | 56 (12.9%) |
| $25,000 to $29,999 | 42 (7.4%) | 11 (2.5%) |
| $30,000 to $34,999 | 33 (5.8%) | 12 (2.8%) |
| $35,000 to $39,999 | 77 (13.5%) | 21 (4.9%) |
| $40,000 to $44,999 | 43 (7.5%) | 75 (17.3%) |
| $45,000 to $49,999 | 20 (3.5%) | 14 (3.2%) |
| $50,000 to $54,999 | 32 (5.6%) | 53 (12.2%) |
| $55,000 to $64,999 | 13 (2.3%) | 10 (2.3%) |
| $65,000 to $74,999 | 26 (4.6%) | 25 (5.8%) |
| $75,000 to $99,999 | 59 (10.3%) | 5 (1.1%) |
| $100,000+ | 86 (15.1%) | 0 (0.0%) |
| Total | 570 (100.0%) | 433 (100.0%) |
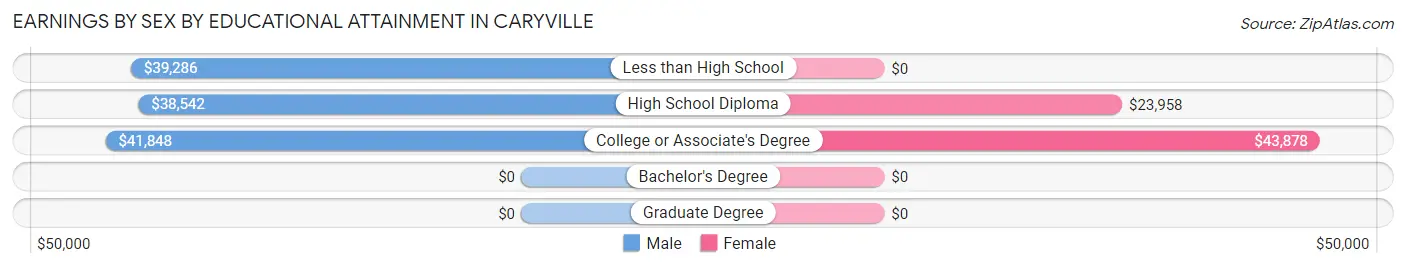
Earnings by Sex by Educational Attainment in Caryville
Average earnings in Caryville are $39,919 for men and $36,528 for women, a difference of 8.5%. Men with an educational attainment of college or associate's degree enjoy the highest average annual earnings of $41,848, while those with high school diploma education earn the least with $38,542. Women with an educational attainment of college or associate's degree earn the most with the average annual earnings of $43,878, while those with high school diploma education have the smallest earnings of $23,958.
| Educational Attainment | Male Income | Female Income |
| Less than High School | $39,286 | $0 |
| High School Diploma | $38,542 | $23,958 |
| College or Associate's Degree | $41,848 | $43,878 |
| Bachelor's Degree | - | - |
| Graduate Degree | - | - |
| Total | $39,919 | $36,528 |
Family Income in Caryville
Family Income Brackets in Caryville
According to the Caryville family income data, there are 137 families falling into the $50,000 to $74,999 income range, which is the most common income bracket and makes up 21.4% of all families. Conversely, the $10,000 to $14,999 income bracket is the least frequent group with only 31 families (4.8%) belonging to this category.
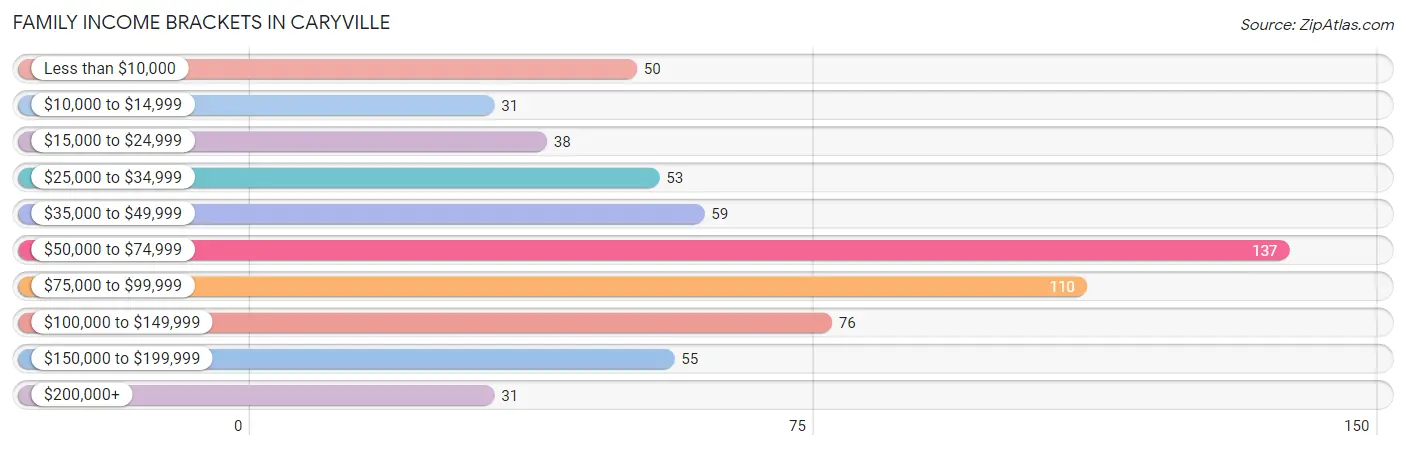
| Income Bracket | # Families | % Families |
| Less than $10,000 | 50 | 7.8% |
| $10,000 to $14,999 | 31 | 4.8% |
| $15,000 to $24,999 | 38 | 5.9% |
| $25,000 to $34,999 | 53 | 8.3% |
| $35,000 to $49,999 | 59 | 9.2% |
| $50,000 to $74,999 | 137 | 21.4% |
| $75,000 to $99,999 | 110 | 17.2% |
| $100,000 to $149,999 | 76 | 11.9% |
| $150,000 to $199,999 | 55 | 8.6% |
| $200,000+ | 31 | 4.8% |
Family Income by Famaliy Size in Caryville
3-person families (180 | 28.1%) account for the highest median family income in Caryville with $74,286 per family, while 2-person families (349 | 54.5%) have the highest median income of $32,818 per family member.
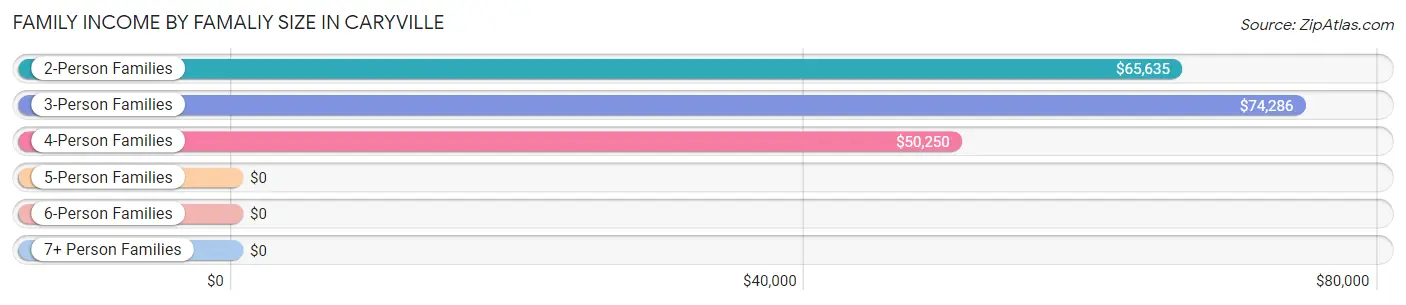
| Income Bracket | # Families | Median Income |
| 2-Person Families | 349 (54.5%) | $65,635 |
| 3-Person Families | 180 (28.1%) | $74,286 |
| 4-Person Families | 49 (7.7%) | $50,250 |
| 5-Person Families | 43 (6.7%) | $0 |
| 6-Person Families | 17 (2.7%) | $0 |
| 7+ Person Families | 2 (0.3%) | $0 |
| Total | 640 (100.0%) | $66,087 |
Family Income by Number of Earners in Caryville
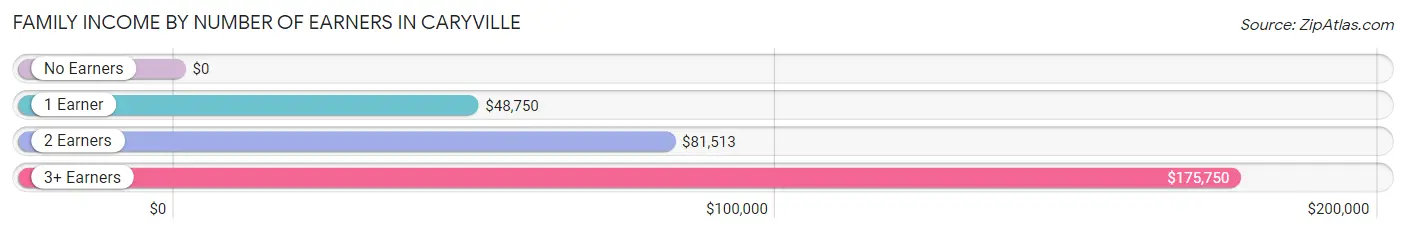
| Number of Earners | # Families | Median Income |
| No Earners | 175 (27.3%) | $0 |
| 1 Earner | 169 (26.4%) | $48,750 |
| 2 Earners | 261 (40.8%) | $81,513 |
| 3+ Earners | 35 (5.5%) | $175,750 |
| Total | 640 (100.0%) | $66,087 |
Household Income in Caryville
Household Income Brackets in Caryville
With 227 households falling in the category, the $50,000 to $74,999 income range is the most frequent in Caryville, accounting for 24.5% of all households. In contrast, only 31 households (3.3%) fall into the $200,000+ income bracket, making it the least populous group.
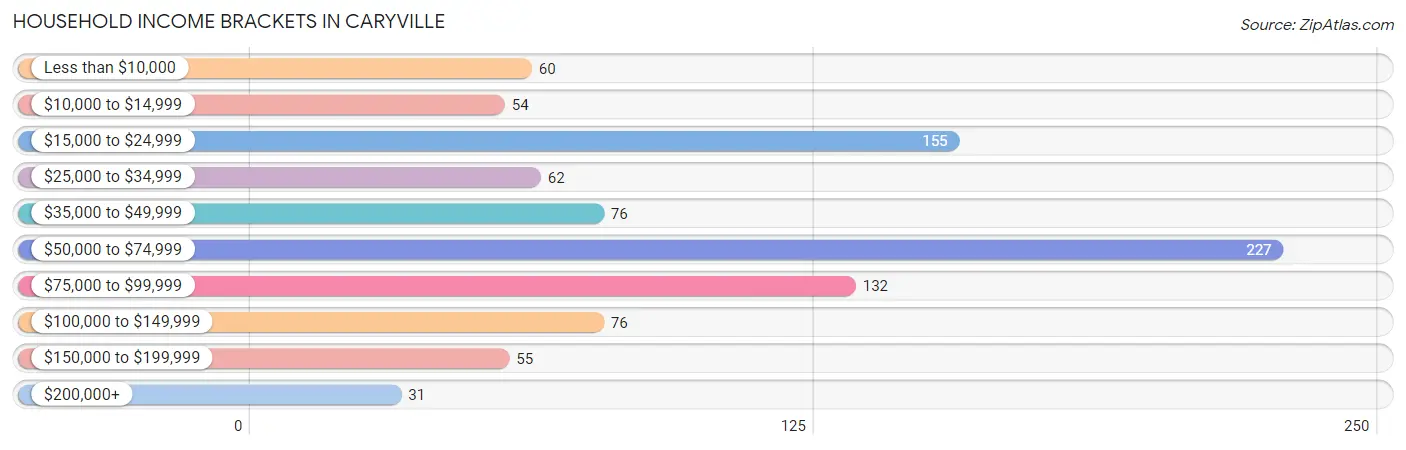
| Income Bracket | # Households | % Households |
| Less than $10,000 | 60 | 6.5% |
| $10,000 to $14,999 | 54 | 5.8% |
| $15,000 to $24,999 | 155 | 16.7% |
| $25,000 to $34,999 | 62 | 6.7% |
| $35,000 to $49,999 | 76 | 8.2% |
| $50,000 to $74,999 | 227 | 24.5% |
| $75,000 to $99,999 | 132 | 14.2% |
| $100,000 to $149,999 | 76 | 8.2% |
| $150,000 to $199,999 | 55 | 5.9% |
| $200,000+ | 31 | 3.3% |
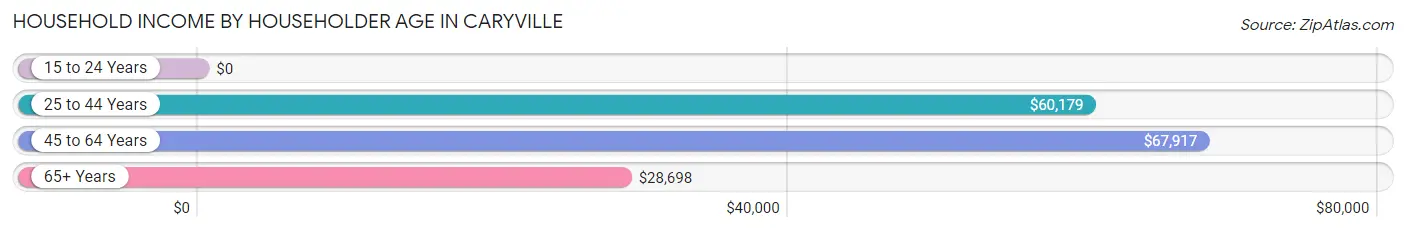
Household Income by Householder Age in Caryville
The median household income in Caryville is $54,257, with the highest median household income of $67,917 found in the 45 to 64 years age bracket for the primary householder. A total of 423 households (45.6%) fall into this category. Meanwhile, the 15 to 24 years age bracket for the primary householder has the lowest median household income of $0, with 7 households (0.7%) in this group.
| Income Bracket | # Households | Median Income |
| 15 to 24 Years | 7 (0.7%) | $0 |
| 25 to 44 Years | 239 (25.8%) | $60,179 |
| 45 to 64 Years | 423 (45.6%) | $67,917 |
| 65+ Years | 259 (27.9%) | $28,698 |
| Total | 928 (100.0%) | $54,257 |
Poverty in Caryville
Income Below Poverty by Sex and Age in Caryville
With 20.6% poverty level for males and 28.6% for females among the residents of Caryville, under 5 year old males and 15 year old females are the most vulnerable to poverty, with 70 males (76.9%) and 6 females (100.0%) in their respective age groups living below the poverty level.
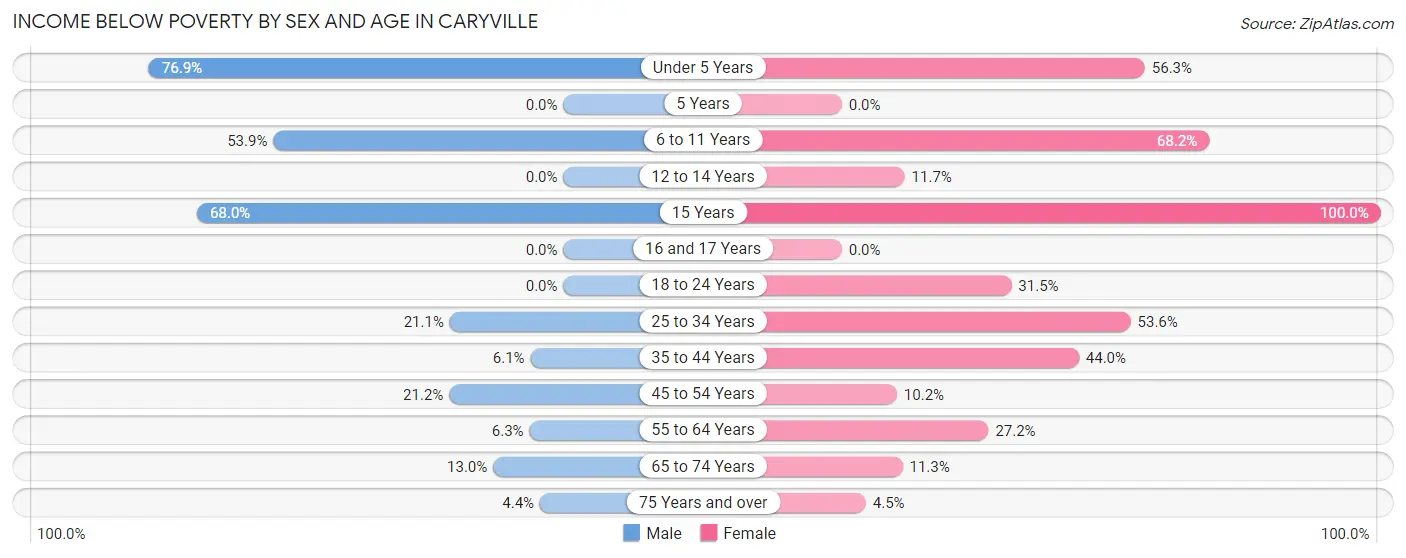
| Age Bracket | Male | Female |
| Under 5 Years | 70 (76.9%) | 54 (56.2%) |
| 5 Years | 0 (0.0%) | 0 (0.0%) |
| 6 to 11 Years | 35 (53.8%) | 30 (68.2%) |
| 12 to 14 Years | 0 (0.0%) | 7 (11.7%) |
| 15 Years | 17 (68.0%) | 6 (100.0%) |
| 16 and 17 Years | 0 (0.0%) | 0 (0.0%) |
| 18 to 24 Years | 0 (0.0%) | 17 (31.5%) |
| 25 to 34 Years | 27 (21.1%) | 52 (53.6%) |
| 35 to 44 Years | 8 (6.1%) | 55 (44.0%) |
| 45 to 54 Years | 46 (21.2%) | 22 (10.2%) |
| 55 to 64 Years | 10 (6.3%) | 46 (27.2%) |
| 65 to 74 Years | 9 (13.0%) | 8 (11.3%) |
| 75 Years and over | 7 (4.3%) | 5 (4.5%) |
| Total | 229 (20.6%) | 302 (28.6%) |
Income Above Poverty by Sex and Age in Caryville
According to the poverty statistics in Caryville, males aged 5 years and females aged 16 and 17 years are the age groups that are most secure financially, with 100.0% of males and 100.0% of females in these age groups living above the poverty line.
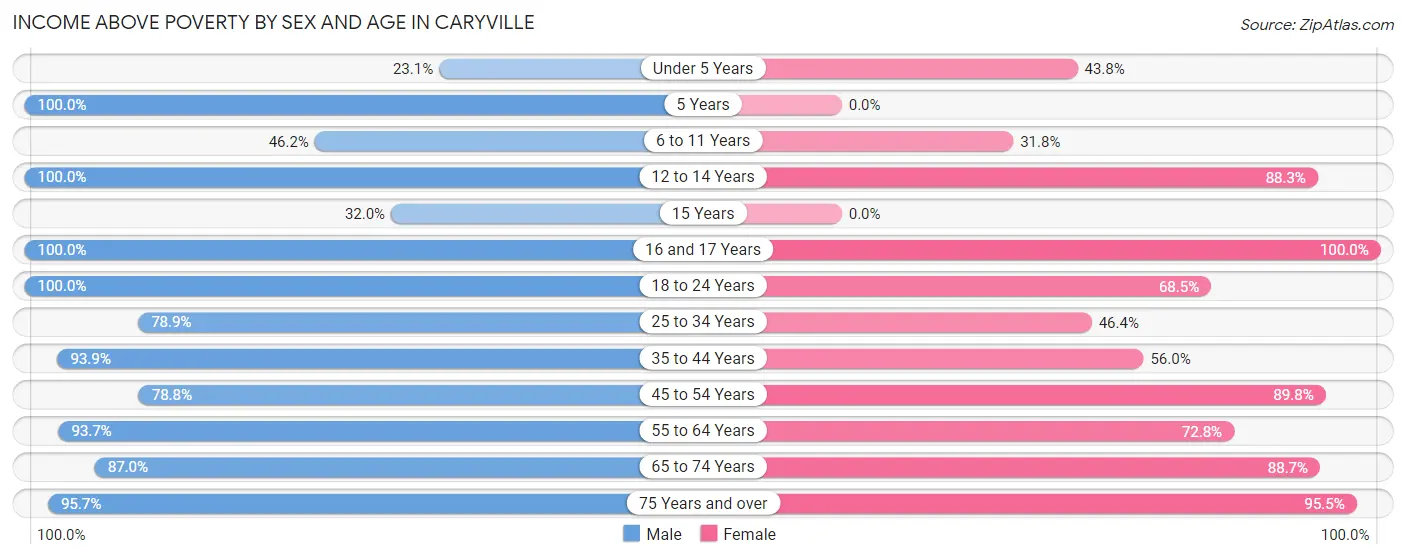
| Age Bracket | Male | Female |
| Under 5 Years | 21 (23.1%) | 42 (43.8%) |
| 5 Years | 18 (100.0%) | 0 (0.0%) |
| 6 to 11 Years | 30 (46.2%) | 14 (31.8%) |
| 12 to 14 Years | 21 (100.0%) | 53 (88.3%) |
| 15 Years | 8 (32.0%) | 0 (0.0%) |
| 16 and 17 Years | 17 (100.0%) | 6 (100.0%) |
| 18 to 24 Years | 7 (100.0%) | 37 (68.5%) |
| 25 to 34 Years | 101 (78.9%) | 45 (46.4%) |
| 35 to 44 Years | 123 (93.9%) | 70 (56.0%) |
| 45 to 54 Years | 171 (78.8%) | 193 (89.8%) |
| 55 to 64 Years | 149 (93.7%) | 123 (72.8%) |
| 65 to 74 Years | 60 (87.0%) | 63 (88.7%) |
| 75 Years and over | 154 (95.7%) | 107 (95.5%) |
| Total | 880 (79.3%) | 753 (71.4%) |
Income Below Poverty Among Married-Couple Families in Caryville
The poverty statistics for married-couple families in Caryville show that 3.7% or 17 of the total 456 families live below the poverty line. Families with 1 or 2 children have the highest poverty rate of 11.5%, comprising of 14 families. On the other hand, families with 3 or 4 children have the lowest poverty rate of 0.0%, which includes 0 families.
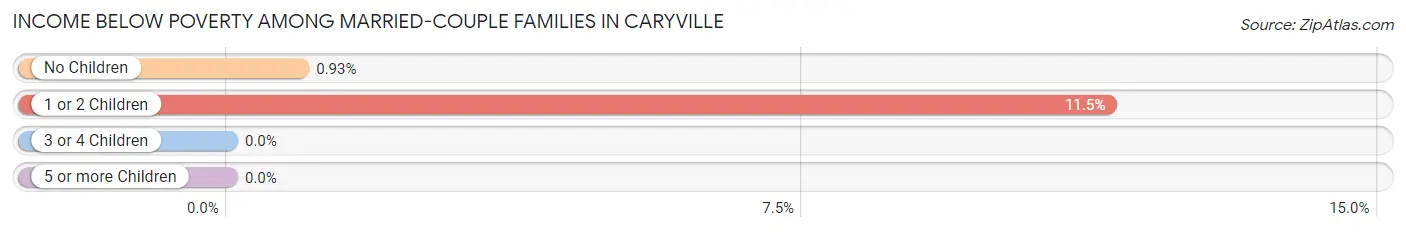
| Children | Above Poverty | Below Poverty |
| No Children | 318 (99.1%) | 3 (0.9%) |
| 1 or 2 Children | 108 (88.5%) | 14 (11.5%) |
| 3 or 4 Children | 11 (100.0%) | 0 (0.0%) |
| 5 or more Children | 2 (100.0%) | 0 (0.0%) |
| Total | 439 (96.3%) | 17 (3.7%) |
Income Below Poverty Among Single-Parent Households in Caryville
According to the poverty data in Caryville, 8.3% or 3 single-father households and 62.8% or 93 single-mother households are living below the poverty line. Among single-father households, those with 1 or 2 children have the highest poverty rate, with 3 households (25.0%) experiencing poverty. Likewise, among single-mother households, those with 3 or 4 children have the highest poverty rate, with 22 households (100.0%) falling below the poverty line.
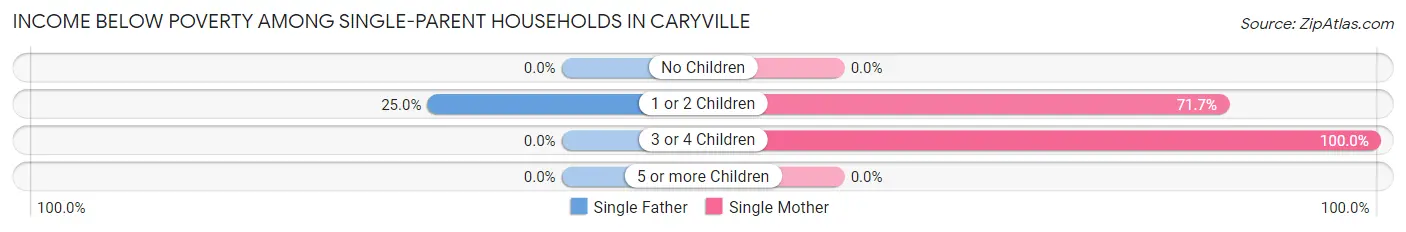
| Children | Single Father | Single Mother |
| No Children | 0 (0.0%) | 0 (0.0%) |
| 1 or 2 Children | 3 (25.0%) | 71 (71.7%) |
| 3 or 4 Children | 0 (0.0%) | 22 (100.0%) |
| 5 or more Children | 0 (0.0%) | 0 (0.0%) |
| Total | 3 (8.3%) | 93 (62.8%) |
Income Below Poverty Among Married-Couple vs Single-Parent Households in Caryville
The poverty data for Caryville shows that 17 of the married-couple family households (3.7%) and 96 of the single-parent households (52.2%) are living below the poverty level. Within the married-couple family households, those with 1 or 2 children have the highest poverty rate, with 14 households (11.5%) falling below the poverty line. Among the single-parent households, those with 3 or 4 children have the highest poverty rate, with 22 household (100.0%) living below poverty.
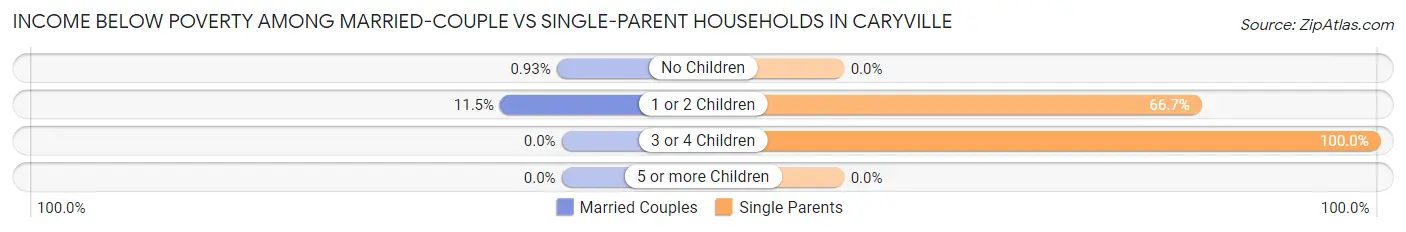
| Children | Married-Couple Families | Single-Parent Households |
| No Children | 3 (0.9%) | 0 (0.0%) |
| 1 or 2 Children | 14 (11.5%) | 74 (66.7%) |
| 3 or 4 Children | 0 (0.0%) | 22 (100.0%) |
| 5 or more Children | 0 (0.0%) | 0 (0.0%) |
| Total | 17 (3.7%) | 96 (52.2%) |
Race in Caryville
The most populous races in Caryville are White / Caucasian (2,072 | 95.0%), Hispanic or Latino (47 | 2.1%), and Some other Race (47 | 2.1%).
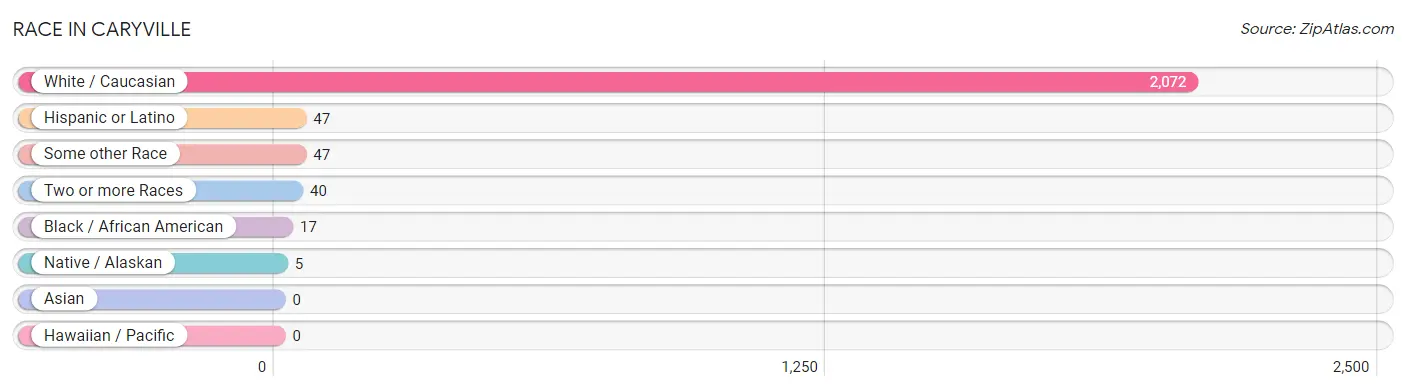
| Race | # Population | % Population |
| Asian | 0 | 0.0% |
| Black / African American | 17 | 0.8% |
| Hawaiian / Pacific | 0 | 0.0% |
| Hispanic or Latino | 47 | 2.1% |
| Native / Alaskan | 5 | 0.2% |
| White / Caucasian | 2,072 | 95.0% |
| Two or more Races | 40 | 1.8% |
| Some other Race | 47 | 2.1% |
| Total | 2,181 | 100.0% |
Ancestry in Caryville
The most populous ancestries reported in Caryville are German (235 | 10.8%), Irish (148 | 6.8%), English (146 | 6.7%), American (143 | 6.6%), and Dutch (99 | 4.5%), together accounting for 35.3% of all Caryville residents.
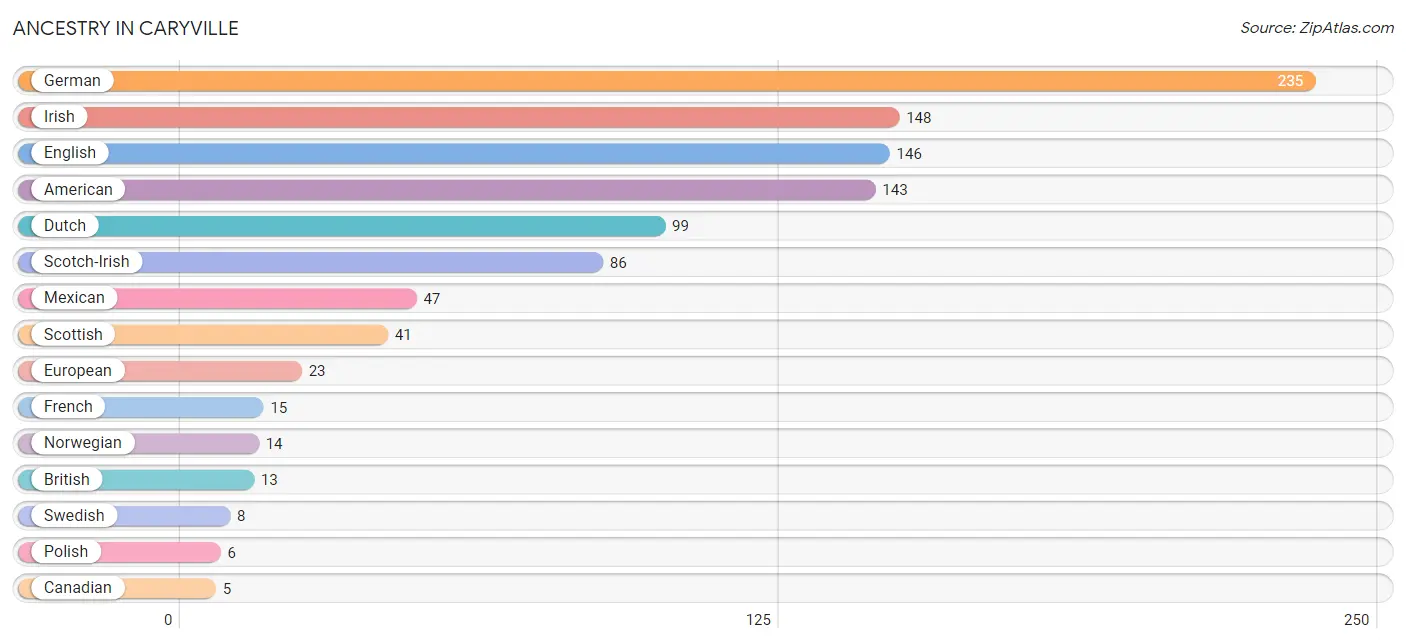
| Ancestry | # Population | % Population |
| American | 143 | 6.6% |
| British | 13 | 0.6% |
| Canadian | 5 | 0.2% |
| Cherokee | 3 | 0.1% |
| Dutch | 99 | 4.5% |
| English | 146 | 6.7% |
| European | 23 | 1.1% |
| French | 15 | 0.7% |
| German | 235 | 10.8% |
| Irish | 148 | 6.8% |
| Italian | 4 | 0.2% |
| Mexican | 47 | 2.1% |
| Norwegian | 14 | 0.6% |
| Polish | 6 | 0.3% |
| Scotch-Irish | 86 | 3.9% |
| Scottish | 41 | 1.9% |
| Swedish | 8 | 0.4% | View All 17 Rows |
Immigrants in Caryville
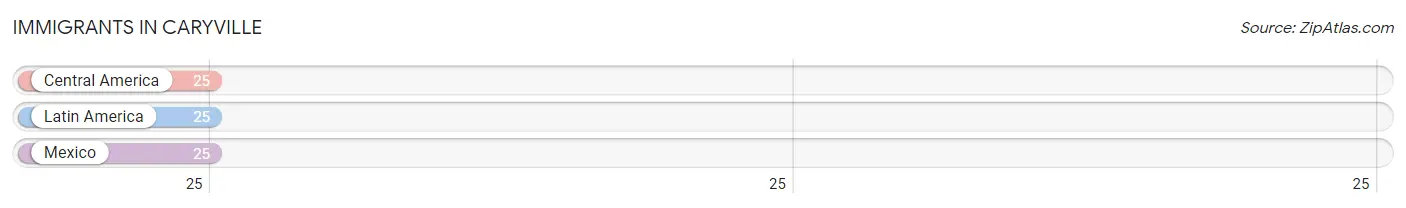
The most numerous immigrant groups reported in Caryville came from Central America (25 | 1.1%), Latin America (25 | 1.1%), and Mexico (25 | 1.1%), together accounting for 3.5% of all Caryville residents.
| Immigration Origin | # Population | % Population |
| Central America | 25 | 1.1% |
| Latin America | 25 | 1.1% |
| Mexico | 25 | 1.1% | View All 3 Rows |
Sex and Age in Caryville
Sex and Age in Caryville
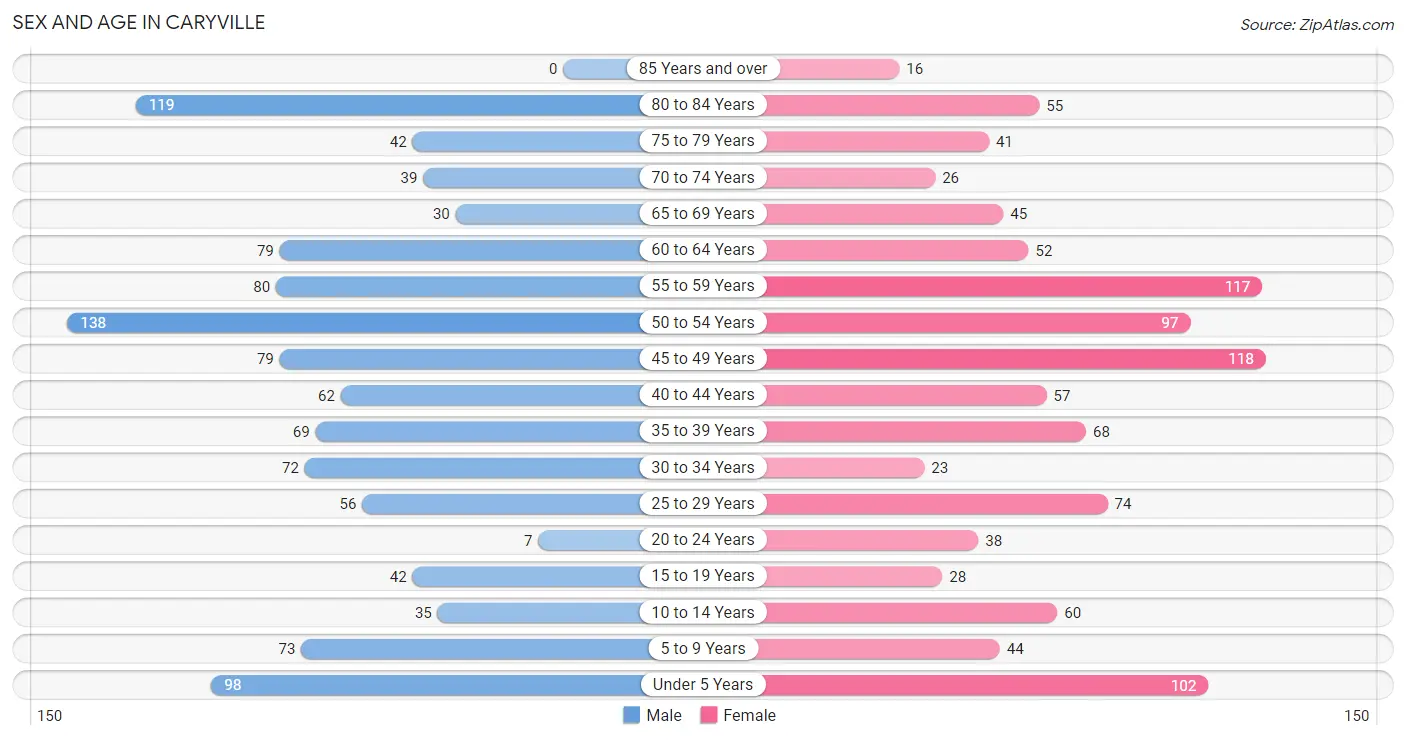
The most populous age groups in Caryville are 50 to 54 Years (138 | 12.3%) for men and 45 to 49 Years (118 | 11.1%) for women.
| Age Bracket | Male | Female |
| Under 5 Years | 98 (8.7%) | 102 (9.6%) |
| 5 to 9 Years | 73 (6.5%) | 44 (4.2%) |
| 10 to 14 Years | 35 (3.1%) | 60 (5.7%) |
| 15 to 19 Years | 42 (3.7%) | 28 (2.6%) |
| 20 to 24 Years | 7 (0.6%) | 38 (3.6%) |
| 25 to 29 Years | 56 (5.0%) | 74 (7.0%) |
| 30 to 34 Years | 72 (6.4%) | 23 (2.2%) |
| 35 to 39 Years | 69 (6.2%) | 68 (6.4%) |
| 40 to 44 Years | 62 (5.5%) | 57 (5.4%) |
| 45 to 49 Years | 79 (7.0%) | 118 (11.1%) |
| 50 to 54 Years | 138 (12.3%) | 97 (9.1%) |
| 55 to 59 Years | 80 (7.1%) | 117 (11.0%) |
| 60 to 64 Years | 79 (7.0%) | 52 (4.9%) |
| 65 to 69 Years | 30 (2.7%) | 45 (4.2%) |
| 70 to 74 Years | 39 (3.5%) | 26 (2.5%) |
| 75 to 79 Years | 42 (3.7%) | 41 (3.9%) |
| 80 to 84 Years | 119 (10.6%) | 55 (5.2%) |
| 85 Years and over | 0 (0.0%) | 16 (1.5%) |
| Total | 1,120 (100.0%) | 1,061 (100.0%) |
Families and Households in Caryville
Median Family Size in Caryville
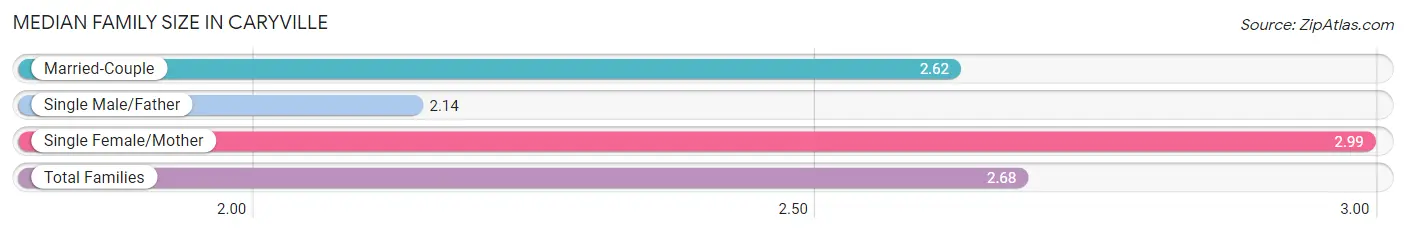
The median family size in Caryville is 2.68 persons per family, with single female/mother families (148 | 23.1%) accounting for the largest median family size of 2.99 persons per family. On the other hand, single male/father families (36 | 5.6%) represent the smallest median family size with 2.14 persons per family.
| Family Type | # Families | Family Size |
| Married-Couple | 456 (71.3%) | 2.62 |
| Single Male/Father | 36 (5.6%) | 2.14 |
| Single Female/Mother | 148 (23.1%) | 2.99 |
| Total Families | 640 (100.0%) | 2.68 |
Median Household Size in Caryville
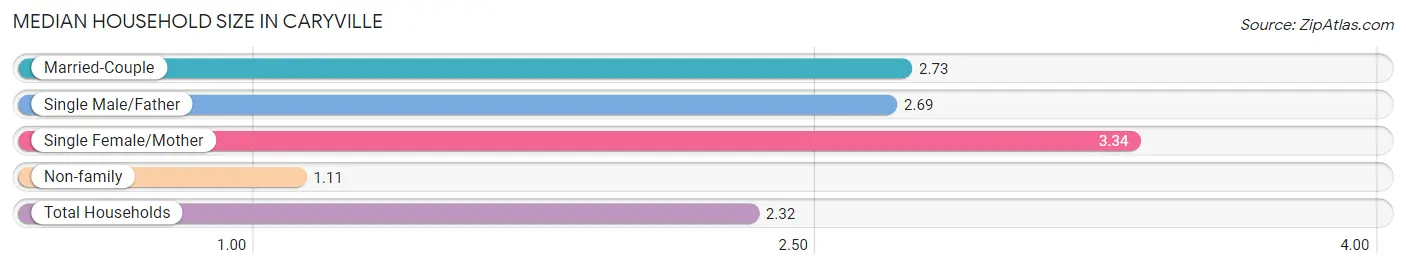
The median household size in Caryville is 2.32 persons per household, with single female/mother households (148 | 16.0%) accounting for the largest median household size of 3.34 persons per household. non-family households (288 | 31.0%) represent the smallest median household size with 1.11 persons per household.
| Household Type | # Households | Household Size |
| Married-Couple | 456 (49.1%) | 2.73 |
| Single Male/Father | 36 (3.9%) | 2.69 |
| Single Female/Mother | 148 (16.0%) | 3.34 |
| Non-family | 288 (31.0%) | 1.11 |
| Total Households | 928 (100.0%) | 2.32 |
Household Size by Marriage Status in Caryville
Out of a total of 928 households in Caryville, 640 (69.0%) are family households, while 288 (31.0%) are nonfamily households. The most numerous type of family households are 2-person households, comprising 304, and the most common type of nonfamily households are 1-person households, comprising 259.
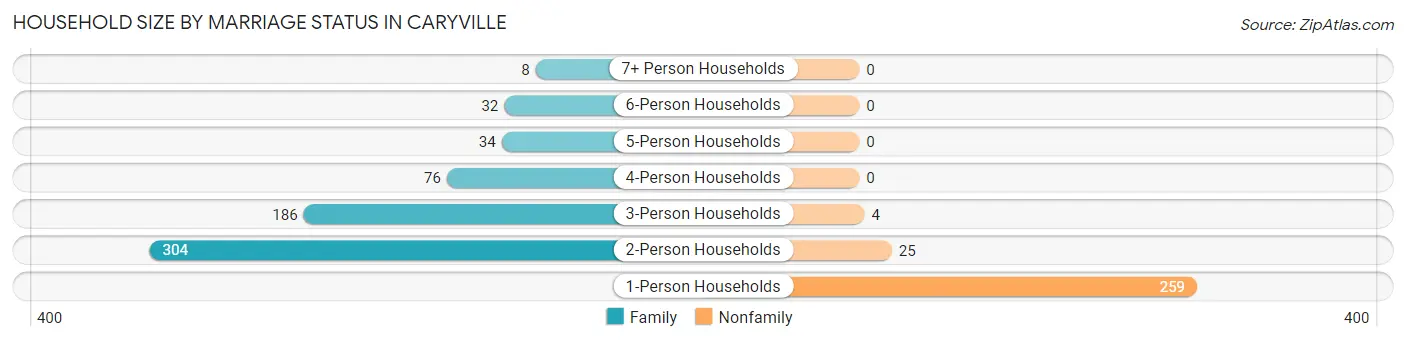
| Household Size | Family Households | Nonfamily Households |
| 1-Person Households | - | 259 (27.9%) |
| 2-Person Households | 304 (32.8%) | 25 (2.7%) |
| 3-Person Households | 186 (20.0%) | 4 (0.4%) |
| 4-Person Households | 76 (8.2%) | 0 (0.0%) |
| 5-Person Households | 34 (3.7%) | 0 (0.0%) |
| 6-Person Households | 32 (3.5%) | 0 (0.0%) |
| 7+ Person Households | 8 (0.9%) | 0 (0.0%) |
| Total | 640 (69.0%) | 288 (31.0%) |
Female Fertility in Caryville
Fertility by Age in Caryville
Average fertility rate in Caryville is 92.0 births per 1,000 women. Women in the age bracket of 20 to 34 years have the highest fertility rate with 244.0 births per 1,000 women. Women in the age bracket of 20 to 34 years acount for 82.5% of all women with births.
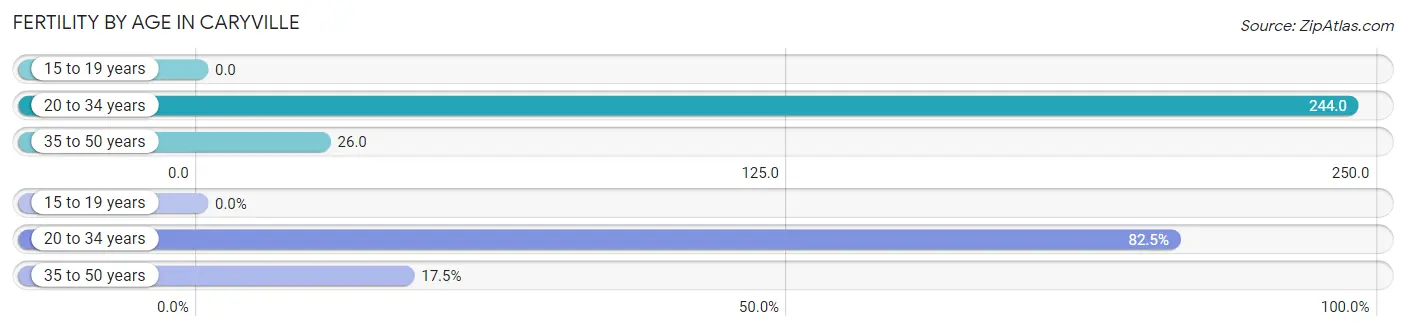
| Age Bracket | Women with Births | Births / 1,000 Women |
| 15 to 19 years | 0 (0.0%) | 0.0 |
| 20 to 34 years | 33 (82.5%) | 244.0 |
| 35 to 50 years | 7 (17.5%) | 26.0 |
| Total | 40 (100.0%) | 92.0 |
Fertility by Age by Marriage Status in Caryville
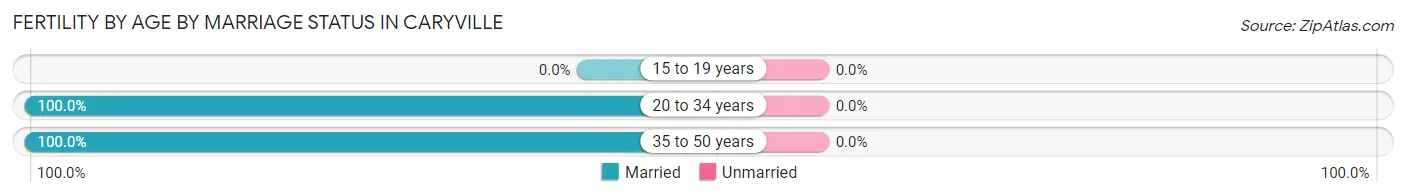
| Age Bracket | Married | Unmarried |
| 15 to 19 years | 0 (0.0%) | 0 (0.0%) |
| 20 to 34 years | 33 (100.0%) | 0 (0.0%) |
| 35 to 50 years | 7 (100.0%) | 0 (0.0%) |
| Total | 40 (100.0%) | 0 (0.0%) |
Fertility by Education in Caryville
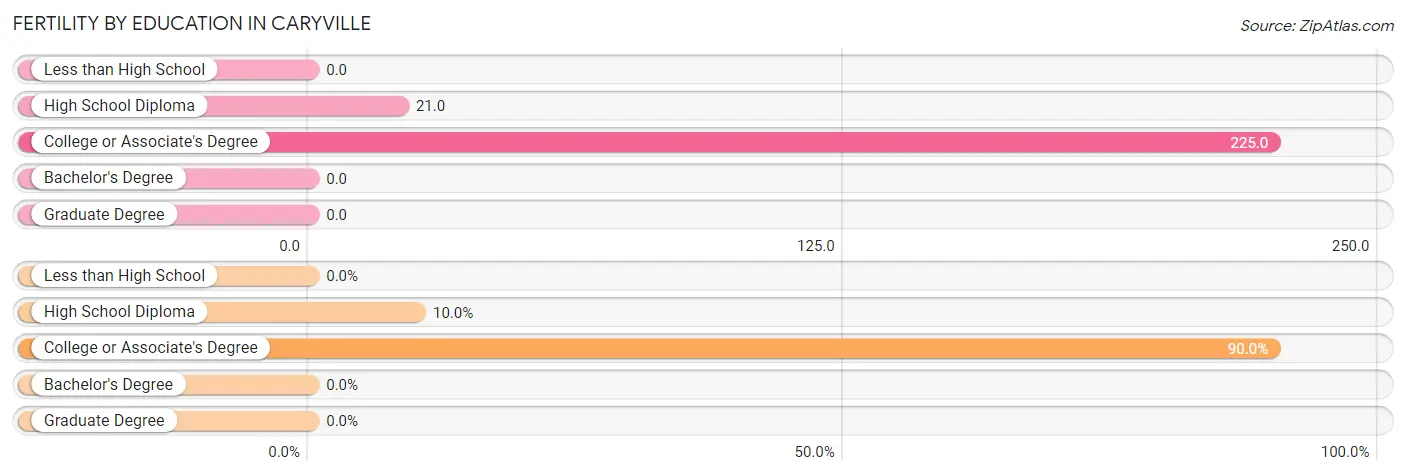
| Educational Attainment | Women with Births | Births / 1,000 Women |
| Less than High School | 0 (0.0%) | 0.0 |
| High School Diploma | 4 (10.0%) | 21.0 |
| College or Associate's Degree | 36 (90.0%) | 225.0 |
| Bachelor's Degree | 0 (0.0%) | 0.0 |
| Graduate Degree | 0 (0.0%) | 0.0 |
| Total | 40 (100.0%) | 92.0 |
Fertility by Education by Marriage Status in Caryville
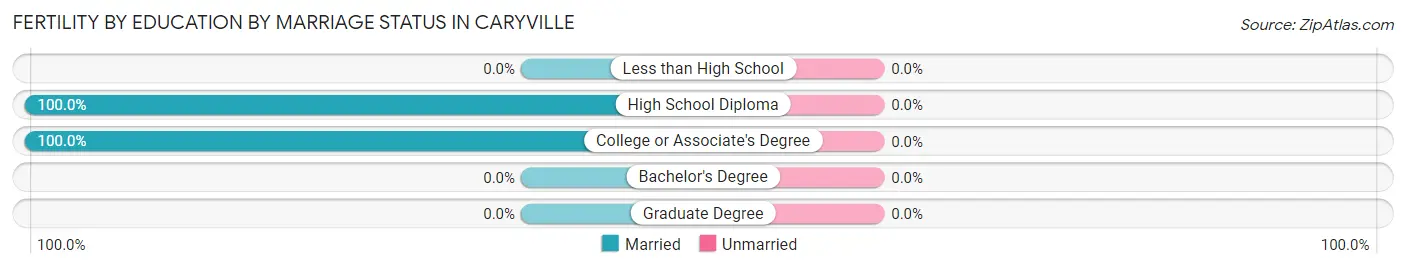
| Educational Attainment | Married | Unmarried |
| Less than High School | 0 (0.0%) | 0 (0.0%) |
| High School Diploma | 4 (100.0%) | 0 (0.0%) |
| College or Associate's Degree | 36 (100.0%) | 0 (0.0%) |
| Bachelor's Degree | 0 (0.0%) | 0 (0.0%) |
| Graduate Degree | 0 (0.0%) | 0 (0.0%) |
| Total | 40 (100.0%) | 0 (0.0%) |
Employment Characteristics in Caryville
Employment by Class of Employer in Caryville
Among the 883 employed individuals in Caryville, private company employees (548 | 62.1%), local government employees (106 | 12.0%), and self-employed (incorporated) (74 | 8.4%) make up the most common classes of employment.
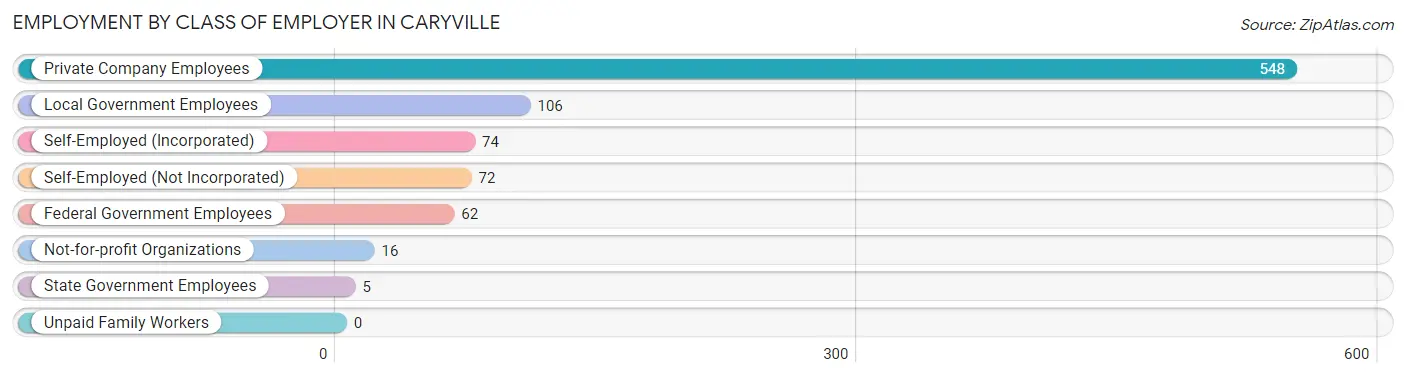
| Employer Class | # Employees | % Employees |
| Private Company Employees | 548 | 62.1% |
| Self-Employed (Incorporated) | 74 | 8.4% |
| Self-Employed (Not Incorporated) | 72 | 8.2% |
| Not-for-profit Organizations | 16 | 1.8% |
| Local Government Employees | 106 | 12.0% |
| State Government Employees | 5 | 0.6% |
| Federal Government Employees | 62 | 7.0% |
| Unpaid Family Workers | 0 | 0.0% |
| Total | 883 | 100.0% |
Employment Status by Age in Caryville
According to the labor force statistics for Caryville, out of the total population over 16 years of age (1,738), 57.5% or 999 individuals are in the labor force, with 10.7% or 107 of them unemployed. The age group with the highest labor force participation rate is 20 to 24 years, with 91.1% or 41 individuals in the labor force. Within the labor force, the 16 to 19 years age range has the highest percentage of unemployed individuals, with 69.2% or 9 of them being unemployed.
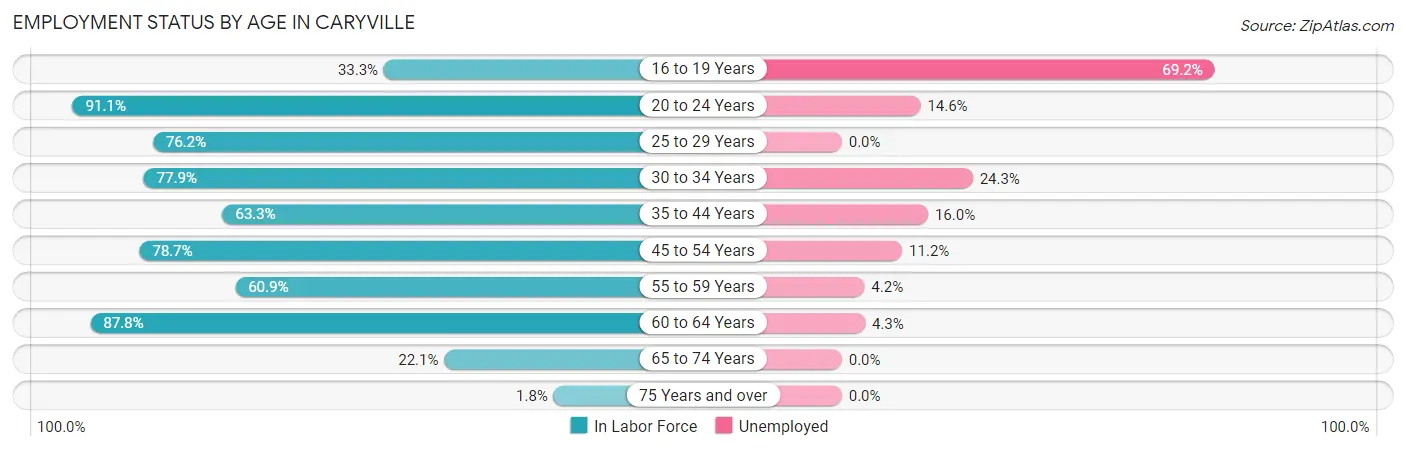
| Age Bracket | In Labor Force | Unemployed |
| 16 to 19 Years | 13 (33.3%) | 9 (69.2%) |
| 20 to 24 Years | 41 (91.1%) | 6 (14.6%) |
| 25 to 29 Years | 99 (76.2%) | 0 (0.0%) |
| 30 to 34 Years | 74 (77.9%) | 18 (24.3%) |
| 35 to 44 Years | 162 (63.3%) | 26 (16.0%) |
| 45 to 54 Years | 340 (78.7%) | 38 (11.2%) |
| 55 to 59 Years | 120 (60.9%) | 5 (4.2%) |
| 60 to 64 Years | 115 (87.8%) | 5 (4.3%) |
| 65 to 74 Years | 31 (22.1%) | 0 (0.0%) |
| 75 Years and over | 5 (1.8%) | 0 (0.0%) |
| Total | 999 (57.5%) | 107 (10.7%) |
Employment Status by Educational Attainment in Caryville
According to labor force statistics for Caryville, 73.3% of individuals (910) out of the total population between 25 and 64 years of age (1,241) are in the labor force, with 10.1% or 92 of them being unemployed. The group with the highest labor force participation rate are those with the educational attainment of college / associate degree, with 81.1% or 309 individuals in the labor force. Within the labor force, individuals with less than high school education have the highest percentage of unemployment, with 25.3% or 22 of them being unemployed.
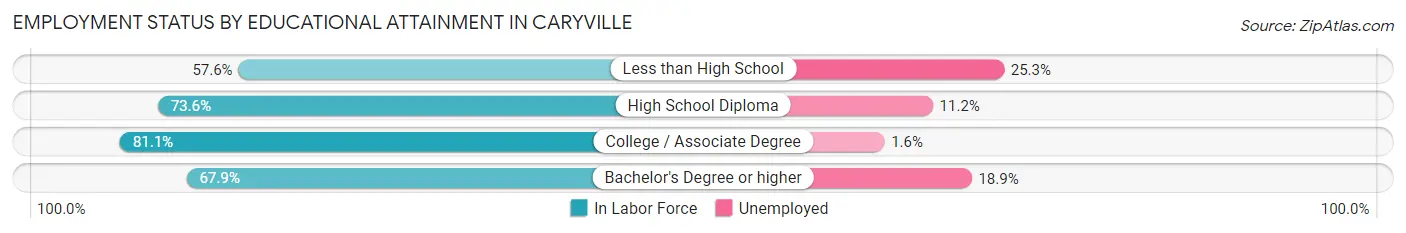
| Educational Attainment | In Labor Force | Unemployed |
| Less than High School | 87 (57.6%) | 38 (25.3%) |
| High School Diploma | 419 (73.6%) | 64 (11.2%) |
| College / Associate Degree | 309 (81.1%) | 6 (1.6%) |
| Bachelor's Degree or higher | 95 (67.9%) | 26 (18.9%) |
| Total | 910 (73.3%) | 125 (10.1%) |
Employment Occupations by Sex in Caryville
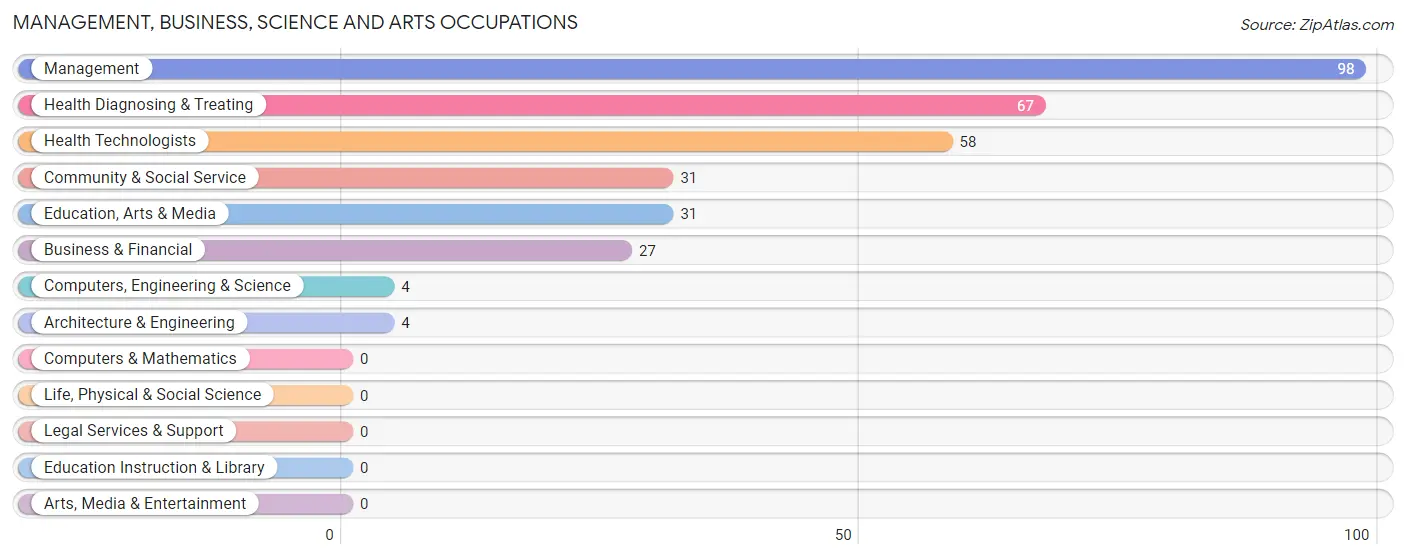
Management, Business, Science and Arts Occupations
The most common Management, Business, Science and Arts occupations in Caryville are Management (98 | 11.0%), Health Diagnosing & Treating (67 | 7.5%), Health Technologists (58 | 6.5%), Community & Social Service (31 | 3.5%), and Education, Arts & Media (31 | 3.5%).
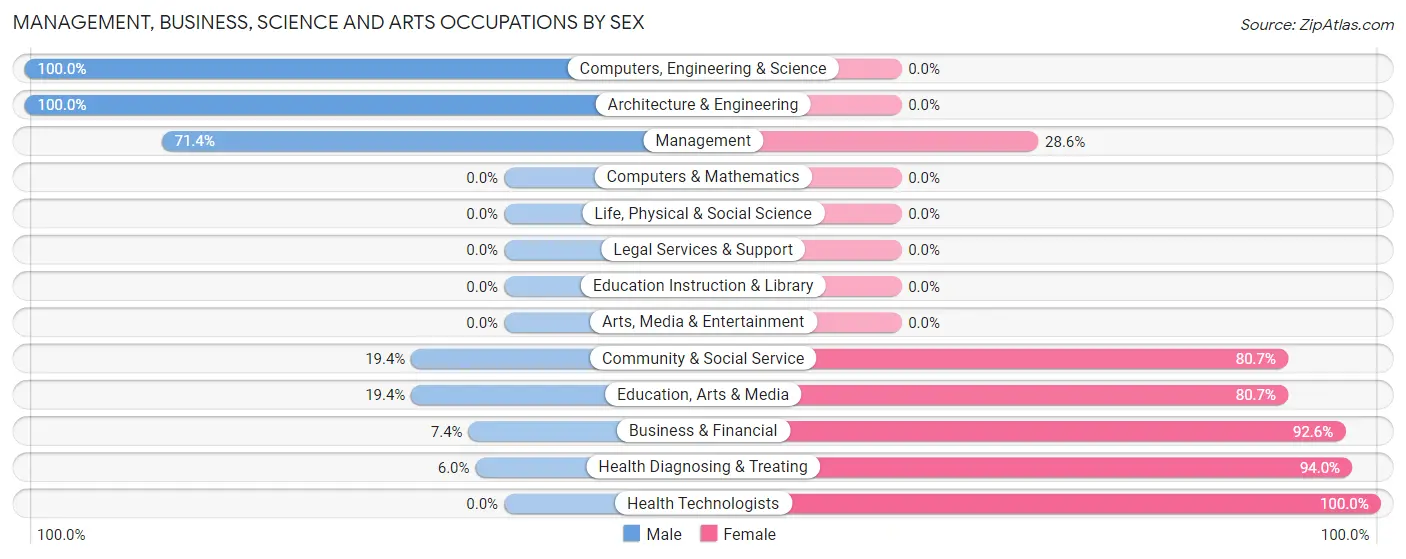
Management, Business, Science and Arts Occupations by Sex
Within the Management, Business, Science and Arts occupations in Caryville, the most male-oriented occupations are Computers, Engineering & Science (100.0%), Architecture & Engineering (100.0%), and Management (71.4%), while the most female-oriented occupations are Health Technologists (100.0%), Health Diagnosing & Treating (94.0%), and Business & Financial (92.6%).
| Occupation | Male | Female |
| Management | 70 (71.4%) | 28 (28.6%) |
| Business & Financial | 2 (7.4%) | 25 (92.6%) |
| Computers, Engineering & Science | 4 (100.0%) | 0 (0.0%) |
| Computers & Mathematics | 0 (0.0%) | 0 (0.0%) |
| Architecture & Engineering | 4 (100.0%) | 0 (0.0%) |
| Life, Physical & Social Science | 0 (0.0%) | 0 (0.0%) |
| Community & Social Service | 6 (19.4%) | 25 (80.6%) |
| Education, Arts & Media | 6 (19.4%) | 25 (80.6%) |
| Legal Services & Support | 0 (0.0%) | 0 (0.0%) |
| Education Instruction & Library | 0 (0.0%) | 0 (0.0%) |
| Arts, Media & Entertainment | 0 (0.0%) | 0 (0.0%) |
| Health Diagnosing & Treating | 4 (6.0%) | 63 (94.0%) |
| Health Technologists | 0 (0.0%) | 58 (100.0%) |
| Total (Category) | 86 (37.9%) | 141 (62.1%) |
| Total (Overall) | 525 (58.8%) | 368 (41.2%) |
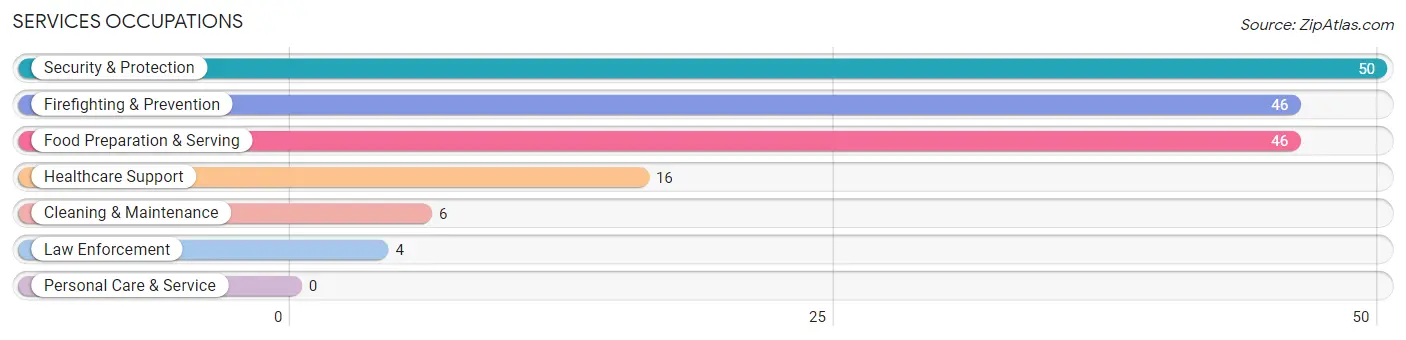
Services Occupations
The most common Services occupations in Caryville are Security & Protection (50 | 5.6%), Firefighting & Prevention (46 | 5.1%), Food Preparation & Serving (46 | 5.1%), Healthcare Support (16 | 1.8%), and Cleaning & Maintenance (6 | 0.7%).
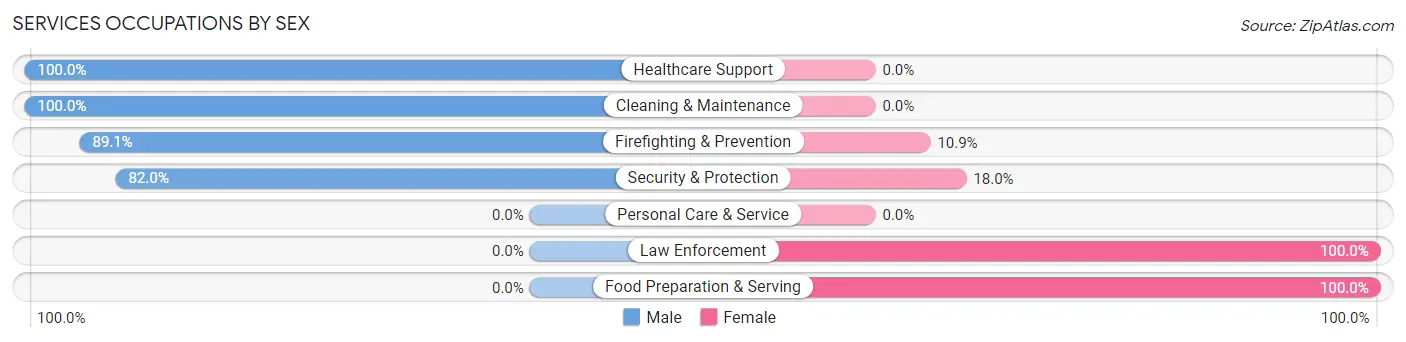
Services Occupations by Sex
Within the Services occupations in Caryville, the most male-oriented occupations are Healthcare Support (100.0%), Cleaning & Maintenance (100.0%), and Firefighting & Prevention (89.1%), while the most female-oriented occupations are Law Enforcement (100.0%), Food Preparation & Serving (100.0%), and Security & Protection (18.0%).
| Occupation | Male | Female |
| Healthcare Support | 16 (100.0%) | 0 (0.0%) |
| Security & Protection | 41 (82.0%) | 9 (18.0%) |
| Firefighting & Prevention | 41 (89.1%) | 5 (10.9%) |
| Law Enforcement | 0 (0.0%) | 4 (100.0%) |
| Food Preparation & Serving | 0 (0.0%) | 46 (100.0%) |
| Cleaning & Maintenance | 6 (100.0%) | 0 (0.0%) |
| Personal Care & Service | 0 (0.0%) | 0 (0.0%) |
| Total (Category) | 63 (53.4%) | 55 (46.6%) |
| Total (Overall) | 525 (58.8%) | 368 (41.2%) |
Sales and Office Occupations
The most common Sales and Office occupations in Caryville are Sales & Related (148 | 16.6%), and Office & Administration (98 | 11.0%).
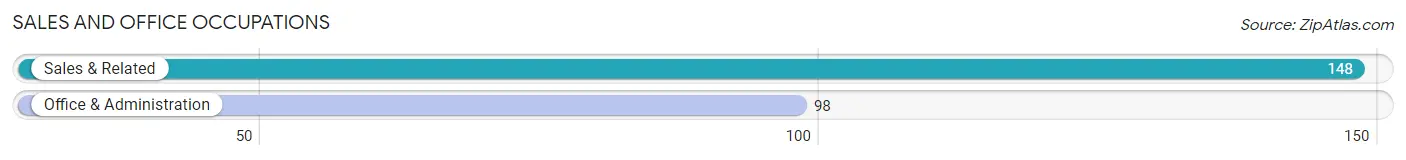
Sales and Office Occupations by Sex
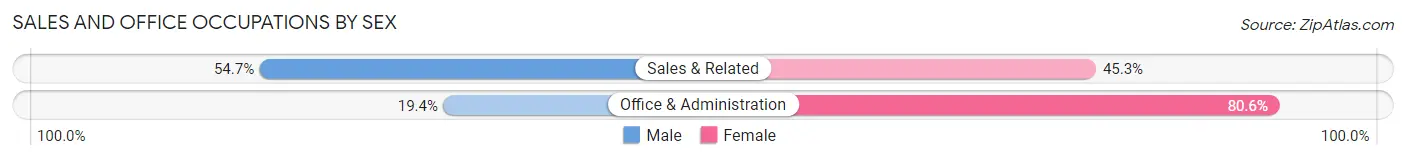
| Occupation | Male | Female |
| Sales & Related | 81 (54.7%) | 67 (45.3%) |
| Office & Administration | 19 (19.4%) | 79 (80.6%) |
| Total (Category) | 100 (40.6%) | 146 (59.4%) |
| Total (Overall) | 525 (58.8%) | 368 (41.2%) |
Natural Resources, Construction and Maintenance Occupations
The most common Natural Resources, Construction and Maintenance occupations in Caryville are Construction & Extraction (74 | 8.3%), Installation, Maintenance & Repair (47 | 5.3%), and Farming, Fishing & Forestry (25 | 2.8%).
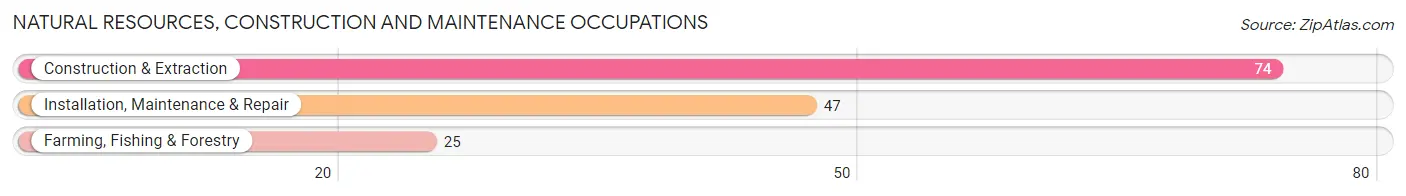
Natural Resources, Construction and Maintenance Occupations by Sex
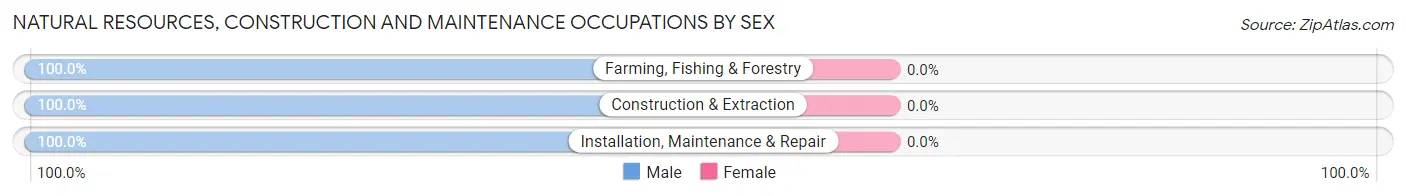
| Occupation | Male | Female |
| Farming, Fishing & Forestry | 25 (100.0%) | 0 (0.0%) |
| Construction & Extraction | 74 (100.0%) | 0 (0.0%) |
| Installation, Maintenance & Repair | 47 (100.0%) | 0 (0.0%) |
| Total (Category) | 146 (100.0%) | 0 (0.0%) |
| Total (Overall) | 525 (58.8%) | 368 (41.2%) |
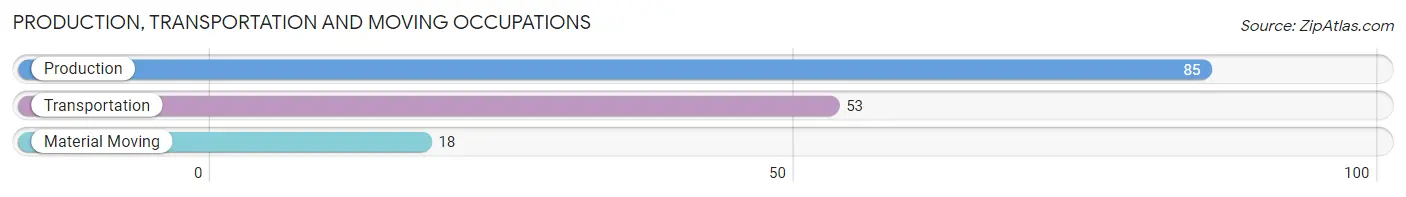
Production, Transportation and Moving Occupations
The most common Production, Transportation and Moving occupations in Caryville are Production (85 | 9.5%), Transportation (53 | 5.9%), and Material Moving (18 | 2.0%).
Production, Transportation and Moving Occupations by Sex
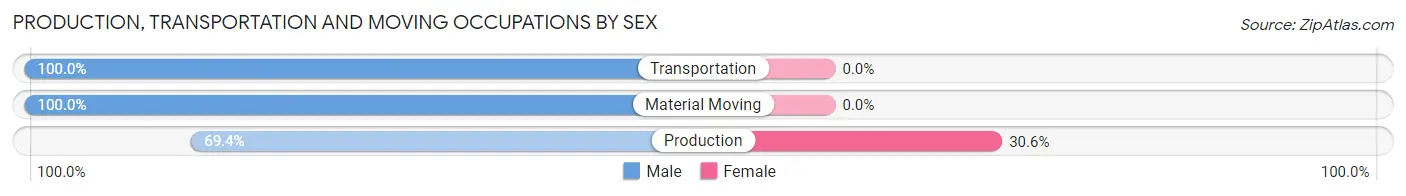
| Occupation | Male | Female |
| Production | 59 (69.4%) | 26 (30.6%) |
| Transportation | 53 (100.0%) | 0 (0.0%) |
| Material Moving | 18 (100.0%) | 0 (0.0%) |
| Total (Category) | 130 (83.3%) | 26 (16.7%) |
| Total (Overall) | 525 (58.8%) | 368 (41.2%) |
Employment Industries by Sex in Caryville
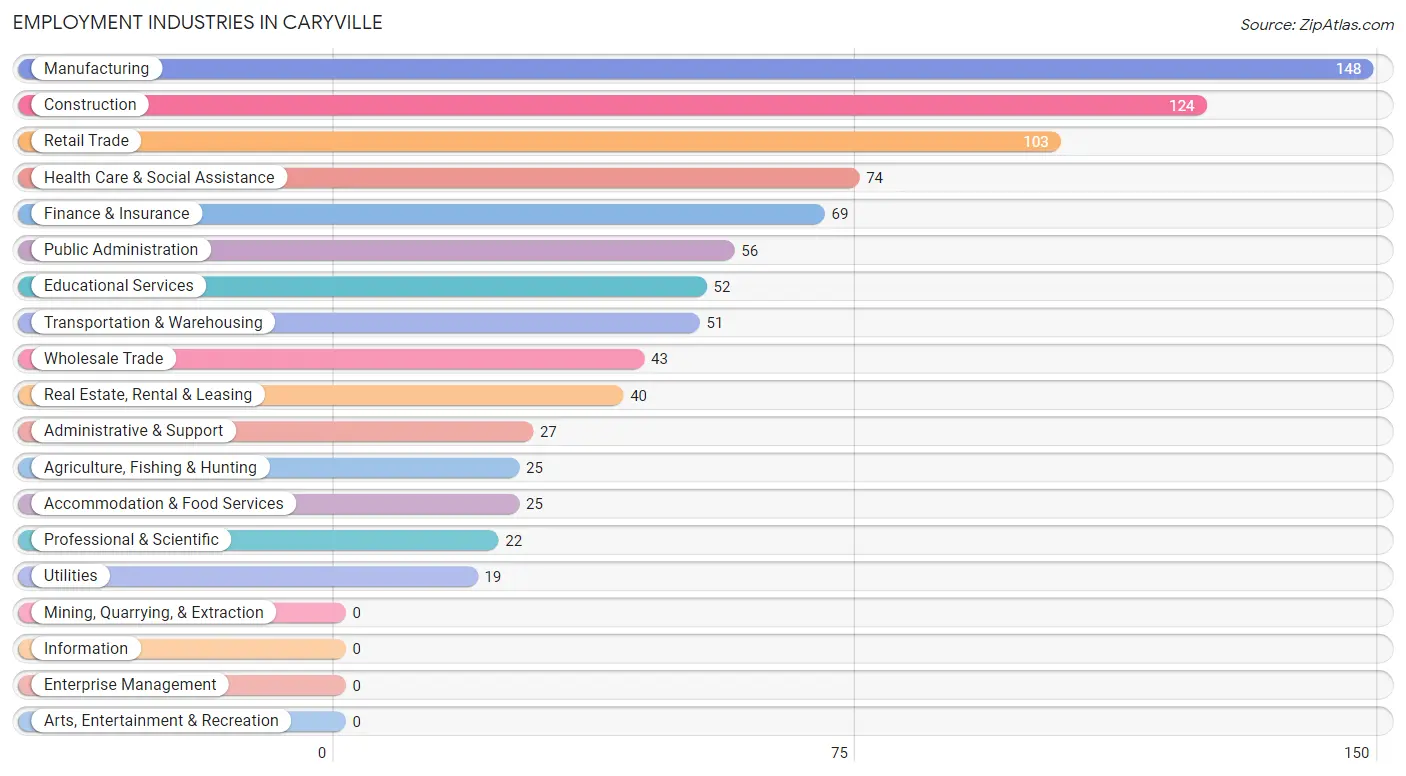
Employment Industries in Caryville
The major employment industries in Caryville include Manufacturing (148 | 16.6%), Construction (124 | 13.9%), Retail Trade (103 | 11.5%), Health Care & Social Assistance (74 | 8.3%), and Finance & Insurance (69 | 7.7%).
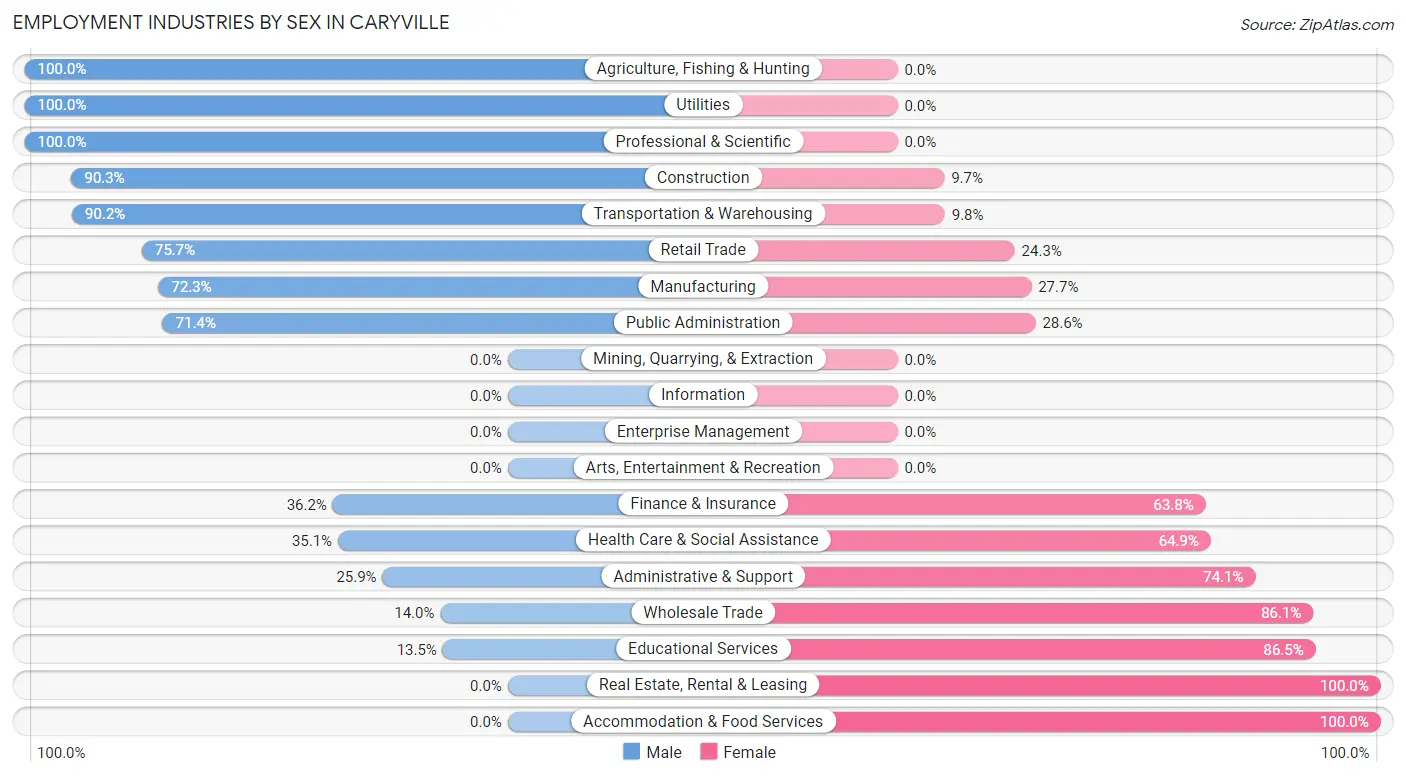
Employment Industries by Sex in Caryville
The Caryville industries that see more men than women are Agriculture, Fishing & Hunting (100.0%), Utilities (100.0%), and Professional & Scientific (100.0%), whereas the industries that tend to have a higher number of women are Real Estate, Rental & Leasing (100.0%), Accommodation & Food Services (100.0%), and Educational Services (86.5%).
| Industry | Male | Female |
| Agriculture, Fishing & Hunting | 25 (100.0%) | 0 (0.0%) |
| Mining, Quarrying, & Extraction | 0 (0.0%) | 0 (0.0%) |
| Construction | 112 (90.3%) | 12 (9.7%) |
| Manufacturing | 107 (72.3%) | 41 (27.7%) |
| Wholesale Trade | 6 (14.0%) | 37 (86.1%) |
| Retail Trade | 78 (75.7%) | 25 (24.3%) |
| Transportation & Warehousing | 46 (90.2%) | 5 (9.8%) |
| Utilities | 19 (100.0%) | 0 (0.0%) |
| Information | 0 (0.0%) | 0 (0.0%) |
| Finance & Insurance | 25 (36.2%) | 44 (63.8%) |
| Real Estate, Rental & Leasing | 0 (0.0%) | 40 (100.0%) |
| Professional & Scientific | 22 (100.0%) | 0 (0.0%) |
| Enterprise Management | 0 (0.0%) | 0 (0.0%) |
| Administrative & Support | 7 (25.9%) | 20 (74.1%) |
| Educational Services | 7 (13.5%) | 45 (86.5%) |
| Health Care & Social Assistance | 26 (35.1%) | 48 (64.9%) |
| Arts, Entertainment & Recreation | 0 (0.0%) | 0 (0.0%) |
| Accommodation & Food Services | 0 (0.0%) | 25 (100.0%) |
| Public Administration | 40 (71.4%) | 16 (28.6%) |
| Total | 525 (58.8%) | 368 (41.2%) |
Education in Caryville
School Enrollment in Caryville
The most common levels of schooling among the 334 students in Caryville are elementary school (88 | 26.4%), high school (72 | 21.6%), and middle school (67 | 20.1%).
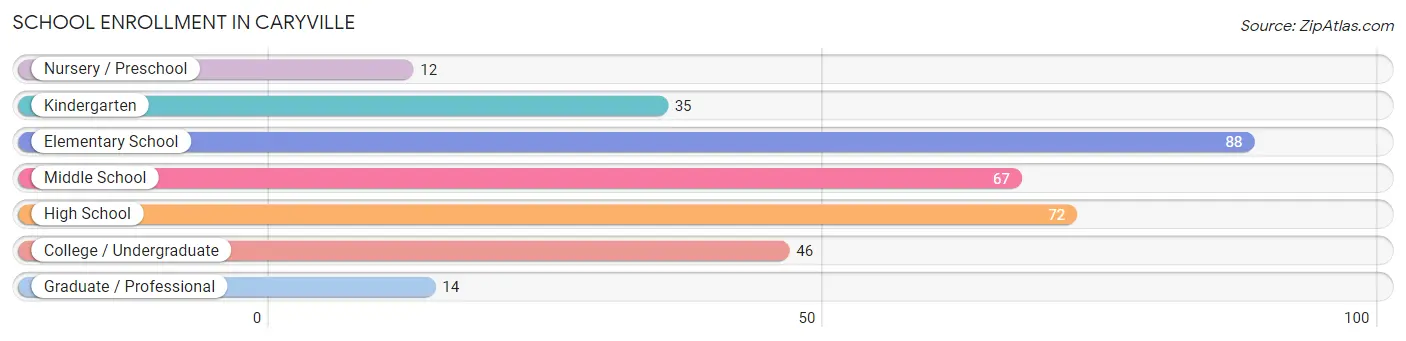
| School Level | # Students | % Students |
| Nursery / Preschool | 12 | 3.6% |
| Kindergarten | 35 | 10.5% |
| Elementary School | 88 | 26.4% |
| Middle School | 67 | 20.1% |
| High School | 72 | 21.6% |
| College / Undergraduate | 46 | 13.8% |
| Graduate / Professional | 14 | 4.2% |
| Total | 334 | 100.0% |
School Enrollment by Age by Funding Source in Caryville
Out of a total of 334 students who are enrolled in schools in Caryville, 30 (9.0%) attend a private institution, while the remaining 304 (91.0%) are enrolled in public schools. The age group of 15 to 17 year olds has the highest likelihood of being enrolled in private schools, with 15 (27.8% in the age bracket) enrolled. Conversely, the age group of 3 to 4 year olds has the lowest likelihood of being enrolled in a private school, with 8 (100.0% in the age bracket) attending a public institution.
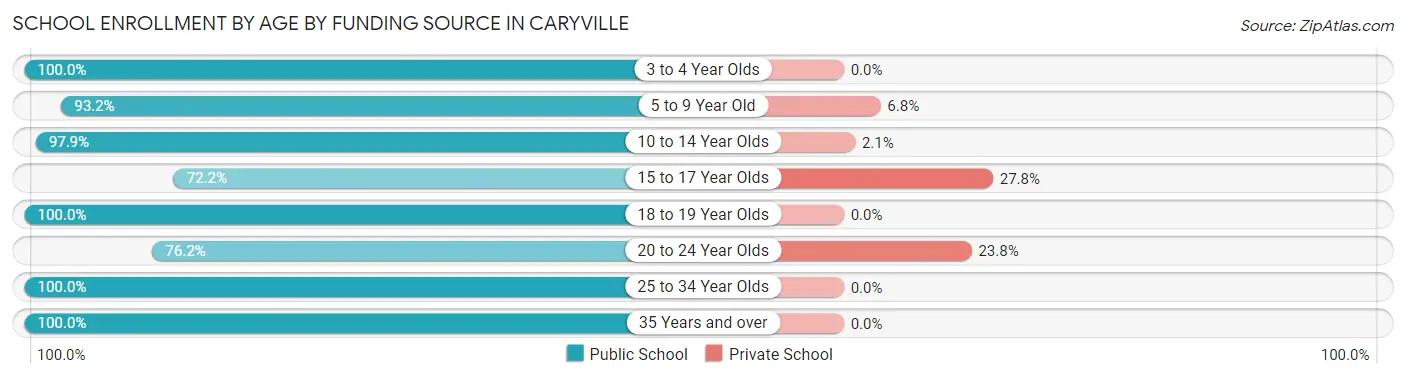
| Age Bracket | Public School | Private School |
| 3 to 4 Year Olds | 8 (100.0%) | 0 (0.0%) |
| 5 to 9 Year Old | 109 (93.2%) | 8 (6.8%) |
| 10 to 14 Year Olds | 93 (97.9%) | 2 (2.1%) |
| 15 to 17 Year Olds | 39 (72.2%) | 15 (27.8%) |
| 18 to 19 Year Olds | 4 (100.0%) | 0 (0.0%) |
| 20 to 24 Year Olds | 16 (76.2%) | 5 (23.8%) |
| 25 to 34 Year Olds | 16 (100.0%) | 0 (0.0%) |
| 35 Years and over | 19 (100.0%) | 0 (0.0%) |
| Total | 304 (91.0%) | 30 (9.0%) |
Educational Attainment by Field of Study in Caryville
Business (85 | 51.2%), science & technology (39 | 23.5%), liberal arts & history (10 | 6.0%), arts & humanities (9 | 5.4%), and education (7 | 4.2%) are the most common fields of study among 166 individuals in Caryville who have obtained a bachelor's degree or higher.
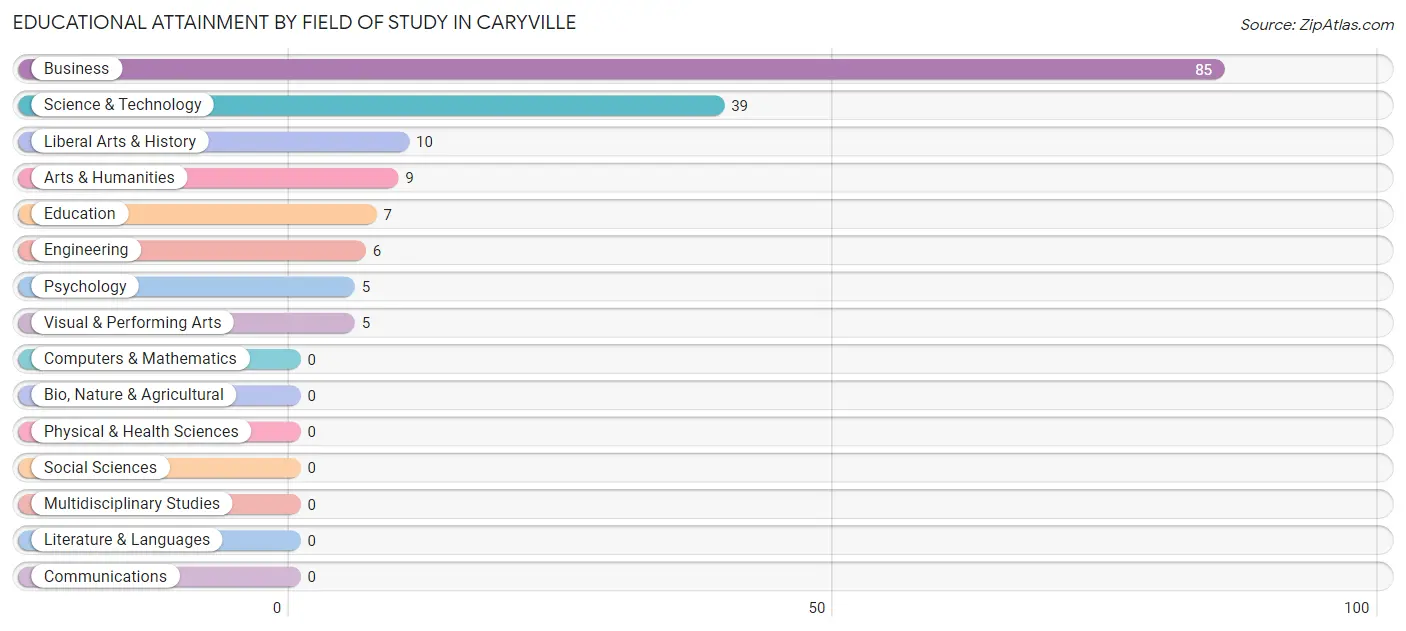
| Field of Study | # Graduates | % Graduates |
| Computers & Mathematics | 0 | 0.0% |
| Bio, Nature & Agricultural | 0 | 0.0% |
| Physical & Health Sciences | 0 | 0.0% |
| Psychology | 5 | 3.0% |
| Social Sciences | 0 | 0.0% |
| Engineering | 6 | 3.6% |
| Multidisciplinary Studies | 0 | 0.0% |
| Science & Technology | 39 | 23.5% |
| Business | 85 | 51.2% |
| Education | 7 | 4.2% |
| Literature & Languages | 0 | 0.0% |
| Liberal Arts & History | 10 | 6.0% |
| Visual & Performing Arts | 5 | 3.0% |
| Communications | 0 | 0.0% |
| Arts & Humanities | 9 | 5.4% |
| Total | 166 | 100.0% |
Transportation & Commute in Caryville
Vehicle Availability by Sex in Caryville
The most prevalent vehicle ownership categories in Caryville are males with 3 vehicles (212, accounting for 41.2%) and females with 3 vehicles (144, making up 57.6%).
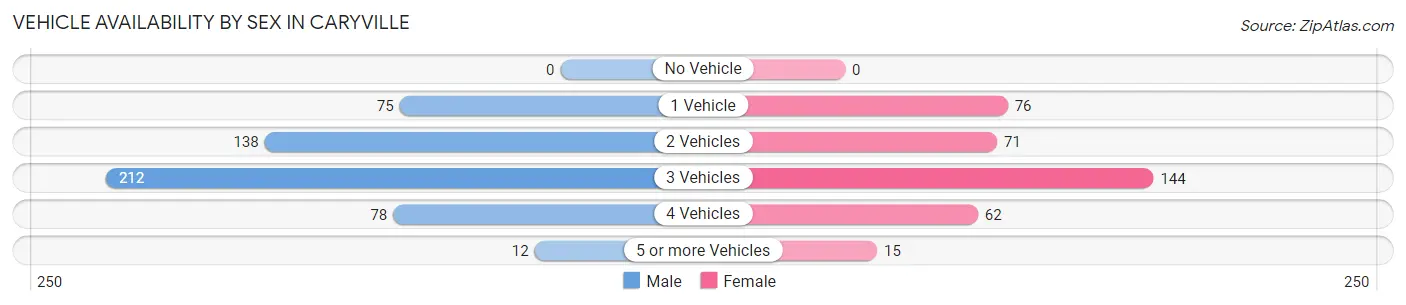
| Vehicles Available | Male | Female |
| No Vehicle | 0 (0.0%) | 0 (0.0%) |
| 1 Vehicle | 75 (14.6%) | 76 (20.6%) |
| 2 Vehicles | 138 (26.8%) | 71 (19.3%) |
| 3 Vehicles | 212 (41.2%) | 144 (39.1%) |
| 4 Vehicles | 78 (15.1%) | 62 (16.9%) |
| 5 or more Vehicles | 12 (2.3%) | 15 (4.1%) |
| Total | 515 (100.0%) | 368 (100.0%) |
Commute Time in Caryville
The most frequently occuring commute durations in Caryville are 5 to 9 minutes (133 commuters, 16.0%), 45 to 59 minutes (125 commuters, 15.0%), and 30 to 34 minutes (103 commuters, 12.3%).
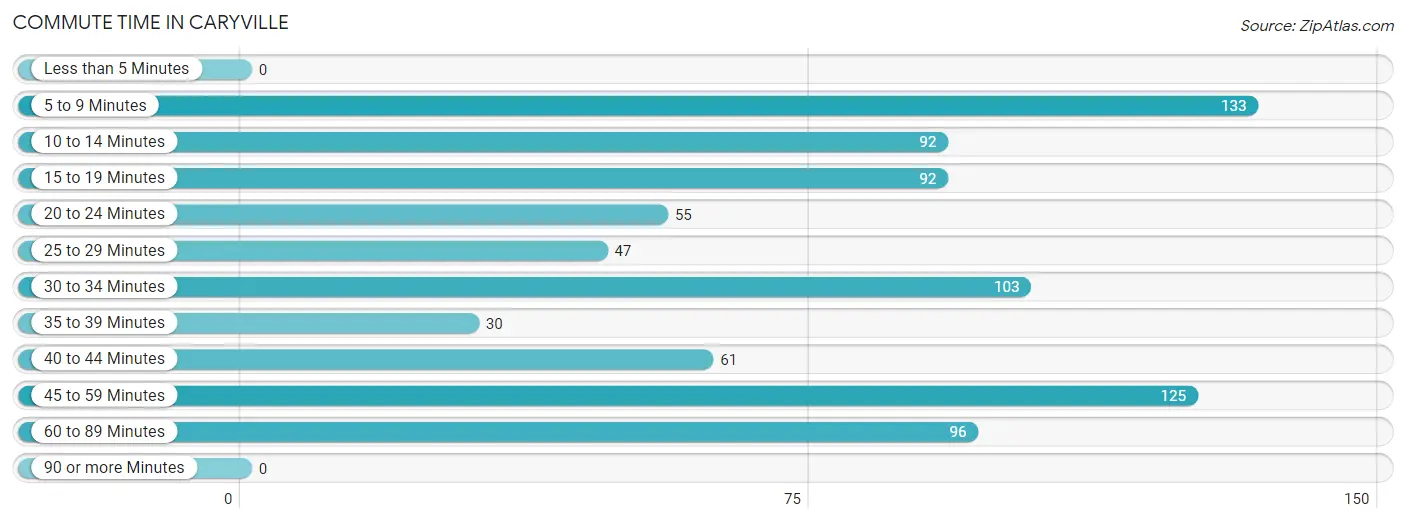
| Commute Time | # Commuters | % Commuters |
| Less than 5 Minutes | 0 | 0.0% |
| 5 to 9 Minutes | 133 | 16.0% |
| 10 to 14 Minutes | 92 | 11.0% |
| 15 to 19 Minutes | 92 | 11.0% |
| 20 to 24 Minutes | 55 | 6.6% |
| 25 to 29 Minutes | 47 | 5.6% |
| 30 to 34 Minutes | 103 | 12.3% |
| 35 to 39 Minutes | 30 | 3.6% |
| 40 to 44 Minutes | 61 | 7.3% |
| 45 to 59 Minutes | 125 | 15.0% |
| 60 to 89 Minutes | 96 | 11.5% |
| 90 or more Minutes | 0 | 0.0% |
Commute Time by Sex in Caryville
The most common commute times in Caryville are 45 to 59 minutes (103 commuters, 21.7%) for males and 5 to 9 minutes (55 commuters, 15.3%) for females.
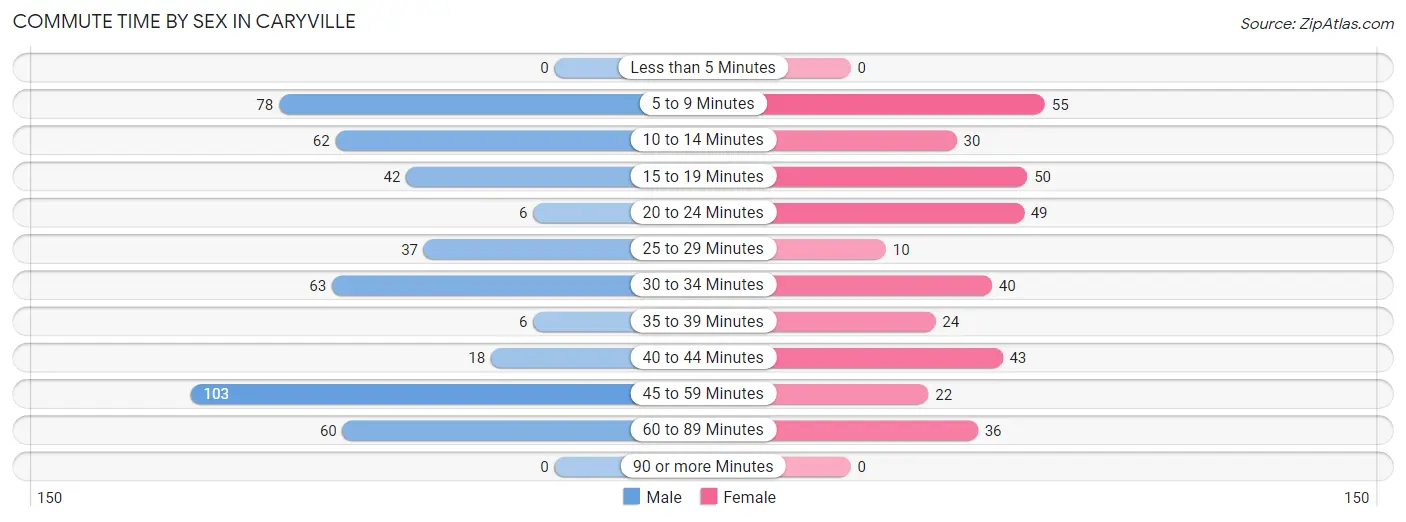
| Commute Time | Male | Female |
| Less than 5 Minutes | 0 (0.0%) | 0 (0.0%) |
| 5 to 9 Minutes | 78 (16.4%) | 55 (15.3%) |
| 10 to 14 Minutes | 62 (13.1%) | 30 (8.4%) |
| 15 to 19 Minutes | 42 (8.8%) | 50 (13.9%) |
| 20 to 24 Minutes | 6 (1.3%) | 49 (13.7%) |
| 25 to 29 Minutes | 37 (7.8%) | 10 (2.8%) |
| 30 to 34 Minutes | 63 (13.3%) | 40 (11.1%) |
| 35 to 39 Minutes | 6 (1.3%) | 24 (6.7%) |
| 40 to 44 Minutes | 18 (3.8%) | 43 (12.0%) |
| 45 to 59 Minutes | 103 (21.7%) | 22 (6.1%) |
| 60 to 89 Minutes | 60 (12.6%) | 36 (10.0%) |
| 90 or more Minutes | 0 (0.0%) | 0 (0.0%) |
Time of Departure to Work by Sex in Caryville
The most frequent times of departure to work in Caryville are 5:00 AM to 5:29 AM (98, 20.6%) for males and 6:30 AM to 6:59 AM (97, 27.0%) for females.
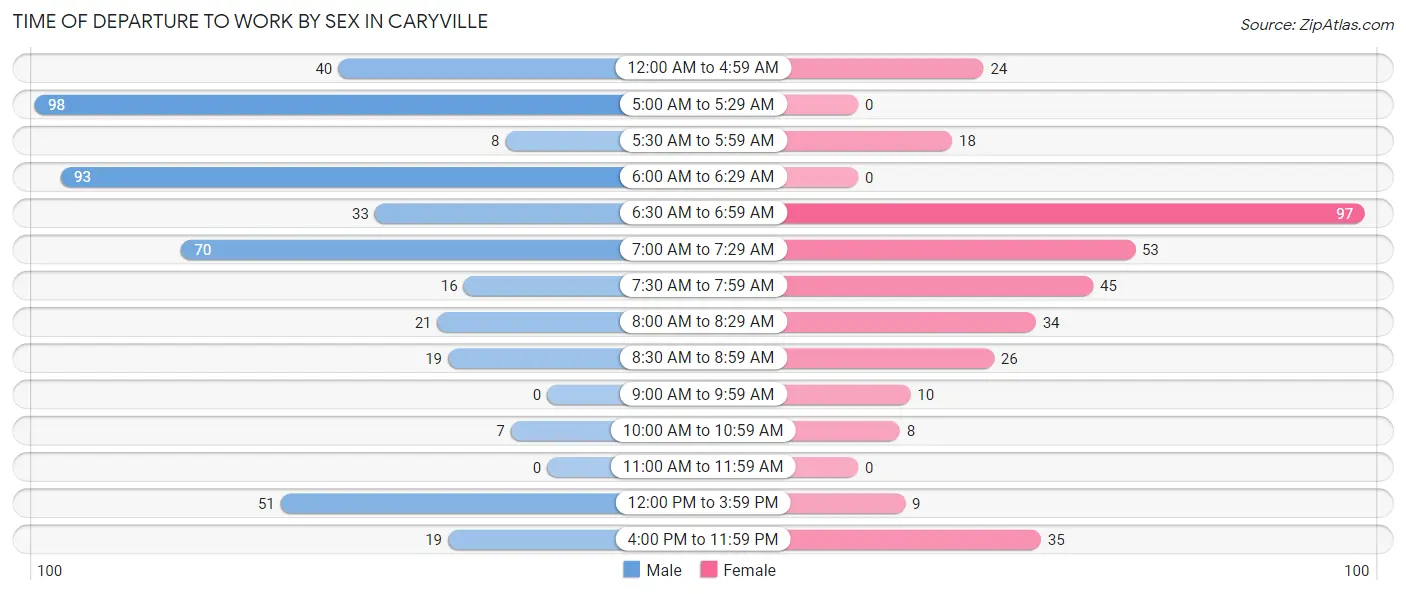
| Time of Departure | Male | Female |
| 12:00 AM to 4:59 AM | 40 (8.4%) | 24 (6.7%) |
| 5:00 AM to 5:29 AM | 98 (20.6%) | 0 (0.0%) |
| 5:30 AM to 5:59 AM | 8 (1.7%) | 18 (5.0%) |
| 6:00 AM to 6:29 AM | 93 (19.6%) | 0 (0.0%) |
| 6:30 AM to 6:59 AM | 33 (7.0%) | 97 (27.0%) |
| 7:00 AM to 7:29 AM | 70 (14.7%) | 53 (14.8%) |
| 7:30 AM to 7:59 AM | 16 (3.4%) | 45 (12.5%) |
| 8:00 AM to 8:29 AM | 21 (4.4%) | 34 (9.5%) |
| 8:30 AM to 8:59 AM | 19 (4.0%) | 26 (7.2%) |
| 9:00 AM to 9:59 AM | 0 (0.0%) | 10 (2.8%) |
| 10:00 AM to 10:59 AM | 7 (1.5%) | 8 (2.2%) |
| 11:00 AM to 11:59 AM | 0 (0.0%) | 0 (0.0%) |
| 12:00 PM to 3:59 PM | 51 (10.7%) | 9 (2.5%) |
| 4:00 PM to 11:59 PM | 19 (4.0%) | 35 (9.8%) |
| Total | 475 (100.0%) | 359 (100.0%) |
Housing Occupancy in Caryville
Occupancy by Ownership in Caryville
Of the total 928 dwellings in Caryville, owner-occupied units account for 568 (61.2%), while renter-occupied units make up 360 (38.8%).
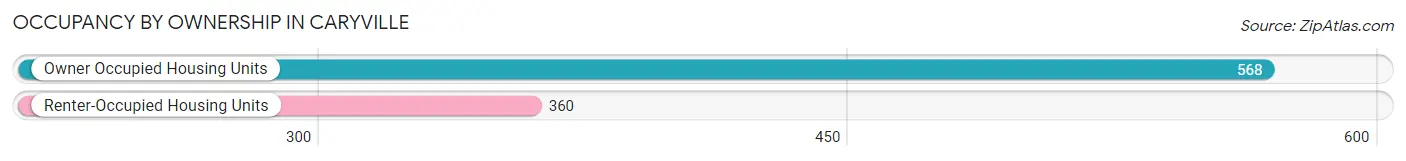
| Occupancy | # Housing Units | % Housing Units |
| Owner Occupied Housing Units | 568 | 61.2% |
| Renter-Occupied Housing Units | 360 | 38.8% |
| Total Occupied Housing Units | 928 | 100.0% |
Occupancy by Household Size in Caryville
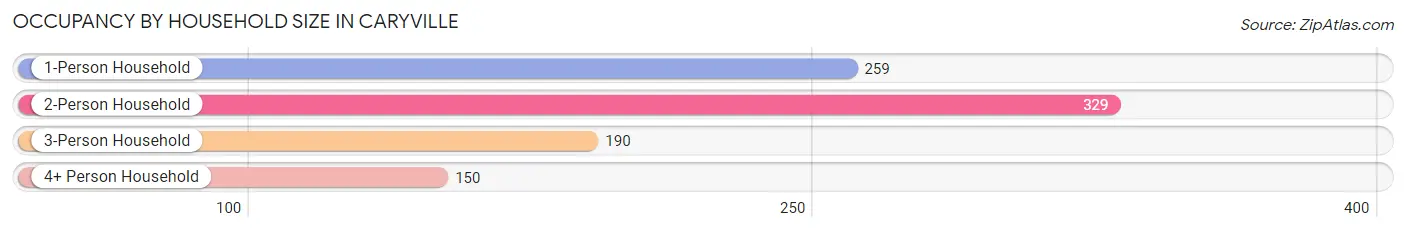
| Household Size | # Housing Units | % Housing Units |
| 1-Person Household | 259 | 27.9% |
| 2-Person Household | 329 | 35.4% |
| 3-Person Household | 190 | 20.5% |
| 4+ Person Household | 150 | 16.2% |
| Total Housing Units | 928 | 100.0% |
Occupancy by Ownership by Household Size in Caryville
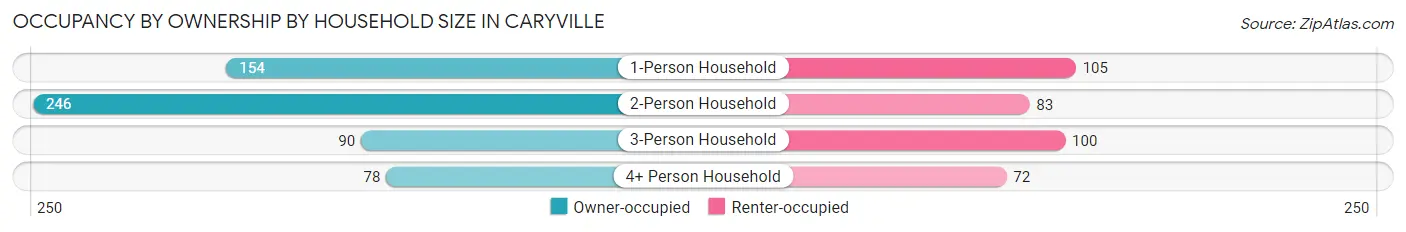
| Household Size | Owner-occupied | Renter-occupied |
| 1-Person Household | 154 (59.5%) | 105 (40.5%) |
| 2-Person Household | 246 (74.8%) | 83 (25.2%) |
| 3-Person Household | 90 (47.4%) | 100 (52.6%) |
| 4+ Person Household | 78 (52.0%) | 72 (48.0%) |
| Total Housing Units | 568 (61.2%) | 360 (38.8%) |
Occupancy by Educational Attainment in Caryville
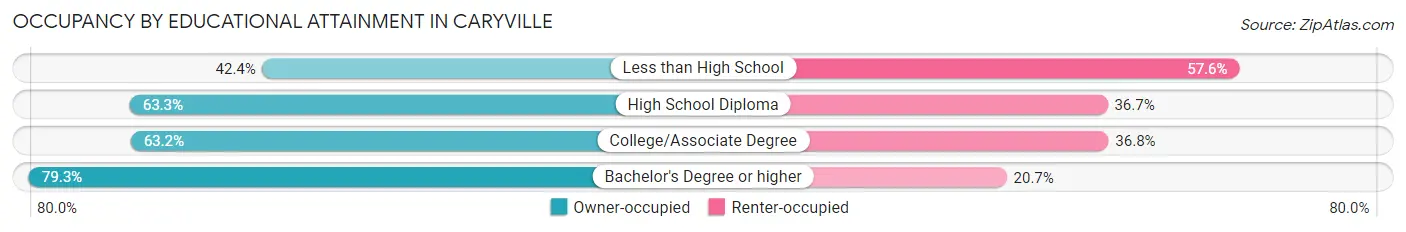
| Household Size | Owner-occupied | Renter-occupied |
| Less than High School | 67 (42.4%) | 91 (57.6%) |
| High School Diploma | 264 (63.3%) | 153 (36.7%) |
| College/Associate Degree | 168 (63.2%) | 98 (36.8%) |
| Bachelor's Degree or higher | 69 (79.3%) | 18 (20.7%) |
Occupancy by Age of Householder in Caryville
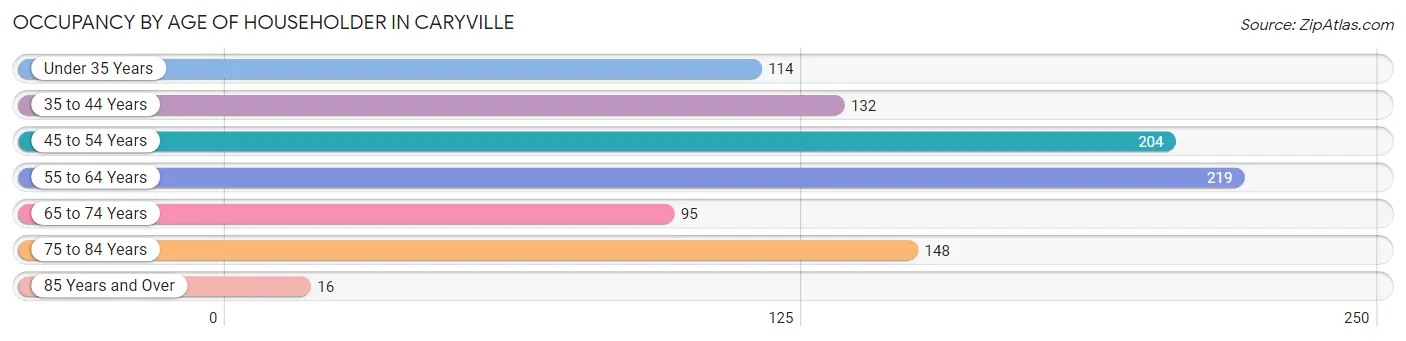
| Age Bracket | # Households | % Households |
| Under 35 Years | 114 | 12.3% |
| 35 to 44 Years | 132 | 14.2% |
| 45 to 54 Years | 204 | 22.0% |
| 55 to 64 Years | 219 | 23.6% |
| 65 to 74 Years | 95 | 10.2% |
| 75 to 84 Years | 148 | 16.0% |
| 85 Years and Over | 16 | 1.7% |
| Total | 928 | 100.0% |
Housing Finances in Caryville
Median Income by Occupancy in Caryville
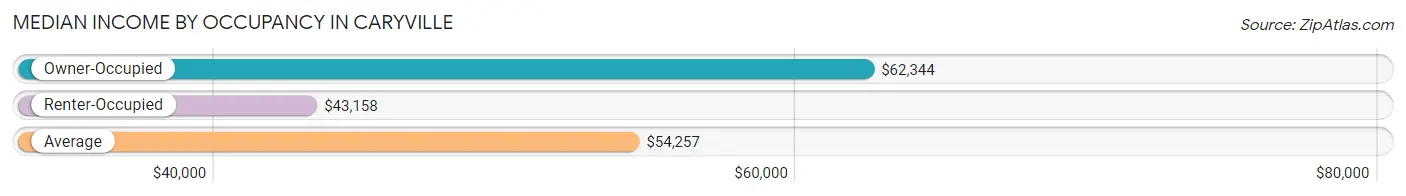
| Occupancy Type | # Households | Median Income |
| Owner-Occupied | 568 (61.2%) | $62,344 |
| Renter-Occupied | 360 (38.8%) | $43,158 |
| Average | 928 (100.0%) | $54,257 |
Occupancy by Householder Income Bracket in Caryville
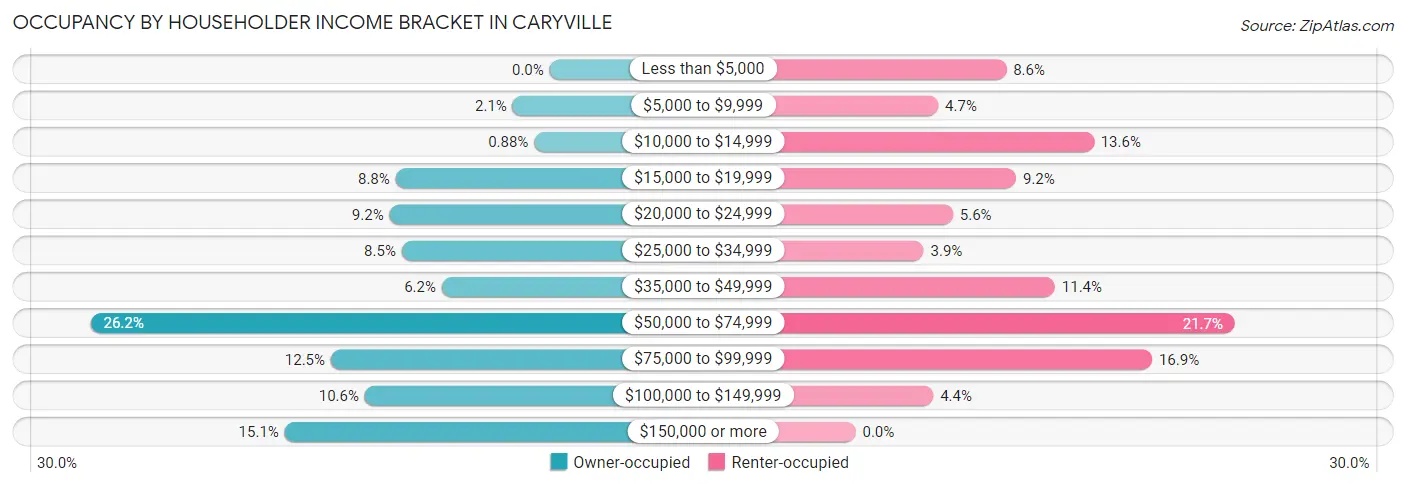
| Income Bracket | Owner-occupied | Renter-occupied |
| Less than $5,000 | 0 (0.0%) | 31 (8.6%) |
| $5,000 to $9,999 | 12 (2.1%) | 17 (4.7%) |
| $10,000 to $14,999 | 5 (0.9%) | 49 (13.6%) |
| $15,000 to $19,999 | 50 (8.8%) | 33 (9.2%) |
| $20,000 to $24,999 | 52 (9.1%) | 20 (5.6%) |
| $25,000 to $34,999 | 48 (8.5%) | 14 (3.9%) |
| $35,000 to $49,999 | 35 (6.2%) | 41 (11.4%) |
| $50,000 to $74,999 | 149 (26.2%) | 78 (21.7%) |
| $75,000 to $99,999 | 71 (12.5%) | 61 (16.9%) |
| $100,000 to $149,999 | 60 (10.6%) | 16 (4.4%) |
| $150,000 or more | 86 (15.1%) | 0 (0.0%) |
| Total | 568 (100.0%) | 360 (100.0%) |
Monthly Housing Cost Tiers in Caryville
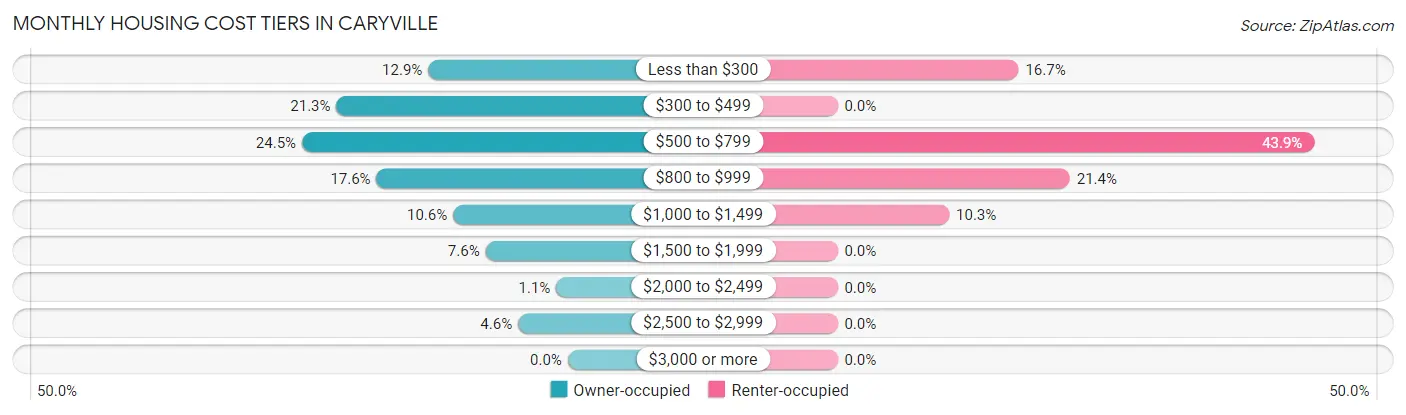
| Monthly Cost | Owner-occupied | Renter-occupied |
| Less than $300 | 73 (12.9%) | 60 (16.7%) |
| $300 to $499 | 121 (21.3%) | 0 (0.0%) |
| $500 to $799 | 139 (24.5%) | 158 (43.9%) |
| $800 to $999 | 100 (17.6%) | 77 (21.4%) |
| $1,000 to $1,499 | 60 (10.6%) | 37 (10.3%) |
| $1,500 to $1,999 | 43 (7.6%) | 0 (0.0%) |
| $2,000 to $2,499 | 6 (1.1%) | 0 (0.0%) |
| $2,500 to $2,999 | 26 (4.6%) | 0 (0.0%) |
| $3,000 or more | 0 (0.0%) | 0 (0.0%) |
| Total | 568 (100.0%) | 360 (100.0%) |
Physical Housing Characteristics in Caryville
Housing Structures in Caryville
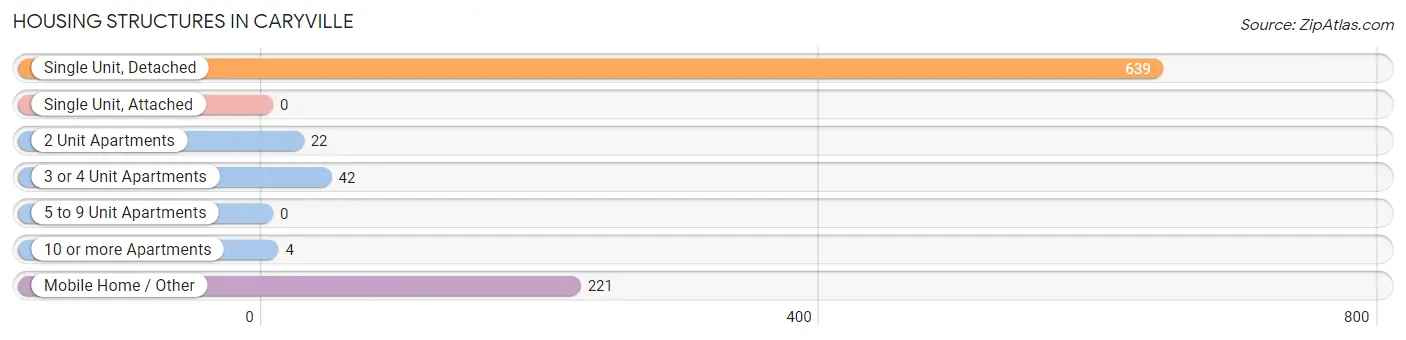
| Structure Type | # Housing Units | % Housing Units |
| Single Unit, Detached | 639 | 68.9% |
| Single Unit, Attached | 0 | 0.0% |
| 2 Unit Apartments | 22 | 2.4% |
| 3 or 4 Unit Apartments | 42 | 4.5% |
| 5 to 9 Unit Apartments | 0 | 0.0% |
| 10 or more Apartments | 4 | 0.4% |
| Mobile Home / Other | 221 | 23.8% |
| Total | 928 | 100.0% |
Housing Structures by Occupancy in Caryville
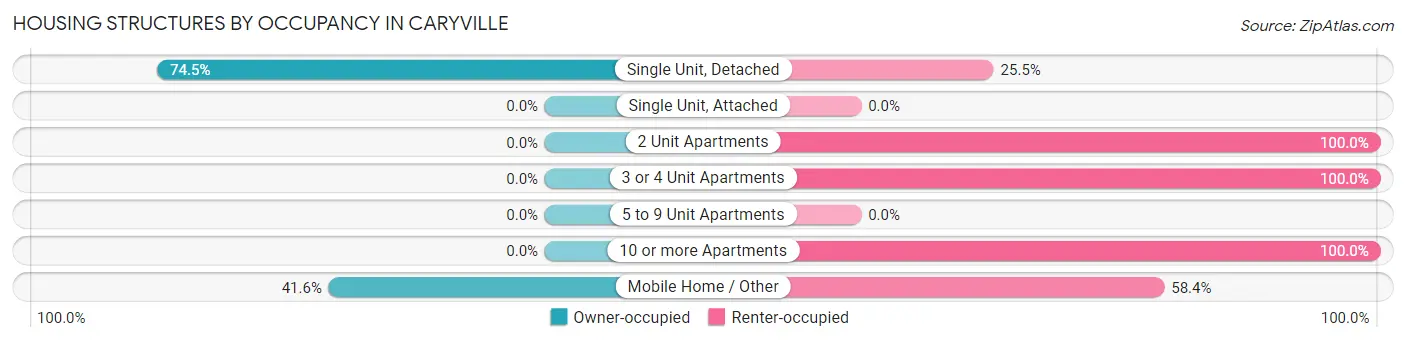
| Structure Type | Owner-occupied | Renter-occupied |
| Single Unit, Detached | 476 (74.5%) | 163 (25.5%) |
| Single Unit, Attached | 0 (0.0%) | 0 (0.0%) |
| 2 Unit Apartments | 0 (0.0%) | 22 (100.0%) |
| 3 or 4 Unit Apartments | 0 (0.0%) | 42 (100.0%) |
| 5 to 9 Unit Apartments | 0 (0.0%) | 0 (0.0%) |
| 10 or more Apartments | 0 (0.0%) | 4 (100.0%) |
| Mobile Home / Other | 92 (41.6%) | 129 (58.4%) |
| Total | 568 (61.2%) | 360 (38.8%) |
Housing Structures by Number of Rooms in Caryville
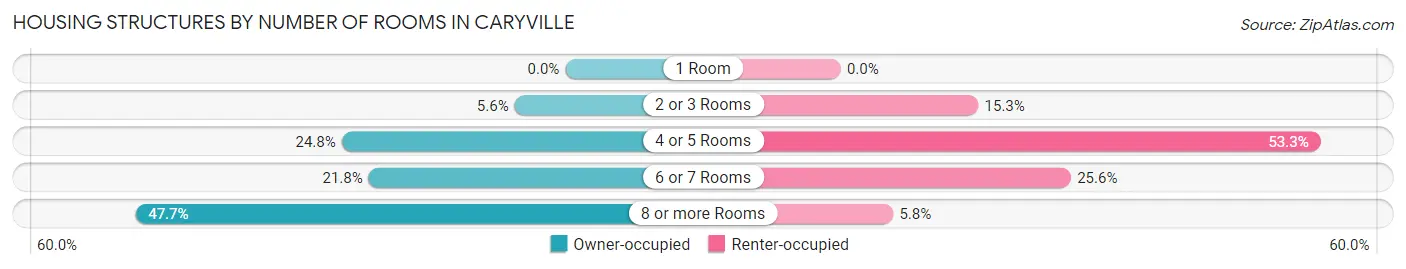
| Number of Rooms | Owner-occupied | Renter-occupied |
| 1 Room | 0 (0.0%) | 0 (0.0%) |
| 2 or 3 Rooms | 32 (5.6%) | 55 (15.3%) |
| 4 or 5 Rooms | 141 (24.8%) | 192 (53.3%) |
| 6 or 7 Rooms | 124 (21.8%) | 92 (25.6%) |
| 8 or more Rooms | 271 (47.7%) | 21 (5.8%) |
| Total | 568 (100.0%) | 360 (100.0%) |
Housing Structure by Heating Type in Caryville
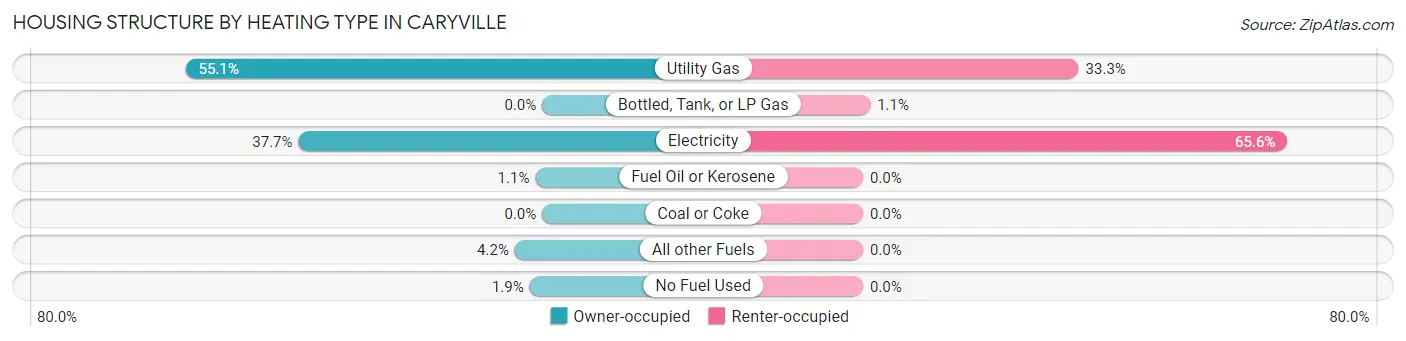
| Heating Type | Owner-occupied | Renter-occupied |
| Utility Gas | 313 (55.1%) | 120 (33.3%) |
| Bottled, Tank, or LP Gas | 0 (0.0%) | 4 (1.1%) |
| Electricity | 214 (37.7%) | 236 (65.6%) |
| Fuel Oil or Kerosene | 6 (1.1%) | 0 (0.0%) |
| Coal or Coke | 0 (0.0%) | 0 (0.0%) |
| All other Fuels | 24 (4.2%) | 0 (0.0%) |
| No Fuel Used | 11 (1.9%) | 0 (0.0%) |
| Total | 568 (100.0%) | 360 (100.0%) |
Household Vehicle Usage in Caryville
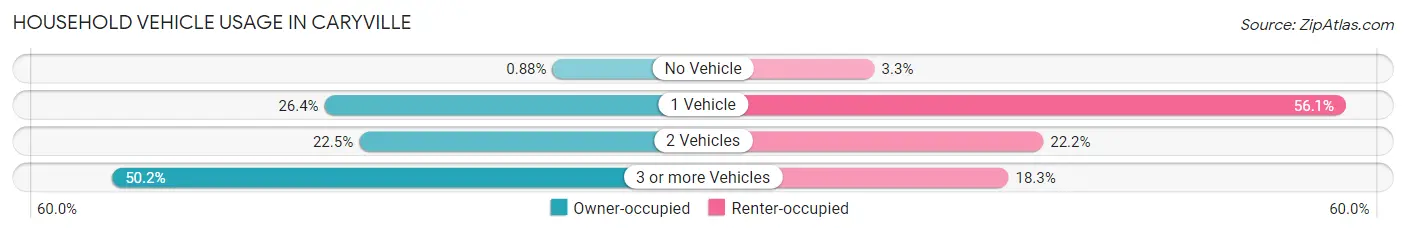
| Vehicles per Household | Owner-occupied | Renter-occupied |
| No Vehicle | 5 (0.9%) | 12 (3.3%) |
| 1 Vehicle | 150 (26.4%) | 202 (56.1%) |
| 2 Vehicles | 128 (22.5%) | 80 (22.2%) |
| 3 or more Vehicles | 285 (50.2%) | 66 (18.3%) |
| Total | 568 (100.0%) | 360 (100.0%) |
Real Estate & Mortgages in Caryville
Real Estate and Mortgage Overview in Caryville
| Characteristic | Without Mortgage | With Mortgage |
| Housing Units | 348 | 220 |
| Median Property Value | $160,900 | $195,000 |
| Median Household Income | $53,359 | $56 |
| Monthly Housing Costs | $482 | $0 |
| Real Estate Taxes | $710 | $26 |
Property Value by Mortgage Status in Caryville
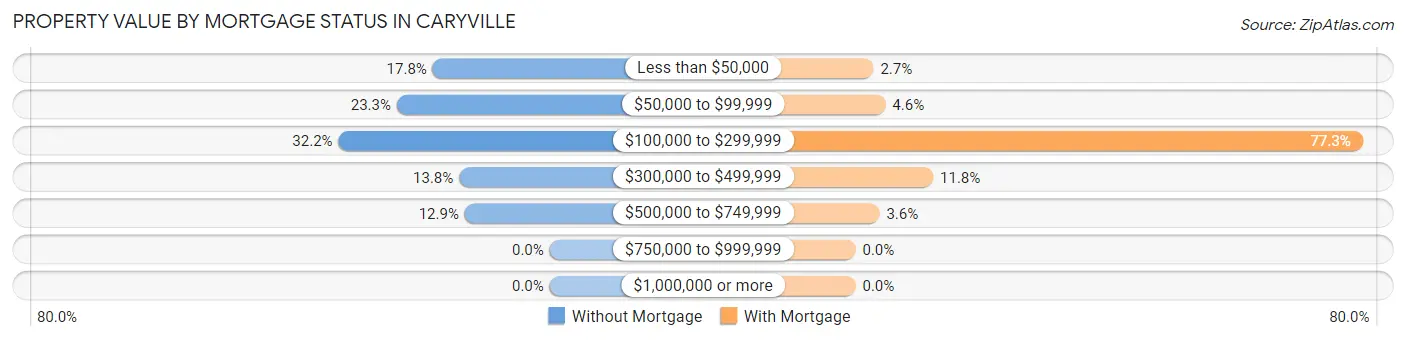
| Property Value | Without Mortgage | With Mortgage |
| Less than $50,000 | 62 (17.8%) | 6 (2.7%) |
| $50,000 to $99,999 | 81 (23.3%) | 10 (4.5%) |
| $100,000 to $299,999 | 112 (32.2%) | 170 (77.3%) |
| $300,000 to $499,999 | 48 (13.8%) | 26 (11.8%) |
| $500,000 to $749,999 | 45 (12.9%) | 8 (3.6%) |
| $750,000 to $999,999 | 0 (0.0%) | 0 (0.0%) |
| $1,000,000 or more | 0 (0.0%) | 0 (0.0%) |
| Total | 348 (100.0%) | 220 (100.0%) |
Household Income by Mortgage Status in Caryville
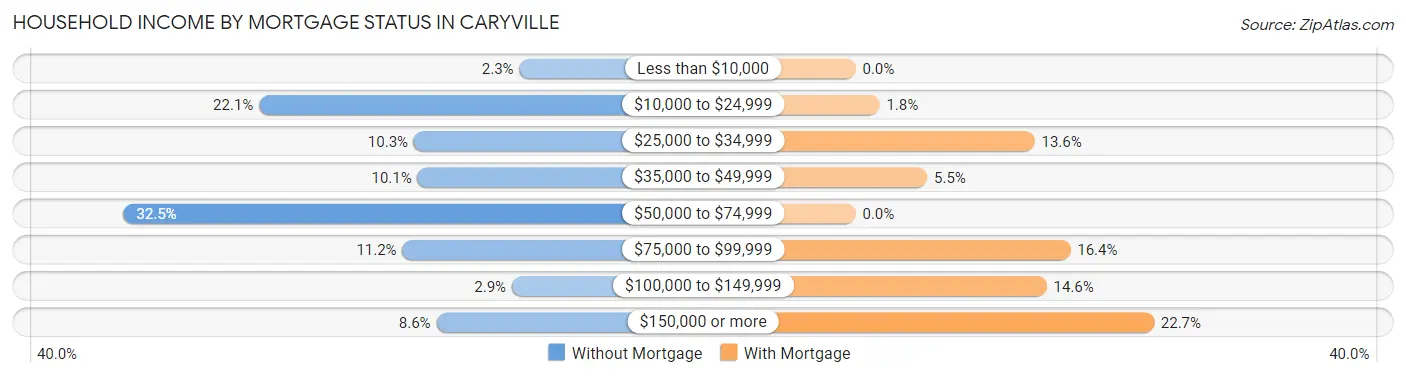
| Household Income | Without Mortgage | With Mortgage |
| Less than $10,000 | 8 (2.3%) | 0 (0.0%) |
| $10,000 to $24,999 | 77 (22.1%) | 4 (1.8%) |
| $25,000 to $34,999 | 36 (10.3%) | 30 (13.6%) |
| $35,000 to $49,999 | 35 (10.1%) | 12 (5.4%) |
| $50,000 to $74,999 | 113 (32.5%) | 0 (0.0%) |
| $75,000 to $99,999 | 39 (11.2%) | 36 (16.4%) |
| $100,000 to $149,999 | 10 (2.9%) | 32 (14.5%) |
| $150,000 or more | 30 (8.6%) | 50 (22.7%) |
| Total | 348 (100.0%) | 220 (100.0%) |
Property Value to Household Income Ratio in Caryville
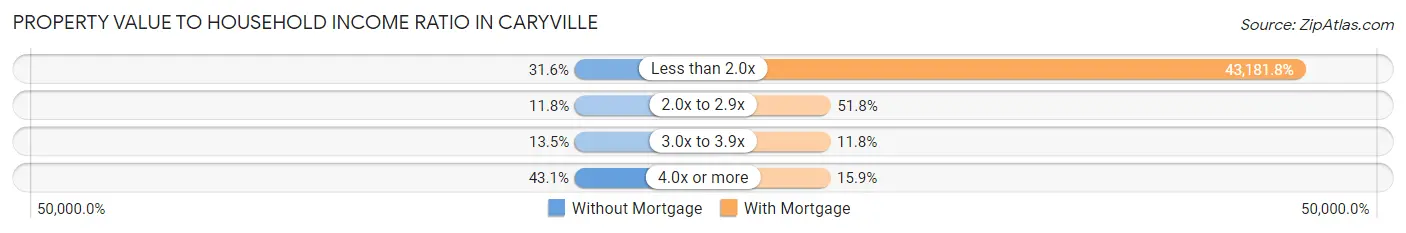
| Value-to-Income Ratio | Without Mortgage | With Mortgage |
| Less than 2.0x | 110 (31.6%) | 95,000 (43,181.8%) |
| 2.0x to 2.9x | 41 (11.8%) | 114 (51.8%) |
| 3.0x to 3.9x | 47 (13.5%) | 26 (11.8%) |
| 4.0x or more | 150 (43.1%) | 35 (15.9%) |
| Total | 348 (100.0%) | 220 (100.0%) |
Real Estate Taxes by Mortgage Status in Caryville
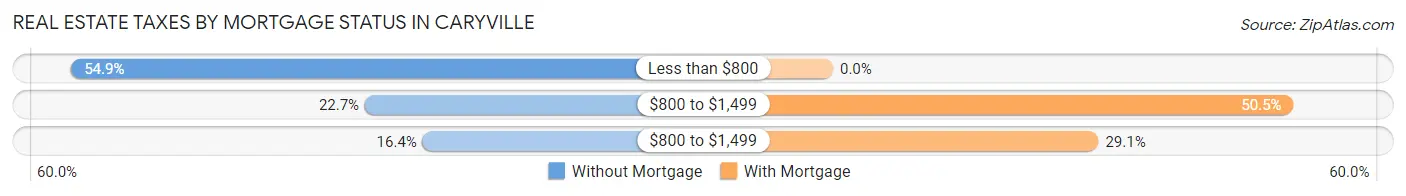
| Property Taxes | Without Mortgage | With Mortgage |
| Less than $800 | 191 (54.9%) | 0 (0.0%) |
| $800 to $1,499 | 79 (22.7%) | 111 (50.4%) |
| $800 to $1,499 | 57 (16.4%) | 64 (29.1%) |
| Total | 348 (100.0%) | 220 (100.0%) |
Health & Disability in Caryville
Health Insurance Coverage by Age in Caryville
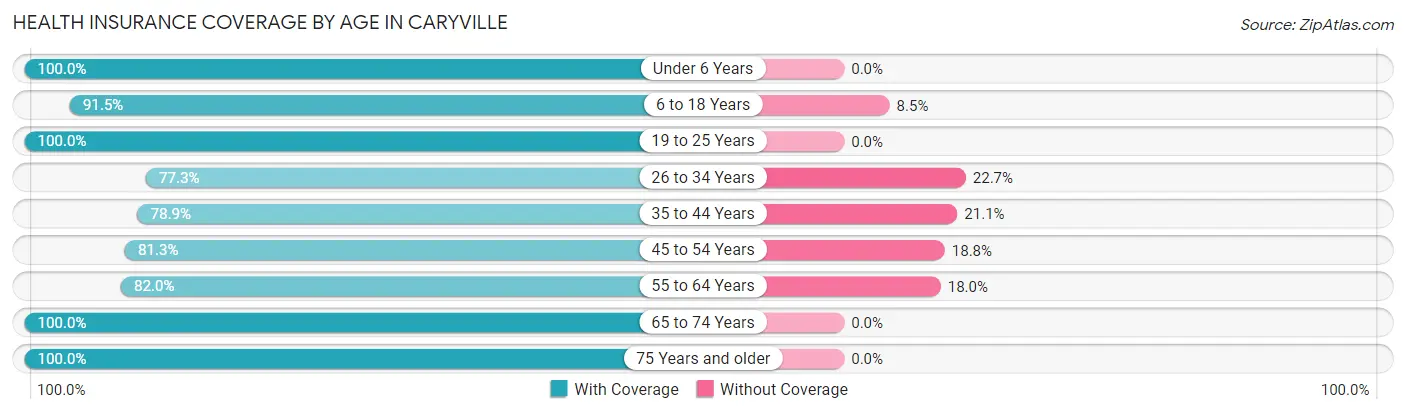
| Age Bracket | With Coverage | Without Coverage |
| Under 6 Years | 218 (100.0%) | 0 (0.0%) |
| 6 to 18 Years | 238 (91.5%) | 22 (8.5%) |
| 19 to 25 Years | 49 (100.0%) | 0 (0.0%) |
| 26 to 34 Years | 174 (77.3%) | 51 (22.7%) |
| 35 to 44 Years | 202 (78.9%) | 54 (21.1%) |
| 45 to 54 Years | 351 (81.2%) | 81 (18.8%) |
| 55 to 64 Years | 269 (82.0%) | 59 (18.0%) |
| 65 to 74 Years | 140 (100.0%) | 0 (0.0%) |
| 75 Years and older | 273 (100.0%) | 0 (0.0%) |
| Total | 1,914 (87.8%) | 267 (12.2%) |
Health Insurance Coverage by Citizenship Status in Caryville
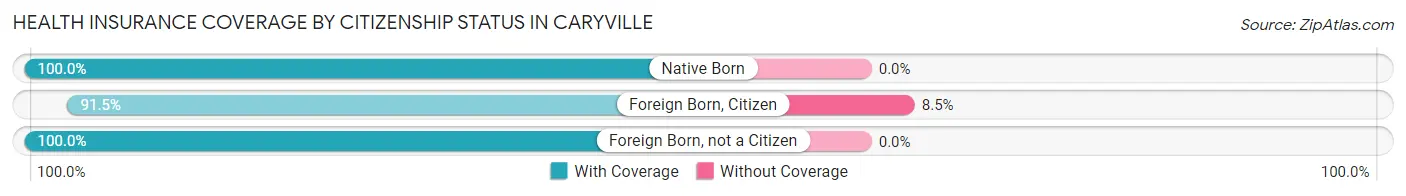
| Citizenship Status | With Coverage | Without Coverage |
| Native Born | 218 (100.0%) | 0 (0.0%) |
| Foreign Born, Citizen | 238 (91.5%) | 22 (8.5%) |
| Foreign Born, not a Citizen | 49 (100.0%) | 0 (0.0%) |
Health Insurance Coverage by Household Income in Caryville
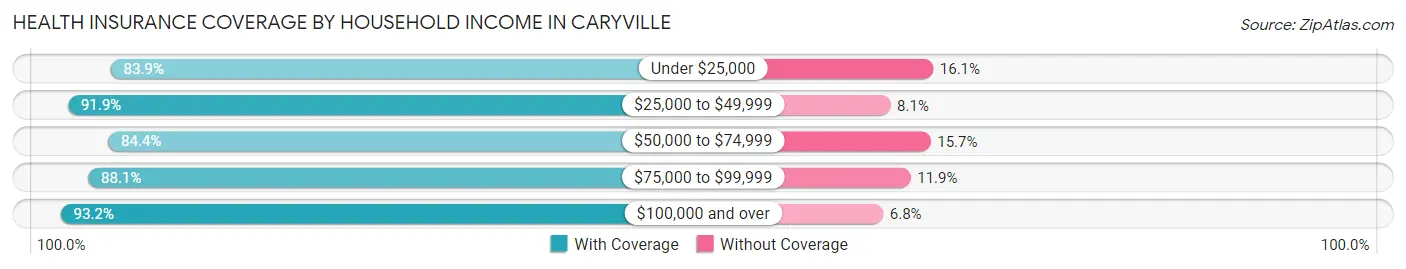
| Household Income | With Coverage | Without Coverage |
| Under $25,000 | 406 (83.9%) | 78 (16.1%) |
| $25,000 to $49,999 | 328 (91.9%) | 29 (8.1%) |
| $50,000 to $74,999 | 415 (84.4%) | 77 (15.7%) |
| $75,000 to $99,999 | 333 (88.1%) | 45 (11.9%) |
| $100,000 and over | 414 (93.2%) | 30 (6.8%) |
Public vs Private Health Insurance Coverage by Age in Caryville
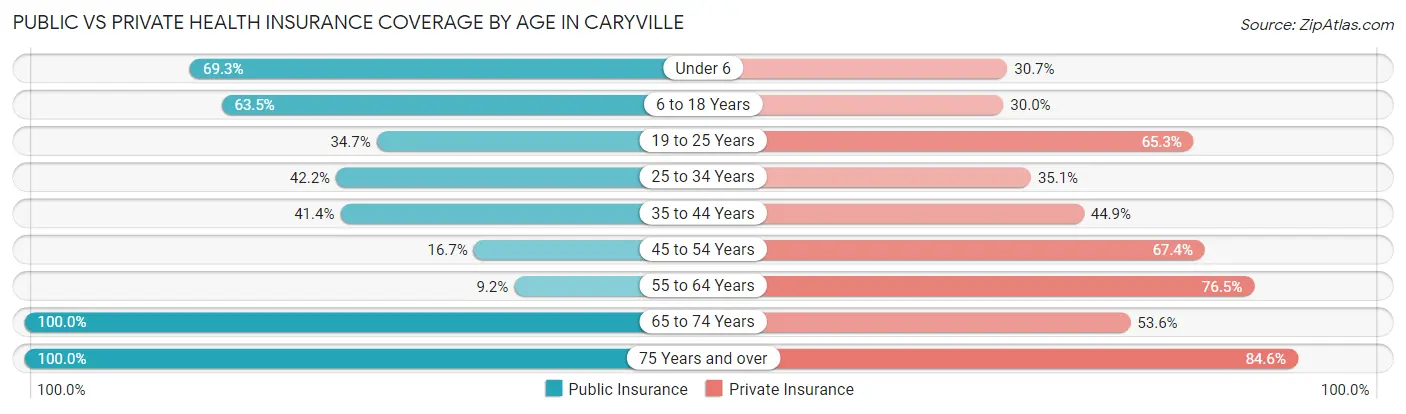
| Age Bracket | Public Insurance | Private Insurance |
| Under 6 | 151 (69.3%) | 67 (30.7%) |
| 6 to 18 Years | 165 (63.5%) | 78 (30.0%) |
| 19 to 25 Years | 17 (34.7%) | 32 (65.3%) |
| 25 to 34 Years | 95 (42.2%) | 79 (35.1%) |
| 35 to 44 Years | 106 (41.4%) | 115 (44.9%) |
| 45 to 54 Years | 72 (16.7%) | 291 (67.4%) |
| 55 to 64 Years | 30 (9.1%) | 251 (76.5%) |
| 65 to 74 Years | 140 (100.0%) | 75 (53.6%) |
| 75 Years and over | 273 (100.0%) | 231 (84.6%) |
| Total | 1,049 (48.1%) | 1,219 (55.9%) |
Disability Status by Sex by Age in Caryville
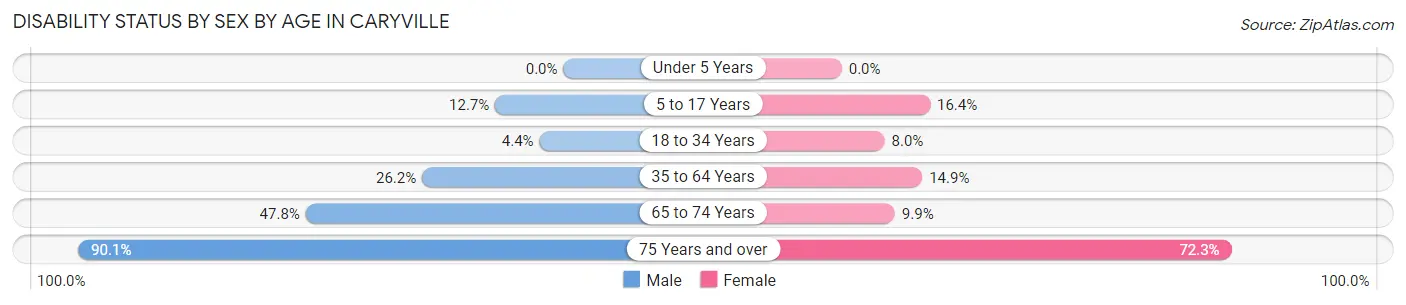
| Age Bracket | Male | Female |
| Under 5 Years | 0 (0.0%) | 0 (0.0%) |
| 5 to 17 Years | 19 (12.7%) | 19 (16.4%) |
| 18 to 34 Years | 6 (4.4%) | 12 (8.0%) |
| 35 to 64 Years | 133 (26.2%) | 76 (14.9%) |
| 65 to 74 Years | 33 (47.8%) | 7 (9.9%) |
| 75 Years and over | 145 (90.1%) | 81 (72.3%) |
Disability Class by Sex by Age in Caryville
Disability Class: Hearing Difficulty
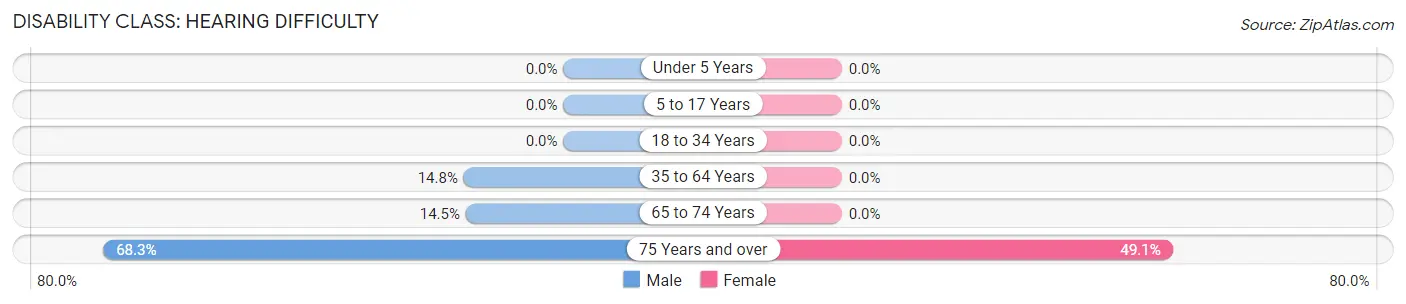
| Age Bracket | Male | Female |
| Under 5 Years | 0 (0.0%) | 0 (0.0%) |
| 5 to 17 Years | 0 (0.0%) | 0 (0.0%) |
| 18 to 34 Years | 0 (0.0%) | 0 (0.0%) |
| 35 to 64 Years | 75 (14.8%) | 0 (0.0%) |
| 65 to 74 Years | 10 (14.5%) | 0 (0.0%) |
| 75 Years and over | 110 (68.3%) | 55 (49.1%) |
Disability Class: Vision Difficulty
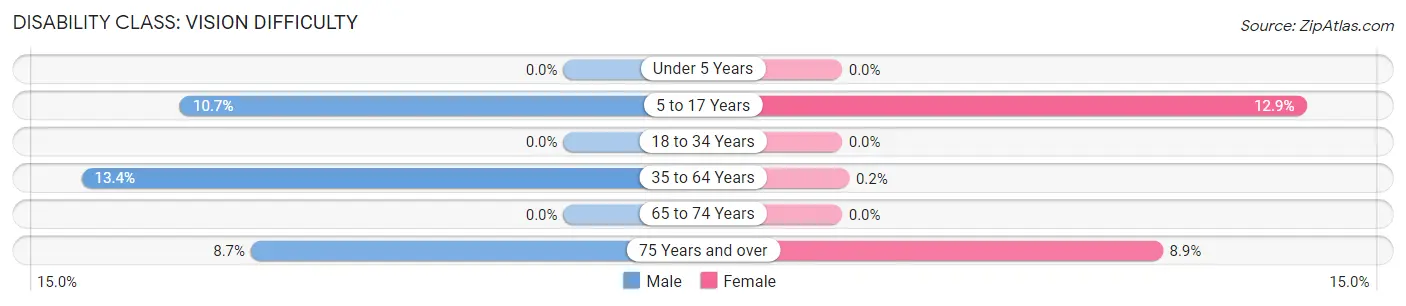
| Age Bracket | Male | Female |
| Under 5 Years | 0 (0.0%) | 0 (0.0%) |
| 5 to 17 Years | 16 (10.7%) | 15 (12.9%) |
| 18 to 34 Years | 0 (0.0%) | 0 (0.0%) |
| 35 to 64 Years | 68 (13.4%) | 1 (0.2%) |
| 65 to 74 Years | 0 (0.0%) | 0 (0.0%) |
| 75 Years and over | 14 (8.7%) | 10 (8.9%) |
Disability Class: Cognitive Difficulty
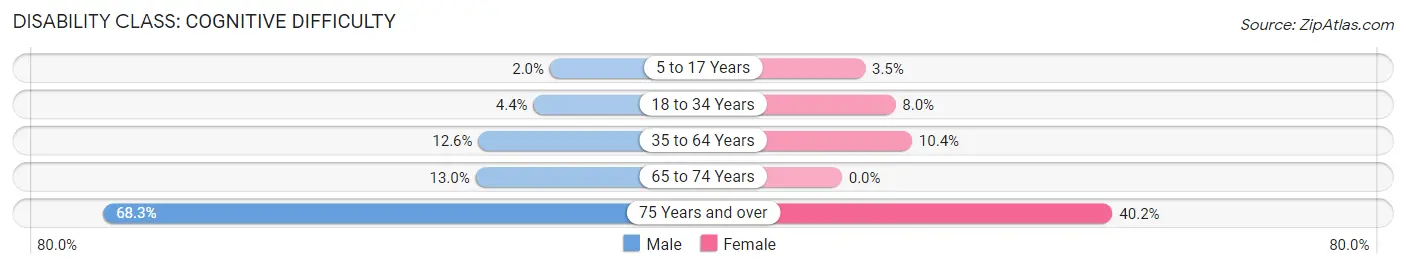
| Age Bracket | Male | Female |
| 5 to 17 Years | 3 (2.0%) | 4 (3.5%) |
| 18 to 34 Years | 6 (4.4%) | 12 (8.0%) |
| 35 to 64 Years | 64 (12.6%) | 53 (10.4%) |
| 65 to 74 Years | 9 (13.0%) | 0 (0.0%) |
| 75 Years and over | 110 (68.3%) | 45 (40.2%) |
Disability Class: Ambulatory Difficulty
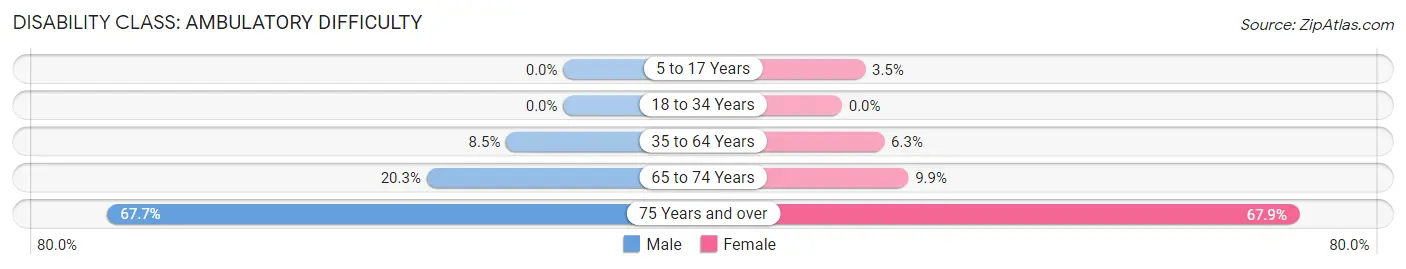
| Age Bracket | Male | Female |
| 5 to 17 Years | 0 (0.0%) | 4 (3.5%) |
| 18 to 34 Years | 0 (0.0%) | 0 (0.0%) |
| 35 to 64 Years | 43 (8.5%) | 32 (6.3%) |
| 65 to 74 Years | 14 (20.3%) | 7 (9.9%) |
| 75 Years and over | 109 (67.7%) | 76 (67.9%) |
Disability Class: Self-Care Difficulty
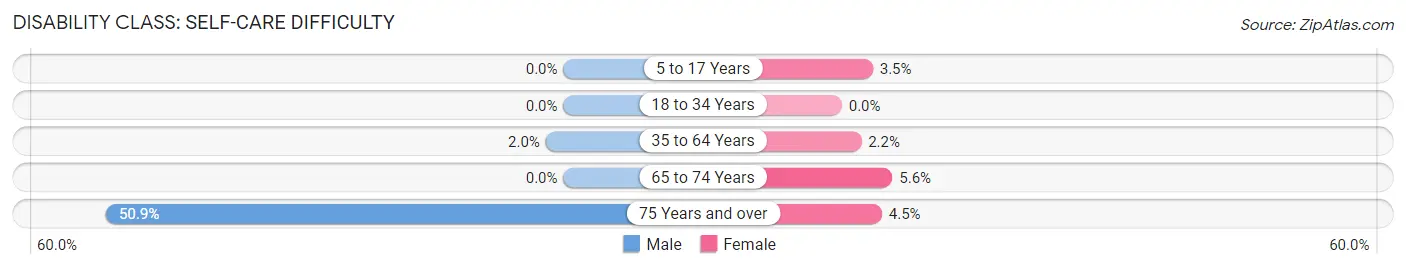
| Age Bracket | Male | Female |
| 5 to 17 Years | 0 (0.0%) | 4 (3.5%) |
| 18 to 34 Years | 0 (0.0%) | 0 (0.0%) |
| 35 to 64 Years | 10 (2.0%) | 11 (2.2%) |
| 65 to 74 Years | 0 (0.0%) | 4 (5.6%) |
| 75 Years and over | 82 (50.9%) | 5 (4.5%) |
Technology Access in Caryville
Computing Device Access in Caryville
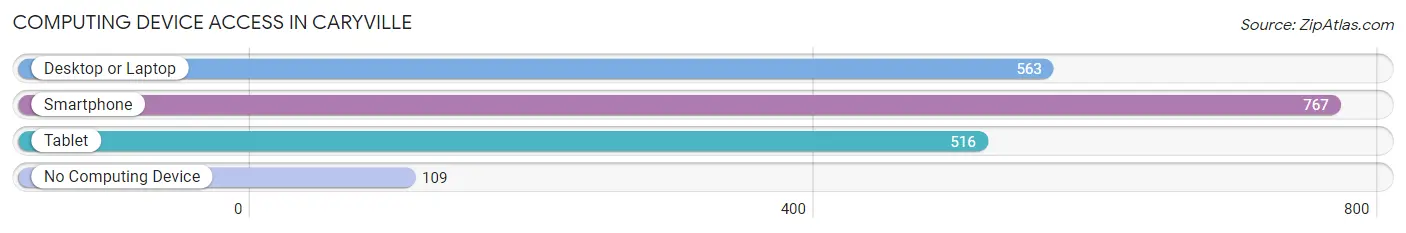
| Device Type | # Households | % Households |
| Desktop or Laptop | 563 | 60.7% |
| Smartphone | 767 | 82.7% |
| Tablet | 516 | 55.6% |
| No Computing Device | 109 | 11.7% |
| Total | 928 | 100.0% |
Internet Access in Caryville
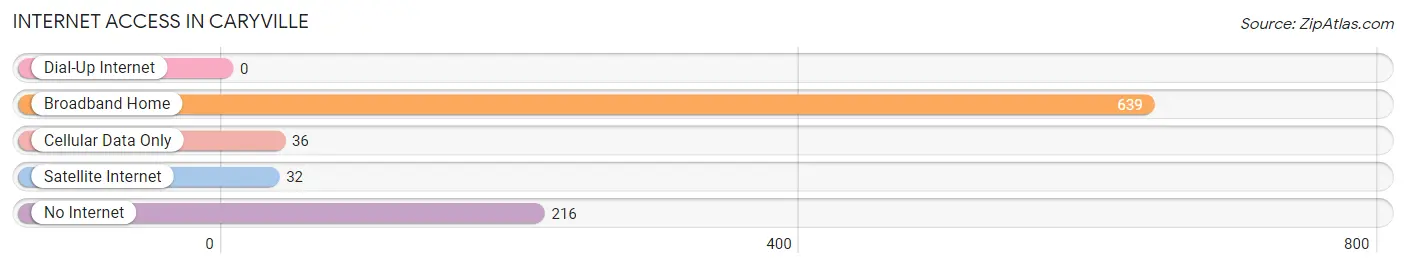
| Internet Type | # Households | % Households |
| Dial-Up Internet | 0 | 0.0% |
| Broadband Home | 639 | 68.9% |
| Cellular Data Only | 36 | 3.9% |
| Satellite Internet | 32 | 3.5% |
| No Internet | 216 | 23.3% |
| Total | 928 | 100.0% |
Caryville Summary
Caryville, Tennessee is a small town located in Campbell County, Tennessee. It is situated in the foothills of the Appalachian Mountains and is part of the Knoxville metropolitan area. The town has a population of approximately 1,500 people and is located about 25 miles north of Knoxville.
History
Caryville was founded in 1820 by William Cary, a Revolutionary War veteran. The town was originally known as Caryville, but was later changed to Caryville in 1883. The town was named after William Cary, who was a prominent figure in the area.
Caryville was an important stop on the Knoxville and Chattanooga Railroad, which was built in the late 1800s. The railroad was a major factor in the growth of the town, as it allowed for the transportation of goods and people to and from the area.
In the early 1900s, Caryville was a thriving community with a variety of businesses, including a hotel, a bank, a post office, a general store, and a sawmill. The town also had a school, a church, and a library.
Geography
Caryville is located in the foothills of the Appalachian Mountains in Campbell County, Tennessee. The town is situated at an elevation of 1,000 feet above sea level and is surrounded by rolling hills and forests. The town is located about 25 miles north of Knoxville and is part of the Knoxville metropolitan area.
The town is located near the Clinch River, which is a major tributary of the Tennessee River. The Clinch River is a popular destination for fishing, boating, and other recreational activities.
Economy
Caryville’s economy is largely based on agriculture and tourism. The town is home to several farms, which produce a variety of crops, including corn, soybeans, and hay. The town is also home to several tourist attractions, including the Clinch River, which is a popular destination for fishing, boating, and other recreational activities.
The town is also home to several small businesses, including restaurants, retail stores, and service providers. The town is also home to several manufacturing companies, which produce a variety of products, including furniture, clothing, and automotive parts.
Demographics
As of the 2010 census, Caryville had a population of 1,500 people. The town is predominantly white, with approximately 95% of the population being white. The town also has a small African American population, with approximately 4% of the population being African American.
The median household income in Caryville is $35,000, which is slightly lower than the national average. The town also has a higher poverty rate than the national average, with approximately 20% of the population living below the poverty line.
Conclusion
Caryville, Tennessee is a small town located in Campbell County, Tennessee. The town has a population of approximately 1,500 people and is located about 25 miles north of Knoxville. The town is situated in the foothills of the Appalachian Mountains and is part of the Knoxville metropolitan area. The town’s economy is largely based on agriculture and tourism, and the town is home to several small businesses, including restaurants, retail stores, and service providers. The town is predominantly white, with approximately 95% of the population being white. The median household income in Caryville is $35,000, which is slightly lower than the national average.
Common Questions
What is Per Capita Income in Caryville?
Per Capita income in Caryville is $32,844.
What is the Median Family Income in Caryville?
Median Family Income in Caryville is $66,087.
What is the Median Household income in Caryville?
Median Household Income in Caryville is $54,257.
What is Income or Wage Gap in Caryville?
Income or Wage Gap in Caryville is 26.5%.
Women in Caryville earn 73.5 cents for every dollar earned by a man.
What is Inequality or Gini Index in Caryville?
Inequality or Gini Index in Caryville is 0.50.
What is the Total Population of Caryville?
Total Population of Caryville is 2,181.
What is the Total Male Population of Caryville?
Total Male Population of Caryville is 1,120.
What is the Total Female Population of Caryville?
Total Female Population of Caryville is 1,061.
What is the Ratio of Males per 100 Females in Caryville?
There are 105.56 Males per 100 Females in Caryville.
What is the Ratio of Females per 100 Males in Caryville?
There are 94.73 Females per 100 Males in Caryville.
What is the Median Population Age in Caryville?
Median Population Age in Caryville is 46.0 Years.
What is the Average Family Size in Caryville
Average Family Size in Caryville is 2.7 People.
What is the Average Household Size in Caryville
Average Household Size in Caryville is 2.3 People.
How Large is the Labor Force in Caryville?
There are 999 People in the Labor Forcein in Caryville.
What is the Percentage of People in the Labor Force in Caryville?
57.5% of People are in the Labor Force in Caryville.
What is the Unemployment Rate in Caryville?
Unemployment Rate in Caryville is 10.7%.