Byrdstown, TN Map & Demographics
Byrdstown Map
Byrdstown Overview
$17,861
PER CAPITA INCOME
$56,944
AVG FAMILY INCOME
$32,125
AVG HOUSEHOLD INCOME
35.6%
WAGE / INCOME GAP [ % ]
64.4¢/ $1
WAGE / INCOME GAP [ $ ]
0.47
INEQUALITY / GINI INDEX
1,275
TOTAL POPULATION
695
MALE POPULATION
580
FEMALE POPULATION
119.83
MALES / 100 FEMALES
83.45
FEMALES / 100 MALES
39.4
MEDIAN AGE
4.2
AVG FAMILY SIZE
2.6
AVG HOUSEHOLD SIZE
396
LABOR FORCE [ PEOPLE ]
42.2%
PERCENT IN LABOR FORCE
4.3%
UNEMPLOYMENT RATE
Byrdstown Zip Codes
Byrdstown Area Codes
Income in Byrdstown
Income Overview in Byrdstown
Per Capita Income in Byrdstown is $17,861, while median incomes of families and households are $56,944 and $32,125 respectively.
| Characteristic | Number | Measure |
| Per Capita Income | 1,275 | $17,861 |
| Median Family Income | 220 | $56,944 |
| Mean Family Income | 220 | $61,541 |
| Median Household Income | 465 | $32,125 |
| Mean Household Income | 465 | $42,061 |
| Income Deficit | 220 | $0 |
| Wage / Income Gap (%) | 1,275 | 35.61% |
| Wage / Income Gap ($) | 1,275 | 64.39¢ per $1 |
| Gini / Inequality Index | 1,275 | 0.47 |
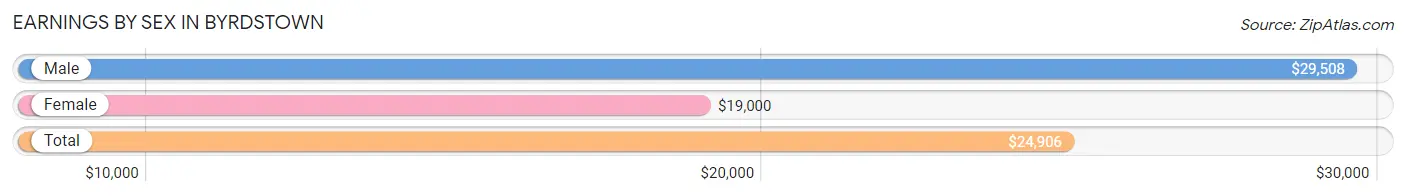
Earnings by Sex in Byrdstown
Average Earnings in Byrdstown are $24,906, $29,508 for men and $19,000 for women, a difference of 35.6%.
| Sex | Number | Average Earnings |
| Male | 245 (56.8%) | $29,508 |
| Female | 186 (43.2%) | $19,000 |
| Total | 431 (100.0%) | $24,906 |
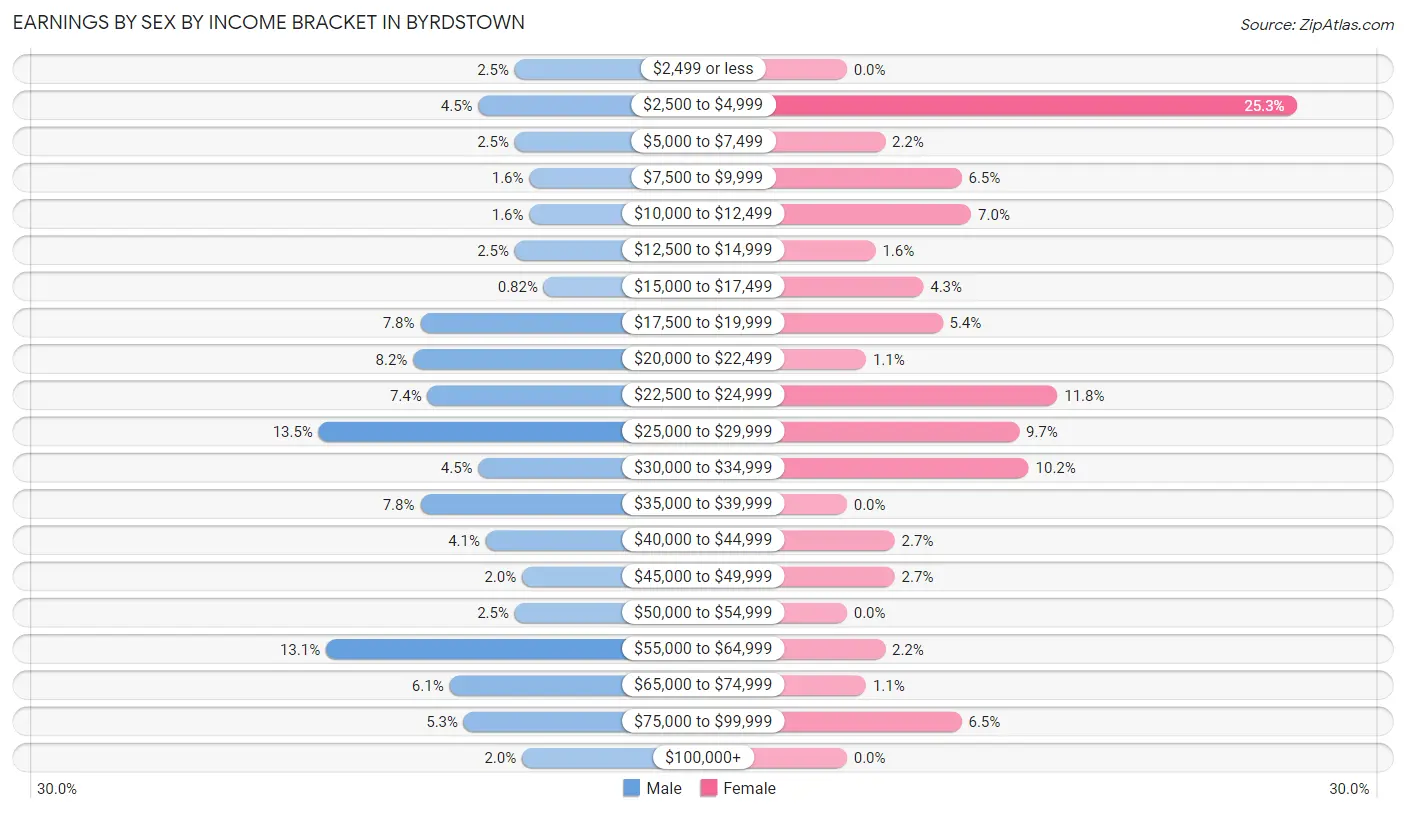
Earnings by Sex by Income Bracket in Byrdstown
The most common earnings brackets in Byrdstown are $25,000 to $29,999 for men (33 | 13.5%) and $2,500 to $4,999 for women (47 | 25.3%).
| Income | Male | Female |
| $2,499 or less | 6 (2.5%) | 0 (0.0%) |
| $2,500 to $4,999 | 11 (4.5%) | 47 (25.3%) |
| $5,000 to $7,499 | 6 (2.5%) | 4 (2.1%) |
| $7,500 to $9,999 | 4 (1.6%) | 12 (6.5%) |
| $10,000 to $12,499 | 4 (1.6%) | 13 (7.0%) |
| $12,500 to $14,999 | 6 (2.5%) | 3 (1.6%) |
| $15,000 to $17,499 | 2 (0.8%) | 8 (4.3%) |
| $17,500 to $19,999 | 19 (7.8%) | 10 (5.4%) |
| $20,000 to $22,499 | 20 (8.2%) | 2 (1.1%) |
| $22,500 to $24,999 | 18 (7.3%) | 22 (11.8%) |
| $25,000 to $29,999 | 33 (13.5%) | 18 (9.7%) |
| $30,000 to $34,999 | 11 (4.5%) | 19 (10.2%) |
| $35,000 to $39,999 | 19 (7.8%) | 0 (0.0%) |
| $40,000 to $44,999 | 10 (4.1%) | 5 (2.7%) |
| $45,000 to $49,999 | 5 (2.0%) | 5 (2.7%) |
| $50,000 to $54,999 | 6 (2.5%) | 0 (0.0%) |
| $55,000 to $64,999 | 32 (13.1%) | 4 (2.1%) |
| $65,000 to $74,999 | 15 (6.1%) | 2 (1.1%) |
| $75,000 to $99,999 | 13 (5.3%) | 12 (6.5%) |
| $100,000+ | 5 (2.0%) | 0 (0.0%) |
| Total | 245 (100.0%) | 186 (100.0%) |
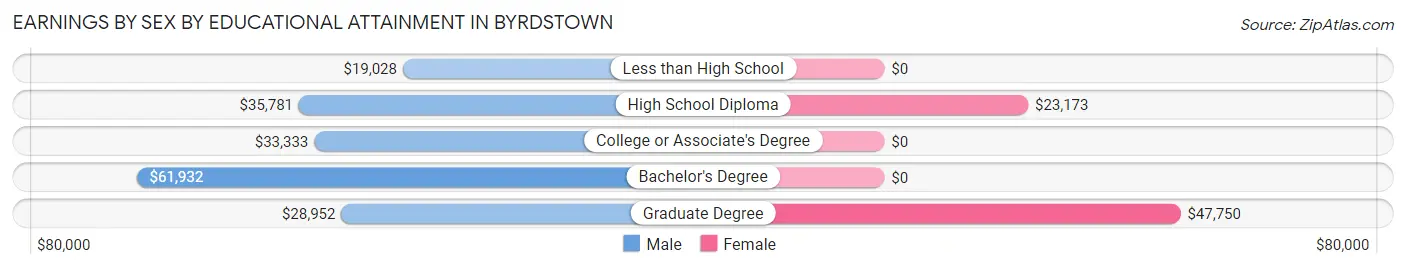
Earnings by Sex by Educational Attainment in Byrdstown
Average earnings in Byrdstown are $30,714 for men and $19,125 for women, a difference of 37.7%. Men with an educational attainment of bachelor's degree enjoy the highest average annual earnings of $61,932, while those with less than high school education earn the least with $19,028. Women with an educational attainment of graduate degree earn the most with the average annual earnings of $47,750, while those with high school diploma education have the smallest earnings of $23,173.
| Educational Attainment | Male Income | Female Income |
| Less than High School | $19,028 | $0 |
| High School Diploma | $35,781 | $23,173 |
| College or Associate's Degree | $33,333 | $0 |
| Bachelor's Degree | $61,932 | $0 |
| Graduate Degree | $28,952 | $47,750 |
| Total | $30,714 | $19,125 |
Family Income in Byrdstown
Family Income Brackets in Byrdstown
According to the Byrdstown family income data, there are 68 families falling into the $50,000 to $74,999 income range, which is the most common income bracket and makes up 30.9% of all families.
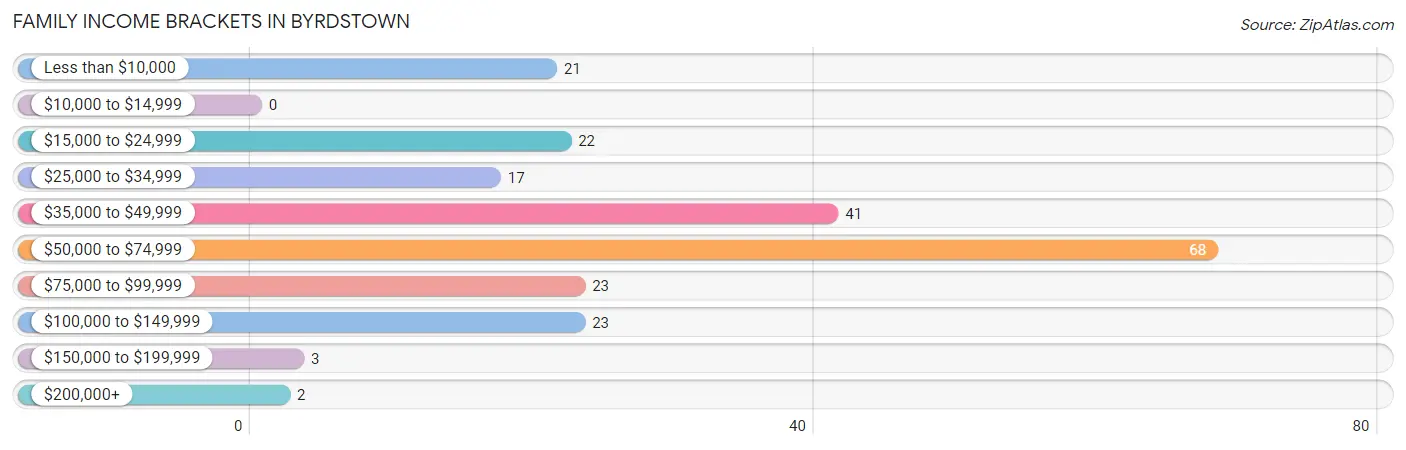
| Income Bracket | # Families | % Families |
| Less than $10,000 | 21 | 9.5% |
| $10,000 to $14,999 | 0 | 0.0% |
| $15,000 to $24,999 | 22 | 10.0% |
| $25,000 to $34,999 | 17 | 7.7% |
| $35,000 to $49,999 | 41 | 18.6% |
| $50,000 to $74,999 | 68 | 30.9% |
| $75,000 to $99,999 | 23 | 10.5% |
| $100,000 to $149,999 | 23 | 10.5% |
| $150,000 to $199,999 | 3 | 1.4% |
| $200,000+ | 2 | 0.9% |
Family Income by Famaliy Size in Byrdstown
3-person families (35 | 15.9%) account for the highest median family income in Byrdstown with $95,417 per family, while 3-person families (35 | 15.9%) have the highest median income of $31,806 per family member.
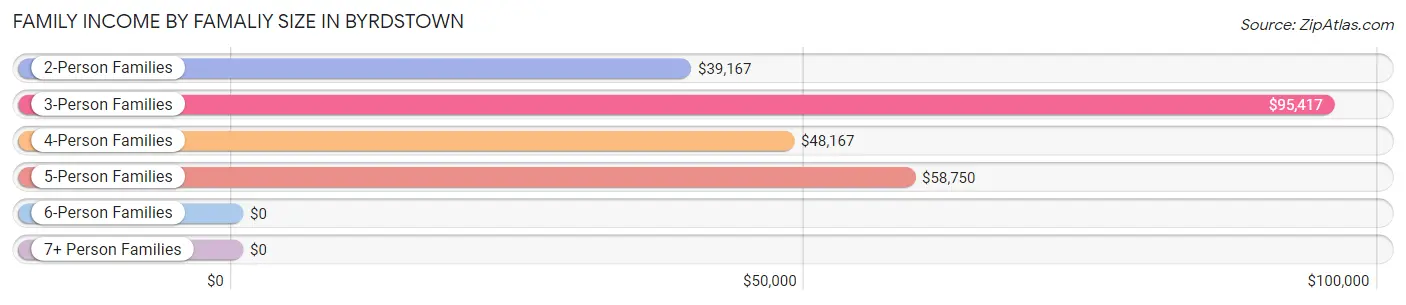
| Income Bracket | # Families | Median Income |
| 2-Person Families | 96 (43.6%) | $39,167 |
| 3-Person Families | 35 (15.9%) | $95,417 |
| 4-Person Families | 48 (21.8%) | $48,167 |
| 5-Person Families | 22 (10.0%) | $58,750 |
| 6-Person Families | 10 (4.5%) | $0 |
| 7+ Person Families | 9 (4.1%) | $0 |
| Total | 220 (100.0%) | $56,944 |
Family Income by Number of Earners in Byrdstown
The median family income in Byrdstown is $56,944, with families comprising 2 earners (102) having the highest median family income of $64,194, while families with no earners (32) have the lowest median family income of $30,625, accounting for 46.4% and 14.5% of families, respectively.
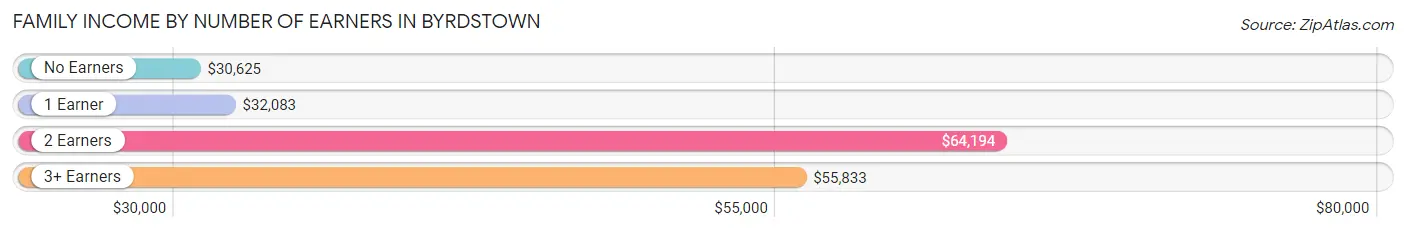
| Number of Earners | # Families | Median Income |
| No Earners | 32 (14.5%) | $30,625 |
| 1 Earner | 70 (31.8%) | $32,083 |
| 2 Earners | 102 (46.4%) | $64,194 |
| 3+ Earners | 16 (7.3%) | $55,833 |
| Total | 220 (100.0%) | $56,944 |
Household Income in Byrdstown
Household Income Brackets in Byrdstown
With 95 households falling in the category, the $50,000 to $74,999 income range is the most frequent in Byrdstown, accounting for 20.4% of all households. In contrast, only 2 households (0.4%) fall into the $200,000+ income bracket, making it the least populous group.
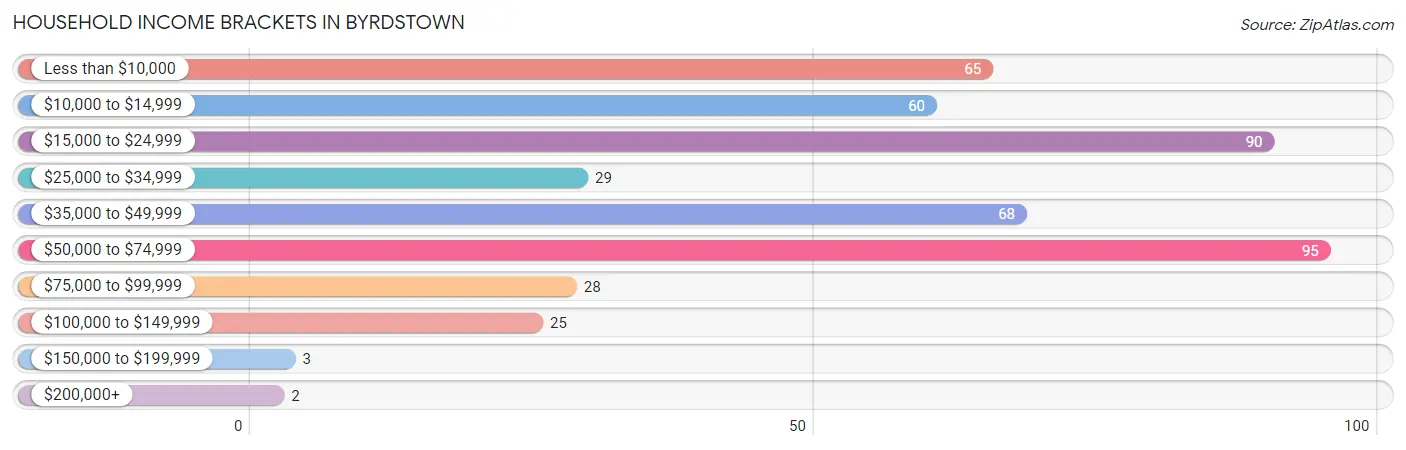
| Income Bracket | # Households | % Households |
| Less than $10,000 | 65 | 14.0% |
| $10,000 to $14,999 | 60 | 12.9% |
| $15,000 to $24,999 | 90 | 19.4% |
| $25,000 to $34,999 | 29 | 6.2% |
| $35,000 to $49,999 | 68 | 14.6% |
| $50,000 to $74,999 | 95 | 20.4% |
| $75,000 to $99,999 | 28 | 6.0% |
| $100,000 to $149,999 | 25 | 5.4% |
| $150,000 to $199,999 | 3 | 0.6% |
| $200,000+ | 2 | 0.4% |
Household Income by Householder Age in Byrdstown
The median household income in Byrdstown is $32,125, with the highest median household income of $62,250 found in the 25 to 44 years age bracket for the primary householder. A total of 113 households (24.3%) fall into this category. Meanwhile, the 15 to 24 years age bracket for the primary householder has the lowest median household income of $21,875, with 33 households (7.1%) in this group.
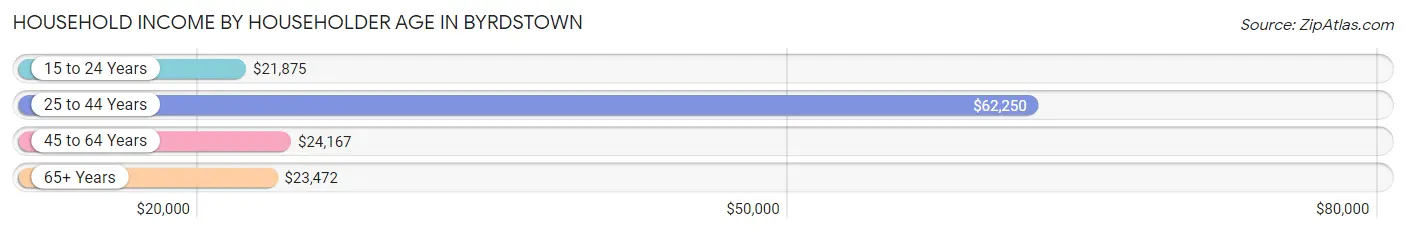
| Income Bracket | # Households | Median Income |
| 15 to 24 Years | 33 (7.1%) | $21,875 |
| 25 to 44 Years | 113 (24.3%) | $62,250 |
| 45 to 64 Years | 126 (27.1%) | $24,167 |
| 65+ Years | 193 (41.5%) | $23,472 |
| Total | 465 (100.0%) | $32,125 |
Poverty in Byrdstown
Income Below Poverty by Sex and Age in Byrdstown
With 19.9% poverty level for males and 18.1% for females among the residents of Byrdstown, 75 year old and over males and 65 to 74 year old females are the most vulnerable to poverty, with 10 males (45.5%) and 32 females (40.5%) in their respective age groups living below the poverty level.
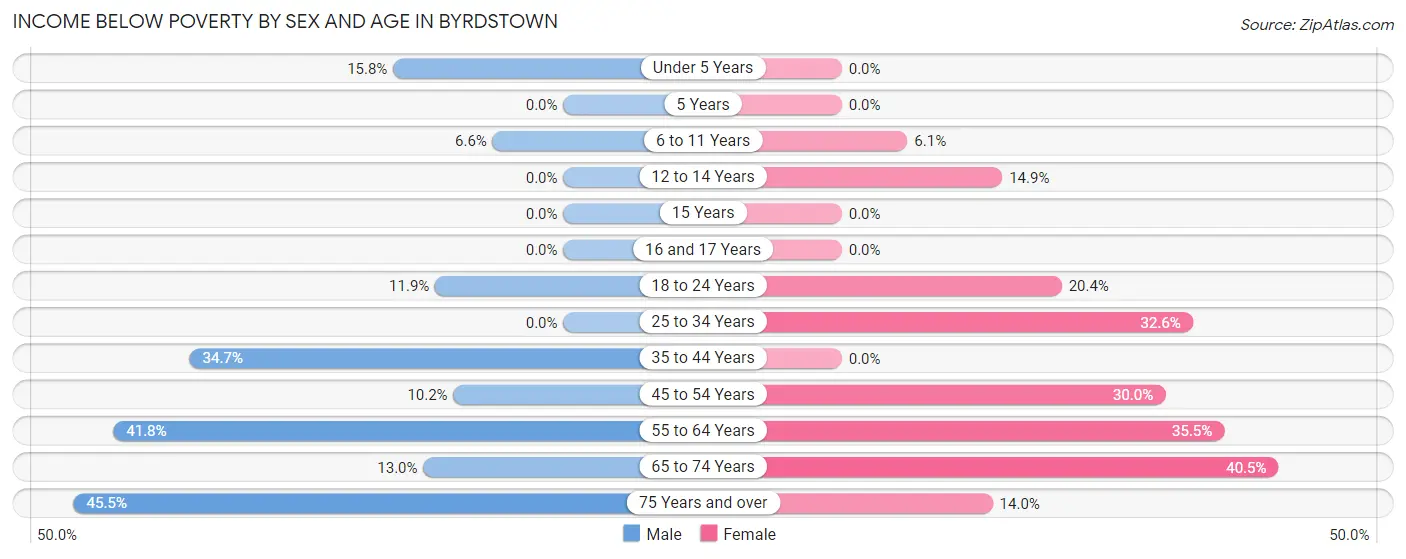
| Age Bracket | Male | Female |
| Under 5 Years | 6 (15.8%) | 0 (0.0%) |
| 5 Years | 0 (0.0%) | 0 (0.0%) |
| 6 to 11 Years | 4 (6.6%) | 7 (6.1%) |
| 12 to 14 Years | 0 (0.0%) | 7 (14.9%) |
| 15 Years | 0 (0.0%) | 0 (0.0%) |
| 16 and 17 Years | 0 (0.0%) | 0 (0.0%) |
| 18 to 24 Years | 10 (11.9%) | 10 (20.4%) |
| 25 to 34 Years | 0 (0.0%) | 14 (32.6%) |
| 35 to 44 Years | 43 (34.7%) | 0 (0.0%) |
| 45 to 54 Years | 5 (10.2%) | 15 (30.0%) |
| 55 to 64 Years | 38 (41.8%) | 11 (35.5%) |
| 65 to 74 Years | 10 (13.0%) | 32 (40.5%) |
| 75 Years and over | 10 (45.5%) | 7 (14.0%) |
| Total | 126 (19.9%) | 103 (18.1%) |
Income Above Poverty by Sex and Age in Byrdstown
According to the poverty statistics in Byrdstown, males aged 5 years and females aged under 5 years are the age groups that are most secure financially, with 100.0% of males and 100.0% of females in these age groups living above the poverty line.
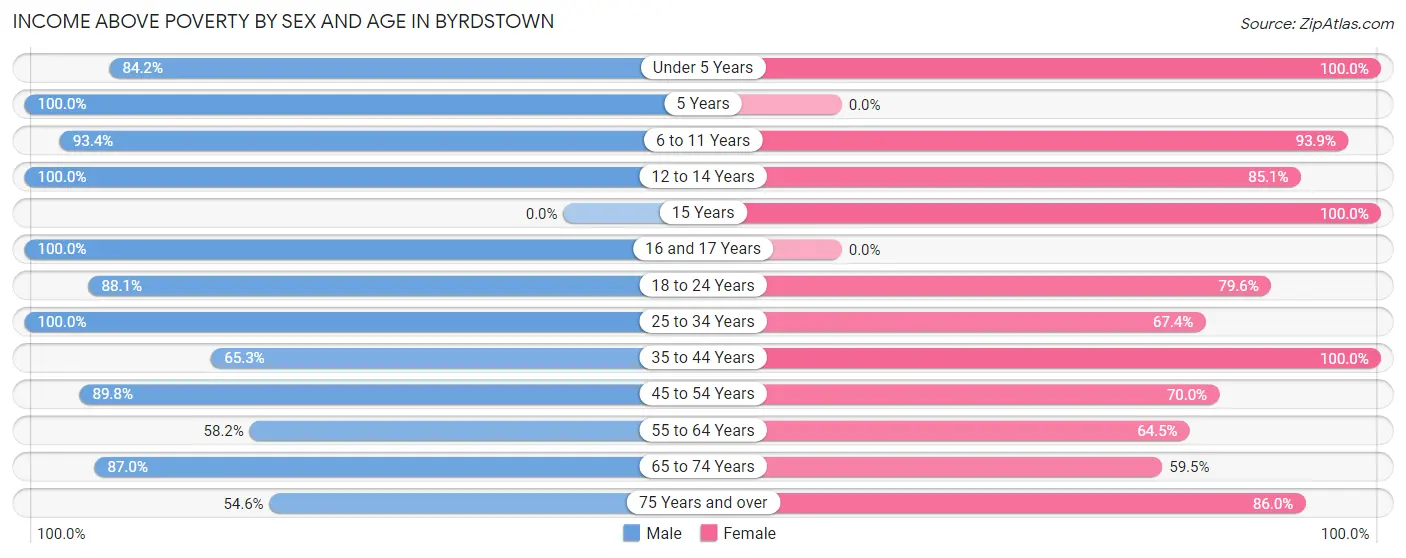
| Age Bracket | Male | Female |
| Under 5 Years | 32 (84.2%) | 36 (100.0%) |
| 5 Years | 15 (100.0%) | 0 (0.0%) |
| 6 to 11 Years | 57 (93.4%) | 108 (93.9%) |
| 12 to 14 Years | 20 (100.0%) | 40 (85.1%) |
| 15 Years | 0 (0.0%) | 4 (100.0%) |
| 16 and 17 Years | 22 (100.0%) | 0 (0.0%) |
| 18 to 24 Years | 74 (88.1%) | 39 (79.6%) |
| 25 to 34 Years | 30 (100.0%) | 29 (67.4%) |
| 35 to 44 Years | 81 (65.3%) | 65 (100.0%) |
| 45 to 54 Years | 44 (89.8%) | 35 (70.0%) |
| 55 to 64 Years | 53 (58.2%) | 20 (64.5%) |
| 65 to 74 Years | 67 (87.0%) | 47 (59.5%) |
| 75 Years and over | 12 (54.5%) | 43 (86.0%) |
| Total | 507 (80.1%) | 466 (81.9%) |
Income Below Poverty Among Married-Couple Families in Byrdstown
The poverty statistics for married-couple families in Byrdstown show that 6.1% or 10 of the total 165 families live below the poverty line. Families with no children have the highest poverty rate of 8.5%, comprising of 7 families. On the other hand, families with 3 or 4 children have the lowest poverty rate of 0.0%, which includes 0 families.
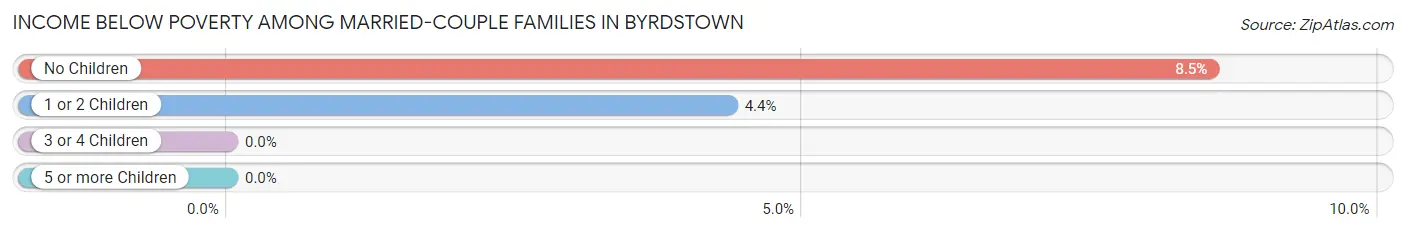
| Children | Above Poverty | Below Poverty |
| No Children | 75 (91.5%) | 7 (8.5%) |
| 1 or 2 Children | 66 (95.7%) | 3 (4.3%) |
| 3 or 4 Children | 6 (100.0%) | 0 (0.0%) |
| 5 or more Children | 8 (100.0%) | 0 (0.0%) |
| Total | 155 (93.9%) | 10 (6.1%) |
Income Below Poverty Among Single-Parent Households in Byrdstown
According to the poverty data in Byrdstown, 12.5% or 2 single-father households and 48.7% or 19 single-mother households are living below the poverty line. Among single-father households, those with 3 or 4 children have the highest poverty rate, with 2 households (40.0%) experiencing poverty. Likewise, among single-mother households, those with 1 or 2 children have the highest poverty rate, with 19 households (57.6%) falling below the poverty line.
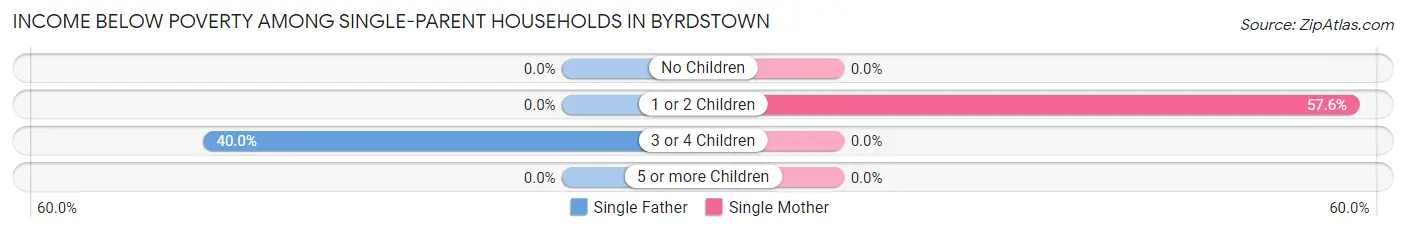
| Children | Single Father | Single Mother |
| No Children | 0 (0.0%) | 0 (0.0%) |
| 1 or 2 Children | 0 (0.0%) | 19 (57.6%) |
| 3 or 4 Children | 2 (40.0%) | 0 (0.0%) |
| 5 or more Children | 0 (0.0%) | 0 (0.0%) |
| Total | 2 (12.5%) | 19 (48.7%) |
Income Below Poverty Among Married-Couple vs Single-Parent Households in Byrdstown
The poverty data for Byrdstown shows that 10 of the married-couple family households (6.1%) and 21 of the single-parent households (38.2%) are living below the poverty level. Within the married-couple family households, those with no children have the highest poverty rate, with 7 households (8.5%) falling below the poverty line. Among the single-parent households, those with 1 or 2 children have the highest poverty rate, with 19 household (48.7%) living below poverty.
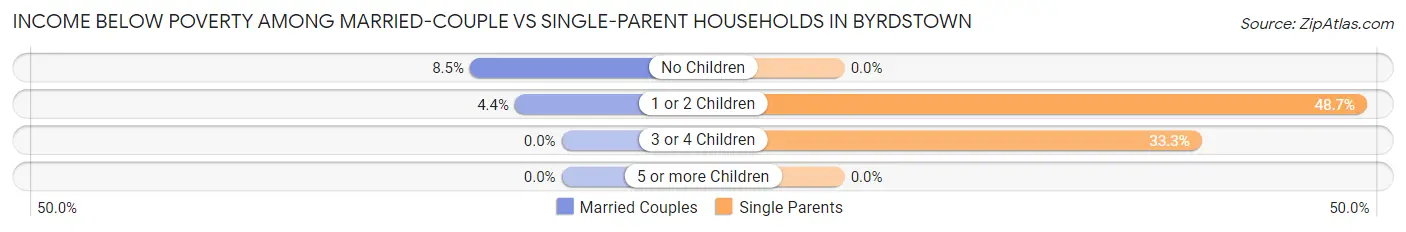
| Children | Married-Couple Families | Single-Parent Households |
| No Children | 7 (8.5%) | 0 (0.0%) |
| 1 or 2 Children | 3 (4.3%) | 19 (48.7%) |
| 3 or 4 Children | 0 (0.0%) | 2 (33.3%) |
| 5 or more Children | 0 (0.0%) | 0 (0.0%) |
| Total | 10 (6.1%) | 21 (38.2%) |
Race in Byrdstown
The most populous races in Byrdstown are White / Caucasian (1,242 | 97.4%), Two or more Races (19 | 1.5%), and Black / African American (14 | 1.1%).
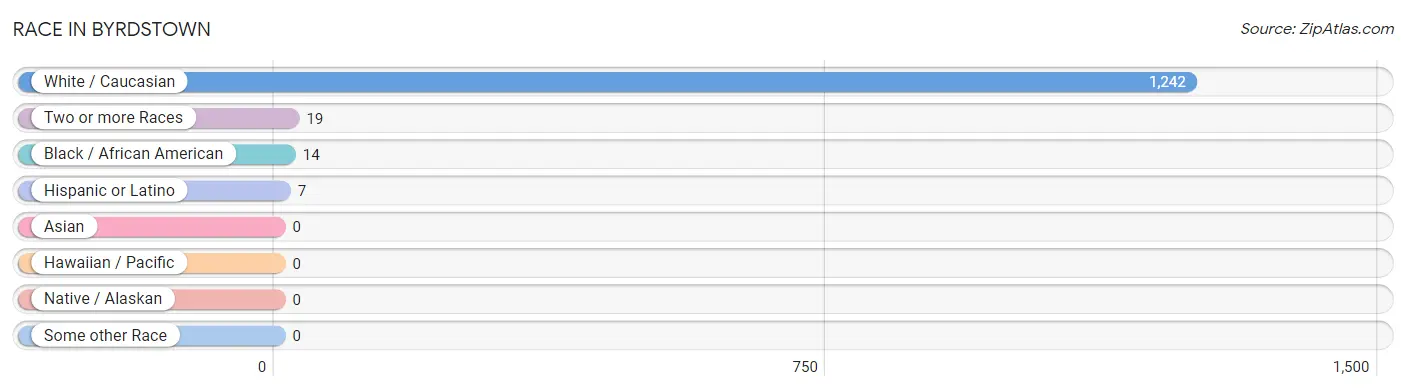
| Race | # Population | % Population |
| Asian | 0 | 0.0% |
| Black / African American | 14 | 1.1% |
| Hawaiian / Pacific | 0 | 0.0% |
| Hispanic or Latino | 7 | 0.5% |
| Native / Alaskan | 0 | 0.0% |
| White / Caucasian | 1,242 | 97.4% |
| Two or more Races | 19 | 1.5% |
| Some other Race | 0 | 0.0% |
| Total | 1,275 | 100.0% |
Ancestry in Byrdstown
The most populous ancestries reported in Byrdstown are American (246 | 19.3%), Irish (119 | 9.3%), German (70 | 5.5%), English (69 | 5.4%), and French (33 | 2.6%), together accounting for 42.1% of all Byrdstown residents.
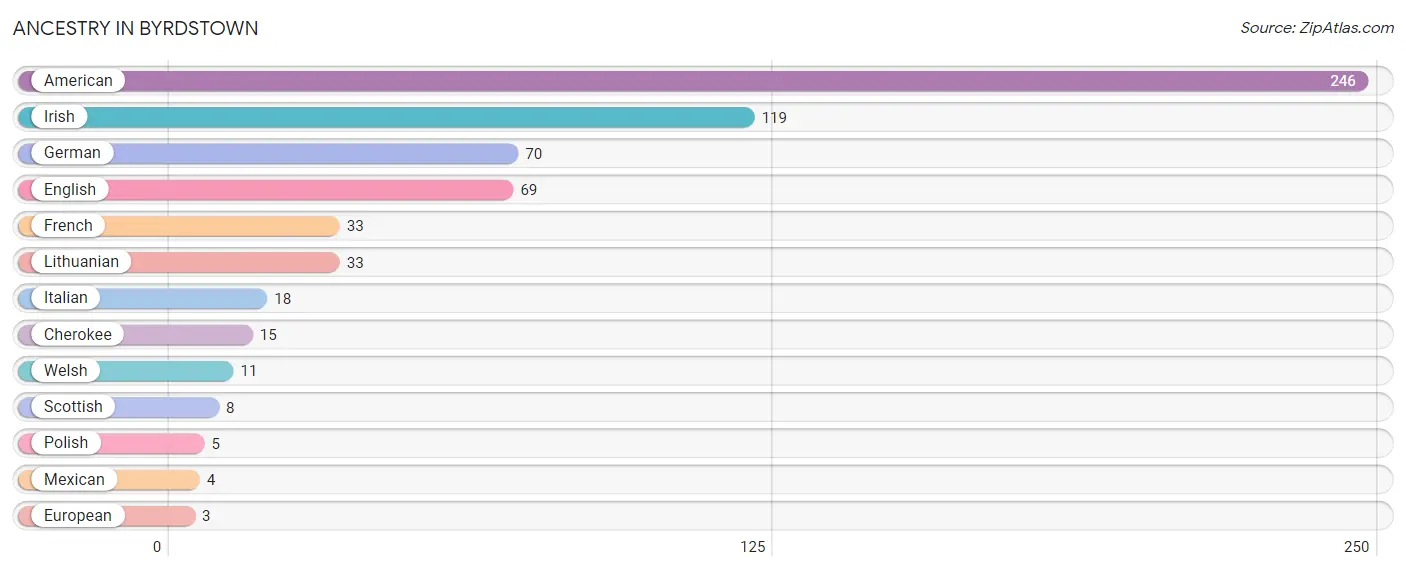
| Ancestry | # Population | % Population |
| American | 246 | 19.3% |
| Cherokee | 15 | 1.2% |
| English | 69 | 5.4% |
| European | 3 | 0.2% |
| French | 33 | 2.6% |
| German | 70 | 5.5% |
| Irish | 119 | 9.3% |
| Italian | 18 | 1.4% |
| Lithuanian | 33 | 2.6% |
| Mexican | 4 | 0.3% |
| Polish | 5 | 0.4% |
| Scottish | 8 | 0.6% |
| Welsh | 11 | 0.9% | View All 13 Rows |
Immigrants in Byrdstown
The most numerous immigrant groups reported in Byrdstown came from Ecuador (3 | 0.2%), Latin America (3 | 0.2%), and South America (3 | 0.2%), together accounting for 0.7% of all Byrdstown residents.
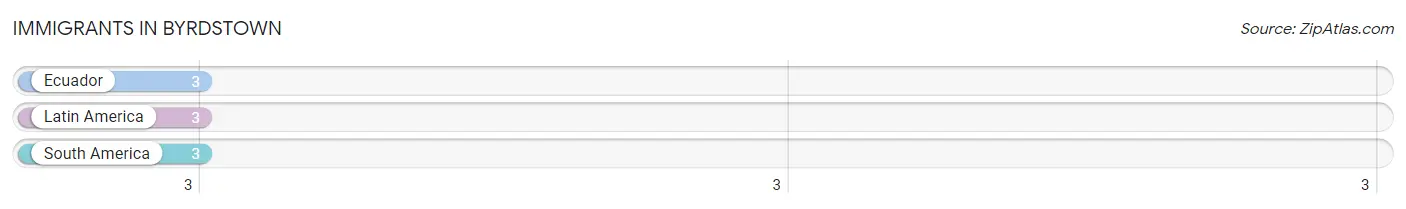
| Immigration Origin | # Population | % Population |
| Ecuador | 3 | 0.2% |
| Latin America | 3 | 0.2% |
| South America | 3 | 0.2% | View All 3 Rows |
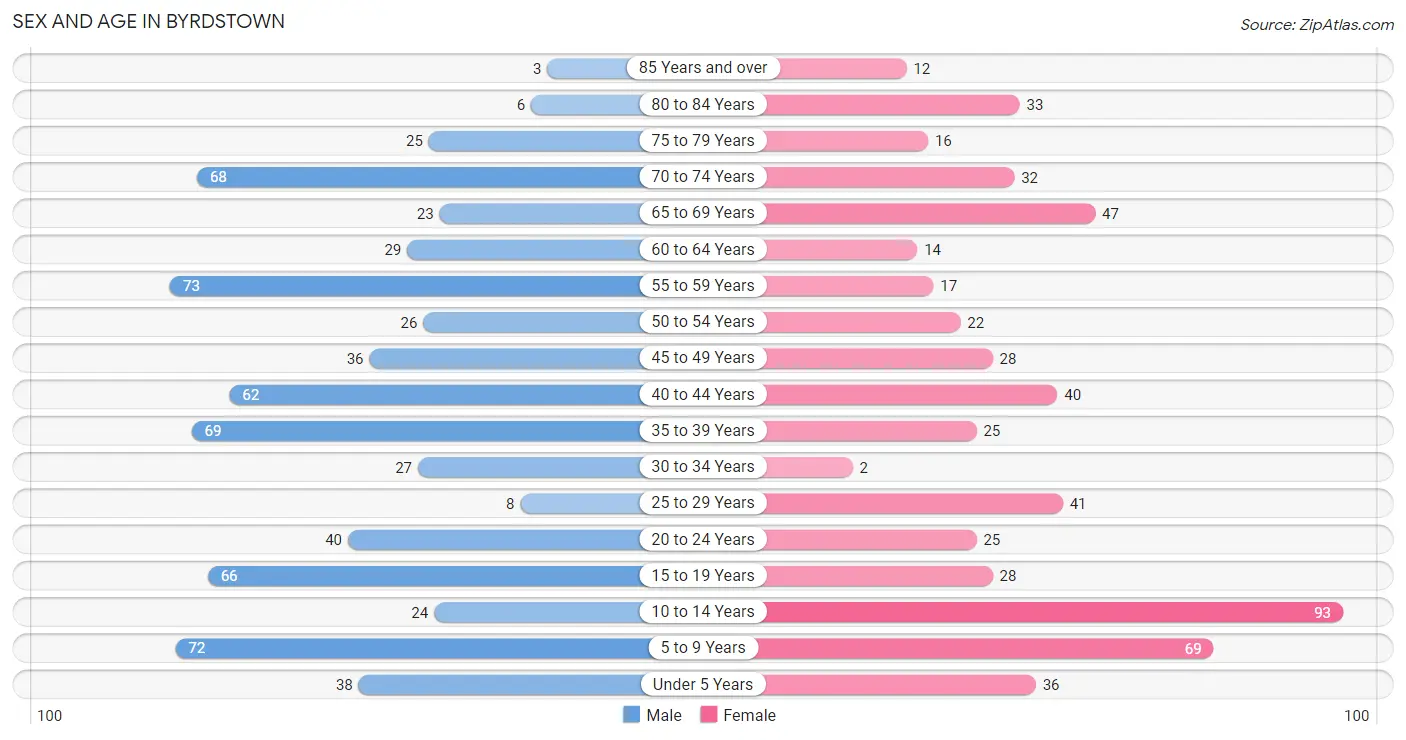
Sex and Age in Byrdstown
Sex and Age in Byrdstown
The most populous age groups in Byrdstown are 55 to 59 Years (73 | 10.5%) for men and 10 to 14 Years (93 | 16.0%) for women.
| Age Bracket | Male | Female |
| Under 5 Years | 38 (5.5%) | 36 (6.2%) |
| 5 to 9 Years | 72 (10.4%) | 69 (11.9%) |
| 10 to 14 Years | 24 (3.5%) | 93 (16.0%) |
| 15 to 19 Years | 66 (9.5%) | 28 (4.8%) |
| 20 to 24 Years | 40 (5.8%) | 25 (4.3%) |
| 25 to 29 Years | 8 (1.1%) | 41 (7.1%) |
| 30 to 34 Years | 27 (3.9%) | 2 (0.3%) |
| 35 to 39 Years | 69 (9.9%) | 25 (4.3%) |
| 40 to 44 Years | 62 (8.9%) | 40 (6.9%) |
| 45 to 49 Years | 36 (5.2%) | 28 (4.8%) |
| 50 to 54 Years | 26 (3.7%) | 22 (3.8%) |
| 55 to 59 Years | 73 (10.5%) | 17 (2.9%) |
| 60 to 64 Years | 29 (4.2%) | 14 (2.4%) |
| 65 to 69 Years | 23 (3.3%) | 47 (8.1%) |
| 70 to 74 Years | 68 (9.8%) | 32 (5.5%) |
| 75 to 79 Years | 25 (3.6%) | 16 (2.8%) |
| 80 to 84 Years | 6 (0.9%) | 33 (5.7%) |
| 85 Years and over | 3 (0.4%) | 12 (2.1%) |
| Total | 695 (100.0%) | 580 (100.0%) |
Families and Households in Byrdstown
Median Family Size in Byrdstown
The median family size in Byrdstown is 4.25 persons per family, with married-couple families (165 | 75.0%) accounting for the largest median family size of 4.73 persons per family. On the other hand, single female/mother families (39 | 17.7%) represent the smallest median family size with 2.56 persons per family.
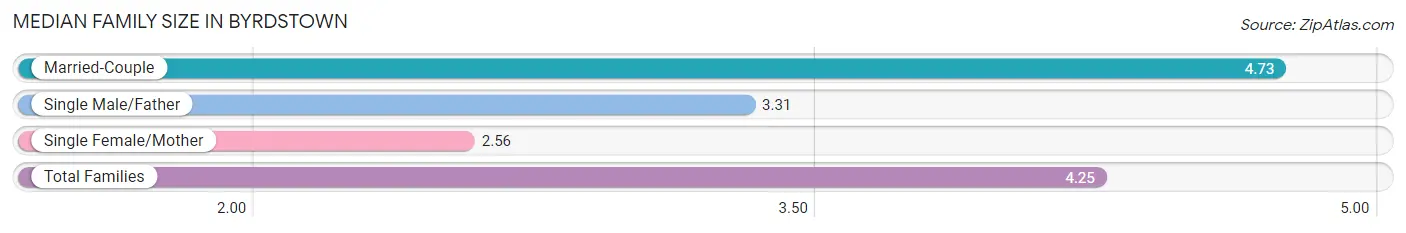
| Family Type | # Families | Family Size |
| Married-Couple | 165 (75.0%) | 4.73 |
| Single Male/Father | 16 (7.3%) | 3.31 |
| Single Female/Mother | 39 (17.7%) | 2.56 |
| Total Families | 220 (100.0%) | 4.25 |
Median Household Size in Byrdstown
The median household size in Byrdstown is 2.58 persons per household, with married-couple households (165 | 35.5%) accounting for the largest median household size of 4.73 persons per household. non-family households (245 | 52.7%) represent the smallest median household size with 1.05 persons per household.
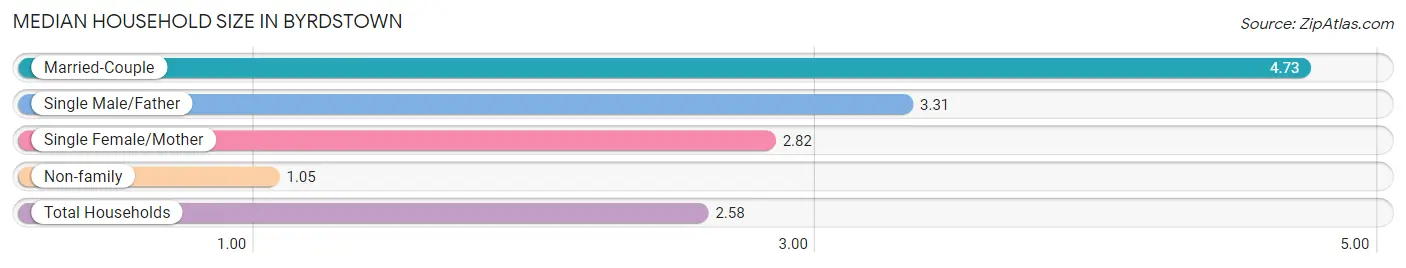
| Household Type | # Households | Household Size |
| Married-Couple | 165 (35.5%) | 4.73 |
| Single Male/Father | 16 (3.4%) | 3.31 |
| Single Female/Mother | 39 (8.4%) | 2.82 |
| Non-family | 245 (52.7%) | 1.05 |
| Total Households | 465 (100.0%) | 2.58 |
Household Size by Marriage Status in Byrdstown
Out of a total of 465 households in Byrdstown, 220 (47.3%) are family households, while 245 (52.7%) are nonfamily households. The most numerous type of family households are 2-person households, comprising 96, and the most common type of nonfamily households are 1-person households, comprising 233.
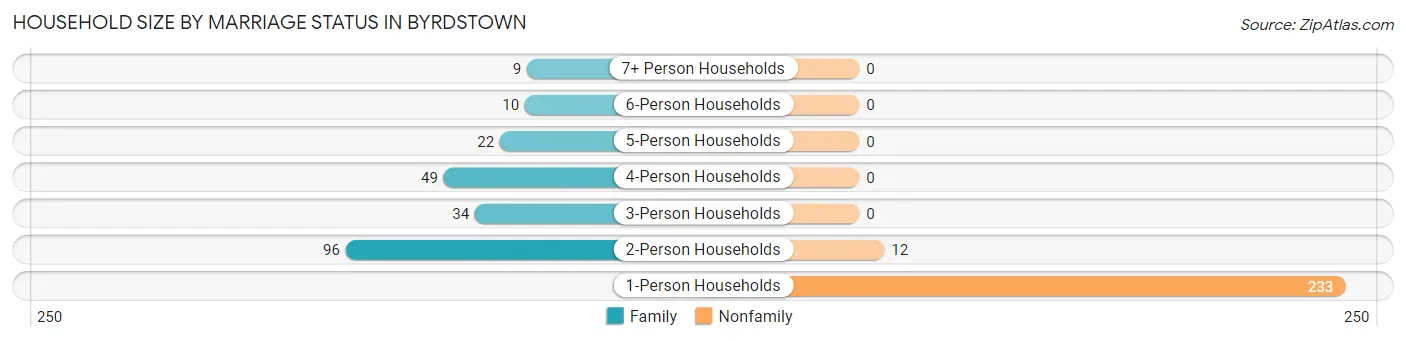
| Household Size | Family Households | Nonfamily Households |
| 1-Person Households | - | 233 (50.1%) |
| 2-Person Households | 96 (20.6%) | 12 (2.6%) |
| 3-Person Households | 34 (7.3%) | 0 (0.0%) |
| 4-Person Households | 49 (10.5%) | 0 (0.0%) |
| 5-Person Households | 22 (4.7%) | 0 (0.0%) |
| 6-Person Households | 10 (2.1%) | 0 (0.0%) |
| 7+ Person Households | 9 (1.9%) | 0 (0.0%) |
| Total | 220 (47.3%) | 245 (52.7%) |
Female Fertility in Byrdstown
Fertility by Age in Byrdstown
Average fertility rate in Byrdstown is 124.0 births per 1,000 women. Women in the age bracket of 15 to 19 years have the highest fertility rate with 321.0 births per 1,000 women. Women in the age bracket of 15 to 19 years acount for 37.5% of all women with births.
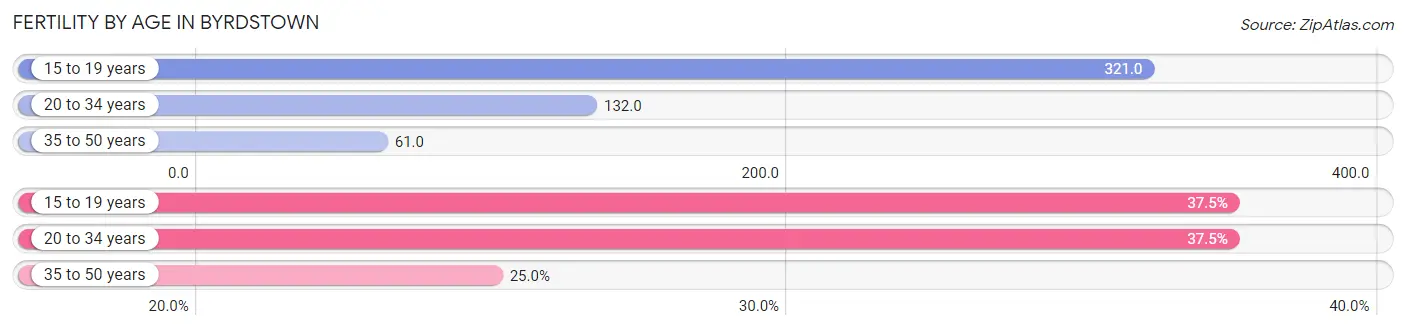
| Age Bracket | Women with Births | Births / 1,000 Women |
| 15 to 19 years | 9 (37.5%) | 321.0 |
| 20 to 34 years | 9 (37.5%) | 132.0 |
| 35 to 50 years | 6 (25.0%) | 61.0 |
| Total | 24 (100.0%) | 124.0 |
Fertility by Age by Marriage Status in Byrdstown
41.7% of women with births (24) in Byrdstown are married. The highest percentage of unmarried women with births falls into 15 to 19 years age bracket with 100.0% of them unmarried at the time of birth, while the lowest percentage of unmarried women with births belong to 35 to 50 years age bracket with 0.0% of them unmarried.
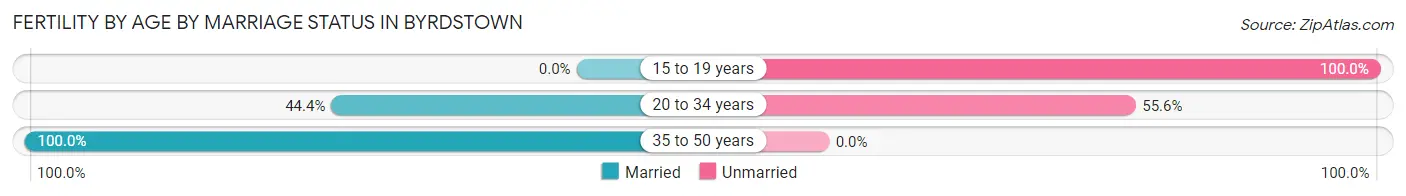
| Age Bracket | Married | Unmarried |
| 15 to 19 years | 0 (0.0%) | 9 (100.0%) |
| 20 to 34 years | 4 (44.4%) | 5 (55.6%) |
| 35 to 50 years | 6 (100.0%) | 0 (0.0%) |
| Total | 10 (41.7%) | 14 (58.3%) |
Fertility by Education in Byrdstown
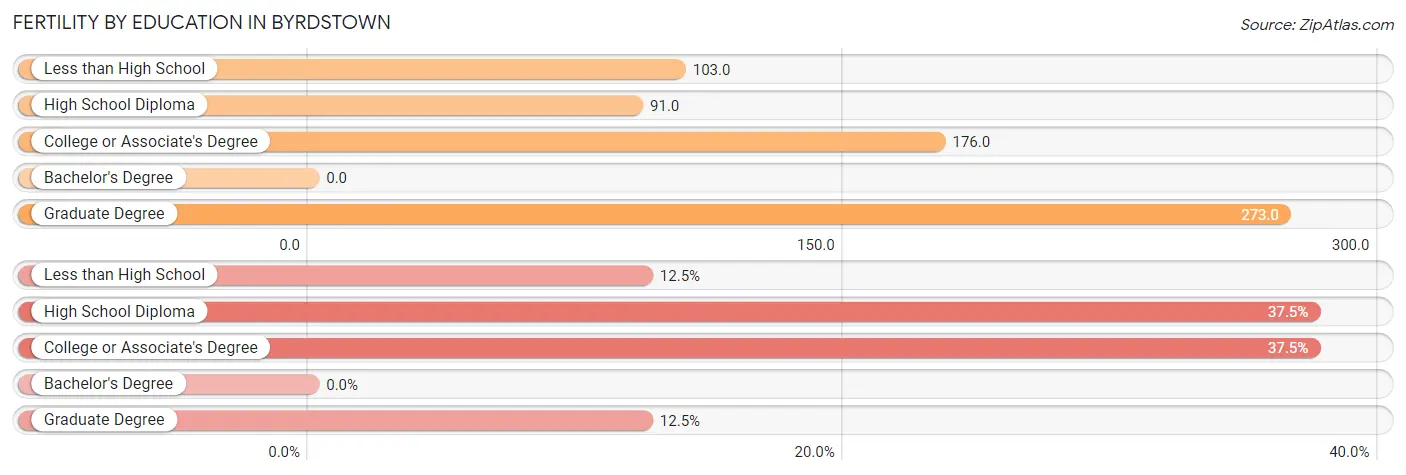
| Educational Attainment | Women with Births | Births / 1,000 Women |
| Less than High School | 3 (12.5%) | 103.0 |
| High School Diploma | 9 (37.5%) | 91.0 |
| College or Associate's Degree | 9 (37.5%) | 176.0 |
| Bachelor's Degree | 0 (0.0%) | 0.0 |
| Graduate Degree | 3 (12.5%) | 273.0 |
| Total | 24 (100.0%) | 124.0 |
Fertility by Education by Marriage Status in Byrdstown
58.3% of women with births in Byrdstown are unmarried. Women with the educational attainment of less than high school are most likely to be married with 100.0% of them married at childbirth, while women with the educational attainment of college or associate's degree are least likely to be married with 100.0% of them unmarried at childbirth.
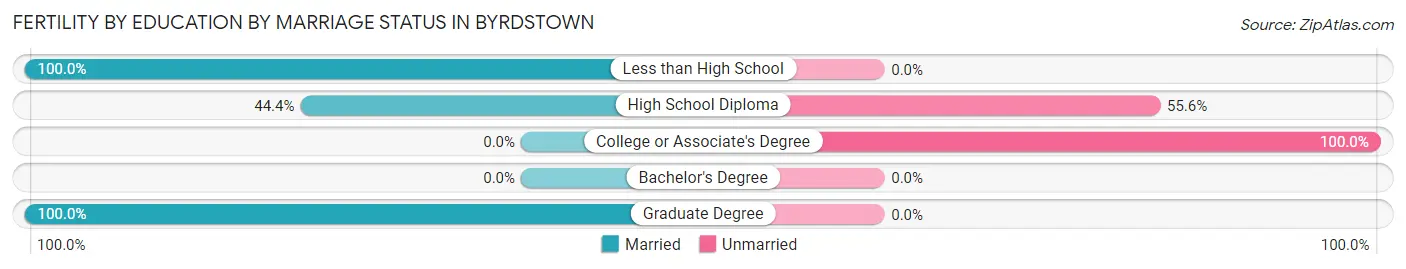
| Educational Attainment | Married | Unmarried |
| Less than High School | 3 (100.0%) | 0 (0.0%) |
| High School Diploma | 4 (44.4%) | 5 (55.6%) |
| College or Associate's Degree | 0 (0.0%) | 9 (100.0%) |
| Bachelor's Degree | 0 (0.0%) | 0 (0.0%) |
| Graduate Degree | 3 (100.0%) | 0 (0.0%) |
| Total | 10 (41.7%) | 14 (58.3%) |
Employment Characteristics in Byrdstown
Employment by Class of Employer in Byrdstown
Among the 376 employed individuals in Byrdstown, private company employees (182 | 48.4%), self-employed (not incorporated) (65 | 17.3%), and not-for-profit organizations (46 | 12.2%) make up the most common classes of employment.
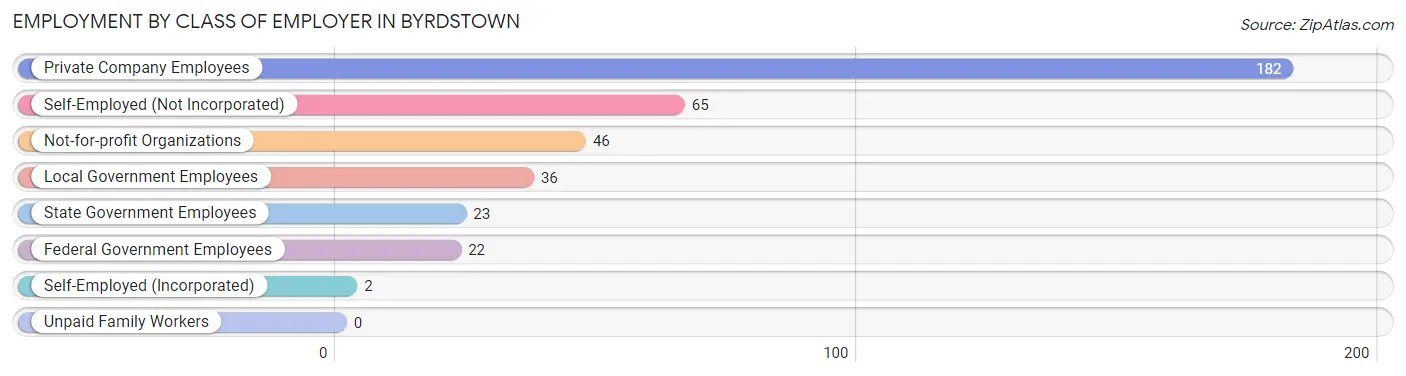
| Employer Class | # Employees | % Employees |
| Private Company Employees | 182 | 48.4% |
| Self-Employed (Incorporated) | 2 | 0.5% |
| Self-Employed (Not Incorporated) | 65 | 17.3% |
| Not-for-profit Organizations | 46 | 12.2% |
| Local Government Employees | 36 | 9.6% |
| State Government Employees | 23 | 6.1% |
| Federal Government Employees | 22 | 5.9% |
| Unpaid Family Workers | 0 | 0.0% |
| Total | 376 | 100.0% |
Employment Status by Age in Byrdstown
According to the labor force statistics for Byrdstown, out of the total population over 16 years of age (939), 42.2% or 396 individuals are in the labor force, with 4.3% or 17 of them unemployed. The age group with the highest labor force participation rate is 25 to 29 years, with 89.8% or 44 individuals in the labor force. Within the labor force, the 16 to 19 years age range has the highest percentage of unemployed individuals, with 100.0% or 3 of them being unemployed.
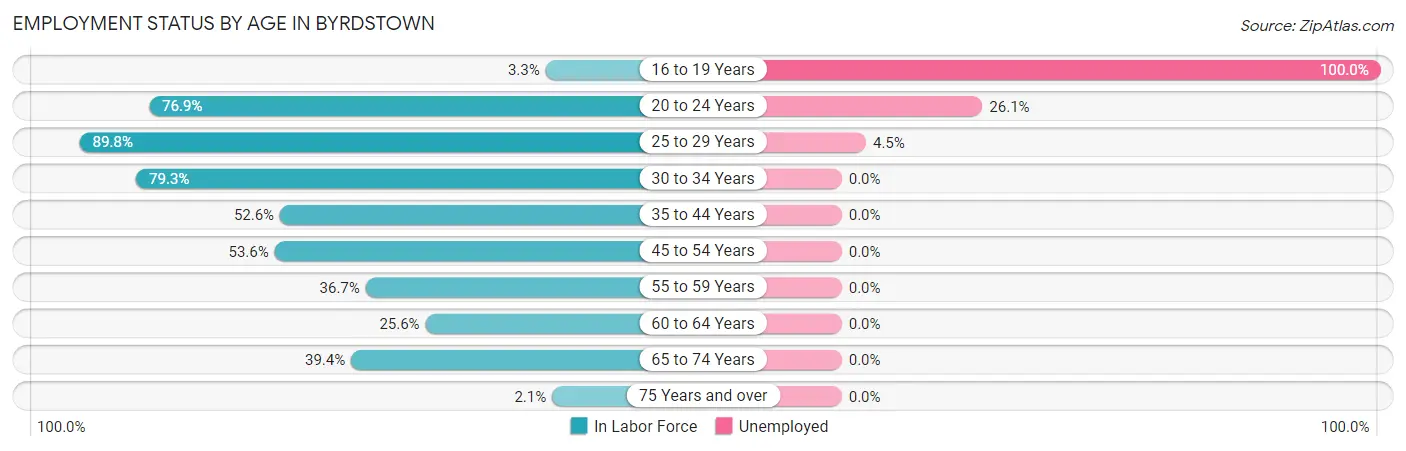
| Age Bracket | In Labor Force | Unemployed |
| 16 to 19 Years | 3 (3.3%) | 3 (100.0%) |
| 20 to 24 Years | 50 (76.9%) | 13 (26.1%) |
| 25 to 29 Years | 44 (89.8%) | 2 (4.5%) |
| 30 to 34 Years | 23 (79.3%) | 0 (0.0%) |
| 35 to 44 Years | 103 (52.6%) | 0 (0.0%) |
| 45 to 54 Years | 60 (53.6%) | 0 (0.0%) |
| 55 to 59 Years | 33 (36.7%) | 0 (0.0%) |
| 60 to 64 Years | 11 (25.6%) | 0 (0.0%) |
| 65 to 74 Years | 67 (39.4%) | 0 (0.0%) |
| 75 Years and over | 2 (2.1%) | 0 (0.0%) |
| Total | 396 (42.2%) | 17 (4.3%) |
Employment Status by Educational Attainment in Byrdstown
According to labor force statistics for Byrdstown, 52.8% of individuals (274) out of the total population between 25 and 64 years of age (519) are in the labor force, with 0.7% or 2 of them being unemployed. The group with the highest labor force participation rate are those with the educational attainment of college / associate degree, with 75.6% or 65 individuals in the labor force. Within the labor force, individuals with high school diploma education have the highest percentage of unemployment, with 1.6% or 2 of them being unemployed.
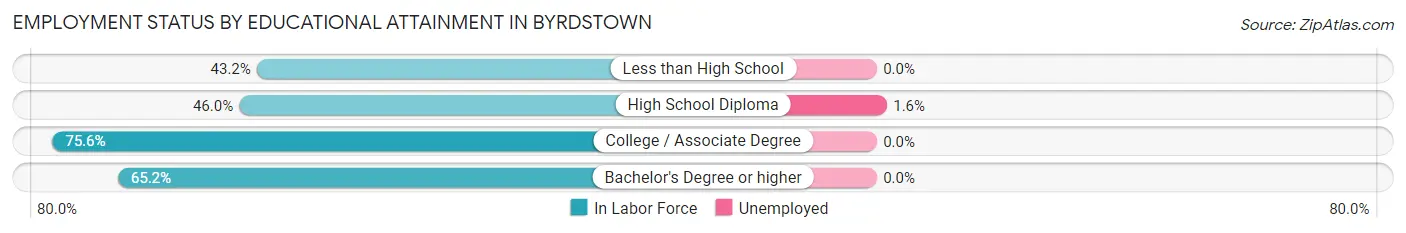
| Educational Attainment | In Labor Force | Unemployed |
| Less than High School | 41 (43.2%) | 0 (0.0%) |
| High School Diploma | 125 (46.0%) | 4 (1.6%) |
| College / Associate Degree | 65 (75.6%) | 0 (0.0%) |
| Bachelor's Degree or higher | 43 (65.2%) | 0 (0.0%) |
| Total | 274 (52.8%) | 4 (0.7%) |
Employment Occupations by Sex in Byrdstown
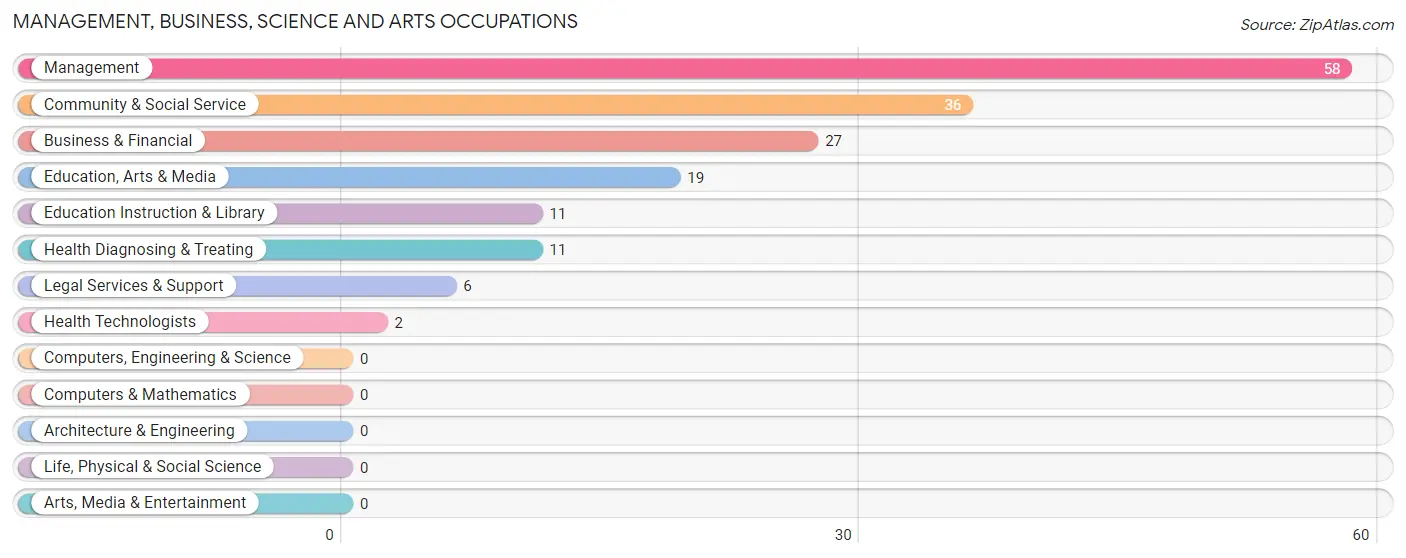
Management, Business, Science and Arts Occupations
The most common Management, Business, Science and Arts occupations in Byrdstown are Management (58 | 15.5%), Community & Social Service (36 | 9.6%), Business & Financial (27 | 7.2%), Education, Arts & Media (19 | 5.1%), and Education Instruction & Library (11 | 2.9%).
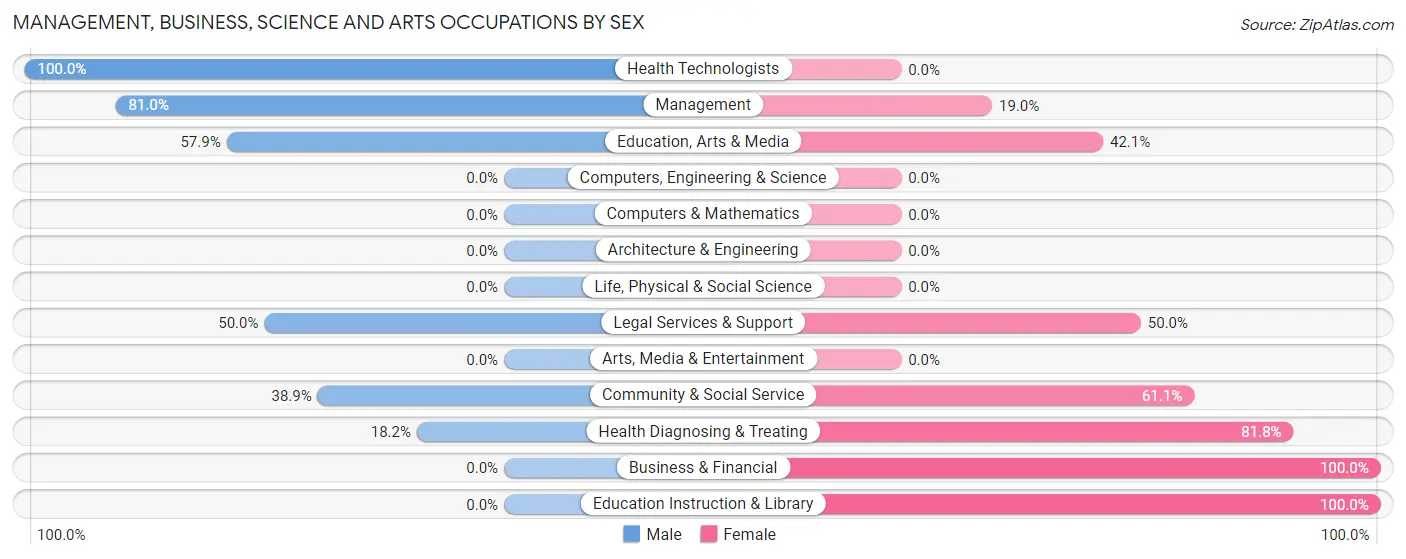
Management, Business, Science and Arts Occupations by Sex
Within the Management, Business, Science and Arts occupations in Byrdstown, the most male-oriented occupations are Health Technologists (100.0%), Management (81.0%), and Education, Arts & Media (57.9%), while the most female-oriented occupations are Business & Financial (100.0%), Education Instruction & Library (100.0%), and Health Diagnosing & Treating (81.8%).
| Occupation | Male | Female |
| Management | 47 (81.0%) | 11 (19.0%) |
| Business & Financial | 0 (0.0%) | 27 (100.0%) |
| Computers, Engineering & Science | 0 (0.0%) | 0 (0.0%) |
| Computers & Mathematics | 0 (0.0%) | 0 (0.0%) |
| Architecture & Engineering | 0 (0.0%) | 0 (0.0%) |
| Life, Physical & Social Science | 0 (0.0%) | 0 (0.0%) |
| Community & Social Service | 14 (38.9%) | 22 (61.1%) |
| Education, Arts & Media | 11 (57.9%) | 8 (42.1%) |
| Legal Services & Support | 3 (50.0%) | 3 (50.0%) |
| Education Instruction & Library | 0 (0.0%) | 11 (100.0%) |
| Arts, Media & Entertainment | 0 (0.0%) | 0 (0.0%) |
| Health Diagnosing & Treating | 2 (18.2%) | 9 (81.8%) |
| Health Technologists | 2 (100.0%) | 0 (0.0%) |
| Total (Category) | 63 (47.7%) | 69 (52.3%) |
| Total (Overall) | 209 (55.7%) | 166 (44.3%) |
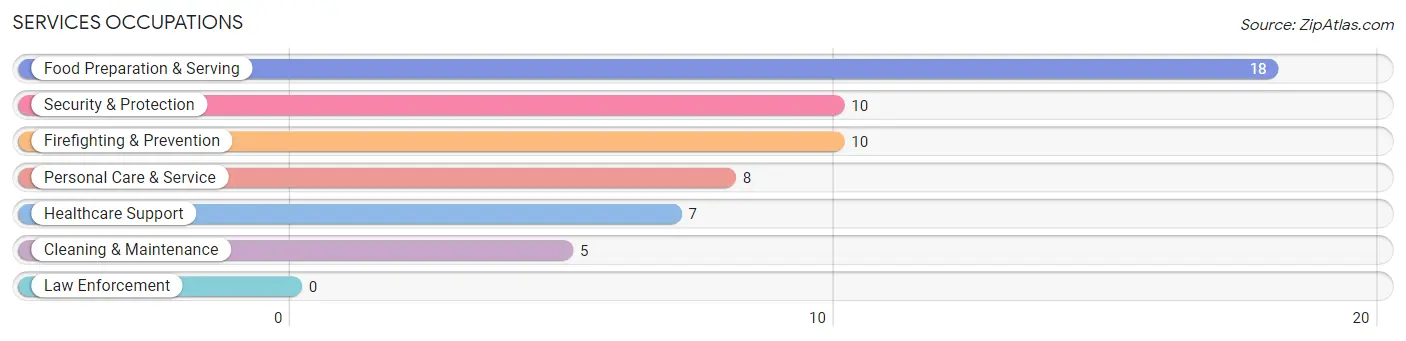
Services Occupations
The most common Services occupations in Byrdstown are Food Preparation & Serving (18 | 4.8%), Security & Protection (10 | 2.7%), Firefighting & Prevention (10 | 2.7%), Personal Care & Service (8 | 2.1%), and Healthcare Support (7 | 1.9%).
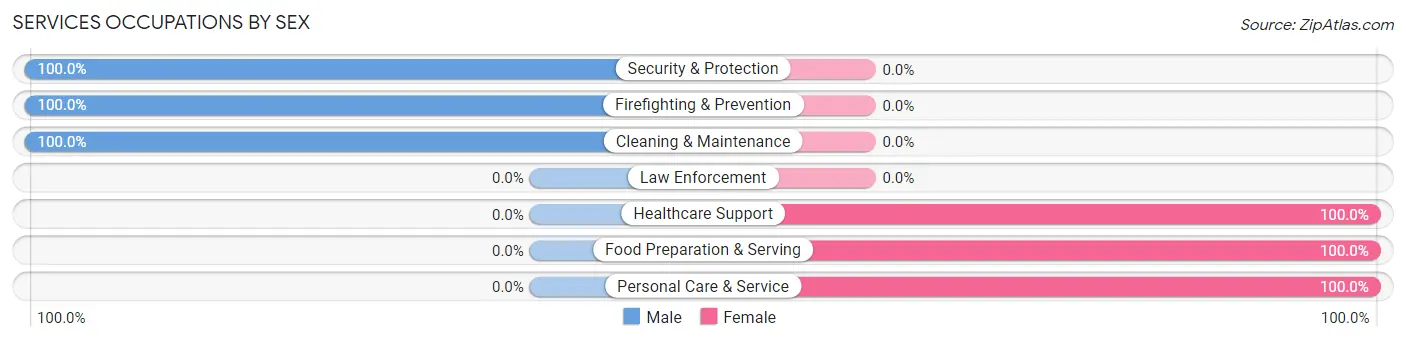
Services Occupations by Sex
Within the Services occupations in Byrdstown, the most male-oriented occupations are Security & Protection (100.0%), Firefighting & Prevention (100.0%), and Cleaning & Maintenance (100.0%), while the most female-oriented occupations are Healthcare Support (100.0%), Food Preparation & Serving (100.0%), and Personal Care & Service (100.0%).
| Occupation | Male | Female |
| Healthcare Support | 0 (0.0%) | 7 (100.0%) |
| Security & Protection | 10 (100.0%) | 0 (0.0%) |
| Firefighting & Prevention | 10 (100.0%) | 0 (0.0%) |
| Law Enforcement | 0 (0.0%) | 0 (0.0%) |
| Food Preparation & Serving | 0 (0.0%) | 18 (100.0%) |
| Cleaning & Maintenance | 5 (100.0%) | 0 (0.0%) |
| Personal Care & Service | 0 (0.0%) | 8 (100.0%) |
| Total (Category) | 15 (31.2%) | 33 (68.8%) |
| Total (Overall) | 209 (55.7%) | 166 (44.3%) |
Sales and Office Occupations
The most common Sales and Office occupations in Byrdstown are Sales & Related (45 | 12.0%), and Office & Administration (36 | 9.6%).
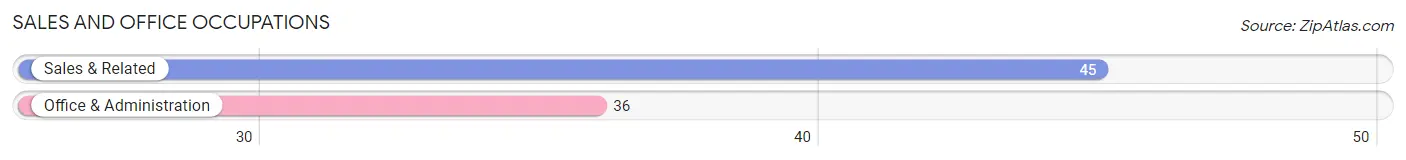
Sales and Office Occupations by Sex
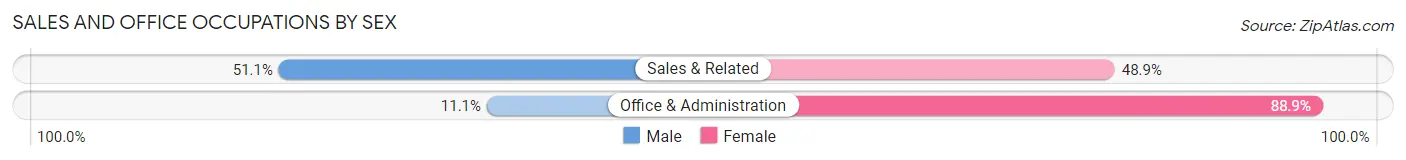
| Occupation | Male | Female |
| Sales & Related | 23 (51.1%) | 22 (48.9%) |
| Office & Administration | 4 (11.1%) | 32 (88.9%) |
| Total (Category) | 27 (33.3%) | 54 (66.7%) |
| Total (Overall) | 209 (55.7%) | 166 (44.3%) |
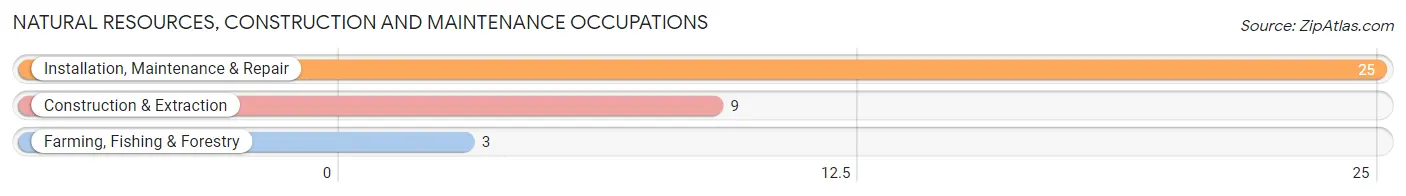
Natural Resources, Construction and Maintenance Occupations
The most common Natural Resources, Construction and Maintenance occupations in Byrdstown are Installation, Maintenance & Repair (25 | 6.7%), Construction & Extraction (9 | 2.4%), and Farming, Fishing & Forestry (3 | 0.8%).
Natural Resources, Construction and Maintenance Occupations by Sex
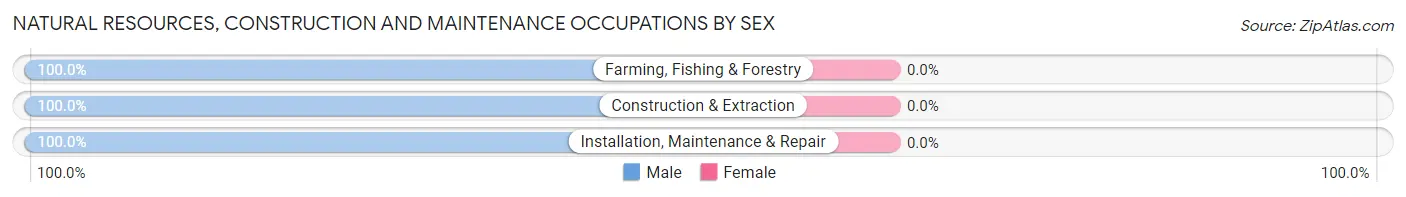
| Occupation | Male | Female |
| Farming, Fishing & Forestry | 3 (100.0%) | 0 (0.0%) |
| Construction & Extraction | 9 (100.0%) | 0 (0.0%) |
| Installation, Maintenance & Repair | 25 (100.0%) | 0 (0.0%) |
| Total (Category) | 37 (100.0%) | 0 (0.0%) |
| Total (Overall) | 209 (55.7%) | 166 (44.3%) |
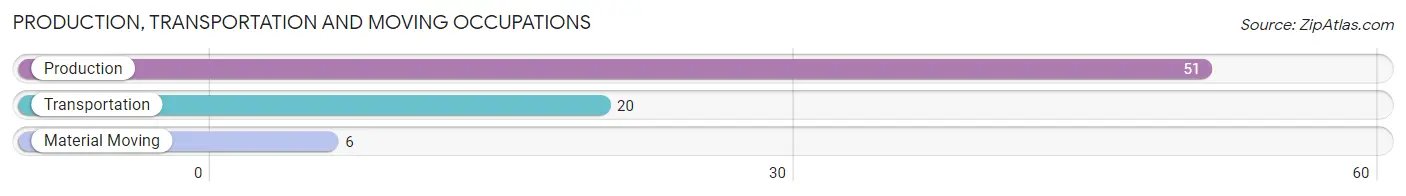
Production, Transportation and Moving Occupations
The most common Production, Transportation and Moving occupations in Byrdstown are Production (51 | 13.6%), Transportation (20 | 5.3%), and Material Moving (6 | 1.6%).
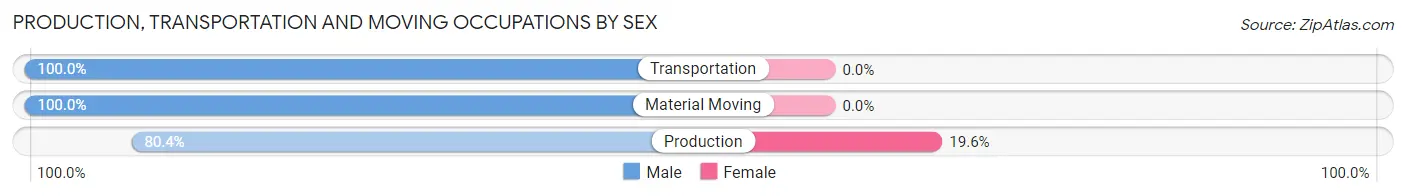
Production, Transportation and Moving Occupations by Sex
| Occupation | Male | Female |
| Production | 41 (80.4%) | 10 (19.6%) |
| Transportation | 20 (100.0%) | 0 (0.0%) |
| Material Moving | 6 (100.0%) | 0 (0.0%) |
| Total (Category) | 67 (87.0%) | 10 (13.0%) |
| Total (Overall) | 209 (55.7%) | 166 (44.3%) |
Employment Industries by Sex in Byrdstown
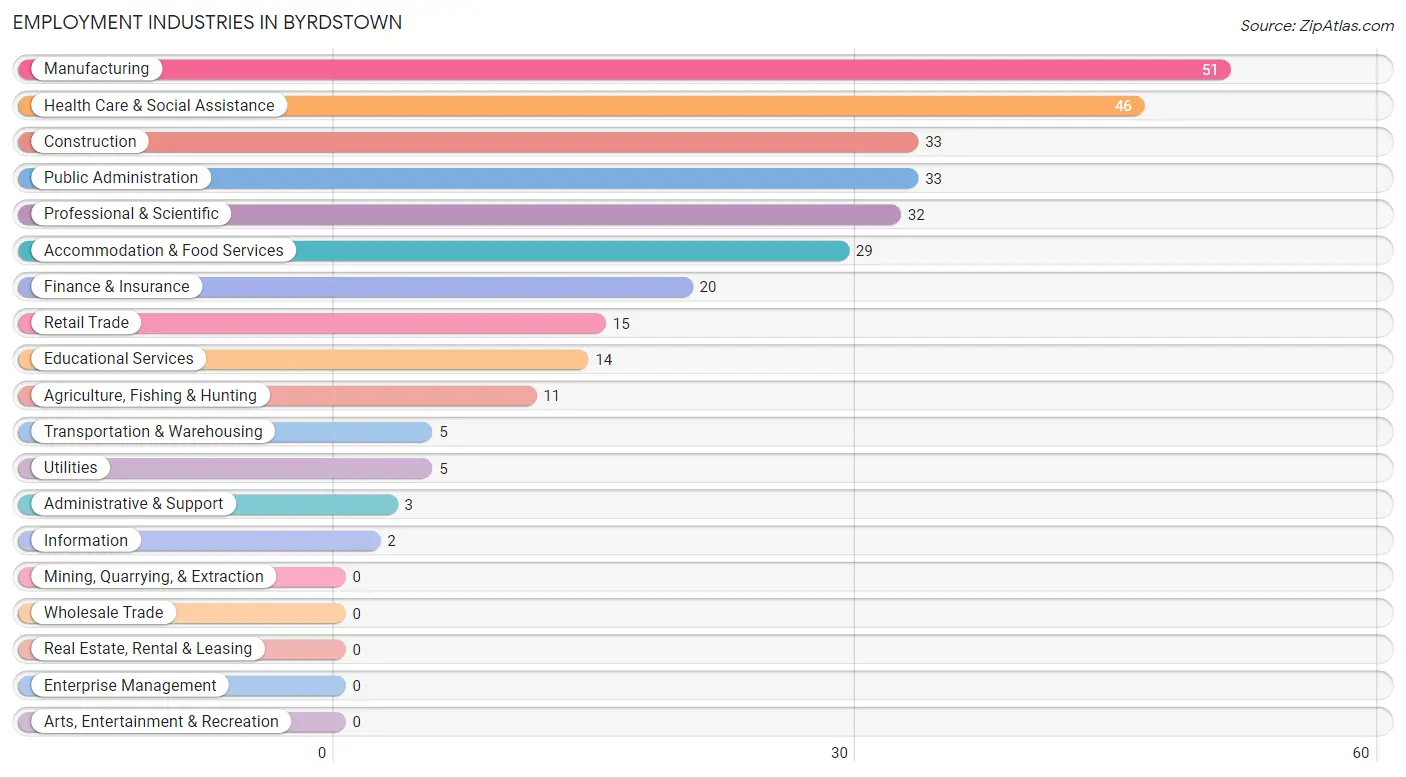
Employment Industries in Byrdstown
The major employment industries in Byrdstown include Manufacturing (51 | 13.6%), Health Care & Social Assistance (46 | 12.3%), Construction (33 | 8.8%), Public Administration (33 | 8.8%), and Professional & Scientific (32 | 8.5%).
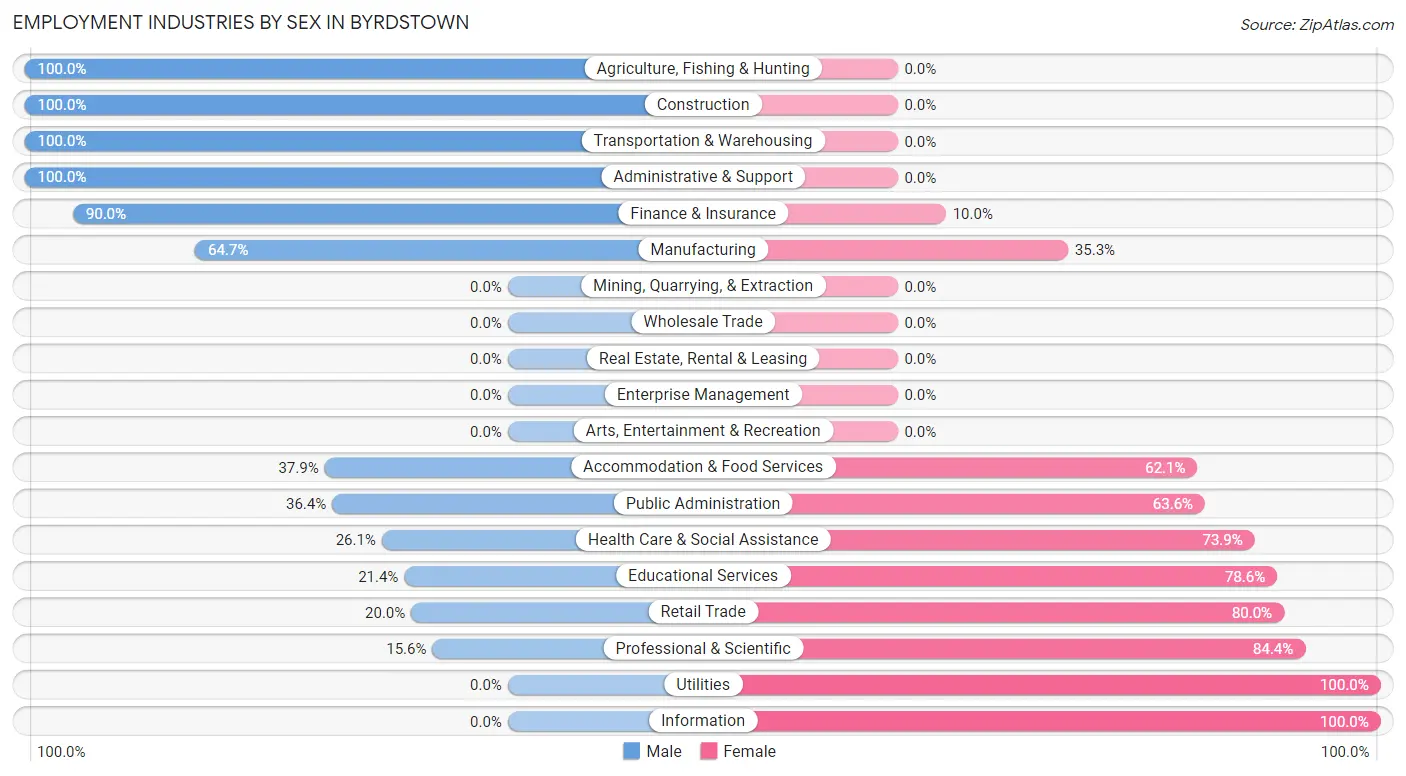
Employment Industries by Sex in Byrdstown
The Byrdstown industries that see more men than women are Agriculture, Fishing & Hunting (100.0%), Construction (100.0%), and Transportation & Warehousing (100.0%), whereas the industries that tend to have a higher number of women are Utilities (100.0%), Information (100.0%), and Professional & Scientific (84.4%).
| Industry | Male | Female |
| Agriculture, Fishing & Hunting | 11 (100.0%) | 0 (0.0%) |
| Mining, Quarrying, & Extraction | 0 (0.0%) | 0 (0.0%) |
| Construction | 33 (100.0%) | 0 (0.0%) |
| Manufacturing | 33 (64.7%) | 18 (35.3%) |
| Wholesale Trade | 0 (0.0%) | 0 (0.0%) |
| Retail Trade | 3 (20.0%) | 12 (80.0%) |
| Transportation & Warehousing | 5 (100.0%) | 0 (0.0%) |
| Utilities | 0 (0.0%) | 5 (100.0%) |
| Information | 0 (0.0%) | 2 (100.0%) |
| Finance & Insurance | 18 (90.0%) | 2 (10.0%) |
| Real Estate, Rental & Leasing | 0 (0.0%) | 0 (0.0%) |
| Professional & Scientific | 5 (15.6%) | 27 (84.4%) |
| Enterprise Management | 0 (0.0%) | 0 (0.0%) |
| Administrative & Support | 3 (100.0%) | 0 (0.0%) |
| Educational Services | 3 (21.4%) | 11 (78.6%) |
| Health Care & Social Assistance | 12 (26.1%) | 34 (73.9%) |
| Arts, Entertainment & Recreation | 0 (0.0%) | 0 (0.0%) |
| Accommodation & Food Services | 11 (37.9%) | 18 (62.1%) |
| Public Administration | 12 (36.4%) | 21 (63.6%) |
| Total | 209 (55.7%) | 166 (44.3%) |
Education in Byrdstown
School Enrollment in Byrdstown
The most common levels of schooling among the 300 students in Byrdstown are elementary school (144 | 48.0%), middle school (82 | 27.3%), and high school (36 | 12.0%).
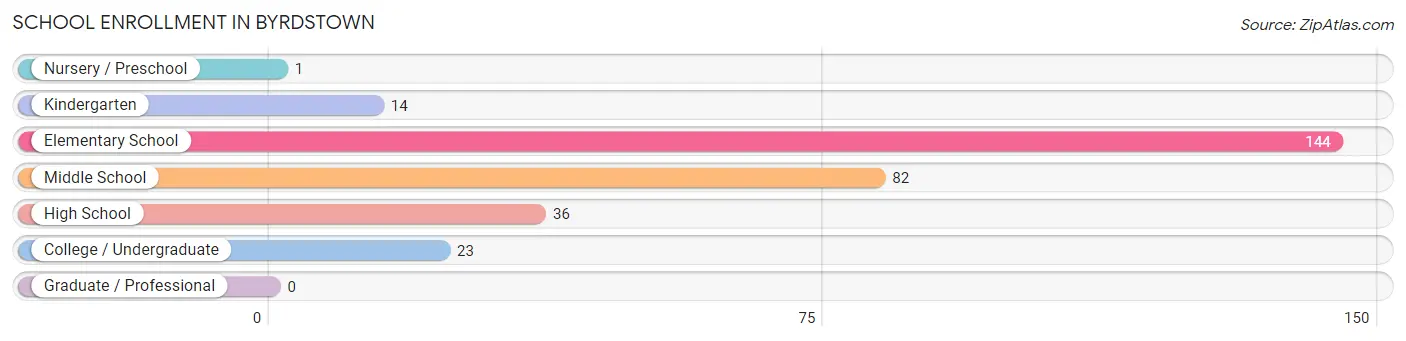
| School Level | # Students | % Students |
| Nursery / Preschool | 1 | 0.3% |
| Kindergarten | 14 | 4.7% |
| Elementary School | 144 | 48.0% |
| Middle School | 82 | 27.3% |
| High School | 36 | 12.0% |
| College / Undergraduate | 23 | 7.7% |
| Graduate / Professional | 0 | 0.0% |
| Total | 300 | 100.0% |
School Enrollment by Age by Funding Source in Byrdstown
Out of a total of 300 students who are enrolled in schools in Byrdstown, 163 (54.3%) attend a private institution, while the remaining 137 (45.7%) are enrolled in public schools. The age group of 20 to 24 year olds has the highest likelihood of being enrolled in private schools, with 10 (83.3% in the age bracket) enrolled. Conversely, the age group of 3 to 4 year olds has the lowest likelihood of being enrolled in a private school, with 1 (100.0% in the age bracket) attending a public institution.
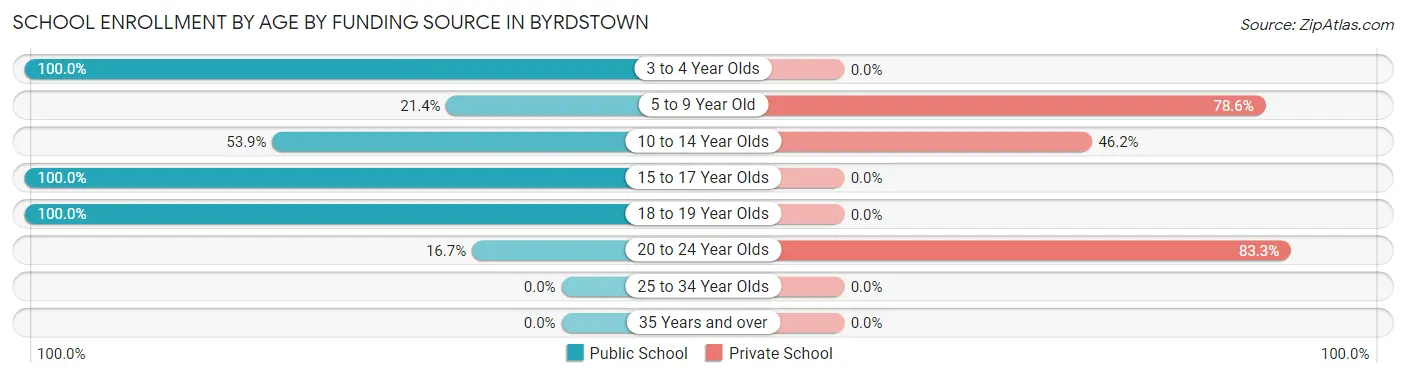
| Age Bracket | Public School | Private School |
| 3 to 4 Year Olds | 1 (100.0%) | 0 (0.0%) |
| 5 to 9 Year Old | 27 (21.4%) | 99 (78.6%) |
| 10 to 14 Year Olds | 63 (53.8%) | 54 (46.2%) |
| 15 to 17 Year Olds | 19 (100.0%) | 0 (0.0%) |
| 18 to 19 Year Olds | 25 (100.0%) | 0 (0.0%) |
| 20 to 24 Year Olds | 2 (16.7%) | 10 (83.3%) |
| 25 to 34 Year Olds | 0 (0.0%) | 0 (0.0%) |
| 35 Years and over | 0 (0.0%) | 0 (0.0%) |
| Total | 137 (45.7%) | 163 (54.3%) |
Educational Attainment by Field of Study in Byrdstown
Business (59 | 42.1%), education (36 | 25.7%), multidisciplinary studies (14 | 10.0%), liberal arts & history (14 | 10.0%), and social sciences (6 | 4.3%) are the most common fields of study among 140 individuals in Byrdstown who have obtained a bachelor's degree or higher.
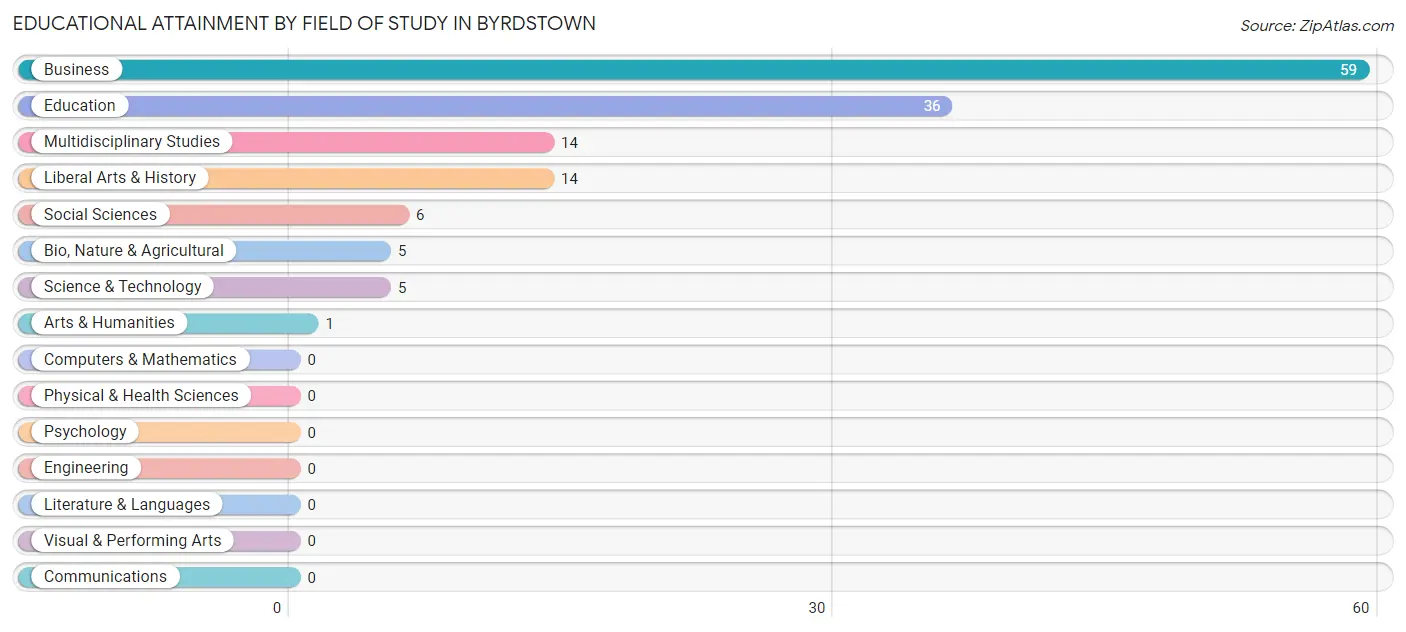
| Field of Study | # Graduates | % Graduates |
| Computers & Mathematics | 0 | 0.0% |
| Bio, Nature & Agricultural | 5 | 3.6% |
| Physical & Health Sciences | 0 | 0.0% |
| Psychology | 0 | 0.0% |
| Social Sciences | 6 | 4.3% |
| Engineering | 0 | 0.0% |
| Multidisciplinary Studies | 14 | 10.0% |
| Science & Technology | 5 | 3.6% |
| Business | 59 | 42.1% |
| Education | 36 | 25.7% |
| Literature & Languages | 0 | 0.0% |
| Liberal Arts & History | 14 | 10.0% |
| Visual & Performing Arts | 0 | 0.0% |
| Communications | 0 | 0.0% |
| Arts & Humanities | 1 | 0.7% |
| Total | 140 | 100.0% |
Transportation & Commute in Byrdstown
Vehicle Availability by Sex in Byrdstown
The most prevalent vehicle ownership categories in Byrdstown are males with 2 vehicles (65, accounting for 30.5%) and females with 2 vehicles (41, making up 39.9%).
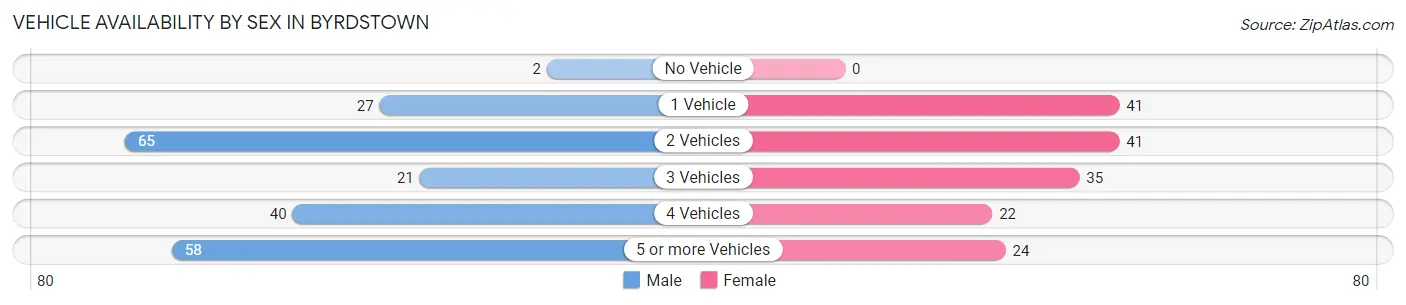
| Vehicles Available | Male | Female |
| No Vehicle | 2 (0.9%) | 0 (0.0%) |
| 1 Vehicle | 27 (12.7%) | 41 (25.2%) |
| 2 Vehicles | 65 (30.5%) | 41 (25.2%) |
| 3 Vehicles | 21 (9.9%) | 35 (21.5%) |
| 4 Vehicles | 40 (18.8%) | 22 (13.5%) |
| 5 or more Vehicles | 58 (27.2%) | 24 (14.7%) |
| Total | 213 (100.0%) | 163 (100.0%) |
Commute Time in Byrdstown
The most frequently occuring commute durations in Byrdstown are 5 to 9 minutes (99 commuters, 26.8%), 30 to 34 minutes (67 commuters, 18.2%), and less than 5 minutes (59 commuters, 16.0%).
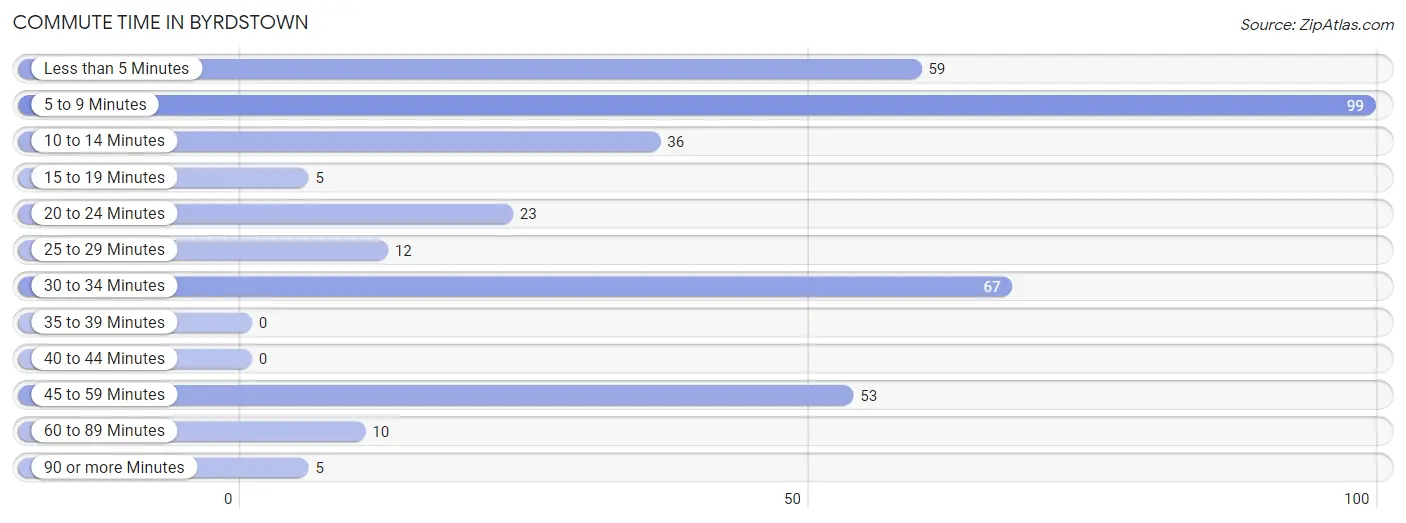
| Commute Time | # Commuters | % Commuters |
| Less than 5 Minutes | 59 | 16.0% |
| 5 to 9 Minutes | 99 | 26.8% |
| 10 to 14 Minutes | 36 | 9.8% |
| 15 to 19 Minutes | 5 | 1.4% |
| 20 to 24 Minutes | 23 | 6.2% |
| 25 to 29 Minutes | 12 | 3.3% |
| 30 to 34 Minutes | 67 | 18.2% |
| 35 to 39 Minutes | 0 | 0.0% |
| 40 to 44 Minutes | 0 | 0.0% |
| 45 to 59 Minutes | 53 | 14.4% |
| 60 to 89 Minutes | 10 | 2.7% |
| 90 or more Minutes | 5 | 1.4% |
Commute Time by Sex in Byrdstown
The most common commute times in Byrdstown are 5 to 9 minutes (49 commuters, 23.0%) for males and 5 to 9 minutes (50 commuters, 32.1%) for females.
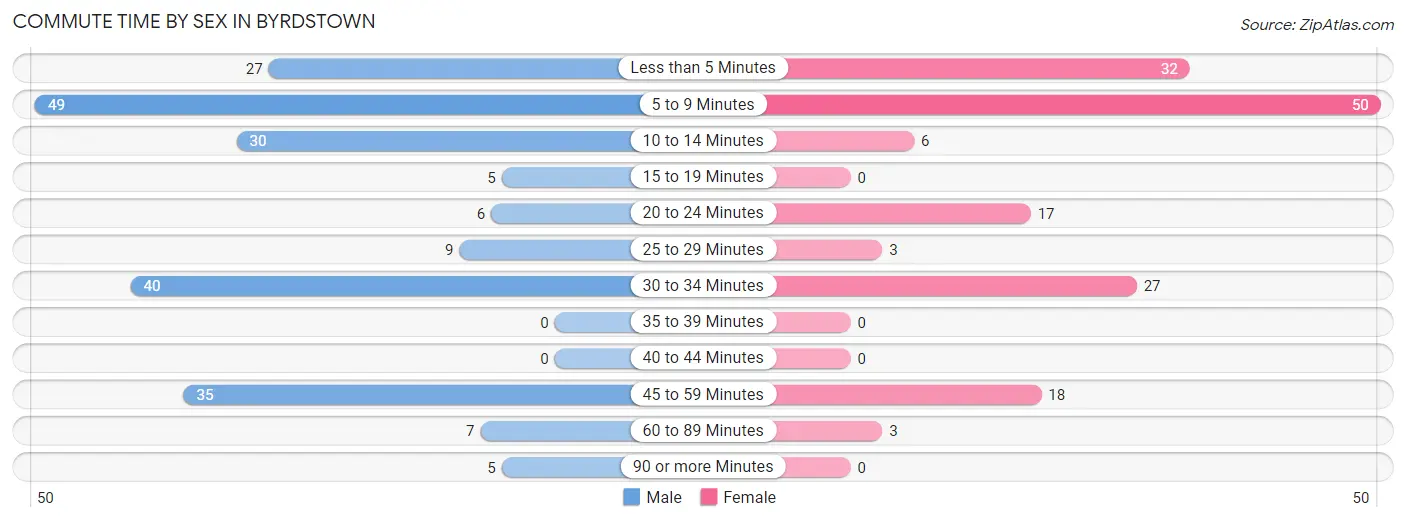
| Commute Time | Male | Female |
| Less than 5 Minutes | 27 (12.7%) | 32 (20.5%) |
| 5 to 9 Minutes | 49 (23.0%) | 50 (32.1%) |
| 10 to 14 Minutes | 30 (14.1%) | 6 (3.8%) |
| 15 to 19 Minutes | 5 (2.4%) | 0 (0.0%) |
| 20 to 24 Minutes | 6 (2.8%) | 17 (10.9%) |
| 25 to 29 Minutes | 9 (4.2%) | 3 (1.9%) |
| 30 to 34 Minutes | 40 (18.8%) | 27 (17.3%) |
| 35 to 39 Minutes | 0 (0.0%) | 0 (0.0%) |
| 40 to 44 Minutes | 0 (0.0%) | 0 (0.0%) |
| 45 to 59 Minutes | 35 (16.4%) | 18 (11.5%) |
| 60 to 89 Minutes | 7 (3.3%) | 3 (1.9%) |
| 90 or more Minutes | 5 (2.4%) | 0 (0.0%) |
Time of Departure to Work by Sex in Byrdstown
The most frequent times of departure to work in Byrdstown are 6:00 AM to 6:29 AM (44, 20.7%) for males and 8:00 AM to 8:29 AM (68, 43.6%) for females.
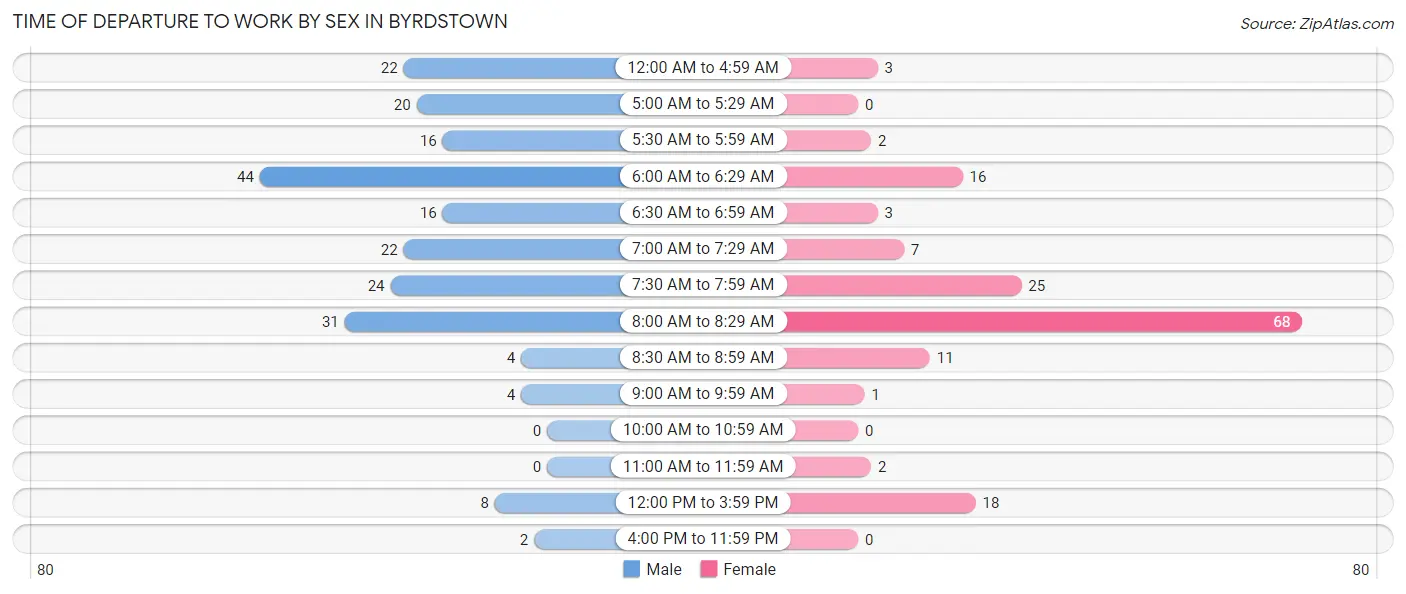
| Time of Departure | Male | Female |
| 12:00 AM to 4:59 AM | 22 (10.3%) | 3 (1.9%) |
| 5:00 AM to 5:29 AM | 20 (9.4%) | 0 (0.0%) |
| 5:30 AM to 5:59 AM | 16 (7.5%) | 2 (1.3%) |
| 6:00 AM to 6:29 AM | 44 (20.7%) | 16 (10.3%) |
| 6:30 AM to 6:59 AM | 16 (7.5%) | 3 (1.9%) |
| 7:00 AM to 7:29 AM | 22 (10.3%) | 7 (4.5%) |
| 7:30 AM to 7:59 AM | 24 (11.3%) | 25 (16.0%) |
| 8:00 AM to 8:29 AM | 31 (14.5%) | 68 (43.6%) |
| 8:30 AM to 8:59 AM | 4 (1.9%) | 11 (7.0%) |
| 9:00 AM to 9:59 AM | 4 (1.9%) | 1 (0.6%) |
| 10:00 AM to 10:59 AM | 0 (0.0%) | 0 (0.0%) |
| 11:00 AM to 11:59 AM | 0 (0.0%) | 2 (1.3%) |
| 12:00 PM to 3:59 PM | 8 (3.8%) | 18 (11.5%) |
| 4:00 PM to 11:59 PM | 2 (0.9%) | 0 (0.0%) |
| Total | 213 (100.0%) | 156 (100.0%) |
Housing Occupancy in Byrdstown
Occupancy by Ownership in Byrdstown
Of the total 465 dwellings in Byrdstown, owner-occupied units account for 274 (58.9%), while renter-occupied units make up 191 (41.1%).
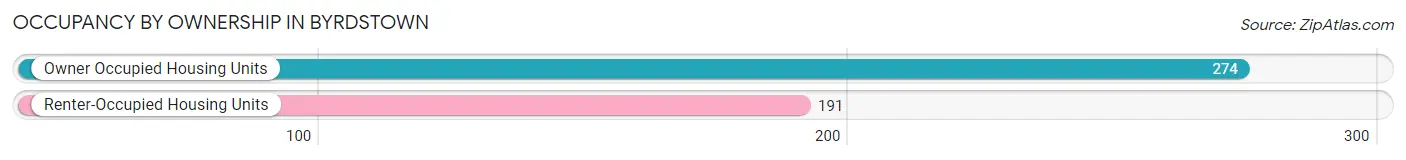
| Occupancy | # Housing Units | % Housing Units |
| Owner Occupied Housing Units | 274 | 58.9% |
| Renter-Occupied Housing Units | 191 | 41.1% |
| Total Occupied Housing Units | 465 | 100.0% |
Occupancy by Household Size in Byrdstown
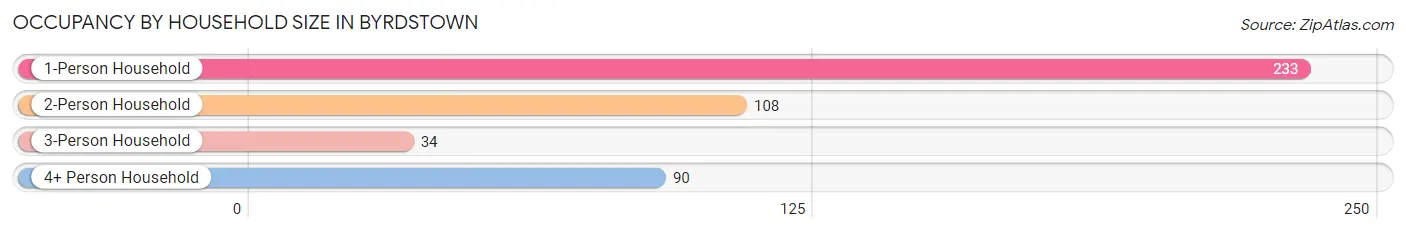
| Household Size | # Housing Units | % Housing Units |
| 1-Person Household | 233 | 50.1% |
| 2-Person Household | 108 | 23.2% |
| 3-Person Household | 34 | 7.3% |
| 4+ Person Household | 90 | 19.4% |
| Total Housing Units | 465 | 100.0% |
Occupancy by Ownership by Household Size in Byrdstown
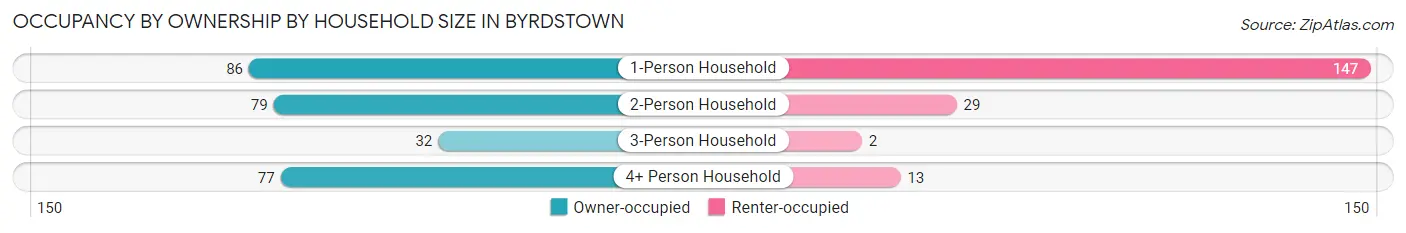
| Household Size | Owner-occupied | Renter-occupied |
| 1-Person Household | 86 (36.9%) | 147 (63.1%) |
| 2-Person Household | 79 (73.2%) | 29 (26.9%) |
| 3-Person Household | 32 (94.1%) | 2 (5.9%) |
| 4+ Person Household | 77 (85.6%) | 13 (14.4%) |
| Total Housing Units | 274 (58.9%) | 191 (41.1%) |
Occupancy by Educational Attainment in Byrdstown
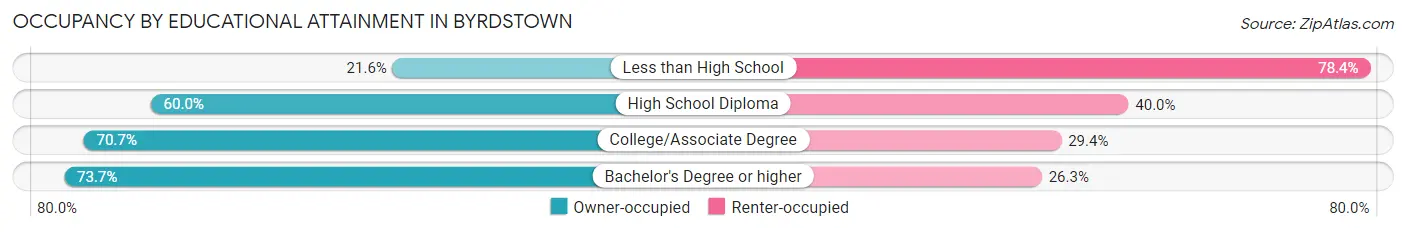
| Household Size | Owner-occupied | Renter-occupied |
| Less than High School | 16 (21.6%) | 58 (78.4%) |
| High School Diploma | 120 (60.0%) | 80 (40.0%) |
| College/Associate Degree | 65 (70.7%) | 27 (29.3%) |
| Bachelor's Degree or higher | 73 (73.7%) | 26 (26.3%) |
Occupancy by Age of Householder in Byrdstown
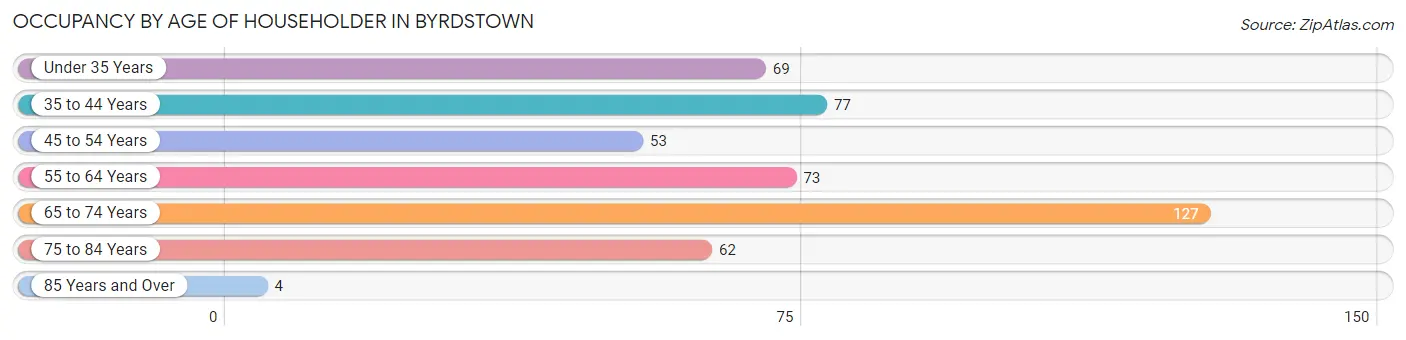
| Age Bracket | # Households | % Households |
| Under 35 Years | 69 | 14.8% |
| 35 to 44 Years | 77 | 16.6% |
| 45 to 54 Years | 53 | 11.4% |
| 55 to 64 Years | 73 | 15.7% |
| 65 to 74 Years | 127 | 27.3% |
| 75 to 84 Years | 62 | 13.3% |
| 85 Years and Over | 4 | 0.9% |
| Total | 465 | 100.0% |
Housing Finances in Byrdstown
Median Income by Occupancy in Byrdstown
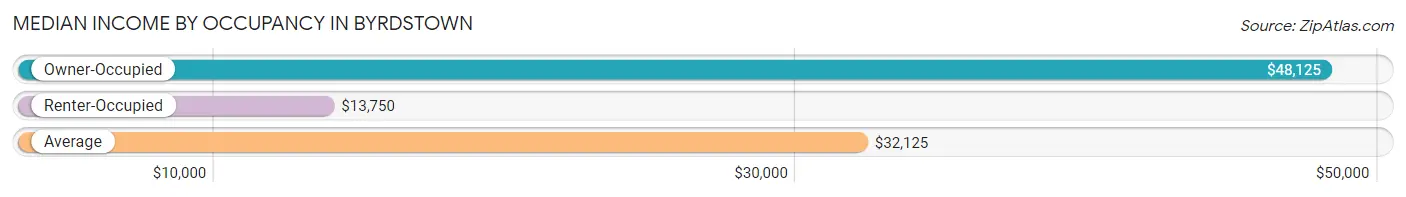
| Occupancy Type | # Households | Median Income |
| Owner-Occupied | 274 (58.9%) | $48,125 |
| Renter-Occupied | 191 (41.1%) | $13,750 |
| Average | 465 (100.0%) | $32,125 |
Occupancy by Householder Income Bracket in Byrdstown
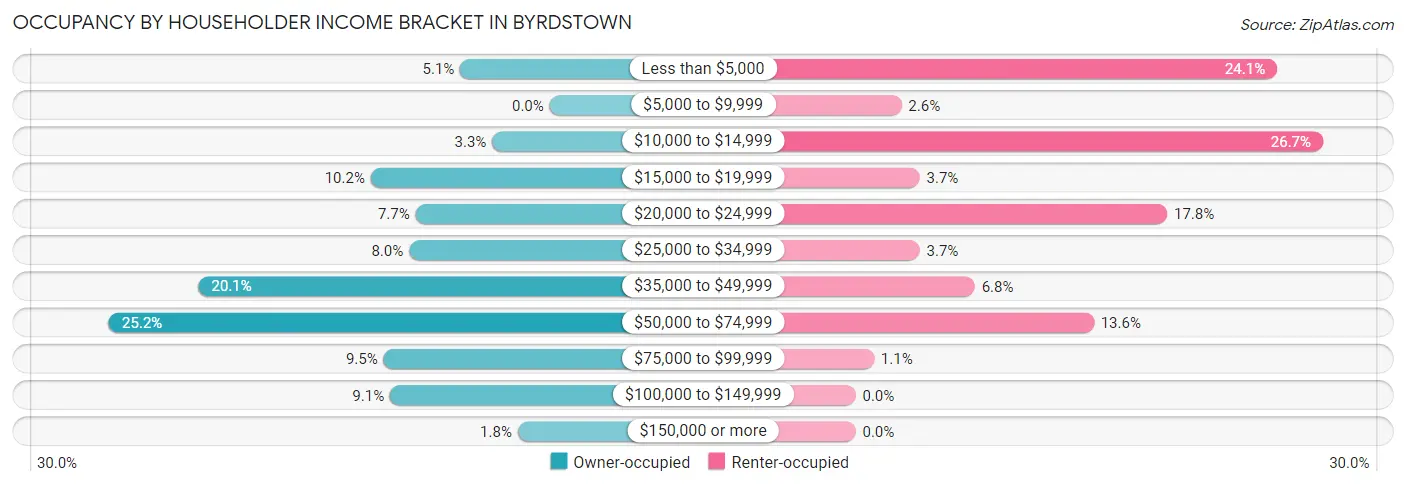
| Income Bracket | Owner-occupied | Renter-occupied |
| Less than $5,000 | 14 (5.1%) | 46 (24.1%) |
| $5,000 to $9,999 | 0 (0.0%) | 5 (2.6%) |
| $10,000 to $14,999 | 9 (3.3%) | 51 (26.7%) |
| $15,000 to $19,999 | 28 (10.2%) | 7 (3.7%) |
| $20,000 to $24,999 | 21 (7.7%) | 34 (17.8%) |
| $25,000 to $34,999 | 22 (8.0%) | 7 (3.7%) |
| $35,000 to $49,999 | 55 (20.1%) | 13 (6.8%) |
| $50,000 to $74,999 | 69 (25.2%) | 26 (13.6%) |
| $75,000 to $99,999 | 26 (9.5%) | 2 (1.1%) |
| $100,000 to $149,999 | 25 (9.1%) | 0 (0.0%) |
| $150,000 or more | 5 (1.8%) | 0 (0.0%) |
| Total | 274 (100.0%) | 191 (100.0%) |
Monthly Housing Cost Tiers in Byrdstown
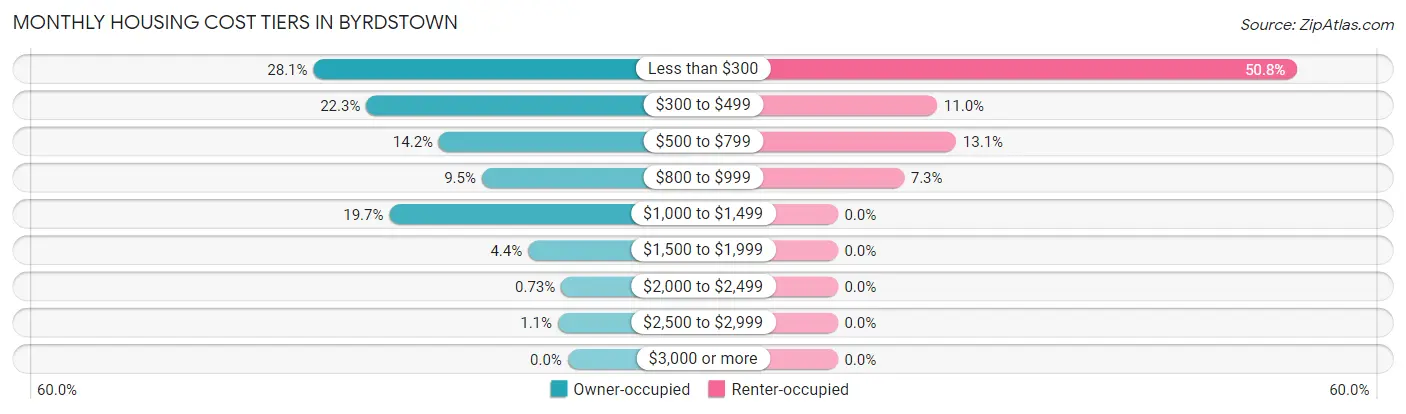
| Monthly Cost | Owner-occupied | Renter-occupied |
| Less than $300 | 77 (28.1%) | 97 (50.8%) |
| $300 to $499 | 61 (22.3%) | 21 (11.0%) |
| $500 to $799 | 39 (14.2%) | 25 (13.1%) |
| $800 to $999 | 26 (9.5%) | 14 (7.3%) |
| $1,000 to $1,499 | 54 (19.7%) | 0 (0.0%) |
| $1,500 to $1,999 | 12 (4.4%) | 0 (0.0%) |
| $2,000 to $2,499 | 2 (0.7%) | 0 (0.0%) |
| $2,500 to $2,999 | 3 (1.1%) | 0 (0.0%) |
| $3,000 or more | 0 (0.0%) | 0 (0.0%) |
| Total | 274 (100.0%) | 191 (100.0%) |
Physical Housing Characteristics in Byrdstown
Housing Structures in Byrdstown
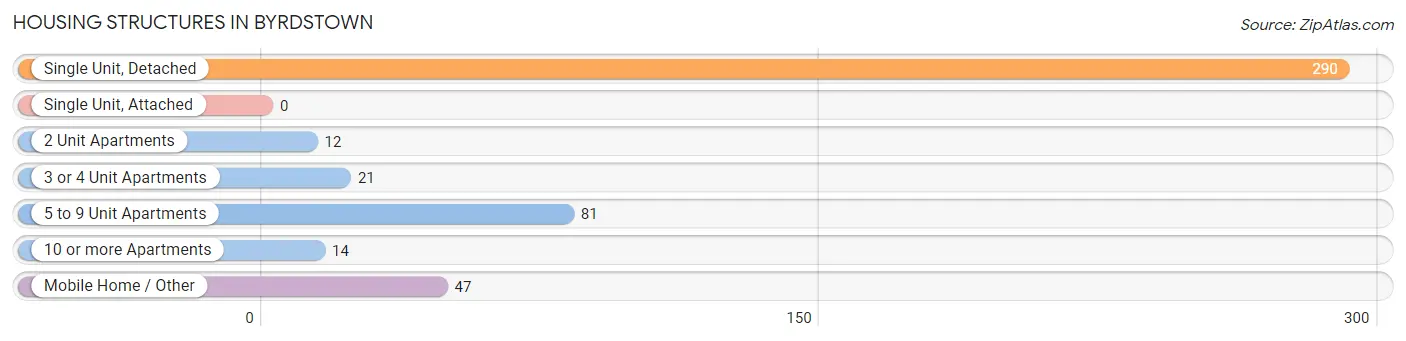
| Structure Type | # Housing Units | % Housing Units |
| Single Unit, Detached | 290 | 62.4% |
| Single Unit, Attached | 0 | 0.0% |
| 2 Unit Apartments | 12 | 2.6% |
| 3 or 4 Unit Apartments | 21 | 4.5% |
| 5 to 9 Unit Apartments | 81 | 17.4% |
| 10 or more Apartments | 14 | 3.0% |
| Mobile Home / Other | 47 | 10.1% |
| Total | 465 | 100.0% |
Housing Structures by Occupancy in Byrdstown
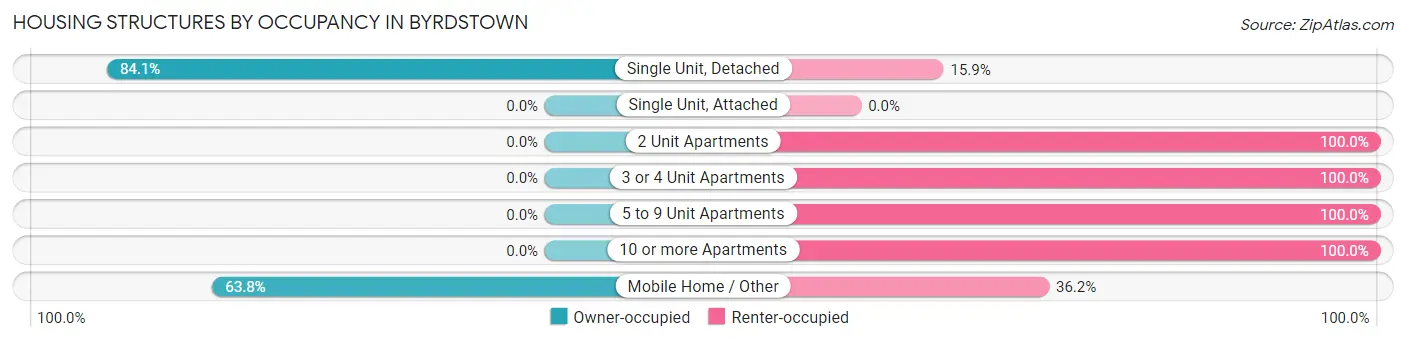
| Structure Type | Owner-occupied | Renter-occupied |
| Single Unit, Detached | 244 (84.1%) | 46 (15.9%) |
| Single Unit, Attached | 0 (0.0%) | 0 (0.0%) |
| 2 Unit Apartments | 0 (0.0%) | 12 (100.0%) |
| 3 or 4 Unit Apartments | 0 (0.0%) | 21 (100.0%) |
| 5 to 9 Unit Apartments | 0 (0.0%) | 81 (100.0%) |
| 10 or more Apartments | 0 (0.0%) | 14 (100.0%) |
| Mobile Home / Other | 30 (63.8%) | 17 (36.2%) |
| Total | 274 (58.9%) | 191 (41.1%) |
Housing Structures by Number of Rooms in Byrdstown
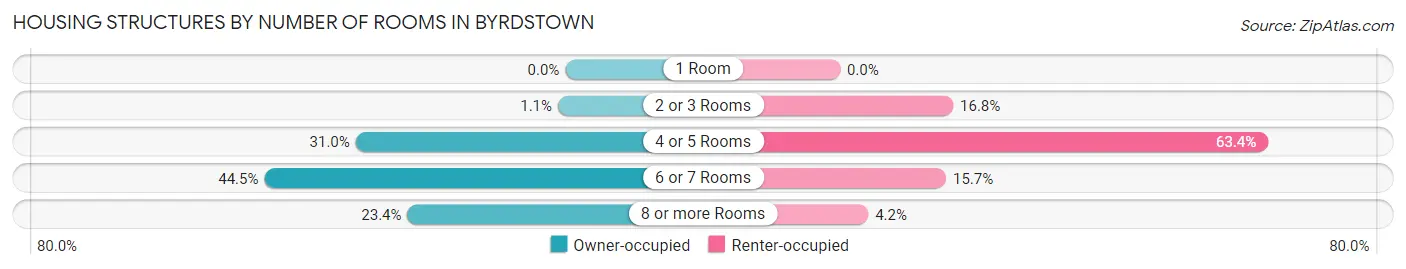
| Number of Rooms | Owner-occupied | Renter-occupied |
| 1 Room | 0 (0.0%) | 0 (0.0%) |
| 2 or 3 Rooms | 3 (1.1%) | 32 (16.8%) |
| 4 or 5 Rooms | 85 (31.0%) | 121 (63.3%) |
| 6 or 7 Rooms | 122 (44.5%) | 30 (15.7%) |
| 8 or more Rooms | 64 (23.4%) | 8 (4.2%) |
| Total | 274 (100.0%) | 191 (100.0%) |
Housing Structure by Heating Type in Byrdstown
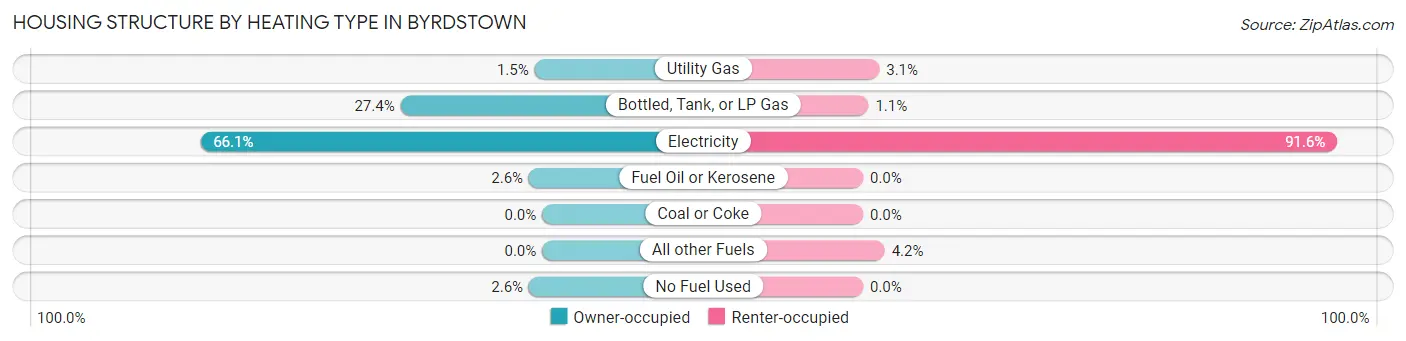
| Heating Type | Owner-occupied | Renter-occupied |
| Utility Gas | 4 (1.5%) | 6 (3.1%) |
| Bottled, Tank, or LP Gas | 75 (27.4%) | 2 (1.1%) |
| Electricity | 181 (66.1%) | 175 (91.6%) |
| Fuel Oil or Kerosene | 7 (2.5%) | 0 (0.0%) |
| Coal or Coke | 0 (0.0%) | 0 (0.0%) |
| All other Fuels | 0 (0.0%) | 8 (4.2%) |
| No Fuel Used | 7 (2.5%) | 0 (0.0%) |
| Total | 274 (100.0%) | 191 (100.0%) |
Household Vehicle Usage in Byrdstown
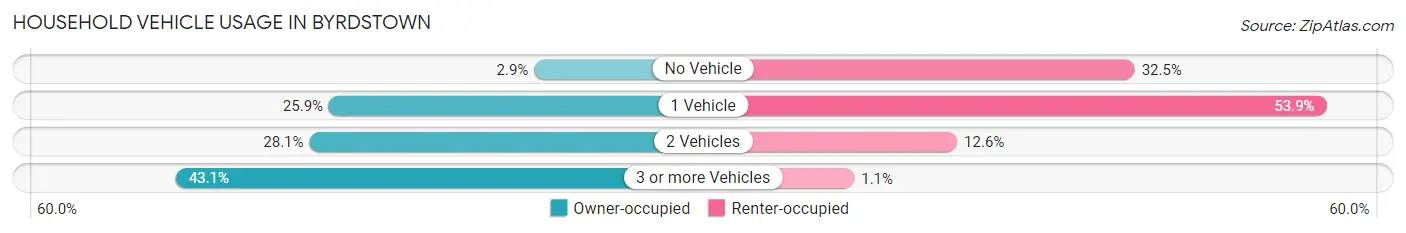
| Vehicles per Household | Owner-occupied | Renter-occupied |
| No Vehicle | 8 (2.9%) | 62 (32.5%) |
| 1 Vehicle | 71 (25.9%) | 103 (53.9%) |
| 2 Vehicles | 77 (28.1%) | 24 (12.6%) |
| 3 or more Vehicles | 118 (43.1%) | 2 (1.1%) |
| Total | 274 (100.0%) | 191 (100.0%) |
Real Estate & Mortgages in Byrdstown
Real Estate and Mortgage Overview in Byrdstown
| Characteristic | Without Mortgage | With Mortgage |
| Housing Units | 151 | 123 |
| Median Property Value | $123,400 | $118,500 |
| Median Household Income | $37,411 | $3 |
| Monthly Housing Costs | $297 | $0 |
| Real Estate Taxes | $611 | $3 |
Property Value by Mortgage Status in Byrdstown
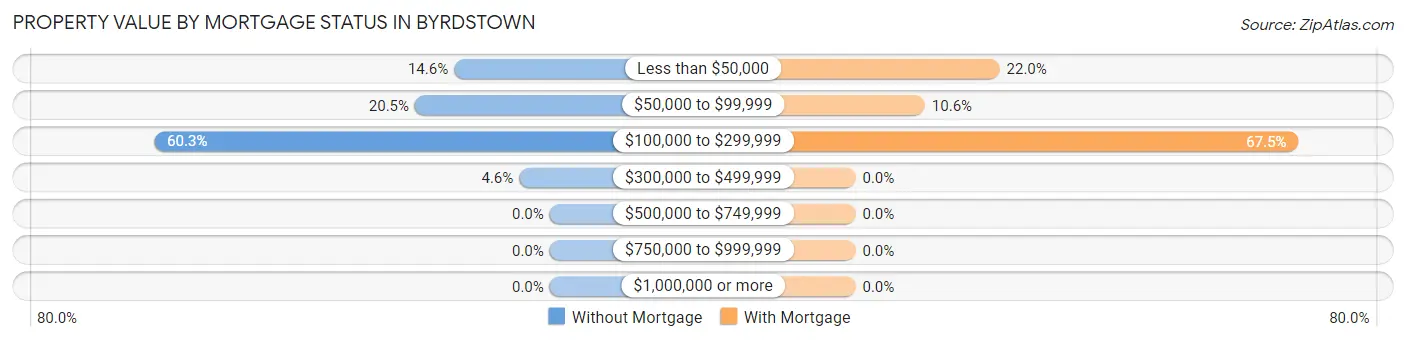
| Property Value | Without Mortgage | With Mortgage |
| Less than $50,000 | 22 (14.6%) | 27 (22.0%) |
| $50,000 to $99,999 | 31 (20.5%) | 13 (10.6%) |
| $100,000 to $299,999 | 91 (60.3%) | 83 (67.5%) |
| $300,000 to $499,999 | 7 (4.6%) | 0 (0.0%) |
| $500,000 to $749,999 | 0 (0.0%) | 0 (0.0%) |
| $750,000 to $999,999 | 0 (0.0%) | 0 (0.0%) |
| $1,000,000 or more | 0 (0.0%) | 0 (0.0%) |
| Total | 151 (100.0%) | 123 (100.0%) |
Household Income by Mortgage Status in Byrdstown
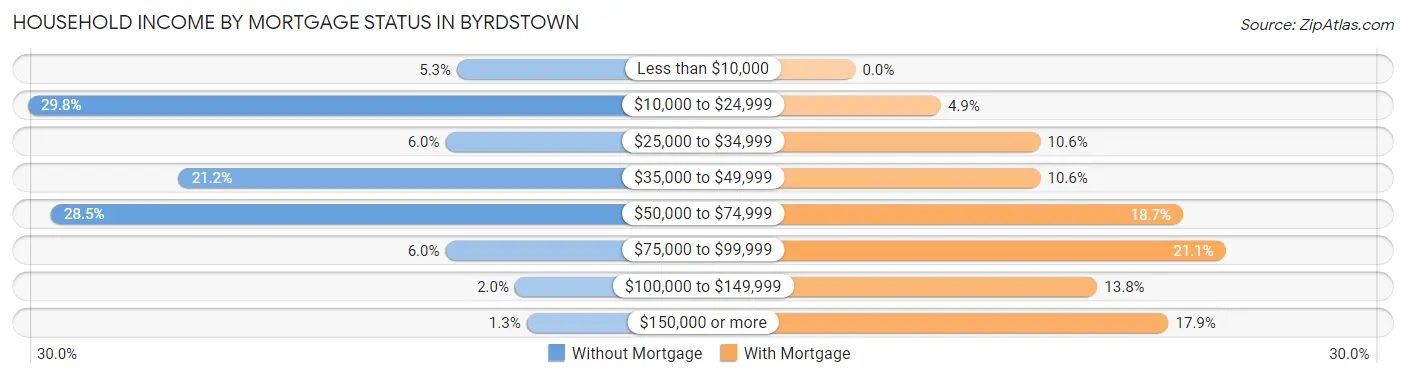
| Household Income | Without Mortgage | With Mortgage |
| Less than $10,000 | 8 (5.3%) | 0 (0.0%) |
| $10,000 to $24,999 | 45 (29.8%) | 6 (4.9%) |
| $25,000 to $34,999 | 9 (6.0%) | 13 (10.6%) |
| $35,000 to $49,999 | 32 (21.2%) | 13 (10.6%) |
| $50,000 to $74,999 | 43 (28.5%) | 23 (18.7%) |
| $75,000 to $99,999 | 9 (6.0%) | 26 (21.1%) |
| $100,000 to $149,999 | 3 (2.0%) | 17 (13.8%) |
| $150,000 or more | 2 (1.3%) | 22 (17.9%) |
| Total | 151 (100.0%) | 123 (100.0%) |
Property Value to Household Income Ratio in Byrdstown
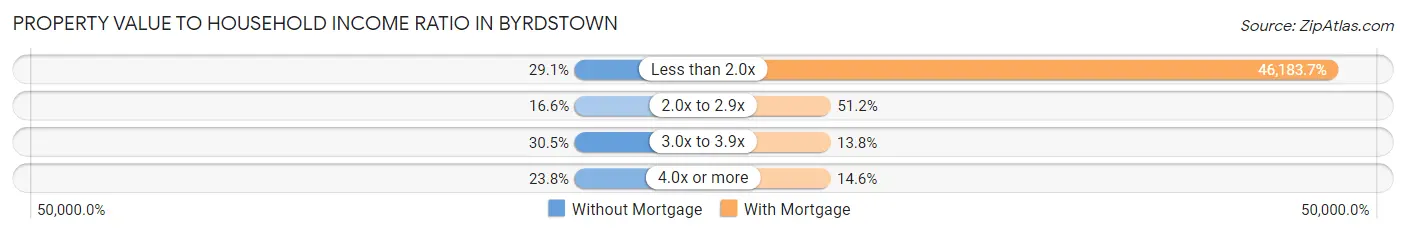
| Value-to-Income Ratio | Without Mortgage | With Mortgage |
| Less than 2.0x | 44 (29.1%) | 56,806 (46,183.7%) |
| 2.0x to 2.9x | 25 (16.6%) | 63 (51.2%) |
| 3.0x to 3.9x | 46 (30.5%) | 17 (13.8%) |
| 4.0x or more | 36 (23.8%) | 18 (14.6%) |
| Total | 151 (100.0%) | 123 (100.0%) |
Real Estate Taxes by Mortgage Status in Byrdstown
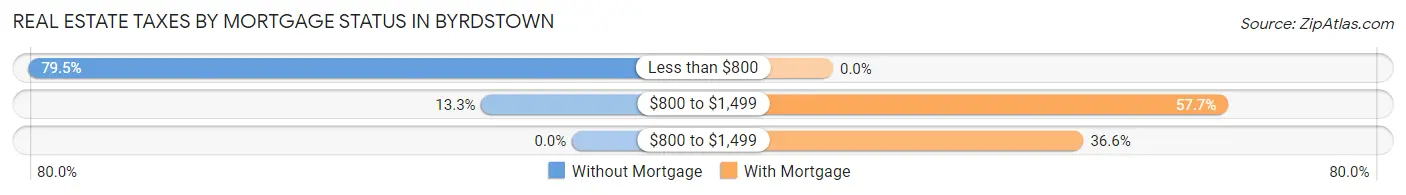
| Property Taxes | Without Mortgage | With Mortgage |
| Less than $800 | 120 (79.5%) | 0 (0.0%) |
| $800 to $1,499 | 20 (13.3%) | 71 (57.7%) |
| $800 to $1,499 | 0 (0.0%) | 45 (36.6%) |
| Total | 151 (100.0%) | 123 (100.0%) |
Health & Disability in Byrdstown
Health Insurance Coverage by Age in Byrdstown
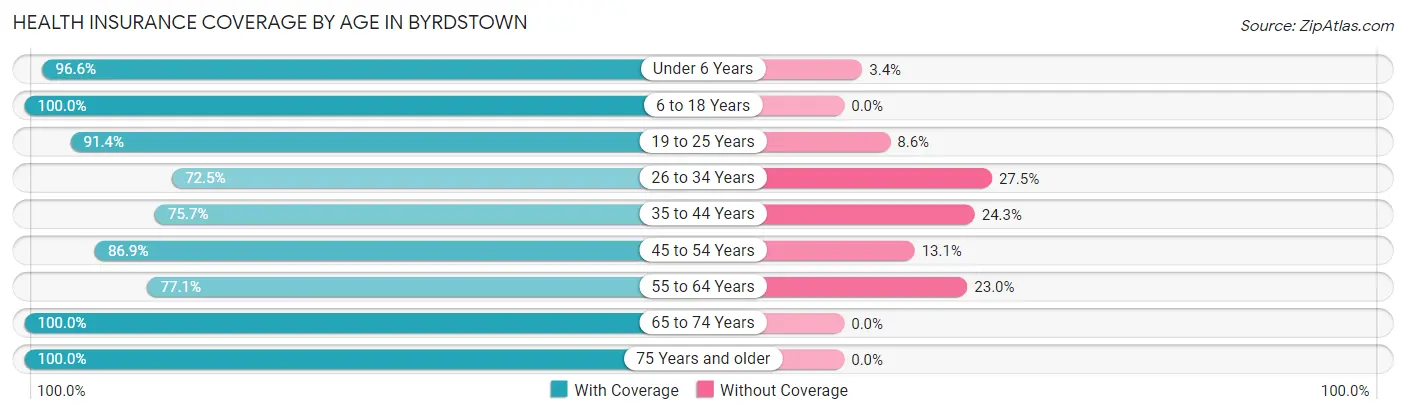
| Age Bracket | With Coverage | Without Coverage |
| Under 6 Years | 86 (96.6%) | 3 (3.4%) |
| 6 to 18 Years | 274 (100.0%) | 0 (0.0%) |
| 19 to 25 Years | 117 (91.4%) | 11 (8.6%) |
| 26 to 34 Years | 50 (72.5%) | 19 (27.5%) |
| 35 to 44 Years | 143 (75.7%) | 46 (24.3%) |
| 45 to 54 Years | 86 (86.9%) | 13 (13.1%) |
| 55 to 64 Years | 94 (77.0%) | 28 (23.0%) |
| 65 to 74 Years | 156 (100.0%) | 0 (0.0%) |
| 75 Years and older | 72 (100.0%) | 0 (0.0%) |
| Total | 1,078 (90.0%) | 120 (10.0%) |
Health Insurance Coverage by Citizenship Status in Byrdstown
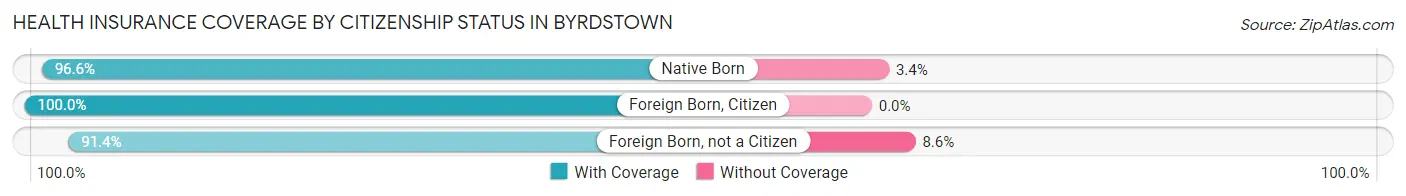
| Citizenship Status | With Coverage | Without Coverage |
| Native Born | 86 (96.6%) | 3 (3.4%) |
| Foreign Born, Citizen | 274 (100.0%) | 0 (0.0%) |
| Foreign Born, not a Citizen | 117 (91.4%) | 11 (8.6%) |
Health Insurance Coverage by Household Income in Byrdstown
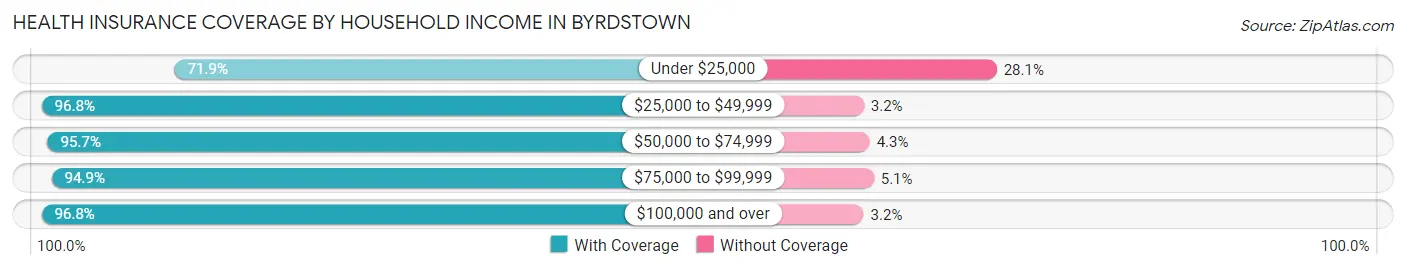
| Household Income | With Coverage | Without Coverage |
| Under $25,000 | 215 (71.9%) | 84 (28.1%) |
| $25,000 to $49,999 | 242 (96.8%) | 8 (3.2%) |
| $50,000 to $74,999 | 379 (95.7%) | 17 (4.3%) |
| $75,000 to $99,999 | 150 (94.9%) | 8 (5.1%) |
| $100,000 and over | 92 (96.8%) | 3 (3.2%) |
Public vs Private Health Insurance Coverage by Age in Byrdstown
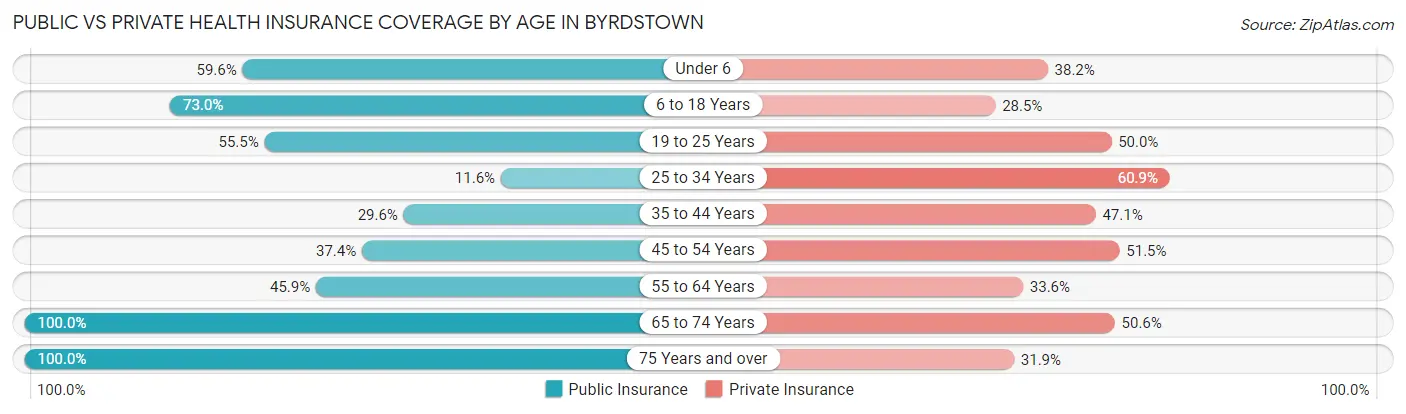
| Age Bracket | Public Insurance | Private Insurance |
| Under 6 | 53 (59.6%) | 34 (38.2%) |
| 6 to 18 Years | 200 (73.0%) | 78 (28.5%) |
| 19 to 25 Years | 71 (55.5%) | 64 (50.0%) |
| 25 to 34 Years | 8 (11.6%) | 42 (60.9%) |
| 35 to 44 Years | 56 (29.6%) | 89 (47.1%) |
| 45 to 54 Years | 37 (37.4%) | 51 (51.5%) |
| 55 to 64 Years | 56 (45.9%) | 41 (33.6%) |
| 65 to 74 Years | 156 (100.0%) | 79 (50.6%) |
| 75 Years and over | 72 (100.0%) | 23 (31.9%) |
| Total | 709 (59.2%) | 501 (41.8%) |
Disability Status by Sex by Age in Byrdstown
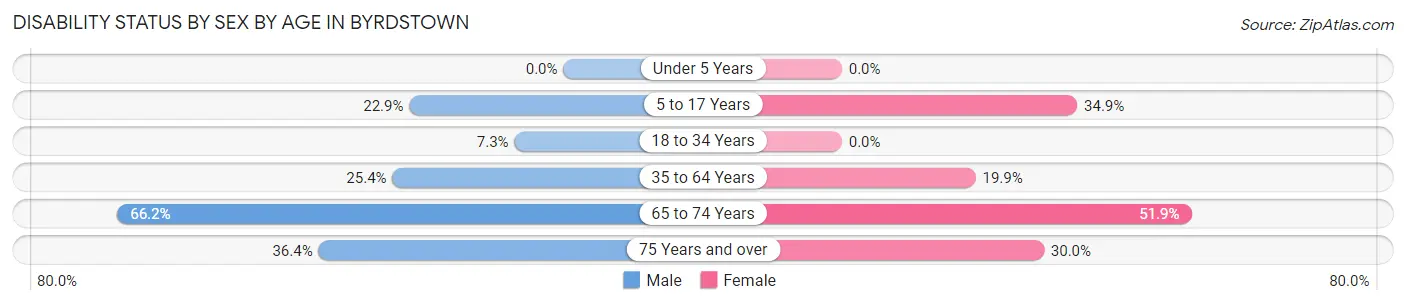
| Age Bracket | Male | Female |
| Under 5 Years | 0 (0.0%) | 0 (0.0%) |
| 5 to 17 Years | 27 (22.9%) | 58 (34.9%) |
| 18 to 34 Years | 8 (7.3%) | 0 (0.0%) |
| 35 to 64 Years | 67 (25.4%) | 29 (19.9%) |
| 65 to 74 Years | 51 (66.2%) | 41 (51.9%) |
| 75 Years and over | 8 (36.4%) | 15 (30.0%) |
Disability Class by Sex by Age in Byrdstown
Disability Class: Hearing Difficulty
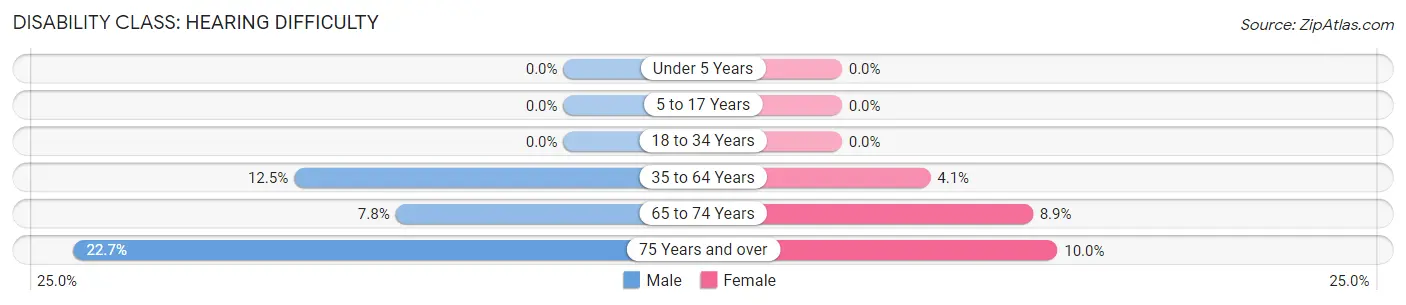
| Age Bracket | Male | Female |
| Under 5 Years | 0 (0.0%) | 0 (0.0%) |
| 5 to 17 Years | 0 (0.0%) | 0 (0.0%) |
| 18 to 34 Years | 0 (0.0%) | 0 (0.0%) |
| 35 to 64 Years | 33 (12.5%) | 6 (4.1%) |
| 65 to 74 Years | 6 (7.8%) | 7 (8.9%) |
| 75 Years and over | 5 (22.7%) | 5 (10.0%) |
Disability Class: Vision Difficulty
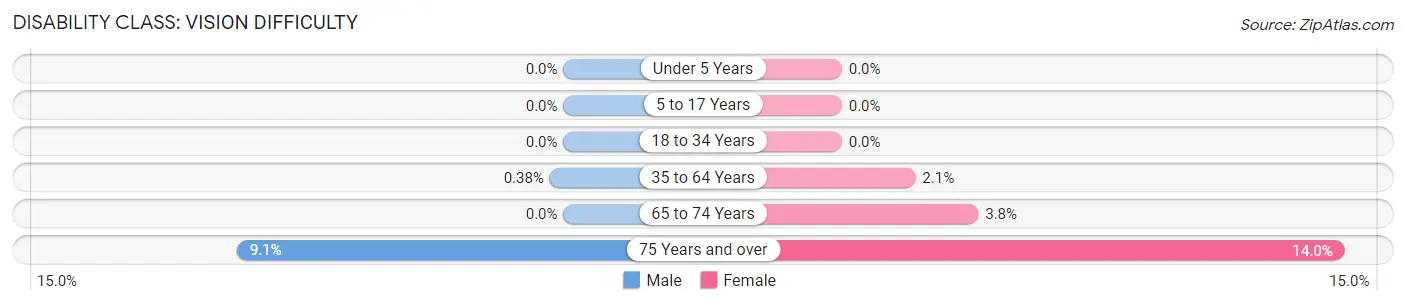
| Age Bracket | Male | Female |
| Under 5 Years | 0 (0.0%) | 0 (0.0%) |
| 5 to 17 Years | 0 (0.0%) | 0 (0.0%) |
| 18 to 34 Years | 0 (0.0%) | 0 (0.0%) |
| 35 to 64 Years | 1 (0.4%) | 3 (2.1%) |
| 65 to 74 Years | 0 (0.0%) | 3 (3.8%) |
| 75 Years and over | 2 (9.1%) | 7 (14.0%) |
Disability Class: Cognitive Difficulty
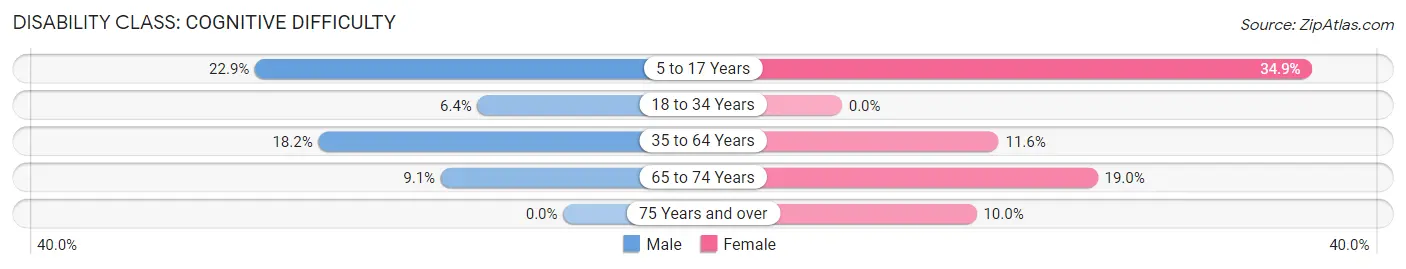
| Age Bracket | Male | Female |
| 5 to 17 Years | 27 (22.9%) | 58 (34.9%) |
| 18 to 34 Years | 7 (6.4%) | 0 (0.0%) |
| 35 to 64 Years | 48 (18.2%) | 17 (11.6%) |
| 65 to 74 Years | 7 (9.1%) | 15 (19.0%) |
| 75 Years and over | 0 (0.0%) | 5 (10.0%) |
Disability Class: Ambulatory Difficulty
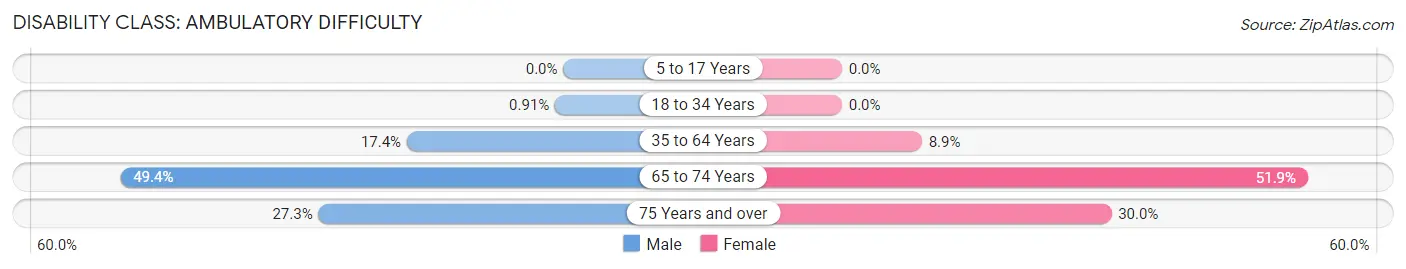
| Age Bracket | Male | Female |
| 5 to 17 Years | 0 (0.0%) | 0 (0.0%) |
| 18 to 34 Years | 1 (0.9%) | 0 (0.0%) |
| 35 to 64 Years | 46 (17.4%) | 13 (8.9%) |
| 65 to 74 Years | 38 (49.3%) | 41 (51.9%) |
| 75 Years and over | 6 (27.3%) | 15 (30.0%) |
Disability Class: Self-Care Difficulty
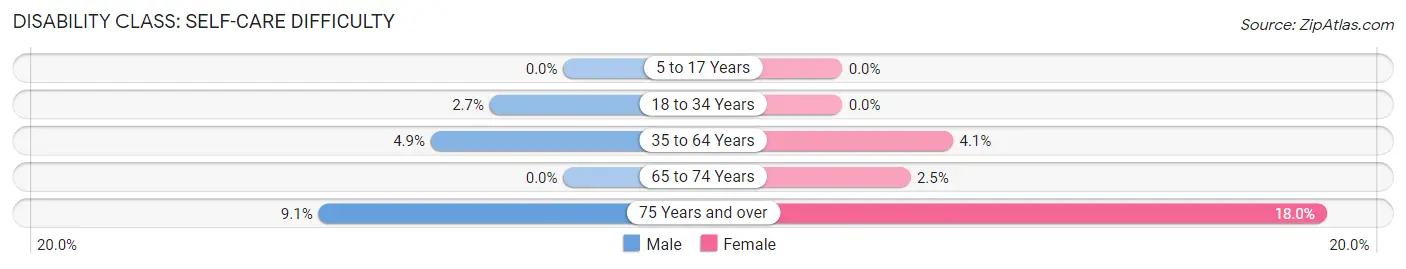
| Age Bracket | Male | Female |
| 5 to 17 Years | 0 (0.0%) | 0 (0.0%) |
| 18 to 34 Years | 3 (2.7%) | 0 (0.0%) |
| 35 to 64 Years | 13 (4.9%) | 6 (4.1%) |
| 65 to 74 Years | 0 (0.0%) | 2 (2.5%) |
| 75 Years and over | 2 (9.1%) | 9 (18.0%) |
Technology Access in Byrdstown
Computing Device Access in Byrdstown
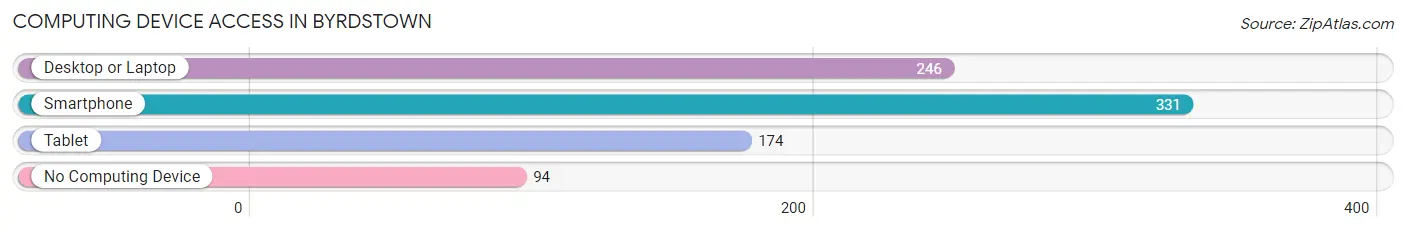
| Device Type | # Households | % Households |
| Desktop or Laptop | 246 | 52.9% |
| Smartphone | 331 | 71.2% |
| Tablet | 174 | 37.4% |
| No Computing Device | 94 | 20.2% |
| Total | 465 | 100.0% |
Internet Access in Byrdstown
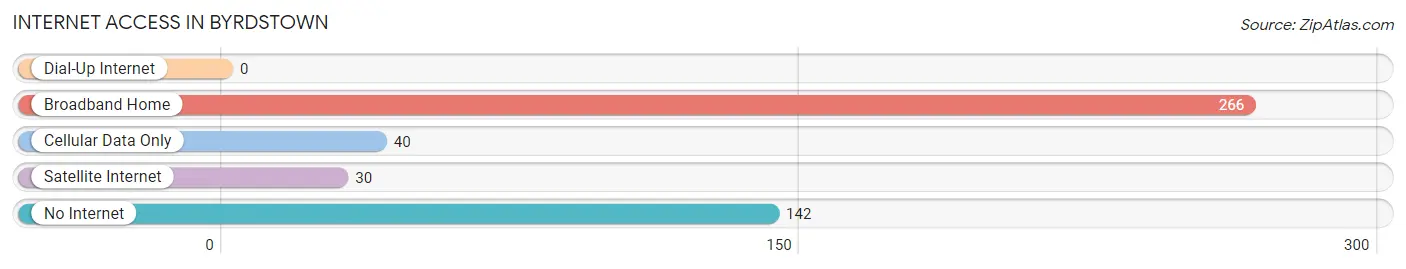
| Internet Type | # Households | % Households |
| Dial-Up Internet | 0 | 0.0% |
| Broadband Home | 266 | 57.2% |
| Cellular Data Only | 40 | 8.6% |
| Satellite Internet | 30 | 6.5% |
| No Internet | 142 | 30.5% |
| Total | 465 | 100.0% |
Byrdstown Summary
Byrdstown is a small town located in Pickett County, Tennessee. It is situated in the foothills of the Cumberland Plateau, and is surrounded by the beautiful scenery of the Big South Fork National River and Recreation Area. The town has a population of approximately 1,000 people, and is the county seat of Pickett County.
History
Byrdstown was founded in 1820 by William Byrd, a Revolutionary War veteran. He named the town after himself, and it was incorporated in 1872. The town was originally a farming community, and the main crops were corn, wheat, and tobacco. In the late 1800s, the town began to grow as a logging and timber town. The timber industry was a major source of income for the town, and it was the main employer for many years.
In the early 1900s, the town began to diversify its economy. The first bank was established in 1910, and the first newspaper was published in 1912. The town also had a number of small businesses, including a general store, a blacksmith shop, and a sawmill.
Geography
Byrdstown is located in the foothills of the Cumberland Plateau, and is surrounded by the Big South Fork National River and Recreation Area. The town is situated on the banks of the Obey River, and is approximately 30 miles from the Kentucky border. The town is located in a rural area, and is surrounded by rolling hills and forests.
Economy
Byrdstown’s economy is largely based on tourism and agriculture. The town is home to a number of tourist attractions, including the Big South Fork National River and Recreation Area, the Obey River, and the Pickett State Park. The town also has a number of small businesses, including restaurants, shops, and a grocery store.
Agriculture is also an important part of the local economy. The main crops grown in the area are corn, wheat, and tobacco. The town also has a number of livestock farms, and is home to a number of dairy farms.
Demographics
As of the 2010 census, the population of Byrdstown was 1,000 people. The racial makeup of the town was 97.2% White, 0.7% African American, 0.2% Native American, 0.2% Asian, 0.2% from other races, and 1.7% from two or more races. The median household income was $30,000, and the median family income was $35,000.
Conclusion
Byrdstown is a small town located in Pickett County, Tennessee. It is situated in the foothills of the Cumberland Plateau, and is surrounded by the beautiful scenery of the Big South Fork National River and Recreation Area. The town has a population of approximately 1,000 people, and is the county seat of Pickett County. The town’s economy is largely based on tourism and agriculture, and it is home to a number of tourist attractions and small businesses. The racial makeup of the town is predominantly White, and the median household income is $30,000.
Common Questions
What is Per Capita Income in Byrdstown?
Per Capita income in Byrdstown is $17,861.
What is the Median Family Income in Byrdstown?
Median Family Income in Byrdstown is $56,944.
What is the Median Household income in Byrdstown?
Median Household Income in Byrdstown is $32,125.
What is Income or Wage Gap in Byrdstown?
Income or Wage Gap in Byrdstown is 35.6%.
Women in Byrdstown earn 64.4 cents for every dollar earned by a man.
What is Inequality or Gini Index in Byrdstown?
Inequality or Gini Index in Byrdstown is 0.47.
What is the Total Population of Byrdstown?
Total Population of Byrdstown is 1,275.
What is the Total Male Population of Byrdstown?
Total Male Population of Byrdstown is 695.
What is the Total Female Population of Byrdstown?
Total Female Population of Byrdstown is 580.
What is the Ratio of Males per 100 Females in Byrdstown?
There are 119.83 Males per 100 Females in Byrdstown.
What is the Ratio of Females per 100 Males in Byrdstown?
There are 83.45 Females per 100 Males in Byrdstown.
What is the Median Population Age in Byrdstown?
Median Population Age in Byrdstown is 39.4 Years.
What is the Average Family Size in Byrdstown
Average Family Size in Byrdstown is 4.2 People.
What is the Average Household Size in Byrdstown
Average Household Size in Byrdstown is 2.6 People.
How Large is the Labor Force in Byrdstown?
There are 396 People in the Labor Forcein in Byrdstown.
What is the Percentage of People in the Labor Force in Byrdstown?
42.2% of People are in the Labor Force in Byrdstown.
What is the Unemployment Rate in Byrdstown?
Unemployment Rate in Byrdstown is 4.3%.