Burns, TN Map & Demographics
Burns Map
Burns Overview
$32,590
PER CAPITA INCOME
$74,125
AVG FAMILY INCOME
$61,250
AVG HOUSEHOLD INCOME
22.4%
WAGE / INCOME GAP [ % ]
77.6¢/ $1
WAGE / INCOME GAP [ $ ]
0.42
INEQUALITY / GINI INDEX
1,702
TOTAL POPULATION
828
MALE POPULATION
874
FEMALE POPULATION
94.74
MALES / 100 FEMALES
105.56
FEMALES / 100 MALES
41.8
MEDIAN AGE
3.0
AVG FAMILY SIZE
2.5
AVG HOUSEHOLD SIZE
923
LABOR FORCE [ PEOPLE ]
66.5%
PERCENT IN LABOR FORCE
2.1%
UNEMPLOYMENT RATE
Burns Zip Codes
Burns Area Codes
Income in Burns
Income Overview in Burns
Per Capita Income in Burns is $32,590, while median incomes of families and households are $74,125 and $61,250 respectively.
| Characteristic | Number | Measure |
| Per Capita Income | 1,702 | $32,590 |
| Median Family Income | 448 | $74,125 |
| Mean Family Income | 448 | $96,410 |
| Median Household Income | 677 | $61,250 |
| Mean Household Income | 677 | $78,371 |
| Income Deficit | 448 | $0 |
| Wage / Income Gap (%) | 1,702 | 22.40% |
| Wage / Income Gap ($) | 1,702 | 77.60¢ per $1 |
| Gini / Inequality Index | 1,702 | 0.42 |
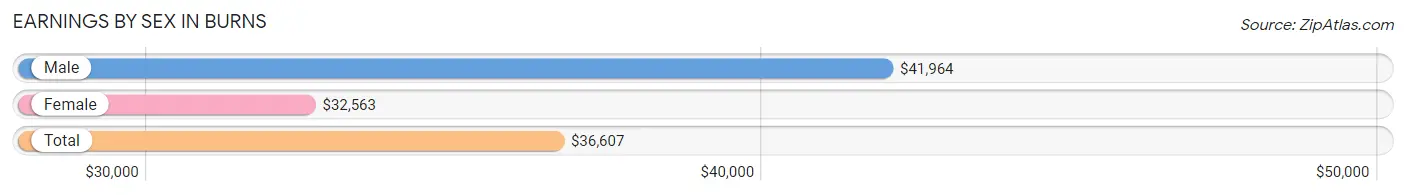
Earnings by Sex in Burns
Average Earnings in Burns are $36,607, $41,964 for men and $32,563 for women, a difference of 22.4%.
| Sex | Number | Average Earnings |
| Male | 515 (53.4%) | $41,964 |
| Female | 449 (46.6%) | $32,563 |
| Total | 964 (100.0%) | $36,607 |
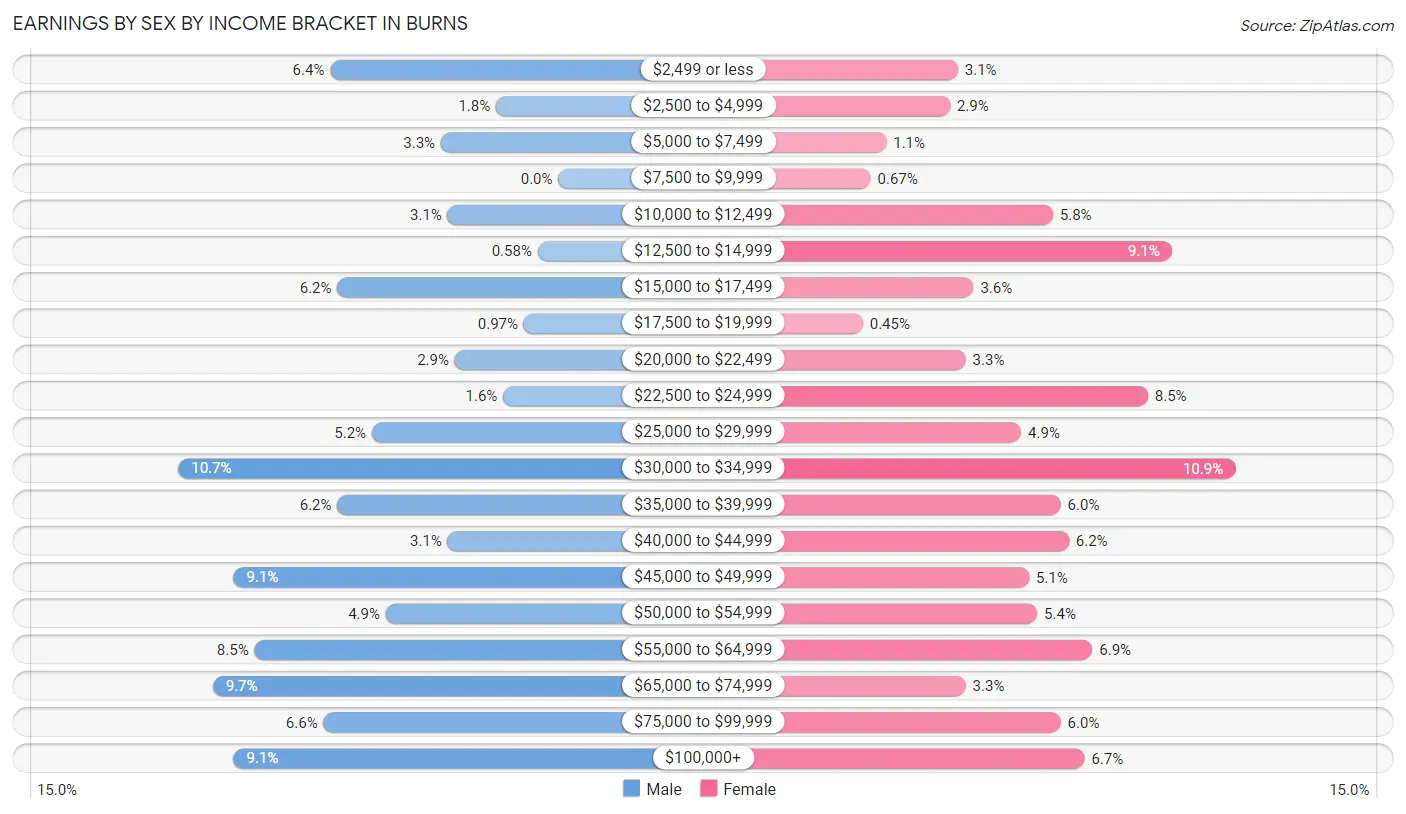
Earnings by Sex by Income Bracket in Burns
The most common earnings brackets in Burns are $30,000 to $34,999 for men (55 | 10.7%) and $30,000 to $34,999 for women (49 | 10.9%).
| Income | Male | Female |
| $2,499 or less | 33 (6.4%) | 14 (3.1%) |
| $2,500 to $4,999 | 9 (1.8%) | 13 (2.9%) |
| $5,000 to $7,499 | 17 (3.3%) | 5 (1.1%) |
| $7,500 to $9,999 | 0 (0.0%) | 3 (0.7%) |
| $10,000 to $12,499 | 16 (3.1%) | 26 (5.8%) |
| $12,500 to $14,999 | 3 (0.6%) | 41 (9.1%) |
| $15,000 to $17,499 | 32 (6.2%) | 16 (3.6%) |
| $17,500 to $19,999 | 5 (1.0%) | 2 (0.4%) |
| $20,000 to $22,499 | 15 (2.9%) | 15 (3.3%) |
| $22,500 to $24,999 | 8 (1.5%) | 38 (8.5%) |
| $25,000 to $29,999 | 27 (5.2%) | 22 (4.9%) |
| $30,000 to $34,999 | 55 (10.7%) | 49 (10.9%) |
| $35,000 to $39,999 | 32 (6.2%) | 27 (6.0%) |
| $40,000 to $44,999 | 16 (3.1%) | 28 (6.2%) |
| $45,000 to $49,999 | 47 (9.1%) | 23 (5.1%) |
| $50,000 to $54,999 | 25 (4.9%) | 24 (5.3%) |
| $55,000 to $64,999 | 44 (8.5%) | 31 (6.9%) |
| $65,000 to $74,999 | 50 (9.7%) | 15 (3.3%) |
| $75,000 to $99,999 | 34 (6.6%) | 27 (6.0%) |
| $100,000+ | 47 (9.1%) | 30 (6.7%) |
| Total | 515 (100.0%) | 449 (100.0%) |
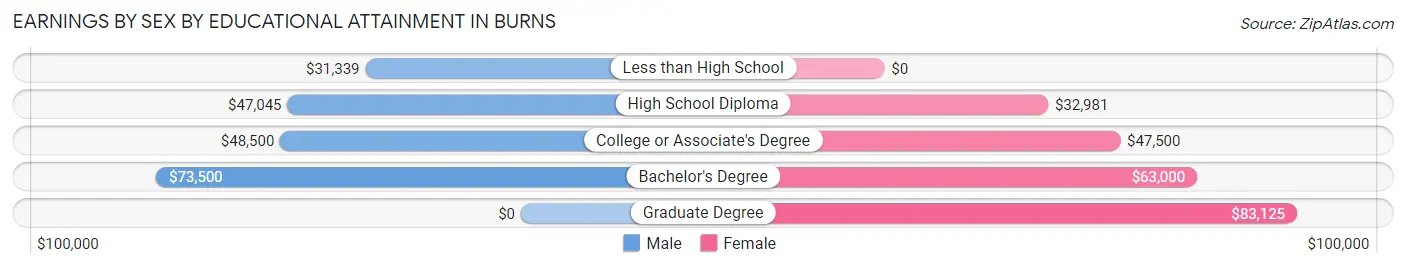
Earnings by Sex by Educational Attainment in Burns
Average earnings in Burns are $47,159 for men and $40,417 for women, a difference of 14.3%. Men with an educational attainment of bachelor's degree enjoy the highest average annual earnings of $73,500, while those with less than high school education earn the least with $31,339. Women with an educational attainment of graduate degree earn the most with the average annual earnings of $83,125, while those with high school diploma education have the smallest earnings of $32,981.
| Educational Attainment | Male Income | Female Income |
| Less than High School | $31,339 | $0 |
| High School Diploma | $47,045 | $32,981 |
| College or Associate's Degree | $48,500 | $47,500 |
| Bachelor's Degree | $73,500 | $63,000 |
| Graduate Degree | - | - |
| Total | $47,159 | $40,417 |
Family Income in Burns
Family Income Brackets in Burns
According to the Burns family income data, there are 137 families falling into the $50,000 to $74,999 income range, which is the most common income bracket and makes up 30.6% of all families. Conversely, the less than $10,000 income bracket is the least frequent group with only 9 families (2.0%) belonging to this category.
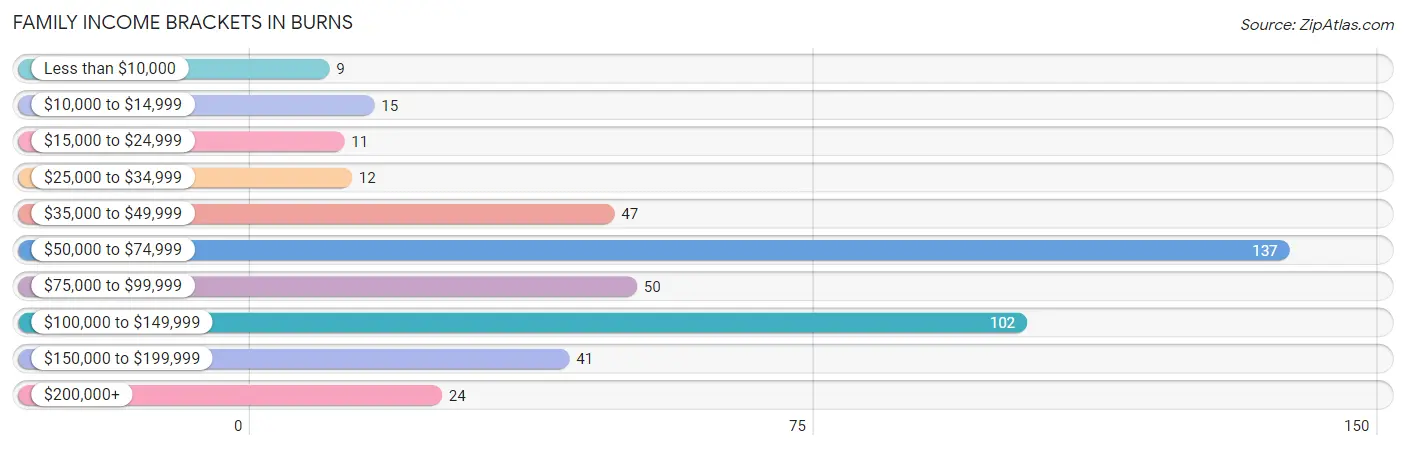
| Income Bracket | # Families | % Families |
| Less than $10,000 | 9 | 2.0% |
| $10,000 to $14,999 | 15 | 3.3% |
| $15,000 to $24,999 | 11 | 2.5% |
| $25,000 to $34,999 | 12 | 2.7% |
| $35,000 to $49,999 | 47 | 10.5% |
| $50,000 to $74,999 | 137 | 30.6% |
| $75,000 to $99,999 | 50 | 11.2% |
| $100,000 to $149,999 | 102 | 22.8% |
| $150,000 to $199,999 | 41 | 9.2% |
| $200,000+ | 24 | 5.4% |
Family Income by Famaliy Size in Burns
4-person families (47 | 10.5%) account for the highest median family income in Burns with $147,813 per family, while 3-person families (109 | 24.3%) have the highest median income of $38,869 per family member.
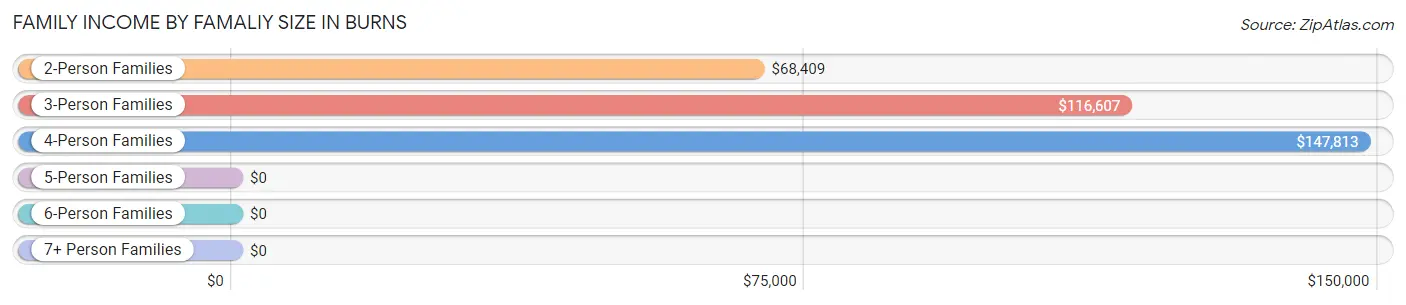
| Income Bracket | # Families | Median Income |
| 2-Person Families | 266 (59.4%) | $68,409 |
| 3-Person Families | 109 (24.3%) | $116,607 |
| 4-Person Families | 47 (10.5%) | $147,813 |
| 5-Person Families | 23 (5.1%) | $0 |
| 6-Person Families | 3 (0.7%) | $0 |
| 7+ Person Families | 0 (0.0%) | $0 |
| Total | 448 (100.0%) | $74,125 |
Family Income by Number of Earners in Burns
The median family income in Burns is $74,125, with families comprising 3+ earners (43) having the highest median family income of $138,750, while families with no earners (64) have the lowest median family income of $37,500, accounting for 9.6% and 14.3% of families, respectively.
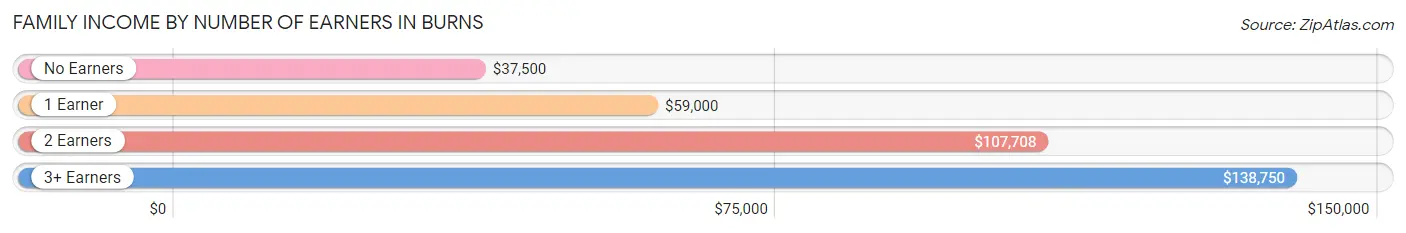
| Number of Earners | # Families | Median Income |
| No Earners | 64 (14.3%) | $37,500 |
| 1 Earner | 152 (33.9%) | $59,000 |
| 2 Earners | 189 (42.2%) | $107,708 |
| 3+ Earners | 43 (9.6%) | $138,750 |
| Total | 448 (100.0%) | $74,125 |
Household Income in Burns
Household Income Brackets in Burns
With 173 households falling in the category, the $50,000 to $74,999 income range is the most frequent in Burns, accounting for 25.6% of all households. In contrast, only 16 households (2.4%) fall into the $10,000 to $14,999 income bracket, making it the least populous group.
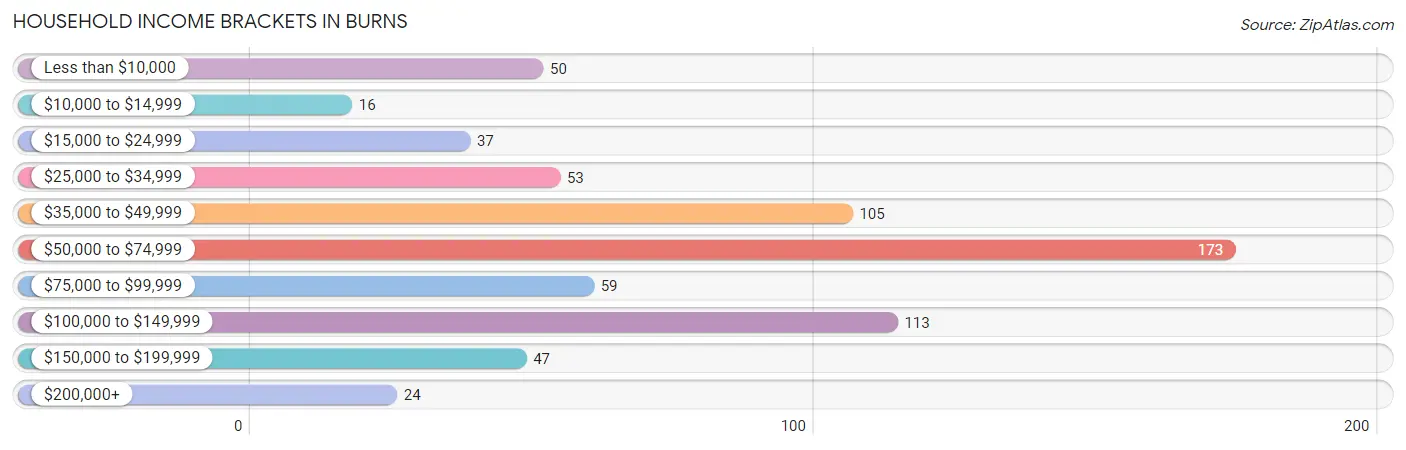
| Income Bracket | # Households | % Households |
| Less than $10,000 | 50 | 7.4% |
| $10,000 to $14,999 | 16 | 2.4% |
| $15,000 to $24,999 | 37 | 5.5% |
| $25,000 to $34,999 | 53 | 7.8% |
| $35,000 to $49,999 | 105 | 15.5% |
| $50,000 to $74,999 | 173 | 25.6% |
| $75,000 to $99,999 | 59 | 8.7% |
| $100,000 to $149,999 | 113 | 16.7% |
| $150,000 to $199,999 | 47 | 6.9% |
| $200,000+ | 24 | 3.5% |
Household Income by Householder Age in Burns
The median household income in Burns is $61,250, with the highest median household income of $77,885 found in the 45 to 64 years age bracket for the primary householder. A total of 246 households (36.3%) fall into this category. Meanwhile, the 65+ years age bracket for the primary householder has the lowest median household income of $43,958, with 192 households (28.4%) in this group.
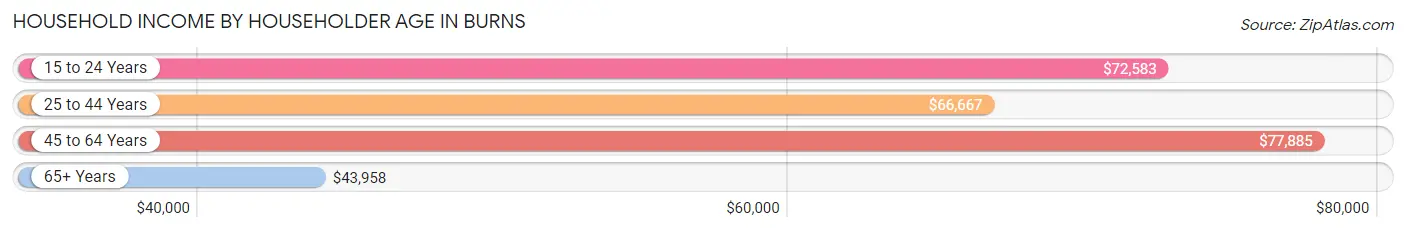
| Income Bracket | # Households | Median Income |
| 15 to 24 Years | 29 (4.3%) | $72,583 |
| 25 to 44 Years | 210 (31.0%) | $66,667 |
| 45 to 64 Years | 246 (36.3%) | $77,885 |
| 65+ Years | 192 (28.4%) | $43,958 |
| Total | 677 (100.0%) | $61,250 |
Poverty in Burns
Income Below Poverty by Sex and Age in Burns
With 9.2% poverty level for males and 12.1% for females among the residents of Burns, 5 year old males and 25 to 34 year old females are the most vulnerable to poverty, with 6 males (50.0%) and 25 females (27.2%) in their respective age groups living below the poverty level.
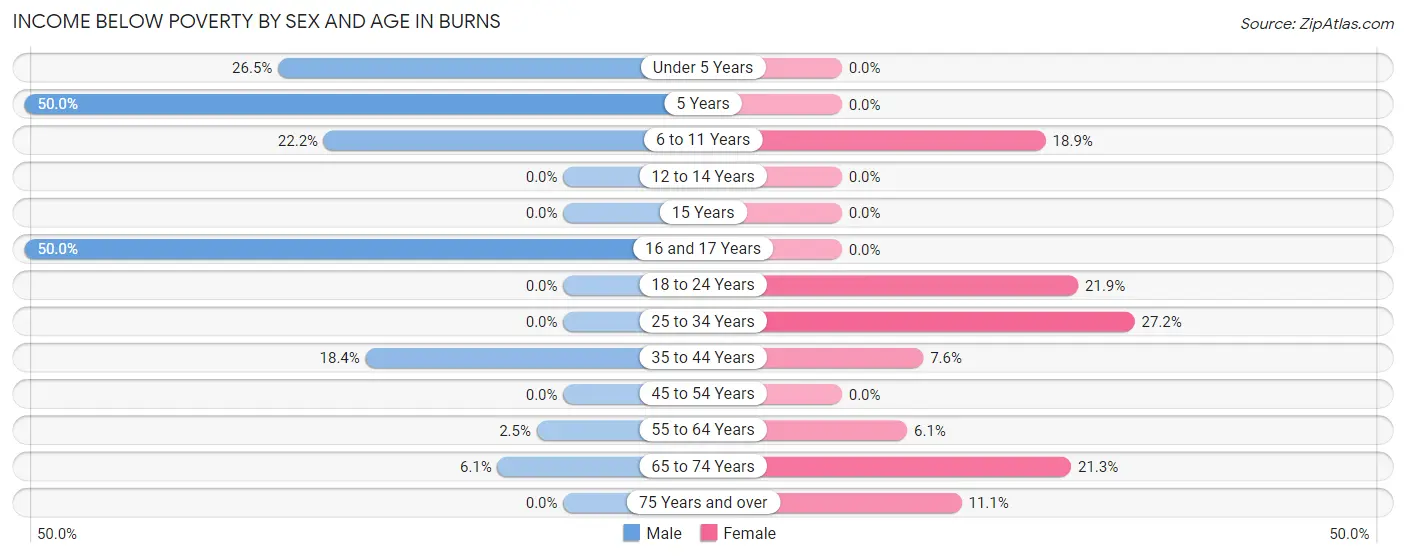
| Age Bracket | Male | Female |
| Under 5 Years | 18 (26.5%) | 0 (0.0%) |
| 5 Years | 6 (50.0%) | 0 (0.0%) |
| 6 to 11 Years | 12 (22.2%) | 7 (18.9%) |
| 12 to 14 Years | 0 (0.0%) | 0 (0.0%) |
| 15 Years | 0 (0.0%) | 0 (0.0%) |
| 16 and 17 Years | 3 (50.0%) | 0 (0.0%) |
| 18 to 24 Years | 0 (0.0%) | 25 (21.9%) |
| 25 to 34 Years | 0 (0.0%) | 25 (27.2%) |
| 35 to 44 Years | 29 (18.3%) | 9 (7.6%) |
| 45 to 54 Years | 0 (0.0%) | 0 (0.0%) |
| 55 to 64 Years | 3 (2.5%) | 6 (6.1%) |
| 65 to 74 Years | 5 (6.1%) | 30 (21.3%) |
| 75 Years and over | 0 (0.0%) | 4 (11.1%) |
| Total | 76 (9.2%) | 106 (12.1%) |
Income Above Poverty by Sex and Age in Burns
According to the poverty statistics in Burns, males aged 12 to 14 years and females aged under 5 years are the age groups that are most secure financially, with 100.0% of males and 100.0% of females in these age groups living above the poverty line.
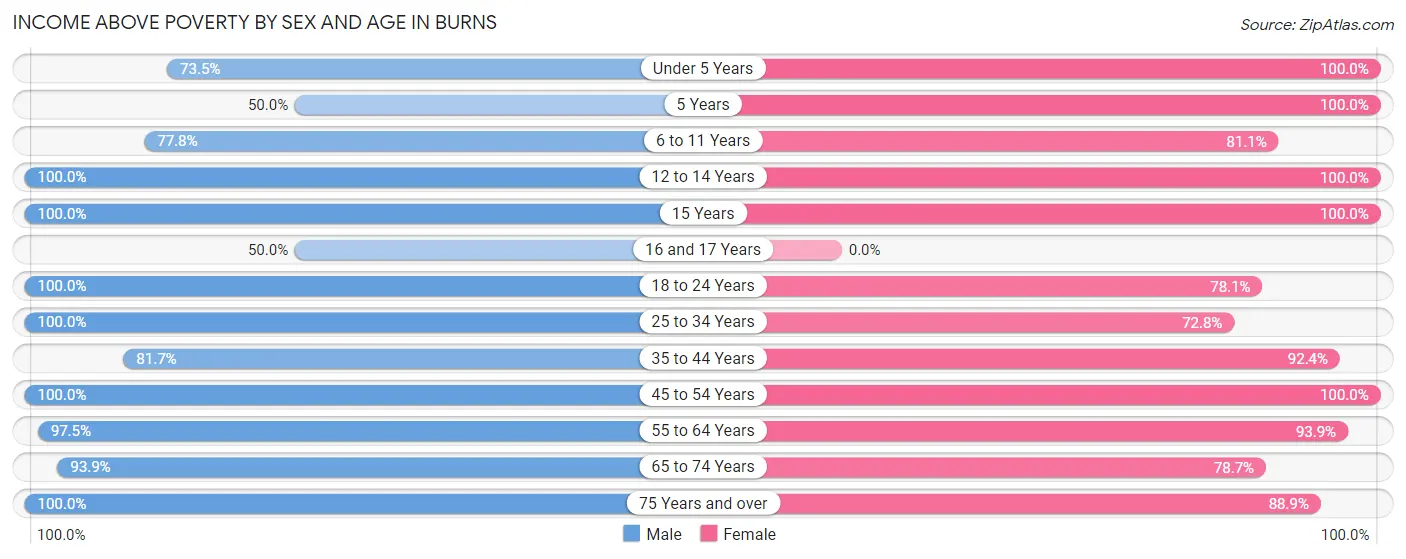
| Age Bracket | Male | Female |
| Under 5 Years | 50 (73.5%) | 87 (100.0%) |
| 5 Years | 6 (50.0%) | 12 (100.0%) |
| 6 to 11 Years | 42 (77.8%) | 30 (81.1%) |
| 12 to 14 Years | 15 (100.0%) | 18 (100.0%) |
| 15 Years | 5 (100.0%) | 3 (100.0%) |
| 16 and 17 Years | 3 (50.0%) | 0 (0.0%) |
| 18 to 24 Years | 107 (100.0%) | 89 (78.1%) |
| 25 to 34 Years | 56 (100.0%) | 67 (72.8%) |
| 35 to 44 Years | 129 (81.7%) | 110 (92.4%) |
| 45 to 54 Years | 119 (100.0%) | 116 (100.0%) |
| 55 to 64 Years | 119 (97.5%) | 93 (93.9%) |
| 65 to 74 Years | 77 (93.9%) | 111 (78.7%) |
| 75 Years and over | 21 (100.0%) | 32 (88.9%) |
| Total | 749 (90.8%) | 768 (87.9%) |
Income Below Poverty Among Married-Couple Families in Burns
The poverty statistics for married-couple families in Burns show that 2.3% or 8 of the total 345 families live below the poverty line. Families with no children have the highest poverty rate of 3.0%, comprising of 8 families. On the other hand, families with 1 or 2 children have the lowest poverty rate of 0.0%, which includes 0 families.
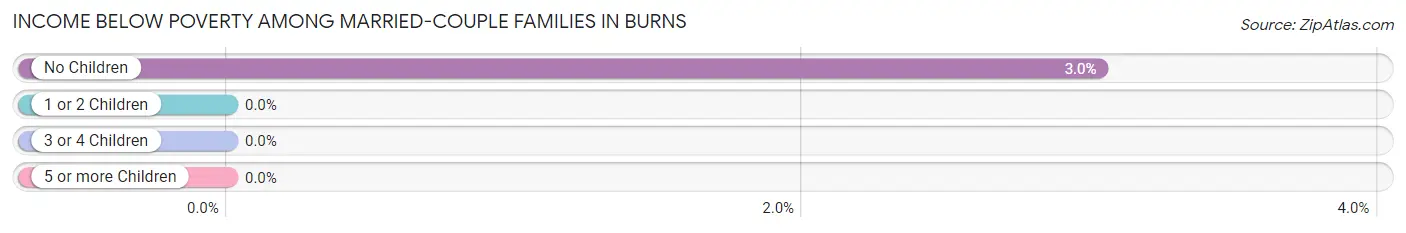
| Children | Above Poverty | Below Poverty |
| No Children | 256 (97.0%) | 8 (3.0%) |
| 1 or 2 Children | 71 (100.0%) | 0 (0.0%) |
| 3 or 4 Children | 10 (100.0%) | 0 (0.0%) |
| 5 or more Children | 0 (0.0%) | 0 (0.0%) |
| Total | 337 (97.7%) | 8 (2.3%) |
Income Below Poverty Among Single-Parent Households in Burns
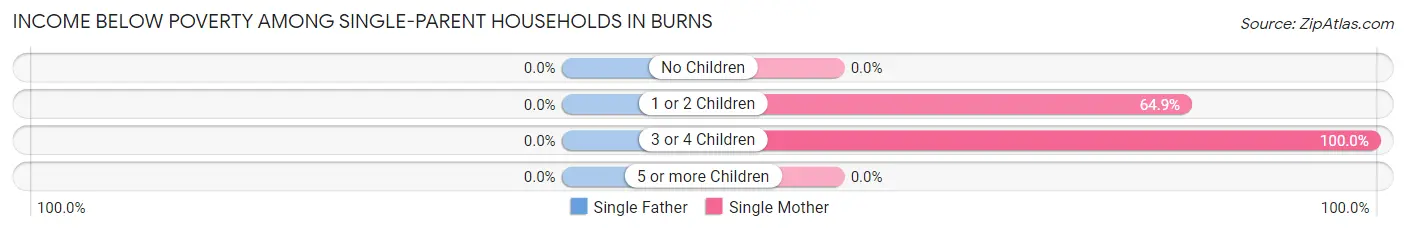
| Children | Single Father | Single Mother |
| No Children | 0 (0.0%) | 0 (0.0%) |
| 1 or 2 Children | 0 (0.0%) | 24 (64.9%) |
| 3 or 4 Children | 0 (0.0%) | 3 (100.0%) |
| 5 or more Children | 0 (0.0%) | 0 (0.0%) |
| Total | 0 (0.0%) | 27 (36.0%) |
Income Below Poverty Among Married-Couple vs Single-Parent Households in Burns
The poverty data for Burns shows that 8 of the married-couple family households (2.3%) and 27 of the single-parent households (26.2%) are living below the poverty level. Within the married-couple family households, those with no children have the highest poverty rate, with 8 households (3.0%) falling below the poverty line. Among the single-parent households, those with 1 or 2 children have the highest poverty rate, with 24 household (49.0%) living below poverty.
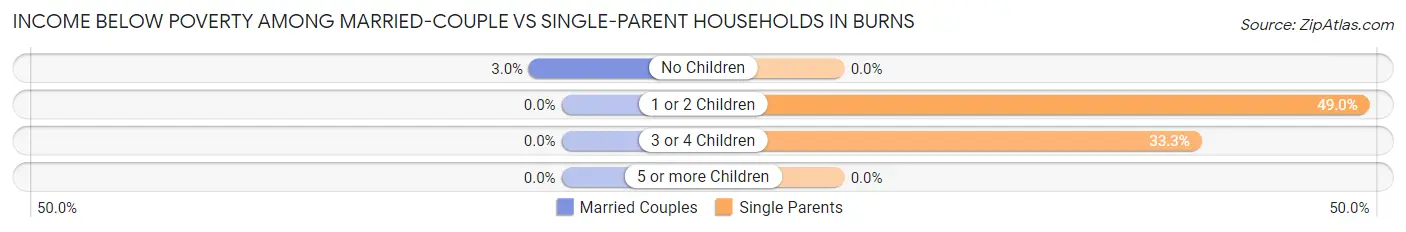
| Children | Married-Couple Families | Single-Parent Households |
| No Children | 8 (3.0%) | 0 (0.0%) |
| 1 or 2 Children | 0 (0.0%) | 24 (49.0%) |
| 3 or 4 Children | 0 (0.0%) | 3 (33.3%) |
| 5 or more Children | 0 (0.0%) | 0 (0.0%) |
| Total | 8 (2.3%) | 27 (26.2%) |
Race in Burns
The most populous races in Burns are White / Caucasian (1,558 | 91.5%), Two or more Races (74 | 4.3%), and Black / African American (64 | 3.8%).
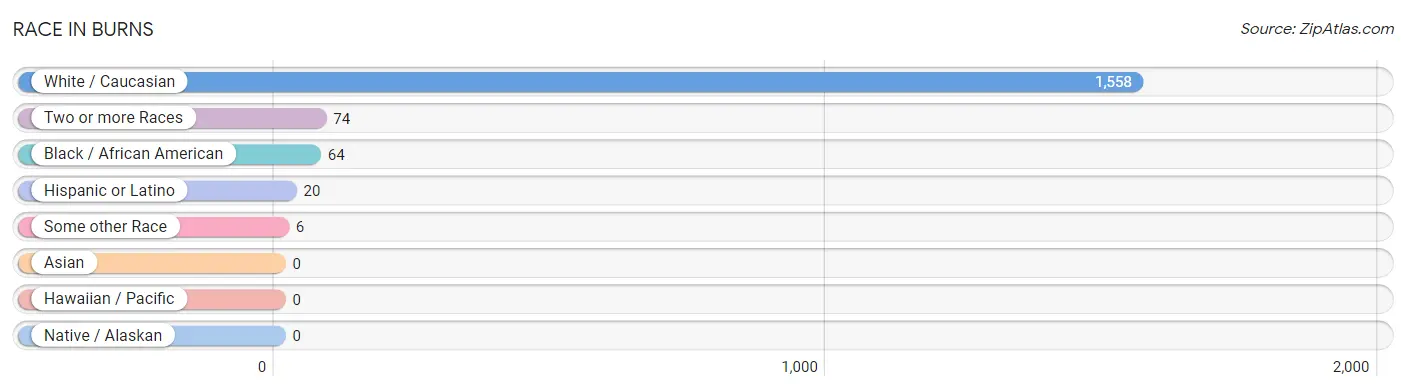
| Race | # Population | % Population |
| Asian | 0 | 0.0% |
| Black / African American | 64 | 3.8% |
| Hawaiian / Pacific | 0 | 0.0% |
| Hispanic or Latino | 20 | 1.2% |
| Native / Alaskan | 0 | 0.0% |
| White / Caucasian | 1,558 | 91.5% |
| Two or more Races | 74 | 4.3% |
| Some other Race | 6 | 0.4% |
| Total | 1,702 | 100.0% |
Ancestry in Burns
The most populous ancestries reported in Burns are American (265 | 15.6%), German (215 | 12.6%), Irish (196 | 11.5%), English (181 | 10.6%), and European (152 | 8.9%), together accounting for 59.3% of all Burns residents.
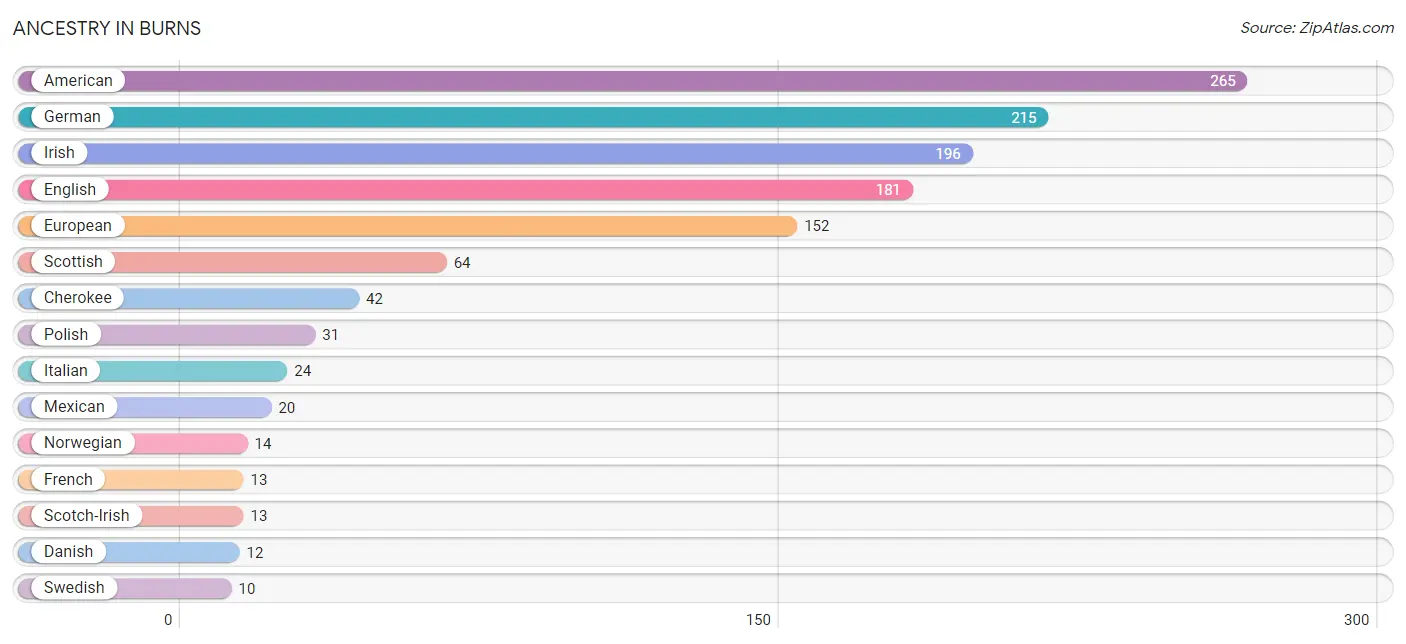
| Ancestry | # Population | % Population |
| American | 265 | 15.6% |
| Bhutanese | 2 | 0.1% |
| British | 7 | 0.4% |
| Cherokee | 42 | 2.5% |
| Choctaw | 6 | 0.4% |
| Croatian | 5 | 0.3% |
| Danish | 12 | 0.7% |
| Dutch | 8 | 0.5% |
| English | 181 | 10.6% |
| European | 152 | 8.9% |
| French | 13 | 0.8% |
| German | 215 | 12.6% |
| Hungarian | 4 | 0.2% |
| Irish | 196 | 11.5% |
| Italian | 24 | 1.4% |
| Lithuanian | 5 | 0.3% |
| Mexican | 20 | 1.2% |
| Norwegian | 14 | 0.8% |
| Polish | 31 | 1.8% |
| Scandinavian | 5 | 0.3% |
| Scotch-Irish | 13 | 0.8% |
| Scottish | 64 | 3.8% |
| Slovene | 3 | 0.2% |
| Swedish | 10 | 0.6% |
| Welsh | 2 | 0.1% | View All 25 Rows |
Immigrants in Burns
The most numerous immigrant groups reported in Burns came from Europe (17 | 1.0%), Croatia (5 | 0.3%), and Eastern Europe (5 | 0.3%), together accounting for 1.6% of all Burns residents.
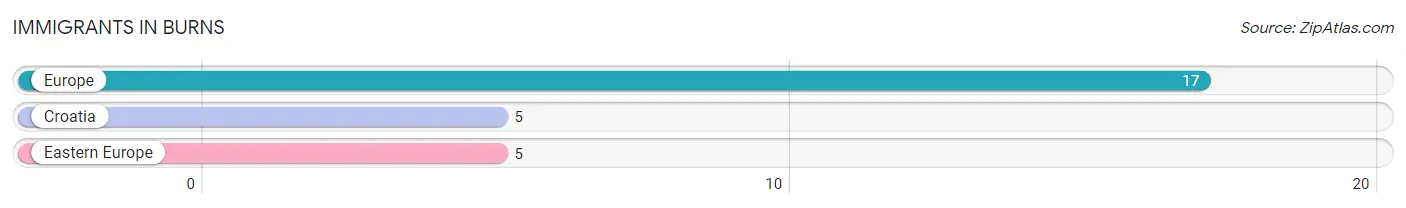
| Immigration Origin | # Population | % Population |
| Croatia | 5 | 0.3% |
| Eastern Europe | 5 | 0.3% |
| Europe | 17 | 1.0% | View All 3 Rows |
Sex and Age in Burns
Sex and Age in Burns
The most populous age groups in Burns are 20 to 24 Years (87 | 10.5%) for men and 20 to 24 Years (106 | 12.1%) for women.
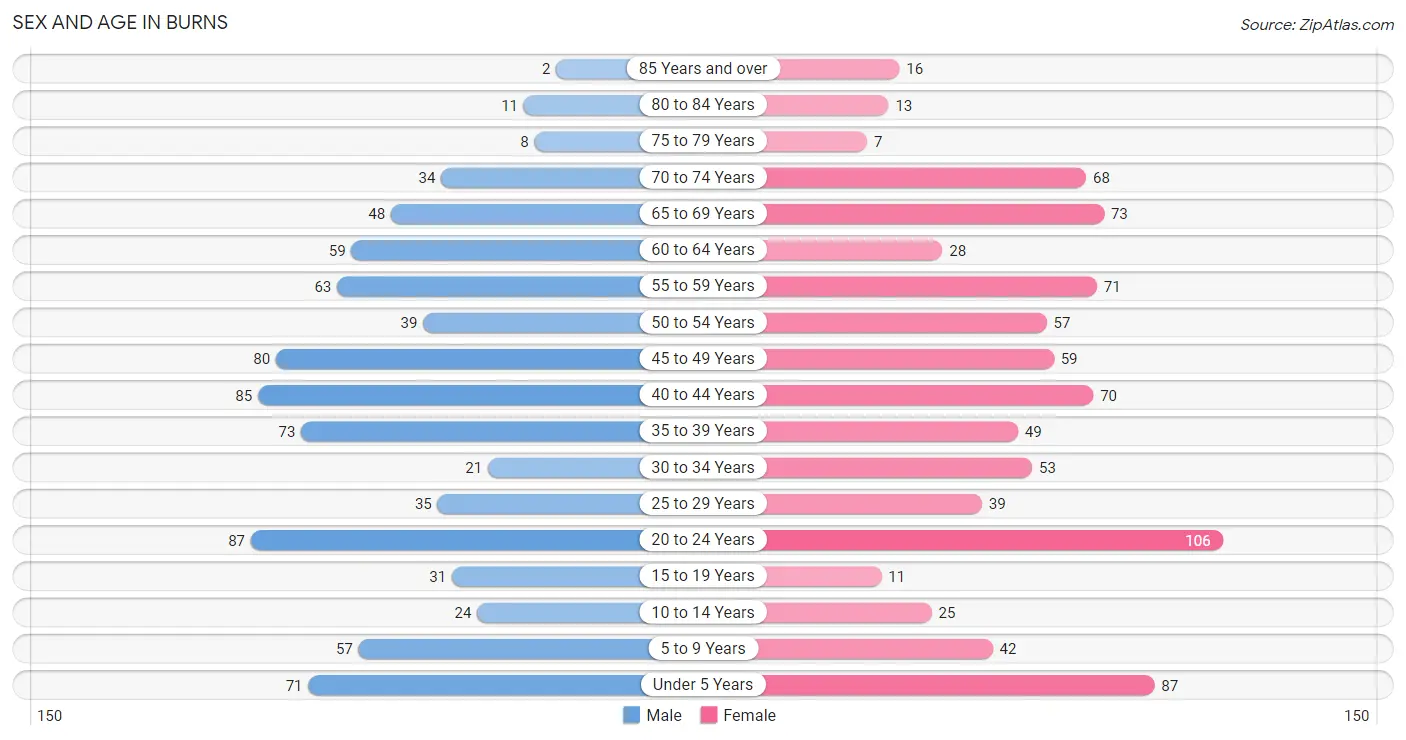
| Age Bracket | Male | Female |
| Under 5 Years | 71 (8.6%) | 87 (10.0%) |
| 5 to 9 Years | 57 (6.9%) | 42 (4.8%) |
| 10 to 14 Years | 24 (2.9%) | 25 (2.9%) |
| 15 to 19 Years | 31 (3.7%) | 11 (1.3%) |
| 20 to 24 Years | 87 (10.5%) | 106 (12.1%) |
| 25 to 29 Years | 35 (4.2%) | 39 (4.5%) |
| 30 to 34 Years | 21 (2.5%) | 53 (6.1%) |
| 35 to 39 Years | 73 (8.8%) | 49 (5.6%) |
| 40 to 44 Years | 85 (10.3%) | 70 (8.0%) |
| 45 to 49 Years | 80 (9.7%) | 59 (6.8%) |
| 50 to 54 Years | 39 (4.7%) | 57 (6.5%) |
| 55 to 59 Years | 63 (7.6%) | 71 (8.1%) |
| 60 to 64 Years | 59 (7.1%) | 28 (3.2%) |
| 65 to 69 Years | 48 (5.8%) | 73 (8.4%) |
| 70 to 74 Years | 34 (4.1%) | 68 (7.8%) |
| 75 to 79 Years | 8 (1.0%) | 7 (0.8%) |
| 80 to 84 Years | 11 (1.3%) | 13 (1.5%) |
| 85 Years and over | 2 (0.2%) | 16 (1.8%) |
| Total | 828 (100.0%) | 874 (100.0%) |
Families and Households in Burns
Median Family Size in Burns
The median family size in Burns is 3.04 persons per family, with single male/father families (28 | 6.2%) accounting for the largest median family size of 5.32 persons per family. On the other hand, single female/mother families (75 | 16.7%) represent the smallest median family size with 2.84 persons per family.
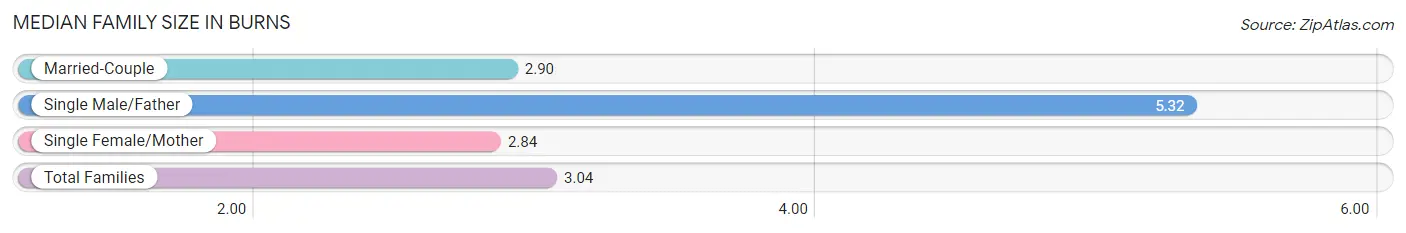
| Family Type | # Families | Family Size |
| Married-Couple | 345 (77.0%) | 2.90 |
| Single Male/Father | 28 (6.2%) | 5.32 |
| Single Female/Mother | 75 (16.7%) | 2.84 |
| Total Families | 448 (100.0%) | 3.04 |
Median Household Size in Burns
The median household size in Burns is 2.51 persons per household, with single male/father households (28 | 4.1%) accounting for the largest median household size of 6.14 persons per household. non-family households (229 | 33.8%) represent the smallest median household size with 1.23 persons per household.
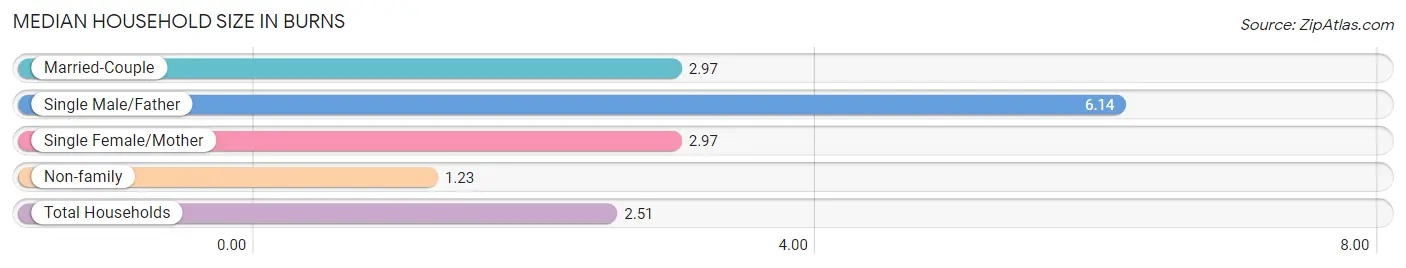
| Household Type | # Households | Household Size |
| Married-Couple | 345 (51.0%) | 2.97 |
| Single Male/Father | 28 (4.1%) | 6.14 |
| Single Female/Mother | 75 (11.1%) | 2.97 |
| Non-family | 229 (33.8%) | 1.23 |
| Total Households | 677 (100.0%) | 2.51 |
Household Size by Marriage Status in Burns
Out of a total of 677 households in Burns, 448 (66.2%) are family households, while 229 (33.8%) are nonfamily households. The most numerous type of family households are 2-person households, comprising 250, and the most common type of nonfamily households are 1-person households, comprising 193.
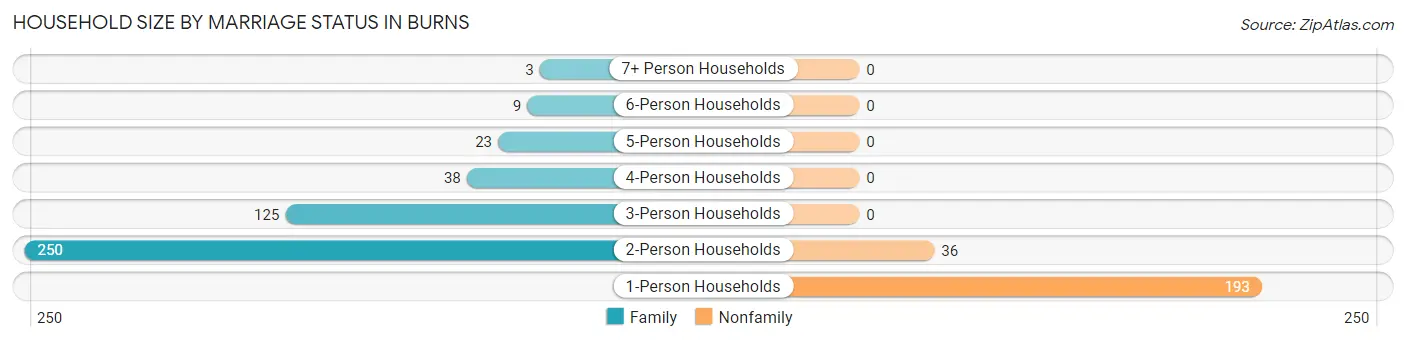
| Household Size | Family Households | Nonfamily Households |
| 1-Person Households | - | 193 (28.5%) |
| 2-Person Households | 250 (36.9%) | 36 (5.3%) |
| 3-Person Households | 125 (18.5%) | 0 (0.0%) |
| 4-Person Households | 38 (5.6%) | 0 (0.0%) |
| 5-Person Households | 23 (3.4%) | 0 (0.0%) |
| 6-Person Households | 9 (1.3%) | 0 (0.0%) |
| 7+ Person Households | 3 (0.4%) | 0 (0.0%) |
| Total | 448 (66.2%) | 229 (33.8%) |
Female Fertility in Burns
Fertility by Age in Burns
Average fertility rate in Burns is 31.0 births per 1,000 women. Women in the age bracket of 20 to 34 years have the highest fertility rate with 45.0 births per 1,000 women. Women in the age bracket of 20 to 34 years acount for 69.2% of all women with births.
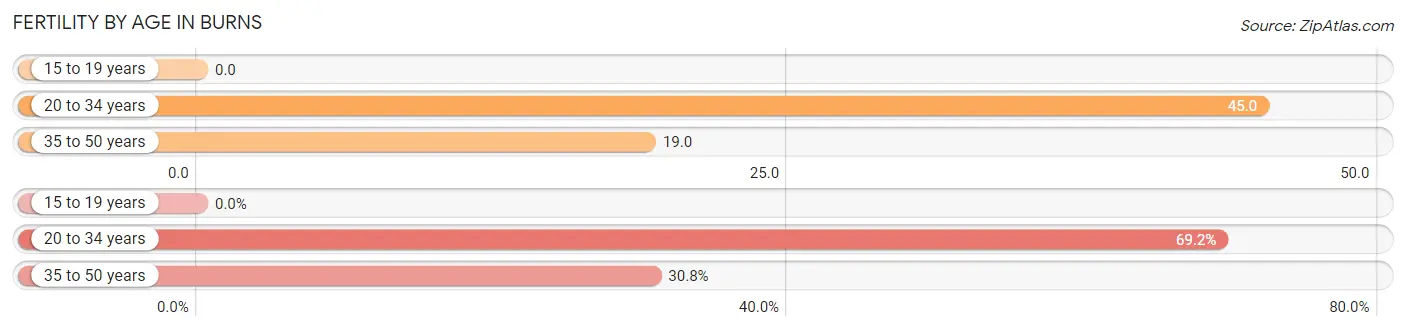
| Age Bracket | Women with Births | Births / 1,000 Women |
| 15 to 19 years | 0 (0.0%) | 0.0 |
| 20 to 34 years | 9 (69.2%) | 45.0 |
| 35 to 50 years | 4 (30.8%) | 19.0 |
| Total | 13 (100.0%) | 31.0 |
Fertility by Age by Marriage Status in Burns
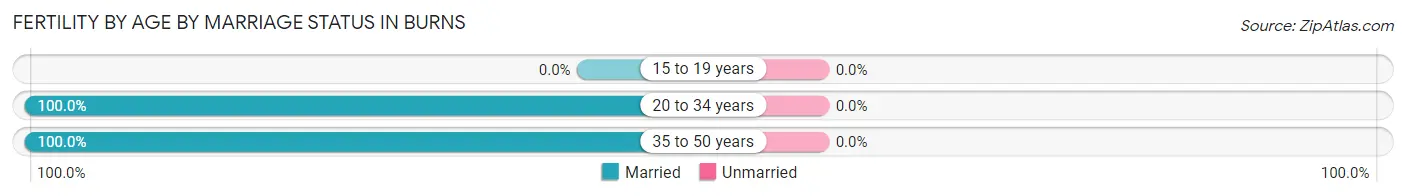
| Age Bracket | Married | Unmarried |
| 15 to 19 years | 0 (0.0%) | 0 (0.0%) |
| 20 to 34 years | 9 (100.0%) | 0 (0.0%) |
| 35 to 50 years | 4 (100.0%) | 0 (0.0%) |
| Total | 13 (100.0%) | 0 (0.0%) |
Fertility by Education in Burns
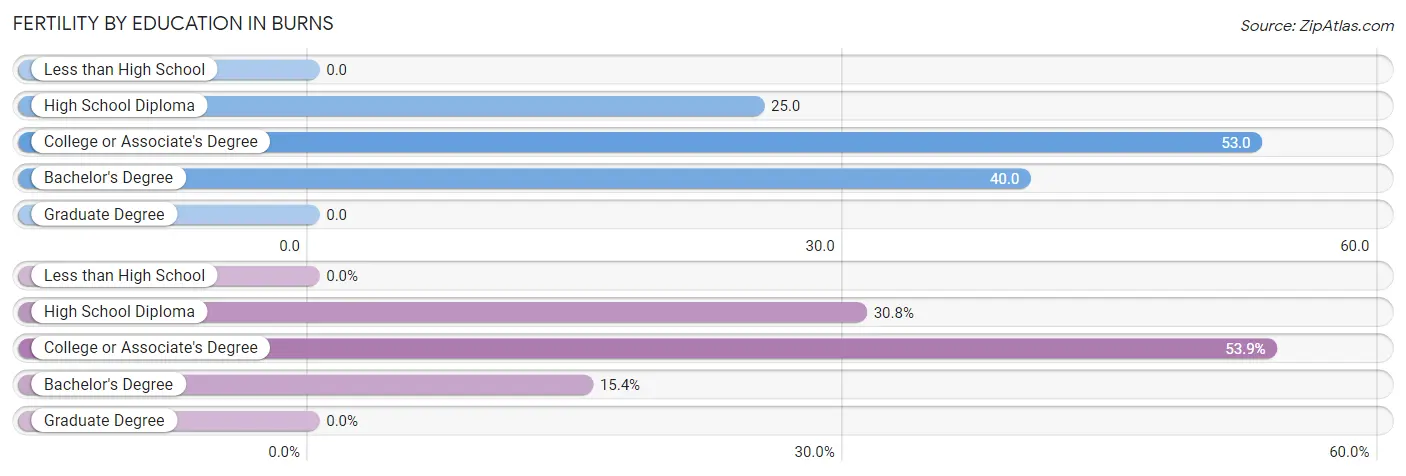
| Educational Attainment | Women with Births | Births / 1,000 Women |
| Less than High School | 0 (0.0%) | 0.0 |
| High School Diploma | 4 (30.8%) | 25.0 |
| College or Associate's Degree | 7 (53.8%) | 53.0 |
| Bachelor's Degree | 2 (15.4%) | 40.0 |
| Graduate Degree | 0 (0.0%) | 0.0 |
| Total | 13 (100.0%) | 31.0 |
Fertility by Education by Marriage Status in Burns
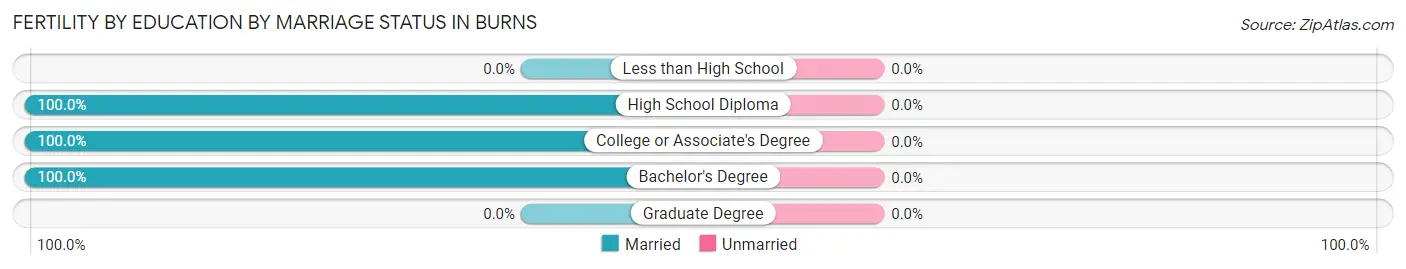
| Educational Attainment | Married | Unmarried |
| Less than High School | 0 (0.0%) | 0 (0.0%) |
| High School Diploma | 4 (100.0%) | 0 (0.0%) |
| College or Associate's Degree | 7 (100.0%) | 0 (0.0%) |
| Bachelor's Degree | 2 (100.0%) | 0 (0.0%) |
| Graduate Degree | 0 (0.0%) | 0 (0.0%) |
| Total | 13 (100.0%) | 0 (0.0%) |
Employment Characteristics in Burns
Employment by Class of Employer in Burns
Among the 898 employed individuals in Burns, private company employees (684 | 76.2%), self-employed (not incorporated) (77 | 8.6%), and local government employees (73 | 8.1%) make up the most common classes of employment.
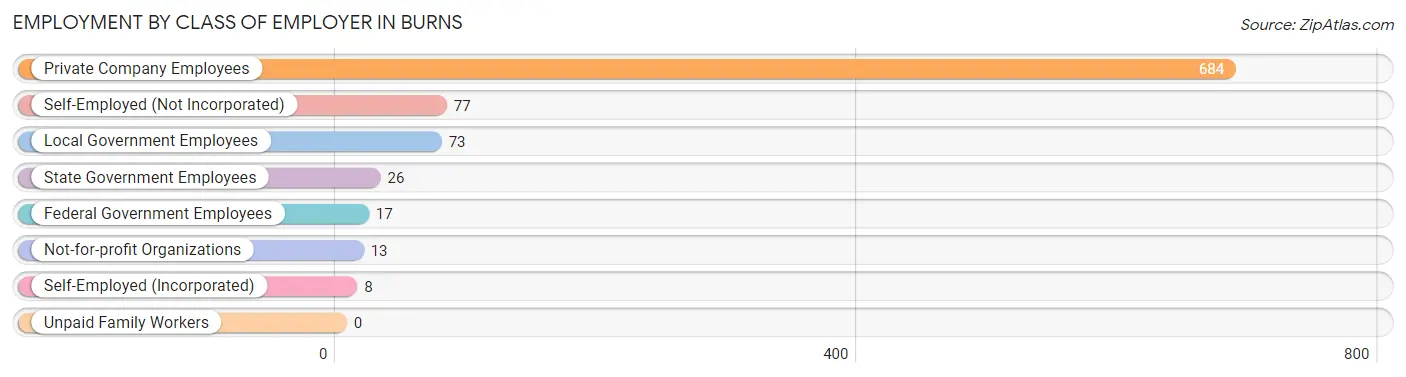
| Employer Class | # Employees | % Employees |
| Private Company Employees | 684 | 76.2% |
| Self-Employed (Incorporated) | 8 | 0.9% |
| Self-Employed (Not Incorporated) | 77 | 8.6% |
| Not-for-profit Organizations | 13 | 1.5% |
| Local Government Employees | 73 | 8.1% |
| State Government Employees | 26 | 2.9% |
| Federal Government Employees | 17 | 1.9% |
| Unpaid Family Workers | 0 | 0.0% |
| Total | 898 | 100.0% |
Employment Status by Age in Burns
According to the labor force statistics for Burns, out of the total population over 16 years of age (1,388), 66.5% or 923 individuals are in the labor force, with 2.1% or 19 of them unemployed. The age group with the highest labor force participation rate is 45 to 54 years, with 88.9% or 209 individuals in the labor force. Within the labor force, the 30 to 34 years age range has the highest percentage of unemployed individuals, with 10.6% or 5 of them being unemployed.
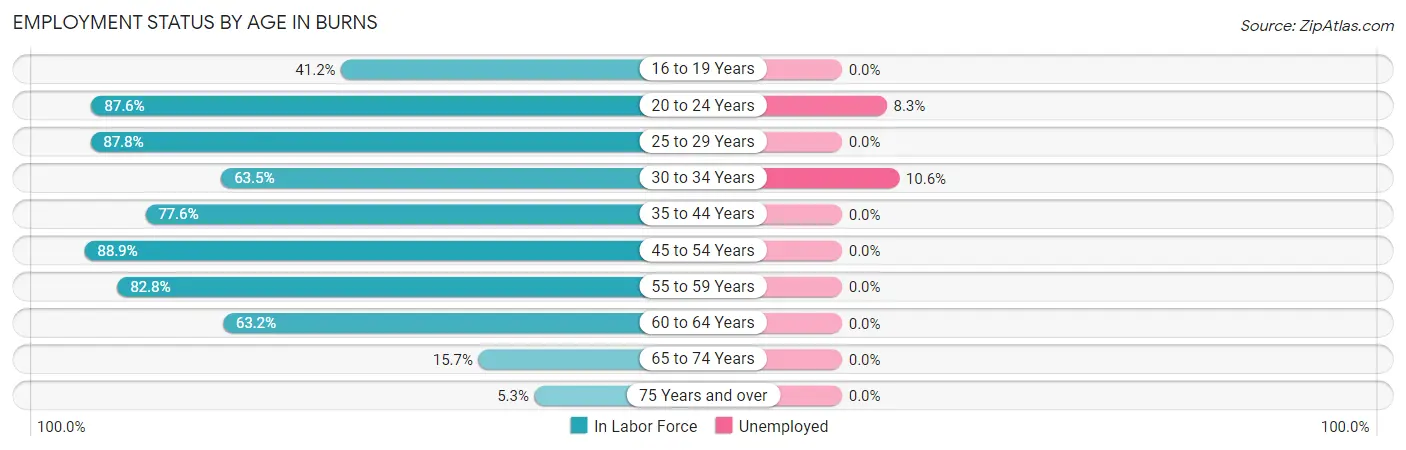
| Age Bracket | In Labor Force | Unemployed |
| 16 to 19 Years | 14 (41.2%) | 0 (0.0%) |
| 20 to 24 Years | 169 (87.6%) | 14 (8.3%) |
| 25 to 29 Years | 65 (87.8%) | 0 (0.0%) |
| 30 to 34 Years | 47 (63.5%) | 5 (10.6%) |
| 35 to 44 Years | 215 (77.6%) | 0 (0.0%) |
| 45 to 54 Years | 209 (88.9%) | 0 (0.0%) |
| 55 to 59 Years | 111 (82.8%) | 0 (0.0%) |
| 60 to 64 Years | 55 (63.2%) | 0 (0.0%) |
| 65 to 74 Years | 35 (15.7%) | 0 (0.0%) |
| 75 Years and over | 3 (5.3%) | 0 (0.0%) |
| Total | 923 (66.5%) | 19 (2.1%) |
Employment Status by Educational Attainment in Burns
According to labor force statistics for Burns, 79.7% of individuals (702) out of the total population between 25 and 64 years of age (881) are in the labor force, with 0.7% or 5 of them being unemployed. The group with the highest labor force participation rate are those with the educational attainment of college / associate degree, with 90.4% or 208 individuals in the labor force. Within the labor force, individuals with college / associate degree education have the highest percentage of unemployment, with 2.4% or 5 of them being unemployed.
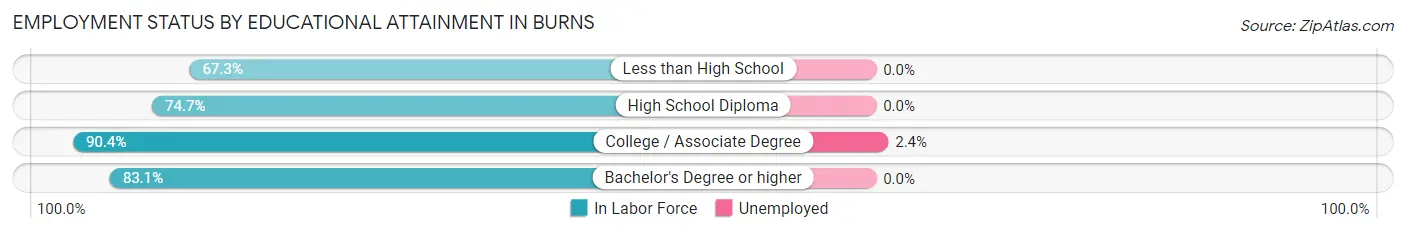
| Educational Attainment | In Labor Force | Unemployed |
| Less than High School | 70 (67.3%) | 0 (0.0%) |
| High School Diploma | 272 (74.7%) | 0 (0.0%) |
| College / Associate Degree | 208 (90.4%) | 6 (2.4%) |
| Bachelor's Degree or higher | 152 (83.1%) | 0 (0.0%) |
| Total | 702 (79.7%) | 6 (0.7%) |
Employment Occupations by Sex in Burns
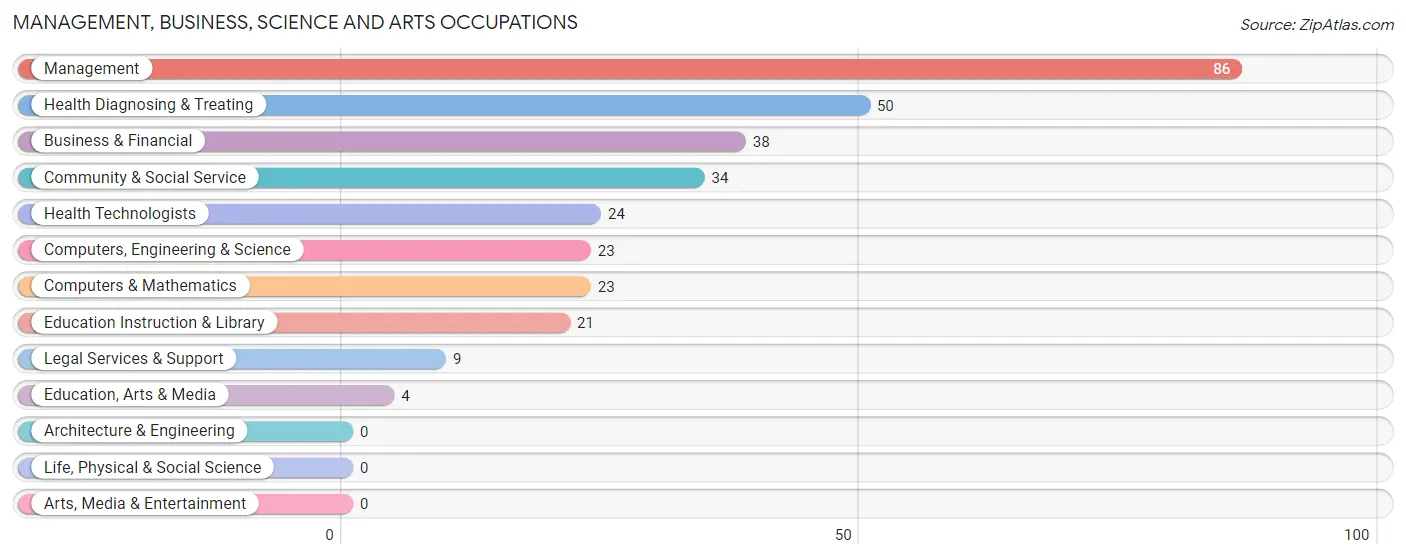
Management, Business, Science and Arts Occupations
The most common Management, Business, Science and Arts occupations in Burns are Management (86 | 9.5%), Health Diagnosing & Treating (50 | 5.5%), Business & Financial (38 | 4.2%), Community & Social Service (34 | 3.8%), and Health Technologists (24 | 2.6%).
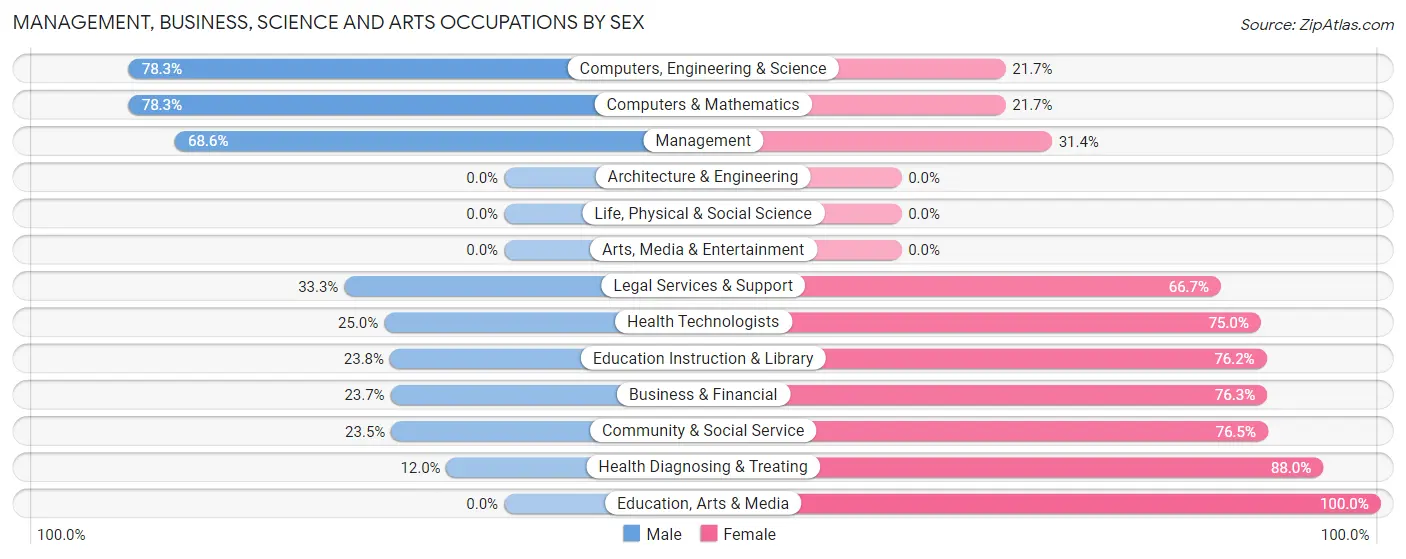
Management, Business, Science and Arts Occupations by Sex
Within the Management, Business, Science and Arts occupations in Burns, the most male-oriented occupations are Computers, Engineering & Science (78.3%), Computers & Mathematics (78.3%), and Management (68.6%), while the most female-oriented occupations are Education, Arts & Media (100.0%), Health Diagnosing & Treating (88.0%), and Community & Social Service (76.5%).
| Occupation | Male | Female |
| Management | 59 (68.6%) | 27 (31.4%) |
| Business & Financial | 9 (23.7%) | 29 (76.3%) |
| Computers, Engineering & Science | 18 (78.3%) | 5 (21.7%) |
| Computers & Mathematics | 18 (78.3%) | 5 (21.7%) |
| Architecture & Engineering | 0 (0.0%) | 0 (0.0%) |
| Life, Physical & Social Science | 0 (0.0%) | 0 (0.0%) |
| Community & Social Service | 8 (23.5%) | 26 (76.5%) |
| Education, Arts & Media | 0 (0.0%) | 4 (100.0%) |
| Legal Services & Support | 3 (33.3%) | 6 (66.7%) |
| Education Instruction & Library | 5 (23.8%) | 16 (76.2%) |
| Arts, Media & Entertainment | 0 (0.0%) | 0 (0.0%) |
| Health Diagnosing & Treating | 6 (12.0%) | 44 (88.0%) |
| Health Technologists | 6 (25.0%) | 18 (75.0%) |
| Total (Category) | 100 (43.3%) | 131 (56.7%) |
| Total (Overall) | 479 (53.0%) | 425 (47.0%) |
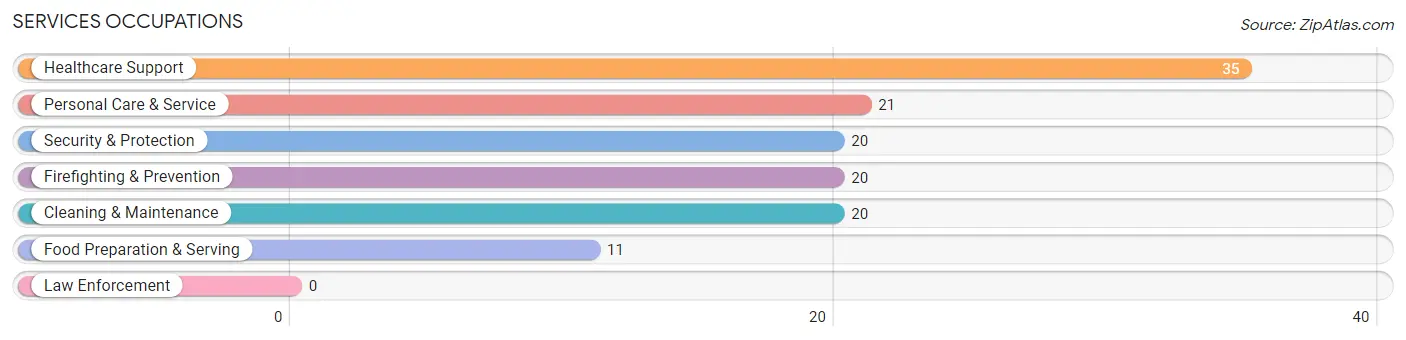
Services Occupations
The most common Services occupations in Burns are Healthcare Support (35 | 3.9%), Personal Care & Service (21 | 2.3%), Security & Protection (20 | 2.2%), Firefighting & Prevention (20 | 2.2%), and Cleaning & Maintenance (20 | 2.2%).
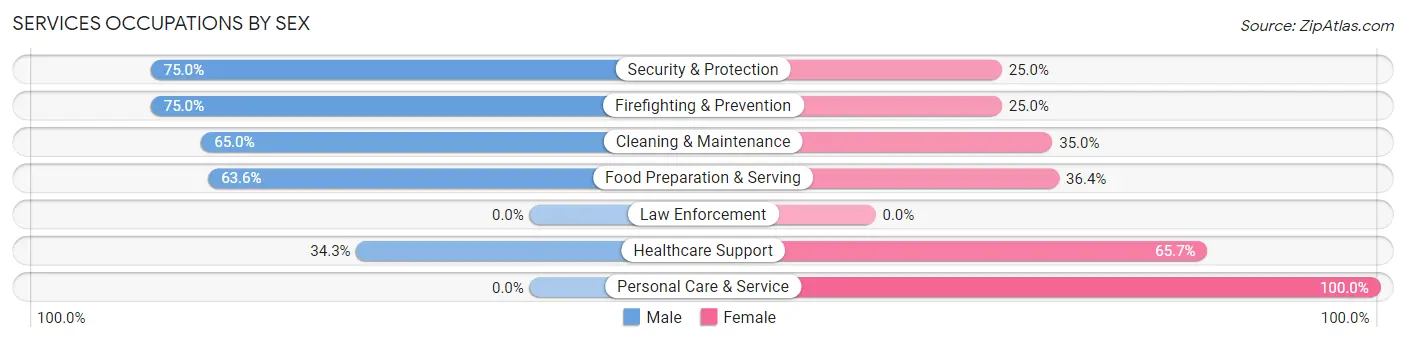
Services Occupations by Sex
Within the Services occupations in Burns, the most male-oriented occupations are Security & Protection (75.0%), Firefighting & Prevention (75.0%), and Cleaning & Maintenance (65.0%), while the most female-oriented occupations are Personal Care & Service (100.0%), Healthcare Support (65.7%), and Food Preparation & Serving (36.4%).
| Occupation | Male | Female |
| Healthcare Support | 12 (34.3%) | 23 (65.7%) |
| Security & Protection | 15 (75.0%) | 5 (25.0%) |
| Firefighting & Prevention | 15 (75.0%) | 5 (25.0%) |
| Law Enforcement | 0 (0.0%) | 0 (0.0%) |
| Food Preparation & Serving | 7 (63.6%) | 4 (36.4%) |
| Cleaning & Maintenance | 13 (65.0%) | 7 (35.0%) |
| Personal Care & Service | 0 (0.0%) | 21 (100.0%) |
| Total (Category) | 47 (43.9%) | 60 (56.1%) |
| Total (Overall) | 479 (53.0%) | 425 (47.0%) |
Sales and Office Occupations
The most common Sales and Office occupations in Burns are Office & Administration (152 | 16.8%), and Sales & Related (99 | 11.0%).
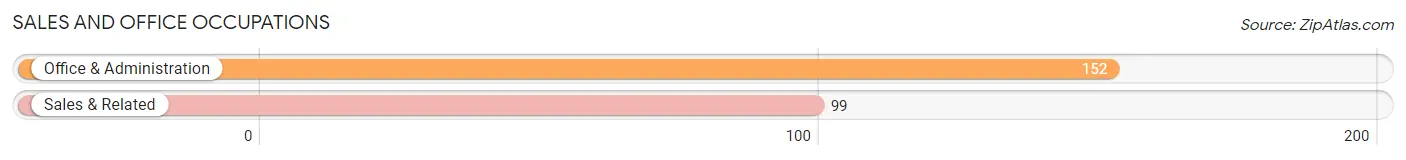
Sales and Office Occupations by Sex
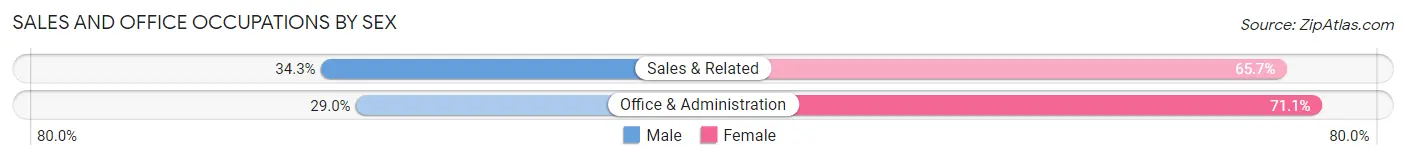
| Occupation | Male | Female |
| Sales & Related | 34 (34.3%) | 65 (65.7%) |
| Office & Administration | 44 (28.9%) | 108 (71.1%) |
| Total (Category) | 78 (31.1%) | 173 (68.9%) |
| Total (Overall) | 479 (53.0%) | 425 (47.0%) |
Natural Resources, Construction and Maintenance Occupations
The most common Natural Resources, Construction and Maintenance occupations in Burns are Construction & Extraction (85 | 9.4%), and Installation, Maintenance & Repair (32 | 3.5%).
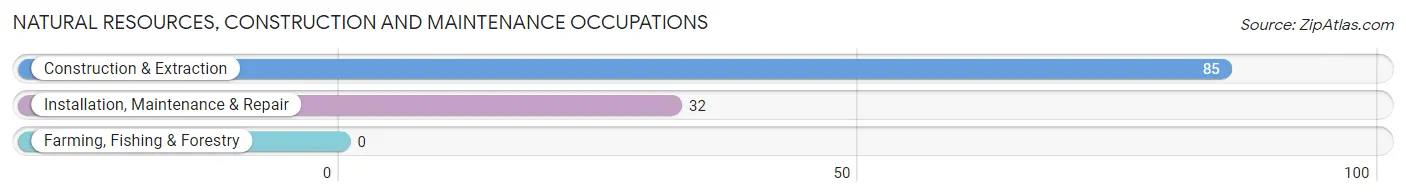
Natural Resources, Construction and Maintenance Occupations by Sex
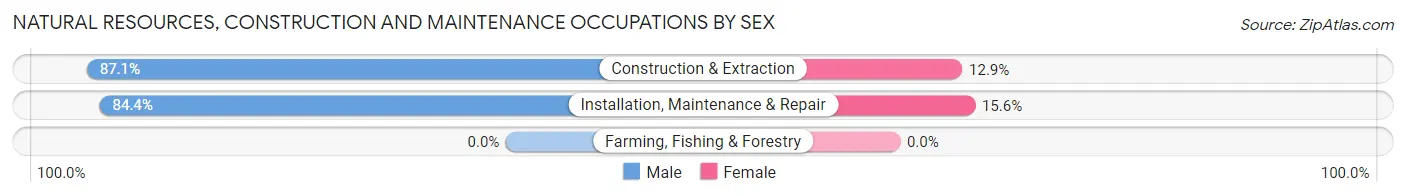
| Occupation | Male | Female |
| Farming, Fishing & Forestry | 0 (0.0%) | 0 (0.0%) |
| Construction & Extraction | 74 (87.1%) | 11 (12.9%) |
| Installation, Maintenance & Repair | 27 (84.4%) | 5 (15.6%) |
| Total (Category) | 101 (86.3%) | 16 (13.7%) |
| Total (Overall) | 479 (53.0%) | 425 (47.0%) |
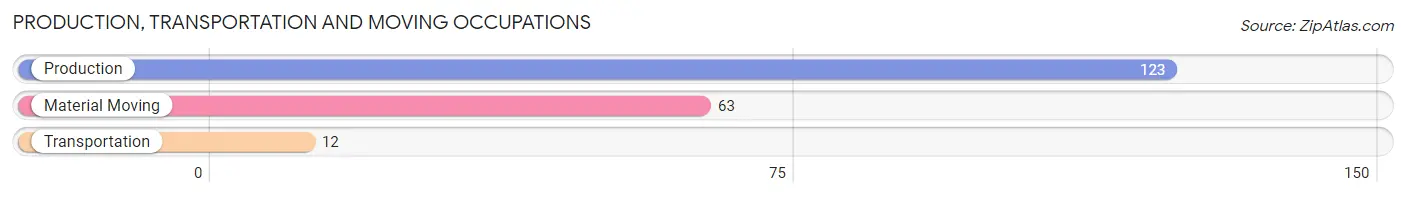
Production, Transportation and Moving Occupations
The most common Production, Transportation and Moving occupations in Burns are Production (123 | 13.6%), Material Moving (63 | 7.0%), and Transportation (12 | 1.3%).
Production, Transportation and Moving Occupations by Sex
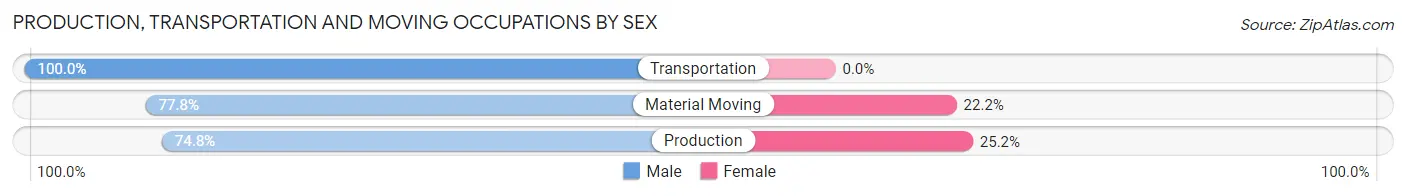
| Occupation | Male | Female |
| Production | 92 (74.8%) | 31 (25.2%) |
| Transportation | 12 (100.0%) | 0 (0.0%) |
| Material Moving | 49 (77.8%) | 14 (22.2%) |
| Total (Category) | 153 (77.3%) | 45 (22.7%) |
| Total (Overall) | 479 (53.0%) | 425 (47.0%) |
Employment Industries by Sex in Burns
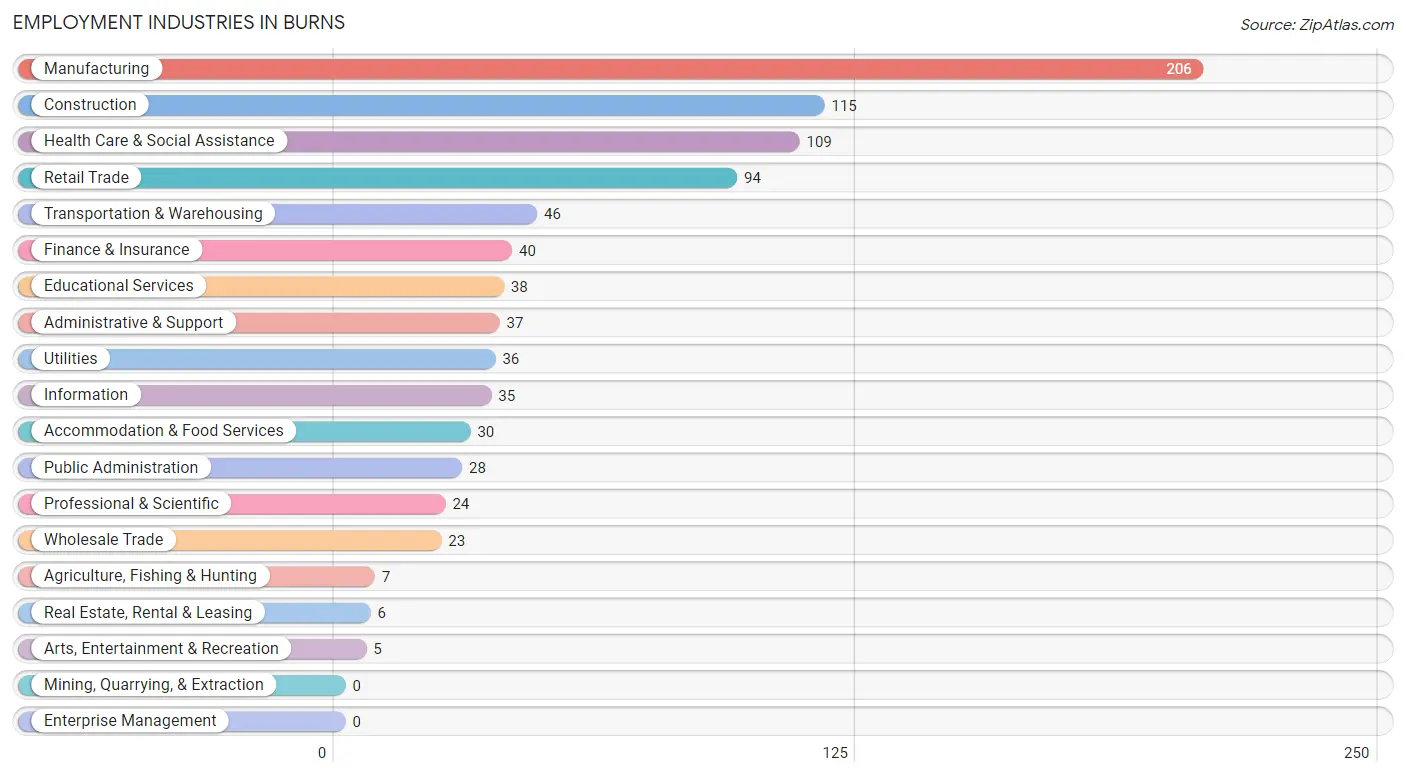
Employment Industries in Burns
The major employment industries in Burns include Manufacturing (206 | 22.8%), Construction (115 | 12.7%), Health Care & Social Assistance (109 | 12.1%), Retail Trade (94 | 10.4%), and Transportation & Warehousing (46 | 5.1%).
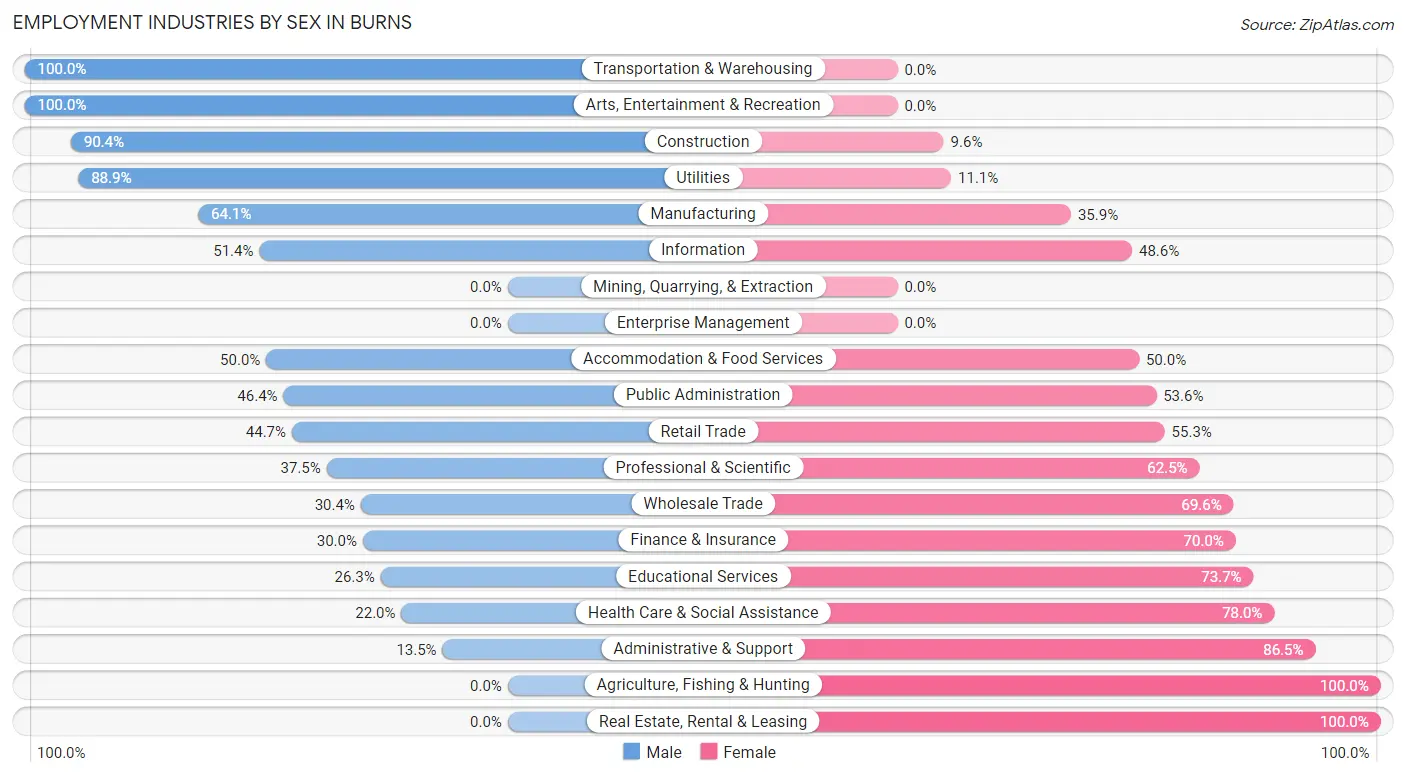
Employment Industries by Sex in Burns
The Burns industries that see more men than women are Transportation & Warehousing (100.0%), Arts, Entertainment & Recreation (100.0%), and Construction (90.4%), whereas the industries that tend to have a higher number of women are Agriculture, Fishing & Hunting (100.0%), Real Estate, Rental & Leasing (100.0%), and Administrative & Support (86.5%).
| Industry | Male | Female |
| Agriculture, Fishing & Hunting | 0 (0.0%) | 7 (100.0%) |
| Mining, Quarrying, & Extraction | 0 (0.0%) | 0 (0.0%) |
| Construction | 104 (90.4%) | 11 (9.6%) |
| Manufacturing | 132 (64.1%) | 74 (35.9%) |
| Wholesale Trade | 7 (30.4%) | 16 (69.6%) |
| Retail Trade | 42 (44.7%) | 52 (55.3%) |
| Transportation & Warehousing | 46 (100.0%) | 0 (0.0%) |
| Utilities | 32 (88.9%) | 4 (11.1%) |
| Information | 18 (51.4%) | 17 (48.6%) |
| Finance & Insurance | 12 (30.0%) | 28 (70.0%) |
| Real Estate, Rental & Leasing | 0 (0.0%) | 6 (100.0%) |
| Professional & Scientific | 9 (37.5%) | 15 (62.5%) |
| Enterprise Management | 0 (0.0%) | 0 (0.0%) |
| Administrative & Support | 5 (13.5%) | 32 (86.5%) |
| Educational Services | 10 (26.3%) | 28 (73.7%) |
| Health Care & Social Assistance | 24 (22.0%) | 85 (78.0%) |
| Arts, Entertainment & Recreation | 5 (100.0%) | 0 (0.0%) |
| Accommodation & Food Services | 15 (50.0%) | 15 (50.0%) |
| Public Administration | 13 (46.4%) | 15 (53.6%) |
| Total | 479 (53.0%) | 425 (47.0%) |
Education in Burns
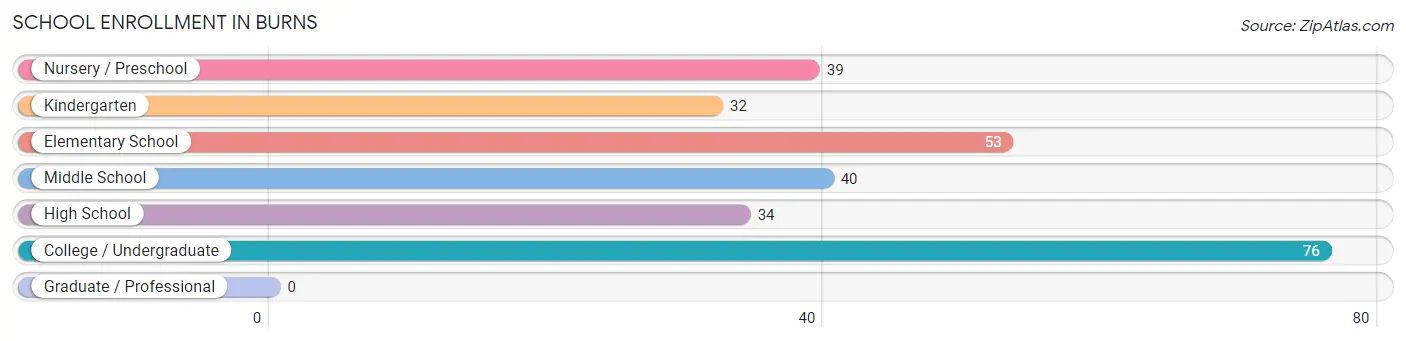
School Enrollment in Burns
The most common levels of schooling among the 274 students in Burns are college / undergraduate (76 | 27.7%), elementary school (53 | 19.3%), and middle school (40 | 14.6%).
| School Level | # Students | % Students |
| Nursery / Preschool | 39 | 14.2% |
| Kindergarten | 32 | 11.7% |
| Elementary School | 53 | 19.3% |
| Middle School | 40 | 14.6% |
| High School | 34 | 12.4% |
| College / Undergraduate | 76 | 27.7% |
| Graduate / Professional | 0 | 0.0% |
| Total | 274 | 100.0% |
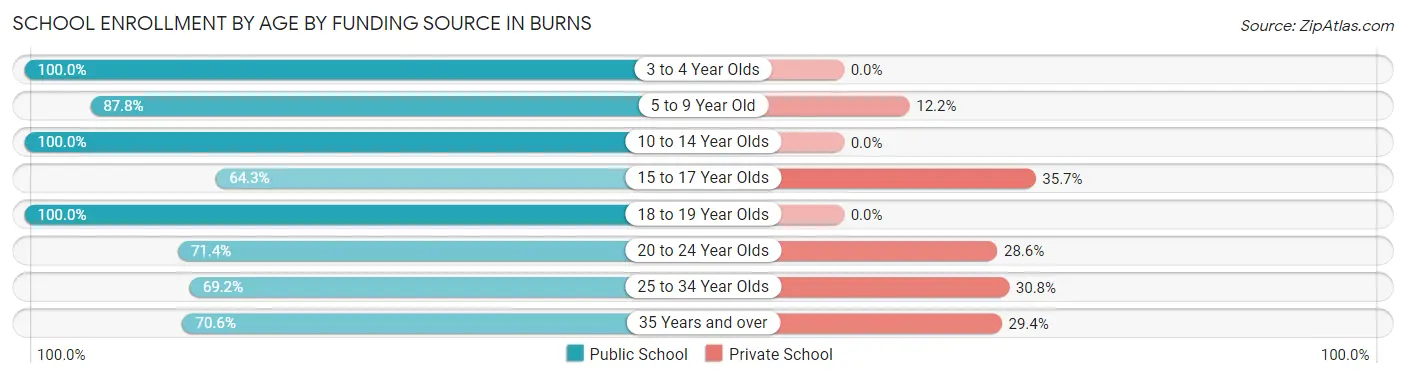
School Enrollment by Age by Funding Source in Burns
Out of a total of 274 students who are enrolled in schools in Burns, 35 (12.8%) attend a private institution, while the remaining 239 (87.2%) are enrolled in public schools. The age group of 15 to 17 year olds has the highest likelihood of being enrolled in private schools, with 5 (35.7% in the age bracket) enrolled. Conversely, the age group of 3 to 4 year olds has the lowest likelihood of being enrolled in a private school, with 30 (100.0% in the age bracket) attending a public institution.
| Age Bracket | Public School | Private School |
| 3 to 4 Year Olds | 30 (100.0%) | 0 (0.0%) |
| 5 to 9 Year Old | 79 (87.8%) | 11 (12.2%) |
| 10 to 14 Year Olds | 49 (100.0%) | 0 (0.0%) |
| 15 to 17 Year Olds | 9 (64.3%) | 5 (35.7%) |
| 18 to 19 Year Olds | 26 (100.0%) | 0 (0.0%) |
| 20 to 24 Year Olds | 25 (71.4%) | 10 (28.6%) |
| 25 to 34 Year Olds | 9 (69.2%) | 4 (30.8%) |
| 35 Years and over | 12 (70.6%) | 5 (29.4%) |
| Total | 239 (87.2%) | 35 (12.8%) |
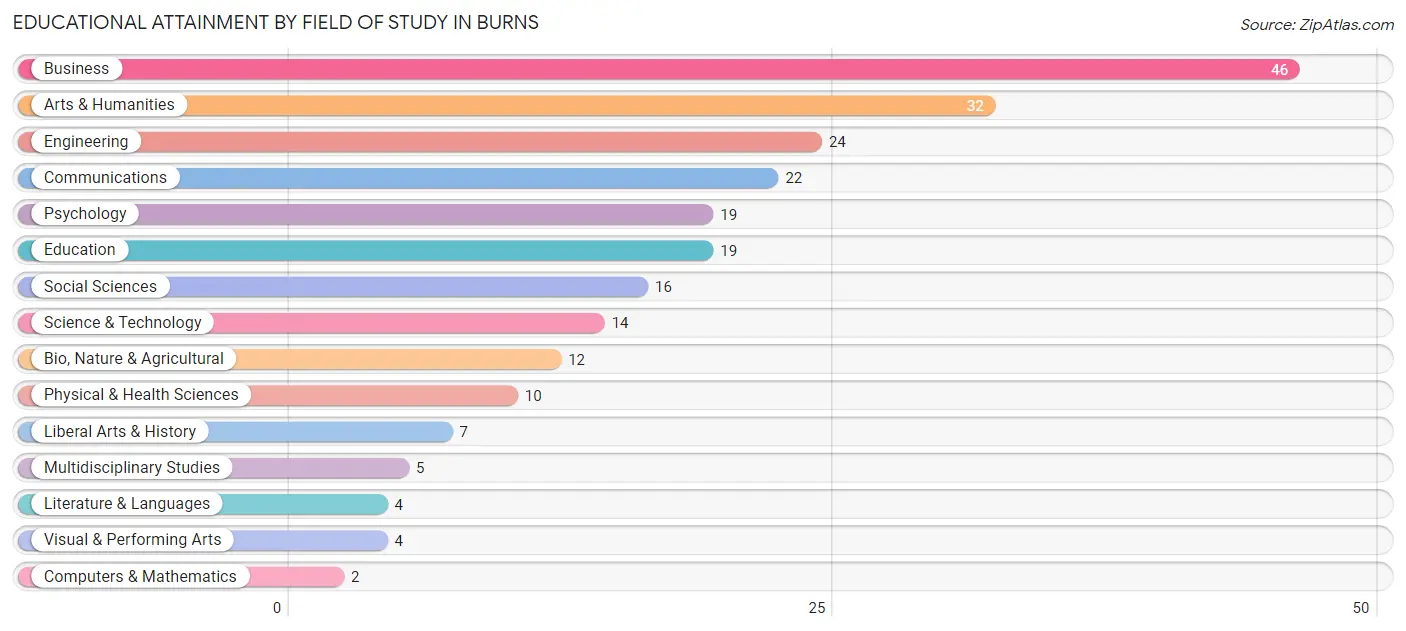
Educational Attainment by Field of Study in Burns
Business (46 | 19.5%), arts & humanities (32 | 13.6%), engineering (24 | 10.2%), communications (22 | 9.3%), and psychology (19 | 8.1%) are the most common fields of study among 236 individuals in Burns who have obtained a bachelor's degree or higher.
| Field of Study | # Graduates | % Graduates |
| Computers & Mathematics | 2 | 0.9% |
| Bio, Nature & Agricultural | 12 | 5.1% |
| Physical & Health Sciences | 10 | 4.2% |
| Psychology | 19 | 8.1% |
| Social Sciences | 16 | 6.8% |
| Engineering | 24 | 10.2% |
| Multidisciplinary Studies | 5 | 2.1% |
| Science & Technology | 14 | 5.9% |
| Business | 46 | 19.5% |
| Education | 19 | 8.1% |
| Literature & Languages | 4 | 1.7% |
| Liberal Arts & History | 7 | 3.0% |
| Visual & Performing Arts | 4 | 1.7% |
| Communications | 22 | 9.3% |
| Arts & Humanities | 32 | 13.6% |
| Total | 236 | 100.0% |
Transportation & Commute in Burns
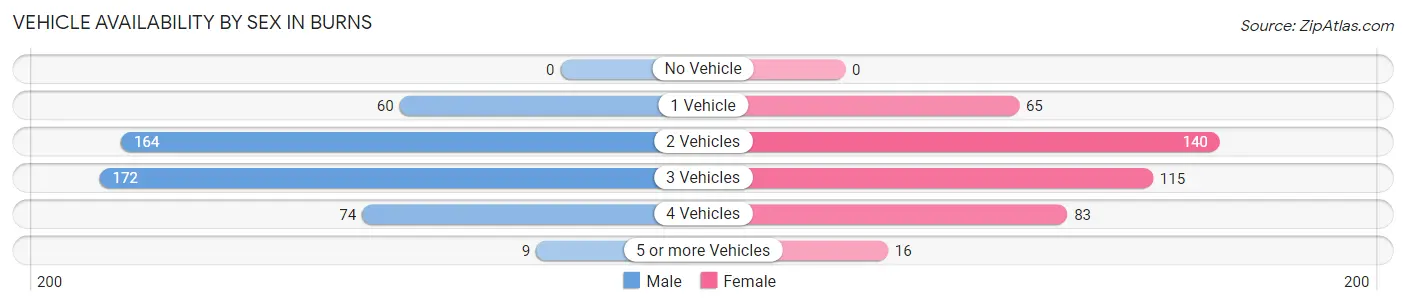
Vehicle Availability by Sex in Burns
The most prevalent vehicle ownership categories in Burns are males with 3 vehicles (172, accounting for 35.9%) and females with 3 vehicles (115, making up 41.0%).
| Vehicles Available | Male | Female |
| No Vehicle | 0 (0.0%) | 0 (0.0%) |
| 1 Vehicle | 60 (12.5%) | 65 (15.5%) |
| 2 Vehicles | 164 (34.2%) | 140 (33.4%) |
| 3 Vehicles | 172 (35.9%) | 115 (27.5%) |
| 4 Vehicles | 74 (15.4%) | 83 (19.8%) |
| 5 or more Vehicles | 9 (1.9%) | 16 (3.8%) |
| Total | 479 (100.0%) | 419 (100.0%) |
Commute Time in Burns
The most frequently occuring commute durations in Burns are 45 to 59 minutes (161 commuters, 19.5%), 5 to 9 minutes (135 commuters, 16.4%), and 10 to 14 minutes (125 commuters, 15.1%).
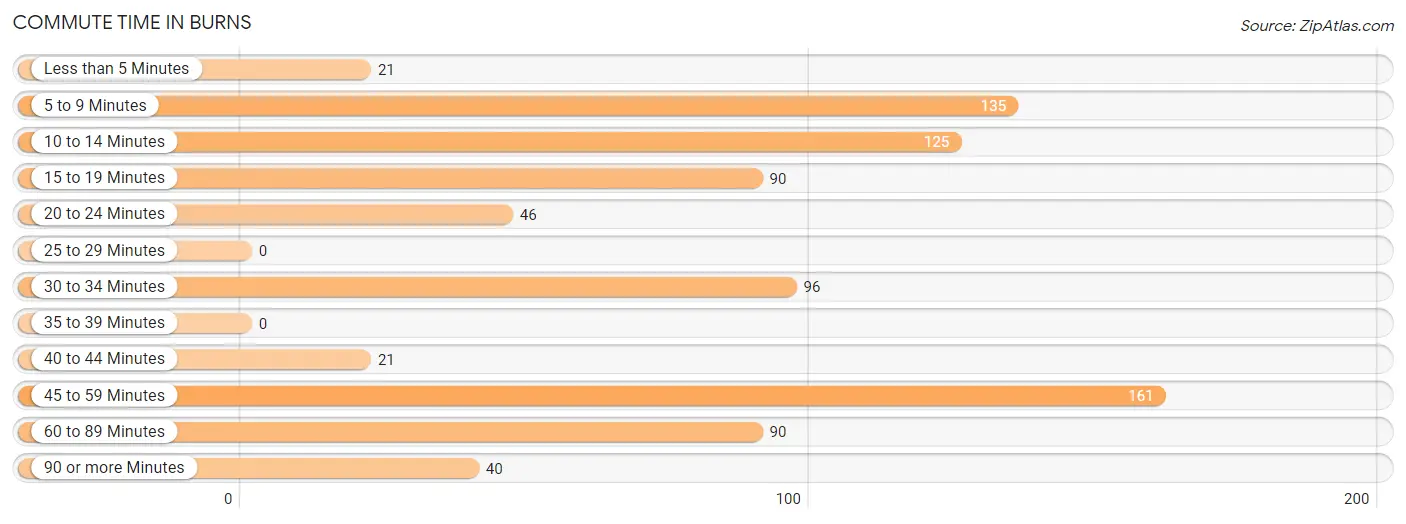
| Commute Time | # Commuters | % Commuters |
| Less than 5 Minutes | 21 | 2.5% |
| 5 to 9 Minutes | 135 | 16.4% |
| 10 to 14 Minutes | 125 | 15.1% |
| 15 to 19 Minutes | 90 | 10.9% |
| 20 to 24 Minutes | 46 | 5.6% |
| 25 to 29 Minutes | 0 | 0.0% |
| 30 to 34 Minutes | 96 | 11.6% |
| 35 to 39 Minutes | 0 | 0.0% |
| 40 to 44 Minutes | 21 | 2.5% |
| 45 to 59 Minutes | 161 | 19.5% |
| 60 to 89 Minutes | 90 | 10.9% |
| 90 or more Minutes | 40 | 4.9% |
Commute Time by Sex in Burns
The most common commute times in Burns are 45 to 59 minutes (110 commuters, 24.4%) for males and 10 to 14 minutes (73 commuters, 19.5%) for females.
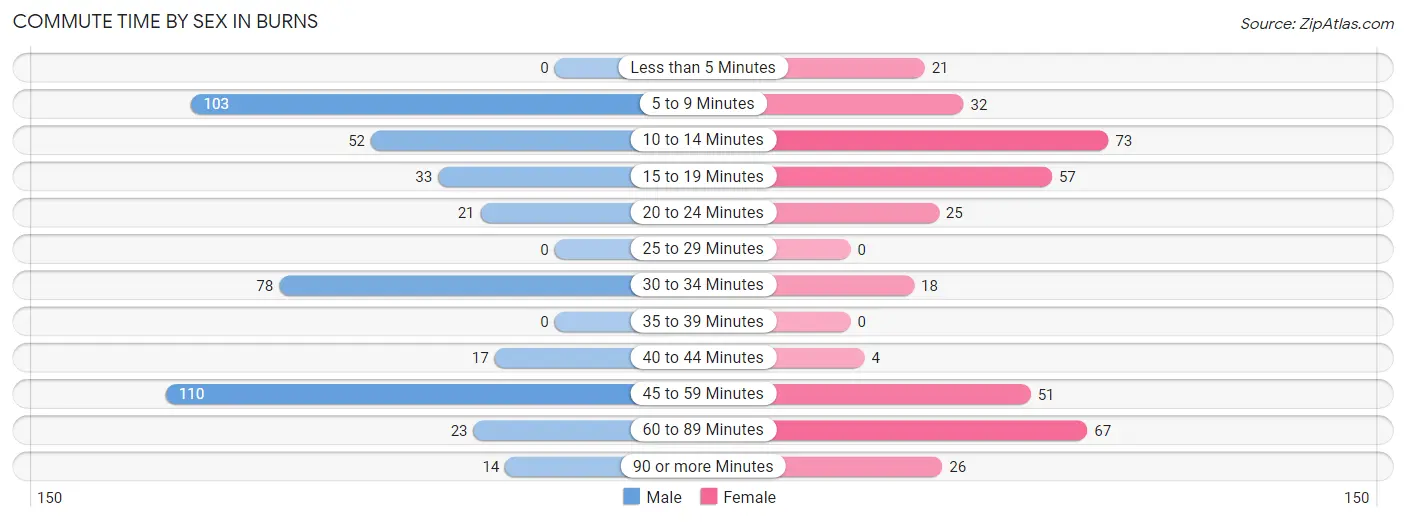
| Commute Time | Male | Female |
| Less than 5 Minutes | 0 (0.0%) | 21 (5.6%) |
| 5 to 9 Minutes | 103 (22.8%) | 32 (8.6%) |
| 10 to 14 Minutes | 52 (11.5%) | 73 (19.5%) |
| 15 to 19 Minutes | 33 (7.3%) | 57 (15.2%) |
| 20 to 24 Minutes | 21 (4.7%) | 25 (6.7%) |
| 25 to 29 Minutes | 0 (0.0%) | 0 (0.0%) |
| 30 to 34 Minutes | 78 (17.3%) | 18 (4.8%) |
| 35 to 39 Minutes | 0 (0.0%) | 0 (0.0%) |
| 40 to 44 Minutes | 17 (3.8%) | 4 (1.1%) |
| 45 to 59 Minutes | 110 (24.4%) | 51 (13.6%) |
| 60 to 89 Minutes | 23 (5.1%) | 67 (17.9%) |
| 90 or more Minutes | 14 (3.1%) | 26 (7.0%) |
Time of Departure to Work by Sex in Burns
The most frequent times of departure to work in Burns are 5:30 AM to 5:59 AM (83, 18.4%) for males and 7:00 AM to 7:29 AM (100, 26.7%) for females.
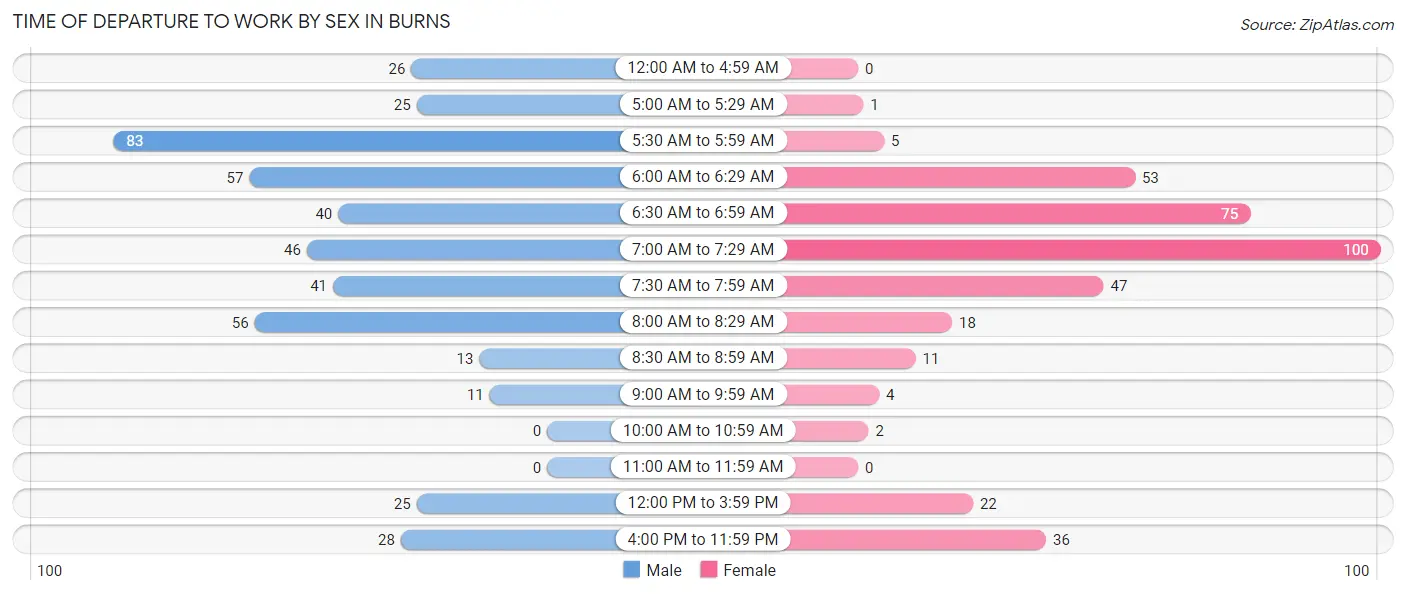
| Time of Departure | Male | Female |
| 12:00 AM to 4:59 AM | 26 (5.8%) | 0 (0.0%) |
| 5:00 AM to 5:29 AM | 25 (5.5%) | 1 (0.3%) |
| 5:30 AM to 5:59 AM | 83 (18.4%) | 5 (1.3%) |
| 6:00 AM to 6:29 AM | 57 (12.6%) | 53 (14.2%) |
| 6:30 AM to 6:59 AM | 40 (8.9%) | 75 (20.1%) |
| 7:00 AM to 7:29 AM | 46 (10.2%) | 100 (26.7%) |
| 7:30 AM to 7:59 AM | 41 (9.1%) | 47 (12.6%) |
| 8:00 AM to 8:29 AM | 56 (12.4%) | 18 (4.8%) |
| 8:30 AM to 8:59 AM | 13 (2.9%) | 11 (2.9%) |
| 9:00 AM to 9:59 AM | 11 (2.4%) | 4 (1.1%) |
| 10:00 AM to 10:59 AM | 0 (0.0%) | 2 (0.5%) |
| 11:00 AM to 11:59 AM | 0 (0.0%) | 0 (0.0%) |
| 12:00 PM to 3:59 PM | 25 (5.5%) | 22 (5.9%) |
| 4:00 PM to 11:59 PM | 28 (6.2%) | 36 (9.6%) |
| Total | 451 (100.0%) | 374 (100.0%) |
Housing Occupancy in Burns
Occupancy by Ownership in Burns
Of the total 677 dwellings in Burns, owner-occupied units account for 497 (73.4%), while renter-occupied units make up 180 (26.6%).
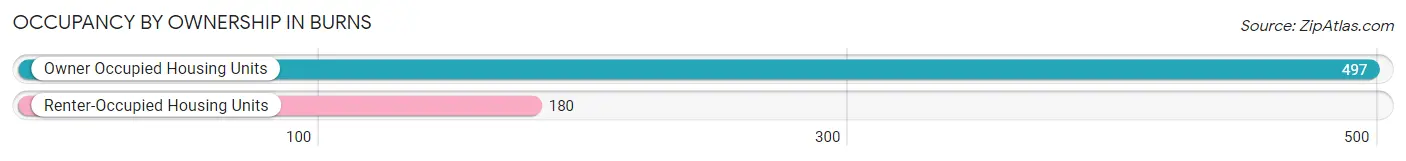
| Occupancy | # Housing Units | % Housing Units |
| Owner Occupied Housing Units | 497 | 73.4% |
| Renter-Occupied Housing Units | 180 | 26.6% |
| Total Occupied Housing Units | 677 | 100.0% |
Occupancy by Household Size in Burns
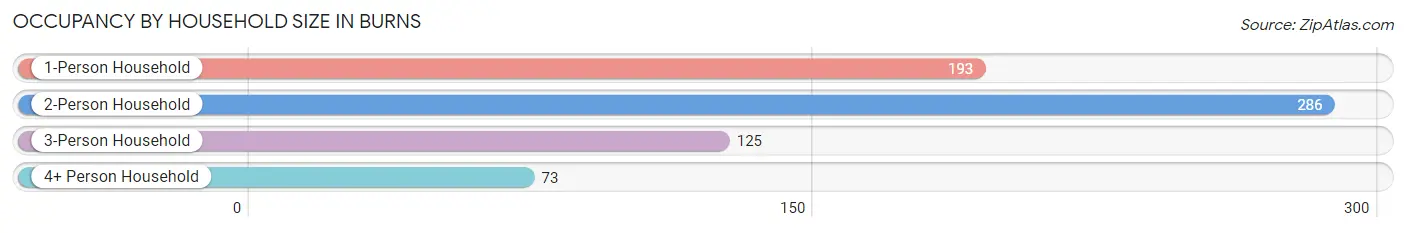
| Household Size | # Housing Units | % Housing Units |
| 1-Person Household | 193 | 28.5% |
| 2-Person Household | 286 | 42.2% |
| 3-Person Household | 125 | 18.5% |
| 4+ Person Household | 73 | 10.8% |
| Total Housing Units | 677 | 100.0% |
Occupancy by Ownership by Household Size in Burns
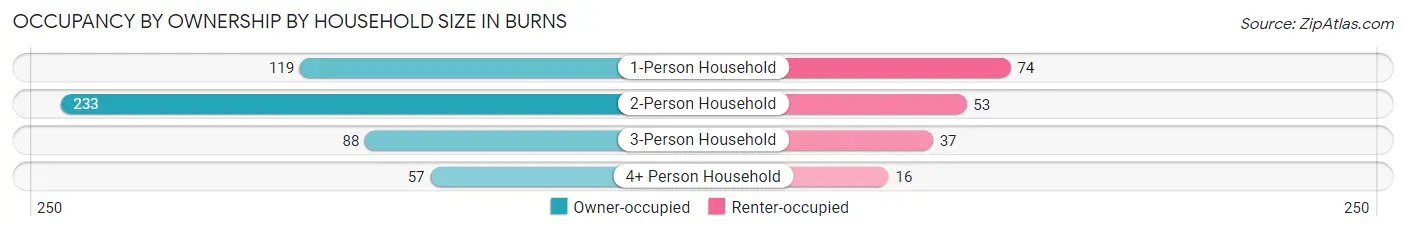
| Household Size | Owner-occupied | Renter-occupied |
| 1-Person Household | 119 (61.7%) | 74 (38.3%) |
| 2-Person Household | 233 (81.5%) | 53 (18.5%) |
| 3-Person Household | 88 (70.4%) | 37 (29.6%) |
| 4+ Person Household | 57 (78.1%) | 16 (21.9%) |
| Total Housing Units | 497 (73.4%) | 180 (26.6%) |
Occupancy by Educational Attainment in Burns
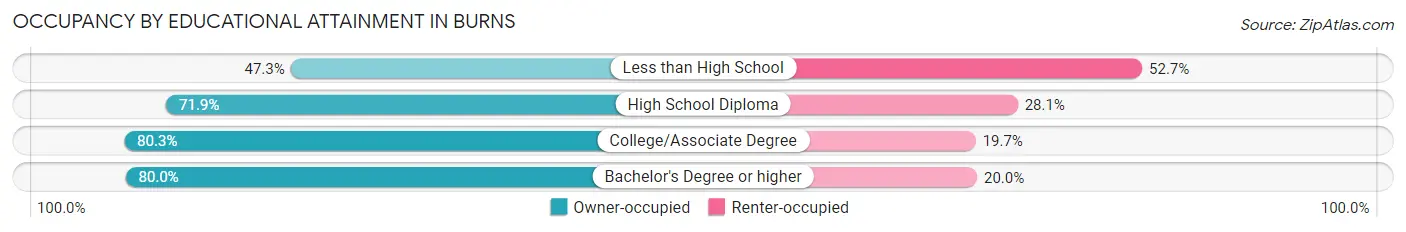
| Household Size | Owner-occupied | Renter-occupied |
| Less than High School | 26 (47.3%) | 29 (52.7%) |
| High School Diploma | 241 (71.9%) | 94 (28.1%) |
| College/Associate Degree | 118 (80.3%) | 29 (19.7%) |
| Bachelor's Degree or higher | 112 (80.0%) | 28 (20.0%) |
Occupancy by Age of Householder in Burns
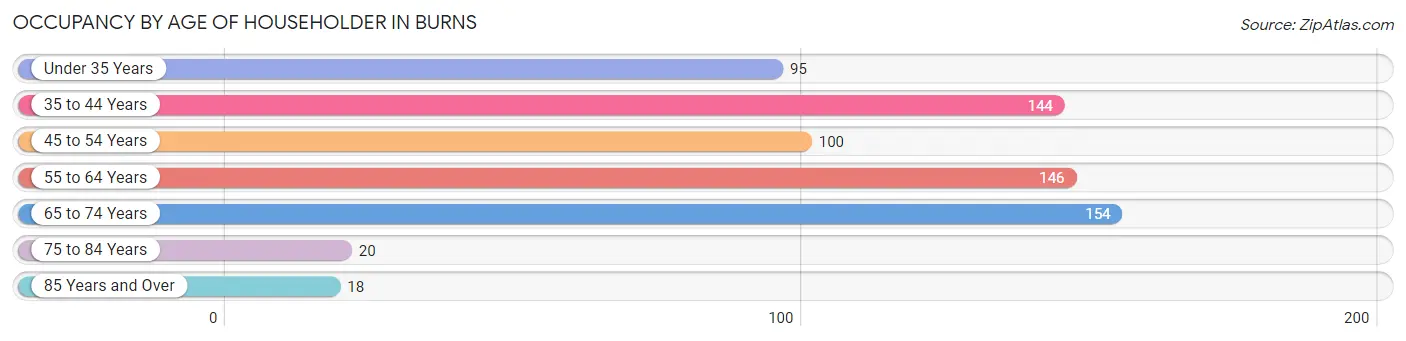
| Age Bracket | # Households | % Households |
| Under 35 Years | 95 | 14.0% |
| 35 to 44 Years | 144 | 21.3% |
| 45 to 54 Years | 100 | 14.8% |
| 55 to 64 Years | 146 | 21.6% |
| 65 to 74 Years | 154 | 22.8% |
| 75 to 84 Years | 20 | 2.9% |
| 85 Years and Over | 18 | 2.7% |
| Total | 677 | 100.0% |
Housing Finances in Burns
Median Income by Occupancy in Burns
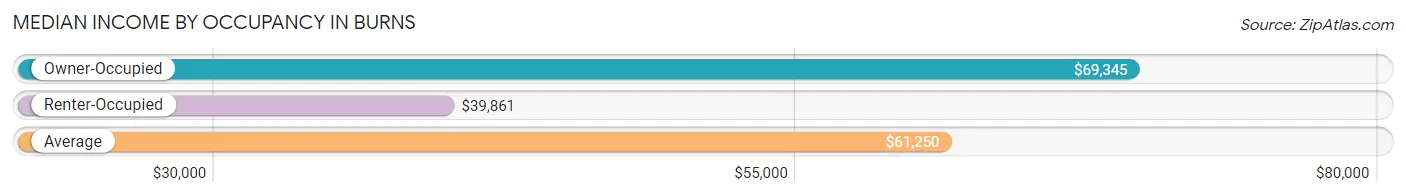
| Occupancy Type | # Households | Median Income |
| Owner-Occupied | 497 (73.4%) | $69,345 |
| Renter-Occupied | 180 (26.6%) | $39,861 |
| Average | 677 (100.0%) | $61,250 |
Occupancy by Householder Income Bracket in Burns
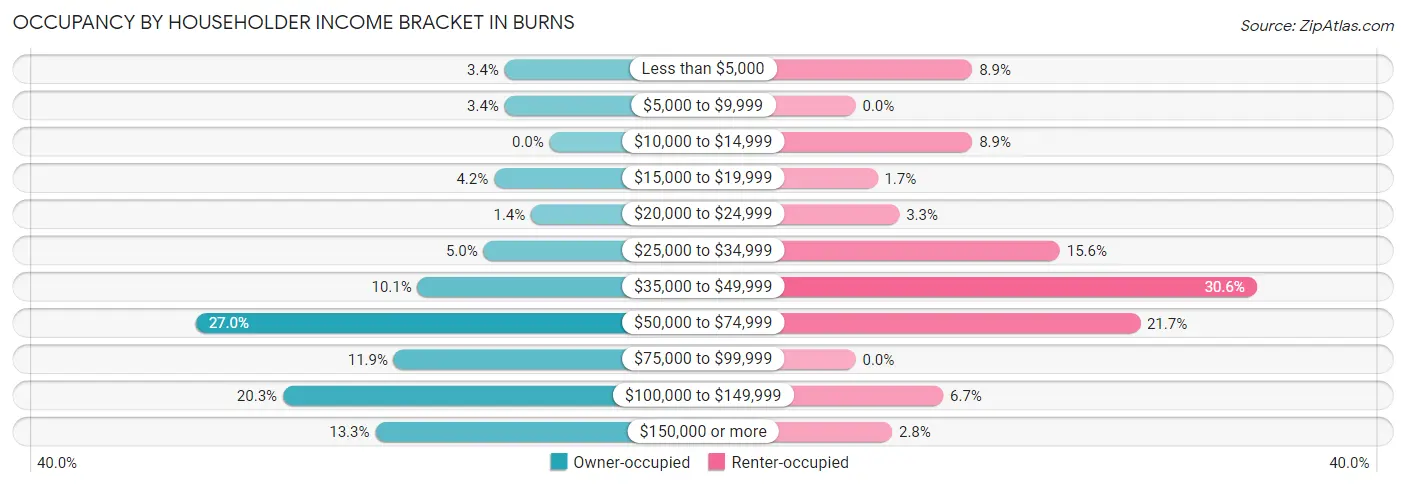
| Income Bracket | Owner-occupied | Renter-occupied |
| Less than $5,000 | 17 (3.4%) | 16 (8.9%) |
| $5,000 to $9,999 | 17 (3.4%) | 0 (0.0%) |
| $10,000 to $14,999 | 0 (0.0%) | 16 (8.9%) |
| $15,000 to $19,999 | 21 (4.2%) | 3 (1.7%) |
| $20,000 to $24,999 | 7 (1.4%) | 6 (3.3%) |
| $25,000 to $34,999 | 25 (5.0%) | 28 (15.6%) |
| $35,000 to $49,999 | 50 (10.1%) | 55 (30.6%) |
| $50,000 to $74,999 | 134 (27.0%) | 39 (21.7%) |
| $75,000 to $99,999 | 59 (11.9%) | 0 (0.0%) |
| $100,000 to $149,999 | 101 (20.3%) | 12 (6.7%) |
| $150,000 or more | 66 (13.3%) | 5 (2.8%) |
| Total | 497 (100.0%) | 180 (100.0%) |
Monthly Housing Cost Tiers in Burns
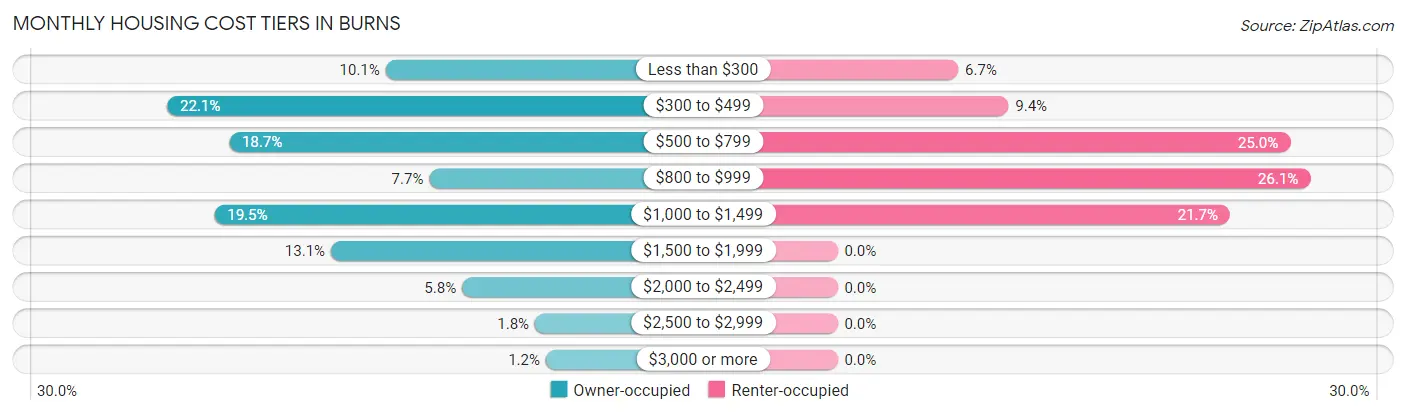
| Monthly Cost | Owner-occupied | Renter-occupied |
| Less than $300 | 50 (10.1%) | 12 (6.7%) |
| $300 to $499 | 110 (22.1%) | 17 (9.4%) |
| $500 to $799 | 93 (18.7%) | 45 (25.0%) |
| $800 to $999 | 38 (7.6%) | 47 (26.1%) |
| $1,000 to $1,499 | 97 (19.5%) | 39 (21.7%) |
| $1,500 to $1,999 | 65 (13.1%) | 0 (0.0%) |
| $2,000 to $2,499 | 29 (5.8%) | 0 (0.0%) |
| $2,500 to $2,999 | 9 (1.8%) | 0 (0.0%) |
| $3,000 or more | 6 (1.2%) | 0 (0.0%) |
| Total | 497 (100.0%) | 180 (100.0%) |
Physical Housing Characteristics in Burns
Housing Structures in Burns
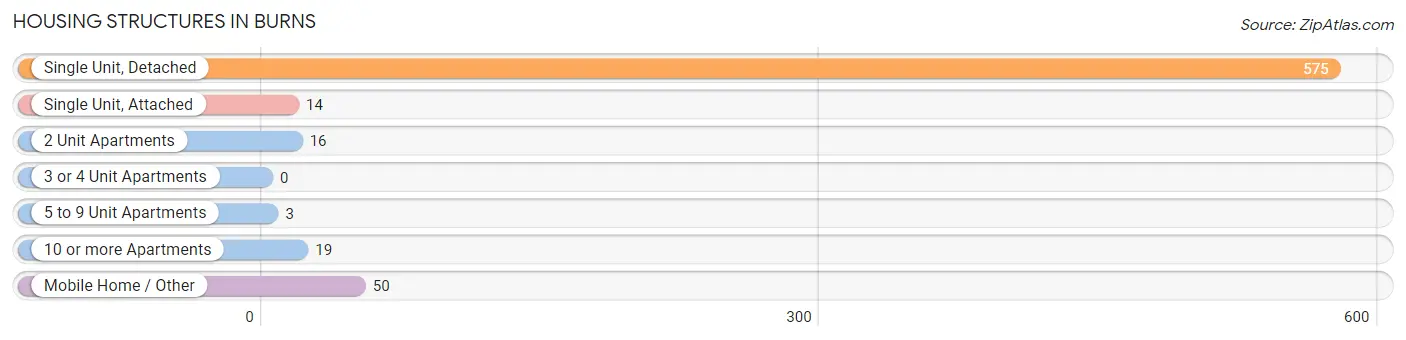
| Structure Type | # Housing Units | % Housing Units |
| Single Unit, Detached | 575 | 84.9% |
| Single Unit, Attached | 14 | 2.1% |
| 2 Unit Apartments | 16 | 2.4% |
| 3 or 4 Unit Apartments | 0 | 0.0% |
| 5 to 9 Unit Apartments | 3 | 0.4% |
| 10 or more Apartments | 19 | 2.8% |
| Mobile Home / Other | 50 | 7.4% |
| Total | 677 | 100.0% |
Housing Structures by Occupancy in Burns
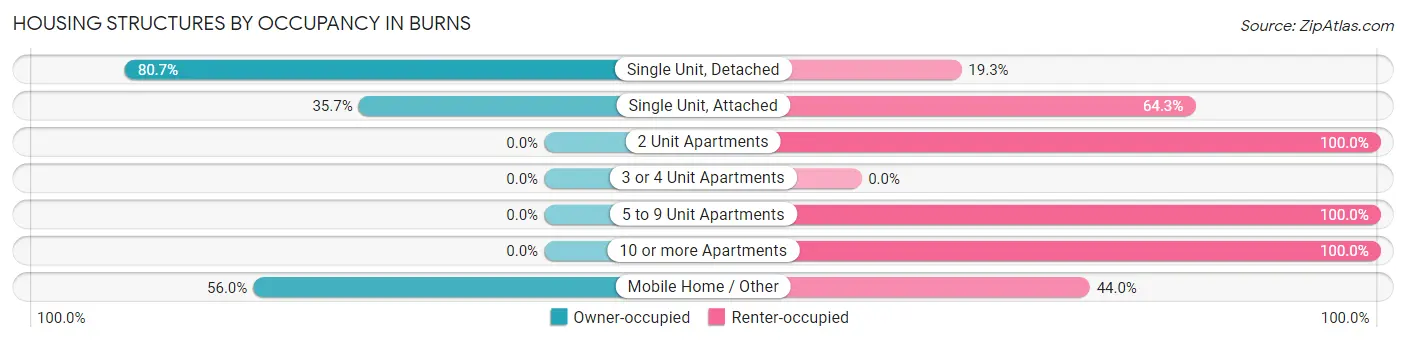
| Structure Type | Owner-occupied | Renter-occupied |
| Single Unit, Detached | 464 (80.7%) | 111 (19.3%) |
| Single Unit, Attached | 5 (35.7%) | 9 (64.3%) |
| 2 Unit Apartments | 0 (0.0%) | 16 (100.0%) |
| 3 or 4 Unit Apartments | 0 (0.0%) | 0 (0.0%) |
| 5 to 9 Unit Apartments | 0 (0.0%) | 3 (100.0%) |
| 10 or more Apartments | 0 (0.0%) | 19 (100.0%) |
| Mobile Home / Other | 28 (56.0%) | 22 (44.0%) |
| Total | 497 (73.4%) | 180 (26.6%) |
Housing Structures by Number of Rooms in Burns
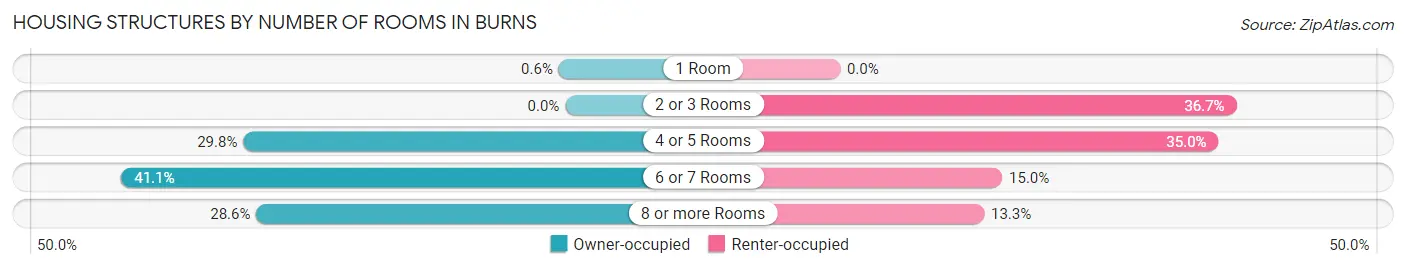
| Number of Rooms | Owner-occupied | Renter-occupied |
| 1 Room | 3 (0.6%) | 0 (0.0%) |
| 2 or 3 Rooms | 0 (0.0%) | 66 (36.7%) |
| 4 or 5 Rooms | 148 (29.8%) | 63 (35.0%) |
| 6 or 7 Rooms | 204 (41.0%) | 27 (15.0%) |
| 8 or more Rooms | 142 (28.6%) | 24 (13.3%) |
| Total | 497 (100.0%) | 180 (100.0%) |
Housing Structure by Heating Type in Burns
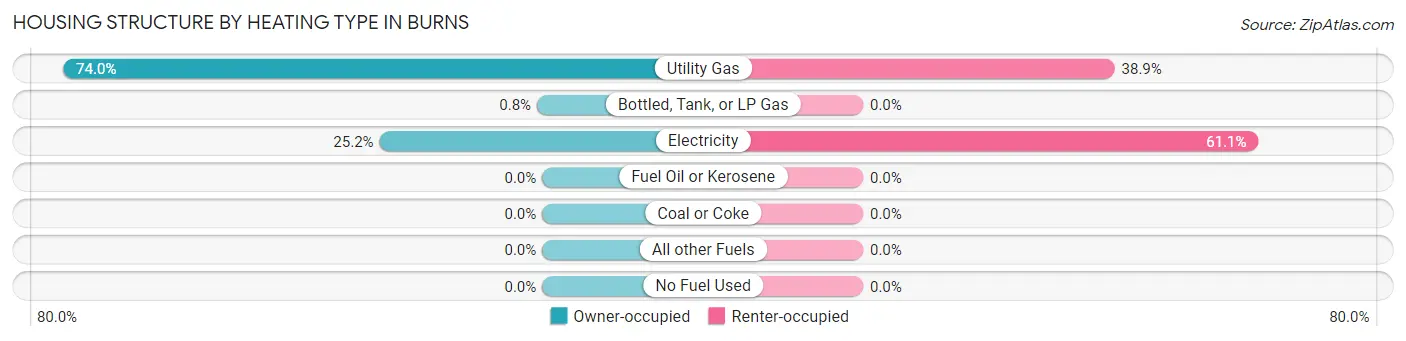
| Heating Type | Owner-occupied | Renter-occupied |
| Utility Gas | 368 (74.0%) | 70 (38.9%) |
| Bottled, Tank, or LP Gas | 4 (0.8%) | 0 (0.0%) |
| Electricity | 125 (25.2%) | 110 (61.1%) |
| Fuel Oil or Kerosene | 0 (0.0%) | 0 (0.0%) |
| Coal or Coke | 0 (0.0%) | 0 (0.0%) |
| All other Fuels | 0 (0.0%) | 0 (0.0%) |
| No Fuel Used | 0 (0.0%) | 0 (0.0%) |
| Total | 497 (100.0%) | 180 (100.0%) |
Household Vehicle Usage in Burns
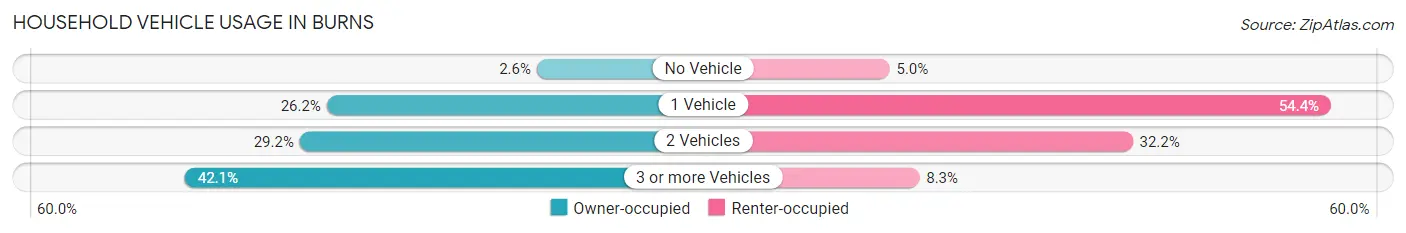
| Vehicles per Household | Owner-occupied | Renter-occupied |
| No Vehicle | 13 (2.6%) | 9 (5.0%) |
| 1 Vehicle | 130 (26.2%) | 98 (54.4%) |
| 2 Vehicles | 145 (29.2%) | 58 (32.2%) |
| 3 or more Vehicles | 209 (42.0%) | 15 (8.3%) |
| Total | 497 (100.0%) | 180 (100.0%) |
Real Estate & Mortgages in Burns
Real Estate and Mortgage Overview in Burns
| Characteristic | Without Mortgage | With Mortgage |
| Housing Units | 233 | 264 |
| Median Property Value | $223,700 | $241,700 |
| Median Household Income | $65,592 | $54 |
| Monthly Housing Costs | $416 | $6 |
| Real Estate Taxes | $1,179 | $3 |
Property Value by Mortgage Status in Burns
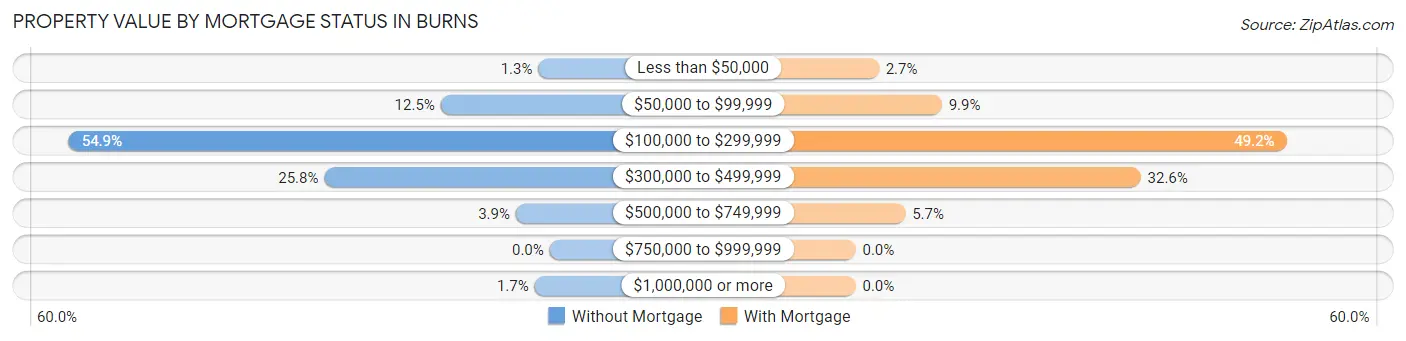
| Property Value | Without Mortgage | With Mortgage |
| Less than $50,000 | 3 (1.3%) | 7 (2.6%) |
| $50,000 to $99,999 | 29 (12.4%) | 26 (9.9%) |
| $100,000 to $299,999 | 128 (54.9%) | 130 (49.2%) |
| $300,000 to $499,999 | 60 (25.8%) | 86 (32.6%) |
| $500,000 to $749,999 | 9 (3.9%) | 15 (5.7%) |
| $750,000 to $999,999 | 0 (0.0%) | 0 (0.0%) |
| $1,000,000 or more | 4 (1.7%) | 0 (0.0%) |
| Total | 233 (100.0%) | 264 (100.0%) |
Household Income by Mortgage Status in Burns
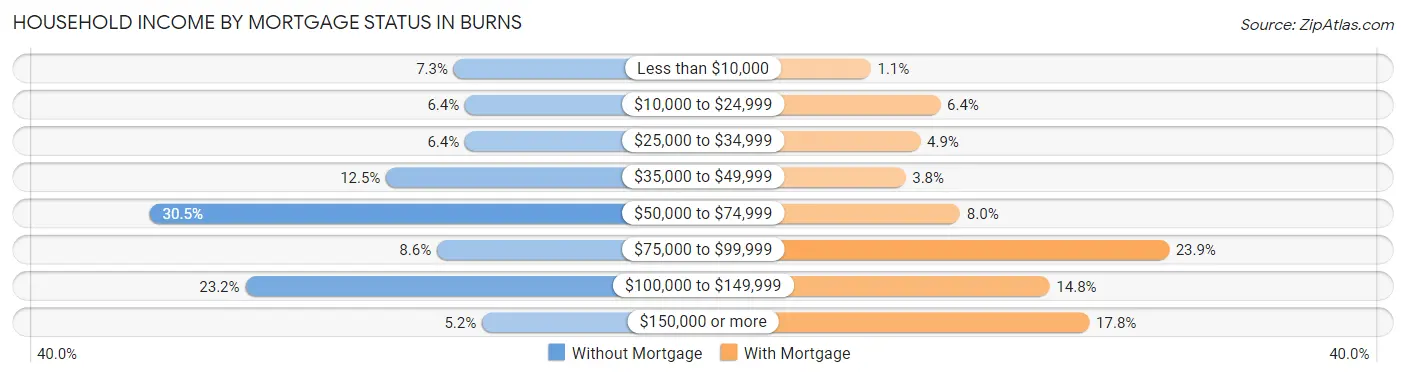
| Household Income | Without Mortgage | With Mortgage |
| Less than $10,000 | 17 (7.3%) | 3 (1.1%) |
| $10,000 to $24,999 | 15 (6.4%) | 17 (6.4%) |
| $25,000 to $34,999 | 15 (6.4%) | 13 (4.9%) |
| $35,000 to $49,999 | 29 (12.4%) | 10 (3.8%) |
| $50,000 to $74,999 | 71 (30.5%) | 21 (8.0%) |
| $75,000 to $99,999 | 20 (8.6%) | 63 (23.9%) |
| $100,000 to $149,999 | 54 (23.2%) | 39 (14.8%) |
| $150,000 or more | 12 (5.1%) | 47 (17.8%) |
| Total | 233 (100.0%) | 264 (100.0%) |
Property Value to Household Income Ratio in Burns
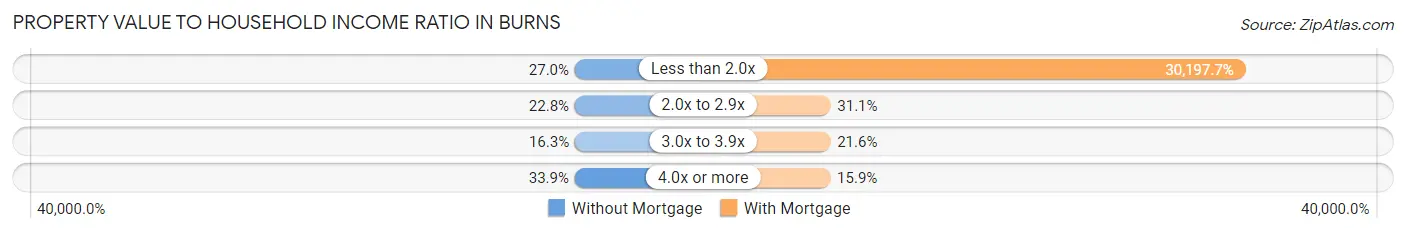
| Value-to-Income Ratio | Without Mortgage | With Mortgage |
| Less than 2.0x | 63 (27.0%) | 79,722 (30,197.7%) |
| 2.0x to 2.9x | 53 (22.8%) | 82 (31.1%) |
| 3.0x to 3.9x | 38 (16.3%) | 57 (21.6%) |
| 4.0x or more | 79 (33.9%) | 42 (15.9%) |
| Total | 233 (100.0%) | 264 (100.0%) |
Real Estate Taxes by Mortgage Status in Burns
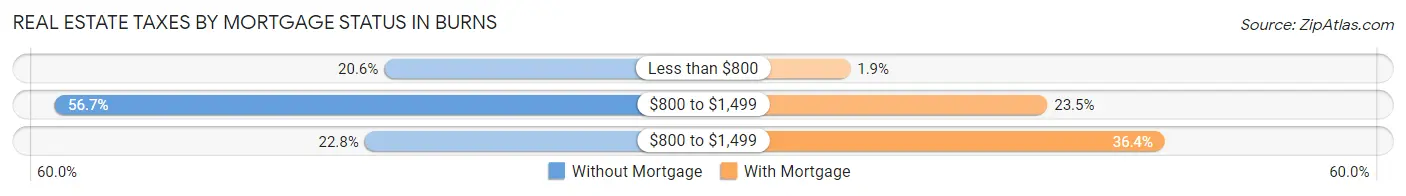
| Property Taxes | Without Mortgage | With Mortgage |
| Less than $800 | 48 (20.6%) | 5 (1.9%) |
| $800 to $1,499 | 132 (56.7%) | 62 (23.5%) |
| $800 to $1,499 | 53 (22.8%) | 96 (36.4%) |
| Total | 233 (100.0%) | 264 (100.0%) |
Health & Disability in Burns
Health Insurance Coverage by Age in Burns
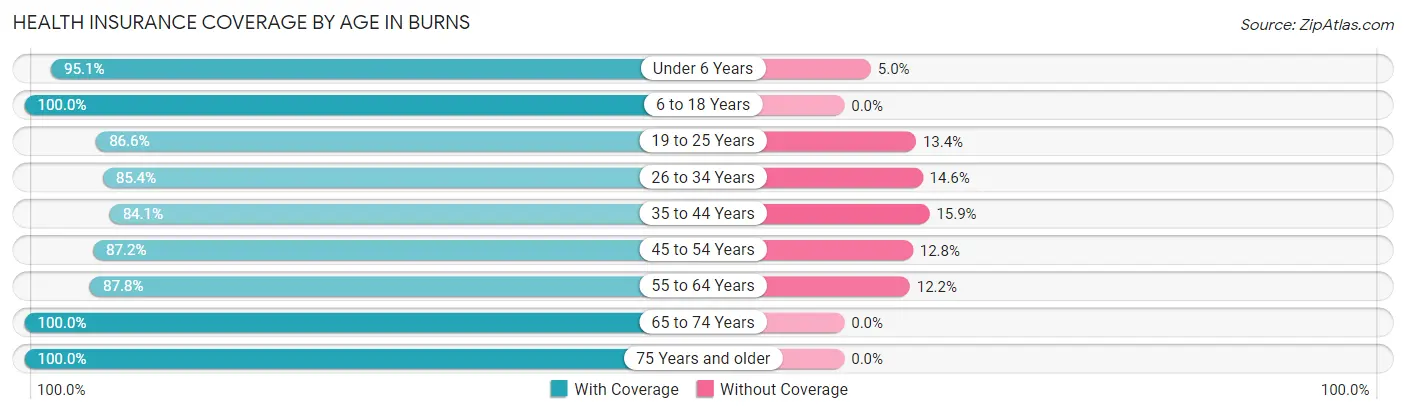
| Age Bracket | With Coverage | Without Coverage |
| Under 6 Years | 173 (95.1%) | 9 (5.0%) |
| 6 to 18 Years | 153 (100.0%) | 0 (0.0%) |
| 19 to 25 Years | 188 (86.6%) | 29 (13.4%) |
| 26 to 34 Years | 117 (85.4%) | 20 (14.6%) |
| 35 to 44 Years | 233 (84.1%) | 44 (15.9%) |
| 45 to 54 Years | 205 (87.2%) | 30 (12.8%) |
| 55 to 64 Years | 194 (87.8%) | 27 (12.2%) |
| 65 to 74 Years | 223 (100.0%) | 0 (0.0%) |
| 75 Years and older | 57 (100.0%) | 0 (0.0%) |
| Total | 1,543 (90.7%) | 159 (9.3%) |
Health Insurance Coverage by Citizenship Status in Burns
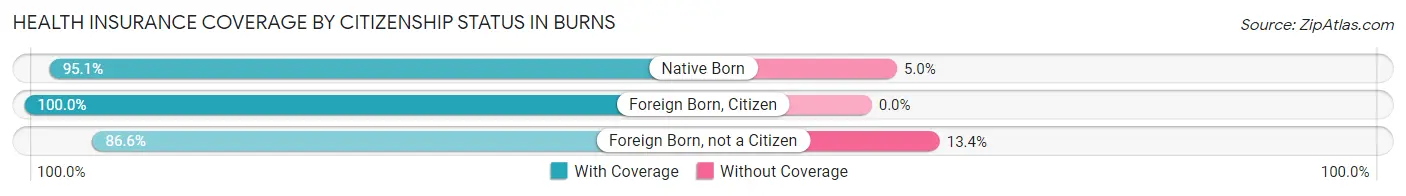
| Citizenship Status | With Coverage | Without Coverage |
| Native Born | 173 (95.1%) | 9 (5.0%) |
| Foreign Born, Citizen | 153 (100.0%) | 0 (0.0%) |
| Foreign Born, not a Citizen | 188 (86.6%) | 29 (13.4%) |
Health Insurance Coverage by Household Income in Burns
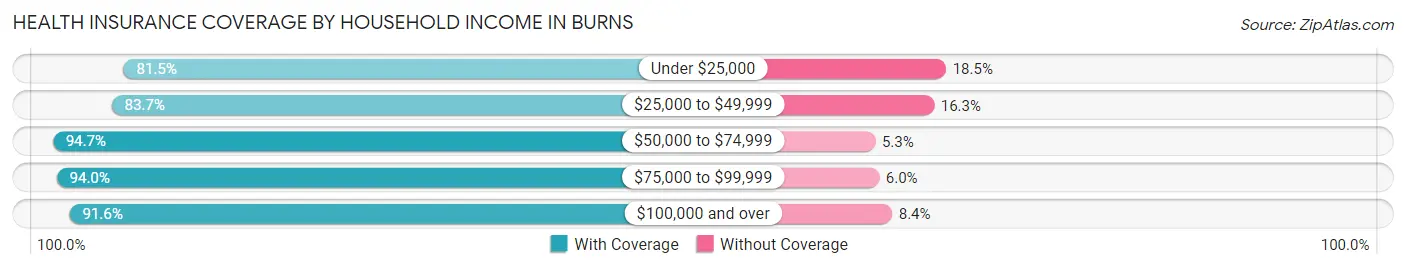
| Household Income | With Coverage | Without Coverage |
| Under $25,000 | 123 (81.5%) | 28 (18.5%) |
| $25,000 to $49,999 | 226 (83.7%) | 44 (16.3%) |
| $50,000 to $74,999 | 521 (94.7%) | 29 (5.3%) |
| $75,000 to $99,999 | 141 (94.0%) | 9 (6.0%) |
| $100,000 and over | 532 (91.6%) | 49 (8.4%) |
Public vs Private Health Insurance Coverage by Age in Burns
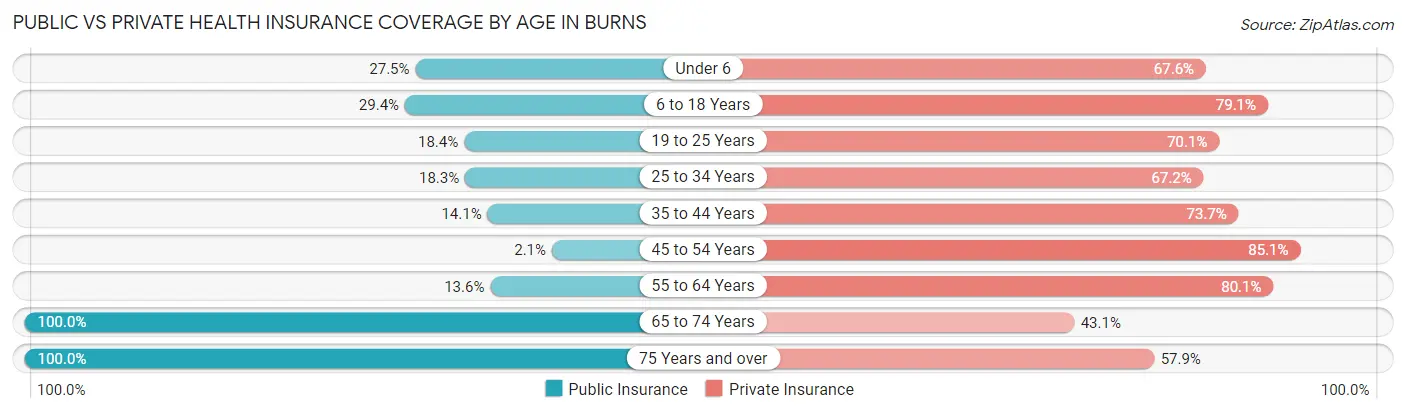
| Age Bracket | Public Insurance | Private Insurance |
| Under 6 | 50 (27.5%) | 123 (67.6%) |
| 6 to 18 Years | 45 (29.4%) | 121 (79.1%) |
| 19 to 25 Years | 40 (18.4%) | 152 (70.1%) |
| 25 to 34 Years | 25 (18.2%) | 92 (67.1%) |
| 35 to 44 Years | 39 (14.1%) | 204 (73.7%) |
| 45 to 54 Years | 5 (2.1%) | 200 (85.1%) |
| 55 to 64 Years | 30 (13.6%) | 177 (80.1%) |
| 65 to 74 Years | 223 (100.0%) | 96 (43.0%) |
| 75 Years and over | 57 (100.0%) | 33 (57.9%) |
| Total | 514 (30.2%) | 1,198 (70.4%) |
Disability Status by Sex by Age in Burns
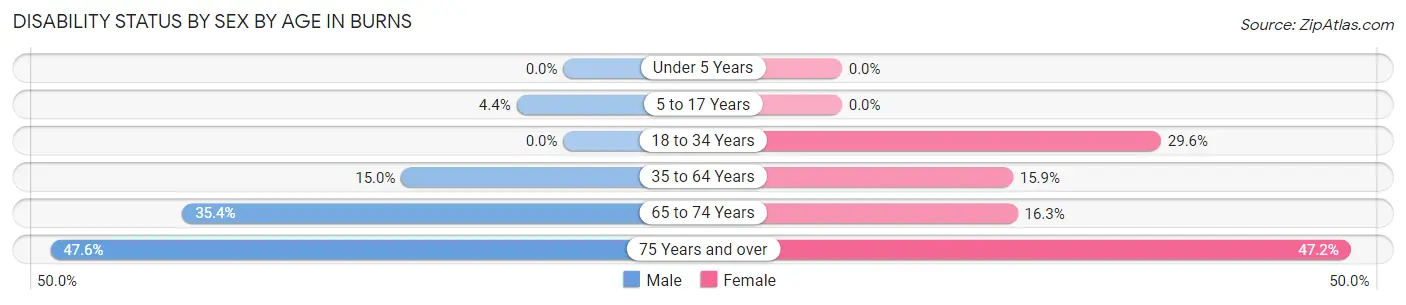
| Age Bracket | Male | Female |
| Under 5 Years | 0 (0.0%) | 0 (0.0%) |
| 5 to 17 Years | 4 (4.3%) | 0 (0.0%) |
| 18 to 34 Years | 0 (0.0%) | 61 (29.6%) |
| 35 to 64 Years | 60 (15.0%) | 53 (15.9%) |
| 65 to 74 Years | 29 (35.4%) | 23 (16.3%) |
| 75 Years and over | 10 (47.6%) | 17 (47.2%) |
Disability Class by Sex by Age in Burns
Disability Class: Hearing Difficulty
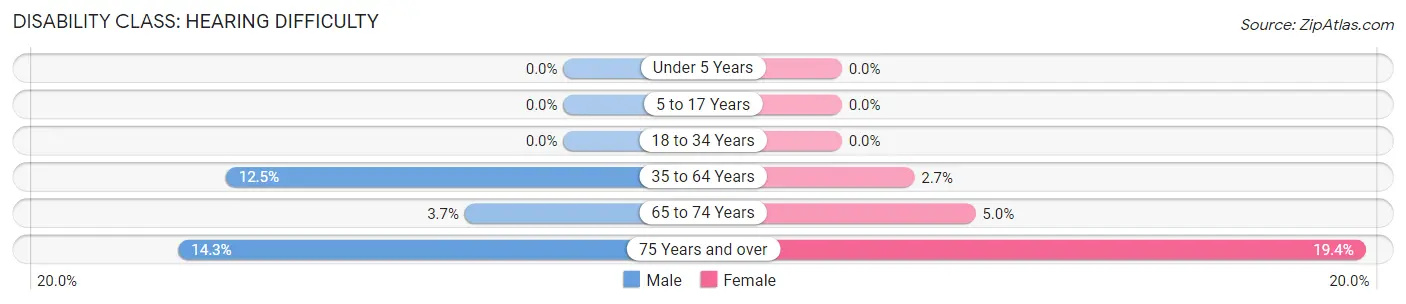
| Age Bracket | Male | Female |
| Under 5 Years | 0 (0.0%) | 0 (0.0%) |
| 5 to 17 Years | 0 (0.0%) | 0 (0.0%) |
| 18 to 34 Years | 0 (0.0%) | 0 (0.0%) |
| 35 to 64 Years | 50 (12.5%) | 9 (2.7%) |
| 65 to 74 Years | 3 (3.7%) | 7 (5.0%) |
| 75 Years and over | 3 (14.3%) | 7 (19.4%) |
Disability Class: Vision Difficulty
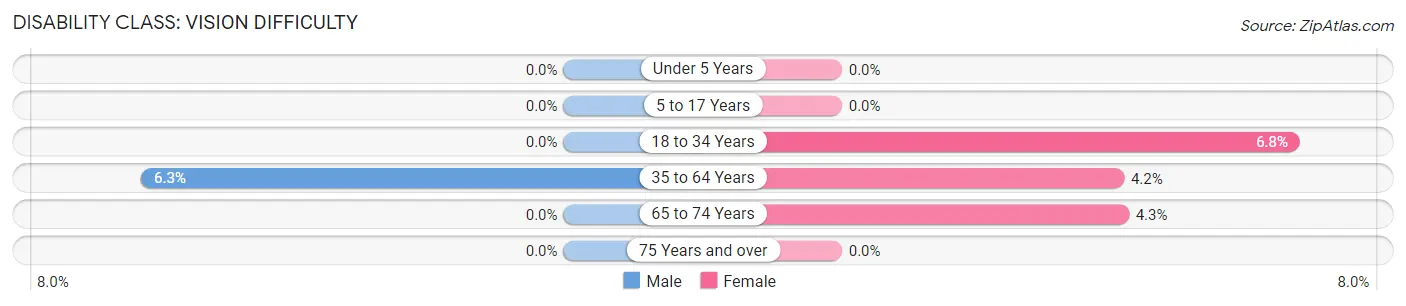
| Age Bracket | Male | Female |
| Under 5 Years | 0 (0.0%) | 0 (0.0%) |
| 5 to 17 Years | 0 (0.0%) | 0 (0.0%) |
| 18 to 34 Years | 0 (0.0%) | 14 (6.8%) |
| 35 to 64 Years | 25 (6.3%) | 14 (4.2%) |
| 65 to 74 Years | 0 (0.0%) | 6 (4.3%) |
| 75 Years and over | 0 (0.0%) | 0 (0.0%) |
Disability Class: Cognitive Difficulty
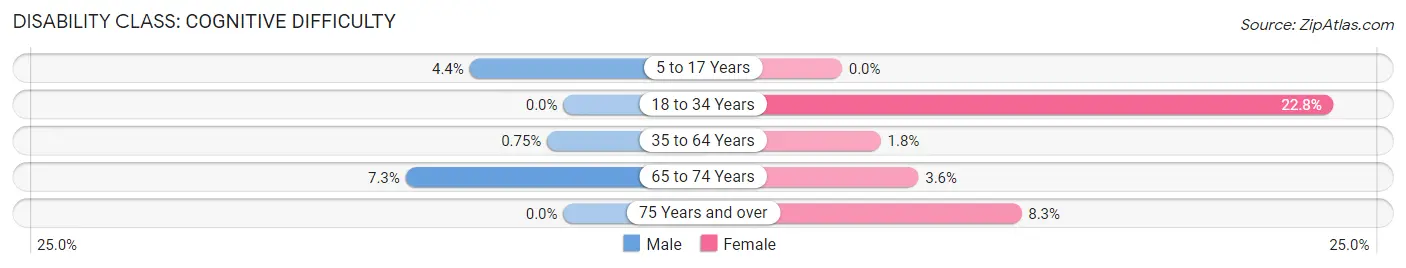
| Age Bracket | Male | Female |
| 5 to 17 Years | 4 (4.3%) | 0 (0.0%) |
| 18 to 34 Years | 0 (0.0%) | 47 (22.8%) |
| 35 to 64 Years | 3 (0.7%) | 6 (1.8%) |
| 65 to 74 Years | 6 (7.3%) | 5 (3.5%) |
| 75 Years and over | 0 (0.0%) | 3 (8.3%) |
Disability Class: Ambulatory Difficulty
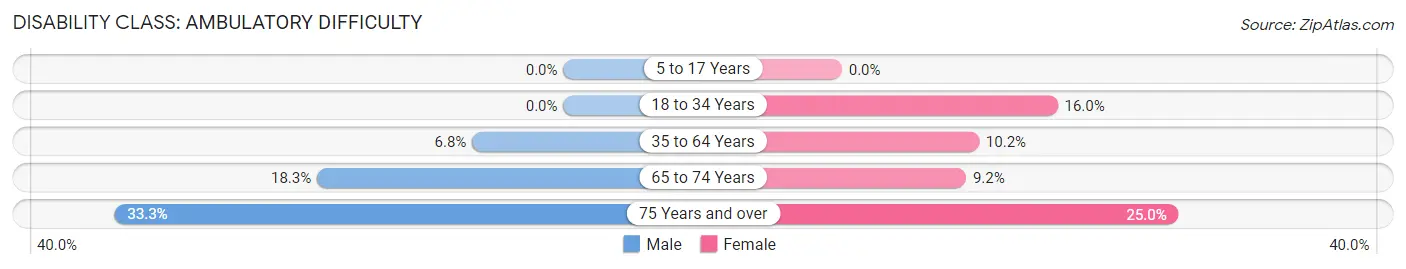
| Age Bracket | Male | Female |
| 5 to 17 Years | 0 (0.0%) | 0 (0.0%) |
| 18 to 34 Years | 0 (0.0%) | 33 (16.0%) |
| 35 to 64 Years | 27 (6.8%) | 34 (10.2%) |
| 65 to 74 Years | 15 (18.3%) | 13 (9.2%) |
| 75 Years and over | 7 (33.3%) | 9 (25.0%) |
Disability Class: Self-Care Difficulty
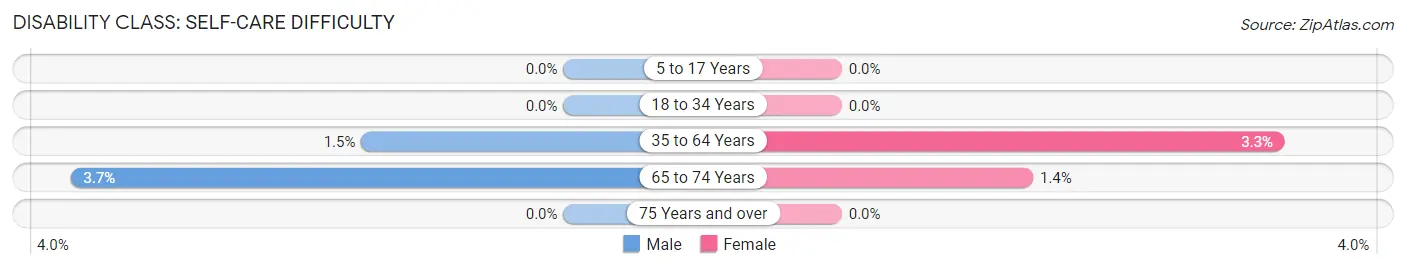
| Age Bracket | Male | Female |
| 5 to 17 Years | 0 (0.0%) | 0 (0.0%) |
| 18 to 34 Years | 0 (0.0%) | 0 (0.0%) |
| 35 to 64 Years | 6 (1.5%) | 11 (3.3%) |
| 65 to 74 Years | 3 (3.7%) | 2 (1.4%) |
| 75 Years and over | 0 (0.0%) | 0 (0.0%) |
Technology Access in Burns
Computing Device Access in Burns
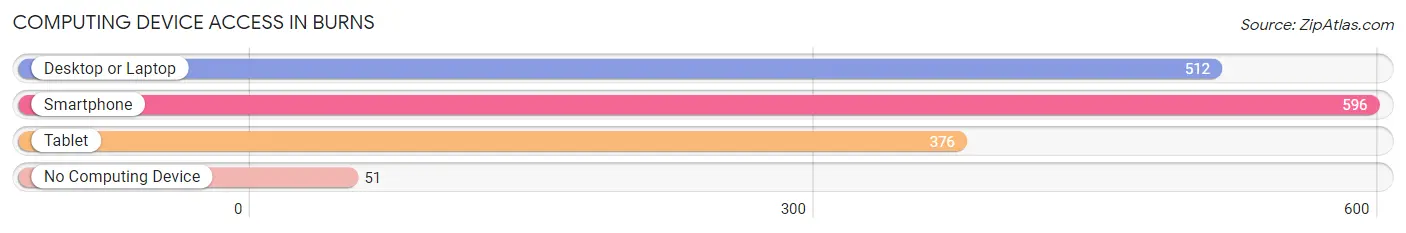
| Device Type | # Households | % Households |
| Desktop or Laptop | 512 | 75.6% |
| Smartphone | 596 | 88.0% |
| Tablet | 376 | 55.5% |
| No Computing Device | 51 | 7.5% |
| Total | 677 | 100.0% |
Internet Access in Burns
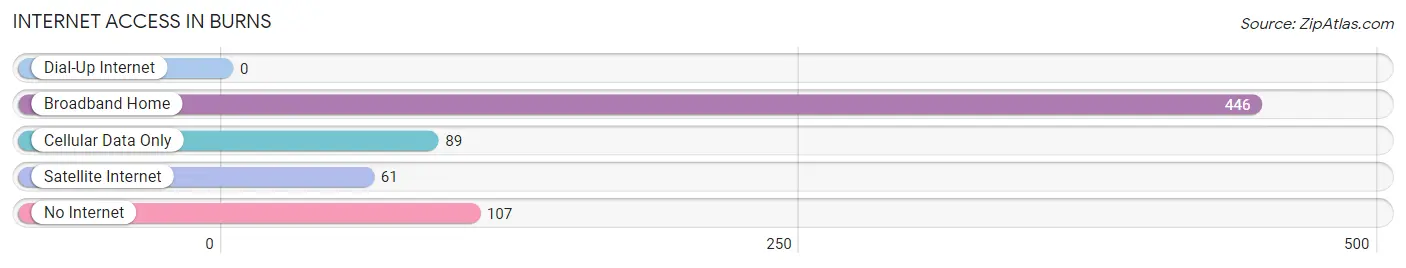
| Internet Type | # Households | % Households |
| Dial-Up Internet | 0 | 0.0% |
| Broadband Home | 446 | 65.9% |
| Cellular Data Only | 89 | 13.2% |
| Satellite Internet | 61 | 9.0% |
| No Internet | 107 | 15.8% |
| Total | 677 | 100.0% |
Burns Summary
Burns, Tennessee is a small town located in Dickson County, approximately 30 miles west of Nashville. The town was founded in 1810 and is named after the Burns family, who were among the first settlers in the area. The population of Burns was 1,845 as of the 2010 census.
Geography
Burns is located in the rolling hills of Middle Tennessee, with an elevation of 590 feet. The town is situated along the banks of the Harpeth River, which flows through the center of town. The town is surrounded by farmland and is located near the Natchez Trace Parkway.
Economy
The economy of Burns is largely based on agriculture, with the majority of the population employed in farming and related industries. The town is also home to several small businesses, including a grocery store, a hardware store, and a few restaurants.
Demographics
As of the 2010 census, the population of Burns was 1,845. The racial makeup of the town was 95.3% White, 2.2% African American, 0.3% Native American, 0.2% Asian, 0.1% Pacific Islander, 0.7% from other races, and 1.2% from two or more races. Hispanic or Latino of any race were 1.7% of the population.
The median income for a household in Burns was $37,917, and the median income for a family was $45,938. The per capita income for the town was $18,945. About 11.2% of families and 14.2% of the population were below the poverty line, including 18.2% of those under age 18 and 11.2% of those age 65 or over.
History
Burns was founded in 1810 by the Burns family, who were among the first settlers in the area. The town was originally known as Burnsville, but the name was changed to Burns in 1871. The town was incorporated in 1875 and has remained relatively unchanged since then.
The town was an important stop on the Natchez Trace, a historic trail that connected Nashville to Natchez, Mississippi. The trail was used by Native Americans, settlers, and traders, and was an important part of the town's early history.
In the late 19th century, Burns was a thriving agricultural center, with a number of cotton gins, grist mills, and other businesses. The town was also home to several churches, a school, and a post office.
In the early 20th century, Burns experienced a period of growth and prosperity. The town was home to several businesses, including a bank, a hotel, and a movie theater. The town also had a thriving music scene, with several local bands playing in the area.
In the late 20th century, Burns experienced a period of decline, as many of the businesses and industries in the area closed or moved away. The town has since experienced a resurgence, with several new businesses opening in recent years.
Today, Burns is a small but vibrant town, with a strong sense of community and a rich history. The town is home to several churches, a library, a museum, and a number of small businesses. The town is also home to a number of festivals and events throughout the year, including the annual Burns Festival, which celebrates the town's history and culture.
Common Questions
What is Per Capita Income in Burns?
Per Capita income in Burns is $32,590.
What is the Median Family Income in Burns?
Median Family Income in Burns is $74,125.
What is the Median Household income in Burns?
Median Household Income in Burns is $61,250.
What is Income or Wage Gap in Burns?
Income or Wage Gap in Burns is 22.4%.
Women in Burns earn 77.6 cents for every dollar earned by a man.
What is Inequality or Gini Index in Burns?
Inequality or Gini Index in Burns is 0.42.
What is the Total Population of Burns?
Total Population of Burns is 1,702.
What is the Total Male Population of Burns?
Total Male Population of Burns is 828.
What is the Total Female Population of Burns?
Total Female Population of Burns is 874.
What is the Ratio of Males per 100 Females in Burns?
There are 94.74 Males per 100 Females in Burns.
What is the Ratio of Females per 100 Males in Burns?
There are 105.56 Females per 100 Males in Burns.
What is the Median Population Age in Burns?
Median Population Age in Burns is 41.8 Years.
What is the Average Family Size in Burns
Average Family Size in Burns is 3.0 People.
What is the Average Household Size in Burns
Average Household Size in Burns is 2.5 People.
How Large is the Labor Force in Burns?
There are 923 People in the Labor Forcein in Burns.
What is the Percentage of People in the Labor Force in Burns?
66.5% of People are in the Labor Force in Burns.
What is the Unemployment Rate in Burns?
Unemployment Rate in Burns is 2.1%.