Bulls Gap, TN Map & Demographics
Bulls Gap Map
Bulls Gap Overview
$24,812
PER CAPITA INCOME
$51,932
AVG FAMILY INCOME
$48,000
AVG HOUSEHOLD INCOME
48.5%
WAGE / INCOME GAP [ % ]
51.5¢/ $1
WAGE / INCOME GAP [ $ ]
0.41
INEQUALITY / GINI INDEX
875
TOTAL POPULATION
478
MALE POPULATION
397
FEMALE POPULATION
120.40
MALES / 100 FEMALES
83.05
FEMALES / 100 MALES
47.1
MEDIAN AGE
3.2
AVG FAMILY SIZE
2.4
AVG HOUSEHOLD SIZE
287
LABOR FORCE [ PEOPLE ]
40.9%
PERCENT IN LABOR FORCE
8.0%
UNEMPLOYMENT RATE
Bulls Gap Zip Codes
Bulls Gap Area Codes
Income in Bulls Gap
Income Overview in Bulls Gap
Per Capita Income in Bulls Gap is $24,812, while median incomes of families and households are $51,932 and $48,000 respectively.
| Characteristic | Number | Measure |
| Per Capita Income | 875 | $24,812 |
| Median Family Income | 207 | $51,932 |
| Mean Family Income | 207 | $65,152 |
| Median Household Income | 360 | $48,000 |
| Mean Household Income | 360 | $56,545 |
| Income Deficit | 207 | $0 |
| Wage / Income Gap (%) | 875 | 48.50% |
| Wage / Income Gap ($) | 875 | 51.50¢ per $1 |
| Gini / Inequality Index | 875 | 0.41 |
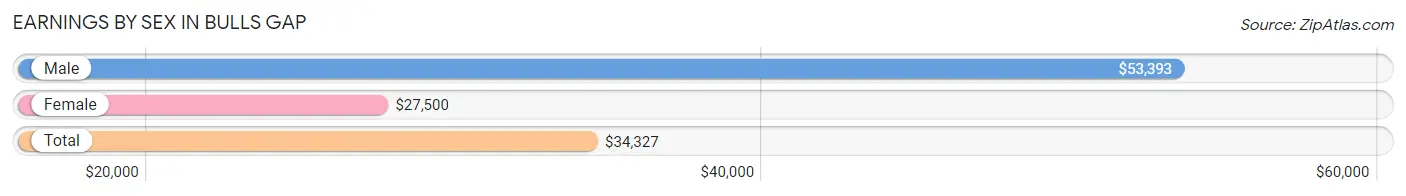
Earnings by Sex in Bulls Gap
Average Earnings in Bulls Gap are $34,327, $53,393 for men and $27,500 for women, a difference of 48.5%.
| Sex | Number | Average Earnings |
| Male | 155 (52.9%) | $53,393 |
| Female | 138 (47.1%) | $27,500 |
| Total | 293 (100.0%) | $34,327 |
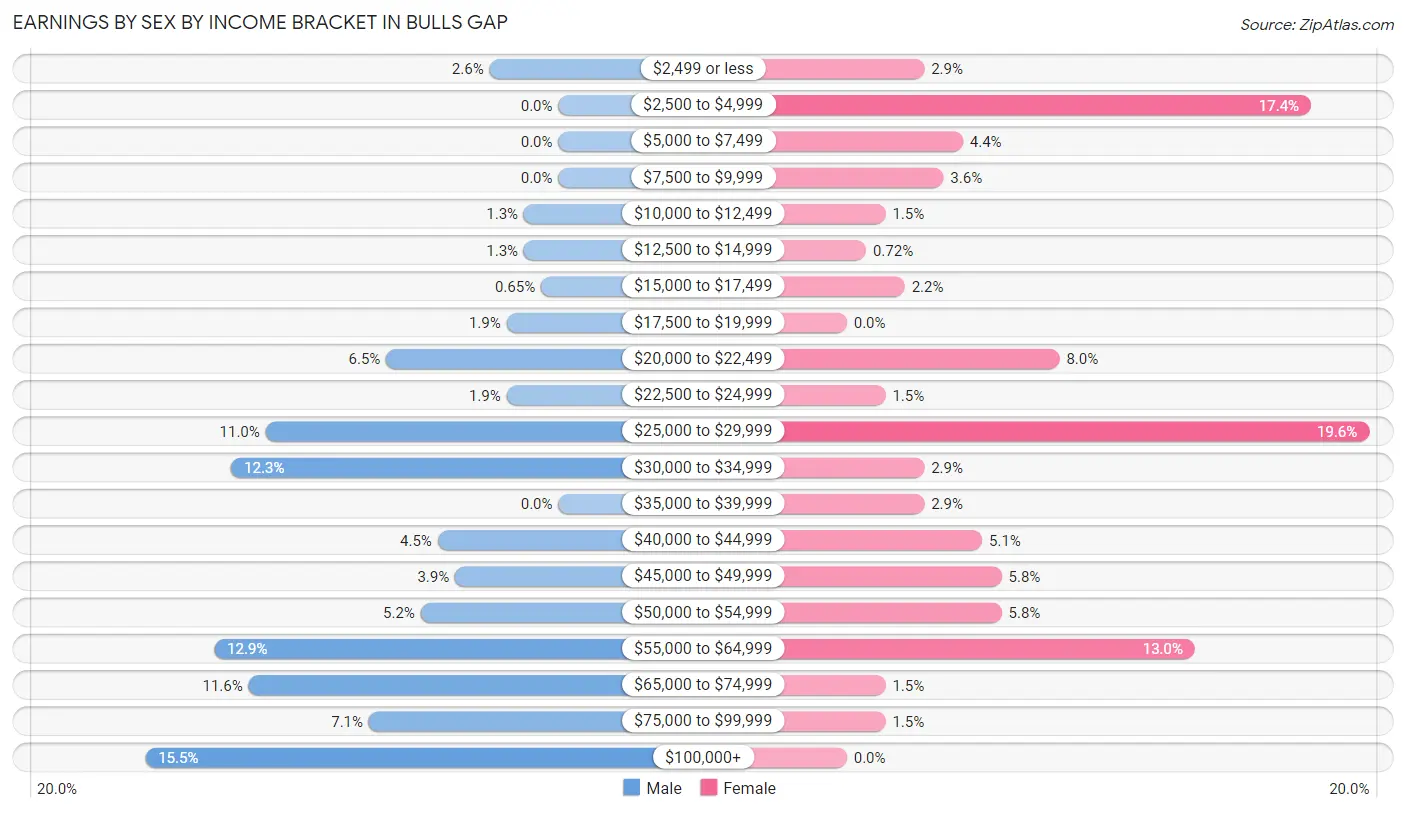
Earnings by Sex by Income Bracket in Bulls Gap
The most common earnings brackets in Bulls Gap are $100,000+ for men (24 | 15.5%) and $25,000 to $29,999 for women (27 | 19.6%).
| Income | Male | Female |
| $2,499 or less | 4 (2.6%) | 4 (2.9%) |
| $2,500 to $4,999 | 0 (0.0%) | 24 (17.4%) |
| $5,000 to $7,499 | 0 (0.0%) | 6 (4.3%) |
| $7,500 to $9,999 | 0 (0.0%) | 5 (3.6%) |
| $10,000 to $12,499 | 2 (1.3%) | 2 (1.5%) |
| $12,500 to $14,999 | 2 (1.3%) | 1 (0.7%) |
| $15,000 to $17,499 | 1 (0.6%) | 3 (2.2%) |
| $17,500 to $19,999 | 3 (1.9%) | 0 (0.0%) |
| $20,000 to $22,499 | 10 (6.5%) | 11 (8.0%) |
| $22,500 to $24,999 | 3 (1.9%) | 2 (1.5%) |
| $25,000 to $29,999 | 17 (11.0%) | 27 (19.6%) |
| $30,000 to $34,999 | 19 (12.3%) | 4 (2.9%) |
| $35,000 to $39,999 | 0 (0.0%) | 4 (2.9%) |
| $40,000 to $44,999 | 7 (4.5%) | 7 (5.1%) |
| $45,000 to $49,999 | 6 (3.9%) | 8 (5.8%) |
| $50,000 to $54,999 | 8 (5.2%) | 8 (5.8%) |
| $55,000 to $64,999 | 20 (12.9%) | 18 (13.0%) |
| $65,000 to $74,999 | 18 (11.6%) | 2 (1.5%) |
| $75,000 to $99,999 | 11 (7.1%) | 2 (1.5%) |
| $100,000+ | 24 (15.5%) | 0 (0.0%) |
| Total | 155 (100.0%) | 138 (100.0%) |
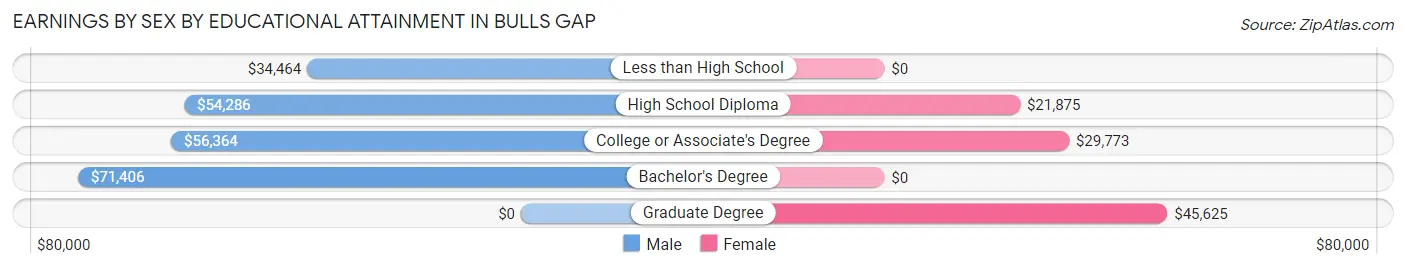
Earnings by Sex by Educational Attainment in Bulls Gap
Average earnings in Bulls Gap are $55,227 for men and $28,047 for women, a difference of 49.2%. Men with an educational attainment of bachelor's degree enjoy the highest average annual earnings of $71,406, while those with less than high school education earn the least with $34,464. Women with an educational attainment of graduate degree earn the most with the average annual earnings of $45,625, while those with high school diploma education have the smallest earnings of $21,875.
| Educational Attainment | Male Income | Female Income |
| Less than High School | $34,464 | $0 |
| High School Diploma | $54,286 | $21,875 |
| College or Associate's Degree | $56,364 | $29,773 |
| Bachelor's Degree | $71,406 | $0 |
| Graduate Degree | - | - |
| Total | $55,227 | $28,047 |
Family Income in Bulls Gap
Family Income Brackets in Bulls Gap
According to the Bulls Gap family income data, there are 41 families falling into the $100,000 to $149,999 income range, which is the most common income bracket and makes up 19.8% of all families. Conversely, the $10,000 to $14,999 income bracket is the least frequent group with only 2 families (1.0%) belonging to this category.
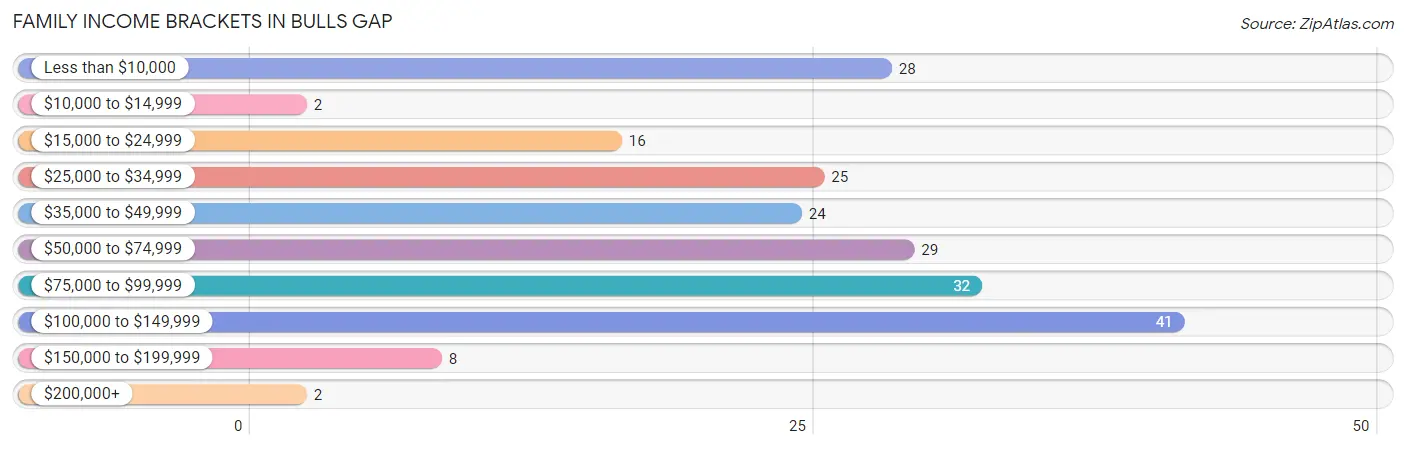
| Income Bracket | # Families | % Families |
| Less than $10,000 | 28 | 13.5% |
| $10,000 to $14,999 | 2 | 1.0% |
| $15,000 to $24,999 | 16 | 7.7% |
| $25,000 to $34,999 | 25 | 12.1% |
| $35,000 to $49,999 | 24 | 11.6% |
| $50,000 to $74,999 | 29 | 14.0% |
| $75,000 to $99,999 | 32 | 15.5% |
| $100,000 to $149,999 | 41 | 19.8% |
| $150,000 to $199,999 | 8 | 3.9% |
| $200,000+ | 2 | 1.0% |
Family Income by Famaliy Size in Bulls Gap
5-person families (11 | 5.3%) account for the highest median family income in Bulls Gap with $125,536 per family, while 3-person families (37 | 17.9%) have the highest median income of $31,131 per family member.
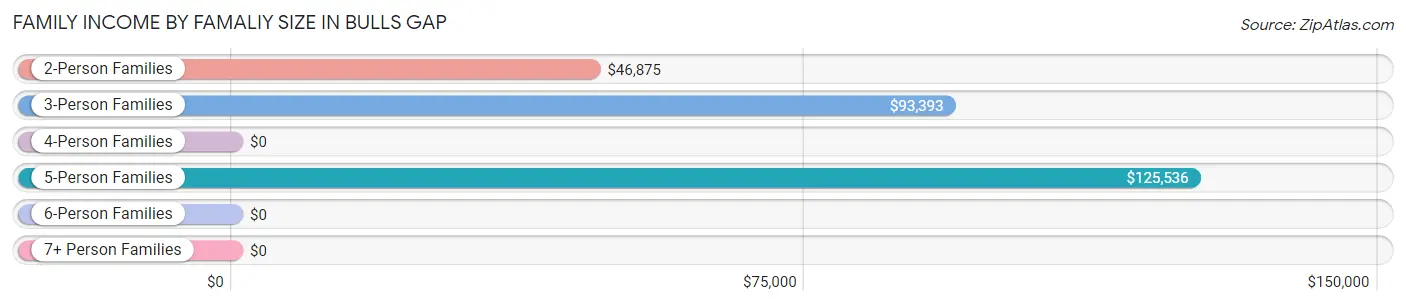
| Income Bracket | # Families | Median Income |
| 2-Person Families | 111 (53.6%) | $46,875 |
| 3-Person Families | 37 (17.9%) | $93,393 |
| 4-Person Families | 33 (15.9%) | $0 |
| 5-Person Families | 11 (5.3%) | $125,536 |
| 6-Person Families | 12 (5.8%) | $0 |
| 7+ Person Families | 3 (1.5%) | $0 |
| Total | 207 (100.0%) | $51,932 |
Family Income by Number of Earners in Bulls Gap
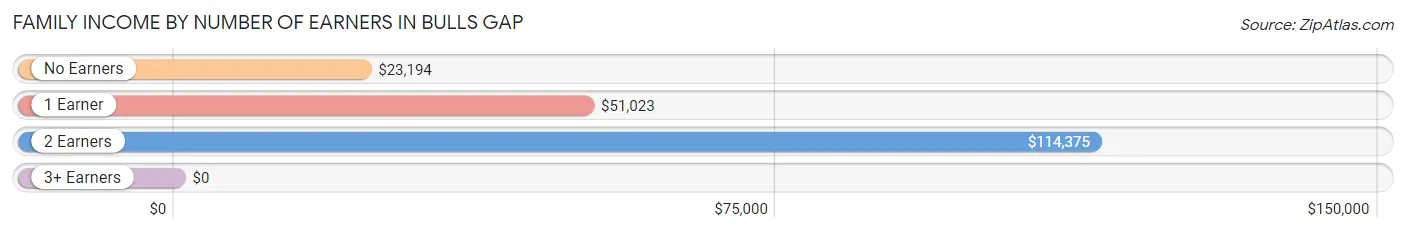
| Number of Earners | # Families | Median Income |
| No Earners | 65 (31.4%) | $23,194 |
| 1 Earner | 67 (32.4%) | $51,023 |
| 2 Earners | 67 (32.4%) | $114,375 |
| 3+ Earners | 8 (3.9%) | $0 |
| Total | 207 (100.0%) | $51,932 |
Household Income in Bulls Gap
Household Income Brackets in Bulls Gap
With 72 households falling in the category, the $75,000 to $99,999 income range is the most frequent in Bulls Gap, accounting for 20.0% of all households. In contrast, only 2 households (0.6%) fall into the $200,000+ income bracket, making it the least populous group.
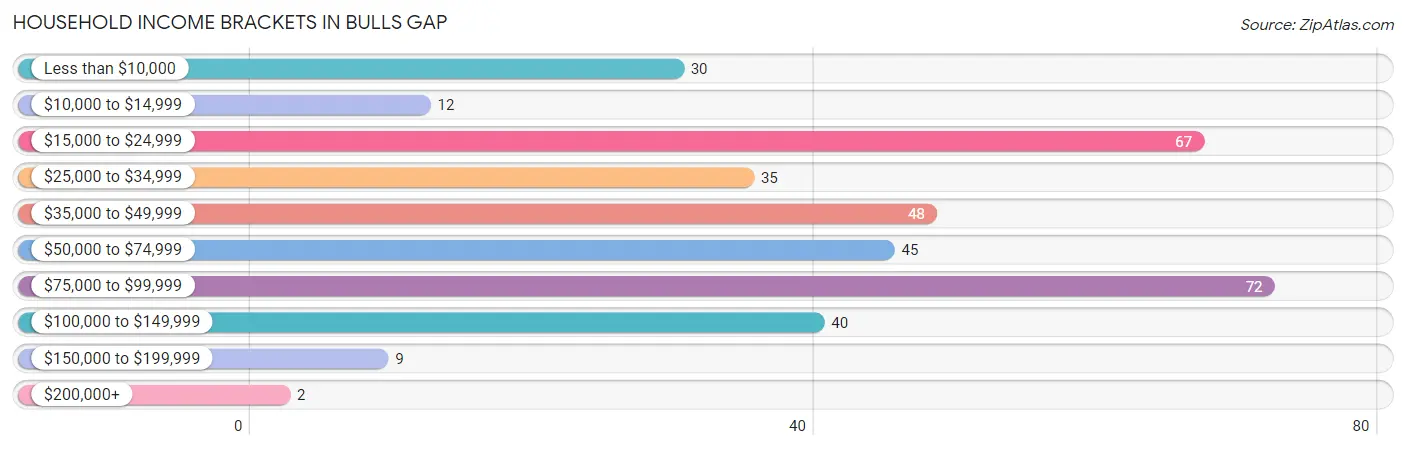
| Income Bracket | # Households | % Households |
| Less than $10,000 | 30 | 8.3% |
| $10,000 to $14,999 | 12 | 3.3% |
| $15,000 to $24,999 | 67 | 18.6% |
| $25,000 to $34,999 | 35 | 9.7% |
| $35,000 to $49,999 | 48 | 13.3% |
| $50,000 to $74,999 | 45 | 12.5% |
| $75,000 to $99,999 | 72 | 20.0% |
| $100,000 to $149,999 | 40 | 11.1% |
| $150,000 to $199,999 | 9 | 2.5% |
| $200,000+ | 2 | 0.6% |
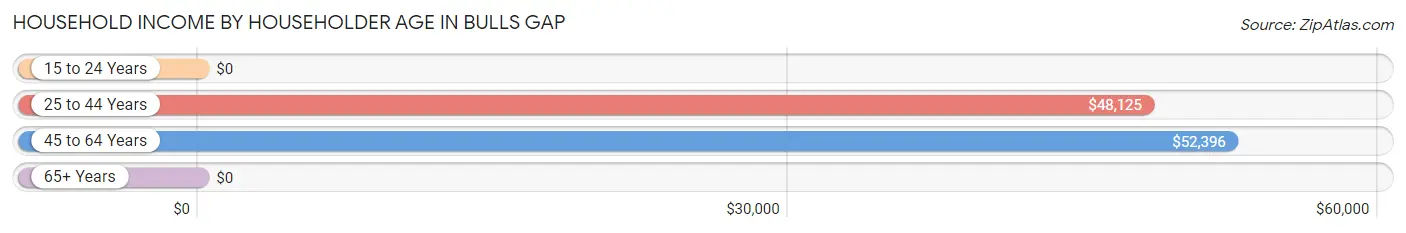
Household Income by Householder Age in Bulls Gap
The median household income in Bulls Gap is $48,000, with the highest median household income of $52,396 found in the 45 to 64 years age bracket for the primary householder. A total of 145 households (40.3%) fall into this category.
| Income Bracket | # Households | Median Income |
| 15 to 24 Years | 0 (0.0%) | $0 |
| 25 to 44 Years | 61 (16.9%) | $48,125 |
| 45 to 64 Years | 145 (40.3%) | $52,396 |
| 65+ Years | 154 (42.8%) | $0 |
| Total | 360 (100.0%) | $48,000 |
Poverty in Bulls Gap
Income Below Poverty by Sex and Age in Bulls Gap
With 15.3% poverty level for males and 20.6% for females among the residents of Bulls Gap, 12 to 14 year old males and 6 to 11 year old females are the most vulnerable to poverty, with 14 males (45.2%) and 25 females (59.5%) in their respective age groups living below the poverty level.
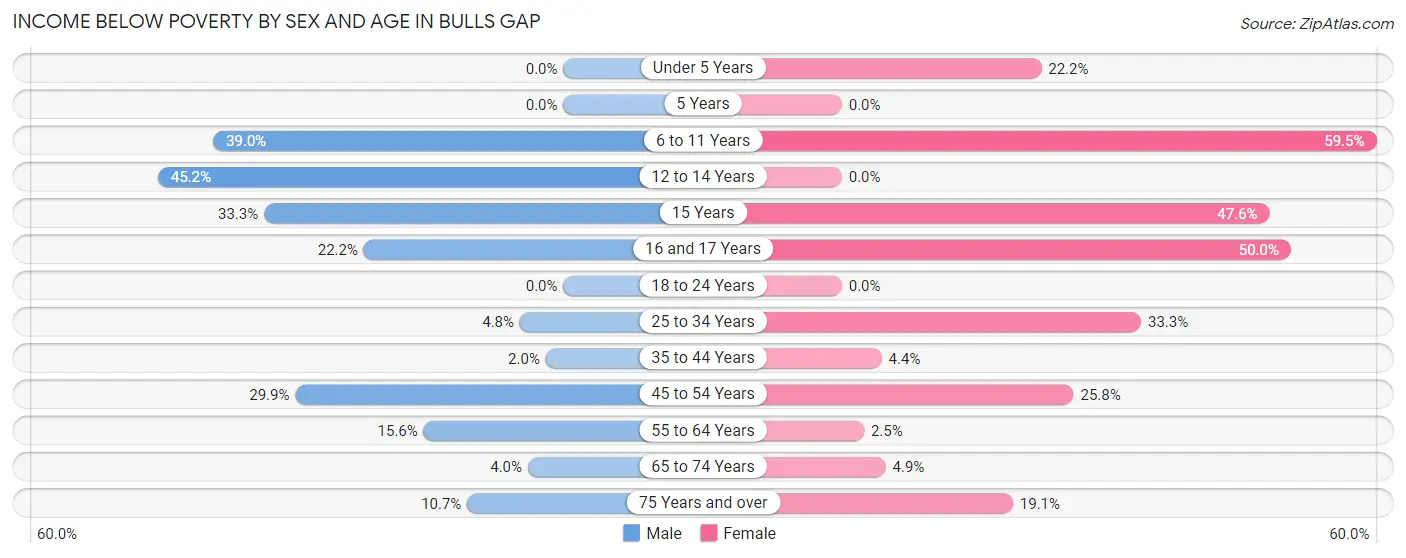
| Age Bracket | Male | Female |
| Under 5 Years | 0 (0.0%) | 4 (22.2%) |
| 5 Years | 0 (0.0%) | 0 (0.0%) |
| 6 to 11 Years | 16 (39.0%) | 25 (59.5%) |
| 12 to 14 Years | 14 (45.2%) | 0 (0.0%) |
| 15 Years | 1 (33.3%) | 10 (47.6%) |
| 16 and 17 Years | 2 (22.2%) | 2 (50.0%) |
| 18 to 24 Years | 0 (0.0%) | 0 (0.0%) |
| 25 to 34 Years | 3 (4.8%) | 15 (33.3%) |
| 35 to 44 Years | 1 (2.0%) | 2 (4.4%) |
| 45 to 54 Years | 20 (29.8%) | 16 (25.8%) |
| 55 to 64 Years | 7 (15.6%) | 2 (2.5%) |
| 65 to 74 Years | 3 (4.0%) | 2 (4.9%) |
| 75 Years and over | 6 (10.7%) | 4 (19.1%) |
| Total | 73 (15.3%) | 82 (20.6%) |
Income Above Poverty by Sex and Age in Bulls Gap
According to the poverty statistics in Bulls Gap, males aged under 5 years and females aged 12 to 14 years are the age groups that are most secure financially, with 100.0% of males and 100.0% of females in these age groups living above the poverty line.
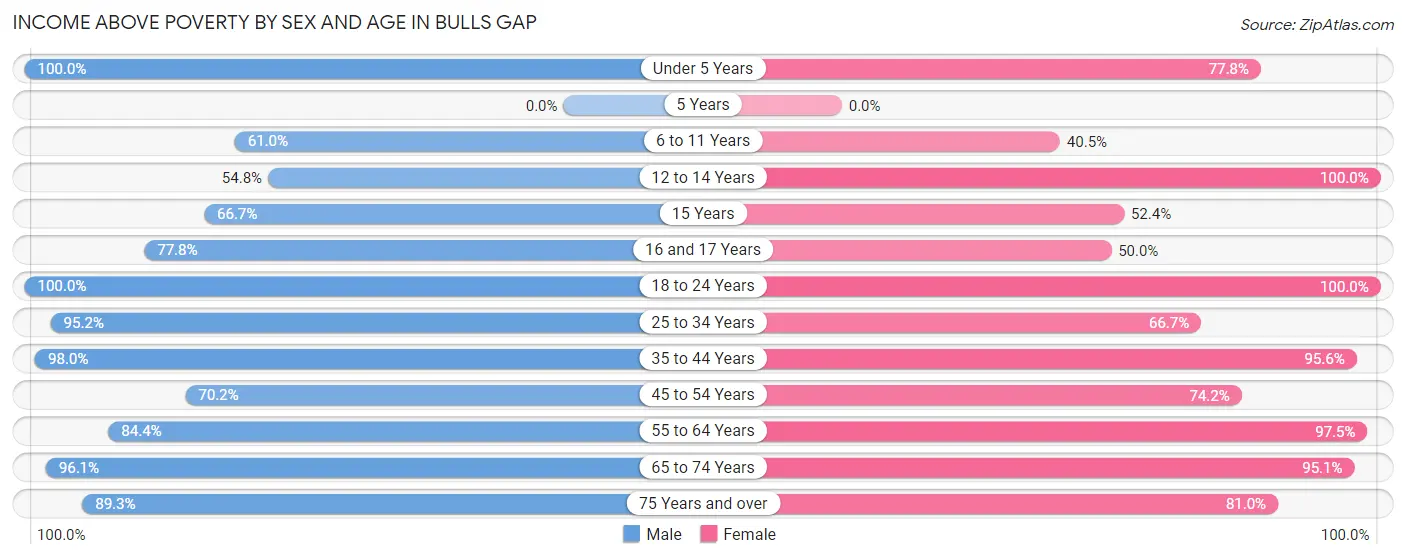
| Age Bracket | Male | Female |
| Under 5 Years | 8 (100.0%) | 14 (77.8%) |
| 5 Years | 0 (0.0%) | 0 (0.0%) |
| 6 to 11 Years | 25 (61.0%) | 17 (40.5%) |
| 12 to 14 Years | 17 (54.8%) | 10 (100.0%) |
| 15 Years | 2 (66.7%) | 11 (52.4%) |
| 16 and 17 Years | 7 (77.8%) | 2 (50.0%) |
| 18 to 24 Years | 29 (100.0%) | 7 (100.0%) |
| 25 to 34 Years | 59 (95.2%) | 30 (66.7%) |
| 35 to 44 Years | 50 (98.0%) | 43 (95.6%) |
| 45 to 54 Years | 47 (70.2%) | 46 (74.2%) |
| 55 to 64 Years | 38 (84.4%) | 79 (97.5%) |
| 65 to 74 Years | 73 (96.1%) | 39 (95.1%) |
| 75 Years and over | 50 (89.3%) | 17 (80.9%) |
| Total | 405 (84.7%) | 315 (79.3%) |
Income Below Poverty Among Married-Couple Families in Bulls Gap
The poverty statistics for married-couple families in Bulls Gap show that 8.0% or 11 of the total 138 families live below the poverty line. Families with no children have the highest poverty rate of 12.5%, comprising of 11 families. On the other hand, families with 1 or 2 children have the lowest poverty rate of 0.0%, which includes 0 families.
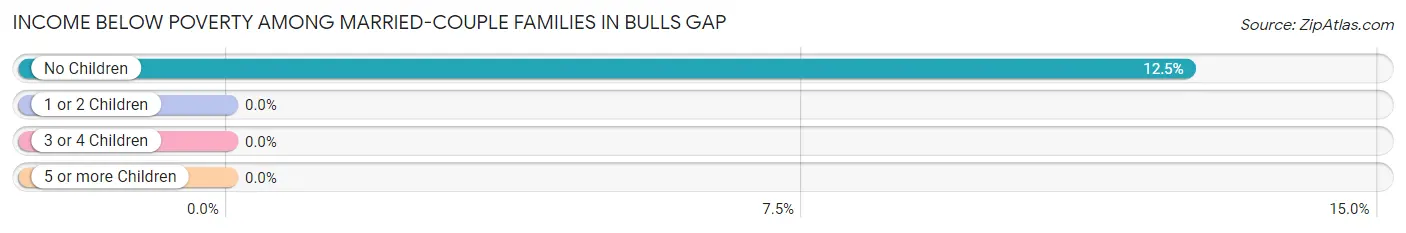
| Children | Above Poverty | Below Poverty |
| No Children | 77 (87.5%) | 11 (12.5%) |
| 1 or 2 Children | 36 (100.0%) | 0 (0.0%) |
| 3 or 4 Children | 14 (100.0%) | 0 (0.0%) |
| 5 or more Children | 0 (0.0%) | 0 (0.0%) |
| Total | 127 (92.0%) | 11 (8.0%) |
Income Below Poverty Among Single-Parent Households in Bulls Gap
According to the poverty data in Bulls Gap, 42.9% or 6 single-father households and 34.5% or 19 single-mother households are living below the poverty line. Among single-father households, those with 1 or 2 children have the highest poverty rate, with 6 households (75.0%) experiencing poverty. Likewise, among single-mother households, those with 3 or 4 children have the highest poverty rate, with 12 households (100.0%) falling below the poverty line.
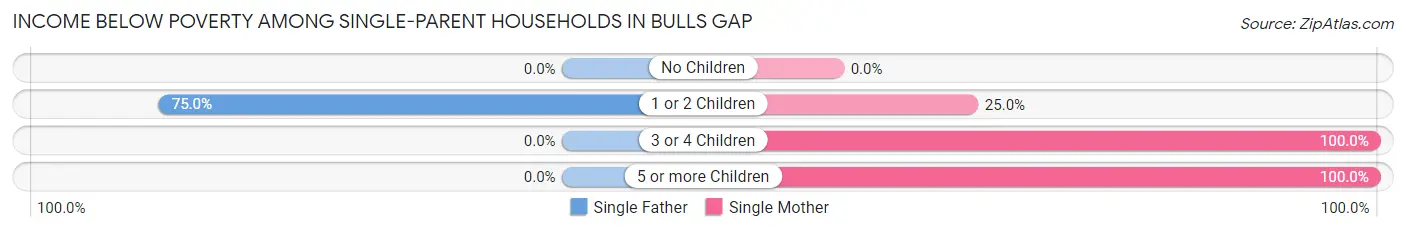
| Children | Single Father | Single Mother |
| No Children | 0 (0.0%) | 0 (0.0%) |
| 1 or 2 Children | 6 (75.0%) | 4 (25.0%) |
| 3 or 4 Children | 0 (0.0%) | 12 (100.0%) |
| 5 or more Children | 0 (0.0%) | 3 (100.0%) |
| Total | 6 (42.9%) | 19 (34.5%) |
Income Below Poverty Among Married-Couple vs Single-Parent Households in Bulls Gap
The poverty data for Bulls Gap shows that 11 of the married-couple family households (8.0%) and 25 of the single-parent households (36.2%) are living below the poverty level. Within the married-couple family households, those with no children have the highest poverty rate, with 11 households (12.5%) falling below the poverty line. Among the single-parent households, those with 5 or more children have the highest poverty rate, with 3 household (100.0%) living below poverty.
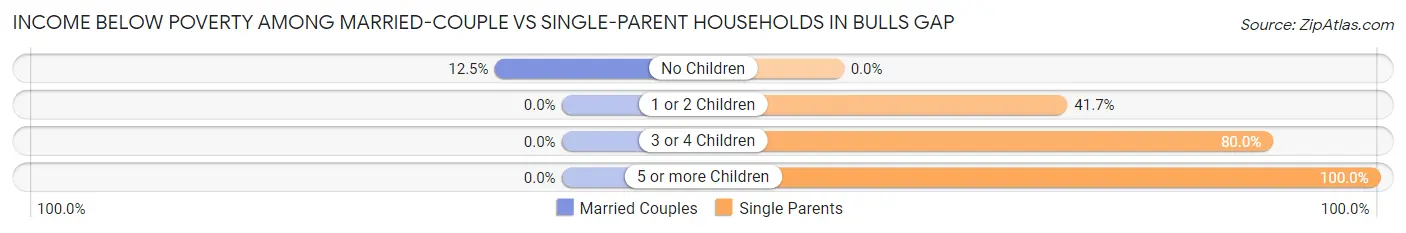
| Children | Married-Couple Families | Single-Parent Households |
| No Children | 11 (12.5%) | 0 (0.0%) |
| 1 or 2 Children | 0 (0.0%) | 10 (41.7%) |
| 3 or 4 Children | 0 (0.0%) | 12 (80.0%) |
| 5 or more Children | 0 (0.0%) | 3 (100.0%) |
| Total | 11 (8.0%) | 25 (36.2%) |
Race in Bulls Gap
The most populous races in Bulls Gap are White / Caucasian (850 | 97.1%), Hispanic or Latino (51 | 5.8%), and Two or more Races (19 | 2.2%).
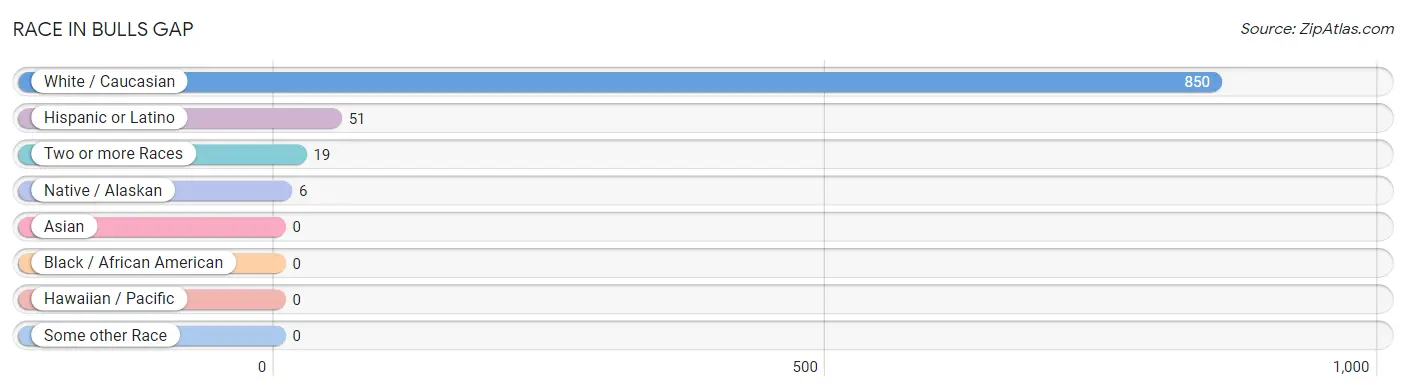
| Race | # Population | % Population |
| Asian | 0 | 0.0% |
| Black / African American | 0 | 0.0% |
| Hawaiian / Pacific | 0 | 0.0% |
| Hispanic or Latino | 51 | 5.8% |
| Native / Alaskan | 6 | 0.7% |
| White / Caucasian | 850 | 97.1% |
| Two or more Races | 19 | 2.2% |
| Some other Race | 0 | 0.0% |
| Total | 875 | 100.0% |
Ancestry in Bulls Gap
The most populous ancestries reported in Bulls Gap are English (108 | 12.3%), German (66 | 7.5%), Irish (62 | 7.1%), American (51 | 5.8%), and Spanish (44 | 5.0%), together accounting for 37.8% of all Bulls Gap residents.
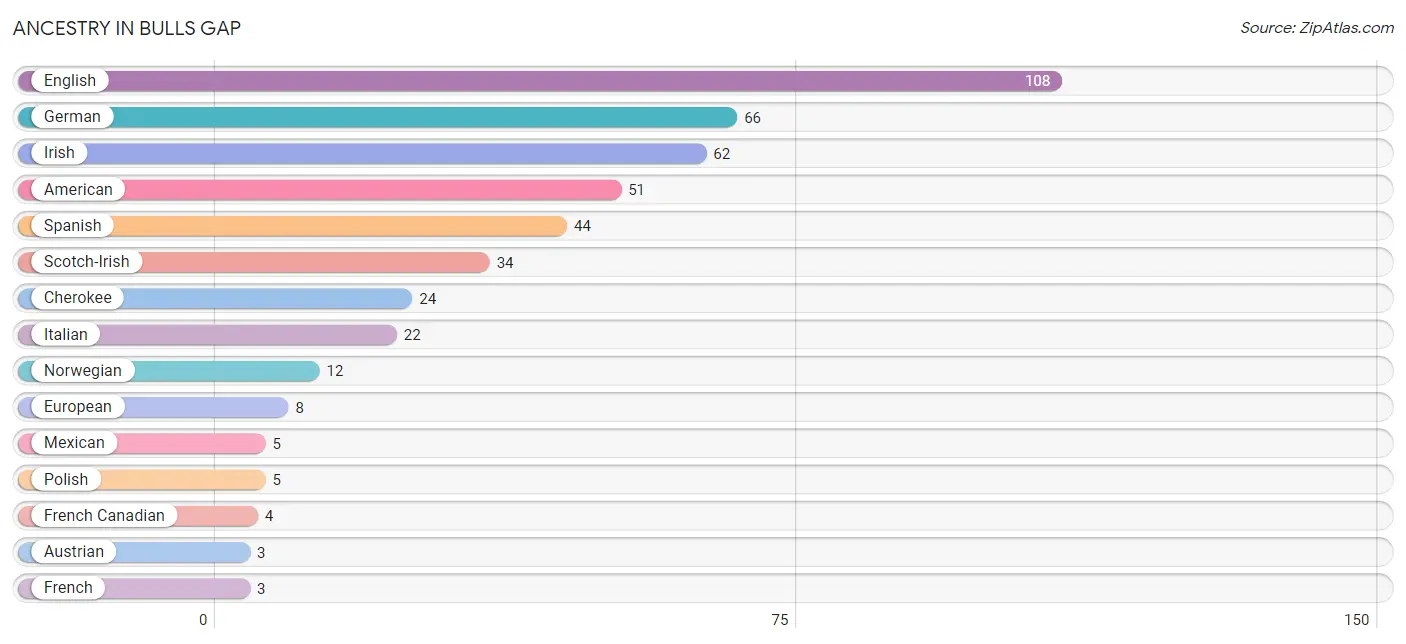
| Ancestry | # Population | % Population |
| American | 51 | 5.8% |
| Austrian | 3 | 0.3% |
| Central American | 2 | 0.2% |
| Cherokee | 24 | 2.7% |
| Dutch | 1 | 0.1% |
| English | 108 | 12.3% |
| European | 8 | 0.9% |
| Finnish | 2 | 0.2% |
| French | 3 | 0.3% |
| French Canadian | 4 | 0.5% |
| German | 66 | 7.5% |
| Honduran | 2 | 0.2% |
| Irish | 62 | 7.1% |
| Italian | 22 | 2.5% |
| Mexican | 5 | 0.6% |
| Norwegian | 12 | 1.4% |
| Polish | 5 | 0.6% |
| Scotch-Irish | 34 | 3.9% |
| Scottish | 2 | 0.2% |
| Spanish | 44 | 5.0% |
| Swiss | 2 | 0.2% | View All 21 Rows |
Immigrants in Bulls Gap
The most numerous immigrant groups reported in Bulls Gap came from Europe (4 | 0.5%), Western Europe (4 | 0.5%), Austria (3 | 0.3%), and Germany (1 | 0.1%), together accounting for 1.4% of all Bulls Gap residents.
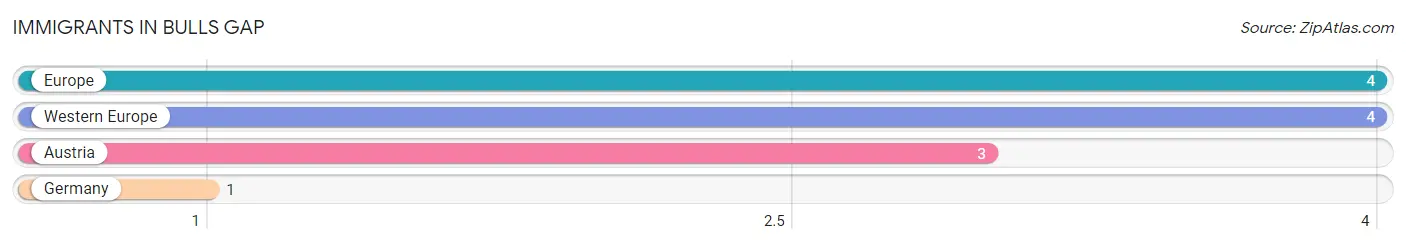
| Immigration Origin | # Population | % Population |
| Austria | 3 | 0.3% |
| Europe | 4 | 0.5% |
| Germany | 1 | 0.1% |
| Western Europe | 4 | 0.5% | View All 4 Rows |
Sex and Age in Bulls Gap
Sex and Age in Bulls Gap
The most populous age groups in Bulls Gap are 50 to 54 Years (54 | 11.3%) for men and 55 to 59 Years (50 | 12.6%) for women.
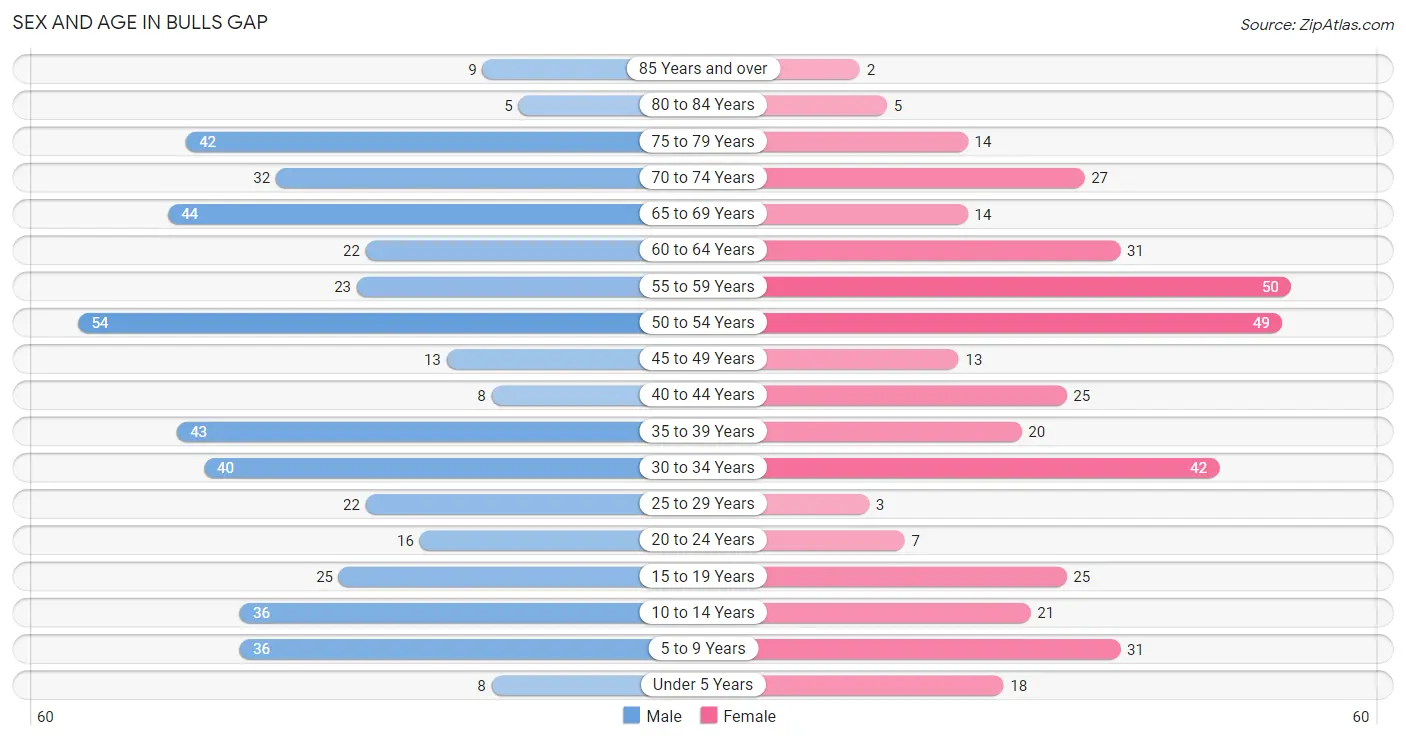
| Age Bracket | Male | Female |
| Under 5 Years | 8 (1.7%) | 18 (4.5%) |
| 5 to 9 Years | 36 (7.5%) | 31 (7.8%) |
| 10 to 14 Years | 36 (7.5%) | 21 (5.3%) |
| 15 to 19 Years | 25 (5.2%) | 25 (6.3%) |
| 20 to 24 Years | 16 (3.4%) | 7 (1.8%) |
| 25 to 29 Years | 22 (4.6%) | 3 (0.8%) |
| 30 to 34 Years | 40 (8.4%) | 42 (10.6%) |
| 35 to 39 Years | 43 (9.0%) | 20 (5.0%) |
| 40 to 44 Years | 8 (1.7%) | 25 (6.3%) |
| 45 to 49 Years | 13 (2.7%) | 13 (3.3%) |
| 50 to 54 Years | 54 (11.3%) | 49 (12.3%) |
| 55 to 59 Years | 23 (4.8%) | 50 (12.6%) |
| 60 to 64 Years | 22 (4.6%) | 31 (7.8%) |
| 65 to 69 Years | 44 (9.2%) | 14 (3.5%) |
| 70 to 74 Years | 32 (6.7%) | 27 (6.8%) |
| 75 to 79 Years | 42 (8.8%) | 14 (3.5%) |
| 80 to 84 Years | 5 (1.1%) | 5 (1.3%) |
| 85 Years and over | 9 (1.9%) | 2 (0.5%) |
| Total | 478 (100.0%) | 397 (100.0%) |
Families and Households in Bulls Gap
Median Family Size in Bulls Gap
The median family size in Bulls Gap is 3.24 persons per family, with single female/mother families (55 | 26.6%) accounting for the largest median family size of 3.91 persons per family. On the other hand, single male/father families (14 | 6.8%) represent the smallest median family size with 2.29 persons per family.
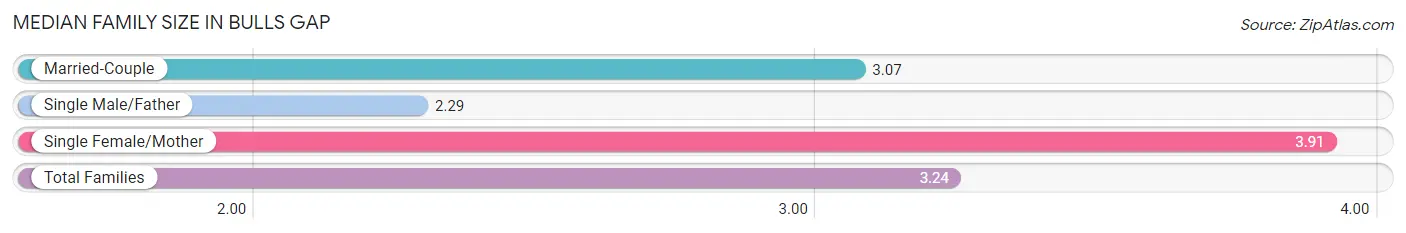
| Family Type | # Families | Family Size |
| Married-Couple | 138 (66.7%) | 3.07 |
| Single Male/Father | 14 (6.8%) | 2.29 |
| Single Female/Mother | 55 (26.6%) | 3.91 |
| Total Families | 207 (100.0%) | 3.24 |
Median Household Size in Bulls Gap
The median household size in Bulls Gap is 2.43 persons per household, with single female/mother households (55 | 15.3%) accounting for the largest median household size of 4.38 persons per household. non-family households (153 | 42.5%) represent the smallest median household size with 1.13 persons per household.
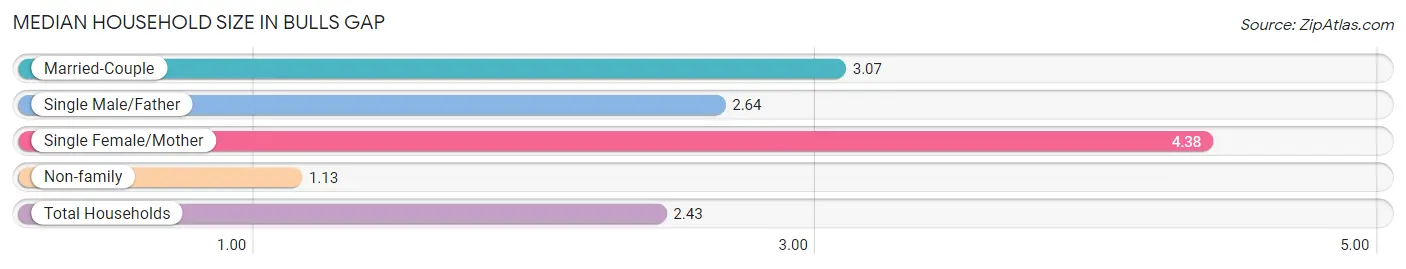
| Household Type | # Households | Household Size |
| Married-Couple | 138 (38.3%) | 3.07 |
| Single Male/Father | 14 (3.9%) | 2.64 |
| Single Female/Mother | 55 (15.3%) | 4.38 |
| Non-family | 153 (42.5%) | 1.13 |
| Total Households | 360 (100.0%) | 2.43 |
Household Size by Marriage Status in Bulls Gap
Out of a total of 360 households in Bulls Gap, 207 (57.5%) are family households, while 153 (42.5%) are nonfamily households. The most numerous type of family households are 2-person households, comprising 102, and the most common type of nonfamily households are 1-person households, comprising 139.
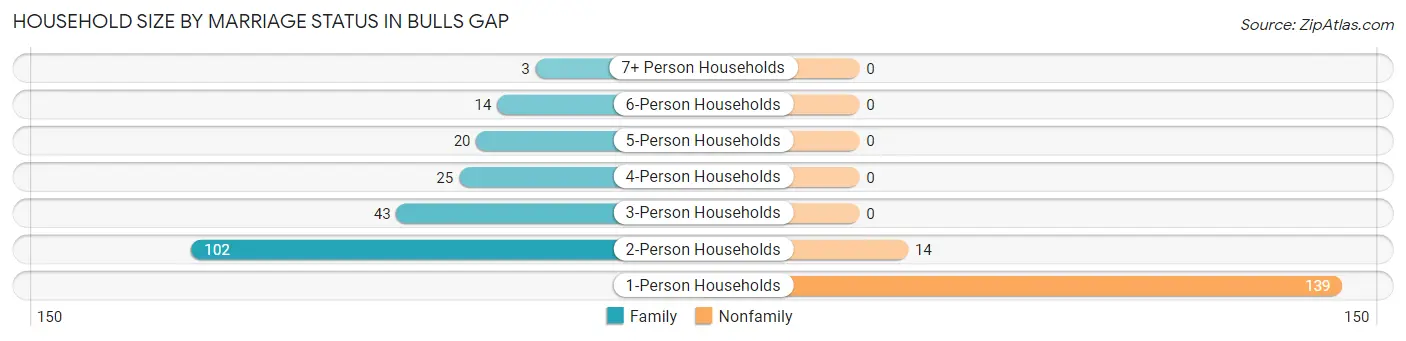
| Household Size | Family Households | Nonfamily Households |
| 1-Person Households | - | 139 (38.6%) |
| 2-Person Households | 102 (28.3%) | 14 (3.9%) |
| 3-Person Households | 43 (11.9%) | 0 (0.0%) |
| 4-Person Households | 25 (6.9%) | 0 (0.0%) |
| 5-Person Households | 20 (5.6%) | 0 (0.0%) |
| 6-Person Households | 14 (3.9%) | 0 (0.0%) |
| 7+ Person Households | 3 (0.8%) | 0 (0.0%) |
| Total | 207 (57.5%) | 153 (42.5%) |
Female Fertility in Bulls Gap
Fertility by Age in Bulls Gap
Average fertility rate in Bulls Gap is 14.0 births per 1,000 women. Women in the age bracket of 35 to 50 years have the highest fertility rate with 29.0 births per 1,000 women. Women in the age bracket of 35 to 50 years acount for 100.0% of all women with births.
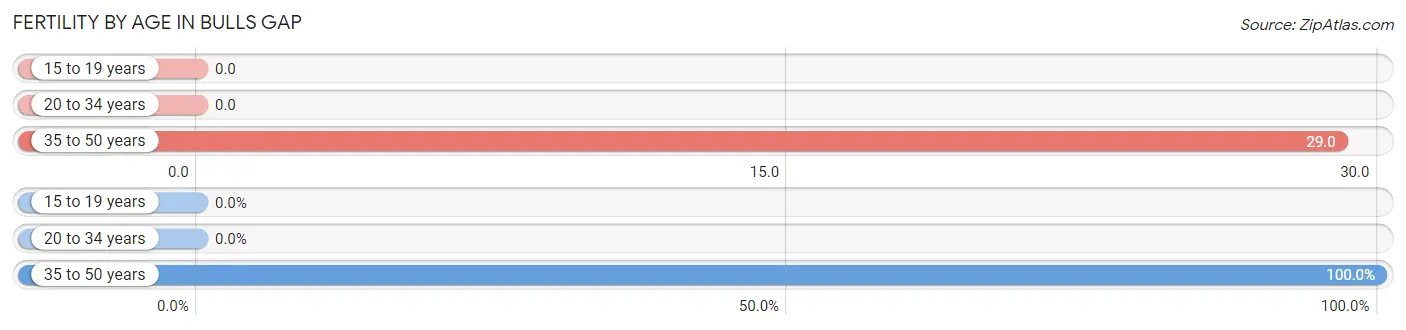
| Age Bracket | Women with Births | Births / 1,000 Women |
| 15 to 19 years | 0 (0.0%) | 0.0 |
| 20 to 34 years | 0 (0.0%) | 0.0 |
| 35 to 50 years | 2 (100.0%) | 29.0 |
| Total | 2 (100.0%) | 14.0 |
Fertility by Age by Marriage Status in Bulls Gap
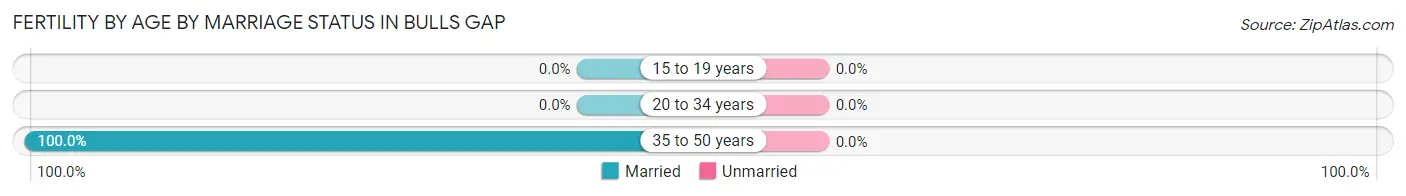
| Age Bracket | Married | Unmarried |
| 15 to 19 years | 0 (0.0%) | 0 (0.0%) |
| 20 to 34 years | 0 (0.0%) | 0 (0.0%) |
| 35 to 50 years | 2 (100.0%) | 0 (0.0%) |
| Total | 2 (100.0%) | 0 (0.0%) |
Fertility by Education in Bulls Gap
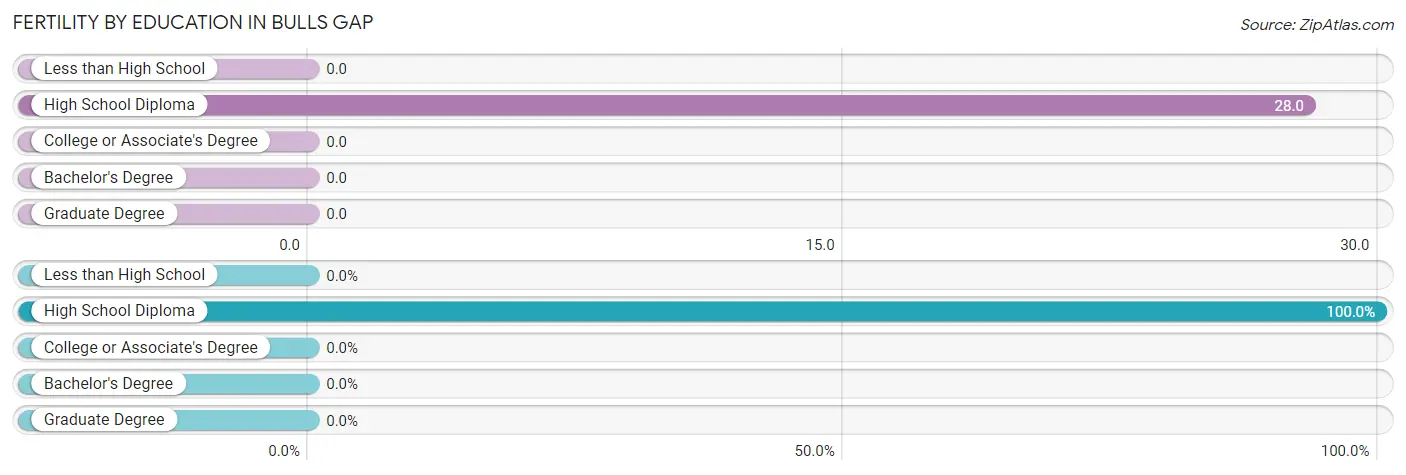
| Educational Attainment | Women with Births | Births / 1,000 Women |
| Less than High School | 0 (0.0%) | 0.0 |
| High School Diploma | 2 (100.0%) | 28.0 |
| College or Associate's Degree | 0 (0.0%) | 0.0 |
| Bachelor's Degree | 0 (0.0%) | 0.0 |
| Graduate Degree | 0 (0.0%) | 0.0 |
| Total | 2 (100.0%) | 14.0 |
Fertility by Education by Marriage Status in Bulls Gap
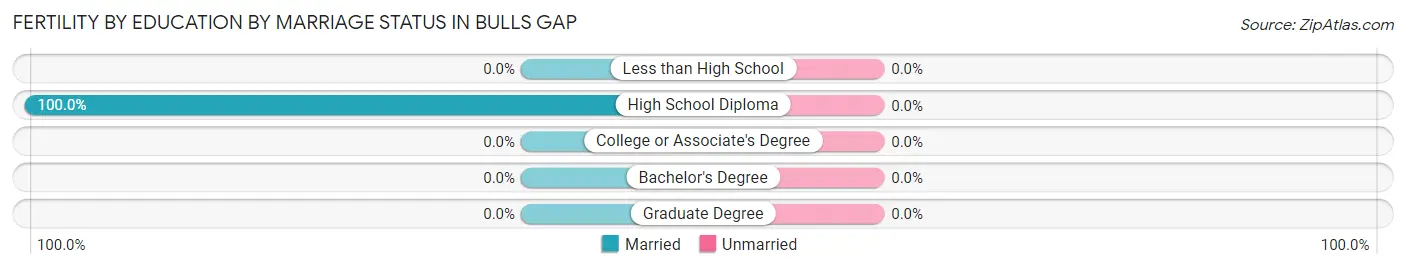
| Educational Attainment | Married | Unmarried |
| Less than High School | 0 (0.0%) | 0 (0.0%) |
| High School Diploma | 2 (100.0%) | 0 (0.0%) |
| College or Associate's Degree | 0 (0.0%) | 0 (0.0%) |
| Bachelor's Degree | 0 (0.0%) | 0 (0.0%) |
| Graduate Degree | 0 (0.0%) | 0 (0.0%) |
| Total | 2 (100.0%) | 0 (0.0%) |
Employment Characteristics in Bulls Gap
Employment by Class of Employer in Bulls Gap
Among the 262 employed individuals in Bulls Gap, private company employees (205 | 78.2%), local government employees (29 | 11.1%), and unpaid family workers (12 | 4.6%) make up the most common classes of employment.
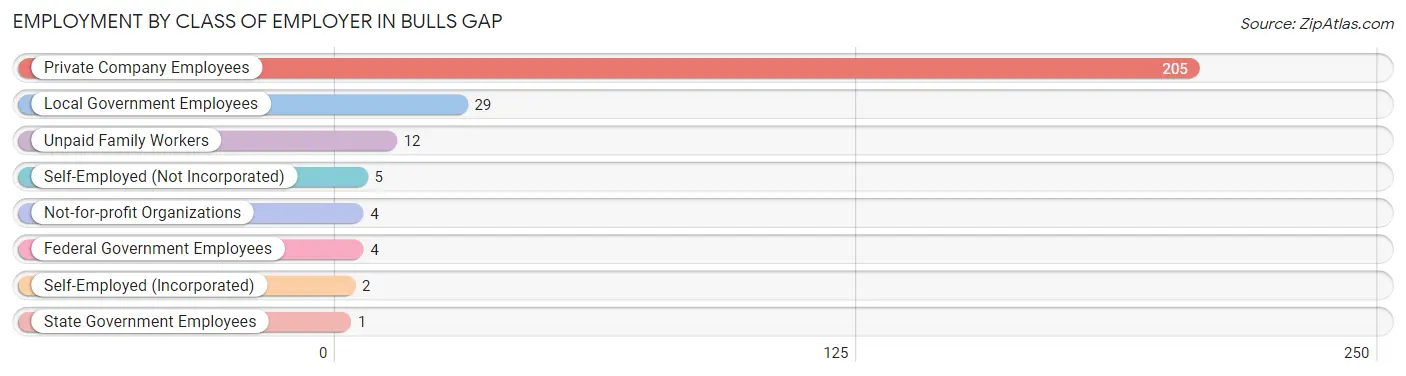
| Employer Class | # Employees | % Employees |
| Private Company Employees | 205 | 78.2% |
| Self-Employed (Incorporated) | 2 | 0.8% |
| Self-Employed (Not Incorporated) | 5 | 1.9% |
| Not-for-profit Organizations | 4 | 1.5% |
| Local Government Employees | 29 | 11.1% |
| State Government Employees | 1 | 0.4% |
| Federal Government Employees | 4 | 1.5% |
| Unpaid Family Workers | 12 | 4.6% |
| Total | 262 | 100.0% |
Employment Status by Age in Bulls Gap
According to the labor force statistics for Bulls Gap, out of the total population over 16 years of age (701), 40.9% or 287 individuals are in the labor force, with 8.0% or 23 of them unemployed. The age group with the highest labor force participation rate is 30 to 34 years, with 78.0% or 64 individuals in the labor force. Within the labor force, the 16 to 19 years age range has the highest percentage of unemployed individuals, with 100.0% or 12 of them being unemployed.
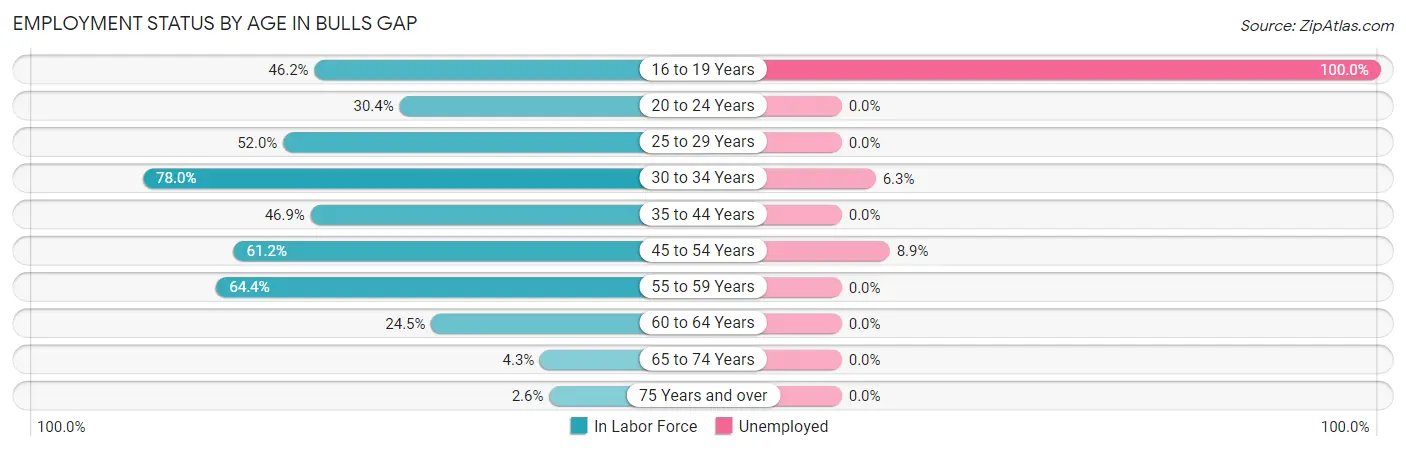
| Age Bracket | In Labor Force | Unemployed |
| 16 to 19 Years | 12 (46.2%) | 12 (100.0%) |
| 20 to 24 Years | 7 (30.4%) | 0 (0.0%) |
| 25 to 29 Years | 13 (52.0%) | 0 (0.0%) |
| 30 to 34 Years | 64 (78.0%) | 4 (6.3%) |
| 35 to 44 Years | 45 (46.9%) | 0 (0.0%) |
| 45 to 54 Years | 79 (61.2%) | 7 (8.9%) |
| 55 to 59 Years | 47 (64.4%) | 0 (0.0%) |
| 60 to 64 Years | 13 (24.5%) | 0 (0.0%) |
| 65 to 74 Years | 5 (4.3%) | 0 (0.0%) |
| 75 Years and over | 2 (2.6%) | 0 (0.0%) |
| Total | 287 (40.9%) | 23 (8.0%) |
Employment Status by Educational Attainment in Bulls Gap
According to labor force statistics for Bulls Gap, 57.0% of individuals (261) out of the total population between 25 and 64 years of age (458) are in the labor force, with 4.2% or 11 of them being unemployed. The group with the highest labor force participation rate are those with the educational attainment of bachelor's degree or higher, with 83.3% or 25 individuals in the labor force. Within the labor force, individuals with high school diploma education have the highest percentage of unemployment, with 7.4% or 9 of them being unemployed.
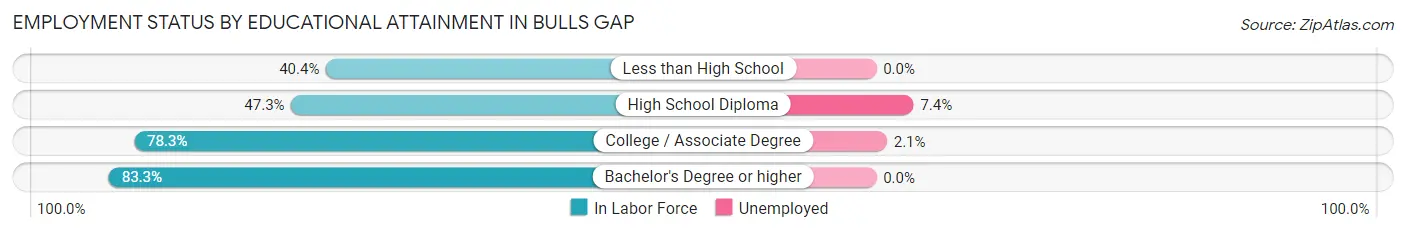
| Educational Attainment | In Labor Force | Unemployed |
| Less than High School | 21 (40.4%) | 0 (0.0%) |
| High School Diploma | 121 (47.3%) | 19 (7.4%) |
| College / Associate Degree | 94 (78.3%) | 3 (2.1%) |
| Bachelor's Degree or higher | 25 (83.3%) | 0 (0.0%) |
| Total | 261 (57.0%) | 19 (4.2%) |
Employment Occupations by Sex in Bulls Gap
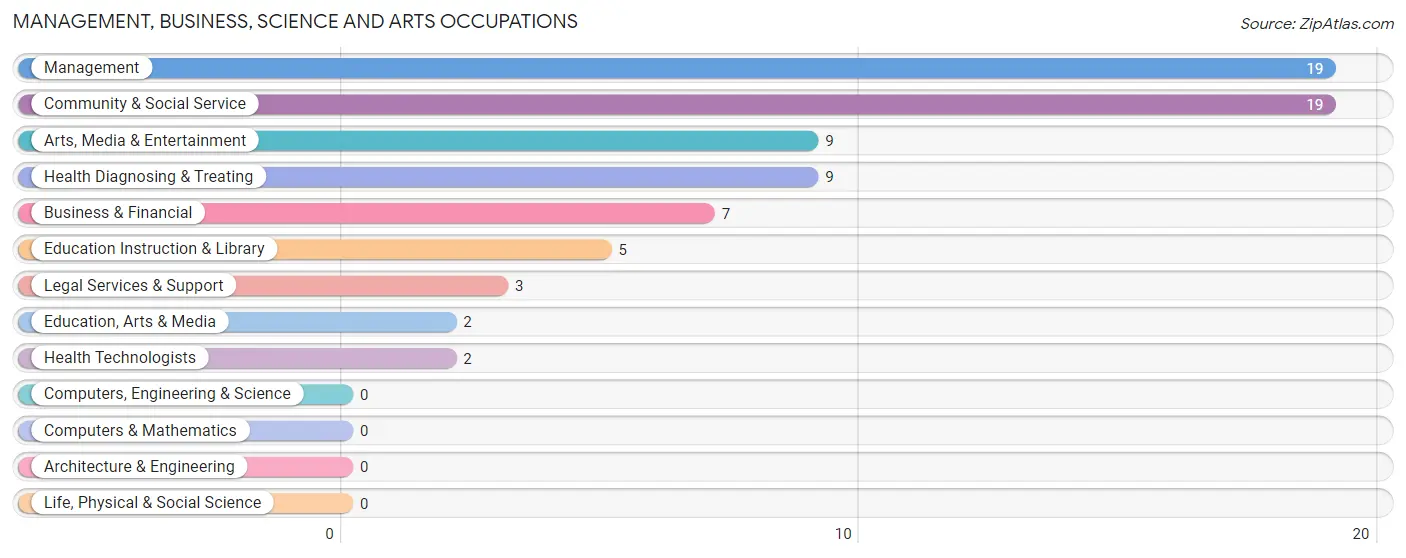
Management, Business, Science and Arts Occupations
The most common Management, Business, Science and Arts occupations in Bulls Gap are Management (19 | 7.2%), Community & Social Service (19 | 7.2%), Arts, Media & Entertainment (9 | 3.4%), Health Diagnosing & Treating (9 | 3.4%), and Business & Financial (7 | 2.6%).
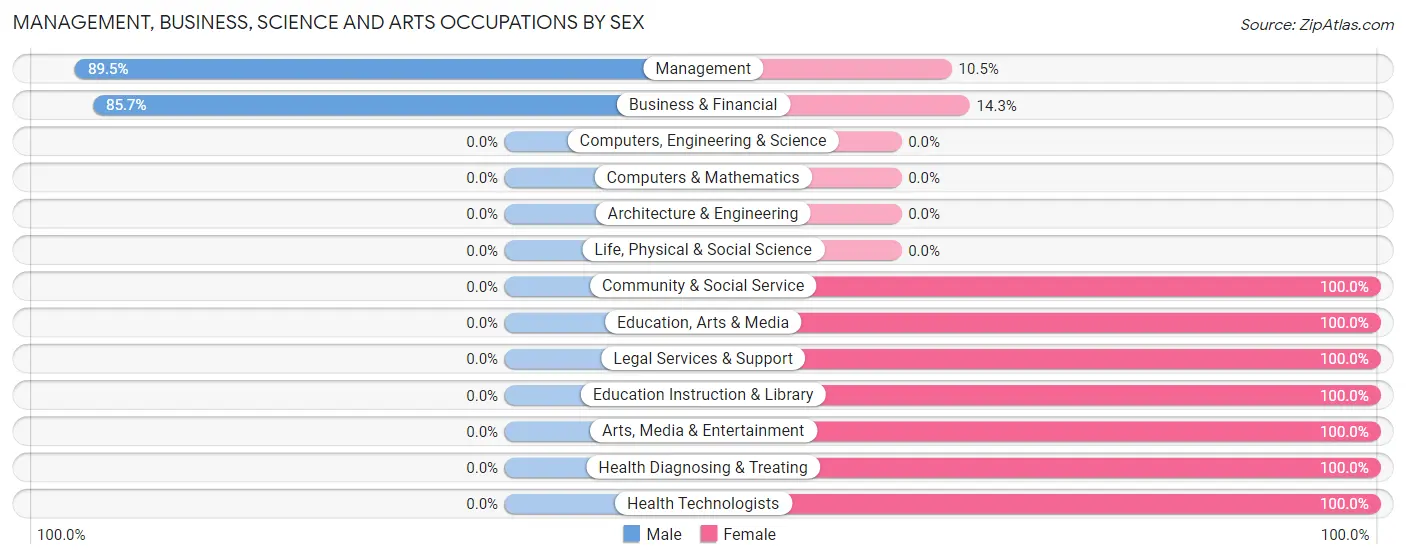
Management, Business, Science and Arts Occupations by Sex
Within the Management, Business, Science and Arts occupations in Bulls Gap, the most male-oriented occupations are Management (89.5%), and Business & Financial (85.7%), while the most female-oriented occupations are Community & Social Service (100.0%), Education, Arts & Media (100.0%), and Legal Services & Support (100.0%).
| Occupation | Male | Female |
| Management | 17 (89.5%) | 2 (10.5%) |
| Business & Financial | 6 (85.7%) | 1 (14.3%) |
| Computers, Engineering & Science | 0 (0.0%) | 0 (0.0%) |
| Computers & Mathematics | 0 (0.0%) | 0 (0.0%) |
| Architecture & Engineering | 0 (0.0%) | 0 (0.0%) |
| Life, Physical & Social Science | 0 (0.0%) | 0 (0.0%) |
| Community & Social Service | 0 (0.0%) | 19 (100.0%) |
| Education, Arts & Media | 0 (0.0%) | 2 (100.0%) |
| Legal Services & Support | 0 (0.0%) | 3 (100.0%) |
| Education Instruction & Library | 0 (0.0%) | 5 (100.0%) |
| Arts, Media & Entertainment | 0 (0.0%) | 9 (100.0%) |
| Health Diagnosing & Treating | 0 (0.0%) | 9 (100.0%) |
| Health Technologists | 0 (0.0%) | 2 (100.0%) |
| Total (Category) | 23 (42.6%) | 31 (57.4%) |
| Total (Overall) | 135 (51.1%) | 129 (48.9%) |
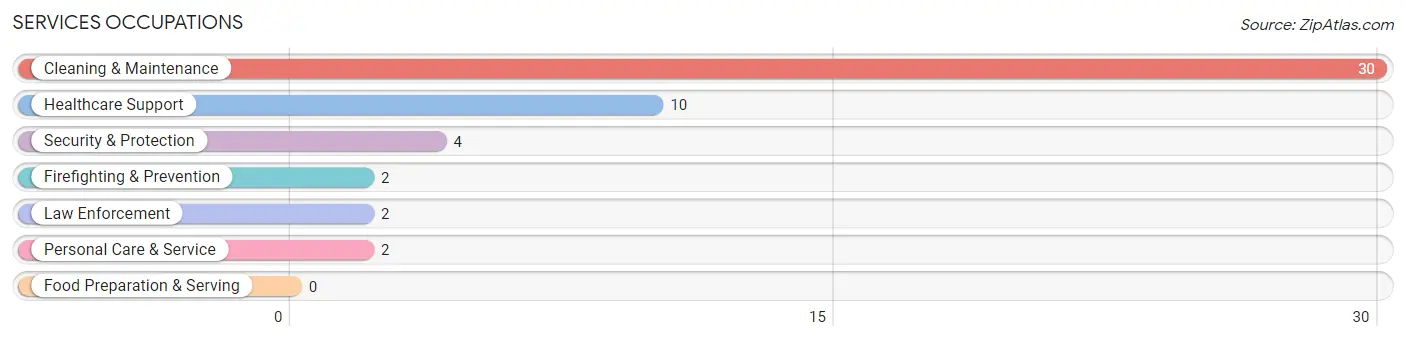
Services Occupations
The most common Services occupations in Bulls Gap are Cleaning & Maintenance (30 | 11.4%), Healthcare Support (10 | 3.8%), Security & Protection (4 | 1.5%), Firefighting & Prevention (2 | 0.8%), and Law Enforcement (2 | 0.8%).
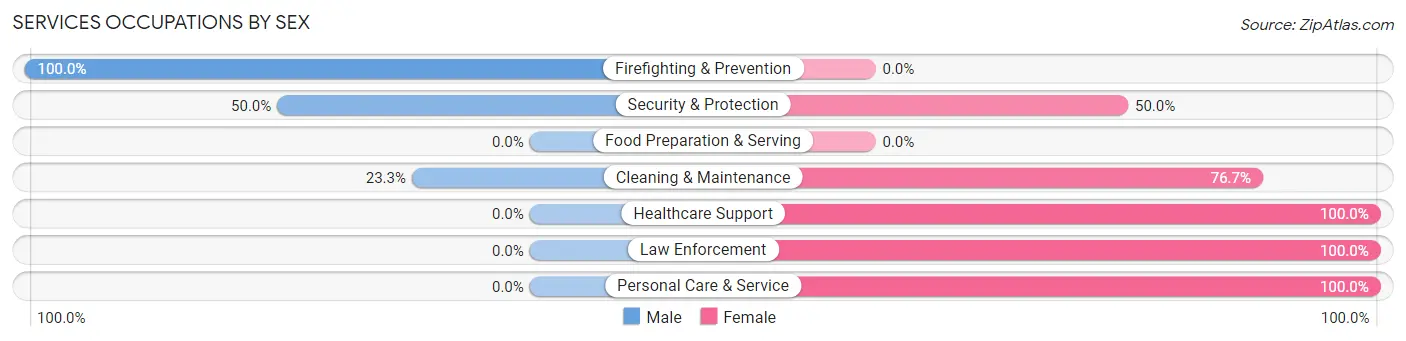
Services Occupations by Sex
Within the Services occupations in Bulls Gap, the most male-oriented occupations are Firefighting & Prevention (100.0%), Security & Protection (50.0%), and Cleaning & Maintenance (23.3%), while the most female-oriented occupations are Healthcare Support (100.0%), Law Enforcement (100.0%), and Personal Care & Service (100.0%).
| Occupation | Male | Female |
| Healthcare Support | 0 (0.0%) | 10 (100.0%) |
| Security & Protection | 2 (50.0%) | 2 (50.0%) |
| Firefighting & Prevention | 2 (100.0%) | 0 (0.0%) |
| Law Enforcement | 0 (0.0%) | 2 (100.0%) |
| Food Preparation & Serving | 0 (0.0%) | 0 (0.0%) |
| Cleaning & Maintenance | 7 (23.3%) | 23 (76.7%) |
| Personal Care & Service | 0 (0.0%) | 2 (100.0%) |
| Total (Category) | 9 (19.6%) | 37 (80.4%) |
| Total (Overall) | 135 (51.1%) | 129 (48.9%) |
Sales and Office Occupations
The most common Sales and Office occupations in Bulls Gap are Office & Administration (35 | 13.3%), and Sales & Related (15 | 5.7%).
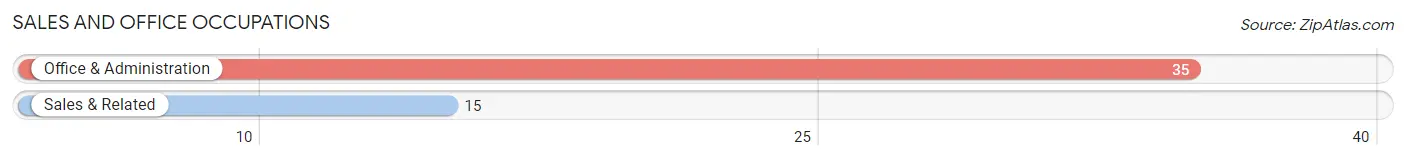
Sales and Office Occupations by Sex
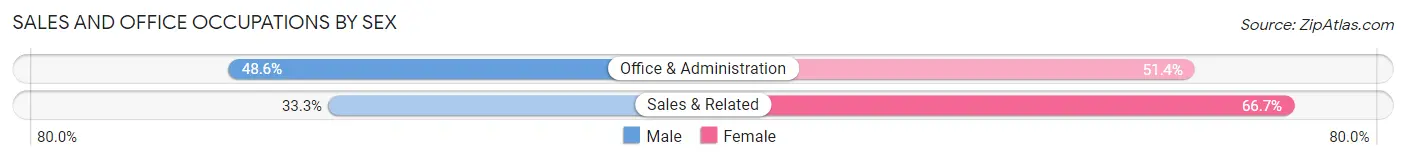
| Occupation | Male | Female |
| Sales & Related | 5 (33.3%) | 10 (66.7%) |
| Office & Administration | 17 (48.6%) | 18 (51.4%) |
| Total (Category) | 22 (44.0%) | 28 (56.0%) |
| Total (Overall) | 135 (51.1%) | 129 (48.9%) |
Natural Resources, Construction and Maintenance Occupations
The most common Natural Resources, Construction and Maintenance occupations in Bulls Gap are Construction & Extraction (6 | 2.3%), and Installation, Maintenance & Repair (5 | 1.9%).
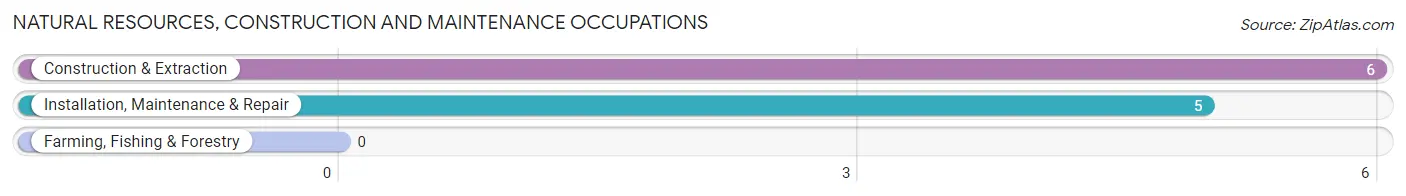
Natural Resources, Construction and Maintenance Occupations by Sex
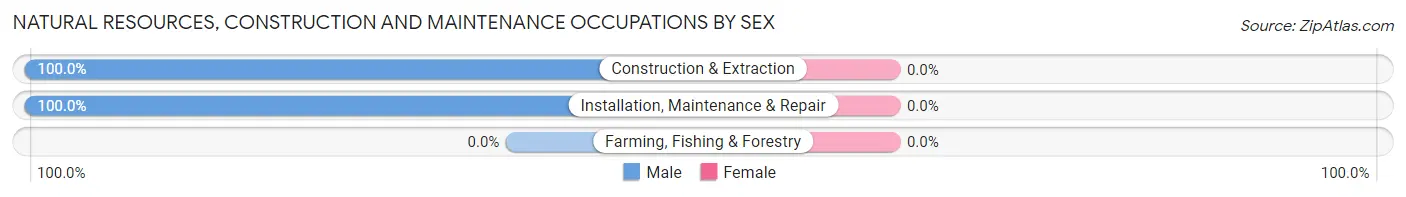
| Occupation | Male | Female |
| Farming, Fishing & Forestry | 0 (0.0%) | 0 (0.0%) |
| Construction & Extraction | 6 (100.0%) | 0 (0.0%) |
| Installation, Maintenance & Repair | 5 (100.0%) | 0 (0.0%) |
| Total (Category) | 11 (100.0%) | 0 (0.0%) |
| Total (Overall) | 135 (51.1%) | 129 (48.9%) |
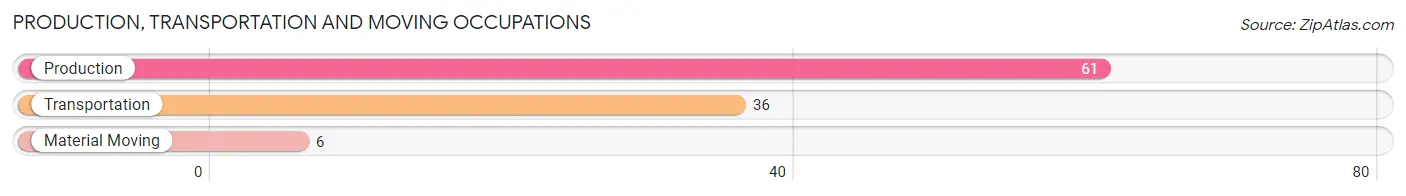
Production, Transportation and Moving Occupations
The most common Production, Transportation and Moving occupations in Bulls Gap are Production (61 | 23.1%), Transportation (36 | 13.6%), and Material Moving (6 | 2.3%).
Production, Transportation and Moving Occupations by Sex
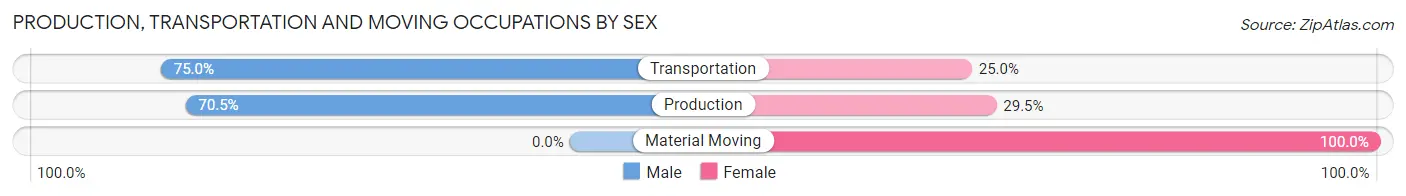
| Occupation | Male | Female |
| Production | 43 (70.5%) | 18 (29.5%) |
| Transportation | 27 (75.0%) | 9 (25.0%) |
| Material Moving | 0 (0.0%) | 6 (100.0%) |
| Total (Category) | 70 (68.0%) | 33 (32.0%) |
| Total (Overall) | 135 (51.1%) | 129 (48.9%) |
Employment Industries by Sex in Bulls Gap
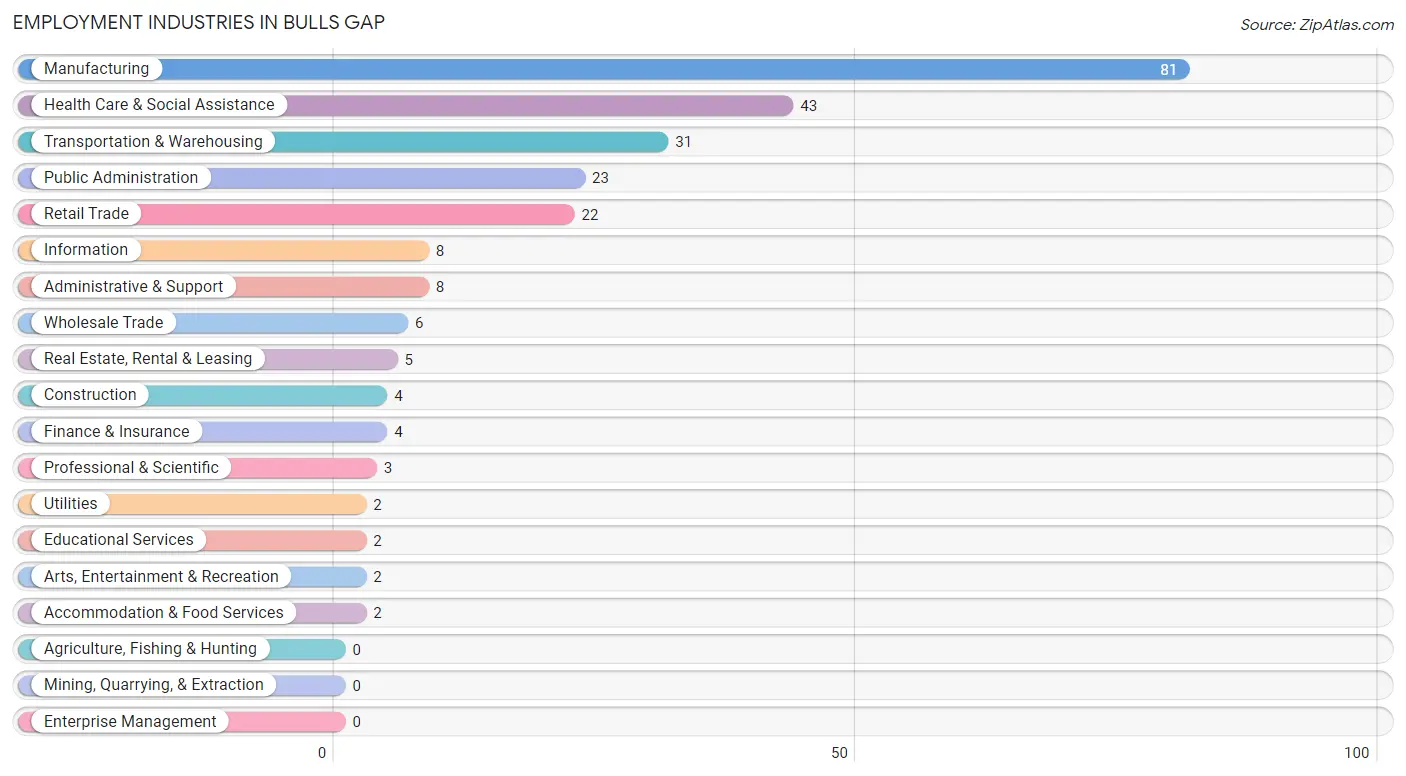
Employment Industries in Bulls Gap
The major employment industries in Bulls Gap include Manufacturing (81 | 30.7%), Health Care & Social Assistance (43 | 16.3%), Transportation & Warehousing (31 | 11.7%), Public Administration (23 | 8.7%), and Retail Trade (22 | 8.3%).
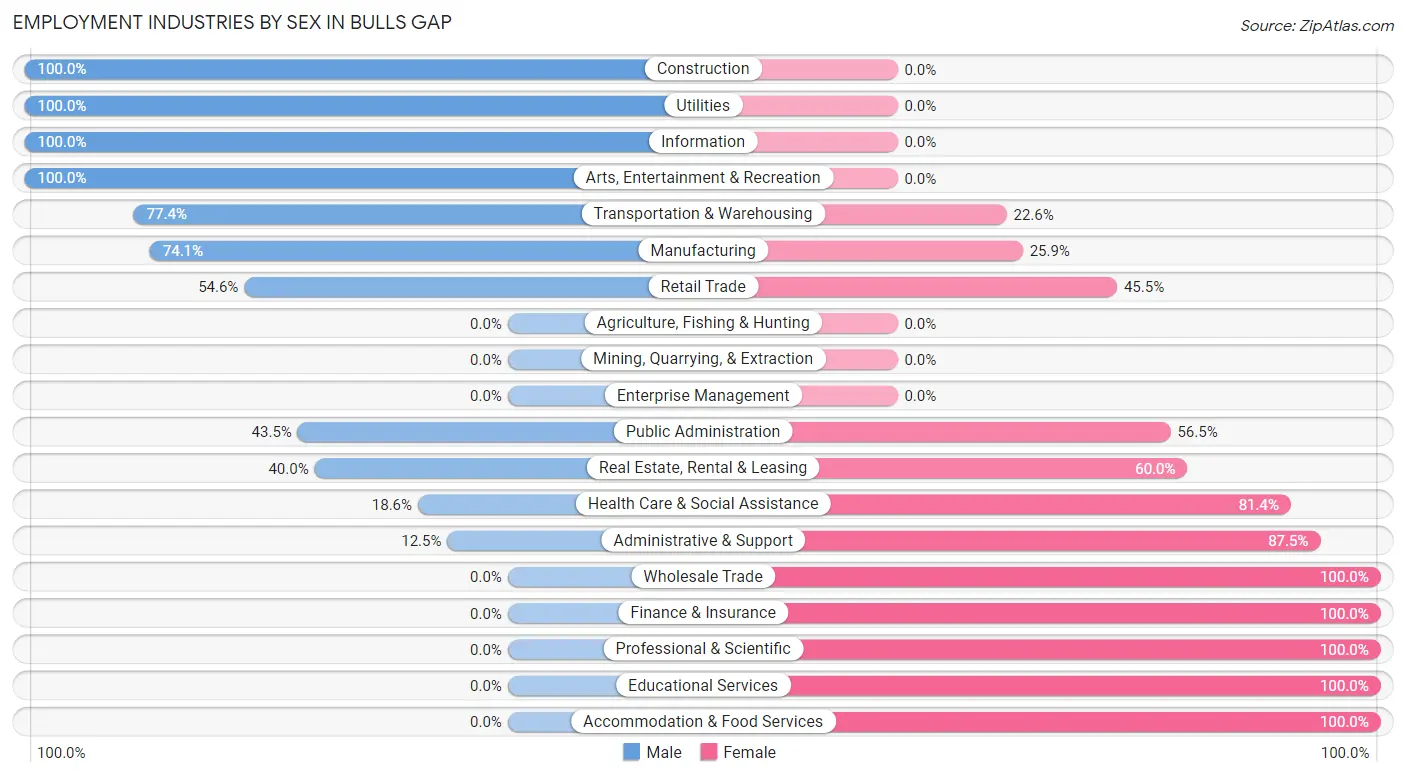
Employment Industries by Sex in Bulls Gap
The Bulls Gap industries that see more men than women are Construction (100.0%), Utilities (100.0%), and Information (100.0%), whereas the industries that tend to have a higher number of women are Wholesale Trade (100.0%), Finance & Insurance (100.0%), and Professional & Scientific (100.0%).
| Industry | Male | Female |
| Agriculture, Fishing & Hunting | 0 (0.0%) | 0 (0.0%) |
| Mining, Quarrying, & Extraction | 0 (0.0%) | 0 (0.0%) |
| Construction | 4 (100.0%) | 0 (0.0%) |
| Manufacturing | 60 (74.1%) | 21 (25.9%) |
| Wholesale Trade | 0 (0.0%) | 6 (100.0%) |
| Retail Trade | 12 (54.5%) | 10 (45.5%) |
| Transportation & Warehousing | 24 (77.4%) | 7 (22.6%) |
| Utilities | 2 (100.0%) | 0 (0.0%) |
| Information | 8 (100.0%) | 0 (0.0%) |
| Finance & Insurance | 0 (0.0%) | 4 (100.0%) |
| Real Estate, Rental & Leasing | 2 (40.0%) | 3 (60.0%) |
| Professional & Scientific | 0 (0.0%) | 3 (100.0%) |
| Enterprise Management | 0 (0.0%) | 0 (0.0%) |
| Administrative & Support | 1 (12.5%) | 7 (87.5%) |
| Educational Services | 0 (0.0%) | 2 (100.0%) |
| Health Care & Social Assistance | 8 (18.6%) | 35 (81.4%) |
| Arts, Entertainment & Recreation | 2 (100.0%) | 0 (0.0%) |
| Accommodation & Food Services | 0 (0.0%) | 2 (100.0%) |
| Public Administration | 10 (43.5%) | 13 (56.5%) |
| Total | 135 (51.1%) | 129 (48.9%) |
Education in Bulls Gap
School Enrollment in Bulls Gap
The most common levels of schooling among the 184 students in Bulls Gap are elementary school (76 | 41.3%), middle school (45 | 24.5%), and high school (40 | 21.7%).
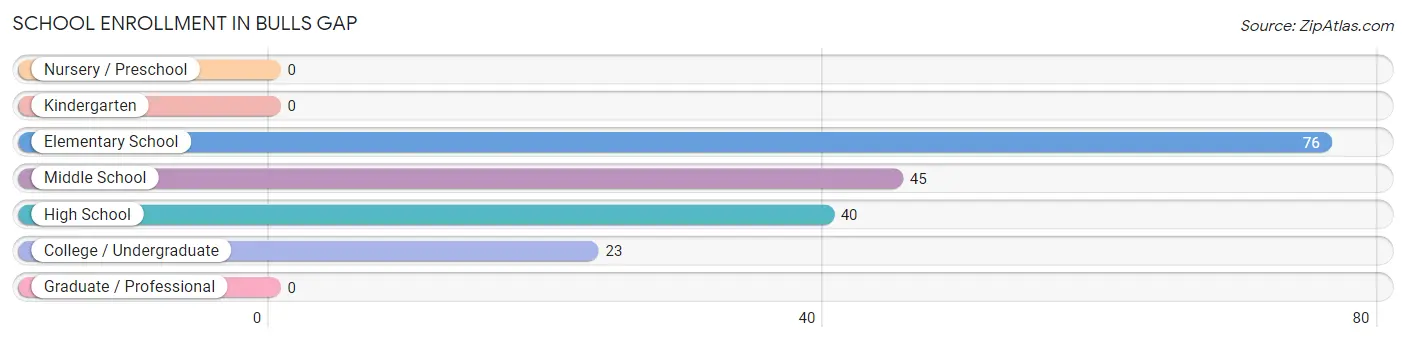
| School Level | # Students | % Students |
| Nursery / Preschool | 0 | 0.0% |
| Kindergarten | 0 | 0.0% |
| Elementary School | 76 | 41.3% |
| Middle School | 45 | 24.5% |
| High School | 40 | 21.7% |
| College / Undergraduate | 23 | 12.5% |
| Graduate / Professional | 0 | 0.0% |
| Total | 184 | 100.0% |
School Enrollment by Age by Funding Source in Bulls Gap
Out of a total of 184 students who are enrolled in schools in Bulls Gap, 14 (7.6%) attend a private institution, while the remaining 170 (92.4%) are enrolled in public schools. The age group of 10 to 14 year olds has the highest likelihood of being enrolled in private schools, with 6 (10.5% in the age bracket) enrolled. Conversely, the age group of 18 to 19 year olds has the lowest likelihood of being enrolled in a private school, with 3 (100.0% in the age bracket) attending a public institution.
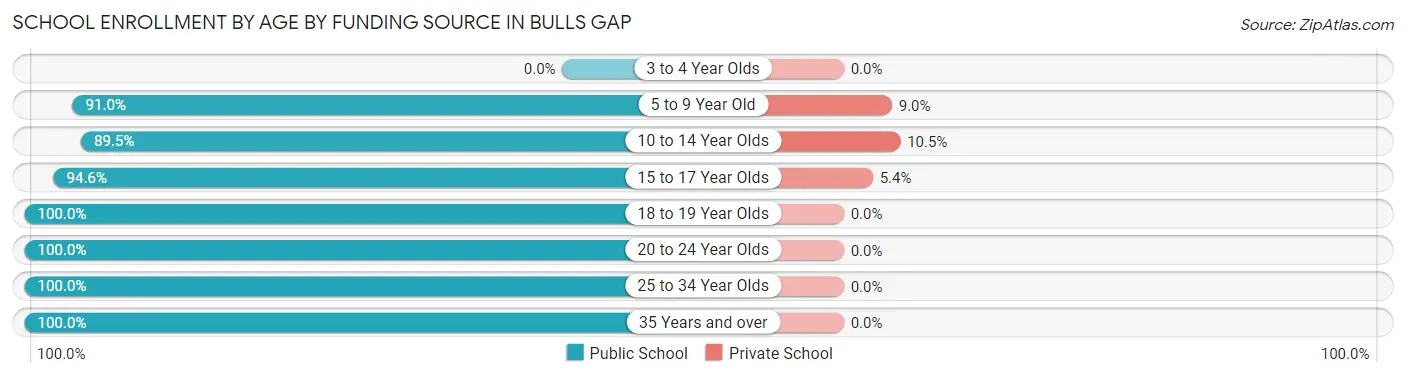
| Age Bracket | Public School | Private School |
| 3 to 4 Year Olds | 0 (0.0%) | 0 (0.0%) |
| 5 to 9 Year Old | 61 (91.0%) | 6 (9.0%) |
| 10 to 14 Year Olds | 51 (89.5%) | 6 (10.5%) |
| 15 to 17 Year Olds | 35 (94.6%) | 2 (5.4%) |
| 18 to 19 Year Olds | 3 (100.0%) | 0 (0.0%) |
| 20 to 24 Year Olds | 15 (100.0%) | 0 (0.0%) |
| 25 to 34 Year Olds | 3 (100.0%) | 0 (0.0%) |
| 35 Years and over | 2 (100.0%) | 0 (0.0%) |
| Total | 170 (92.4%) | 14 (7.6%) |
Educational Attainment by Field of Study in Bulls Gap
Psychology (36 | 31.9%), literature & languages (36 | 31.9%), business (20 | 17.7%), education (11 | 9.7%), and social sciences (4 | 3.5%) are the most common fields of study among 113 individuals in Bulls Gap who have obtained a bachelor's degree or higher.
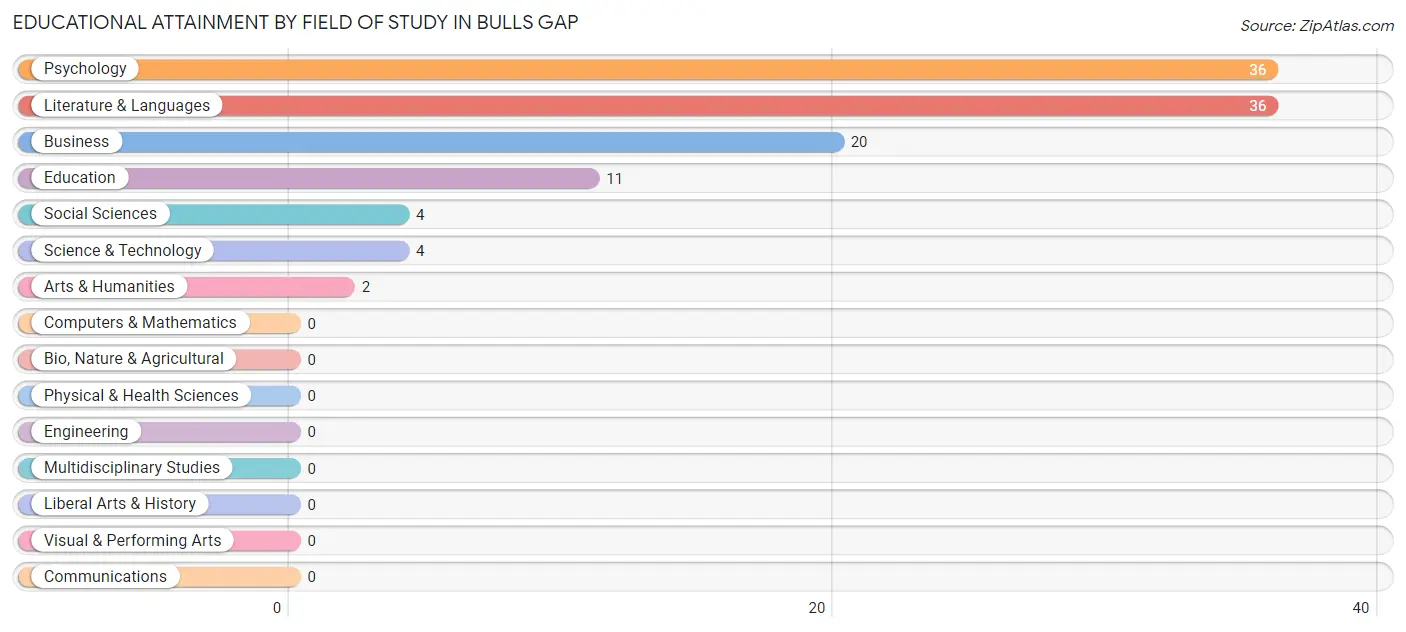
| Field of Study | # Graduates | % Graduates |
| Computers & Mathematics | 0 | 0.0% |
| Bio, Nature & Agricultural | 0 | 0.0% |
| Physical & Health Sciences | 0 | 0.0% |
| Psychology | 36 | 31.9% |
| Social Sciences | 4 | 3.5% |
| Engineering | 0 | 0.0% |
| Multidisciplinary Studies | 0 | 0.0% |
| Science & Technology | 4 | 3.5% |
| Business | 20 | 17.7% |
| Education | 11 | 9.7% |
| Literature & Languages | 36 | 31.9% |
| Liberal Arts & History | 0 | 0.0% |
| Visual & Performing Arts | 0 | 0.0% |
| Communications | 0 | 0.0% |
| Arts & Humanities | 2 | 1.8% |
| Total | 113 | 100.0% |
Transportation & Commute in Bulls Gap
Vehicle Availability by Sex in Bulls Gap
The most prevalent vehicle ownership categories in Bulls Gap are males with 2 vehicles (69, accounting for 51.1%) and females with 2 vehicles (46, making up 54.3%).
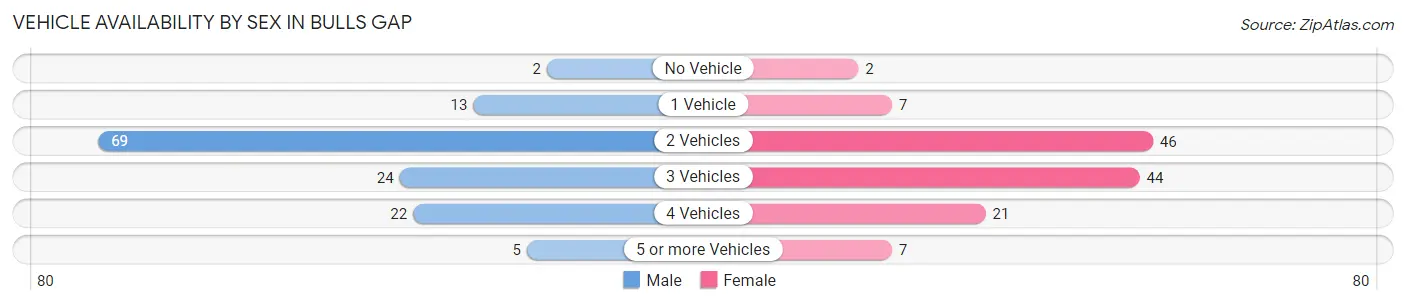
| Vehicles Available | Male | Female |
| No Vehicle | 2 (1.5%) | 2 (1.6%) |
| 1 Vehicle | 13 (9.6%) | 7 (5.5%) |
| 2 Vehicles | 69 (51.1%) | 46 (36.2%) |
| 3 Vehicles | 24 (17.8%) | 44 (34.6%) |
| 4 Vehicles | 22 (16.3%) | 21 (16.5%) |
| 5 or more Vehicles | 5 (3.7%) | 7 (5.5%) |
| Total | 135 (100.0%) | 127 (100.0%) |
Commute Time in Bulls Gap
The most frequently occuring commute durations in Bulls Gap are 25 to 29 minutes (51 commuters, 20.2%), 20 to 24 minutes (48 commuters, 19.1%), and 30 to 34 minutes (30 commuters, 11.9%).
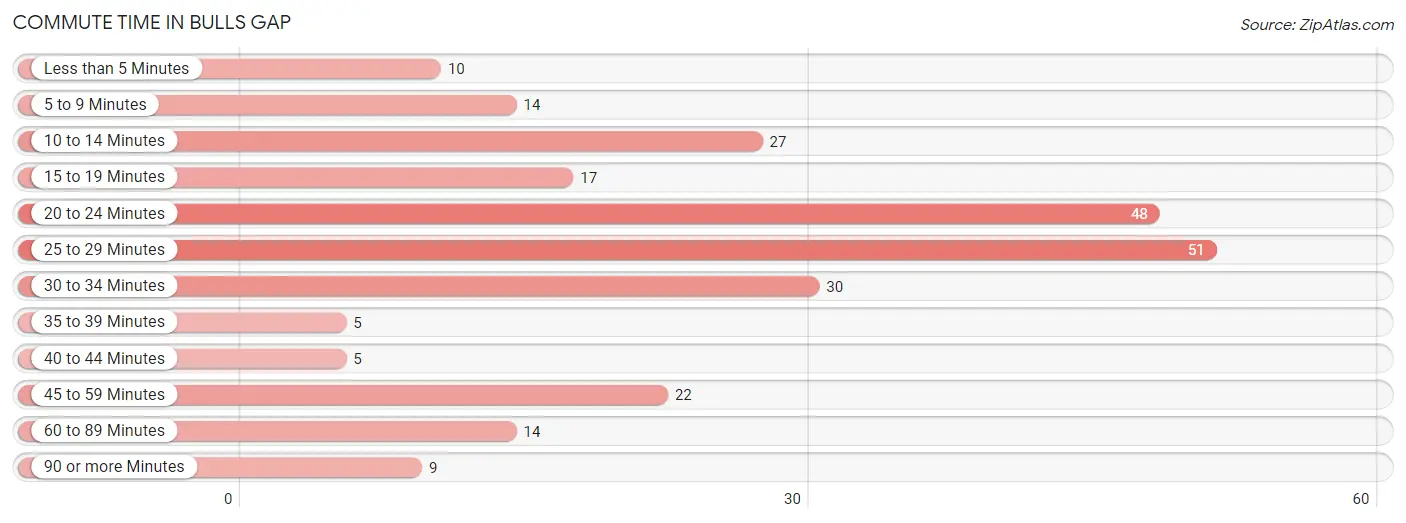
| Commute Time | # Commuters | % Commuters |
| Less than 5 Minutes | 10 | 4.0% |
| 5 to 9 Minutes | 14 | 5.6% |
| 10 to 14 Minutes | 27 | 10.7% |
| 15 to 19 Minutes | 17 | 6.8% |
| 20 to 24 Minutes | 48 | 19.1% |
| 25 to 29 Minutes | 51 | 20.2% |
| 30 to 34 Minutes | 30 | 11.9% |
| 35 to 39 Minutes | 5 | 2.0% |
| 40 to 44 Minutes | 5 | 2.0% |
| 45 to 59 Minutes | 22 | 8.7% |
| 60 to 89 Minutes | 14 | 5.6% |
| 90 or more Minutes | 9 | 3.6% |
Commute Time by Sex in Bulls Gap
The most common commute times in Bulls Gap are 25 to 29 minutes (30 commuters, 24.0%) for males and 20 to 24 minutes (28 commuters, 22.1%) for females.
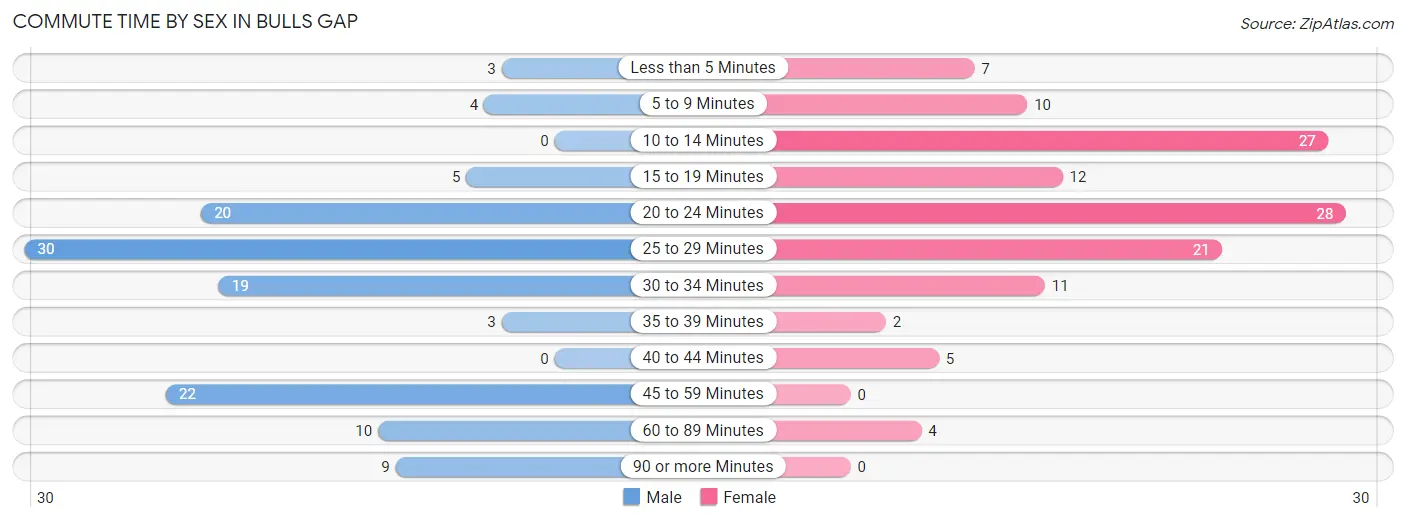
| Commute Time | Male | Female |
| Less than 5 Minutes | 3 (2.4%) | 7 (5.5%) |
| 5 to 9 Minutes | 4 (3.2%) | 10 (7.9%) |
| 10 to 14 Minutes | 0 (0.0%) | 27 (21.3%) |
| 15 to 19 Minutes | 5 (4.0%) | 12 (9.5%) |
| 20 to 24 Minutes | 20 (16.0%) | 28 (22.1%) |
| 25 to 29 Minutes | 30 (24.0%) | 21 (16.5%) |
| 30 to 34 Minutes | 19 (15.2%) | 11 (8.7%) |
| 35 to 39 Minutes | 3 (2.4%) | 2 (1.6%) |
| 40 to 44 Minutes | 0 (0.0%) | 5 (3.9%) |
| 45 to 59 Minutes | 22 (17.6%) | 0 (0.0%) |
| 60 to 89 Minutes | 10 (8.0%) | 4 (3.2%) |
| 90 or more Minutes | 9 (7.2%) | 0 (0.0%) |
Time of Departure to Work by Sex in Bulls Gap
The most frequent times of departure to work in Bulls Gap are 5:00 AM to 5:29 AM (29, 23.2%) for males and 8:00 AM to 8:29 AM (37, 29.1%) for females.
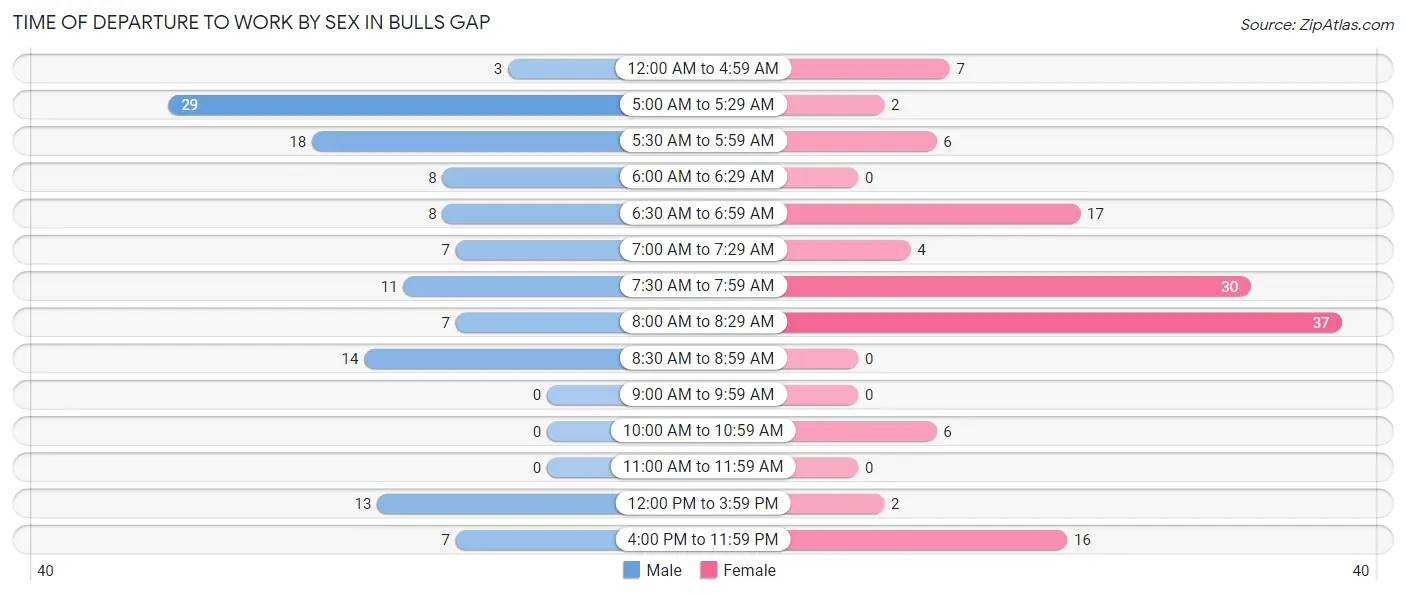
| Time of Departure | Male | Female |
| 12:00 AM to 4:59 AM | 3 (2.4%) | 7 (5.5%) |
| 5:00 AM to 5:29 AM | 29 (23.2%) | 2 (1.6%) |
| 5:30 AM to 5:59 AM | 18 (14.4%) | 6 (4.7%) |
| 6:00 AM to 6:29 AM | 8 (6.4%) | 0 (0.0%) |
| 6:30 AM to 6:59 AM | 8 (6.4%) | 17 (13.4%) |
| 7:00 AM to 7:29 AM | 7 (5.6%) | 4 (3.2%) |
| 7:30 AM to 7:59 AM | 11 (8.8%) | 30 (23.6%) |
| 8:00 AM to 8:29 AM | 7 (5.6%) | 37 (29.1%) |
| 8:30 AM to 8:59 AM | 14 (11.2%) | 0 (0.0%) |
| 9:00 AM to 9:59 AM | 0 (0.0%) | 0 (0.0%) |
| 10:00 AM to 10:59 AM | 0 (0.0%) | 6 (4.7%) |
| 11:00 AM to 11:59 AM | 0 (0.0%) | 0 (0.0%) |
| 12:00 PM to 3:59 PM | 13 (10.4%) | 2 (1.6%) |
| 4:00 PM to 11:59 PM | 7 (5.6%) | 16 (12.6%) |
| Total | 125 (100.0%) | 127 (100.0%) |
Housing Occupancy in Bulls Gap
Occupancy by Ownership in Bulls Gap
Of the total 360 dwellings in Bulls Gap, owner-occupied units account for 250 (69.4%), while renter-occupied units make up 110 (30.6%).
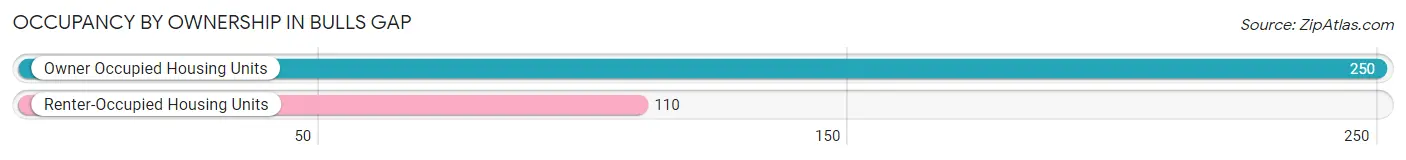
| Occupancy | # Housing Units | % Housing Units |
| Owner Occupied Housing Units | 250 | 69.4% |
| Renter-Occupied Housing Units | 110 | 30.6% |
| Total Occupied Housing Units | 360 | 100.0% |
Occupancy by Household Size in Bulls Gap
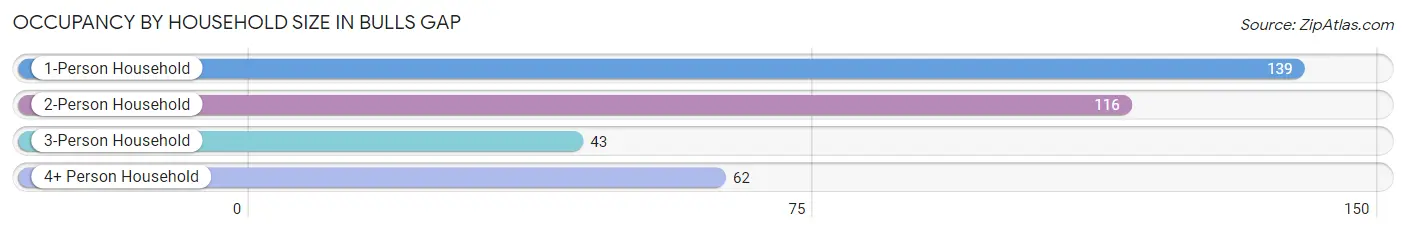
| Household Size | # Housing Units | % Housing Units |
| 1-Person Household | 139 | 38.6% |
| 2-Person Household | 116 | 32.2% |
| 3-Person Household | 43 | 11.9% |
| 4+ Person Household | 62 | 17.2% |
| Total Housing Units | 360 | 100.0% |
Occupancy by Ownership by Household Size in Bulls Gap
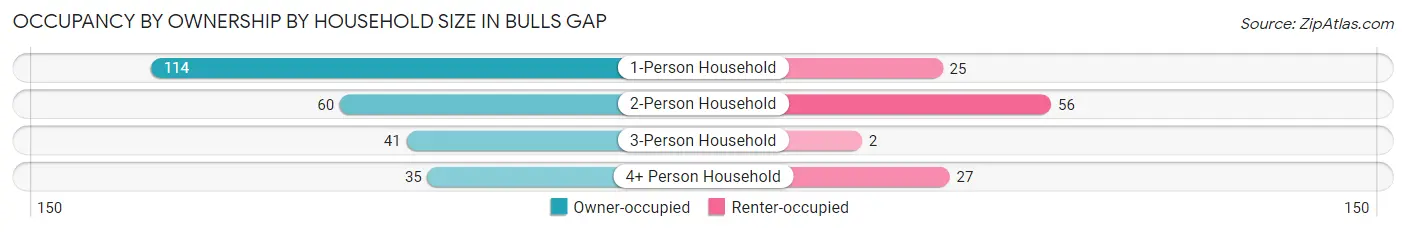
| Household Size | Owner-occupied | Renter-occupied |
| 1-Person Household | 114 (82.0%) | 25 (18.0%) |
| 2-Person Household | 60 (51.7%) | 56 (48.3%) |
| 3-Person Household | 41 (95.4%) | 2 (4.6%) |
| 4+ Person Household | 35 (56.5%) | 27 (43.5%) |
| Total Housing Units | 250 (69.4%) | 110 (30.6%) |
Occupancy by Educational Attainment in Bulls Gap
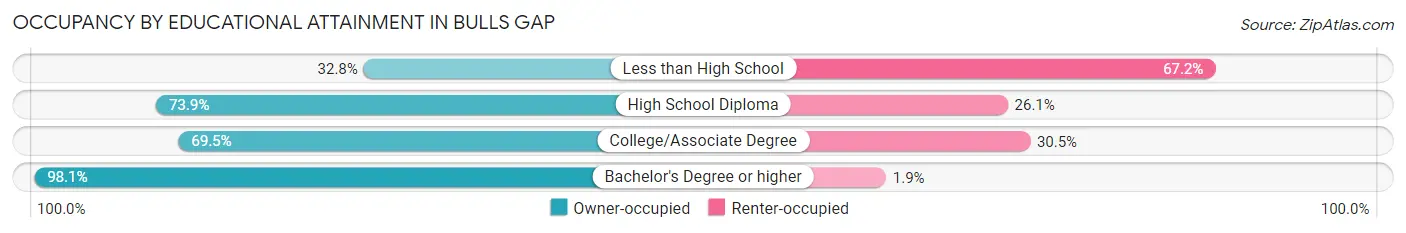
| Household Size | Owner-occupied | Renter-occupied |
| Less than High School | 20 (32.8%) | 41 (67.2%) |
| High School Diploma | 122 (73.9%) | 43 (26.1%) |
| College/Associate Degree | 57 (69.5%) | 25 (30.5%) |
| Bachelor's Degree or higher | 51 (98.1%) | 1 (1.9%) |
Occupancy by Age of Householder in Bulls Gap
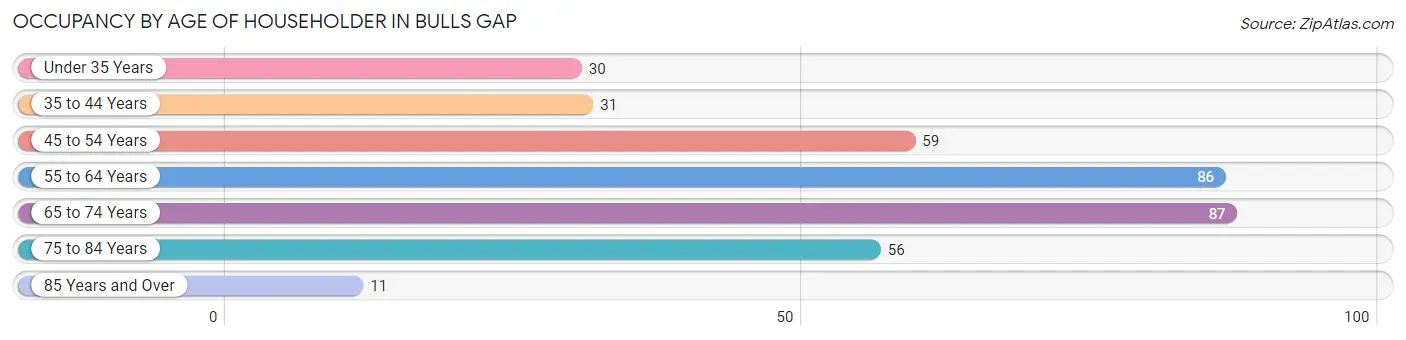
| Age Bracket | # Households | % Households |
| Under 35 Years | 30 | 8.3% |
| 35 to 44 Years | 31 | 8.6% |
| 45 to 54 Years | 59 | 16.4% |
| 55 to 64 Years | 86 | 23.9% |
| 65 to 74 Years | 87 | 24.2% |
| 75 to 84 Years | 56 | 15.6% |
| 85 Years and Over | 11 | 3.1% |
| Total | 360 | 100.0% |
Housing Finances in Bulls Gap
Median Income by Occupancy in Bulls Gap
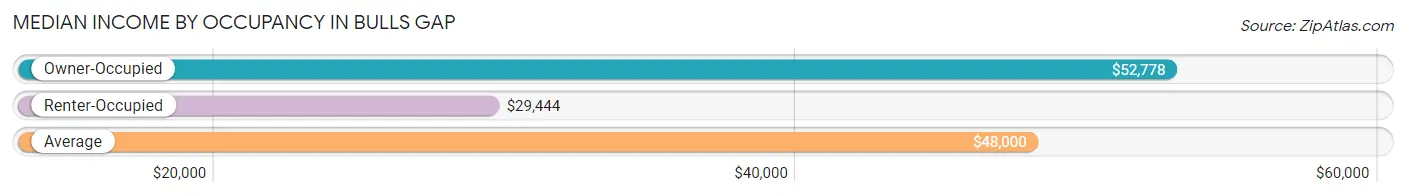
| Occupancy Type | # Households | Median Income |
| Owner-Occupied | 250 (69.4%) | $52,778 |
| Renter-Occupied | 110 (30.6%) | $29,444 |
| Average | 360 (100.0%) | $48,000 |
Occupancy by Householder Income Bracket in Bulls Gap
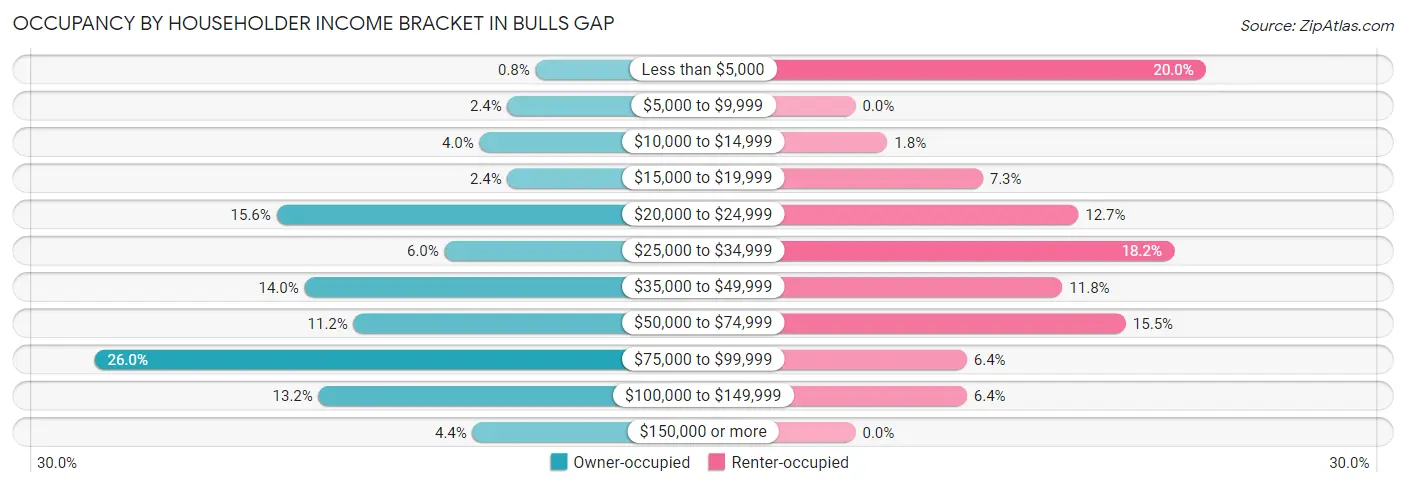
| Income Bracket | Owner-occupied | Renter-occupied |
| Less than $5,000 | 2 (0.8%) | 22 (20.0%) |
| $5,000 to $9,999 | 6 (2.4%) | 0 (0.0%) |
| $10,000 to $14,999 | 10 (4.0%) | 2 (1.8%) |
| $15,000 to $19,999 | 6 (2.4%) | 8 (7.3%) |
| $20,000 to $24,999 | 39 (15.6%) | 14 (12.7%) |
| $25,000 to $34,999 | 15 (6.0%) | 20 (18.2%) |
| $35,000 to $49,999 | 35 (14.0%) | 13 (11.8%) |
| $50,000 to $74,999 | 28 (11.2%) | 17 (15.4%) |
| $75,000 to $99,999 | 65 (26.0%) | 7 (6.4%) |
| $100,000 to $149,999 | 33 (13.2%) | 7 (6.4%) |
| $150,000 or more | 11 (4.4%) | 0 (0.0%) |
| Total | 250 (100.0%) | 110 (100.0%) |
Monthly Housing Cost Tiers in Bulls Gap
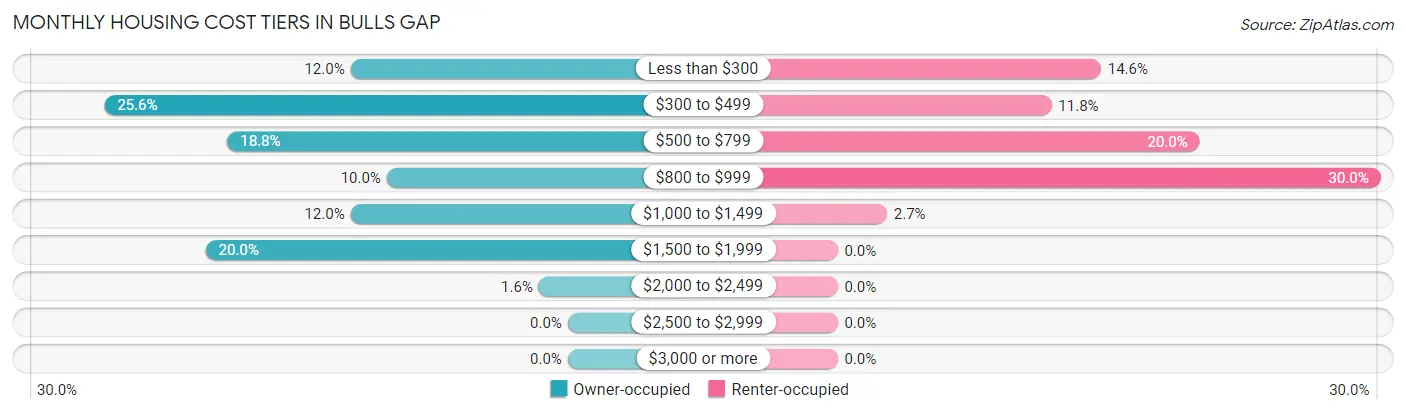
| Monthly Cost | Owner-occupied | Renter-occupied |
| Less than $300 | 30 (12.0%) | 16 (14.5%) |
| $300 to $499 | 64 (25.6%) | 13 (11.8%) |
| $500 to $799 | 47 (18.8%) | 22 (20.0%) |
| $800 to $999 | 25 (10.0%) | 33 (30.0%) |
| $1,000 to $1,499 | 30 (12.0%) | 3 (2.7%) |
| $1,500 to $1,999 | 50 (20.0%) | 0 (0.0%) |
| $2,000 to $2,499 | 4 (1.6%) | 0 (0.0%) |
| $2,500 to $2,999 | 0 (0.0%) | 0 (0.0%) |
| $3,000 or more | 0 (0.0%) | 0 (0.0%) |
| Total | 250 (100.0%) | 110 (100.0%) |
Physical Housing Characteristics in Bulls Gap
Housing Structures in Bulls Gap
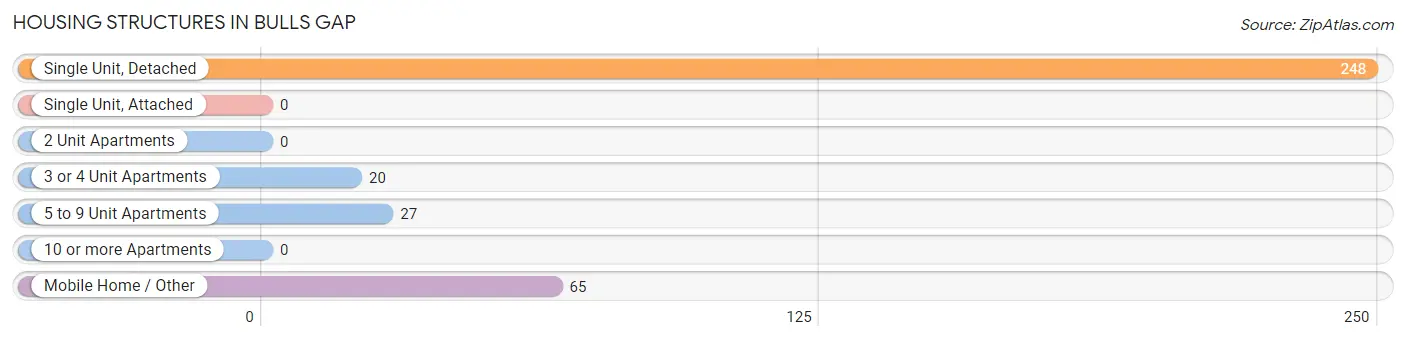
| Structure Type | # Housing Units | % Housing Units |
| Single Unit, Detached | 248 | 68.9% |
| Single Unit, Attached | 0 | 0.0% |
| 2 Unit Apartments | 0 | 0.0% |
| 3 or 4 Unit Apartments | 20 | 5.6% |
| 5 to 9 Unit Apartments | 27 | 7.5% |
| 10 or more Apartments | 0 | 0.0% |
| Mobile Home / Other | 65 | 18.1% |
| Total | 360 | 100.0% |
Housing Structures by Occupancy in Bulls Gap
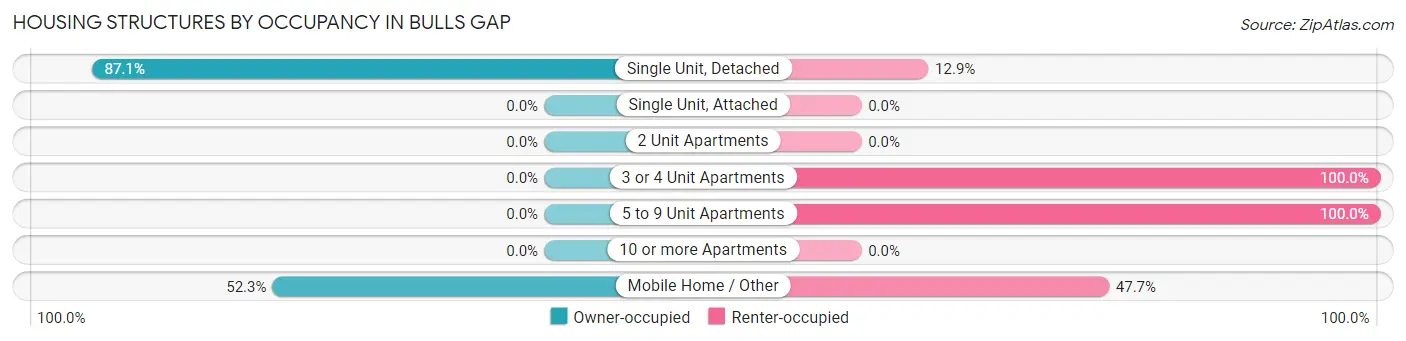
| Structure Type | Owner-occupied | Renter-occupied |
| Single Unit, Detached | 216 (87.1%) | 32 (12.9%) |
| Single Unit, Attached | 0 (0.0%) | 0 (0.0%) |
| 2 Unit Apartments | 0 (0.0%) | 0 (0.0%) |
| 3 or 4 Unit Apartments | 0 (0.0%) | 20 (100.0%) |
| 5 to 9 Unit Apartments | 0 (0.0%) | 27 (100.0%) |
| 10 or more Apartments | 0 (0.0%) | 0 (0.0%) |
| Mobile Home / Other | 34 (52.3%) | 31 (47.7%) |
| Total | 250 (69.4%) | 110 (30.6%) |
Housing Structures by Number of Rooms in Bulls Gap
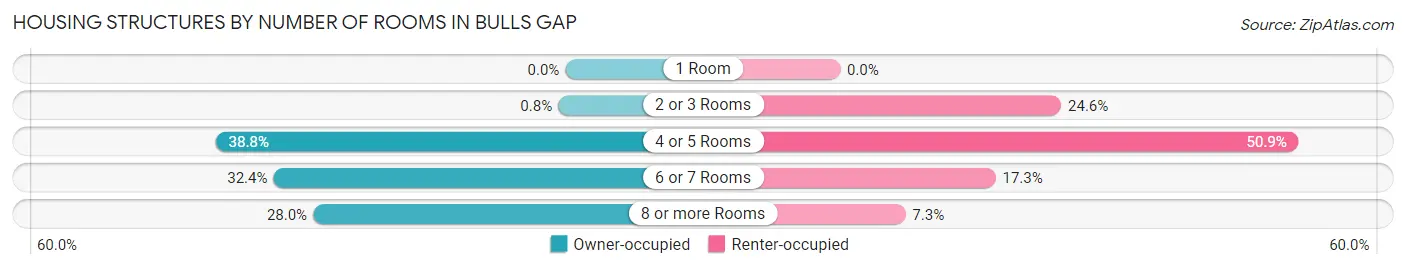
| Number of Rooms | Owner-occupied | Renter-occupied |
| 1 Room | 0 (0.0%) | 0 (0.0%) |
| 2 or 3 Rooms | 2 (0.8%) | 27 (24.5%) |
| 4 or 5 Rooms | 97 (38.8%) | 56 (50.9%) |
| 6 or 7 Rooms | 81 (32.4%) | 19 (17.3%) |
| 8 or more Rooms | 70 (28.0%) | 8 (7.3%) |
| Total | 250 (100.0%) | 110 (100.0%) |
Housing Structure by Heating Type in Bulls Gap
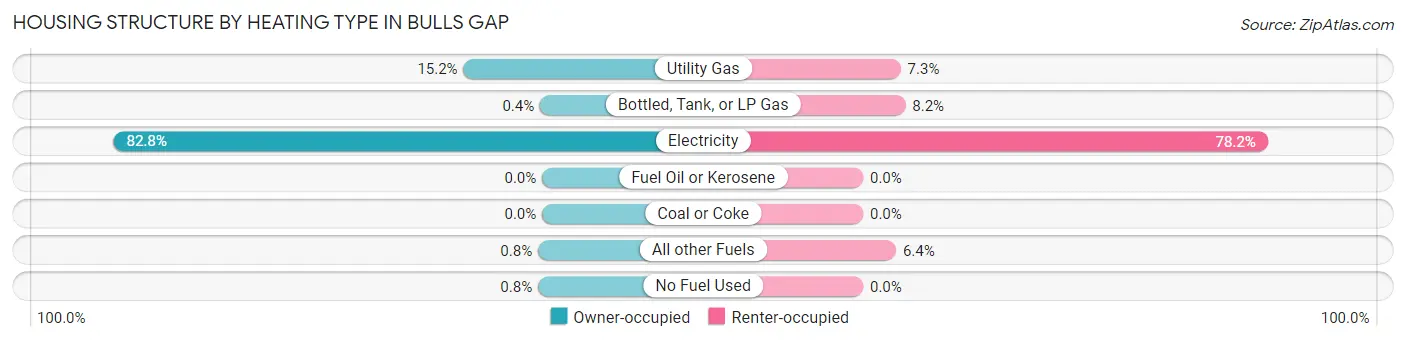
| Heating Type | Owner-occupied | Renter-occupied |
| Utility Gas | 38 (15.2%) | 8 (7.3%) |
| Bottled, Tank, or LP Gas | 1 (0.4%) | 9 (8.2%) |
| Electricity | 207 (82.8%) | 86 (78.2%) |
| Fuel Oil or Kerosene | 0 (0.0%) | 0 (0.0%) |
| Coal or Coke | 0 (0.0%) | 0 (0.0%) |
| All other Fuels | 2 (0.8%) | 7 (6.4%) |
| No Fuel Used | 2 (0.8%) | 0 (0.0%) |
| Total | 250 (100.0%) | 110 (100.0%) |
Household Vehicle Usage in Bulls Gap
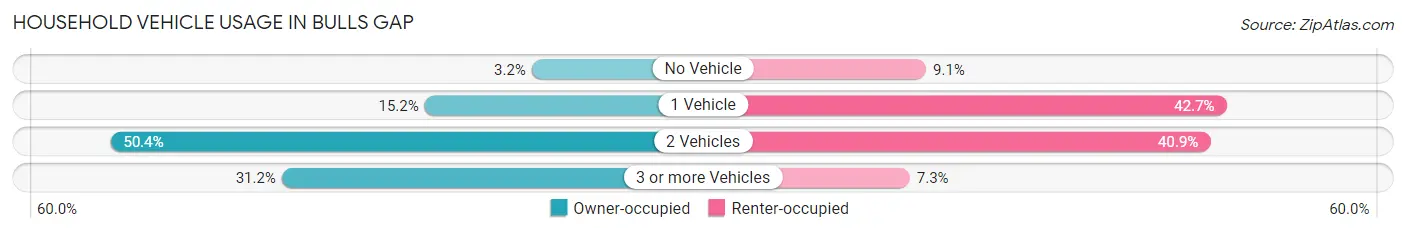
| Vehicles per Household | Owner-occupied | Renter-occupied |
| No Vehicle | 8 (3.2%) | 10 (9.1%) |
| 1 Vehicle | 38 (15.2%) | 47 (42.7%) |
| 2 Vehicles | 126 (50.4%) | 45 (40.9%) |
| 3 or more Vehicles | 78 (31.2%) | 8 (7.3%) |
| Total | 250 (100.0%) | 110 (100.0%) |
Real Estate & Mortgages in Bulls Gap
Real Estate and Mortgage Overview in Bulls Gap
| Characteristic | Without Mortgage | With Mortgage |
| Housing Units | 117 | 133 |
| Median Property Value | $129,100 | $170,800 |
| Median Household Income | $36,250 | $5 |
| Monthly Housing Costs | $368 | $0 |
| Real Estate Taxes | $770 | $6 |
Property Value by Mortgage Status in Bulls Gap
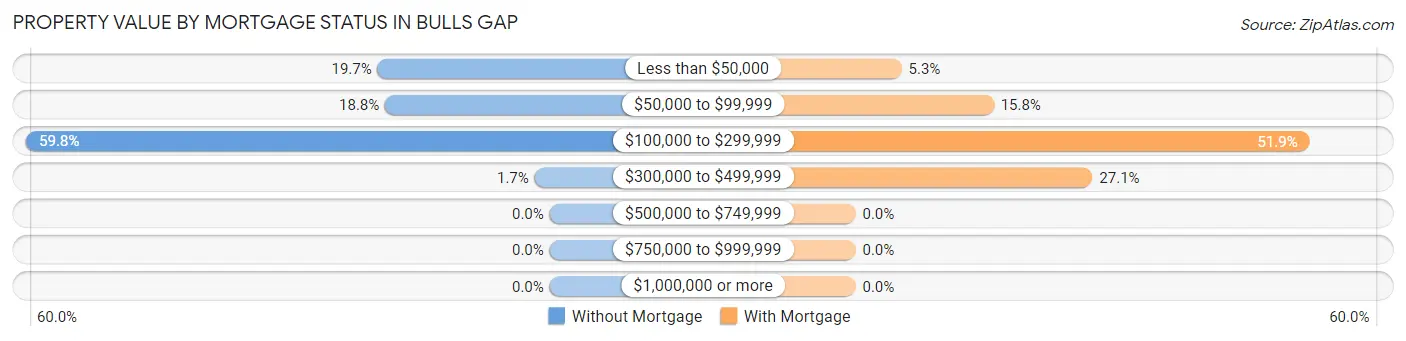
| Property Value | Without Mortgage | With Mortgage |
| Less than $50,000 | 23 (19.7%) | 7 (5.3%) |
| $50,000 to $99,999 | 22 (18.8%) | 21 (15.8%) |
| $100,000 to $299,999 | 70 (59.8%) | 69 (51.9%) |
| $300,000 to $499,999 | 2 (1.7%) | 36 (27.1%) |
| $500,000 to $749,999 | 0 (0.0%) | 0 (0.0%) |
| $750,000 to $999,999 | 0 (0.0%) | 0 (0.0%) |
| $1,000,000 or more | 0 (0.0%) | 0 (0.0%) |
| Total | 117 (100.0%) | 133 (100.0%) |
Household Income by Mortgage Status in Bulls Gap
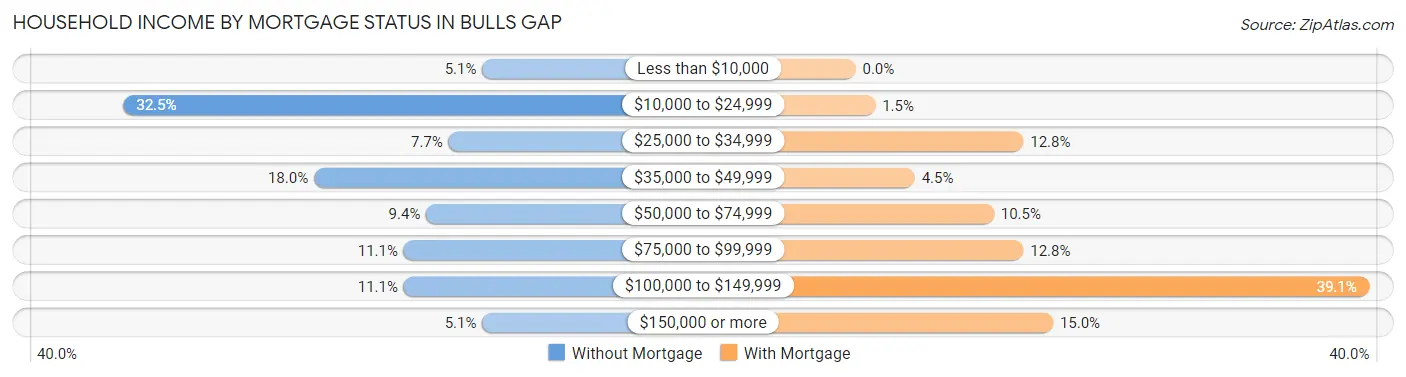
| Household Income | Without Mortgage | With Mortgage |
| Less than $10,000 | 6 (5.1%) | 0 (0.0%) |
| $10,000 to $24,999 | 38 (32.5%) | 2 (1.5%) |
| $25,000 to $34,999 | 9 (7.7%) | 17 (12.8%) |
| $35,000 to $49,999 | 21 (17.9%) | 6 (4.5%) |
| $50,000 to $74,999 | 11 (9.4%) | 14 (10.5%) |
| $75,000 to $99,999 | 13 (11.1%) | 17 (12.8%) |
| $100,000 to $149,999 | 13 (11.1%) | 52 (39.1%) |
| $150,000 or more | 6 (5.1%) | 20 (15.0%) |
| Total | 117 (100.0%) | 133 (100.0%) |
Property Value to Household Income Ratio in Bulls Gap
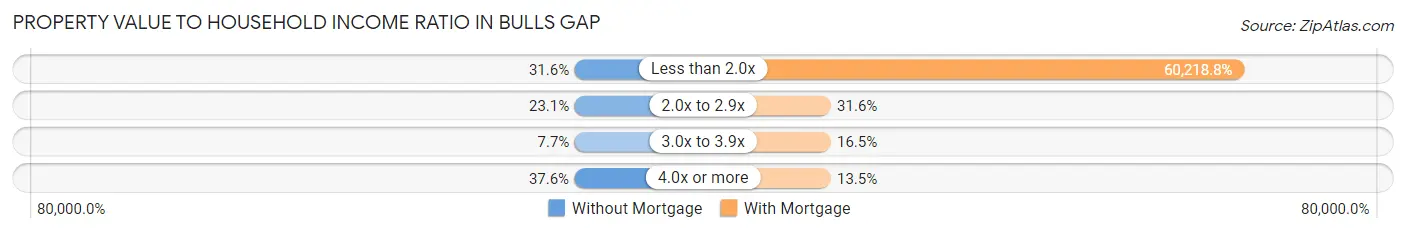
| Value-to-Income Ratio | Without Mortgage | With Mortgage |
| Less than 2.0x | 37 (31.6%) | 80,091 (60,218.8%) |
| 2.0x to 2.9x | 27 (23.1%) | 42 (31.6%) |
| 3.0x to 3.9x | 9 (7.7%) | 22 (16.5%) |
| 4.0x or more | 44 (37.6%) | 18 (13.5%) |
| Total | 117 (100.0%) | 133 (100.0%) |
Real Estate Taxes by Mortgage Status in Bulls Gap
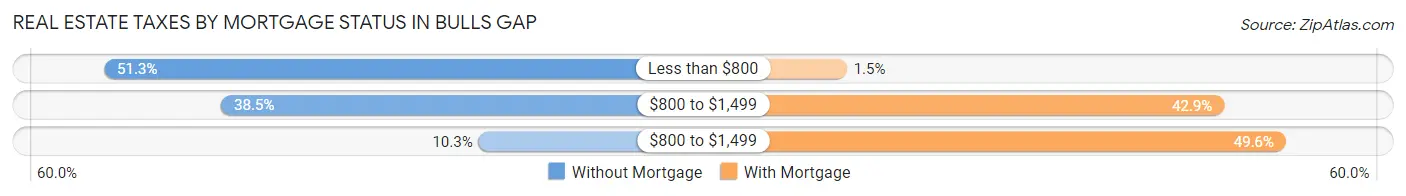
| Property Taxes | Without Mortgage | With Mortgage |
| Less than $800 | 60 (51.3%) | 2 (1.5%) |
| $800 to $1,499 | 45 (38.5%) | 57 (42.9%) |
| $800 to $1,499 | 12 (10.3%) | 66 (49.6%) |
| Total | 117 (100.0%) | 133 (100.0%) |
Health & Disability in Bulls Gap
Health Insurance Coverage by Age in Bulls Gap
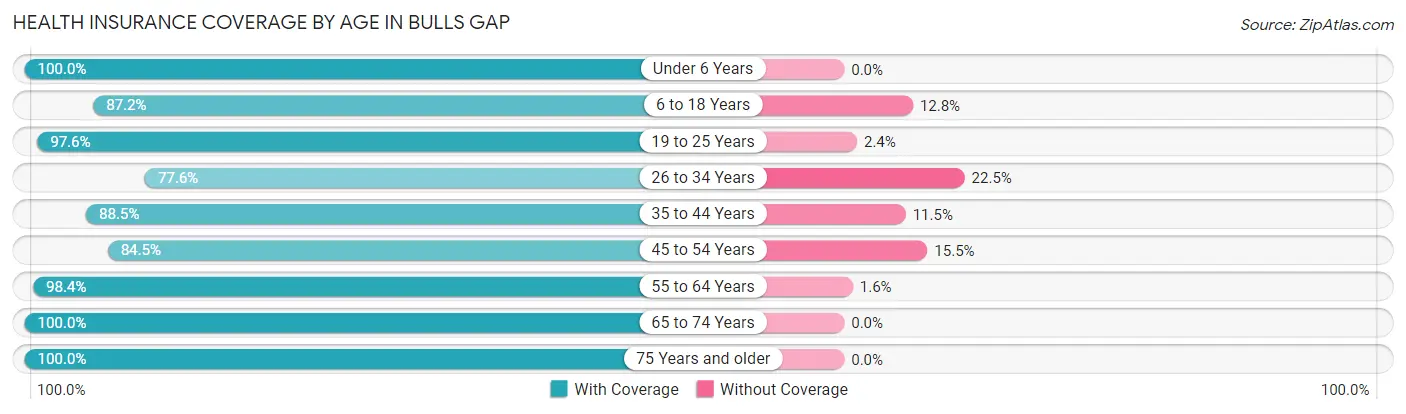
| Age Bracket | With Coverage | Without Coverage |
| Under 6 Years | 26 (100.0%) | 0 (0.0%) |
| 6 to 18 Years | 143 (87.2%) | 21 (12.8%) |
| 19 to 25 Years | 41 (97.6%) | 1 (2.4%) |
| 26 to 34 Years | 76 (77.5%) | 22 (22.5%) |
| 35 to 44 Years | 85 (88.5%) | 11 (11.5%) |
| 45 to 54 Years | 109 (84.5%) | 20 (15.5%) |
| 55 to 64 Years | 124 (98.4%) | 2 (1.6%) |
| 65 to 74 Years | 117 (100.0%) | 0 (0.0%) |
| 75 Years and older | 77 (100.0%) | 0 (0.0%) |
| Total | 798 (91.2%) | 77 (8.8%) |
Health Insurance Coverage by Citizenship Status in Bulls Gap
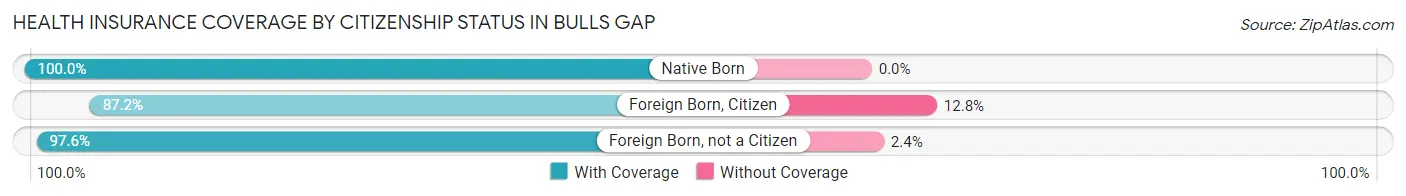
| Citizenship Status | With Coverage | Without Coverage |
| Native Born | 26 (100.0%) | 0 (0.0%) |
| Foreign Born, Citizen | 143 (87.2%) | 21 (12.8%) |
| Foreign Born, not a Citizen | 41 (97.6%) | 1 (2.4%) |
Health Insurance Coverage by Household Income in Bulls Gap
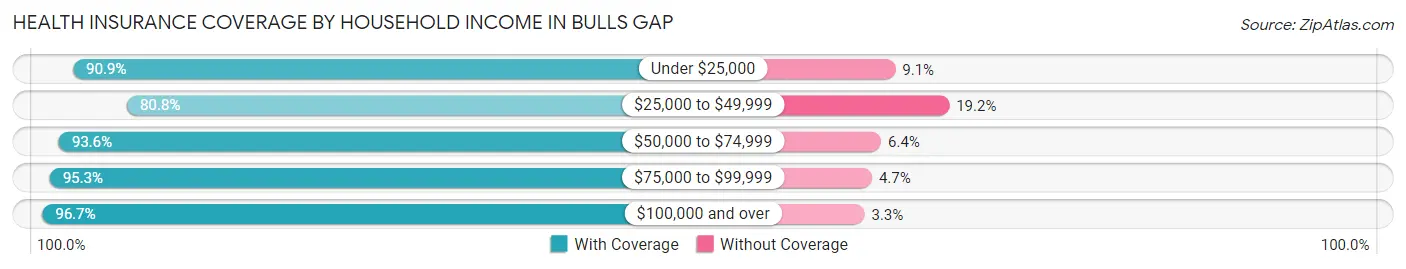
| Household Income | With Coverage | Without Coverage |
| Under $25,000 | 170 (90.9%) | 17 (9.1%) |
| $25,000 to $49,999 | 160 (80.8%) | 38 (19.2%) |
| $50,000 to $74,999 | 102 (93.6%) | 7 (6.4%) |
| $75,000 to $99,999 | 162 (95.3%) | 8 (4.7%) |
| $100,000 and over | 204 (96.7%) | 7 (3.3%) |
Public vs Private Health Insurance Coverage by Age in Bulls Gap
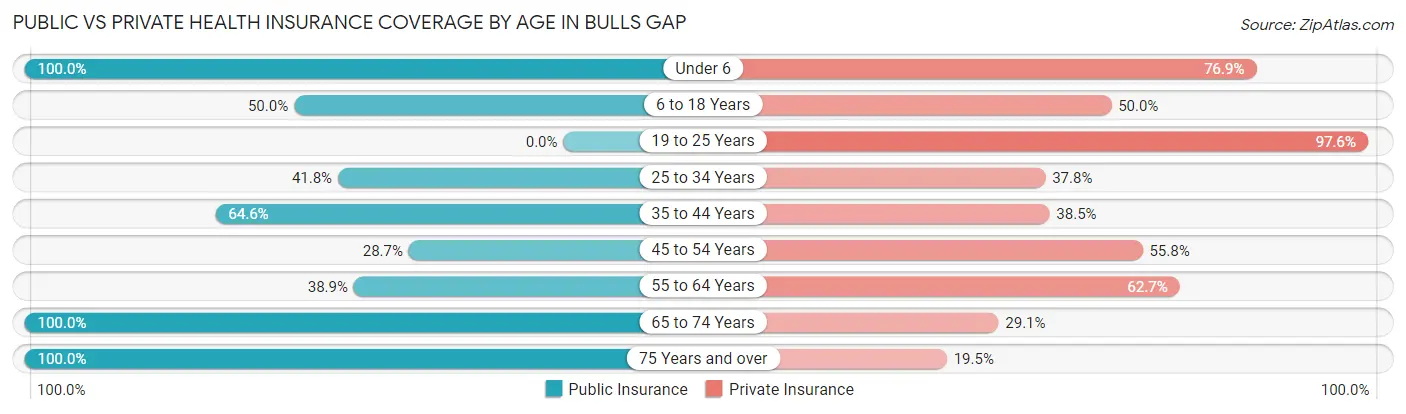
| Age Bracket | Public Insurance | Private Insurance |
| Under 6 | 26 (100.0%) | 20 (76.9%) |
| 6 to 18 Years | 82 (50.0%) | 82 (50.0%) |
| 19 to 25 Years | 0 (0.0%) | 41 (97.6%) |
| 25 to 34 Years | 41 (41.8%) | 37 (37.8%) |
| 35 to 44 Years | 62 (64.6%) | 37 (38.5%) |
| 45 to 54 Years | 37 (28.7%) | 72 (55.8%) |
| 55 to 64 Years | 49 (38.9%) | 79 (62.7%) |
| 65 to 74 Years | 117 (100.0%) | 34 (29.1%) |
| 75 Years and over | 77 (100.0%) | 15 (19.5%) |
| Total | 491 (56.1%) | 417 (47.7%) |
Disability Status by Sex by Age in Bulls Gap
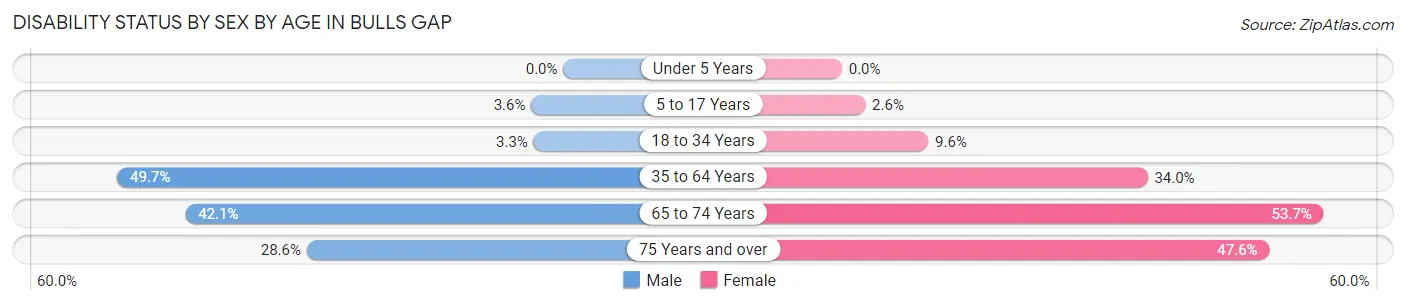
| Age Bracket | Male | Female |
| Under 5 Years | 0 (0.0%) | 0 (0.0%) |
| 5 to 17 Years | 3 (3.6%) | 2 (2.6%) |
| 18 to 34 Years | 3 (3.3%) | 5 (9.6%) |
| 35 to 64 Years | 81 (49.7%) | 64 (34.0%) |
| 65 to 74 Years | 32 (42.1%) | 22 (53.7%) |
| 75 Years and over | 16 (28.6%) | 10 (47.6%) |
Disability Class by Sex by Age in Bulls Gap
Disability Class: Hearing Difficulty
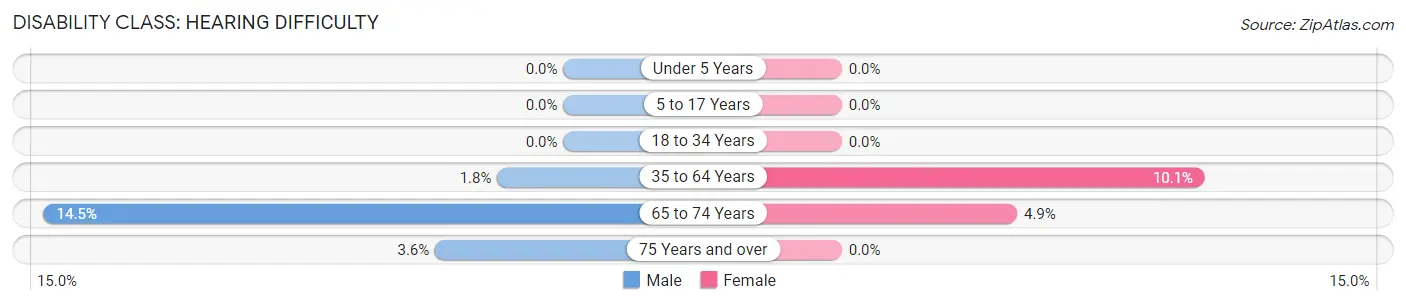
| Age Bracket | Male | Female |
| Under 5 Years | 0 (0.0%) | 0 (0.0%) |
| 5 to 17 Years | 0 (0.0%) | 0 (0.0%) |
| 18 to 34 Years | 0 (0.0%) | 0 (0.0%) |
| 35 to 64 Years | 3 (1.8%) | 19 (10.1%) |
| 65 to 74 Years | 11 (14.5%) | 2 (4.9%) |
| 75 Years and over | 2 (3.6%) | 0 (0.0%) |
Disability Class: Vision Difficulty
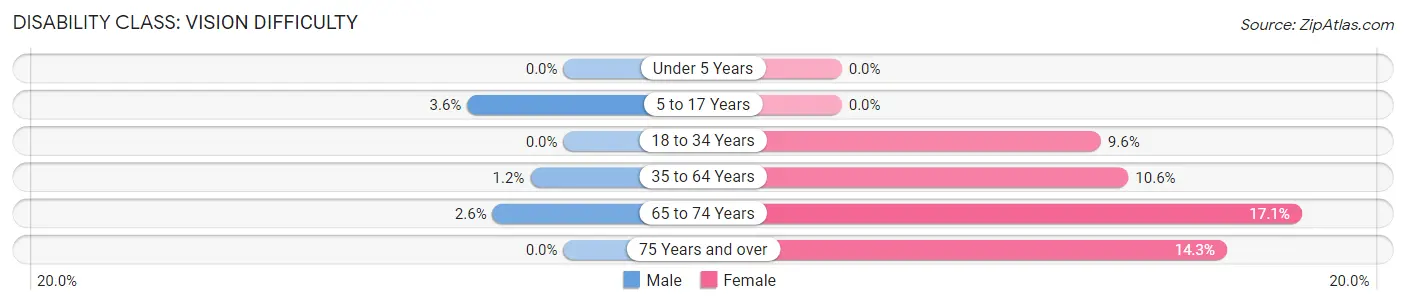
| Age Bracket | Male | Female |
| Under 5 Years | 0 (0.0%) | 0 (0.0%) |
| 5 to 17 Years | 3 (3.6%) | 0 (0.0%) |
| 18 to 34 Years | 0 (0.0%) | 5 (9.6%) |
| 35 to 64 Years | 2 (1.2%) | 20 (10.6%) |
| 65 to 74 Years | 2 (2.6%) | 7 (17.1%) |
| 75 Years and over | 0 (0.0%) | 3 (14.3%) |
Disability Class: Cognitive Difficulty
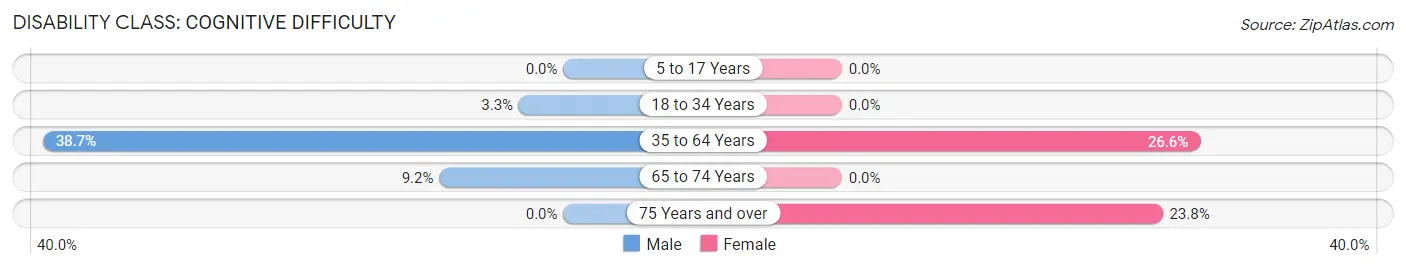
| Age Bracket | Male | Female |
| 5 to 17 Years | 0 (0.0%) | 0 (0.0%) |
| 18 to 34 Years | 3 (3.3%) | 0 (0.0%) |
| 35 to 64 Years | 63 (38.7%) | 50 (26.6%) |
| 65 to 74 Years | 7 (9.2%) | 0 (0.0%) |
| 75 Years and over | 0 (0.0%) | 5 (23.8%) |
Disability Class: Ambulatory Difficulty
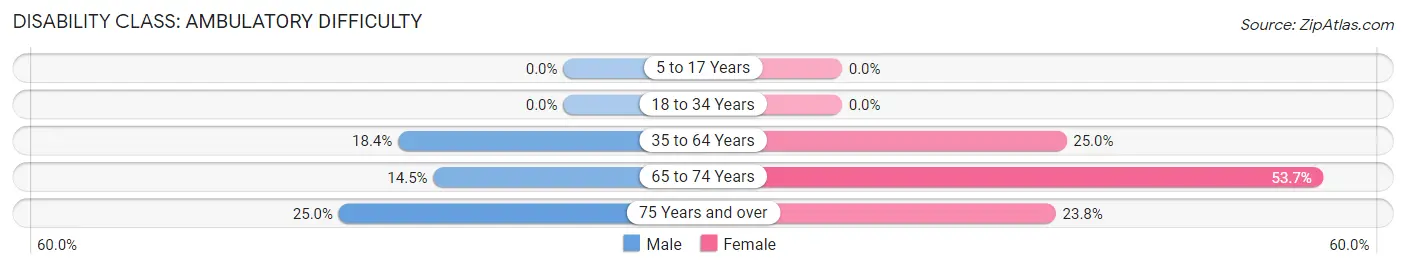
| Age Bracket | Male | Female |
| 5 to 17 Years | 0 (0.0%) | 0 (0.0%) |
| 18 to 34 Years | 0 (0.0%) | 0 (0.0%) |
| 35 to 64 Years | 30 (18.4%) | 47 (25.0%) |
| 65 to 74 Years | 11 (14.5%) | 22 (53.7%) |
| 75 Years and over | 14 (25.0%) | 5 (23.8%) |
Disability Class: Self-Care Difficulty
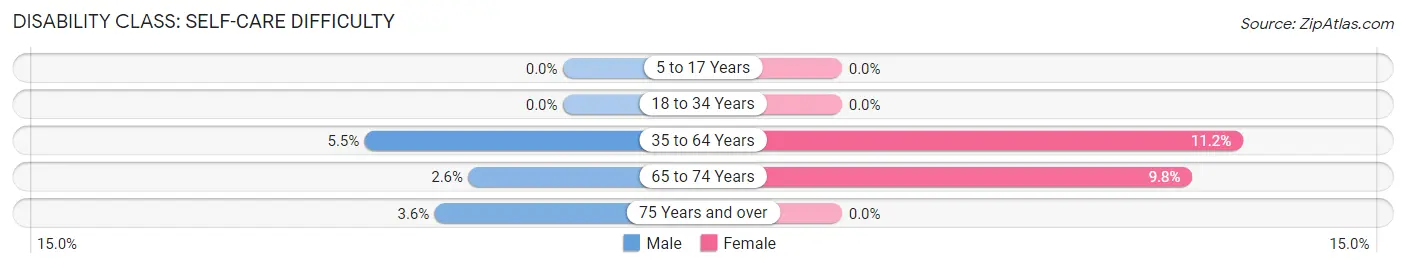
| Age Bracket | Male | Female |
| 5 to 17 Years | 0 (0.0%) | 0 (0.0%) |
| 18 to 34 Years | 0 (0.0%) | 0 (0.0%) |
| 35 to 64 Years | 9 (5.5%) | 21 (11.2%) |
| 65 to 74 Years | 2 (2.6%) | 4 (9.8%) |
| 75 Years and over | 2 (3.6%) | 0 (0.0%) |
Technology Access in Bulls Gap
Computing Device Access in Bulls Gap
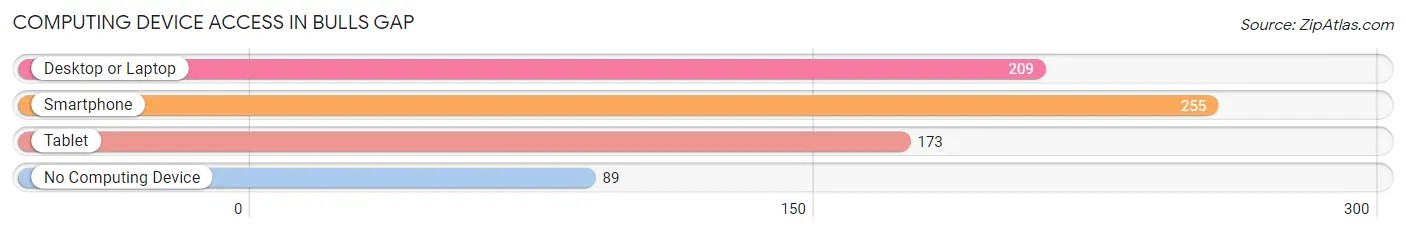
| Device Type | # Households | % Households |
| Desktop or Laptop | 209 | 58.1% |
| Smartphone | 255 | 70.8% |
| Tablet | 173 | 48.1% |
| No Computing Device | 89 | 24.7% |
| Total | 360 | 100.0% |
Internet Access in Bulls Gap
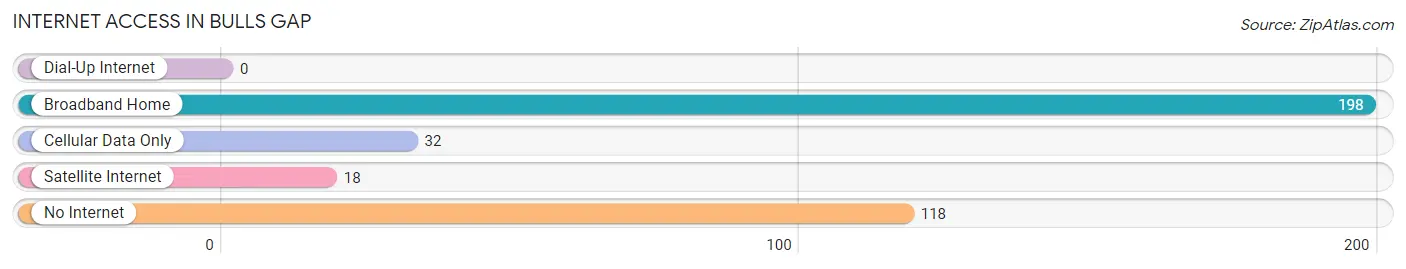
| Internet Type | # Households | % Households |
| Dial-Up Internet | 0 | 0.0% |
| Broadband Home | 198 | 55.0% |
| Cellular Data Only | 32 | 8.9% |
| Satellite Internet | 18 | 5.0% |
| No Internet | 118 | 32.8% |
| Total | 360 | 100.0% |
Bulls Gap Summary
Bulls Gap is a small town located in Hawkins County, Tennessee. It is situated in the foothills of the Appalachian Mountains and is part of the Tri-Cities region of Northeast Tennessee. The town has a population of approximately 1,000 people and is located about 25 miles northeast of Knoxville.
History
The area that is now Bulls Gap was first settled in the late 1700s by a group of settlers from North Carolina. The town was originally known as “Bull’s Gap” after a local settler named John Bull. The town was officially incorporated in 1883 and was named after the nearby gap in the mountains.
In the late 1800s, Bulls Gap was a thriving community with a variety of businesses, including a hotel, a general store, a blacksmith shop, and a grist mill. The town was also home to a number of churches, including the Bulls Gap Methodist Church, which was founded in 1883.
In the early 1900s, Bulls Gap began to decline as the railroad bypassed the town. The decline continued until the 1950s when the town began to experience a resurgence. The town was revitalized by the construction of a new highway, which brought new businesses and residents to the area.
Geography
Bulls Gap is located in the foothills of the Appalachian Mountains in Hawkins County, Tennessee. The town is situated at the intersection of State Route 11 and State Route 70. The town is located about 25 miles northeast of Knoxville and is part of the Tri-Cities region of Northeast Tennessee.
The town is situated in a valley surrounded by hills and mountains. The nearby Clinch Mountain is the highest peak in the area, reaching an elevation of 4,843 feet. The town is also located near the Cherokee National Forest, which is home to a variety of wildlife and outdoor activities.
Economy
The economy of Bulls Gap is largely based on agriculture and tourism. The town is home to a number of farms, which produce a variety of crops, including corn, soybeans, and hay. The town is also home to a number of tourist attractions, including the Bulls Gap Railroad Museum and the Bulls Gap Speedway.
The town is also home to a number of small businesses, including restaurants, retail stores, and auto repair shops. The town is also home to a number of manufacturing companies, including a furniture factory and a plastics factory.
Demographics
As of the 2010 census, the population of Bulls Gap was 1,000 people. The town is predominantly white, with about 95% of the population being white. The median household income in the town is $35,000, and the median age is 42 years old.
Conclusion
Bulls Gap is a small town located in Hawkins County, Tennessee. The town has a population of approximately 1,000 people and is situated in the foothills of the Appalachian Mountains. The town’s economy is largely based on agriculture and tourism, and the town is home to a number of small businesses. The town is predominantly white, with about 95% of the population being white.
Common Questions
What is Per Capita Income in Bulls Gap?
Per Capita income in Bulls Gap is $24,812.
What is the Median Family Income in Bulls Gap?
Median Family Income in Bulls Gap is $51,932.
What is the Median Household income in Bulls Gap?
Median Household Income in Bulls Gap is $48,000.
What is Income or Wage Gap in Bulls Gap?
Income or Wage Gap in Bulls Gap is 48.5%.
Women in Bulls Gap earn 51.5 cents for every dollar earned by a man.
What is Inequality or Gini Index in Bulls Gap?
Inequality or Gini Index in Bulls Gap is 0.41.
What is the Total Population of Bulls Gap?
Total Population of Bulls Gap is 875.
What is the Total Male Population of Bulls Gap?
Total Male Population of Bulls Gap is 478.
What is the Total Female Population of Bulls Gap?
Total Female Population of Bulls Gap is 397.
What is the Ratio of Males per 100 Females in Bulls Gap?
There are 120.40 Males per 100 Females in Bulls Gap.
What is the Ratio of Females per 100 Males in Bulls Gap?
There are 83.05 Females per 100 Males in Bulls Gap.
What is the Median Population Age in Bulls Gap?
Median Population Age in Bulls Gap is 47.1 Years.
What is the Average Family Size in Bulls Gap
Average Family Size in Bulls Gap is 3.2 People.
What is the Average Household Size in Bulls Gap
Average Household Size in Bulls Gap is 2.4 People.
How Large is the Labor Force in Bulls Gap?
There are 287 People in the Labor Forcein in Bulls Gap.
What is the Percentage of People in the Labor Force in Bulls Gap?
40.9% of People are in the Labor Force in Bulls Gap.
What is the Unemployment Rate in Bulls Gap?
Unemployment Rate in Bulls Gap is 8.0%.