Bruceton, TN Map & Demographics
Bruceton Map
Bruceton Overview
$27,346
PER CAPITA INCOME
$59,344
AVG FAMILY INCOME
$54,740
AVG HOUSEHOLD INCOME
29.2%
WAGE / INCOME GAP [ % ]
70.8¢/ $1
WAGE / INCOME GAP [ $ ]
0.42
INEQUALITY / GINI INDEX
1,311
TOTAL POPULATION
628
MALE POPULATION
683
FEMALE POPULATION
91.95
MALES / 100 FEMALES
108.76
FEMALES / 100 MALES
49.0
MEDIAN AGE
2.9
AVG FAMILY SIZE
2.3
AVG HOUSEHOLD SIZE
452
LABOR FORCE [ PEOPLE ]
43.3%
PERCENT IN LABOR FORCE
2.9%
UNEMPLOYMENT RATE
Bruceton Zip Codes
Bruceton Area Codes
Income in Bruceton
Income Overview in Bruceton
Per Capita Income in Bruceton is $27,346, while median incomes of families and households are $59,344 and $54,740 respectively.
| Characteristic | Number | Measure |
| Per Capita Income | 1,311 | $27,346 |
| Median Family Income | 337 | $59,344 |
| Mean Family Income | 337 | $70,582 |
| Median Household Income | 531 | $54,740 |
| Mean Household Income | 531 | $64,783 |
| Income Deficit | 337 | $0 |
| Wage / Income Gap (%) | 1,311 | 29.22% |
| Wage / Income Gap ($) | 1,311 | 70.78¢ per $1 |
| Gini / Inequality Index | 1,311 | 0.42 |
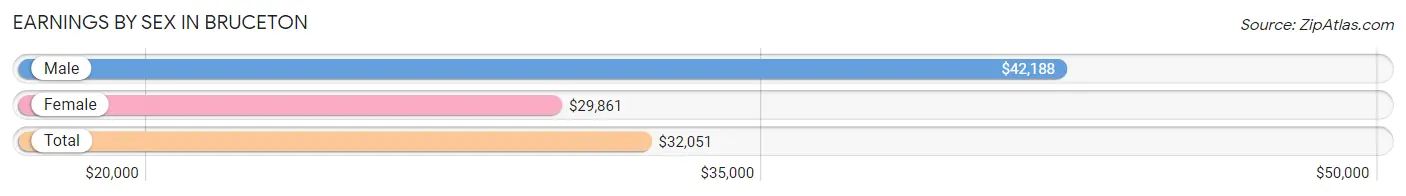
Earnings by Sex in Bruceton
Average Earnings in Bruceton are $32,051, $42,188 for men and $29,861 for women, a difference of 29.2%.
| Sex | Number | Average Earnings |
| Male | 227 (50.0%) | $42,188 |
| Female | 227 (50.0%) | $29,861 |
| Total | 454 (100.0%) | $32,051 |
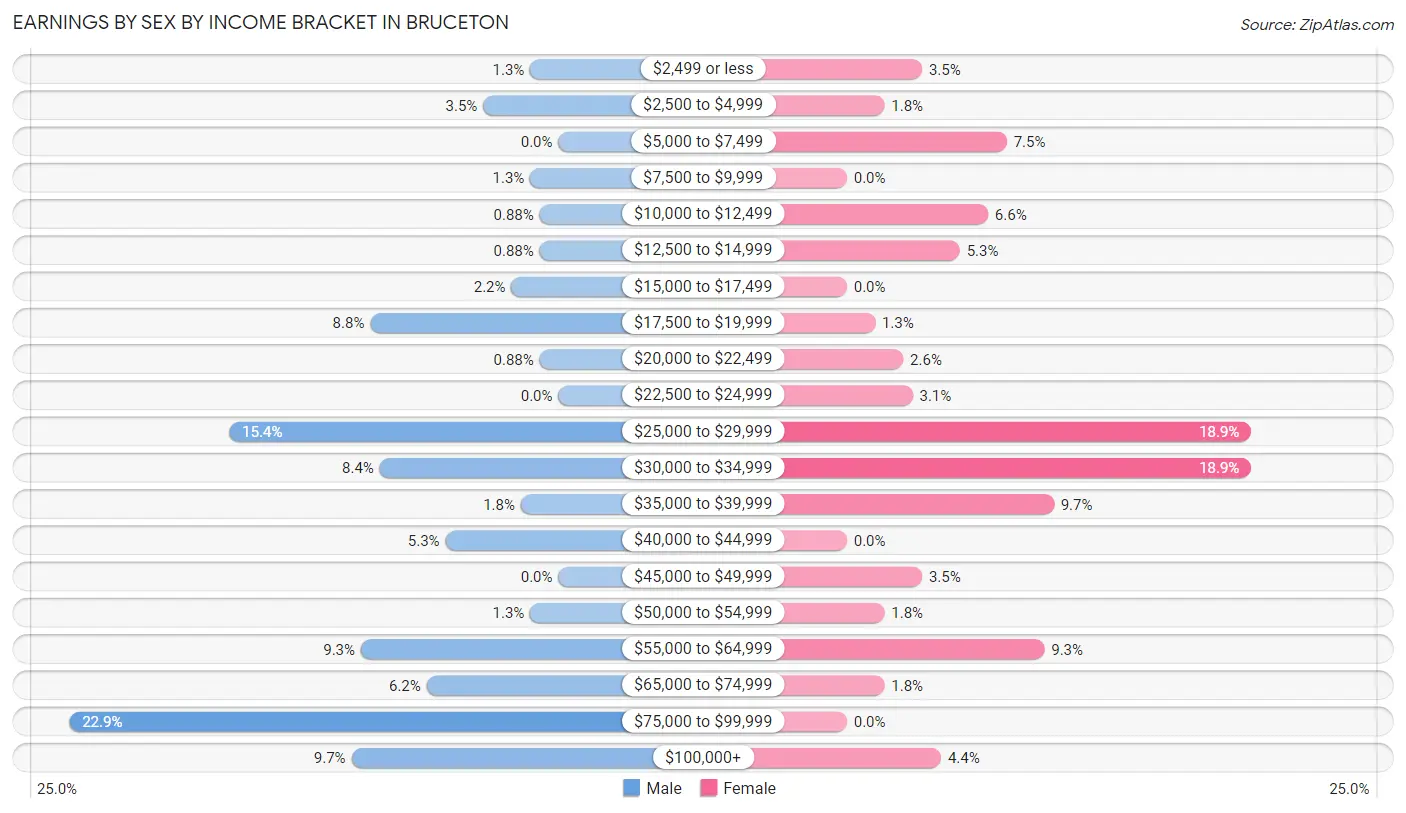
Earnings by Sex by Income Bracket in Bruceton
The most common earnings brackets in Bruceton are $75,000 to $99,999 for men (52 | 22.9%) and $25,000 to $29,999 for women (43 | 18.9%).
| Income | Male | Female |
| $2,499 or less | 3 (1.3%) | 8 (3.5%) |
| $2,500 to $4,999 | 8 (3.5%) | 4 (1.8%) |
| $5,000 to $7,499 | 0 (0.0%) | 17 (7.5%) |
| $7,500 to $9,999 | 3 (1.3%) | 0 (0.0%) |
| $10,000 to $12,499 | 2 (0.9%) | 15 (6.6%) |
| $12,500 to $14,999 | 2 (0.9%) | 12 (5.3%) |
| $15,000 to $17,499 | 5 (2.2%) | 0 (0.0%) |
| $17,500 to $19,999 | 20 (8.8%) | 3 (1.3%) |
| $20,000 to $22,499 | 2 (0.9%) | 6 (2.6%) |
| $22,500 to $24,999 | 0 (0.0%) | 7 (3.1%) |
| $25,000 to $29,999 | 35 (15.4%) | 43 (18.9%) |
| $30,000 to $34,999 | 19 (8.4%) | 43 (18.9%) |
| $35,000 to $39,999 | 4 (1.8%) | 22 (9.7%) |
| $40,000 to $44,999 | 12 (5.3%) | 0 (0.0%) |
| $45,000 to $49,999 | 0 (0.0%) | 8 (3.5%) |
| $50,000 to $54,999 | 3 (1.3%) | 4 (1.8%) |
| $55,000 to $64,999 | 21 (9.2%) | 21 (9.2%) |
| $65,000 to $74,999 | 14 (6.2%) | 4 (1.8%) |
| $75,000 to $99,999 | 52 (22.9%) | 0 (0.0%) |
| $100,000+ | 22 (9.7%) | 10 (4.4%) |
| Total | 227 (100.0%) | 227 (100.0%) |
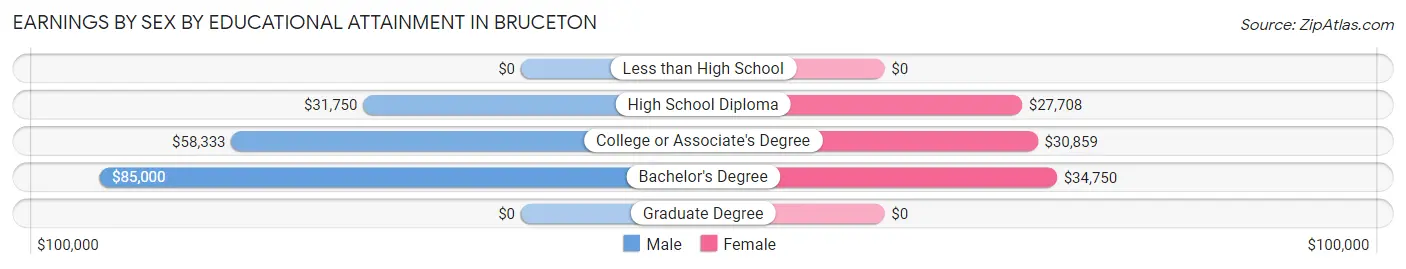
Earnings by Sex by Educational Attainment in Bruceton
Average earnings in Bruceton are $55,833 for men and $31,364 for women, a difference of 43.8%. Men with an educational attainment of bachelor's degree enjoy the highest average annual earnings of $85,000, while those with high school diploma education earn the least with $31,750. Women with an educational attainment of bachelor's degree earn the most with the average annual earnings of $34,750, while those with high school diploma education have the smallest earnings of $27,708.
| Educational Attainment | Male Income | Female Income |
| Less than High School | - | - |
| High School Diploma | $31,750 | $27,708 |
| College or Associate's Degree | $58,333 | $30,859 |
| Bachelor's Degree | $85,000 | $34,750 |
| Graduate Degree | - | - |
| Total | $55,833 | $31,364 |
Family Income in Bruceton
Family Income Brackets in Bruceton
According to the Bruceton family income data, there are 90 families falling into the $50,000 to $74,999 income range, which is the most common income bracket and makes up 26.7% of all families. Conversely, the $200,000+ income bracket is the least frequent group with only 5 families (1.5%) belonging to this category.
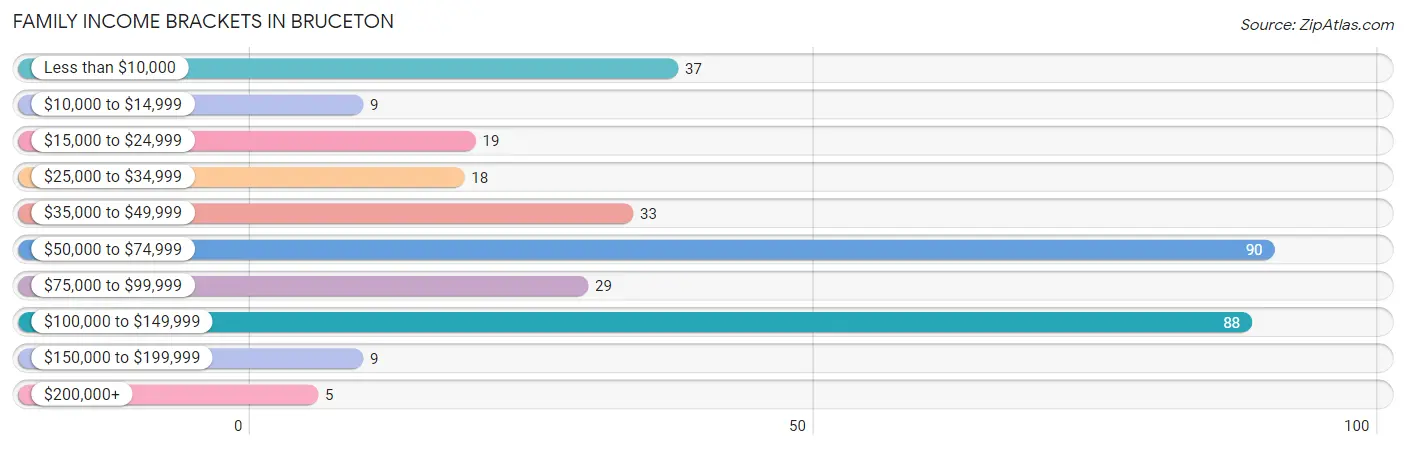
| Income Bracket | # Families | % Families |
| Less than $10,000 | 37 | 11.0% |
| $10,000 to $14,999 | 9 | 2.7% |
| $15,000 to $24,999 | 19 | 5.6% |
| $25,000 to $34,999 | 18 | 5.3% |
| $35,000 to $49,999 | 33 | 9.8% |
| $50,000 to $74,999 | 90 | 26.7% |
| $75,000 to $99,999 | 29 | 8.6% |
| $100,000 to $149,999 | 88 | 26.1% |
| $150,000 to $199,999 | 9 | 2.7% |
| $200,000+ | 5 | 1.5% |
Family Income by Famaliy Size in Bruceton
4-person families (52 | 15.4%) account for the highest median family income in Bruceton with $118,750 per family, while 4-person families (52 | 15.4%) have the highest median income of $29,688 per family member.
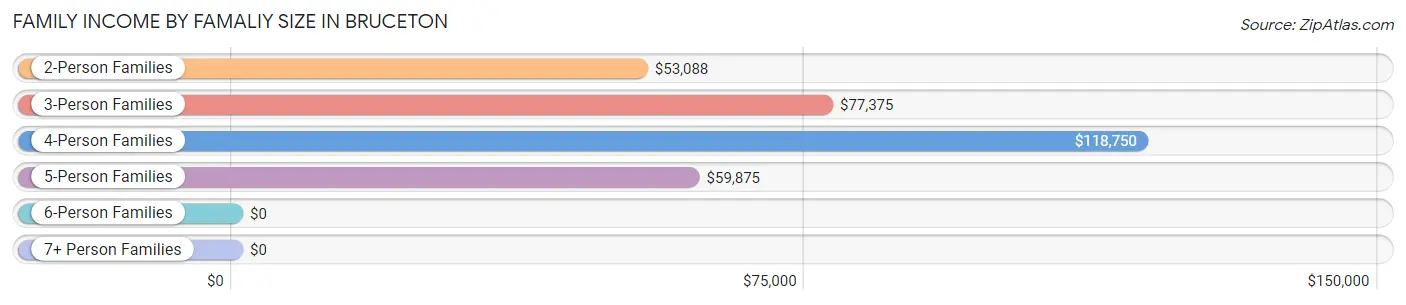
| Income Bracket | # Families | Median Income |
| 2-Person Families | 200 (59.4%) | $53,088 |
| 3-Person Families | 57 (16.9%) | $77,375 |
| 4-Person Families | 52 (15.4%) | $118,750 |
| 5-Person Families | 19 (5.6%) | $59,875 |
| 6-Person Families | 9 (2.7%) | $0 |
| 7+ Person Families | 0 (0.0%) | $0 |
| Total | 337 (100.0%) | $59,344 |
Family Income by Number of Earners in Bruceton
The median family income in Bruceton is $59,344, with families comprising 2 earners (101) having the highest median family income of $107,232, while families with no earners (100) have the lowest median family income of $30,625, accounting for 30.0% and 29.7% of families, respectively.
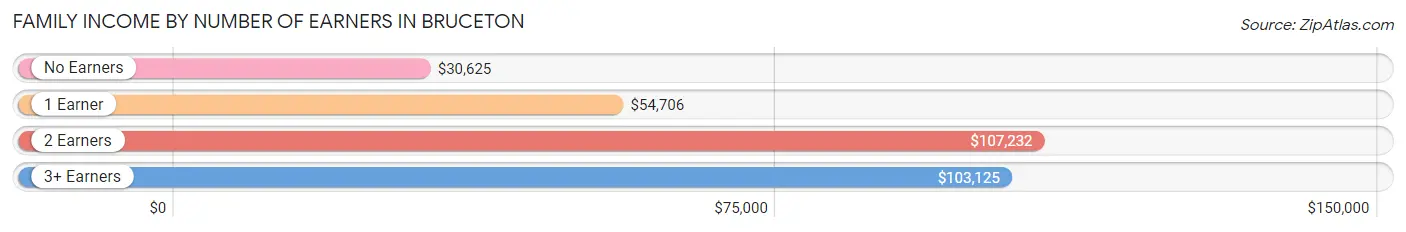
| Number of Earners | # Families | Median Income |
| No Earners | 100 (29.7%) | $30,625 |
| 1 Earner | 114 (33.8%) | $54,706 |
| 2 Earners | 101 (30.0%) | $107,232 |
| 3+ Earners | 22 (6.5%) | $103,125 |
| Total | 337 (100.0%) | $59,344 |
Household Income in Bruceton
Household Income Brackets in Bruceton
With 131 households falling in the category, the $100,000 to $149,999 income range is the most frequent in Bruceton, accounting for 24.7% of all households. In contrast, only 5 households (0.9%) fall into the $200,000+ income bracket, making it the least populous group.
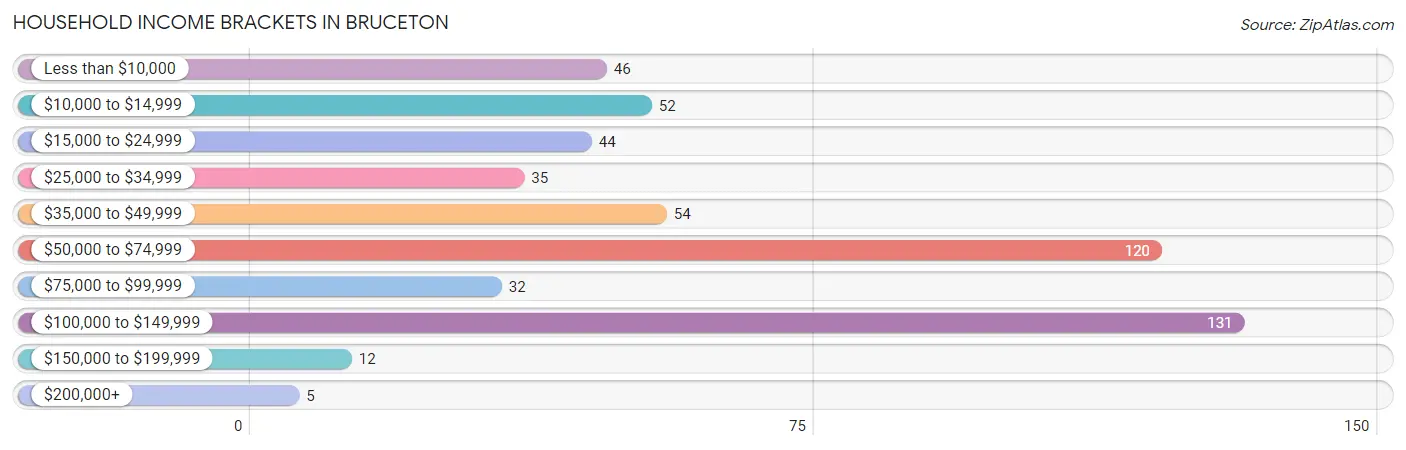
| Income Bracket | # Households | % Households |
| Less than $10,000 | 46 | 8.7% |
| $10,000 to $14,999 | 52 | 9.8% |
| $15,000 to $24,999 | 44 | 8.3% |
| $25,000 to $34,999 | 35 | 6.6% |
| $35,000 to $49,999 | 54 | 10.2% |
| $50,000 to $74,999 | 120 | 22.6% |
| $75,000 to $99,999 | 32 | 6.0% |
| $100,000 to $149,999 | 131 | 24.7% |
| $150,000 to $199,999 | 12 | 2.3% |
| $200,000+ | 5 | 0.9% |
Household Income by Householder Age in Bruceton
The median household income in Bruceton is $54,740, with the highest median household income of $71,250 found in the 45 to 64 years age bracket for the primary householder. A total of 200 households (37.7%) fall into this category. Meanwhile, the 15 to 24 years age bracket for the primary householder has the lowest median household income of $0, with 15 households (2.8%) in this group.
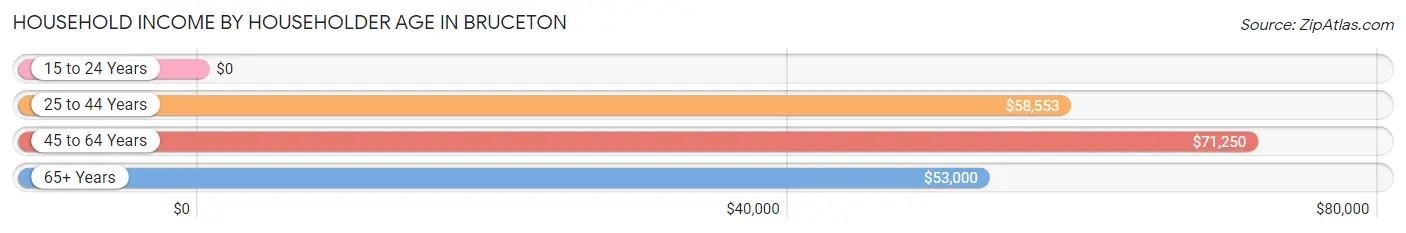
| Income Bracket | # Households | Median Income |
| 15 to 24 Years | 15 (2.8%) | $0 |
| 25 to 44 Years | 118 (22.2%) | $58,553 |
| 45 to 64 Years | 200 (37.7%) | $71,250 |
| 65+ Years | 198 (37.3%) | $53,000 |
| Total | 531 (100.0%) | $54,740 |
Poverty in Bruceton
Income Below Poverty by Sex and Age in Bruceton
With 11.1% poverty level for males and 23.1% for females among the residents of Bruceton, under 5 year old males and 16 and 17 year old females are the most vulnerable to poverty, with 15 males (44.1%) and 10 females (100.0%) in their respective age groups living below the poverty level.
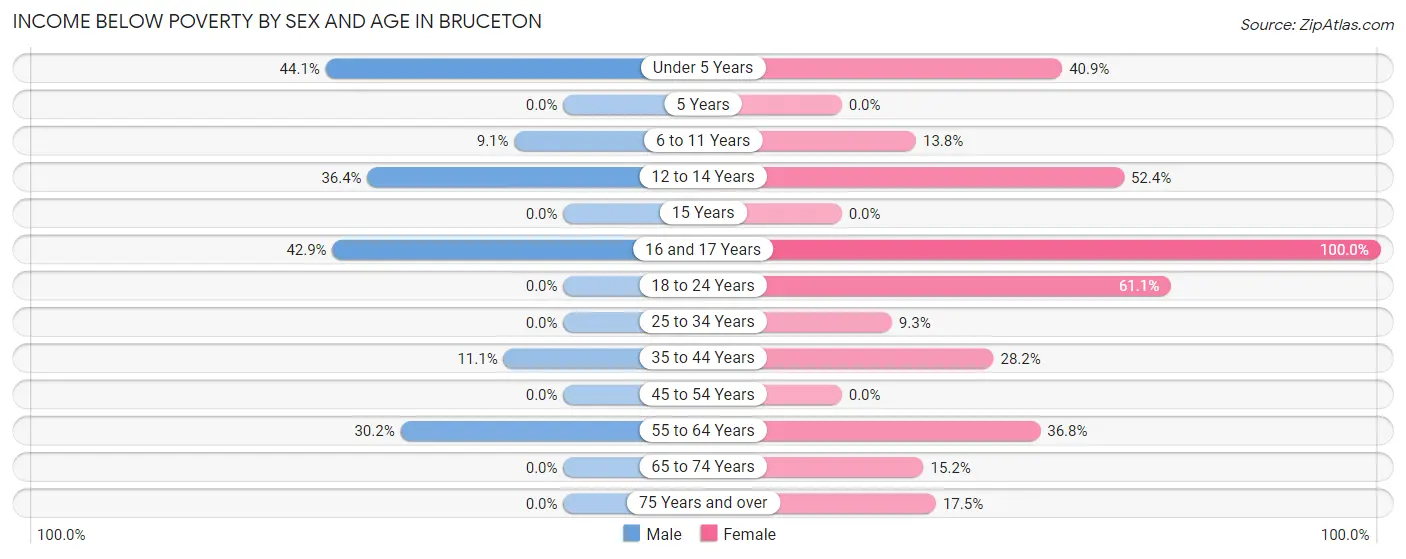
| Age Bracket | Male | Female |
| Under 5 Years | 15 (44.1%) | 9 (40.9%) |
| 5 Years | 0 (0.0%) | 0 (0.0%) |
| 6 to 11 Years | 8 (9.1%) | 8 (13.8%) |
| 12 to 14 Years | 8 (36.4%) | 11 (52.4%) |
| 15 Years | 0 (0.0%) | 0 (0.0%) |
| 16 and 17 Years | 3 (42.9%) | 10 (100.0%) |
| 18 to 24 Years | 0 (0.0%) | 22 (61.1%) |
| 25 to 34 Years | 0 (0.0%) | 4 (9.3%) |
| 35 to 44 Years | 6 (11.1%) | 20 (28.2%) |
| 45 to 54 Years | 0 (0.0%) | 0 (0.0%) |
| 55 to 64 Years | 26 (30.2%) | 28 (36.8%) |
| 65 to 74 Years | 0 (0.0%) | 12 (15.2%) |
| 75 Years and over | 0 (0.0%) | 18 (17.5%) |
| Total | 66 (11.1%) | 142 (23.1%) |
Income Above Poverty by Sex and Age in Bruceton
According to the poverty statistics in Bruceton, males aged 5 years and females aged 5 years are the age groups that are most secure financially, with 100.0% of males and 100.0% of females in these age groups living above the poverty line.
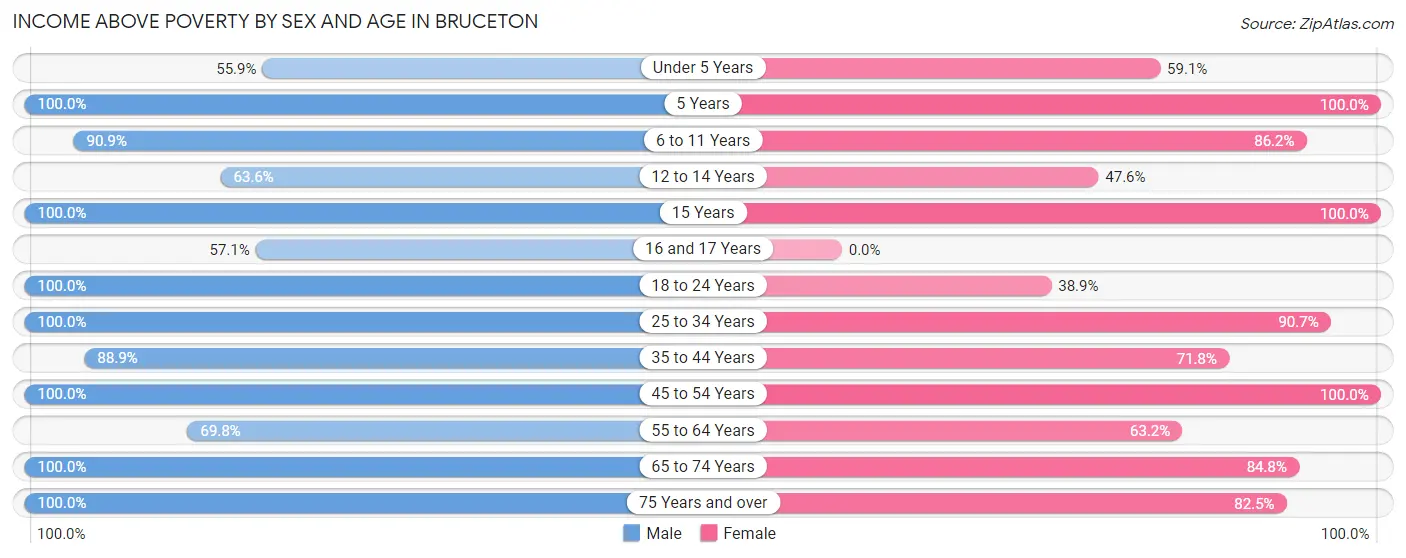
| Age Bracket | Male | Female |
| Under 5 Years | 19 (55.9%) | 13 (59.1%) |
| 5 Years | 8 (100.0%) | 7 (100.0%) |
| 6 to 11 Years | 80 (90.9%) | 50 (86.2%) |
| 12 to 14 Years | 14 (63.6%) | 10 (47.6%) |
| 15 Years | 2 (100.0%) | 3 (100.0%) |
| 16 and 17 Years | 4 (57.1%) | 0 (0.0%) |
| 18 to 24 Years | 13 (100.0%) | 14 (38.9%) |
| 25 to 34 Years | 85 (100.0%) | 39 (90.7%) |
| 35 to 44 Years | 48 (88.9%) | 51 (71.8%) |
| 45 to 54 Years | 67 (100.0%) | 87 (100.0%) |
| 55 to 64 Years | 60 (69.8%) | 48 (63.2%) |
| 65 to 74 Years | 52 (100.0%) | 67 (84.8%) |
| 75 Years and over | 76 (100.0%) | 85 (82.5%) |
| Total | 528 (88.9%) | 474 (76.9%) |
Income Below Poverty Among Married-Couple Families in Bruceton
The poverty statistics for married-couple families in Bruceton show that 10.0% or 27 of the total 269 families live below the poverty line. Families with no children have the highest poverty rate of 14.4%, comprising of 27 families. On the other hand, families with 1 or 2 children have the lowest poverty rate of 0.0%, which includes 0 families.
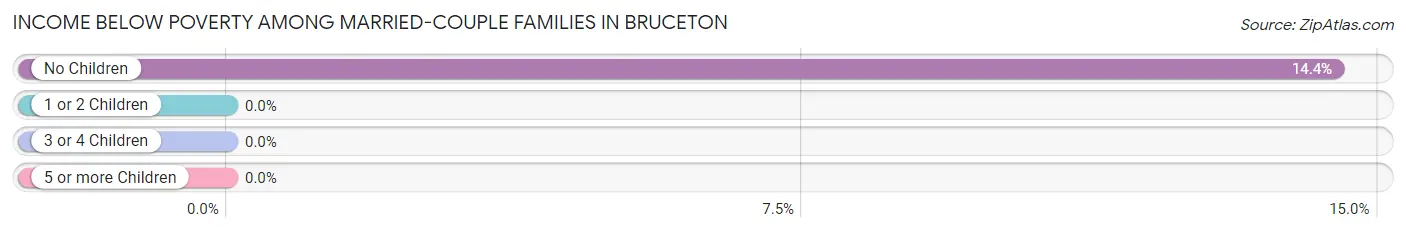
| Children | Above Poverty | Below Poverty |
| No Children | 160 (85.6%) | 27 (14.4%) |
| 1 or 2 Children | 63 (100.0%) | 0 (0.0%) |
| 3 or 4 Children | 19 (100.0%) | 0 (0.0%) |
| 5 or more Children | 0 (0.0%) | 0 (0.0%) |
| Total | 242 (90.0%) | 27 (10.0%) |
Income Below Poverty Among Single-Parent Households in Bruceton
According to the poverty data in Bruceton, 62.5% or 5 single-father households and 45.0% or 27 single-mother households are living below the poverty line. Among single-father households, those with 1 or 2 children have the highest poverty rate, with 5 households (100.0%) experiencing poverty. Likewise, among single-mother households, those with 5 or more children have the highest poverty rate, with 3 households (100.0%) falling below the poverty line.
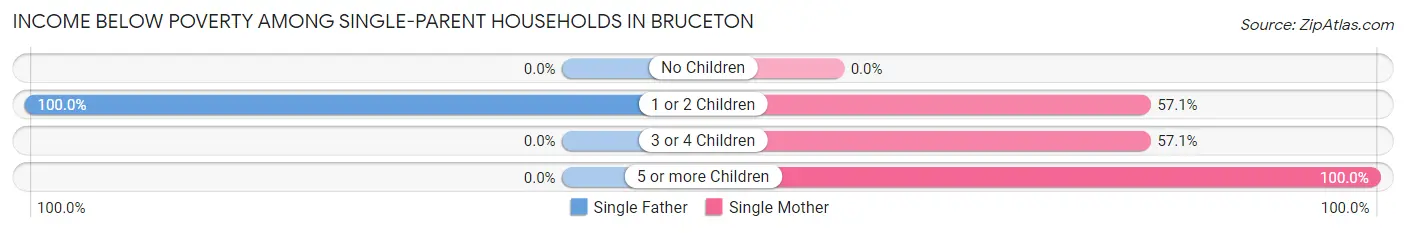
| Children | Single Father | Single Mother |
| No Children | 0 (0.0%) | 0 (0.0%) |
| 1 or 2 Children | 5 (100.0%) | 20 (57.1%) |
| 3 or 4 Children | 0 (0.0%) | 4 (57.1%) |
| 5 or more Children | 0 (0.0%) | 3 (100.0%) |
| Total | 5 (62.5%) | 27 (45.0%) |
Income Below Poverty Among Married-Couple vs Single-Parent Households in Bruceton
The poverty data for Bruceton shows that 27 of the married-couple family households (10.0%) and 32 of the single-parent households (47.1%) are living below the poverty level. Within the married-couple family households, those with no children have the highest poverty rate, with 27 households (14.4%) falling below the poverty line. Among the single-parent households, those with 5 or more children have the highest poverty rate, with 3 household (100.0%) living below poverty.
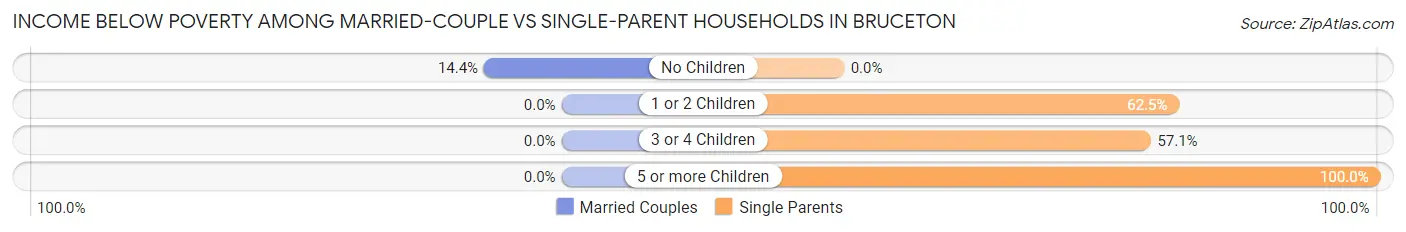
| Children | Married-Couple Families | Single-Parent Households |
| No Children | 27 (14.4%) | 0 (0.0%) |
| 1 or 2 Children | 0 (0.0%) | 25 (62.5%) |
| 3 or 4 Children | 0 (0.0%) | 4 (57.1%) |
| 5 or more Children | 0 (0.0%) | 3 (100.0%) |
| Total | 27 (10.0%) | 32 (47.1%) |
Race in Bruceton
The most populous races in Bruceton are White / Caucasian (1,227 | 93.6%), Two or more Races (45 | 3.4%), and Black / African American (39 | 3.0%).
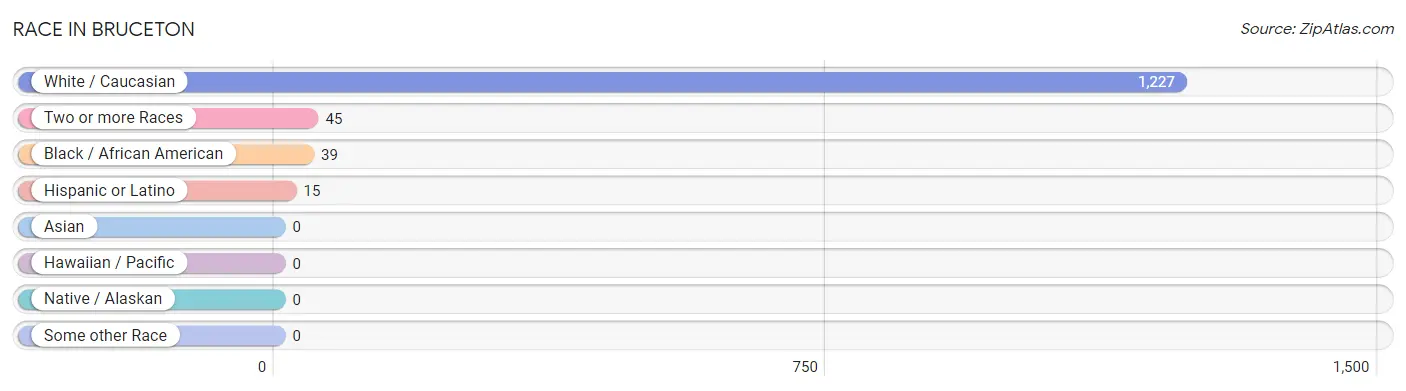
| Race | # Population | % Population |
| Asian | 0 | 0.0% |
| Black / African American | 39 | 3.0% |
| Hawaiian / Pacific | 0 | 0.0% |
| Hispanic or Latino | 15 | 1.1% |
| Native / Alaskan | 0 | 0.0% |
| White / Caucasian | 1,227 | 93.6% |
| Two or more Races | 45 | 3.4% |
| Some other Race | 0 | 0.0% |
| Total | 1,311 | 100.0% |
Ancestry in Bruceton
The most populous ancestries reported in Bruceton are American (497 | 37.9%), English (136 | 10.4%), Irish (114 | 8.7%), German (84 | 6.4%), and Italian (42 | 3.2%), together accounting for 66.6% of all Bruceton residents.
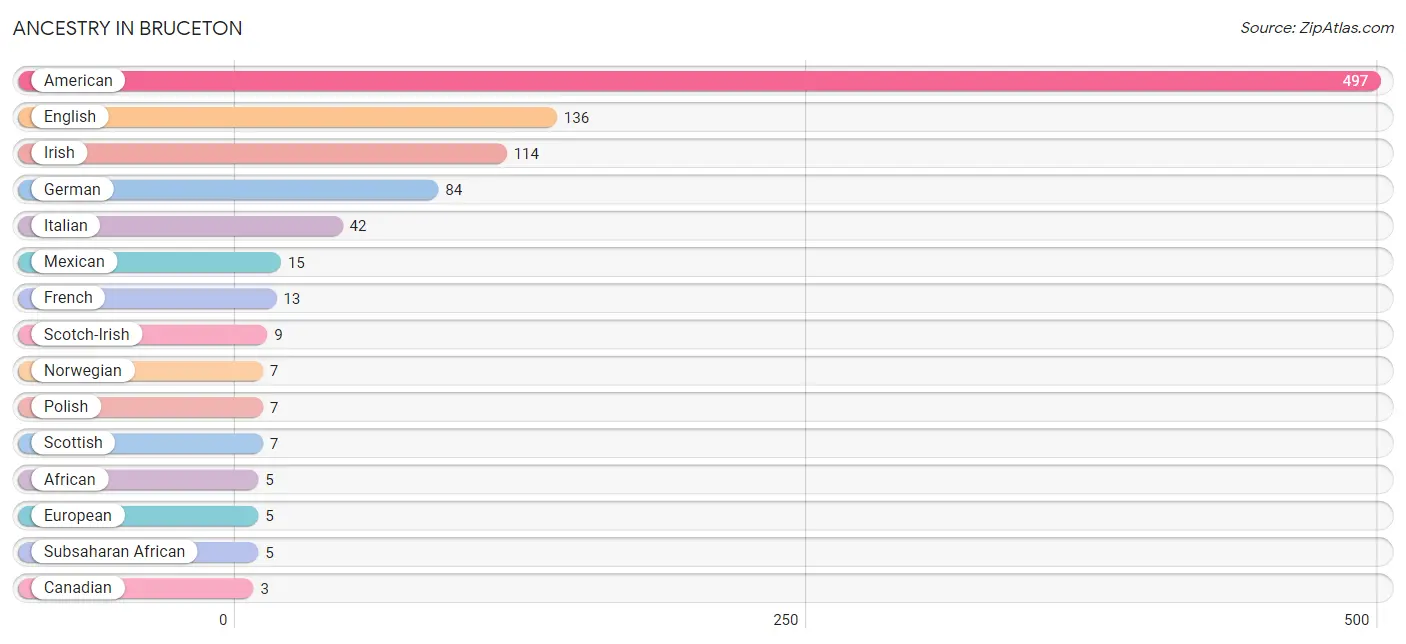
| Ancestry | # Population | % Population |
| African | 5 | 0.4% |
| American | 497 | 37.9% |
| Canadian | 3 | 0.2% |
| Danish | 3 | 0.2% |
| Dutch | 2 | 0.2% |
| English | 136 | 10.4% |
| European | 5 | 0.4% |
| Finnish | 3 | 0.2% |
| French | 13 | 1.0% |
| German | 84 | 6.4% |
| Irish | 114 | 8.7% |
| Italian | 42 | 3.2% |
| Mexican | 15 | 1.1% |
| Norwegian | 7 | 0.5% |
| Polish | 7 | 0.5% |
| Scotch-Irish | 9 | 0.7% |
| Scottish | 7 | 0.5% |
| Slovene | 3 | 0.2% |
| Subsaharan African | 5 | 0.4% |
| Swedish | 3 | 0.2% | View All 20 Rows |
Immigrants in Bruceton

| Immigration Origin | # Population | % Population | View All 0 Rows |
Sex and Age in Bruceton
Sex and Age in Bruceton
The most populous age groups in Bruceton are 5 to 9 Years (90 | 14.3%) for men and 75 to 79 Years (61 | 8.9%) for women.
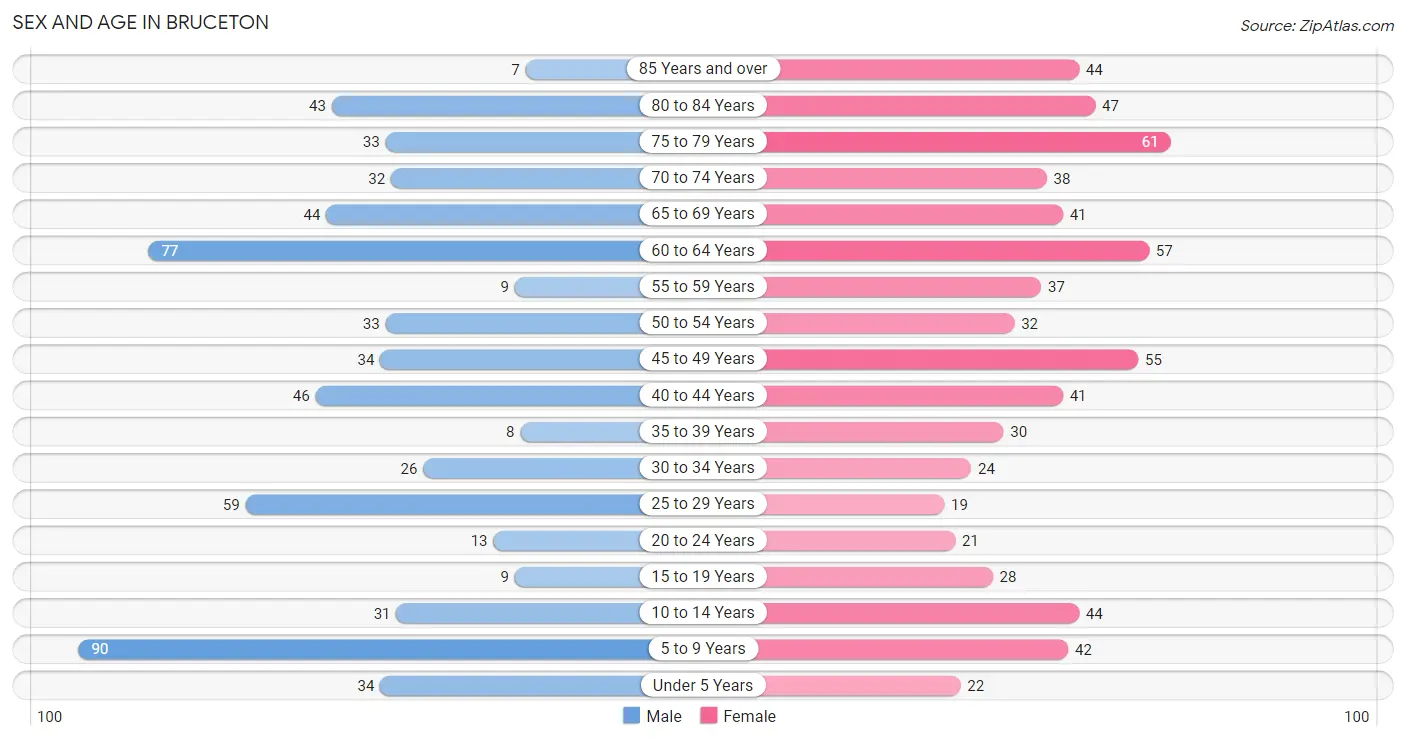
| Age Bracket | Male | Female |
| Under 5 Years | 34 (5.4%) | 22 (3.2%) |
| 5 to 9 Years | 90 (14.3%) | 42 (6.1%) |
| 10 to 14 Years | 31 (4.9%) | 44 (6.4%) |
| 15 to 19 Years | 9 (1.4%) | 28 (4.1%) |
| 20 to 24 Years | 13 (2.1%) | 21 (3.1%) |
| 25 to 29 Years | 59 (9.4%) | 19 (2.8%) |
| 30 to 34 Years | 26 (4.1%) | 24 (3.5%) |
| 35 to 39 Years | 8 (1.3%) | 30 (4.4%) |
| 40 to 44 Years | 46 (7.3%) | 41 (6.0%) |
| 45 to 49 Years | 34 (5.4%) | 55 (8.1%) |
| 50 to 54 Years | 33 (5.2%) | 32 (4.7%) |
| 55 to 59 Years | 9 (1.4%) | 37 (5.4%) |
| 60 to 64 Years | 77 (12.3%) | 57 (8.4%) |
| 65 to 69 Years | 44 (7.0%) | 41 (6.0%) |
| 70 to 74 Years | 32 (5.1%) | 38 (5.6%) |
| 75 to 79 Years | 33 (5.2%) | 61 (8.9%) |
| 80 to 84 Years | 43 (6.9%) | 47 (6.9%) |
| 85 Years and over | 7 (1.1%) | 44 (6.4%) |
| Total | 628 (100.0%) | 683 (100.0%) |
Families and Households in Bruceton
Median Family Size in Bruceton
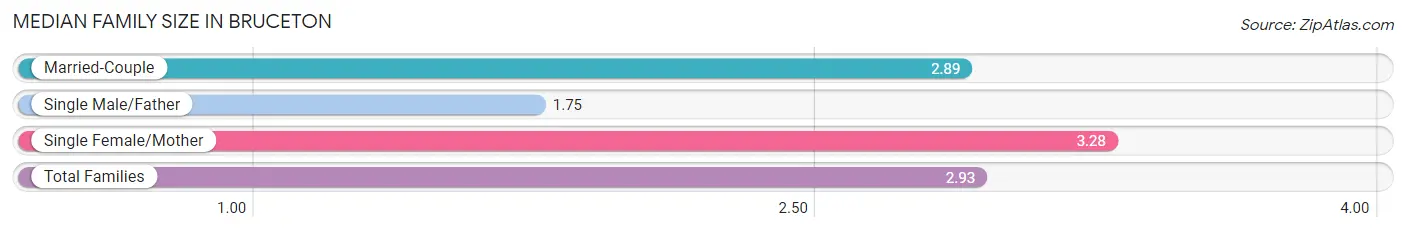
The median family size in Bruceton is 2.93 persons per family, with single female/mother families (60 | 17.8%) accounting for the largest median family size of 3.28 persons per family. On the other hand, single male/father families (8 | 2.4%) represent the smallest median family size with 1.75 persons per family.
| Family Type | # Families | Family Size |
| Married-Couple | 269 (79.8%) | 2.89 |
| Single Male/Father | 8 (2.4%) | 1.75 |
| Single Female/Mother | 60 (17.8%) | 3.28 |
| Total Families | 337 (100.0%) | 2.93 |
Median Household Size in Bruceton
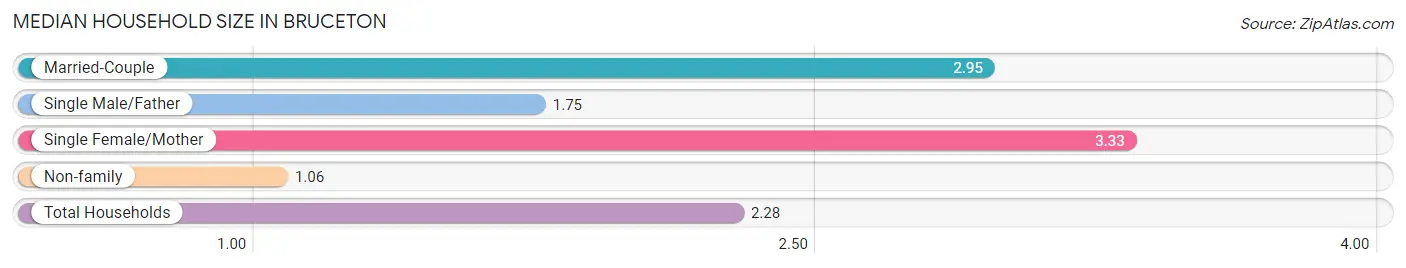
The median household size in Bruceton is 2.28 persons per household, with single female/mother households (60 | 11.3%) accounting for the largest median household size of 3.33 persons per household. non-family households (194 | 36.5%) represent the smallest median household size with 1.06 persons per household.
| Household Type | # Households | Household Size |
| Married-Couple | 269 (50.7%) | 2.95 |
| Single Male/Father | 8 (1.5%) | 1.75 |
| Single Female/Mother | 60 (11.3%) | 3.33 |
| Non-family | 194 (36.5%) | 1.06 |
| Total Households | 531 (100.0%) | 2.28 |
Household Size by Marriage Status in Bruceton
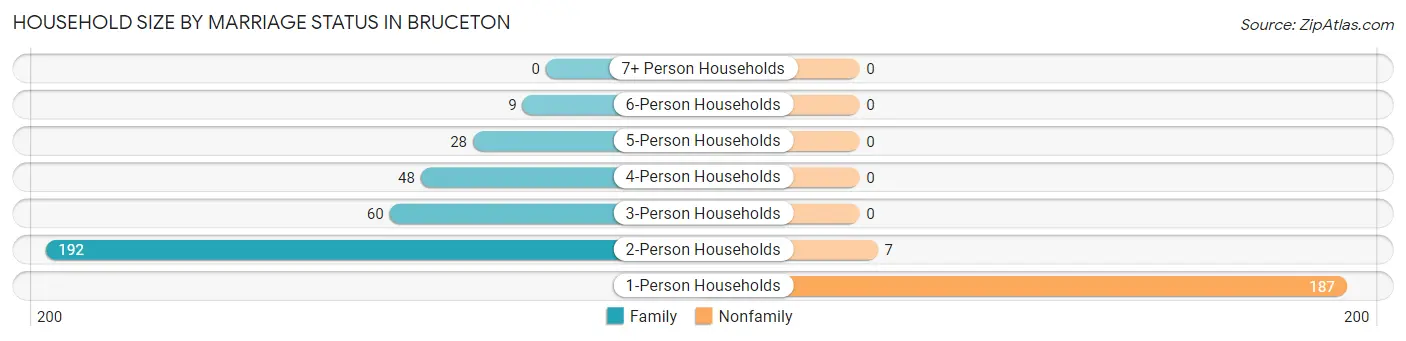
Out of a total of 531 households in Bruceton, 337 (63.5%) are family households, while 194 (36.5%) are nonfamily households. The most numerous type of family households are 2-person households, comprising 192, and the most common type of nonfamily households are 1-person households, comprising 187.
| Household Size | Family Households | Nonfamily Households |
| 1-Person Households | - | 187 (35.2%) |
| 2-Person Households | 192 (36.2%) | 7 (1.3%) |
| 3-Person Households | 60 (11.3%) | 0 (0.0%) |
| 4-Person Households | 48 (9.0%) | 0 (0.0%) |
| 5-Person Households | 28 (5.3%) | 0 (0.0%) |
| 6-Person Households | 9 (1.7%) | 0 (0.0%) |
| 7+ Person Households | 0 (0.0%) | 0 (0.0%) |
| Total | 337 (63.5%) | 194 (36.5%) |
Female Fertility in Bruceton
Fertility by Age in Bruceton
Average fertility rate in Bruceton is 113.0 births per 1,000 women. Women in the age bracket of 15 to 19 years have the highest fertility rate with 536.0 births per 1,000 women. Women in the age bracket of 15 to 19 years acount for 60.0% of all women with births.
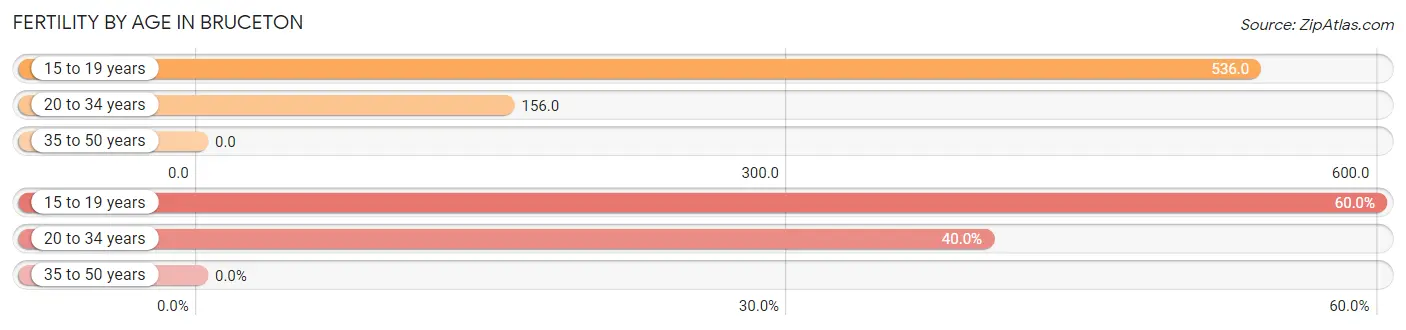
| Age Bracket | Women with Births | Births / 1,000 Women |
| 15 to 19 years | 15 (60.0%) | 536.0 |
| 20 to 34 years | 10 (40.0%) | 156.0 |
| 35 to 50 years | 0 (0.0%) | 0.0 |
| Total | 25 (100.0%) | 113.0 |
Fertility by Age by Marriage Status in Bruceton
12.0% of women with births (25) in Bruceton are married. The highest percentage of unmarried women with births falls into 15 to 19 years age bracket with 100.0% of them unmarried at the time of birth, while the lowest percentage of unmarried women with births belong to 20 to 34 years age bracket with 70.0% of them unmarried.
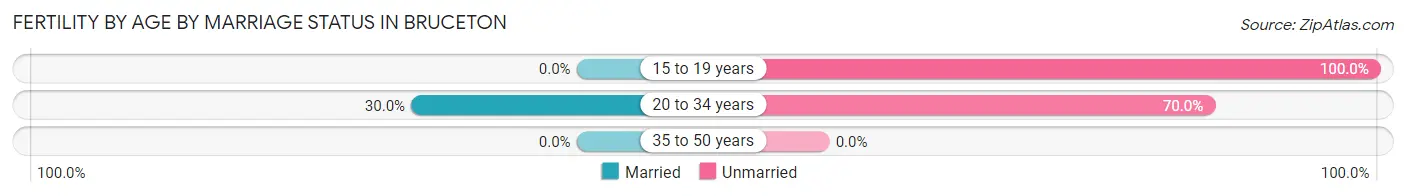
| Age Bracket | Married | Unmarried |
| 15 to 19 years | 0 (0.0%) | 15 (100.0%) |
| 20 to 34 years | 3 (30.0%) | 7 (70.0%) |
| 35 to 50 years | 0 (0.0%) | 0 (0.0%) |
| Total | 3 (12.0%) | 22 (88.0%) |
Fertility by Education in Bruceton
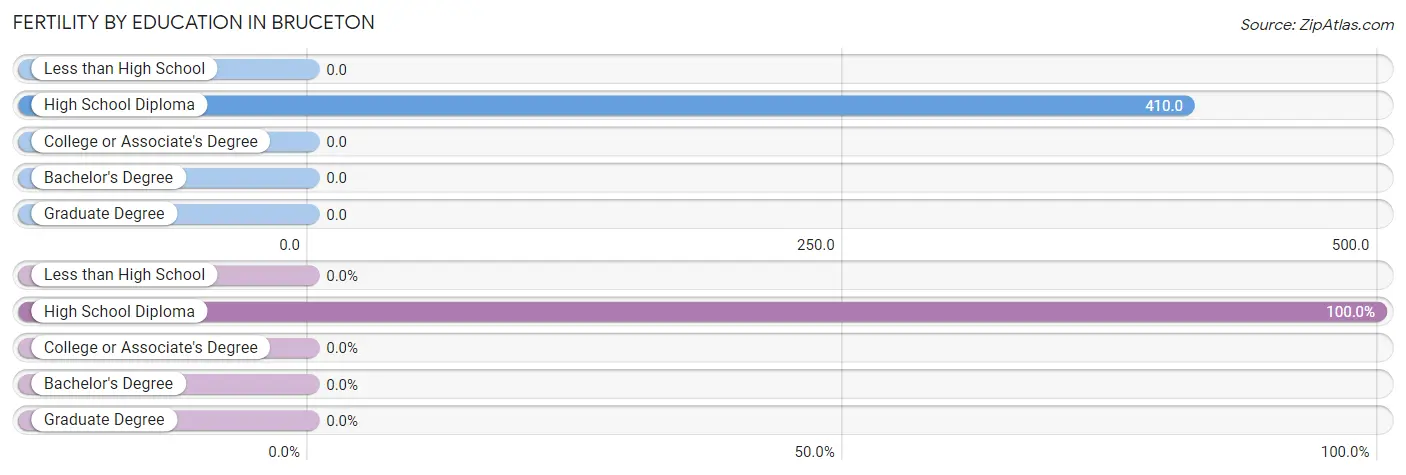
| Educational Attainment | Women with Births | Births / 1,000 Women |
| Less than High School | 0 (0.0%) | 0.0 |
| High School Diploma | 25 (100.0%) | 410.0 |
| College or Associate's Degree | 0 (0.0%) | 0.0 |
| Bachelor's Degree | 0 (0.0%) | 0.0 |
| Graduate Degree | 0 (0.0%) | 0.0 |
| Total | 25 (100.0%) | 113.0 |
Fertility by Education by Marriage Status in Bruceton
88.0% of women with births in Bruceton are unmarried. Women with the educational attainment of high school diploma are most likely to be married with 12.0% of them married at childbirth, while women with the educational attainment of high school diploma are least likely to be married with 88.0% of them unmarried at childbirth.
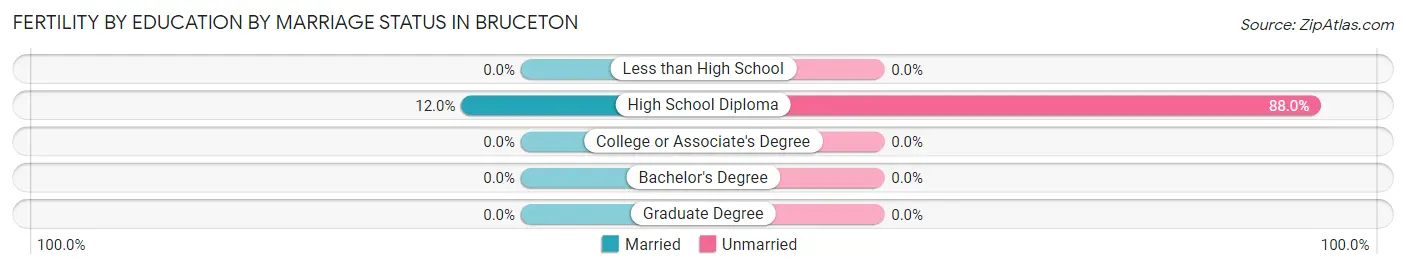
| Educational Attainment | Married | Unmarried |
| Less than High School | 0 (0.0%) | 0 (0.0%) |
| High School Diploma | 3 (12.0%) | 22 (88.0%) |
| College or Associate's Degree | 0 (0.0%) | 0 (0.0%) |
| Bachelor's Degree | 0 (0.0%) | 0 (0.0%) |
| Graduate Degree | 0 (0.0%) | 0 (0.0%) |
| Total | 3 (12.0%) | 22 (88.0%) |
Employment Characteristics in Bruceton
Employment by Class of Employer in Bruceton
Among the 439 employed individuals in Bruceton, private company employees (317 | 72.2%), local government employees (28 | 6.4%), and state government employees (28 | 6.4%) make up the most common classes of employment.
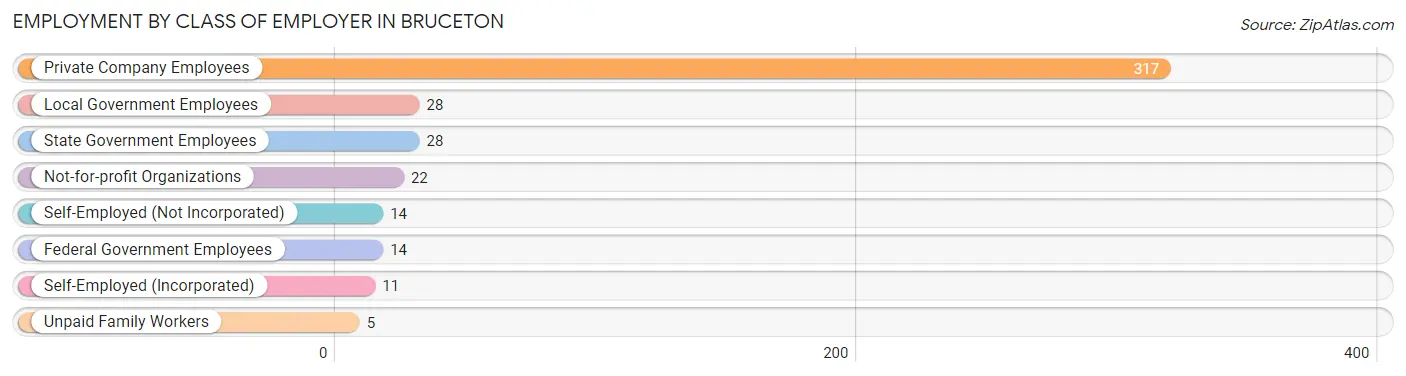
| Employer Class | # Employees | % Employees |
| Private Company Employees | 317 | 72.2% |
| Self-Employed (Incorporated) | 11 | 2.5% |
| Self-Employed (Not Incorporated) | 14 | 3.2% |
| Not-for-profit Organizations | 22 | 5.0% |
| Local Government Employees | 28 | 6.4% |
| State Government Employees | 28 | 6.4% |
| Federal Government Employees | 14 | 3.2% |
| Unpaid Family Workers | 5 | 1.1% |
| Total | 439 | 100.0% |
Employment Status by Age in Bruceton
According to the labor force statistics for Bruceton, out of the total population over 16 years of age (1,043), 43.3% or 452 individuals are in the labor force, with 2.9% or 13 of them unemployed. The age group with the highest labor force participation rate is 45 to 54 years, with 89.0% or 137 individuals in the labor force. Within the labor force, the 30 to 34 years age range has the highest percentage of unemployed individuals, with 17.5% or 7 of them being unemployed.
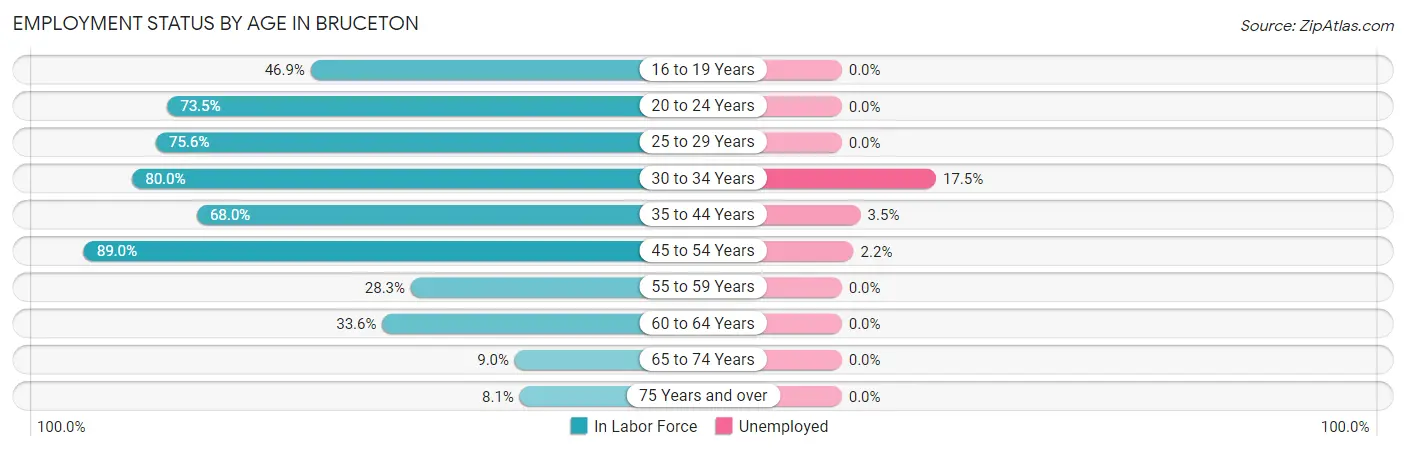
| Age Bracket | In Labor Force | Unemployed |
| 16 to 19 Years | 15 (46.9%) | 0 (0.0%) |
| 20 to 24 Years | 25 (73.5%) | 0 (0.0%) |
| 25 to 29 Years | 59 (75.6%) | 0 (0.0%) |
| 30 to 34 Years | 40 (80.0%) | 7 (17.5%) |
| 35 to 44 Years | 85 (68.0%) | 3 (3.5%) |
| 45 to 54 Years | 137 (89.0%) | 3 (2.2%) |
| 55 to 59 Years | 13 (28.3%) | 0 (0.0%) |
| 60 to 64 Years | 45 (33.6%) | 0 (0.0%) |
| 65 to 74 Years | 14 (9.0%) | 0 (0.0%) |
| 75 Years and over | 19 (8.1%) | 0 (0.0%) |
| Total | 452 (43.3%) | 13 (2.9%) |
Employment Status by Educational Attainment in Bruceton
According to labor force statistics for Bruceton, 64.6% of individuals (379) out of the total population between 25 and 64 years of age (587) are in the labor force, with 3.4% or 13 of them being unemployed. The group with the highest labor force participation rate are those with the educational attainment of bachelor's degree or higher, with 90.4% or 103 individuals in the labor force. Within the labor force, individuals with college / associate degree education have the highest percentage of unemployment, with 7.8% or 10 of them being unemployed.
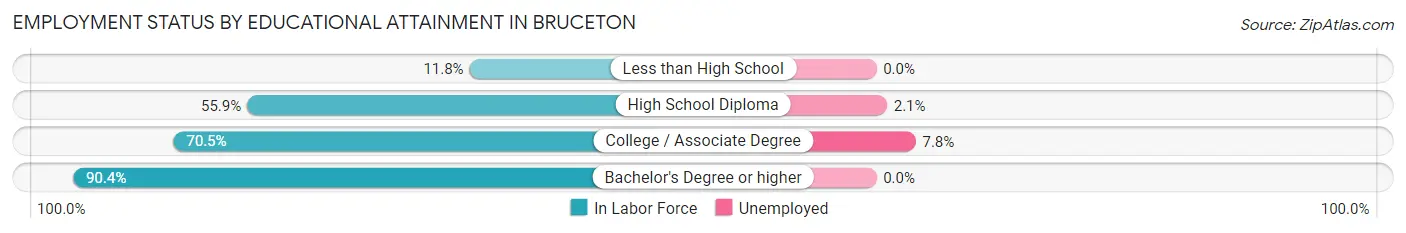
| Educational Attainment | In Labor Force | Unemployed |
| Less than High School | 4 (11.8%) | 0 (0.0%) |
| High School Diploma | 143 (55.9%) | 5 (2.1%) |
| College / Associate Degree | 129 (70.5%) | 14 (7.8%) |
| Bachelor's Degree or higher | 103 (90.4%) | 0 (0.0%) |
| Total | 379 (64.6%) | 20 (3.4%) |
Employment Occupations by Sex in Bruceton
Management, Business, Science and Arts Occupations
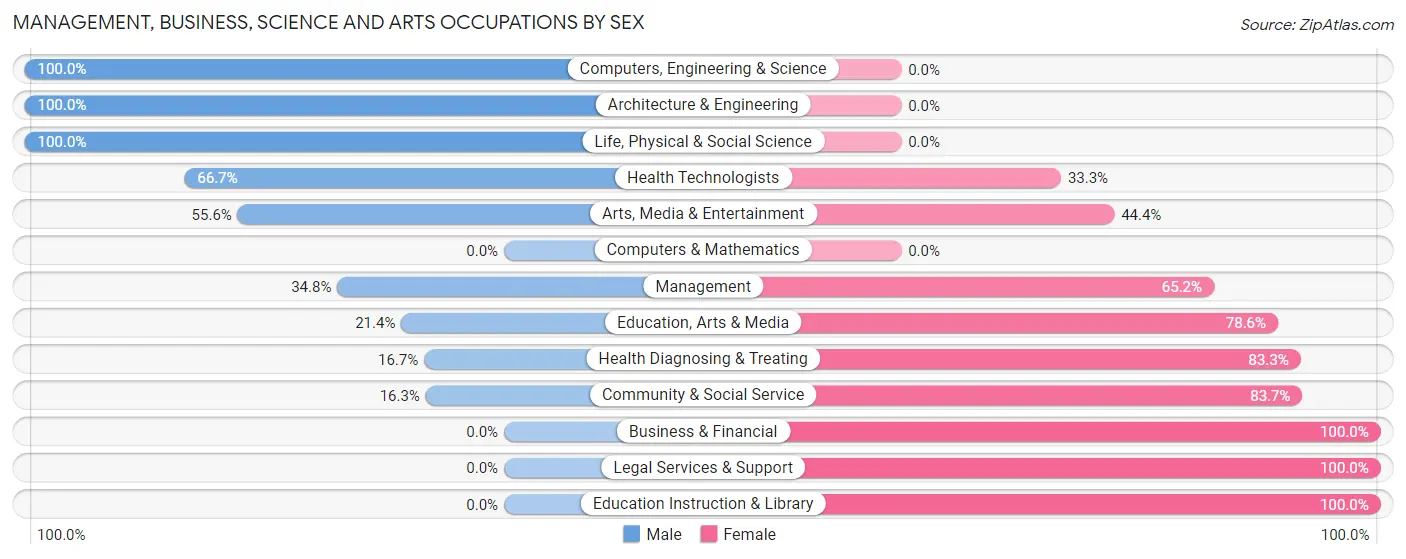
The most common Management, Business, Science and Arts occupations in Bruceton are Community & Social Service (49 | 11.2%), Health Diagnosing & Treating (24 | 5.5%), Management (23 | 5.2%), Education Instruction & Library (21 | 4.8%), and Education, Arts & Media (14 | 3.2%).
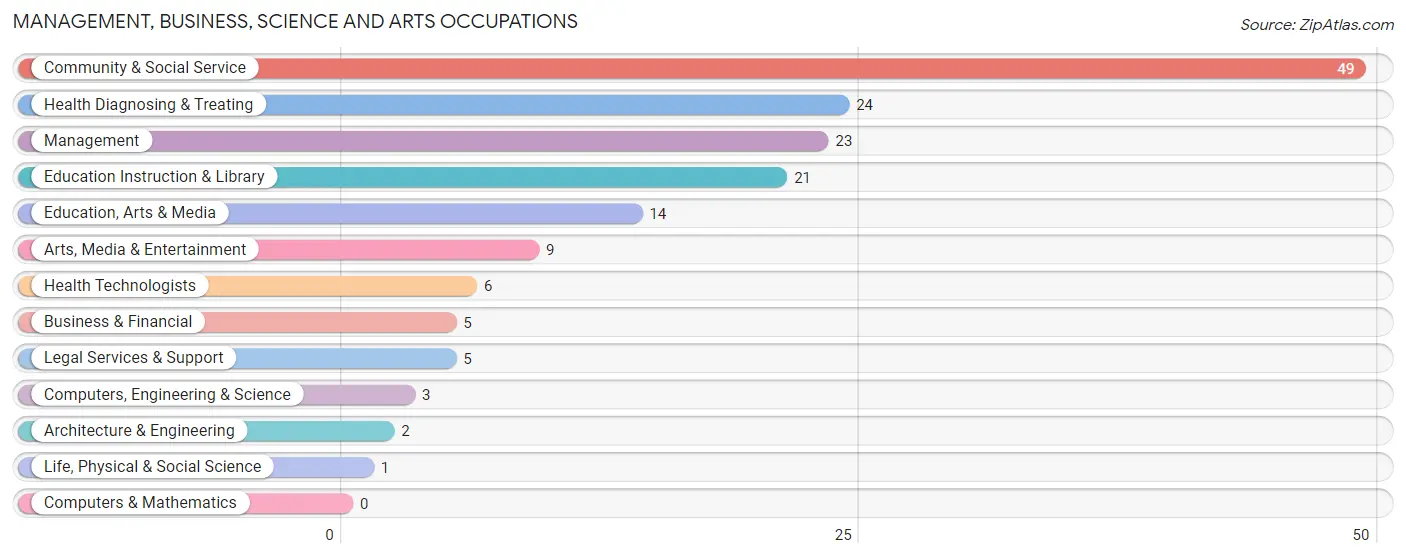
Management, Business, Science and Arts Occupations by Sex
Within the Management, Business, Science and Arts occupations in Bruceton, the most male-oriented occupations are Computers, Engineering & Science (100.0%), Architecture & Engineering (100.0%), and Life, Physical & Social Science (100.0%), while the most female-oriented occupations are Business & Financial (100.0%), Legal Services & Support (100.0%), and Education Instruction & Library (100.0%).
| Occupation | Male | Female |
| Management | 8 (34.8%) | 15 (65.2%) |
| Business & Financial | 0 (0.0%) | 5 (100.0%) |
| Computers, Engineering & Science | 3 (100.0%) | 0 (0.0%) |
| Computers & Mathematics | 0 (0.0%) | 0 (0.0%) |
| Architecture & Engineering | 2 (100.0%) | 0 (0.0%) |
| Life, Physical & Social Science | 1 (100.0%) | 0 (0.0%) |
| Community & Social Service | 8 (16.3%) | 41 (83.7%) |
| Education, Arts & Media | 3 (21.4%) | 11 (78.6%) |
| Legal Services & Support | 0 (0.0%) | 5 (100.0%) |
| Education Instruction & Library | 0 (0.0%) | 21 (100.0%) |
| Arts, Media & Entertainment | 5 (55.6%) | 4 (44.4%) |
| Health Diagnosing & Treating | 4 (16.7%) | 20 (83.3%) |
| Health Technologists | 4 (66.7%) | 2 (33.3%) |
| Total (Category) | 23 (22.1%) | 81 (77.9%) |
| Total (Overall) | 219 (49.9%) | 220 (50.1%) |
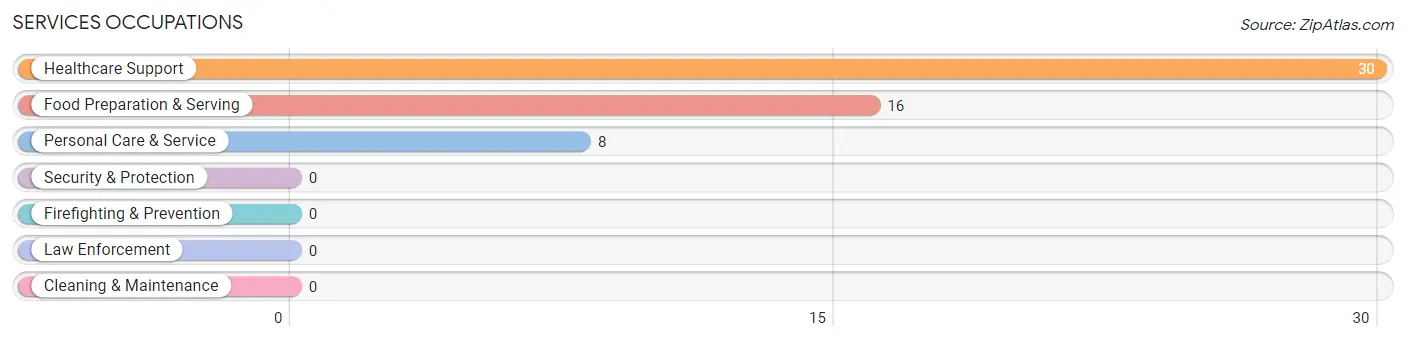
Services Occupations
The most common Services occupations in Bruceton are Healthcare Support (30 | 6.8%), Food Preparation & Serving (16 | 3.6%), and Personal Care & Service (8 | 1.8%).
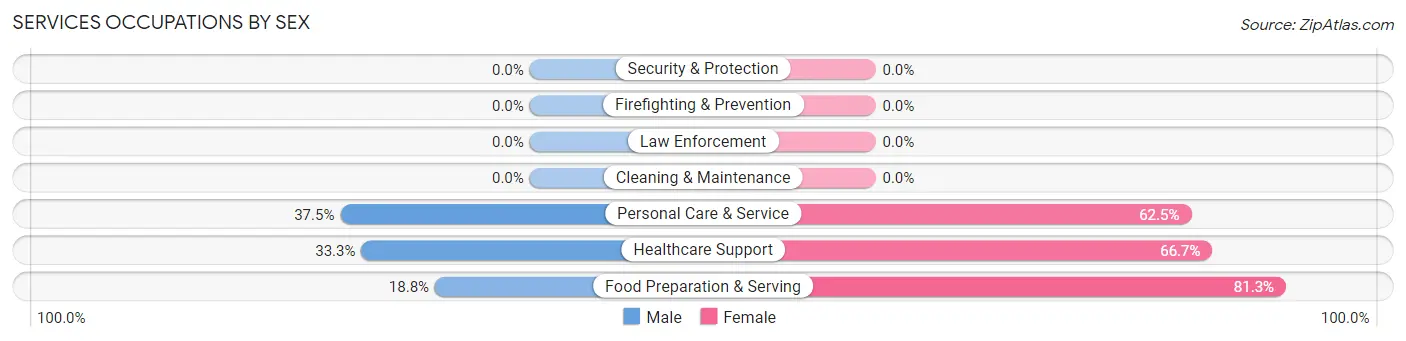
Services Occupations by Sex
Within the Services occupations in Bruceton, the most male-oriented occupations are Personal Care & Service (37.5%), Healthcare Support (33.3%), and Food Preparation & Serving (18.8%), while the most female-oriented occupations are Food Preparation & Serving (81.2%), Healthcare Support (66.7%), and Personal Care & Service (62.5%).
| Occupation | Male | Female |
| Healthcare Support | 10 (33.3%) | 20 (66.7%) |
| Security & Protection | 0 (0.0%) | 0 (0.0%) |
| Firefighting & Prevention | 0 (0.0%) | 0 (0.0%) |
| Law Enforcement | 0 (0.0%) | 0 (0.0%) |
| Food Preparation & Serving | 3 (18.8%) | 13 (81.2%) |
| Cleaning & Maintenance | 0 (0.0%) | 0 (0.0%) |
| Personal Care & Service | 3 (37.5%) | 5 (62.5%) |
| Total (Category) | 16 (29.6%) | 38 (70.4%) |
| Total (Overall) | 219 (49.9%) | 220 (50.1%) |
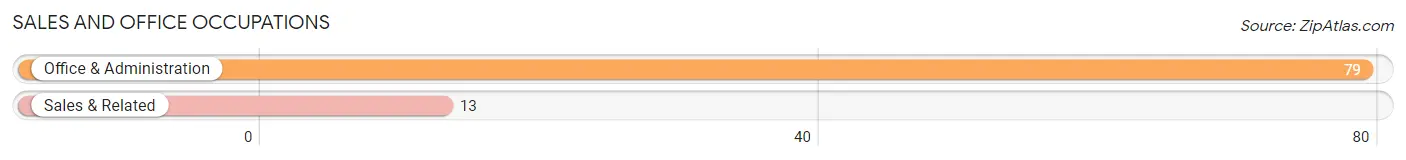
Sales and Office Occupations
The most common Sales and Office occupations in Bruceton are Office & Administration (79 | 18.0%), and Sales & Related (13 | 3.0%).
Sales and Office Occupations by Sex
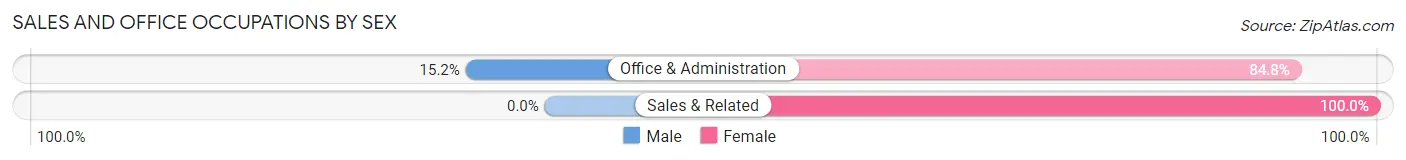
| Occupation | Male | Female |
| Sales & Related | 0 (0.0%) | 13 (100.0%) |
| Office & Administration | 12 (15.2%) | 67 (84.8%) |
| Total (Category) | 12 (13.0%) | 80 (87.0%) |
| Total (Overall) | 219 (49.9%) | 220 (50.1%) |
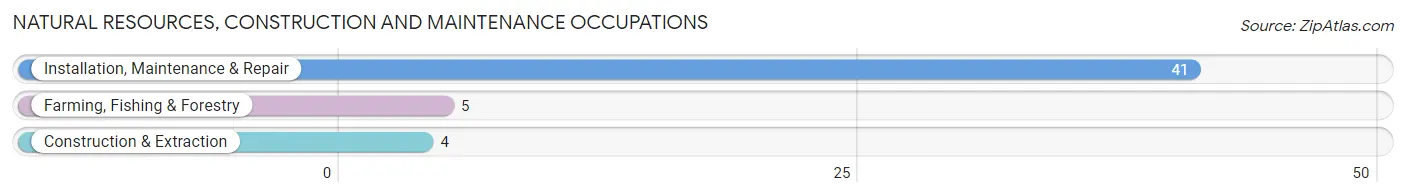
Natural Resources, Construction and Maintenance Occupations
The most common Natural Resources, Construction and Maintenance occupations in Bruceton are Installation, Maintenance & Repair (41 | 9.3%), Farming, Fishing & Forestry (5 | 1.1%), and Construction & Extraction (4 | 0.9%).
Natural Resources, Construction and Maintenance Occupations by Sex
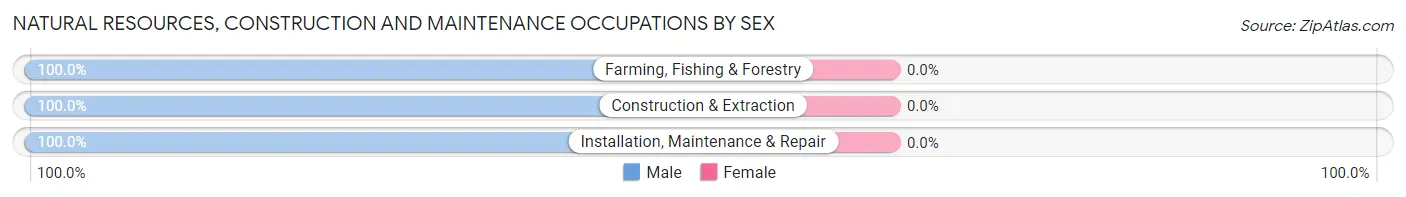
| Occupation | Male | Female |
| Farming, Fishing & Forestry | 5 (100.0%) | 0 (0.0%) |
| Construction & Extraction | 4 (100.0%) | 0 (0.0%) |
| Installation, Maintenance & Repair | 41 (100.0%) | 0 (0.0%) |
| Total (Category) | 50 (100.0%) | 0 (0.0%) |
| Total (Overall) | 219 (49.9%) | 220 (50.1%) |
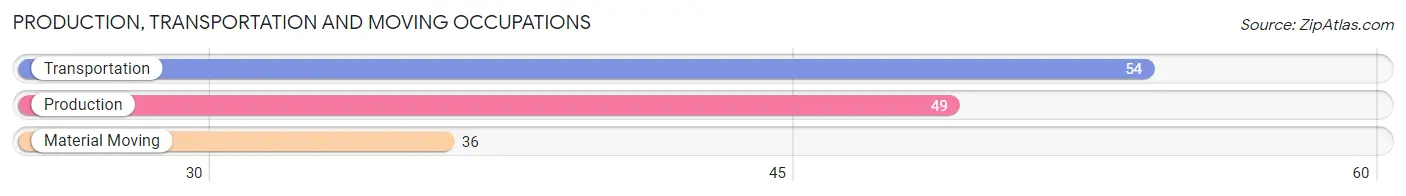
Production, Transportation and Moving Occupations
The most common Production, Transportation and Moving occupations in Bruceton are Transportation (54 | 12.3%), Production (49 | 11.2%), and Material Moving (36 | 8.2%).
Production, Transportation and Moving Occupations by Sex
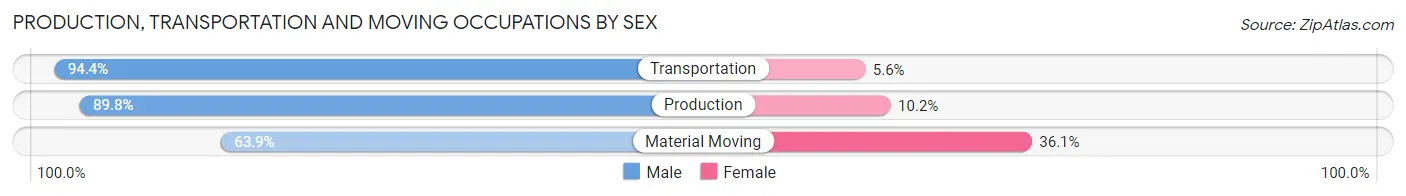
| Occupation | Male | Female |
| Production | 44 (89.8%) | 5 (10.2%) |
| Transportation | 51 (94.4%) | 3 (5.6%) |
| Material Moving | 23 (63.9%) | 13 (36.1%) |
| Total (Category) | 118 (84.9%) | 21 (15.1%) |
| Total (Overall) | 219 (49.9%) | 220 (50.1%) |
Employment Industries by Sex in Bruceton
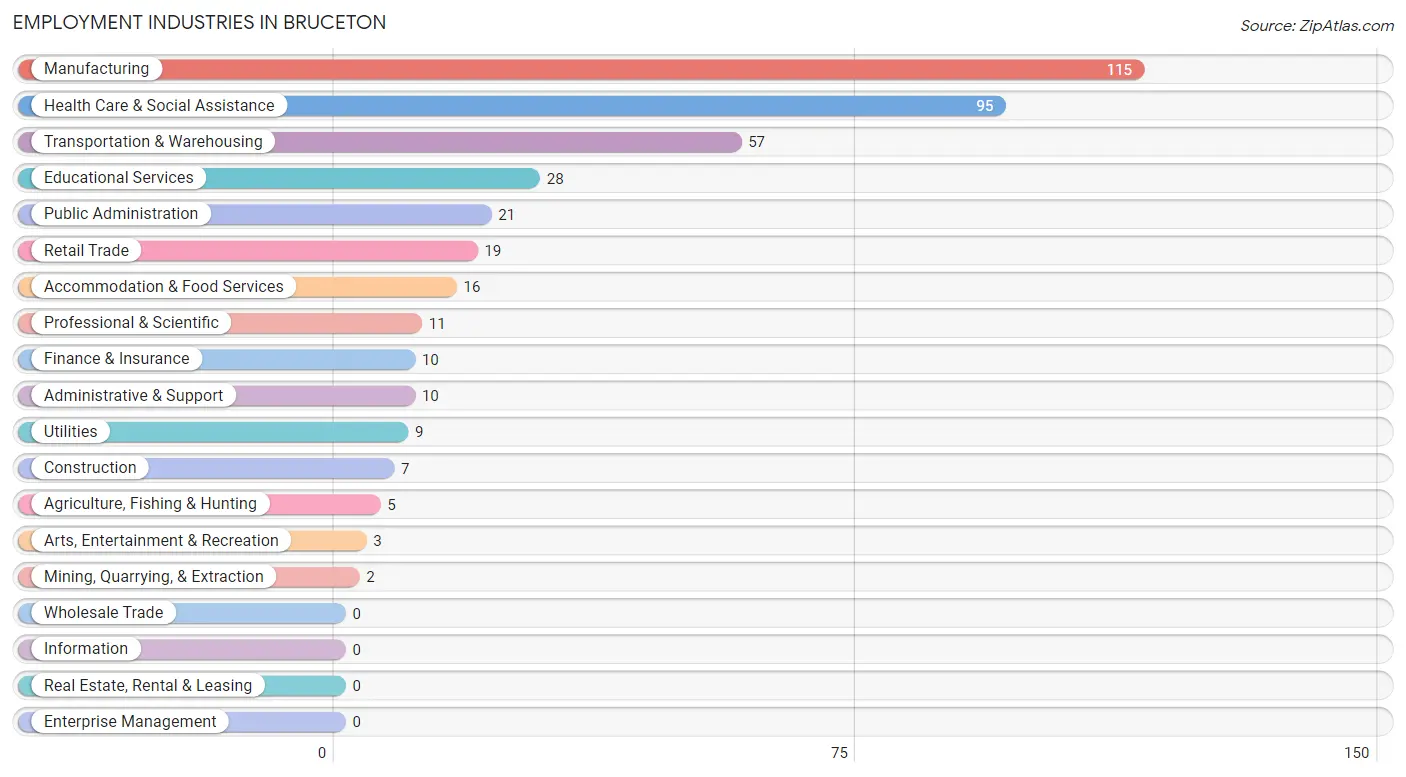
Employment Industries in Bruceton
The major employment industries in Bruceton include Manufacturing (115 | 26.2%), Health Care & Social Assistance (95 | 21.6%), Transportation & Warehousing (57 | 13.0%), Educational Services (28 | 6.4%), and Public Administration (21 | 4.8%).
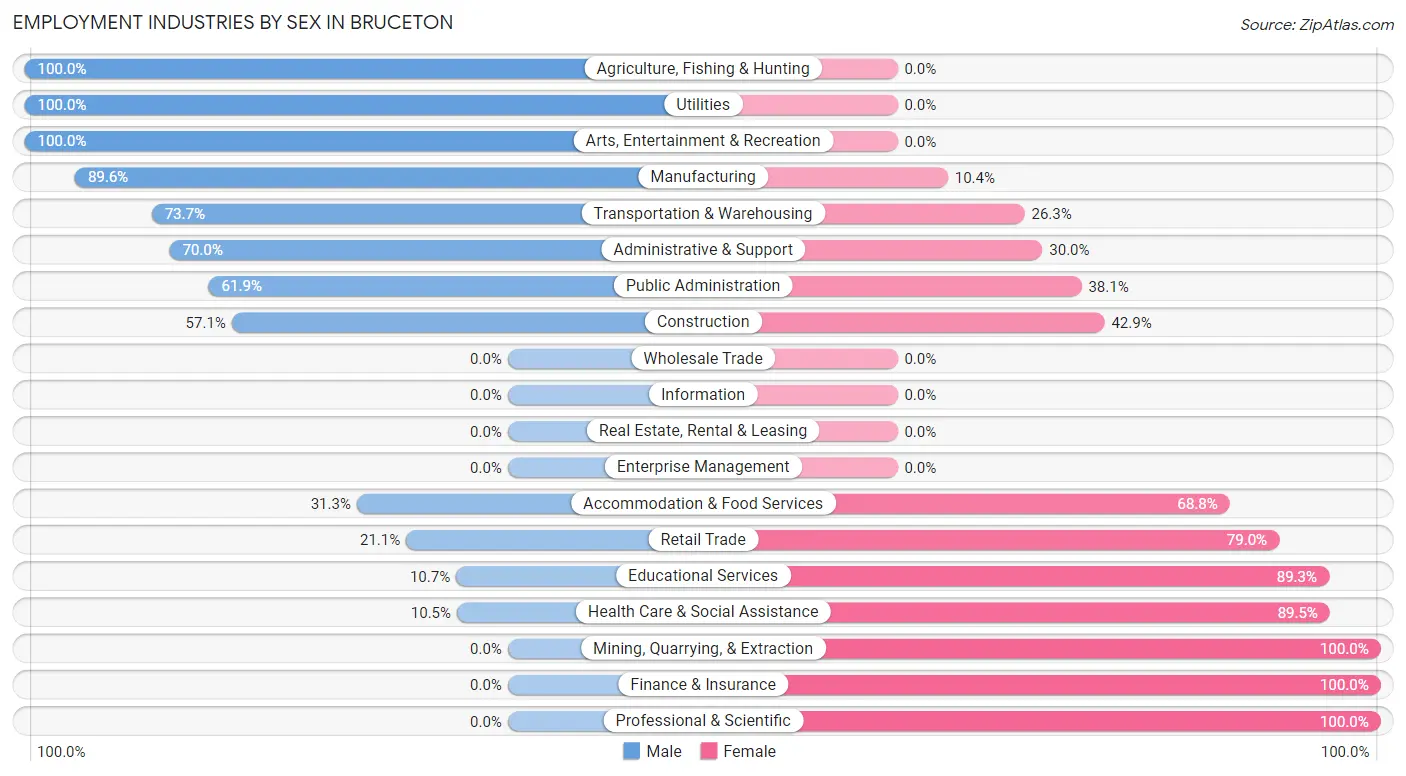
Employment Industries by Sex in Bruceton
The Bruceton industries that see more men than women are Agriculture, Fishing & Hunting (100.0%), Utilities (100.0%), and Arts, Entertainment & Recreation (100.0%), whereas the industries that tend to have a higher number of women are Mining, Quarrying, & Extraction (100.0%), Finance & Insurance (100.0%), and Professional & Scientific (100.0%).
| Industry | Male | Female |
| Agriculture, Fishing & Hunting | 5 (100.0%) | 0 (0.0%) |
| Mining, Quarrying, & Extraction | 0 (0.0%) | 2 (100.0%) |
| Construction | 4 (57.1%) | 3 (42.9%) |
| Manufacturing | 103 (89.6%) | 12 (10.4%) |
| Wholesale Trade | 0 (0.0%) | 0 (0.0%) |
| Retail Trade | 4 (21.0%) | 15 (78.9%) |
| Transportation & Warehousing | 42 (73.7%) | 15 (26.3%) |
| Utilities | 9 (100.0%) | 0 (0.0%) |
| Information | 0 (0.0%) | 0 (0.0%) |
| Finance & Insurance | 0 (0.0%) | 10 (100.0%) |
| Real Estate, Rental & Leasing | 0 (0.0%) | 0 (0.0%) |
| Professional & Scientific | 0 (0.0%) | 11 (100.0%) |
| Enterprise Management | 0 (0.0%) | 0 (0.0%) |
| Administrative & Support | 7 (70.0%) | 3 (30.0%) |
| Educational Services | 3 (10.7%) | 25 (89.3%) |
| Health Care & Social Assistance | 10 (10.5%) | 85 (89.5%) |
| Arts, Entertainment & Recreation | 3 (100.0%) | 0 (0.0%) |
| Accommodation & Food Services | 5 (31.2%) | 11 (68.8%) |
| Public Administration | 13 (61.9%) | 8 (38.1%) |
| Total | 219 (49.9%) | 220 (50.1%) |
Education in Bruceton
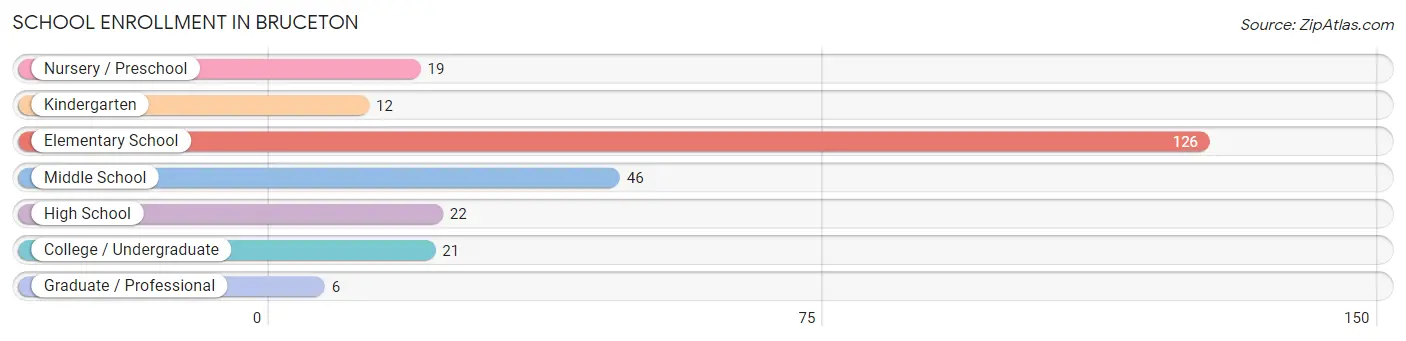
School Enrollment in Bruceton
The most common levels of schooling among the 252 students in Bruceton are elementary school (126 | 50.0%), middle school (46 | 18.2%), and high school (22 | 8.7%).
| School Level | # Students | % Students |
| Nursery / Preschool | 19 | 7.5% |
| Kindergarten | 12 | 4.8% |
| Elementary School | 126 | 50.0% |
| Middle School | 46 | 18.2% |
| High School | 22 | 8.7% |
| College / Undergraduate | 21 | 8.3% |
| Graduate / Professional | 6 | 2.4% |
| Total | 252 | 100.0% |
School Enrollment by Age by Funding Source in Bruceton
Out of a total of 252 students who are enrolled in schools in Bruceton, 16 (6.3%) attend a private institution, while the remaining 236 (93.7%) are enrolled in public schools. The age group of 15 to 17 year olds has the highest likelihood of being enrolled in private schools, with 3 (13.6% in the age bracket) enrolled. Conversely, the age group of 3 to 4 year olds has the lowest likelihood of being enrolled in a private school, with 4 (100.0% in the age bracket) attending a public institution.
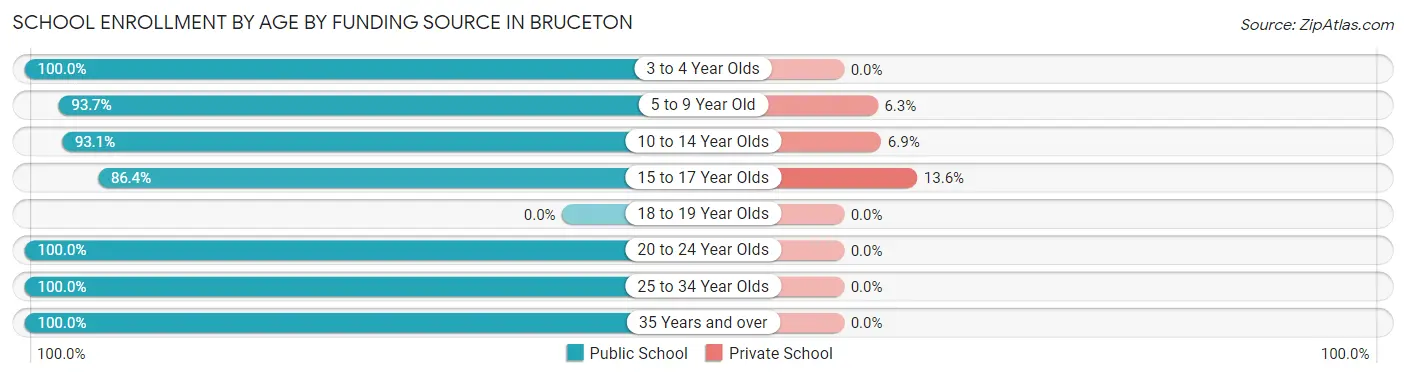
| Age Bracket | Public School | Private School |
| 3 to 4 Year Olds | 4 (100.0%) | 0 (0.0%) |
| 5 to 9 Year Old | 119 (93.7%) | 8 (6.3%) |
| 10 to 14 Year Olds | 67 (93.1%) | 5 (6.9%) |
| 15 to 17 Year Olds | 19 (86.4%) | 3 (13.6%) |
| 18 to 19 Year Olds | 0 (0.0%) | 0 (0.0%) |
| 20 to 24 Year Olds | 14 (100.0%) | 0 (0.0%) |
| 25 to 34 Year Olds | 7 (100.0%) | 0 (0.0%) |
| 35 Years and over | 6 (100.0%) | 0 (0.0%) |
| Total | 236 (93.7%) | 16 (6.3%) |
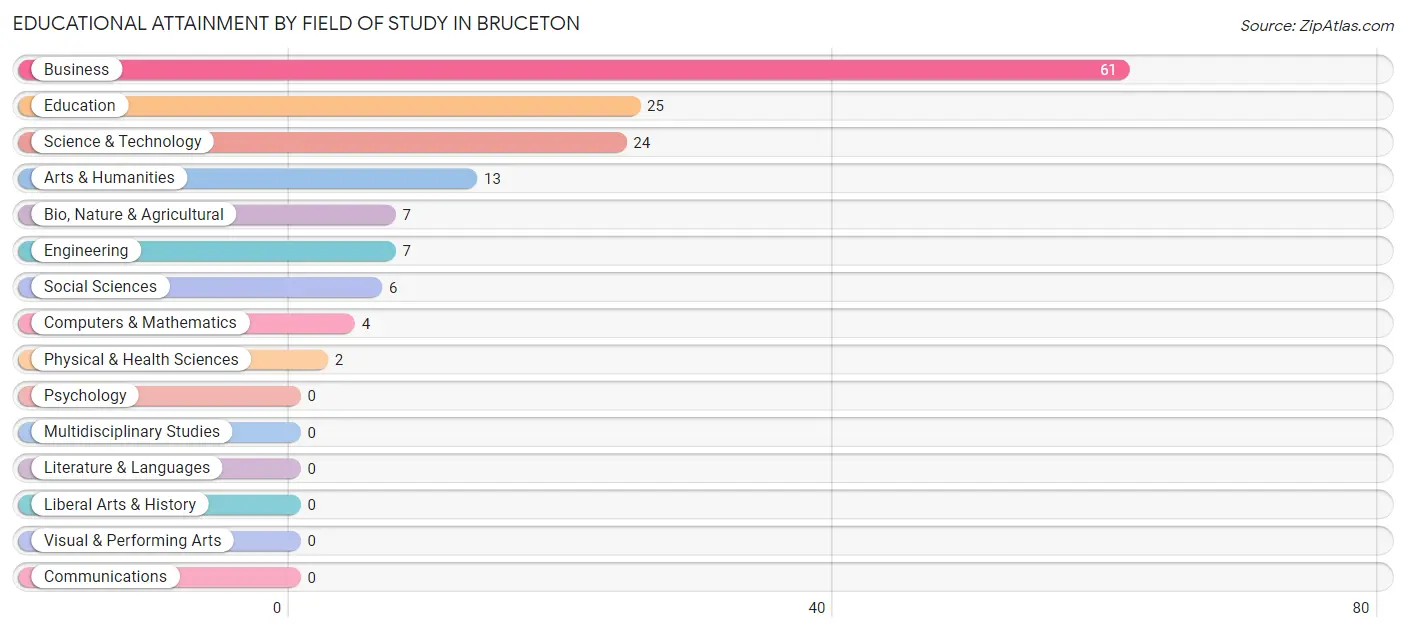
Educational Attainment by Field of Study in Bruceton
Business (61 | 40.9%), education (25 | 16.8%), science & technology (24 | 16.1%), arts & humanities (13 | 8.7%), and bio, nature & agricultural (7 | 4.7%) are the most common fields of study among 149 individuals in Bruceton who have obtained a bachelor's degree or higher.
| Field of Study | # Graduates | % Graduates |
| Computers & Mathematics | 4 | 2.7% |
| Bio, Nature & Agricultural | 7 | 4.7% |
| Physical & Health Sciences | 2 | 1.3% |
| Psychology | 0 | 0.0% |
| Social Sciences | 6 | 4.0% |
| Engineering | 7 | 4.7% |
| Multidisciplinary Studies | 0 | 0.0% |
| Science & Technology | 24 | 16.1% |
| Business | 61 | 40.9% |
| Education | 25 | 16.8% |
| Literature & Languages | 0 | 0.0% |
| Liberal Arts & History | 0 | 0.0% |
| Visual & Performing Arts | 0 | 0.0% |
| Communications | 0 | 0.0% |
| Arts & Humanities | 13 | 8.7% |
| Total | 149 | 100.0% |
Transportation & Commute in Bruceton
Vehicle Availability by Sex in Bruceton
The most prevalent vehicle ownership categories in Bruceton are males with 2 vehicles (82, accounting for 37.4%) and females with 2 vehicles (73, making up 37.3%).
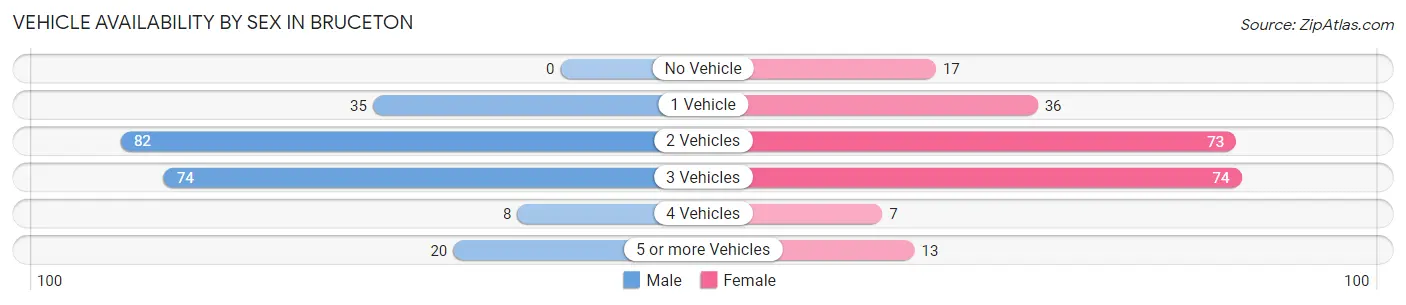
| Vehicles Available | Male | Female |
| No Vehicle | 0 (0.0%) | 17 (7.7%) |
| 1 Vehicle | 35 (16.0%) | 36 (16.4%) |
| 2 Vehicles | 82 (37.4%) | 73 (33.2%) |
| 3 Vehicles | 74 (33.8%) | 74 (33.6%) |
| 4 Vehicles | 8 (3.6%) | 7 (3.2%) |
| 5 or more Vehicles | 20 (9.1%) | 13 (5.9%) |
| Total | 219 (100.0%) | 220 (100.0%) |
Commute Time in Bruceton
The most frequently occuring commute durations in Bruceton are 15 to 19 minutes (72 commuters, 17.2%), 30 to 34 minutes (61 commuters, 14.6%), and 5 to 9 minutes (54 commuters, 12.9%).
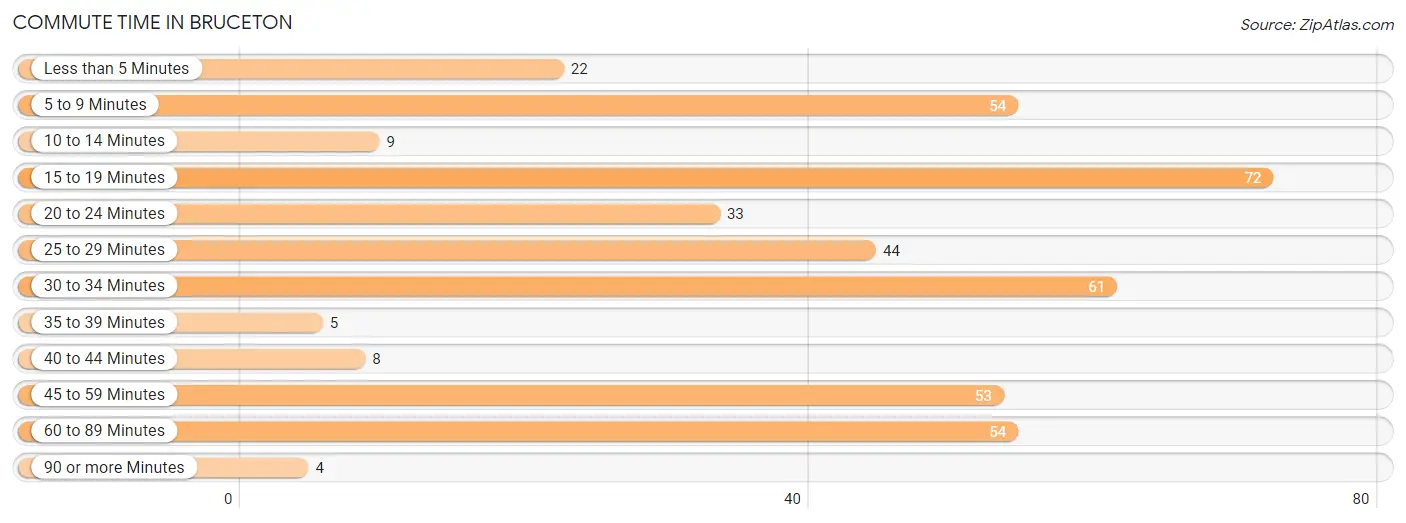
| Commute Time | # Commuters | % Commuters |
| Less than 5 Minutes | 22 | 5.2% |
| 5 to 9 Minutes | 54 | 12.9% |
| 10 to 14 Minutes | 9 | 2.1% |
| 15 to 19 Minutes | 72 | 17.2% |
| 20 to 24 Minutes | 33 | 7.9% |
| 25 to 29 Minutes | 44 | 10.5% |
| 30 to 34 Minutes | 61 | 14.6% |
| 35 to 39 Minutes | 5 | 1.2% |
| 40 to 44 Minutes | 8 | 1.9% |
| 45 to 59 Minutes | 53 | 12.7% |
| 60 to 89 Minutes | 54 | 12.9% |
| 90 or more Minutes | 4 | 0.9% |
Commute Time by Sex in Bruceton
The most common commute times in Bruceton are 60 to 89 minutes (45 commuters, 21.1%) for males and 30 to 34 minutes (45 commuters, 21.8%) for females.
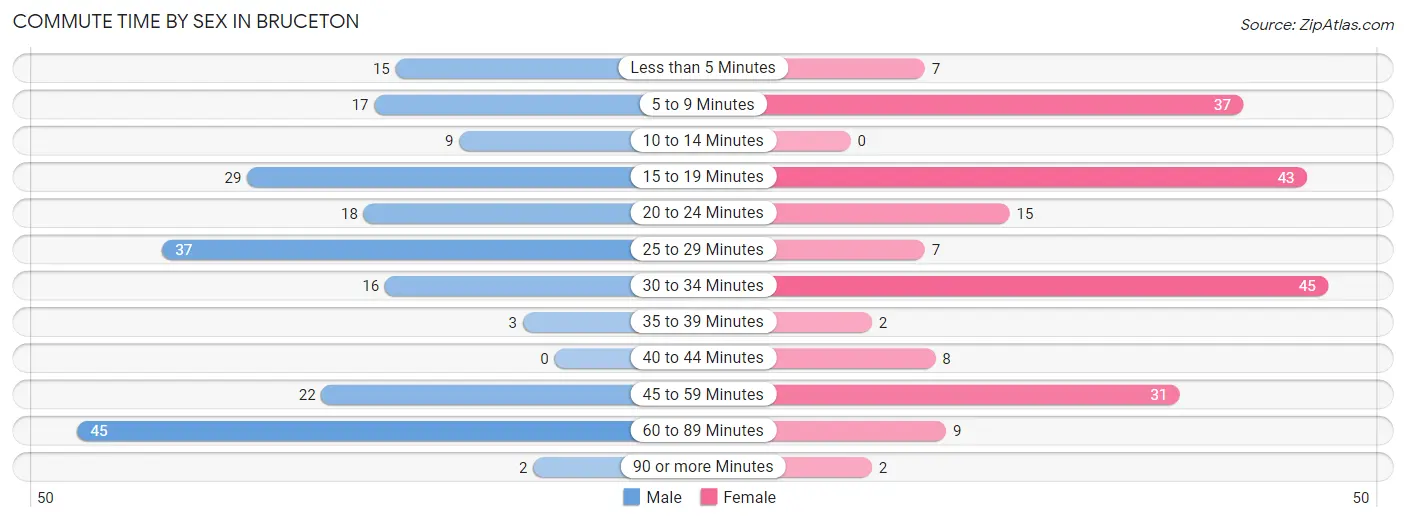
| Commute Time | Male | Female |
| Less than 5 Minutes | 15 (7.0%) | 7 (3.4%) |
| 5 to 9 Minutes | 17 (8.0%) | 37 (18.0%) |
| 10 to 14 Minutes | 9 (4.2%) | 0 (0.0%) |
| 15 to 19 Minutes | 29 (13.6%) | 43 (20.9%) |
| 20 to 24 Minutes | 18 (8.5%) | 15 (7.3%) |
| 25 to 29 Minutes | 37 (17.4%) | 7 (3.4%) |
| 30 to 34 Minutes | 16 (7.5%) | 45 (21.8%) |
| 35 to 39 Minutes | 3 (1.4%) | 2 (1.0%) |
| 40 to 44 Minutes | 0 (0.0%) | 8 (3.9%) |
| 45 to 59 Minutes | 22 (10.3%) | 31 (15.0%) |
| 60 to 89 Minutes | 45 (21.1%) | 9 (4.4%) |
| 90 or more Minutes | 2 (0.9%) | 2 (1.0%) |
Time of Departure to Work by Sex in Bruceton
The most frequent times of departure to work in Bruceton are 5:30 AM to 5:59 AM (61, 28.6%) for males and 7:30 AM to 7:59 AM (55, 26.7%) for females.
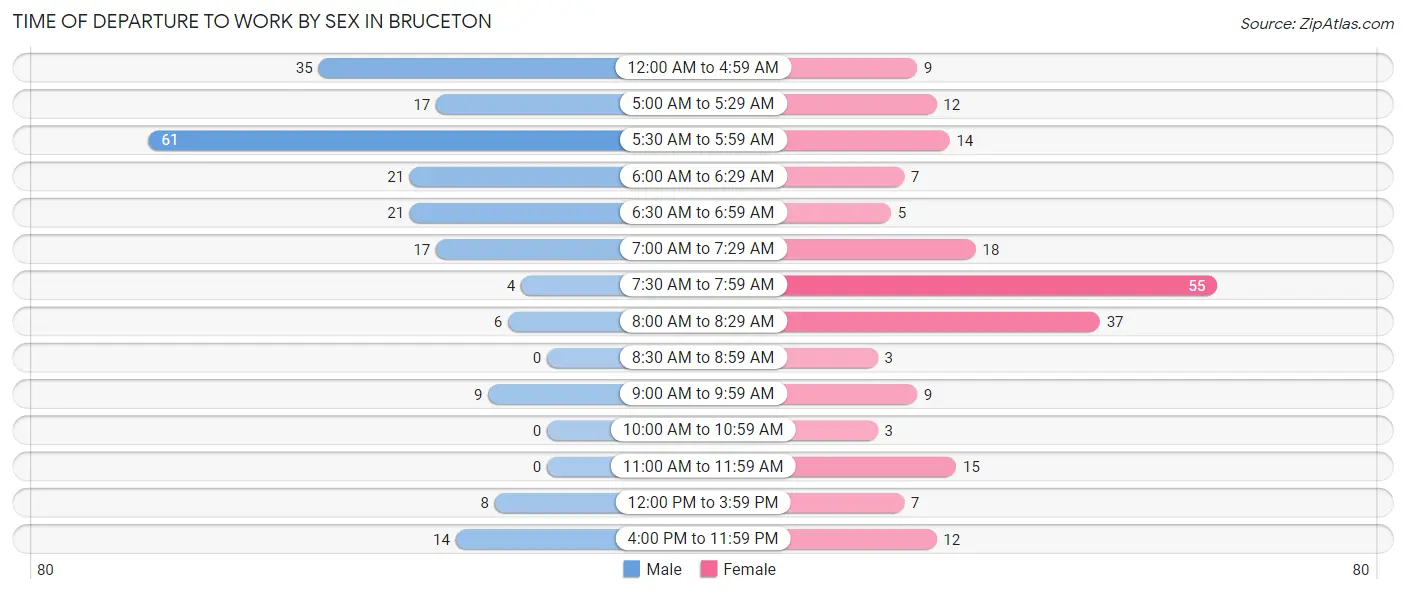
| Time of Departure | Male | Female |
| 12:00 AM to 4:59 AM | 35 (16.4%) | 9 (4.4%) |
| 5:00 AM to 5:29 AM | 17 (8.0%) | 12 (5.8%) |
| 5:30 AM to 5:59 AM | 61 (28.6%) | 14 (6.8%) |
| 6:00 AM to 6:29 AM | 21 (9.9%) | 7 (3.4%) |
| 6:30 AM to 6:59 AM | 21 (9.9%) | 5 (2.4%) |
| 7:00 AM to 7:29 AM | 17 (8.0%) | 18 (8.7%) |
| 7:30 AM to 7:59 AM | 4 (1.9%) | 55 (26.7%) |
| 8:00 AM to 8:29 AM | 6 (2.8%) | 37 (18.0%) |
| 8:30 AM to 8:59 AM | 0 (0.0%) | 3 (1.5%) |
| 9:00 AM to 9:59 AM | 9 (4.2%) | 9 (4.4%) |
| 10:00 AM to 10:59 AM | 0 (0.0%) | 3 (1.5%) |
| 11:00 AM to 11:59 AM | 0 (0.0%) | 15 (7.3%) |
| 12:00 PM to 3:59 PM | 8 (3.8%) | 7 (3.4%) |
| 4:00 PM to 11:59 PM | 14 (6.6%) | 12 (5.8%) |
| Total | 213 (100.0%) | 206 (100.0%) |
Housing Occupancy in Bruceton
Occupancy by Ownership in Bruceton
Of the total 531 dwellings in Bruceton, owner-occupied units account for 399 (75.1%), while renter-occupied units make up 132 (24.9%).
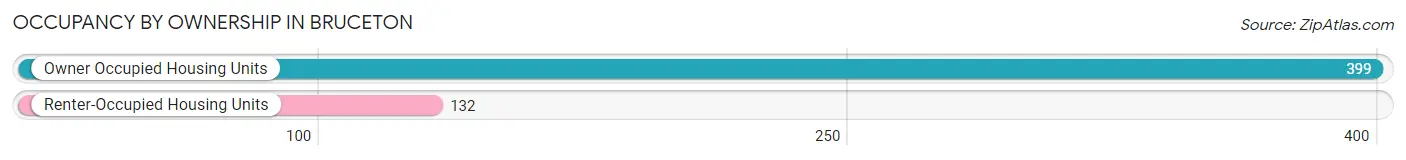
| Occupancy | # Housing Units | % Housing Units |
| Owner Occupied Housing Units | 399 | 75.1% |
| Renter-Occupied Housing Units | 132 | 24.9% |
| Total Occupied Housing Units | 531 | 100.0% |
Occupancy by Household Size in Bruceton
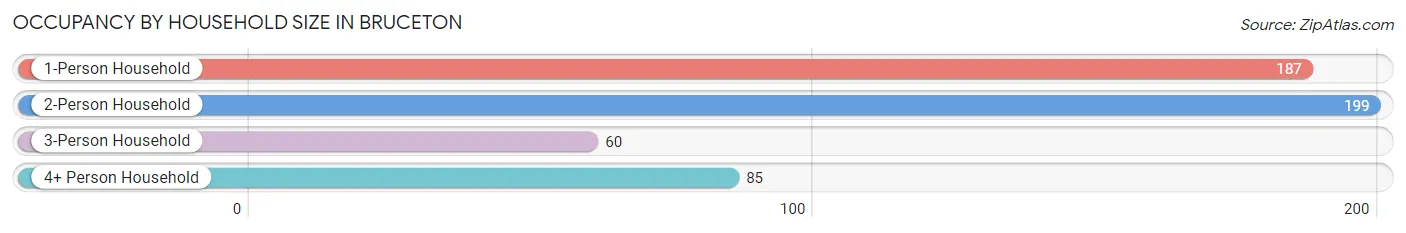
| Household Size | # Housing Units | % Housing Units |
| 1-Person Household | 187 | 35.2% |
| 2-Person Household | 199 | 37.5% |
| 3-Person Household | 60 | 11.3% |
| 4+ Person Household | 85 | 16.0% |
| Total Housing Units | 531 | 100.0% |
Occupancy by Ownership by Household Size in Bruceton
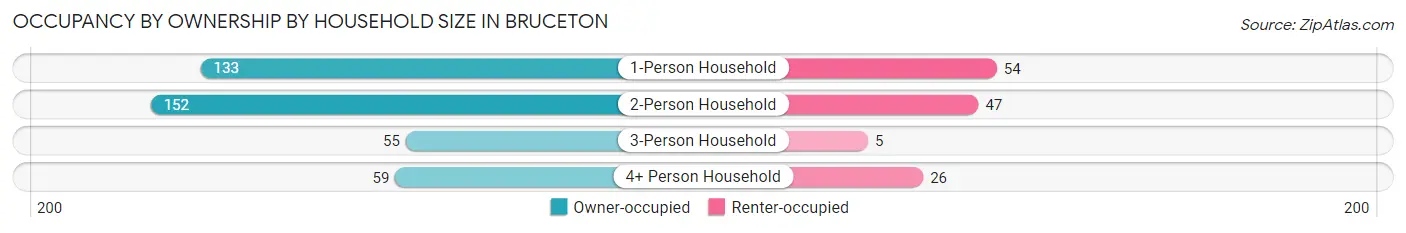
| Household Size | Owner-occupied | Renter-occupied |
| 1-Person Household | 133 (71.1%) | 54 (28.9%) |
| 2-Person Household | 152 (76.4%) | 47 (23.6%) |
| 3-Person Household | 55 (91.7%) | 5 (8.3%) |
| 4+ Person Household | 59 (69.4%) | 26 (30.6%) |
| Total Housing Units | 399 (75.1%) | 132 (24.9%) |
Occupancy by Educational Attainment in Bruceton
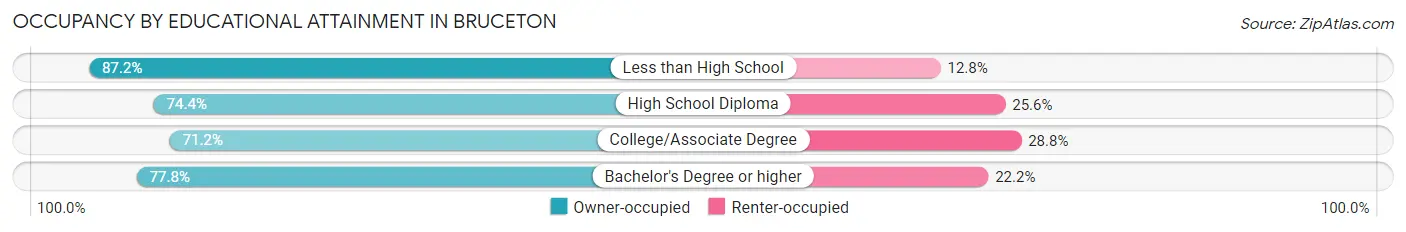
| Household Size | Owner-occupied | Renter-occupied |
| Less than High School | 41 (87.2%) | 6 (12.8%) |
| High School Diploma | 186 (74.4%) | 64 (25.6%) |
| College/Associate Degree | 109 (71.2%) | 44 (28.8%) |
| Bachelor's Degree or higher | 63 (77.8%) | 18 (22.2%) |
Occupancy by Age of Householder in Bruceton
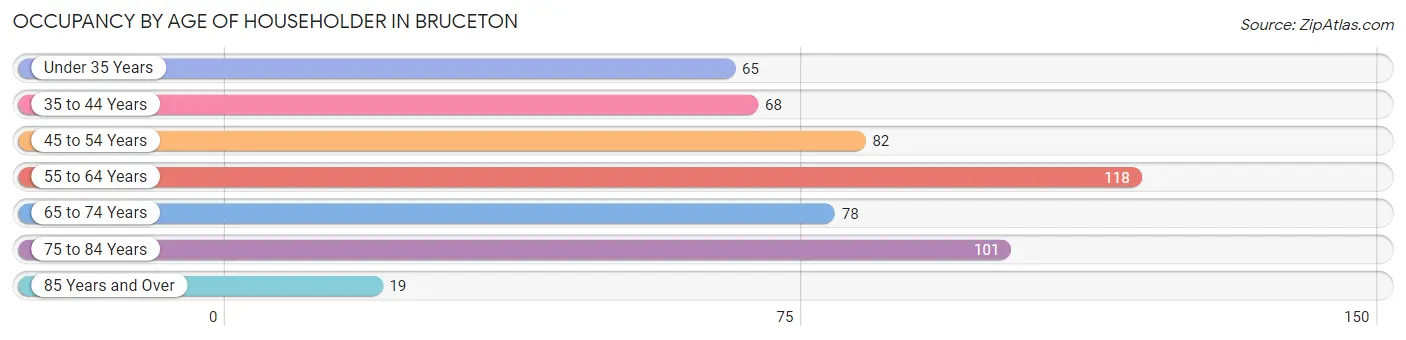
| Age Bracket | # Households | % Households |
| Under 35 Years | 65 | 12.2% |
| 35 to 44 Years | 68 | 12.8% |
| 45 to 54 Years | 82 | 15.4% |
| 55 to 64 Years | 118 | 22.2% |
| 65 to 74 Years | 78 | 14.7% |
| 75 to 84 Years | 101 | 19.0% |
| 85 Years and Over | 19 | 3.6% |
| Total | 531 | 100.0% |
Housing Finances in Bruceton
Median Income by Occupancy in Bruceton
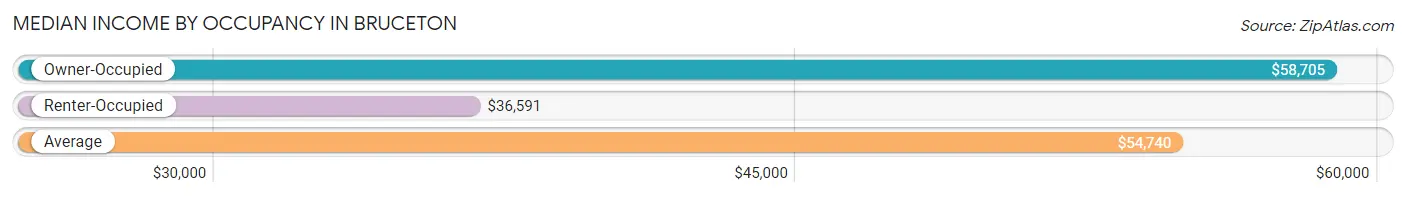
| Occupancy Type | # Households | Median Income |
| Owner-Occupied | 399 (75.1%) | $58,705 |
| Renter-Occupied | 132 (24.9%) | $36,591 |
| Average | 531 (100.0%) | $54,740 |
Occupancy by Householder Income Bracket in Bruceton
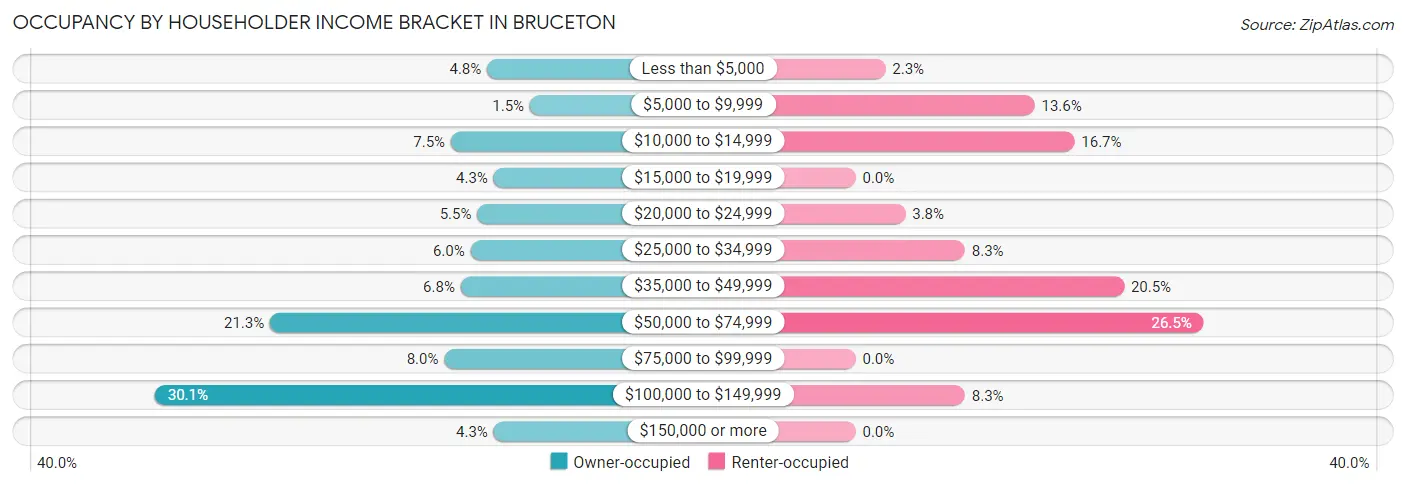
| Income Bracket | Owner-occupied | Renter-occupied |
| Less than $5,000 | 19 (4.8%) | 3 (2.3%) |
| $5,000 to $9,999 | 6 (1.5%) | 18 (13.6%) |
| $10,000 to $14,999 | 30 (7.5%) | 22 (16.7%) |
| $15,000 to $19,999 | 17 (4.3%) | 0 (0.0%) |
| $20,000 to $24,999 | 22 (5.5%) | 5 (3.8%) |
| $25,000 to $34,999 | 24 (6.0%) | 11 (8.3%) |
| $35,000 to $49,999 | 27 (6.8%) | 27 (20.4%) |
| $50,000 to $74,999 | 85 (21.3%) | 35 (26.5%) |
| $75,000 to $99,999 | 32 (8.0%) | 0 (0.0%) |
| $100,000 to $149,999 | 120 (30.1%) | 11 (8.3%) |
| $150,000 or more | 17 (4.3%) | 0 (0.0%) |
| Total | 399 (100.0%) | 132 (100.0%) |
Monthly Housing Cost Tiers in Bruceton
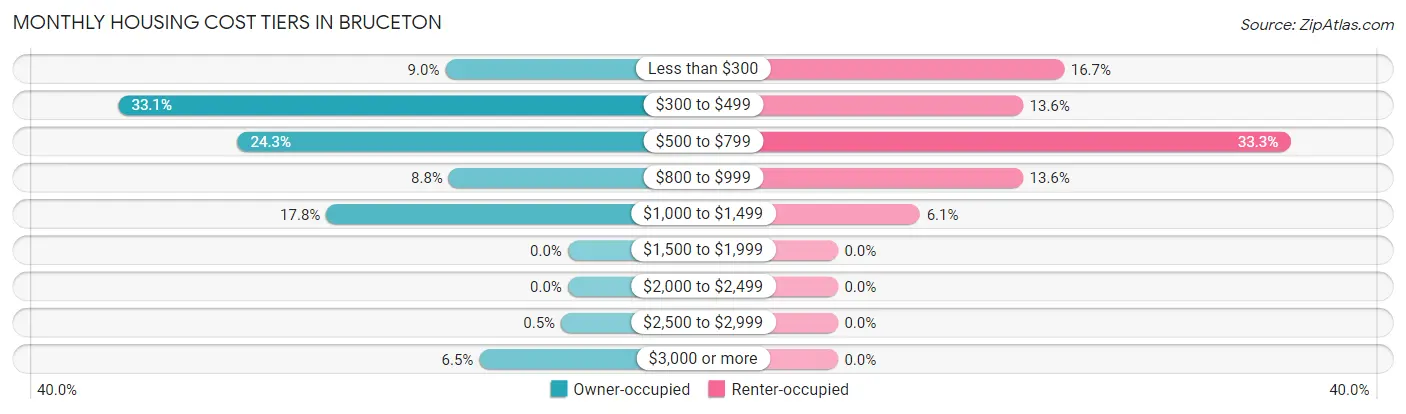
| Monthly Cost | Owner-occupied | Renter-occupied |
| Less than $300 | 36 (9.0%) | 22 (16.7%) |
| $300 to $499 | 132 (33.1%) | 18 (13.6%) |
| $500 to $799 | 97 (24.3%) | 44 (33.3%) |
| $800 to $999 | 35 (8.8%) | 18 (13.6%) |
| $1,000 to $1,499 | 71 (17.8%) | 8 (6.1%) |
| $1,500 to $1,999 | 0 (0.0%) | 0 (0.0%) |
| $2,000 to $2,499 | 0 (0.0%) | 0 (0.0%) |
| $2,500 to $2,999 | 2 (0.5%) | 0 (0.0%) |
| $3,000 or more | 26 (6.5%) | 0 (0.0%) |
| Total | 399 (100.0%) | 132 (100.0%) |
Physical Housing Characteristics in Bruceton
Housing Structures in Bruceton
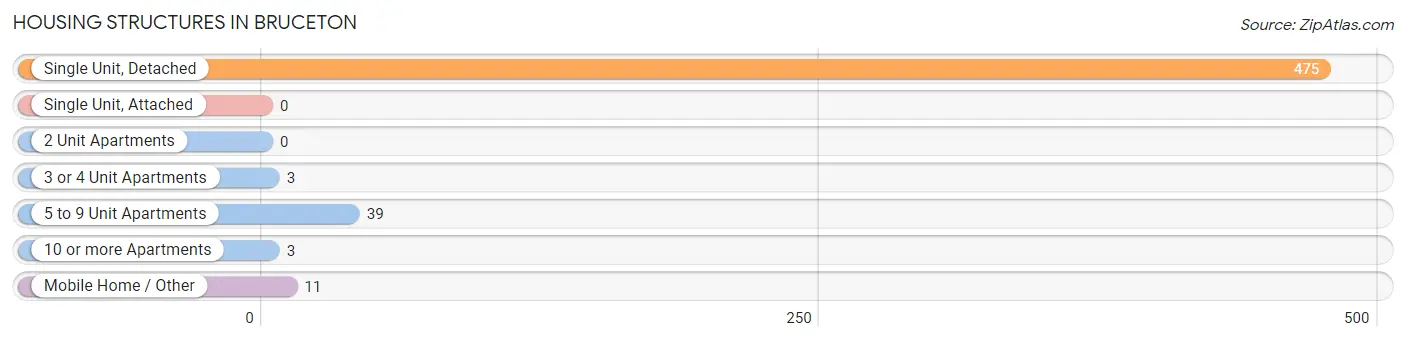
| Structure Type | # Housing Units | % Housing Units |
| Single Unit, Detached | 475 | 89.4% |
| Single Unit, Attached | 0 | 0.0% |
| 2 Unit Apartments | 0 | 0.0% |
| 3 or 4 Unit Apartments | 3 | 0.6% |
| 5 to 9 Unit Apartments | 39 | 7.3% |
| 10 or more Apartments | 3 | 0.6% |
| Mobile Home / Other | 11 | 2.1% |
| Total | 531 | 100.0% |
Housing Structures by Occupancy in Bruceton
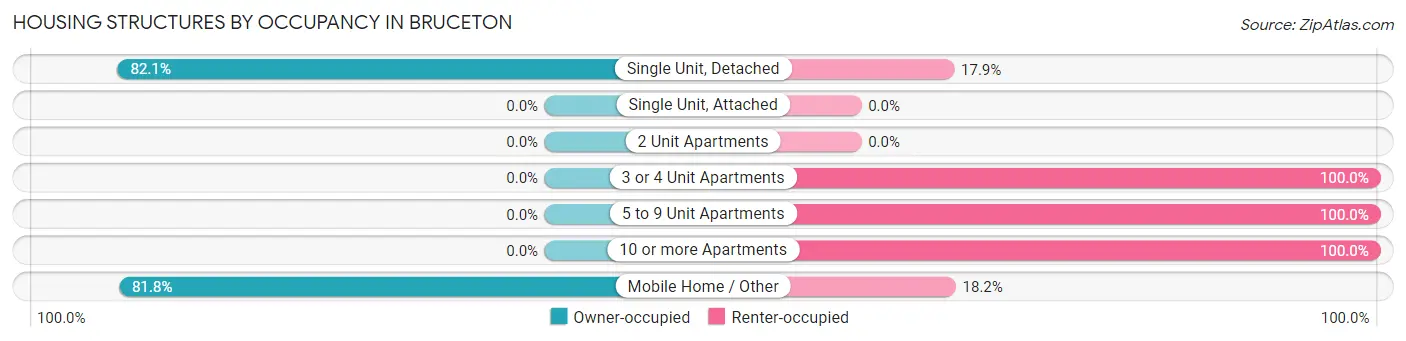
| Structure Type | Owner-occupied | Renter-occupied |
| Single Unit, Detached | 390 (82.1%) | 85 (17.9%) |
| Single Unit, Attached | 0 (0.0%) | 0 (0.0%) |
| 2 Unit Apartments | 0 (0.0%) | 0 (0.0%) |
| 3 or 4 Unit Apartments | 0 (0.0%) | 3 (100.0%) |
| 5 to 9 Unit Apartments | 0 (0.0%) | 39 (100.0%) |
| 10 or more Apartments | 0 (0.0%) | 3 (100.0%) |
| Mobile Home / Other | 9 (81.8%) | 2 (18.2%) |
| Total | 399 (75.1%) | 132 (24.9%) |
Housing Structures by Number of Rooms in Bruceton
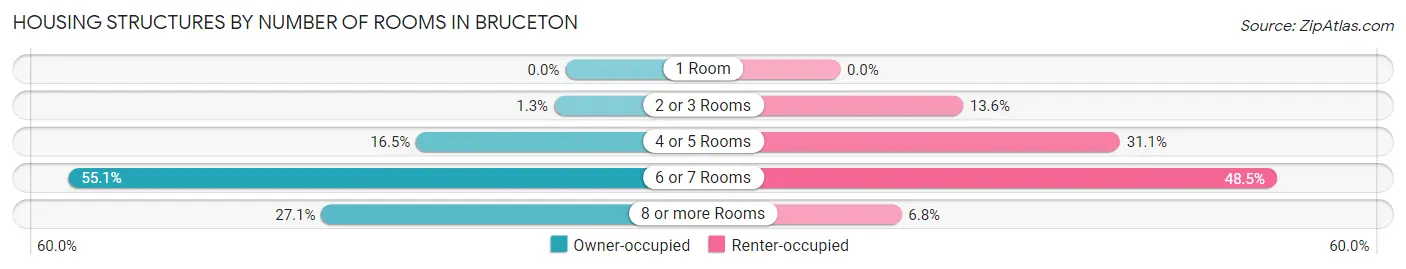
| Number of Rooms | Owner-occupied | Renter-occupied |
| 1 Room | 0 (0.0%) | 0 (0.0%) |
| 2 or 3 Rooms | 5 (1.3%) | 18 (13.6%) |
| 4 or 5 Rooms | 66 (16.5%) | 41 (31.1%) |
| 6 or 7 Rooms | 220 (55.1%) | 64 (48.5%) |
| 8 or more Rooms | 108 (27.1%) | 9 (6.8%) |
| Total | 399 (100.0%) | 132 (100.0%) |
Housing Structure by Heating Type in Bruceton
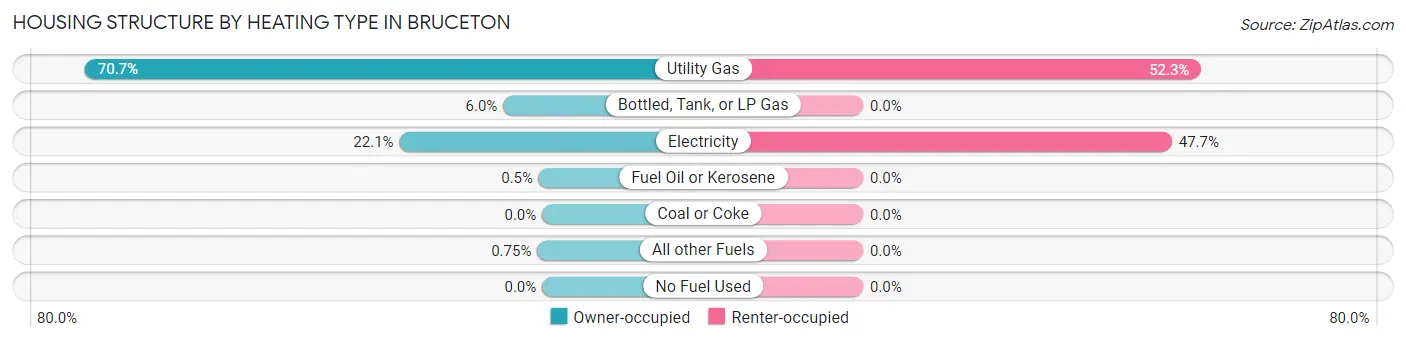
| Heating Type | Owner-occupied | Renter-occupied |
| Utility Gas | 282 (70.7%) | 69 (52.3%) |
| Bottled, Tank, or LP Gas | 24 (6.0%) | 0 (0.0%) |
| Electricity | 88 (22.1%) | 63 (47.7%) |
| Fuel Oil or Kerosene | 2 (0.5%) | 0 (0.0%) |
| Coal or Coke | 0 (0.0%) | 0 (0.0%) |
| All other Fuels | 3 (0.7%) | 0 (0.0%) |
| No Fuel Used | 0 (0.0%) | 0 (0.0%) |
| Total | 399 (100.0%) | 132 (100.0%) |
Household Vehicle Usage in Bruceton
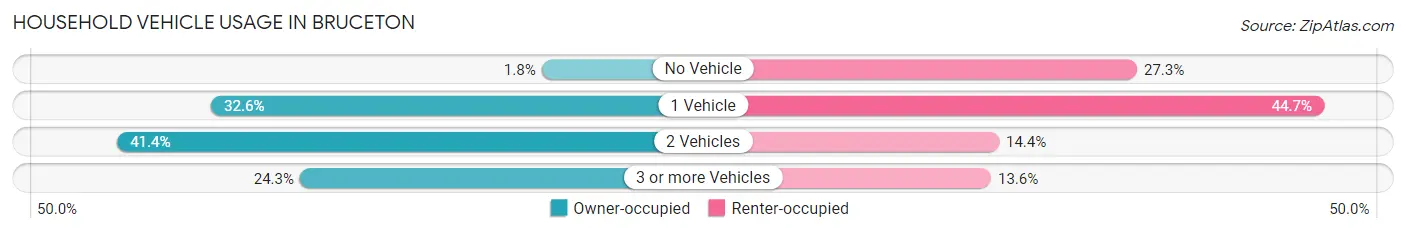
| Vehicles per Household | Owner-occupied | Renter-occupied |
| No Vehicle | 7 (1.8%) | 36 (27.3%) |
| 1 Vehicle | 130 (32.6%) | 59 (44.7%) |
| 2 Vehicles | 165 (41.3%) | 19 (14.4%) |
| 3 or more Vehicles | 97 (24.3%) | 18 (13.6%) |
| Total | 399 (100.0%) | 132 (100.0%) |
Real Estate & Mortgages in Bruceton
Real Estate and Mortgage Overview in Bruceton
| Characteristic | Without Mortgage | With Mortgage |
| Housing Units | 227 | 172 |
| Median Property Value | $88,200 | $105,000 |
| Median Household Income | $53,250 | $10 |
| Monthly Housing Costs | $423 | $24 |
| Real Estate Taxes | $1,018 | $13 |
Property Value by Mortgage Status in Bruceton
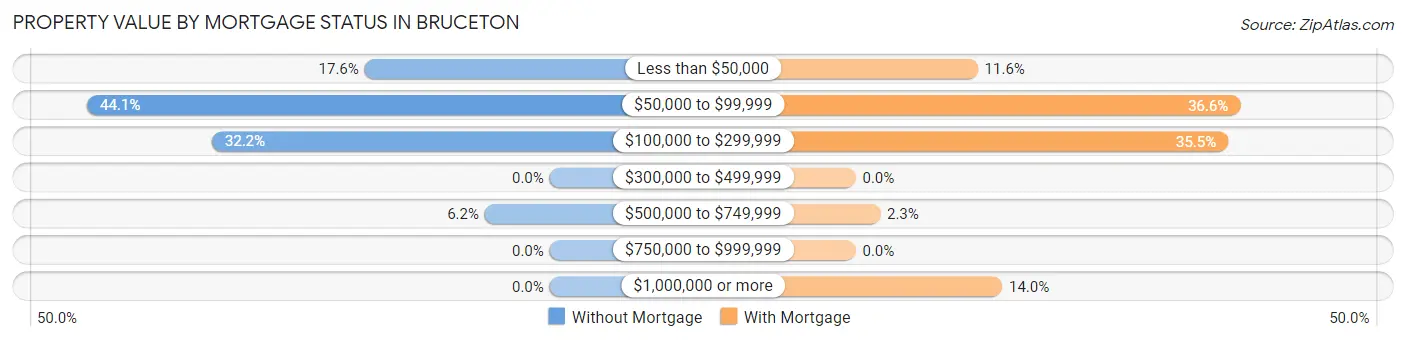
| Property Value | Without Mortgage | With Mortgage |
| Less than $50,000 | 40 (17.6%) | 20 (11.6%) |
| $50,000 to $99,999 | 100 (44.1%) | 63 (36.6%) |
| $100,000 to $299,999 | 73 (32.2%) | 61 (35.5%) |
| $300,000 to $499,999 | 0 (0.0%) | 0 (0.0%) |
| $500,000 to $749,999 | 14 (6.2%) | 4 (2.3%) |
| $750,000 to $999,999 | 0 (0.0%) | 0 (0.0%) |
| $1,000,000 or more | 0 (0.0%) | 24 (14.0%) |
| Total | 227 (100.0%) | 172 (100.0%) |
Household Income by Mortgage Status in Bruceton
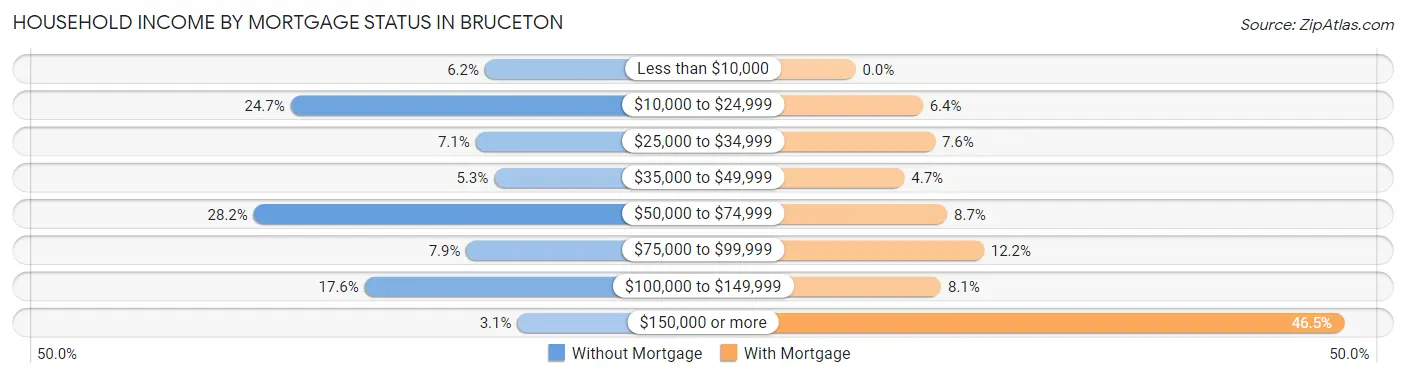
| Household Income | Without Mortgage | With Mortgage |
| Less than $10,000 | 14 (6.2%) | 0 (0.0%) |
| $10,000 to $24,999 | 56 (24.7%) | 11 (6.4%) |
| $25,000 to $34,999 | 16 (7.0%) | 13 (7.6%) |
| $35,000 to $49,999 | 12 (5.3%) | 8 (4.6%) |
| $50,000 to $74,999 | 64 (28.2%) | 15 (8.7%) |
| $75,000 to $99,999 | 18 (7.9%) | 21 (12.2%) |
| $100,000 to $149,999 | 40 (17.6%) | 14 (8.1%) |
| $150,000 or more | 7 (3.1%) | 80 (46.5%) |
| Total | 227 (100.0%) | 172 (100.0%) |
Property Value to Household Income Ratio in Bruceton
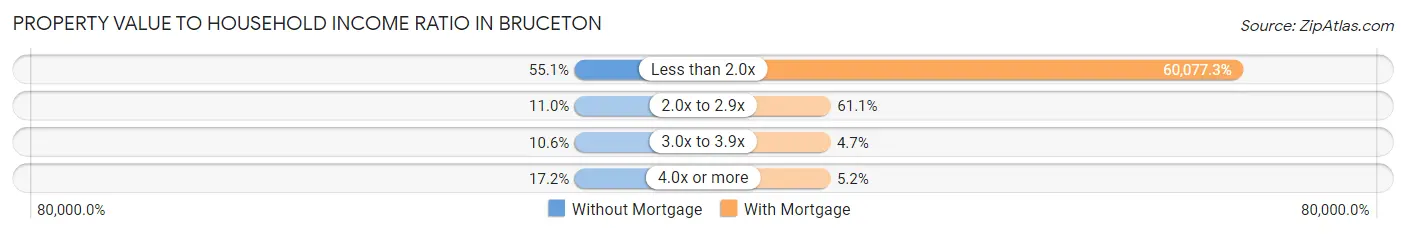
| Value-to-Income Ratio | Without Mortgage | With Mortgage |
| Less than 2.0x | 125 (55.1%) | 103,333 (60,077.3%) |
| 2.0x to 2.9x | 25 (11.0%) | 105 (61.1%) |
| 3.0x to 3.9x | 24 (10.6%) | 8 (4.6%) |
| 4.0x or more | 39 (17.2%) | 9 (5.2%) |
| Total | 227 (100.0%) | 172 (100.0%) |
Real Estate Taxes by Mortgage Status in Bruceton
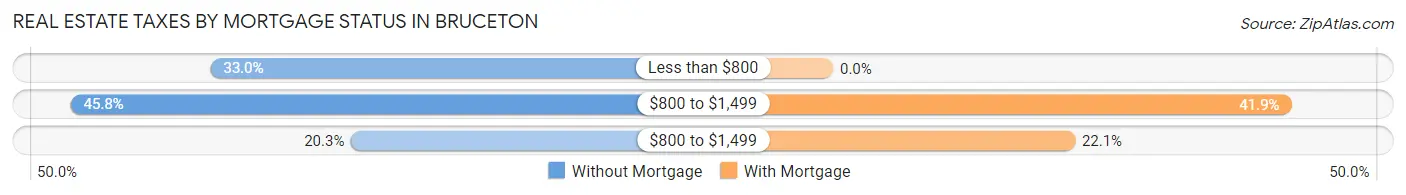
| Property Taxes | Without Mortgage | With Mortgage |
| Less than $800 | 75 (33.0%) | 0 (0.0%) |
| $800 to $1,499 | 104 (45.8%) | 72 (41.9%) |
| $800 to $1,499 | 46 (20.3%) | 38 (22.1%) |
| Total | 227 (100.0%) | 172 (100.0%) |
Health & Disability in Bruceton
Health Insurance Coverage by Age in Bruceton
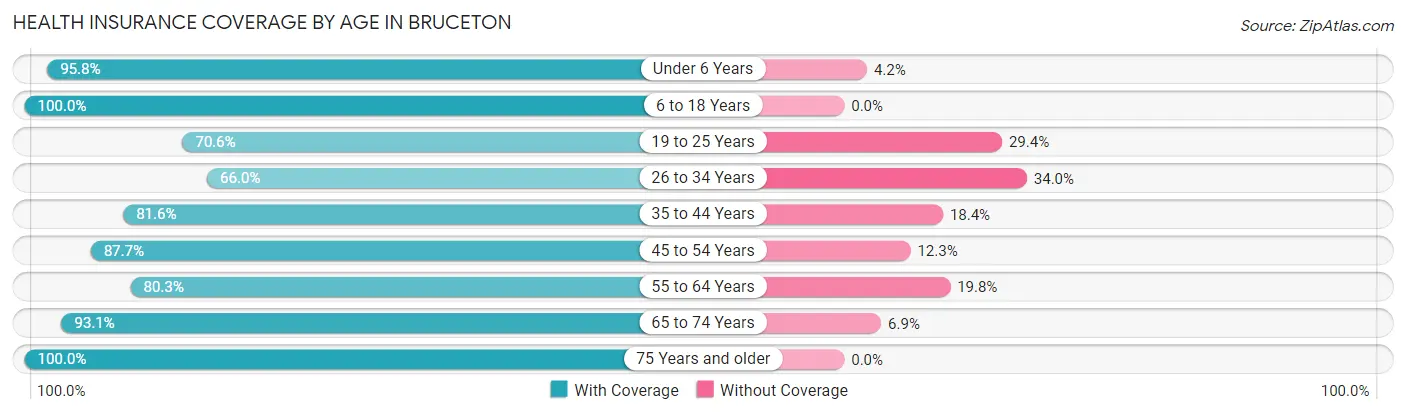
| Age Bracket | With Coverage | Without Coverage |
| Under 6 Years | 68 (95.8%) | 3 (4.2%) |
| 6 to 18 Years | 229 (100.0%) | 0 (0.0%) |
| 19 to 25 Years | 48 (70.6%) | 20 (29.4%) |
| 26 to 34 Years | 62 (66.0%) | 32 (34.0%) |
| 35 to 44 Years | 102 (81.6%) | 23 (18.4%) |
| 45 to 54 Years | 135 (87.7%) | 19 (12.3%) |
| 55 to 64 Years | 130 (80.2%) | 32 (19.8%) |
| 65 to 74 Years | 122 (93.1%) | 9 (6.9%) |
| 75 Years and older | 179 (100.0%) | 0 (0.0%) |
| Total | 1,075 (88.6%) | 138 (11.4%) |
Health Insurance Coverage by Citizenship Status in Bruceton
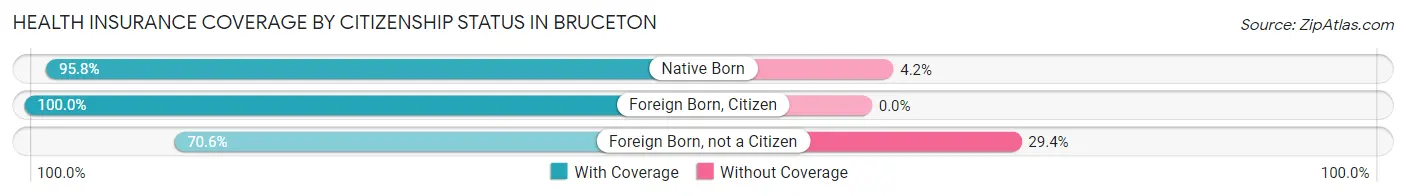
| Citizenship Status | With Coverage | Without Coverage |
| Native Born | 68 (95.8%) | 3 (4.2%) |
| Foreign Born, Citizen | 229 (100.0%) | 0 (0.0%) |
| Foreign Born, not a Citizen | 48 (70.6%) | 20 (29.4%) |
Health Insurance Coverage by Household Income in Bruceton
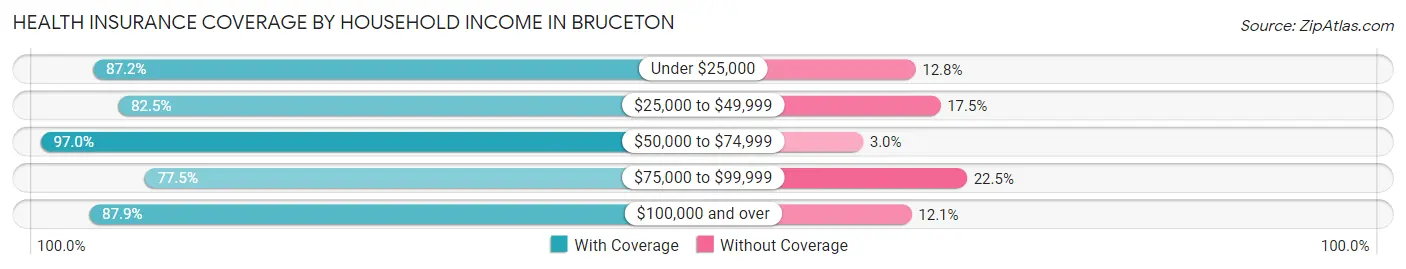
| Household Income | With Coverage | Without Coverage |
| Under $25,000 | 190 (87.2%) | 28 (12.8%) |
| $25,000 to $49,999 | 165 (82.5%) | 35 (17.5%) |
| $50,000 to $74,999 | 324 (97.0%) | 10 (3.0%) |
| $75,000 to $99,999 | 69 (77.5%) | 20 (22.5%) |
| $100,000 and over | 327 (87.9%) | 45 (12.1%) |
Public vs Private Health Insurance Coverage by Age in Bruceton
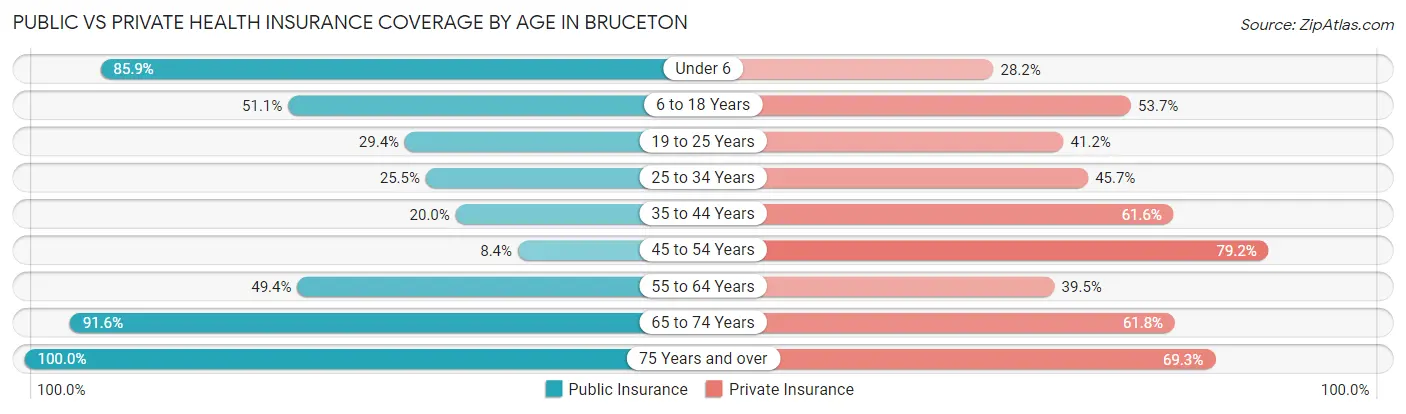
| Age Bracket | Public Insurance | Private Insurance |
| Under 6 | 61 (85.9%) | 20 (28.2%) |
| 6 to 18 Years | 117 (51.1%) | 123 (53.7%) |
| 19 to 25 Years | 20 (29.4%) | 28 (41.2%) |
| 25 to 34 Years | 24 (25.5%) | 43 (45.7%) |
| 35 to 44 Years | 25 (20.0%) | 77 (61.6%) |
| 45 to 54 Years | 13 (8.4%) | 122 (79.2%) |
| 55 to 64 Years | 80 (49.4%) | 64 (39.5%) |
| 65 to 74 Years | 120 (91.6%) | 81 (61.8%) |
| 75 Years and over | 179 (100.0%) | 124 (69.3%) |
| Total | 639 (52.7%) | 682 (56.2%) |
Disability Status by Sex by Age in Bruceton
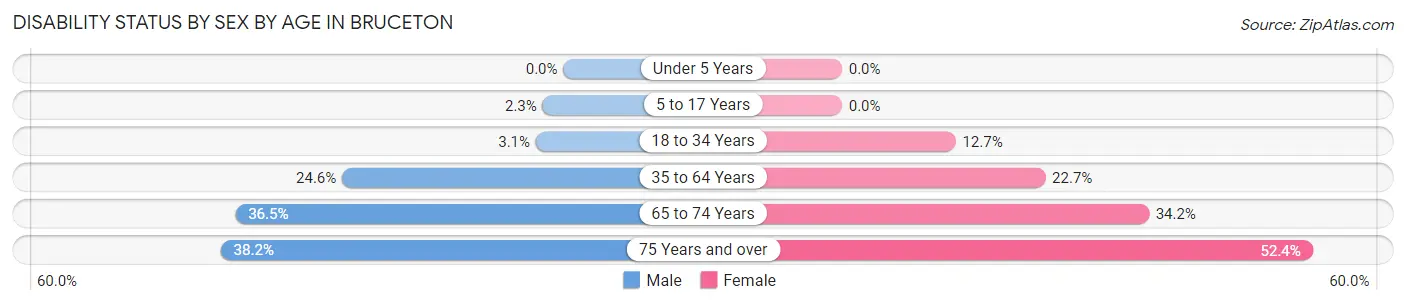
| Age Bracket | Male | Female |
| Under 5 Years | 0 (0.0%) | 0 (0.0%) |
| 5 to 17 Years | 3 (2.3%) | 0 (0.0%) |
| 18 to 34 Years | 3 (3.1%) | 10 (12.7%) |
| 35 to 64 Years | 51 (24.6%) | 53 (22.7%) |
| 65 to 74 Years | 19 (36.5%) | 27 (34.2%) |
| 75 Years and over | 29 (38.2%) | 54 (52.4%) |
Disability Class by Sex by Age in Bruceton
Disability Class: Hearing Difficulty
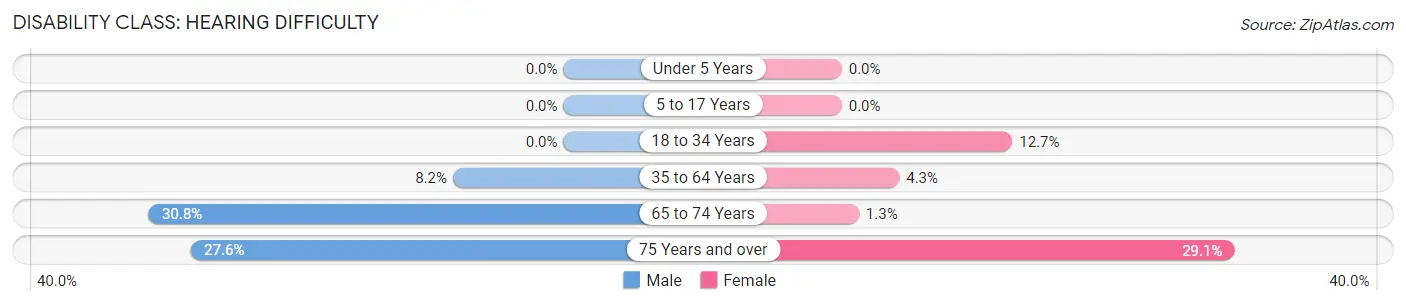
| Age Bracket | Male | Female |
| Under 5 Years | 0 (0.0%) | 0 (0.0%) |
| 5 to 17 Years | 0 (0.0%) | 0 (0.0%) |
| 18 to 34 Years | 0 (0.0%) | 10 (12.7%) |
| 35 to 64 Years | 17 (8.2%) | 10 (4.3%) |
| 65 to 74 Years | 16 (30.8%) | 1 (1.3%) |
| 75 Years and over | 21 (27.6%) | 30 (29.1%) |
Disability Class: Vision Difficulty
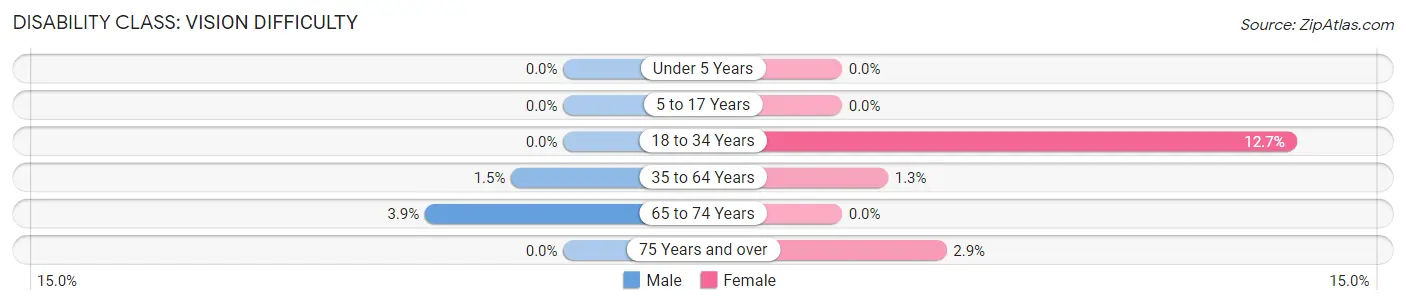
| Age Bracket | Male | Female |
| Under 5 Years | 0 (0.0%) | 0 (0.0%) |
| 5 to 17 Years | 0 (0.0%) | 0 (0.0%) |
| 18 to 34 Years | 0 (0.0%) | 10 (12.7%) |
| 35 to 64 Years | 3 (1.5%) | 3 (1.3%) |
| 65 to 74 Years | 2 (3.8%) | 0 (0.0%) |
| 75 Years and over | 0 (0.0%) | 3 (2.9%) |
Disability Class: Cognitive Difficulty
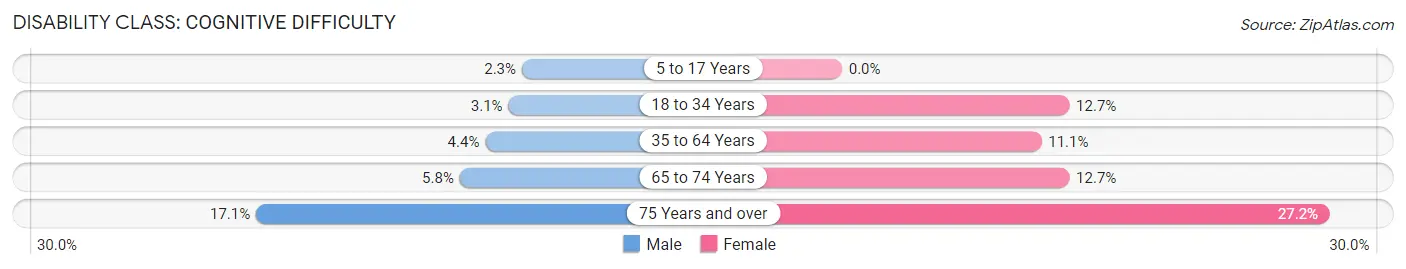
| Age Bracket | Male | Female |
| 5 to 17 Years | 3 (2.3%) | 0 (0.0%) |
| 18 to 34 Years | 3 (3.1%) | 10 (12.7%) |
| 35 to 64 Years | 9 (4.3%) | 26 (11.1%) |
| 65 to 74 Years | 3 (5.8%) | 10 (12.7%) |
| 75 Years and over | 13 (17.1%) | 28 (27.2%) |
Disability Class: Ambulatory Difficulty
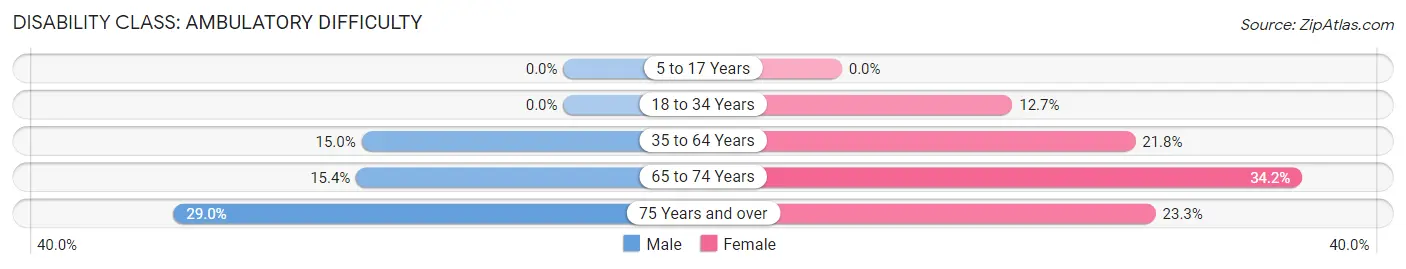
| Age Bracket | Male | Female |
| 5 to 17 Years | 0 (0.0%) | 0 (0.0%) |
| 18 to 34 Years | 0 (0.0%) | 10 (12.7%) |
| 35 to 64 Years | 31 (15.0%) | 51 (21.8%) |
| 65 to 74 Years | 8 (15.4%) | 27 (34.2%) |
| 75 Years and over | 22 (28.9%) | 24 (23.3%) |
Disability Class: Self-Care Difficulty
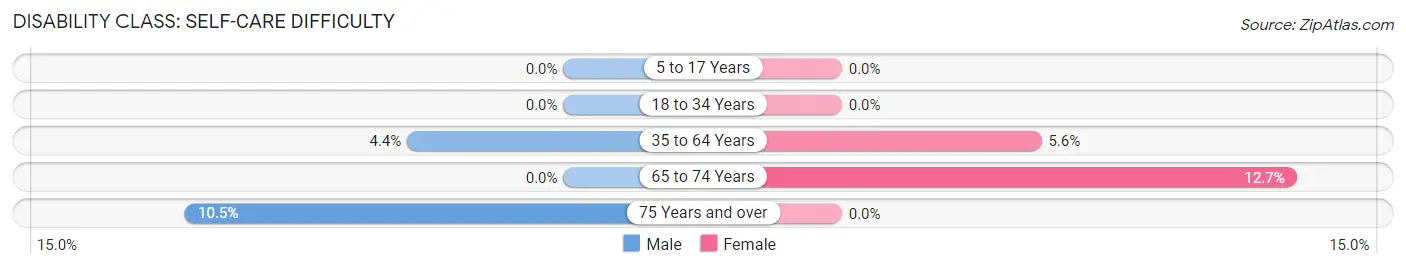
| Age Bracket | Male | Female |
| 5 to 17 Years | 0 (0.0%) | 0 (0.0%) |
| 18 to 34 Years | 0 (0.0%) | 0 (0.0%) |
| 35 to 64 Years | 9 (4.3%) | 13 (5.6%) |
| 65 to 74 Years | 0 (0.0%) | 10 (12.7%) |
| 75 Years and over | 8 (10.5%) | 0 (0.0%) |
Technology Access in Bruceton
Computing Device Access in Bruceton
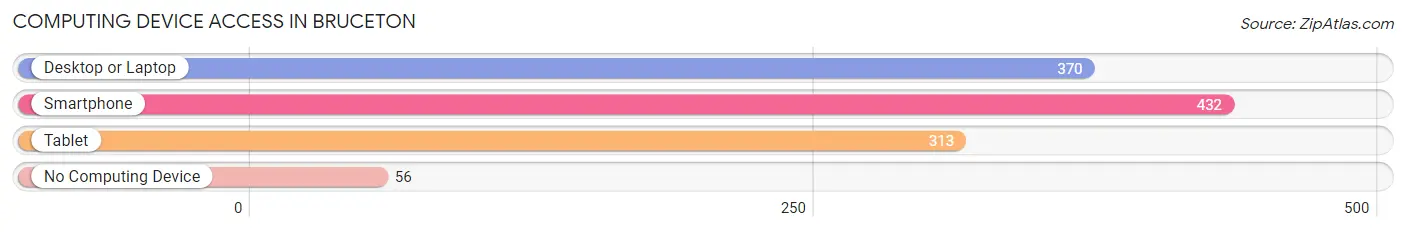
| Device Type | # Households | % Households |
| Desktop or Laptop | 370 | 69.7% |
| Smartphone | 432 | 81.4% |
| Tablet | 313 | 59.0% |
| No Computing Device | 56 | 10.5% |
| Total | 531 | 100.0% |
Internet Access in Bruceton
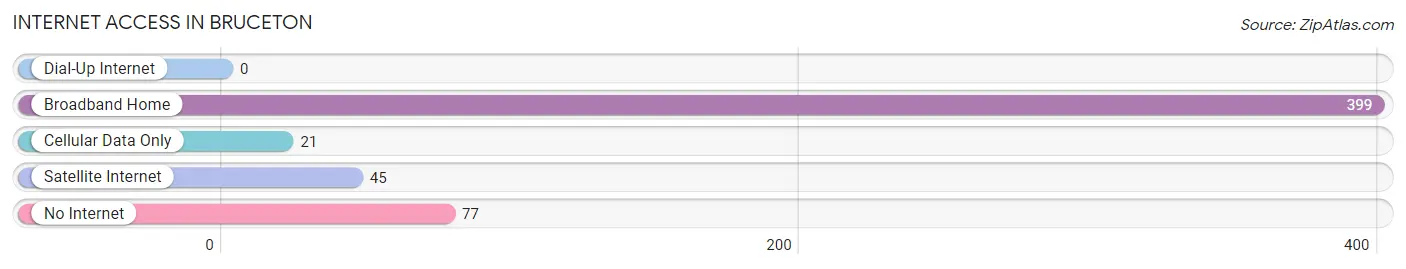
| Internet Type | # Households | % Households |
| Dial-Up Internet | 0 | 0.0% |
| Broadband Home | 399 | 75.1% |
| Cellular Data Only | 21 | 4.0% |
| Satellite Internet | 45 | 8.5% |
| No Internet | 77 | 14.5% |
| Total | 531 | 100.0% |
Bruceton Summary
Bruceton is a small town located in the northwest corner of Carroll County, Tennessee. It is situated along the banks of the Tennessee River, approximately 30 miles west of Jackson and 40 miles east of Memphis. The town has a population of 1,717 people, according to the 2010 census.
History
Bruceton was founded in 1837 by William Bruce, a local landowner. The town was named after him and was originally known as Bruce’s Town. The town was incorporated in 1845 and the name was changed to Bruceton.
The town was an important stop on the Memphis and Ohio Railroad, which ran through the town in the late 19th century. The railroad brought economic growth to the area and helped to make Bruceton a thriving community.
In the early 20th century, Bruceton was a major producer of cotton and tobacco. The town was also home to several factories, including a cotton mill, a furniture factory, and a canning factory.
Geography
Bruceton is located in the northwest corner of Carroll County, Tennessee. It is situated along the banks of the Tennessee River, approximately 30 miles west of Jackson and 40 miles east of Memphis. The town has a total area of 1.7 square miles, all of which is land.
The town is located in a hilly region of the state, with elevations ranging from 500 to 800 feet above sea level. The climate is humid subtropical, with hot summers and mild winters.
Economy
Bruceton’s economy is largely based on agriculture and manufacturing. The town is home to several factories, including a cotton mill, a furniture factory, and a canning factory.
The town is also home to several small businesses, including restaurants, retail stores, and service providers. The town is also home to a branch of the Bank of Bruceton, which serves the local community.
Demographics
According to the 2010 census, Bruceton has a population of 1,717 people. The racial makeup of the town is 95.2% White, 2.2% African American, 0.3% Native American, 0.2% Asian, 0.1% Pacific Islander, 0.7% from other races, and 1.3% from two or more races.
The median household income in Bruceton is $31,250, and the median family income is $37,500. The per capita income in the town is $17,845. The town has a poverty rate of 22.3%.
Conclusion
Bruceton is a small town located in the northwest corner of Carroll County, Tennessee. It is situated along the banks of the Tennessee River, approximately 30 miles west of Jackson and 40 miles east of Memphis. The town has a population of 1,717 people, according to the 2010 census. The town’s economy is largely based on agriculture and manufacturing, and it is home to several small businesses. The median household income in Bruceton is $31,250, and the median family income is $37,500. The town has a poverty rate of 22.3%.
Common Questions
What is Per Capita Income in Bruceton?
Per Capita income in Bruceton is $27,346.
What is the Median Family Income in Bruceton?
Median Family Income in Bruceton is $59,344.
What is the Median Household income in Bruceton?
Median Household Income in Bruceton is $54,740.
What is Income or Wage Gap in Bruceton?
Income or Wage Gap in Bruceton is 29.2%.
Women in Bruceton earn 70.8 cents for every dollar earned by a man.
What is Inequality or Gini Index in Bruceton?
Inequality or Gini Index in Bruceton is 0.42.
What is the Total Population of Bruceton?
Total Population of Bruceton is 1,311.
What is the Total Male Population of Bruceton?
Total Male Population of Bruceton is 628.
What is the Total Female Population of Bruceton?
Total Female Population of Bruceton is 683.
What is the Ratio of Males per 100 Females in Bruceton?
There are 91.95 Males per 100 Females in Bruceton.
What is the Ratio of Females per 100 Males in Bruceton?
There are 108.76 Females per 100 Males in Bruceton.
What is the Median Population Age in Bruceton?
Median Population Age in Bruceton is 49.0 Years.
What is the Average Family Size in Bruceton
Average Family Size in Bruceton is 2.9 People.
What is the Average Household Size in Bruceton
Average Household Size in Bruceton is 2.3 People.
How Large is the Labor Force in Bruceton?
There are 452 People in the Labor Forcein in Bruceton.
What is the Percentage of People in the Labor Force in Bruceton?
43.3% of People are in the Labor Force in Bruceton.
What is the Unemployment Rate in Bruceton?
Unemployment Rate in Bruceton is 2.9%.